first application of new gas plant technology · 2015-04-20 · coupled to an adjoining...
TRANSCRIPT

First Application of New Gas Plant Technology
Presented at the 94th Annual Convention
of the Gas Processors Association
April 14, 2015 San Antonio, Texas, USA
Scott A. Miller, P.E. Ortloff Engineers, Ltd. Midland, Texas, USA
W. Larry Lewis, P.E. SME Products, L.P. Houston, TX, USA
Bruce A. Darter Kinder Morgan
Houston, TX, USA
www.ortloff.com

First Application of New Gas Plant Technology
Scott A. Miller, P.E., Ortloff Engineers, Ltd., Midland, TX W. Larry Lewis, P.E., SME Products, L.P., Houston, TX
Bruce A. Darter, Kinder Morgan, Houston, TX
ABSTRACT
A retrofitted 200 MMSCFD gas processing plant was placed into service at the Houston Central Plant (HCP) near Sheridan, Texas as part of an expansion project. Although the new plant was based on well-proven process concepts, it was the first application of new compact “Bottle” technology. Through collaboration between the HCP operations team, the EPC contractor, and the process licensor, the new plant is operating well while exceeding its design goals. As with any technology innovation, moving from concept to reality for the Bottle required facing and overcoming challenges from start to finish. This paper is a recount of the project history focusing on the following:
Project scope and drivers Actual plant operations and performance versus design operations and performance Startup issues, challenges, and steps to achieve desired plant performance Lessons learned during startup and the early days of plant operation Current plant operation

- 3 -
INTRODUCTION In early 2012, a retrofitted cryogenic natural gas liquids (NGL) recovery plant was placed into service at the Houston Central Plant (HCP) near Sheridan, Texas to process Eagle Ford shale gas. Ortloff ’ s Gas Plant in a Bottle™ (Bottle) cryogenic gas plant technology offered a number of advantages over a traditional revamp of the original cryogenic gas plant and was selected as the best solution by the owner/operator for the project. However, during startup the commissioning team found itself addressing a number of operational challenges, including an inlet gas that was much richer than the design inlet gas composition.
HCP SITE BACKGROUND
The Houston Central Plant is currently owned and operated by Kinder Morgan, and is located about 3 miles southeast of Sheridan, Texas. Kinder Morgan became the owner and operator of the HCP site as part of their acquisition of Copano Energy, LLC in 2013 after startup of the Bottle. The HCP site now processes 1.0 billion standard cubic feet per day (BCFD) of natural gas from two different supply sources, a local field supply and the Eagle Ford shale; however the vast majority of that gas is supplied from the Eagle Ford shale region of south Texas.
Since 2011, the owner has constructed and started up three gas processing plants with capacities of 200 million standard cubic feet per day (MMSCFD), 400 MMSCFD, and 400 MMSCFD, respectively, each capable of recovering a higher amount of ethane and heavier hydrocarbons compared to the gas processing plants they replaced. The retrofitted 200 MMSCFD gas processing train is the only train that receives gas from both of these supply sources. The two 400 MMSCFD gas processing trains receive and process gas only from the Eagle Ford shale region. The two original gas processing plants replaced at the site were a 500 MMSCFD lean oil plant and a 200 MMSCFD turbo-expander plant, neither of which were suitable for processing the rich gas resulting from the shale gas boom.
BOTTLE CONCEPT
Gas Plant in a Bottle™ is a cryogenic gas plant concept developed by Ortloff Engineers, Ltd. (Ortloff) and SME Products, LP (SME-P). Through an innovative use of integrated heat and mass transfer equipment, most of the processing equipment found in a typical cryogenic gas plant can now be placed inside a single vertical vessel or Bottle.
With the Bottle concept, the cryogenic gas plant can be reduced to a single processing assembly coupled to an adjoining turbo-expander/booster compressor (TEC), significantly reducing the cryogenic plant footprint. Much of the piping used to join the equipment items together in a typical gas plant is eliminated by placing the equipment services inside the assembly. Most, if not all, of the heat transfer devices are inside the assembly, eliminating the external reboilers, the often troublesome thermosiphon reboiler piping, and issues with heat exchanger thermal stress sometimes found in standard gas plants.

- 4 -
The key feature of the Bottle is the Heat and Mass Transfer (HMT) module which provides simultaneous heat and mass transfer within the Bottle assembly eliminating the need for an external reboiler or side heaters. This device is typically incorporated into the stripping section of the fractionation column and uses a warm process heat source, like inlet gas for ethane recovery plant applications, as heat input to generate stripping vapors and mass transfer contact within the HMT module instead of discrete locations for generating stripping vapors when using an external reboiler and side heaters.
For gas plant designs where it might not be advantageous to the owner/operator to include some of the heat exchangers inside the Bottle assembly, an alternate design (the Ortloff “modified” Bottle concept) can be utilized. For a “modified” Bottle, some of the heat exchanger equipment, like the gas/gas exchanger and subcooler in an ethane recovery plant design, would remain outside the Bottle assembly.
Among the advantages of the Bottle concept are lower plant cost, less plot space, less piping, reduced pressure drop with resulting lower compression power, fewer flanged connections reducing the potential sources of leaks and atmospheric emissions, fewer foundations meaning less civil work, and shorter construction schedules.
Bottle designs use Ortloff natural gas liquids or liquefied petroleum gas (NGL / LPG) technologies, or industry- standard open-art technology, such as Ortloff ’s Gas Subcooled Process (GSP) design. Technology selection is based on the processing requirements and product economics for each plant site (1).
CRYOGENIC GAS PLANT PROCESS For the HCP plant project, Ortloff ’s Gas Subcooled Process Modified Bottle (GSP-MB) was selected for the cryogenic gas plant portion (2). The HCP plant was the first industrial application of the new Bottle technology. The HCP plant is a “modified” Bottle arrangement where both the gas/gas exchanger and subcooler are excluded from the main Bottle assembly. Excluding these two exchangers from the main Bottle assembly was a decision made early in the project detailed design phase to improve the Bottle assembly fabrication schedule and meet the project schedule set by the owner/operator. Figure 1 below illustrates the cryogenic gas plant process flow arrangement and equipment item locations in relation to the Bottle assembly.

- 5 -
BOTTLEASSEMBLY
Figure 1 – GSP-MB Process Flow Schematic
PROJECT SCOPE AND DRIVERS
The HCP natural gas processing expansion project was a retrofit application meant to replace the original 200 MMSCFD turbo-expander cryogenic gas plant designed to process a leaner gas composition (See the Appendix for the original versus retrofit design inlet gas comparison.). Processing a richer gas composition limited both throughput and NGL recovery in the original plant. The modified gas processing plant, known at the HCP site as the Cryo-1 unit, was to process 200 MMSCFD of gas containing 4.2 gallons of ethane and heavier liquids per thousand standard cubic feet of inlet gas (G.P.M.) and achieve higher NGL recoveries than the original plant while meeting a lower methane concentration in the NGL product (Table 1).
Table 1 – Design Process Performance Comparison of Original vs. Retrofit Cryo-1 Unit
Cryo-1 Original Plant Retrofit Plant
Inlet Gas G.P.M. 2.3 4.2
Inlet Gas Flow, MMSCFD 200.0 200.0
Ethane Recovery, % 72.1 80.5
Propane Recovery, % 96.4 96.0
NGL Product Methane, mol% 2.0 1.5
The retrofitted gas plant re-used the original dehydration system and residue gas compressors. No additional residue gas compressor horsepower was added. The original plant TEC skid was also utilized, but a new center section was installed to improve the efficiency for the new inlet operating conditions. One of the original shell and tube heat exchangers from the original gas plant was re-tubed and used as a preheater upstream of the HMT module to provide the needed additional heat input during Joule Thomson (J-T) plant operation and winter condition operation. Additionally, two-thousand horsepower of new propane refrigeration was installed to provide supplemental cooling for the richer Eagle Ford shale gas and achieve the design NGL recovery levels as limited by the

- 6 -
existing residue gas compression. Table 2 below provides a summary of the project scope and schedule.
Table 2 –Retrofit Project Scope and Schedule Summary
200 MMSCFD capacity Install new propane refrigeration Process rich Eagle Ford shale gas Re-wheel TEC Retrofit of original gas plant Re-use dehydrators 46 week GSP-MB™ delivery Re-tube heat exchanger for preheater
Re-use residue gas compression
The cost for installing the GSP-MB plant was lower than the cost to revamp the original gas plant, but one of the main incentives for the GSP-MB plant was the shorter period of time for the plant to be out of service to complete the project. There was significant savings in downtime by using the GSP-MB plant. The downtime needed to perform tie-ins was only 10 days instead of 4-5 weeks of downtime for revamping the original gas plant. Additionally, the GSP-MB footprint was much smaller and could be conveniently located in an open plot space near the original process equipment and pipe rack. Pipe connections between the original and new process equipment could easily be made, and the original pipe rack could be utilized for the new pipe runs, particularly those needed to tie-in the new propane refrigeration system.
Figure 3 below is a picture of the completed Cryo-1 gas processing unit. The major equipment items for the retrofitted gas processing unit are outlined and identified to give a better understanding of the plant layout.
Figure 3 – Process Equipment Items Location
GSP-MB
TEC
Dehydrators
Refrigeration Chiller Residue Gas
Compressor
Original Tower (abandoned in place)

- 7 -
STARTUP CHALLENGES The plant startup will be addressed in two separate sections of the paper. All of the startup challenges will be described in this section, followed by a discussion of the solutions implemented to address the startup challenges in the next section. The list of challenges is as follows:
Richer-than-design inlet gas composition (20-40% richer-than-design)
Reduced heat transfer capacity due to heat exchanger fouling
Erratic inlet gas conditions and composition resulting in unstable plant operation
Dry-out valve leaking high methane content gas into the NGL product
Possible poor liquid distribution in the stripping section of the Bottle due to: o Trash collecting on distributor o Distributor limited for the richer-than-design inlet gas
Internal vapor bypass in the Bottle
Construction debris in piping and equipment
Water in the cryogenic gas plant after construction
Richer-than-design inlet gas composition
The biggest challenge was the richer-than-design inlet gas entering the plant. Table 3 provides the expected performance for the original retrofit design equipment sizes and design residue gas compression for four actual inlet gas compositions processed by the plant during startup in 2012. For reference, the table compares the results to the expected performance for the design composition.
Table 3 – Expected Theoretical Performance based on Actual Inlet Gas Compositions
Retrofit Design Expected Plant Performance
Base Case 1 Case 2 Case 3 Case 4 Inlet Gas G.P.M. 4.2 5.0 5.2 5.6 5.9Calculated Ethane Recovery, % 80.5 71 65 59 52Calculated Propane Recovery, % 96.0 95 94 93 91Relative NGL Production, % Base 110% 111% 112% 112%
Note: Actual inlet gas compositions for each case are included in the Appendix.
As illustrated by the results in Table 3, the expected NGL recovery efficiency is much lower for the richer compositions than the design case. When richer-than-design inlet gas is processed through any gas plant, the processing equipment is undersized to handle the greater quantity of ethane and heavier hydrocarbons in the gas, which will always affect the plant performance negatively because the gas cannot be cooled sufficiently and the tower stripping capacity needed for the NGL can be limited. When the gas entering the turbo-expander is warmer than design the volumetric flow to the machine is higher than design. This typically requires the J-T valve around the turbo-expander to open, further reducing the cooling applied to the gas. Additionally, plants operating with lower ethane recovery

- 8 -
levels must be reboiled at a warmer demethanizer bottom temperature to meet the same NGL product methane specification, which means a warmer reboiler heating source is required.
What has been described above is what actually took place when the plant was started up. The inlet gas composition was at times as much as 40% richer in ethane and heavier components than that for which the plant was designed. The plant heat exchangers, TEC, and propane refrigeration were under-designed for the richer gas, and as a result the plant could not reach the expected NGL recovery efficiency or meet the NGL product methane specification. The richer inlet gas could not be cooled sufficiently, and the volumetric flow to the turbo-expander was much higher than design and required the J-T valve to remain partially open to handle the higher flow rate. The reboiler heating source was the inlet gas, which was not warm enough to reboil the column effectively. As a result, the preheater upstream of the inlet gas pass of the HMT module was placed in continuous service. This proved critical for operating the plant and reducing the methane in the NGL product.
Reduced heat transfer efficiency due to heat exchanger fouling
The original 200 MMSCFD turbo-expander plant had a history of foreign material entering the gas plant with the inlet gas. Cleaning the process equipment by acid washing was an activity routinely done to remove the foreign material from inside the process equipment. No changes to eliminate the contaminant were made upstream of the retrofitted plant as part of this project.
When the Bottle was started up the unknown material coated the internal inlet gas passes on the new heat exchange equipment. Several of the new cryogenic gas plant heat exchangers fouled quickly. The fouling led to a reduction in the overall heat transfer coefficient (U) for each exchanger and combined with the richer gas severely affected the plant’s ability to cool down sufficiently for maximum recovery and to meet the NGL product specification.
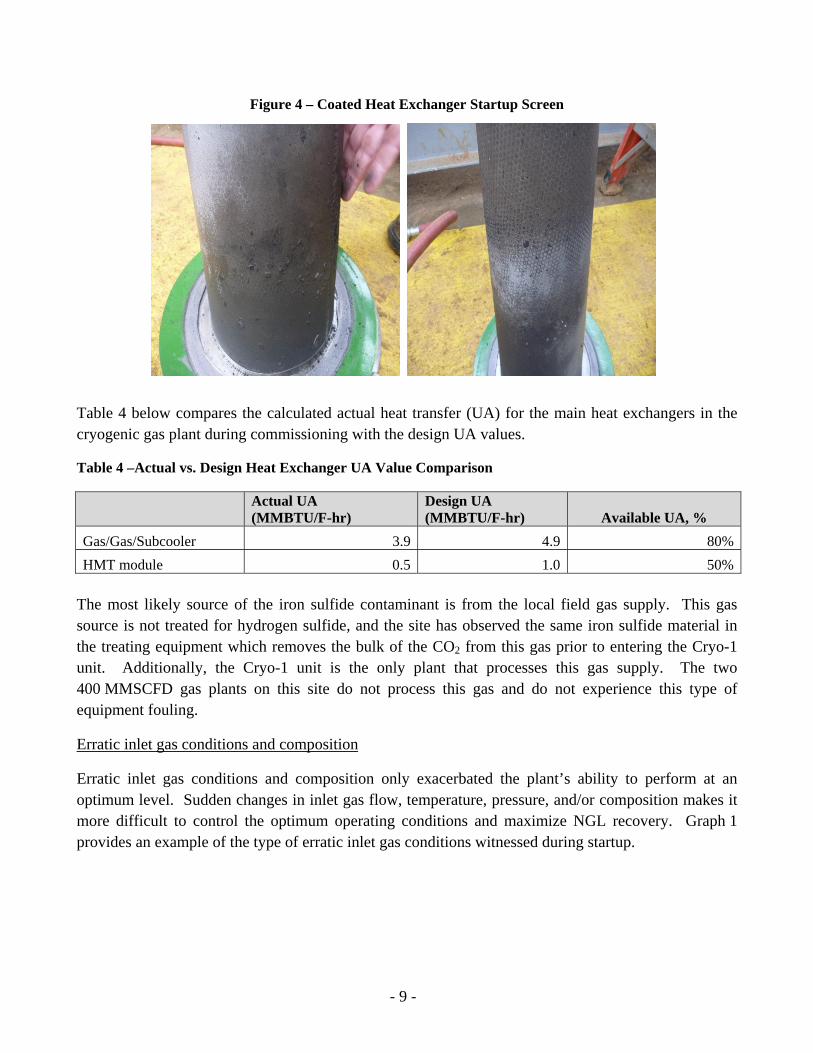
The commissioning team first witnessed the foreign material during the plant dry-out period while exchanger startup screens were being removed from the piping for cleaning. The foreign material was a black substance which had a “shoe polish” appearance. From its appearance and an initial sample analysis, the foreign material is most likely iron sulfide. Figure 4 below shows two pictures of a dirty startup screen coated with black material upstream of a heat exchanger pass.
- 9 -
Figure 4 – Coated Heat Exchanger Startup Screen
Table 4 below compares the calculated actual heat transfer (UA) for the main heat exchangers in the cryogenic gas plant during commissioning with the design UA values.
Table 4 –Actual vs. Design Heat Exchanger UA Value Comparison
Actual UA (MMBTU/F-hr)
Design UA (MMBTU/F-hr) Available UA, %
Gas/Gas/Subcooler 3.9 4.9 80%
HMT module 0.5 1.0 50% The most likely source of the iron sulfide contaminant is from the local field gas supply. This gas source is not treated for hydrogen sulfide, and the site has observed the same iron sulfide material in the treating equipment which removes the bulk of the CO2 from this gas prior to entering the Cryo-1 unit. Additionally, the Cryo-1 unit is the only plant that processes this gas supply. The two 400 MMSCFD gas plants on this site do not process this gas and do not experience this type of equipment fouling.
Erratic inlet gas conditions and composition
Erratic inlet gas conditions and composition only exacerbated the plant’s ability to perform at an optimum level. Sudden changes in inlet gas flow, temperature, pressure, and/or composition makes it more difficult to control the optimum operating conditions and maximize NGL recovery. Graph 1 provides an example of the type of erratic inlet gas conditions witnessed during startup.

- 10 -
Graph 1 – Erratic Inlet Gas Conditions
The inlet temperature spikes takes place during a dehydrator bed switch. The newly regenerated bed comes online at a warmer temperature than the process gas causing the inlet gas temperature to spike by 10°F to 15°F. Anytime the inlet gas pressure decreases, it directly affects NGL recovery because it reduces the pressure ratio across the turbo-expander and reduces the refrigeration in the plant. Maintaining stable inlet temperature and pressure is critical for best plant operation. Sudden changes in flow rate also affect plant stability, making it difficult to maintain optimum plant performance. Graph 2 is an example of the type of erratic inlet flow seen during startup.
Graph 2 – Erratic Inlet Gas Flow
During startup, plant operations had neither warning of nor the ability to predict when the composition was going to change. As a result, the demethanizer was typically over-reboiled in order to handle the swings in composition and ensure the NGL product did not exceed the maximum methane content. Graph 3 provides an example of the composition swings typically seen over one day.
920
930
940
950
960
970
980
990
0
20
40
60
80
100
120
0.0 0.5 1.0 1.5 2.0 2.5 3.0 3.5 4.0
Pressure, p
sig
Temperature, F
Feed Temp Feed Pressure
160
170
180
190
200
210
220
0.0 0.2 0.4 0.6 0.8 1.0
Inlet Gas Rate, M
MSCFD
Feed Rate
Duration, Days
Duration, Days

- 11 -
VALVEDRY-OUT
Graph 3 – Erratic Inlet Gas Composition
The graph shows significant changes in composition (up to a 30% change) during a single day. It was not uncommon for the ethane content to change by one percentage point in a single analyzer update (20 minute updates). Erratic compositions of this nature drastically change the feed rates and compositions to the demethanizer. The erratic inlet gas conditions and composition coupled with the richer gas made it very difficult to optimize ethane recovery while meeting the NGL methane specification.
Leaking dry-out valve
A two-inch line connecting the inlet gas feed from the HMT module inlet to the demethanizer bottom was included as part of the cryogenic gas plant design to supply warm, dry gas to the bottom of the column during dry-out. This section of the column remains stagnant during dry-out unless a supplemental flow is introduced. Figure 5 shows the supplemental dry-out line connection points. This line is fully opened during dry-out and is then closed once the plant is moisture-free and ready to process inlet gas. Following a plant shutdown, this valve was found leaking inlet gas directly into the NGL product.
Figure 5 – Dry-out Connection to Demethanizer Bottom
3.5
3.7
3.9
4.1
4.3
4.5
4.7
4.9
5.1
5.3
5.5
8.0
8.5
9.0
9.5
10.0
10.5
11.0
11.5
12.0
12.5
13.0
0.0 0.1 0.2 0.3 0.4 0.5 0.6 0.7 0.8 0.9 1.0
Ethane Content Propane Content
Duration, Days
Inlet Gas Ethane, m
ol%
Inlet Gas Propane, m
ol%

- 12 -
Possible poor liquid distribution in the stripping section of the Bottle assembly
Early on, the team was concerned that there could be an issue with the liquid/vapor distribution to the HMT module because the plant could not meet the NGL methane specification. The decision was made to gamma-scan the column to help determine column performance and liquid distribution, and to verify the integrity of the column internals.
The results from the scan showed that all column internals were in place. However, the scan indicated an abnormally high liquid level on the redistributor above the HMT module. It was originally believed this hindered good liquid distribution into the HMT module and contributed to the unit’s lower performance early on.
Internal vapor bypass in Bottle assembly
A gap in the seal around the HMT module was found. Both Ortloff and the equipment supplier suspected that some stripping vapors were bypassing the HMT module, which could be contributing to the elevated methane content in the NGL product. The commissioning team along with the vessel fabricator engineered and installed a seal to ensure vapors could not bypass the HMT module.
Construction debris in piping and equipment
Any debris remaining in the piping and equipment after construction has its first opportunity to move toward downstream process equipment when flow is introduced during dry-out. Debris that collects or lodges in process equipment will restrict or completely obstruct flow, causing higher system pressure drop and lower NGL recovery.
Multiple startup screens upstream of several heat exchangers showed signs of high pressure drop during dry-out. The plant was shut down numerous times for screen cleaning and one screen had to be replaced because of damage from high differential pressure due to hydrates. Concerns about what may have escaped the damaged startup screens led to back-puffing some of the heat exchangers. Additionally, startup debris was found collected above the HMT module inside the column which was causing liquids to build up above the device.
Water in the cryogenic gas plant
It is common in all cryogenic gas plants for water to collect in piping and equipment during and after construction activities and removing water is a standard practice performed before the plant is cooled down. However, the length of dry-out is always dependent on the amount of water remaining in the processing unit. The commissioning team performed an extended dry-out to remove the moisture from the plant. Methanol was used in process locations where deemed necessary to remove water and hydrates.
Early on during startup, hydrates forming in process piping and equipment hindered the plant from cooling effectively, and restricted flow through some areas of the plant causing operational problems.

- 13 -
Initially, hydrates in the stripping section of the demethanizer were suspected to be contributing to the high methane content in the NGL product.
SOLUTIONS IMPLEMENTED DURING STARTUP The following section explains the solutions implemented during startup to address the issues causing reduced plant performance discussed in the previous section. Many of these solutions were implemented in parallel because a single cause for the poor initial plant performance could not be identified. Additionally, some solutions were “added insurance”, which was helpful in the end because of the ongoing erratic inlet gas conditions and composition.
The changes below were implemented during two plant shutdowns.
A second propane refrigeration chiller was installed upstream of the cold separator to supplement the cooling for the richer-than-design inlet gas
Supplemental heat input to the demethanizer to compensate for HMT module fouling and the richer-than-design inlet gas
o Preheater used to provide hotter gas to fouled HMT module due o External steam heater installed as reboiling capacity “insurance”
Blinded leaking dry-out valve
Sealed vapor bypass around HMT module
Eliminated liquid buildup above the HMT module in demethanizer o Construction debris removed o Modified distributor design
Construction debris removed from plant piping and Bottle assembly
Installation of second propane refrigeration chiller
The owner/operator connected a second propane refrigeration chiller in series with the chiller installed as part of the plant retrofit project (Figure 6). This second chiller was in the original Cryo-1 gas plant, and was re-piped so it could use available refrigeration capacity from the lean oil plant to further cool the inlet gas upstream of the cold separator.

- 14 -
REFRIGERATIONADDITIONAL
Figure 6 –Location of Additional Propane Refrigeration
Graph 4 illustrates the plant performance prior to installing the second chiller, during a time period when the feed conditions and composition remained relatively stable. The inlet gas being processed was 5.0 G.P.M. at an average inlet gas rate of 196 MMSCFD. The cold separator temperature was 20°F warmer than design, which implies a much higher volumetric flow to the turbo-expander than design. At this temperature, the volumetric flow was too high to pass through the expander without exceeding the maximum speed of the machine; therefore, the J-T valve had to open in order to pass part of the entire flow affecting the efficiency of the plant and NGL recovery. To compensate, the operations team utilized available residue gas compression capacity to reduce the column pressure to lower than design to help cool the cold separator temperature as much as possible and decrease the volumetric flow to the expander. The lower column pressure also lowered the bottom temperature required and the preheater outlet temperature needed to reboil the demethanizer.
The plant averaged 73% ethane recovery, but still produced an average of 109% of the design NGL production. The methane concentration in the NGL product averaged 2.0% during this time period allowing the owner to blend the NGL product with the other NGL product streams and meet the pipeline specification. Note that this plant performance was achieved with fouled heat exchangers. Also, reboiling of the demethanizer was provided by the HMT module during this time period using the preheater to increase the temperature of the inlet gas.

- 15 -
Graph 4 – Plant Performance without Second Chiller
The new chiller increased the available refrigeration capacity by about 40%, which allowed the cold separator to operate closer to the design temperature and allowed the turbo-expander to operate without the J-T valve opening as often. Graph 5 depicts the improved performance immediately following the installation of the additional refrigeration. The plant was processing 5.3 G.P.M. inlet gas, which is 6% richer than the inlet gas composition from the performance shown in Graph 4 (5.0 G.P.M.).
During this 3-day period, the methane content averaged 2.0% (again low enough to be blended with the NGL produced from the other gas plants at the site and remain below the methane content product specification). The reboiling for the demethanizer was provided by just the HMT module. The cold separator was only 11°F warmer than design instead of 20°F. The plant averaged 80.6% ethane recovery and produced an average of 118% of the design NGL while processing this rich gas composition at an average inlet gas rate of 200 MMSCFD. The plant processed as much as 210 MMSCFD and reached an ethane recovery level as high as 86.0%.
Graph 5 - Plant Performance with Additional Propane Refrigeration
100%
105%
110%
115%
120%
125%
130%
135%
140%
0
50
100
150
200
250
Rel. N
GL Production, %
of Design Flow
Inlet Gas Rate, M
MSCFD
Inlet Gas Rate Relative NGL Product FLow
100%
105%
110%
115%
120%
125%
130%
135%
140%
0
50
100
150
200
250
Rel. N
GL Production, %
of Design Flow
Inlet Gas Rate, M
MSCFD
Inlet Gas Rate Relative NGL Product Flow

- 16 -
Supplemental demethanizer heat input to compensate for HMT module fouling and richer inlet gas
Although all of the heat exchangers were cleaned once during startup, the heat exchangers quickly fouled again after inlet gas was reintroduced into the plant. Due to the reduced UA values as a result of fouling, some operating adjustments had to be made, particularly with the HMT module. The preheater, which was originally installed for J-T mode operation and winter conditions, was used to provide supplemental heat to the HMT module by increasing inlet gas temperature in order to raise the demethanizer bottom temperature to strip more methane from the liquids.
Because the inlet gas temperature had to be increased to provide supplemental heat to the HMT module due to the lower-than-design U-value from fouling, the inlet gas exiting the HMT module was warmer-than-design further affecting the plant’s ability to sufficiently cool down. This issue in conjunction with the richer-than-design inlet gas created a situation much worse on plant performance than if the plant only had to deal with and address one of the two issues.
In addition to increasing the preheater gas outlet temperature, additional heat input was provided by pumping a small portion of the demethanizer bottoms through a steam heater and back to the column. The steam heater was installed during startup by the owner/operator to supply additional reboiling capacity if needed. During startup this heater was helpful, particularly before the second refrigeration chiller was installed.
The HMT module has demonstrated that it can still produce NGL with methane content near design when processing a richer gas without the use of the steam heater even when fouled. However, by keeping the steam heater in service, the plant operations team has a reboiling “cushion” that allows the plant to better handle changes in inlet gas composition and still ensures the NGL product remains below the methane specification. For recent plant operations, the heat input from the steam heater contributes less than 5% of the total reboiler duty required for the column, and its contribution is only to provide some reboiling margin for plant operations.
Blinded leaking dry-out valve
The leaking dry-out valve was blinded when it was found to be leaking following a planned shutdown, and eventually a double-block–and-bleed was installed. Simulations conducted using the plant data for various time periods during startup indicated this leaking valve was a significant contributor to the higher methane content in the NGL product. The estimated contribution of the leak was as much as 1.0 percentage point increase in methane content.
Sealed vapor bypass around HMT module
A permanent seal was installed to close the gap around the HMT module. The seal was installed at the same time as the additional refrigeration and at the time when the leaking dry-out valve was blinded. A comparison of field data before and after the changes confirmed that all the changes were effective. However, it was not possible to quantify the effect of the vapor leak around the HMT module. During

- 17 -
startup, both Ortloff and SME-P were concerned that the vapor bypass had a significant effect on the performance of the HMT module. Ortloff has since modeled several possible vapor bypass scenarios and has concluded that the amount of vapor bypass resulting from the observed gap size may not have been detectable from the plant data or in plant performance.
Eliminated liquid buildup above the HMT module
Additional mass transfer stages were included above the HMT module in the demethanizer design to ensure there was excess fractionation in the stripping section of the column. This was the first industrial application of the Bottle technology, and both Ortloff and SME-P believed the design margin was worth the additional cost. As a result, a very short bed of random packing was installed followed by a liquid redistributor above the HMT module.
Based on the gamma scan results, a vessel entry was planned in order to address the liquid buildup above the HMT module. Because the commissioning team was not completely sure what was causing the liquid buildup, an alternate design was developed in conjunction with the mass transfer equipment supplier to improve on the original liquid distribution design described above and to accommodate the higher liquid loadings. The original design was to be replaced with structured packing, as the mass transfer company believed that the structured packing would give better liquid distribution exiting the bottom of the bed compared to random packing. Note that the changes had to be planned before the column was opened for inspection.
After entering the column, the inspection team found the original packing was evenly distributed throughout the bed and there was no damage to the individual rings. The team did discover, however, that 10 gallons of debris had collected on the redistributor above the HMT module. Despite discovering the startup debris, the structured packing was still installed. In retrospect, the original random packing probably did not need to be replaced. Its liquid distribution above the HMT module was probably adequate to ensure proper heat transfer and fractionation. However, the debris that had collected on the redistributor would not have been discovered without removing the random packing above it.
Both the startup debris and redistributor were removed from the column. The redistributor above the HMT module was a restriction at the higher liquid loading as a result of the richer feed gas. It was concluded that the combination of debris and the undersized redistributor was the cause for the liquid build-up above the bed.
Construction debris removed from plant piping and Bottle assembly
Most of the construction debris within the plant piping was removed early on by cleaning the heat exchanger startup screens. As mentioned in the previous section, some of this debris found its way into the Bottle assembly. Figure 7 is a picture showing some of the debris collected on the redistributor above the HMT module. The picture shows how debris had collected in the troughs of the distributor and lodged in the perforations.

- 18 -
Figure 7 – Construction Debris in Bottle above HMT Module
POST-STARTUP PLANT OPERATION
The plant has continued to operate with richer-than-design inlet gas compositions and erratic inlet gas conditions and compositions. The heat exchangers continued to operate at reduced heat transfer capacity due to fouling. However, after the changes discussed in the previous section were implemented, the plant has demonstrated it is capable of performing at design recovery levels, design capacity, and acceptable methane concentrations in the NGL product. Graph 6 below is an example of the plant’s performance capabilities in 2012.
Graph 6 – Gas Plant Performance (Post-Startup)
During this time period the plant averaged 80.0% ethane recovery while processing an average of 204 MMSCFD of gas with an ethane-plus content of 5.4 G.P.M. Graph 7 shows the resulting NGL product flow and methane concentration during the same time period.
150
160
170
180
190
200
210
220
230
0%
10%
20%
30%
40%
50%
60%
70%
80%
90%
100%
Inlet Gas Rate, M
MSCFD
Ethane Recovery, %
Ethane Recovery, % Feed Rate
Top view of redistributor trough
View from beneath redistributor

- 19 -
Graph 7 – Relative NGL Product Flow and Methane Concentration (Post-Startup)
During this time period the heat input to the column was only provided by the HMT module after pre-heating the inlet gas. The average product flow rate is 20% higher than design and the product methane concentration averaged 1.6 mol% (only 0.1 mol% higher than design) while processing a richer gas, allowing the plant operator to easily blend the product with the other NGL product streams and meet the pipeline specification.
Although the inlet gas flow, temperature, and pressure were still erratic, the plant was able to manage the swings reasonably well. This is consistent with the confidential laboratory testing data which indicated that the HMT module was stable and operated with constant HETPs over a wide range of vapor-liquid loadings. Graph 8 shows the temperature and pressure changes during the same time period as Graphs 6 and 7.
Graph 8 – Inlet Gas Temperature and Pressure
Although still operating with reduced heat exchanger UA values due to fouling, the HMT module showed very good fractionation capabilities even under the higher liquid load. Graph 9 provides HMT
100%
105%
110%
115%
120%
125%
130%
135%
140%
0.0
0.2
0.4
0.6
0.8
1.0
1.2
1.4
1.6
1.8
2.0
Relative NGL Production, %
of Design Flow
NGL Product M
ethane, m
ol%
NGL Product C1 Relative NGL Product Flow
920
930
940
950
960
970
980
0
20
40
60
80
100
120
Pressure, p
sig
Temperature, F
Feed Temp Feed Pressure

- 20 -
module temperature profile for a different time period in 2012 with only the preheater in service. The plant throughput during this time period was 198 MMSCFD, recovering 81.5% of the ethane from the inlet gas with the liquid flow through the column bottoms being 18% higher than design. Based on the plant data, as shown in the graph below, the HMT module fractionation is providing the design number of theoretical stages with good temperature spread across the unit. (Temperature indicators were included along the length of the HMT module as part of the original design to monitor its performance).
Graph 9 – HMT Module Fractionation (Post-Startup)
The HMT module has demonstrated its ability to handle the higher liquid and vapor loads without flooding. Graph 10 shows the pressure drop across the entire stripping section of the demethanizer (including the HMT module column side) during the same time period as Graph 9. The pressure drop is still well within the expected pressure drop range despite the higher liquid and vapor traffic in the HMT module.
‐100
‐80
‐60
‐40
‐20
0
20
40
60
80
100
Temperature, F
HMT Bottom HMT Btm‐Mid HMT Middle
HMT Top‐Mid HMT Top
~150°F

- 21 -
Graph 10 – HMT Module Column-side Pressure Drop Profile
CURRENT PLANT OPERATION
The Cryo-1 Bottle plant now has three years of operating history behind it. The plant is still processing a gas richer than the original retrofit design composition and is subjected to erratic inlet gas conditions and compositions. The heat exchangers are still fouled. However, the plant operator manages the inlet gas conditions and composition swings as well as possible, and has been proactive in addressing items which can be addressed. But with multiple producers providing gas to the Cryo-1 unit, the site is totally dependent on what the inlet gas pipeline delivers. Cryo-1 is still capable of performing at design capacity and ethane recovery when inlet gas conditions and composition are stable, and can produce more NGL than design while meeting the methane content specification for the NGL product. Ethane recovery and NGL specification graphs for early December 2014 are shown in Graphs 11 and 12 below.
Graph 11 – Current Gas Plant Performance Results
0.0
0.2
0.4
0.6
0.8
1.0
1.2
1.4
1.6
1.8
2.0
155 160 165 170 175 180 185 190 195 200 205 210 215
Column Stripping Section dP, psi
Inlet Gas Flow, MMSCFD
150
160
170
180
190
200
210
0%
10%
20%
30%
40%
50%
60%
70%
80%
90%
100%
Inlet Gas Rate, M
MSCFD
Ethane Recovery, %
Ethane Recovery, % Feed Rate
Design dP

- 22 -
Graph 12 – Relative NGL Product Flow and Methane Content (Current)
As Graphs 11 and 12 show, the plant averaged 80% ethane recovery while processing an average of 190 MMSCFD of gas with an ethane-plus content of 5.0 G.P.M. The plant operations team still uses the external steam heater to provide operating margin in the form of additional reboiling capability to better handle changes in inlet gas conditions and/or composition. The average NGL methane content during this time period was 1.4% while averaging 22% more NGL production than design.
The HMT module is still performing well despite operating under conditions much different than that for which it was designed. The unit is still operating with a lower UA value due to fouling, but is still capable of processing the much richer gas composition. The following graph (Graph 13) provides the temperature difference across the HMT module giving indication to the amount of fractionation it is providing. Its fractionation performance still remains equally as good as it was during the immediate post-startup operation.
Graph 13 – HMT Module Fractionation (Current)
100%
105%
110%
115%
120%
125%
130%
135%
140%
0.6
0.8
1.0
1.2
1.4
1.6
1.8
Rel. N
GL Production, %
of Design Flow
NGL Product M
ethane, m
ol%
NGL Product C1 Relative NGL Product Flow
‐100
‐80
‐60
‐40
‐20
0
20
40
60
80
100
Temperature, F
HMT Bottom HMT Btm‐Mid HMT MiddleHMT Top‐Mid HMT Top
~ 150°F

- 23 -
The HMT module continues to handle the higher liquid and vapor loads without flooding. Graph 14 shows the effect of pressure drop across the entire stripping section of the column, including the HMT module column side, which is still well within the normal pressure drop range for this section of the column.
Graph 14 – HMT Module Column-side Pressure Drop Profile (Current)
PLANT IMPROVEMENTS
Since startup the HCP site has replaced the TEC center section with wheel sizes that allow the machine to operate more efficiently at the average actual inlet conditions. The new center section also allows the turbo-expander to operate without the J-T valve around the expander opening. The J-T valve remaining closed further improves operating efficiency and plant performance.
The owner is currently implementing several improvements upstream of the Cryo-1 unit to better handle the richer inlet gas and ensure it remains in vapor phase through front-end treatment. (The heavier hydrocarbons in the inlet gas condense in the upstream piping and dehydrators and the molecular sieve adsorbs the liquids. This causes the molecular sieve to break apart during regeneration when the heavier hydrocarbons desorb). In order to eliminate this inlet gas retrograde condensation, the site is installing a new knock-out drum and has re-piped the gas/gas exchanger from the original 200 MMSCFD gas plant to be used for heating the inlet gas upstream of the dehydrators. Figure 8 illustrates the location of the newly installed process equipment.
0.0
0.2
0.4
0.6
0.8
1.0
1.2
1.4
1.6
1.8
2.0
155 160 165 170 175 180 185 190 195 200 205
Column Stripping Section dP, psi
Inlet Gas Flow, MMSCFD
Design dP

- 24 -
KNOCK-OUTDRUM
INLET GASHEATER
TO RESIDUE GASCOMPRESSION
Figure 8 – Inlet Gas Liquids Knock-out and Pre-Heating
Additionally, the HCP plant personnel are pursuing methods for eliminating the suspected iron sulfide contaminant. However additional legwork needs to be done in order to determine how to best treat the inlet gas.
CONCLUSION
Many gas processors have had to deal with a richer-than-design inlet gas composition at startup. At the HCP site, the plant startup was a challenge; however the commissioning team successfully modified the plant to accommodate the richer gas as well as addressed the other challenges discussed in this paper. After three years of operation, the new Bottle design has shown it is very forgiving operationally, with the ability to process gas at design ethane recovery and design capacity over a wide range of operating conditions well beyond its original design.
The Houston Central Plant is a world-class gas processing facility with a wealth of experience at the plant management level. The Cryo-1 gas processing plant has demonstrated it is capable of performing at design capacity producing on-specification NGL at design recovery levels while processing a richer-than-design inlet gas.
REFERENCES CITED
(1) Wilkinson, J.D., Hudson, H.M., Lynch, J.T., Munden, S.J., Miller, S.A., Cuellar, K.T., Johnke, A.F., Lewis, W.F. “Gas Plant in a Bottle™”, 90th Annual Convention of the Gas Processors Association, April 4, 2011.
(2) Johnke, A.F., Lewis, W.L., Wilkinson, J.D., Lynch, J.T., Hudson, H.M., and Cuellar, K.T., Tyler, L.D., U.S. Patent Application No. 13/048,315.

- 25 -
APPENDIX
A. Cryo-1 Design Inlet Gas Conditions and Composition Comparison (Original vs. Retrofit Design)
Inlet Gas
Original Design Retrofit Design
Temperature, °F 80 100
Pressure, psig 939 930
Molar Flow, MMSCFD 200 200
Nitrogen 0.11% 0.15%
Carbon Dioxide 2.34% 2.00%
Methane 89.37% 82.85%
Ethane 5.11% 9.25%
Propane 1.64% 3.31%
i-Butane 0.36% 0.74%
n-Butane 0.36% 0.89%
i-Pentane 0.17% 0.33%
n-Pentane 0.11% 0.22%
Hexane Plus 0.43% 0.26%
Total Mol% 100.00% 100.00%
B. Inlet Gas Compositions for Table 3
Case 1 Case 2 Case 3 Case 4
4/23/2012 5/1/2012 4/27/2012 5/17/2012
Feed G.P.M. 5.0 5.2 5.6 5.9
Nitrogen 0.14% 0.15% 0.15% 0.16%
Carbon Dioxide 0.65% 0.61% 0.49% 0.24%
Methane 81.59% 80.84% 79.57% 78.56%
Ethane 10.35% 11.12% 11.82% 12.57%
Propane 4.35% 4.58% 4.98% 5.34%
i-Butane 0.90% 0.87% 0.97% 1.01%
n-Butane 1.13% 1.07% 1.20% 1.23%
i-Pentane 0.35% 0.30% 0.33% 0.38%
n-Pentane 0.24% 0.21% 0.23% 0.24%
Hexane Plus 0.30% 0.25% 0.27% 0.27%
Total 100.00% 100.00% 100.00% 100.00%