finite element analysis prediction of stresses in h.l
TRANSCRIPT

Clemson UniversityTigerPrints
All Theses Theses
5-2011
Finite Element Analysis Prediction of Stresses inH.L. Hunley Submarine by Global-to-Local ModelCoordinationAditya sai nag ChoragudiClemson University, [email protected]
Follow this and additional works at: https://tigerprints.clemson.edu/all_theses
Part of the Mechanical Engineering Commons
This Thesis is brought to you for free and open access by the Theses at TigerPrints. It has been accepted for inclusion in All Theses by an authorizedadministrator of TigerPrints. For more information, please contact [email protected].
Recommended CitationChoragudi, Aditya sai nag, "Finite Element Analysis Prediction of Stresses in H.L. Hunley Submarine by Global-to-Local ModelCoordination" (2011). All Theses. 1074.https://tigerprints.clemson.edu/all_theses/1074
FINITE ELEMENT ANALYSIS PREDICTION OF STRESSES IN H.L.
HUNLEY SUBMARINE BY GLOBAL-TO-LOCAL MODEL
COORDINATION
A Thesis
Presented to
the Graduate School of
Clemson University
In Partial Fulfillment
of the Requirements for the Degree
Master of Science
Mechanical Engineering
by
Aditya Sai Nag Choragudi
May 2011
Accepted by:
Dr. Vincent Blouin, Committee Chair
Dr. Gang Li
Dr. Richard Miller
Dr. Lonny Thompson
ii
ABSTRACT
H.L Hunley was a submarine of the Confederate States of America that
participated in the American Civil War. On February 17, 1864, H.L.Hunley created
history by becoming the first submarine to sink a enemy ship after its attack on USS
Houstanic. After Hunley never returned to the shore and the details of its wreck were
unknown. On August 8, 2000, H. L Hunley was brought to the surface after 136 years of
its wreckage. The submarine is currently at the Warren Lasch Conservation Center
located in Charleston.
This study focuses on the structural analysis of the H.L Hunley submarine to
predict stresses and potential structural failure. Modeling the structure is challenging
because of (1) the lack of symmetry due to its current position, (2) non-uniformity due to
high corrosion, and (3) the riveted connections with more than 4000 rivets. Although
connections between plates in ships are generally considered stronger and stiffer than the
rest of the structure, this assumption is assumed to be invalid in the case of the Hunley
because of the high and non-uniform corrosion. Since modeling the entire submarine and
its 4000 rivet is impossible, the purpose of this study is to create a coordination procedure
between the global model of the submarine with simplified connections and the local
model of a riveted connection to affectively predict the stresses. The Global model is the
whole submarine modeled using shell elements to decrease complexity. The local model
consists of one of the riveted connections in the submarine. The validation of the
procedure is discussed.

iii
DEDICATION
To my parents Mr. Ch. Subrahmanyeswara Rao and Ch. Vijaya Nirmala.

iv
ACKNOWLEDGMENTS
I would like to acknowledge my advisor, Dr. Blouin for his continuous support,
encouragement and patience.
I would like to acknowledge all the Committee members, Dr. Gang Li, Dr.
Richard Miller, Dr. Lonny Thompson, for providing their valuable input and actively
participating in decision making for recommendations of this study.
Additionally I would like to acknowledge Warren Lasch Conservation Center for
its financial support.
v
TABLE OF CONTENTS
Page
TITLE PAGE ................................................................................................................. i
ABSTRACT .................................................................................................................... ii
DEDICATION ............................................................................................................... iii
ACKNOWLEDGMENTS .............................................................................................. iv
LIST OF TABLES ....................................................................................................... viii
LIST OF FIGURES ........................................................................................................ ix
CHAPTER 1 .................................................................................................................... 1
INTRODUCTION ........................................................................................................... 1
1.1 Background ............................................................................................................ 1
1.2 Research Goals ...................................................................................................... 4
1.3 History of H.L. Hunley .......................................................................................... 7
1.3.1 Recovery of H.L. Hunley ................................................................................... 8
1.3.2 Conservation of H.L. Hunley ............................................................................. 9
1.4 Literature review.................................................................................................. 11
1.5 Thesis Outline ...................................................................................................... 13
CHAPTER 2 .................................................................................................................. 14
GLOBAL MODEL ....................................................................................................... 14
2.1 Global Model ....................................................................................................... 14
2.2 Plate thickness and mass density ......................................................................... 17
2.3 Mechanical properties.......................................................................................... 18
2.3.1 Stiffness ............................................................................................................ 18
2.3.2Strength .............................................................................................................. 19
2.3.3 Interaction Properties ........................................................................................ 19
vi
2.4 Global model assembly: ...................................................................................... 21
2.4.1 Slings ................................................................................................................ 21
2.4.2 Foam cushions .................................................................................................. 22
2.4.3 Hull ................................................................................................................... 23
2.4.4 Compression hoops .......................................................................................... 24
2.5 Boundary Conditions and Loads ......................................................................... 26
2.6 FEA mesh ............................................................................................................ 27
2.7 Results: ................................................................................................................ 28
2.8. Parametric study ................................................................................................. 31
CHAPTER 3 .................................................................................................................. 32
LOCAL MODEL .......................................................................................................... 32
3.1 Riveted connections ............................................................................................. 32
3.2 3D local model .................................................................................................... 34
3.2.1Top Plate ............................................................................................................ 34
3.2.2 Bottom Plate ..................................................................................................... 35
3.2.3. Rivet ................................................................................................................ 35
3.3 Assembly and Material Properties:...................................................................... 36
3.4 Interaction properties: .......................................................................................... 36
3.5 Boundary Conditions ........................................................................................... 38
3.6 Loads ................................................................................................................... 41
3.7 Results ................................................................................................................. 43
3.8 Shell local model ................................................................................................. 45
3.8.1 Loads and Boundary conditions ....................................................................... 46
3.8.2 Results .............................................................................................................. 46
CHAPTER 4 .................................................................................................................. 47
FINDING ACTUAL STRESSES IN RIVETED CONNECTION ............................... 47
4.1 Matching 3D local model to the shell local model .............................................. 47
4.2 Simplified global model ...................................................................................... 49
vii
4.2.1 Simplified submarine ........................................................................................ 50
4.2.2 Material properties ............................................................................................ 51
4.2.3 Finite Element Analysis of the simplified submarine ...................................... 52
4.2.4 Results .............................................................................................................. 53
4.3 Validating the thickness and stiffness values ...................................................... 54
4.4 Matching the strain .............................................................................................. 55
4.5 Finding the final stresses in the riveted connection ............................................. 55
CHAPTER 5 .................................................................................................................. 57
CORRODED RIVETED MODEL ............................................................................... 57
5.1 Introduction to Marine corrosion ......................................................................... 57
5.2 Modeling corrosion ............................................................................................. 57
5.3 Finite Element Analysis ...................................................................................... 59
5.4 Results ................................................................................................................. 60
CHAPTER 6 .................................................................................................................. 62
CONCLUSION AND FUTURE WORK ...................................................................... 62
6.1 Conclusion ........................................................................................................... 62
6.2 Future Work ......................................................................................................... 63
REFERENCES .............................................................................................................. 64
viii
LIST OF TABLES
Table Page
2.1 Physical and mechanical properties.............................................................................19
2.2 Parametric study of effect of corrosion on stress in Global Model............................. 30
3.1 Parametric study on the effect of Frictional coefficient on Maximum stress............. 43
3.2 Parametric study on the effect of Pretension on Maximum stress….......................... 44
4.1 Pseudo values of stiffness, thickness of riveted region after matching
displacement................................................................................................................ 48
4.2 The results of the simple global model analysis.......................................................... 53
4.3 Thee material properties assigned to riveted region.................................................... 53
4.4 The difference in results before and after applying pseudo values............................. 54
4.5 Validation of pseudo values........................................................................................ 54
ix
LIST OF FIGURES
Figure Page
1.1 Recovery of H.L. Hunley, August 2000………………………………………........ 1
1.2 H.L. Hunley, cushions and sling system in conservation tank ……………………..2
1.3 The submarine is composed of about 70 plates and backing ………………........... 2
1.4 The submarine is now open and emptied ……………………………………......... 3
1.5 Simplification of complex geometry..…………………………………………....... 5
1.6 H.L Hunley with its crew ………………………………………………………..... 7
1.7 H.L Hunley during the recovery and in Conservation tank……………….……......9
2.1The complete assembly of the Global Model……………………………..……..... 15
2.2 Iron plates are sandwiched between two concretion layers…………………….....17
2.3 The slings used in the analysis………………………………………………….....21
2.4 Design of the foams used in the analysis……………………………………….....22
2.5 The design of the submarine used in the analysis………………………………....23
2.6The design of the hoops used in the analysis……………………………………....23
2.7 Model components…………………………………………………………….......24
2.8 Model of the submarine in upright position on fixed keel blocks........................... 25
2.9 The Boundary conditions and loads on the global model………………………... 26
2.10 Finite element mesh……………………………………………………………... 27
2.11 Submarine in slings at 45-degree roll angle…………………………………...... 28
2.12 Submarine in slings at 20-degree roll angle…………………………………...... 28
2.13 Submarine in slings in upright position………………………….... …………….29
x
LIST OF FIGURES(CONTINUED)
Figure Page
2.14. Submarine in upright position on fixed keel blocks............................................. 29
3.1 Riveted connections are modeled as uniform plates in
the global model of the sub..……………………………………………......…….31
3.2 The three models used in the coordination procedure……………………......……32
3.3 Actual shape of the rivets and the shape used in the analysis……………......……33
3.4 Front view and the Top view of the Top Plate…………………………….....……34
3.5 Three dimensional model of the Bottom plate…………………………….....……34
3.6 Three dimensional model of the rivet…………………………………………..... .35
3.7 The three dimensional assembly of the local riveted model……………………....35
3.8 Contact interaction between top plate and bottom plate………………………......36
3.9 Contact interaction between rivet and bottom plate…………………………….... 36
3.10 Contact interaction between top plate and rivet……………………………….... 37
3.11 On end of rivet is fixed in steps1 and 2………………………………………..... 38
3.12 The end of the bottom plate is fixed in steps1 and 2…………………………..... 39
3.13 Boundary conditions applied for symmetry and repition……………………...... 39
3.14 The end of top plate is fixed for all steps…………………………………….......40
3.15 State of stress from the global model………………………………………….....41
3.16 Pressure load applied on the top plate…………………………………………....42
3.17 Stress calculations in the local rivet model…………………………………........42
LIST OF FIGURES (CONTINUED)
xi
Figure Page
3.18 Von mises stress distribution in rivet………………………………………….....43
3.19 Local shell model used……………………………………………………….......44
3.20 Stress analysis of local shell model…………………………………………....... 46
4.1 Block diagram of the procedure used to find the pseudo values of stiffness,
thickness………………………………………………………………………..... 47
4.2 Graph demonstrating the pseudo values of the stiffness and thickness ………......49
4.3 Simplified 3D global model……………………………………………….............50
4.4 Flow diagram of the procedure used to find the final value of stresses………...... 51
4.5 The 3D assembly of the simplified Submarine model……………………….........52
4.6 Stress calculation in 3D rivet model after increased pressure………………......... 56
5.1 The corrosion in the H.L Hunley……………………………………………......... 59
5.2 Rivet model before and after the application of corrosion……………………...... 60
5.3 Three-dimensional local model of corroded riveted connection………………..... 60
5.4 Von Mises stresses in the corroded rivet………………………………………..... 61
1
CHAPTER 1
INTRODUCTION
1.1 Background
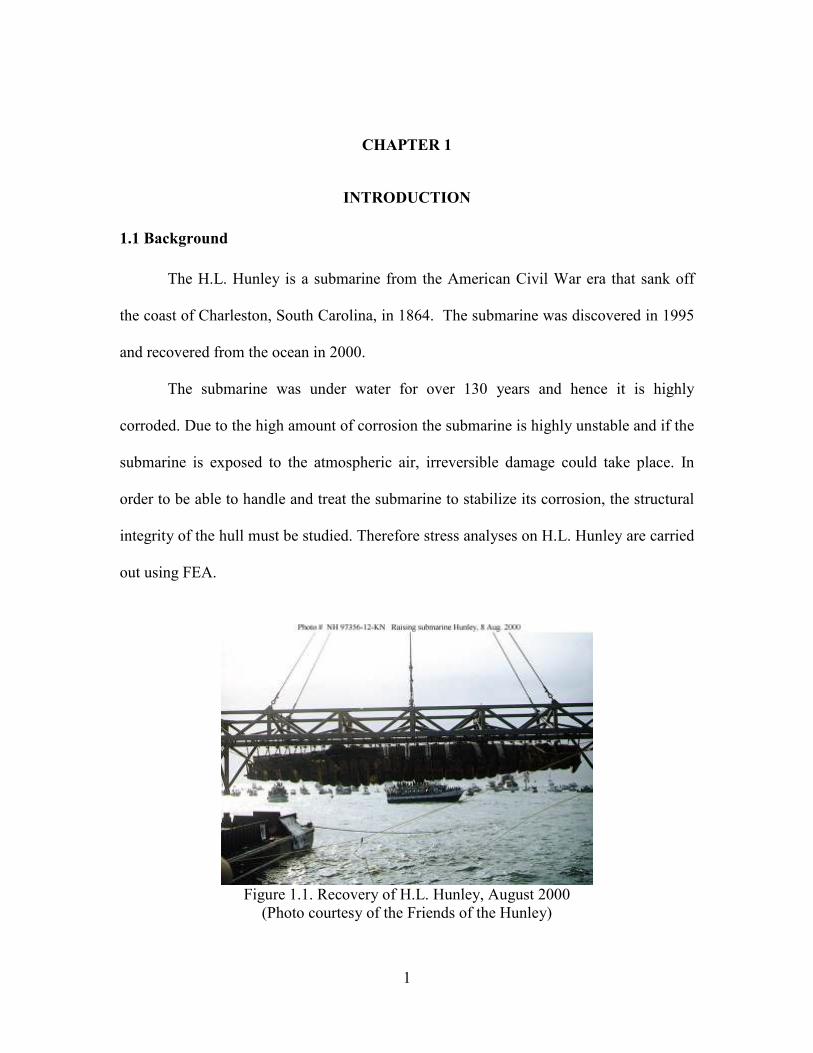
The H.L. Hunley is a submarine from the American Civil War era that sank off
the coast of Charleston, South Carolina, in 1864. The submarine was discovered in 1995
and recovered from the ocean in 2000.
The submarine was under water for over 130 years and hence it is highly
corroded. Due to the high amount of corrosion the submarine is highly unstable and if the
submarine is exposed to the atmospheric air, irreversible damage could take place. In
order to be able to handle and treat the submarine to stabilize its corrosion, the structural
integrity of the hull must be studied. Therefore stress analyses on H.L. Hunley are carried
out using FEA.
Figure 1.1. Recovery of H.L. Hunley, August 2000
(Photo courtesy of the Friends of the Hunley)
2
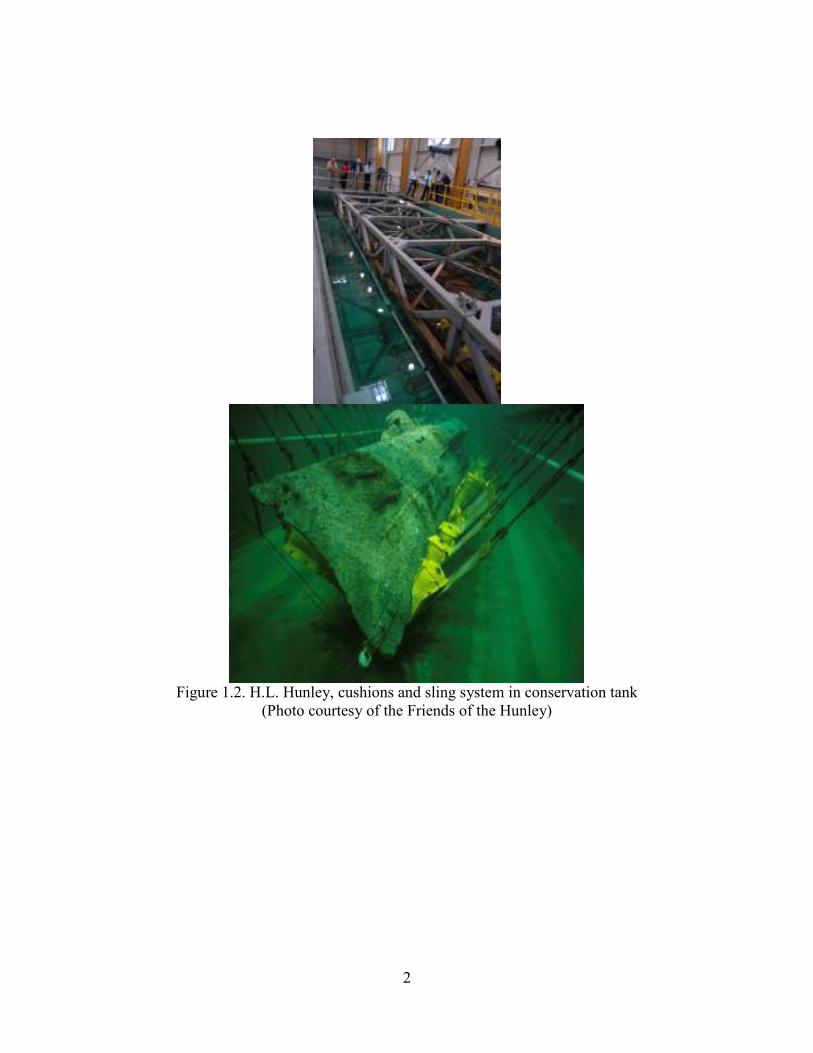
Figure 1.2. H.L. Hunley, cushions and sling system in conservation tank
(Photo courtesy of the Friends of the Hunley)

3
Figure 1.3. The submarine is composed of about 70 plates and backing plates
riveted together. Shaded areas show removed plates for excavation
As shown in Figure 1.1, the submarine was raised from the ocean floor in its
original position using a truss and sling system composed of 32 slings and expanded
polyurethane foam cushions. The submarine was then placed in a fresh water tank (Figure
1.2) at the Clemson University Conservation Center in Charleston SC and is being treated
for long term conservation
Dive planes
4
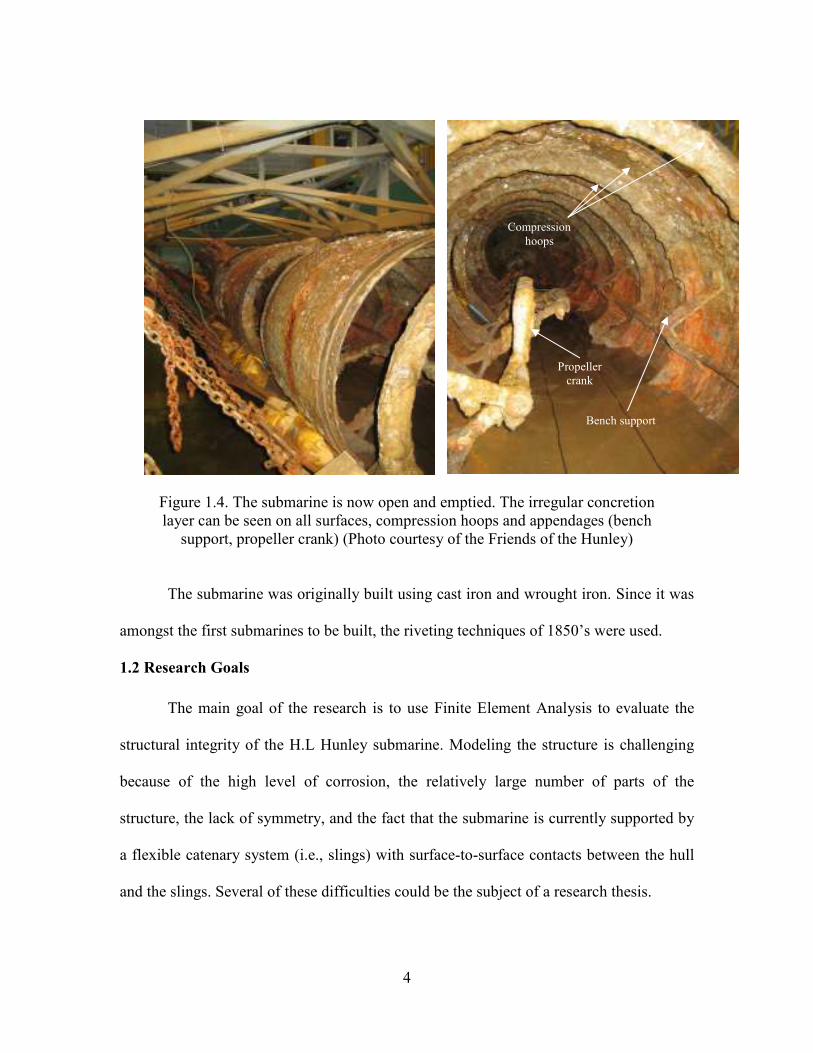
Figure 1.4. The submarine is now open and emptied. The irregular concretion
layer can be seen on all surfaces, compression hoops and appendages (bench
support, propeller crank) (Photo courtesy of the Friends of the Hunley)
The submarine was originally built using cast iron and wrought iron. Since it was
amongst the first submarines to be built, the riveting techniques of 1850’s were used.
1.2 Research Goals
The main goal of the research is to use Finite Element Analysis to evaluate the
structural integrity of the H.L Hunley submarine. Modeling the structure is challenging
because of the high level of corrosion, the relatively large number of parts of the
structure, the lack of symmetry, and the fact that the submarine is currently supported by
a flexible catenary system (i.e., slings) with surface-to-surface contacts between the hull
and the slings. Several of these difficulties could be the subject of a research thesis.
Compression
hoops
Bench support
Propeller
crank
5
Given the geometric and mechanical complexity of the system, representing the
submarine using a single model is not sufficient. The whole representation of the
submarine and its supports is done using a global model. The global model assembly is
discussed in detail in chapter 2. The hull is made of thin plates riveted together.
Therefore, the global model uses three-dimensional shell elements. The rivets are very
critical components of the structure and representing them in the shell model is
impossible. However, neglecting the localized stresses developed in the riveted
connections can prove to be dangerous while predicting the structural integrity of the
submarine.
Hence a global-local coordination procedure is developed to effectively calculate
the stresses generated at the riveted connections in the submarine. The global model
consists of the entire submarine modeled with shell elements, and the local model
represents one of the riveted connections in the submarine using 3D solid elements.
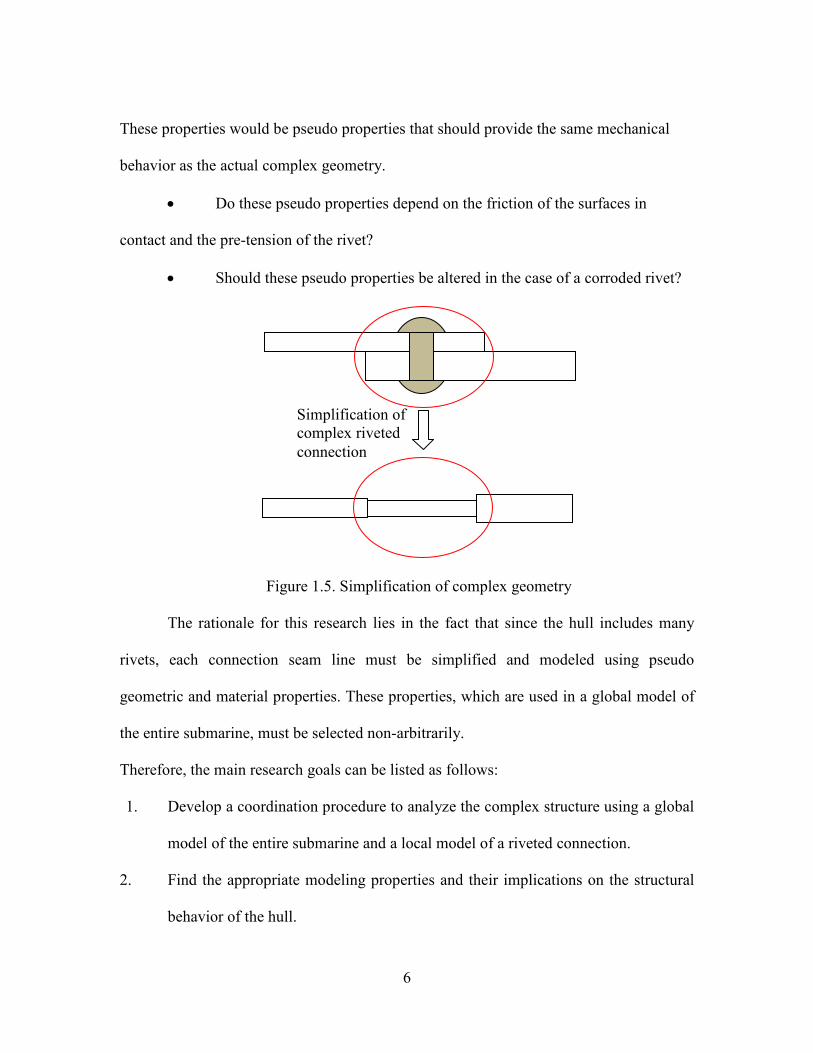
This research focuses on the modeling aspects related to the evaluation of stresses
in the riveted connections. In particular, the research focuses on how to effectively model
the simplified riveted connections without losing accuracy. The questions raised in this
research can be illustrated as shown in Figure 1.5. If a rivet maintains two plates
connected, depending on the geometry and stiffness of the rivet, the connection has a
certain mechanical behavior. Typical questions include:
• If the riveted connection (i.e., zone highlighted in red in Figure 1.5) is
simplified and modeled as a plate, what should be its thickness and material stiffness?
6
These properties would be pseudo properties that should provide the same mechanical
behavior as the actual complex geometry.
• Do these pseudo properties depend on the friction of the surfaces in
contact and the pre-tension of the rivet?
• Should these pseudo properties be altered in the case of a corroded rivet?
Figure 1.5. Simplification of complex geometry
The rationale for this research lies in the fact that since the hull includes many
rivets, each connection seam line must be simplified and modeled using pseudo
geometric and material properties. These properties, which are used in a global model of
the entire submarine, must be selected non-arbitrarily.
Therefore, the main research goals can be listed as follows:
1. Develop a coordination procedure to analyze the complex structure using a global
model of the entire submarine and a local model of a riveted connection.
2. Find the appropriate modeling properties and their implications on the structural
behavior of the hull.
Simplification of
complex riveted
connection
7
3. Estimate the static stresses in the hull under gravitational loads and various sets of
boundary conditions.
4. Study the effects of corrosion on the behavior of riveted connections and the
overall structure.
1.3 History of H.L. Hunley
H.L. Hunley was a submarine of the Confederate States of America that
participated in the American Civil War. As per the findings of Sally M. Walker in his
book “Secrets of a Civil War submarine: solving the mysteries of the H.L. Hunley”, the
idea of a submarine was not new during the American civil war. In the early sixteenth
century Cornelis Grebbel had built a submarine that resembled a rowboat enclosed with a
leather cover [1].
David Bushnell built the first American submarine named as the Turtle during the
American Revolution. Although Turtle could navigate underwater, it was not successful
in attacking an enemy warship. In fact, no submarine had ever sunk an enemy ship until
then. [1]
H.L. Hunley was built in Mobile, Alabama in the spring of 1862 at Park & Lyons
Machine Shop with the help of machinists, businessmen engineers James McClintock,
lawyer Horace L. Hunley and four members from a manufacturing organization called
Singer Submarine Corps [2]. Although H.L. Hunley was technically remarkable for its
time, it possessed both advantages and dangers in attacking an enemy ship [3]. Due to the
size of the submarine, it had to navigate very low in the water and an unexpected wave
could wash into an open hatch, sinking the submarine [1].

8
Figure 1.6. H.L Hunley with its crew [1]
In fact during a test run in Charleston, the submarine sank due to an error of a
crew member killing five of its sailors on board. A few months later, it sank for the
second time, killing all of its crew members. Despite this H.L. Hunley became the first
submarine to successfully attack an enemy ship [4]. On February 17, 1864, H.L. Hunley
created history by becoming the first submarine to sink an enemy ship after its attack on
USS Houstanic. After the successful attack, H.L. Hunley never returned to the shore and
the details of its wreck were unknown.
1.3.1 Recovery of H.L. Hunley
After its wreck in 1864, the whereabouts of Hunley were unknown. It is due to the
efforts of Clive Cussler, a Novelist and adventurer and his divers, Hunley was found in
1995 [5]. On August 8, 2000, H.L. Hunley was brought to the surface after 136 years.
After resolving the major issues of locating the submarine and recovering it, the most
important and difficult part was to conserve the remains of the structure. The submarine

9
is currently at the Warren Lasch Conservation Center located in Charleston, South
Carolina.
1.3.2 Conservation of H.L. Hunley
The Hunley submarine could be considered as one of the most complex composite
structures to be ever recovered by a team of conservators and archaeologists. Any step
taken in the conservation is carefully analyzed so that the structural integrity is not
comprimised. After its recovery H.L. Hunley was placed in a water tank consisting of
chilled water at 10 degrees Celsius to minimize the impact of potential enzymatic
reactions on organic remains and also to reduce the impact of corrosion [6]. The
uncontrolled exposure to air of H.L. Hunley could lead to damage and the disastrous loss
of archaeological data. Because the Hunley was mainly built using wrought and cast iron,
it makes it even more susceptible to oxygen. Since it was underwater for over 136 years,
chlorides from the seawater penetrated the iron at the molecular level. These chlorides
would destroy the submarine if exposed to oxygen rich environment due to a sudden
change in equilibrium. Hence it is very important for the conservators to gain sufficient
knowledge regarding the handling, storage, stabilization, and study the recovered artifacts
[7].
10
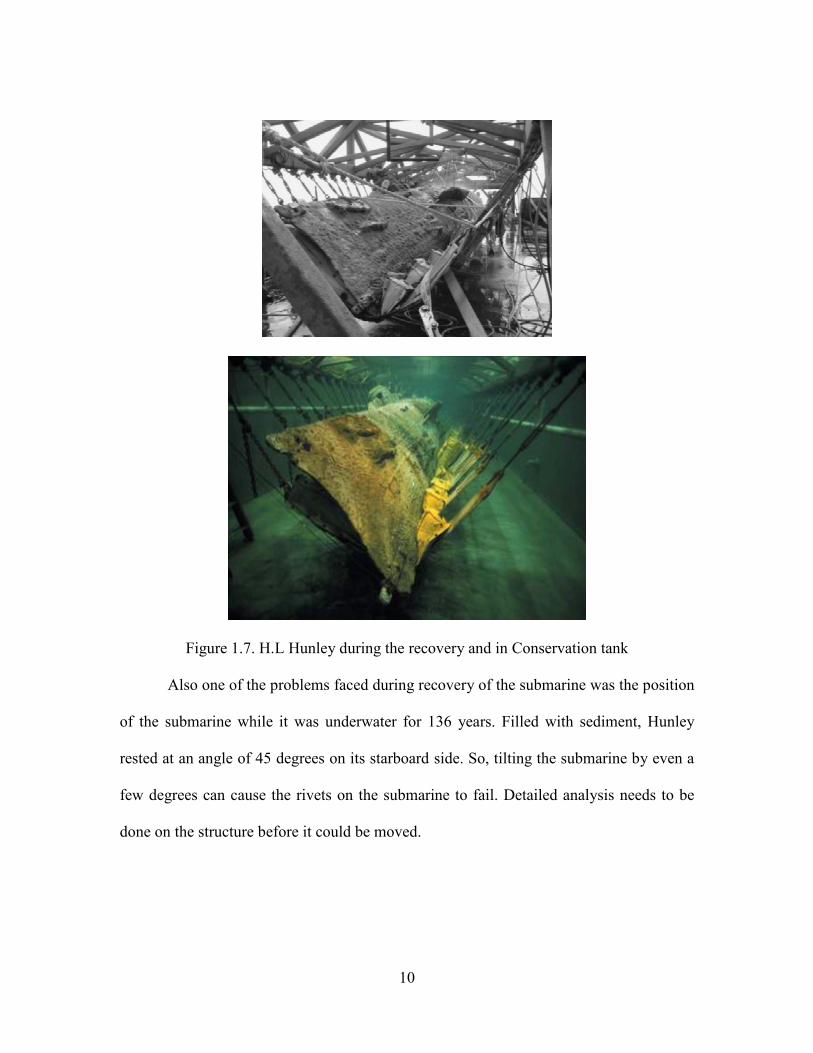
Figure 1.7. H.L Hunley during the recovery and in Conservation tank
Also one of the problems faced during recovery of the submarine was the position
of the submarine while it was underwater for 136 years. Filled with sediment, Hunley
rested at an angle of 45 degrees on its starboard side. So, tilting the submarine by even a
few degrees can cause the rivets on the submarine to fail. Detailed analysis needs to be
done on the structure before it could be moved.
11
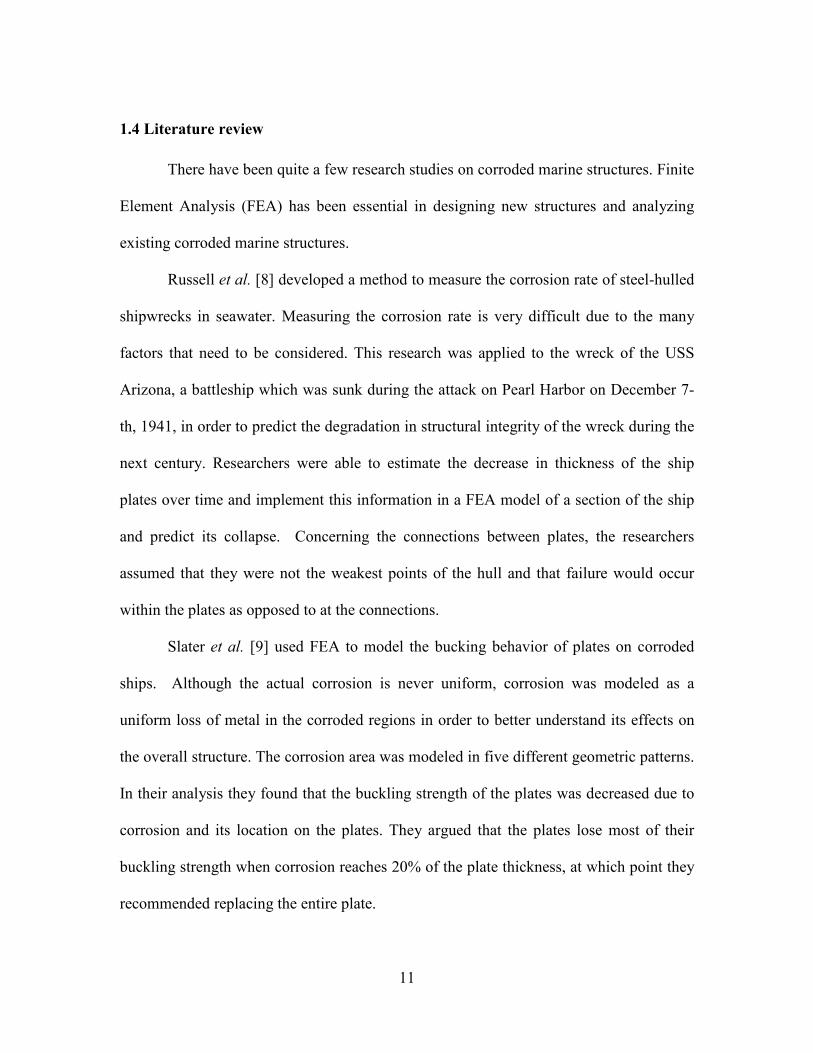
1.4 Literature review
There have been quite a few research studies on corroded marine structures. Finite
Element Analysis (FEA) has been essential in designing new structures and analyzing
existing corroded marine structures.
Russell et al. [8] developed a method to measure the corrosion rate of steel-hulled
shipwrecks in seawater. Measuring the corrosion rate is very difficult due to the many
factors that need to be considered. This research was applied to the wreck of the USS
Arizona, a battleship which was sunk during the attack on Pearl Harbor on December 7-
th, 1941, in order to predict the degradation in structural integrity of the wreck during the
next century. Researchers were able to estimate the decrease in thickness of the ship
plates over time and implement this information in a FEA model of a section of the ship
and predict its collapse. Concerning the connections between plates, the researchers
assumed that they were not the weakest points of the hull and that failure would occur
within the plates as opposed to at the connections.
Slater et al. [9] used FEA to model the bucking behavior of plates on corroded
ships. Although the actual corrosion is never uniform, corrosion was modeled as a
uniform loss of metal in the corroded regions in order to better understand its effects on
the overall structure. The corrosion area was modeled in five different geometric patterns.
In their analysis they found that the buckling strength of the plates was decreased due to
corrosion and its location on the plates. They argued that the plates lose most of their
buckling strength when corrosion reaches 20% of the plate thickness, at which point they
recommended replacing the entire plate.
12
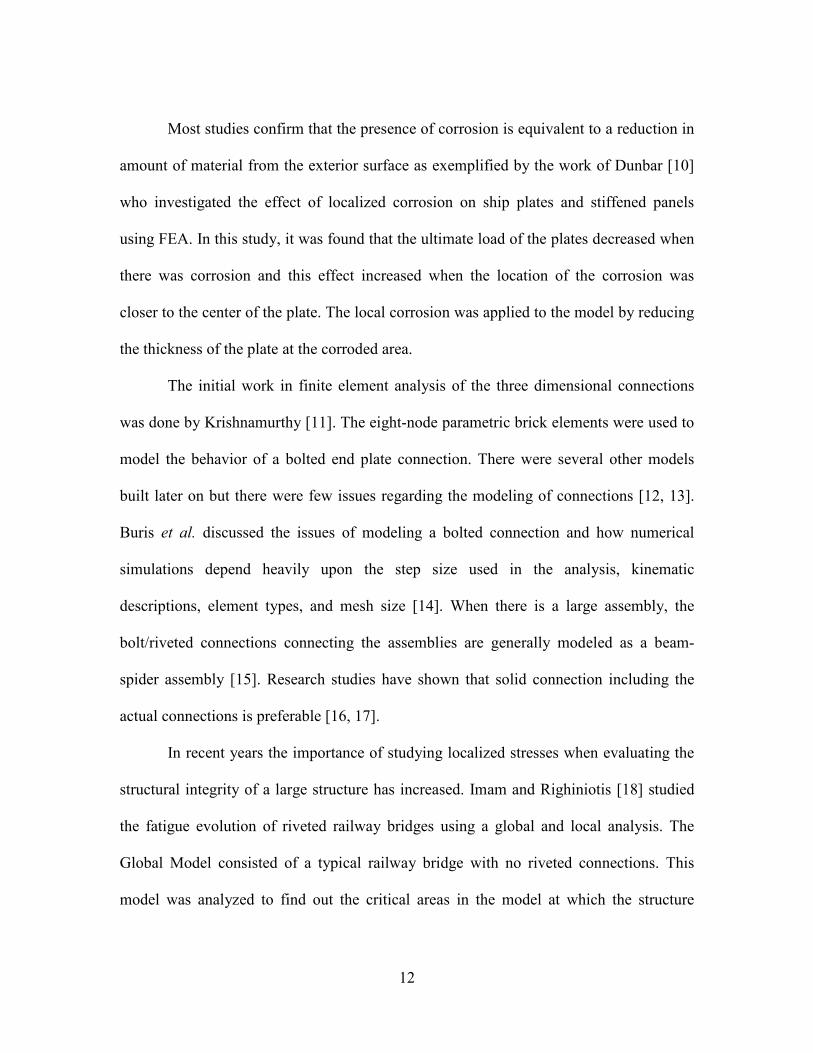
Most studies confirm that the presence of corrosion is equivalent to a reduction in
amount of material from the exterior surface as exemplified by the work of Dunbar [10]
who investigated the effect of localized corrosion on ship plates and stiffened panels
using FEA. In this study, it was found that the ultimate load of the plates decreased when
there was corrosion and this effect increased when the location of the corrosion was
closer to the center of the plate. The local corrosion was applied to the model by reducing
the thickness of the plate at the corroded area.
The initial work in finite element analysis of the three dimensional connections
was done by Krishnamurthy [11]. The eight-node parametric brick elements were used to
model the behavior of a bolted end plate connection. There were several other models
built later on but there were few issues regarding the modeling of connections [12, 13].
Buris et al. discussed the issues of modeling a bolted connection and how numerical
simulations depend heavily upon the step size used in the analysis, kinematic
descriptions, element types, and mesh size [14]. When there is a large assembly, the
bolt/riveted connections connecting the assemblies are generally modeled as a beam-
spider assembly [15]. Research studies have shown that solid connection including the
actual connections is preferable [16, 17].
In recent years the importance of studying localized stresses when evaluating the
structural integrity of a large structure has increased. Imam and Righiniotis [18] studied
the fatigue evolution of riveted railway bridges using a global and local analysis. The
Global Model consisted of a typical railway bridge with no riveted connections. This
model was analyzed to find out the critical areas in the model at which the structure
13
experiences higher stresses. After evaluating the critical areas a global-local model was
created in which only the critical region was modeled with a detailed geometric
description of the riveted connection. The single most critical connection was modeled
with a shell-to-solid transition. Using the global-local model local stresses were found
and also potential crack initiation was evaluated in the detailed part of the model. As
explained in the following chapters, the approach presented in this thesis differs from the
global-local model of [18] since three distinct models are used in a coordination
procedure as opposed to a single global-local model.
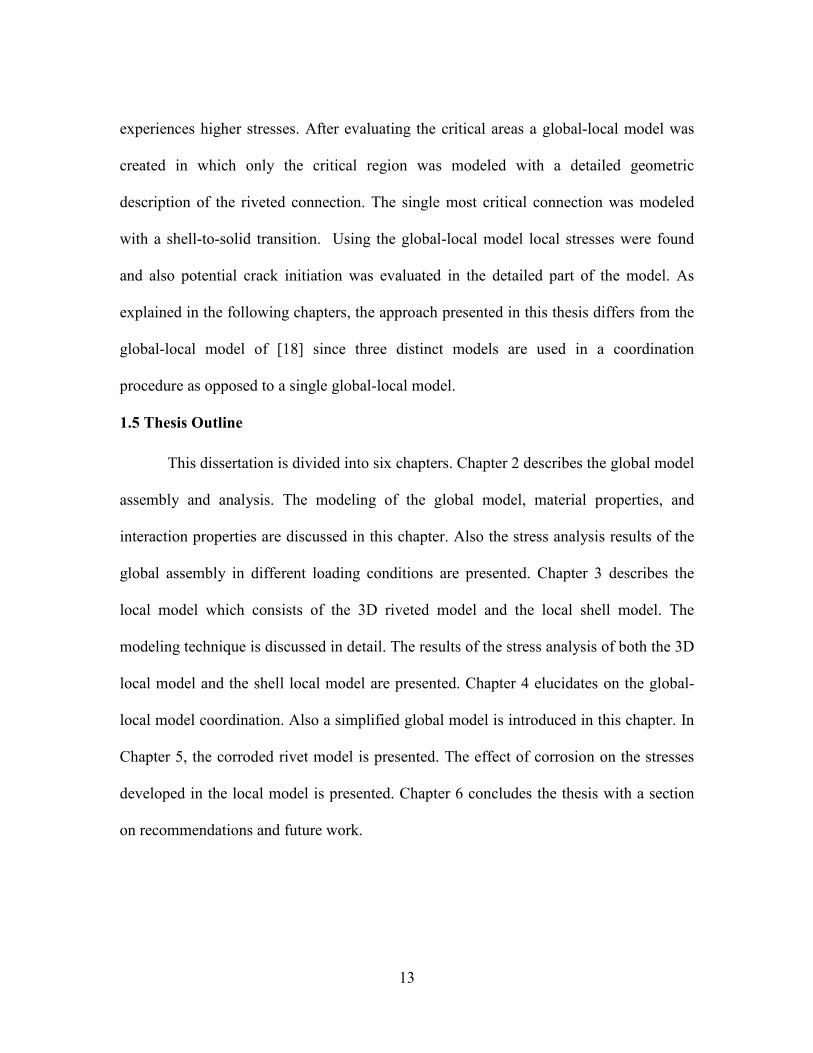
1.5 Thesis Outline
This dissertation is divided into six chapters. Chapter 2 describes the global model
assembly and analysis. The modeling of the global model, material properties, and
interaction properties are discussed in this chapter. Also the stress analysis results of the
global assembly in different loading conditions are presented. Chapter 3 describes the
local model which consists of the 3D riveted model and the local shell model. The
modeling technique is discussed in detail. The results of the stress analysis of both the 3D
local model and the shell local model are presented. Chapter 4 elucidates on the global-
local model coordination. Also a simplified global model is introduced in this chapter. In
Chapter 5, the corroded rivet model is presented. The effect of corrosion on the stresses
developed in the local model is presented. Chapter 6 concludes the thesis with a section
on recommendations and future work.
14
CHAPTER 2
GLOBAL MODEL
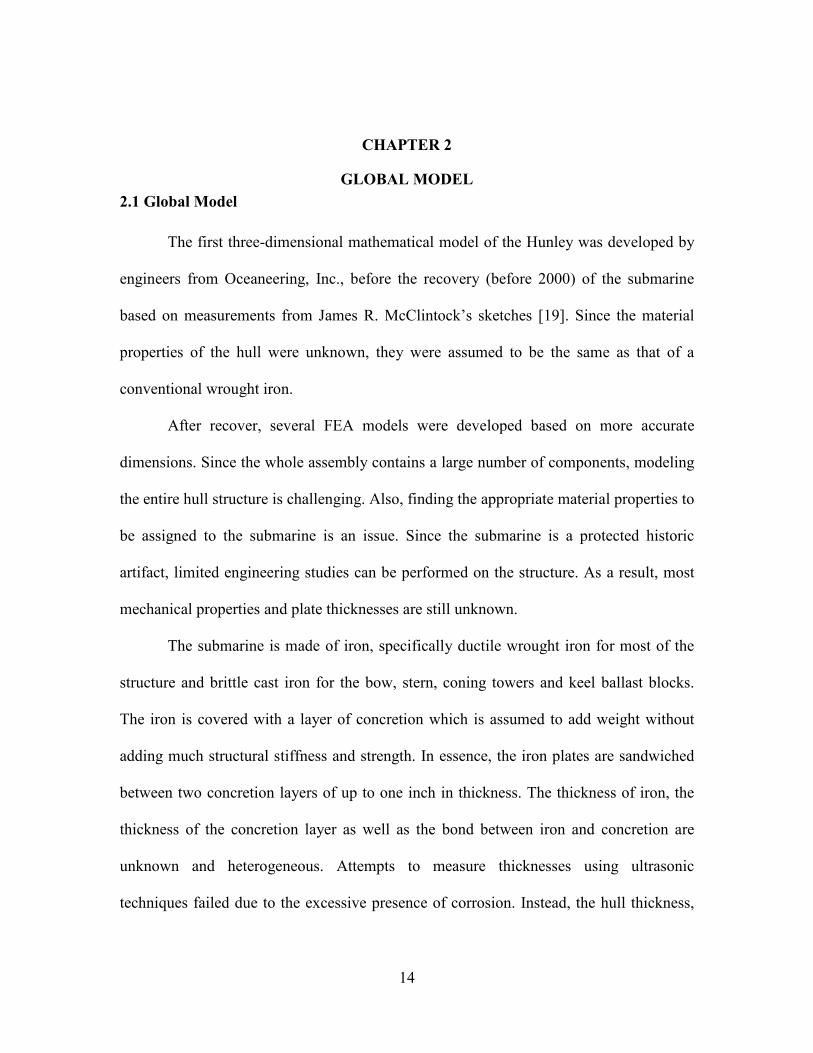
2.1 Global Model
The first three-dimensional mathematical model of the Hunley was developed by
engineers from Oceaneering, Inc., before the recovery (before 2000) of the submarine
based on measurements from James R. McClintock’s sketches [19]. Since the material
properties of the hull were unknown, they were assumed to be the same as that of a
conventional wrought iron.
After recover, several FEA models were developed based on more accurate
dimensions. Since the whole assembly contains a large number of components, modeling
the entire hull structure is challenging. Also, finding the appropriate material properties to
be assigned to the submarine is an issue. Since the submarine is a protected historic
artifact, limited engineering studies can be performed on the structure. As a result, most
mechanical properties and plate thicknesses are still unknown.
The submarine is made of iron, specifically ductile wrought iron for most of the
structure and brittle cast iron for the bow, stern, coning towers and keel ballast blocks.
The iron is covered with a layer of concretion which is assumed to add weight without
adding much structural stiffness and strength. In essence, the iron plates are sandwiched
between two concretion layers of up to one inch in thickness. The thickness of iron, the
thickness of the concretion layer as well as the bond between iron and concretion are
unknown and heterogeneous. Attempts to measure thicknesses using ultrasonic
techniques failed due to the excessive presence of corrosion. Instead, the hull thickness,
15
approximately 0.375” (9.5 mm), was measured from a rivet hole in which the rivet had
completely disintegrated [20].
The goal of the FEA is to enable project engineers and conservators to identify the
conditions in which the submarine will be handled (during rotation and treatment) such
that stresses are minimized. Also, the stresses computed by FEA are used to estimate a
factor of safety with respect to the yield strength of today’s iron.
In order to produce a meaningful finite element model, four pieces of information
are needed:
• a numerical model of the geometry of the structure,
• the mechanical properties of all materials,
• the interaction properties of parts in contact, and
• the loads applied on the structure including boundary conditions.
If accurate information is defined in the model, FEA can provide valuable data,
such as the distribution of stresses and location and value of areas of highest stress. In the
case of the Hunley submarine, obtaining these four pieces of information presents
significant challenges due to the lack of available data. Therefore, important assumptions
were made and various parametric studies are being conducted to evaluate the
hypothetical effect of several parameters and account for their inherent uncertainty.
The FEA models were created and analyzed using the commercial software
ABAQUS®
version 6.8 [21]. Abaqus is one of the leading FEA software for structural
analysis. Version 6.8 offers a recently improved contact model, which is particularly
important in the analysis of the Hunley submarine. Also, Abaqus provides two different
16
solvers: the implicit solver (Abaqus/Standard) which is computationally efficient but
requires well-defined boundary conditions and contact interactions, and the explicit
solver (Abaqus/Explicit) which is significantly slower but is able to solve singular
problems with loose boundary conditions and offers a general contact tool which greatly
simplifies model development.
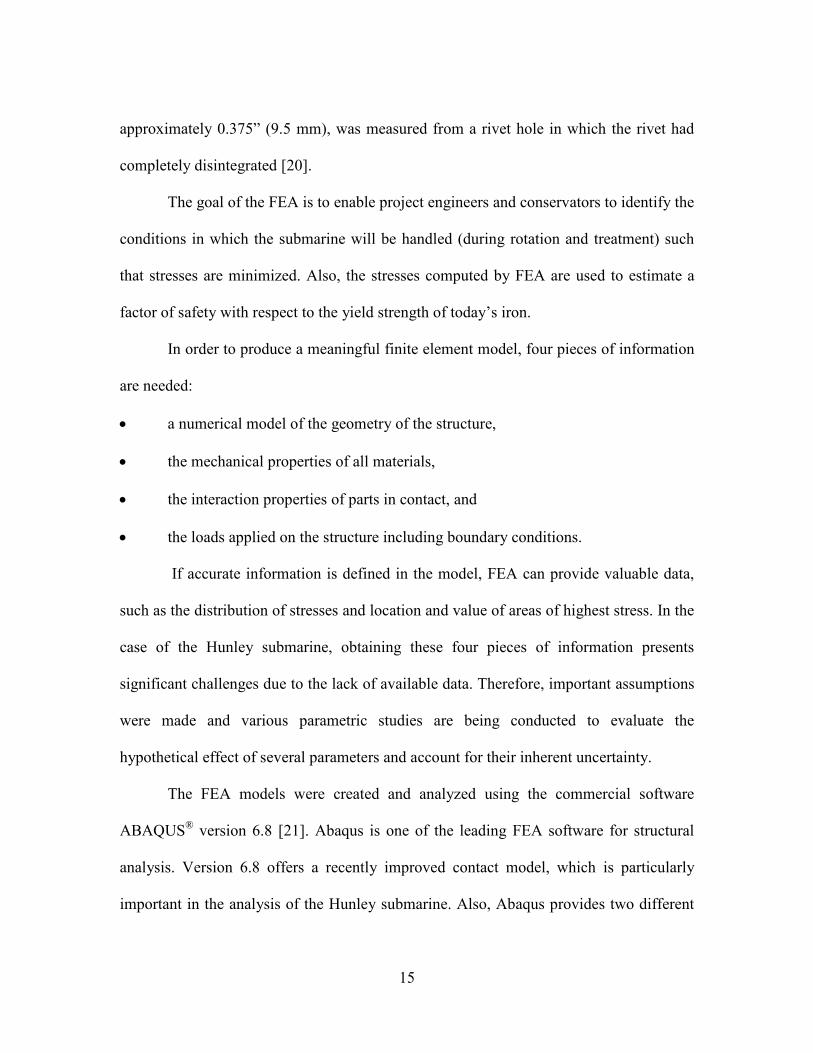
The global model is a very essential part of the analysis. It comprises of the
closest real time simulation of the Hunley submarine. Since the Hunley submarine is a
large complex structure, it is impossible to completely incorporate all the components in
one single model. Therefore the global model, shown in Figure 2.1, includes the major
components of the Hunley.
Figure 2.1. The complete assembly of the global model
As discussed earlier, the submarine is currently resting on its starboard side at a
roll angle of 45 degrees in a water tank in Charleston, SC. The submarine is currently
supported by about 30 slings, which are belts with polyurethane foam cushions. The FEA
17
global model shown in Figure 2.1, however, includes only half of the current slings,
which is the configuration that will be used for the rotation process of the submarine from
its current 45-degree roll angle to the upright vertical position.
2.2 Plate thickness and mass density
The effects of corrosion are a major concern for modeling and analyzing the
Hunley. Although corrosion occurred in a non-uniform manner across the submarine, the
thickness of shell components (i.e., plates, backing plates, riveted connections and coning
towers) is assumed to be uniform throughout each component. Since the actual thickness
of plates cannot be exactly known, parametric studies were conducted by varying the
thickness parameters.
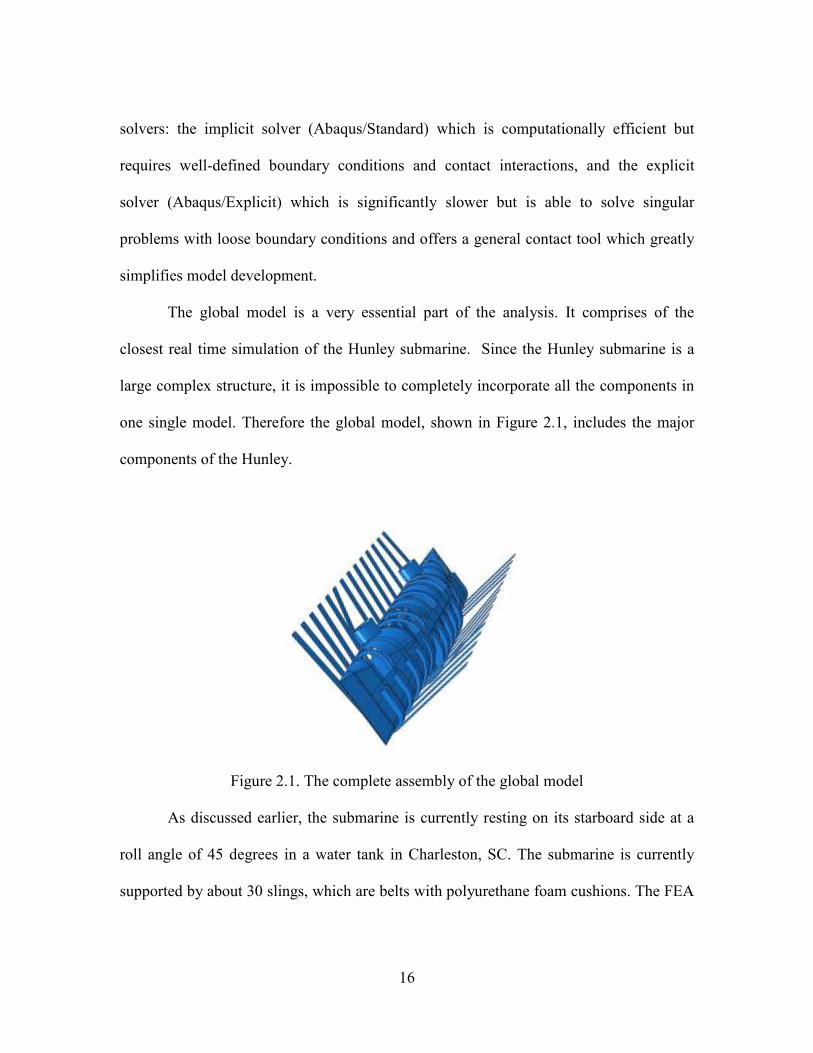
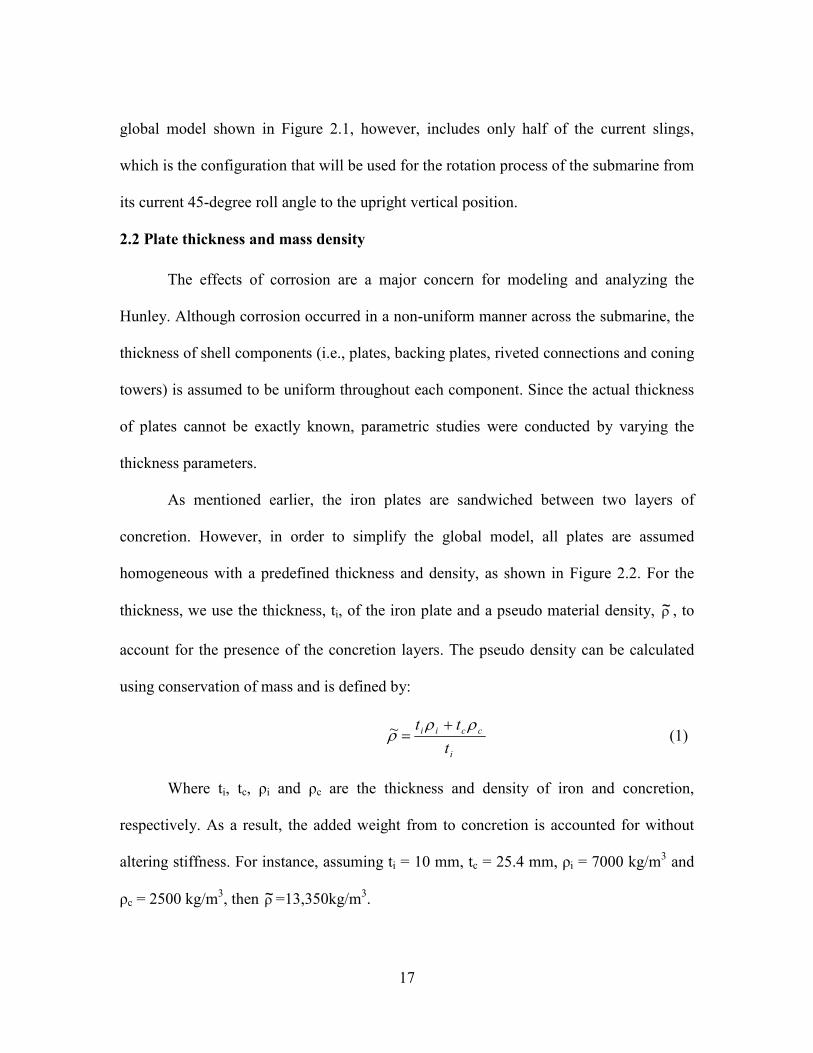
As mentioned earlier, the iron plates are sandwiched between two layers of
concretion. However, in order to simplify the global model, all plates are assumed
homogeneous with a predefined thickness and density, as shown in Figure 2.2. For the
thickness, we use the thickness, ti, of the iron plate and a pseudo material density, ρ~ , to
account for the presence of the concretion layers. The pseudo density can be calculated
using conservation of mass and is defined by:
i
ccii
t
tt ρρρ
+=~ (1)
Where ti, tc, ρi and ρc are the thickness and density of iron and concretion,
respectively. As a result, the added weight from to concretion is accounted for without
altering stiffness. For instance, assuming ti = 10 mm, tc = 25.4 mm, ρi = 7000 kg/m3 and
ρc = 2500 kg/m3, then ρ~=13,350kg/m
3.
18
Figure 2.2. Iron plates are sandwiched between two concretion layers
The effect of buoyancy, which was estimated to be equivalent to at most 20
percent reduction in mass density of the iron, is neglected as a conservative measure
since a possible worst-case scenario is likely to occur when the tank is emptied.
2.3 Mechanical properties
2.3.1 Stiffness
Stiffness of the metal is defined by the modulus of elasticity, E, and Poisson’s
ratio, ν. Metallurgical studies of cast and wrought iron components from the Hunley were
conducted at the National Institute of Standards and Technology (NIST) to determine the
chemical constituents and microstructure of the Hunley’s iron components [20]. Due to
sampling constraints, testing of the cast iron was inconclusive, but testing of the wrought
iron samples demonstrated that a metal core was still present and that the alloy was of
‘good’ quality by contemporary standards. However, the diversity of the corrosion noted
throughout the submarine’s structure does not permit assessment of a single stiffness
value, as would be possible with freshly cast or wrought iron. Therefore, given the
uncertainty of the analysis, elastic properties are estimated to vary within a range of
values described in Table 2.2.
ti+tc Concretion
(ρ )
Concretion
(ρ )
ti Iron + concretion
Actual configuration As modeled
19
2.3.2Strength
The strength of the metal, which is necessary to predict the risk of failure,
represents the upper stress limit that the metal can withstand before permanent
deformation will occur. Metallurgical studies from the Hunley carried out by NIST,
showed a relatively high level of silicate slag in wrought iron components, which
generally provides added strength [22]. Since then, micro-hardness tests were performed
on wrought iron rivets of the Hunley. By direct comparison with known metals, the
strength of the iron was found to be comparable to today’s wrought iron [22].
2.3.3 Interaction Properties
The hull of the Hunley is constructed from nearly one hundred different parts
riveted together. Several parts, namely the compression hoops and the keel ballast blocks
are in surface-to-surface contact with the hull. More specifically, the compression hoops
are maintained in place by friction and localized brackets. Each keel ballast block is
attached to the bottom of the hull either by three large bolts or a single key originally
intended to be used for releasing the block from the inside of the sub. When properly
modeled as surface-to-surface contacts, the computational time becomes prohibitively
high. Therefore, these contacts are modeled as rigid connections, which is assumed to be
a satisfactory assumption given the high friction between parts.
The submarine is supported by a set of movable slings (i.e., belts and cushions)
that are in surface-to-surface contact with the hull. These interactions represent an
important aspect for the reliability of the numerical model. The contact friction
coefficient is set to a relatively large baseline value of 0.95.
20
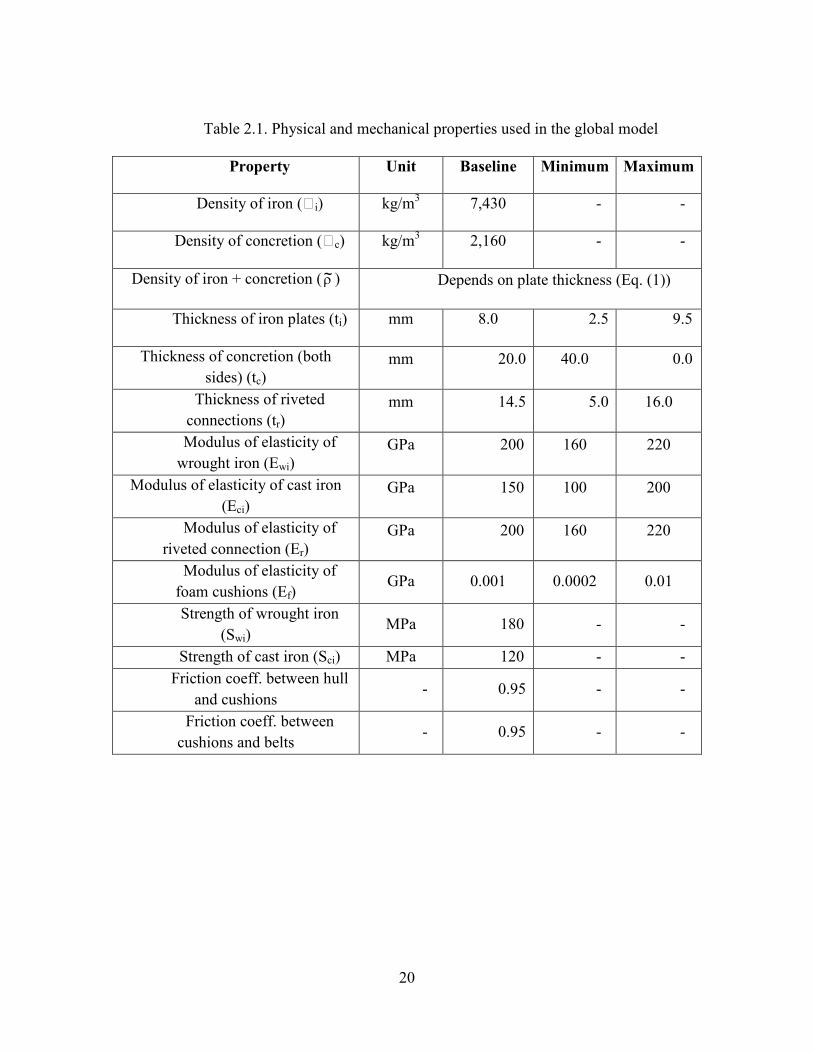
Table 2.1. Physical and mechanical properties used in the global model
Property Unit Baseline Minimum Maximum
Density of iron (Ti) kg/m3 7,430 - -
Density of concretion (Tc) kg/m3 2,160 - -
Density of iron + concretion ( ρ~ ) Depends on plate thickness (Eq. (1))
Thickness of iron plates (ti) mm 8.0 2.5 9.5
Thickness of concretion (both
sides) (tc)
mm 20.0 40.0 0.0
Thickness of riveted
connections (tr)
mm 14.5 5.0 16.0
Modulus of elasticity of
wrought iron (Ewi)
GPa 200 160 220
Modulus of elasticity of cast iron
(Eci)
GPa 150 100 200
Modulus of elasticity of
riveted connection (Er)
GPa 200 160 220
Modulus of elasticity of
foam cushions (Ef) GPa 0.001 0.0002 0.01
Strength of wrought iron
(Swi) MPa 180 - -
Strength of cast iron (Sci) MPa 120 - -
Friction coeff. between hull
and cushions - 0.95 - -
Friction coeff. between
cushions and belts - 0.95 - -
21
2.4 Global model assembly:
The global model assembly consists of many parts. Each part and its pertaining
assumptions are discussed in this section.
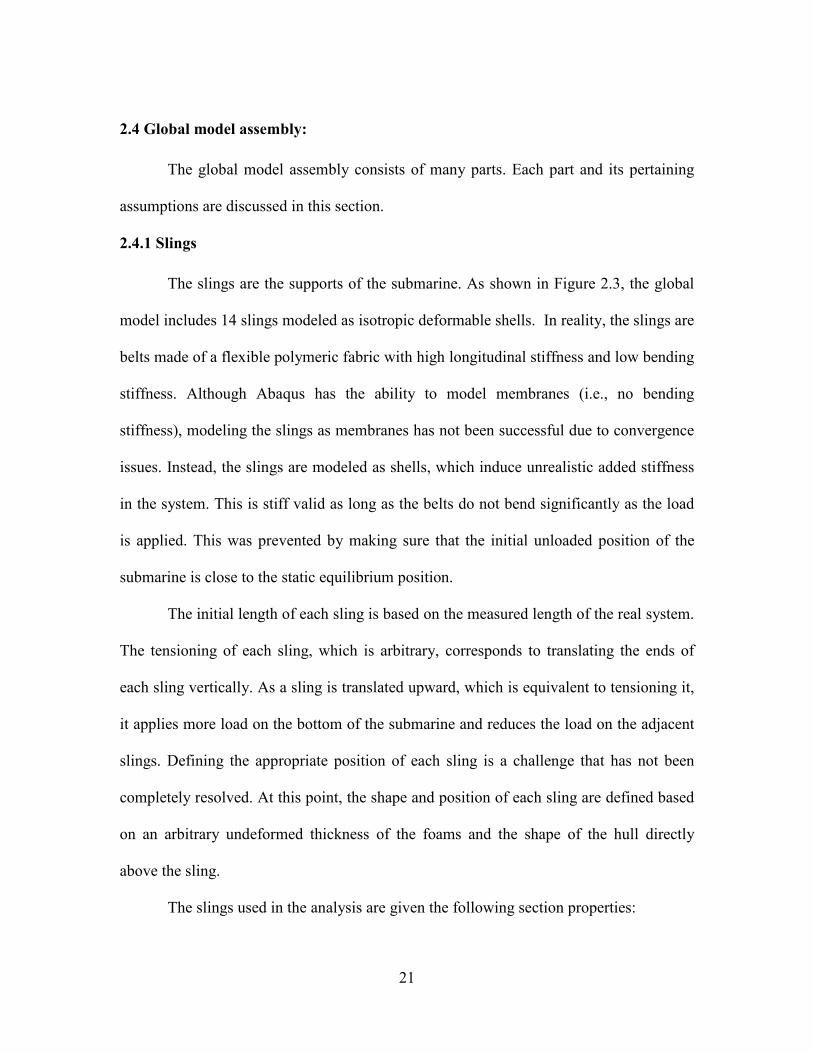
2.4.1 Slings
The slings are the supports of the submarine. As shown in Figure 2.3, the global
model includes 14 slings modeled as isotropic deformable shells. In reality, the slings are
belts made of a flexible polymeric fabric with high longitudinal stiffness and low bending
stiffness. Although Abaqus has the ability to model membranes (i.e., no bending
stiffness), modeling the slings as membranes has not been successful due to convergence
issues. Instead, the slings are modeled as shells, which induce unrealistic added stiffness
in the system. This is stiff valid as long as the belts do not bend significantly as the load
is applied. This was prevented by making sure that the initial unloaded position of the
submarine is close to the static equilibrium position.
The initial length of each sling is based on the measured length of the real system.
The tensioning of each sling, which is arbitrary, corresponds to translating the ends of
each sling vertically. As a sling is translated upward, which is equivalent to tensioning it,
it applies more load on the bottom of the submarine and reduces the load on the adjacent
slings. Defining the appropriate position of each sling is a challenge that has not been
completely resolved. At this point, the shape and position of each sling are defined based
on an arbitrary undeformed thickness of the foams and the shape of the hull directly
above the sling.
The slings used in the analysis are given the following section properties:
22
Type : Shell/ Continuum Shell
Shell Thickness : 10 mm
Density : 1000 kg/m3
Young’s Modulus : .01 GPa
Poisson’s Ratio : 0.3
Figure 2.3. Slings used in the analysis model
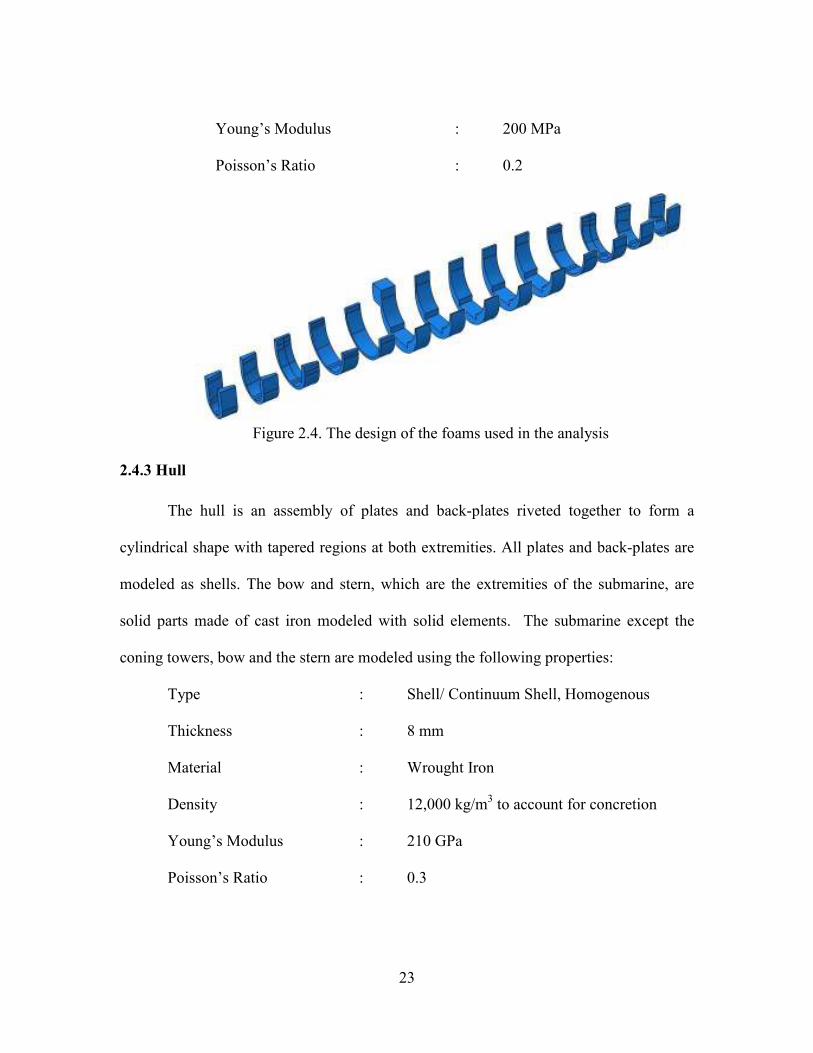
2.4.2 Foam cushions
Foam cushions are used to block the submarine in the slings and distribute any
concentrated load thereby decreasing the amount of pressure on the hull. The actual foam
cushions are the original cushions made of expanded polyurethane that were installed
during the recovery of the Hunley. Since the polyurethane was expanded in cylindrical
bags under the hull, they are naturally pre-shaped to match the curvature of the hull. The
foam cushions of the global model are also shaped to perfectly match the curvature of the
hull.
Type : Solid, Homogenous
Density : 200 kg/m3
23
Young’s Modulus : 200 MPa
Poisson’s Ratio : 0.2
Figure 2.4. The design of the foams used in the analysis
2.4.3 Hull
The hull is an assembly of plates and back-plates riveted together to form a
cylindrical shape with tapered regions at both extremities. All plates and back-plates are
modeled as shells. The bow and stern, which are the extremities of the submarine, are
solid parts made of cast iron modeled with solid elements. The submarine except the
coning towers, bow and the stern are modeled using the following properties:
Type : Shell/ Continuum Shell, Homogenous
Thickness : 8 mm
Material : Wrought Iron
Density : 12,000 kg/m3 to account for concretion
Young’s Modulus : 210 GPa
Poisson’s Ratio : 0.3
24
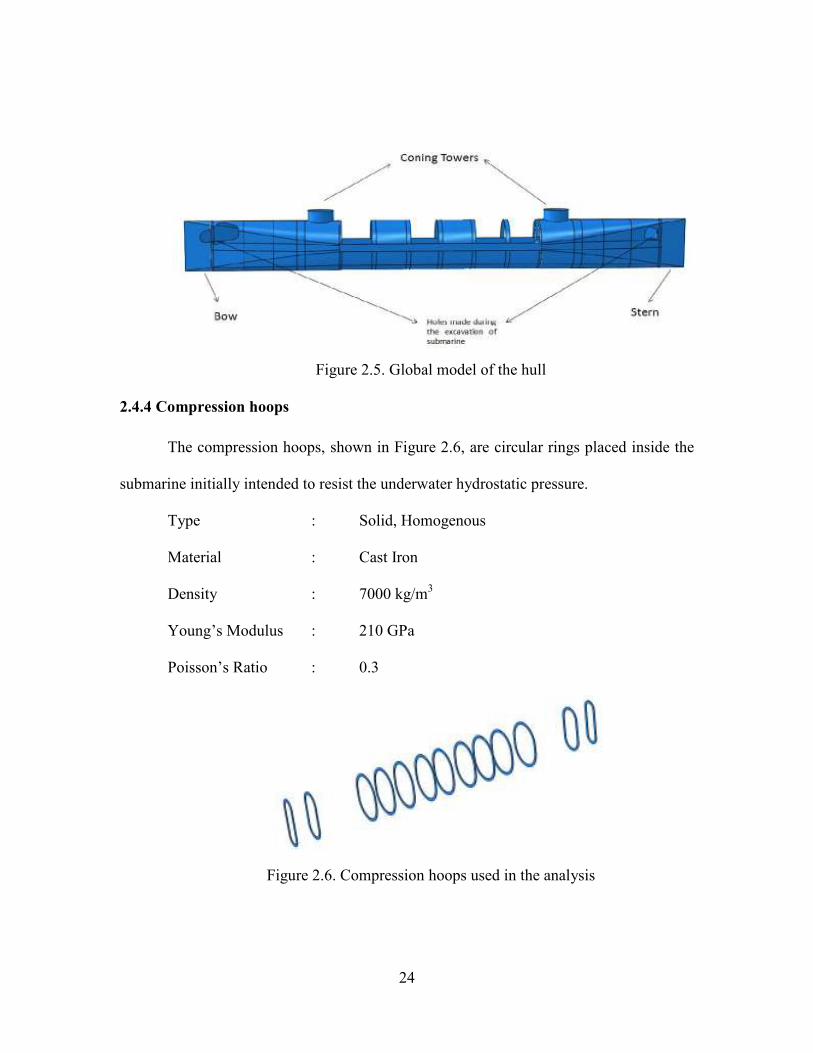
Figure 2.5. Global model of the hull
2.4.4 Compression hoops
The compression hoops, shown in Figure 2.6, are circular rings placed inside the
submarine initially intended to resist the underwater hydrostatic pressure.
Type : Solid, Homogenous
Material : Cast Iron
Density : 7000 kg/m3
Young’s Modulus : 210 GPa
Poisson’s Ratio : 0.3
Figure 2.6. Compression hoops used in the analysis
25
The structural stability of the submarine is increased by the presence of these
hoops even though they are not rigidly connected to the hull. Two brackets and friction
maintain them in place.
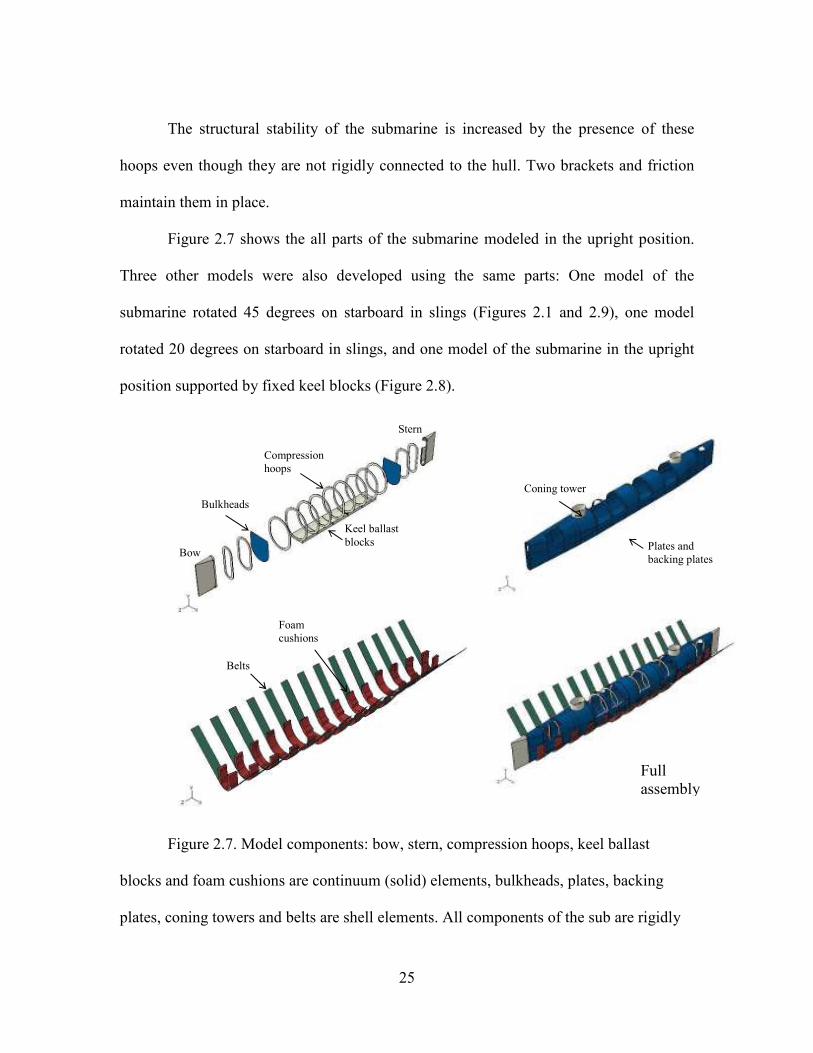
Figure 2.7 shows the all parts of the submarine modeled in the upright position.
Three other models were also developed using the same parts: One model of the
submarine rotated 45 degrees on starboard in slings (Figures 2.1 and 2.9), one model
rotated 20 degrees on starboard in slings, and one model of the submarine in the upright
position supported by fixed keel blocks (Figure 2.8).
Figure 2.7. Model components: bow, stern, compression hoops, keel ballast
blocks and foam cushions are continuum (solid) elements, bulkheads, plates, backing
plates, coning towers and belts are shell elements. All components of the sub are rigidly
Compression
hoops
Bulkheads
Keel ballast
blocks Bow
Stern
Coning tower
Belts
Foam
cushions
Plates and
backing plates
Full
assembly
26
connected using tie constraints. Interactions between belts, foam cushions and the sub are
modeled as surface-to-surface contacts.
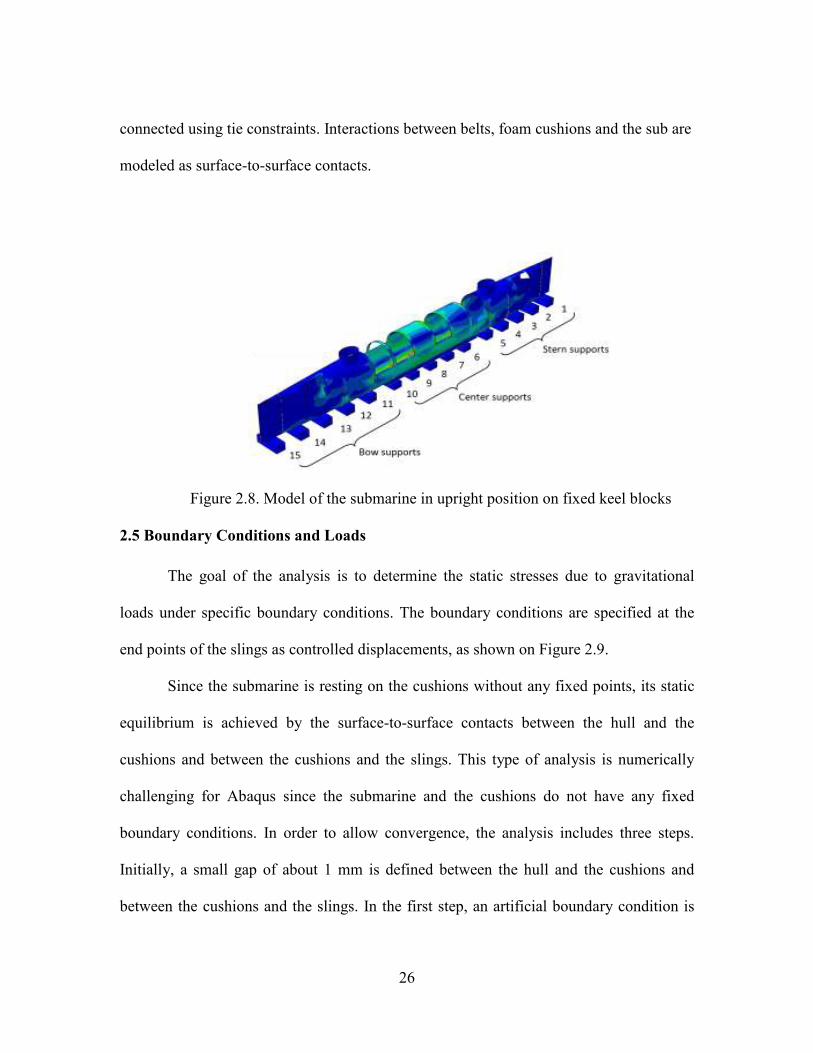
Figure 2.8. Model of the submarine in upright position on fixed keel blocks
2.5 Boundary Conditions and Loads
The goal of the analysis is to determine the static stresses due to gravitational
loads under specific boundary conditions. The boundary conditions are specified at the
end points of the slings as controlled displacements, as shown on Figure 2.9.
Since the submarine is resting on the cushions without any fixed points, its static
equilibrium is achieved by the surface-to-surface contacts between the hull and the
cushions and between the cushions and the slings. This type of analysis is numerically
challenging for Abaqus since the submarine and the cushions do not have any fixed
boundary conditions. In order to allow convergence, the analysis includes three steps.
Initially, a small gap of about 1 mm is defined between the hull and the cushions and
between the cushions and the slings. In the first step, an artificial boundary condition is
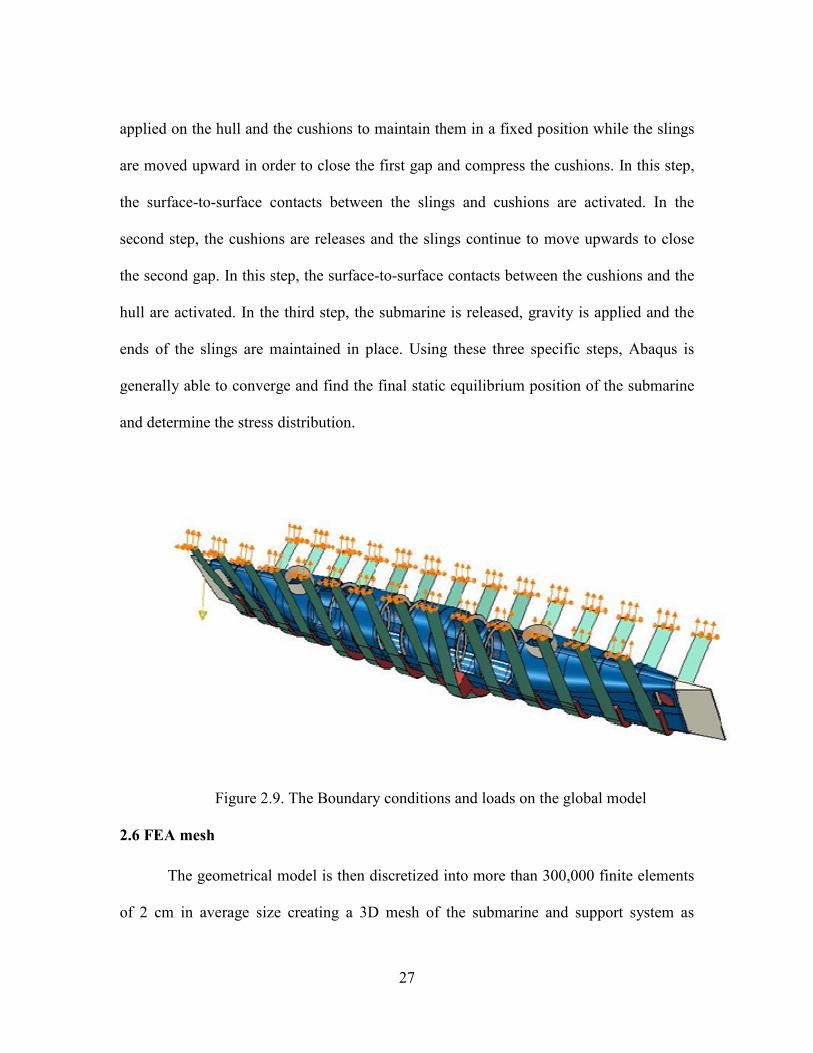
27
applied on the hull and the cushions to maintain them in a fixed position while the slings
are moved upward in order to close the first gap and compress the cushions. In this step,
the surface-to-surface contacts between the slings and cushions are activated. In the
second step, the cushions are releases and the slings continue to move upwards to close
the second gap. In this step, the surface-to-surface contacts between the cushions and the
hull are activated. In the third step, the submarine is released, gravity is applied and the
ends of the slings are maintained in place. Using these three specific steps, Abaqus is
generally able to converge and find the final static equilibrium position of the submarine
and determine the stress distribution.
Figure 2.9. The Boundary conditions and loads on the global model
2.6 FEA mesh
The geometrical model is then discretized into more than 300,000 finite elements
of 2 cm in average size creating a 3D mesh of the submarine and support system as
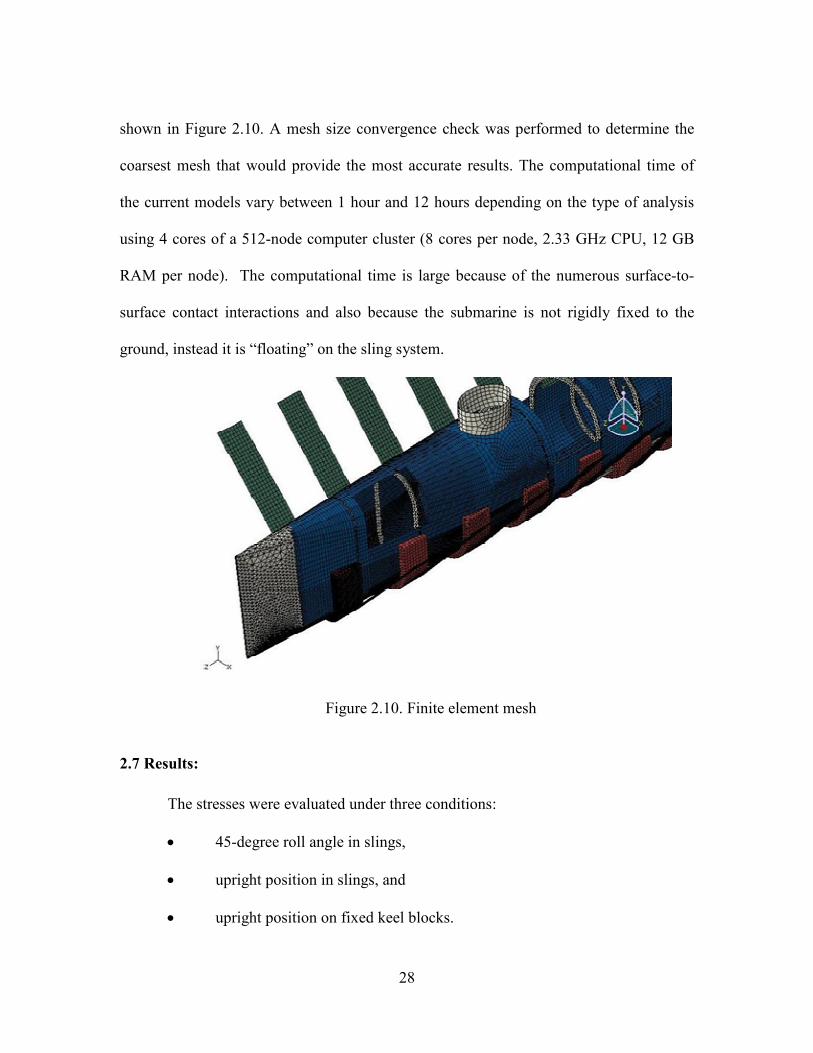
28
shown in Figure 2.10. A mesh size convergence check was performed to determine the
coarsest mesh that would provide the most accurate results. The computational time of
the current models vary between 1 hour and 12 hours depending on the type of analysis
using 4 cores of a 512-node computer cluster (8 cores per node, 2.33 GHz CPU, 12 GB
RAM per node). The computational time is large because of the numerous surface-to-
surface contact interactions and also because the submarine is not rigidly fixed to the
ground, instead it is “floating” on the sling system.
Figure 2.10. Finite element mesh
2.7 Results:
The stresses were evaluated under three conditions:
• 45-degree roll angle in slings,
• upright position in slings, and
• upright position on fixed keel blocks.
29
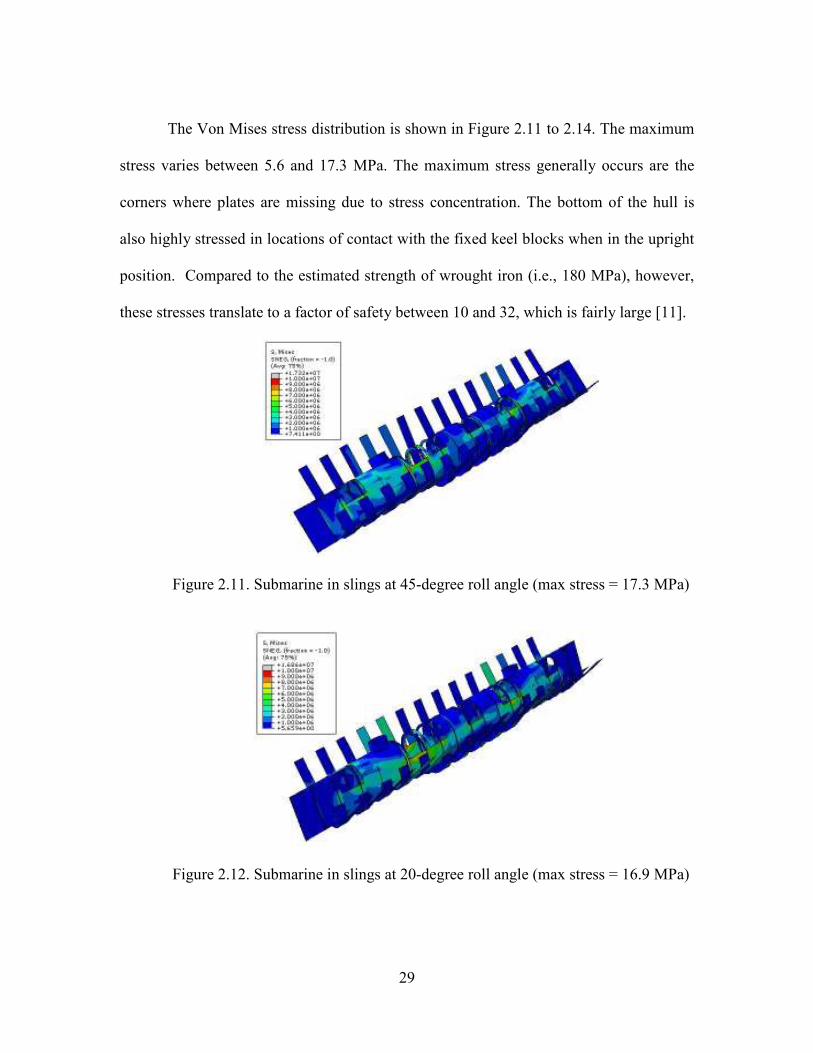
The Von Mises stress distribution is shown in Figure 2.11 to 2.14. The maximum
stress varies between 5.6 and 17.3 MPa. The maximum stress generally occurs are the
corners where plates are missing due to stress concentration. The bottom of the hull is
also highly stressed in locations of contact with the fixed keel blocks when in the upright
position. Compared to the estimated strength of wrought iron (i.e., 180 MPa), however,
these stresses translate to a factor of safety between 10 and 32, which is fairly large [11].
Figure 2.11. Submarine in slings at 45-degree roll angle (max stress = 17.3 MPa)
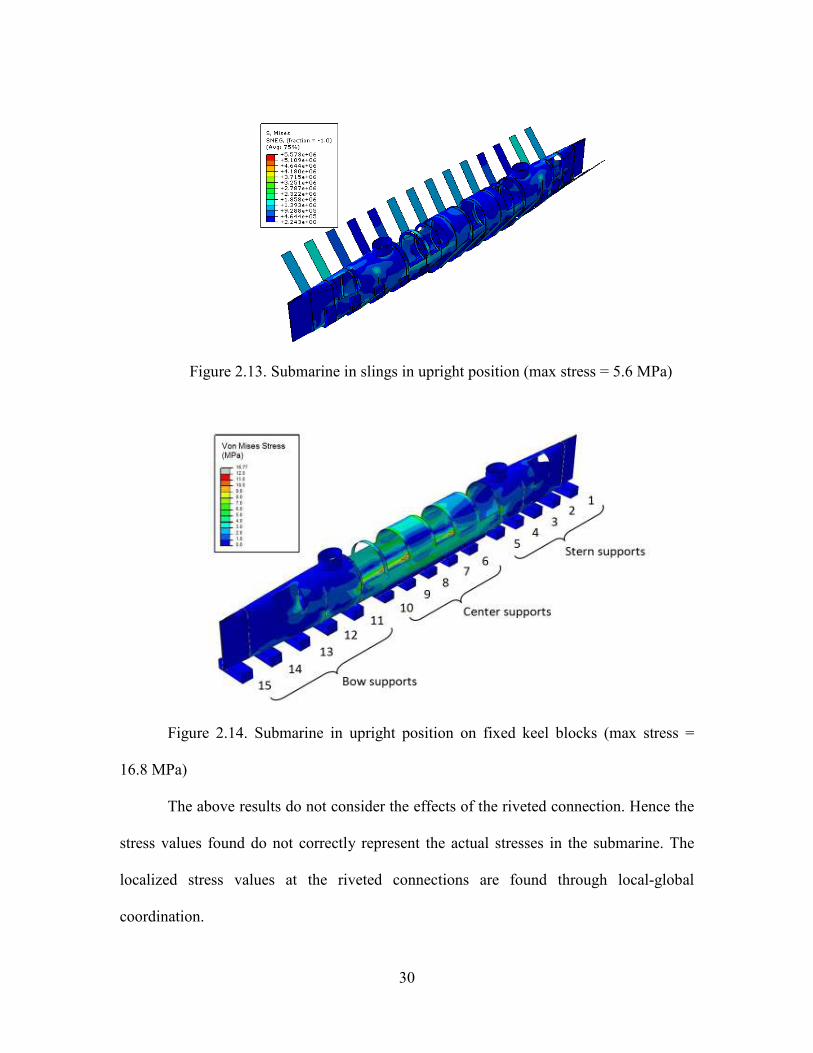
Figure 2.12. Submarine in slings at 20-degree roll angle (max stress = 16.9 MPa)
30
Figure 2.13. Submarine in slings in upright position (max stress = 5.6 MPa)
Figure 2.14. Submarine in upright position on fixed keel blocks (max stress =
16.8 MPa)
The above results do not consider the effects of the riveted connection. Hence the
stress values found do not correctly represent the actual stresses in the submarine. The
localized stress values at the riveted connections are found through local-global
coordination.

31
2.8. Parametric study
The initial thickness of all plates is 8 mm. However, to find out the effects of
corrosion, the plates were assumed be decrease in thickness. A parametric study was
performed using the model at 45-roll angle in slings. The thickness of the plates was set
to 8 mm, 6 mm, 4 mm, and 2 mm and the maximum stress was recorded.
Although this method assumes that the plate thickness is uniform throughout the
submarine, which is probably not the case, it provides valuable information on the effect
of plate thickness on the maximum stress.
The maximum stress does not occur at the same position. Therefore two locations
were selected and the effect of thickness on stress at those particular locations is
summarized in Table 2.1.We can observe that, with the decrease in the thickness of the
submarine, the stress experienced by the submarine is increased significantly. Hence, the
effects of corrosion cannot be ignored.
Table 2.2 Parametric study of effect of corrosion on stress in global model
Thickness Max Stress
(Location 1)
Max Stress
(Location 2)
Overall
Max Stress
8mm 17.32MPa 10MPa 17.32MPa
6mm 21.2MPa 12.5MPa 21.2MPa
4mm 20MPa 25MPa 30MPa
2mm 60MPa 79MPa 79MPa
32
CHAPTER 3
LOCAL MODEL
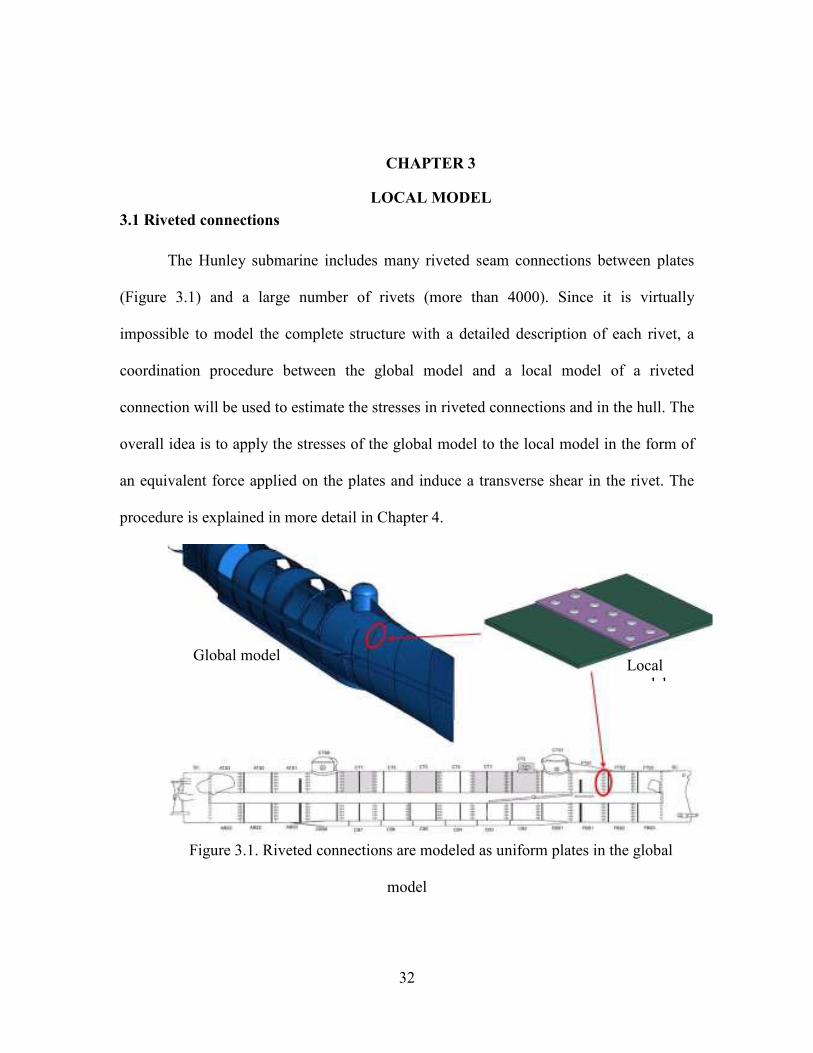
3.1 Riveted connections
The Hunley submarine includes many riveted seam connections between plates
(Figure 3.1) and a large number of rivets (more than 4000). Since it is virtually
impossible to model the complete structure with a detailed description of each rivet, a
coordination procedure between the global model and a local model of a riveted
connection will be used to estimate the stresses in riveted connections and in the hull. The
overall idea is to apply the stresses of the global model to the local model in the form of
an equivalent force applied on the plates and induce a transverse shear in the rivet. The
procedure is explained in more detail in Chapter 4.
Figure 3.1. Riveted connections are modeled as uniform plates in the global
model
Global model Local
model

33
Three different models are used to employ the local-global coordination. To reduce
the complexity of modeling and run time, a simplified global model is used instead of the
global model introduced in the previous chapter. The detailed assembly of the Simplified
global model of the submarine is presented in the Chapter 4. Three Finite Element models are
used in this coordination procedure as shown in Figure 3.2:
a) Simplified global model of the submarine,
b) A three-dimensional local model of a riveted connection, and
c) A three-dimensional local model of a riveted connection using the same
simplification as in the global model, namely, using shells.
Figure 3.2. The three models used in the coordination procedure
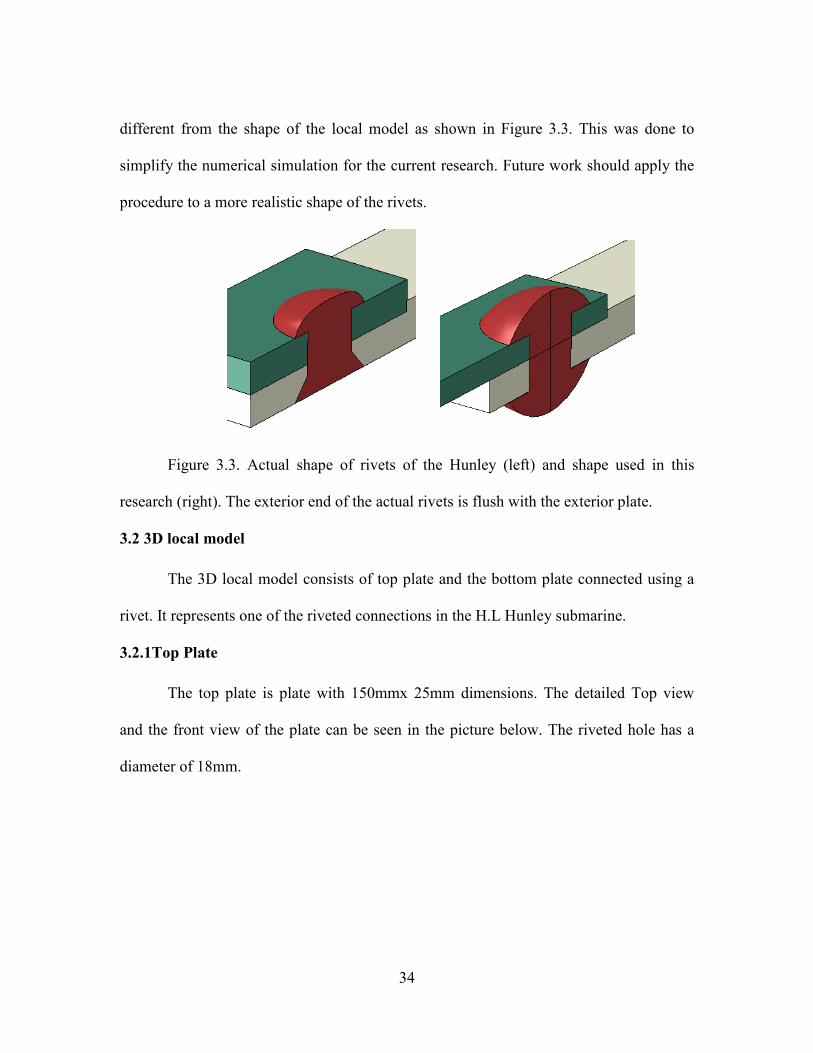
Chapter 3 focuses on the description and results of the three-dimensional local
model of riveted connections. The actual shape of the rivets of the Hunley is slightly
3D local model
Shell local
model
3D simplified global
model
34
different from the shape of the local model as shown in Figure 3.3. This was done to
simplify the numerical simulation for the current research. Future work should apply the
procedure to a more realistic shape of the rivets.
Figure 3.3. Actual shape of rivets of the Hunley (left) and shape used in this
research (right). The exterior end of the actual rivets is flush with the exterior plate.
3.2 3D local model
The 3D local model consists of top plate and the bottom plate connected using a
rivet. It represents one of the riveted connections in the H.L Hunley submarine.
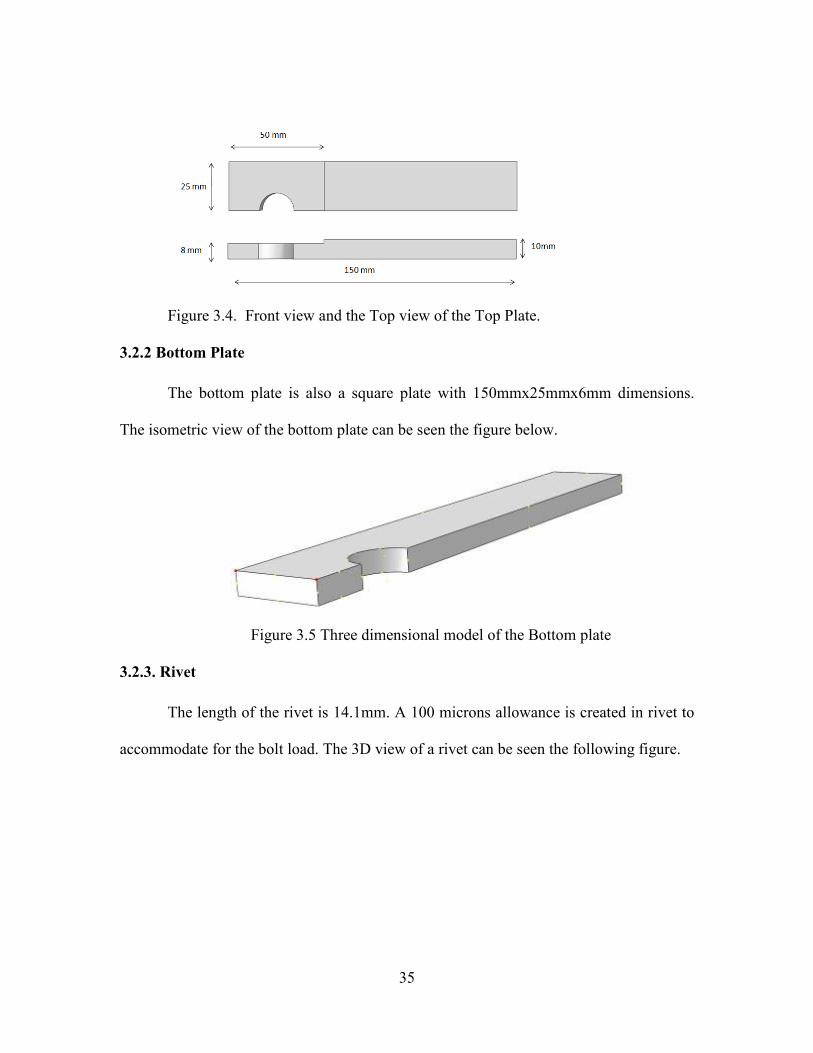
3.2.1Top Plate
The top plate is plate with 150mmx 25mm dimensions. The detailed Top view
and the front view of the plate can be seen in the picture below. The riveted hole has a
diameter of 18mm.
35
Figure 3.4. Front view and the Top view of the Top Plate.
3.2.2 Bottom Plate
The bottom plate is also a square plate with 150mmx25mmx6mm dimensions.
The isometric view of the bottom plate can be seen the figure below.
Figure 3.5 Three dimensional model of the Bottom plate
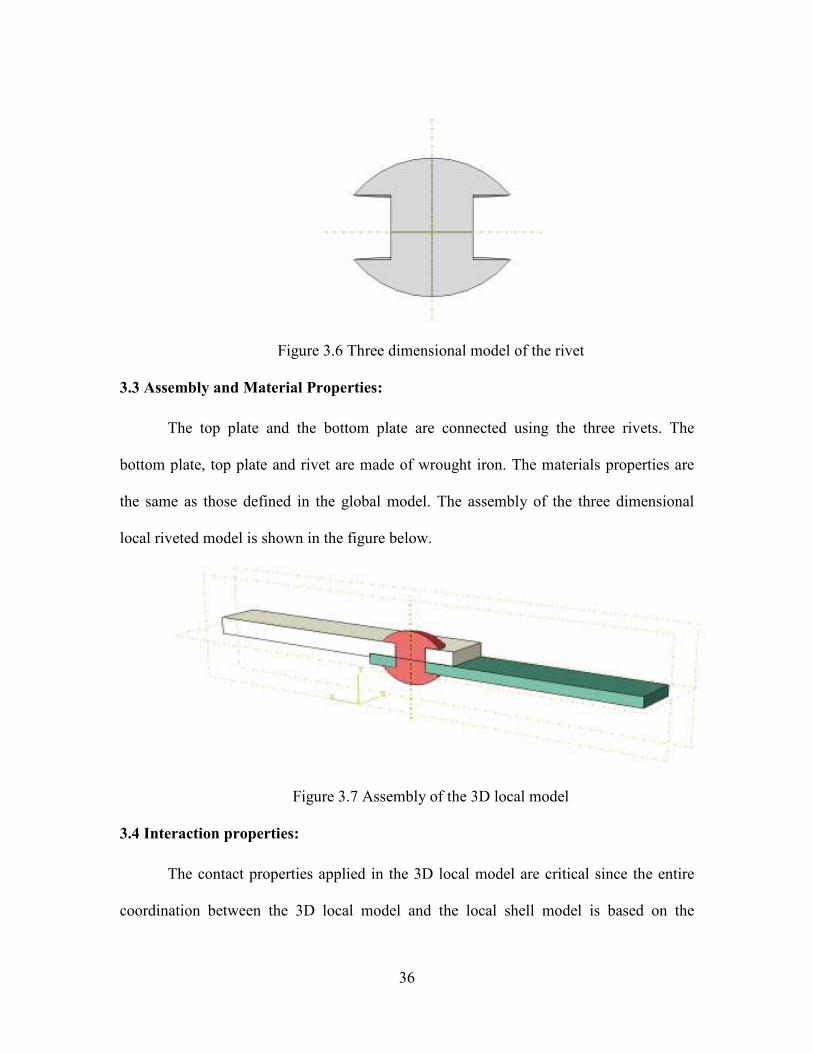
3.2.3. Rivet
The length of the rivet is 14.1mm. A 100 microns allowance is created in rivet to
accommodate for the bolt load. The 3D view of a rivet can be seen the following figure.
36
Figure 3.6 Three dimensional model of the rivet
3.3 Assembly and Material Properties:
The top plate and the bottom plate are connected using the three rivets. The
bottom plate, top plate and rivet are made of wrought iron. The materials properties are
the same as those defined in the global model. The assembly of the three dimensional
local riveted model is shown in the figure below.
Figure 3.7 Assembly of the 3D local model
3.4 Interaction properties:
The contact properties applied in the 3D local model are critical since the entire
coordination between the 3D local model and the local shell model is based on the
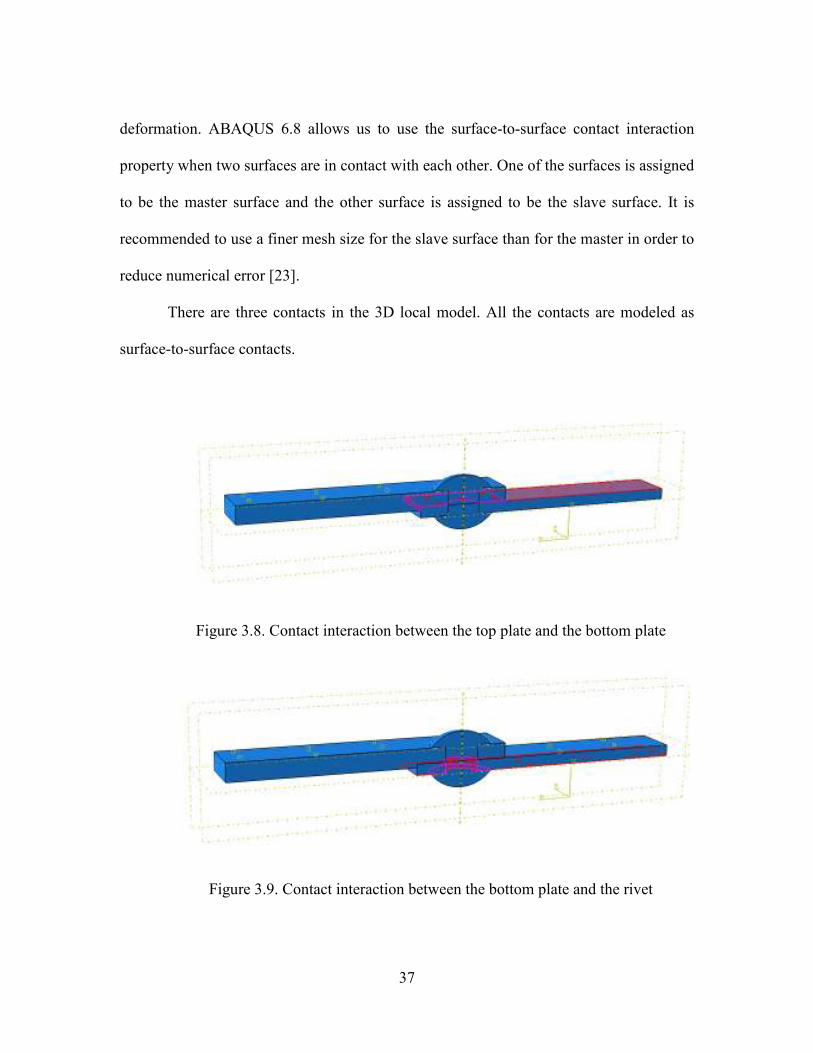
37
deformation. ABAQUS 6.8 allows us to use the surface-to-surface contact interaction
property when two surfaces are in contact with each other. One of the surfaces is assigned
to be the master surface and the other surface is assigned to be the slave surface. It is
recommended to use a finer mesh size for the slave surface than for the master in order to
reduce numerical error [23].
There are three contacts in the 3D local model. All the contacts are modeled as
surface-to-surface contacts.
Figure 3.8. Contact interaction between the top plate and the bottom plate
Figure 3.9. Contact interaction between the bottom plate and the rivet

38
Figure 3.10. Contact interaction between the top plate and the rivet
A surface smoothing technique is enabled to alleviate potential numerical issues
in calculating the contact stresses. Also since the 3D local model analysis is expected to
have lower deformation, the surface smoothing technique is expected to have a higher
significance [24].
The friction coefficient between all surfaces is assumed to be 0.8 as a reference.
Since the friction coefficient is unknown, a parametric study, presented in Section 3.7,
was performed to estimate its effect on the response of the riveted connection.
3.5 Boundary Conditions
Since the rivet is not rigidly connected to any fixed point, its static equilibrium
can be numerically found only when the contacts are properly activated. Therefore the
analysis is decomposed into at least three consecutive steps. In the initial configuration, a
small gap is defined between the two plates and both heads of the rivet by making the
rivet slightly longer than expected (by 0.1 mm). In the first step, one end of the rivet is
fixed and a “bolt load” (i.e., artificial shrinkage) is applied to the rivet to close the gap
and activate all contacts. In the second step, a longitudinal force is applied on the top
39
plate to represent the stress of the global model. In the third step, the rivet is releases,
which provides the static equilibrium of the connection due to the force applied in step 2.
A fourth step can then be defined to release the bolt load, which would be equivalent to
the creep behavior of the rivet over time. Three boundary conditions are applied and
removed at different steps of the analysis
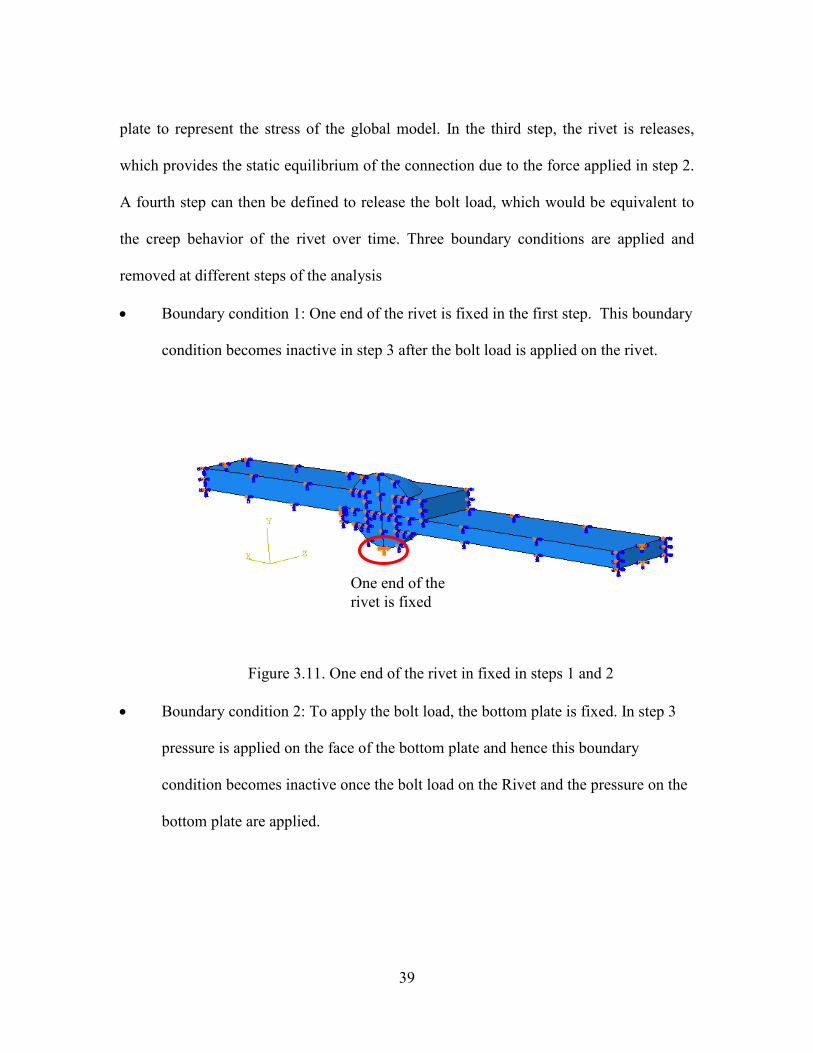
• Boundary condition 1: One end of the rivet is fixed in the first step. This boundary
condition becomes inactive in step 3 after the bolt load is applied on the rivet.
Figure 3.11. One end of the rivet in fixed in steps 1 and 2
• Boundary condition 2: To apply the bolt load, the bottom plate is fixed. In step 3
pressure is applied on the face of the bottom plate and hence this boundary
condition becomes inactive once the bolt load on the Rivet and the pressure on the
bottom plate are applied.
One end of the
rivet is fixed
40
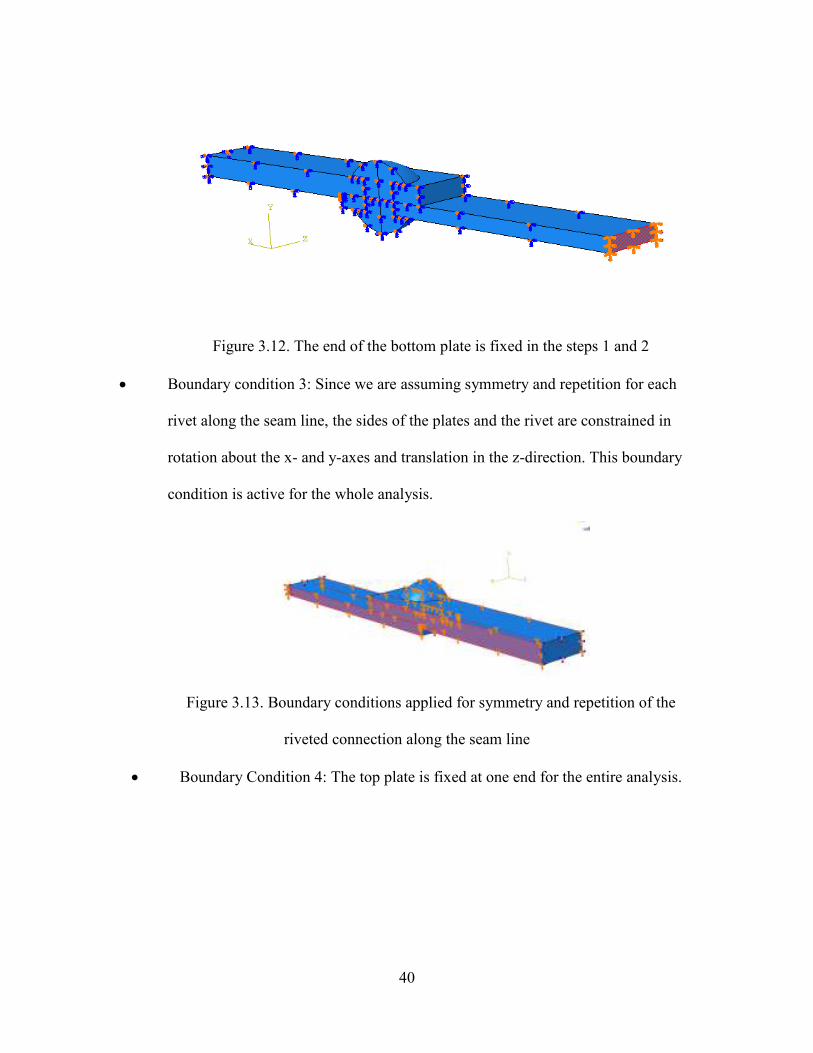
Figure 3.12. The end of the bottom plate is fixed in the steps 1 and 2
• Boundary condition 3: Since we are assuming symmetry and repetition for each
rivet along the seam line, the sides of the plates and the rivet are constrained in
rotation about the x- and y-axes and translation in the z-direction. This boundary
condition is active for the whole analysis.
Figure 3.13. Boundary conditions applied for symmetry and repetition of the
riveted connection along the seam line
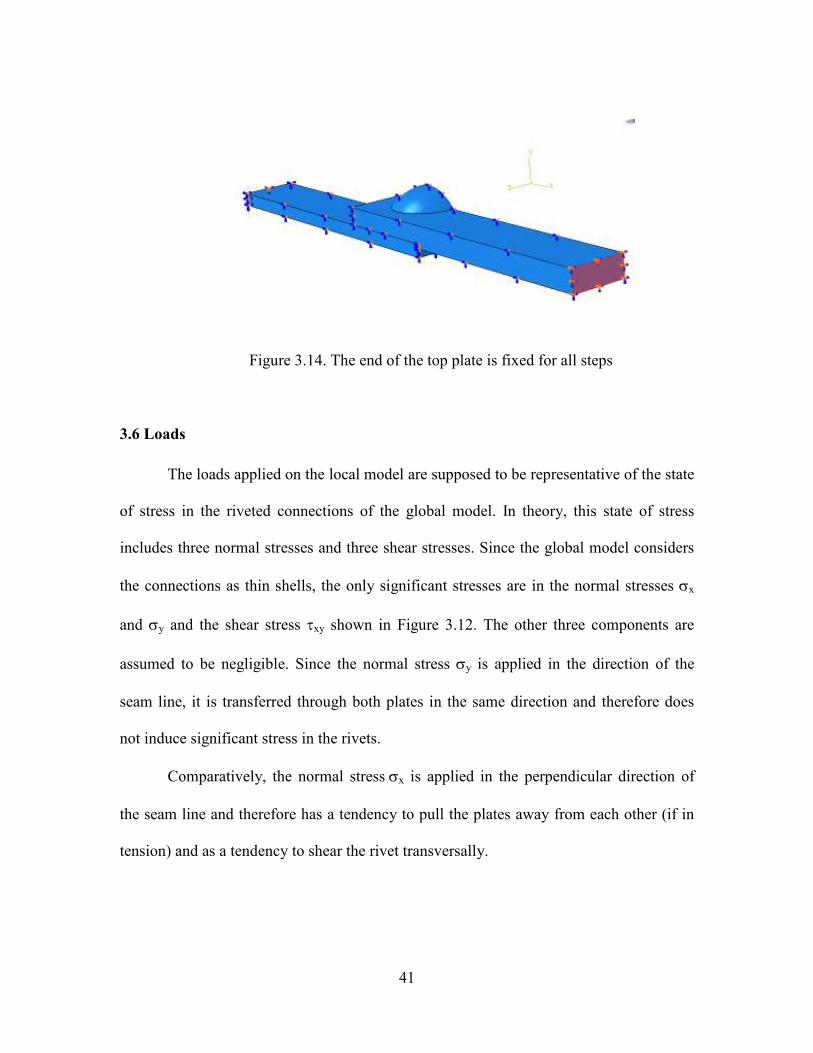
• Boundary Condition 4: The top plate is fixed at one end for the entire analysis.
41
Figure 3.14. The end of the top plate is fixed for all steps
3.6 Loads
The loads applied on the local model are supposed to be representative of the state
of stress in the riveted connections of the global model. In theory, this state of stress
includes three normal stresses and three shear stresses. Since the global model considers
the connections as thin shells, the only significant stresses are in the normal stresses σx
and σy and the shear stress τxy shown in Figure 3.12. The other three components are
assumed to be negligible. Since the normal stress σy is applied in the direction of the
seam line, it is transferred through both plates in the same direction and therefore does
not induce significant stress in the rivets.
Comparatively, the normal stress σx is applied in the perpendicular direction of
the seam line and therefore has a tendency to pull the plates away from each other (if in
tension) and as a tendency to shear the rivet transversally.
42
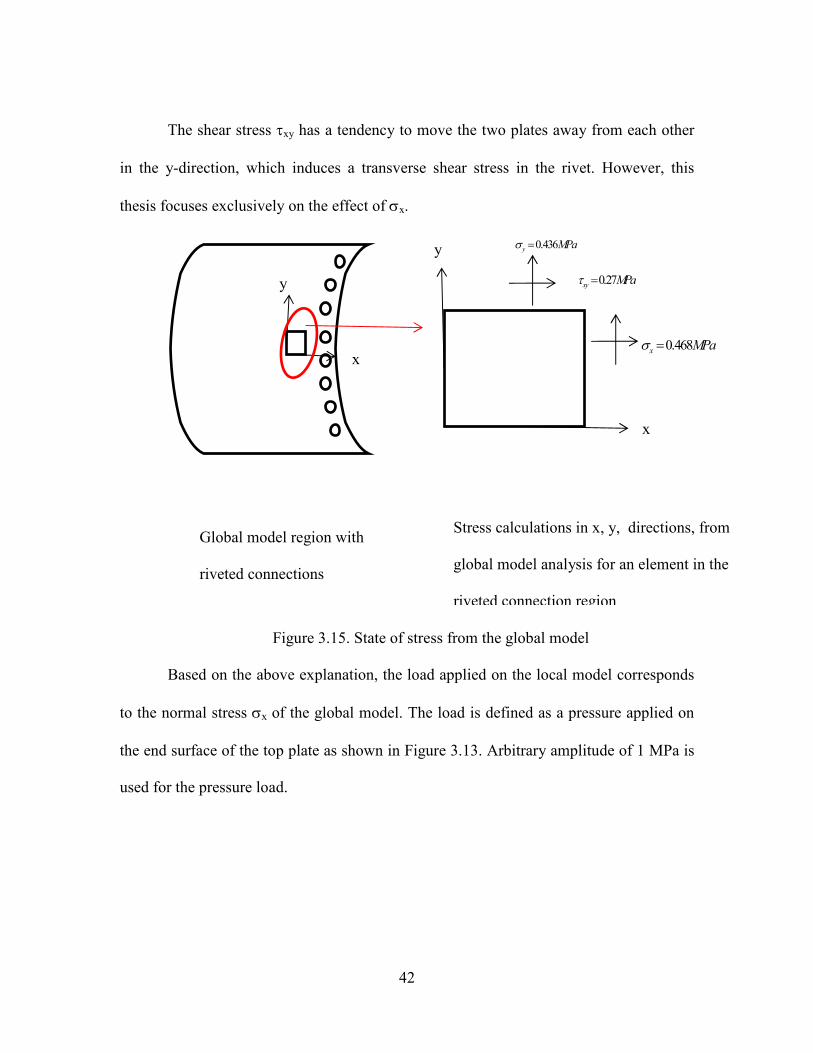
The shear stress τxy has a tendency to move the two plates away from each other
in the y-direction, which induces a transverse shear stress in the rivet. However, this
thesis focuses exclusively on the effect of σx.
Figure 3.15. State of stress from the global model
Based on the above explanation, the load applied on the local model corresponds
to the normal stress σx of the global model. The load is defined as a pressure applied on
the end surface of the top plate as shown in Figure 3.13. Arbitrary amplitude of 1 MPa is
used for the pressure load.
y
x
y
x
Global model region with
riveted connections
Stress calculations in x, y, directions, from
global model analysis for an element in the
riveted connection region
0.436y MPaσ =
0.27xy
MPaτ =
0.468x MPaσ =
43
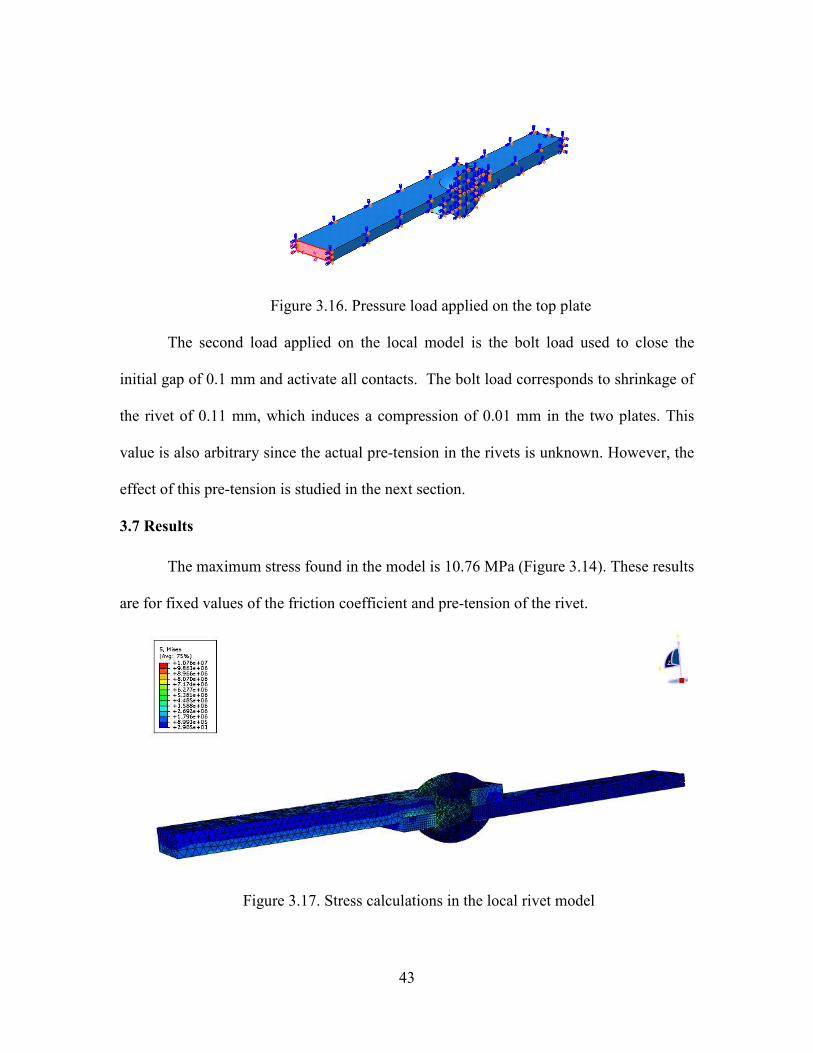
Figure 3.16. Pressure load applied on the top plate
The second load applied on the local model is the bolt load used to close the
initial gap of 0.1 mm and activate all contacts. The bolt load corresponds to shrinkage of
the rivet of 0.11 mm, which induces a compression of 0.01 mm in the two plates. This
value is also arbitrary since the actual pre-tension in the rivets is unknown. However, the
effect of this pre-tension is studied in the next section.
3.7 Results
The maximum stress found in the model is 10.76 MPa (Figure 3.14). These results
are for fixed values of the friction coefficient and pre-tension of the rivet.
Figure 3.17. Stress calculations in the local rivet model

44
Figure 3.18 Von Mises stress distribution in rivet
The effect of the friction coefficient and pre-tension is studied by varying the
values of the friction coefficient from 0.4 to 1.0 with an increment of 0.2. The stress
values are evaluated at a single location on the rivet. From the parametric study it was
found that the friction coefficient does not affect the stress in the rivet significantly.
Table 3.1 Parametric study on the effect of Frictional coefficient on Maximum
stress
Friction
coefficient
Maximum
stress
1 9.05 MPa
0.8 9.19 MPa
0.6 9.21 MPa
0.4 9.69 MPa
Studying the effect of pre-tension on the stress generated in the riveted connection
is crucial. Since the Hunley was under water for many years, it is hard to predict if there
45
is still any pretension in the rivets. It was found that pretension has a negligible effect on
the amount of stress generated in the riveted connection.
Table 3.2 Parametric study on the effect of pretension on Maximum stress
Pretension as
a length adjustment
(mm)
Maximum
stress(MPa)
0.10 9.19
0.20 9.21
0.30 9.22
0.40 9.19
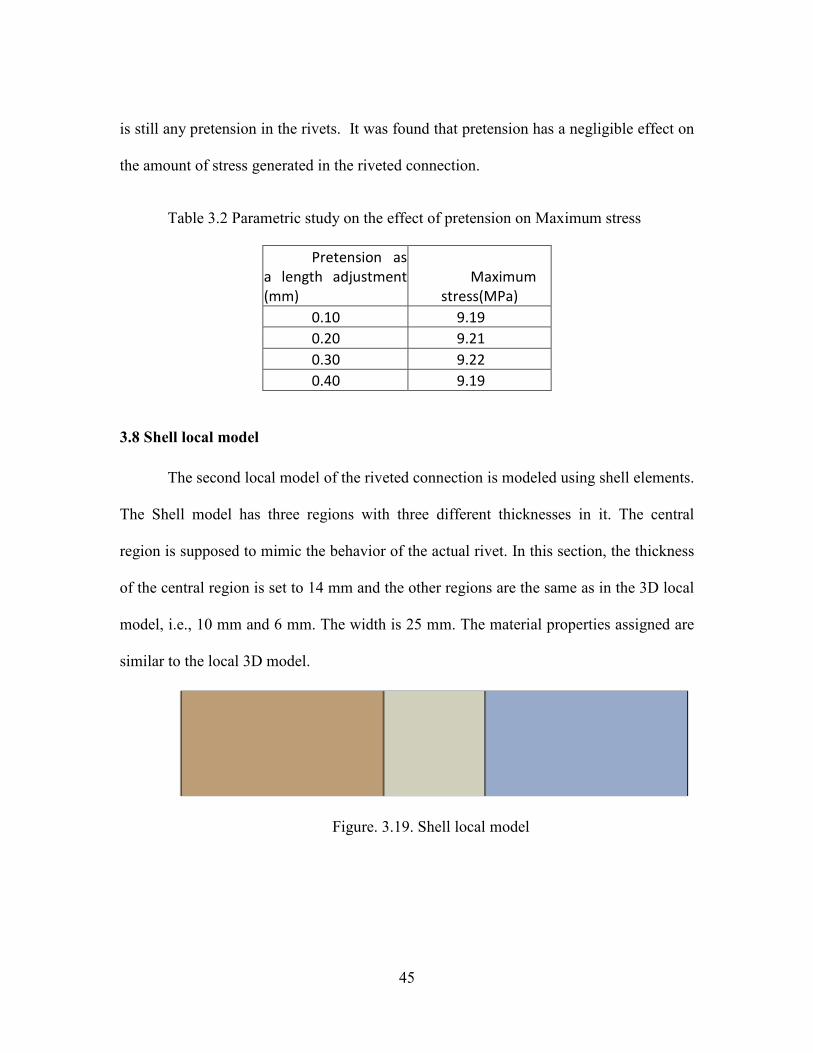
3.8 Shell local model
The second local model of the riveted connection is modeled using shell elements.
The Shell model has three regions with three different thicknesses in it. The central
region is supposed to mimic the behavior of the actual rivet. In this section, the thickness
of the central region is set to 14 mm and the other regions are the same as in the 3D local
model, i.e., 10 mm and 6 mm. The width is 25 mm. The material properties assigned are
similar to the local 3D model.
Figure. 3.19. Shell local model
46
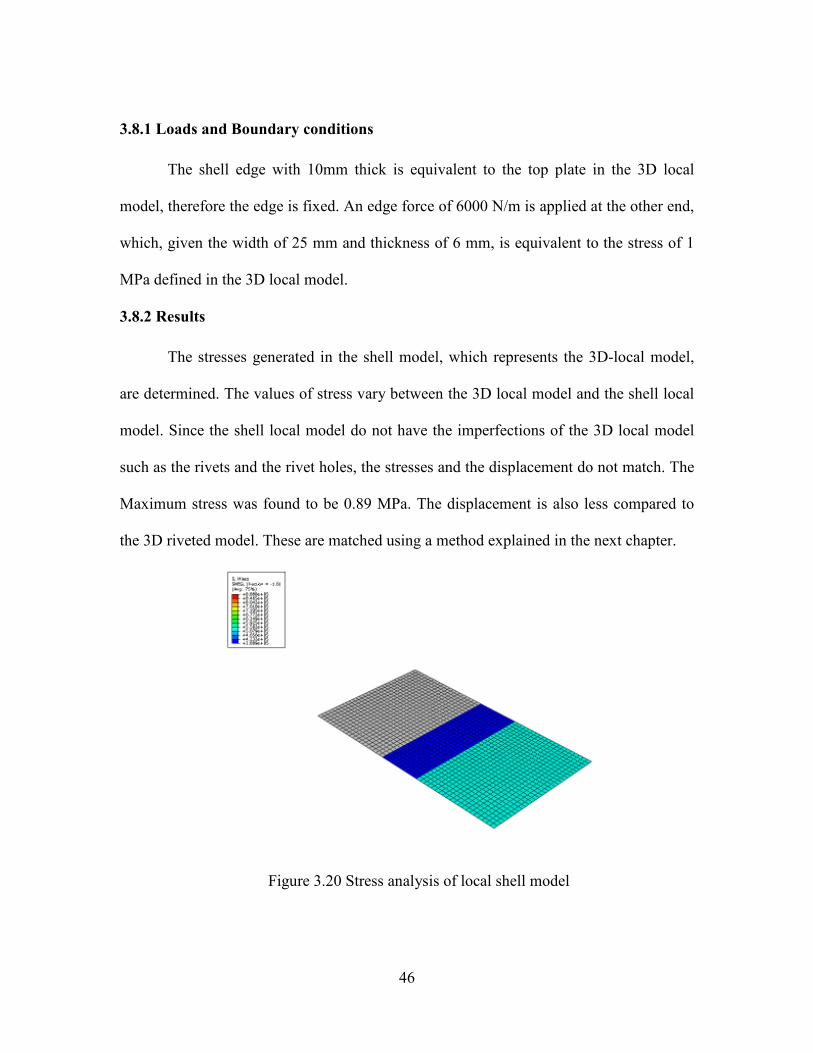
3.8.1 Loads and Boundary conditions
The shell edge with 10mm thick is equivalent to the top plate in the 3D local
model, therefore the edge is fixed. An edge force of 6000 N/m is applied at the other end,
which, given the width of 25 mm and thickness of 6 mm, is equivalent to the stress of 1
MPa defined in the 3D local model.
3.8.2 Results
The stresses generated in the shell model, which represents the 3D-local model,
are determined. The values of stress vary between the 3D local model and the shell local
model. Since the shell local model do not have the imperfections of the 3D local model
such as the rivets and the rivet holes, the stresses and the displacement do not match. The
Maximum stress was found to be 0.89 MPa. The displacement is also less compared to
the 3D riveted model. These are matched using a method explained in the next chapter.
Figure 3.20 Stress analysis of local shell model
47
CHAPTER 4
FINDING ACTUAL STRESSES IN RIVETED CONNECTION
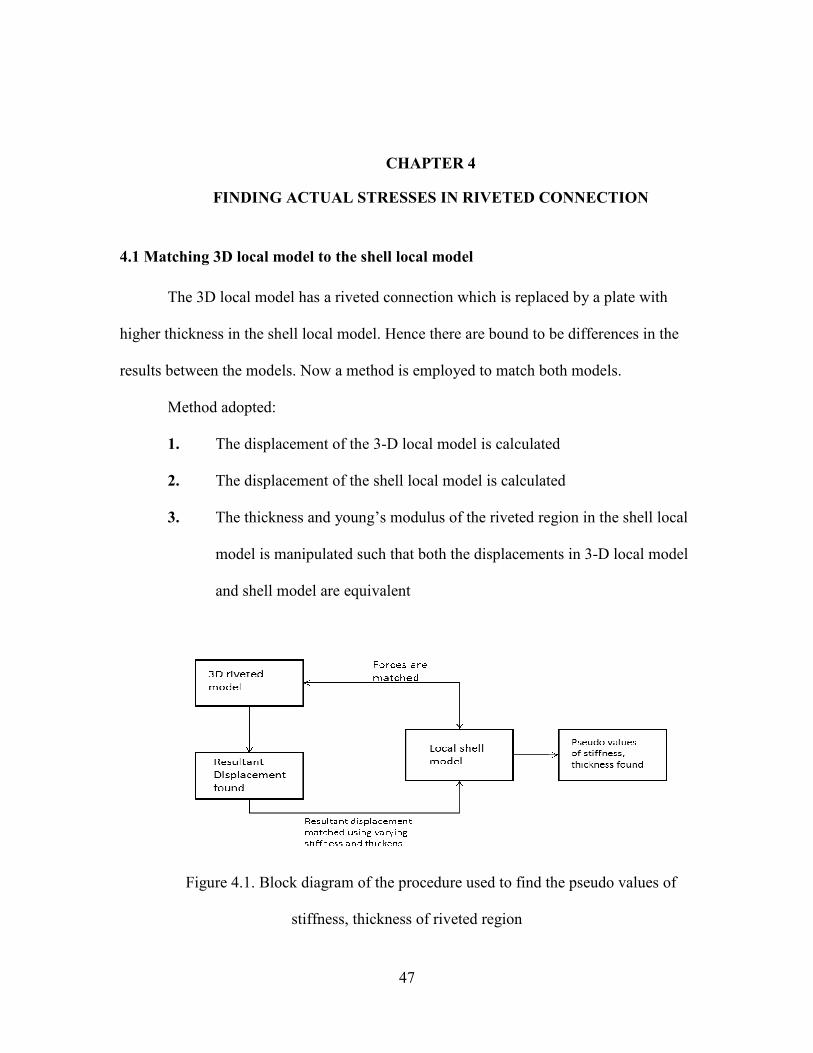
4.1 Matching 3D local model to the shell local model
The 3D local model has a riveted connection which is replaced by a plate with
higher thickness in the shell local model. Hence there are bound to be differences in the
results between the models. Now a method is employed to match both models.
Method adopted:
1. The displacement of the 3-D local model is calculated
2. The displacement of the shell local model is calculated
3. The thickness and young’s modulus of the riveted region in the shell local
model is manipulated such that both the displacements in 3-D local model
and shell model are equivalent
Figure 4.1. Block diagram of the procedure used to find the pseudo values of
stiffness, thickness of riveted region
48
From the results of the 3D local model, it was found that the bottom plate has a
displacement of 3.36 microns. Also the displacement of the shell plate was found to be
0.78 microns. Since we need to match the displacements of both the model, a parametric
study is conducted to find out the values of Young’s modulus and thickness in the riveted
connection of the shell model. These values will increase the displacement of the shell
model to 3.36 microns.
The initial thickness of the riveted connection in the shell model is 14 mm. A
parametric study was conducted by decreasing the thickness from 14 mm to 1 mm. For
this entire model the Young’s modulus was 210 GPa. However, even with a thickness
value of 1 mm the displacement value was less than that of the 3D model. Now at the
decreased thickness, the young’s modulus of the riveted region was also decreased. The
Young’s modulus was decreased from 210 GPa to 100 GPa to find the appropriate
combination of Young’s modulus and thickness of the riveted region.
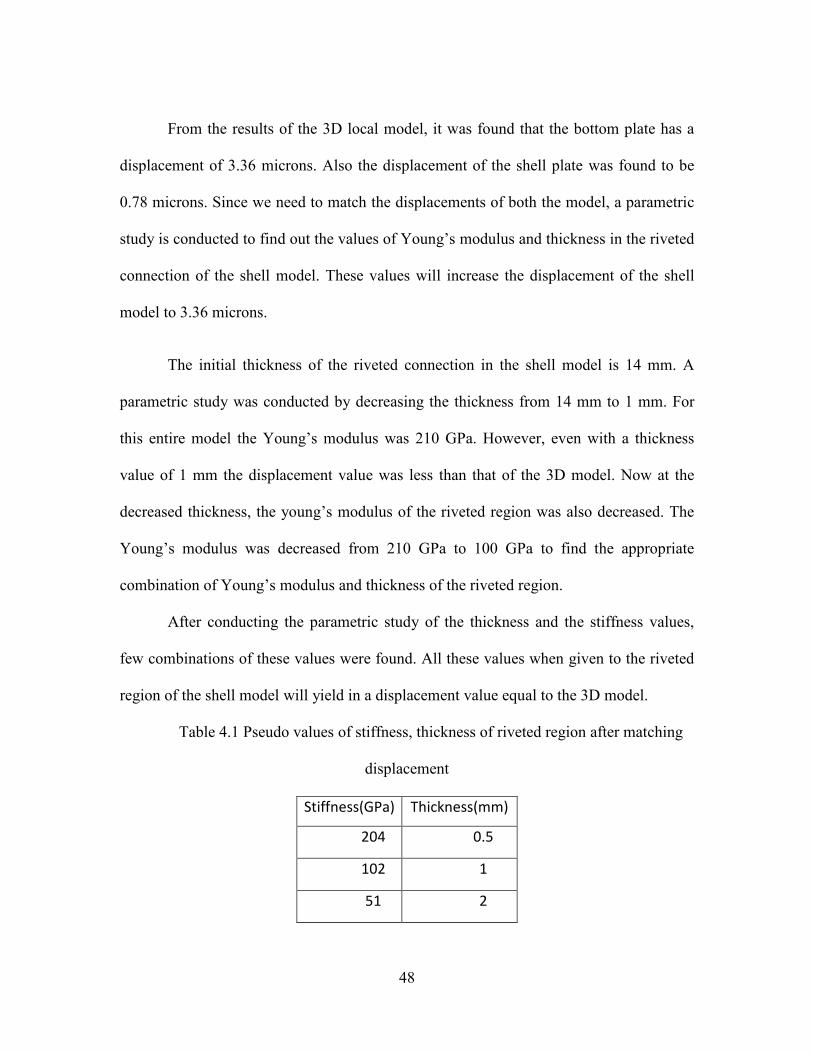
After conducting the parametric study of the thickness and the stiffness values,
few combinations of these values were found. All these values when given to the riveted
region of the shell model will yield in a displacement value equal to the 3D model.
Table 4.1 Pseudo values of stiffness, thickness of riveted region after matching
displacement
Stiffness(GPa) Thickness(mm)
204 0.5
102 1
51 2
49
25.5 4
12.75 8
Figure 4.2 Graph demonstrating the pseudo values of the stiffness and thickness
of the riveted region
4.2 Simplified global model
The pseudo values of stiffness and thickness of the riveted connection which
corresponds to the riveted region in a 3D local model were found. These pseudo values
must now be substituted in the riveted regions of the global model.
Since the global model is a large model with a high number of parts and
interactions, the effect of the riveted regions are studied using a simplified global model.
50
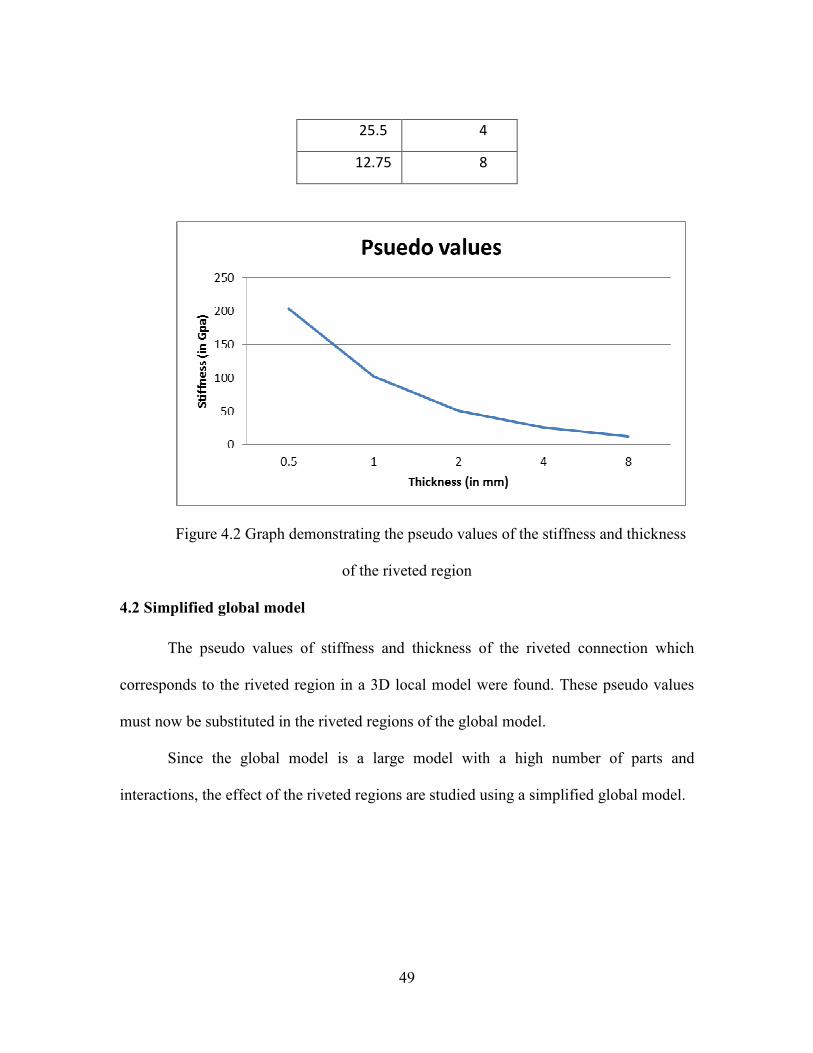
4.2.1 Simplified submarine
The simplified submarine, shown in Figure 4.3, is a shell model which does not
consist of the different parts of the main assembly such as the bow, stern, keel block, bulk
heads, hoops etc. It is a simple shell model which is representative of the submarine. For
reducing the analysis time, only half of the model was considered.
Figure 4.3. Simplified 3D global model
51
Figure 4.4. Flow diagram of the procedure used to find the final stress values in the
riveted connection
4.2.2 Material properties
The simplified sub has two regions, which are a main submarine region and the
riveted connections regions. The whole submarine except the riveted connections is
assigned the following material properties:
Region Thickness Young’s
Modulus
Density
Submarine (without
riveted connections)
8mm 210 GPa 7800
Riveted connection
region
14mm 210 GPa 7800

52
4.2.3 Finite Element Analysis of the simplified submarine
The effect of the riveted connections in the submarine is studied using the
simplified submarine. Since we just need to study the effect of the riveted connections,
the submarine is assumed to be supported on a single cushion. The simplified submarine
is assumed to be cantilevered at one end. The cushion is placed at distance of 12 microns
below the submarine before the start of the simulation.
The stresses developed in the submarine and the cushions are studied when the
support is raised by a distance of 15 microns towards the submarine. This can be
alternatively understood as the stresses developed when the submarine is lifted by 3
microns.
Figure 4.5. The 3D assembly of the simplified submarine model
An interaction between the cushion and the submarine was simulated using a
surface-to-surface contact in Abaqus and a frictional coefficient of 0.95 was assigned.
53
4.2.4 Results
The maximum stresses occurred in the submarine were at the contact of the
cushion and the submarine. The results obtained from the analysis were as below.
Table 4.2 The results of the Simple global model analysis
Max Stress
in Sub (MPa)
Max Displacement in
Sub (µm)
Max Stress in
cushion (MPa)
Reaction Force in
cushion (KN)
83.46 1.29 1.28 59.7
We have obtained the results of the submarine when the thickness of the riveted
region was not accounted for the local to global model analysis. Now we substitute the
pseudo values that were obtained from our analysis to the riveted regions and compare
the results. The riveted regions are assigned the flowing properties.
Table 4.3 The material properties assigned to riveted region in the Simple global
model
Thickness Young’s modulus Density
4 mm 25.5 GPa 7800 kg/m3
The resultant assembly is less stiff. The overall stress resulted in the submarine
was found to be much smaller when the pseudo values were assigned to the riveted
regions. Since the regions were less stiff the submarine was lifted easily. This resulted in
the lower reaction forces in the cushion and lower stresses in the submarine. The
displacement was also found to be higher when the stiffness was low. Detailed
comparison between the values of both the scenarios is given below.
54
Table 4.4 The difference in the results of Simplified before and after adding pseudo
values
Pseudo thickness
and stiffness
(riveted region)
Max Stress
in Sub (MPa)
Max Displacement
in Sub (µm)
Max Stress
in cushion
(MPa)
Reaction
Force in
Cushion (KN)
14mm, 210 Gpa 83.46 1.29 1.28 59.7
4mm, 25.5 Gpa 54.88 1.36 0.97 42.94
4.3 Validating the thickness and stiffness values
From the procedure discussed in the section we have found a set of thickness and
stiffness values. Now these values were assigned to the riveted regions in the submarine
and check whether the values yield similar results. The values are in the table below.
Table 4.5 Validation of the pseudo values
Pseudo thickness
and stiffness
(riveted region)
Max
Stress in Sub
(MPa)
Max
Displacement
in Sub (µm)
Max Stress
in cushion
(MPa)
Reaction
Force in
Cushion (KN)
0.5 mm, 204 GPa 54.34 1.36 0.97 42.97
1 mm, 102 GPa 54.37 1.36 0.97 42.95
2 mm, 51GPa 54.25 1.36 0.965 42.89
4 mm, 25.5GPa 54.88 1.36 0.97 42.94
From the above table we can see that the results for pseudo values of the thickness
and stiffness of the riveted region are comparable.
55
4.4 Matching the strain
We now match the strain of the riveted region in the simple sub model to the
strain in the local shell model. The strains are matched by changing the load that we
applied in the shell model.
The Maximum strain in the riveted connections in the simple sub was found to be
4.18 x10⁻⁴
.Now this strain is matched to the strain in the local shell model. The local shell
model has the strain of 5.59x10⁻⁵
.
The strain in the local shell model has to be matched to the strain in the simplified
global model. This is done by increasing the load on the local shell model. The local shell
model currently has a shell edge load of 6000 N. The load applied is increased until the
resultant strain is increased from 5.59x10⁻⁵
to 4.18 x10⁻⁴
.
The resultant load applied was found to be 45000 N by trial and error method.
4.5 Finding the final stresses in the riveted connection
Now we have the shell edge load that matches the strain values of the local shell
model and the simplified global model. The shell edge load is converted into an
equivalent pressure to be applied onto the 3D local model. This will provide the final
stresses in the riveted connection.
The pressure to be applied on the face of the 3D local model was found to be 7.5
MPa. This pressure is applied onto the final model and the resultant maximum stress is
92.11 MPa.
56
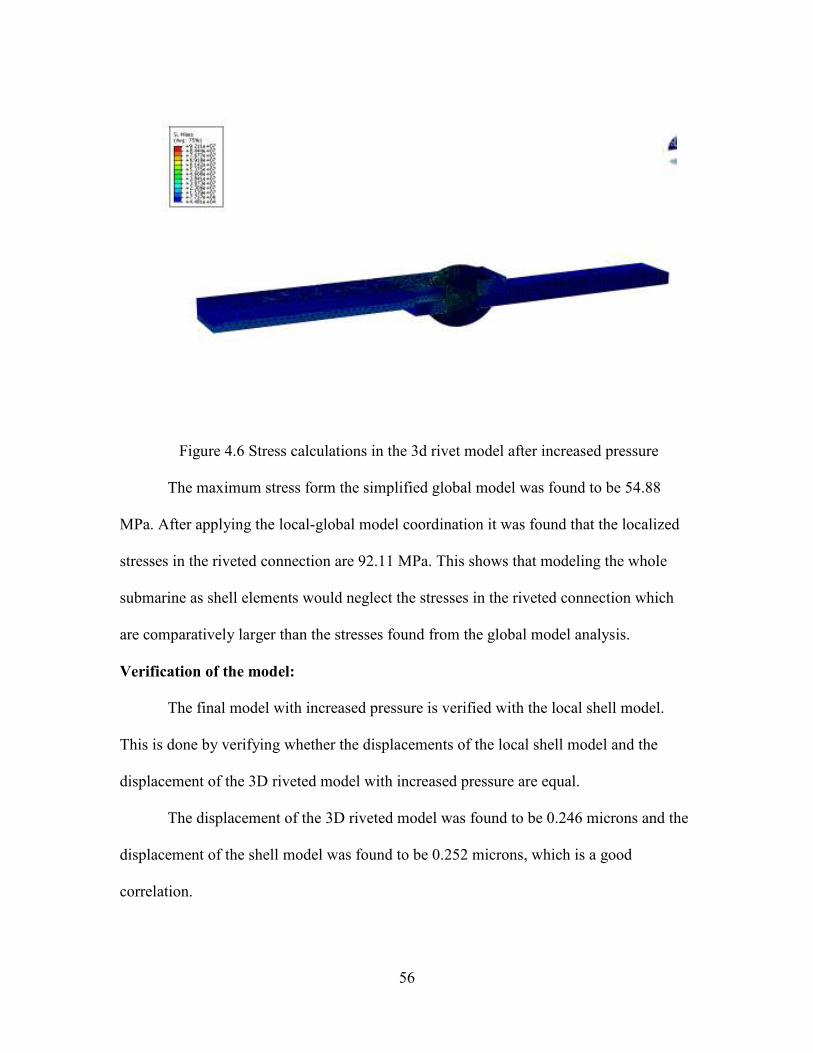
Figure 4.6 Stress calculations in the 3d rivet model after increased pressure
The maximum stress form the simplified global model was found to be 54.88
MPa. After applying the local-global model coordination it was found that the localized
stresses in the riveted connection are 92.11 MPa. This shows that modeling the whole
submarine as shell elements would neglect the stresses in the riveted connection which
are comparatively larger than the stresses found from the global model analysis.
Verification of the model:
The final model with increased pressure is verified with the local shell model.
This is done by verifying whether the displacements of the local shell model and the
displacement of the 3D riveted model with increased pressure are equal.
The displacement of the 3D riveted model was found to be 0.246 microns and the
displacement of the shell model was found to be 0.252 microns, which is a good
correlation.
57
CHAPTER 5
CORRODED RIVETED MODEL
5.1 Introduction to Marine corrosion
When a metal is dropped into sea water, the surface of the metal reacts with the
sea water and this reactive action is known as corrosion. Types of corrosion can be
broadly categorized in to the following:
• General Corrosion
• Localized Corrosion
• Erosion/Corrosion
• Galvanic corrosion
• Stress corrosion cracking
• Corrosion Fatigue[25]
As discussed earlier, the H.L. Hunley is heavily corroded. There is a lot of uneven
corrosion in the hull, which is difficult to model using Finite Element Analysis.
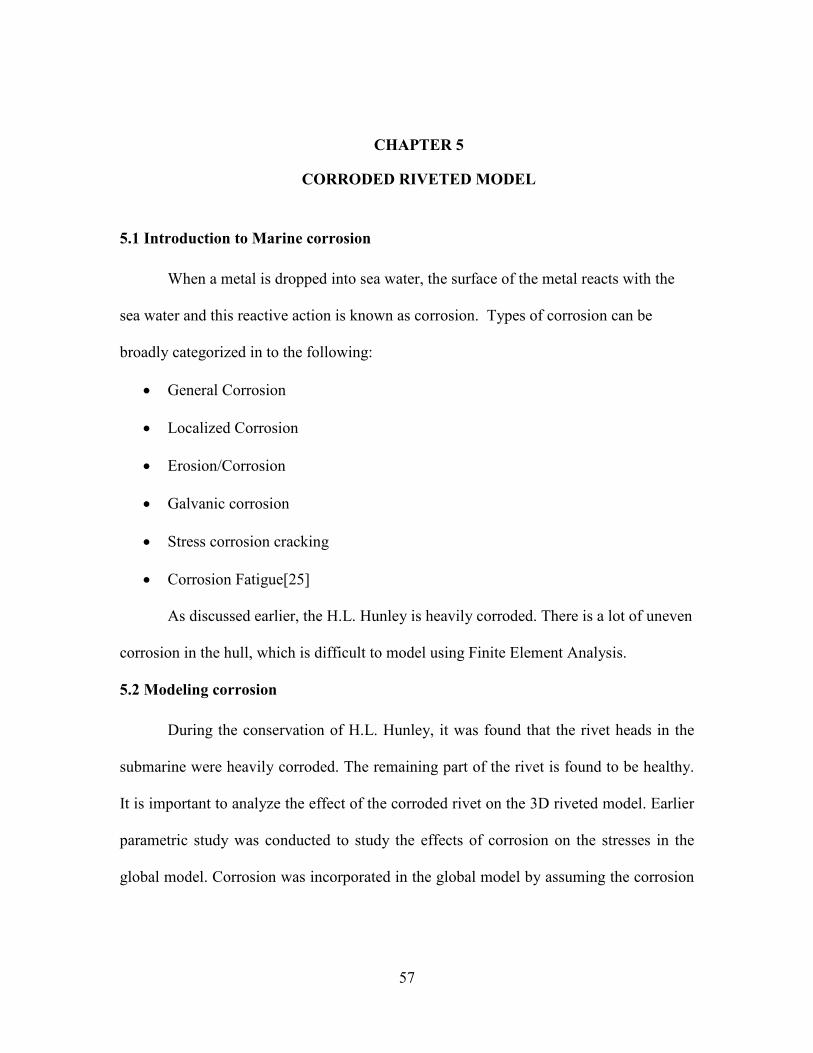
5.2 Modeling corrosion
During the conservation of H.L. Hunley, it was found that the rivet heads in the
submarine were heavily corroded. The remaining part of the rivet is found to be healthy.
It is important to analyze the effect of the corroded rivet on the 3D riveted model. Earlier
parametric study was conducted to study the effects of corrosion on the stresses in the
global model. Corrosion was incorporated in the global model by assuming the corrosion
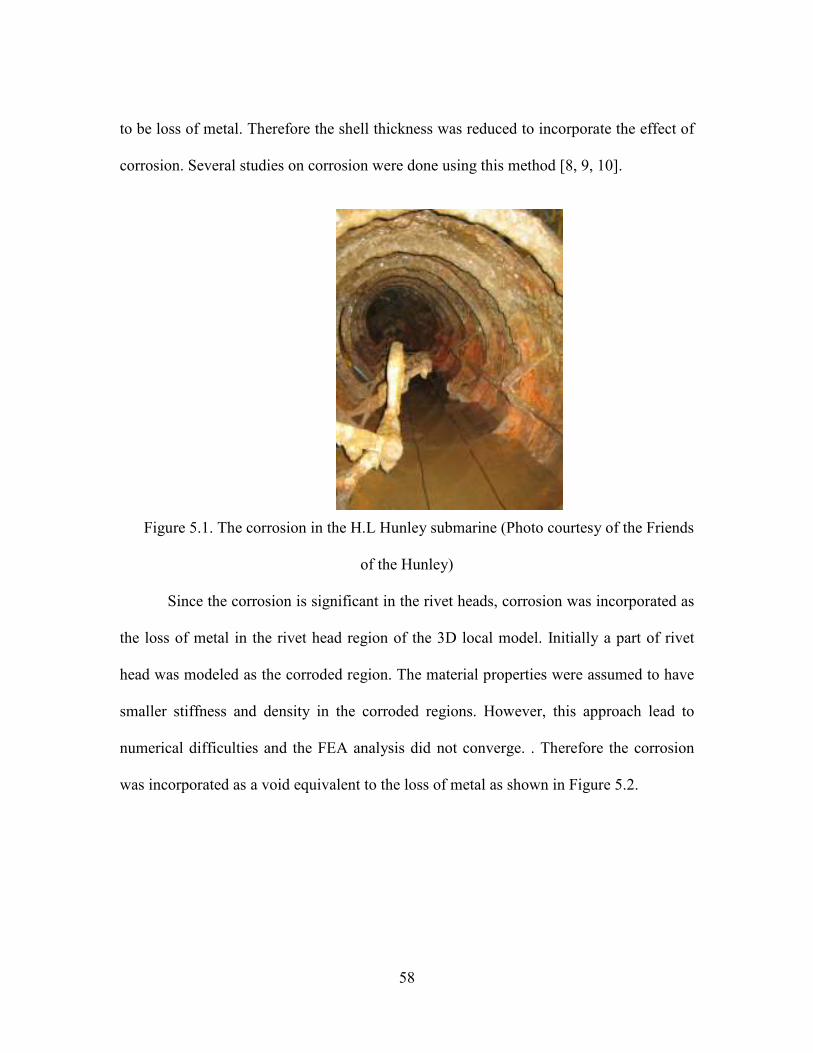
58
to be loss of metal. Therefore the shell thickness was reduced to incorporate the effect of
corrosion. Several studies on corrosion were done using this method [8, 9, 10].
Figure 5.1. The corrosion in the H.L Hunley submarine (Photo courtesy of the Friends
of the Hunley)
Since the corrosion is significant in the rivet heads, corrosion was incorporated as
the loss of metal in the rivet head region of the 3D local model. Initially a part of rivet
head was modeled as the corroded region. The material properties were assumed to have
smaller stiffness and density in the corroded regions. However, this approach lead to
numerical difficulties and the FEA analysis did not converge. . Therefore the corrosion
was incorporated as a void equivalent to the loss of metal as shown in Figure 5.2.
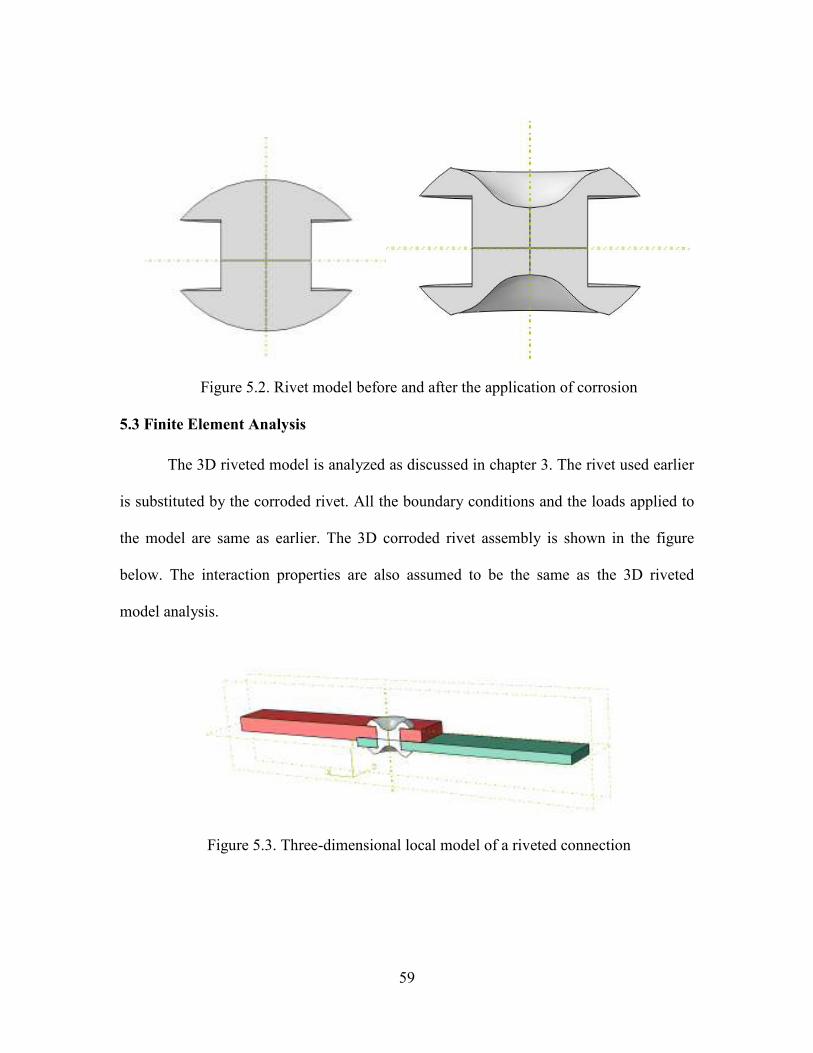
59
Figure 5.2. Rivet model before and after the application of corrosion
5.3 Finite Element Analysis
The 3D riveted model is analyzed as discussed in chapter 3. The rivet used earlier
is substituted by the corroded rivet. All the boundary conditions and the loads applied to
the model are same as earlier. The 3D corroded rivet assembly is shown in the figure
below. The interaction properties are also assumed to be the same as the 3D riveted
model analysis.
Figure 5.3. Three-dimensional local model of a riveted connection

60
5.4 Results
The effect of corrosion of the rivets on stresses induced in the 3D local model is
studied. The stresses are found to be critical in the riveted connections. The 3D local
model has a load of 1MPa applied on the bottom plate. Since only the top and bottom of
the riveted part are assumed to be affected by corrosion, it was found that the corrosion
does not have a large effect on the stresses induced in the connection.
The riveted connection has one critical node with high stresses. The Von-Misses
stresses at that node in the rivet are determined. The critical node in the rivet is shown in
the figure below.
Figure 5.4 Von Mises stress in the corroded rivet
The Principal stresses in the high stress region are found out from the corroded
rivet analysis. They are as follows:
σ 1 = 1.3 MPa σ 2 = 12.7 MPa σ 3 = 3.85 MPa
σ 12 = 4.45 MPa σ 13 = 0.14 MPa σ 23 = 0.25 MPa
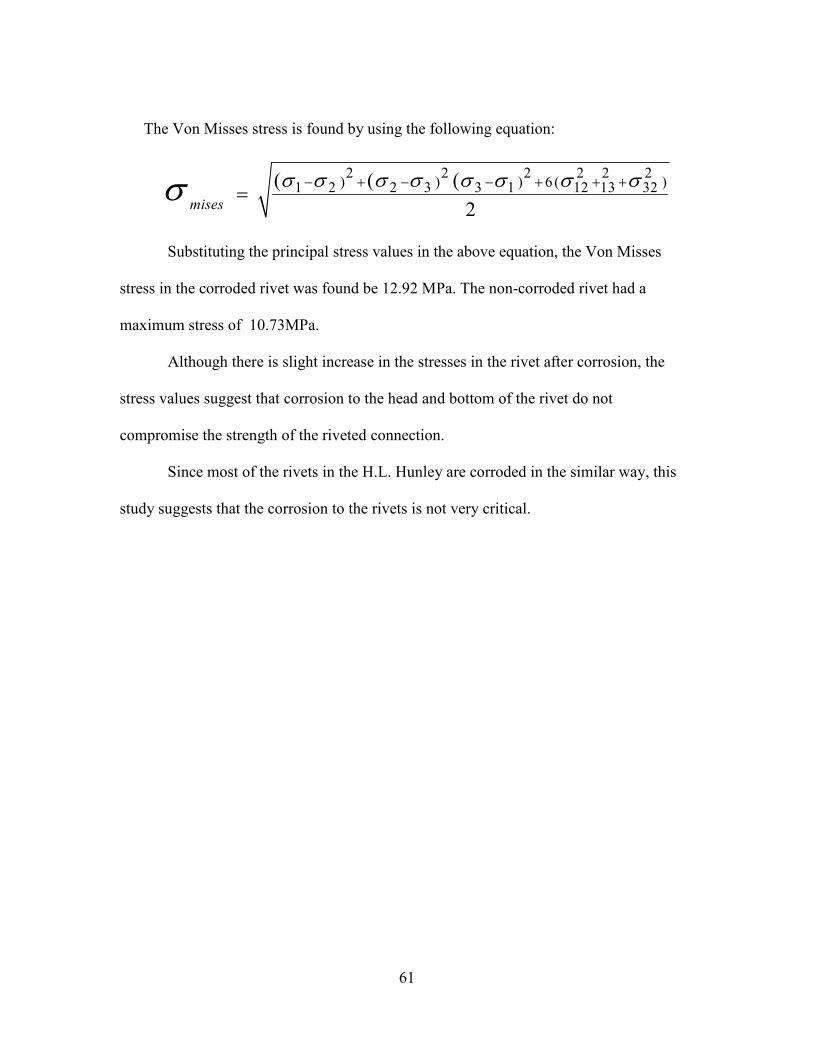
61
The Von Misses stress is found by using the following equation:
2 2 2 2 2 2) ) ) 6 ( )1 2 2 3 3 1 12 13 32( ( (
2mises
σ σ σ σ σ σ σ σσ − + − − + + +=
Substituting the principal stress values in the above equation, the Von Misses
stress in the corroded rivet was found be 12.92 MPa. The non-corroded rivet had a
maximum stress of 10.73MPa.
Although there is slight increase in the stresses in the rivet after corrosion, the
stress values suggest that corrosion to the head and bottom of the rivet do not
compromise the strength of the riveted connection.
Since most of the rivets in the H.L. Hunley are corroded in the similar way, this
study suggests that the corrosion to the rivets is not very critical.
62
CHAPTER 6
CONCLUSION AND FUTURE WORK
6.1 Conclusion
The intent of this thesis is to provide the foundation and the initial ground work
for further study on stress analysis of H.L. Hunley submarine using a global-local model
coordination procedure. The research presented in this thesis includes the following main
contributions:
1. Partial development of several global models of the H.L. Hunley submarine to
analysis the structural integrity of the hull.
2. Created a 3D riveted model, shell model to represent the riveted connections in
the H.L. Hunley. Carried out the Finite element analysis using ABAQUS 6.8 and
determined the stresses in the riveted connection.
3. Created a Simplified Submarine model, corresponding to H.L. Hunley and carried
out the stress analysis using ABAQUS 6.8. Developed a global- global model
coordination procedure to more accurately find the localized stresses in the
riveted connection.
4. Demonstrated the difference between the stresses found using the shell elements
in the global model and the stresses in the riveted connection using global- global
model coordination.
5. Created a corroded rivet model and studied the effects of corrosion in the rivets in
the H.L. Hunley submarine.

63
6.2 Future Work
Based on the experience gathered during this research project, the following
recommendations for future work include:
1. Validation of the global-local coordination procedure using experimental analysis
to support the results from the Finite Element Analysis.
2. Substituting the simplified global model with the actual global model. Finding the
difference between the localized stresses and the stresses induced in the global
model.
3. Analysis of crack propagation around riveted connections using ABAQUS 6.10
should be carried out. Methods such as finding the stress intensity factor,
predicting crack growth and propagation should be carried out.
64
REFERENCES
[1] Walker, S. M. (2005). In S. M. Walker, Secrets of a Civil war submarine: solving the
mysteries of the H.L Hunley. Minneapolis: Carolthoda Books Inc.
[2] Naval Historical Center. (2000, June 27). Navy Credits Clive Cussler with Locating
Hunley. Retrieved September 22, 2010, from National Underwater and marine
agency: http://www.numa.net/articles/navy_credits_clive_cussler.html
[3] Young, M. (2007, October 24). 1838-1874: Sectionalism, the Civil War, and
Reconstruction: H.L. Hunley. Retrieved September 22, 2010, from Encyclopedia of
Alabama: http://www.encyclopediaofalabama.org/face/Article.jsp?id=h-1376
[4] Curry, A. (2007, June 24). Time Capsule From the Sea: Artifacts from the South's
Submarine are Turning Fable into Fact. Retrieved September 07, 2010, from US
News & World report:
http://www.usnews.com/usnews/news/articles/070624/2hunley_2.htm
[5] Historic Naval Ships Association. (1997). H.L. HUNLEY. Retrieved September 22,
2010, from Historic Naval Ships Association: http://www.hnsa.org/ships/hunley.htm
[6] Mardikian, P. (2004). Conservation and Management Strategies Applied to Post-
Recovery and Analysis of the American civil war submarine. The International
Journal of Nautical Archeology , 137-148
[7] CONSERVATION. (2010). Retrieved September 22, 2010, from Friends of the
Hunley:
http://www.hunley.org/main_index.asp?CONTENT=CONSERVATION
65
[8] Boulent M. Imam, T. D. (2010). Fatigue evaluation of riveted railway bridges through
global and local analysis. Journal of Constructional Steel Research, 1411-1421
[9] Matthew A. Russell, D. L. (2006). A Minimum-Impact Method for Measuring
Corrosion Rate of Steel-Hulled Shipwrecks in Seawater. The International Journal of
Nautical Archaeology, 310-318.
[10] P.A. Slater, M. P. (2000). Finite element analysis of buckling of corroded ship
plates. Can. J. Civ. Eng. Vol. 27, 463-474.
[11] Krishnamurthy N, Graddy D. Correlation between 2 and 3-dimensional Finite
element analysis of steel bolted end-plate connections. Comput Struct 1976;6:381-
389
[12] Kukreti AR, Murray TM, Abolmaali A. End plate con-nection moment±rotation
relationship. J Constr Steel Res 1987;8:137-57.
[13] Kukreti AR, Murray TM, Ghassemieh M. Finite element modeling of large capacity
stiffened steel tee-hanger connections. Comput Struct 1989;32(2):409-22
[14] O.S. Bursi, J. J. (1998). Basic issues in the Finite element simulation of extended
end plate connections. Computers and Structures 69 , 361-382
[15] Ashok L.Ramteke, P. B. (2009). Improving analysis accuracy by modeling
rivet/bolts as solids in sheet metal structure. 7th European LS-DYNA conference.
DYNAmore GmbH
[16] Montgomery Jerome. Methods of modeling bolts in the bolted joints, ANSYS World
conference, 2006
66
[17] John D. Reid and Nicholas R. Hiser. Detailed modeling of bolted joints with
slippage, Finite elements in analysis and design, Volume 41, Issue 6, 2005,
Pages:547-562
[18] Timothy E. Dunbar, N. P. (2004). A computational investigation of the effects of
localized corrosion on plates and stiffened panels. Marine Structures, 385-402.
[19] Simulia product: ABAQUS, http://www.simulia.com/products/abaqus_fea.html,
accessed May 15, 2010.
[20] Mardikian, P., M. Drews, N. Gonzalez, P. deVivies, “H.L. Hunley conservation
plan”, ed. J. Hunter III., Submitted to the US Naval Historical Center for approval
after peer review, Charleston, 2006.
[21] Oceaneering International, Inc., H.L. Hunley General Recovery Procedures, Internal
document, Clemson Conservation Center, North Charleston, SC, January 4, 2000.
[22] Vincent Y. Blouin, Paul Mardikian, Christopher Watters (2010). Finite element
analysis of the H.L Hunley submarine: A turning point in the project’s history. Metal
Conference
[23] ABAQUS. (n.d.). Contact formulations in Abaqus/Standard. Retrieved 04 14, 2011,
from Abaqus analysis user manual:
http://129.25.22.58:2180/v6.8/books/usb/default.htm
67
[24] ABAQUS. (n.d.). Smoothing contact surfaces in Abaqus/Standard. Retrieved 04 14,
2011, from Abaqus User manual:
http://129.25.22.58:2180/v6.8/books/usb/default.htm?startat=pt09ch30s02aus121.ht
ml#usb-cni-asmoothsurfaces
[25] Morton, A. G. MARINE CORROSION. Annapolis, Maryland 2140: David Taylor
Naval Ship Research and Development.