financial statements for the year ended december …
TRANSCRIPT

Management Report of Fund Performance For the Six Month Period Ended December 31, 2015 August 27, 2014
Financial Statements Page | 1
MANAGEMENT’S RESPONSIBILITY FOR FINANCIAL REPORTING
FINANCIAL STATEMENTS FOR THE YEAR ENDED DECEMBER 31, 2017 AUDITED
MANAGEMENT’S RESPONSIBILITY FOR FINANCIAL REPORTING
Financial Statements Page | 1
The financial statements of Priviti Oil & Gas Opportunities Limited Partnership 2013 (the “Fund”) have been prepared by Priviti Capital Corporation (the “Manager”). The Manager of the Fund is responsible for the information and representations contained in these financial statements. These statements have been prepared in compliance with International Financial Reporting Standards (“IFRS”) as published by the International Accounting Standards Board. These financial statements include certain estimates that reflect the Manager’s best estimates and judgments. The Manager has ensured that careful judgment has been made and that these estimates are reasonable based on all information known at the time the estimate is made.
The Manager is responsible for maintaining a system of internal controls designed to provide reasonable assurance that all transactions are properly authorized and recorded, that the financial statements realistically report the Fund’s financial position and performance, and that the Fund’s assets are safeguarded. The Manager has effective disclosure controls and procedures to ensure timely and accurate disclosure of material information relating to the Fund. The Board of Directors of Priviti Oil & Gas Opportunities 2013 General Partner Corp., the general partner of the Fund, is responsible for ensuring that the Manager fulfills its responsibilities for financial reporting and has reviewed and approved these financial statements. The Board of Directors of the General Partner has engaged PricewaterhouseCoopers LLP to examine the financial statements of the Limited Partnership. PricewaterhouseCoopers LLP have audited the financial statements in accordance with Canadian generally accepted auditing standards to enable them to express to the Limited Partners their independent opinion on the financial statements. The auditors have full and unrestricted access to the audit committee, with or without the presence of Management, in order to discuss their audit and related findings.
Ward Mallabone President and Chief Executive Officer Priviti Capital Corporation
Robert Vargo Chief Operating Officer Priviti Capital Corporation
March 22, 2018
INDEPENDENT AUDITOR’S REPORT To the Limited Partners of Priviti Oil & Gas Opportunities Limited Partnership 2013 (the Fund)
Financial Statements Page | 2
We have audited the accompanying financial statements of the Fund, which comprise the statements of financial position as at December 31, 2017 and December 31 2016, and the statements of comprehensive income, changes in net assets and cash flows for the years then ended, and the related notes, which comprise a summary of significant accounting policies and other explanatory information. Management’s responsibility for the financial statements Management is responsible for the preparation and fair presentation of these financial statements in accordance with International Financial Reporting Standards, and for such internal control as management determines is necessary to enable the preparation of financial statements that are free from material misstatement, whether due to fraud or error. Auditor’s responsibility Our responsibility is to express an opinion on these financial statements based on our audits. We conducted our audits in accordance with Canadian generally accepted auditing standards. Those standards require that we comply with ethical requirements and plan and perform the audit to obtain reasonable assurance about whether the financial statements are free from material misstatement. An audit involves performing procedures to obtain audit evidence about the amounts and disclosures in the financial statements. The procedures selected depend on the auditor’s judgment, including the assessment of the risks of material misstatement of the financial statements, whether due to fraud or error. In making those risk assessments, the auditor considers internal control relevant to the entity’s preparation and fair presentation of the financial statements in order to design audit procedures that are appropriate in the circumstances, but not for the purpose of expressing an opinion on the effectiveness of the entity’s internal control. An audit also includes evaluating the appropriateness of accounting policies used and the reasonableness of accounting estimates made by management, as well as evaluating the overall presentation of the financial statements. We believe that the audit evidence we have obtained in our audits is sufficient and appropriate to provide a basis for our audit opinion. Opinion In our opinion, the financial statements present fairly, in all material respects, the financial position of the Fund as at December 31, 2017 and December 31, 2016 and its financial performance and its cash flows for the years then ended in accordance with International Financial Reporting Standards. Chartered Professional Accountants Calgary, Alberta March 22, 2018
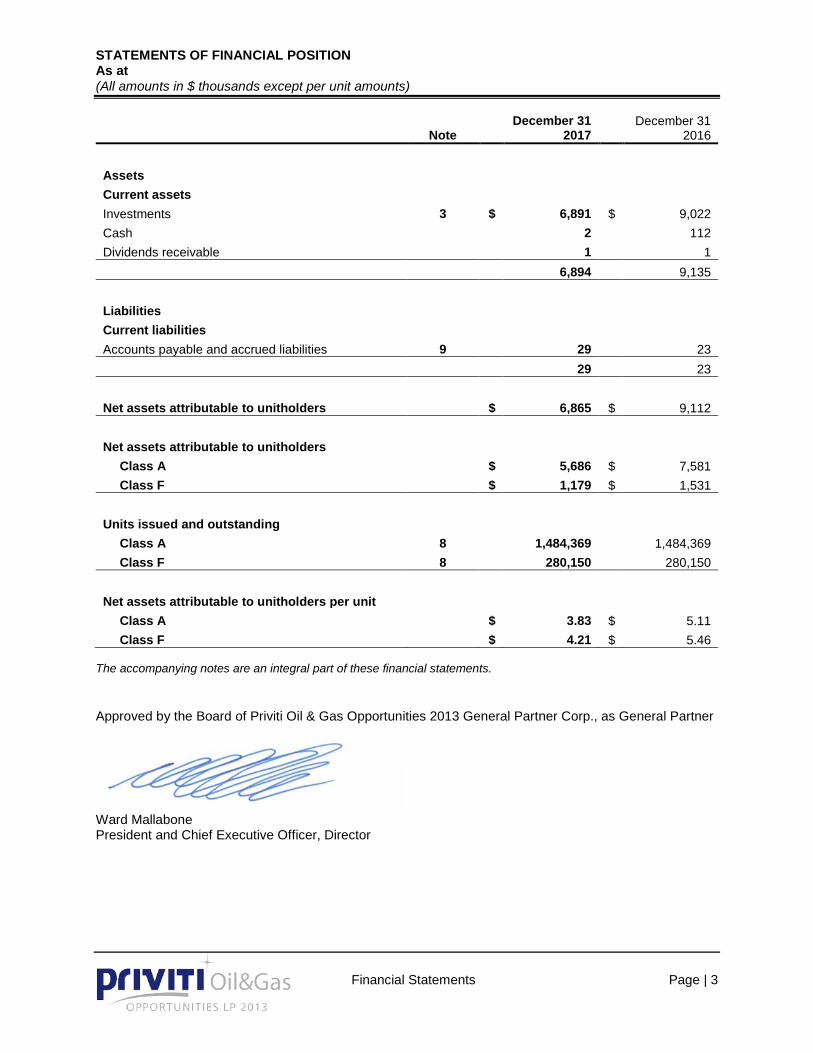
STATEMENTS OF FINANCIAL POSITION As at (All amounts in $ thousands except per unit amounts)
Financial Statements Page | 3
STATEMENTS OF FINANCIAL POSITION
Note December 31
2017 December 31
2016 Assets Current assets Investments 3 $ 6,891 $ 9,022 Cash 2 112 Dividends receivable 1 1 6,894 9,135 Liabilities Current liabilities Accounts payable and accrued liabilities 9 29 23 29 23 Net assets attributable to unitholders $ 6,865 $ 9,112 Net assets attributable to unitholders
Class A $ 5,686 $ 7,581 Class F $ 1,179 $ 1,531
Units issued and outstanding
Class A 8 1,484,369 1,484,369 Class F 8 280,150 280,150
Net assets attributable to unitholders per unit
Class A $ 3.83 $ 5.11 Class F $ 4.21 $ 5.46
The accompanying notes are an integral part of these financial statements. Approved by the Board of Priviti Oil & Gas Opportunities 2013 General Partner Corp., as General Partner
Ward Mallabone President and Chief Executive Officer, Director
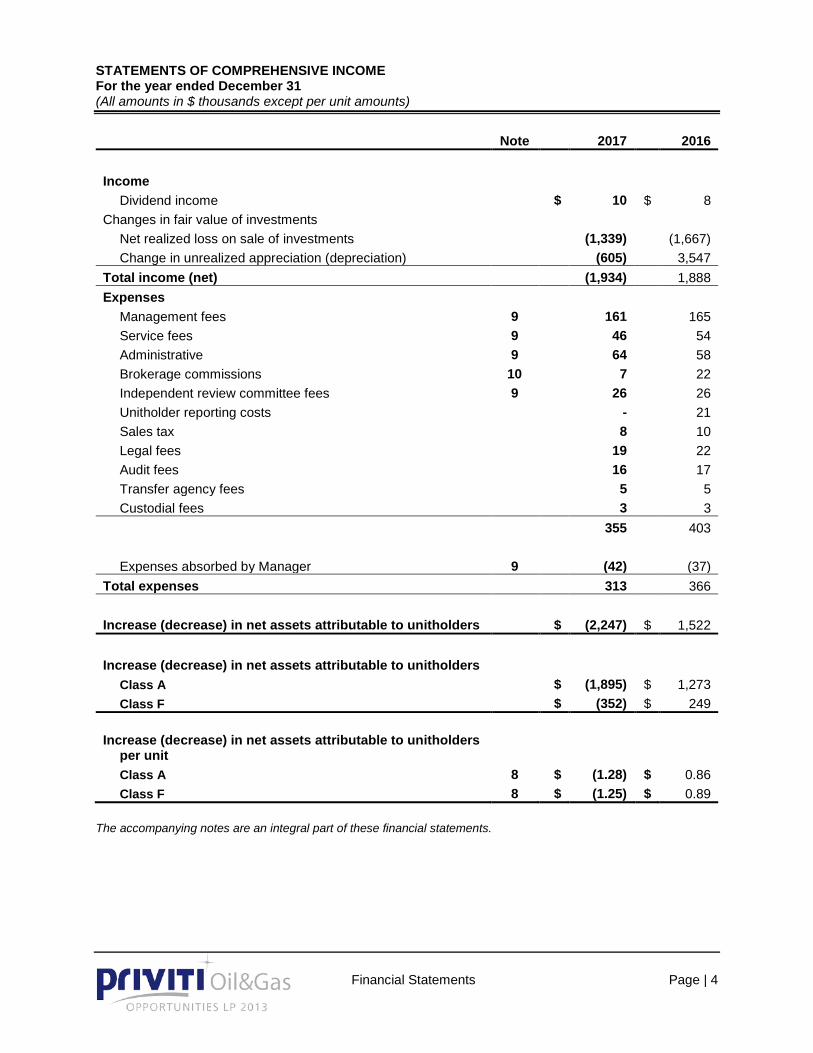
STATEMENTS OF COMPREHENSIVE INCOME For the year ended December 31 (All amounts in $ thousands except per unit amounts)
Financial Statements Page | 4
STATEMENTS OF COMPREHENSIVE INCOME Note 2017 2016 Income
Dividend income $ 10 $ 8 Changes in fair value of investments
Net realized loss on sale of investments (1,339) (1,667) Change in unrealized appreciation (depreciation) (605) 3,547
Total income (net) (1,934) 1,888 Expenses
Management fees 9 161 165 Service fees 9 46 54 Administrative 9 64 58 Brokerage commissions 10 7 22 Independent review committee fees 9 26 26 Unitholder reporting costs - 21 Sales tax 8 10 Legal fees 19 22 Audit fees 16 17 Transfer agency fees 5 5 Custodial fees 3 3 355 403 Expenses absorbed by Manager 9 (42) (37)
Total expenses 313 366
Increase (decrease) in net assets attributable to unitholders $ (2,247) $ 1,522
Increase (decrease) in net assets attributable to unitholders Class A $ (1,895) $ 1,273 Class F $ (352) $ 249
Increase (decrease) in net assets attributable to unitholders per unit Class A 8 $ (1.28) $ 0.86 Class F 8 $ (1.25) $ 0.89
The accompanying notes are an integral part of these financial statements.
STATEMENTS OF CHANGES IN NET ASSETS For the year ended December 31 (All amounts in $ thousands)
Financial Statements Page | 5
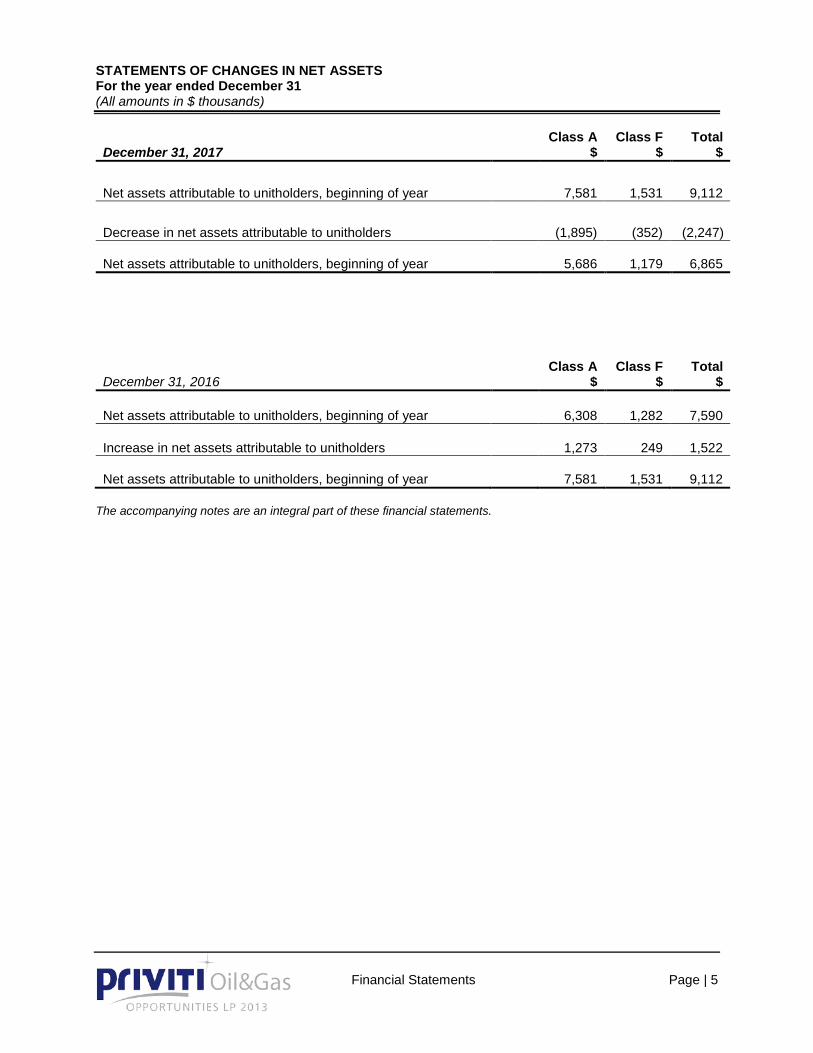
STATEMENTS OF CHANGES IN NET ASSETS
December 31, 2017 Class A
$ Class F
$ Total
$ Net assets attributable to unitholders, beginning of year 7,581 1,531 9,112 Decrease in net assets attributable to unitholders (1,895) (352) (2,247) Net assets attributable to unitholders, beginning of year 5,686 1,179 6,865
December 31, 2016 Class A
$ Class F
$ Total
$ Net assets attributable to unitholders, beginning of year 6,308 1,282 7,590 Increase in net assets attributable to unitholders 1,273 249 1,522 Net assets attributable to unitholders, beginning of year 7,581 1,531 9,112
The accompanying notes are an integral part of these financial statements.
STATEMENTS OF CASH FLOWS For the year ended December 31 (All amounts in $ thousands)
Financial Statements Page | 6
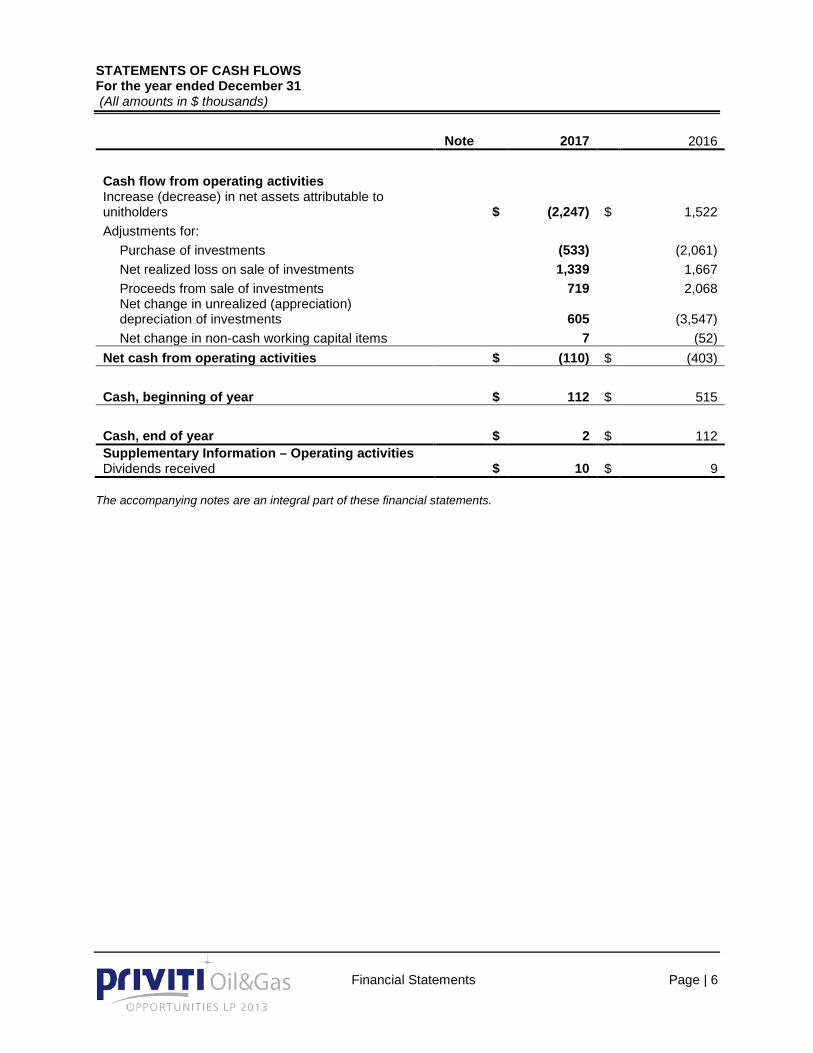
STATEMENTS OF CASH FLOWS Note 2017 2016 Cash flow from operating activities Increase (decrease) in net assets attributable to unitholders $ (2,247) $ 1,522 Adjustments for:
Purchase of investments (533) (2,061) Net realized loss on sale of investments 1,339 1,667 Proceeds from sale of investments 719 2,068 Net change in unrealized (appreciation) depreciation of investments
605 (3,547)
Net change in non-cash working capital items 7 (52) Net cash from operating activities $ (110) $ (403) Cash, beginning of year $ 112 $ 515 Cash, end of year $ 2 $ 112 Supplementary Information – Operating activities Dividends received $ 10 $ 9
The accompanying notes are an integral part of these financial statements.
SCHEDULE OF INVESTMENT PORTFOLIO As at December 31, 2017
Financial Statements Page | 7
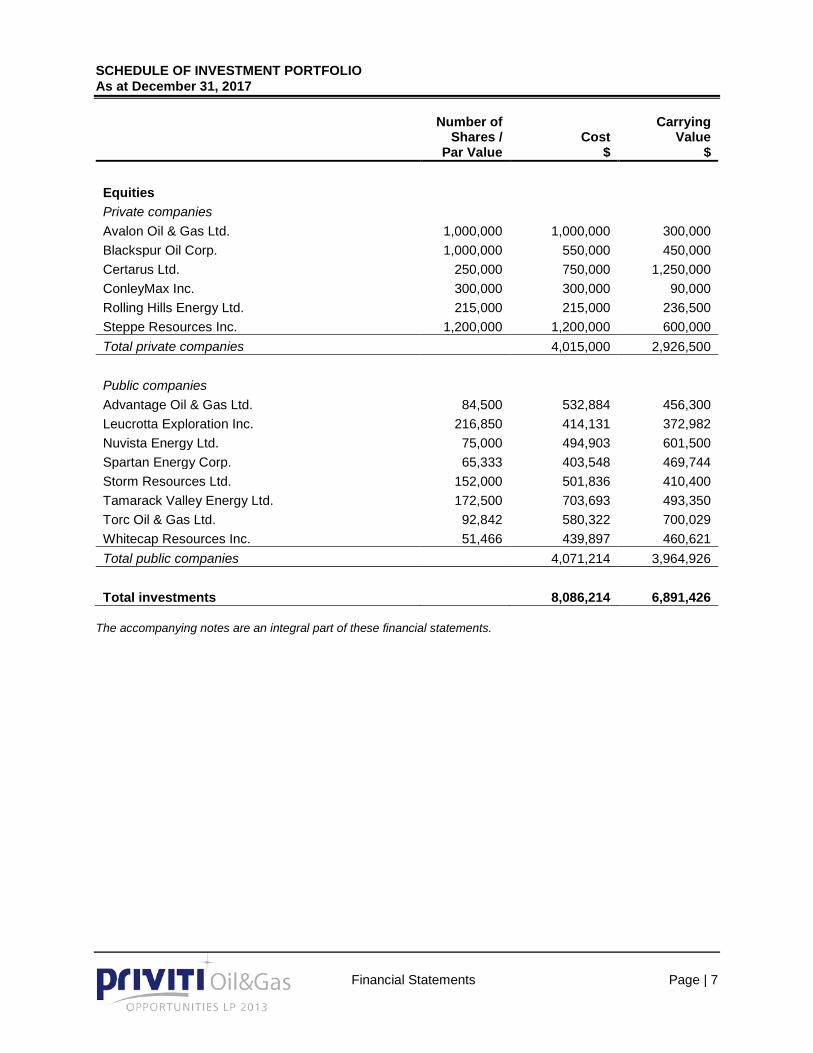
SCHEDULE OF INVESTMENT PORTFOLIO
Number of Shares /
Par Value Cost
$
Carrying Value
$ Equities Private companies Avalon Oil & Gas Ltd. 1,000,000 1,000,000 300,000 Blackspur Oil Corp. 1,000,000 550,000 450,000 Certarus Ltd. 250,000 750,000 1,250,000 ConleyMax Inc. 300,000 300,000 90,000 Rolling Hills Energy Ltd. 215,000 215,000 236,500 Steppe Resources Inc. 1,200,000 1,200,000 600,000 Total private companies 4,015,000 2,926,500 Public companies Advantage Oil & Gas Ltd. 84,500 532,884 456,300 Leucrotta Exploration Inc. 216,850 414,131 372,982 Nuvista Energy Ltd. 75,000 494,903 601,500 Spartan Energy Corp. 65,333 403,548 469,744 Storm Resources Ltd. 152,000 501,836 410,400 Tamarack Valley Energy Ltd. 172,500 703,693 493,350 Torc Oil & Gas Ltd. 92,842 580,322 700,029 Whitecap Resources Inc. 51,466 439,897 460,621 Total public companies 4,071,214 3,964,926 Total investments 8,086,214 6,891,426
The accompanying notes are an integral part of these financial statements.
NOTES TO THE FINANCIAL STATEMENTS For the year ended December 31, 2017 (All amounts in $ thousands unless otherwise stated)
Financial Statements Page | 8
NOTES TO TH E FIN ANC IAL ST ATEM ENTS
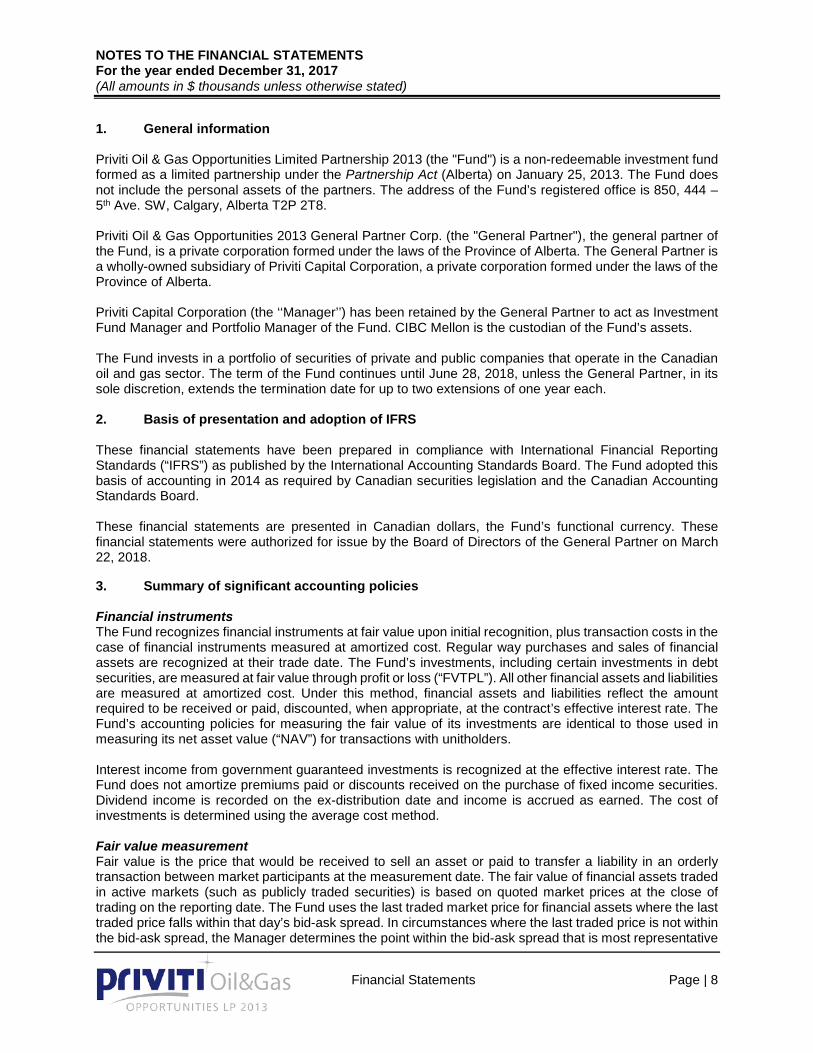
1. General information Priviti Oil & Gas Opportunities Limited Partnership 2013 (the "Fund") is a non-redeemable investment fund formed as a limited partnership under the Partnership Act (Alberta) on January 25, 2013. The Fund does not include the personal assets of the partners. The address of the Fund’s registered office is 850, 444 – 5th Ave. SW, Calgary, Alberta T2P 2T8. Priviti Oil & Gas Opportunities 2013 General Partner Corp. (the "General Partner"), the general partner of the Fund, is a private corporation formed under the laws of the Province of Alberta. The General Partner is a wholly-owned subsidiary of Priviti Capital Corporation, a private corporation formed under the laws of the Province of Alberta. Priviti Capital Corporation (the ‘‘Manager’’) has been retained by the General Partner to act as Investment Fund Manager and Portfolio Manager of the Fund. CIBC Mellon is the custodian of the Fund’s assets. The Fund invests in a portfolio of securities of private and public companies that operate in the Canadian oil and gas sector. The term of the Fund continues until June 28, 2018, unless the General Partner, in its sole discretion, extends the termination date for up to two extensions of one year each. 2. Basis of presentation and adoption of IFRS These financial statements have been prepared in compliance with International Financial Reporting Standards (“IFRS”) as published by the International Accounting Standards Board. The Fund adopted this basis of accounting in 2014 as required by Canadian securities legislation and the Canadian Accounting Standards Board. These financial statements are presented in Canadian dollars, the Fund’s functional currency. These financial statements were authorized for issue by the Board of Directors of the General Partner on March 22, 2018.
3. Summary of significant accounting policies Financial instruments The Fund recognizes financial instruments at fair value upon initial recognition, plus transaction costs in the case of financial instruments measured at amortized cost. Regular way purchases and sales of financial assets are recognized at their trade date. The Fund’s investments, including certain investments in debt securities, are measured at fair value through profit or loss (“FVTPL”). All other financial assets and liabilities are measured at amortized cost. Under this method, financial assets and liabilities reflect the amount required to be received or paid, discounted, when appropriate, at the contract’s effective interest rate. The Fund’s accounting policies for measuring the fair value of its investments are identical to those used in measuring its net asset value (“NAV”) for transactions with unitholders. Interest income from government guaranteed investments is recognized at the effective interest rate. The Fund does not amortize premiums paid or discounts received on the purchase of fixed income securities. Dividend income is recorded on the ex-distribution date and income is accrued as earned. The cost of investments is determined using the average cost method. Fair value measurement Fair value is the price that would be received to sell an asset or paid to transfer a liability in an orderly transaction between market participants at the measurement date. The fair value of financial assets traded in active markets (such as publicly traded securities) is based on quoted market prices at the close of trading on the reporting date. The Fund uses the last traded market price for financial assets where the last traded price falls within that day’s bid-ask spread. In circumstances where the last traded price is not within the bid-ask spread, the Manager determines the point within the bid-ask spread that is most representative
NOTES TO THE FINANCIAL STATEMENTS For the year ended December 31, 2017 (All amounts in $ thousands unless otherwise stated)
Financial Statements Page | 9
of fair value based on the specific facts and circumstances. The Fund’s policy is to recognize transfers into and out of the fair value hierarchy levels as of the date of the event or change in circumstances giving rise to the transfer. The fair value of financial assets and liabilities not traded in an active market is determined using valuation techniques. The Manager uses a variety of methods and makes assumptions that are based on market conditions existing at each reporting date. Valuation techniques include the use of comparable recent arm’s length transactions, reference to other instruments that are substantially the same and others commonly used by market participants and which make the maximum use of observable inputs. Given the focus of the Fund’s investment strategy on the Canadian energy sector, the NAV valuation technique is the primary technique utilized for valuing private equity securities when an arm’s length transaction is not available. This technique, commonly used in the oil and gas industry, derives fair value for a security based on a build-up of the current fair value of a company’s assets and liabilities. The Manager, however, may utilize other valuation techniques if, in the Manager’s opinion, the NAV valuation technique is not the most appropriate technique given the particular security under the circumstances. Refer to Note 6 for further information about the Fund’s fair value measurements. Impairment of financial assets At each reporting date, the Fund assesses whether there is objective evidence that a financial asset at amortized cost is impaired. If such evidence exists, the Fund recognizes an impairment loss as the difference between the amortized cost of the financial asset and the present value of the estimated future cash flows, discounted using the instrument’s original effective interest rate. Impairment losses on financial assets at amortized cost are reversed in subsequent periods if the amount of the loss decreases and the decrease can be related objectively to an event occurring after the impairment was recognized. Cash Cash is comprised of deposits with financial institutions with original terms to maturity of 3 months or less. Increase (decrease) in net assets attributable to unitholders per unit The increase (decrease) in net assets attributable to unitholders per unit is calculated by dividing the increase (decrease) in net assets attributable to unitholders by the weighted average units outstanding during the period. As the number of units has not changed during the period, the weighted average units outstanding is equal to the total of 1,484,369 and 280,150 units outstanding for Class A and F respectively. Taxation For each unit held at the end of a fiscal year, unitholders will be allocated 99.99% of the income (or loss) of the Fund for the fiscal year (before deduction of management fees and the performance fees, if any, and the amount of the Fund 's deductions under paragraph 20(1)(e) of the Income Tax Act (Canada) (the “Variable Expense”)) divided by the number of units then outstanding less, in the case of Class A units, the total of the Variable Expense attributable to the Class A units divided by the number of Class A units, and, in the case of the Class F units, the total of the Variable Expense attributable to the Class F units divided by the number of Class F units. The Variable Expense relates to the terms of the Agency Agreement, under which, for every unit placed, an agent is entitled to $0.575 per Class A Unit (5.75%) and $0.225 per Class F Unit (2.25%), which will be paid by the Partnership from the proceeds of the Offering. At the end of each fiscal year of the Fund, the General Partner will be allocated 0.01% of the income (or loss) of the Fund for each fiscal year of the Fund. The Fund is not itself a taxable entity; the liability for income taxes is that of the Partners and not the Partnership. Accordingly, no provision for income tax is required in these financial statements. Sales tax The Fund is not eligible to claim input tax credits for goods and services tax (“GST”), harmonized sales tax (“HST”) or any provincial sales tax (“PST”) paid.
NOTES TO THE FINANCIAL STATEMENTS For the year ended December 31, 2017 (All amounts in $ thousands unless otherwise stated)
Financial Statements Page | 10
Accounting standards issued but not yet adopted The Fund has not applied the following new IFRS that have been issued but are not yet effective: IFRS 9 - Financial Instruments, was originally issued November 12, 2009 to replace IAS 39 Financial Instruments: Recognition and Measurement. IFRS 9 uses a single approach to determine whether a financial asset is measured at amortized cost or fair value, and replaces the multiple rules in IAS 39. The approach in IFRS 9 focuses on how an entity manages its financial instruments in the context of its business model, as well as the contractual cash flow characteristics of the financial assets. In addition, it provides new guidance on hedge accounting, which aligns accounting more closely with risk management. The new standard also requires a single impairment method to be used, replacing the multiple impairment methods currently provided in IAS 39. IFRS 9 is effective for annual periods beginning on or after January 1, 2018. The Fund continues to monitor and evaluate the impact of IFRS 9 on its financial statements and does not anticipate material adjustments. IFRS 15 – Revenue from Contracts with Customers was issued in May 2014 to replace IAS 11 Construction Contracts and IAS 18 Revenue and related interpretative guidance. IFRS 15 provides a single, principles based five step model to be applied to all contracts with customers as well as new disclosure requirements with the objective of a more structured approach, improving comparability across entities and industries. Under IFRS 15 an entity will recognize revenue at the amount to which it expects to be entitled in exchange for goods or services on their transfer. IFRS 15 is effective for annual periods beginning on or after January 1, 2018 and is to be applied retrospectively. The Fund continues to monitor and evaluate the impact of IFRS 15 on its financial statements and does not anticipate material adjustments. IFRS 16 - Leases was issued in January 2016. It will result in almost all leases being recognized on the balance sheet, as the distinction between operating and finance lease is removed under the new standard - an asset (the right to use the leased item) and a financial liability to pay rentals are recognized. The only exception are short-term and low-value leases. The standard is effective for annual periods beginning on, or after January 1, 2019. The Fund continues to monitor and evaluate the impact of IFRS 16 on its financial statements and does not anticipate material adjustments. 4. Critical accounting estimates and judgments The preparation of financial statements requires management to use judgment in applying its accounting policies and to make estimates and assumptions about the future. The following discusses the most significant accounting judgments and estimates that the Fund has made in preparing the financial statements. Fair value measurement of securities not quoted in an active market The Fund holds financial instruments that are not quoted in an active market. Fair values of such instruments are determined using valuation techniques and may be determined using reputable pricing sources (such as pricing agencies) or indicative prices from market makers. Broker quotes as obtained from pricing sources may be indicative and not executable or binding. Where no market data is available, the Fund may value positions using its own models which are usually based on valuation methods and techniques generally recognized as standard within the industry. The models used to determine fair values are validated and periodically reviewed by experienced personnel of the Manager, independent of the party that created them. The models used for private equity securities are based mainly on the NAV valuation technique adjusted for minority and liquidity discounts as appropriate. Models use observable data, to the extent practicable. However, areas such as liquidity discounts, commodity prices, estimated reserves, etc., require the Manager to make estimates. Changes in assumptions about these factors could affect the reported fair values of financial instruments. The Fund considers observable data to be market data that is readily available, regularly distributed and updated, reliable and verifiable, not proprietary, and provided by independent sources that are actively involved in the relevant market. Refer to Note 6 for further information about the fair value measurement of the Fund’s
NOTES TO THE FINANCIAL STATEMENTS For the year ended December 31, 2017 (All amounts in $ thousands unless otherwise stated)
Financial Statements Page | 11
financial instruments. Classification of non-redeemable units issued by the Fund Under IFRS, IAS 32, Financial Instruments: Presentation, requires that units of an entity which include a contractual obligation for the issuer to redeem them for cash or another financial asset on liquidation of the fund to be classified as a financial liability. The Fund has liability features including the Fund’s fixed life and non-identical contractual obligation to deliver a pro-rata share of its net assets on liquidation. As such, in accordance with the standard, the units have been classified as a financial liability. The units are carried at the value calculated as the residual of the assets and non-unit related liabilities. Classification and measurement of investments and application of the fair value option In classifying and measuring financial instruments held by the Fund, the Manager is required to make significant judgments about whether or not the business of the Fund is to invest on a total return basis for the purpose of applying the fair value option for financial assets under IAS 39. The most significant judgments made include the determination that certain investments are held-for-trading (e.g. including derivatives, and investments that are acquired with an intention to resell within a period of three days or less), and that the fair value option can be applied to those which are not. Investment entity The most significant judgment that the Fund has made in determining that it meets the definition of an ‘investment entity’ is that the objectives and business purposes are to generate investment income, and that fair value is the primary measurement attribute to measure and evaluate the performance of substantially all of its investments.
5. Risk management The Portfolio Manager of the Fund follows a disciplined, fundamental approach in its investment selection and Management style, which consists of a rigorous and ongoing process of evaluating investment opportunities in natural resource companies. The Portfolio Manager purchases and holds securities for the medium to long-term. The Fund’s investment activities expose it to a variety of financial risks. Significant risks relevant to the Fund are described below. Market risk Market risk is the risk that the fair value or future cash flows of a financial instrument will fluctuate because of changes in market prices. Market risk is comprised of interest rate risk, foreign currency risk and other price risk. Portfolio investments held by the Fund are subject to normal market fluctuations and the risks inherent in investments in the Canadian energy sector. The Fund invests with a medium to long-term outlook while focusing on quality businesses that consistently deliver strong returns for unitholders. As a significant number of the Fund’s investments are made in private entities, additional market price risk exists as there is no actively traded market that enables the private investments to be valued on a daily basis as exists for publicly traded entities. Therefore, future cash flows may be impacted by the differences between the fair values determined for those entities and the value at which they are ultimately disposed. Private companies are valued in accordance with the accounting policy as described in Note 3. Interest rate risk Interest rate risk is the risk that the fair value or future cash flows of a financial instrument will fluctuate because of changes in market interest rates. At December 31, 2017 and December 31, 2016 all of the Fund’s assets and liabilities are non-interest bearing, therefore the Fund is not directly exposed to significant interest rate risk. The Fund is also exposed to risks related to the effects of fluctuations in the prevailing levels of market interest rates on the value of its investments which may impact the cash amount realized upon disposition.
NOTES TO THE FINANCIAL STATEMENTS For the year ended December 31, 2017 (All amounts in $ thousands unless otherwise stated)
Financial Statements Page | 12
Foreign currency risk All of the Fund’s assets and liabilities are denominated in Canadian dollars, therefore its direct exposure to foreign currency risk is minimal. Other price risk Other price risk is the risk that the fair value of future cash flows of financial instruments will fluctuate as a result of changes in market prices (other than those arising from interest rate risk or foreign currency risk) whether those changes are caused by factors specific to the individual financial instrument, its issuer or factors affecting all similar financial instruments in the market or a market segment. Exposure to other price risk is mainly in equities. As at December 31, 2017, approximately 100% (2016 - 99%) of the Fund’s net assets were exposed to other price risk. If prices of these investments had decreased or increased by 5%, with all other variables being held constant, net assets of the Fund would have decreased or increased respectively by approximately $345 (2016 - $451). In practice, actual results will differ from this sensitivity analysis and the difference could be material. Liquidity risk Liquidity risk is the risk that the Fund will encounter difficulties in meeting its financial obligations. A significant portion of the Fund’s assets are investments in private companies, and consequently there is no market to readily liquidate these investments. The Fund’s Limited Partners cannot redeem their positions in the Fund, which thereby reduces the need for highly liquid assets. The Fund’s objective is to have sufficient liquidity to meet its liabilities when they come due. The Fund monitors its cash balances and cash flows generated from operations to meet its requirements. All of the Fund’s obligations at December 31, 2017, are due within one year from that date. Sufficient cash balances are maintained to cover daily operating expenses, or are provided by the General Partner, to the extent that the timing of cash inflows are not aligned with immediate cash requirements. As at December 31, 2017, the Fund’s contractual liabilities of $29 exceed its liquid assets of $3. However, the Fund has public investments with a carrying value of $3,965 that can be easily liquidated to settle the contractual liabilities if required. As at December 31, 2016, the Fund’s liquid assets of $112 exceeds its contractual liabilities of $23. As at December 31, 2017 Financial liabilities On demand Less than 3 months Total Accounts payable and accrued liabilities $ - $ 29 $ 29
As at December 31, 2016 Financial liabilities On demand Less than 3 months Total Accounts payable and accrued liabilities $ - $ 23 $ 23
NOTES TO THE FINANCIAL STATEMENTS For the year ended December 31, 2017 (All amounts in $ thousands unless otherwise stated)
Financial Statements Page | 13
Credit risk Credit risk is the risk that the counterparty to a financial asset will default, resulting in a financial loss. All of the Fund’s cash and cash equivalents are held by its custodian or in deposits with a Canadian chartered bank. All transactions in listed securities are settled upon delivery, using reputable brokers. Securities sold are delivered once payment has been received by the broker and securities purchased are paid for once the securities have been received by the broker, therefore the risk of default is considered minimal. Trades will fail if either party fails to meet its obligation. Concentration risk Concentration risk is the risk that the Fund is over-weighted in any one investment type, geographical location or business line or industry. Since the Fund invests primarily in securities issued by businesses engaged in the oil and gas business, in Canada, the net asset value may be more volatile than portfolios with a more diversified investment focus. Also, the net asset value may fluctuate with underlying market prices for commodities produced by those sectors of the economy. 6. Fair value measurement The Fund classifies fair value measurements within a hierarchy which gives the highest priority to unadjusted quoted prices in active markets for identical assets or liabilities (Level 1) and the lowest priority to unobservable inputs (Level 3). The three levels of the fair value hierarchy are:
Level 1 Quoted prices (unadjusted) in active markets for identical assets or liabilities that the entity can access at the measurement date;
Level 2 Inputs other than quoted prices included within Level 1 that are observable for the
asset or liability, either directly or indirectly; and Level 3 Inputs are unobservable for the asset or liability
If inputs of different levels are used to measure an asset’s or liability’s fair value, the classification within the hierarchy is based on the lowest level input that is significant to the fair value measurement. The following table illustrates the classification of the Fund’s assets and liabilities measured at fair value within the fair value hierarchy as at December 31, 2017, and December 31, 2016: As at December 31, 2017 Level 1 Level 2 Level 3 Total Equities $ 3,965 $ - $ 2,926 $ 6,891
As at December 31, 2016 Level 1 Level 2 Level 3 Total Equities $ 5,915 $ - $ 3,107 $ 9,022
All fair value measurements are recurring. The carrying values of cash, dividends receivable, and accrued liabilities approximate their fair values due to their short-term nature. Fair values are classified as Level 1 when the related security is actively traded and a quoted price is available. If an instrument classified as Level 1 subsequently ceases to be actively traded, it is transferred out of Level 1. In such cases, instruments are reclassified into Level 2, unless the measurement of its fair value requires the use of significant unobservable inputs, in which case it is classified as Level 3. The Manager is responsible for performing the fair value measurements included in the financial statements of the Fund, including Level 3 measurements. The Manager obtains pricing, where available, from a third party pricing vendor, which is monitored and reviewed by Management on each valuation date. At each financial reporting date, all Level 3 fair value measurements are reviewed and approved by two senior officers of the Manager. The Manager also has a valuation committee which includes senior officers of the
NOTES TO THE FINANCIAL STATEMENTS For the year ended December 31, 2017 (All amounts in $ thousands unless otherwise stated)
Financial Statements Page | 14
Manager, as well as members of the portfolio management and compliance teams. The committee meets quarterly to perform detailed reviews of the valuation of investments held by the Fund. All Level 3 valuation results are discussed with the Audit Committee during its quarterly review. Equities The Fund’s equity positions are classified as Level 1 when the security is actively traded and a reliable price is observable. Certain of the Fund’s equities do not trade frequently and therefore observable prices may not be available. In such cases, fair value is determined using observable market data (e.g. transactions for similar securities of the same issuer) and the fair value is classified as Level 2, unless the determination of fair value requires significant unobservable data, in which case the measurement is classified as Level 3. For the portfolio investments BlackSpur Oil Corp., Certarus Ltd. and Rolling Hills Energy Ltd. the fair value is based upon grey market trades or company financings that have recently occurred. No other unobservable inputs were obtained that would change the estimated fair value. As of December 31, 2016, these investments represented approximately 28% (2016 - 23%) of the Fund’s net assets. If the prices of these investments had increased or decreased by 10%, with all other variables being held constant, net assets attributable to unitholders would have increased or decreased respectively by approximately $194 (2016 – $209). For the portfolio investments Avalon Oil & Gas Ltd., ConleyMax Inc. and Steppe Resources Inc. the fair value is based upon valuation techniques that are commonly used by market participants and are appropriate for each particular investment based on the nature, facts and circumstances of the investment. Standard valuation techniques such as NAV valuation technique, capitalized earnings and relative valuation based on recent market data, to the extent possible are used to estimate fair value. As of December 31, 2016, these investments represented approximately 14% (2016 – 11%) of the Fund’s net assets. Each internally developed model is based on inputs that were obtained as close to the reporting date as possible. Based on the unique characteristics of each company, the Manager selects a key metric or multiple, such as estimated fair value of oil and gas reserves, to be used in NAV or capitalized earnings approaches. The valuation for each company is discounted for considerations such as liquidity and lack of control. The following table shows the sensitivities of the fair value calculated to a change in the unobservable metrics such as the key metric used to calculate the NAV, capitalized earnings and relative valuation, or any additional discounts that may have been applied to account for lack of control or illiquidity. A relative +/- 10% change has been applied on the key metrics and an absolute change of +/- 5% has been applied for specific company discounts.
There were no transfers of financial assets between Level 1 and 2 or between Level 2 and 3 during the year.
Change in valuation +/-
Unobservable inputs Reasonable possible shift +/- 2016
2017
Key metrics 10% $76/ ($76) $83/ ($83) Non-controlling interest / liquidity discount 5% ($45)/$45 ($35)/$35
NOTES TO THE FINANCIAL STATEMENTS For the year ended December 31, 2017 (All amounts in $ thousands unless otherwise stated)
Financial Statements Page | 15
The following table provides a reconciliation of fair value measurements using Level 3 inputs from December 31, 2016 to December 31, 2017, and December 31, 2015 to December 31, 2016:
December 31, 2017 December 31, 2016 Balance, beginning of period $ 3,107 $ 3,702 Transfer out to Level 1 - (1,000) Unrealized gains (losses) (181) 405 Balance, end of period $ 2,926 $ 3,107
7. Financial instruments by category The following table presents the carrying amounts of the Fund’s financial assets by category as at December 31, 2017. All of the Fund’s financial liabilities as at December 31, 2017, were carried at amortized cost.
Financial assets at FVTPL designated
at inception Financial assets at
amortized cost Total Investments $ 6,891 $ - $ 6,891 Cash - 2 2 Dividends receivable - 1 1 Total $ 6,891 $ 3 $ 6,894
The following table presents the carrying amounts of the Fund’s financial assets by category as at December 31, 2016. All of the Fund’s financial liabilities as at December 31, 2016, were carried at amortized cost.
Financial assets at FVTPL designated
at inception Financial assets at
amortized cost Total Investments $ 9,022 $ - $ 9,022 Cash - 112 112 Dividends receivable - 1 1 Total $ 9,022 $ 113 $ 9,135
8. Units The interests of unitholders in the Fund are divided into two classes of units, Class A units and Class F units. Each unit represents an undivided interest in the Fund. Each unit of a class entitles the unitholder to the same rights and obligations as a unitholder of such class and no unitholder of a class is entitled to any privilege, priority or preference in relation to any other unitholder of such class. Each unit entitles the unitholder to one vote at all meetings of all unitholders. Each unitholder of a class is entitled to participate equally with respect to any and all distributions to the class made by the Fund. On termination or liquidation of the Fund, the unitholders of record of a class are entitled to receive on a pro-rata basis all of the assets of the Fund allocated to that class remaining after payment of all debts, liabilities and liquidation expenses of the Fund allocated to that class. The Class F units are designed for fee-based accounts, which are a type of account that certain Unitholders have set up with their investment advisor and for which such unitholders pay a certain fee for that account.
NOTES TO THE FINANCIAL STATEMENTS For the year ended December 31, 2017 (All amounts in $ thousands unless otherwise stated)
Financial Statements Page | 16
Class F units differ from the Class A units due to the lower offering costs paid on the issuance of Class F units and no service fee being paid to dealers in respect of the Class F units; this results in a difference between the net asset value of Class A units and the net asset value of Class F units. Net asset value will also reflect the performance fees, if any, allocated to each class of units. Issued units On January 25, 2013, the Fund issued 1,484,369 Class A units and 280,150 Class F units for proceeds (net of agents’ fees and issuance costs) of $13,768 and $2,696, respectively, under its initial public offering. No units have been issued or redeemed since that time. 9. Related party transactions
Management fees and expenses The General Partner has delegated the management of the business affairs of the Fund to the Manager. The Manager is entitled to charge the following: • a management fee of 2.0% annually of the net asset value of the Fund based on the quarter opening net asset value of the Fund calculated on the first business day of each quarter, payable in advance, plus an amount equal to the 0.75% annual service fee payable on Class A units to registered dealers, calculated and paid at the end of each calendar quarter commencing on March 31, 2017; a performance fee equal to 20% of any disposition proceeds after which the unitholders have received back 100% of the available proceeds, net of service fees, plus an 8% simple annual rate of return based on the return of capital contribution to the Limited Partner; and • reimbursement for all ordinary expenses related to the operation of the Fund. The General Partner is a related party to the Fund and retains a 0.01% interest in the Fund. All transactions are in the normal course of operations and are recorded at the exchange amount. The Fund has adopted IAS 24, Related Party Disclosures amendments which provide additional disclosure requirements when key management personnel services are provided by a management entity. The Manager provides key management personnel to the Fund. Pursuant to the terms of a Management Agreement among the Fund, the General Partner, and the Manager, the Manager will provide management, administrative and other services to the Fund on behalf of the General Partner. All fees payable to the Manager in its capacity as Investment Fund Manager are the responsibility of the General Partner and not the Fund. Management fees totaled $161 (2016 - $165) during the period. The Manager is also reimbursed for all expenses incurred on the Fund’s behalf, including legal, audit, transfer agency, custodial, operating and administrative costs, unitholder reporting costs, and costs of financial and other reporting. All transactions are in the normal course of operations and are recorded at the exchange amount. The portion related to reimbursement is reflected in administrative expenses on the statement of comprehensive income; such expenses totaled $64 (2016 - $58) for the period. The Manager, in its discretion, absorbed $42 (2016 - $37) of operating expenses during the period. There is no obligation for the Manager to continue to absorb such expenses, nor is there a guarantee that these expenses will continue to be absorbed in the future. Included in accounts payable and accrued liabilities at December 31, 2017, is $28 (2016 - $23) for the above items.
NOTES TO THE FINANCIAL STATEMENTS For the year ended December 31, 2017 (All amounts in $ thousands unless otherwise stated)
Financial Statements Page | 17
Independent Review Committee The total remuneration paid to members of the Independent Review Committee during the year ended December 31, 2017 was $26 (2016 - $26) and consisted only of fixed fees. 10. Broker commission charges The brokerage commissions paid to dealers included $7 (2016 - $22) that was available for paying to third party vendors. 11. Capital management The Fund’s capital structure consists of its partnership liability. Partnership liability comprises the net assets attributable to unitholders. The Manager has policies and procedures in place to manage the Fund’s capital in accordance with its investment objectives, strategies and restrictions as detailed in the limited partnership agreement. The Fund has no specific capital requirements.

MANAGEMENT REPORT OF FUND PERFORMANCE For the year ended December 31, 2017 March 22, 2018
Management Report of Fund Performance Annual 2017 Page | 1
MANAGEMENT REPORT OF FUND PERFORMANCE FOR THE YEAR ENDED DECEMBER 31, 2017
MANAGEMENT REPORT OF FUND PERFORMANCE For the year ended December 31, 2017 March 22, 2018
Management Report of Fund Performance Annual 2017 Page | 2
This annual management report of fund performance contains financial highlights but does not contain the complete annual financial statements of the investment fund. You can get a copy of the annual financial statements at your request, and at no cost, by calling toll-free 1-855-333-9943, by writing to us at Priviti Capital Corporation, 850 – 444 5th Avenue SW, Calgary, Alberta, T2P 2T8, or by visiting our website at www.priviticapital.com or SEDAR at www.sedar.com. Unitholders may also contact us using one of these methods to request a copy of the investment fund’s proxy voting policies and procedures, proxy voting disclosure record, or quarterly portfolio disclosure. MANAGEMENT DISCUSSION OF FUND PERFORMANCE INVESTMENT OBJECTIVES AND STRATEGIES Priviti Oil & Gas Opportunities 2013 General Partner Corp. is the general partner of Priviti Oil & Gas Opportunities Limited Partnership 2013 (the “Fund”). Priviti Capital Corporation (the “Manager”) is the investment fund manager and the portfolio manager of the Fund. The investment objectives of the Fund are to provide unitholders with the opportunity for capital appreciation and to distribute to unitholders, at the discretion of the Manager, cash proceeds realized on periodic liquidity events. To achieve its investment objectives, the Fund invests in a portfolio of securities of private and public companies that operate in the Canadian oil and gas sector. In the case of private companies, the Manager focuses on companies where there is an opportunity to invest in treasury issuances at the time of start-up, or shortly thereafter, or recapitalizations, and where the relevant companies have indicated an intention to have a liquidity event in five years or less from the time the Fund purchases the company's securities. As the timeline for private companies from start-up to liquidity can be longer, the Fund also invests in public companies that the Manager believes offer the opportunity for near-term capital appreciation and liquidity. With respect to public companies, the Manager targets companies that are considered to be under-valued, securities being issued through a president's list, initial public offerings, or securities that are being issued at a time of re-capitalization of a company. RISK The risks of investing in the Fund remain as outlined in the prospectus dated June 19, 2013, which is available on our website at www.priviticapital.com or SEDAR at www.sedar.com. There were no significant changes to the investment objectives and strategies that affected the Fund’s overall level of risk during the reporting period. The risks of investing in the Fund and the suitability of the Fund for investors remain as discussed in the prospectus. RESULTS OF OPERATIONS The most recent year began with strong crude oil markets, however, things quickly slowed as concerns over OPEC’s compliance with previously announced production cuts and potential United States supply response weighed on oil prices and equity values. Since worldwide storage levels of crude peaked worldwide in early 2017, we have seen a continued decline in inventories around the world. We believe that the fundamentals for crude prices remain strong. The primary source of the draw down in crude stocks around the world has been strong demand, led by accelerating global economies. We expect that demand in 2018 will continue to outpace supply increases around the world. For their part, OPEC compliance with their cuts has remained strong, led by Saudi Arabia. Outside of OPEC, we have seen continued underinvestment in oil projects globally and we don’t expect that to change in the near term. Previously there were significant investments being made into long cycle projects such as offshore drilling and oil sands. For the most part projects that were started before 2014 have now been brought on stream, but we are not seeing a proportionate number of new long cycle projects being sanctioned at this time. A significant amount of capital has been directed to fast cycle projects such as shale production in the United States and most of the worldwide supply
MANAGEMENT REPORT OF FUND PERFORMANCE For the year ended December 31, 2017 March 22, 2018
Management Report of Fund Performance Annual 2017 Page | 3
growth will continue to come from the United States. We don’t believe that the growth in the US can continue unabated, for a number of reasons. Drilling efficiencies have begun to plateau and even decline in some areas as operators had previously focused on drilling their best assets. There are other challenges for US growth including service equipment availability and staffing challenges. We have also seen a shift in producer sentiment of how they are deploying capital. Many producers are choosing to shift cash flow to share buybacks and dividend increases, rather than increasing their production base. In Canada, we see strong opportunity in oil producers who are starting to see free cash flow come back after a few challenging years. Current oil prices deliver significant optionality for producers to deliver returns to shareholders either through share buybacks, dividend growth, asset acquisitions or organic growth. While we believe that the oil markets are fundamentally solid, we exercise caution with natural gas. In the US, there has been significant growth in natural gas production. Current forecasts for natural gas production in the US in 2018 will be up almost 9% year over year. Domestic demand in the US has been mixed recently as power burn has trended below prior year numbers, while other key demand factors (residential, commercial and industrial) have remained relatively flat. Where the US has shown growth is through increased exports to Mexico and Liquefied Natural Gas (“LNG”) projects exporting natural gas to other continents. In Canada, we are experiencing our own record natural gas production without incremental demand to absorb the increases. Further, pipeline bottlenecks have created challenges for producers to get their product to market. The result has been a significant decrease in the price received for domestic natural gas relative to the US. We believe this is a supply issue that will need to be dealt with, similar to how the oil market has had to rebalance over the past few years. We are optimistic that there is an opportunity for LNG projects to go ahead in Canada, which will increase demand and get natural gas out of the country. However, at this point we believe any operational LNG projects in Canada are at least four to five years way. We believe there are select opportunities for investment in Canadian natural gas producers, however, the requirement for asset quality, cost structure, take-away capacity and balance sheet strength is more important than ever. Portfolio As of December 31, 2017, the portfolio consisted of 42.45% private companies, 57.50% public companies, and 0.05% in cash and cash equivalents. Financial Performance Total loss during the year was $1,933,689, the majority coming from realized loss of $1,339,210 and from unrealized portfolio loss of $604,830. Management fees charged to the Fund were $160,695 accounting for approximately 51.46% of the total expenses of $312,289. Commissions on portfolio transactions were $6,859. The remaining expenses relate to costs incurred for ongoing maintenance of the Fund, including service fees, audit and legal fees, transfer fees, administrative expenses, custody fees, and independent review committee fees. As a result, the Fund had a decrease in net assets from operations of $2,245,978. As at December 31, 2017, the Fund’s net assets totaled $6,865,479. RECENT DEVELOPMENTS Accounting standards issued but not yet adopted The Fund has not applied the following new IFRS that have been issued but are not yet effective: IFRS 9 - Financial Instruments, was originally issued November 12, 2009 to replace IAS 39 Financial Instruments: Recognition and Measurement. IFRS 9 uses a single approach to determine whether a financial asset is measured at amortized cost or fair value, and replaces the multiple rules in IAS 39. The approach in IFRS 9 focuses on how an entity manages its financial instruments in the context of its business model, as well as the contractual cash flow characteristics of the financial assets. In addition, it provides new guidance on hedge accounting, which aligns accounting more closely with risk management. The new standard also requires a single impairment method to be used, replacing the multiple impairment methods currently provided in IAS 39. IFRS 9 is effective for annual periods beginning on or after January 1, 2018. The Fund continues to monitor and evaluate the impact of IFRS 9 on its financial statements and does not anticipate
MANAGEMENT REPORT OF FUND PERFORMANCE For the year ended December 31, 2017 March 22, 2018
Management Report of Fund Performance Annual 2017 Page | 4
material adjustments. IFRS 15 – Revenue from Contracts with Customers was issued in May 2014 to replace IAS 11 Construction Contracts and IAS 18 Revenue and related interpretative guidance. IFRS 15 provides a single, principles based five step model to be applied to all contracts with customers as well as new disclosure requirements with the objective of a more structured approach, improving comparability across entities and industries. Under IFRS 15 an entity will recognize revenue at the amount to which it expects to be entitled in exchange for goods or services on their transfer. IFRS 15 is effective for annual periods beginning on or after January 1, 2018 and is to be applied retrospectively. The Fund continues to monitor and evaluate the impact of IFRS 15 on its financial statements and does not anticipate material adjustments. IFRS 16 - Leases was issued in January 2016. It will result in almost all leases being recognized on the balance sheet, as the distinction between operating and finance lease is removed under the new standard - an asset (the right to use the leased item) and a financial liability to pay rentals are recognized. The only exception are short-term and low-value leases. The standard is effective for annual periods beginning on, or after January 1, 2019. The Fund continues to monitor and evaluate the impact of IFRS 16 on its financial statements and does not anticipate material adjustments. RELATED PARTY TRANSACTIONS Management and Service Fees Pursuant to a management agreement, the Manager provides management and administrative services for which it charges management fees equal to 2.0% annually of the net asset value of the Fund based on the quarter opening net asset value of the Fund calculated on the first business day of each quarter, payable in advance, plus an amount equal to the service fee. The Manager will pay to each registered dealer an annual service fee equal to 0.75% of the net asset value per Class A unit for the Class A units held by clients of such registered dealer at the end of the relevant quarter. A service fee will not be payable on the Class F units. The Manager is also reimbursed for all expenses incurred on the Fund’s behalf, including legal, audit, transfer agency, custodial, operating and administrative costs, unitholder reporting costs, and costs of financial and other reporting. All transactions are in the normal course of operations and are recorded at the exchange amount. All fees payable to the Manager in its capacity as investment fund manager are the responsibility of the General Partner and not the Fund. Independent Review Committee An independent review committee (the “IRC”) has been established by the Fund in accordance with National Instrument 81-107 Independent Review Committee for Investment Funds (“NI 81-107”) and is comprised of three members, each of whom is independent. The IRC deals with conflict of interest matters presented to it by the Manager in accordance with NI 81-107. The Manager is required under NI 81-107 to identify conflicts of interest inherent in its management of the Fund and request input from the IRC on how it manages those conflicts of interest. NI 81-107 also requires the Manager to establish written policies and procedures outlining its management of those conflicts of interest. The IRC provides its recommendations or approvals, as required, to the Manager with a view to the best interests of the Fund. The Manager received standing instructions from the IRC with respect to: the valuation of securities held in the Fund’s portfolio; the allocation of expenses from the Manager; proxy voting and procedures; and net asset value error correction procedures. The Manager has relied on these standing instructions during the period. IRC fees and expenses were $26,082.
MANAGEMENT REPORT OF FUND PERFORMANCE For the year ended December 31, 2017 March 22, 2018
Management Report of Fund Performance Annual 2017 Page | 5
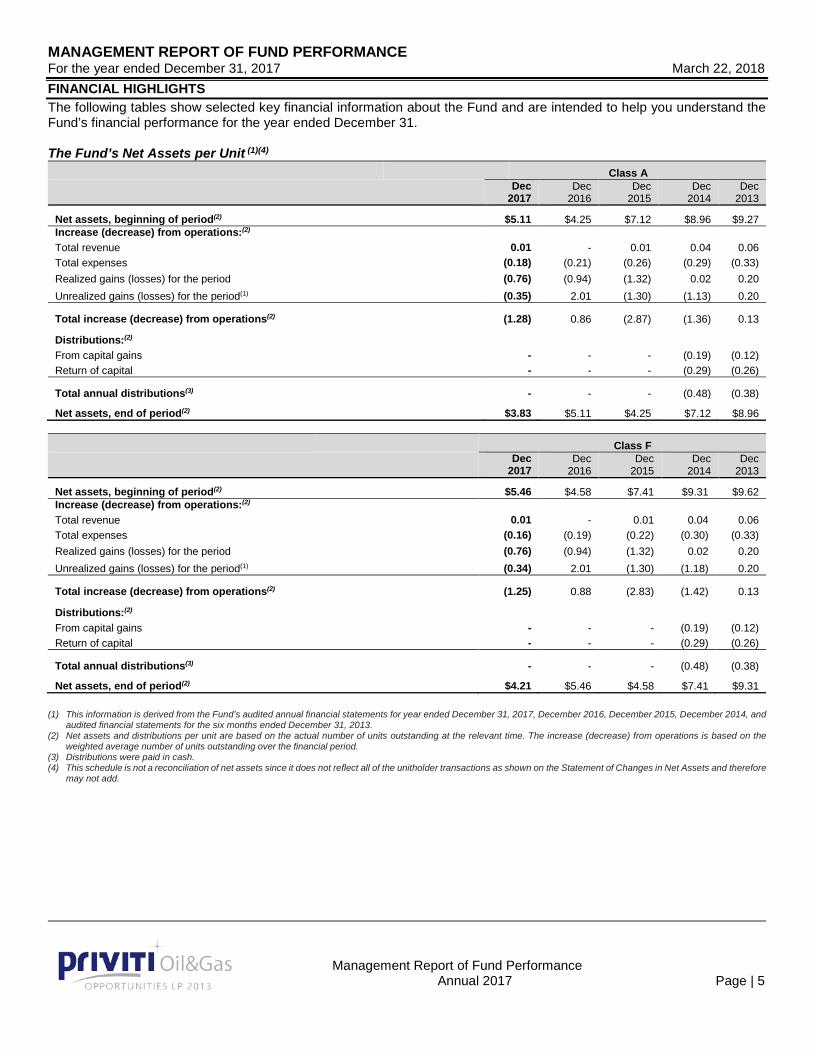
FINANCIAL HIGHLIGHTS The following tables show selected key financial information about the Fund and are intended to help you understand the Fund’s financial performance for the year ended December 31. The Fund’s Net Assets per Unit (1)(4)
Class A
Dec
2017 Dec
2016 Dec
2015 Dec
2014 Dec
2013
Net assets, beginning of period(2) $5.11 $4.25 $7.12 $8.96 $9.27 Increase (decrease) from operations:(2) Total revenue 0.01 - 0.01 0.04 0.06 Total expenses (0.18) (0.21) (0.26) (0.29) (0.33) Realized gains (losses) for the period (0.76) (0.94) (1.32) 0.02 0.20 Unrealized gains (losses) for the period(1) (0.35) 2.01 (1.30) (1.13) 0.20
Total increase (decrease) from operations(2) (1.28) 0.86 (2.87) (1.36) 0.13
Distributions:(2) From capital gains - - - (0.19) (0.12) Return of capital - - - (0.29) (0.26)
Total annual distributions(3) - - - (0.48) (0.38)
Net assets, end of period(2) $3.83 $5.11 $4.25 $7.12 $8.96
Class F
Dec
2017 Dec
2016 Dec
2015 Dec
2014 Dec
2013
Net assets, beginning of period(2) $5.46 $4.58 $7.41 $9.31 $9.62 Increase (decrease) from operations:(2) Total revenue 0.01 - 0.01 0.04 0.06 Total expenses (0.16) (0.19) (0.22) (0.30) (0.33) Realized gains (losses) for the period (0.76) (0.94) (1.32) 0.02 0.20 Unrealized gains (losses) for the period(1) (0.34) 2.01 (1.30) (1.18) 0.20
Total increase (decrease) from operations(2) (1.25) 0.88 (2.83) (1.42) 0.13
Distributions:(2) From capital gains - - - (0.19) (0.12) Return of capital - - - (0.29) (0.26)
Total annual distributions(3) - - - (0.48) (0.38)
Net assets, end of period(2) $4.21 $5.46 $4.58 $7.41 $9.31
(1) This information is derived from the Fund’s audited annual financial statements for year ended December 31, 2017, December 2016, December 2015, December 2014, and audited financial statements for the six months ended December 31, 2013.
(2) Net assets and distributions per unit are based on the actual number of units outstanding at the relevant time. The increase (decrease) from operations is based on the weighted average number of units outstanding over the financial period.
(3) Distributions were paid in cash. (4) This schedule is not a reconciliation of net assets since it does not reflect all of the unitholder transactions as shown on the Statement of Changes in Net Assets and therefore
may not add.
MANAGEMENT REPORT OF FUND PERFORMANCE For the year ended December 31, 2017 March 22, 2018
Management Report of Fund Performance Annual 2017 Page | 6
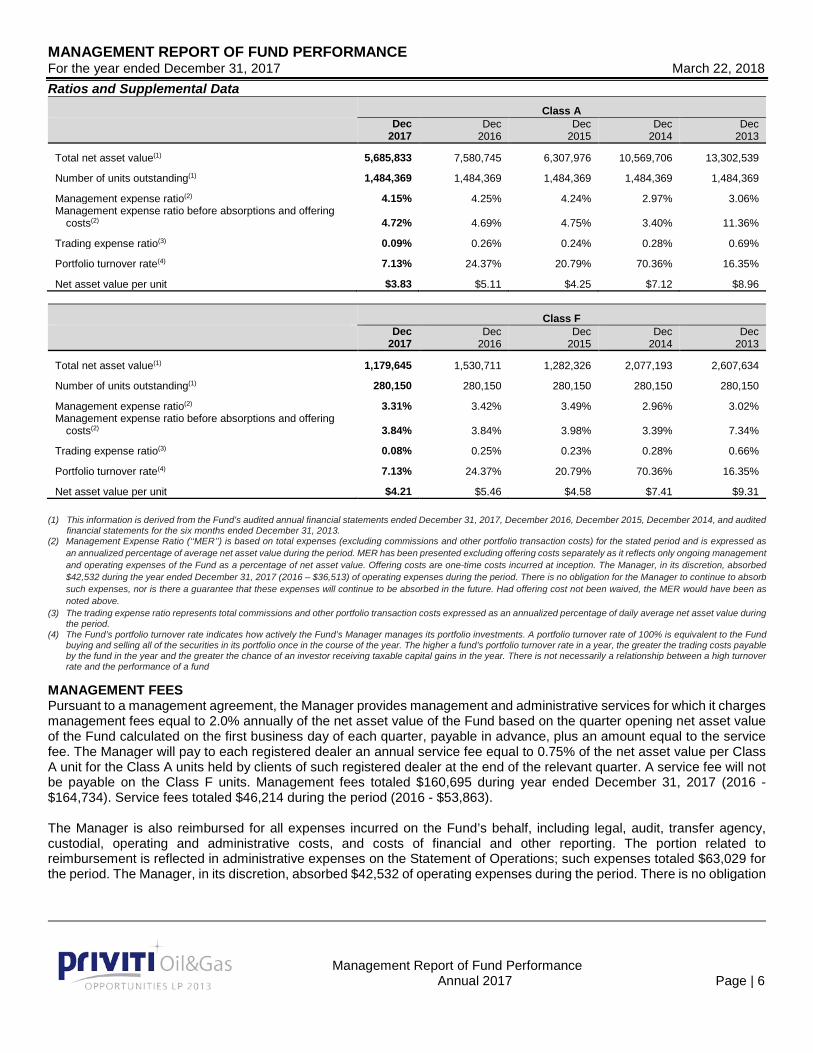
Ratios and Supplemental Data Class A
Dec 2017
Dec 2016
Dec 2015
Dec 2014
Dec 2013
Total net asset value(1) 5,685,833 7,580,745 6,307,976 10,569,706 13,302,539
Number of units outstanding(1) 1,484,369 1,484,369 1,484,369 1,484,369 1,484,369
Management expense ratio(2) 4.15% 4.25% 4.24% 2.97% 3.06% Management expense ratio before absorptions and offering
costs(2) 4.72% 4.69% 4.75% 3.40% 11.36%
Trading expense ratio(3) 0.09% 0.26% 0.24% 0.28% 0.69%
Portfolio turnover rate(4) 7.13% 24.37% 20.79% 70.36% 16.35%
Net asset value per unit $3.83 $5.11 $4.25 $7.12 $8.96
Class F Dec
2017 Dec
2016 Dec
2015 Dec
2014 Dec
2013
Total net asset value(1) 1,179,645 1,530,711 1,282,326 2,077,193 2,607,634
Number of units outstanding(1) 280,150 280,150 280,150 280,150 280,150
Management expense ratio(2) 3.31% 3.42% 3.49% 2.96% 3.02% Management expense ratio before absorptions and offering
costs(2) 3.84% 3.84% 3.98% 3.39% 7.34%
Trading expense ratio(3) 0.08% 0.25% 0.23% 0.28% 0.66%
Portfolio turnover rate(4) 7.13% 24.37% 20.79% 70.36% 16.35%
Net asset value per unit $4.21 $5.46 $4.58 $7.41 $9.31 (1) This information is derived from the Fund’s audited annual financial statements ended December 31, 2017, December 2016, December 2015, December 2014, and audited
financial statements for the six months ended December 31, 2013. (2) Management Expense Ratio (‘‘MER’’) is based on total expenses (excluding commissions and other portfolio transaction costs) for the stated period and is expressed as
an annualized percentage of average net asset value during the period. MER has been presented excluding offering costs separately as it reflects only ongoing management and operating expenses of the Fund as a percentage of net asset value. Offering costs are one-time costs incurred at inception. The Manager, in its discretion, absorbed $42,532 during the year ended December 31, 2017 (2016 – $36,513) of operating expenses during the period. There is no obligation for the Manager to continue to absorb such expenses, nor is there a guarantee that these expenses will continue to be absorbed in the future. Had offering cost not been waived, the MER would have been as noted above.
(3) The trading expense ratio represents total commissions and other portfolio transaction costs expressed as an annualized percentage of daily average net asset value during the period.
(4) The Fund’s portfolio turnover rate indicates how actively the Fund’s Manager manages its portfolio investments. A portfolio turnover rate of 100% is equivalent to the Fund buying and selling all of the securities in its portfolio once in the course of the year. The higher a fund’s portfolio turnover rate in a year, the greater the trading costs payable by the fund in the year and the greater the chance of an investor receiving taxable capital gains in the year. There is not necessarily a relationship between a high turnover rate and the performance of a fund
MANAGEMENT FEES Pursuant to a management agreement, the Manager provides management and administrative services for which it charges management fees equal to 2.0% annually of the net asset value of the Fund based on the quarter opening net asset value of the Fund calculated on the first business day of each quarter, payable in advance, plus an amount equal to the service fee. The Manager will pay to each registered dealer an annual service fee equal to 0.75% of the net asset value per Class A unit for the Class A units held by clients of such registered dealer at the end of the relevant quarter. A service fee will not be payable on the Class F units. Management fees totaled $160,695 during year ended December 31, 2017 (2016 - $164,734). Service fees totaled $46,214 during the period (2016 - $53,863). The Manager is also reimbursed for all expenses incurred on the Fund’s behalf, including legal, audit, transfer agency, custodial, operating and administrative costs, and costs of financial and other reporting. The portion related to reimbursement is reflected in administrative expenses on the Statement of Operations; such expenses totaled $63,029 for the period. The Manager, in its discretion, absorbed $42,532 of operating expenses during the period. There is no obligation
MANAGEMENT REPORT OF FUND PERFORMANCE For the year ended December 31, 2017 March 22, 2018
Management Report of Fund Performance Annual 2017 Page | 7
for the Manager to continue to absorb such expenses, nor is there a guarantee that these expenses will continue to be absorbed in the future. Included in accounts payable and accrued liabilities at December 31, 2017, is $27,977 for above items. PAST PERFORMANCE The performance data provided assumes that all distributions, if any, made by each class of the Fund’s units in the periods shown were reinvested in additional units of the respective class and does not take into account sales, distribution or other optional charges, that may be borne by the investor and would have reduced returns or performance. Past performance does not necessarily indicate how the Fund will perform in the future.
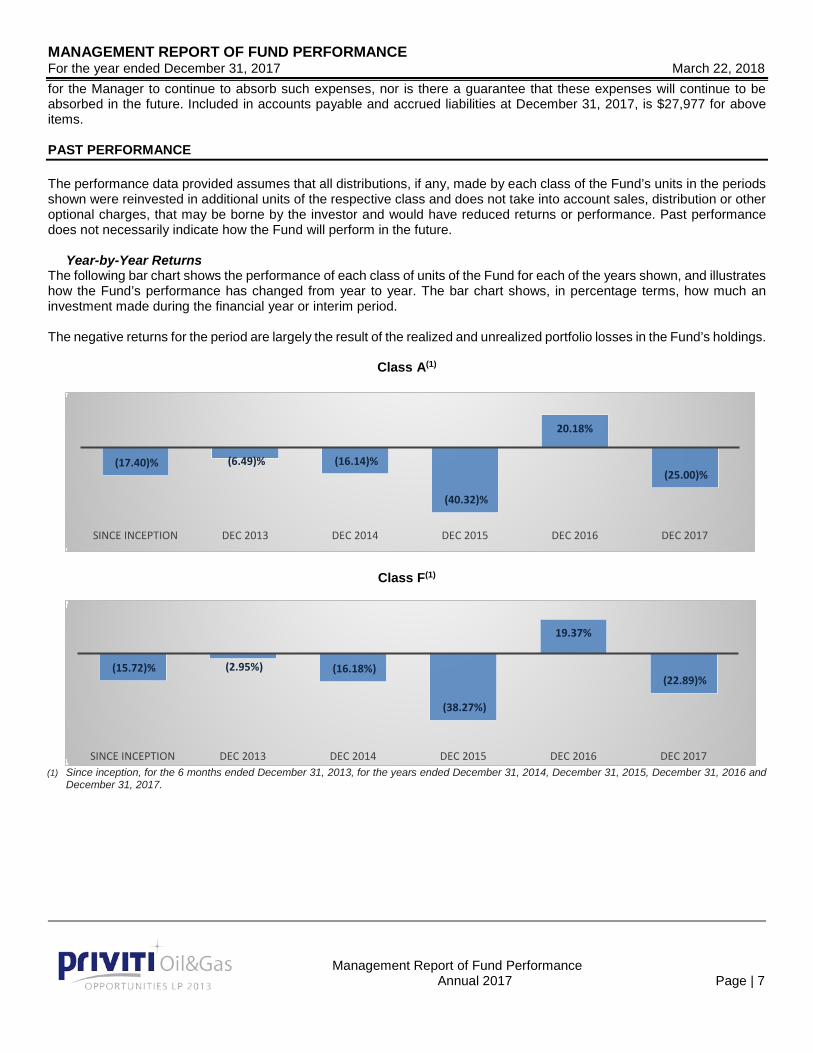
Year-by-Year Returns The following bar chart shows the performance of each class of units of the Fund for each of the years shown, and illustrates how the Fund’s performance has changed from year to year. The bar chart shows, in percentage terms, how much an investment made during the financial year or interim period. The negative returns for the period are largely the result of the realized and unrealized portfolio losses in the Fund’s holdings.
Class A(1)
Class F(1)
(1) Since inception, for the 6 months ended December 31, 2013, for the years ended December 31, 2014, December 31, 2015, December 31, 2016 and
December 31, 2017.
(17.40)% (6.49)% (16.14)%
(40.32)%
20.18%
(25.00)%
SINCE INCEPTION DEC 2013 DEC 2014 DEC 2015 DEC 2016 DEC 2017
(15.72)% (2.95%) (16.18%)
(38.27%)
19.37%
(22.89)%
SINCE INCEPTION DEC 2013 DEC 2014 DEC 2015 DEC 2016 DEC 2017
MANAGEMENT REPORT OF FUND PERFORMANCE For the year ended December 31, 2017 March 22, 2018
Management Report of Fund Performance Annual 2017 Page | 8
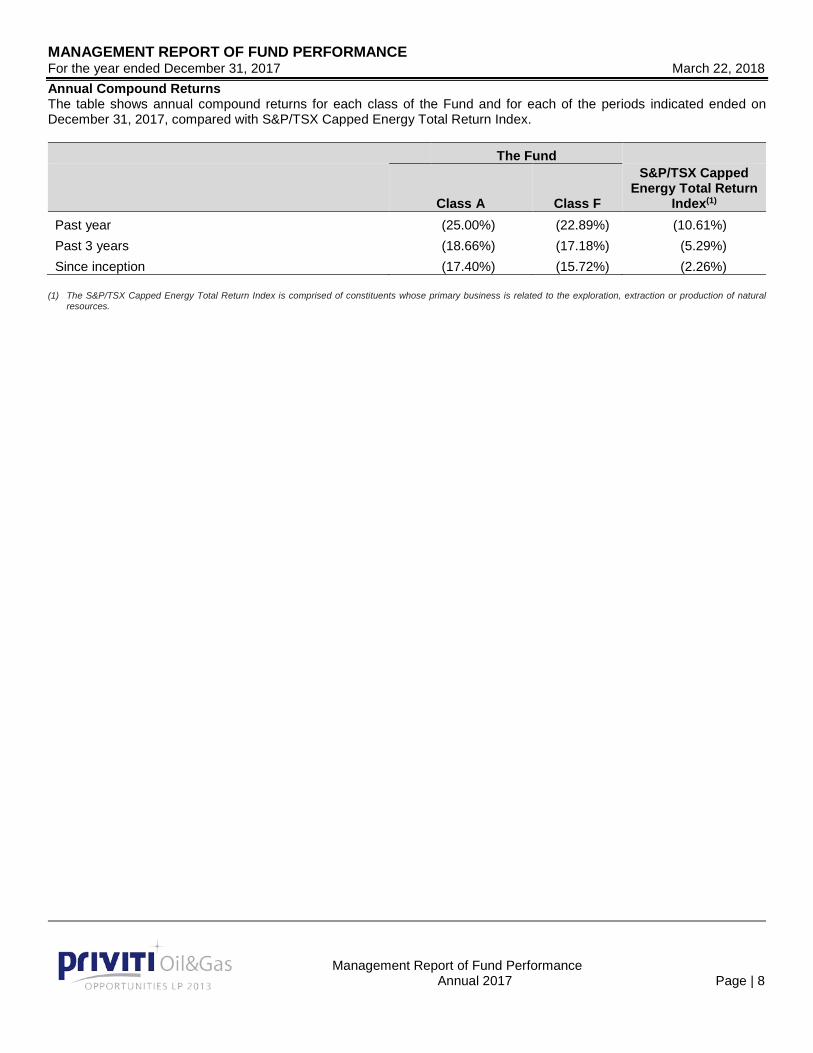
Annual Compound Returns The table shows annual compound returns for each class of the Fund and for each of the periods indicated ended on December 31, 2017, compared with S&P/TSX Capped Energy Total Return Index.
The Fund
Class A Class F
S&P/TSX Capped Energy Total Return
Index(1) Past year (25.00%) (22.89%) (10.61%) Past 3 years (18.66%) (17.18%) (5.29%) Since inception (17.40%) (15.72%) (2.26%)
(1) The S&P/TSX Capped Energy Total Return Index is comprised of constituents whose primary business is related to the exploration, extraction or production of natural
resources.
MANAGEMENT REPORT OF FUND PERFORMANCE For the year ended December 31, 2017 March 22, 2018
Management Report of Fund Performance Annual 2017 Page | 9
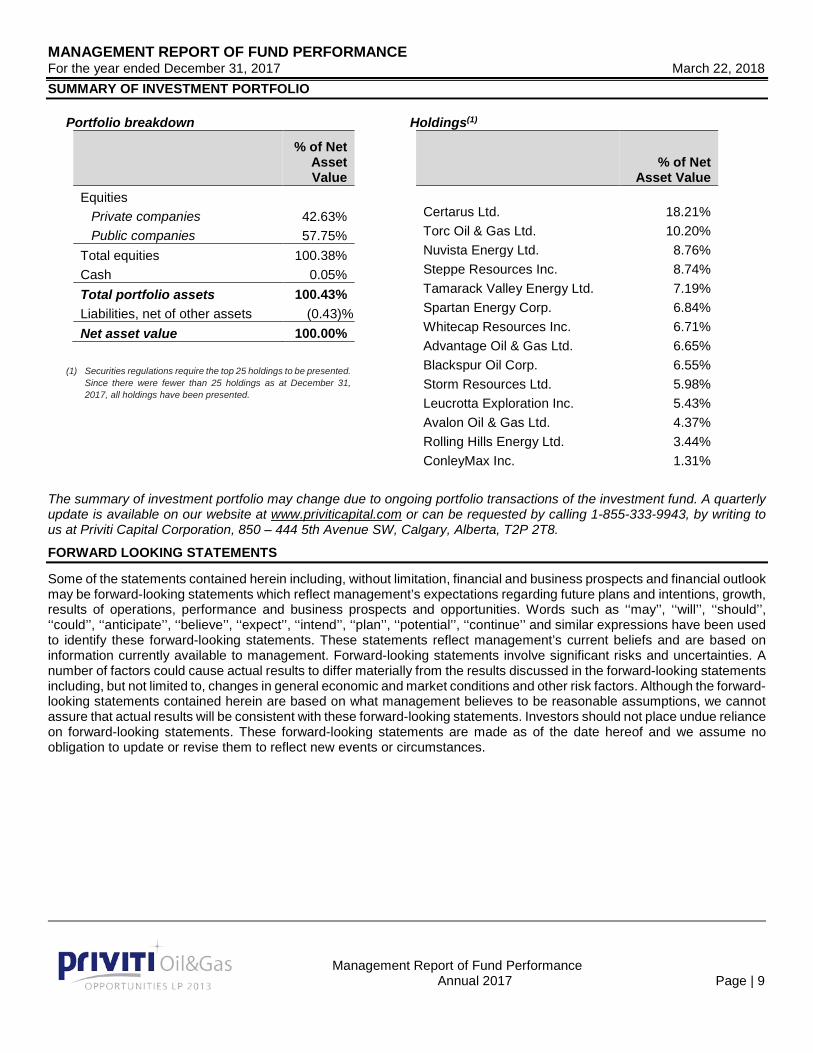
SUMMARY OF INVESTMENT PORTFOLIO
Portfolio breakdown
% of Net Asset Value
Equities Private companies 42.63% Public companies 57.75%
Total equities 100.38% Cash 0.05% Total portfolio assets 100.43% Liabilities, net of other assets (0.43)% Net asset value 100.00%
(1) Securities regulations require the top 25 holdings to be presented. Since there were fewer than 25 holdings as at December 31, 2017, all holdings have been presented.
Holdings(1)
% of Net
Asset Value
Certarus Ltd. 18.21% Torc Oil & Gas Ltd. 10.20% Nuvista Energy Ltd. 8.76% Steppe Resources Inc. 8.74% Tamarack Valley Energy Ltd. 7.19% Spartan Energy Corp. 6.84% Whitecap Resources Inc. 6.71% Advantage Oil & Gas Ltd. 6.65% Blackspur Oil Corp. 6.55% Storm Resources Ltd. 5.98% Leucrotta Exploration Inc. 5.43% Avalon Oil & Gas Ltd. 4.37% Rolling Hills Energy Ltd. 3.44% ConleyMax Inc. 1.31%
The summary of investment portfolio may change due to ongoing portfolio transactions of the investment fund. A quarterly update is available on our website at www.priviticapital.com or can be requested by calling 1-855-333-9943, by writing to us at Priviti Capital Corporation, 850 – 444 5th Avenue SW, Calgary, Alberta, T2P 2T8.
FORWARD LOOKING STATEMENTS
Some of the statements contained herein including, without limitation, financial and business prospects and financial outlook may be forward-looking statements which reflect management’s expectations regarding future plans and intentions, growth, results of operations, performance and business prospects and opportunities. Words such as ‘‘may’’, ‘‘will’’, ‘‘should’’, ‘‘could’’, ‘‘anticipate’’, ‘‘believe’’, ‘‘expect’’, ‘‘intend’’, ‘‘plan’’, ‘‘potential’’, ‘‘continue’’ and similar expressions have been used to identify these forward-looking statements. These statements reflect management’s current beliefs and are based on information currently available to management. Forward-looking statements involve significant risks and uncertainties. A number of factors could cause actual results to differ materially from the results discussed in the forward-looking statements including, but not limited to, changes in general economic and market conditions and other risk factors. Although the forward-looking statements contained herein are based on what management believes to be reasonable assumptions, we cannot assure that actual results will be consistent with these forward-looking statements. Investors should not place undue reliance on forward-looking statements. These forward-looking statements are made as of the date hereof and we assume no obligation to update or revise them to reflect new events or circumstances.