financial statements year ended 31 december 2016 · financial statements year ended 31 december...
TRANSCRIPT

HANNOVER LIFE RE OF
AUSTRALASIA LTD
FINANCIAL STATEMENTS
YEAR ENDED
31 DECEMBER 2016
CONTENTS
ANNUAL FINANCIAL REPORT
Page
Company Particulars 3
Directors’ Report 4
Corporate Governance Statement 8
Lead Auditor’s Independence Declaration 11
Financial Statements - Statement of Comprehensive Income 12- Statement of Financial Position 13- Statement of Cash Flows 14- Statement of Changes in Equity 15
Notes to the Financial Statements 17
Directors’ Declaration 49
Independent Auditor’s Report 50
Company Particulars
Head Office Level 7, 70 Phillip Street, Sydney, NSW, 2000 Telephone: (02) 9251 6911 Facsimile: (02) 9251 6862 E-mail: [email protected] Website: www.hannover-re.com
Directors P. R. Gaydon, BCom, CA, MAICD, ChairmanC.J. Chèvre, Deputy ChairmanE.G. Payne, BEc(Hons), BLegS, CA, GAICDS.R. Swil, B Bus Sc, MBA, FIAA, FAICDU. WallinG. Obertopp, Actuary (DAV), Managing Director
Executive G. Obertopp, Actuary (DAV), Managing DirectorG. Campbell, BEc, MAS, FIAA, Appointed ActuaryM. de Villiers, BSc (Hons), MBA, FIAA, Assistant General Manager (Products & Marketing)D.N. Tallack, BEc, CPA, AGIA, General Manager (Finance) & Company Secretary
Bankers National Australia Bank Limited
Solicitors Minter Ellison
Auditors KPMG
3
Directors’ Report
For the Year Ended 31 December 2016
The Directors have pleasure in presenting their report together with the financial report of the entity for the
year ended 31 December 2016 and the auditor’s report thereon.
Directors
The Directors of the entity at any time during or since the end of the financial year are:
Mr Peter Gaydon, BCom, CA, MAICD Chairman Independent Non-Executive Director Age 66
Mr Gaydon was previously employed by the international accounting firm Ernst & Young for over 40 years and was client service partner to a number of insurance companies in Australia. Mr Gaydon was also involved in insurance industry development activity across Asia and was with Ernst & Young in Japan for almost 6 years. Member of the Board Audit, Board Risk and Board Remuneration Committees. Appointed Director on 1 July 2016 and Chairman on 1 December 2016.
Mr Rodney John Atfield, FIA, FIAA, FAII Resigned as Chairman and Independent Non-Executive Director on 1 December 2016 Age 79
Mr Atfield previously held the positions of Managing Director of Mercantile Mutual (now OnePath Group) and Chief Executive Officer of Mercantile Mutual Life and had over 40 years experience in the life insurance and funds management industry. Mr Atfield was also previously a director of APRA. Served as member of the Board Audit, Board Risk and Board Remuneration Committees.
Mr Claude Jacques Chèvre Deputy Chairman Non-Executive Director Age 49
Mr Chèvre is a member of the Executive Boards of Hannover Rück SE and E + S Rückversicherung AG. Member of the Board Remuneration Committee. Director since 2011 and Deputy Chairman since 2012.
Mr Gerd Obertopp, Actuary (DAV) Managing Director Age 55
Mr Obertopp has been in the Reinsurance industry for over 25 years, and has previously been Managing Director of entities in the Hannover Re Group in South Africa and Hong Kong.
4

Ms Elsa Gene Payne, BEc(Hons), BLegS, CA, GAICD
Independent Non-Executive Director Age 63
Ms Payne held the position of Tax Partner at PricewaterhouseCoopers for over 20 years and has had over 30 years experience in the financial services industry. Chair of the Board Audit Committee and member of the Board Risk Committee. Director since 2010.
Mr Samuel Robert Swil, B Bus Sc, MBA, FIAA, FAICD Independent Non-Executive Director Age 66
Mr Swil previously held the positions of Chairman of Prefsure Life Limited and Managing Director of FAI Life Limited and Australian Casualty and Life Limited and has had over 35 years experience in the life insurance and superannuation industry.
Chairman of the Board Risk and Board Remuneration Committees and member of the Board Audit Committee. Director since 2006.
Mr Ulrich Wallin Non-Executive Director Age 62
Mr Wallin is Chairman of the Executive Boards of Hannover Rück SE and E + S Rückversicherung AG. Director since 2009.
Company Secretary
Mr David Tallack BEc CPA AGIA has held the position of Company Secretary for over 10 years. Mr Tallack is a member of Governance Institute of Australia and holds a Graduate Diploma of Applied Corporate Governance.
Directors’ meetings
The number of Directors’ meetings (including meetings of committees of Directors) and number of meetings attended by each of the Directors of the entity during the financial year are:
Director Directors’
Meetings
Board Audit
Committee
Meetings
Board Risk
Committee
Meetings
Board
Remuneration
Committee
A B A B A B A B
* Mr P Gaydon 2 2 1 1 2 2 - - *# Mr R Atfield 3 3 2 2 4 4 1 1 # Mr C Chèvre 3 3 - - - - - 1* Ms E Payne 3 3 2 2 4 4 - -*# Mr S Swil 3 3 2 2 4 4 1 1
Mr U Wallin 3 3 - - - - - - Mr G Obertopp 3 3 - - - - - -
A - number of meetings attended B - number of meetings held during the time the Director held office during the year * - member of Board Audit and Board Risk Committee# - member of Board Remuneration Committee
Principal activities
The principal activities of the entity during the course of the financial year were the transaction of life reinsurance and life insurance business. The entity provides risk carrying and associated services to insurance offices transacting life and disability insurance risk business. It also provides risk carrying and associated services to employers and
5
trustees of superannuation plans in respect of group life insurances and retail policyholders via direct marketed distribution arrangements.
Review and results of operations
Overview of the entity
The entity recorded a profit before tax for the 2016 financial year of $21.5m (2015: $2.4m). The increase in profit was primarily due to favourable claims experience on the entity’s group business and direct marketed business.
The effective tax charge was substantially higher than the nominal Australian tax rate of 30% due to the overseas retrocession of profits on morbidity business being non-deductible.
The Company experienced losses on its fixed interest portfolios, albeit lower than prior year losses, due to further increases in bond yields. The negative impact of higher bond yields on the entity’s fixed interest portfolios was, however, largely offset by the entity’s interest rate sensitive policy liabilities.
The total comprehensive income for the 2016 financial year of $4.4m (2015: loss of $1.9m) benefitted from the revaluation of the entity’s owner occupied property and a stronger New Zealand dollar.
Significant changes in the state of affairs
In the opinion of the Directors, there were no significant changes in the state of affairs of the entity that occurred during the financial year under review.
Dividends
No dividends were paid or declared by the entity since the end of the previous financial year.
Events subsequent to reporting date
At a meeting of the Board of Directors on 15 March 2017, the Board approved the transfers of retained profits between statutory funds and the Shareholder Fund with an effective date of 31 December 2016.
On 15 March 2017, the Company finalised changes to its outwards reinsurance arrangements with Hannover Rück SE to simplify its existing arrangements by recapturing existing surplus arrangements and restructuring its quota share arrangements with effect from 1 January 2017. The estimated increase in the Company's excess of Capital Base over Prescribed Capital Amount arising from the changes is in the range of $40 million to $60 million.
Likely developments
The entity will continue to pursue its objective of attaining above average returns on shareholders' equity and to achieve long term growth in its business consistent with increased profits on a year to year basis.
Environmental regulation
The operations of the entity are not subject to any particular and significant environmental regulation under any law of the Commonwealth of Australia or of any States or Territories. The entity has not incurred any liability (including rectification costs) under any environmental legislation.
6

Indemnification and insurance of Directors and Officers
Indemnification
In accordance with the entity’s Constitution the entity has agreed to indemnify all current and past Directors and Officers of the entity, to the fullest extent permitted by the law, against a liability incurred by that person as a Director or Officer of the entity including, without limitation, legal costs and expenses incurred in defending an action.
Insurance Premiums
Since the end of the previous financial year, the entity has paid insurance premiums in respect of Directors' and Officers' liability and legal expenses insurance contracts for current and former Directors and Officers including Executive Officers of the entity. The Directors have not included details of the nature of the liabilities covered or the amount of the premium paid in respect of the Directors’ and Officers’ Liability insurance contract, as such disclosure is prohibited under the terms of the contract.
Lead Auditor’s Independence Declaration
The Lead Auditor’s Independence Declaration is included after the Corporate Governance Statement and forms part of the Directors’ Report for the financial year.
Rounding off
The entity is of a kind referred to in ASIC Corporations (Rounding in Financial/Director’s Reports) Instrument 2016/191 and in accordance with that Instrument, amounts in the financial report and Directors’ Report have been rounded off to the nearest thousand dollars, unless otherwise stated.
Signed in accordance with a resolution of the Directors.
P. R. Gaydon Sydney Chairman 15 March 2017
7
Corporate Governance Statement
For the Year Ended 31 December 2016
This Statement outlines the main corporate governance practices in place throughout the financial year, unless
otherwise stated.
Board of Directors
Role of the Board
The Board's primary role is the protection and enhancement of long-term shareholder value.
In addition, the Board, in accordance with the Life Insurance Act 1995 and the Insurance (Prudential
Supervision) Act 2010 (jointly “the Life Acts”), has a duty to take reasonable care and use due diligence in
relation to the interests of the owners and prospective owners of policies referrable to the Statutory Funds of
the entity.
To fulfil this role, the Board is responsible for the overall Corporate Governance of the entity including:
approving the entity's strategic direction;
establishing goals for management and monitoring the achievement of these goals;
internal controls and management information systems;
appraising and monitoring financial and other reporting;
capital management; and
risk management.
Composition of the Board
The names of the Directors of the entity are set out in the Directors' Report. The Board currently comprises
six Directors (of which three are independent Non-Executive Directors) with a broad range of expertise and
experience appropriate to the entity's business and the industry which it operates in. In accordance with the
entity's Constitution, Directors must retire after three years, at which time, if they are eligible, they may offer
themselves for re-election.
Board Processes
To assist it in the execution of its responsibilities, the Board has established a Board Charter and Board Audit,
Risk and Remuneration Committees with their own Charters.
The Board delegates the operation and administration of the entity to the Managing Director who is
accountable to the Board.
The full Board currently holds three scheduled meetings each year, plus any other meetings at such other
times as may be necessary to address any specific significant matters that may arise. The agenda for
meetings include financial reports, technical and investment reports and any legal and statutory matters if
required. The Board Book is circulated in advance and Executives are available to be involved in Board
discussions.
8
Recognition and Management of Risk
The Board has established a framework for identifying areas of significant business risk and maintaining
appropriate and adequate controls and monitoring procedures, in addition to ensuring compliance with legal
and regulatory requirements. The framework is documented in the Board’s Risk Management Strategy. The
Board is responsible for reviewing and overseeing the Strategy and ensuring the appropriate corporate
governance structure.
The Risk Management Strategy operates within the context of the Board’s documented risk appetite.
Adequacy of Capital
The Board is responsible for ensuring that the entity, and each statutory fund, has adequate capital to meet its
obligations under a wide range of circumstances. The Board has adopted a Target Capital position and an
Internal Capital Adequacy Assessment Process (ICAAP) that is documented in the Board’s ICAAP Summary
Statement.
Board Audit Committee
The responsibilities of the Board Audit Committee (Audit Committee) include reviewing compliance with the entity’s accounting policies and internal control framework and the industry’s regulatory environment and advising the Board of Directors on the quality and reliability of financial information prepared for use by the Board in determining policies or for inclusion in the financial report. In addition, the performance of the auditors and the adequacy of the internal audit plans are reviewed by the Audit Committee.
The Audit Committee has a documented Charter, approved by the Board. The Chairperson may not be the Chairperson of the Board.
The Appointed Auditor, the Managing Director, the Company Secretary and Appointed Actuary are invited to Audit Committee meetings. The Appointed Auditor meets at least once a year with the Audit Committee without management being present.
Board Risk Committee
The Board Risk Committee (Risk Committee) is responsible for assisting the Board of Directors through its oversight of the implementation and operation of the Company’s Risk Management Framework.
The Risk Committee has a documented Charter approved by the Board. The Chairperson may not be the Chairperson of the Board.
The Managing Director, Chief Risk Officer, Company Secretary, Assistant Company Secretary, Appointed Actuary, Senior Corporate Actuary and Appointed Auditor are invited to the Risk Committee meetings.
Board Remuneration Committee
The Board Remuneration Committee (Remuneration Committee) is responsible for conducting regular reviews of the Remuneration Policy, making recommendations to the Board on changes to the Remuneration Policy and making annual recommendations to the Board on the remuneration of the Managing Director, direct reports to the Managing Director and any other person whose activities may, in the Board’s opinion, affect the financial soundness of the Company.
The Remuneration Committee has a documented Charter approved by the Board. The Remuneration Committee is selected from the non-executive directors of the Board with a minimum of three members. The Chairperson of the Remuneration Committee must be an independent director with the majority of members being independent directors.
9
Remuneration of the Board
All Directors' remuneration is determined on a bi-annual basis by the shareholder.
Fit and Proper Policy
The Board has adopted a Fit and Proper Policy under which the Board assesses annually the responsible
persons (including individual directors) of the entity for their fitness and proprietary in holding their responsible
person positions.
Financial supervision
The Life Acts govern the principal activities of the entity and identifies responsibilities of the Board with respect
to operations. In addition, the entity is required to comply with the provisions of the Corporations Act 2001.
The Board seeks to discharge its responsibilities in a number of ways:
an annual business plan and budget is reviewed and approved by the Board;
three Board meetings are held to monitor performance against budget and financial benchmarks;
Directors are responsible for ensuring financial statements that are presented to the parent entity and
regulatory bodies are prepared in accordance with Australian Accounting Standard AASB 1038 Life
Insurance Contracts, the Financial Sector (Collection of Data) Act 2001 and the Corporations Act 2001;
the entity’s Appointed Actuary is responsible for investigating the financial condition of the entity including
the valuation of policy liabilities, solvency and capital adequacy requirements in accordance with the
standards applied by the Australian Prudential Regulation Authority (APRA) and for providing advice to
Executive Management and the Board as required under Prudential Standards and the Life Acts;
Investment Guidelines are approved by the Board. Investment management decisions in accordance
with the requirements of the Guidelines are delegated to an external investment manager in accordance
with an Investment Management Agreement; and
adoption of various policies such as the Risk Appetite Statement, Risk Management Strategy, Target
Capital, ICAAP Summary Statement, Remuneration Policy and Fit & Proper Policy.
Ethical standards
Code of Conduct
The Company has adopted a Code of Conduct that requires all managers and employees to act with the
utmost integrity and objectivity in their dealings with business partners, regulators, the community and
employees, striving at all times to enhance the reputation and performance of the entity.
Conflict of interest
Directors are required to keep the Board advised, on an ongoing basis, of any interest that could potentially
conflict with those of the entity. Details of Director related entity transactions with the entity are set out in the
notes to the financial report.
10
11
Lead Auditor’s Independence Declaration under
Section 307C of the Corporations Act 2001
To the Directors of Hannover Life Re of Australasia Ltd
I declare that, to the best of my knowledge and belief, in relation to the audit for the financial year ended 31 December 2016 there have been:
(i) no contraventions of the auditor independence requirements as set out in the Corporations Act 2001 in relation to the audit; and
(ii) no contraventions of any applicable code of professional conduct in relation to the audit.
KPMG Andrew Reeves Partner
Sydney 15 March 2017
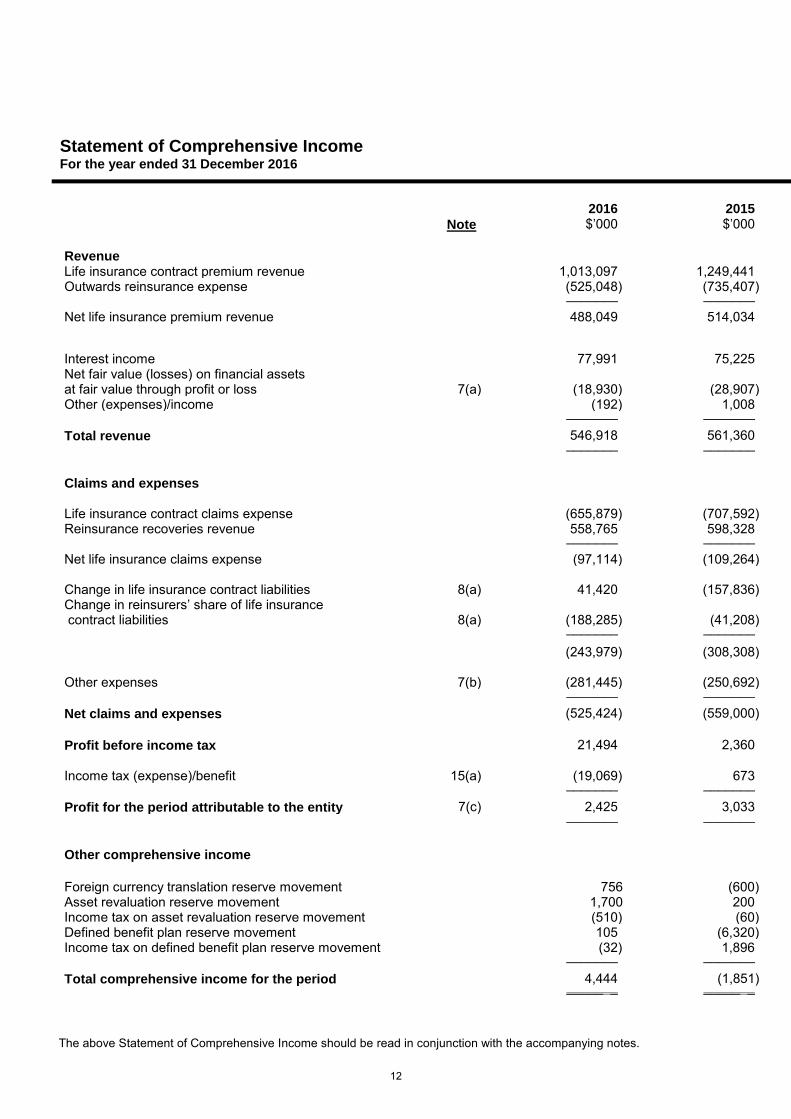
Statement of Comprehensive Income For the year ended 31 December 2016
2016 2015 2013 2012 2011
Note $’000 $’000 $’000 $’000 $’000
Revenue Life insurance contract premium revenue 1,013,097 1,249,441 809,079 718,380 547,325 Outwards reinsurance expense (525,048) (735,407) (421,141) (373,798) (283,973)
_______ _______ _______ _______ _______
Net life insurance premium revenue 488,049 514,034 387,938 344,582 263,352
Interest income 77,991 75,225 57,127Net fair value (losses) on financial assets at fair value through profit or loss 7(a) (18,930) (28,907) (29,272) 85,727 88,321 Other (expenses)/income (192) 1,008 278 123 99
_______ _______ _______ _______ _______
Total revenue 546,918 561,360 416,071 430,432 351,772 _______ _______ _______ _______ _______
Claims and expenses
Life insurance contract claims expense (655,879) (707,592) (528,669) (469,110) (369,054)Reinsurance recoveries revenue 558,765 598,328 489,714 330,716 281,077
_______ _______ _______ _______ _______
Net life insurance claims expense (97,114) (109,264) (38,955) (138,394) (87,977)
Change in life insurance contract liabilities 8(a) 41,420 (157,836) (295,532) (87,992) (118,271)Change in reinsurers’ share of life insurance contract liabilities 8(a) (188,285) (41,208) 115,092 17,821 19,116
_______ _______ _______ _______ _______
(243,979) (308,308) (219,395) (208,565) (187,132)
Other expenses 7(b) (281,445) (250,692) (209,677) (188,683) (137,648)_______ _______ _______ _______ _______
Net claims and expenses (525,424) (559,000) (429,072) (397,248) (324,780)
Profit before income tax 21,494 2,360 (13,001) 33,184 26,992
Income tax (expense)/benefit 15(a) (19,069) 673 50,828 5,513 18,545 _______ _______ _______ _______ _______
Profit for the period attributable to the entity 7(c) 2,425 3,033 37,827 38,697 45,537 _______ _______ _______ _______ _______
Other comprehensive income
Foreign currency translation reserve movement 756 (600) 5,021 1,126 33Asset revaluation reserve movement 1,700 200 950 - 100 Income tax on asset revaluation reserve movement (510) (60) (285) - Defined benefit plan reserve movement 105 (6,320) 1,423 536 Income tax on defined benefit plan reserve movement (32) 1,896 (427) (161) (30)
_______ _______ _______ _______ _______
Total comprehensive income for the period 4,444 (1,851) 44,509 40,198 45,640 _____ _ _____ _ _____ _ _____ _ _____ _
The above Statement of Comprehensive Income should be read in conjunction with the accompanying notes.
12

Statement of Financial Position As at 31 December 2016
2016 2015 2012
Note $’000 $’000 $’000
Assets
Cash 81,715 72,134 58,617 Trade and other receivables 9 141,385 148,690 98,716 Financial assets at fair value through profit or loss 18 1,857,982 1,747,018 1,017,677 Reinsurers’ share of life insurance contract liabilities 8(a) 79,458 267,726 133,522
Property, plant and equipment 10 14,142 11,356 9,165 Deferred tax assets 15(b) 63,693 79,608 34,056
_________ _________ _______
Total assets 2,238,375 2,326,532 1,351,753
_ _____ _ _ _____ ________
Liabilities
Trade and other payables 11 31,600 85,732 64,277 Employee benefits 12 7,167 8,717 5,192 Gross life insurance contract liabilities 8(a) 1,715,007 1,755,706 945,673 Current tax liability 911 37 Deferred tax liability 15(b) 2,906 - 23
_________ _________ _______
Total liabilities 1,757,591 1,850,192 1,015,165 _________ _________ _______
Equity
Contributed equity 13 80,000 80,000 10,000 Reserves 63,119 61,100 (1,022) Retained profits 337,665 335,240 327,610
_________ _________ _______
Total equity 480,784 476,340 336,588 _________ _________ _______
Total liabilities and equity 2,238,375 _ _____ _
2,326,532 _ _____ _
The above Statement of Financial Position should be read in conjunction with the accompanying notes.
13
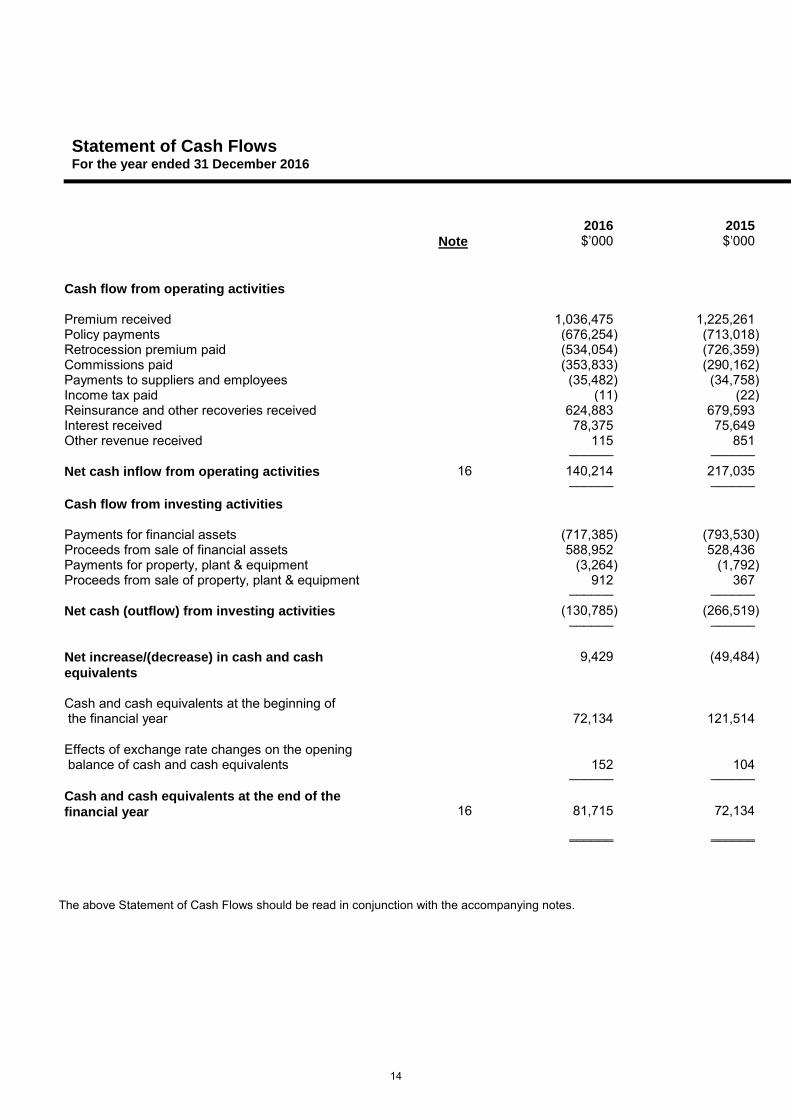
Statement of Cash Flows For the year ended 31 December 2016
2016 2015
Note $’000 $’000
Cash flow from operating activities
Premium received 1,036,475 1,225,261 Policy payments (676,254) (713,018) Retrocession premium paid (534,054) (726,359) Commissions paid (353,833) (290,162) Payments to suppliers and employees (35,482) (34,758) Income tax paid (11) (22) Reinsurance and other recoveries received 624,883 679,593 Interest received 78,375 75,649 Other revenue received 115 851
______ ______
Net cash inflow from operating activities 16 140,214 217,035 ______ ______
Cash flow from investing activities
Payments for financial assets (717,385) (793,530) Proceeds from sale of financial assets 588,952 528,436 Payments for property, plant & equipment (3,264) (1,792) Proceeds from sale of property, plant & equipment 912 367
______ ______
Net cash (outflow) from investing activities (130,785) (266,519) ______ ______
Net increase/(decrease) in cash and cash
equivalents
9,429 (49,484)
Cash and cash equivalents at the beginning of the financial year 72,134 121,514
Effects of exchange rate changes on the opening balance of cash and cash equivalents 152 104
______ ______
Cash and cash equivalents at the end of the
financial year 16 81,715 72,134
______ ______
The above Statement of Cash Flows should be read in conjunction with the accompanying notes.
14

Statement of Changes in Equity For the year ended 31 December 2016
Share Capital
Translation Reserve
Revaluation Reserve
Defined Benefit Reserve
Other Reserve
Retained Earnings
Total
$’000 $’000 $’000 $’000 $’000 $’000 $’000
Balance at 1 January 2016 80,000 4,433 2,450 (5,783) 60,000 335,240 476,340
Profit for the period - - - - - 2,425 2,425
Other comprehensive income Foreign currency translation - 756 - - - - 756 Revaluation of owner occupied property - - 1,190 - - - 1,190 Revaluation of defined benefit provision - - - 73 - - 73
________ _________ ________ ________ ________ _________ _________
Total comprehensive income for the period
- 756 1,190 73 - 2,425 4,444
________ _________ ________ ________ ________ _________ _________
Balance at 31 December 2016 80,000 5,189 3,640 (5,710) 60,000 337,665 480,784 _________ ________ ________ ________ __________ __________ __________
Share Capital
Translation Reserve
Revaluation Reserve
Defined Benefit Reserve
Other Reserve
Retained Earnings
Total
$’000 $’000 $’000 $’000 $’000 $’000 $’000
Balance at 1 January 2015 80,000 5,033 2,310 (1,359) 60,000 332,207 478,191
Profit for the period - - - - 3,033 3,033
Other comprehensive income Foreign currency translation - (600) - - - - (600) Revaluation of owner occupied property - - 140 - - - 140 Revaluation of defined benefit provision - - - (4,424) - (4,424)
________ _________ ________ ________ ________ _________ _________
Total comprehensive income for the period
- (600) 140 (4,424) - 3,033 (1,851)
________ _________ ________ ________ ________ _________ _________
Balance at 31 December 2015 80,000 4,433 2,450 (5,783) 60,000 335,240 476,340 _________ ________ ________ ________ __________ __________ __________
The above Statement of Changes in Equity should be read in conjunction with the accompanying notes.
15

Hannover Life Re of Australasia Ltd
Notes to the Financial Statements For the Year Ended 31 December 2016
Contents of the Notes to the Financial Statements
Note Page
1 Summary of significant accounting policies 172 Critical accounting judgments and estimates 21
3 Actuarial assumptions and methods 22
4 Risk management policies and procedures 26
5 Disclosure on asset restrictions 30
6 Capital requirements 30
7 Profit and loss information 32
8 Life insurance contract liabilities 33
9 Trade and other receivables 34
10 Property, plant and equipment 34
11 Trade and other payables 35
12 Employee benefits 35
13 Capital and reserves 36
14 Disaggregated information of life insurance business by fund 37
15 Income tax 38
16 Reconciliation of profit after income tax expense to net cash inflow from operating activities
40
17 Fair value hierarchy 41
18 Financial instrument risks 42
19 Operating leases 45
20 Defined Benefit Plan 45
21 Auditor’s remuneration 46
22 Directors and Executive disclosures (key management personnel) 46
23 Non Director related parties 47
24 Reconciliation of reported results with Life Act results 48
25 Events Occurring After Balance Date 48
16

1. Summary of significant accounting policies
The principal accounting policies adopted in the preparation of the financial report are set out below. These policieshave been consistently applied, unless otherwise stated.
(a) Basis of presentation
The entity is incorporated and domiciled in Australia. The registered office of the entity is Level 7, 70 PhillipStreet, Sydney, Australia 2000. The entity is a public company limited by shares.
The financial statements are general purpose financial statements which have been prepared inaccordance with Australian Accounting Standards (AASBs) including Australian Interpretations adopted bythe Australian Accounting Standards Board (AASB) and the Corporations Act 2001. The financialstatements comply with International Financial Reporting Standards (IFRS) and interpretations adopted bythe International Accounting Standard Board (IASB).
This financial report is prepared in accordance with the fair value basis of accounting with certainexceptions as described in the accounting policies below.
The preparation of financial statements in conformity with AASBs requires the use of certain criticalaccounting estimates. It also requires management to exercise its judgement in the process of applying theentity’s accounting policies. The areas involving a higher degree of judgement or complexity, or areaswhere assumptions and estimates are significant to the financial statements have been disclosed in Note 2.
Where necessary, comparative information has been reclassified to achieve consistency in disclosure withcurrent financial period amounts and other disclosures.
These financial statements are presented in Australian Dollars, which is the entity’s functional currency.
The financial statements are prepared on a liquidity basis as this provides more reliable and relevantinformation.
The financial statements were authorised for issue by the Board of Directors on 15 March 2017.
(b) Principles for life insurance business
The life insurance operations of the entity are conducted within separate statutory funds as required by theLife Insurance Act 1995 (Life Act) and are reported in aggregate with the shareholder’s fund in theStatement of Comprehensive Income, Statement of Financial Position, Statement of Cash Flows andStatement of Changes in Equity. The life insurance operations of the entity comprise of the insurance andreinsurance of individual and group death, total and permanent disability, trauma and income protectionbusiness in Australia and New Zealand.
Life insurance contracts involve the acceptance of significant insurance risk. Insurance risk is defined assignificant if and only if, an insured event could cause an insurer to pay significant additional benefits in anyscenario, excluding scenarios that lack commercial substance (i.e. have no discernible effect on theeconomics of the transaction). Insurance contracts include those where the insured benefit is payable onthe occurrence of a specified event such as death, injury or disability caused by accident or illness. Theinsured benefit is not linked to the market value of the investments held by the entity, and the financial risksare substantially borne by the entity.
The life insurance operations consist of non-investment linked business only. All business written by theentity is non-participating and all profits and losses from non-participating business are allocated to theshareholder.
17
(c) Premium and claims
Premium and claims have been classified as revenue and expense respectively as the entity only issues lifeinsurance contract risk products. Premium is recognised as revenue on an accruals basis. Claims arerecognised when the liability to the policy owner under the policy owner contract has been established orupon notification of the insured event depending on the type of claim.
(d) Liabilities
(i) Life Insurance contract liabilities
Life insurance contract liabilities are measured at net present values of estimated future cashflows or, where the result would not be materially different, as the accumulated benefits availableto policyholders. Applicable reinsurance recoveries are brought to account on the same basis aslife insurance contract liabilities. Changes in life insurance contract liabilities are recognised inthe Statement of Comprehensive Income in the financial year in which they occur. Profit marginsare released over each reporting period in line with the services that have been provided. Thebalance of the planned profit margins is deferred by including them in the value of the lifeinsurance contract liabilities. Further details of the actuarial assumptions used in thesecalculations are set out in Note 3.
(ii) Trade and other payables
Trade and other payables are measured at book value, which is the best estimate of fair value.Trade payables are non interest bearing and settled on normal commercial terms.
(e) Assets backing life insurance contract liabilities
The entity has determined that all assets held within its statutory funds are assets backing lifeinsurance contract liabilities. The measurement of these liabilities incorporates current information andmeasuring the financial assets backing these life insurance contract liabilities at fair value eliminates orsignificantly reduces a potential measurement inconsistency which would arise if the financial assets wereclassified as available for sale or measured at amortised cost. In addition, the use of fair value with changesin fair value taken to profit and loss is consistent with key elements of the entity’s risk managementframework. Consequently all financial assets within the statutory funds are measured at fair value as at thereporting date.
Financial assets
(i) Valuation
Upon initial recognition, financial assets are designated at fair value through profit or loss. Gainsand losses on subsequent measurement to fair value or on sale are recognised through profit orloss. Fair value is determined as follows:
Cash assets are carried at face value of the amounts deposited. The carrying amounts ofcash assets approximate their fair value. For the purpose of the Statement of Cash Flows,cash includes cash on hand, deposits held at call with banks and investments in moneymarket investments.
18
The fair value of listed fixed interest securities is taken as the bid price of the instruments.
Trade and other receivables are carried at book value, which is the best estimate of fairvalue, as they are settled within a short period.
(ii) Impairment of financial assets
A financial asset is considered to be impaired if objective evidence indicates that one or moreevents have had a negative effect on the estimated future cash flows of that asset.
An impairment loss in respect of a financial asset is calculated as the difference between itscarrying amount and the present value of the estimated future cash flows discounted at the originaleffective interest rate.
The financial assets are assessed collectively in groups that share similar risk characteristics.
Impairment losses are recognised through profit or loss.
(f) Shareholders’ fund assets
Financial assets which do not back life insurance liabilities are designated at fair value through profit andloss. Plant and equipment are initially recorded at cost and depreciated on either a straight line ordiminishing value basis over their estimated useful lives. The depreciation is charged to the profit or loss.Depreciation rates and methods are reviewed annually. When changes are made, adjustments arereflected prospectively in current and future periods only.
(g) Deferred acquisition costs
Acquisition costs relate to the fixed and variable costs incurred in acquiring new business during thefinancial year. They do not include the general growth and development costs incurred. The actualacquisition costs incurred are recorded in the Statement of Comprehensive Income.
The Appointed Actuary, in determining the life insurance contract liabilities, takes account of the deferral ofpolicy acquisition costs and assesses the value and future recovery of these costs. These deferredamounts are recognised in the Statement of Financial Position as a reduction in life insurance contractliabilities and are amortised through the Statement of Comprehensive Income over the period that they aredeemed to be recoverable. The impact of this deferral is reflected in “change in life insurance contractliabilities” in the Statement of Comprehensive Income.
The acquisition costs deferred are determined as the actual costs incurred subject to an overall limit thatthe value of future profits at inception cannot be negative. Acquisition losses are recognised at inception tothe extent the latter situation arises.
19

(h) Basis of expense apportionments
Apportionments under Part 6, Division 2 of the Life Insurance Act 1995 have been made as set out below.
Expenses are apportioned between statutory funds as follows:
• Expenses directly identifiable to a particular fund are apportioned to that fund;
• All expenses which are staff related are allocated in proportion to the estimated time involved in eachfund;
• Other expenses are allocated in proportion to appropriate cost drivers.
All expenses, excluding investment management fees which are directly identifiable, have been apportioned between policy acquisition and policy maintenance having regard to the objective when incurred. Expenses identifiable as policy acquisition, such as initial commission, have been allocated in accordance with accounts received from cedants. All other expenses have been apportioned between policy acquisition and policy maintenance according to appropriate cost drivers and an analysis of the time spent by each employee.
All expenses relate to non-participating business as the entity only writes this category of business.
(i) New standards and interpretations not yet adopted
A number of new standards, amendments to standards and interpretations are effective for annual periodsbeginning after 1 January 2017, and have not been applied in preparing this financial report. None of theseare expected to have a significant effect on the financial report of the entity, except for IFRS 9 “FinancialInstruments”, which has a mandatory effective date of 1 January 2018 and could change the classificationand measurement of financial assets. The entity does not plan to adopt this standard early and the extentof the impact has not been determined.
20
2. Critical accounting judgments and estimates
The entity makes estimates and assumptions that affect the reported amounts of assets and liabilities at year end. Estimates and judgments are continually evaluated and are based on historical experience and other factors, including expectations of future events that are believed to be reasonable under the circumstances. The areas where critical accounting estimates are applied are noted below.
(a) Life insurance contract liabilities
Life insurance contract liabilities are computed using statistical or mathematical methods, which are
expected to give approximately the same results as if an individual liability was calculated for each contract.
The computations are made by suitably qualified personnel on the basis of recognised actuarial methods,
with due regard to relevant actuarial principles. The methodology takes into account the risks and
uncertainties of the particular classes of life insurance business. Deferred policy acquisition costs are
connected with the measurement basis of life insurance contract liabilities and are equally sensitive to the
factors that are considered in the liability measurement.
The key factors that affect the estimation of these liabilities and related assets are:
(i) mortality and morbidity experience on life insurance products;
(ii) the cost of providing benefits and administering these insurance contracts; and
(iii) discontinuance experience, which affects the entity’s ability to recover the cost of acquiring new
business over the lives of the contracts.
In addition, factors such as regulation, competition, interest rates, taxes, securities market conditions and
general economic conditions affect the level of these liabilities. In some contracts, the entity shares
experience on mortality, morbidity and persistency with its customers and this can offset the impact of these
factors on profitability from those products. Details of specific actuarial policies and methods are set out in
Note 3. Details of gross life insurance contract liabilities are set out in Note 8.
(b) Reinsurers’ share of life insurance contract liabilities
Reinsurers’ share of life insurance contract liabilities is also computed using the methods in (a) above. In
addition, the recoverability of these assets is assessed on a periodic basis to ensure that the balance is
reflective of the amounts that will ultimately be received, taking into consideration factors such as
counterparty and credit risk. Impairment is recognised where there is objective evidence that the entity may
not receive amounts due to it and these amounts can be reliably measured. Details of the reinsurers’ share
of life insurance contract liabilities are set out in Note 8.
21
3. Actuarial assumptions and methods
The effective date of the actuarial report on life insurance contract liabilities and solvency reserves is 31 December2016. The actuarial report dated 15 March 2017 was prepared by Mr G. Campbell, BEc, MAS, FIAA, FNZSA. Theactuarial report indicates that Mr Campbell is satisfied as to the accuracy of the data upon which life insurancecontract liabilities have been determined.
The life insurance contract liabilities for life insurance contracts are valued in accordance with AASB 1038 “LifeInsurance Contracts”, APRA Prudential Standard LPS 340 “Valuation of Policy Liabilities”, and the relevant actuarialstandards and guidance.
The accounting standard requires that the life insurance contract liabilities equal the amount which together withfuture expected premium and investment earnings will:
(i) provide for the systematic release of planned margins as services are provided to policyholders andpremium is received; and
(ii) meet the expected payment of future benefits and expenses.
The profit carrier used for the major product groups in order to achieve the systematic release of planned margins was as follows:
Major Product Groups Profit Carrier Individual and group death and Claims disability insurance
The life insurance contract liabilities have been calculated using the methods set out below:
(i) Level premium businessWhere individual policy data was available, liabilities were calculated by projecting cash flows on eachpolicy. Otherwise, liabilities were calculated using accumulation methods.
(ii) Claims in course of paymentClaims in course of payment were calculated by projecting cash flows for each individual claim.
(iii) Other businessLiabilities for all other business were determined using accumulation methods, including allowances forrecoverable deferred acquisition expenses.
22

(a) Disclosure of assumptions
The assumptions used to value life insurance contract liabilities are best estimates of expected futureexperience determined in accordance with AASB 1038 and APRA Prudential Standard LPS 340. The keyassumptions are as follows:
(i) Discount rates
The discount rates assumed are risk free rates based on current observable objective rates that relateto the nature, structure and term of the future obligations. Discount rates assumed are:
Australian business 2016: 1.76% to 3.05% p.a. 2015: 1.85% to 2.87% p.a.
Overseas business 2016: 1.80% to 3.63% p.a. 2015: 2.54% to 3.46% p.a.
(ii) Inflation rates
Inflation rates are primarily relevant to the determination of the outstanding life insurance contractliabilities. The assumptions have been based on current inflation rates and the outlook for inflationover the term of the liabilities. The assumed inflation rates are:
Australian business 2016: 2.25% p.a. 2015: 2.5% p.a.
Overseas business 2016: 2.00% p.a. 2015: 2.2% p.a.
(iii) Future expenses
Future maintenance expenses are assumed to be a set percentage of future premium income andclaim payments. Future investment expenses have been assumed to be at the same percentage ofassets under management as currently applies.
(iv) Rates of taxation
Policy liabilities have been determined on a gross of taxation basis. The rates of taxation that apply tothe entity are shown in Note 15.
(v) Mortality and morbidity
Assumed claim rates were based on various published tables, primarily those most recently publishedby the Institute of Actuaries of Australia and the Australian Financial Services Council, adjusted in lightof recent industry experience and the entity’s own experience. For disability income claims,adjustments were made to the tabular claim termination assumptions based on the entity’s ownexperience, as follows.
Claim termination rates as percentage of tabular termination assumptions:
Australian business 2016: 50% to 400% of ADI 2007-2011 2015: 50% to 400% of ADI 2007-2011
Overseas business 2016: 80% to 140% of ADI 2007-2011 2015: 100% of ADI 2007-2011
23
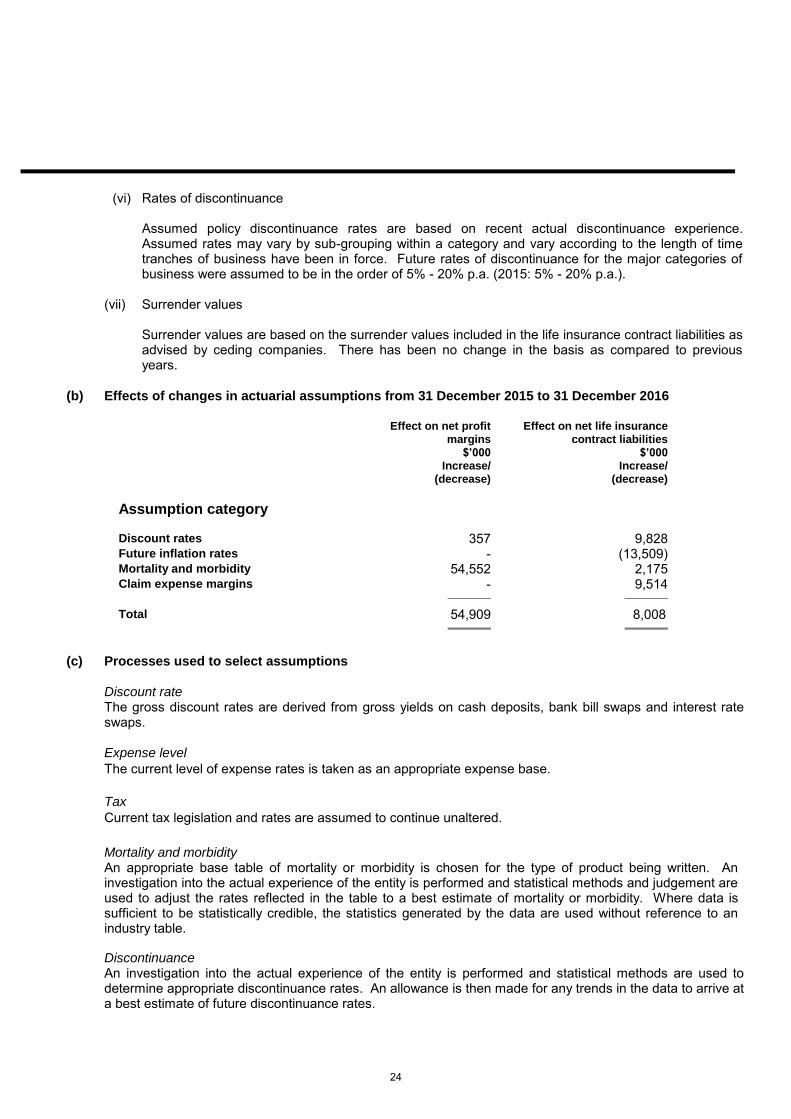
(vi) Rates of discontinuance
Assumed policy discontinuance rates are based on recent actual discontinuance experience.Assumed rates may vary by sub-grouping within a category and vary according to the length of timetranches of business have been in force. Future rates of discontinuance for the major categories ofbusiness were assumed to be in the order of 5% - 20% p.a. (2015: 5% - 20% p.a.).
(vii) Surrender values
Surrender values are based on the surrender values included in the life insurance contract liabilities asadvised by ceding companies. There has been no change in the basis as compared to previousyears.
(b) Effects of changes in actuarial assumptions from 31 December 2015 to 31 December 2016
Effect on net profit margins
$’000 Increase/
(decrease)
Effect on net life insurance contract liabilities
$’000 Increase/
(decrease)
Assumption category
Discount rates 357 9,828 Future inflation rates - (13,509) Mortality and morbidity 54,552 2,175 Claim expense margins - 9,514
_________ _________
Total 54,909 8,008 _________ _________
(c) Processes used to select assumptions
Discount rateThe gross discount rates are derived from gross yields on cash deposits, bank bill swaps and interest rateswaps.
Expense level
The current level of expense rates is taken as an appropriate expense base.
Tax
Current tax legislation and rates are assumed to continue unaltered.
Mortality and morbidityAn appropriate base table of mortality or morbidity is chosen for the type of product being written. Aninvestigation into the actual experience of the entity is performed and statistical methods and judgement areused to adjust the rates reflected in the table to a best estimate of mortality or morbidity. Where data issufficient to be statistically credible, the statistics generated by the data are used without reference to anindustry table.
DiscontinuanceAn investigation into the actual experience of the entity is performed and statistical methods are used todetermine appropriate discontinuance rates. An allowance is then made for any trends in the data to arrive ata best estimate of future discontinuance rates.
24
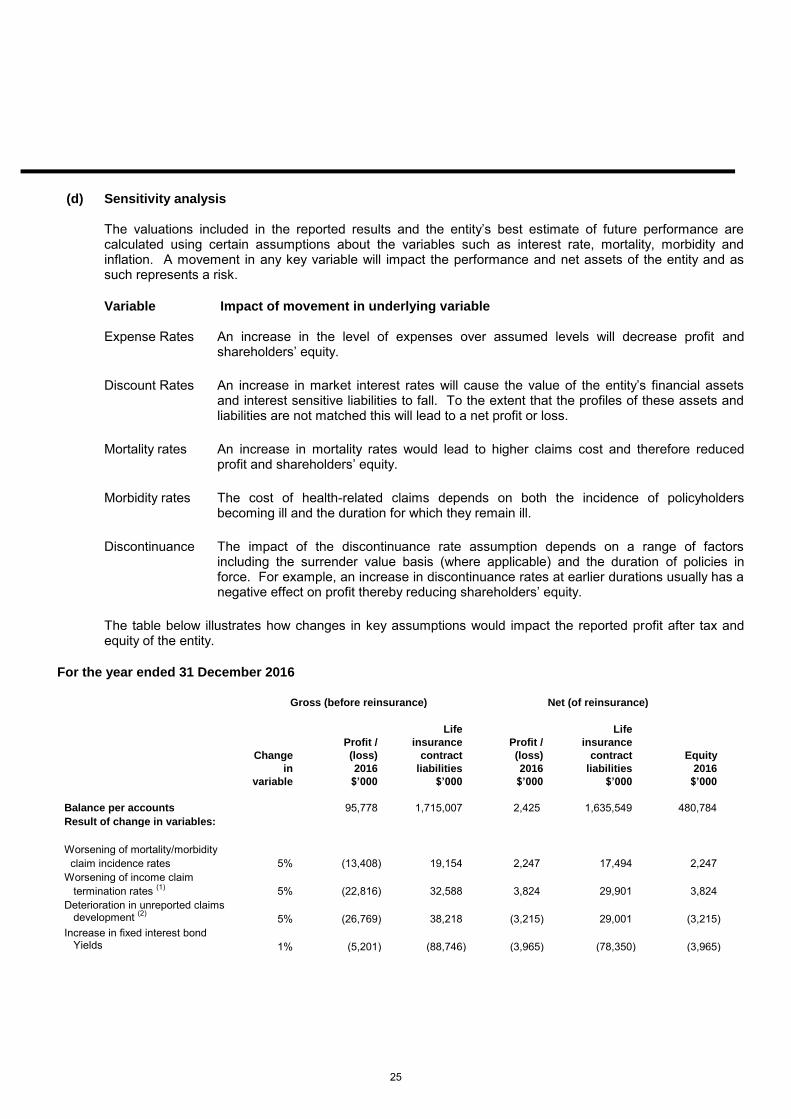
(d) Sensitivity analysis
The valuations included in the reported results and the entity’s best estimate of future performance arecalculated using certain assumptions about the variables such as interest rate, mortality, morbidity andinflation. A movement in any key variable will impact the performance and net assets of the entity and assuch represents a risk.
Variable Impact of movement in underlying variable
Expense Rates An increase in the level of expenses over assumed levels will decrease profit and shareholders’ equity.
Discount Rates An increase in market interest rates will cause the value of the entity’s financial assets and interest sensitive liabilities to fall. To the extent that the profiles of these assets and liabilities are not matched this will lead to a net profit or loss.
Mortality rates An increase in mortality rates would lead to higher claims cost and therefore reduced profit and shareholders’ equity.
Morbidity rates The cost of health-related claims depends on both the incidence of policyholders becoming ill and the duration for which they remain ill.
Discontinuance The impact of the discontinuance rate assumption depends on a range of factors including the surrender value basis (where applicable) and the duration of policies in force. For example, an increase in discontinuance rates at earlier durations usually has a negative effect on profit thereby reducing shareholders’ equity.
The table below illustrates how changes in key assumptions would impact the reported profit after tax and equity of the entity.
For the year ended 31 December 2016
Gross (before reinsurance) Net (of reinsurance)
Change
in
variable
Profit /
(loss)
2016
$’000
Life
insurance
contract
liabilities
$’000
Profit /
(loss)
2016
$’000
Life
insurance
contract
liabilities
$’000
Equity
2016
$’000
Balance per accounts 95,778 1,715,007 2,425 1,635,549 480,784
Result of change in variables:
Worsening of mortality/morbidity
claim incidence rates 5% (13,408) 19,154 2,247 17,494 2,247
Worsening of income claim
termination rates (1)
5% (22,816) 32,588 3,824 29,901 3,824
Deterioration in unreported claims development
(2) 5% (26,769) 38,218 (3,215) 29,001 (3,215)
Increase in fixed interest bond Yields 1% (5,201) (88,746) (3,965) (78,350) (3,965)
25
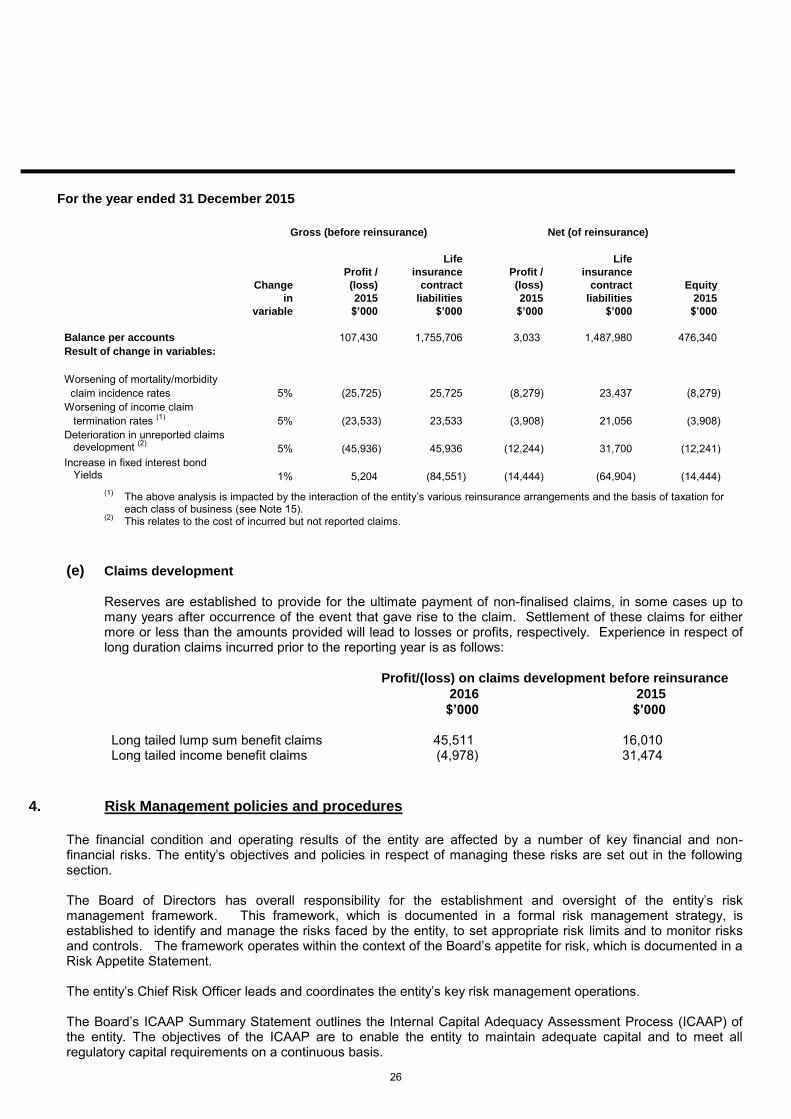
For the year ended 31 December 2015
Gross (before reinsurance) Net (of reinsurance)
Change
in
variable
Profit /
(loss)
2015
$’000
Life
insurance
contract
liabilities
$’000
Profit /
(loss)
2015
$’000
Life
insurance
contract
liabilities
$’000
Equity
2015
$’000
Balance per accounts 107,430 1,755,706 3,033 1,487,980 476,340
Result of change in variables:
Worsening of mortality/morbidity
claim incidence rates 5% (25,725) 25,725 (8,279) 23,437 (8,279)
Worsening of income claim
termination rates (1)
5% (23,533) 23,533 (3,908) 21,056 (3,908)
Deterioration in unreported claims development
(2) 5% (45,936) 45,936 (12,244) 31,700 (12,241)
Increase in fixed interest bond Yields 1% 5,204 (84,551) (14,444) (64,904) (14,444)
(1)The above analysis is impacted by the interaction of the entity’s various reinsurance arrangements and the basis of taxation foreach class of business (see Note 15).
(2)This relates to the cost of incurred but not reported claims.
(e) Claims development
Reserves are established to provide for the ultimate payment of non-finalised claims, in some cases up tomany years after occurrence of the event that gave rise to the claim. Settlement of these claims for eithermore or less than the amounts provided will lead to losses or profits, respectively. Experience in respect oflong duration claims incurred prior to the reporting year is as follows:
Profit/(loss) on claims development before reinsurance
2016
$’000
2015
$’000
Long tailed lump sum benefit claims 45,511 16,010 Long tailed income benefit claims (4,978) 31,474
4. Risk Management policies and procedures
The financial condition and operating results of the entity are affected by a number of key financial and non-financial risks. The entity’s objectives and policies in respect of managing these risks are set out in the following section.
The Board of Directors has overall responsibility for the establishment and oversight of the entity’s risk management framework. This framework, which is documented in a formal risk management strategy, is established to identify and manage the risks faced by the entity, to set appropriate risk limits and to monitor risks and controls. The framework operates within the context of the Board’s appetite for risk, which is documented in a Risk Appetite Statement.
The entity’s Chief Risk Officer leads and coordinates the entity’s key risk management operations.
The Board’s ICAAP Summary Statement outlines the Internal Capital Adequacy Assessment Process (ICAAP) of the entity. The objectives of the ICAAP are to enable the entity to maintain adequate capital and to meet all regulatory capital requirements on a continuous basis.
26
The risk management framework is reviewed at least annually and amended as required. The entity, through its training and management standards and procedures, aims to develop a disciplined and constructive control environment in which all employees understand their roles and obligations.
A sub-committee of the Board, the Risk Committee, is responsible for monitoring the entity’s risk management framework and reporting to the Board. The Committee monitors compliance and reviews the adequacy of the framework in relation to the risks faced by the entity. The Committee is assisted in its oversight role by Internal Audit. Internal Audit undertakes regular reviews and tests of risk management controls and procedures, the results of which are reported to the Committee.
(a) Risks arising from financial instruments
Credit risk
Credit risk is the risk of financial loss to the entity if a customer, outwards reinsurer or counterparty to afinancial instrument fails to meet its contractual obligations, and arises principally from the entity’sreceivables from customers, outwards reinsurance receivables and investment securities.
(i) Trade and other receivables
The entity’s exposure to credit risk is influenced by the market in which the entity operates. The largerclients of the entity, by premium revenue, are financial entities regulated by the Australian PrudentialRegulation Authority. Given this client base, management does not expect a material client to default onreceivables. The entity has not experienced credit losses on receivables.
The entity aims to limit its exposure to credit risk by only reinsuring with financial entities with strong creditratings. All of the entity’s outwards reinsurance exposures are to reinsurers that at the valuation date hada credit rating of at least A- (Standard & Poor’s). Given these high credit ratings, management does notexpect a reinsurer to fail to meet its obligations.
(ii) Investments
The entity’s Investment Guidelines, approved by the Board, contain credit rating based limits on exposureto securities and issuers. Compliance with the Investment Policy is monitored daily by the entity’sinvestment managers and reported regularly to the Investment Strategy Committee. The Committee isresponsible for setting strategy within the framework of the Investment Guidelines and reporting to theBoard on strategy, performance and compliance.
Liquidity risk
Liquidity risk is the risk that the entity will not be able to meet its financial obligations as they fall due. The entity’s approach to managing liquidity is to ensure, as far as possible, that it will always have sufficient liquidity to meet its liabilities when due, under both normal and stressed conditions, without incurring unacceptable losses or risking damage to the entity’s reputation.
The entity maintains a float of cash to meet obligations. The entity also has access to more liquid government or semi government bonds within the entity’s fixed interest portfolio, the sale proceeds of which would be available to the entity.
27

Market risk
Market risk is the risk that changes in market prices, such as interest rates and foreign exchange rates will affect the entity’s income or the value of its holdings of financial instruments. The objective of market risk management is to manage and control market risk exposures within acceptable parameters, while optimising the return on risk.
Interest rate risk
The entity has a portfolio of fixed interest security assets and a portfolio of life insurance contract liabilities. Both of these portfolios are subject to change in carrying value due to changes in interest rates. The entity manages these interest rate risks by approximately matching the duration of the fixed interest portfolio and the insurance contract liability portfolio.
Currency risk
The entity has a New Zealand branch whose assets and liabilities are denominated in New Zealand dollars. On translation of the New Zealand branch into the reporting currency (Australian dollars) of the entity, exchange rate variations on Statement of Financial Position items are recognised in a foreign currency translation reserve within equity. The entity is exposed to currency risk on the translation of Statement of Comprehensive Income items and the settlement of monetary balances between the Australian and New Zealand businesses.
(b) Insurance risks
Controls over insurance risk include the use of underwriting procedures, established processes over settingof premium rates and policy charges and regular monitoring of reinsurance arrangements. Controls are alsomaintained over claims management practices to ensure the timely payment of insurance claims inaccordance with policy obligations.
Methods to limit or transfer insurance risk exposures
(i) Outwards reinsurance
The entity’s outwards reinsurance agreements are designed to provide some protection against volatilityof profit from claims fluctuations and deteriorating experience and to provide financial support by way ofcapital relief. Outwards reinsurance treaties are analysed to assess the impact on the entity’s exposure torisk.
(ii) Underwriting procedures
The entity has formal Underwriting Guidelines which document the entity’s underwriting frameworkincluding the types of business that the entity may write, underwriting authorities and limits. The entity alsohas documented underwriting procedures for underwriting decisions. Such procedures include limits todelegated authorities and signing powers. The underwriting process is monitored by the entity’s internalauditors to assess the adequacy and effectiveness of controls over the underwriting process. Whereunderwriting authority is delegated to a cedant, the entity has a program for auditing the cedant’sunderwriting processes.
28

(iii) Claims Management
Strict claims management procedures and controls are in place to ensure the timely payment of claimsin accordance with policy conditions. The entity has in place a program to assist cedants manage theirclaim portfolios.
(iv) Pricing
The entity adopts standard pricing processes and controls. In specified circumstances, particularly forlarge or non-standard risks, advice is provided by the Appointed Actuary specific to that quotation and isconsidered by the entity.
(v) Experience analysis
Experience studies are performed at a client and product level to determine the adequacy of pricingassumptions. The results are used to determine prospective changes in pricing.
(vi) Management reporting
The entity reports quarterly financial and operational results, mortality and morbidity experience, claimsfrequency and severity, and exposure for each portfolio of contracts (gross and net of reinsurance).This information includes the entity’s gross and net results which are compared against the entity’sbusiness plan. The information is reviewed by the Executive Committee on a quarterly basis.
(vii) Concentration of insurance risk
The age profile and mix of genders within the population of policyholders is spread with the expectationthat the entity’s risk concentration in relation to any particular age group is minimal.
(c) Sensitivity to insurance risks
The nature of the terms of the life insurance contracts written is such that certain external variables can beidentified on which related cash flows for claim payments depend. The table below provides an overview ofthe key variables upon which the amount of related cash flows are dependent.
Type of contract Detail of contract
workings
Nature of
compensation for
claims
Key variables that
affect the timing and
uncertainty of future
cash flows
Non-participating life insurance contracts with fixed terms (Term Life and Disability)
Benefits paid on death or ill health that are fixed and not at the discretion of the issuer
Benefits, defined by the insurance contract, are determined by the contract and are not directly affected by the performance of underlying assets or the performance of the contracts as a whole
Mortality Morbidity Interest rates Inflation rates Discontinuance rates Expenses
29
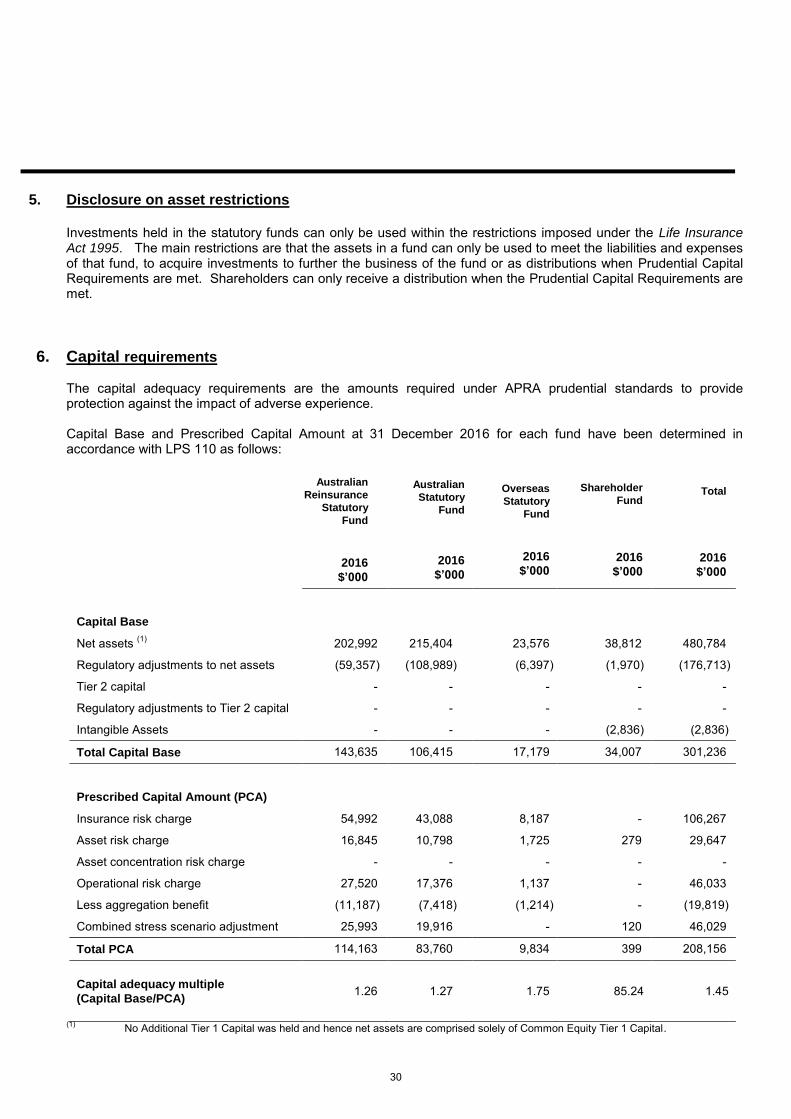
5. Disclosure on asset restrictions
Investments held in the statutory funds can only be used within the restrictions imposed under the Life InsuranceAct 1995. The main restrictions are that the assets in a fund can only be used to meet the liabilities and expensesof that fund, to acquire investments to further the business of the fund or as distributions when Prudential CapitalRequirements are met. Shareholders can only receive a distribution when the Prudential Capital Requirements aremet.
6. Capital requirements
The capital adequacy requirements are the amounts required under APRA prudential standards to provideprotection against the impact of adverse experience.
Capital Base and Prescribed Capital Amount at 31 December 2016 for each fund have been determined inaccordance with LPS 110 as follows:
Australian
Reinsurance
Statutory
Fund
2016
$’000
Australian
Statutory
Fund
2016
$’000
Overseas
Statutory
Fund
2016
$’000
Shareholder
Fund
2016
$’000
Total
2016
$’000
Capital Base
Net assets (1)
202,992 215,404 23,576 38,812 480,784
Regulatory adjustments to net assets (59,357) (108,989) (6,397) (1,970) (176,713)
Tier 2 capital - - - - -
Regulatory adjustments to Tier 2 capital - - - - -
Intangible Assets - - - (2,836) (2,836)
Total Capital Base 143,635 106,415 17,179 34,007 301,236
Prescribed Capital Amount (PCA)
Insurance risk charge 54,992 43,088 8,187 - 106,267
Asset risk charge 16,845 10,798 1,725 279 29,647
Asset concentration risk charge - - - - -
Operational risk charge 27,520 17,376 1,137 - 46,033
Less aggregation benefit (11,187) (7,418) (1,214) - (19,819)
Combined stress scenario adjustment 25,993 19,916 - 120 46,029
Total PCA 114,163 83,760 9,834 399 208,156
Capital adequacy multiple
(Capital Base/PCA) 1.26 1.27 1.75 85.24 1.45
(1)No Additional Tier 1 Capital was held and hence net assets are comprised solely of Common Equity Tier 1 Capital.
30

Capital Base and Prescribed Capital Amount at 31 December 2015 for each fund have been determined in accordance with LPS 110 as follows:
Australian
Reinsurance
Statutory
Fund
2015
$’000
Australian
Statutory
Fund
2015
$’000
Overseas
Statutory
Fund
2015
$’000
Shareholder
Fund
2015
$’000
Total
2015
$’000
Capital Base
Net assets (1)
195,130 224,972 30,454 25,784 476,340
Regulatory adjustments to net assets (73,878) (112,020) (8,519) (3,007) (197,424)
Tier 2 capital - - - - -
Regulatory adjustments to Tier 2 capital - - - - -
Total Capital Base 121,252 112,952 21,935 22,777 278,916
Prescribed Capital Amount (PCA)
Insurance risk charge 47,330 48,061 11,967 - 107,358
Asset risk charge 15,927 15,113 2,158 120 33,318
Asset concentration risk charge - - - - -
Operational risk charge 24,445 21,719 1,090 - 47,254
Less aggregation benefit (10,386) (9,988) (1,548) - (21,922)
Combined stress scenario adjustment 22,659 22,794 - 52 45,505
Total PCA 99,975 97,699 13,667 172 211,513
Capital adequacy multiple
(Capital Base/PCA) 1.21 1.16 1.60 132.35 1.32
(1)No Additional Tier 1 Capital was held and hence net assets are comprised solely of Common Equity Tier 1 Capital.
On 15 March 2017, the Company finalised changes to its outwards reinsurance arrangements with Hannover Rück SE to simplify its existing arrangements by recapturing existing surplus arrangements and restructuring its quota share arrangements with effect from 1 January 2017. The estimated increase in the Company's excess of Capital Base over Prescribed Capital Amount arising from the changes is in the range of $40 million to $60 million. As the effective date is 1 January 2017 this change has not been incorporated into the capital calculations above.
31

7. Profit and loss information
(a) Net fair value gains on financial assets at
fair value through profit or loss
Net realised gains 4,901 2,306 Net unrealised fair value (losses) (23,831) (31,213)
________ ________
(18,930) (28,907) _________ _________
(b) Other expenses
Policy acquisition costs – life insurance contracts - Net commission 49,097 31,917 - Other acquisition costs 2,422 3,981
_________ _________
Total policy acquisition costs 51,519 35,898 _________ _________
Policy maintenance costs – life insurance contracts - Net commission 199,171 187,342 - Other expenses 28,712 25,629
_________ _________
Total policy maintenance costs 227,883 212,971 _________ _________
Investment management expenses 2,043 1,823 _________ _________
Total administration expenses 281,445 250,692 __________ _________+
(c) Components of profit
Planned margin of revenues over expenses released 3,898 9,398 Difference between actual and assumed experience (4,748) (8,570) Change in valuation methods and assumptions (7,538) (2,499) Investment earnings on assets in excess of life insurance Liabilities 10,813 4,704
____________ ____________
Profit for the year 2,425 3,033 __________ __________
All of the profit is attributable to shareholder interests as the entity only writes business that is non-participating.
(d) Defined contribution plans
The entity contributes as a participating employer on a defined contribution basis to the Mercer Superannuation Trust (the default fund) and, where applicable, funds chosen by individual employees. In addition, the entity contributes the minimum pursuant to the Superannuation Guarantee Charge on behalf of Non-Executive Directors. The amount recognised as expense for all defined contribution plans was $1,628,835 for the year ended 31 December 2016 (2015: $1,389,451).
2016 $’000
2015 $’000
32
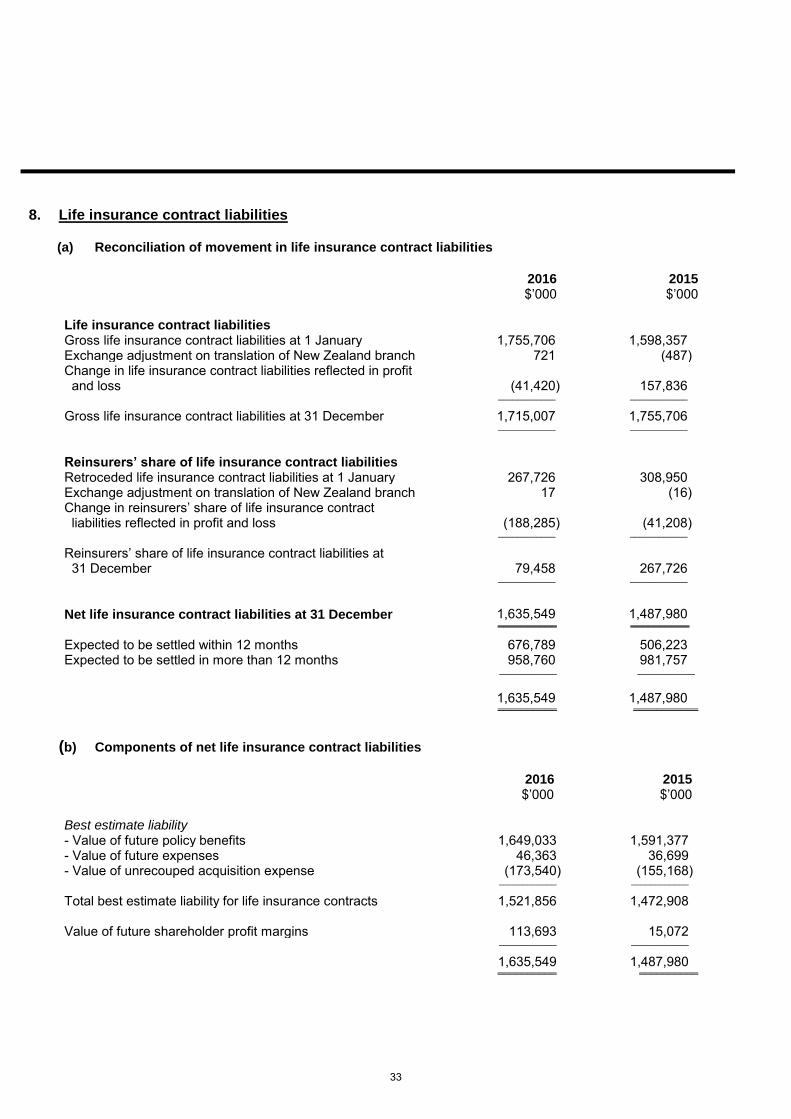
8. Life insurance contract liabilities
(a) Reconciliation of movement in life insurance contract liabilities
2016 2015 $’000 $’000
Life insurance contract liabilities Gross life insurance contract liabilities at 1 January 1,755,706 1,598,357 Exchange adjustment on translation of New Zealand branch 721 (487) Change in life insurance contract liabilities reflected in profit and loss (41,420) 157,836
____________ ____________
Gross life insurance contract liabilities at 31 December 1,715,007 1,755,706 ____________ ____________
Reinsurers’ share of life insurance contract liabilities Retroceded life insurance contract liabilities at 1 January 267,726 308,950 Exchange adjustment on translation of New Zealand branch 17 (16) Change in reinsurers’ share of life insurance contract liabilities reflected in profit and loss (188,285) (41,208)
____________ ____________
Reinsurers’ share of life insurance contract liabilities at 31 December 79,458 267,726
____________ ____________
Net life insurance contract liabilities at 31 December 1,635,549 1,487,980 __________ __________
Expected to be settled within 12 months 676,789 506,223 Expected to be settled in more than 12 months 958,760 981,757
____________ ____________
1,635,549 1,487,980 __________ ___________
(b) Components of net life insurance contract liabilities
2016 2015 $’000 $’000
Best estimate liability - Value of future policy benefits 1,649,033 1,591,377 - Value of future expenses 46,363 36,699 - Value of unrecouped acquisition expense (173,540) (155,168)
____________ ____________
Total best estimate liability for life insurance contracts 1,521,856 1,472,908
Value of future shareholder profit margins 113,693 15,072 ____________ ____________
1,635,549 1,487,980 __________ __________
33

9. Trade and other receivables
2016 $’000
2015 $’000
Outstanding premium 115,277 129,390 Investment income accrued and receivable 16,965 17,232 Insurance recoveries due from related parties 5,183 - Other receivables 3,960 2,068
____________ ____________
Total trade and other receivables 141,385 148,690 __________ __________
All trade and other receivables are current assets. The entity does not have any concerns regarding the collectability of the Outstanding Premium.
The entity’s exposure to credit and currency risks related to trade and other receivables is disclosed in Note 18.
10. Property, plant and equipment
2016 2015
Property
$’000
Fixtures,
Fittings,
Equipment and
Software $’000
Total
$’000
Property
$’000
Fixtures,
Fittings,
Equipment and
Software $’000
Total
$’000
Cost
Balance at 1 Jan 8,700 3,563 12,263 8,500 5,182 13,682 Acquisitions - 3,264 3,264 - 1,791 1,791 Disposals - (1,502) (1,502) - (3,410) (3,410) Revaluation 1,700 - 1,700 200 - 200
Balance at 31 Dec 10,400 5,325 15,725 8,700 3,563 12,263
Depreciation Balance at 1 Jan - 907 907 - 2,344 2,344 Depreciation charge for year - 1,238 1,238 - 928 928 Disposals - (562) (562) - (2,365) (2,365) Balance at 31 Dec - 1,583 1,583 - 907 907
Carrying Amounts
At 1 January 8,700 2,656 11,356 8,500 2,838 11,338 At 31 December 10,400 3,742 14,142 8,700 2,656 11,356
Depreciation Rate 0% 1-40% 0-40% 0% 1-40% 0-40%
The entity holds strata title to the property at Level 7, 70 Phillip Street Sydney. An independent valuation of the property was carried out on 31 December 2016 by Mr R Lawrie and Mr N Guo of the firm Jones Lang LaSalle Advisory Services Pty Limited and is based on the open market value of the property. The property was valued at $10.4m (2015: $8.7m). Movements in the valuation of the property are included in Other Comprehensive Income.
34
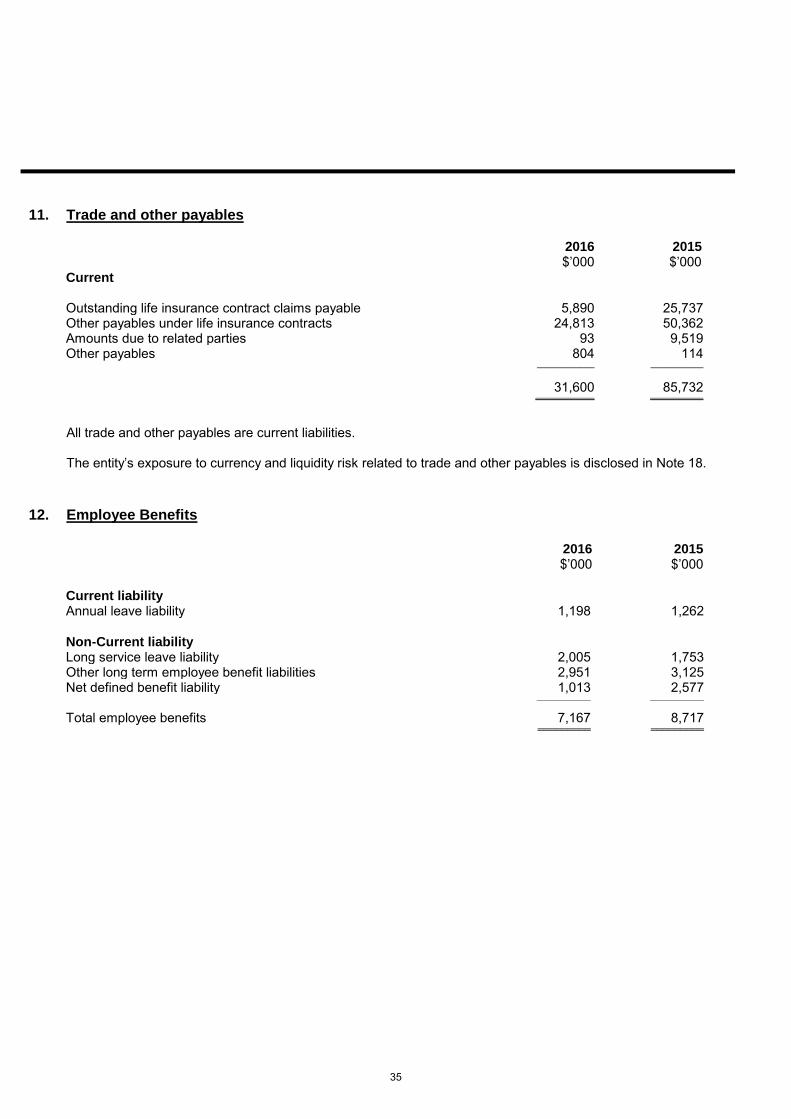
11. Trade and other payables
2016 $’000
2015 $’000
Current
Outstanding life insurance contract claims payable 5,890 25,737 Other payables under life insurance contracts 24,813 50,362 Amounts due to related parties 93 9,519 Other payables 804 114
____________ ___________
31,600 85,732 __________ _________
All trade and other payables are current liabilities.
The entity’s exposure to currency and liquidity risk related to trade and other payables is disclosed in Note 18.
12. Employee Benefits
2016 2015 $’000 $’000
Current liability Annual leave liability 1,198 1,262
Non-Current liability Long service leave liability 2,005 1,753 Other long term employee benefit liabilities 2,951 3,125 Net defined benefit liability 1,013 2,577
_____________ _____________
Total employee benefits 7,167 8,717 _________ _________
35
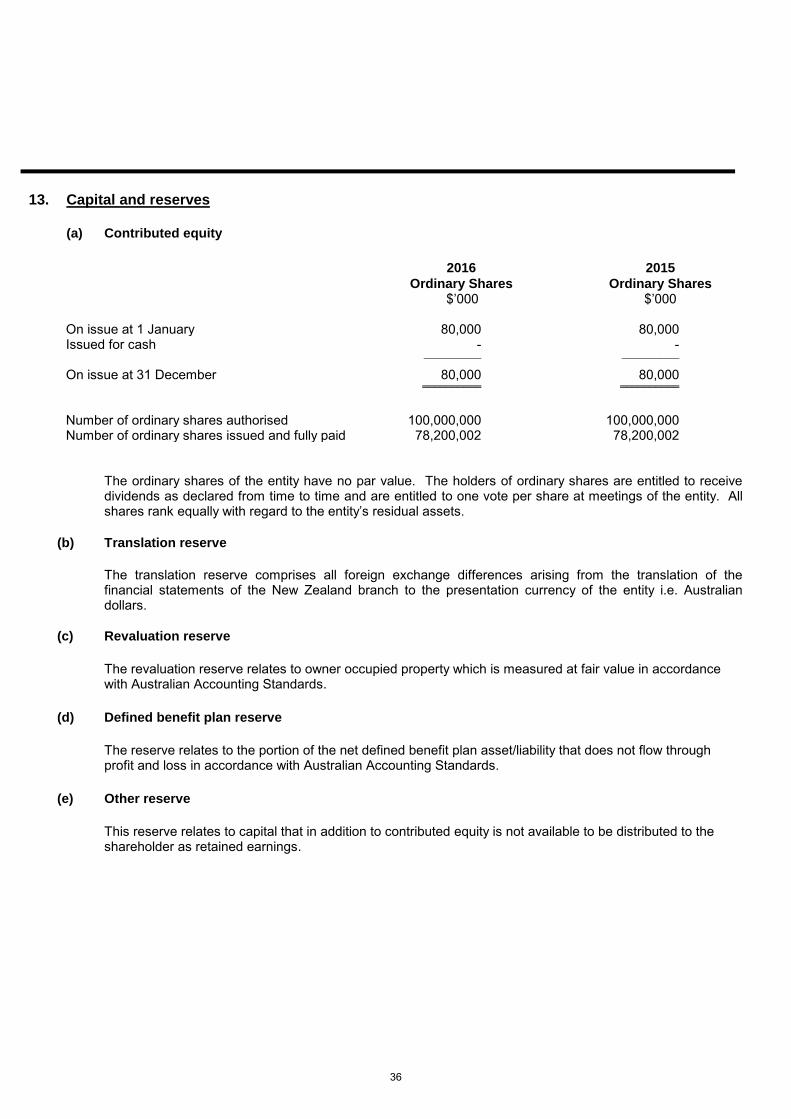
13. Capital and reserves
(a) Contributed equity
2016
Ordinary Shares $’000
2015
Ordinary Shares $’000
On issue at 1 January 80,000 80,000 Issued for cash - -
____________ ____________
On issue at 31 December 80,000 80,000 __________ __________
Number of ordinary shares authorised 100,000,000 100,000,000 Number of ordinary shares issued and fully paid 78,200,002 78,200,002
The ordinary shares of the entity have no par value. The holders of ordinary shares are entitled to receive dividends as declared from time to time and are entitled to one vote per share at meetings of the entity. All shares rank equally with regard to the entity’s residual assets.
(b) Translation reserve
The translation reserve comprises all foreign exchange differences arising from the translation of thefinancial statements of the New Zealand branch to the presentation currency of the entity i.e. Australiandollars.
(c) Revaluation reserve
The revaluation reserve relates to owner occupied property which is measured at fair value in accordancewith Australian Accounting Standards.
(d) Defined benefit plan reserve
The reserve relates to the portion of the net defined benefit plan asset/liability that does not flow throughprofit and loss in accordance with Australian Accounting Standards.
(e) Other reserve
This reserve relates to capital that in addition to contributed equity is not available to be distributed to theshareholder as retained earnings.
36

14. Disaggregated information of life insurance business by fund
2016
Australian
Statutory
Fund
Australian
Reinsurance
Statutory Fund
Overseas
Statutory
Fund
Shareholders’
Fund
Total
$’000 $’000 $’000 $'000 $'000
Financial assets 407,886 1,371,764 63,138 15,194 1,857,982
Other assets 78,539 211,307 7,920 36,169 333,935
Reinsurers’ share of life insurance contract liabilities
9,426 69,419 613 - 79,458
Life insurance contract liabilities assumed
232,751 1,450,151 32,105 - 1,715,007
Other liabilities 47,696 (653) 15,991 12,551 75,585
Retained earnings 118,689 163,505 18,386 37,085 337,665
Premium revenue 463,154 515,539 34,404 - 1,013,097
Investment revenue 14,363 42,721 1,538 439 59,061
Claims expense (314,489) (319,461) (21,929) - (655,879)
Other operating expenses (218,547) (57,241) (5,640) (17) (281,445)
Operating profit/(loss) before tax 21,830 (4,825) 4,060 429 21,494
Operating profit/(loss) after tax 5,356 (3,325) 365 29 2,425
Note: The Retained Earnings reported above are after the transfer of retained profits between the Statutory Funds and the Shareholder Fund (refer Note 25 Events occurring after balance date).
2015
Australian
Statutory
Fund
Australian
Reinsurance
Statutory Fund
Overseas
Statutory
Fund
Shareholders’
Fund
Total
$’000 $’000 $’000 $'000 $'000
Financial assets 420,393 1,255,849 61,599 9,177 1,747,018
Other assets 120,747 197,032 8,123 20,503 346,405
Reinsurers’ share of life insurance contract liabilities
170,467 96,522 737 - 267,726
Life insurance contract liabilities assumed
419,457 1,307,978 28,271 - 1,755,706
Other liabilities 67,179 46,295 11,733 3,896 129,103
Retained earnings 128,333 156,830 26,021 24,056 335,240
Premium revenue 724,005 494,477 30,959 - 1,249,441
Investment revenue 10,630 32,081 3,205 402 46,318
Claims expense (405,626) (280,763) (21,203) - (707,592)
Other operating expenses (190,014) (54,181) (5,796) (701) (250,692)
Operating profit before tax 17,807 (19,817) 4,667 (298) 2,360
Operating profit after tax 12,466 (13,872) 4,648 (209) 3,033
37
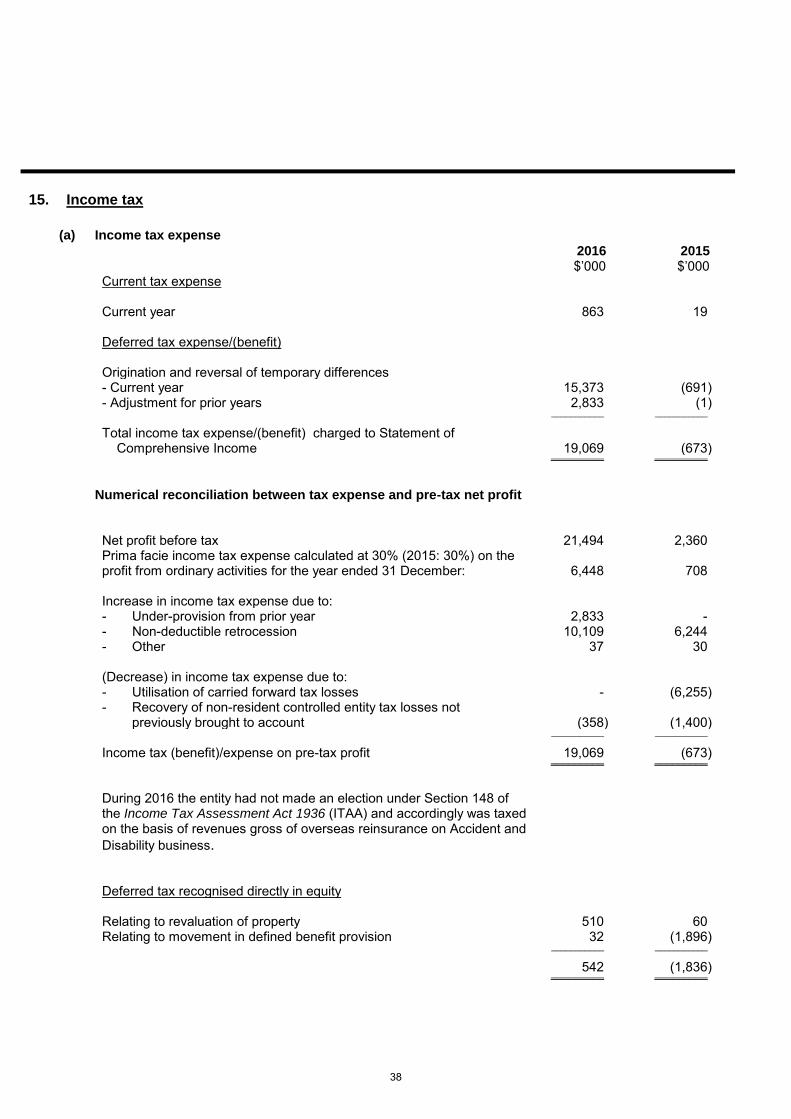
15. Income tax
(a) Income tax expense
2016 $’000
2015 $’000
Current tax expense
Current year 863 19
Deferred tax expense/(benefit)
Origination and reversal of temporary differences - Current year- Adjustment for prior years
15,373 2,833
(691) (1)
___________ ___________
Total income tax expense/(benefit) charged to Statement of Comprehensive Income 19,069 (673)
_________ _________
Numerical reconciliation between tax expense and pre-tax net profit
Net profit before tax 21,494 2,360 Prima facie income tax expense calculated at 30% (2015: 30%) on the profit from ordinary activities for the year ended 31 December: 6,448 708
Increase in income tax expense due to: - Under-provision from prior year 2,833 - - Non-deductible retrocession 10,109 6,244 - Other 37 30
(Decrease) in income tax expense due to: - Utilisation of carried forward tax losses - (6,255)- Recovery of non-resident controlled entity tax losses not
previously brought to account (358) (1,400)___________ ___________
Income tax (benefit)/expense on pre-tax profit 19,069 (673) _________ _________
During 2016 the entity had not made an election under Section 148 of the Income Tax Assessment Act 1936 (ITAA) and accordingly was taxed on the basis of revenues gross of overseas reinsurance on Accident and
Disability business.
Deferred tax recognised directly in equity
Relating to revaluation of property 510 60 Relating to movement in defined benefit provision 32 (1,896)
___________ ___________
542 (1,836) _________ _________
38

15. Income tax (continued)
(b) Recognised deferred tax (assets) and liabilities
Assets Liabilities Net Tax Asset
2016 2015 2016 2015 2016 2015 $’000 $’000 $’000 $’000 $’000 $’000
Property, plant & equipment 1,921 1,411 - - 1,921 1,411
Employee benefits (2,150) (2,614) - - (2,150) (2,614)
Life insurance contract liabilities (28,865) (21,165) 2,906 - (25,959) (21,165)
Other items 179 176 - - 179 176
Tax value of loss carry-forward recognised (34,778) (57,416) - - (34,778) (57,416)
___________ ___________ ___________ ___________ ___________ ___________
Net tax (assets)/liabilities (63,693) (79,608) 2,906 - (60,787) (79,608) ________ ________ ________ ________ ________ _________
(c) Movements in temporary differences during the year
Balance
1 Jan 2016
Recognised
in Income
Recognised
in Equity
Balance
31 Dec 2016 $’000 $’000 $’000 $’000
Property, plant & equipment 1,411 - 510 1,921
Employee benefits (2,614) 432 32 (2,150)
Life insurance contract liabilities (21,165) (4,794) - (25,959)
Other items 176 3 - 179
Tax value of loss carry-forward recognised (57,416) 22,638 - (34,778)
____________ ____________ ___________ ____________
(79,608) 18,279 542 (60,787) _________ _________ ________ _________
Balance
1 Jan 2015
Recognised
in Income
Recognised
in Equity
Balance
31 Dec 2015 $’000 $’000 $’000 $’000
Property, plant & equipment 1,351 - 60 1,411
Employee benefits (2,385) 1,667 (1,896) (2,614)
Life insurance contract liabilities (24,792) 3,627 - (21,165)
Other items Tax value of loss carry-forward recognised
104 (51,359)
72 (6,057)
- -
176 (57,416)
____________ ____________ ___________ ____________
(77,081) (691) (1,836) (79,608) _________ _________ ________ _________
39
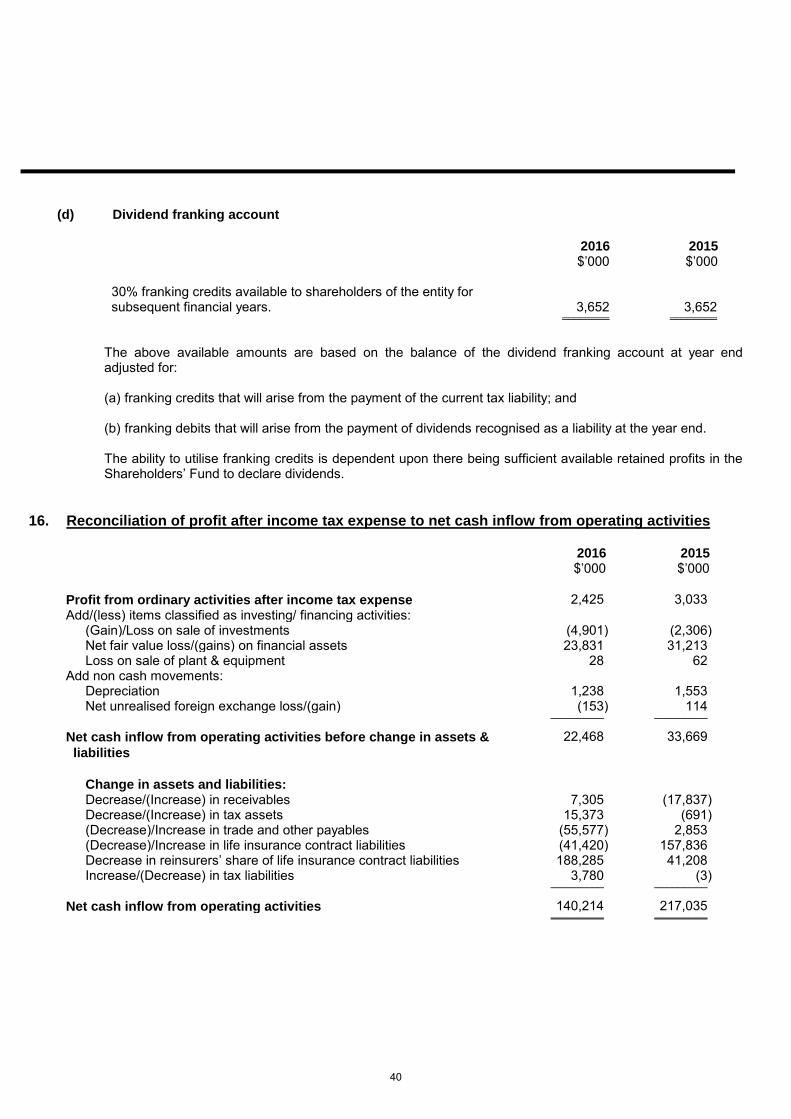
(d) Dividend franking account
2016 $’000
2015 $’000
30% franking credits available to shareholders of the entity for subsequent financial years. 3,652 3,652
________ ________
The above available amounts are based on the balance of the dividend franking account at year end adjusted for:
(a) franking credits that will arise from the payment of the current tax liability; and
(b) franking debits that will arise from the payment of dividends recognised as a liability at the year end.
The ability to utilise franking credits is dependent upon there being sufficient available retained profits in the Shareholders’ Fund to declare dividends.
16. Reconciliation of profit after income tax expense to net cash inflow from operating activities
2016 2015 $’000 $’000
Profit from ordinary activities after income tax expense 2,425 3,033
Add/(less) items classified as investing/ financing activities: (Gain)/Loss on sale of investments (4,901) (2,306) Net fair value loss/(gains) on financial assets 23,831 31,213 Loss on sale of plant & equipment 28 62
Add non cash movements: Depreciation 1,238 1,553 Net unrealised foreign exchange loss/(gain) (153) 114
_________ _________
Net cash inflow from operating activities before change in assets &
liabilities
22,468 33,669
Change in assets and liabilities: Decrease/(Increase) in receivables 7,305 (17,837) Decrease/(Increase) in tax assets 15,373 (691) (Decrease)/Increase in trade and other payables (55,577) 2,853 (Decrease)/Increase in life insurance contract liabilities (41,420) 157,836 Decrease in reinsurers’ share of life insurance contract liabilities 188,285 41,208 Increase/(Decrease) in tax liabilities 3,780 (3)
_________ _________
Net cash inflow from operating activities 140,214 217,035 _________ _________
40
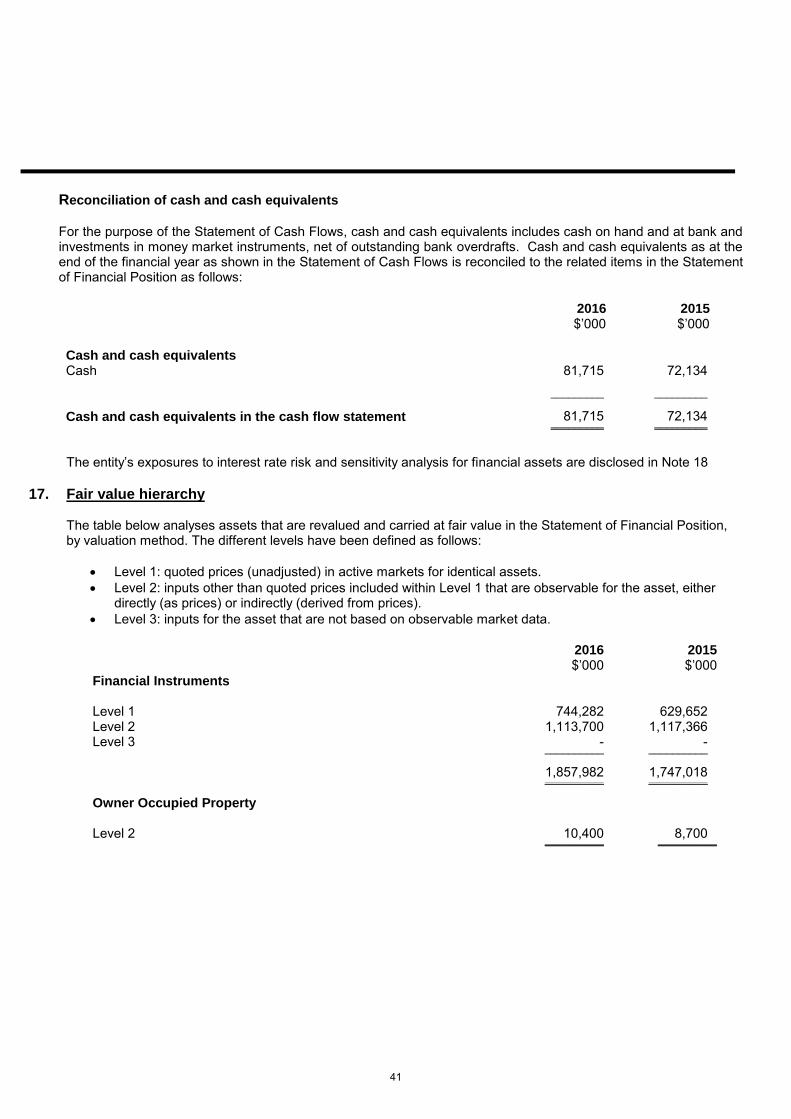
Reconciliation of cash and cash equivalents
For the purpose of the Statement of Cash Flows, cash and cash equivalents includes cash on hand and at bank and investments in money market instruments, net of outstanding bank overdrafts. Cash and cash equivalents as at the end of the financial year as shown in the Statement of Cash Flows is reconciled to the related items in the Statement of Financial Position as follows:
2016 2015 $’000 $’000
Cash and cash equivalents Cash 81,715 72,134
_________ _________
Cash and cash equivalents in the cash flow statement 81,715 72,134 _________ _________
The entity’s exposures to interest rate risk and sensitivity analysis for financial assets are disclosed in Note 18
17. Fair value hierarchy
The table below analyses assets that are revalued and carried at fair value in the Statement of Financial Position,by valuation method. The different levels have been defined as follows:
Level 1: quoted prices (unadjusted) in active markets for identical assets.
Level 2: inputs other than quoted prices included within Level 1 that are observable for the asset, eitherdirectly (as prices) or indirectly (derived from prices).
Level 3: inputs for the asset that are not based on observable market data.
2016 2015 $’000 $’000
Financial Instruments
Level 1 744,282 629,652 Level 2 1,113,700 1,117,366 Level 3 - -
__________ __________
1,857,982 1,747,018 __________ __________
Owner Occupied Property
Level 2 10,400 8,700 __________ __________
41
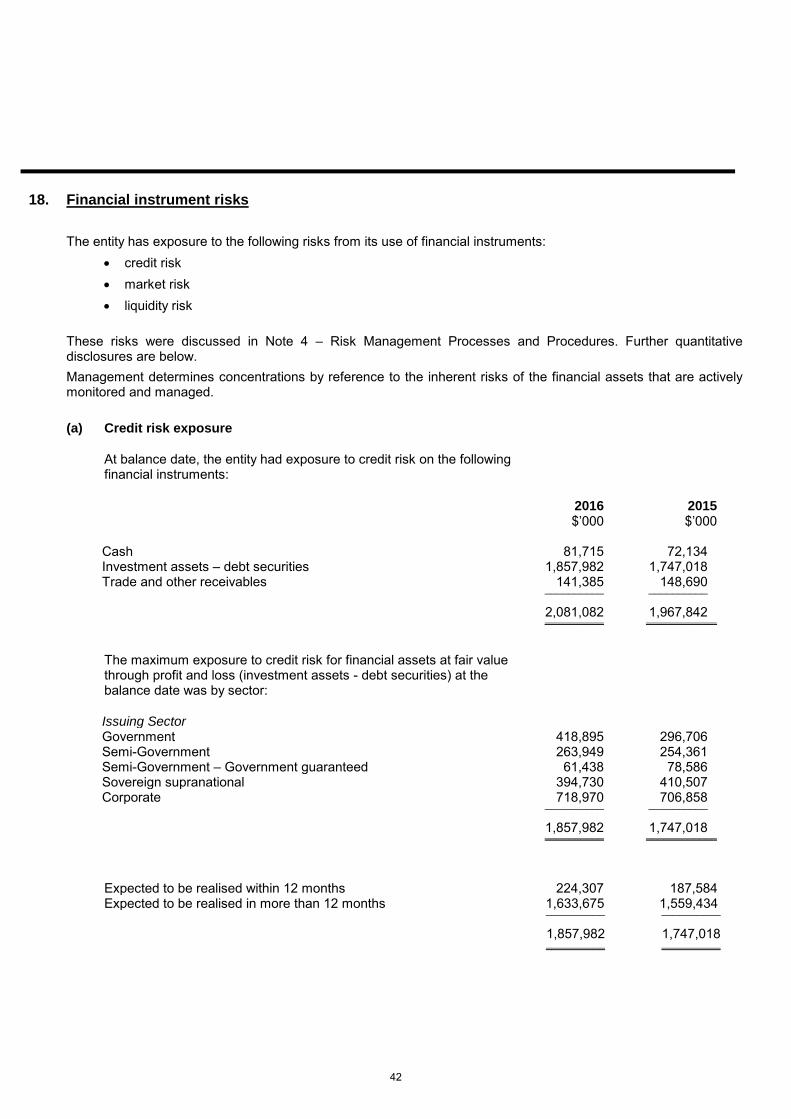
18. Financial instrument risks
The entity has exposure to the following risks from its use of financial instruments:
credit risk
market risk
liquidity risk
These risks were discussed in Note 4 – Risk Management Processes and Procedures. Further quantitative disclosures are below.
Management determines concentrations by reference to the inherent risks of the financial assets that are actively monitored and managed.
(a) Credit risk exposure
At balance date, the entity had exposure to credit risk on the followingfinancial instruments:
2016 2015 $’000 $’000
Cash 81,715 72,134 Investment assets – debt securities 1,857,982 1,747,018 Trade and other receivables 141,385 148,690
__________ __________
2,081,082 1,967,842 __________ ____________
The maximum exposure to credit risk for financial assets at fair value through profit and loss (investment assets - debt securities) at the balance date was by sector:
Issuing Sector Government 418,895 296,706 Semi-Government 263,949 254,361 Semi-Government – Government guaranteed 61,438 78,586 Sovereign supranational 394,730 410,507 Corporate 718,970 706,858
__________ __________
1,857,982 1,747,018 __________ ____________
Expected to be realised within 12 months 224,307 187,584 Expected to be realised in more than 12 months 1,633,675 1,559,434
__________ __________
1,857,982 1,747,018 __________ __________
42

2016 2015 $’000 $’000
The maximum exposure to credit risk for financial assets at fair value through profit and loss (investment assets - debt securities) at the balance date was by rating:
Rating of Issuer
AAA 1,060,193 944,829 AA 450,623 454,300 A 285,603 268,005 BBB 61,563 79,884
__________ __________
1,857,982 1,747,018 __________ __________
(b) Market risk sensitivity
The entity has sensitivity to the following market risks:(i) Interest rate risk
At balance date the entity held the following interest sensitivefinancial instruments:
Investment assets – debt securities 1,857,982__________
1,747,018__________
A change of 100 basis points in interest rates at balance date would have increased/(decreased) equity and profit/(loss) by the amounts shown below.
- plus 100 basis points - (decrease) profit and equity by (91,041) (76,859) - minus 100 basis points - increase profit and equity by 100,331
__________83,520
__________
(ii) Currency risk
The entity has a New Zealand branch whose financial assets and liabilities are denominated in NewZealand dollars (NZD). On translation of the financial assets and liabilities into the reporting currency ofthe entity (Australian dollars), exchange rate variations are recognised in a foreign currency translationreserve within equity.
$’000 NZD
$’000 NZD
At the balance date the entity’s exposure to foreign currency risk was as follows based on notional amounts:
Total assets denominated in New Zealand dollars 74,504 75,068 Total liabilities denominated in New Zealand dollars 41,705
________34,146
________
43
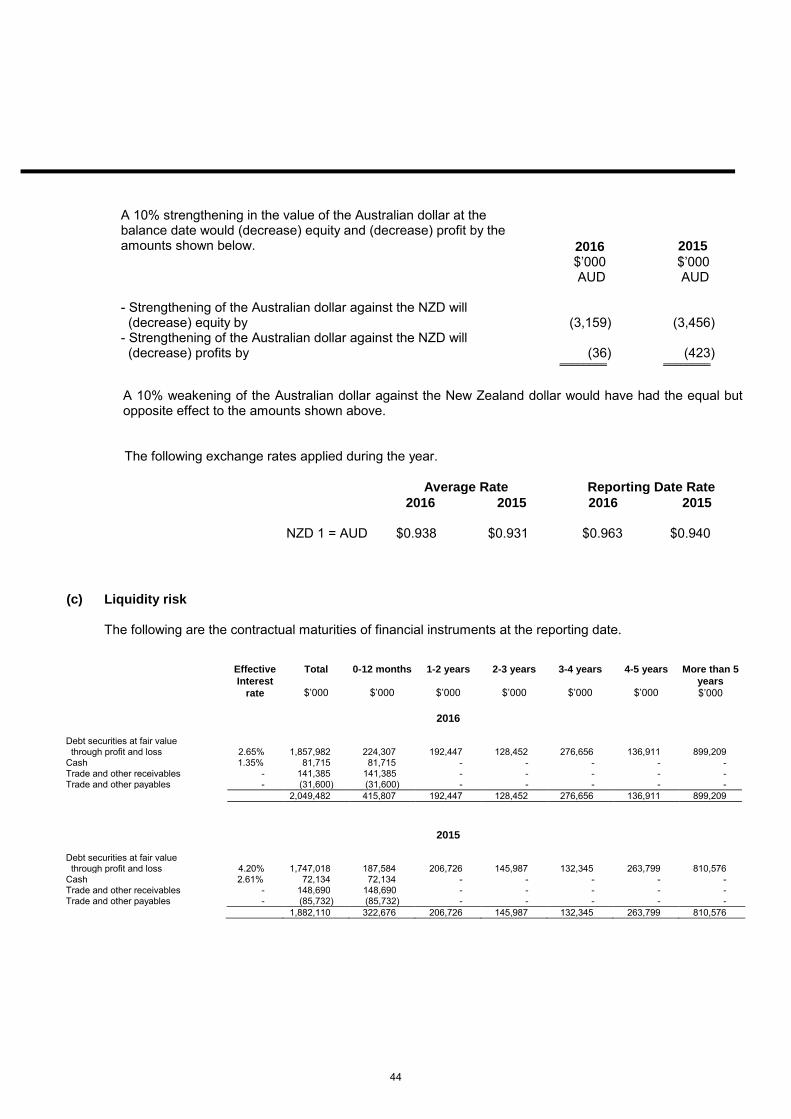
A 10% strengthening in the value of the Australian dollar at the balance date would (decrease) equity and (decrease) profit by the amounts shown below. 2016 2015
$’000 AUD
$’000 AUD
- Strengthening of the Australian dollar against the NZD will(decrease) equity by (3,159) (3,456)
- Strengthening of the Australian dollar against the NZD will(decrease) profits by (36)
________(423)
________
A 10% weakening of the Australian dollar against the New Zealand dollar would have had the equal but opposite effect to the amounts shown above.
The following exchange rates applied during the year.
Average Rate Reporting Date Rate
2016 2015 2016 2015
NZD 1 = AUD $0.938 $0.931 $0.963 $0.940
(c) Liquidity risk
The following are the contractual maturities of financial instruments at the reporting date.
Effective
Interest
rate
Total
$’000
0-12 months
$’000
1-2 years
$’000
2-3 years
$’000
3-4 years
$’000
4-5 years
$’000
More than 5
years
$’000
2016
Debt securities at fair value through profit and loss 2.65% 1,857,982 224,307 192,447 128,452 276,656 136,911 899,209 Cash 1.35% 81,715 81,715 - - - - - Trade and other receivables - 141,385 141,385 - - - - - Trade and other payables - (31,600) (31,600) - - - - -
2,049,482 415,807 192,447 128,452 276,656 136,911 899,209
2015
Debt securities at fair value through profit and loss 4.20% 1,747,018 187,584 206,726 145,987 132,345 263,799 810,576 Cash 2.61% 72,134 72,134 - - - - - Trade and other receivables - 148,690 148,690 - - - - - Trade and other payables - (85,732) (85,732) - - - - -
1,882,110 322,676 206,726 145,987 132,345 263,799 810,576
44

19. Operating leases
Leases as Lessee
Non-cancellable operating leases contracted for but not capitalised in the financial statements:
2016 2015 $’000 $’000
Payable – minimum lease payments - not later than 12 months 297 242 - between 12 months and 5 years 122 359 - greater than 5 years - -
__________ __________
Total 419 601 __________ __________
20. Defined Benefit Plan
(a) Plan characteristics
The entity makes contributions to a defined benefit plan (the Plan) that provides retirement, death andinvalidity benefits to members based on the member’s salary and years of service. The Plan provides anindexed pension benefit on retirement. Part or all the pension benefit may be converted to an account basedpension or with the approval of the Plan trustees, the pension benefit may be commuted to a lump sum.
The Plan is a sub account of the Mercer Superannuation Trust (MST). The entity is the Principal Employer ofthe Plan.
(b) Defined benefit plan obligations and assets
The cost of the defined benefit obligation is recognised in the profit or loss and other comprehensive income(OCI). Member service costs and interest on the net defined benefit plan obligation are recognised in profit orloss. Remeasurements, being actuarial gains and losses, and differences between expected net interestincome and the actual return are recognised in OCI.
The defined benefit obligation of the Plan as at 31 December 2016 was $4,882,000 (2015: $6,179,000). Theassets of the Plan are invested in unit linked products within MST. The assets of the Plan as at 31 December2016 were $3,869,000 (2015: $3,602,000). The net defined benefit liability at this date was $ 1,013,000(2015: $2,577,000).
45

21. Auditor's remuneration
2016 $
2015 $
Audit Services: Auditors of the entity – KPMG
Audit and review of the financial reports 320,663 320,663 Other regulatory audit services 32,500 32,500
____________ _____________
353,163 353,163 _________ _________
Other Services: Auditors of the entity – KPMG
Taxation services 33,715 22,000 Other consulting 29,717 111,378
____________ ____________
63,432 133,378 _________ _________
22. Directors’ and Executive disclosures (key management personnel)
The following were specified Directors and Executives of Hannover Life Re of Australasia Ltd for the entire reporting period, unless otherwise stated.
Non-Executive Independent
Directors
Non-Executive Non-Independent
Directors
Executive Directors
Mr P. R. Gaydon (appointed 1 July 2016)
Mr C. J. Chèvre (Deputy Chairman) Gerd Obertopp
Mr R.J. Atfield (resigned 1 December 2016)
Mr U. Wallin
Ms E. G. Payne Mr S. R. Swil
Executive Management
Mr Gerd Obertopp (Managing Director) Mr Graeme Campbell (Appointed Actuary) Ms Moira De Villiers (Assistant General Manager (Products, Marketing & Pricing) Mr Thomas Grogan (General Manager – Marketing) Mr David Tallack (General Manager – Finance and Company Secretary)
In addition to their salaries, the entity contributes to post employment benefit plans on behalf of the entity’s Australian resident Non-Executive Directors and Executive Management.
46
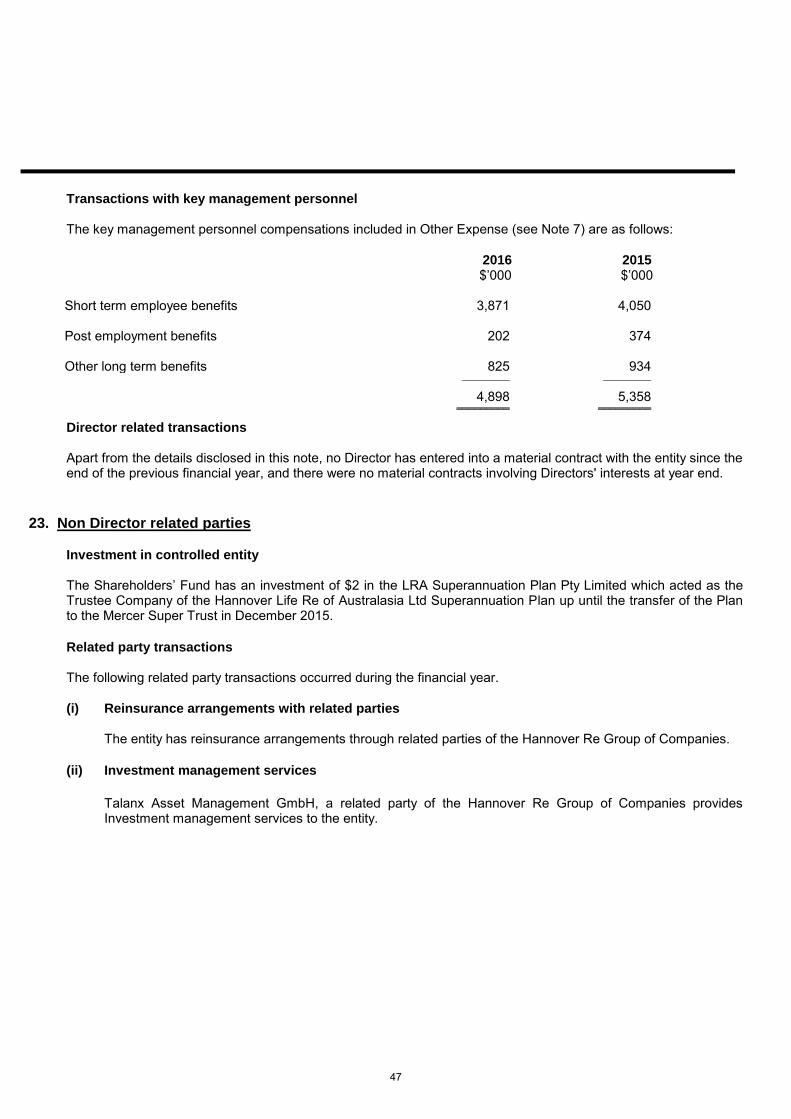
Transactions with key management personnel
The key management personnel compensations included in Other Expense (see Note 7) are as follows:
2016 $’000
2015 $’000
Short term employee benefits 3,871 4,050
Post employment benefits 202 374
Other long term benefits 825 934 __________ __________
4,898 5,358 _________ _________
Director related transactions
Apart from the details disclosed in this note, no Director has entered into a material contract with the entity since the end of the previous financial year, and there were no material contracts involving Directors' interests at year end.
23. Non Director related parties
Investment in controlled entity
The Shareholders’ Fund has an investment of $2 in the LRA Superannuation Plan Pty Limited which acted as the Trustee Company of the Hannover Life Re of Australasia Ltd Superannuation Plan up until the transfer of the Plan to the Mercer Super Trust in December 2015.
Related party transactions
The following related party transactions occurred during the financial year.
(i) Reinsurance arrangements with related parties
The entity has reinsurance arrangements through related parties of the Hannover Re Group of Companies.
(ii) Investment management services
Talanx Asset Management GmbH, a related party of the Hannover Re Group of Companies providesInvestment management services to the entity.
47
(iii) Transactions with related parties
The value of transactions during the year with related parties and the aggregate amounts receivable fromand payable to related parties are as follows:
2016 2015 $’000 $’000
Transactions during the year
Outwards reinsurance expenses (446,378) (465,731) Reinsurance recoveries 418,313 393,951 Other recoveries including commission 2,614 5,789 Investment management fees 1,996 1,758
_________ _________
Creditors – Current Amounts due to related parties 94 9,519
_________ _________
Debtors – Current Amounts due from related parties 5,183 -
_________ _________
All transactions with related parties were conducted at arm’s length. All outstanding balances are due and payable on normal terms of credit.
Parent entities
The immediate parent entity is Hannover Life Re AG, a wholly owned subsidiary of Hannover Rück SE. The ultimate parent entity is Haftpflichtverband der Deutschen Industrie V.a.G. (HDI). These parent entities are incorporated in Germany and have their headquarters in Hannover, Germany.
24. Reconciliation of reported results with Life Act results
In respect of the entity’s life insurance contracts business, there are no differences between the valuationrequirements adopted as per relevant accounting standards in these financial statements and those of the LifeInsurance Act 1995. Consequently the entity’s profit and retained profits reported in these financial statements arethe same under the Life Insurance Act 1995.
25. Events occurring after balance date
At a meeting of the Board of Directors on 15 March 2017, the Board approved the following transfers of retainedprofits between statutory funds and the Shareholder Fund with an effective date of 31 December 2016. Thesetransfers are reflected in Note 14 Disaggregated information of life insurance business by statutory fund.
Shareholders Fund to Australian Reinsurance Statutory Fund $ 10,000,000 Australian Statutory Fund to Shareholder Fund $ 15,000,000 Overseas Statutory Fund to Shareholder Fund $ 8,000,000
On 15 March 2017, the Company finalised changes to its outwards reinsurance arrangements with Hannover Rück SE to simplify its existing arrangements by recapturing existing surplus arrangements and restructuring its quota share arrangements with effect from 1 January 2017. The estimated increase in the Company's excess of Capital Base over Prescribed Capital Amount arising from the changes is in the range of $40 million to $60 million. As the effective date is 1 January 2017, these changes are not reflected in the financial statements.
The Board of Directors have not become aware of any other matter or circumstance that is likely to affect the operation or the state of affairs of the entity in subsequent financial statements.
48
Directors’ Declaration
For the Year Ended 31 December 2016
1 In the opinion of the directors of Hannover Life Re of Australasia Ltd (the Company):
(a) the financial statements and notes are in accordance with the Corporations Act 2001, including:
(i) giving a true and fair view of the Company’s financial position as at 31 December 2016 and
of its performance for the financial year ended on that date; and
(ii) complying with Australian Accounting Standards and the Corporations Regulations 2001;
and
(b) there are reasonable grounds to believe that the Company will be able to pay its debts as and
when they become due and payable.
2 The directors draw attention to Note 1a to the financial statements, which includes a statement of
compliance with International Financial Reporting Standards.
Signed in accordance with a resolution of the directors:
Peter Gaydon Sydney
Chairman 15 March 2017
49
50
KPMG, an Australian partnership and a member firm of the KPMG network of independent member firms affiliated with KPMG International Cooperative (“KPMG International”), a Swiss
tit
Liability limited by a scheme approved under Professional Standards Legislation.
Independent Auditor’s Report
To the members of Hannover Life Re of Australasia Ltd
Report on the audit of the Financial Report
Opinion
We have audited the Financial Report of Hannover Life Re of Australasia Ltd (“the Company”).
In our opinion, the accompanying Financial Report of the Company is in accordance with the Corporations Act 2001, including:
• giving a true and fair view of the Company’s financial position as at 31 December 2016 and of its financial performance for the year ended on that date; and
• complying with Australian Accounting Standards and the Corporations Regulations 2001.
The Financial Report comprises: • Statement of financial position as at
31 December 2016
• Statement of comprehensive income, Statement of changes in equity, and Statement of cash flows for the year then ended
• Notes including a summary of significant accounting policies
• Directors’ Declaration.
Basis for opinion
We conducted our audit in accordance with Australian Auditing Standards. We believe that the audit evidence we have obtained is sufficient and appropriate to provide a basis for our opinion.
Our responsibilities under those standards are further described in the Auditor’s responsibilities for the audit of the Financial Report section of our report.
We are independent of the Company in accordance with the Corporations Act 2001 and the ethical requirements of the Accounting Professional and Ethical Standards Board’s APES 110 Code of Ethics for Professional Accountants (the Code) that are relevant to our audit of the Financial Report in Australia. We have fulfilled our other ethical responsibilities in accordance with the Code.
51
Other Information
Other Information is financial and non-financial information in Hannover Life Re of Australasia Ltd’s annual reporting which is provided in addition to the Financial Report and the Auditor’s Report. This includes the Directors’ Report and the Corporate Governance Statement. The Directors are responsible for the Other Information.
Our opinion on the Financial Report does not cover the Other Information and, accordingly, the auditor does not express any form of assurance conclusion thereon.
In connection with our audit of the Financial Report, our responsibility is to read the Other Information. In doing so, we consider whether the Other Information is materially inconsistent with the Financial Report or our knowledge obtained in the audit, or otherwise appears to be materially misstated.
We are required to report if we conclude that there is a material misstatement of this Other Information, and based on the work we have performed on the Other Information that we obtained prior to the date of this Auditor’s Report we have nothing to report.
Responsibilities of the Directors for the Financial Report
The Directors are responsible for:
• preparing the Financial Report that gives a true and fair view in accordance with Australian Accounting Standards and the Corporations Act 2001
• implementing necessary internal control to enable the preparation of a Financial Report that gives a true and fair view and is free from material misstatement, whether due to fraud or error
• assessing the Company’s ability to continue as a going concern. This includes disclosing, as applicable, matters related to going concern and using the going concern basis of accounting unless they either intend to liquidate the Company or to cease operations, or have no realistic alternative but to do so.
Auditor’s responsibilities for the audit of the Financial Report
Our objective is:
• to obtain reasonable assurance about whether the Financial Report as a whole is free from material misstatement, whether due to fraud or error; and
• to issue an Auditor’s Report that includes our opinion.
Reasonable assurance is a high level of assurance, but is not a guarantee that an audit conducted in accordance with Australian Auditing Standards will always detect a material misstatement when it exists.
Misstatements can arise from fraud or error. They are considered material if, individually or in the aggregate, they could reasonably be expected to influence the economic decisions of users taken on the basis of this Financial Report.

52
A further description of our responsibilities for the Audit of the Financial Report is located at the Auditing and Assurance Standards Board website at: http://www.auasb.gov.au/auditors_files/ar3.pdf. This description forms part of our Auditor’s Report.
KPMG
Andrew Reeves Partner
Sydney 15 March 2017