consolidated financial statements year ended december 31, 2015 · consolidated financial...
TRANSCRIPT

CONSOLIDATED FINANCIAL
STATEMENTS
YEAR ENDED DECEMBER 31, 2015
Contents Consolidated Income Statement 2 Consolidated Statement of Comprehensive Income 3 Consolidated Statement of Financial Position 4 Consolidated Statement of Cash Flows 5 Consolidated Statement of Changes in Shareholders’ Equity 6 Notes to the Consolidated Financial Statements 7
Note 1: Basis of preparation of the consolidated financial statements Note 2: Significant events of the year Note 3: Scope of consolidation Note 4: Segment information Note 5: Operating items Note 6: Intangible assets, property and equipment, investment property Note 7: Investments in companies accounted for by the equity method Note 8: Income tax Note 9: Provisions and contingent liabilities Note 10: Number of employees, employee compensation and benefits Note 11: Equity and earnings per share Note 12: Financial assets and liabilities, finance costs and other financial income and expenses Note 13: Off-balance sheet commitments Note 14: Subsequent events Note 15: Fees paid to the Auditors Note 16: List of consolidated companies

Consolidated Financial Statements, Year Ended December 31, 2015
2
The consolidated financial statements are presented in millions of euros, rounded to the nearest million. As a result, there may be rounding differences between the amounts reported in the various statements. CONSOLIDATED INCOME STATEMENT (in € millions) Notes 2015 2014 % change
Net sales 5.1 76,945 74,706 3.0%
Loyalty program costs (552) (609) (9.3%)
Net sales ne t of loyalty program costs 76,393 74,097 3.1%
Other revenue 5.1 2,464 2,221 10.9%
Tota l revenue 78,857 76,318 3.3%
Cost of sales 5.2 (60,838) (59,270) 2.6%
Gross margin from recurring operations 18,019 17,049 5.7%
Sales, general and administrative expenses, depreciation and amortization 5.2 (15,574) (14,662) 6.2%
Recurring operating income 2,445 2,387 2.4%
Net income from companies accounted for by the equity method 7 44 37 21.4%
Recurring operating income afte r ne t income from co mpanies accounted for by the equity method
2,489 2,423 2.7%
Non-recurring income and expenses, net 5.3 (257) 149 (272.3%)
Operating income 2,232 2,572 (13.2%)
Finance costs and other financial income and expenses, net 12 (515) (563) (8.4%)
Finance costs, net (347) (399) (12.9%)
Other financial incom e and expenses, net (168) (164) 2.6%
Income before taxes 1,717 2,010 (14.6%)
Income tax expense 8 (597) (709) (15.8%)
Net income from continuing operations 1,120 1,300 (13.9%)
Net income from discontinued operations 3.4 4 67 (94.7%)
Net income for the year 1,123 1,367 (17.9%)
Group share 980 1,249 (21.5%)
of which net income from continuing operations 977 1,182 (17.4%)
of which net income from discontinued operations 4 67 (94.7%)
Attributable to non-controlling interests 143 118 20.8%
Basic ea rnings/(loss) pe r share, in € 2015 2014 Prog
Earnings/(loss) from continuing operations per share 1.35 1.67 (19.2%)Earnings from discontinued operations per share 0.00 0.09 (94.8%)Basic earnings per share – Group share 1.36 1.77 (23.3%)
Diluted earnings/(loss) pe r share, in € 2015 2014 Prog
Diluted earnings/(loss) from continuing operations per share 1.35 1.67 (19.2%)Diluted earnings from discontinued operations per share 0.00 0.09 (94.8%)Diluted earnings per share – Group share 1.36 1.77 (23.3%)
Details of earnings per share calculations are provided in Note 11.6.

Consolidated Financial Statements, Year Ended December 31, 2015
3
CONSOLIDATED STATEMENT OF COMPREHENSIVE INCOME
Net income for the year 1,123 1,367
Effective portion of changes in the fair value of cash flow hedges (1) 1 15
Changes in the fair value of available-for-sale financial assets (1) (5) 13
Exchange differences on translating foreign operations (2) (602) 13
Items tha t may be reclassified subsequently to prof it or loss (605) 42
Remeasurements of defined benefit plans obligation (1) (17) (129)
Items tha t w ill not be reclassified to profit or lo ss (17) (129)
Other comprehensive income a fte r tax (623) (87)
Tota l comprehensive income 501 1,280
Group share 451 1,138Attributable to non-controlling interests 49 142
(in € millions) 2015 2014
(1) Presented net of the tax effect (see Note 11.4 for details). (2) Exchange differences on translating foreign operations recognized in 2015 mainly reflect the decline in the Brazilian
and Argentine currencies.

Consolidated Financial Statements, Year Ended December 31, 2015
4
CONSOLIDATED STATEMENT OF FINANCIAL POSITION
(in € millions) NotesDecember 31,
2015December 31,
2014
Goodwill 6.1 8,495 8,228
Other intangible assets 6.1 1,014 1,315
Property and equipment 6.2 12,071 12,272
Investment property 6.4 383 296
Investments in companies accounted for by the equity method 7 1,433 1,471
Other non-current financial assets 12.4 1,291 1,340
Consumer credit granted by the financial services companies – long term 5.5 2,351 2,560
Deferred tax assets 8.2 744 759
Non-current assets 27,784 28,240
Inventories 5.4 6,362 6,213
Trade receivables 5.4 2,269 2,260
Consumer credit granted by the financial services companies – short-term 5.5 3,658 3,420
Other current financial assets 12.2 358 504
Tax receivables 1,168 1,136
Other assets 5.4 705 853
Cash and cash equivalents 12.2 2,724 3,113
Assets held for sale (1) 66 49
Current assets 17,311 17,549
TOTAL ASSETS 45,095 45,789
SHAREHOLDERS’ EQUITY AND LIABILITIES
(in € millions) NotesDecember 31,
2015December 31,
2014
Share capital 11.2 1,846 1,837
Consolidated reserves and income for the year 7,787 7,353
Shareholders’ equity – Group share 9,633 9,191
Shareholders’ equity attributable to non-controlling interests 11.5 1,039 1,037
Tota l shareholders' equity 10,672 10,228
Long-term borrowings 12.2 6,662 6,815
Provisions 9 3,014 3,581
Consumer credit financing – long-term 5.5 1,921 1,589
Deferred tax liabilities 8.2 508 523
Non-current liabilities 12,106 12,508
Short-term borrowings 12.2 966 1,757
Suppliers and other creditors 5.4 13,648 13,384
Consumer credit financing – short-term 5.5 3,328 3,718
Tax payables 1,097 1,172
Other payables 5.4 3,244 3,022
Liabilities related to assets held for sale (1) 34 1
Current liabilities 22,317 23,053 TOTAL SHAREHOLDERS’ EQUITY AND LIABILITIES 45,095 45,789
(1) Assets held for sale and liabilities related to assets held for sale correspond mainly to the Dia stores that were in the process of being sold as of December 31, 2015 (Note 3.2.2).

Consolidated Financial Statements, Year Ended December 31, 2015
5
CONSOLIDATED STATEMENT OF CASH FLOWS (in € millions) 2015 2014
INCOME BEFORE TAXES 1,717 2,010
CASH FLOW S FROM OPERATING ACTIVITIES
Taxes (663) (800)
Depreciation and amortization expense 1,574 1,451
Capital (gains)/losses on sales of assets (13) (355)
Change in provisions and impairment (215) (175)
Finance costs, net 347 399
Net income and dividends received from companies accounted for by the equity method 8 (4)
Impact of discontinued operations (22) (23)
Cash flow from operations 2,733 2,504
Change in working capital requirement (1) 276 18
Impact of discontinued operations 3 86
Net cash from operating activities (excluding finan cia l services companies) 3,012 2,608
Change in consumer credit granted by the financial services companies (195) 1
Net cash from operating activities 2,818 2,609
CASH FLOW S FROM INVESTING ACTIVITIES
Acquisitions of property and equipment and intangible assets (2) (2,378) (2,411)
Acquisitions of non-current financial assets (29) (148)
Acquisitions of subsidiaries and investments in associates (3) (56) (1,188)
Proceeds from the disposal of subsidiaries and investments in associates 7 82
Proceeds from the disposal of property and equipment and intangible assets 186 293
Proceeds from the disposal of non-current financial assets 5 3
Change in amounts receivable from and due to suppliers of fixed assets 151 (36)
Investments net of disposals (2,115) (3,405)
Other cash flows from investing activities (28) (5)
Impact of discontinued operations 7 13
Net cash from/(used in) investing activities (2,136) (3,397)
CASH FLOW S FROM FINANCING ACTIVITIES
Proceeds from share issues to non-controlling interests 14 5
Acquisitions and disposals of investments without any change of control (4) 208 311
Dividends paid by Carrefour (parent company) (5) (390) (149)
Dividends paid by consolidated companies to non-controlling interests (98) (70)
Change in treasury stock and other equity instruments (6) 384 (18)
Change in current financial assets 40 (48)
Issuance of bonds (7) 750 683
Repayments of bonds (7) (744) (1,178)
Net interests paid (360) (463)
Other changes in borrowings (7) (625) 71
Impact of discontinued operations 0 (17)
Net cash from/(used in) financing activities (821) (874)
Net change in cash and cash equiva lents before the e ffect of changes in exchange ra tes (139) (1,662)
Effect of changes in exchange rates (249) 19
Net change in cash and cash equiva lents (388) (1,643)
Cash and cash equiva lents a t beginning of year 3,113 4,757
Cash and cash equiva lents a t end of year 2,724 3,113
(1) The change in working capital is analyzed in Note 5.4.1. (2) Acquisitions of property and equipment and intangible assets are presented in Notes 6.1 and 6.2. (3) The amount reported for 2014 corresponds to the various transactions described in Note 3.2.2 (acquisition of Dia in
France and Billa in Italy, investments in the associated company Carmila). (4) This item mainly concerns the sale of shares in the Group's Brazilian subsidiary to a local investment firm, Peninsula, as
described in Note 3.2.2, comprising (i) in 2014, part of the proceeds from the year-end sale of an initial 10% interest, and (ii) in 2015, the balance of the proceeds from the end-2014 transaction plus the proceeds from the exercise by Peninsula, in the first half, of a call option on an additional 2%.
(5) Payment of the cash dividend to shareholders who chose not to reinvest their dividends (Note 2.3). (6) This item corresponds for the most part to the sale of treasury stock described in Note 2.1. (7) See Note 12.2.
Consolidated Financial Statements, Year Ended December 31, 2015
6
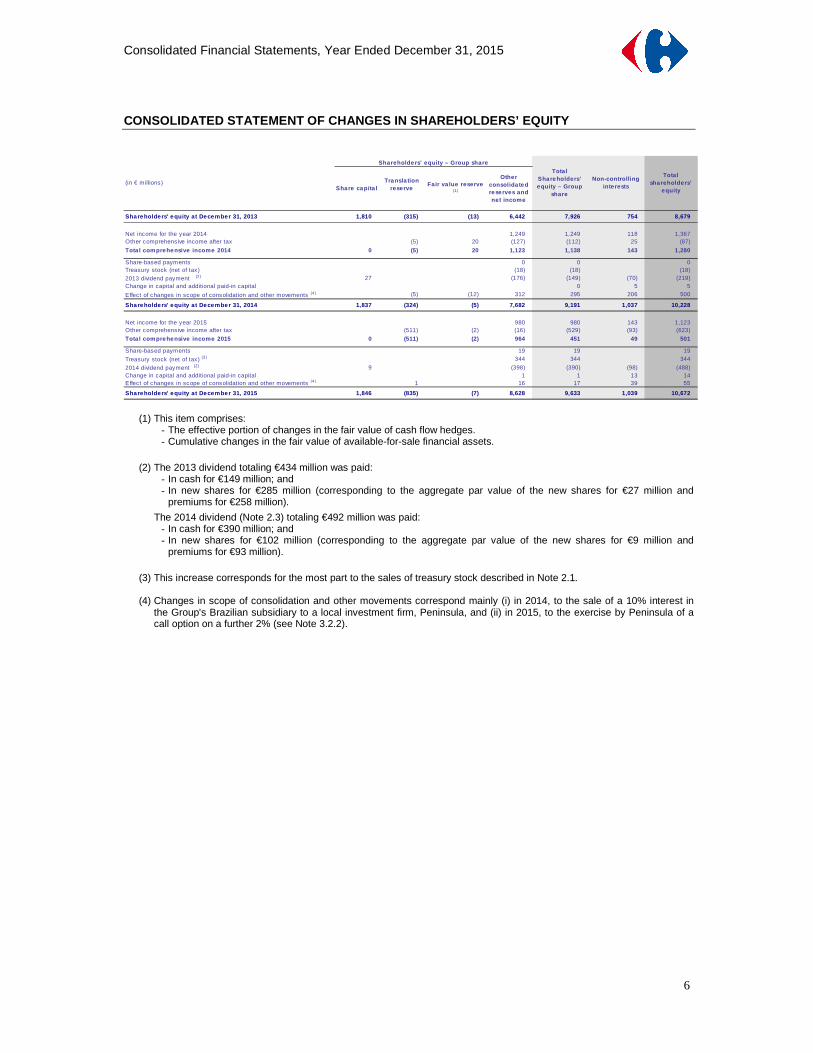
CONSOLIDATED STATEMENT OF CHANGES IN SHAREHOLDERS’ EQUITY
Share capita lTransla tion
reserveFair va lue reserve
(1)
Other consolida ted rese rves and net income
Shareholde rs' equity at December 31, 2013 1,810 (315) (13) 6,442 7,926 754 8,679
Net income for the year 2014 1,249 1,249 118 1,367Other comprehensive income after tax (5) 20 (127) (112) 25 (87)
Tota l comprehensive income 2014 0 (5) 20 1,123 1,138 143 1,280
Share-based payments 0 0 0Treasury stock (net of tax) (18) (18) (18)
2013 dividend payment (2) 27 (176) (149) (70) (219)Change in capital and additional paid-in capital 0 5 5
Effect of changes in scope of consolidation and other movements (4) (5) (12) 312 295 206 500
Shareholde rs' equity at December 31, 2014 1,837 (324) (5) 7,682 9,191 1,037 10,228
Net income for the year 2015 980 980 143 1,123Other comprehensive income after tax (511) (2) (16) (529) (93) (623)
Tota l comprehensive income 2015 0 (511) (2) 964 451 49 501
Share-based payments 19 19 19
Treasury stock (net of tax) (3) 344 344 344
2014 dividend payment (2) 9 (398) (390) (98) (488)Change in capital and additional paid-in capital 1 1 13 14Effect of changes in scope of consolidation and other movements (4) 1 16 17 39 55
Shareholde rs' equity at December 31, 2015 1,846 (835) (7) 8,628 9,633 1,039 10,672
Non-controlling interests
Total shareholders’
equity(in € millions)
Shareholde rs’ equity – Group shareTota l
Shareholders’ equity – Group
share
(1) This item comprises:
- The effective portion of changes in the fair value of cash flow hedges. - Cumulative changes in the fair value of available-for-sale financial assets.
(2) The 2013 dividend totaling €434 million was paid:
- In cash for €149 million; and - In new shares for €285 million (corresponding to the aggregate par value of the new shares for €27 million and
premiums for €258 million).
The 2014 dividend (Note 2.3) totaling €492 million was paid: - In cash for €390 million; and - In new shares for €102 million (corresponding to the aggregate par value of the new shares for €9 million and
premiums for €93 million).
(3) This increase corresponds for the most part to the sales of treasury stock described in Note 2.1.
(4) Changes in scope of consolidation and other movements correspond mainly (i) in 2014, to the sale of a 10% interest in the Group's Brazilian subsidiary to a local investment firm, Peninsula, and (ii) in 2015, to the exercise by Peninsula of a call option on a further 2% (see Note 3.2.2).
Consolidated Financial Statements, Year Ended December 31, 2015
7
NOTE 1: BASIS OF PREPARATION OF THE CONSOLIDATED FI NANCIAL STATEMENTS The consolidated financial statements for the year ended December 31, 2015 were approved for publication by the Board of Directors on March 9, 2016. They will be submitted to shareholders for final approval at the Annual General Meeting. Carrefour (the "Company") is domiciled in France. The consolidated financial statements for the year ended December 31, 2015 comprise the financial statements of the Company and its subsidiaries (together the "Group") and the Group’s share of the profits and losses and net assets of associates and joint ventures accounted for by the equity method. The presentation currency of the consolidated financial statements is the euro, which is the Company’s functional currency. 1.1 Statement of compliance In accordance with European Regulation (EC) 1606/2002 dated July 19, 2002, the 2015 consolidated financial statements have been prepared in compliance with the international accounting standards adopted for use in the European Union as of December 31, 2015 and applicable at that date, with 2014 comparative information prepared using the same standards. International accounting standards comprise International Financial Reporting Standards (IFRSs), International Accounting Standards (IASs), International Financial Reporting Standards Interpretation Committee (IFRIC) Interpretations and Standing Interpretations Committee (SIC) Interpretations. All of the standards and interpretations adopted for use in the European Union are available on the European Commission’s website, http://ec.europa.eu/finance/accounting/ias/index_en.htm At December 31, 2015, the standards and interpretations adopted for use in the European Union were the same as those published by the IASB and applicable at that date, except for IAS 39 – Financial Instruments: Recognition and Measurement, which was only partly adopted. The unadopted provisions of IAS 39 had no impact on the Group’s consolidated financial statements. 1.2 Changes of method The accounting and calculation methods used to prepare the 2015 consolidated financial statements were the same as those used in 2014 except for the changes resulting from the following amendments, which were applicable as of January 1, 2015 and were not early adopted:
• IFRS Annual Improvements 2011-2013
Application of these amendments had no material impact on the Group’s published consolidated financial statements. IFRIC 21 – Levies, which was also applicable as of January 1, 2015, was early adopted in 2014. The Group decided not to early adopt the following standards and interpretations that were not applicable as of January 1, 2015:
Adopted for use in the European Union:
• IFRS Annual Improvements 2010-2012 (applicable in annual periods beginning on or after February 1, 2015)
• Amendments to IAS 19 – Defined Benefit Plans: Employee Contributions (applicable in annual periods beginning on or after February 1, 2015)
• Amendments to IAS 1 – Disclosure Initiative (applicable in annual periods beginning on or after January 1, 2016)
Consolidated Financial Statements, Year Ended December 31, 2015
8
• Amendments to IFRS 11 – Acquisition of an Interest in a Joint Operation (applicable in annual periods beginning on or after January 1, 2016)
• Amendments to IAS 16/IAS 38 – Clarification of Acceptable Methods of Depreciation and Amortisation (applicable in annual periods beginning on or after January 1, 2016)
• IFRS Annual Improvements 2012-2014 (applicable in annual periods beginning on or after January 1, 2016)
Not yet adopted for use in the European Union:
• IFRS 9 – Financial Instruments and amendments to IFRS 9 – Financial Instruments: Hedge Accounting and amendments to IFRS 7 and IAS 39 (applicable according to the IASB in annual periods beginning on or after January 1, 2018). IFRS 9, which describes the principles to be applied for the classification and measurement of financial assets and liabilities, replaces IAS 39. The new standard's impact on the amount and timing of the recognition of financial assets and liabilities and on profit cannot yet be reasonably estimated.
• IFRS 15 – Revenues from Contracts with Customers (applicable according to the IASB in accounting periods beginning on or after January 1, 2018). This standard, which replaces IAS 18 – Revenues and IAS 11 – Construction Contracts, may have an impact on the amount and timing of revenue recognition by the Group. This impact cannot yet be reasonably estimated.
• IFRS 16 – Leases (applicable according to the IASB in annual periods beginning on or after January 1, 2019). This standard, which replaces IAS 17, sets out the principles for recognizing leases and brings most leases on-balance sheet for lessees under a single model, eliminating the distinction between operating and finance leases. Its impact cannot yet be reasonably estimated.
• Amendments to IAS 12 – Recognition of Deferred Tax Assets for Unrealised Losses (applicable according to the IASB in accounting periods beginning on or after January 1, 2017).
• Amendments to IAS 7 – Disclosure Initiative (applicable according to the IASB in annual periods beginning on or after January 1, 2017).
The possible impact on the consolidated financial statements of applying these new and amended standards is currently being assessed. 1.3 Use of estimates and judgment Preparation of consolidated financial statements involves the use of management estimates and assumptions that may affect the reported amounts of certain assets, liabilities, income and expenses, as well as the disclosures contained in the notes. These estimates and assumptions are reviewed at regular intervals to ensure that they are reasonable in light of past experience and the current economic situation. Actual results may differ from current estimates. In addition to using estimates, Group management is required to exercise judgment when determining what is the appropriate accounting treatment of certain transactions and activities and how it should be applied. The main estimates and judgments applied for the preparation of these consolidated financial statements concern:
- Useful lives of operating assets (Note 6) - Definition of Cash Generating Units (Note 6.3) - Recoverable amount of goodwill, other intangible assets and property and equipment
(Note 6.3) - Fair value of identifiable assets acquired and liabilities assumed in business combinations
(Note 3) - Classification of leases (Note 6.5)
Consolidated Financial Statements, Year Ended December 31, 2015
9
- Measurement of provisions for contingencies and other business-related provisions (Note 9) - Determination of the level of control or influence exercised by the Group over investees
(Notes 3 and 7) - Assumptions used to calculate pension and other post-employment benefit obligations
(Note 10.1) - Recognition of deferred tax assets (Note 8)
1.4 Measurement methods The consolidated financial statements have been prepared using the historical cost convention, except for:
- Certain financial assets and liabilities measured using the fair value model (Note 12). - Assets acquired and liabilities assumed in business combinations, measured using the fair
value model (Note 3). - Non-current assets held for sale, measured at the lower of carrying amount and fair value less
costs to sell (Note 3).
Fair value is the price that would be received to sell an asset or paid to transfer a liability in an orderly transaction between market participants at the measurement date. Based on the hierarchy defined in IFRS 13 – Fair Value Measurement, fair value may be measured using the following inputs:
- Level 1 inputs: unadjusted quoted prices in active markets for identical assets or liabilities that the entity can access at the measurement date.
- Level 2 inputs: models that use inputs that are observable for the asset or liability, either directly (i.e., prices) or indirectly (i.e., price-based data).
- Level 3 inputs: inputs that are intrinsic to the asset or liability and are not based on observable market data for the asset or liability.

Consolidated Financial Statements, Year Ended December 31, 2015
10
NOTE 2: SIGNIFICANT EVENTS OF THE YEAR 2.1 Placement of 12.7 million treasury shares On March 23, 2015, Carrefour announced the disposal of 12.7 million treasury shares, representing approximately 1.73% of its share capital. The sale was carried out through a private placement by way of an accelerated bookbuilding at a price of €31 per share, for a total amount of €393.7 million. Of the 12.7 million treasury shares sold, 9.3 million shares were directly owned by Carrefour and 3.4 million shares were indirectly owned through an equity swap. These shares correspond to the excess coverage of Carrefour's obligations under stock option plans and free share allotments. 2.2 Operations to strengthen the Group's financial position On January 22, 2015, the Group obtained a new €2,500 million five-year bank facility (expiring in January 2020) with two one-year extension options from a pool of 22 banks. This facility replaces two existing facilities, for €1,591 million and €1,458 million, expiring in July 2017 and November 2018 respectively. The operation contributed to the ongoing strategy to secure the Group's long-term financing sources by extending the average maturity of its facilities and reducing the related borrowing costs, while aligning their amount with the Group's needs. On January 27, 2015, the Group carried out a new €750 million 10.3-year 1.25% bond issue due June 2025. The issue's settlement date was February 3, 2015. The issue consolidated the Group’s long-term financing, extended the average maturity of its bond debt and further reduced its borrowing costs. 2.3 2014 dividend reinvestment option At the Annual General Meeting held on June 11, 2015, shareholders decided to set the 2014 dividend at €0.68 per share with a dividend reinvestment option. The issue price of the shares to be issued in exchange for reinvested dividends was set at €28.77 per share, representing 95% of the average of the opening prices quoted on Euronext Paris during the 20 trading days preceding the date of the Annual General Meeting, less the net amount of the dividend of €0.68 per share and rounded up to the nearest euro cent. The option period was open from June 17 to July 7, 2015. At the end of this period, shareholders owning 20.69% of Carrefour's shares had elected to reinvest their 2014 dividends. July 17, 2015 was set as the date for:
- Settlement/delivery of the 3,556,885 new shares corresponding to reinvested dividends, leading to a total capital increase including premiums of €102 million.
- Payment of the cash dividend to shareholders who chose not to reinvest their dividends, representing a total payout of €390 million.
Consolidated Financial Statements, Year Ended December 31, 2015
11
2.4 Acquisition of Rue du Commerce On August 24, 2015, Carrefour announced that it was in exclusive negotiations with Altarea Cogedim for the acquisition of 100% of the shares of Rue du Commerce, a major player in the non-food e-commerce market in France.
The acquisition was completed in January 2016 after employee representatives at Rue du Commerce had been consulted and the necessary anti-trust approvals had been obtained.
It represents another step in the roll-out of Carrefour's omnichannel strategy in France for the benefit of its customers both in stores and on-line. 2.5 Planned acquisition in Romania On December 22, 2015, Carrefour announced that an agreement had been signed with the Rewe Group for the acquisition of Billa Romania, which operates a network of 86 supermarkets spread across the whole of Romania, representing a total sales area of 83,000 square meters. Through this acquisition, Carrefour would become the leading supermarket operator in Romania, strengthening its multiformat offer to better serve its customers. Completion of this transaction remains subject to approval by the relevant anti-trust authorities.
Consolidated Financial Statements, Year Ended December 31, 2015
12
NOTE 3: SCOPE OF CONSOLIDATION 3.1 Accounting policies
Basis of consolidation
The consolidated financial statements include the financial statements of subsidiaries from the date of acquisition (the date when the Group gains control) up to the date when the Group ceases to control the subsidiary, and the Group's equity in associates and joint ventures accounted for by the equity method.
(i) Subsidiaries A subsidiary is an entity over which the Group exercises control, directly or indirectly. An entity is controlled when the Group is exposed, or has rights, to variable returns from its involvement with the entity and has the ability to affect those returns through its power over the entity. The Group considers all facts and circumstances when assessing whether it controls an investee, such as rights resulting from contractual arrangements or substantial potential voting rights held by the Group.
The profit or loss of subsidiaries acquired during the year is included in the consolidated financial statements from the date when control is acquired. The profit or loss of subsidiaries sold during the year or that the Group ceases to control, is included up to the date when control ceases.
Intra-group transactions and assets and liabilities are eliminated in consolidation. Profits and losses on transactions between a subsidiary and an associate or joint venture accounted for by the equity method are included in the consolidated financial statements to the extent of unrelated investors’ interests in the associate or joint venture.
(ii) Associates and joint ventures Entities in which the Group exercises significant influence (associates), and entities over which the Group exercises joint control and that meet the definition of a joint venture, are accounted for by the equity method, as explained in Note 7 "Investments in companies accounted for by the equity method".
Significant influence is the power to participate in the financial and operating policy decisions of the investee but is not control or joint control of those policies.
Joint control is the contractually agreed sharing of control of an arrangement, which exists only when decisions about the relevant activities require the unanimous consent of the parties sharing control.
(iii) Other investments
Investments in companies where the Group does not exercise control or significant influence over financial and operating policy decisions are qualified as available-for-sale financial assets and reported under "Other noncurrent financial assets". The accounting treatment of these investments is described in Note 12 "Financial assets and liabilities, finance costs and other financial income and expenses".
Business combinations
Business combinations, defined as transactions where the assets acquired and liabilities assumed constitute a business, are accounted for by the purchase method. Business combinations carried out since January 1, 2010 are measured and recognized as described below, in accordance with IFRS 3 – Business Combinations (as revised in 2008).
• As of the acquisition date, the identifiable assets acquired and liabilities assumed are recognized and measured at fair value.
• Goodwill corresponds to the excess of (i) the sum of the consideration transferred (i.e., the acquisition price) and the amount of any non-controlling interest in the acquiree, over (ii) the net of the acquisition-date amounts of the identifiable assets acquired and the liabilities assumed. It is recorded directly in the statement of financial position of the acquiree, in the latter's functional currency, and is subsequently tested for impairment at the level of the Cash Generating Unit to which the acquiree belongs, by the method described in Note 6.3. Any gain from a bargain purchase (i.e., negative goodwill) is recognized directly in profit or loss.

Consolidated Financial Statements, Year Ended December 31, 2015
13
• For business combinations on a less than 100% basis, the acquisition date components of non-controlling interests in the acquiree (i.e., interests that entitle their holders to a proportionate share of the acquiree's net assets) are measured at either:
- fair value, such that part of the goodwill recognized at the time of the business combination is allocated to non-controlling interests ("full goodwill" method), or
- the proportionate share of the acquiree's identifiable net assets, such that only the goodwill attributable to the Group is recognized ("partial goodwill" method).
The method used is determined on a transaction-by-transaction basis.
• The provisional amounts recognized for a business combination may be adjusted during a measurement period that ends as soon as the Group receives the information it was seeking about facts and circumstances that existed as of the acquisition date or learns that more information is not obtainable, or at the latest 12 months from the acquisition date. Adjustments during the measurement period to the fair value of the identifiable assets acquired and liabilities assumed or the consideration transferred are offset by a corresponding adjustment to goodwill, provided they result from facts and circumstances that existed as of the acquisition date. Any adjustments identified after the measurement period ends are recognized directly in profit or loss.
• For a business combination achieved in stages (step acquisition), when control is acquired the previously held equity interest is remeasured at fair value through profit or loss. In the case of a reduction in the Group's equity interest resulting in a loss of control, the remaining interest is also remeasured at fair value through profit or loss.
• Transaction costs are recorded directly as an operating expense for the period in which they are incurred.
At the IFRS transition date, the Group elected to maintain the accounting treatment for business combinations applied under previous accounting standards, in line with the option available to first-time adopters under IFRS 1.
Changes in ownership interest not resulting in a ch ange of control
Any change in the Group's ownership interest in a subsidiary after the business combination that does not result in control being acquired or lost is qualified as a transaction with owners in their capacity as owners and recorded directly in equity in accordance with IFRS 10 – Consolidated Financial Statements. The corresponding cash outflow or inflow is reported in the consolidated statement of cash flows under "Cash flows from financing activities".
Translation of the financial statements of foreign operations
The consolidated financial statements are presented in euros.
An entity's functional currency is the currency of the primary economic environment in which the entity operates. The functional currency of Group entities is the currency of their home country.
The financial statements of entities whose functional currency is not the euro and is not the currency of a hyperinflationary economy are translated into euros as follows:
• Assets and liabilities are translated at the period-end closing rate. • Income and expenses are translated at the weighted average exchange rate for the period. • All resulting exchange differences are recognized in "Other comprehensive income" and are taken into
account in the calculation of any gain or loss realized on the subsequent disposal of the foreign operation.
• Items in the statement of cash flows are translated at the average rate for the period unless the rate on the transaction date is materially different.
No Group companies operated in a hyperinflationary economy in either 2015 or 2014.
Translation of foreign currency transactions
Transactions by Group entities in a currency other than their functional currency are initially translated at the exchange rate on the transaction date.
At each period-end, monetary assets and liabilities denominated in foreign currency are translated at the period-end closing rate and the resulting exchange gain or loss is recorded in the income statement.
Intra-group loans to certain foreign operations are treated as part of the net investment in that operation if settlement of the loan is neither planned nor likely to occur. The gain or loss arising from translation of the loan at each successive period-end is recorded directly in "Other comprehensive income" in accordance with IAS 21 – The Effects of Changes in Foreign Exchange Rates.
Consolidated Financial Statements, Year Ended December 31, 2015
14
3.2 Main changes in scope of consolidation
3.2.1 Changes in 2015
No material acquisitions or divestments were carried out in 2015.
The acquisitions of Rue du Commerce and Billa Romania described in Note 2 "Significant events" were not completed until after the year-end. Consequently, they were not included in the scope of consolidation at December 31, 2015.
3.2.2 Changes in 2014
Acquisition of Dia’s operations in France
On June 20, 2014, the Carrefour Group announced that, following exclusive negotiations with Dia, it had agreed to acquire Dia France based on an enterprise value of €600 million. The deal was approved by France's anti-trust authorities in November 2014 and the acquisition was completed on December 1, 2014, allowing the Group to pursue its multi-format expansion in its domestic market. The anti-trust approval covered the acquisition of over 800 points of sale, in exchange for an undertaking by Carrefour to sell around fifty others that had been reclassified as held for sale at December 31, 2014 in accordance with IFRS 5 – Non-current Assets Held for Sale and Discontinued Operations.
In the months following the acquisition, the Group completed a review to identify stores eligible to operate under Carrefour banners (Market, City, Contact, etc.) and found that around a hundred stores were unsuitable for this purpose. As the Group does not wish to operate discount stores, the stores concerned are also presented in accordance with IFRS 5 in the 2015 consolidated financial statements.
Application of IFRS 5 to all of these stores resulted in the following reclassifications in the consolidated financial statements at December 31, 2015:
- The net loss generated by the stores in 2015, in the amount of €19 million, has been presented in "Net income/(loss) from discontinued operations" (Note 3.4).
- Cash flows from the stores concerned have been presented in "Impact of discontinued operations" in the consolidated statement of cash flows.
- The assets of the stores whose sale was in progress at December 31, 2015 and the related liabilities have been presented in "Assets held for sale" and "Liabilities related to assets held for sale" in an amount of €53 million and €34 million respectively.
Non-current assets and disposal groups held for sal e and discontinued operations
If the carrying amount of a non-current asset (or disposal group) will be recovered principally through a sale transaction rather than through continuing use, it is presented separately in the consolidated statement of financial position under "Assets held for sale" in accordance with IFRS 5 – Non-current Assets Held for Sale and Discontinued Operations. Liabilities related to non-current assets held for sale are also reported on a separate line of the consolidated statement of financial position (under "Liabilities related to assets held for sale"). Following their classification as held for sale, the assets concerned are measured at the lower of their carrying amount and fair value less costs to sell and they cease to be depreciated or amortized.
A discontinued operation is a component of an entity that has been either disposed of or classified as held for sale, and:
• represents a separate major line of business or geographical area of operations, and • is part of a single coordinated plan to dispose of a separate major line of business or geographical area
of operations, or • is a subsidiary acquired exclusively with a view to resale.
It is classified as a discontinued operation at the time of sale or earlier if its assets and liabilities meet the criteria for classification as "held for sale". When a component of an entity is classified as a discontinued operation, comparative income statement and cash flow information are restated as if the entity had met the criteria for classification as a discontinued operation on the first day of the comparative period.
In addition, all the assets and liabilities of the discontinued operation are presented on separate lines on each side of the statement of financial position, for the amounts at which they would be reported at the time of sale after eliminating intra-group items.
Consolidated Financial Statements, Year Ended December 31, 2015
15
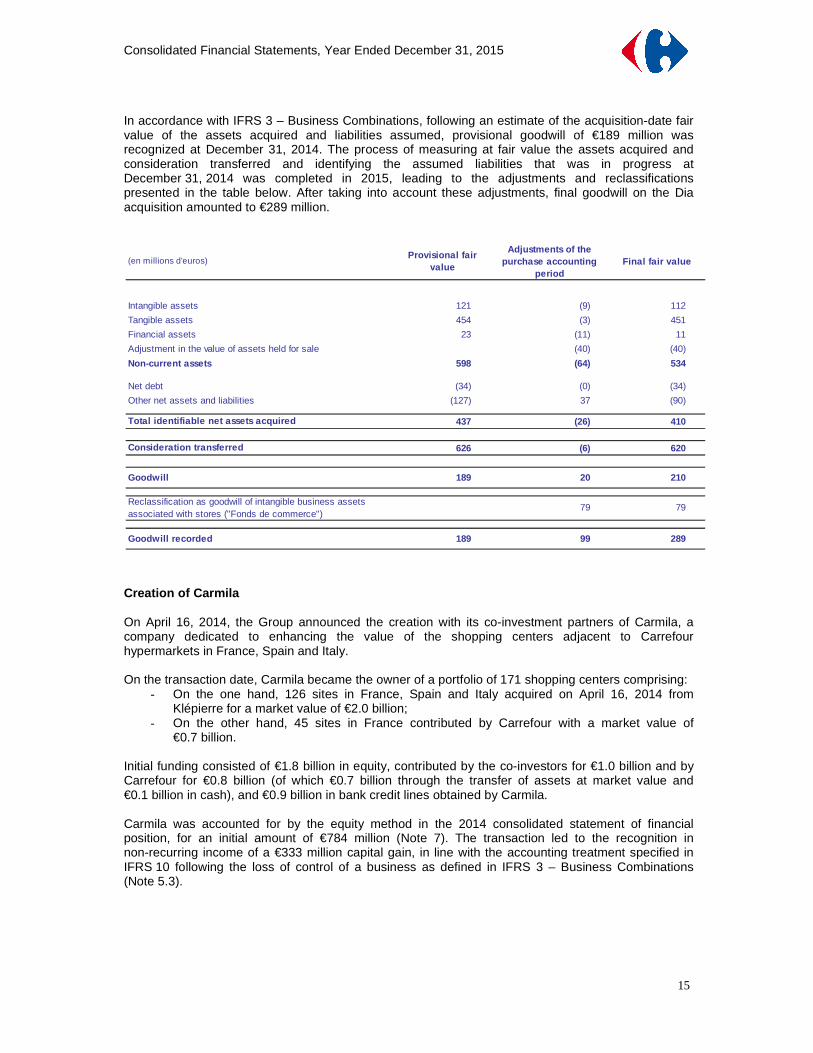
In accordance with IFRS 3 – Business Combinations, following an estimate of the acquisition-date fair value of the assets acquired and liabilities assumed, provisional goodwill of €189 million was recognized at December 31, 2014. The process of measuring at fair value the assets acquired and consideration transferred and identifying the assumed liabilities that was in progress at December 31, 2014 was completed in 2015, leading to the adjustments and reclassifications presented in the table below. After taking into account these adjustments, final goodwill on the Dia acquisition amounted to €289 million.
Creation of Carmila On April 16, 2014, the Group announced the creation with its co-investment partners of Carmila, a company dedicated to enhancing the value of the shopping centers adjacent to Carrefour hypermarkets in France, Spain and Italy. On the transaction date, Carmila became the owner of a portfolio of 171 shopping centers comprising:
- On the one hand, 126 sites in France, Spain and Italy acquired on April 16, 2014 from Klépierre for a market value of €2.0 billion;
- On the other hand, 45 sites in France contributed by Carrefour with a market value of €0.7 billion.
Initial funding consisted of €1.8 billion in equity, contributed by the co-investors for €1.0 billion and by Carrefour for €0.8 billion (of which €0.7 billion through the transfer of assets at market value and €0.1 billion in cash), and €0.9 billion in bank credit lines obtained by Carmila. Carmila was accounted for by the equity method in the 2014 consolidated statement of financial position, for an initial amount of €784 million (Note 7). The transaction led to the recognition in non-recurring income of a €333 million capital gain, in line with the accounting treatment specified in IFRS 10 following the loss of control of a business as defined in IFRS 3 – Business Combinations (Note 5.3).
(en millions d'euros)Provisional fair
value
Adjustments of the purchase accounting
periodFinal fair value
Intangible assets 121 (9) 112
Tangible assets 454 (3) 451
Financial assets 23 (11) 11
Adjustment in the value of assets held for sale (40) (40)
Non-current assets 598 (64) 534
Net debt (34) (0) (34)
Other net assets and liabilities (127) 37 (90)
Total identifiable net assets acquired 437 (26) 410
Consideration transferred 626 (6) 620
Goodwill 189 20 210
Reclassification as goodwill of intangible business assets associated with stores ("Fonds de commerce")
79 79
Goodwill recorded 189 99 289
Consolidated Financial Statements, Year Ended December 31, 2015
16
Sale of an interest in the Brazilian subsidiary to a n outside investor On December 18, 2014, the Group sold 10% of its Brazilian subsidiary to local investment firm Peninsula for BRL 1.8 billion (€525 million).
In accordance with IFRS 10 – Consolidated Financial Statements, the transaction led to the recognition in consolidated equity of a capital gain of €285 million, net of income tax, and of non-controlling interests of €174 million. The Group also granted call options to Peninsula allowing it to increase its interest to up to 16% over the next five years. One of these options was exercised by Peninsula during the first half of 2015, raising its interest to 12%.
Acquisition in Italy On June 30, 2014, Carrefour announced that it had entered into an agreement with the Rewe Group to acquire 53 Billa supermarkets located in northern Italy. The supermarkets represent a total retail surface area of 58,000 square meters and generated revenue of some €300 million excluding VAT in 2013. The transaction was completed on September 11, 2014. In accordance with IFRS 3 – Business Combinations, provisional goodwill of €64 million was recorded in the consolidated financial statements at December 31, 2014.
The purchase price allocation process was completed during 2015. No material adjustments were made to the acquisition date fair values of the assets acquired and consideration transferred or to the identifiable liabilities assumed compared to the provisional amounts at December 31, 2014.
3.3 Scope of consolidation at December 31, 2015
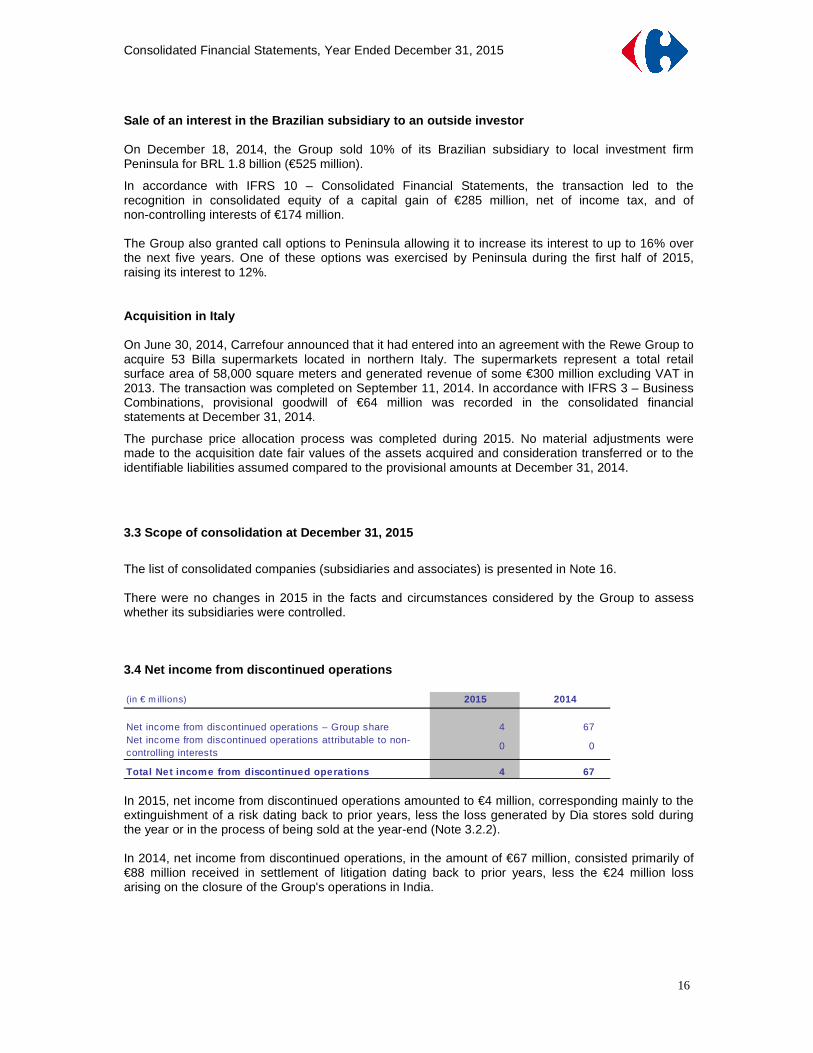
The list of consolidated companies (subsidiaries and associates) is presented in Note 16. There were no changes in 2015 in the facts and circumstances considered by the Group to assess whether its subsidiaries were controlled. 3.4 Net income from discontinued operations (in € m illions) 2015 2014
Net income from discontinued operations – Group share 4 67 Net income from discontinued operations attributable to non-controlling interests
0 0
Total Net income from discontinued operations 4 67 In 2015, net income from discontinued operations amounted to €4 million, corresponding mainly to the extinguishment of a risk dating back to prior years, less the loss generated by Dia stores sold during the year or in the process of being sold at the year-end (Note 3.2.2). In 2014, net income from discontinued operations, in the amount of €67 million, consisted primarily of €88 million received in settlement of litigation dating back to prior years, less the €24 million loss arising on the closure of the Group's operations in India.
Consolidated Financial Statements, Year Ended December 31, 2015
17
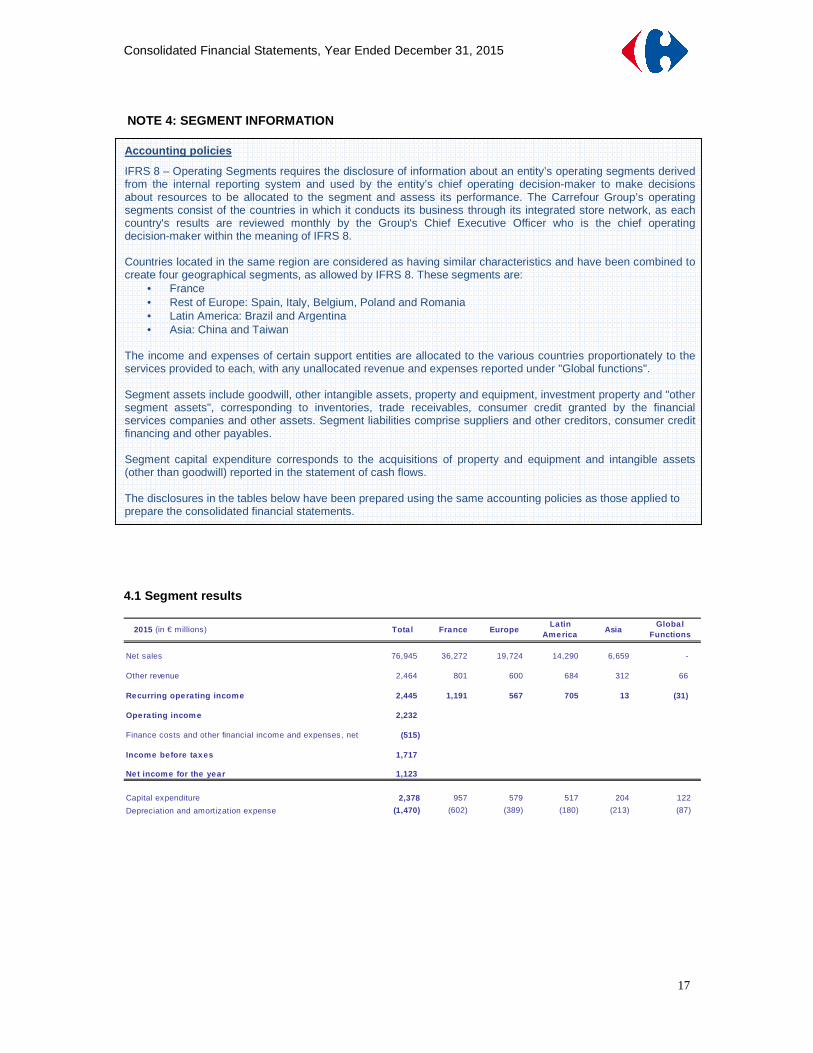
NOTE 4: SEGMENT INFORMATION 4.1 Segment results
2015 (in € millions) Tota l France Europe
Latin America
AsiaGloba l
Functions
Net sales 76,945 36,272 19,724 14,290 6,659 -
Other revenue 2,464 801 600 684 312 66
Recurring operating income 2,445 1,191 567 705 13 (31)
Opera ting income 2,232
Finance costs and other financial income and expenses, net (515)
Income before taxes 1,717
Net income for the year 1,123
Capital expenditure 2,378 957 579 517 204 122
Depreciation and amortization expense (1,470) (602) (389) (180) (213) (87)
Accounting policies
IFRS 8 – Operating Segments requires the disclosure of information about an entity’s operating segments derived from the internal reporting system and used by the entity’s chief operating decision-maker to make decisions about resources to be allocated to the segment and assess its performance. The Carrefour Group’s operating segments consist of the countries in which it conducts its business through its integrated store network, as each country's results are reviewed monthly by the Group's Chief Executive Officer who is the chief operating decision-maker within the meaning of IFRS 8. Countries located in the same region are considered as having similar characteristics and have been combined to create four geographical segments, as allowed by IFRS 8. These segments are:
• France • Rest of Europe: Spain, Italy, Belgium, Poland and Romania • Latin America: Brazil and Argentina • Asia: China and Taiwan
The income and expenses of certain support entities are allocated to the various countries proportionately to the services provided to each, with any unallocated revenue and expenses reported under "Global functions". Segment assets include goodwill, other intangible assets, property and equipment, investment property and "other segment assets", corresponding to inventories, trade receivables, consumer credit granted by the financial services companies and other assets. Segment liabilities comprise suppliers and other creditors, consumer credit financing and other payables. Segment capital expenditure corresponds to the acquisitions of property and equipment and intangible assets (other than goodwill) reported in the statement of cash flows. The disclosures in the tables below have been prepared using the same accounting policies as those applied to prepare the consolidated financial statements.

Consolidated Financial Statements, Year Ended December 31, 2015
18
2014 (in € millions) Tota l France EuropeLatin
AmericaAsia
Global Functions
Net sales 74,706 35,336 19,191 13,891 6,288 -
Other revenue 2,221 738 549 621 270 43
Recurring opera ting income 2,387 1,271 425 660 97 (67)
Operating income 2,572
Finance costs and other financial income and expenses, net (563)
Income before taxes 2,010
Net income for the year 1,367
Capital expenditure 2,411 988 536 622 214 51Depreciation and amortization expense (1,381) (610) (380) (174) (189) (28)
For the purposes of comparison with 2015 segment information, 2014 recurring operating income by segment has been restated to reflect an adjustment linked to the allocation of head office costs.
4.2 Segment assets and liabilities
December 31, 2015 (in € millions) Tota l France Europe Latin America AsiaGloba l
functionsASSETSGoodwill 8,495 4,718 3,138 528 110 1 Other intangible assets 1,014 255 340 101 21 298 Property and equipment 12,071 5,173 3,604 2,102 1,160 32 Investment property 383 31 165 48 139 - Other segment assets 16,514 8,954 3,024 3,066 912 558 Tota l segment assets 38,477 19,131 10,272 5,844 2,341 889 Unallocated assets 6,618 Tota l Asse ts 45,095
LIABILITIES (excluding equity)Segment liabilities 23,238 11,842 5,268 3,428 2,304 395 Unallocated liabilities 11,185 Tota l Liabilities 34,423
December 31, 2014 (in € millions) Tota l France Europe Latin America AsiaGloba l
functionsASSETSGoodwill 8,228 4,285 3,139 700 103 1 Other intangible assets 1,315 781 313 108 16 97 Property and equipment 12,272 5,014 3,553 2,455 1,219 31 Investment property 296 33 141 64 57 - Other segment assets 16,442 8,641 2,895 3,413 849 644 Tota l segment assets 38,553 18,754 10,041 6,739 2,244 773 Unallocated assets 7,236 Tota l Asse ts 45,789
LIABILITIES (excluding equity)Segment liabilities 22,885 11,365 4,968 3,906 2,223 423 Unallocated liabilities 12,676 Tota l Liabilities 35,561
Consolidated Financial Statements, Year Ended December 31, 2015
19
NOTE 5: OPERATING ITEMS 5.1 Revenue
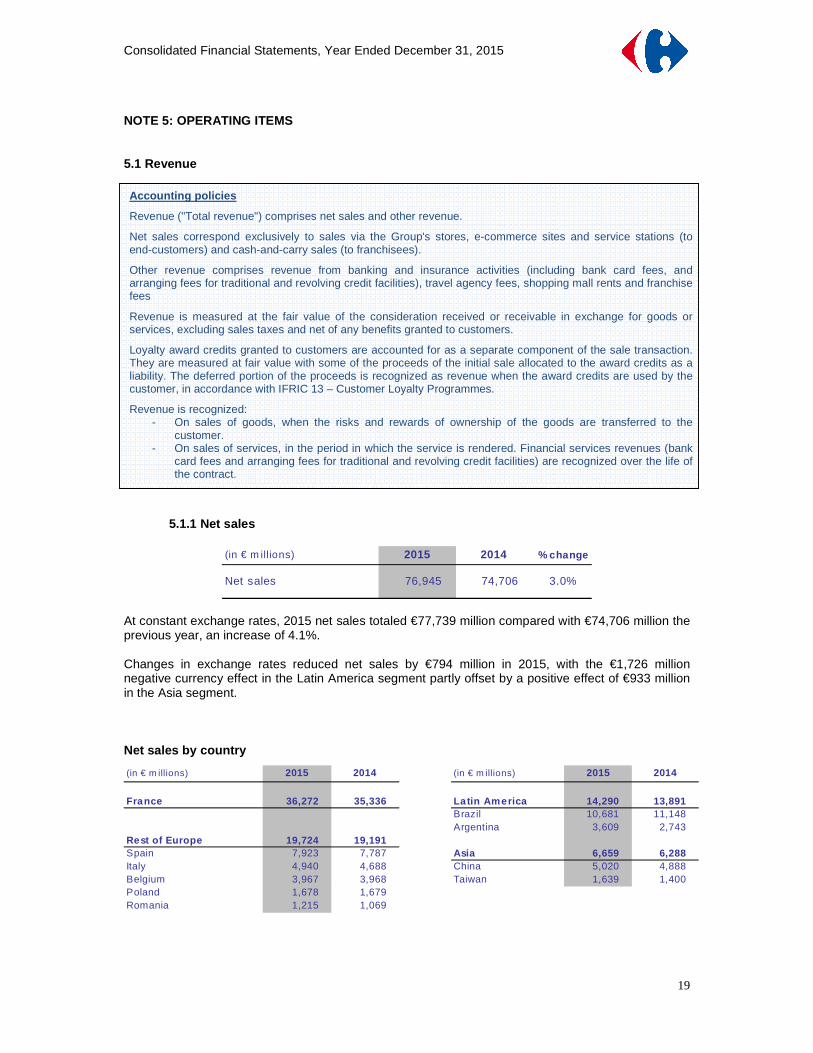
5.1.1 Net sales
(in € m illions) 2015 2014 % change
Net sales 76,945 74,706 3.0%
At constant exchange rates, 2015 net sales totaled €77,739 million compared with €74,706 million the previous year, an increase of 4.1%. Changes in exchange rates reduced net sales by €794 million in 2015, with the €1,726 million negative currency effect in the Latin America segment partly offset by a positive effect of €933 million in the Asia segment. Net sales by country
(in € m illions) 2015 2014 (in € m illions) 2015 2014
France 36,272 35,336 Latin America 14,290 13,891Brazil 10,681 11,148Argentina 3,609 2,743
Rest of Europe 19,724 19,191Spain 7,923 7,787 Asia 6,659 6,288Italy 4,940 4,688 China 5,020 4,888Belgium 3,967 3,968 Taiwan 1,639 1,400Poland 1,678 1,679Romania 1,215 1,069
Accounting policies
Revenue ("Total revenue") comprises net sales and other revenue.
Net sales correspond exclusively to sales via the Group's stores, e-commerce sites and service stations (to end-customers) and cash-and-carry sales (to franchisees).
Other revenue comprises revenue from banking and insurance activities (including bank card fees, and arranging fees for traditional and revolving credit facilities), travel agency fees, shopping mall rents and franchise fees
Revenue is measured at the fair value of the consideration received or receivable in exchange for goods or services, excluding sales taxes and net of any benefits granted to customers.
Loyalty award credits granted to customers are accounted for as a separate component of the sale transaction. They are measured at fair value with some of the proceeds of the initial sale allocated to the award credits as a liability. The deferred portion of the proceeds is recognized as revenue when the award credits are used by the customer, in accordance with IFRIC 13 – Customer Loyalty Programmes.
Revenue is recognized: - On sales of goods, when the risks and rewards of ownership of the goods are transferred to the
customer. - On sales of services, in the period in which the service is rendered. Financial services revenues (bank
card fees and arranging fees for traditional and revolving credit facilities) are recognized over the life of the contract.

Consolidated Financial Statements, Year Ended December 31, 2015
20
5.1.2 Other revenue
(in € m illions) 2015 2014 % change
Financing fees and commissions (1) 1,330 1,246 6.8%
Rental revenue 210 219 (3.8%)
Revenue from sub-leases 271 230 17.8%
Other revenue (2) 653 527 23.9%
Tota l Other revenues 2,464 2,221 10.9%
(1) Including net banking revenue generated by the Group's financial services companies. (2) The amounts reported on the line "Other revenue" in the above table correspond mainly to franchise fees, business lease
fees and ancillary revenue. 5.2 Recurring operating income
5.2.1 Cost of sales
5.2.2 Sales, general and administrative expenses, a nd depreciation and amortization (in € m illions) 2015 2014 % change
Sales, general and administrative expenses (14,105) (13,281) 6.2%Depreciation and amortization (1,470) (1,381) 6.4%
Tota l SG&A and depreciation and amortization (15,574 ) (14,662) 6.2%
Accounting policies
Cost of sales corresponds to the cost of purchases net of rebates and commercial income, changes in inventory (including impairments), discounting revenue, exchange gains and losses on goods purchases, logistics costs and other costs (primarily the cost of products sold by the financial services companies).
Rebates and commercial income are measured based on the contractual terms negotiated with suppliers.
Accounting policies
Recurring operating income is an earnings indicator disclosed in order to help users of the consolidated financial statements to better understand the Group's underlying operating performance. It corresponds to operating income (defined as earnings from continuing operations before interest and tax) before material items that are unusual in terms of their nature and frequency and are reported under "Non-recurring income" or "Non-recurring expenses" (Note 5.3).

Consolidated Financial Statements, Year Ended December 31, 2015
21
Sales, general and administrative expenses
Sales, general and administrative expenses break down as follows: (in € m illions) 2015 2014 % change
Employee benefits expense (8,209) (7,762) 5.8%
Property rentals (1,035) (908) 14.0%
Advertising expense (896) (866) 3.4%
Fees (847) (861) (1.5%)
Maintenance and repair costs (806) (722) 11.6%
Energy and electricity (673) (621) 8.4%
Taxes other than on income (598) (532) 12.2%
Other SG&A expenses (1,041) (1,008) 3.3%
Tota l SG&A expenses (14,105) (13,281) 6.2%
Depreciation and amortization
Including depreciation of logistics equipment recognized in cost of sales, total depreciation and amortization expense recognized in the consolidated income statement amounted to €1,511 million in 2015 (2014: €1,416 million), as follows:
(in € m illions) 2015 2014 % change
Property and equipm ent (1,282) (1,203) 6.5% Intangib le assets (155) (147) 4.8% Assets under finance leases (21) (19) 13.3% Investm ent property (12) (12) 2.1%
Depreciation and amortiza tion of tangible and intangible asse ts and investment property
(1,470) (1,381) 6.4%
Depreciation and amortiza tion of logistic activity (included in Cost of sales)
(41) (35) 18.8%
Total Deprecia tion and amortization (1,511) (1,416) 6. 7% 5.3 Non-recurring income and expenses
Accounting policies
In accordance with the recommendation of the French accounting authorities (Autorité des normes comptables [ANC] recommendation 2013-03 dated November 7, 2013), non-recurring income and expenses are reported on a separate line of the income statement. Non-recurring items are defined as "items that are limited in number, clearly identifiable and non-recurring that have a material impact on consolidated results".
This classification is applied to certain material items of income and expense that are unusual in terms of their nature and frequency, such as non-recurring impairment charges, restructuring costs and provision charges recorded to reflect revised estimates of risks provided for in prior periods, based on information that came to the Group's attention during the reporting year.
They are presented separately in the income statement to "help users of the financial statements to better understand the Group's underlying operating performance and provide them with useful information to assess the earnings outlook".
Consolidated Financial Statements, Year Ended December 31, 2015
22
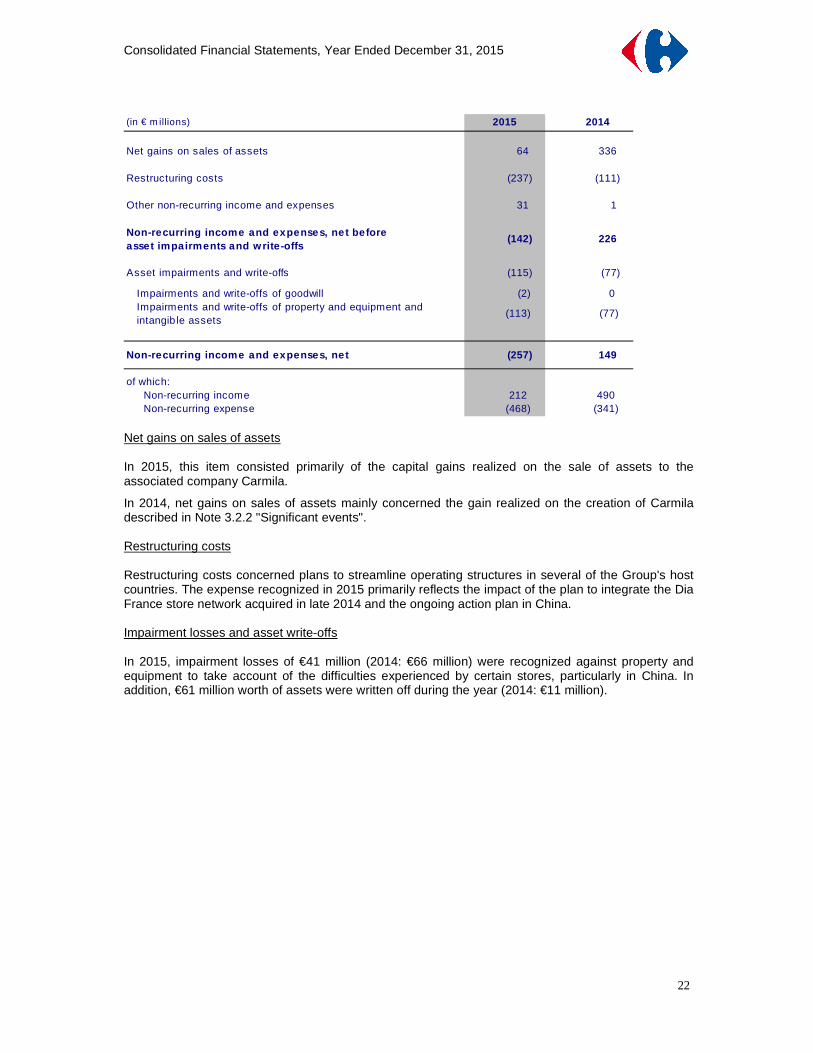
(in € m illions) 2015 2014
Net gains on sales of assets 64 336
Restructuring costs (237) (111)
Other non-recurring income and expenses 31 1
Non-recurring income and expenses, ne t before asset impairments and w rite-offs
(142) 226
Asset impairments and write-offs (115) (77)
Impairments and write-offs of goodwill (2) 0Impairments and write-offs of property and equipment and intangib le assets
(113) (77)
Non-recurring income and expenses, ne t (257) 149
of which: Non-recurring income 212 490 Non-recurring expense (468) (341)
Net gains on sales of assets In 2015, this item consisted primarily of the capital gains realized on the sale of assets to the associated company Carmila.
In 2014, net gains on sales of assets mainly concerned the gain realized on the creation of Carmila described in Note 3.2.2 "Significant events". Restructuring costs Restructuring costs concerned plans to streamline operating structures in several of the Group's host countries. The expense recognized in 2015 primarily reflects the impact of the plan to integrate the Dia France store network acquired in late 2014 and the ongoing action plan in China. Impairment losses and asset write-offs In 2015, impairment losses of €41 million (2014: €66 million) were recognized against property and equipment to take account of the difficulties experienced by certain stores, particularly in China. In addition, €61 million worth of assets were written off during the year (2014: €11 million).

Consolidated Financial Statements, Year Ended December 31, 2015
23
5.4 Working capital
5.4.1 Change in working capital The change in working capital reported in the consolidated statement of cash flows under "Cash flows from operating activities" breaks down as follows:
Working capital, like all other items in the statement of cash flows, is translated at the average rate for the period.
5.4.2 Inventories
(in € millions)December 31,
2015December 31,
2014
Inventories at cost 6,595 6,444
Impairment (233) (231)
Inventories, net 6,362 6,213
5.4.3 Trade receivables
(in € millions) December 31,
2015December 31,
2014Change
Change in inventories (528) (310) (217) Change in trade receivables (69) 80 (149) Change in trade payables 875 246 629Change in loyalty program liabilities and other (55) (78) 23
Change in trade working capital requirement 224 (63) 287
Change in other receivables and payables 52 81 (29)
Change in working capital requirement 276 18 258
Accounting policies
In accordance with IAS 2 – Inventories, goods inventories are measured at the lower of cost and net realizable value.
Cost corresponds to the latest purchase price plus all related expenses. This method is appropriate given the rapid inventory turnover, and the resulting values are close to those obtained by the first in-first out (FIFO) method. The cost of inventories includes all components of the purchase cost of goods sold (with the exception of exchange gains and losses) and takes into account the rebates and commercial income negotiated with suppliers.
Net realizable value corresponds to the estimated selling price in the ordinary course of business, less the estimated costs necessary to make the sale.
Accounting policies
Trade receivables correspond for the most part to rebates and commercial income receivable from suppliers, amounts receivable from franchisees and shopping mall rental receivables.
They represent financial instruments classified as "Loans and receivables" (Note 12).
Trade receivables are initially recognized for the invoice amount. Impairment losses are recognized where necessary, based on an estimate of the debtor’s ability to pay the amount due and the age of the receivable (Note 12.6.4).
Certain Group subsidiaries operate receivables discounting programs. In accordance with IAS 39 - Financial Instruments, receivables sold under these programs are derecognized when substantially all of the related risks and rewards (i.e., mainly default, late payment and dilution risks) are transferred to the buyer.

Consolidated Financial Statements, Year Ended December 31, 2015
24
(in € m illions)December 31,
2015December 31,
2014
Receivables from clients 1,353 1,302
Impairment (180) (185)
Receivables from clients, ne t 1,173 1,117
Receivables from suppliers 1,096 1,144
Total Trade receivables 2,269 2,260
5.4.4 Suppliers and other creditors
5.4.5 Other current assets and payables Other assets
(in € m illions)December 31,
2015December 31,
2014
Employee advances 23 23Proceeds receivable from disposals of non-current assets 23 120Prepaid expenses 288 302Other operating receivables, net 372 408
Total Other current assets 705 853 Other payables
(in € m illions)December 31,
2015December 31,
2014
Accrued employee benefits expense 1,874 1,856Due to suppliers of non-current assets 831 706Deferred revenue 121 111Other payables 419 349
Tota l Other payables 3,244 3,022
Accounting policies
Suppliers and other creditors correspond primarily to trade payables.
They are classified as "Financial liabilities at amortized cost" (Note 12). Suppliers and other creditors are initially recognized at their nominal amount, which represents a reasonable estimate of fair value in light of their short maturities.
Consolidated Financial Statements, Year Ended December 31, 2015
25
5.5 Banking activities
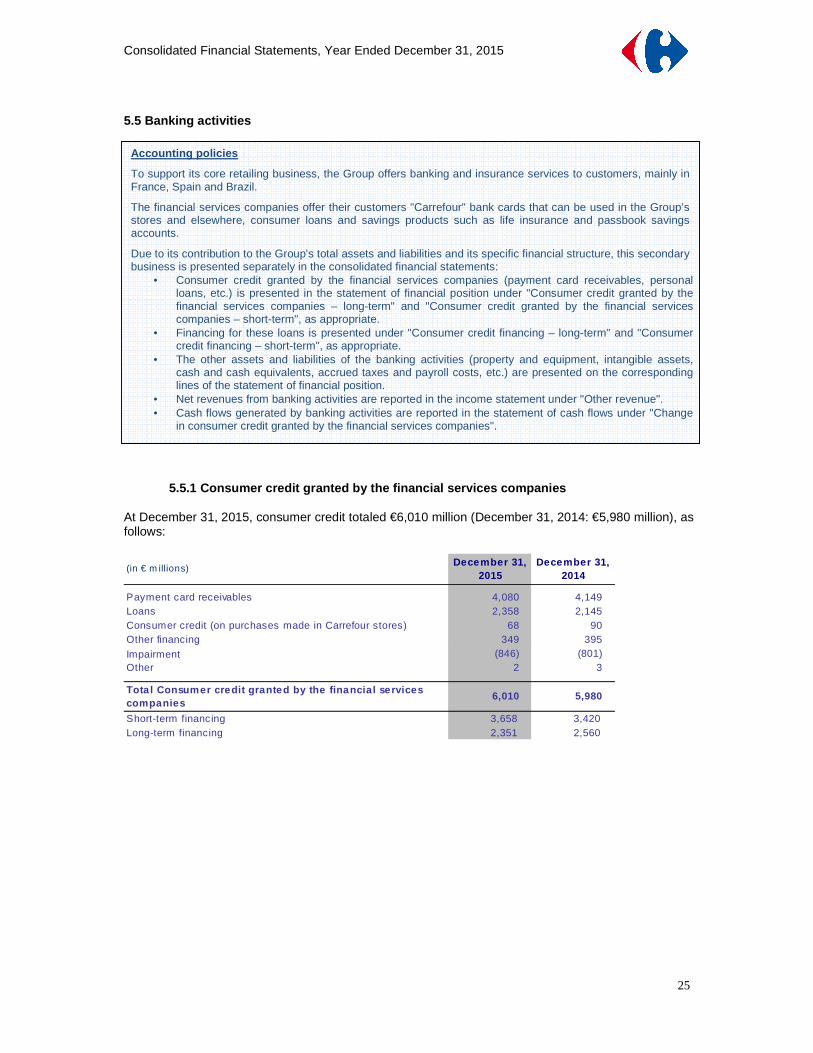
5.5.1 Consumer credit granted by the financial serv ices companies At December 31, 2015, consumer credit totaled €6,010 million (December 31, 2014: €5,980 million), as follows:
(in € m illions)December 31,
2015December 31,
2014
Payment card receivables 4,080 4,149Loans 2,358 2,145Consumer credit (on purchases made in Carrefour stores) 68 90Other financing 349 395
Impairment (846) (801)Other 2 3
Tota l Consumer credit granted by the financia l serv ices companies
6,010 5,980
Short-term financing 3,658 3,420Long-term financing 2,351 2,560
Accounting policies
To support its core retailing business, the Group offers banking and insurance services to customers, mainly in France, Spain and Brazil.
The financial services companies offer their customers "Carrefour" bank cards that can be used in the Group’s stores and elsewhere, consumer loans and savings products such as life insurance and passbook savings accounts.
Due to its contribution to the Group's total assets and liabilities and its specific financial structure, this secondary business is presented separately in the consolidated financial statements:
• Consumer credit granted by the financial services companies (payment card receivables, personal loans, etc.) is presented in the statement of financial position under "Consumer credit granted by the financial services companies – long-term" and "Consumer credit granted by the financial services companies – short-term", as appropriate.
• Financing for these loans is presented under "Consumer credit financing – long-term" and "Consumer credit financing – short-term", as appropriate.
• The other assets and liabilities of the banking activities (property and equipment, intangible assets, cash and cash equivalents, accrued taxes and payroll costs, etc.) are presented on the corresponding lines of the statement of financial position.
• Net revenues from banking activities are reported in the income statement under "Other revenue". • Cash flows generated by banking activities are reported in the statement of cash flows under "Change
in consumer credit granted by the financial services companies".
Consolidated Financial Statements, Year Ended December 31, 2015
26
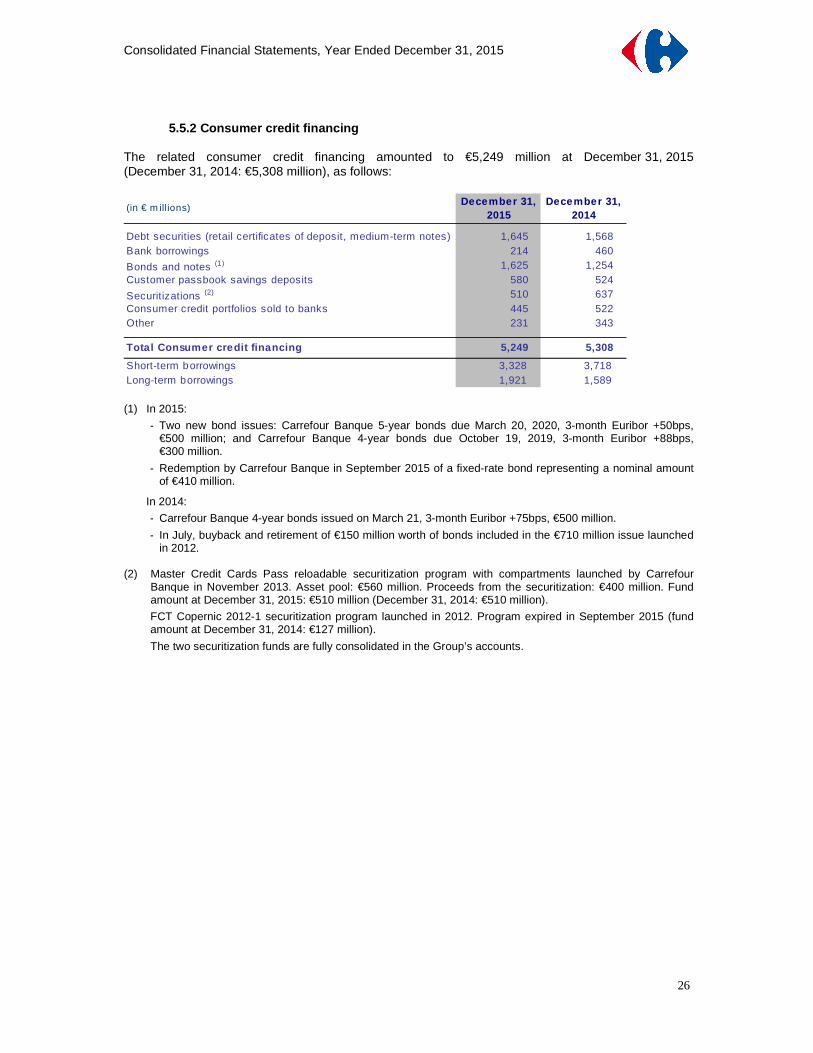
5.5.2 Consumer credit financing The related consumer credit financing amounted to €5,249 million at December 31, 2015 (December 31, 2014: €5,308 million), as follows:
(in € m illions)December 31,
2015December 31,
2014
Debt securities (retail certificates of deposit, medium-term notes) 1,645 1,568Bank borrowings 214 460
Bonds and notes (1) 1,625 1,254Customer passbook savings deposits 580 524
Securitizations (2) 510 637Consumer credit portfolios sold to banks 445 522Other 231 343
Total Consumer credit financing 5,249 5,308
Short-term borrowings 3,328 3,718Long-term borrowings 1,921 1,589 (1) In 2015:
- Two new bond issues: Carrefour Banque 5-year bonds due March 20, 2020, 3-month Euribor +50bps, €500 million; and Carrefour Banque 4-year bonds due October 19, 2019, 3-month Euribor +88bps, €300 million.
- Redemption by Carrefour Banque in September 2015 of a fixed-rate bond representing a nominal amount of €410 million.
In 2014:
- Carrefour Banque 4-year bonds issued on March 21, 3-month Euribor +75bps, €500 million.
- In July, buyback and retirement of €150 million worth of bonds included in the €710 million issue launched in 2012.
(2) Master Credit Cards Pass reloadable securitization program with compartments launched by Carrefour
Banque in November 2013. Asset pool: €560 million. Proceeds from the securitization: €400 million. Fund amount at December 31, 2015: €510 million (December 31, 2014: €510 million).
FCT Copernic 2012-1 securitization program launched in 2012. Program expired in September 2015 (fund amount at December 31, 2014: €127 million).
The two securitization funds are fully consolidated in the Group’s accounts.

Consolidated Financial Statements, Year Ended December 31, 2015
27
NOTE 6: INTANGIBLE ASSETS, PROPERTY AND EQUIPMENT, INVESTMENT PROPERTY 6.1 Intangible assets Goodwill, which constitutes the main intangible asset, is reported on a separate line of the statement of financial position from other intangible assets.
6.1.1 Goodwill The recoverable amount of goodwill is generally monitored at the level of the cash-generating units (CGUs) represented by the countries in which the Group conducts its business through its integrated store networks. During 2015, the total carrying amount of goodwill increased by €267 million, primarily due to (i) final adjustments in the second half of 2015 to the fair value of the assets acquired and liabilities assumed in the Dia business combination, leading to a corresponding adjustment of the related goodwill (Note 3.2.2) and (ii) the reclassification as goodwill of items presented in "Other intangible assets" in 2014, partly offset by (iii) translation adjustments to goodwill in Brazil and Argentina.
(in € m illions)Net goodw ill a t December 31,
2014Acquisitions Disposals Impairment
Other movements
Translation adjustment
Net goodw ill a t December 31,
2015
France 4,285 90 343 4,718
Italy 963 1 1 964
Belgium 959 (2) 957
Spain 862 862
Brazil 613 (149) 465
Poland 246 1 246
Argentina 86 (23) 63
Other countries 214 6 220
Total 8,228 91 0 (2) 343 (165) 8,495
(in € millions)December 31,
2015December 31,
2014
Goodwill, net 8,495 8,228
Other intangible assets 1,014 1,315
Intangible assets, net 9,510 9,543
Accounting policies
Goodwill Goodwill is initially recognized on business combinations as explained in Note 3.1.
In accordance with IAS 36 – Impairment of Assets, goodwill recognized on business combinations is not amortized but is tested for impairment every year, or more frequently if there is an indication that its carrying amount may not be recovered, by the method described in Note 6.3.
Other intangible assets
Intangible assets consist mainly of software and other intangible assets related to the stores.
Separately acquired intangible assets are initially recognized at cost and intangible assets acquired in business combinations are recognized at fair value (Note 3.1).
Software is amortized by the straight-line method over periods ranging from one to eight years.

Consolidated Financial Statements, Year Ended December 31, 2015
28
(in € m illions)Net goodw ill a t December 31,
2013Acquisitions Disposa ls Impairment
Other movements
Translation adjustment
Net goodwill at December 31,
2014
France 4,394 215 (2) (321) 4,285
Italy 899 64 963
Belgium 959 959
Spain 862 862
Brazil 606 7 613
Poland 253 (7) 246
Argentina 98 (12) 86
Other countries 206 8 214
Total 8,277 279 (2) 0 (321) (4) 8,228
6.1.2 Other intangible assets
(in € m illions)December 31,
2015December 31,
2014
Other intangible assets, at cost 3,214 3,796
Amortization (2,243) (2,380)Impairment (136) (247)Intangible assets in progress 179 146
Other intangible assets, net 1,014 1,315
Change in other intangible assets (in € m illions) Cost
Amortiza tion and impairment
Net
At December 31, 2013 3,044 (2,277) 767Acquisitions 287 287Disposals (62) 42 (20)Translation adjustment 4 (4) 0Amortization (153) (153)Impairment (5) (5)
Changes in scope of consolidation, transfers and other movements 667 (229) 438At December 31, 2014 3,940 (2,625) 1,315Acquisitions 302 302Disposals (106) 67 (39)Translation adjustment (98) 69 (29)Amortization (161) (161)Impairment (26) (26)
Changes in scope of consolidation, transfers and other movements (645) 297 (347)At December 31, 2015 3,393 (2,379) 1,014
Consolidated Financial Statements, Year Ended December 31, 2015
29
6.2 Property and equipment
Accounting policies
Property and equipment mainly comprise buildings, store fixtures and fittings and land.
Initial recognition
In accordance with IAS 16 – Property, Plant and Equipment, land, buildings and equipment are stated at cost less accumulated depreciation and any accumulated impairment losses. Borrowing costs that are directly attributable to the acquisition, construction or production of a qualifying asset are capitalized as part of the cost of the asset. Qualifying assets are defined in IAS 23 – Borrowing Costs as assets that necessarily take a substantial period of time to get ready for their intended use or sale, corresponding in the Group's case to investment properties, hypermarkets and supermarkets for which the construction period exceeds one year.
Assets under construction are recognized at cost less any identified impairment losses.
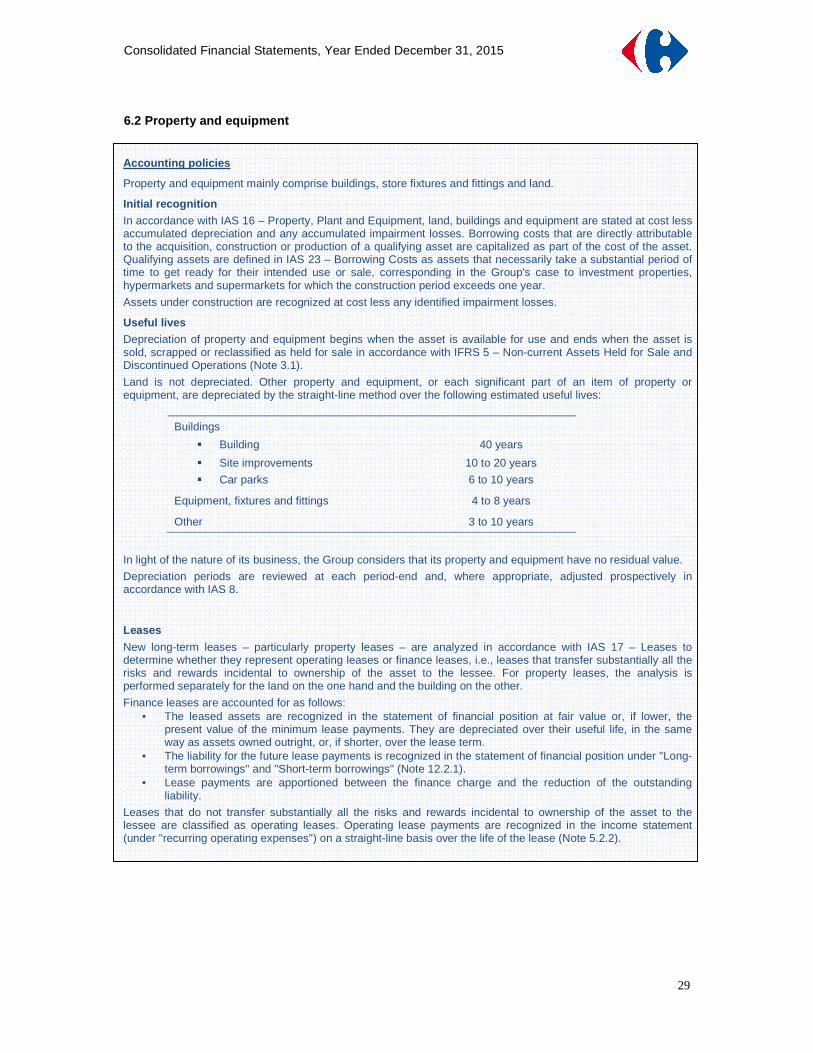
Useful lives Depreciation of property and equipment begins when the asset is available for use and ends when the asset is sold, scrapped or reclassified as held for sale in accordance with IFRS 5 – Non-current Assets Held for Sale and Discontinued Operations (Note 3.1).
Land is not depreciated. Other property and equipment, or each significant part of an item of property or equipment, are depreciated by the straight-line method over the following estimated useful lives:
Buildings
� Building 40 years
� Site improvements 10 to 20 years
� Car parks 6 to 10 years
Equipment, fixtures and fittings 4 to 8 years
Other 3 to 10 years
In light of the nature of its business, the Group considers that its property and equipment have no residual value.
Depreciation periods are reviewed at each period-end and, where appropriate, adjusted prospectively in accordance with IAS 8.
Leases
New long-term leases – particularly property leases – are analyzed in accordance with IAS 17 – Leases to determine whether they represent operating leases or finance leases, i.e., leases that transfer substantially all the risks and rewards incidental to ownership of the asset to the lessee. For property leases, the analysis is performed separately for the land on the one hand and the building on the other.
Finance leases are accounted for as follows: • The leased assets are recognized in the statement of financial position at fair value or, if lower, the
present value of the minimum lease payments. They are depreciated over their useful life, in the same way as assets owned outright, or, if shorter, over the lease term.
• The liability for the future lease payments is recognized in the statement of financial position under "Long-term borrowings" and "Short-term borrowings" (Note 12.2.1).
• Lease payments are apportioned between the finance charge and the reduction of the outstanding liability.
Leases that do not transfer substantially all the risks and rewards incidental to ownership of the asset to the lessee are classified as operating leases. Operating lease payments are recognized in the income statement (under "recurring operating expenses") on a straight-line basis over the life of the lease (Note 5.2.2).
Consolidated Financial Statements, Year Ended December 31, 2015
30
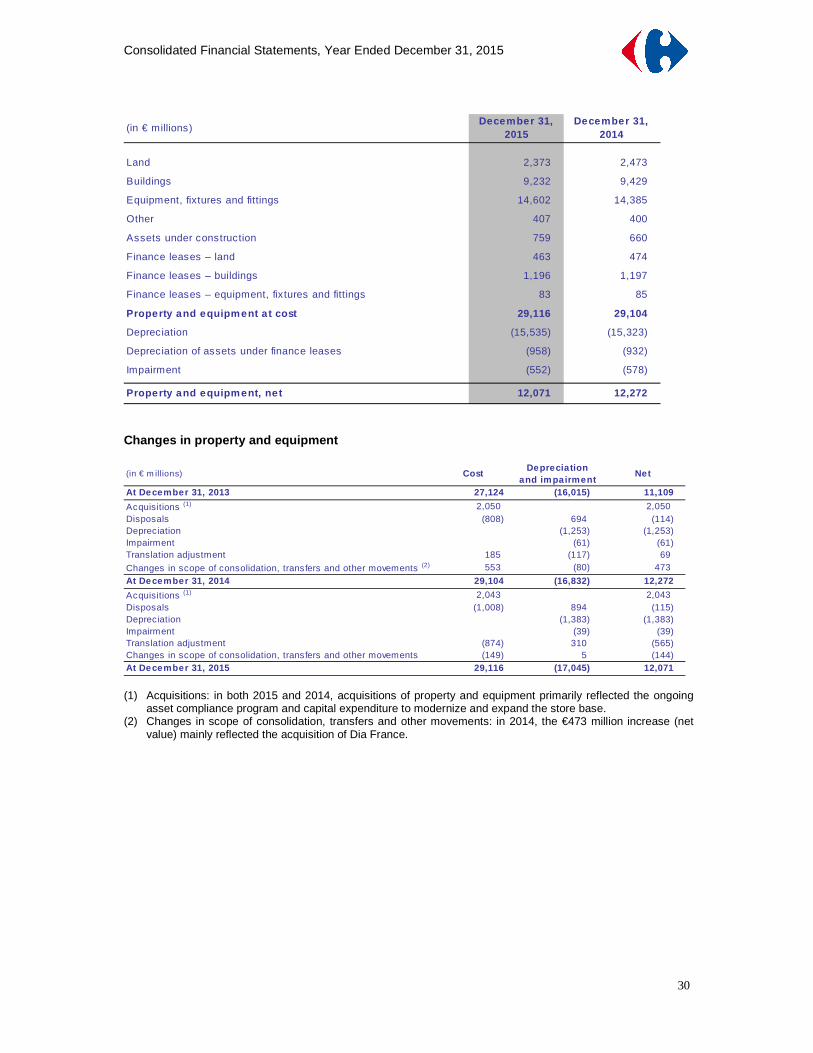
(in € millions)December 31,
2015December 31,
2014
Land 2,373 2,473
Buildings 9,232 9,429
Equipment, fixtures and fittings 14,602 14,385
Other 407 400
Assets under construction 759 660
Finance leases – land 463 474
Finance leases – buildings 1,196 1,197
Finance leases – equipment, fixtures and fittings 83 85
Property and equipment a t cost 29,116 29,104
Depreciation (15,535) (15,323)
Depreciation of assets under finance leases (958) (932)
Impairment (552) (578)
Property and equipment, ne t 12,071 12,272
Changes in property and equipment (in € m illions) Cost
Depreciation and impairment
Net
At December 31, 2013 27,124 (16,015) 11,109
Acquisitions (1) 2,050 2,050 Disposals (808) 694 (114)Depreciation (1,253) (1,253)Impairment (61) (61)Translation adjustment 185 (117) 69
Changes in scope of consolidation, transfers and other movements (2) 553 (80) 473
At December 31, 2014 29,104 (16,832) 12,272
Acquisitions (1) 2,043 2,043 Disposals (1,008) 894 (115)Depreciation (1,383) (1,383)Impairment (39) (39)Translation adjustment (874) 310 (565)Changes in scope of consolidation, transfers and other movements (149) 5 (144)At December 31, 2015 29,116 (17,045) 12,071 (1) Acquisitions: in both 2015 and 2014, acquisitions of property and equipment primarily reflected the ongoing
asset compliance program and capital expenditure to modernize and expand the store base. (2) Changes in scope of consolidation, transfers and other movements: in 2014, the €473 million increase (net
value) mainly reflected the acquisition of Dia France.
Consolidated Financial Statements, Year Ended December 31, 2015
31
6.3 Impairment tests
Accounting policies
In accordance with IAS 36 – Impairment of Assets, intangible assets and property and equipment are tested for impairment whenever events or changes in the market environment indicate that the recoverable amount of an individual asset and/or a cash-generating unit (CGU) may be less than its carrying amount. For assets with an indefinite useful life – mainly goodwill in the case of the Carrefour Group – the test is performed at least once a year.
Individual assets or groups of assets are tested for impairment by comparing their carrying amount to their recoverable amount, defined as the higher of their fair value less costs of disposal and their value in use. Value in use is the present value of the future cash flows expected to be derived from the asset.
If the recoverable amount is less than the carrying amount, an impairment loss is recognized for the difference. Impairment losses on property and equipment and intangible assets (other than goodwill) may be reversed in future periods provided that the asset’s increased carrying amount attributable to the reversal does not exceed the carrying amount that would have been determined, net of depreciation or amortization, had no impairment loss been recognized for the asset in prior years.
Impairment of assets other than goodwill
Impairment tests on property and equipment are performed at the level of the individual stores (CGUs), for all formats.
In accordance with IAS 36, intangible assets (other than goodwill) and property and equipment are tested for impairment whenever there is an indication that their recoverable amount may be less than their carrying amount. All stores that report a recurring operating loss before depreciation and amortization for two consecutive years (after the start-up period) are tested.
Recoverable amount is defined as the higher of fair value less costs of disposal and value in use.
Value in use is considered as being equal to the store’s discounted future cash flows over a period of up to five years plus a terminal value. Fair value is estimated based on the prices of recent transactions, industry practice, independent valuations or the estimated price at which the store could be sold to a competitor.
The discount rate applied is the same as for impairment tests on goodwill.
Goodwill impairment
IAS 36 requires impairment tests to be performed annually at the level of each CGU or group of CGUs to which the goodwill is allocated.
According to the standard, goodwill is allocated to the CGU or group of CGUs that is expected to benefit from the synergies of the business combination. Each unit or group of units to which the goodwill is so allocated should represent the lowest level within the entity at which the goodwill is monitored for internal management purposes and should not be larger than an operating segment as defined in IFRS 8 – Operating Segments before aggregation.
For the purpose of analyzing the recoverable amount of goodwill, each individual country is considered as representing a separate CGU. The choice of this level is based on a combination of organizational and strategic criteria:
• Operations within each country (hypermarkets, supermarkets, etc.) use shared resources (country-level centralized purchasing organization, marketing systems, headquarters functions, etc.) that represent an essential source of synergies between the various operations.
• Decisions to dispose of business portfolios are generally made at country level and it is rare for just a single store to be sold.
Value in use is considered as corresponding to the sum of discounted future cash flows for a period generally not exceeding five years, plus a terminal value calculated by projecting data for the final year to perpetuity at a perpetual growth rate. A specific discount rate by country is used for the calculation. Future cash flows are estimated based on the three-year business plan drawn up by country management and approved by Group management.
Consolidated Financial Statements, Year Ended December 31, 2015
32
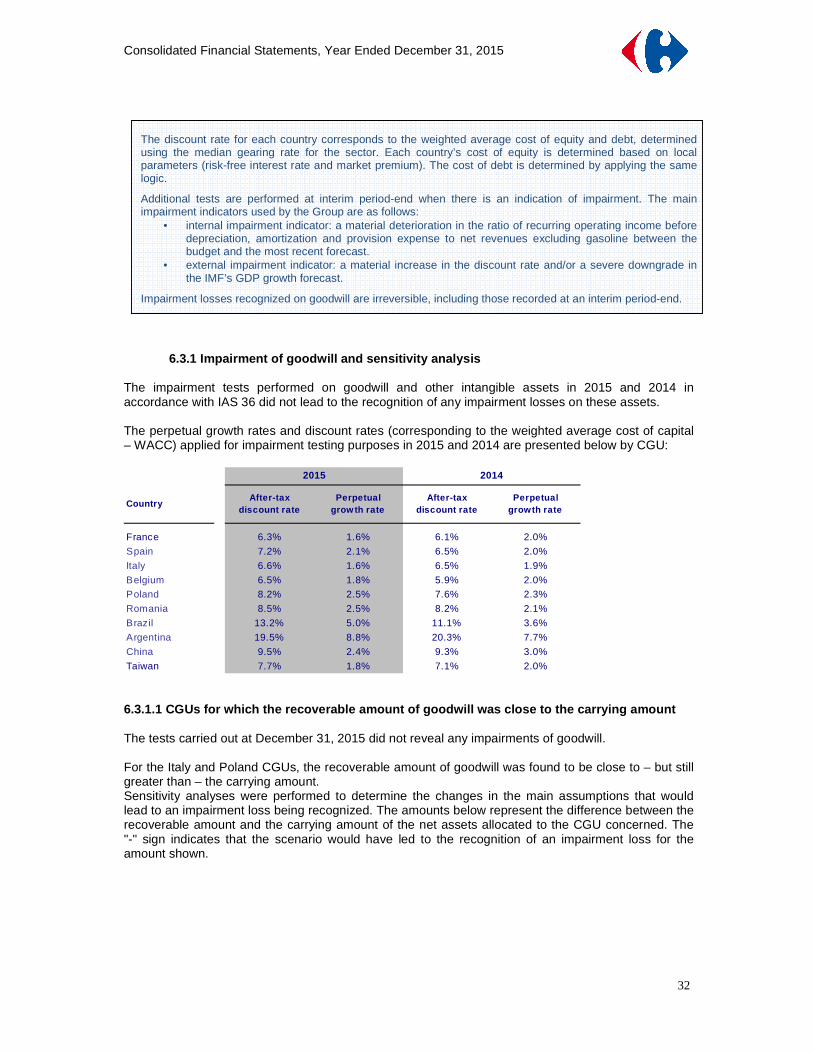
6.3.1 Impairment of goodwill and sensitivity analys is The impairment tests performed on goodwill and other intangible assets in 2015 and 2014 in accordance with IAS 36 did not lead to the recognition of any impairment losses on these assets. The perpetual growth rates and discount rates (corresponding to the weighted average cost of capital – WACC) applied for impairment testing purposes in 2015 and 2014 are presented below by CGU:
CountryAfter-tax
discount ratePerpetual
grow th rateAfter-tax
discount ratePerpetual
growth rate
France 6.3% 1.6% 6.1% 2.0%
Spain 7.2% 2.1% 6.5% 2.0%
Italy 6.6% 1.6% 6.5% 1.9%
Belgium 6.5% 1.8% 5.9% 2.0%
Poland 8.2% 2.5% 7.6% 2.3%
Romania 8.5% 2.5% 8.2% 2.1%
Brazil 13.2% 5.0% 11.1% 3.6%
Argentina 19.5% 8.8% 20.3% 7.7%
China 9.5% 2.4% 9.3% 3.0%
Taiwan 7.7% 1.8% 7.1% 2.0%
2015 2014
6.3.1.1 CGUs for which the recoverable amount of go odwill was close to the carrying amount The tests carried out at December 31, 2015 did not reveal any impairments of goodwill. For the Italy and Poland CGUs, the recoverable amount of goodwill was found to be close to – but still greater than – the carrying amount. Sensitivity analyses were performed to determine the changes in the main assumptions that would lead to an impairment loss being recognized. The amounts below represent the difference between the recoverable amount and the carrying amount of the net assets allocated to the CGU concerned. The "-" sign indicates that the scenario would have led to the recognition of an impairment loss for the amount shown.
The discount rate for each country corresponds to the weighted average cost of equity and debt, determined using the median gearing rate for the sector. Each country’s cost of equity is determined based on local parameters (risk-free interest rate and market premium). The cost of debt is determined by applying the same logic.
Additional tests are performed at interim period-end when there is an indication of impairment. The main impairment indicators used by the Group are as follows:
• internal impairment indicator: a material deterioration in the ratio of recurring operating income before depreciation, amortization and provision expense to net revenues excluding gasoline between the budget and the most recent forecast.
• external impairment indicator: a material increase in the discount rate and/or a severe downgrade in the IMF’s GDP growth forecast.
Impairment losses recognized on goodwill are irreversible, including those recorded at an interim period-end.

Consolidated Financial Statements, Year Ended December 31, 2015
33
6.3.1.2 Other countries For the other countries where the Group conducts business, the analysis of sensitivity to a simultaneous change in the key inputs based on reasonably possible assumptions (such as those presented above for Italy and Poland) did not reveal any probable scenario according to which the recoverable amount of any of the groups of CGUs would be less than its carrying amount. 6.4 Investment property
Italy
-1.0% -0.50% 0.00% 0.50% 1.0% -1.00% -0.50% 0.00% 0.50% 1.00%
-0.50% 472 222 19 (151) (293) -0.50% (264) (221) (176) (131) (85)
-0.25% 611 333 109 (75) (230) -0.25% (81) (33) 16 67 119
0.00% 768 457 209 7 (161) 0.00% 101 155 209 265 322
0.25% 945 595 319 97 (87) 0.25% 284 342 402 463 526
0.50% 1,148 750 442 196 (5) 0.50% 466 530 595 661 729
* Adjustment variable for each of the years covered by the business plan
Poland
-1.0% -0.50% 0.00% 0.50% 1.0% -1.00% -0.50% 0.00% 0.50% 1.00%
-0.50% 89 15 (47) (100) (145) -0.50% (148) (136) (123) (69) (55)
-0.25% 137 55 (13) (70) (119) -0.25% (82) (68) (53) 8 25
0.00% 191 99 24 (39) (92) 0.00% (16) 1 24 34 52
0.25% 251 148 65 (4) (62) 0.25% 50 69 87 107 127
0.50% 317 202 110 34 (30) 0.50% 117 137 158 179 201
* Adjustment variable for each of the years covered by the business plan
Pe
rpetu
al
gro
wth
(%
)Sensitivity to changes in net sales and EBITDA marg in growth rates
Net sales growth (%)*
EB
ITD
A
marg
in
gro
wth
(%
)*
Sensitivity to changes in WACC and perpetual growth rate
WACC (%)
Sensitivity to changes in WACC and perpetual growth rate Sensitivity to changes in net sales and EBITDA margin growth rates
WACC (%) Net sales growth (%)*
Pe
rpetu
al
gro
wth
(%
)
EB
IT
DA
ma
rgin
gro
wth
(%
)*
Accounting policies
IAS 40 – Investment Property defines investment property as property (land or a building or both) held to earn rentals or for capital appreciation or both. Based on this definition, investment property held by the Group consists of shopping malls (retail and service units located behind the stores’ check-out area) that are exclusively or jointly owned or subject to a finance lease and represent a surface area of at least 2,500 square meters. These assets generate cash flows that are largely independent of the cash flows generated by the Group's other retail assets.
Investment property is recognized at cost and is depreciated over the same period as owner-occupied property (Note 6.2).
Rental revenue generated by investment property is reported in the income statement under "Other revenue" on a straight-line basis over the lease term. The rewards granted by the Group under its leases are an integral part of the net rental revenue and are recognized over the lease term (Note 6.2).
The fair value of investment property is measured twice a year • by applying a multiple that is a function of (i) each shopping mall’s profitability and (ii) a country-specific
capitalization rate, to the gross annualized rental revenue generated by each property, or • by obtaining independent valuations prepared using two methods: the discounted cash flows method
and the yield method. Valuers generally also compare the results of applying these methods to market values per square meter and to recent transaction values.
In view of the limited external data available, particularly concerning capitalization rates, the complexity of the property valuation process and the fact that valuations are based on passing rents for the Group’s own properties, the fair value of investment property is considered as being determined on the basis of level 3 inputs.
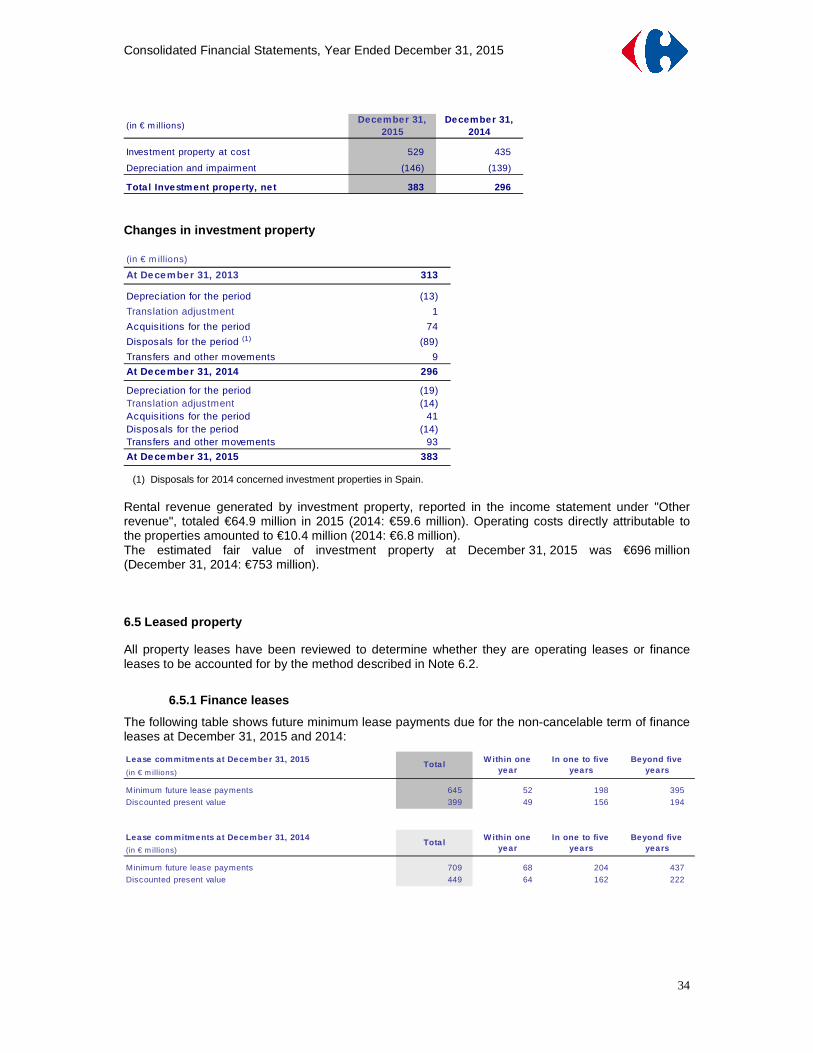
Consolidated Financial Statements, Year Ended December 31, 2015
34
(in € m illions)December 31,
2015December 31,
2014
Investment property at cost 529 435
Depreciation and impairment (146) (139)
Tota l Investment property, ne t 383 296 Changes in investment property (in € m illions)
At December 31, 2013 313
Depreciation for the period (13)
Translation adjustment 1
Acquisitions for the period 74
Disposals for the period (1) (89)
Transfers and other movements 9
At December 31, 2014 296
Depreciation for the period (19)Translation adjustment (14)Acquisitions for the period 41Disposals for the period (14)Transfers and other movements 93
At December 31, 2015 383 (1) Disposals for 2014 concerned investment properties in Spain.
Rental revenue generated by investment property, reported in the income statement under "Other revenue", totaled €64.9 million in 2015 (2014: €59.6 million). Operating costs directly attributable to the properties amounted to €10.4 million (2014: €6.8 million). The estimated fair value of investment property at December 31, 2015 was €696 million (December 31, 2014: €753 million). 6.5 Leased property All property leases have been reviewed to determine whether they are operating leases or finance leases to be accounted for by the method described in Note 6.2.
6.5.1 Finance leases
The following table shows future minimum lease payments due for the non-cancelable term of finance leases at December 31, 2015 and 2014:
Lease commitments at December 31, 2015
(in € m illions)
Minimum future lease payments 645 52 198 395
Discounted present value 399 49 156 194
Lease commitments at December 31, 2014
(in € m illions)
Minimum future lease payments 709 68 204 437
Discounted present value 449 64 162 222
Tota lW ithin one
yearIn one to five
yearsBeyond five
years
Tota lW ithin one
yearIn one to five
yearsBeyond five
years
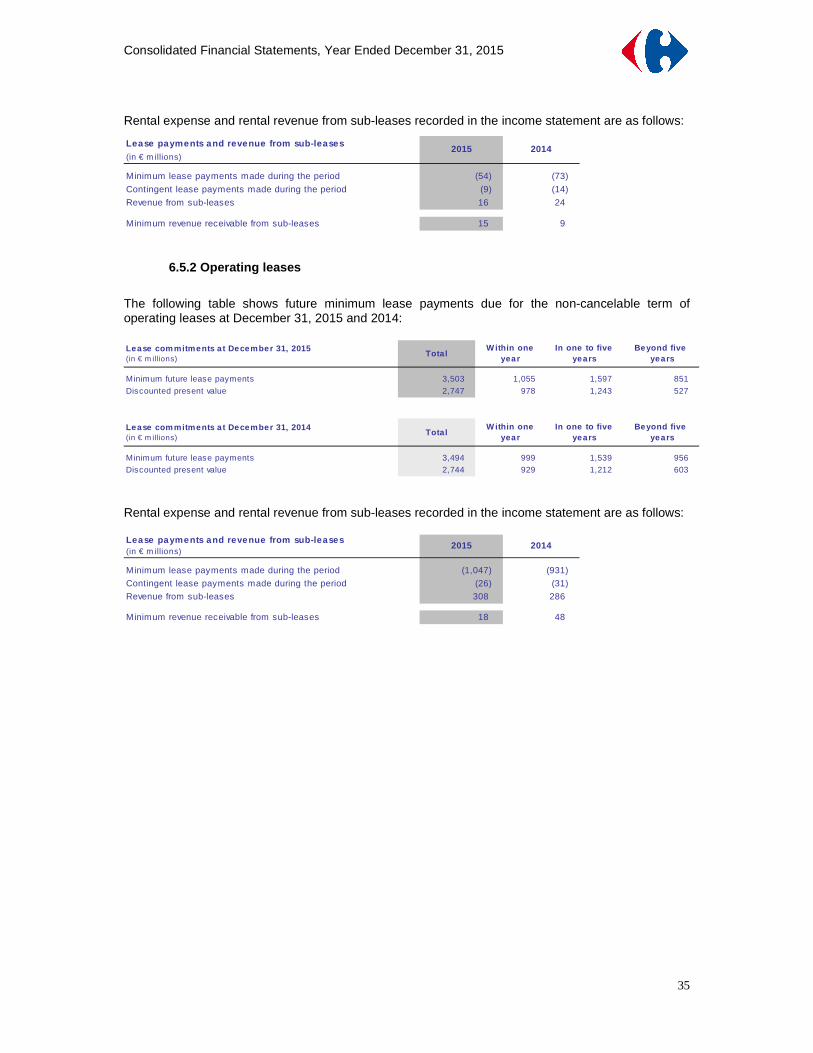
Consolidated Financial Statements, Year Ended December 31, 2015
35
Rental expense and rental revenue from sub-leases recorded in the income statement are as follows:
Lease payments and revenue from sub-leases(in € m illions)
Minimum lease payments made during the period (54) (73)
Contingent lease payments made during the period (9) (14)
Revenue from sub-leases 16 24
Minimum revenue receivable from sub-leases 15 9
2015 2014
6.5.2 Operating leases
The following table shows future minimum lease payments due for the non-cancelable term of operating leases at December 31, 2015 and 2014: Lease commitments a t December 31, 2015(in € m illions)
TotalW ithin one
year In one to five
yearsBeyond five
years
Minimum future lease payments 3,503 1,055 1,597 851
Discounted present value 2,747 978 1,243 527
Lease commitments a t December 31, 2014(in € m illions)
TotalW ithin one
year In one to five
yearsBeyond five
years
Minimum future lease payments 3,494 999 1,539 956
Discounted present value 2,744 929 1,212 603
Rental expense and rental revenue from sub-leases recorded in the income statement are as follows: Lease payments and revenue from sub-leases(in € m illions)
Minimum lease payments made during the period (1,047) (931)
Contingent lease payments made during the period (26) (31)
Revenue from sub-leases 308 286
Minimum revenue receivable from sub-leases 18 48
2015 2014
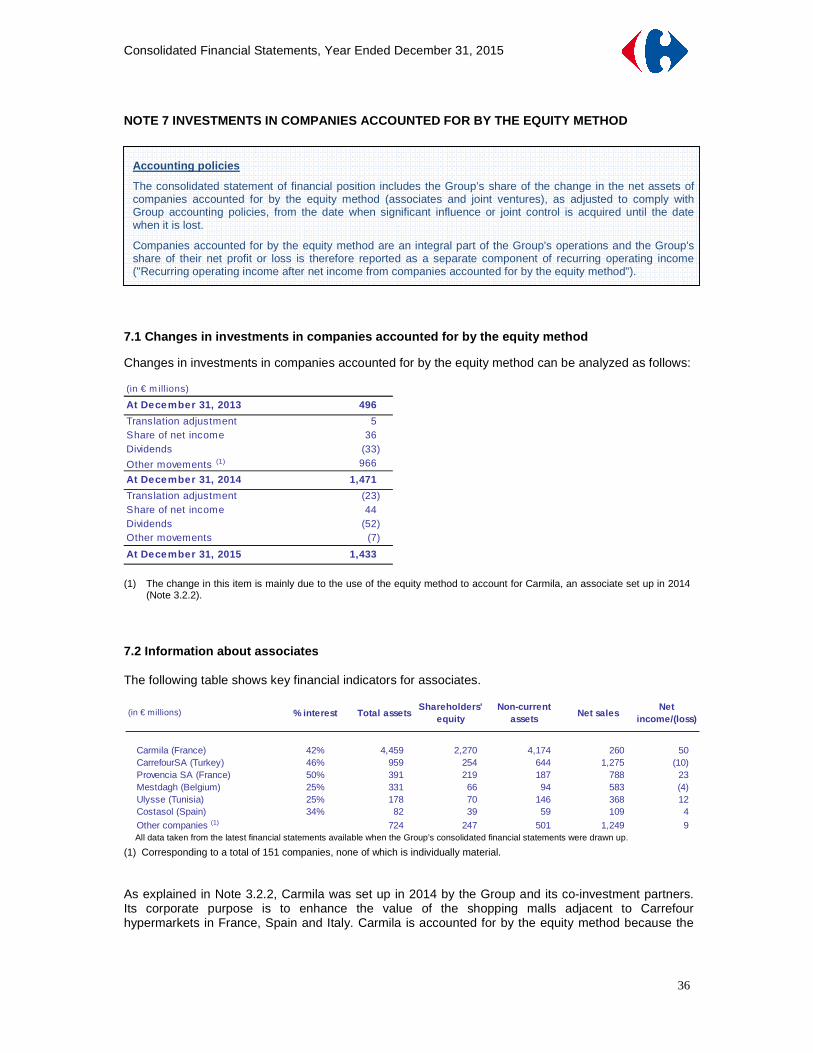
Consolidated Financial Statements, Year Ended December 31, 2015
36
NOTE 7 INVESTMENTS IN COMPANIES ACCOUNTED FOR BY TH E EQUITY METHOD 7.1 Changes in investments in companies accounted f or by the equity method Changes in investments in companies accounted for by the equity method can be analyzed as follows: (in € m illions)
At December 31, 2013 496
Translation adjustment 5 Share of net income 36 Dividends (33)
Other movements (1) 966
At December 31, 2014 1,471
Translation adjustment (23)Share of net income 44 Dividends (52)Other movements (7)
At December 31, 2015 1,433
(1) The change in this item is mainly due to the use of the equity method to account for Carmila, an associate set up in 2014
(Note 3.2.2). 7.2 Information about associates The following table shows key financial indicators for associates.
All data taken from the latest financial statements available when the Group’s consolidated financial statements were drawn up.
(1) Corresponding to a total of 151 companies, none of which is individually material. As explained in Note 3.2.2, Carmila was set up in 2014 by the Group and its co-investment partners. Its corporate purpose is to enhance the value of the shopping malls adjacent to Carrefour hypermarkets in France, Spain and Italy. Carmila is accounted for by the equity method because the
(in € millions) % interest Total assetsShareholders'
equityNon-current
assetsNet sales
Net income/(loss)
Carmila (France) 42% 4,459 2,270 4,174 260 50CarrefourSA (Turkey) 46% 959 254 644 1,275 (10)Provencia SA (France) 50% 391 219 187 788 23Mestdagh (Belgium) 25% 331 66 94 583 (4)Ulysse (Tunisia) 25% 178 70 146 368 12Costasol (Spain) 34% 82 39 59 109 4
Other companies (1) 724 247 501 1,249 9
Accounting policies
The consolidated statement of financial position includes the Group’s share of the change in the net assets of companies accounted for by the equity method (associates and joint ventures), as adjusted to comply with Group accounting policies, from the date when significant influence or joint control is acquired until the date when it is lost.
Companies accounted for by the equity method are an integral part of the Group's operations and the Group's share of their net profit or loss is therefore reported as a separate component of recurring operating income ("Recurring operating income after net income from companies accounted for by the equity method").
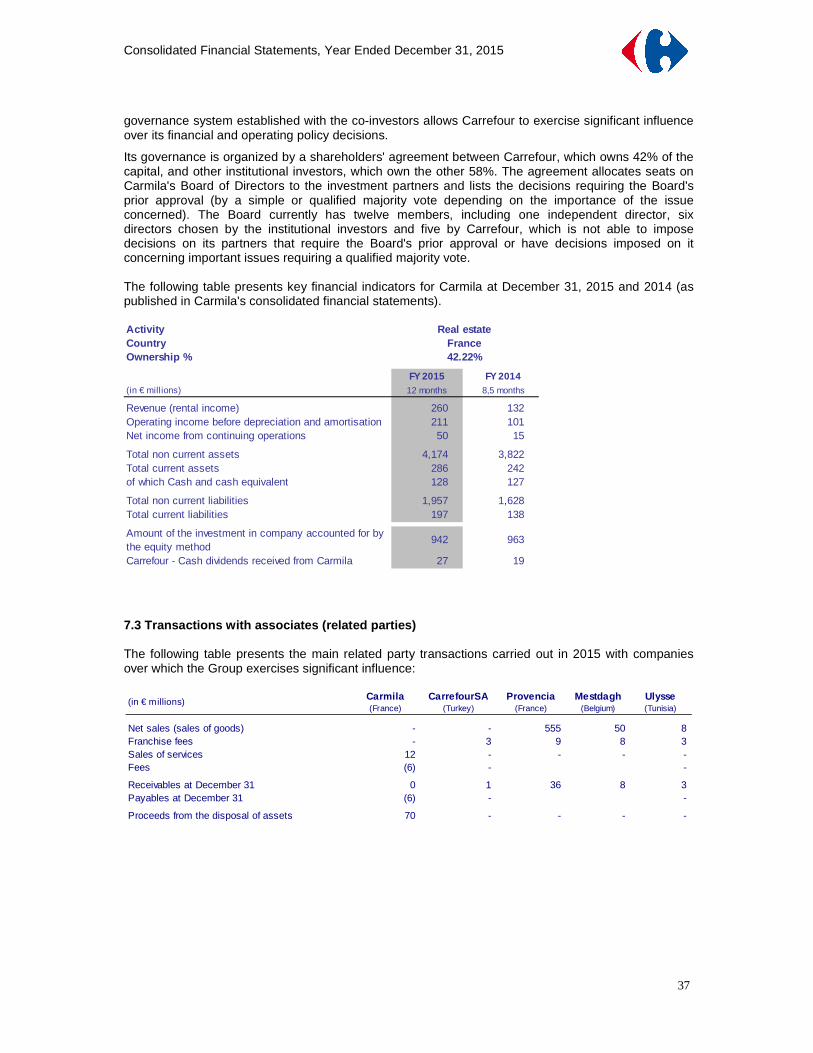
Consolidated Financial Statements, Year Ended December 31, 2015
37
governance system established with the co-investors allows Carrefour to exercise significant influence over its financial and operating policy decisions.
Its governance is organized by a shareholders' agreement between Carrefour, which owns 42% of the capital, and other institutional investors, which own the other 58%. The agreement allocates seats on Carmila's Board of Directors to the investment partners and lists the decisions requiring the Board's prior approval (by a simple or qualified majority vote depending on the importance of the issue concerned). The Board currently has twelve members, including one independent director, six directors chosen by the institutional investors and five by Carrefour, which is not able to impose decisions on its partners that require the Board's prior approval or have decisions imposed on it concerning important issues requiring a qualified majority vote. The following table presents key financial indicators for Carmila at December 31, 2015 and 2014 (as published in Carmila's consolidated financial statements).
7.3 Transactions with associates (related parties) The following table presents the main related party transactions carried out in 2015 with companies over which the Group exercises significant influence:
ActivityCountryOwnership %
FY 2015 FY 2014(in € millions) 12 months 8,5 months
Revenue (rental income) 260 132 Operating income before depreciation and amortisation 211 101 Net income from continuing operations 50 15
Total non current assets 4,174 3,822 Total current assets 286 242 of which Cash and cash equivalent 128 127
Total non current liabilities 1,957 1,628 Total current liabilities 197 138
Amount of the investment in company accounted for by the equity method
942 963
Carrefour - Cash dividends received from Carmila 27 19
Real estateFrance42.22%
(in € millions) Carmila(France)
CarrefourSA(Turkey)
Provencia(France)
Mestdagh(Belgium)
Ulysse(Tunisia)
Net sales (sales of goods) - - 555 50 8Franchise fees - 3 9 8 3Sales of services 12 - - - - Fees (6) - -
Receivables at December 31 0 1 36 8 3Payables at December 31 (6) - -
Proceeds from the disposal of assets 70 - - - -
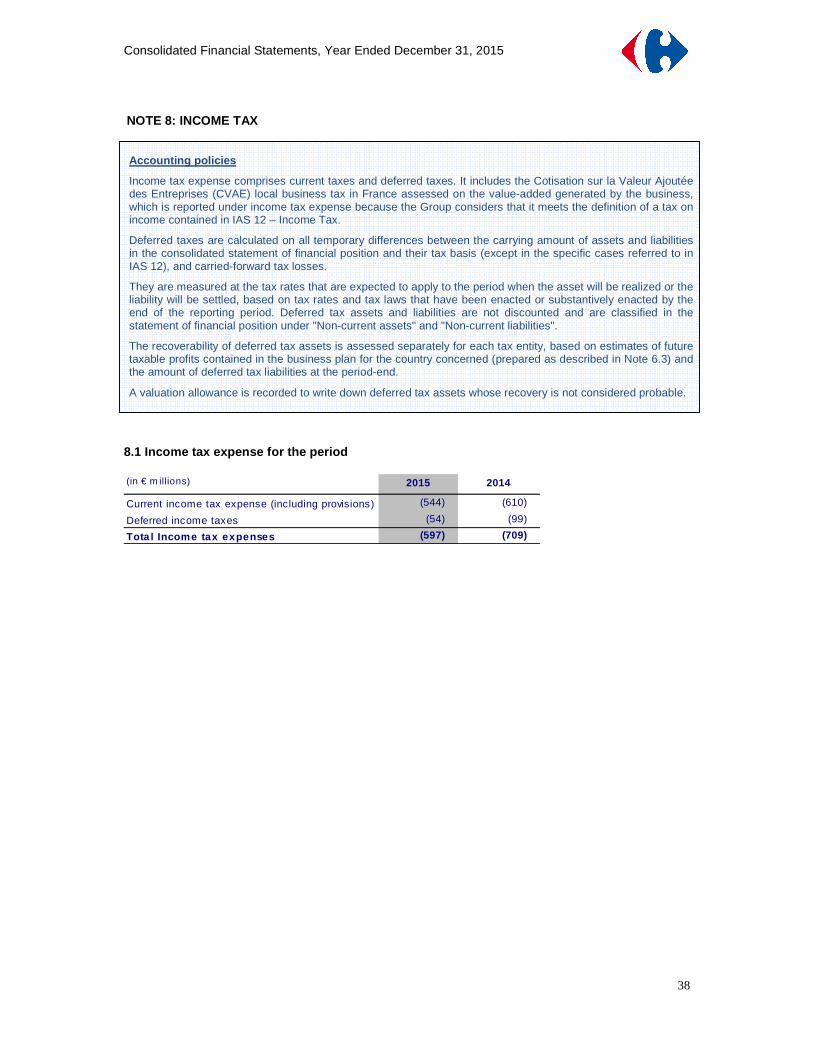
Consolidated Financial Statements, Year Ended December 31, 2015
38
NOTE 8: INCOME TAX 8.1 Income tax expense for the period (in € m illions) 2015 2014
Current income tax expense (including provisions) (544) (610)
Deferred income taxes (54) (99)
Tota l Income tax expenses (597) (709)
Accounting policies
Income tax expense comprises current taxes and deferred taxes. It includes the Cotisation sur la Valeur Ajoutée des Entreprises (CVAE) local business tax in France assessed on the value-added generated by the business, which is reported under income tax expense because the Group considers that it meets the definition of a tax on income contained in IAS 12 – Income Tax.
Deferred taxes are calculated on all temporary differences between the carrying amount of assets and liabilities in the consolidated statement of financial position and their tax basis (except in the specific cases referred to in IAS 12), and carried-forward tax losses.
They are measured at the tax rates that are expected to apply to the period when the asset will be realized or the liability will be settled, based on tax rates and tax laws that have been enacted or substantively enacted by the end of the reporting period. Deferred tax assets and liabilities are not discounted and are classified in the statement of financial position under "Non-current assets" and "Non-current liabilities".
The recoverability of deferred tax assets is assessed separately for each tax entity, based on estimates of future taxable profits contained in the business plan for the country concerned (prepared as described in Note 6.3) and the amount of deferred tax liabilities at the period-end.
A valuation allowance is recorded to write down deferred tax assets whose recovery is not considered probable.

Consolidated Financial Statements, Year Ended December 31, 2015
39
Tax proof Theoretical income tax for 2015 and 2014 has been calculated by multiplying consolidated income before tax by the standard French corporate income tax rate (including the 10.7% contribution exceptionnelle surtax applicable until December 30, 2016). For 2015, theoretical income tax expense amounted to €652 million compared with actual net income tax expense of €597 million.
(1) The reported amount of taxes with no tax base notably takes into account changes in provisions for tax risks (Note 9.2.1).
This caption also includes the CVAE local business tax in France assessed on the basis of the value-added generated by the business, which is considered as meeting the definition of a tax on income. This tax amounted to €64 million in 2015 (2014: €64 million).
(2) Deferred tax assets recognized on prior years’ tax losses primarily concerned Brazil and Spain in 2015 and Italy in 2014.
8.2 Deferred tax assets and liabilities The Group had a net deferred tax asset of €236 million at December 31, 2015. The change compared with December 31, 2014 was not material. (in € m illions) December 31,
2015December 31,
2014Change
Deferred tax assets 744 759 (15)
Deferred tax liabilities (508) (523) 15
Net deferred tax assets 236 236 (0)
Income before taxes 1,717 2,010
Standard French corporate income tax rate 38.0% 38.0%Theoretical income tax expense (652) (764)
Differences in overseas nominal taxation rates 67 59
Adjustments to arrive at effective income tax rate:
- Tax expense and tax credits not based on the taxable income (tax
provisions, withholding taxes, etc.) (1)(7) 32
- Deferred tax assets not recognized on temporary differences and tax loss carryforwards arising in the year
(61) (147)
- Deferred tax assets recognized on temporary differences and tax loss
carryforwards of previous years (2)105 55
- Valuation allowances on deferred tax assets recognized in prior years - (20)
- Tax effect of other permanent differences (29) 24
- Other differences (19) 51
Total Income tax expense (597) (709)
Effective tax rate 34.8% 35.3%
(in € millions) 2015 2014
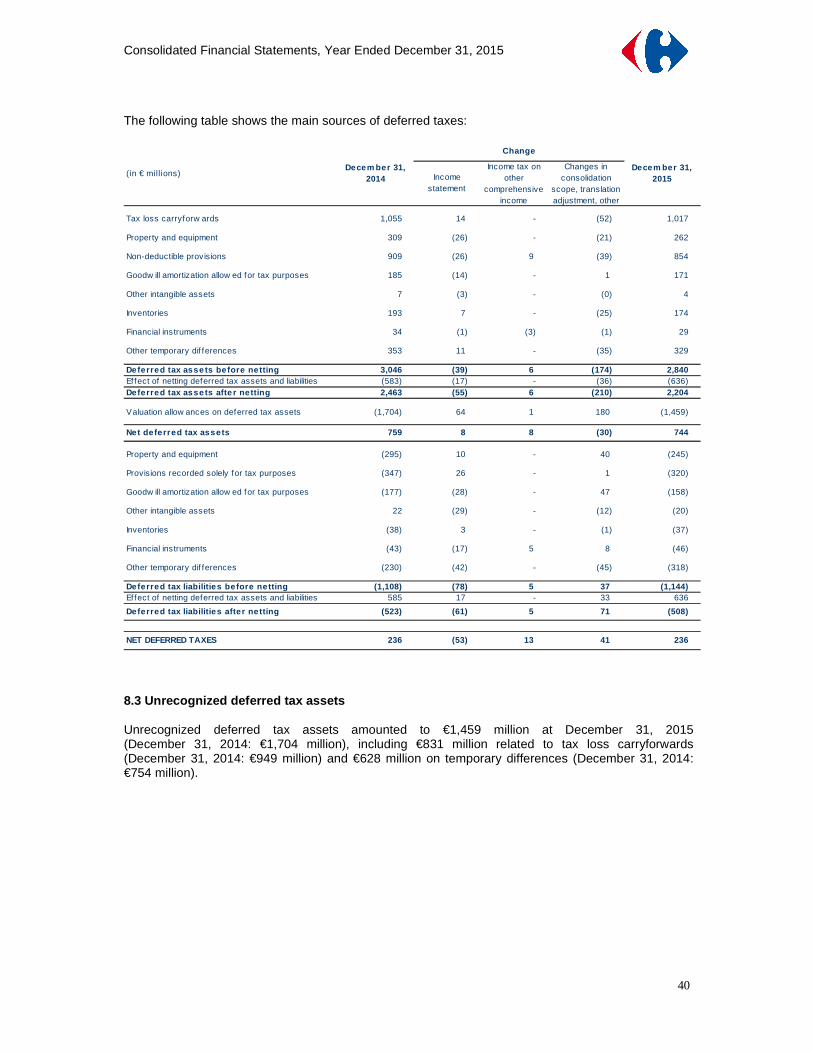
Consolidated Financial Statements, Year Ended December 31, 2015
40
The following table shows the main sources of deferred taxes:
Income statement
Income tax on other
comprehensive income
Changes in consolidation
scope, translation adjustment, other
Tax loss carryforw ards 1,055 14 - (52) 1,017
Property and equipment 309 (26) - (21) 262
Non-deductible provisions 909 (26) 9 (39) 854
Goodw ill amortization allow ed for tax purposes 185 (14) - 1 171
Other intangible assets 7 (3) - (0) 4
Inventories 193 7 - (25) 174
Financial instruments 34 (1) (3) (1) 29
Other temporary dif ferences 353 11 - (35) 329
Deferred tax asse ts before netting 3,046 (39) 6 (174) 2 ,840Effect of netting deferred tax assets and liabilities (583) (17) - (36) (636)Deferred tax asse ts afte r ne tting 2,463 (55) 6 (210) 2, 204
Valuation allow ances on deferred tax assets (1,704) 64 1 180 (1,459)
Net deferred tax assets 759 8 8 (30) 744
Property and equipment (295) 10 - 40 (245)
Provisions recorded solely for tax purposes (347) 26 - 1 (320)
Goodw ill amortization allow ed for tax purposes (177) (28) - 47 (158)
Other intangible assets 22 (29) - (12) (20)
Inventories (38) 3 - (1) (37)
Financial instruments (43) (17) 5 8 (46)
Other temporary dif ferences (230) (42) - (45) (318)
Deferred tax liabilities before netting (1,108) (78) 5 37 (1,144)Effect of netting deferred tax assets and liabilities 585 17 - 33 636
Deferred tax liabilities afte r ne tting (523) (61) 5 71 (508)
NET DEFERRED TAXES 236 (53) 13 41 236
Decem ber 31, 2014
Change
Decem ber 31, 2015
(in € millions)
8.3 Unrecognized deferred tax assets Unrecognized deferred tax assets amounted to €1,459 million at December 31, 2015 (December 31, 2014: €1,704 million), including €831 million related to tax loss carryforwards (December 31, 2014: €949 million) and €628 million on temporary differences (December 31, 2014: €754 million).
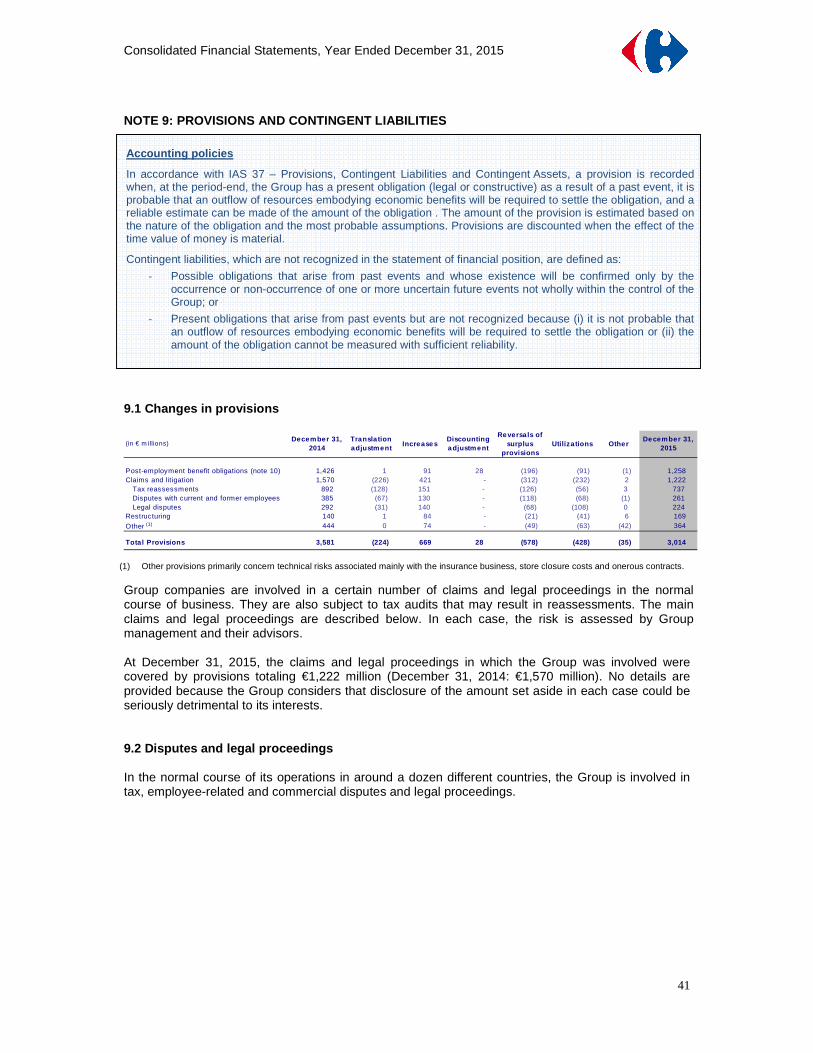
Consolidated Financial Statements, Year Ended December 31, 2015
41
NOTE 9: PROVISIONS AND CONTINGENT LIABILITIES 9.1 Changes in provisions
(in € m illions)December 31,
2014Transla tion adjustment
IncreasesDiscounting adjustment
Reversa ls of surplus
provisionsUtiliza tions Other
December 31, 2015
Post-employment benefit obligations (note 10) 1,426 1 91 28 (196) (91) (1) 1,258 Claims and litigation 1,570 (226) 421 - (312) (232) 2 1,222
Tax reassessments 892 (128) 151 - (126) (56) 3 737 Disputes with current and former employees 385 (67) 130 - (118) (68) (1) 261 Legal disputes 292 (31) 140 - (68) (108) 0 224
Restructuring 140 1 84 - (21) (41) 6 169
Other (1) 444 0 74 - (49) (63) (42) 364
Tota l Provisions 3,581 (224) 669 28 (578) (428) (35) 3,014
(1) Other provisions primarily concern technical risks associated mainly with the insurance business, store closure costs and onerous contracts.
Group companies are involved in a certain number of claims and legal proceedings in the normal course of business. They are also subject to tax audits that may result in reassessments. The main claims and legal proceedings are described below. In each case, the risk is assessed by Group management and their advisors. At December 31, 2015, the claims and legal proceedings in which the Group was involved were covered by provisions totaling €1,222 million (December 31, 2014: €1,570 million). No details are provided because the Group considers that disclosure of the amount set aside in each case could be seriously detrimental to its interests. 9.2 Disputes and legal proceedings In the normal course of its operations in around a dozen different countries, the Group is involved in tax, employee-related and commercial disputes and legal proceedings.
Accounting policies
In accordance with IAS 37 – Provisions, Contingent Liabilities and Contingent Assets, a provision is recorded when, at the period-end, the Group has a present obligation (legal or constructive) as a result of a past event, it is probable that an outflow of resources embodying economic benefits will be required to settle the obligation, and a reliable estimate can be made of the amount of the obligation . The amount of the provision is estimated based on the nature of the obligation and the most probable assumptions. Provisions are discounted when the effect of the time value of money is material.
Contingent liabilities, which are not recognized in the statement of financial position, are defined as:
- Possible obligations that arise from past events and whose existence will be confirmed only by the occurrence or non-occurrence of one or more uncertain future events not wholly within the control of the Group; or
- Present obligations that arise from past events but are not recognized because (i) it is not probable that an outflow of resources embodying economic benefits will be required to settle the obligation or (ii) the amount of the obligation cannot be measured with sufficient reliability.

Consolidated Financial Statements, Year Ended December 31, 2015
42
9.2.1 Tax reassessments Certain Group companies have been or are currently the subject of tax audits conducted by their local tax authorities. In Brazil, tax audits are in progress covering, in particular, the tax on the distribution of goods and services (ICMS), related tax credits (determination of the amounts claimable and documentation of the claims), and federal contributions to the social integration program and to the financing of the social security system (Pis-Cofins). The Group has challenged most of the reassessments, particularly the constitutionality of certain legislative provisions on which they are based. The estimated risk in each case is reviewed regularly with Carrefour Brazil’s advisors and an appropriate provision is recorded. In Argentina, in previous years the tax authorities have challenged Carrefour's omission of certain categories of supplier rebates from the basis for calculating sales tax. Carrefour contested the tax authorities' interpretation but nonetheless recorded a provision in prior years for the estimated risk, as determined jointly with its local tax advisors. The dispute concerning the proposed reassessments was settled in 2015, with no material impact on the consolidated financial statements for the year. In France, up until 2003, Carrefour paid a rendering levy (taxe d’équarrissage) on its meat purchases. In 2003, the Court of Justice of the European Union ruled that this levy, which was paid over by the French State to abattoirs, constituted state aid awarded in breach of EU rules. As a result of this ruling, the rendering levy paid for the years 1997 to 2003 was refunded to the Group. In 2004, however, the French tax authorities reversed their decision and instructed the Group to repay the refunded amounts for the years 2001 to 2003, totaling €145 million. Although this amount was paid by Carrefour in 2012, the Group has contested the validity of the claim and the case is currently pending before the tax courts.
9.2.2 Employee-related disputes As a major employer, the Group is regularly involved in disputes with current or former employees. From time to time, disputes may also arise with a large group of current or former employees. In Brazil, many former employees have initiated legal proceedings against the Group, claiming overtime pay that they allege is due to them.
9.2.3 Legal and commercial disputes The Group is subject to regular audits by the authorities responsible for overseeing compliance with the laws applicable to the retail industry and by the competition authorities. Disputes may also arise with suppliers as a result of differing interpretations of legal or contractual provisions. On October 1, 2012, a report on the price increases applied by major retailers for "household and personal care" products was handed to the Belgian competition authorities. The report alleges that between 2002 and 2007, the leading retailers coordinated price increases for these products with the help of the products' suppliers. In relation to this report, Carrefour was obliged to pay a fine to the Belgian competition authorities in June 2015. 9.3 Contingent liabilities To the best of the Group's knowledge, there are no contingent liabilities that may be considered as being likely to have a material impact on the Group’s results, financial position, assets and liabilities or business.

Consolidated Financial Statements, Year Ended December 31, 2015
43
NOTE 10: NUMBER OF EMPLOYEES, EMPLOYEE COMPENSATION AND BENEFITS 10.1 Pension and other post-employment benefits
Accounting policies
Post-employment benefits are employee benefits that are payable after the completion of employment. The Group's post-employment benefit plans include both defined contribution plans and defined benefit plans.
Defined contribution plans
Defined contribution plans are post-employment benefit plans under which the Group pays fixed contributions into a separate entity that is responsible for the plan’s administrative and financial management as well as for the payment of benefits, such that the Group has no obligation to pay further contributions if the plan assets are insufficient. Examples include government-sponsored pension schemes, defined contribution supplementary pension plans and defined contribution pension funds.
The contributions are recorded as an expense for the period in which they become due.
Defined benefit and long-term benefit plans
A liability is recognized for defined benefit obligations that are determined by reference to the plan participants’ years of service with the Group.
The defined benefit obligation is calculated annually using the projected unit credit method, taking into account actuarial assumptions concerning future salary levels, retirement age, mortality, staff turnover and the discount rate.
The discount rate corresponds to the interest rate observed at the period-end for investment grade corporate bonds with a maturity close to that of the defined benefit obligation. The calculations are performed by a qualified actuary.
The net liability recorded for defined benefit plans corresponds to the present value of the defined benefit obligation less the fair value of plan assets (if any). The cost recognized in the income statement comprises:
- Current service cost, past service cost and the gain or loss on plan amendments or settlements (if any), recorded in operating expense.
- Net interest on the net defined benefit liability, recorded in financial expense.
Remeasurements of the net defined benefit liability (comprising actuarial gains and losses, the return on plan assets and any change in the effect of the asset ceiling) are recognized immediately in "Other comprehensive income".
Accounting policies
Group employees receive short-term benefits (such as paid vacation, paid sick leave and statutory profit-sharing bonuses), long-term benefits (such as long-service awards and seniority bonuses) and post-employment benefits (such as length-of-service awards and supplementary pension benefits). Post-employment benefits may be paid under defined contribution or defined benefit plans.
All of these benefits are accounted for in accordance with IAS 19 – Employee Benefits. Short-term benefits (i.e., benefits expected to be settled wholly before twelve months after the end of the annual reporting period in which the employees render the related services) are classified as current liabilities (under "Other payables") and recorded as an expense for the year in which the employees render the related services (Note 5.2.2). Postemployment benefits and other long-term benefits are measured and recognized as described in Note 10.1.
Two types of share-based payment plans have been set up for management and selected employees – stock option plans and stock grant plans. These plans fall within the scope of IFRS 2 – Share-based Payment and are accounted for as described in Note 10.2.

Consolidated Financial Statements, Year Ended December 31, 2015
44
10.1.1 Description of the main defined benefit plan s The main defined benefit plans concern supplementary pension benefits paid annually in some countries to retired employees of the Group, and length-of-service awards provided for in collective bargaining agreements that are paid to employees upon retirement. The plans, which are presented below, mainly concern France, Belgium and Italy. French plans Group employees in France are entitled to a length-of-service award when they retire, determined in accordance with the law and the applicable collective bargaining agreement. The award is measured as a multiple of the individual’s monthly salary for the last twelve months before retirement, determined by reference to his or her years of service.
In 2009, the Group set up a supplementary pension plan. The main terms of this defined benefit plan, which was amended in 2015, are as follows:
• Eligibility: plan participants must have completed at least three years’ service at the time of retirement and their annual compensation must be greater than 18 times the annual ceiling for Social Security contributions.
• Benefits: 2.75% of the reference compensation per year of service, subject to the applicable performance conditions being met for each year. No benefits are paid if a minimum number of years has not been validated in connection with the performance conditions;
• Years of service taken into account for the calculation of plan benefits: years of service with the Carrefour Group under consecutive or non-consecutive employment contracts. The plan's terms do not provide for any increase in benefits for participants who have completed more than a certain number of years' service.
• The reference compensation is calculated as the average of the last three salaries (basic salary + annual variable compensation) received over the last three calendar years preceding retirement. or 60 times the annual ceiling for Social Security contributions, whichever is lower.
• Annual benefit cap: 25% of the reference compensation and the difference between 45% of the reference compensation and the total basic and supplementary pension benefits received by the plan participant.
• Reversionary pension: upon the participant's death, payable to the surviving spouse in an amount equal to 50% of the original benefit.
Belgian plans The Group’s main commitments in Belgium concern "prepensions" and the "solidarity fund". The prepension scheme provided for the payment of unemployment benefits during the period from the retirement age proposed in the collective bargaining agreement to the statutory retirement age. Carrefour is committed to topping up the benefits paid by the Belgian State, so that the individuals concerned receive 95% of their final net salary. The retirement age under Belgian law, amended in 2015, is 67 (unless otherwise provided). Under the collective bargaining agreement applicable to Carrefour, employees are eligible for prepension benefits from the age of 62 (unless otherwise provided). The solidarity fund is a corporate supplementary pension plan that offers participants the choice between a lump sum payment on retirement or a monthly pension for the rest of their lives. The plan was closed in 1994 and replaced by a defined contribution plan. Consequently, the projected benefit obligation only concerns pension rights that vested before 1994.

Consolidated Financial Statements, Year Ended December 31, 2015
45
Italian plans The Group’s commitments in Italy primarily concern the Trattemento di Fine Rapporto (TFR) deferred salary scheme. The TFR scheme underwent a radical reform in 2007, with employers now required to pay contributions to an independent pension fund in full discharge of their liability. The Group's obligation therefore only concerns deferred salary rights that vested before 2007.
10.1.2 Net expense for the period
(1) The following table presents details of service cost:
Net amount for 2015, which includes the effect of plan amendments introduced during the year, breaks down as €186 million deducted from employee benefits expense and €26 million recorded in financial expense.
10.1.3 Breakdown of the provision
Expense recognized in the income statement(in € millions)
France Belgium ItalyOther
countriesGroup total
Service cost (1) (70) 7 (3) 3 (63)Interest cost (discount effect) 30 10 4 1 45 Return on plan assets (3) (3) 0 (0) (6)Other items (0) 0 0 (1) (1)Expense (income) for 2014 (43) 14 1 2 (25)
Service cost (1) (195) 7 (0) 0 (187)Interest cost (discount effect) 19 7 2 1 29 Return on plan assets (1) (2) 0 (0) (3)Other items 1 0 0 0 1 Expense (income) for 2015 (176) 12 2 1 (160)
2014 (in € millions) France Belgium ItalyOther
countriesGroup total
Current service cost 55 7 0 0 63 Past service cost (plan amendments and curtailments) (105) 0 (3) 3 (105)Settlements and other (20) 0 0 (0) (20)Total Service cost 2014 (70) 7 (3) 3 (63)
2015 (in € millions) France Belgium ItalyOther
countriesGroup total
Current service cost 62 8 0 0 70 Past service cost (plan amendments and curtailments) (252) (0) 0 0 (252)Settlements and other (5) 0 (0) 0 (5)Total Service cost 2015 (195) 7 (0) 0 (187)
(in € millions) France Belgium ItalyOther
countriesGroup total
Defined Benefit Obligation 1,080 350 153 30 1,613Fair value of plan assets (93) (89) 0 (6) (188)Provision at December 31, 2014 987 261 153 23 1,425Defined Benefit Obligation 915 334 136 34 1,419Fair value of plan assets (70) (84) 0 (6) (161)Provision at December 31, 2015 845 250 136 27 1,258

Consolidated Financial Statements, Year Ended December 31, 2015
46
10.1.4 Change in the provision
(1) This line breaks down as follows:
10.1.5 Plan assets
Plan assets break down as follows by asset class:
All bonds and equities held in plan asset portfolios are listed securities.
(in € millions) France Belgium ItalyOther
countriesGroup total
Provision at December 31, 2013 859 227 150 37 1,272 Movements recorded in the income statement (43) 14 1 2 (25)Benefits paid directly by the employer (3) (15) (12) (1) (31)Effect of changes in scope of consolidation 26 0 2 (15) 13
Change in actuarial gains and losses (1) 150 34 12 1 196 Other (1) 1 0 (0) 1 Provision at December 31, 2014 987 261 153 23 1,425 Movements recorded in the income statement (176) 12 2 1 (160)Benefits paid directly by the employer (3) (14) (14) (0) (32)Effect of changes in scope of consolidation (4) 0 0 (0) (4)
Change in actuarial gains and losses (1) 41 (9) (6) 2 28 Other (1) 0 (0) 1 0 Provision at December 31, 2015 845 250 136 27 1,258
2014 (in € millions) France Belgium ItalyOther
countriesGroup total
Actuarial (gain)/loss due to experience (45) 0 (4) (0) (49)Actuarial (gain)/loss due to demographic assumption changes 22 0 0 1 24 Actuarial (gain)/loss due to financial assumption changes 174 39 16 (0) 229 Return on Plan Assets (Greater) / Less than Discount Rate (2) (5) 0 (0) (8)Changes in actuarial gains and losses 2014 150 34 12 1 196
2015 (in € millions) France Belgium ItalyOther
countriesGroup total
Actuarial (gain)/loss due to experience 33 (0) (0) 1 34 Actuarial (gain)/loss due to demographic assumption changes 25 0 0 1 26 Actuarial (gain)/loss due to financial assumption changes (16) (4) (6) 0 (25)Return on Plan Assets (Greater) / Less than Discount Rate (1) (5) 0 (0) (6)Changes in actuarial gains and losses 2015 41 (9) (6) 2 28
(in € millions) France Belgium ItalyOther
countriesGroup total
Fair value at December 31, 2013 108 92 0 4 204 Effect of changes in scope of consolidation 1 0 0 0 1 Return on plan assets 3 3 0 (0) 6 Benefits paid out of plan assets (21) (12) 0 (1) (34)Actuarial gain/(loss) 2 5 0 0 8 Other 1 0 0 3 5 Fair value at December 31, 2014 93 89 0 6 188 Effect of changes in scope of consolidation (0) 0 0 0 (0)Return on plan assets 1 2 0 0 3 Benefits paid out of plan assets (25) (11) 0 (1) (37)Actuarial gain/(loss) 1 5 0 0 6 Other 0 0 0 1 1 Fair value at December 31, 2015 70 84 0 6 161
Bonds EquitiesReal estate and other
Bonds EquitiesReal estate and other
France 62% 8% 31% 68% 4% 28%
Belgium 69% 21% 11% 72% 20% 9%
December 31, 2015 December 31, 2014

Consolidated Financial Statements, Year Ended December 31, 2015
47
10.1.6 Actuarial assumptions and sensitivity analys is The assumptions used to measure defined benefit obligations for length-of-service awards are as follows:
Projected benefit obligations were calculated using a discount rate of 1.90% for the French, Belgian and Italian plans (2014: 1.90% for the French and Belgian plans, 1.50% for the Italian plan). These rates are based on an index of AA-rated corporate bonds with maturities similar to the estimated duration of the defined benefit obligation. In 2015, the average duration of the defined benefit obligation under French, Belgian and Italian plans was 10.3 years, 10.2 years and 10.6 years respectively (2014: 11.5 years, 10.4 years and 11 years respectively). Sensitivity tests show that:
- A 25-bps increase in the discount rate would have a negative impact of around €38 million on the defined benefit obligation under the French, Belgian and Italian plans.
- A 25-bps increase in the inflation rate would have a positive impact of around €6 million on the defined benefit obligation under the French, Belgian and Italian plans.
10.2 Share-based payments The cost of share-based payment plans is recorded under "Payroll costs" in recurring operating income, with a corresponding increase in equity. The plan cost in 2015 was equal to zero (2014: €0.2 million). Details of the stock option and stock grant plans set up for senior management are presented below.
2015 2014
Retirement age 60-67 60-65
Rate of future salary increases 1.8% to 2.7% 2.1% to 3.0%
Inflation rate 1.9% 1.9%
Discount rate 1.9% 1.5% à 1.9%
Accounting policies
Two types of share-based payment plans have been set up for management and selected employees – stock option plans and stock grant plans.
As the plans are equity-settled, the benefit represented by the share-based payment is recorded in employee benefits expense with a corresponding increase in shareholders’ equity in accordance with IFRS 2 – Share-based Payment. The amount recorded in employee benefits expense corresponds to the recognition over the vesting period of the benefit’s fair value. Fair value is the value determined using the Black & Scholes option pricing model at the grant date in the case of options or the share price at the grant date in the case of stock grants. Performance conditions that are not market conditions are not taken into account to estimate the fair value of stock options and stock grants at the measurement date.

Consolidated Financial Statements, Year Ended December 31, 2015
48
10.2.1 Stock option plans
No new plans were set up in 2015 or 2014. The following table provides details of the stock option plans that were in progress at December 31, 2015 or expired during the year.
(1) Date of the meeting of the Management Board (before July 28, 2008) or Board of Directors (after that date) when the stock option grants were decided.
(2) Adjusted number of options and adjusted exercise price following the distribution of Dia shares in connection with the Maxidiscount demerger on
July 5, 2011.
(3) The options will vest only if the grantee is still employed by the Group at the start of the exercise period. Since 2006, the options vest as follows:
- 50% after two years
- 25% after three years
- 25% after four years
Concerning the exercise date, specific rules apply in the event of the grantee’s death.
(4) All of the options outstanding at December 31, 2015 were exercisable at that date.
All of the options are exercisable for existing Carrefour shares. There are two types of plans:
- Presence Plans, for which the only condition is that grantees must remain employed by the Group between the grant date and the starting date of the exercise period for each tranche of options (50% of options vest after two years, 25% after three years and 25% after four years).
- Performance Plans, for which the above presence condition applies as well as two conditions based on the Group’s financial performance, with 50% of the options vesting when each of these conditions are met: o Performance conditions for the 2009 Performance Plan concerned (i) sales growth for the
period 2008 to 2010 and (ii) the level of 2010 free cash flow. o Performance conditions for the 2010 Performance Plan concerned growth in (i) sales and
(ii) recurring operating income over the period 2009 to 2011.
Grant date (1) Number of
options granted(2)
Life of the options
Number of grantees
Exercise period (3)
Number of options
outstanding(4)
Exercise price in €(2)
2008 Presence Plan I
June 6, 2008 4,545,183 7 years 505June 6, 2010 to June
5, 20150 39.68
2008 Presence Plan II
July 7, 2008 17,109 7 years 1July 7, 2010 to July 6,
20150 39.68
2009 Plan Performance
June 17, 2009 1,252,994 7 years 57June 17, 2011 to June
16, 2016399,711 29.55
2009 Presence Plan
June 17, 2009 6,974,861 7 years 2571June 17, 2011 to June
16, 20165,064,396 29.55
2010 Performance Plan
July 16, 2010 1,439,017 7 years 56July 17, 2012 to May
3, 2017471,416 29.91
2010 Presence Plan II
July 16, 2010 1,941,610 7 years 507July 17, 2012 to July
16, 20171,351,784 29.91
Total 7,287,307
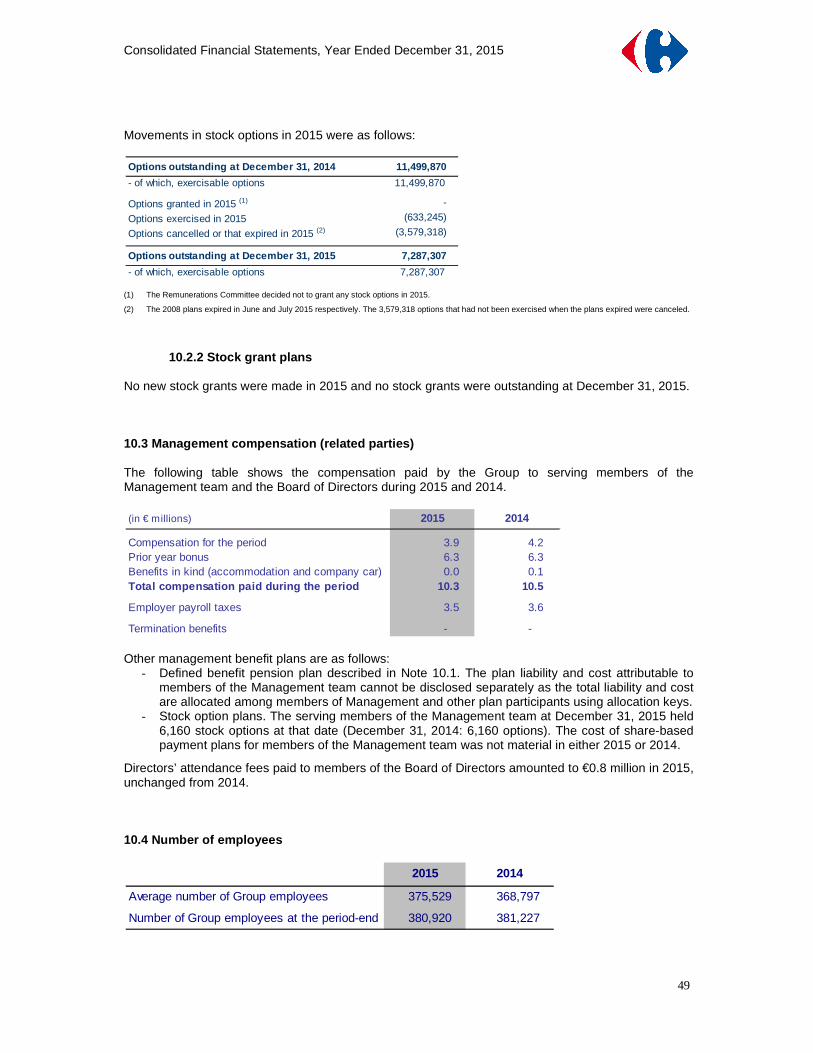
Consolidated Financial Statements, Year Ended December 31, 2015
49
Movements in stock options in 2015 were as follows:
(1) The Remunerations Committee decided not to grant any stock options in 2015.
(2) The 2008 plans expired in June and July 2015 respectively. The 3,579,318 options that had not been exercised when the plans expired were canceled.
10.2.2 Stock grant plans No new stock grants were made in 2015 and no stock grants were outstanding at December 31, 2015. 10.3 Management compensation (related parties) The following table shows the compensation paid by the Group to serving members of the Management team and the Board of Directors during 2015 and 2014.
Other management benefit plans are as follows:
- Defined benefit pension plan described in Note 10.1. The plan liability and cost attributable to members of the Management team cannot be disclosed separately as the total liability and cost are allocated among members of Management and other plan participants using allocation keys.
- Stock option plans. The serving members of the Management team at December 31, 2015 held 6,160 stock options at that date (December 31, 2014: 6,160 options). The cost of share-based payment plans for members of the Management team was not material in either 2015 or 2014.
Directors’ attendance fees paid to members of the Board of Directors amounted to €0.8 million in 2015, unchanged from 2014. 10.4 Number of employees
Options outstanding at December 31, 2014 11,499,870
- of which, exercisable options 11,499,870
Options granted in 2015 (1) -
Options exercised in 2015 (633,245)
Options cancelled or that expired in 2015 (2) (3,579,318)
Options outstanding at December 31, 2015 7,287,307
- of which, exercisable options 7,287,307
(in € millions) 2015 2014
Compensation for the period 3.9 4.2 Prior year bonus 6.3 6.3 Benefits in kind (accommodation and company car) 0.0 0.1 Total compensation paid during the period 10.3 10.5
Employer payroll taxes 3.5 3.6
Termination benefits - -
2015 2014
Average number of Group employees 375,529 368,797
Number of Group employees at the period-end 380,920 381,227

Consolidated Financial Statements, Year Ended December 31, 2015
50
NOTE 11: EQUITY AND EARNINGS PER SHARE 11.1 Capital management The parent company, Carrefour, must have sufficient equity capital to comply with the provisions of France's Commercial Code. The Group owns interests in a certain number of financial services companies (banks, insurance companies). These subsidiaries must have sufficient equity capital to comply with capital adequacy ratios and the minimum capital rules set by their local banking and insurance supervisors. Capital management objectives (equity and debt capital) are to:
� Ensure that the Group can continue operating as a going concern, in particular by maintaining high levels of liquid resources.
� Optimize shareholder returns. � Keep gearing at an appropriate level, in order to minimize the cost of capital and maintain the
Group’s credit rating at a level that allows it to access a wide range of financing sources and instruments.
In order to maintain or adjust its gearing, the Group may take on new borrowings or retire existing borrowings, adjust the dividend paid to shareholders, return capital to shareholders, issue new shares, buy back shares or sell assets in order to use the proceeds to pay down debt. 11.2 Share capital and treasury stock
11.2.1 Share capital At December 31, 2015, the share capital was made up of 738,470,794 ordinary shares with a par value of €2.5 each, all fully paid.
The increase during the year corresponded to new shares issued to shareholders who chose to reinvest their 2014 dividend (Notes 2.3 and 11.3).
11.2.2 Treasury stock
(in thousands of shares) 2015 2014
Outstanding at January 1 734,914 723,984
Issued for cash - -
Issued upon exercise of stock options - -
Issued in payment of dividends 3,557 10,930
Cancelled shares - -
Outstanding at December 31 738,471 734,914
Accounting policies
Treasury stock is recorded as a deduction from shareholders’ equity, at cost. Gains and losses from sales of treasury stock (and the related tax effect) are recorded directly in shareholders’ equity without affecting income for the period.

Consolidated Financial Statements, Year Ended December 31, 2015
51
At December 31, 2015, a total of 10,990,800 shares were held in treasury (December 31, 2014: 23,386,284 shares).
The year-on-year decrease reflected the sale of 12.7 million shares described in Note 2.1.
Shares held directly The Carrefour shares held directly by the Company are intended, notably, for the Group's stock option plans or for the liquidity agreement set up in January 2014 with Oddo Corporate Finance. All rights attached to these shares are suspended for as long as they are held in treasury.
Shares held indirectly via an equity swap In 2009, the Group reorganized the portfolio of treasury shares and instruments held to meet its obligations under the stock option and stock grant plans. On June 15, 2009, a total of 18,638,439 shares were sold out of treasury at a price of €28.725 per share, generating total proceeds of €535 million, and 18,638,439 shares were bought back at the same price per share of €28.725 for forward delivery at various dates through July 2017. The transaction had no impact on the consolidated income statement. Following the distribution of Dia shares on July 5, 2011, Carrefour delivered an additional 2,196,200 shares in exchange for a reduction in the buyback price per share to €25.184. At December 31, 2015, Carrefour was committed to buying back 3,063,097 shares under the equity swap on June 15, 2016 for a total of €77 million recorded as a financial liability (Note 12.2.3). 11.3 Dividends The 2014 ordinary dividend of €0.68 per share was paid on July 17, 2015 as follows:
- 3,556,885 new shares were issued and delivered in settlement of reinvested dividends, leading to a total capital increase including premiums of €102 million.
- €390 million was paid in cash to shareholders who had chosen not to reinvest their dividends.
(in thousands of shares)December 31,
2015December 31,
2014Change
Shares held directly 7,928 10,281 (2,354)
Shares held indirectly via an equity swap 3,063 13,105 (10,042)
Treasury stock 10,991 23,386 (12,395)

Consolidated Financial Statements, Year Ended December 31, 2015
52
11.4 Other comprehensive income
11.5 Non-controlling interests
Non-controlling interests mainly concern:
- Sub-group made up of Carrefour Banque SA and its subsidiaries (part of the France operating segment), which is 60% owned by the Group;
- Sub-group made up of Atacadaõ and its subsidiaries (part of the Brazil operating segment), which includes all the activities operated by Carrefour in Brazil and is 88% owned by the Group.
The following tables present the key information from the sub-groups' consolidated financial statements:
Carrefour Banque SA sub-group
(in € millions)Group share
Pre-tax Tax Net Pre-tax Tax Net
Effective portion of changes in the fair value of cash flow hedges (0) 0 (0) 28 (15) 13Changes in the fair value of available-for-sale financial assets (3) 1 (2) 10 (3) 7Exchange differences on translating foreign operations (511) 0 (511) (5) (0) (5)
Items that may be reclassified subsequently to prof it or loss (515) 1 (513) 33 (18) 15
Remeasurements of defined benefit plans obligation (27) 11 (16) (192) 66 (127)
Items that will not be reclassified to profit or lo ss (27) 11 (16) (192) 66 (127)
Total Other comprehensive income - Group share (542) 13 (529) (159) 48 (112)
Non-controlling interests
Pre-tax Tax Net Pre-tax Tax Net
Effective portion of changes in the fair value of cash flow hedges 2 (1) 1 3 (1) 2Changes in the fair value of available-for-sale financial assets (4) 1 (2) 10 (3) 7Exchange differences on translating foreign operations (91) 0 (91) 18 0 18
Items that may be reclassified subsequently to prof it or loss (92) 0 (92) 31 (4) 27
Remeasurements of defined benefit plans obligation (2) 0 (1) (3) 0 (3)
Items that will not be reclassified to profit or lo ss (2) 0 (1) (3) 0 (3)
Total Other comprehensive income - Non-controlling interests
(94) 1 (93) 28 (4) 24
2015 2014
2015 2014
in € million
Income statement 2015 2014 Statement of financial posi tion December 31, 2015
December 31, 2014
Revenue (Net Banking Product) 413 440 Non current assets 2,090 2,400Net result 37 49 Current assets 2,889 2,784of which: - attributab le to the Group Carrefour 22 29 Non current liabilities (excluding shareholders' equity) 1,947 1,587 - attributab le to non-controlling interests 15 20 Current liabilities 2,523 3,104
Dividends paid to non-controlling interests 13 11
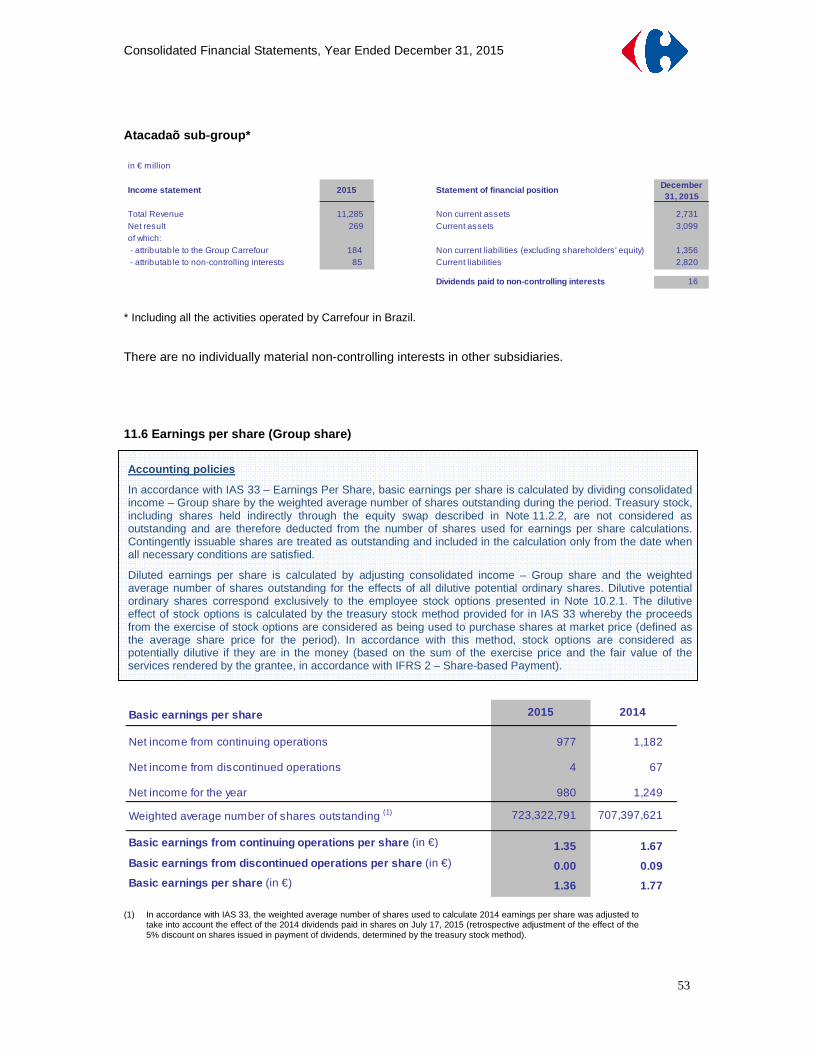
Consolidated Financial Statements, Year Ended December 31, 2015
53
Atacadaõ sub-group*
* Including all the activities operated by Carrefour in Brazil.
There are no individually material non-controlling interests in other subsidiaries.
11.6 Earnings per share (Group share)
(1) In accordance with IAS 33, the weighted average number of shares used to calculate 2014 earnings per share was adjusted to take into account the effect of the 2014 dividends paid in shares on July 17, 2015 (retrospective adjustment of the effect of the 5% discount on shares issued in payment of dividends, determined by the treasury stock method).
in € million
Income statement 2015 Statement of financial position December 31, 2015
Total Revenue 11,285 Non current assets 2,731Net result 269 Current assets 3,099of which: - attributab le to the Group Carrefour 184 Non current liabilities (excluding shareholders' equity) 1,356 - attributab le to non-controlling interests 85 Current liabilities 2,820
Dividends paid to non-controlling interests 16
Basic earnings per share 2015 2014
Net income from continuing operations 977 1,182
Net income from discontinued operations 4 67
Net income for the year 980 1,249
Weighted average number of shares outstanding (1) 723,322,791 707,397,621
Basic earnings from continuing operations per share (in €) 1.35 1.67
Basic earnings from discontinued operations per sha re (in €) 0.00 0.09
Basic earnings per share (in €) 1.36 1.77
Accounting policies
In accordance with IAS 33 – Earnings Per Share, basic earnings per share is calculated by dividing consolidated income – Group share by the weighted average number of shares outstanding during the period. Treasury stock, including shares held indirectly through the equity swap described in Note 11.2.2, are not considered as outstanding and are therefore deducted from the number of shares used for earnings per share calculations. Contingently issuable shares are treated as outstanding and included in the calculation only from the date when all necessary conditions are satisfied.
Diluted earnings per share is calculated by adjusting consolidated income – Group share and the weighted average number of shares outstanding for the effects of all dilutive potential ordinary shares. Dilutive potential ordinary shares correspond exclusively to the employee stock options presented in Note 10.2.1. The dilutive effect of stock options is calculated by the treasury stock method provided for in IAS 33 whereby the proceeds from the exercise of stock options are considered as being used to purchase shares at market price (defined as the average share price for the period). In accordance with this method, stock options are considered as potentially dilutive if they are in the money (based on the sum of the exercise price and the fair value of the services rendered by the grantee, in accordance with IFRS 2 – Share-based Payment).
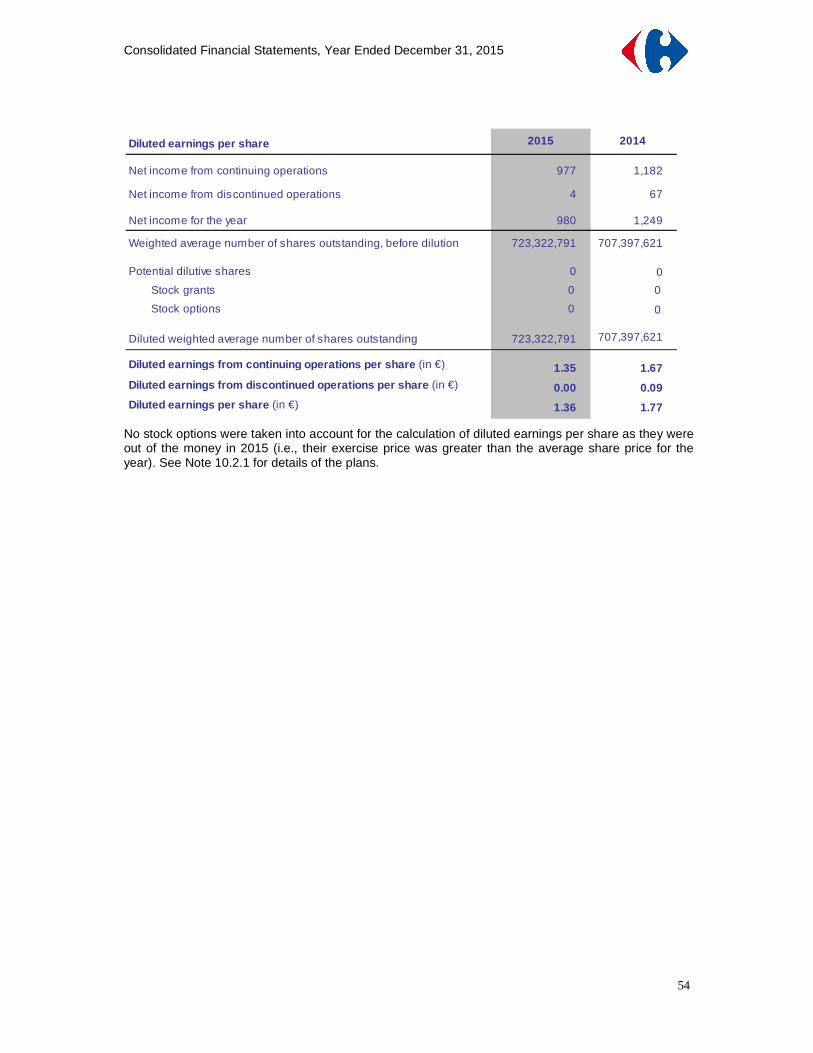
Consolidated Financial Statements, Year Ended December 31, 2015
54
No stock options were taken into account for the calculation of diluted earnings per share as they were out of the money in 2015 (i.e., their exercise price was greater than the average share price for the year). See Note 10.2.1 for details of the plans.
Diluted earnings per share 2015 2014
Net income from continuing operations 977 1,182
Net income from discontinued operations 4 67
Net income for the year 980 1,249
Weighted average number of shares outstanding, before dilution 723,322,791 707,397,621
Potential dilutive shares 0 0
Stock grants 0 0
Stock options 0 00 1E-14
Diluted weighted average number of shares outstanding 723,322,791 707,397,621
Diluted earnings from continuing operations per sha re (in €) 1.35 1.67
Diluted earnings from discontinued operations per s hare (in €) 0.00 0.09
Diluted earnings per share (in €) 1.36 1.77

Consolidated Financial Statements, Year Ended December 31, 2015
55
NOTE 12: FINANCIAL ASSETS AND LIABILITIES, FINANCE COSTS AND OTHER FINANCIAL INCOME AND EXPENSES
Accounting policies
Non-derivative financial assets
In accordance with IAS 39 – Financial Instruments: Recognition and Measurement, the main financial assets are classified in one of the following four categories:
• Financial assets at fair value through profit or loss.
• Loans and receivables.
• Held-to-maturity investments.
• Available-for-sale financial assets.
Their classification determines their accounting treatment. They are classified by the Group upon initial recognition, based on the type of asset and the purpose for which it was acquired. Purchases and sales of financial assets are recognized on the trade date, defined as the date on which the Group is committed to buying or selling the asset.
(i) Financial assets at fair value through profit o r loss These are financial assets held for trading, i.e., assets acquired principally for the purpose of selling them at a profit in the short term, or financial assets designated at the outset as at fair value through profit or loss.
They are measured at fair value with changes in fair value recognized in the income statement, under financial income or expense.
(ii) Loans and receivables Loans and receivables are non-derivative financial assets with fixed or determinable payments that are not quoted in an active market and that do not meet the criteria for classification as either held for trading or available for sale.
They are initially recognized at fair value and are subsequently measured at amortized cost by the effective interest method. For short-term receivables with no specified interest rate, fair value is considered as being equal to the original invoice amount.
These assets are tested for impairment when there is an indication that their recoverable amount may be less than their carrying amount. If this is found to be the case, an impairment loss is recorded.
This category includes receivables from non-consolidated companies, other loans and receivables and trade receivables. They are reported under "Other financial assets" or "Trade receivables".
(iii) Held-to-maturity investments Held-to-maturity investments are non-derivative financial assets other than loans and receivables with fixed or determinable payments and a fixed maturity that the Group has the positive intention and ability to hold to maturity. They are initially recognized at fair value and are subsequently measured at amortized cost by the effective interest method.
The Group did not hold any assets classified as held-to-maturity at December 31, 2015 or December 31, 2014.
(iv) Available-for-sale financial assets Available-for-sale financial assets are financial assets that do not meet the criteria for classification in any of the other three categories. They consist mainly of shares in non-consolidated companies. Available-for-sale financial assets are measured at fair value, with changes in fair value recognized in "Other comprehensive income", under "Changes in the fair value of available-for-sale financial assets". When the assets are sold, the gains and losses accumulated in shareholders’ equity are reclassified to the income statement.
However, in the event of a prolonged or significant fall in value of an equity instrument or a decline in estimated cash flows from a debt instrument, an impairment loss is recognized in the income statement. If, in a subsequent period, the impairment decreases, the previously recognized impairment loss is released as follows:
• For equity instruments (shares and other): through "Other comprehensive income".
• For debt instruments (bonds, notes and other): where an increase is observed in estimated future cash flows, through profit or loss for an amount not exceeding the previously recognized impairment loss.
The fair value of listed securities corresponds to their market price. For unlisted securities, fair value is determined by reference to recent transactions or by using valuation techniques based on reliable and observable market data. When it is impossible to obtain a reasonable estimate of an asset’s fair value, it is measured at historical cost.

Consolidated Financial Statements, Year Ended December 31, 2015
56
Non-derivative financial assets held by the Group The main non-derivative financial assets held by the Group are as follows:
- Non-current financial assets, mainly comprising investments in non-consolidated companies and long-term loans.
- Trade receivables (Note 5.4.3).
- Other current financial assets, mainly available-for-sale financial assets, measured at fair value, and short-term loans and deposits.
Non-derivative financial liabilities
Non-derivative financial liabilities are initially recognized at fair value plus transaction costs and premiums directly attributable to their issue. They are subsequently measured at amortized cost.
Non-derivative financial assets held by the Group The main non-derivative financial liabilities held by the Group are as follows:
- Borrowings: "Long-term borrowings" and "Short-term borrowings" include bonds and notes issued by the Group, finance lease liabilities, other bank loans and financial liabilities related to securitized receivables for which the credit risk is retained by the Group.
- Suppliers and other creditors (Note 5.4.4).
- Other payables: other payables classified in current liabilities correspond to all other operating payables (mainly accrued employee benefits expense and amounts due to suppliers of non-current assets) and miscellaneous liabilities.
Derivative financial instruments
The Group uses derivative financial instruments to hedge its exposure to risks arising in the course of business, mainly currency and interest rate risks. Exceptionally, the risk of changes in the prices of certain commodities – mainly diesel – may also be hedged.
Derivatives are initially recognized at fair value. They are subsequently measured at fair value with the resulting unrealized gains and losses recorded as explained below.
(i) Derivatives designated as hedging instruments Hedge accounting is applied if, and only if, the following conditions are met:
• At the inception of the hedge, there is formal designation and documentation of the hedging relationship. • The effectiveness of the hedge is demonstrated at inception.
The derivatives used by the Group may be qualified as either cash flow hedges or fair value hedges. The Group does not currently hedge its net investment in foreign operations.
Cash flow hedges For instruments qualified as cash flow hedges, the portion of the change in fair value determined to be an effective hedge is recognized directly in "Other comprehensive income" and accumulated in shareholders’ equity until the hedged transaction affects profit. The ineffective portion of the change in fair value is recognized in the income statement, under "Financial income and expense".
The main cash flow hedges consist of interest rate options and swaps that convert variable rate debt to fixed rate debt, and forward purchases of foreign currencies that hedge future goods purchases in foreign currency.
Fair value hedges
Changes in fair value of instruments qualified as fair value hedges are recognized in the income statement, with the effective portion offsetting changes in the fair value of the hedged item.
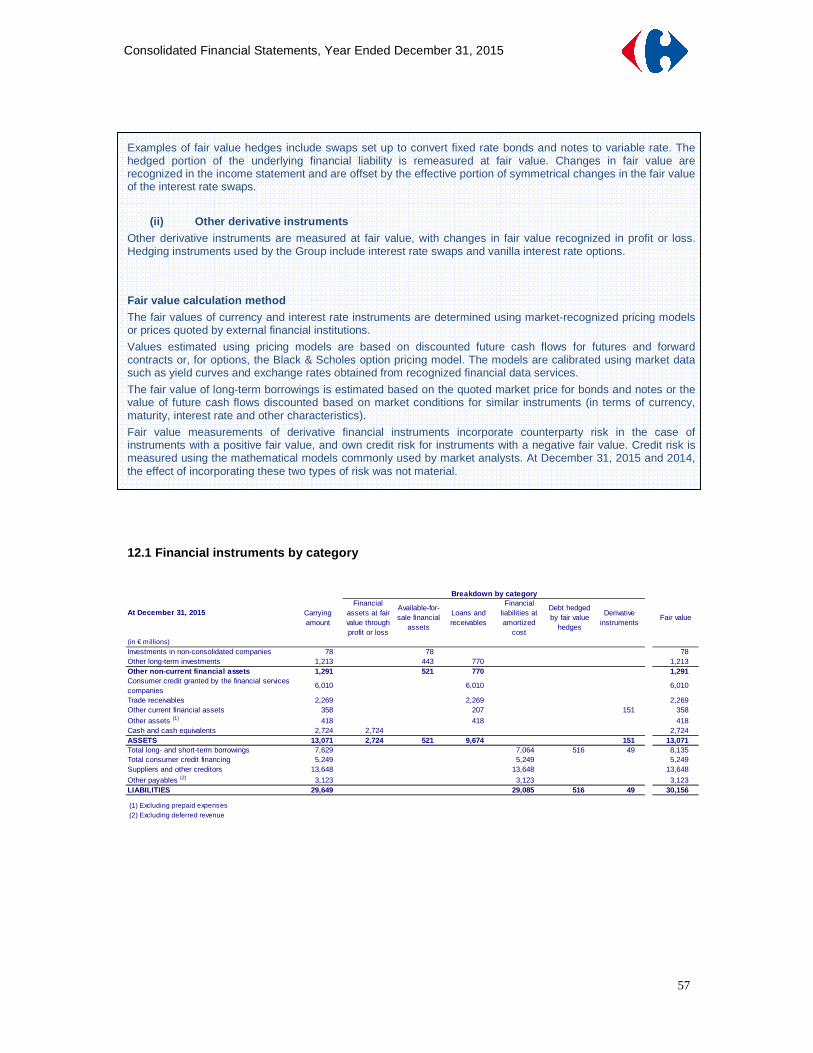
Consolidated Financial Statements, Year Ended December 31, 2015
57
12.1 Financial instruments by category
Carrying amount
Financial assets at fair value through profit or loss
Available-for-sale financial
assets
Loans and receivables
Financial liabilities at amortized
cost
Debt hedged by fair value
hedges
Derivative instruments
Fair value
(in € millions)
Investments in non-consolidated companies 78 78 78 Other long-term investments 1,213 443 770 1,213 Other non-current financial assets 1,291 521 770 1,291 Consumer credit granted by the financial services companies
6,010 6,010 6,010
Trade receivables 2,269 2,269 2,269 Other current financial assets 358 207 151 358
Other assets (1) 418 418 418 Cash and cash equivalents 2,724 2,724 2,724 ASSETS 13,071 2,724 521 9,674 151 13,071 Total long- and short-term borrowings 7,629 7,064 516 49 8,135 Total consumer credit financing 5,249 5,249 5,249 Suppliers and other creditors 13,648 13,648 13,648
Other payables (2) 3,123 3,123 3,123 LIABILITIES 29,649 29,085 516 49 30,156
(1) Excluding prepaid expenses (2) Excluding deferred revenue
Breakdown by category
At December 31, 2015
Examples of fair value hedges include swaps set up to convert fixed rate bonds and notes to variable rate. The hedged portion of the underlying financial liability is remeasured at fair value. Changes in fair value are recognized in the income statement and are offset by the effective portion of symmetrical changes in the fair value of the interest rate swaps.
(ii) Other derivative instruments Other derivative instruments are measured at fair value, with changes in fair value recognized in profit or loss. Hedging instruments used by the Group include interest rate swaps and vanilla interest rate options.
Fair value calculation method The fair values of currency and interest rate instruments are determined using market-recognized pricing models or prices quoted by external financial institutions.
Values estimated using pricing models are based on discounted future cash flows for futures and forward contracts or, for options, the Black & Scholes option pricing model. The models are calibrated using market data such as yield curves and exchange rates obtained from recognized financial data services.
The fair value of long-term borrowings is estimated based on the quoted market price for bonds and notes or the value of future cash flows discounted based on market conditions for similar instruments (in terms of currency, maturity, interest rate and other characteristics).
Fair value measurements of derivative financial instruments incorporate counterparty risk in the case of instruments with a positive fair value, and own credit risk for instruments with a negative fair value. Credit risk is measured using the mathematical models commonly used by market analysts. At December 31, 2015 and 2014, the effect of incorporating these two types of risk was not material.

Consolidated Financial Statements, Year Ended December 31, 2015
58
Assets and liabilities measured at fair value based on the hierarchy provided for in IFRS 13 – Fair Value Measurement (Note 1.4)
No assets or liabilities were reclassified between the various levels between December 31, 2014 and 2015.
Carrying amount
Financial assets at fair value through profit or loss
Available-for-sale financial
assets
Loans and receivables
Financial liabilities at amortized
cost
Debt hedged by fair value
hedges
Derivative instruments
Fair value
(in € millions)
Investments in non-consolidated companies 78 78 78 Other long-term investments 1,262 403 859 1,262 Other non-current financial assets 1,340 481 859 1,340 Consumer credit granted by the financial services companies
5,980 5,976 4 5,980
Trade receivables 2,260 2,260 2,260 Other current financial assets 504 96 297 111 504
Other assets (1) 551 551 551 Cash and cash equivalents 3,113 3,113 3,113 ASSETS 13,748 3,113 577 9,943 115 13,748 Total long- and short-term borrowings 8,572 7,986 525 61 9,147 Total consumer credit financing 5,308 5,015 293 5,308 Suppliers and other creditors 13,384 13,384 13,384
Other payables (2) 2,910 2,910 2,910 LIABILITIES 30,174 29,295 818 61 30,749
Breakdown by category
At December 31, 2014
December 31, 2015(in € millions)
Investments in non-consolidated companies 78 78 Other long-term investments 443 443 Derivative instruments recorded in current financial assets 151 151 Cash and cash equivalents 2,724 2,724 Derivative instruments recorded in liabilities (39) (10) (49)
Level 1 Level 2 Level 3 Total
December 31, 2014(in € millions)
Investments in non-consolidated companies 78 78 Other long-term investments 403 403 Available-for-sale financial assets 96 96 Derivative instruments recorded in current financial assets 111 111 Cash and cash equivalents 3,113 3,113 Derivative instruments recorded in liabilities (51) (9) (61)
Level 1 Level 2 Level 3 Total
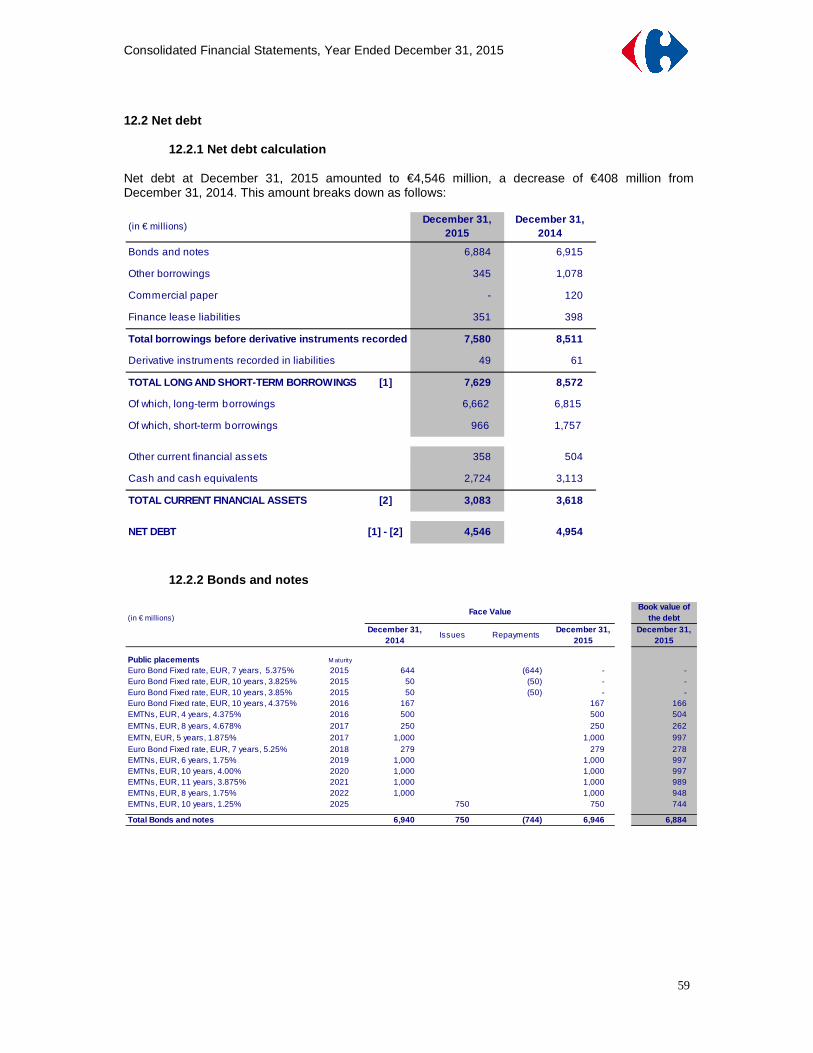
Consolidated Financial Statements, Year Ended December 31, 2015
59
12.2 Net debt
12.2.1 Net debt calculation Net debt at December 31, 2015 amounted to €4,546 million, a decrease of €408 million from December 31, 2014. This amount breaks down as follows:
12.2.2 Bonds and notes
(in € millions)December 31,
2015December 31,
2014
Bonds and notes 6,884 6,915
Other borrowings 345 1,078
Commercial paper - 120
Finance lease liabilities 351 398
Total borrowings before derivative instruments reco rded in liabilities 7,580 8,511
Derivative instruments recorded in liabilities 49 61
TOTAL LONG AND SHORT-TERM BORROWINGS [1] 7,629 8,572
Of which, long-term borrowings 6,662 6,815
Of which, short-term borrowings 966 1,757
Other current financial assets 358 504
Cash and cash equivalents 2,724 3,113
TOTAL CURRENT FINANCIAL ASSETS [2] 3,083 3,618
NET DEBT [1] - [2] 4,546 4,954
(in € millions)Book value of
the debtDecember 31,
2014Issues Repayments
December 31, 2015
December 31, 2015
Public placements M aturity
Euro Bond Fixed rate, EUR, 7 years, 5.375% 2015 644 (644) - -Euro Bond Fixed rate, EUR, 10 years, 3.825% 2015 50 (50) - -Euro Bond Fixed rate, EUR, 10 years, 3.85% 2015 50 (50) - -Euro Bond Fixed rate, EUR, 10 years, 4.375% 2016 167 167 166EMTNs, EUR, 4 years, 4.375% 2016 500 500 504EMTNs, EUR, 8 years, 4.678% 2017 250 250 262EMTN, EUR, 5 years, 1.875% 2017 1,000 1,000 997Euro Bond Fixed rate, EUR, 7 years, 5.25% 2018 279 279 278EMTNs, EUR, 6 years, 1.75% 2019 1,000 1,000 997EMTNs, EUR, 10 years, 4.00% 2020 1,000 1,000 997EMTNs, EUR, 11 years, 3.875% 2021 1,000 1,000 989EMTNs, EUR, 8 years, 1.75% 2022 1,000 1,000 948EMTNs, EUR, 10 years, 1.25% 2025 750 750 744
Total Bonds and notes 6,940 750 (744) 6,946 6,884
Face Value

Consolidated Financial Statements, Year Ended December 31, 2015
60
12.2.3 Other borrowings
(1) Accrued interest on total borrowings, including bonds and notes.
12.2.4 Cash and cash equivalents
There are no material restrictions on the Group's ability to recover or use the assets and settle the liabilities of foreign operations, except for those resulting from local regulations in its host countries. The local supervisory authorities may require banking subsidiaries to comply with certain capital, liquidity and other ratios and to limit their exposure to other Group parties.
12.2.5 Other current financial assets
(in € millions)December 31,
2015December 31,
2014Equity swap liability 77 330Latin America borrowings 107 200Other borrowings 52 350
Accrued interest (1) 99 112Other financial liabilities 10 87
Total Other borrowings 345 1,078
(in € millions)December 31,
2015December 31,
2014
Cash 1,286 2,027
Cash equivalents 1,439 1,086
Total Cash and cash equivalents 2,724 3,113
(in € millions)December 31,
2015December 31,
2014
Available-for-sale financial assets 0 96
Derivative instruments 151 111
Deposits with maturities of more than three months 186 222
Other 22 76
Total Other current financial assets 358 504
Accounting policies
Cash includes cash on hand and demand deposits.
Cash equivalents are highly liquid investments with an original maturity of less than three months that are readily convertible to a known amount of cash and are subject to an insignificant risk of changes in value.
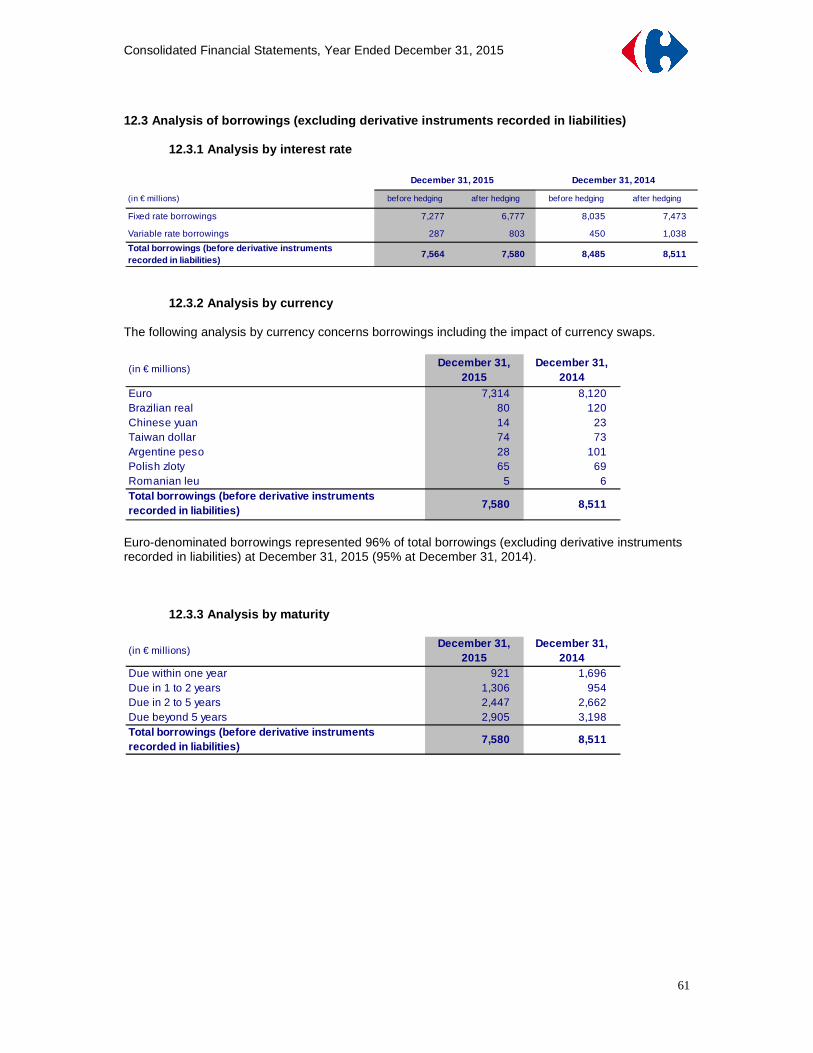
Consolidated Financial Statements, Year Ended December 31, 2015
61
12.3 Analysis of borrowings (excluding derivative i nstruments recorded in liabilities)
12.3.1 Analysis by interest rate
12.3.2 Analysis by currency The following analysis by currency concerns borrowings including the impact of currency swaps.
Euro-denominated borrowings represented 96% of total borrowings (excluding derivative instruments recorded in liabilities) at December 31, 2015 (95% at December 31, 2014).
12.3.3 Analysis by maturity
(in € millions) before hedging after hedging before hedging after hedging
Fixed rate borrowings 7,277 6,777 8,035 7,473
Variable rate borrowings 287 803 450 1,038
7,564 7,580 8,485 8,511
December 31, 2015 December 31, 2014
Total borrowings (before derivative instruments recorded in liabilities)
(in € millions)December 31,
2015December 31,
2014Euro 7,314 8,120Brazilian real 80 120Chinese yuan 14 23Taiwan dollar 74 73Argentine peso 28 101Polish zloty 65 69Romanian leu 5 6
7,580 8,511Total borrowings (before derivative instruments recorded in liabilities)
(in € millions)December 31,
2015December 31,
2014Due within one year 921 1,696Due in 1 to 2 years 1,306 954Due in 2 to 5 years 2,447 2,662Due beyond 5 years 2,905 3,198
7,580 8,511Total borrowings (before derivative instruments recorded in liabilities)
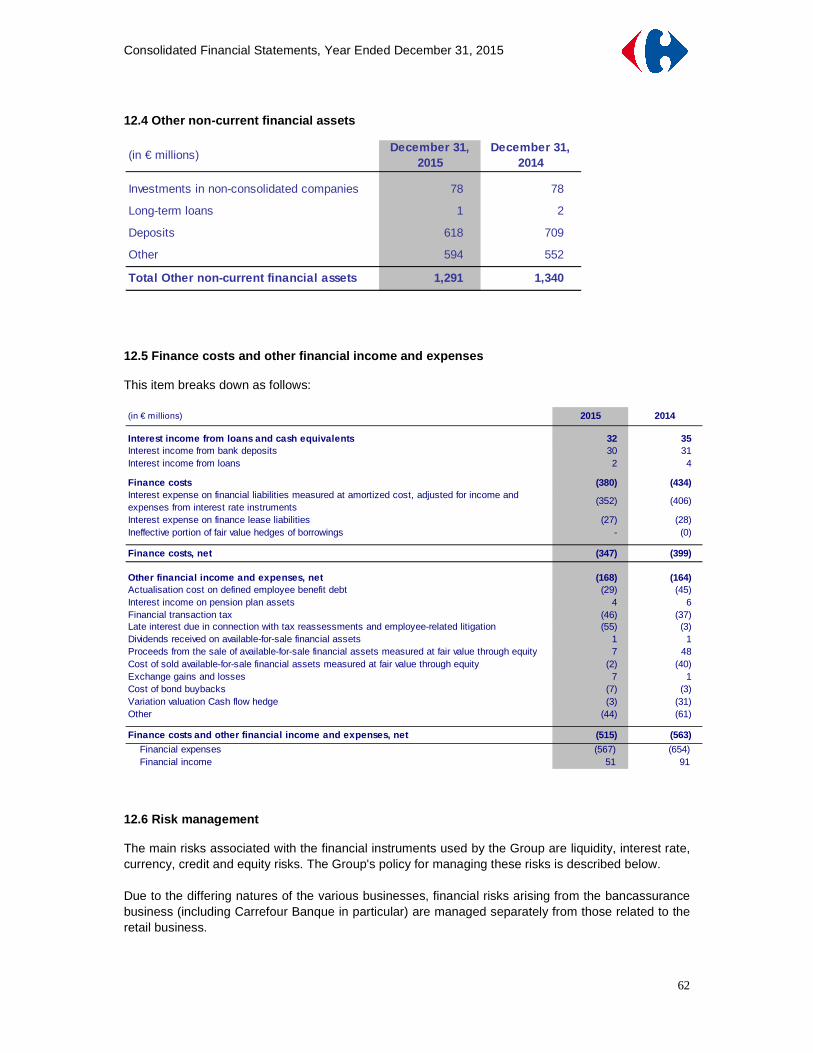
Consolidated Financial Statements, Year Ended December 31, 2015
62
12.4 Other non-current financial assets
12.5 Finance costs and other financial income and e xpenses This item breaks down as follows:
12.6 Risk management The main risks associated with the financial instruments used by the Group are liquidity, interest rate, currency, credit and equity risks. The Group's policy for managing these risks is described below. Due to the differing natures of the various businesses, financial risks arising from the bancassurance business (including Carrefour Banque in particular) are managed separately from those related to the retail business.
(in € millions)December 31,
2015December 31,
2014
Investments in non-consolidated companies 78 78
Long-term loans 1 2
Deposits 618 709
Other 594 552
Total Other non-current financial assets 1,291 1,340
(in € millions) 2015 2014
Interest income from loans and cash equivalents 32 35Interest income from bank deposits 30 31Interest income from loans 2 4
Finance costs (380) (434)Interest expense on financial liabilities measured at amortized cost, adjusted for income and expenses from interest rate instruments
(352) (406)
Interest expense on finance lease liabilities (27) (28)Ineffective portion of fair value hedges of borrowings - (0)
Finance costs, net (347) (399)
Other financial income and expenses, net (168) (164)Actualisation cost on defined employee benefit debt (29) (45)Interest income on pension plan assets 4 6Financial transaction tax (46) (37)Late interest due in connection with tax reassessments and employee-related litigation (55) (3)Dividends received on available-for-sale financial assets 1 1Proceeds from the sale of available-for-sale financial assets measured at fair value through equity 7 48Cost of sold available-for-sale financial assets measured at fair value through equity (2) (40)Exchange gains and losses 7 1Cost of bond buybacks (7) (3)Variation valuation Cash flow hedge (3) (31)Other (44) (61)
Finance costs and other financial income and expens es, net (515) (563)
Financial expenses (567) (654) Financial income 51 91

Consolidated Financial Statements, Year Ended December 31, 2015
63
An organization has been set up around a cash-pooling system to track financial risks. The Corporate Treasury and Financing Department based in Brussels manages the treasury and financing needs of all retail subsidiaries, on the instructions of Group senior management. A reporting system ensures that Group senior management can oversee the department’s implementation of the approved management strategies. The risks associated with the consumer credit business are managed and tracked directly by the entities concerned. Corporate Treasury and Financing oversees the proper implementation of the rules governing the consumer credit business, jointly with the other investors in the business where applicable. A reporting system exists between local teams and Corporate Treasury and Financing.
12.6.1 Liquidity risk
12.6.1.1 Retail business Liquidity risk is the risk that Carrefour will be unable to settle its financial liabilities when they fall due. The Group manages its liquidity risk by ensuring, to the extent possible, that it has sufficient liquid assets at all times to settle its liabilities when they fall due, whatever the conditions in the market. A Liquidity Committee meets at monthly intervals to check that the Group’s financing needs are covered by its available resources. Corporate Treasury and Financing's liquidity management strategy consists of:
- Promoting conservative financing strategies in order to ensure that the Group’s credit rating allows it to raise funds on the bond and commercial paper markets.
- Maintaining a presence in the debt market through regular debt issuance programs, mainly in euros, in order to create a balanced maturity profile. The Group’s issuance capacity under its Euro Medium-Term Notes (EMTN) program totals €12 billion. Since 2007, the loan agreements for the EMTN program include a soft change of control clause that would be triggered in the event that a change of control led to Carrefour losing its investment grade rating. In this case, the notes would not become immediately repayable but the interest rate would increase.
- Using the €5 billion commercial paper program on Euronext Paris, described in a prospectus filed with the Banque de France.
- Maintaining undrawn medium-term bank facilities that can be drawn down at any time according to the Group’s needs. At December 31, 2015, the Group had two undrawn syndicated lines of credit obtained from a pool of leading banks, for a total of €3.9 billion. Group policy consists of keeping these facilities on stand-by to support the commercial paper program. The loan agreements for the syndicated lines of credit include the usual commitments and default clauses, including pari passu, negative pledge, change of control and cross-default clauses and a clause restricting substantial sales of assets. They do not include any rating trigger, although they do allow for the pricing grid to be adjusted up or down to reflect changes in the long-term credit rating. None of the agreements contains a material adverse change clause.
The Group considers that its liquidity position is robust as it has sufficient cash reserves to meet its debt repayment obligations in the coming year. The Group’s debt profile is balanced, with no peak in refinancing needs across the remaining life of bond debt, which averages four years and four months.

Consolidated Financial Statements, Year Ended December 31, 2015
64
12.6.1.2 Bancassurance business
Carrefour Banque’s liquidity risk is monitored within the framework of a senior management-approved liquidity strategy that is part of the Group’s overall strategy.
Carrefour Banque’s refinancing situation is assessed based on internal standards, early warning indicators and regulatory ratios. Liquidity risk management objectives are to:
- Ensure that refinancing needs are met, based on monthly assessments of projected cash surpluses or shortfalls over a three-year period performed by comparing static forecasts of committed financing facilities with dynamic lending forecasts.
- Gradually achieve compliance with the new Basel III liquidity coverage ratios, through a process that is designed to deliver a sustainable improvement in asset quality by investing in a dedicated fund eligible for inclusion in the ratio calculation and extending the maturity of liabilities in order to improve the net stable funding ratio.
- Diversify refinancing sources to include bank lines of credit, bond issues, securitization programs, money market issues and customer deposits. During 2015, Carrefour Banque carried out two bond issues to support the financing and development of its businesses (Note 5.5.2). The master trust structure allows Carrefour Banque to dynamically manage asset-backed securities series issued by the securitization fund. Within this structure, the €400 million serie was renewed for a two year period, from June 2015.
In November 2014, Carrefour Banque secured its refinancing sources by rolling over its €750 million five-year syndicated line of credit and negotiating two one-year extension options, one of which was exercised during the year, extending the facility's maturity to November 2020. The Group therefore retains an option to extend it by a further year.
The following tables analyze the cash flows generated by the Group’s financial and other liabilities by period.
December 31, 2015Carrying amount
Contractual cash flows
Within 1 year In 1 to 5 yearsBeyond 5
years(in € millions)
Borrowings hedged by fair value hedges 516 501 251 250Borrowings hedged by cash flow hedges - -Fixed rate borrowings 6,636 7,532 771 3,890 2,871Unhedged borrowings 77 78 78Finance lease liabilities 351 645 52 198 395Derivative instruments 49 48 22 17 10Total long and short-term borrowings 7,629 8,803 1,173 4,355 3,275
Suppliers and other creditors 13,648 13,648 13,648Consumer credit financing 5,249 5,249 3,328 1,921
Other payables (1) 3,123 3,123 3,123
Total Financial liabilities 29,649 30,824 21,272 6,277 3,275
(1) Excluding deferred revenue

Consolidated Financial Statements, Year Ended December 31, 2015
65
12.6.2 Interest rate risk
Interest rate risk is the risk of a change in interest rates leading to an increase in the Group’s net borrowing costs. It is managed at headquarters level by Corporate Treasury and Financing, which reports monthly to an Interest Rate Risk Committee responsible for recommending hedging strategies and methods to be used to limit interest rate exposures and optimize borrowing costs. Long-term borrowings are generally at fixed rates of interest and do not therefore give rise to any exposure to rising interest rates. Various financial instruments are nonetheless used to hedge borrowings against the risk of changes in interest rates. These are mainly basic swaps and options. Hedge accounting is applied in all cases where the required criteria are met. Variable rate long-term borrowings are hedged using financial instruments that cap rises in interest rates over all or part of the life of the debt. The following table shows the sensitivity of total borrowings to changes in interest rates over one year:
December 31, 2014Carrying amount
Contractual cash flows
Within 1 year In 1 to 5 yearsBeyond 5
years(in € millions)
Borrowings hedged by fair value hedges 500 524 12 512Borrowings hedged by cash flow hedges - -Fixed rate borrowings 7,163 7,992 1,572 3,313 3,106Unhedged borrowings 450 456 236 220Finance lease liabilities 398 709 68 204 437Derivative instruments 61 49 35 5 9Total long and short-term borrowings 8,572 9,729 1,923 4,254 3,553
Suppliers and other creditors 13,384 13,384 13,384Consumer credit financing 5,308 5,308 3,718 1,589
Other payables (1) 2,910 2,910 2,910
Total Financial liabilities 30,174 31,331 21,935 5,843 3,553
(1) Excluding deferred revenue
Impact on shareholders'
equity
Impact on income
statement
Impact on shareholders'
equity
Impact on income
statement
Investments - (4.5) - 4.5 Variable rate borrowings - 0.4 - (0.4)Borrowings hedged by fair value hedges - (2.5) - 2.5 Swaps qualified as fair value hedges - 2.5 - (2.5)Options classified as cash flow hedges - (8.5) - 13.5 Options classified as held for trading - (0.6) - 1.7
Total effect 0.0 (13.2) 0.0 19.3
(in € millions)(- = loss; + = gain)
50-bps decline 50-bps increase

Consolidated Financial Statements, Year Ended December 31, 2015
66
12.6.3 Currency risk Currency transaction risk is the risk of an unfavorable change in exchange rates having an adverse effect on cash flows from commercial transactions denominated in foreign currency. The Group conducts its international operations through subsidiaries that operate almost exclusively in their home country, such that purchases and sales are denominated in local currency. As a result, the Group’s exposure to currency risk on commercial transactions is naturally limited and mainly concerns imported products. Currency risks on import transactions (i.e., goods purchases billed in foreign currencies) covered by firm commitments are hedged by forward purchases of the payment currency. Currency hedges are generally for periods of less than 12 months. The following table shows the effect of an increase/decrease in exchange rates on instruments:
Currency translation risk is the risk of an unfavorable change in exchange rates reducing the value of the net assets of a subsidiary whose functional currency is not the euro, after conversion into euros for inclusion in the Group’s consolidated statement of financial position. The consolidated statement of financial position and income statement are exposed to a currency translation risk: consolidated financial ratios are affected by changes in exchange rates used to translate the income and net assets of foreign subsidiaries operating outside the eurozone. The translation risk on foreign operations outside the eurozone mainly concerns the Brazilian real, Argentine peso and Chinese renminbi. For example, changes in the average exchange rates used in 2015 compared with those for 2014 reduced consolidated net sales by €794 million or 1% and recurring operating income by €109 million or 4.5%. Lastly, when financing is arranged locally, it is generally denominated in local currency.
Impact on shareholders'
equity
Impact on income
statement
Impact on shareholders'
equity
Impact on income
statement
EUR / USD position - 68.6 - (68.6)
EUR / HKD position - 2.1 - (2.1)
EUR / PLN position - 3.5 - (3.5)
EUR / RON position - 6.7 - (6.7)
(in € millions)(- = loss; + = gain)
10% decline 10% increase

Consolidated Financial Statements, Year Ended December 31, 2015
67
12.6.4 Credit risk The Group's estimated exposure to credit risk is presented below:
12.6.4.1 Retail business
1) Trade receivables
Trade receivables correspond mainly to amounts receivable from franchisees (for delivered goods and franchise fees), suppliers (mainly rebates) and tenants of shopping mall units (rent). Impairment losses are recognized where necessary, based on an estimate of the debtor’s ability to pay the amount due and the age of the receivable. At December 31, 2015, trade receivables net of impairment (excluding receivables from suppliers) amounted to €1,173 million (Note 5.4.3). At that date, past due receivables amounted to a net €112 million, of which €32 million were over 90 days past due (2.7% of total trade receivables net of impairment). No additional impairment has been recognized for these receivables as the Group considers that the risk of non-recovery is very limited.
2) Investments (cash equivalents and other current financial assets) The Group’s short-term cash management strategy focuses on acquiring liquid investments that are easily convertible into cash and are subject to an insignificant risk of changes in value. Investments are made for the most part by Corporate Treasury and Financing, in diversified instruments such as term deposits with leading banks and mutual funds classified by the AMF as "money market" and "short-term money market" funds without any withdrawal restrictions. Investments made at the country level are approved by Corporate Treasury and Financing. Counterparty risk monitoring procedures are implemented to track counterparties' direct investment strategies and the underlying assets held by mutual funds in which the Group invests. The Group’s objective is to never hold more than 5% of a fund’s units and to never invest more than €250 million in any single fund.
Investments in non-consolidated companies 78 78
Other long-term investments 1,213 1,262
Total Other non-current financial assets 1,291 1,340
Consumer credit granted by the financial services companies
6,010 5,980
Trade receivables 2,269 2,260
Other current financial assets 358 504
Other assets (1) 418 551
Cash and cash equivalents 2,724 3,113
Maximum exposure to credit risk 13,071 13,748
(1) Excluding prepaid expenses
(in € millions)December 31,
2015December 31,
2014

Consolidated Financial Statements, Year Ended December 31, 2015
68
12.6.4.2 Bancassurance business
1) Credit risk management
To protect against default by borrowers, the Group’s financial services companies have set up systems to check the quality and repayment capacity of their customers. These include:
- Decision-making aids such as credit scoring applications, income/debt simulation tools and credit history checking procedures.
- Interrogation of positive and negative credit history databases, where they exist. - Active management of collection processes. - Credit risk monitoring and control systems.
Within each credit company, a Credit Risk Department is responsible for all of these processes, and the Board of Directors receives copies of all Credit Risk Management Committee reports. At Group level, a Credit Risk – Europe unit has been set up to oversee and implement credit risk management policies in France, Spain, Belgium and Italy.
2) Impairment for non-performing consumer loans Consumer loans are classified as non-performing when the Group believes that there is a risk that all or part of the amount due will not be recovered (for example, because of overdue payment). Impairment models are developed in accordance with IAS 39 – Financial Instruments: Recognition and Measurement and local banking regulations in each country, according to a two-step process:
- Classification of outstanding loans in uniform risk categories based on the probability of default; then
- Modeling of the loss given default based on historical data. In a certain number of countries, specific provisions are also recorded for certain types of exposures, to comply with local central bank guidelines. Analysis of due and past due consumer loans
0 to 3 months
3 to 6 months
6 months to 1 year
More than one year
Consumer credit granted by the financial services companies
6,010 5,829 27 39 25 90
0 to 3 months
3 to 6 months
6 months to 1 year
More than one year
Consumer credit granted by the financial services companies
5,981 5,822 39 24 28 67
(in € millions)
(in € millions)Amounts due and past-due at the period-endAmounts not yet
due at the period-end
December 31, 2014
December 31, 2015
Amounts not yet due at the period-
end
Amounts due and past-due at the period-end

Consolidated Financial Statements, Year Ended December 31, 2015
69
Analysis of consumer loans by maturity
12.6.5 Equity risk Equity risk corresponds to the potential impact of changes in the Carrefour share price on its share-based payment commitments and on treasury stock. Group policy is to avoid taking positions on its own shares or those of other companies, except in response to particular circumstances or needs. From time to time, the Group buys back its shares on the market or purchases call options on its shares, mainly in connection with its stock option plans. The frequency and size of these purchases depend on the share price. At December 31, 2015, shares and options held directly or indirectly by the Group covered its total commitments under outstanding stock option plans. Marketable securities portfolios and other financial investments held by the Group consist for the most part of money market instruments that do not expose the Group to any material equity risk.
(in € millions)Total December
31, 2015Due within
1 yearDue in 1 to
5 yearsDue beyond
5 years
France 2,825 1,242 1,465 118
Belgium 175 7 159 8
Spain 1,640 1,180 227 234
Italy 201 93 75 32
Argentina 166 159 8 -
Brazil 1,003 978 24 -
TOTAL 6,010 3,658 1,958 393
(in € millions)Total December
31, 2014Due within
1 yearDue in 1 to
5 yearsDue beyond
5 years
France 2,834 952 1,701 181
Belgium 188 8 174 6
Spain 1,448 1,071 198 178
Italy 190 93 97 -
Argentina 174 170 4 -
Brazil 1,146 1,126 20 -
TOTAL 5,981 3,421 2,194 366

Consolidated Financial Statements, Year Ended December 31, 2015
70
NOTE 13: OFF-BALANCE SHEET COMMITMENTS
Off-balance sheet commitments related to cash transactions include:
- Credit commitments given to customers by the financial services companies in the course of their operating activities, and credit commitments received from banks.
- Mortgages and other guarantees given or received, mainly in connection with the Group’s real estate activities.
- Committed lines of credit available to the Group but not drawn down at the period-end. Off-balance sheet commitments related to operations include:
- Commitments to purchase land given in connection with the Group’s expansion programs. - Miscellaneous commitments arising from commercial contracts.
Due within 1 year
Due in 1 to 5 years
Due beyond 5 years
Related to cash management transactions 9,706 7,956 1, 171 580 7,869
Financial services companies 8,961 7,855 1,106 0 6,969
Other companies 745 101 65 579 900
Related to operations/real estate/expansion, etc. 2, 430 1,319 984 127 2,795
Related to sales of securities 261 131 57 73 171
Related to leases 3,503 1,055 1,597 851 3,494
TOTAL 15,900 10,460 3,809 1,631 14,328
Due within 1 year
Due in 1 to 5 years
Due beyond 5 years
Related to cash management transactions 6,633 938 5,67 5 20 6,819
Financial services companies 1,860 146 1,696 18 1,563
Other companies 4,774 791 3,980 3 5,256
Related to operations/real estate/expansion, etc. 1, 040 239 530 270 921
Related to sales of securities 279 176 79 23 337
Related to leases 636 226 325 84 654
TOTAL 8,588 1,579 6,610 399 8,730
December 31, 2014
December 31, 2014
By maturityCommitments given (in € millions)
Commitments received (in € millions)December 31,
2015
By maturity
December 31, 2015
Accounting policies
Commitments given and received by the Group that are not recognized in the statement of financial position correspond to contractual obligations whose performance depends on the occurrence of conditions or transactions after the period-end. There are three types of off-balance sheet commitments, related to (i) cash transactions, (ii) retailing operations and (iii) acquisitions of securities. The Group is also party to leases that give rise to future commitments such as for the payment of rent on retail units leased by the Group from owners (commitments given), and the payment of rent on retail units in shopping malls owned by the Group and leased to other parties (commitments received).
Consolidated Financial Statements, Year Ended December 31, 2015
71
- Performance bonds issued in connection with the Group’s expansion programs. - Rent guarantees and guarantees from shopping mall operators. - Guarantees for the payment of receivables. - Other commitments given or received.
Off-balance sheet commitments related to securities consist of firm commitments to purchase and sell securities received from third parties:
- For the most part in France, in connection with the Group’s franchising activities. - Including immediately exercisable put and call options and sellers’ warranties given to third
parties. No value is attributed to sellers’ warranties received by the Group. Off-balance sheet commitments related to leases:
At December 31, 2015, 691 hypermarket properties and 509 supermarket properties were owned outright out of a total integrated store base of 1,190 hypermarkets and 1,353 supermarkets.
Rent on store properties not owned by the Group totaled €1,035 million in 2015 (Note 5.2.2).
Of total future minimum rentals due under operating and finance leases, 27% are due within one year, 43% in one to five years and 30% beyond five years.
Future minimum rentals under operating leases – determined based on the Group’s maximum commitment in terms of both duration and amount for each of the property leases in progress at the period-end – amounted to €3,503 million at December 31, 2015, or €2,747 million after discounting (Note 6.5).
The Group also owns various shopping malls, mainly built on the same sites as its hypermarkets and supermarkets. Rental of the retail units in these malls generated revenues of €206 million in 2015. Future minimum rentals receivable from these retail units – determined based on the tenants’ maximum commitment in terms of both duration and amount for each of the leases in progress at the period-end – amounted to €636 million at December 31, 2015, or €510 million after discounting. NOTE 14: SUBSEQUENT EVENTS In December 2015, the Group exercised an option to extend a €2,500 million credit facility. The one-year extension, until January 2021, became effective in January 2016. The Group retains an option to extend the facility by a further year. The operation has contributed to the ongoing strategy to secure the Group's long-term financing sources by extending the average maturity of its facilities (from 3.7 to 4.4 years as of December 31, 2015). On February 29, 2016, the Group announced it had signed an agreement with the Eroski Group to acquire 36 compact hypermarkets with a total sales area of 235,000 square meters, as well as 8 shopping malls and 22 gas stations adjacent to the stores. The acquisition is subject to conditions, including approval by the relevant antitrust authorities. No other events have occurred since the year-end that would have a material impact on the consolidated financial statements. NOTE 15: FEES PAID TO THE AUDITORS
(in € millions)
Deloitte KPMG Mazars Total Deloitte KPMG Mazars Total
& Associés & Associés
Audit services 3.0 8.3 2.2 13.6 2.3 10.2 2.5 15.1
Other services 0.8 0.2 0.1 1.1 0.8 0.3 0.1 1.2
TOTAL 3.8 8.5 2.3 14.7 3.1 10.5 2.6 16.3
2015 2014

Consolidated Financial Statements, Year Ended December 31, 2015
72
NOTE 16: LIST OF CONSOLIDATED COMPANIES 16.1 Fully consolidated companies at December 31, 2 015
AJACCIO DISTRIBUTION 100.0ALHE DISTRIBUTION 100.0ALSATOP 100.0AMIDIS ET CIE 100.0ANTIDIS 100.0APEN 100.0AVENUE 52.0BELLEVUE DISTRIBUTION 100.0BLO DISTRIBUTION 100.0BOEDIM 100.0BREM 63 SCI 51.0C.S.D 74.0C.S.F 100.0CADS 97.9CALLIAN DISTRIBUTION 100.0CALLOUETS 51.0CAMPUS ERTECO 100.0CARAUTOROUTES 100.0CARDADEL 100.0CARFUEL 100.0CARIMA 100.0CARMA 50.0CARMA COURTAGE 50.0CARMA VIE 50.0CARREFOUR ADMINISTRATIF FRANCE 100.0CARREFOUR BANQUE (Ex S2P - SOCIETE DES PAIEMENTS PASS ) 60.0CARREFOUR DRIVE 100.0CARREFOUR FRANCE 100.0CARREFOUR France PARTICIPATION 100.0CARREFOUR HYPERMARCHES 100.0CARREFOUR IMPORT 100.0CARREFOUR MANAGEMENT 100.0CARREFOUR MARCHANDISES INTERNATIONALES 100.0CARREFOUR MONACO 100.0CARREFOUR PARTENARIAT INTERNATIONAL 100.0CARREFOUR PROPERTY DEVELOPPEMENT 58.23CARREFOUR PROPERTY FRANCE 100.0CARREFOUR PROPERTY GESTION 100.0CARREFOUR PROPERTY INTERNATIONAL 100.0CARREFOUR PROXIMITE FRANCE 100.0CARREFOUR SA 100.0CARREFOUR SERVICES CLIENTS 100.0CARREFOUR STATION SERVICE 100.0CARREFOUR SUPPLY CHAIN 100.0CARREFOUR VOYAGES 100.0CARVILLENEUVE 100.0CENTRE DE FORMATION ET COMPETENCES 100.0CHALLENGER 100.0CHAMNORD 56.7CIGOTOP 100.0CLAIREFONTAINE 100.0CODIEP 100.0COMPAGNIE D'ACTIVITE ET DE COMMERCE INTERNATIONAL -CACI- 100.0COVIAM 8 100.0COVICAR 2 100.0COVICAR IC 1 99.99
FRANCEPercent interest
used in consolidation
Consolidated Financial Statements, Year Ended December 31, 2015
73
COVICAR IC 2 99.99COVICAR IC 3 99.99COVICAR IC 4 99.99COVICARGO 4 99.99COVICARGO 5 99.99CPF ASSET MANAGEMENT 100.0CRF REGIE PUBLICITAIRE 100.0CRFP10 100.0CRFP11 100.0CRFP13 100.0CRFP14 100.0CRFP15 100.0CRFP16 100.0CRFP19 100.0CRFP20 100.0CRFP21 100.0CRFP22 100.0CRFP23 100.0CRFP4 100.0CRFP8 100.0CSD TRANSPORTS 74.0CSI 100.0DAUPHINOISE DE PARTICIPATIONS 100.0DE KERSALUN 100.0DE LA COQUERIE 51.0DE LA FONTAINE 51.0DE SIAM 51.0DELDIS 99.9DIGITAL MEDIA SHOPPER 100.0DIPLO 99.96DISTRIVAL 100.0DOREL 99.9ECALHAN 51.0ED FRANCHISE 100.0EPG 66.0ERTECO 100.0ERTECO FRANCE 100.0FALDIS 99.9FAVICAR 100.0FCT MASTER CREDIT CARD 2013 60.0FINANCIERE RSV 100.0FINIFAC 100.0FORUM DEVELOPPEMENT 100.0GAMACASH 100.0GEILEROP 100.0GENEDIS 100.0GERNIMES 100.0GIE CARREFOUR PERSONAL FINANCE SERVICES 57.5GM CARREFOUR 100.0GRANDVINS-PRIVÉS.COM 100.0GUILVIDIS 99.9GUYENNE & GASCOGNE 100.0GVTIMM 51.0HAUTS DE ROYA 100.0HERMES 100.0HYPARLO 100.0HYPERADOUR 100.0HYPERMARCHES DE LA VEZERE 50.0IMMAUFFAY 51.0IMMO ARTEMARE 51.0IMMO BACQUEVILLE 51.0IMMOBILIERE CARREFOUR 100.0IMMOBILIERE ERTECO 100.0IMMOCYPRIEN 51.0IMMODIS 100.0
Consolidated Financial Statements, Year Ended December 31, 2015
74
IMMODIVINE 51.0IMMOLOUBES 51.0IMMOTOURNAY 51.0INTERDIS 100.0KERGALYS 100.0LA BAUDRIERE 51.0LA CROIX VIGNON 51.0LA GERSOISE 51.0LALAUDIS 99.0LANN KERGUEN 51.2LAPALUS 100.0LE COURTEMBLET 100.0LE PHENIX 100.0LES TASSEAUX 51.0LES VALLEES 51.0LOGIDIS 100.0LOGISTICADOUR 100.0LUDIS 100.0LVDIS 100.0MAISON JOANNES BOUBEE 100.0MARKET PAY 100.0MARKET PAY TECH 100.0MATOLIDIS 100.0MAXIMOISE DE CREATION 51.0MELGVEN DISTRIBUTION 100.0MENUDIS 100.0MICHEL HOCHARD 100.0MONTECO 100.0MONTEL DISTRIBUTION 100.0MORTEAU DISTRIBUTION 100.0MPF PODIROUX 100.0MPH DISTRI 99.9NEWMAG 100.0NOSAEL 51.0NOVA.DIS 100.0ON LINE CARREFOUR 100.0OOSHOP 100.0OPCI KART CRF 100.0P.R.M. 100.0PASDEL 99.9PHIVETOL 100.0PLORAUDIS 100.0PROFIDIS 100.0PROFIDIS ET CIE 99.9PROLACOUR 100.0RESSONS 51.0SAINT HERMENTAIRE 100.0SAINTE VICTOIRE DISTRIBUTION 100.0SAM PROSPECTIVE 90.0SAMAD 100.0SELIMA 100.0SELOJA 51.0SIGOULIM 51.0SOCIETE DES NOUVEAUX HYPERMARCHES 100.0SODICO 100.0SODIMOB 100.0SODIMODIS 100.0SODISAL 100.0SODISCAF 100.0SODITA 100.0SODITRIVE 100.0SOFALINE 100.0SOFIDIM 98.9SOFIDIS 100.0SOPROMAL 100.0SOVAL 99.9
Consolidated Financial Statements, Year Ended December 31, 2015
75
STATION SUD 100.0STELAUR 99.9STENN 100.0SUPERADOUR 100.0SUPERDIS 96.5TERTRA 51.0UNIVU 100.0VALECAR 100.0VARJEA 100.0VEZERE DISTRIBUTION 50.0VISAGE 100.0VIZEGU 90.1
GERMANYCARREFOUR PROCUREMENT INTERNATIONAL AG & CO. KG 100.0
ARGENTINABANCO DE SERVICIOS FINANCIEROS SA 60.0INC S.A. 100.0
BELGIUMBIGG'S SA 100.0BRUGGE RETAIL ASSOCIATE 100.0CAPARBEL 100.0CARREFOUR BELGIUM 100.0CARREFOUR FINANCE 100.0CARUM 100.0DE NETELAAR 100.0DIKON 100.0DRIVE 1 100.0DRIVE 2 100.0ECLAIR 100.0FILUNIC 100.0FIMASER 60.0FOMAR 100.0FRESHFOOD 100.0GB RETAIL ASSOCIATES SA 100.0GENT DAMPOORT RETAIL ASSOCIATE 100.0GMR 100.0GROSFRUIT 100.0HALLE RETAIL ASSOCIATE 100.0HEPPEN RETAIL ASSOCIATE 100.0LA LOUVIERE RETAIL ASSOCIATE 100.0MABE 100.0MARKET A1 CBRA 100.0MARKET B2 CBRA 100.0MARKET C3 CBRA 100.0MARKET D4 CBRA 100.0MARKET E5 CBRA 100.0MARKET F6 CBRA 100.0QUIEVRAIN RETAIL ASSOCIATE 100.0R&D FOOD 100.0ROB 100.0RULUK 100.0SCHILCO 100.0SOUTH MED INVESTMENTS 100.0STIGAM 100.0VANDEN MEERSSCHE NV 100.0VERSMARKT 100.0WAPRO 100.0
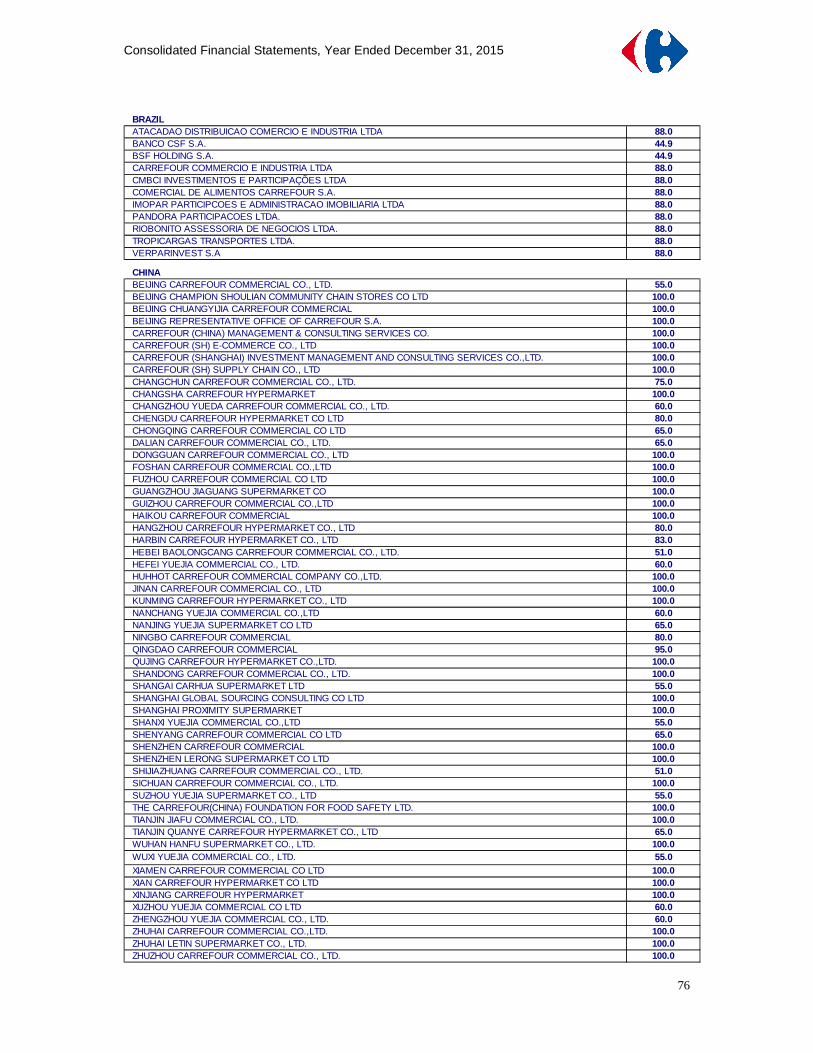
Consolidated Financial Statements, Year Ended December 31, 2015
76
BRAZILATACADAO DISTRIBUICAO COMERCIO E INDUSTRIA LTDA 88.0BANCO CSF S.A. 44.9BSF HOLDING S.A. 44.9CARREFOUR COMMERCIO E INDUSTRIA LTDA 88.0CMBCI INVESTIMENTOS E PARTICIPAÇÕES LTDA 88.0COMERCIAL DE ALIMENTOS CARREFOUR S.A. 88.0IMOPAR PARTICIPCOES E ADMINISTRACAO IMOBILIARIA LTDA 88.0PANDORA PARTICIPACOES LTDA. 88.0RIOBONITO ASSESSORIA DE NEGOCIOS LTDA. 88.0TROPICARGAS TRANSPORTES LTDA. 88.0VERPARINVEST S.A 88.0
CHINABEIJING CARREFOUR COMMERCIAL CO., LTD. 55.0BEIJING CHAMPION SHOULIAN COMMUNITY CHAIN STORES CO LTD 100.0BEIJING CHUANGYIJIA CARREFOUR COMMERCIAL 100.0BEIJING REPRESENTATIVE OFFICE OF CARREFOUR S.A. 100.0CARREFOUR (CHINA) MANAGEMENT & CONSULTING SERVICES CO. 100.0CARREFOUR (SH) E-COMMERCE CO., LTD 100.0CARREFOUR (SHANGHAI) INVESTMENT MANAGEMENT AND CONSULTING SERVICES CO.,LTD. 100.0CARREFOUR (SH) SUPPLY CHAIN CO., LTD 100.0CHANGCHUN CARREFOUR COMMERCIAL CO., LTD. 75.0CHANGSHA CARREFOUR HYPERMARKET 100.0CHANGZHOU YUEDA CARREFOUR COMMERCIAL CO., LTD. 60.0CHENGDU CARREFOUR HYPERMARKET CO LTD 80.0CHONGQING CARREFOUR COMMERCIAL CO LTD 65.0DALIAN CARREFOUR COMMERCIAL CO., LTD. 65.0DONGGUAN CARREFOUR COMMERCIAL CO., LTD 100.0FOSHAN CARREFOUR COMMERCIAL CO.,LTD 100.0FUZHOU CARREFOUR COMMERCIAL CO LTD 100.0GUANGZHOU JIAGUANG SUPERMARKET CO 100.0GUIZHOU CARREFOUR COMMERCIAL CO.,LTD 100.0HAIKOU CARREFOUR COMMERCIAL 100.0HANGZHOU CARREFOUR HYPERMARKET CO., LTD 80.0HARBIN CARREFOUR HYPERMARKET CO., LTD 83.0HEBEI BAOLONGCANG CARREFOUR COMMERCIAL CO., LTD. 51.0HEFEI YUEJIA COMMERCIAL CO., LTD. 60.0HUHHOT CARREFOUR COMMERCIAL COMPANY CO.,LTD. 100.0JINAN CARREFOUR COMMERCIAL CO., LTD 100.0KUNMING CARREFOUR HYPERMARKET CO., LTD 100.0NANCHANG YUEJIA COMMERCIAL CO.,LTD 60.0NANJING YUEJIA SUPERMARKET CO LTD 65.0NINGBO CARREFOUR COMMERCIAL 80.0QINGDAO CARREFOUR COMMERCIAL 95.0QUJING CARREFOUR HYPERMARKET CO.,LTD. 100.0SHANDONG CARREFOUR COMMERCIAL CO., LTD. 100.0SHANGAI CARHUA SUPERMARKET LTD 55.0SHANGHAI GLOBAL SOURCING CONSULTING CO LTD 100.0SHANGHAI PROXIMITY SUPERMARKET 100.0SHANXI YUEJIA COMMERCIAL CO.,LTD 55.0SHENYANG CARREFOUR COMMERCIAL CO LTD 65.0SHENZHEN CARREFOUR COMMERCIAL 100.0SHENZHEN LERONG SUPERMARKET CO LTD 100.0SHIJIAZHUANG CARREFOUR COMMERCIAL CO., LTD. 51.0SICHUAN CARREFOUR COMMERCIAL CO., LTD. 100.0SUZHOU YUEJIA SUPERMARKET CO., LTD 55.0THE CARREFOUR(CHINA) FOUNDATION FOR FOOD SAFETY LTD. 100.0TIANJIN JIAFU COMMERCIAL CO., LTD. 100.0TIANJIN QUANYE CARREFOUR HYPERMARKET CO., LTD 65.0WUHAN HANFU SUPERMARKET CO., LTD. 100.0WUXI YUEJIA COMMERCIAL CO., LTD. 55.0XIAMEN CARREFOUR COMMERCIAL CO LTD 100.0XIAN CARREFOUR HYPERMARKET CO LTD 100.0XINJIANG CARREFOUR HYPERMARKET 100.0XUZHOU YUEJIA COMMERCIAL CO LTD 60.0ZHENGZHOU YUEJIA COMMERCIAL CO., LTD. 60.0ZHUHAI CARREFOUR COMMERCIAL CO.,LTD. 100.0ZHUHAI LETIN SUPERMARKET CO., LTD. 100.0ZHUZHOU CARREFOUR COMMERCIAL CO., LTD. 100.0

Consolidated Financial Statements, Year Ended December 31, 2015
77
SPAINCARREFOUR ESPANA PROPERTIES, S.L. 100.0CARREFOUR NAVARRA, S.L. 100.0CARREFOUR NORTE, S.L. 100.0CARREFOURONLINE S.L (SUBMARINO HISPANIA) 100.0CENTROS COMERCIALES CARREFOUR, S.A. 100.0CORREDURIA DE SEGUROS CARREFOUR 100.0ESTABLECIMIENTOS DE DESCUENTO STONE 100.0GROUP SUPECO MAXOR 100.0INVERSIONES PRYCA, S.A. 100.0NORFIN HOLDER S.L. 100.0SERVICIOS FINANCIEROS CARREFOUR EF.C. (FINANCIERA PRYCA) 59.9SIDAMSA CONTINENTE HIPERMERCADOS, S.A. 99.9SOCIEDAD DE COMPRAS MODERNAS, S.A. (SOCOMO) 100.0SUPERMERCADOS CHAMPION, S.A. 100.0VIAJES CARREFOUR, S.L.UNIPERSONAL 100.0
HONG KONGCARREFOUR ASIA LTD 100.0CARREFOUR GLOBAL SOURCING ASIA 100.0CARREFOUR TRADING ASIA LTD (CTA) 100.0
INDIACARREFOUR INDIA MASTER FRANCHISE LTD 100.0CARREFOUR WC & C INDIA PRIVATE LTD 100.0
IRLANDCARREFOUR INSURANCE LIMITED 100.0
ITALIACARREFOUR BANCA 60.0CARREFOUR ITALIA FINANCE SRL 100.0CARREFOUR ITALIA SPA 100.0CARREFOUR PROPERTY ITALIA SRL 99.8CONSORZIO PROPRIETARI CENTRO COMMERCIALE BRIANZA 52.8CONSORZIO PROPRIETARI CENTRO COMMERCIALE BUROLO 89.0CONSORZIO PROPRIETARI CENTRO COMMERCIALE GIUSSANO 76.8CONSORZIO PROPRIETARI CENTRO COMMERCIALE MASSA 54.1CONSORZIO PROPRIETARI CENTRO COMMERCIALE THIENE 57.8CONSORZIO PROPRIETARI CENTRO COMMERCIALE TORINO MONTECUCCO 87.2CONSORZIO PROPRIETARI CENTRO COMMERCIALE VERCELLI 84.2DIPERDI SRL 99.8GALLERIA COMMERCIALE PADERNO S.R.L. 99.8GALLERIA COMMERCIALE PROPERTY FUTURA S.R.L. 99.8GS SPA 99.8S.C.A.R.L. SHOPVILLE GRAN RENO 57.7SOCIETA SVILUPPO COMMERCIALE SRL 99.8
LUXEMBOURGVELASQUES SA 100.0
NETHERLANDSCARREFOUR CHINA HOLDINGS BV 100.0CARREFOUR INTERNATIONAL SERVICES BV (HYPER GERMANY HOLDING BV) 100.0CARREFOUR NEDERLAND BV 100.0CARREFOUR PROPERTY BV 100.0FICADAM BV 100.0FOURET BV 100.0HYPER GERMANY BV 100.0HYPER INVEST BV 100.0INTERCROSSROADS BV 100.0SOCA BV 100.0

Consolidated Financial Statements, Year Ended December 31, 2015
78
POLANDCARREFOUR POLSKA 100.0CARREFOUR POLSKA WAW 100.0CPA WAW 1 SKA 100.0IBES 100.0GALERIE ALKOHOLI 100.0WIGRY 100.0
ROMANIAARTIMA SA 100.0CARREFOUR MERCHANDISING 100.0CARREFOUR ROUMANIE 100.0MILITARI GALERIE COMERCIALA 100.0SUPECO INVESTMENT SRL 100.0
SWITZERLANDCARREFOUR WORLD TRADE 100.0HYPERDEMA (PHS) 100.0PROMOHYPERMARKT AG (PHS) 100.0
TAIWANCARREFOUR INSURANCE BROKER CO 60.0CARREFOUR STORES TAIWAN CO 60.0CARREFOUR TELECOMMUNICATION CO 30.6CHARNG YANG DEVELOPMENT CO 30.0PRESICARRE 60.0

Consolidated Financial Statements, Year Ended December 31, 2015
79
16.2 Companies accounted for by the equity method a t December 31, 2015
ABREDIS 50.0ADIALEA 45.0ALEXANDRE 50.0AP2L DISTRIBUTION 50.0AROBLIS 50.0AUDIST SAS 50.0AZAYDIS 34.0AZIMMO 33.8BLADIS 33.3BORDEROUGE 49.9BPJ 26.0CALODIAN DISTRIBUTION 50.0CARDUTOT 26.0CARGAN 50.0CARMILA 42.2CERBEL 50.0CEVIDIS 50.0CHERBOURG INVEST 48.0CHRISTIA 50.0CINQDIS 09 50.0CJA DISTRIBUTION 50.0COLODOR 50.0CONCEPT 2003 50.0COROU 50.0COVIAM 21 50.0DECODIS 50.0DEPOT PETROLIER DE LYON 50.0DEPOTS PETROLIERS COTIERS 24.4DIRIC 50.0DISMONPT 50.0DISTRI PALAVAS 50.0DISTRIBOURG 50.0DISTRIFLEURY 50.0DU MOULIN 49.9ENTREPOT PETROLIER DE VALENCIENNES 34.0FABCORJO 50.0FARO 50.0FERRARI 50.0FIVER 50.0FONCIERE MARSEILLAN 50.0FONCIERE PLANES 50.0FONCIERE SOLANDIS 33.8FRELUM 50.0GANDIS 50.0GERIC GIE 60.8GPVM 30.0GRANDI 50.0GWENDA 50.0HBLP 25.0IDEC 50.0IMMO ST PIERRE EGLISE 50.0JOSIM 34.0JUPILOU 34.0LA CATALANE DE DISTRIBUTION 50.0LA CRAUDIS 50.0LAITA BELON DISTRIBUTION 50.0
FRANCEPercent interest
used in consolidation

Consolidated Financial Statements, Year Ended December 31, 2015
80
LAURENJI 50.0LB LE PLAN 50.0LE CLAUZELS 50.0LE PETIT BAILLY 50.0LEATILD 50.0LES OLIVIERS 50.0LEZIDIS 50.0LSODIS 50.0LUMIMMO 51.0MADIS 50.0MAGODIS 50.0MAISON VIZET FABRE 29.1MALISSOL 50.0MARIDYS 50.0MASSEINE 50.0MAUDIS 50.0MBD 50.0MY DESIGN 40.0NASOCA 50.0NOUKAT 50.0OLICOURS 50.0OUISDIS 50.0OVEA 50.0PAM 50.0PLAMIDIS 50.0PLANE MARSEILLAN 50.0PRASSIDIS 50.0PRODIX 50.0PROPHI 50.0PROVENCIA SA 50.0REBAIS DISTRIBUTION 50.0RIMADIS 50.0ROND POINT 34.0ROSE BERGER 50.0SAM 50.0SCA 50.0SCB 26.0SCI DOMINIQUE 50.0SCI IMMODISC 50.0SCI LA CLAIRETTE 50.0SCI LATOUR 60.0SCI PONT D'ALLIER 50.0SCI SOVALAC 50.0SCOMONDIS 50.0SCYCADIS 50.0SDR 50.0SEREDIS 26.0SIFO 50.0SMD 50.0SME 50.0SOCADIS 50.0SOCADIS CAVALAIRE 50.0SODIBOR 50.0SODILIM 50.0SODYEN 50.0SOLANDIS 34.0SOQUIMDIS 50.0SOVADIS 50.0ST PAUL DE DISTRIBUTION 50.0STE DU DEPOT PETROLIER DE NANTERRE 20.0STE FINANCIERE GERIC 34.9STORYDIS 50.0TARDIS 50.0TURENNE 50.0VALMENDIS 50.0

Consolidated Financial Statements, Year Ended December 31, 2015
81
BELGIUMMESTDAGH 25.0
BRAZILCOSMOPOLITANO SHOPPING EMPREENDIMENTOS S.A. 44.0
SPAIN2013 COUÑAGO NEVADO 26.02013 CID OTERO 26.02013 ALBADALEJO VALENCIA 26.02013 MARTINEZ CARRION 26.02013 GISBERT CATAÑA 26.02013 SOBAS ROMERO 26.02013 CORCOLES ARGADOÑA SL 26.02011 CAYETANO PANELLES, S.L. 26.02013 ALVARO EFREM JIMENEZ 26.02013 CORDOBA RODRIGUEZ 26.02013 ERIK DAVID 26.02013 FLORES HERNANDEZ 26.02013 LIZANDA TORTAJADA 26.02013 NAYARA S.MARTIN 26.02013 VICENTE ARLANDIS 26.0ANTONIO PEREZ, S.L 26.0COSTASOL DE HIPERMERCADOS, S.L. 34.0DIAGONAL PARKING, S.C. 57.5GLORIAS PARKING S.A. 50.0HEGERVIS MATARO, S.L. 26.0ILITURGITANA DE HIPERMERCADOS, S.L. 34.0JM.MARMOL SUPERMERCADOS. S.L. 26.0J.CARLOS VAZQUEZ, S.L. 26.0LUHERVASAN, S.L. 26.0SAGRADA FAMILIA, S.L. 26.0SUPERMERCADOS CENTENO S.L. 26.0VALATROZ 26.0
ITALIACARMILA THIENE S.R.L. 49.8CONSORZIO CIEFFEA 49.9CONSORZIO PROPRIETARI CENTRO COMMERCIALE ASSAGO 49.9CONSORZIO PROPRIETARI CENTRO COMMERCIALE ROMANINA 46.3CONSORZIO PROPRIETARI CENTRO COMMERCIALE SIRACUSA 33.3S.C.A.R.L. SHOPVILLE LE GRU 39.3
POLANDC SERVICES 30.0
ROMANIAPLOIESTI SHOPPING CITY 50.0
TURKEYCARREFOUR SABANCI TICARET MERKEZI AS CARREFOURSA 46.0
TUNISIAULYSSE 25.0