financial performance summary · 2019-03-21 · strategic report governance financial statements...
TRANSCRIPT

Strategic Report Governance Financial Statements Other InformationFinancial Review
“ A good year of progress in our key financial metrics”Ben StevensFinance Director
Financial performance summary
Non‑GAAP measuresIn the reporting of financial information, the Group uses certain measures that are not defined by IFRS, the generally accepted accounting principles (GAAP) under which the Group reports. The Group believes that these additional measures, which are used internally, are useful to users of the financial information in helping them understand the underlying business performance.
The principal non-GAAP measures which the Group uses are adjusted revenue, adjusted revenue from the Strategic Portfolio, adjusted profit from operations, adjusted diluted earnings per share, operating cash flow conversion ratio@ and adjusted cash generated from operations@. Adjusting items are significant items in revenue, profit from operations, net finance costs, taxation and the Group’s share of the post-tax results of associates and joint ventures which individually or, if of a similar type, in aggregate, are relevant to an understanding of the Group’s underlying financial performance. As an additional measure to indicate the results of the Group before the impact of exchange rates on the Group’s results, the movement in adjusted revenue, adjusted revenue from the Strategic Portfolio, adjusted profit from operations and adjusted diluted earnings per share are shown at constant rates of exchange. The Group also includes, where appropriate, measures termed ‘representative’ or ‘organic’ to provide the user with the Group’s performance without the potentially distorting effects of acquisitions, particularly RAI. These non-GAAP measures are explained on pages 258 to 266.
Reconciliation of revenue to adjusted revenue at constant rates
2018 2017 2016
£m Change % £m £m Change % £m
(vs 2017 Rep) Repres Organic (vs 2016 Org) £m
Revenue 24,492 +25% 19,564 19,564 +39% 14,130Adjusting items (180) – (258) (258) – –Add/(subtract) impact of acquisition (for representative/organic calculation) – – 5,577 (4,050) – –Adjusted revenue 24,312 ‑2.3% 24,883 15,256 +8% 14,130Impact of exchange 1,448 – (700) –Adjusted revenue at constant rates 25,760 +3.5% 14,556 +3%
After adjusting for the revenue from acquisitions, including RAI, the short-term uplift to revenue due to the treatment of excise on bought-in goods and the effect of exchange on the reported result, on a representative, constant currency basis, adjusted revenue was up by 3.5% (2017: 3.0% on an adjusted organic basis) as pricing and the growth in THP, vapour and modern oral more than offset the decline in combustible volume on a representative basis (2017: down 2.6% on an organic basis).
Change in adjusted revenue at constant rates (%)
+33.4% Non-GAAP
KPI
20182018 (rep)20172017 (org)2016
+33%+4%
+32%+3%+6%
Definition: Change in revenue before the impact of adjusting items and the impact of fluctuations in foreign exchange rates.
@ Denotes phrase, paragraph or similar that does not form part of BAT’s Annual Report on Form 20-F as filed with the SEC.
In 2018, revenue was £24,492 million, an increase of 25.2% on 2017 (2017: £19,564 million, up 38.5% on 2016). The revenue growth in both years was mainly due to the inclusion of RAI as a wholly-owned subsidiary from the acquisition date, with 2018, 2017 and 2016 including 12 months, approximately five months and nil months of revenue from RAI respectively. Revenue was also up, driven by price mix of 6% (on the combustible brands) and the growth of the PRRP portfolio. Revenue was affected by the sale of products bought in on short-term contract manufacturing arrangements inclusive of excise. Revenue was also affected by the movements of foreign exchange on our reported results which was a headwind in 2018 of approximately 6%, compared to a tailwind of 4% in 2017.
RevenueRevenue (£m)
£24,492m +25.2%201820172016
+25%+39%+13%
£24,492m£19,564m
£14,130m
Definition: Revenue recognised, net of duty, excise and other taxes.
In 2018, revenue includes £17,257 million of revenue from the Strategic Portfolio, an increase of 49% on 2017 (on a reported and representative basis).
33BAT Annual Report and Form 20-F 2018
Highlights– Group revenue was up 25% or 3.5% on an adjusted,
representative basis at constant rates of exchange;
– Profit from operations increased by 45% or 4.0% on an adjusted, representative basis at constant rates of exchange;
– Diluted earnings per share fell 86%. Adjusted diluted earnings per share up 5.2% or 11.8% at constant rates;
– Dividend per share up 4.0% at 203.0p;
– Net cash generated from operating activities up 93%, with adjusted cash generated from operations@ at constant rates up 158%;
– Cash conversion at 111%, with operating cash flow conversion ratio at 113%@.

Financial Review
Reconciliation of revenue to adjusted revenue at constant rates of exchange, by product category
2018 £m
Adjusting items
£m
Impact of exchange
£m
Adjusted at constant
2018£m
Adjusted at constantvs 2017
%
Adjusted at constant vs 2017
repres %2017
£mAcquisitions
£m
2017 repres
£m
Strategic Portfolio comprises:Combustible portfolio 15,457 – 816 16,273 +50.1% +5.7% 10,842 4,553 15,395Potentially reduced-risk products (PRRPs)
Vapour 318 – 7 325 +93.5% +26.0% 168 90 258THP 565 – 11 576 +185.1% +183.7% 202 1 203
NGP 883 – 18 901 +143.5% +95.4% 370 91 461Modern Oral 34 – 2 36 +140.0% +140.0% 15 – 15Traditional Oral 883 – 33 916 +136.7% +9.0% 387 453 840
Oral 917 – 35 952 +136.8% +11.3% 402 453 855Total PRRPs 1,800 – 53 1,853 +140.0% +40.8% 772 544 1,316Strategic Portfolio 17,257 – 869 18,126 +56.1% +8.5% 11,614 5,097 16,711Other 7,235 (180) 579 7,634 -0.8% -6.6% 7,692 480 8,172Revenue 24,492 (180) 1,448 25,760 +33.4% +3.5% 19,306 5,577 24,883
Income statement
Revenue from the Strategic Portfolio and adjusted revenue from the Strategic Portfolio grew by 49% at current rates and by over 56% at constant rates, benefiting from the acquired brands from RAI in 2017. On a representative basis this was a growth of 8.5% at constant rates.
This performance was driven by the strategic combustible brands, up 43% or 50% at constant rates of exchange, or 5.7% on a constant rate, representative basis, due to the volume performance described on pages 20 and 21 and pricing across the major markets.
PRRP revenue grew 133% in total, to £1,800 million (2017: £772 million). Adjusting for the enhancement from the acquisitions and the impact of foreign exchange, this was an increase of 41%, largely due to THP and vapour (together delivering £901 million on an adjusted, representative, constant currency basis).
Vapour grew to £318 million from £168 million in 2017, an increase of over 26% to £325 million on an adjusted constant currency, representative basis), with THP (up over 180% to £565 million or £576 million at constant rates of exchange).
Also included in PRRP are traditional oral, delivering revenue of £883 million, an increase of 9% to £916 million on an adjusted constant currency, representative basis, and modern oral, (increasing adjusted revenue by 140% to £36 million at constant rates of exchange).
THP growth was due to an increase in consumables volume of 217% to 7 billion, largely in Japan as described on page 21.
The 26% representative, constant currency growth in vapour revenue was supported by a 35% increase (on a representative basis) in consumable volume with growth in the world’s three largest vapour markets (US, UK and France), as discussed on page 21.
The increase in revenue was despite the impact of the product recall in the US, @which was estimated to be £19 million.
Modern oral adjusted revenue increased, up 140% at £36 million on a constant currency, representative basis, due to the growth of EPOK and Lyft, notably in the Nordics and Switzerland.
Traditional oral grew adjusted revenue by 9% on a representative, constant rate basis, as a 2.3% volume decline in the US, partly due to the impact in the prior period of a competitor product recall which positively affected volume in 2017, was more than offset by pricing.
Adjusted revenue growth from the Strategic Portfolio
Change in adjusted revenue from the Strategic Portfolio at constant rates (%)
+56.1% Non-GAAP
KPI
20182018 (rep)
56%8%
Definition: Change in revenue from the Strategic Portfolio before the impact of adjusting items and the impact of fluctuations in foreign exchange rates.
This measure was introduced in 2018, with no comparators provided.
@ Denotes phrase, paragraph or similar that does not form part of BAT’s Annual Report on Form 20-F as filed with the SEC.
34 BAT Annual Report and Form 20-F 2018
Strategic Report Governance Financial Statements Other Information
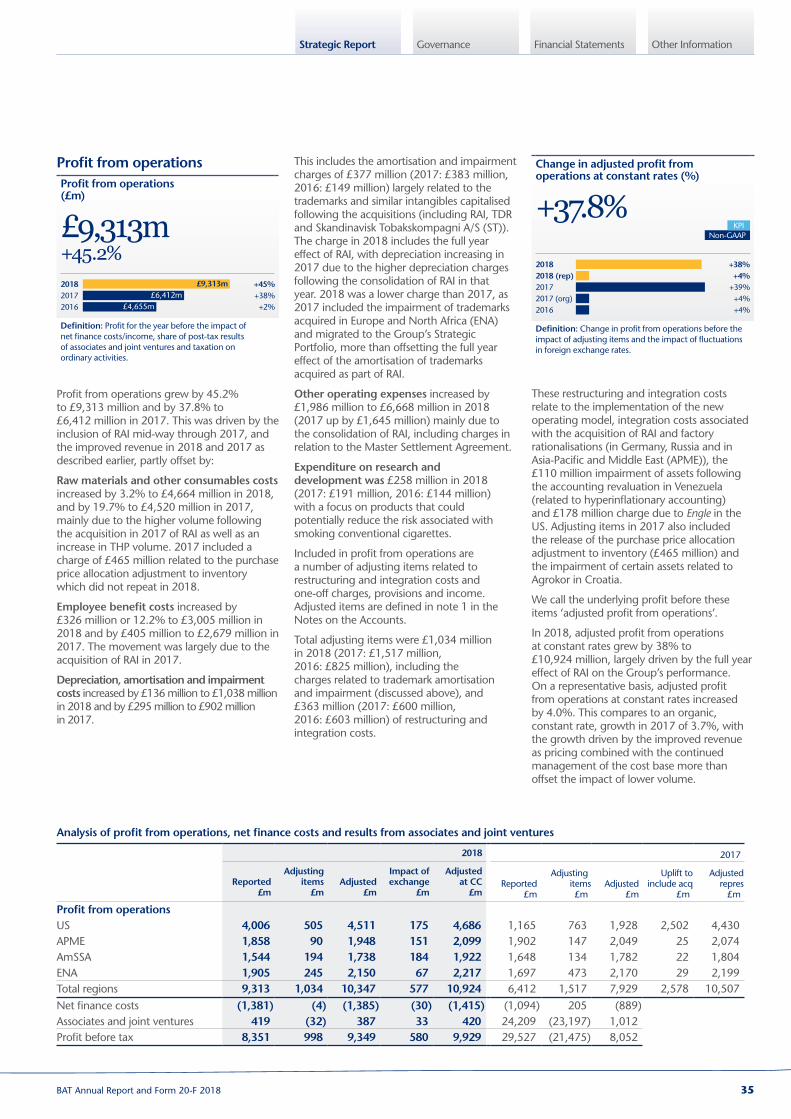
Profit from operationsProfit from operations (£m)
£9,313m +45.2%201820172016
+45%+38%+2%
£9,313m£6,412m
£4,655m
Definition: Profit for the year before the impact of net finance costs/income, share of post-tax results of associates and joint ventures and taxation on ordinary activities.
Profit from operations grew by 45.2% to £9,313 million and by 37.8% to £6,412 million in 2017. This was driven by the inclusion of RAI mid-way through 2017, and the improved revenue in 2018 and 2017 as described earlier, partly offset by:
Raw materials and other consumables costs increased by 3.2% to £4,664 million in 2018, and by 19.7% to £4,520 million in 2017, mainly due to the higher volume following the acquisition in 2017 of RAI as well as an increase in THP volume. 2017 included a charge of £465 million related to the purchase price allocation adjustment to inventory which did not repeat in 2018.
Employee benefit costs increased by £326 million or 12.2% to £3,005 million in 2018 and by £405 million to £2,679 million in 2017. The movement was largely due to the acquisition of RAI in 2017.
Depreciation, amortisation and impairment costs increased by £136 million to £1,038 million in 2018 and by £295 million to £902 million in 2017.
Analysis of profit from operations, net finance costs and results from associates and joint ventures
2018 2017
Reported£m
Adjusting items
£mAdjusted
£m
Impact of exchange
£m
Adjustedat CC
£mReported
£m
Adjustingitems£m
Adjusted£m
Uplift to include acq
£m
Adjusted repres
£m
Profit from operationsUS 4,006 505 4,511 175 4,686 1,165 763 1,928 2,502 4,430APME 1,858 90 1,948 151 2,099 1,902 147 2,049 25 2,074AmSSA 1,544 194 1,738 184 1,922 1,648 134 1,782 22 1,804ENA 1,905 245 2,150 67 2,217 1,697 473 2,170 29 2,199Total regions 9,313 1,034 10,347 577 10,924 6,412 1,517 7,929 2,578 10,507Net finance costs (1,381) (4) (1,385) (30) (1,415) (1,094) 205 (889)Associates and joint ventures 419 (32) 387 33 420 24,209 (23,197) 1,012Profit before tax 8,351 998 9,349 580 9,929 29,527 (21,475) 8,052
This includes the amortisation and impairment charges of £377 million (2017: £383 million, 2016: £149 million) largely related to the trademarks and similar intangibles capitalised following the acquisitions (including RAI, TDR and Skandinavisk Tobakskompagni A/S (ST)). The charge in 2018 includes the full year effect of RAI, with depreciation increasing in 2017 due to the higher depreciation charges following the consolidation of RAI in that year. 2018 was a lower charge than 2017, as 2017 included the impairment of trademarks acquired in Europe and North Africa (ENA) and migrated to the Group’s Strategic Portfolio, more than offsetting the full year effect of the amortisation of trademarks acquired as part of RAI.
Other operating expenses increased by £1,986 million to £6,668 million in 2018 (2017 up by £1,645 million) mainly due to the consolidation of RAI, including charges in relation to the Master Settlement Agreement.
Expenditure on research and development was £258 million in 2018 (2017: £191 million, 2016: £144 million) with a focus on products that could potentially reduce the risk associated with smoking conventional cigarettes.
Included in profit from operations are a number of adjusting items related to restructuring and integration costs and one-off charges, provisions and income. Adjusted items are defined in note 1 in the Notes on the Accounts.
Total adjusting items were £1,034 million in 2018 (2017: £1,517 million, 2016: £825 million), including the charges related to trademark amortisation and impairment (discussed above), and £363 million (2017: £600 million, 2016: £603 million) of restructuring and integration costs.
Change in adjusted profit from operations at constant rates (%)
+37.8% Non-GAAP
KPI
20182018 (rep)20172017 (org)2016
+38%+4%
+39%+4%+4%
Definition: Change in profit from operations before the impact of adjusting items and the impact of fluctuations in foreign exchange rates.
These restructuring and integration costs relate to the implementation of the new operating model, integration costs associated with the acquisition of RAI and factory rationalisations (in Germany, Russia and in Asia-Pacific and Middle East (APME)), the £110 million impairment of assets following the accounting revaluation in Venezuela (related to hyperinflationary accounting) and £178 million charge due to Engle in the US. Adjusting items in 2017 also included the release of the purchase price allocation adjustment to inventory (£465 million) and the impairment of certain assets related to Agrokor in Croatia.
We call the underlying profit before these items ‘adjusted profit from operations’.
In 2018, adjusted profit from operations at constant rates grew by 38% to £10,924 million, largely driven by the full year effect of RAI on the Group’s performance. On a representative basis, adjusted profit from operations at constant rates increased by 4.0%. This compares to an organic, constant rate, growth in 2017 of 3.7%, with the growth driven by the improved revenue as pricing combined with the continued management of the cost base more than offset the impact of lower volume.
35BAT Annual Report and Form 20-F 2018

Financial Review
Operating marginOperating margin (%)
38.0%201820172016
38.0%32.8%32.9%
Definition: Profit from operations as a percentage of revenue.
Operating margin in 2018 was ahead of 2017 by over 500 bps to 38.0%, as the Group’s performance and the full year impact of RAI more than offset the increased spend related to the PRRP portfolio, restructuring and integration costs incurred. 2017 (down 10 bps to 32.8% against 2016) was affected by the purchase price allocation adjustments arising as part of the RAI acquisition, including the £465 million uplift to inventory, dilutive effects of excise on bought-in goods and higher investment in PRRP.
In 2018, adjusted operating margin grew by 150 bps largely due to the full year effect of RAI. On a representative basis, this was an increase of 40 bps as the impact of pricing more than offset the investment into PRRP and inflation on the cost base.
In 2017, adjusted operating margin increased by 230 bps as the inclusion of RAI, the growth in adjusted organic revenue (driven in part by pricing) and ongoing cost savings (including the US$70 million of synergies achieved), more than offset the impact of inflation and transactional foreign exchange. Adjusted organic operating margin increased by 40 bps in 2017.
Analysis of profit from operations, net finance costs and results from associates and joint ventures
2017 2016
Reported£m
Adjusting items
£mAdjusted
£m
Impact of exchange
£m
Adjustedat CC
£m
Impact of acquisitions
£m
Adjusted organic
at CC£m
Reported£m
Adjusting items
£mAdjusted
£m
Profit from operationsUS 1,165 763 1,928 (101) 1,827 (1,827) – – – –APME 1,902 147 2,049 (87) 1,962 (31) 1,931 1,774 198 1,972AmSSA 1,648 134 1,782 17 1,799 (27) 1,772 1,422 262 1,684ENA 1,697 473 2,170 (153) 2,017 (36) 1,981 1,479 345 1,824Total regions 6,412 1,517 7,929 (324) 7,605 (1,921) 5,684 4,675 805 5,480Non-tobacco litigation:Fox River/Flintkote – – – – – (20) 20 –Profit from operations 6,412 1,517 7,929 (324) 7,605 4,655 825 5,480Net finance (costs)/income (1,094) 205 (889) 56 (833) (637) 108 (529)Associates and joint ventures 24,209 (23,197) 1,012 (61) 951 2,227 (900) 1,327Profit before tax 29,527 (21,475) 8,052 (329) 7,723 6,245 33 6,278
Adjusted operating margin (%)
42.6% Non-GAAP
201820172016
42.6%41.1%38.8%
Definition: Adjusted profit from operations as a percentage of adjusted revenue.
Net finance costsIn 2018, net finance costs increased by £287 million to £1,381 million, largely due to the full year effect of servicing a higher level of debt following the acquisition of RAI. In 2017, net finance costs increased by £457 million to £1,094 million, largely due to the additional financing, including pre-financing charges of £153 million, required to acquire RAI and the finance costs associated with the RAI debt now consolidated within the Group.
In both 2018 and 2017, the Group recognised interest of £25 million in relation to FII GLO.
In 2018, the Group also recognised a monetary gain arising from the revaluation of the Group’s operations in Venezuela in line with hyperinflation (£45 million), which has been treated as an adjusting item.
Before the impact of adjusting charges related to FII GLO, the monetary gain in Venezuela, the 2017 pre-financing noted above and the translation impact of foreign exchange, adjusted net finance costs were 59.2% higher in 2018, with 2017 up 57.5% on 2016.
The Group’s average cost of debt in 2018 was 3.0%, ahead of 3.3% achieved in 2017 (2016: 3.1%).
Associates and joint venturesAssociates in 2018 largely comprised the Group’s shareholding in its Indian associate, ITC. The Group’s share of post-tax results of associates and joint ventures, included at the pre-tax level under IFRS, declined 98% to £419 million (2017 up £21,982 million on 2016, to £24,209 million) as the prior period included the results of RAI prior to the acquisition, after which it was consolidated as a wholly-owned subsidiary. Also in 2017, the Group recognised a gain of £23,288 million, which arose as the Group was deemed, under IFRS, to have disposed of RAI as an associate in that period.
Excluding the effect of the gain noted above and other adjusting items, the Group’s share of associates and joint ventures on an adjusted, constant currency basis was 58.5% lower in 2018 at £420 million as the Group ceased to recognise the results of RAI as an associate, while the Group’s share of ITC’s post-tax results grew by 8.0%. In 2017, the Group’s share of results of associates and joint ventures on an adjusted constant currency basis fell to £951 million, a decline of 28.3% due to RAI’s contribution as an associate for only part of the year, while the Group’s share of ITC’s post-tax results grew by 16.7%.
Income statement continued
36 BAT Annual Report and Form 20-F 2018
Strategic Report Governance Financial Statements Other Information
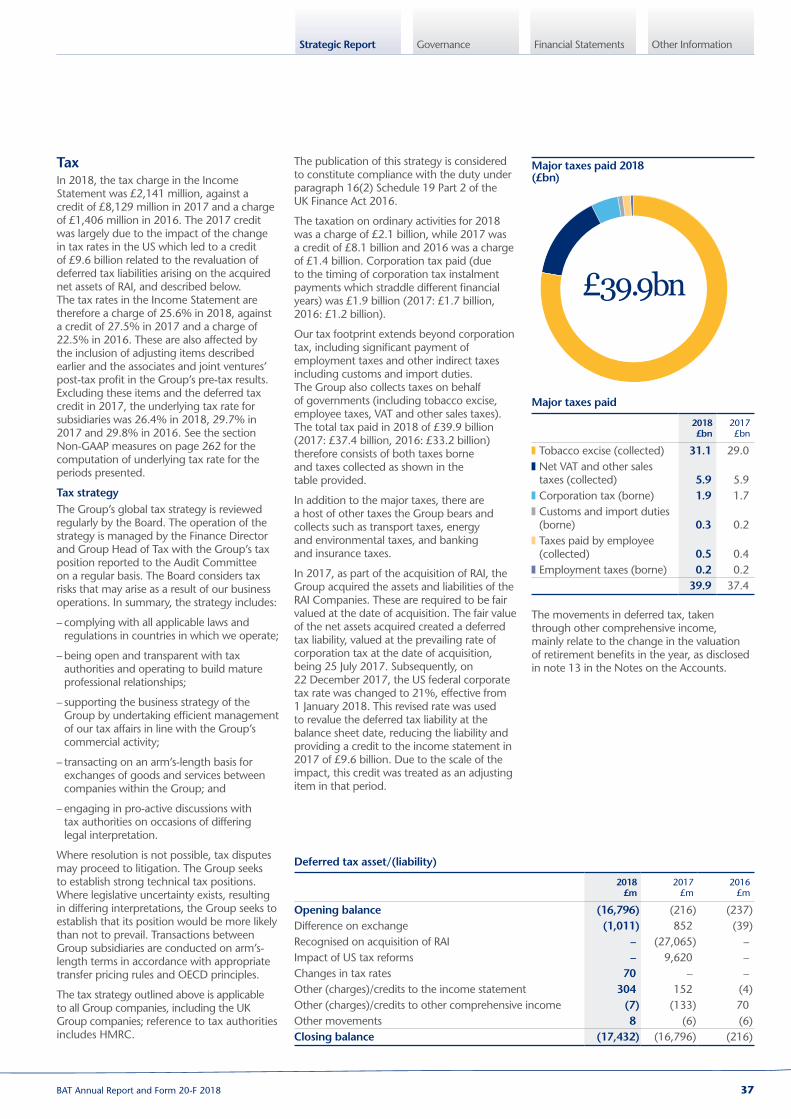
TaxIn 2018, the tax charge in the Income Statement was £2,141 million, against a credit of £8,129 million in 2017 and a charge of £1,406 million in 2016. The 2017 credit was largely due to the impact of the change in tax rates in the US which led to a credit of £9.6 billion related to the revaluation of deferred tax liabilities arising on the acquired net assets of RAI, and described below. The tax rates in the Income Statement are therefore a charge of 25.6% in 2018, against a credit of 27.5% in 2017 and a charge of 22.5% in 2016. These are also affected by the inclusion of adjusting items described earlier and the associates and joint ventures’ post-tax profit in the Group’s pre-tax results. Excluding these items and the deferred tax credit in 2017, the underlying tax rate for subsidiaries was 26.4% in 2018, 29.7% in 2017 and 29.8% in 2016. See the section Non-GAAP measures on page 262 for the computation of underlying tax rate for the periods presented.
Tax strategy The Group’s global tax strategy is reviewed regularly by the Board. The operation of the strategy is managed by the Finance Director and Group Head of Tax with the Group’s tax position reported to the Audit Committee on a regular basis. The Board considers tax risks that may arise as a result of our business operations. In summary, the strategy includes:
– complying with all applicable laws and regulations in countries in which we operate;
– being open and transparent with tax authorities and operating to build mature professional relationships;
– supporting the business strategy of the Group by undertaking efficient management of our tax affairs in line with the Group’s commercial activity;
– transacting on an arm’s-length basis for exchanges of goods and services between companies within the Group; and
– engaging in pro-active discussions with tax authorities on occasions of differing legal interpretation.
Where resolution is not possible, tax disputes may proceed to litigation. The Group seeks to establish strong technical tax positions. Where legislative uncertainty exists, resulting in differing interpretations, the Group seeks to establish that its position would be more likely than not to prevail. Transactions between Group subsidiaries are conducted on arm’s-length terms in accordance with appropriate transfer pricing rules and OECD principles.
The tax strategy outlined above is applicable to all Group companies, including the UK Group companies; reference to tax authorities includes HMRC.
Major taxes paid
2018 £bn
2017 £bn
Tobacco excise (collected) 31.1 29.0 Net VAT and other sales taxes (collected) 5.9 5.9
Corporation tax (borne) 1.9 1.7 Customs and import duties (borne) 0.3 0.2
Taxes paid by employee (collected) 0.5 0.4
Employment taxes (borne) 0.2 0.239.9 37.4
Major taxes paid 2018 (£bn)
£39.9bn
Deferred tax asset/(liability)
2018 £m
2017 £m
2016 £m
Opening balance (16,796) (216) (237)Difference on exchange (1,011) 852 (39)Recognised on acquisition of RAI – (27,065) –Impact of US tax reforms – 9,620 –Changes in tax rates 70 – –Other (charges)/credits to the income statement 304 152 (4)Other (charges)/credits to other comprehensive income (7) (133) 70Other movements 8 (6) (6)Closing balance (17,432) (16,796) (216)
The publication of this strategy is considered to constitute compliance with the duty under paragraph 16(2) Schedule 19 Part 2 of the UK Finance Act 2016.
The taxation on ordinary activities for 2018 was a charge of £2.1 billion, while 2017 was a credit of £8.1 billion and 2016 was a charge of £1.4 billion. Corporation tax paid (due to the timing of corporation tax instalment payments which straddle different financial years) was £1.9 billion (2017: £1.7 billion, 2016: £1.2 billion).
Our tax footprint extends beyond corporation tax, including significant payment of employment taxes and other indirect taxes including customs and import duties. The Group also collects taxes on behalf of governments (including tobacco excise, employee taxes, VAT and other sales taxes). The total tax paid in 2018 of £39.9 billion (2017: £37.4 billion, 2016: £33.2 billion) therefore consists of both taxes borne and taxes collected as shown in the table provided.
In addition to the major taxes, there are a host of other taxes the Group bears and collects such as transport taxes, energy and environmental taxes, and banking and insurance taxes.
In 2017, as part of the acquisition of RAI, the Group acquired the assets and liabilities of the RAI Companies. These are required to be fair valued at the date of acquisition. The fair value of the net assets acquired created a deferred tax liability, valued at the prevailing rate of corporation tax at the date of acquisition, being 25 July 2017. Subsequently, on 22 December 2017, the US federal corporate tax rate was changed to 21%, effective from 1 January 2018. This revised rate was used to revalue the deferred tax liability at the balance sheet date, reducing the liability and providing a credit to the income statement in 2017 of £9.6 billion. Due to the scale of the impact, this credit was treated as an adjusting item in that period.
The movements in deferred tax, taken through other comprehensive income, mainly relate to the change in the valuation of retirement benefits in the year, as disclosed in note 13 in the Notes on the Accounts.
37BAT Annual Report and Form 20-F 2018
Financial Review
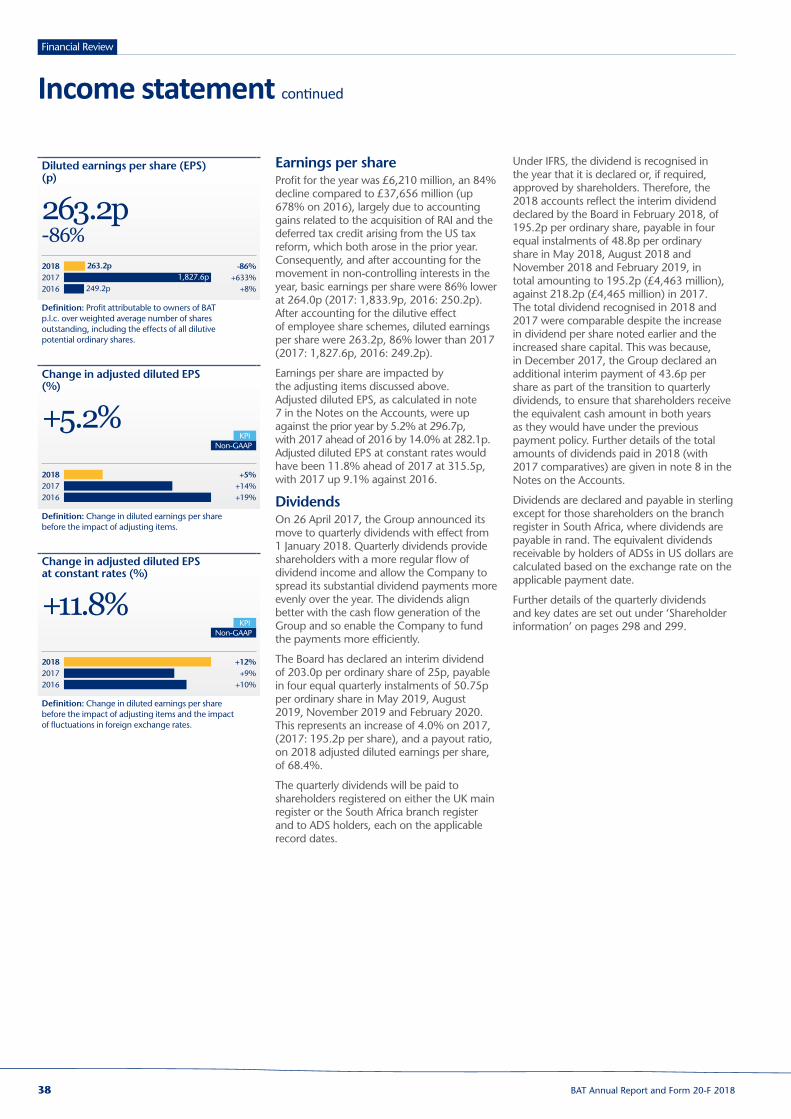
Earnings per shareProfit for the year was £6,210 million, an 84% decline compared to £37,656 million (up 678% on 2016), largely due to accounting gains related to the acquisition of RAI and the deferred tax credit arising from the US tax reform, which both arose in the prior year. Consequently, and after accounting for the movement in non-controlling interests in the year, basic earnings per share were 86% lower at 264.0p (2017: 1,833.9p, 2016: 250.2p). After accounting for the dilutive effect of employee share schemes, diluted earnings per share were 263.2p, 86% lower than 2017 (2017: 1,827.6p, 2016: 249.2p).
Earnings per share are impacted by the adjusting items discussed above. Adjusted diluted EPS, as calculated in note 7 in the Notes on the Accounts, were up against the prior year by 5.2% at 296.7p, with 2017 ahead of 2016 by 14.0% at 282.1p. Adjusted diluted EPS at constant rates would have been 11.8% ahead of 2017 at 315.5p, with 2017 up 9.1% against 2016.
DividendsOn 26 April 2017, the Group announced its move to quarterly dividends with effect from 1 January 2018. Quarterly dividends provide shareholders with a more regular flow of dividend income and allow the Company to spread its substantial dividend payments more evenly over the year. The dividends align better with the cash flow generation of the Group and so enable the Company to fund the payments more efficiently.
The Board has declared an interim dividend of 203.0p per ordinary share of 25p, payable in four equal quarterly instalments of 50.75p per ordinary share in May 2019, August 2019, November 2019 and February 2020. This represents an increase of 4.0% on 2017, (2017: 195.2p per share), and a payout ratio, on 2018 adjusted diluted earnings per share, of 68.4%.
The quarterly dividends will be paid to shareholders registered on either the UK main register or the South Africa branch register and to ADS holders, each on the applicable record dates.
Under IFRS, the dividend is recognised in the year that it is declared or, if required, approved by shareholders. Therefore, the 2018 accounts reflect the interim dividend declared by the Board in February 2018, of 195.2p per ordinary share, payable in four equal instalments of 48.8p per ordinary share in May 2018, August 2018 and November 2018 and February 2019, in total amounting to 195.2p (£4,463 million), against 218.2p (£4,465 million) in 2017. The total dividend recognised in 2018 and 2017 were comparable despite the increase in dividend per share noted earlier and the increased share capital. This was because, in December 2017, the Group declared an additional interim payment of 43.6p per share as part of the transition to quarterly dividends, to ensure that shareholders receive the equivalent cash amount in both years as they would have under the previous payment policy. Further details of the total amounts of dividends paid in 2018 (with 2017 comparatives) are given in note 8 in the Notes on the Accounts.
Dividends are declared and payable in sterling except for those shareholders on the branch register in South Africa, where dividends are payable in rand. The equivalent dividends receivable by holders of ADSs in US dollars are calculated based on the exchange rate on the applicable payment date.
Further details of the quarterly dividends and key dates are set out under ‘Shareholder information’ on pages 298 and 299.
Change in adjusted diluted EPS at constant rates (%)
+11.8% Non-GAAP
KPI
201820172016
+12%+9%
+10%
Definition: Change in diluted earnings per share before the impact of adjusting items and the impact of fluctuations in foreign exchange rates.
Change in adjusted diluted EPS (%)
+5.2% Non-GAAP
KPI
201820172016
+5%+14%+19%
Definition: Change in diluted earnings per share before the impact of adjusting items.
Income statement continued
Diluted earnings per share (EPS) (p)
263.2p -86%201820172016
‑86%+633%
+8%
263.2p1,827.6p
249.2p
Definition: Profit attributable to owners of BAT p.l.c. over weighted average number of shares outstanding, including the effects of all dilutive potential ordinary shares.
38 BAT Annual Report and Form 20-F 2018

Strategic Report Governance Financial Statements Other Information
The Group believes that its contracts with interest rates based on LIBOR adequately provide for alternate calculations of interest in the event that LIBOR is unavailable.
Although these alternative calculations may cause an administrative burden, the Group does not believe that it would materially adversely affect the Group or its ability to manage its interest rate risk.
The Group continues to maintain investment-grade credit ratings*, with ratings from Moody’s/S&P at Baa2 (stable outlook)/BBB+ (stable outlook), respectively, with a medium-term rating target of Baa1/BBB+. The strength of the ratings has underpinned debt issuance and the Group is confident of its ability to successfully access the debt capital markets. All contractual borrowing covenants have been met and these covenants are not expected to inhibit the Group’s operations or funding plans.
In 2017, the Group replaced the existing £3 billion revolving credit facility maturing in 2021 with a new two-tranche £6 billion revolving credit facility. This consists of a £3 billion 364-day revolving credit facility (with a one-year extension, that was exercised in July 2018, and a one-year term-out option), and a £3 billion revolving credit facility maturing in 2021. In 2017, the Group also increased the EMTN programme from £15 billion to £25 billion and increased its US and European commercial paper programmes from US$3 billion to US$4 billion and from £1 billion to £3 billion, respectively, to accommodate the liquidity needs of the enlarged Group. At 31 December 2018, the revolving credit facility was undrawn (2017: £600 million drawn) with £536 million of commercial paper outstanding (2017: £1.2 billion, 2016: £254 million). The increase in the short-term funding requirement in 2017 was due to the timing of the payment of the 2017 Master Settlement Agreement (MSA) liability.
Management believes that the Group has sufficient working capital for present requirements, taking into account the amounts of undrawn borrowing facilities and levels of cash and cash equivalents, and the ongoing ability to generate cash.
On 25 July 2017, British American Tobacco p.l.c. acceded as guarantor under the indentures of its indirect wholly-owned subsidiaries RAI and R.J. Reynolds Tobacco Company. The securities issued under these indentures include approximately US$12.2 billion aggregate principal amount of unsecured RAI debt securities and approximately US$231 million aggregate principal amount of unsecured R.J. Reynolds Tobacco Company debt securities.
Treasury, liquidity and capital structureThe Treasury Function is responsible for raising finance for the Group and managing the Group’s cash resources and the financial risks arising from underlying operations. Clear parameters have been established, including levels of authority, on the type and use of financial instruments to manage the financial risks facing the Group. Such instruments are only used if they relate to an underlying exposure; speculative transactions are expressly forbidden under the Group’s treasury policy. All these activities are carried out under defined policies, procedures and limits, reviewed and approved by the Board, delegating oversight to the Finance Director and Treasury Function. See note 23 in the Notes on the Accounts for further detail.
It is the policy of the Group to maximise financial flexibility and minimise refinancing risk by issuing debt with a range of maturities, generally matching the projected cash flows of the Group and obtaining this financing from a wide range of sources. The Group targets an average centrally managed debt maturity of at least five years with no more than 20% of centrally managed debt maturing in a single rolling year. As at 31 December 2018, the average centrally managed debt maturity was 8.8 years (2017: 9.2 years, 2016: 8.2 years) and the highest proportion of centrally managed debt maturing in a single rolling 12-month period was 18.4% (2017: 13.2%, 2016: 18.1%).
The only externally imposed capital requirement the Group has is in respect of its centrally managed banking facilities, which require a gross interest cover of 4.5 times. The Group targets a gross interest cover, as calculated under its key central banking facilities, of greater than 5 times. For 2018, it was 7.2 times (2017: 7.8 times, 2016: 12.2 times).
In order to manage its interest rate risk, the Group maintains both floating rate and fixed rate debt. The Group sets targets (within overall guidelines) for the desired ratio of floating to fixed rate debt on a net basis (at least 50% fixed on a net basis in the short to medium term). At 31 December 2018, the relevant ratios of floating to fixed rate borrowings were 21:79 (2017: 19:81, 2016: 15:85) on a net basis.
As part of the management of liquidity, funding and interest rate risk the Group regularly evaluates market conditions and may enter into transactions, from time to time, to repurchase outstanding debt, pursuant to open market purchases, tender offers or other means.
In addition, the Group has evaluated its floating rate debt maturing after 2021 in connection with the potential discontinuation of LIBOR after 2021 as a result of the UK Financial Conduct Authority’s announcement on 27 July 2017.
Cash flowNet cash generated from operating activities In 2018, net cash generated from operating activities increased by £4,948 million to £10,295 million, principally due to the full year effect from RAI, compared to approximately five months’ contribution to 2017, the timing of payments related to the MSA in the US and an increase in debtor factoring by approximately £300 million. These more than offset a reduction in dividends from associates following the acquisition of RAI. Other movements include:
– the increase in inventory in 2018 was predominantly related to the timing of leaf purchases and inventory movements in Romania, Turkey and Russia;
– the increase in trade and other payables was driven by higher excise payables which are impacted by the timing of inventory movements in the supply chain; and
– the final quarterly payments in relation to the Quebec class-action in 2017.
Net cash generated from operating activities increased in 2017 by £737 million (or 16.0%) largely due to the cash generated by RAI from 25 July 2017, the profit from operations earned in the period from the rest of the Group (as discussed on pages 44 to 47) and a reduction in inventories. This more than offset an increase in receivables, a reduction in trade and other payables, the payment of the 2017 liability related to the MSA in the US and the final quarterly payments in relation to the Quebec class-action.
Net cash used in investing activitiesIn 2018, net cash used in investing activities declined by £17,523 million to £1,021 million (2017: £18,544 million, 2016: £640 million) as 2017 included the acquisition of the shares in RAI not already owned by the Group.
Included within investing activities is gross capital expenditure which includes purchases of property, plant and equipment and purchases of intangibles. This includes the investment in the Group’s global operational infrastructure (including, but not limited to, the manufacturing network, trade marketing software and IT systems). In 2018, the Group invested £883 million, an increase of 2.4% on the prior year (2017: £862 million, 2016: £652 million). The Group expects gross capital expenditure in 2019 of £872 million, mainly related to the ongoing investment in the Group’s operational infrastructure including the expansion of PRRPs.
Treasury and cash flow
* A credit rating is not a recommendation to buy, sell or hold securities. A credit rating may be subject to withdrawal or revision at any time. Each rating should be evaluated separately of any other rating.
39BAT Annual Report and Form 20-F 2018

Financial Review
Net cash used in financing activitiesNet cash used in financing activities was an outflow of £9,630 million in 2018 (2017: £14,759 million inflow). The 2018 outflow was mainly due to the payment of a €0.4 billion bond (in March 2018) and three bonds totalling US$2.5 billion (in June 2018) at maturity, the repayment of £0.6 billion, under the revolving credit facility and £1.2 billion of commercial paper outstanding in each case at 31 December 2017.
The 2018 outflow also included the higher dividend payment of £4,347 million (2017: £3,465 million, 2016: £2,910 million) due to the higher dividend per share and the increase in share capital.
The inflow in 2017 noted above, was principally due to the debt taken on related to the acquisition of RAI.
Eight series of US$ denominated unregistered bonds totalling US$17.25 billion were issued in August 2017 pursuant to Rule 144A with registration rights, whereby the Group committed to investors that the bonds would be exchangeable for registered notes. In October 2018, investors were offered to exchange their unregistered bonds for registered bonds in line with the registration rights. The exchange offer was completed in November 2018 with 99.7% of the bonds exchanged.
In March and April 2017, the Group arranged short-term bilateral facilities with some of its core banks for a total of approximately £1.6 billion. In June 2017, a €1,250 million bond and a US$600 million bond were repaid at maturity. In August 2017, the Group paid on maturity a US$500 million bond.
In July 2017, following the shareholder approvals of the acquisition of RAI, the Group used its US$25 billion acquisition facility provided by a syndicate of relationship banks comprising US$15 billion and US$5 billion bridge facilities with one- and two-year maturities, respectively. In addition, the acquisition facility included two US$2.5 billion term loans with maturity in 2020 and 2022. In August 2017, the bridge facilities were refinanced in the US and European capital markets.
During 2017, four series of bonds were issued pursuant to the EMTN programme and comprised a £450 million bond maturing in August 2025 and three euro-denominated bonds totalling €3.1 billion comprising a €1.1 billion bond maturing in August 2021, a €750 million bond maturing in November 2023 and a €1.25 billion bond maturing in January 2030.
Free cash flow@ Free cash flow, as defined on page 265, was £7,684 million, an increase of 120% on 2017 (£3,500 million). This movement was driven by the full year inclusion of results from RAI and enhanced delivery across the remainder of the Group. This was partly offset by higher interest payments on the increased level of borrowings and a reduction in dividends from associates (due to the acquisition of RAI in 2017).
In 2017, free cash flow increased by 3.3% from £3,389 million in 2016, as the additional cash recognised following the acquisition of RAI, was largely offset by the additional interest charges and costs incurred related to the acquisition and the subsequent integration of RAI.
Adjusted cash generated from operations (Adjusted CGFO)@ Adjusted CGFO is defined on page 264.Adjusted CGFO was £8,071 million, an increase of 146% (2017: £3,282 million, 2016: £3,115 million), or 158% at constant rates of exchange. The increase in 2018 was against a 2017 comparator which included an early payment of the 2017 MSA liability, which was tax deductible at 2017 tax rates. Excluding the timing impact of this payment, adjusted cash generated from operations would have increased against 2017 by approximately 43%, with 2017 up against 2016 by over 45%, largely due to the cash earned in that year by RAI following the acquisition. See page 264 for further information on this measure.
Cash flow conversionThe conversion of profit from operations to net cash generated from operating activities may indicate the Group’s ability to generate cash from the profits earned. Based upon net cash generated from operating activities, the Group’s conversion rate increased from 83% to 111% in 2018. This was largely due to the timing of the payment for the MSA in December 2017, the costs associated with the acquisition of RAI and other adjusting items. @Operating cash flow conversion ratio (based upon adjusted profit from operations) increased in 2018 to 113% from 79% in 2017, as 2017 was impacted by the timing of the MSA payment which was brought forward to December 2017. Normalising for this timing difference in both 2017 and 2018, operating cash flow conversion ratio would have been 100% in 2018, 97% in 2017 and 93% in 2016, reflecting the Group’s ability to deliver cash from the operating performance of the business. See page 263 for further information on this measure.
Reconciliation of net cash generated from operating activities to free cash flow and adjusted cash generated from operations@
2018£m
2017£m
2016£m
Net cash generated from operating activities 10,295 5,347 4,610Dividends paid to non-controlling interests (142) (167) (147)Net interest paid (1,533) (1,004) (537)Net capital expenditure (845) (767) (559)Proceeds from associates' share buy-backs – – 23Trading loans to third party (93) 101 –Other 2 (10) (1)Free cash flow 7,684 3,500 3,389
Net cash impact of adjusting items 601 685 711Dividends and other appropriations from associates (214) (903) (985)Adjusted cash generated from operations 8,071 3,282 3,115
Summary cash flow
2018£m
2017£m
2016£m
Cash generated from operations 11,972 6,119 4,893Dividends received from associates 214 903 962Tax paid (1,891) (1,675) (1,245)Net cash generated from operating activities 10,295 5,347 4,610Net cash used in investing activities (1,021) (18,544) (640)Net cash (used in)/from financing activities (9,630) 14,759 (4,229)Differences on exchange (138) (391) 180(Decrease)/increase in net cash and cash equivalents (494) 1,171 (79)
@ Denotes phrase, paragraph or similar that does not form part of BAT’s Annual Report on Form 20-F as filed with the SEC.
Treasury and cash flow continued
40 BAT Annual Report and Form 20-F 2018
Strategic Report Governance Financial Statements Other Information
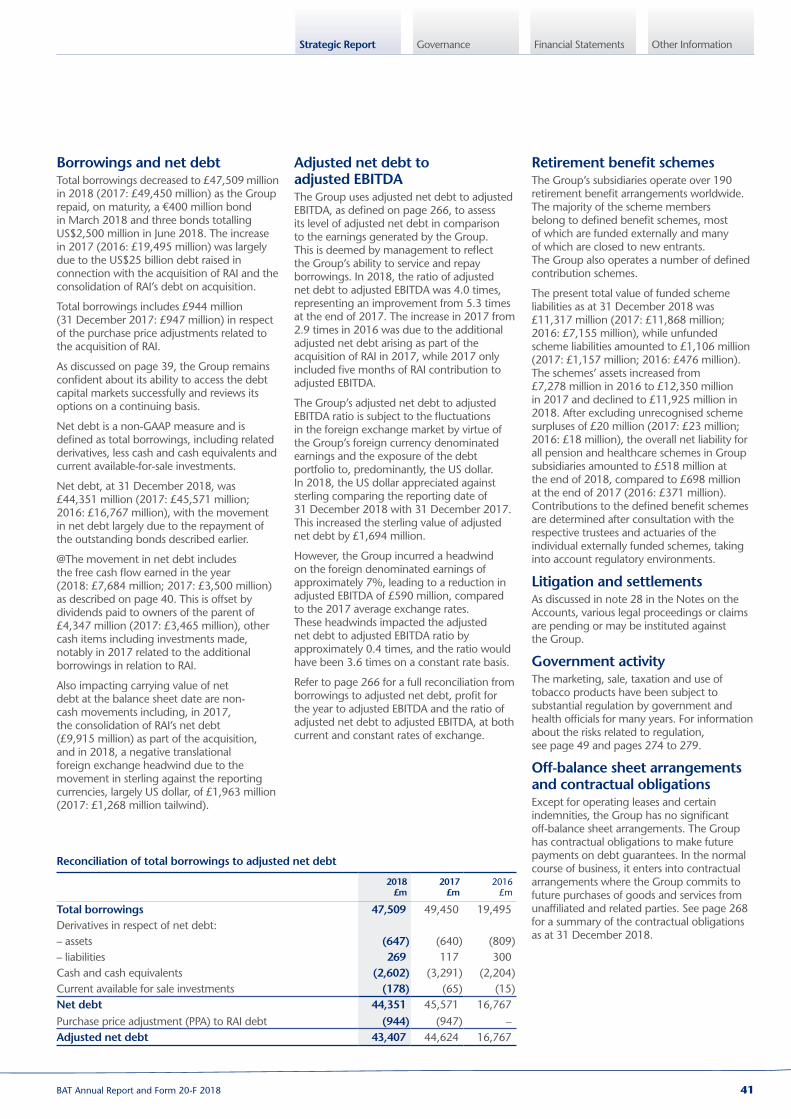
Borrowings and net debtTotal borrowings decreased to £47,509 million in 2018 (2017: £49,450 million) as the Group repaid, on maturity, a €400 million bond in March 2018 and three bonds totalling US$2,500 million in June 2018. The increase in 2017 (2016: £19,495 million) was largely due to the US$25 billion debt raised in connection with the acquisition of RAI and the consolidation of RAI’s debt on acquisition.
Total borrowings includes £944 million (31 December 2017: £947 million) in respect of the purchase price adjustments related to the acquisition of RAI.
As discussed on page 39, the Group remains confident about its ability to access the debt capital markets successfully and reviews its options on a continuing basis.
Net debt is a non-GAAP measure and is defined as total borrowings, including related derivatives, less cash and cash equivalents and current available-for-sale investments.
Net debt, at 31 December 2018, was £44,351 million (2017: £45,571 million; 2016: £16,767 million), with the movement in net debt largely due to the repayment of the outstanding bonds described earlier.
@The movement in net debt includes the free cash flow earned in the year (2018: £7,684 million; 2017: £3,500 million) as described on page 40. This is offset by dividends paid to owners of the parent of £4,347 million (2017: £3,465 million), other cash items including investments made, notably in 2017 related to the additional borrowings in relation to RAI.
Also impacting carrying value of net debt at the balance sheet date are non-cash movements including, in 2017, the consolidation of RAI’s net debt (£9,915 million) as part of the acquisition, and in 2018, a negative translational foreign exchange headwind due to the movement in sterling against the reporting currencies, largely US dollar, of £1,963 million (2017: £1,268 million tailwind).
Adjusted net debt to adjusted EBITDAThe Group uses adjusted net debt to adjusted EBITDA, as defined on page 266, to assess its level of adjusted net debt in comparison to the earnings generated by the Group. This is deemed by management to reflect the Group’s ability to service and repay borrowings. In 2018, the ratio of adjusted net debt to adjusted EBITDA was 4.0 times, representing an improvement from 5.3 times at the end of 2017. The increase in 2017 from 2.9 times in 2016 was due to the additional adjusted net debt arising as part of the acquisition of RAI in 2017, while 2017 only included five months of RAI contribution to adjusted EBITDA.
The Group’s adjusted net debt to adjusted EBITDA ratio is subject to the fluctuations in the foreign exchange market by virtue of the Group’s foreign currency denominated earnings and the exposure of the debt portfolio to, predominantly, the US dollar. In 2018, the US dollar appreciated against sterling comparing the reporting date of 31 December 2018 with 31 December 2017. This increased the sterling value of adjusted net debt by £1,694 million.
However, the Group incurred a headwind on the foreign denominated earnings of approximately 7%, leading to a reduction in adjusted EBITDA of £590 million, compared to the 2017 average exchange rates. These headwinds impacted the adjusted net debt to adjusted EBITDA ratio by approximately 0.4 times, and the ratio would have been 3.6 times on a constant rate basis.
Refer to page 266 for a full reconciliation from borrowings to adjusted net debt, profit for the year to adjusted EBITDA and the ratio of adjusted net debt to adjusted EBITDA, at both current and constant rates of exchange.
Reconciliation of total borrowings to adjusted net debt
2018£m
2017£m
2016£m
Total borrowings 47,509 49,450 19,495Derivatives in respect of net debt:– assets (647) (640) (809)– liabilities 269 117 300Cash and cash equivalents (2,602) (3,291) (2,204)Current available for sale investments (178) (65) (15)Net debt 44,351 45,571 16,767Purchase price adjustment (PPA) to RAI debt (944) (947) –Adjusted net debt 43,407 44,624 16,767
Retirement benefit schemesThe Group’s subsidiaries operate over 190 retirement benefit arrangements worldwide. The majority of the scheme members belong to defined benefit schemes, most of which are funded externally and many of which are closed to new entrants. The Group also operates a number of defined contribution schemes.
The present total value of funded scheme liabilities as at 31 December 2018 was £11,317 million (2017: £11,868 million; 2016: £7,155 million), while unfunded scheme liabilities amounted to £1,106 million (2017: £1,157 million; 2016: £476 million). The schemes’ assets increased from £7,278 million in 2016 to £12,350 million in 2017 and declined to £11,925 million in 2018. After excluding unrecognised scheme surpluses of £20 million (2017: £23 million; 2016: £18 million), the overall net liability for all pension and healthcare schemes in Group subsidiaries amounted to £518 million at the end of 2018, compared to £698 million at the end of 2017 (2016: £371 million). Contributions to the defined benefit schemes are determined after consultation with the respective trustees and actuaries of the individual externally funded schemes, taking into account regulatory environments.
Litigation and settlementsAs discussed in note 28 in the Notes on the Accounts, various legal proceedings or claims are pending or may be instituted against the Group.
Government activityThe marketing, sale, taxation and use of tobacco products have been subject to substantial regulation by government and health officials for many years. For information about the risks related to regulation, see page 49 and pages 274 to 279.
Off‑balance sheet arrangements and contractual obligationsExcept for operating leases and certain indemnities, the Group has no significant off-balance sheet arrangements. The Group has contractual obligations to make future payments on debt guarantees. In the normal course of business, it enters into contractual arrangements where the Group commits to future purchases of goods and services from unaffiliated and related parties. See page 268 for a summary of the contractual obligations as at 31 December 2018.
41BAT Annual Report and Form 20-F 2018

Financial Review
Foreign exchange rates
Average Closing
2018 2017 2016 2018 2017 2016
Australian dollar 1.786 1.681 1.824 1.809 1.730 1.707Brazilian real 4.868 4.116 4.740 4.936 4.487 4.022Canadian dollar 1.730 1.672 1.795 1.739 1.695 1.657Euro 1.130 1.142 1.224 1.114 1.127 1.172Indian rupee 91.227 83.895 91.022 88.916 86.343 83.864Japanese yen 147.376 144.521 147.466 139.733 152.387 144.120Russian rouble 83.677 75.170 91.026 88.353 77.880 75.429South African rand 17.643 17.150 19.962 18.321 16.747 16.898US dollar 1.335 1.289 1.355 1.274 1.353 1.236
Foreign exchange ratesThe principal exchange rates used to convert the results of the Group’s foreign operations to sterling, for the purposes of inclusion and consolidation within the Group’s financial statements, are indicated in the table below.
Where the Group has provided results at constant rates of exchange this refers to the translation of the results from the foreign operations at rates of exchange prevailing in the prior period – thereby eliminating the potentially distorting impact of the movement in foreign exchange on the reported results.
Going concernA description of the Group’s business activities, its financial position, cash flows, liquidity position, facilities and borrowings position, together with the factors likely to affect its future development, performance and position, are set out in this Annual Report and Form 20-F.
The key Group risks include analyses of financial risk and the Group’s approach to financial risk management. Notes 20 and 23 in the Notes on the Accounts provide further detail on the Group’s borrowings and management of financial risks.
The Group has, at the date of this report, sufficient existing financing available for its estimated requirements for at least the next 12 months. This, together with the proven ability to generate cash from trading activities, the performance of the Group’s Strategic Portfolio, its leading market positions in a number of countries and its broad geographical spread, as well as numerous contracts with established customers and suppliers across different geographical areas and industries, provides the Directors with the confidence that the Group is well placed to manage its business risks successfully in the context of current financial conditions and the general outlook in the global economy.
After reviewing the Group’s annual budget, plans and financing arrangements for the next three years, the Directors consider that the Group has adequate resources to continue operating and that it is therefore appropriate to continue to adopt the going concern basis in preparing the Annual Report and Form 20-F.
Other
Accounting policiesThe application of the accounting standards and the accounting policies adopted by the Group are set out in the Group Manual of Accounting Policies and Procedures (GMAPP).
GMAPP includes the Group instructions in respect of the accounting and reporting of business activities, such as revenue recognition, asset valuations and impairment testing, adjusting items, the accrual of obligations and the appraisal of contingent liabilities, which include taxes and litigation. Formal processes are in place whereby central management and end-market management confirm adherence to the principles and the procedures and to the completeness of reporting. Central analyses and revision of information are also performed to ensure and confirm adherence.
In order to prepare the Group’s consolidated financial information in accordance with IFRS, management has used estimates and assumptions that affect the reported amounts of revenue, expenses, assets and the disclosure of contingent liabilities at the date of the financial statements.
The critical accounting estimates are described in note 1 in the Notes on the Accounts and include:
– review of asset values, including goodwill and impairment testing;
– estimation and accounting for retirement benefit costs;
– estimation of provisions, including as related to taxation and legal matters; and
– estimation of the fair values of acquired net assets arising in a business combination.
The critical accounting judgements are described in note 1 in the Notes on the Accounts and include:
– identification and quantification of adjusting items;
– determination as to whether control (subsidiaries), joint control (joint arrangements), or significant influence (associates) exist in relation to investments held by the Group; and
– review of applicable exchange rates for transactions with and translation of entities in territories where there are restrictions on the free access to foreign currency or multiple exchange rates.
Accounting developmentsThe Group has prepared its annual consolidated financial statements in accordance with IFRS.
Other than as stated below, there were no further material changes to the accounting standards applied in 2018 from those applied in 2017.
IFRS 9 Financial Instruments and IFRS 15 Revenue from Contracts with Customers became effective from 1 January 2018, and the impact of these changes is also disclosed in note 1 in the Notes on the Accounts.
IFRS 16 Leases was published in January 2016 with a mandatory effective date of 1 January 2019. The effect is that virtually all leasing arrangements are brought on to the balance sheet as financial obligations and ‘right-to-use’ assets. The impact of applying the Standard to the Group’s reported profit in 2018, 2017 or 2016 would not have been material. Had the Standard been applied to the 2018 accounts, non-current assets and liabilities would have each been increased by £564 million at the start of the year. At the end of the year, non-current assets would have been increased by £551 million and non-current liabilities by £558 million. The impact of adopting IFRS 16 with effect from 1 January 2019 is shown in note 31 in the Notes on the Accounts.
Future changes applicable on the accounting standards that will be applied by the Group are set out in note 1 in the Notes on the Accounts.
42 BAT Annual Report and Form 20-F 2018

Strategic Report Governance Financial Statements Other Information
Regional review
VarianceUnited States Americas and Sub‑Saharan Africa
Variance
2018
2018 vs 2017
%
2018 vs 2017 (rep)
%
2017 vs 2016
%
2018
2018 vs 2017
%
2018 vs 2017 (rep)
%
2017 vs 2016
%
Volume (bn) 77 +118% -5.3% n/a 157 -5.4% -5.4% -4.2%Movement in market share (bps) -20 bps n/a -20 bps +10 bpsRevenue (£m) 9,495 +128% n/a 4,111 -4.9% +7.1%Adjusted revenue at constant rates (£m) 9,838 +137% +1.5% n/a 4,560 +5.6% +5.6% +8.1%Profit from operations (£m) 4,006 +244% n/a 1,544 -6.3% +15.9%Adjusted profit from operations at constant rates (£m) 4,686 +143% +5.8% n/a 1,922 +7.9% +6.5% +5.2%Adjusted organic profit from operations at constant rates (£m) n/a +5.2%
Europe and North Africa Asia‑Pacific and Middle East
Variance
2018
2018 vs 2017
%
2018 vs 2017 (rep)
%
2017 vs 2016
%
2018
2018 vs 2017
%
2018 vs 2017 (rep)
%
2017 vs 2016
%
Volume (bn) 246 -4.7% -5.3% -1.9% 228 +0.7% +0.7% -1.0%Movement in market share (bps) FLAT +20 bps +110 bps +50 bpsRevenue (£m) 6,004 -1.7% +14.7% 4,882 -1.8% +4.3%Adjusted revenue at constant rates (£m) 6,112 +4.5% +3.5% +3.4% 5,250 +5.7% +5.7% +0.2%Profit from operations (£m) 1,905 +12.3% +14.7% 1,858 -2.3% +7.2%Adjusted profit from operations at constant rates (£m) 2,217 +2.2% +0.8% +10.6% 2,099 +2.4% +1.2% -0.5%Adjusted organic profit from operations at constant rates (£m) +8.6% -0.5%
Effective 1 January 2018, the Group, excluding the Group’s associate undertakings, was organised into four regions: The United States (US – Reynolds American Inc.), Asia-Pacific and Middle East (APME), Americas and Sub-Saharan Africa (AmSSA) and Europe and North Africa (ENA). For presentation purposes within this Annual Report and Form 20-F, all prior periods have been revised to be consistent with the current reporting structure.
43BAT Annual Report and Form 20-F 2018

Financial Review
Regional review continued
United States“ Pricing and value share growth in combustibles, as well as increased Vuse consumables volumes, has more than offset total volume declines”Ricardo OberlanderPresident and CEO (RAI)
Volume and Market ShareThe cigarette industry was estimated to be around 4.5% lower in 2018 partly due to the impact of higher fuel prices on disposable income, the growth of the vapour category and the full year effect of the change in excise in 2017 in California. The decline moderated in the second half of the year, from 5.3% to 4.1%.
In 2018, cigarette volume from the US business was 77 billion sticks, which represents an increase of 118% due to the recognition of a full year’s volume from RAI. On a representative basis, this was 5.3% lower than in 2017, with market share declining 20 bps, as continued growth in market share in Natural American Spirit (up 20 bps) and Newport (10 bps higher) and stable Camel share was more than offset by lower market share in Pall Mall (down 20 bps) and declines in the remainder of the portfolio. US volumes were further affected by a strong comparator due to Camel and Newport product launches in the first six months of 2017. Total value share grew 25 bps driven by the performance of the premium brands.
The US vapour market experienced strong growth (up approximately 120% in volume terms) which the Group estimates has contributed to a total volume decline in cigarettes of 0.7% during 2018. While new competitor vapour brands have taken market share, Vuse continued to grow volume of consumables (cartridges) by 36%, on a representative basis, with distribution of Alto reaching over 70,000 outlets, which is estimated to be approximately 70% of the retail universe. Performance was negatively impacted by a product recall, of Vibe, arising from a few isolated issues which have been resolved.
Oral volume declined 2.3% on a representative basis, with market share down against the prior period which, on a representative basis, benefited from a competitor’s product recall.
During 2018, the US Food and Drug Administration’s (FDA) regulatory proposals contributed to increased uncertainty in the US operating environment. Given our long track record of success in the face of regulatory change in the industry, and our strong portfolio of brands, we are confident in our ability to manage the proposals noting that any FDA regulation or proposed ban of menthol in cigarettes must be
developed through a comprehensive rule-making process, be based on a thorough scientific review and consider all unintended consequences in order to withstand judicial review.
In 2017, the FDA accepted and filed for substantive review the Modified Risk Tobacco Products (MRTP) applications for Camel Snus, which were subsequently provided with a favourable recommendation from the Tobacco Products Scientific Advisory Committee (TPSAC). There is no timetable for the FDA to issue a decision on the MRTP applications, however, the Group anticipates a decision during 2019.
In 2017, in the period since acquisition, cigarette volume was 36 billion, outperforming the industry with total cigarette market share at 34.7%, up 20 bps on 2016. Newport and Natural American Spirit continued to grow market share driven by the investment into the trade and, together, were the fastest growing premium brands on the market. Camel market share increased due to the performance of the menthol range. Pall Mall market share decreased due to the price competition in the value-for-money category. Combined, the US strategic combustible portfolio grew market share by 40 bps in 2017. Volume of moist snuff was equivalent to 3.2 billion sticks in the period since acquisition. Total moist market share was up 100 bps on 2016 to 34.4%, primarily due to the performance of Grizzly in the moist snuff category, benefiting from its strength in the pouch and wintergreen categories, as well as the recent national expansion of its Dark Select style and the limited edition packs.
RevenueReported revenue was £9,495 million, an increase on 2017 of 128%, largely due to the 12-month inclusion of results from RAI, compared to approximately five months in 2017.
On a constant currency, representative basis, adjusted revenue was up 1.5% as pricing in both the combustibles and oral categories and higher Vuse consumables volume more than offset the reduction in combustibles and oral volume (noted above).
Revenue in 2017 on a representative basis included £94 million of revenue recognised by RAI related to the sale of inventory associated with the international brand rights of Natural
American Spirit. @Excluding the revenue related to the sale, adjusted revenue would have increased by 2.5% on a representative, constant currency basis. Revenue from vapour grew by 149% to £184 million, an increase of 20% on a representative, constant currency basis. @Excluding the impact of the recall related to the consignment of batteries noted above, management estimate the increase would have been an increase of approximately 32%.
In 2017, revenue was £4,160 million in the period since acquisition. Prior to July 2017, RAI was an associate and no revenue was recognised by the group in the periods previous to the acquisition.
Profit from operationsReported profit from operations was £4,006 million, an increase of 244% on 2017, largely due to the full year’s inclusion in the Group’s results. Excluding adjusting items related to Engle and integration costs, profit from operations was £4,511 million, an increase of 1.8% on an adjusted, representative basis, or 5.8% excluding the translational foreign exchange headwind. This increase reflects the growth in revenue from the portfolio and cost reductions since the acquisition of RAI.
Cost synergies are progressing well, with annualised savings of over US$300 million delivered to date. The Group continues to expect to deliver over US$400 million of synergies by the en d of 2020.
In 2017, profit from operations was £1,165 million in the period since acquisition. Profit from operations was impacted by the FDA user fees of £62 million and product liability defence costs of £59 million. Additionally, £865 million was incurred as part of the State Settlement Agreements, with £109 million in credits recognised as part of the non-participating manufacturers’ (NPM) adjustment claims. The US business also incurred other costs that relate to adjusting items, including the Engle progeny cases, tobacco-related or other litigation and other costs associated with the integration with the rest of the Group. Adjusted profit from operations at constant rates was £1,827 million for the period since acquisition.
44 BAT Annual Report and Form 20-F 2018

Strategic Report Governance Financial Statements Other Information
Americas and Sub-Saharan Africa“ Growth was driven by pricing, which more than offset volume declines in a difficult environment”Luciano CominRegional Director
Key markets
Argentina, Brazil, Canada, Caribbean, Central America, Chile, Colombia, Kenya, Mexico, Nigeria, Paraguay, Peru, South Africa, Venezuela
Volume and Market ShareIn 2018, volume was 5.4% lower at 157 billion sticks, largely driven by the growth of illicit trade in Brazil and South Africa, the termination of a third-party licence agreement in Mexico and market contraction in Canada, Colombia and Venezuela. South African volumes stabilised in the second half of 2018 after a period of decline.
Market share was 20 bps lower as growth driven by Kent (migration from Free) in Brazil, Dunhill in South Africa, Rothmans in Colombia and Brazil (following the migration from Mustang and Minister respectively, to strengthen the consumer proposition) and in Argentina, and Pall Mall in Mexico was more than offset by declines in the local portfolio which was largely due to the growth in illicit trade especially in South Africa and Brazil.
Vype was launched in Canada through exclusive distribution in the top four key accounts, representing over 4,000 retail outlets. In the seven months since launch, it had sold to over 92,000 adult users.
Volume was 4.2% lower in 2017 at 166 billion, as growth in Mexico and Nigeria was more than offset by the difficult economic conditions which led to continued down-trading and industry contraction in Brazil and Argentina, lower volume in South Africa and the growth of illicit trade in Chile. Market share was up as the combined growth in Mexico, Argentina, Colombia and Chile more than offset South Africa and Brazil, which was lower despite the continued success of Minister and Kent (following the migration from Free).
RevenueIn 2018, revenue declined 4.9% to £4,111 million, due to the translational foreign exchange headwind of approximately 10%. On a constant currency, representative basis, adjusted revenue grew by 5.6% to £4,560 million, as pricing across the region (notably in Mexico, Brazil, Chile and Nigeria) more than offset the lower total volume and the negative impact of mix due to the growth of lower-priced products following the significant excise-led price increases in a number of markets.
Revenue grew by 7.1% in 2017, to £4,323 million. This was driven by pricing in a number of markets, with revenue higher in Canada, Mexico, Chile and Colombia, more than offsetting a decline in Brazil and in Venezuela, where the deterioration in the exchange rate more than offset higher pricing due to local inflation. On an organic constant rate basis adjusted revenue was up 8.1% at £4,365 million.
Profit from operationsIn 2018, profit from operations was down 6.3% to £1,544 million, as the effect of currency headwinds more than offset growth across the region. Excluding adjusting items (mainly related to a £110 million asset impairment to recoverable value in Venezuela arising from hyperinflationary accounting and costs related to the Group’s ongoing restructuring programme) and the effect of currency, adjusted profit from operations on a representative, constant currency basis grew by 6.5% to £1,922 million, driven by Nigeria, Mexico and Chile, partly offset by the effect of the lower duty paid market and down-trading in South Africa.
In 2017, profit from operations increased by 15.9% to £1,648 million. This was mainly due to the growth in revenue noted above. Excluding adjusting items, which largely relate to the amortisation of acquired trademarks, and the impact of currency, adjusted, organic, profit from operations at constant rates increased by 5.2% to £1,772 million.
@ denotes phrase, paragraph or similar that does not form part of BAT’s Annual Report on Form 20-F as filed with the SEC.
45BAT Annual Report and Form 20-F 2018
Financial Review
Europe and North AfricaRegional review continued
“ PRRPs are gaining a strong foothold with THP now present in 12 markets, while oral volumes have grown 45%”Johan VandermeulenRegional Director
Key markets
Austria, Bulgaria, Czech Republic, Denmark, Finland, France, Germany, Greece, Hungary, Italy, Norway, Poland, Russia, Spain, Sweden, Switzerland, Turkey, Ukraine
Volume and Market ShareIn 2018, volume declined 4.7% to 246 billion sticks, which was a reduction of 5.3% on a representative basis, as volume from assets acquired (from Bulgartabac and FDS) in 2017 combined with growth in Turkey, Egypt, Poland and Romania was more than offset by Russia (partly due to inventory movements and the growth of illicit trade), Ukraine (due to market contraction following the excise-led price increase, leading to an increase in illicit trade), Italy (partly due to impact of higher prices) and France (following the excise-led price increase).
Market share was flat as increases in Kent, led by Ukraine, Turkey, Kazakhstan and regaining premium segment leadership in Russia, and Rothmans (Ukraine, Russia, Poland, Spain, Bulgaria and Italy) was offset by both the continued reduction in Pall Mall (Poland, Germany and Belgium) and a decline in the low-priced portfolio in Russia. Total market share in Russia returned to growth in the second half of 2018, as the effects of the trade inventory movements normalised.
Our THP and vapour portfolio continued to expand, with glo now present in 12 countries in ENA, including Russia, Switzerland, Romania, Italy, Poland and Ukraine. Volume of vapour (devices and consumables) grew, notably in the UK (driven by Vype, Ten Motives and VIP), with market share up (in traditional retail) in France and Vype remaining the leading vapour brand in Germany. In November 2018, the Group further enhanced its capabilities with the acquisition of Germany’s leading vapour retail chain, Quantus Beteiligungs-und Beratungsgesellschaft mbH. Further launches and product developments are planned across the portfolio during 2019.
In oral, volume grew 44%, mainly driven by EPOK which is the fastest growing premium oral brand in both Norway (reaching 8% total oral market share in December 2018) and in Switzerland (achieving 17% total oral market share in December 2018). In Sweden, the Group launched Lyft, a tobacco-free product, achieving a 4.5% share of the total oral market in handlers.
In 2017, volume was 258 billion, 1.9% down on 2016. This was due to the contribution from the tobacco assets of Bulgartac and FDS acquired in the year, and higher volume in Spain, Romania, Portugal, Poland and Hungary, which was more than offset by lower volume in Russia, Ukraine, Italy and Greece. On an organic basis, volume fell 3.1%. Market share was up 20 bps, driven by Russia, Turkey, Germany, Spain, Romania and Poland.
RevenueIn 2018, revenue was down 1.7% against 2017 at £6,004 million as pricing across the region (notably in Romania, Russia, Germany and Ukraine) was more than offset by the impact of lower regional volume, continued excise absorption in France and the translational foreign exchange headwinds of approximately 5%.
Adjusted revenue, at constant rates, was £6,112 million, an increase of 3.5% on a representative basis. This excludes excise on bought-in goods, acquired and sold under short-term contract manufacturing arrangements which distorts revenue and operating margin on a temporary basis, and the impact of foreign exchange movements on revenue.
Revenue, in 2017, grew by 14.7% to £6,108 million, as the positive effect of acquisitions in the year and higher revenue in Germany, Romania and Spain offset a decline in the UK due to aggressive pricing in the market, lower revenue in Italy and France, and the down-trading in Russia. Excluding excise on goods acquired under short-term contract manufacturing arrangements, on an adjusted, constant rate basis, revenue was up 3.4% or 1.6% on an organic basis.
Profit from operationsIn 2018, profit from operations grew 12.3% to £1,905 million. This was due to an improvement in the operating performance in Germany, Romania and Ukraine and a one-off charge of £69 million in 2017 in relation to a third party in Croatia that does not repeat in 2018. This more than offset a reduction in profit from operations in Russia (largely due to the impact of lower volume), the impact of excise absorption in France, restructuring costs incurred (largely in Germany related to the factory closure), significantly increased investment in PRRPs and the impact of foreign exchange on the reported results. Excluding adjusting items (related to the factory closure in Germany, amortisation of acquired brands, other costs related to the Group’s ongoing restructuring programme and the 2017 impairment in Croatia) and the impact of the foreign currency headwind, adjusted profit from operations at constant rates, on a representative basis was up 0.8%, at £2,217 million.
Profit from operations grew 14.7% in 2017 to £1,697 million, due to improved revenue and devaluation in sterling, with profit from operations up in Germany, Romania, Denmark and Spain. This was partly offset by the costs of the ongoing closure of the factory in Germany and impairment of certain assets related to a third-party distributor (Agrokor) in Croatia, the partial absorption of excise in France, investment behind NGP in the UK, lower profit from operations in Belgium and the Netherlands and the impact of down-trading in Russia. Excluding the acquisitions, adjusting items (including Agrokor, factory closure costs and trademark amortisation) and the impact of foreign exchange, adjusted organic profit from operations at constant rates of exchange increased by 8.6% to £1,981 million.
46 BAT Annual Report and Form 20-F 2018
Strategic Report Governance Financial Statements Other Information
Asia-Pacific and Middle East“ Growth was driven by volume recovery in Pakistan as well as strong performance of glo in Japan”Guy MeldrumRegional Director
Key markets
Australia, Bangladesh, Cambodia, China, Hong Kong, Indonesia, Japan, Korea, Malaysia, New Zealand, Pakistan, Sri Lanka, Taiwan, Vietnam
Volume and Market ShareIn 2018, volume was up 0.7% at 228 billion sticks driven by the recovery in the combustibles volume in Pakistan (following the revision to the excise structure that negatively impacted the equivalent period in 2017) and the performance of glo in Japan and South Korea with sales of 6.5 billion sticks in the period. This growth in volume was partly offset by lower volume in the Middle East, largely due to the impact of a 2017 excise-led price increase in Saudi Arabia and the difficult trading environment in a number of countries in the Middle East. Volume was lower in Bangladesh due to higher illicit trade following an increase in excise, with Indonesia lower due to market contraction. Volume decreases have slowed in Malaysia after a period of accelerated decline following the excise changes in prior years.
Market share in the region was up 110 bps. Kent (including THP sticks) was up in Japan (which was partly due to a growing share of glo, up 340 bps), with Dunhill and Lucky Strike higher in Indonesia. Pall Mall grew in Pakistan, Australia and particularly in Saudi Arabia, where the Group became market leader. The Group also grew Rothmans in Malaysia and increased total market share in Bangladesh. This growth was partially offset by lower market share in South Korea, due to a reduction in Dunhill partly driven by the growth of the THP segment and a reduction in Taiwan driven by Dunhill and Pall Mall.
Volume was lower in 2017 (down 1.0% at 226 billion). glo was launched nationally in Japan and South Korea, performing well with national market share in Japan reaching 3.6% in December 2017. Volume from glo and cigarette volume growth in Bangladesh and Gulf Cooperation Council countries (GCC) was more than offset by the lower combustible volume in Japan and industry volume decline in Malaysia, Pakistan and South Korea. Market share was higher, up 50 bps, with growth in Bangladesh, Japan, Pakistan and Australia, driven by Lucky Strike, Pall Mall and Rothmans, more than offsetting lower market share in Malaysia and Indonesia, which was due to down-trading.
RevenueIn 2018, revenue declined 1.8% to £4,882 million, as pricing, higher volume (discussed earlier) and the positive mix effect, largely in Japan through the growth in glo, was offset by a combination of inventory movements in the prior year, down-trading in Saudi Arabia and by the foreign exchange headwinds related to the relative strength of sterling. Excluding the translational foreign exchange headwind, constant currency, adjusted revenue, on a representative basis grew 5.7%.
In 2017, revenue was up by 4.3% at £4,973 million due to the combination of volume and pricing, notably in Bangladesh, Australia and New Zealand, revenue from glo following the roll-out and subsequent growth in Japan and South Korea, and the positive impact of the devaluation in sterling on the reported results. This more than offset the impact of down-trading in Malaysia and Saudi Arabia, and the industry contraction combined with growth in illicit trade in Pakistan. Excluding the positive currency effect, on a constant exchange rate basis, adjusted revenue was marginally higher than 2016, up 0.2% to £4,776 million.
Profit from operationsIn 2018, profit from operations declined 2.3% to £1,858 million, as the performance was negatively affected by foreign exchange headwinds and adjusting items related to the ongoing costs of the Group’s restructuring programme. Adjusted profit from operations on a representative constant currency basis grew 1.2% to £2,099 million driven by an improvement in Japan, where the performance of both combustibles and THP more than offset the higher marketing investment, and increases in Australia, Pakistan and Bangladesh. These were partly offset by Saudi Arabia which was negatively impacted by down-trading, described above, and South Korea.
Profit from operations was 7.2% higher in 2017 at £1,902 million, as the growth in revenue, and transactional foreign exchange tailwinds notably due to the relative movements in the US dollar and euro against the Japanese yen, were partly offset by the investment behind glo in Japan and South Korea and negative mix effects from down-trading in Malaysia and Saudi Arabia. Before adjusting items, which mainly related to the Malaysian factory closure and the amortisation of trademarks, and the impact of exchange rate movements on the reported results, adjusted profit from operations on a constant currency basis was down 0.5% at £1,962 million.
47BAT Annual Report and Form 20-F 2018