financial monitoring reports for world...
TRANSCRIPT

FINANCIAL MONITORING REPORTS FOR WORLD BANK-FINANCED PROJECTS:
GUIDELINES FOR BORROWERS
OPERATIONS POLICY AND COUNTRY SERVICES NOVEMBER 30, 2001

ACRONYMS
FMR Financial Monitoring Report FMS Financial Management Specialist LACI Loan Administration Change Initiative M&E Monitoring and Evaluation PAD Project Appraisal Document PAS Procurement Accredited Staff PIP Project Implementation Plan PMR Project Management Report PS Procurement Specialist SA Special Account TL Team Leader TT Task Team

FINANCIAL MONITORING REPORTS FOR WORLD BANK-FINANCED PROJECTS:
GUIDELINES FOR BORROWERS
CONTENTS
Foreword........................................................................................................................................iv
I. Introduction.......................................................................................................................... 1
II. Financial Monitoring Reports ............................................................................................ 2
A. Underlying Principles ...................................................................................................... 2
B. Contents of Financial Monitoring Reports ....................................................................... 3
C. Format of Financial Monitoring Reports ......................................................................... 9
D. Submission of Financial Monitoring Reports .................................................................. 9
III. Disbursements .................................................................................................................... 10
IV. Transitional Arrangements ............................................................................................... 10
V. Donor Coordination........................................................................................................... 11
Annexes
A. Sample Financial Monitoring Reports
B. Disbursement Documentation for Investment Loans

iv
FINANCIAL MONITORING REPORTS FOR WORLD BANK-FINANCED PROJECTS:
GUIDELINES FOR BORROWERS
FOREWORD
1. These guidelines have been prepared to assist the World Bank and its borrowers to reach agreement on the content, format, and timing of financial monitoring reports (FMRs) for Bank-financed projects. The guidelines apply to all investment loans and credits.
2. These guidelines replace previous guidance on PMRs contained in the Loan Administration Change Initiative Handbook and the Project Financial Management Manual.1
3. Section I provides a brief background explanation of these changes. Section II provides detailed guidance on the development of FMRs, and discusses underlying principles; the basic content of FMRs (financial, phys ical progress, and procurement information); and FMR format, frequency, and submission. Section III discusses the disbursement implications of FMRs. Section IV discusses arrangements for transitioning to FMRs. Section V discusses coordination with other donors on FMR issues. There are also two annexes. Annex A provides illustrative examples of the possible format and content of FMRs, using five different types of projects. Annex B provides further information on the documentation required for disbursement for investment loans.
1 See the Loan Administration Change Initiative (LACI) Implementation Handbook , World Bank, Loan
Department, September 1998; and Project Financial Management Manual, Exposure Draft , World Bank, Loan Department, February, 1999.

FINANCIAL MONITORING REPORTS FOR WORLD BANK-FINANCED PROJECTS: GUIDELINES FOR BORROWERS
I. INTRODUCTION
1. Bank policy requires that projects be supervised to ensure that loan proceeds are used only for the purposes for which the loan was granted, with due regard to economy, efficiency, and the sustainable achievement of the project’s development objectives. As an aspect of this supervision, the Bank requires borrowers to submit reports needed for effective project monitoring and evalua tion. In July 1998, the Bank introduced a requirement for borrowers to prepare project management reports (PMRs) based on a standardized format, which included financial management, physical progress (outputs), and procurement reporting. Although the major objective of PMRs was to improve project financial management, the reports also provided a new basis for disbursements, described as PMR-based disbursements.
2. Change from PMR to FMR. The Bank has recently decided to simplify and customize reporting requirements, thus facilitating the generation of reports directly from the project management information systems rather than their having to be prepared separately. It has also been decided to rename PMRs as financial monitoring reports (FMRs) so as to clearly reflect their objective and to signal the changes from PMRs. While their objective is the same as the previous PMRs, the change in nomenclature reflects two key points—that they focus on the financial aspects of projects and that their purpose is project monitoring, not management. The FMRs are not the same as the audited financial statements required annually for each project. However they may form the basis of these statements (see paragraph 10a).
3. Borrower and Bank Responsibilities. The borrower is responsible for putting in place and maintaining adequate financial management, procurement, and progress monitoring arrangements for the project as part of overall arrangements for project management. The Bank’s role is to ensure that these arrangements are in place before project implementation begins, and that they remain in place throughout project execution.
4. Borrower Staff Responsibilities. The duties of project staff with respect to preparation of FMRs and other reports should be explained as part of the project’s Operations Manual. The Project Manager/Coordinator is responsible for ensuring that a complete FMR is produced, and provided to all stakeholders in a timely manner. As manager of the project, he/she should also work with the appropriate government officials and project staff to provide narrative explanations of project progress and to take actions to address problems or take advantage of opportunities that may be presented in the FMR. Typically, the Project Accountant/Financial Manager is responsible for preparing the financial reports, while physical progress reports are produced by technical specialists and procurement reports by the project staff responsible for procurement. However, the exact responsibilities will vary depending on the nature of the project.
5. Bank Staff Responsibilities. Responsibility for project supervision by the Bank rests with the task team (TT) assigned to the project. As part of project preparation, the TT agrees on the arrangements for project supervision with borrower staff. These arrangements include the

2
format and content of reports to be provided by the borrower—such as FMRs, annual financial statements and audit reports, and other reports required for effective project monitoring, evaluation, and disclosure. The team leader (TL) is the Bank’s principal point of contact with the borrower. The TL is supported by financial management specialists (FMS), procurement specialists (PS) or procurement accredited staff (PAS), and other TT members.
II. FINANCIAL MONITORING REPORTS
6. Although FMRs should be flexible and customized to each project or, where appropriate, to each country or sector, they must adhere to underlying principles, noted below. 1 Subsequent sections discuss the content, format, and frequency of FMRs.
A. Underlying Principles
7. The principles that underpin FMRs are as follows:
• FMRs should provide information that is useful to the borrower while also providing the Bank with sufficient information to establish whether:
Ø funds disbursed to projects are being used for the purpose intended,
Ø project implementation is on track, and
Ø budgeted costs will not be exceeded.
• Financial information should be linked with information on physical progress and procurement, to give assurance that financial and physical progress are consistent. The monitoring of expenditures in relation to physical progress is a key aspect of ensuring that the project is under proper financial control, although in some projects it may be difficult to develop quantitative output indicators.
• Project monitoring by the Bank should be cost effective from the viewpoint of both the Bank and borrowers. This entails the following:
1 Financial monitoring reports provided to the Bank may be a sub-set or summary of the project’s management
reports, since for monitoring purposes the Bank does not need as detailed information as is contained in reports for project management. Such management reports should broadly follow the principles outlined in this section as regards: (a) flexibility of format and frequency; (b) report design predicated on the size, nature, and complexity of the project, and the systems, needs, and expertise of borrower staff; (c) the need to compare planned and actual expenditures in relation to physical progress and to analyze revealed variances; (d) the need to highlight issues requiring attention (including unexpected developments that may have a significant impact on the project’s implementation or its procurement and financial management systems); and (e) the need to report project overall progress as agreed during project preparation. Bank staff may also provide assistance to the borrower on management reports—to help determine the information required, the frequency of reporting, and how best to identify formats that can be produced from borrowers’ own systems and how to enhance those systems.

3
Ø Reporting requirements that necessitate borrowers investing in or maintaining parallel or duplicate systems should be avoided, as far as possible (see paragraph 10a). While the FMR should allow the reader to compare information across the various reports, linkage of the information should be done through a consistent information structure and should not require new, complex, “integrated” information systems.
Ø The same structure of financial information should normally be used for project planning and costing, FMRs, the annual audited financial statements of the project, and implementation completion reports.
Ø The requirements for financial and procurement monitoring should, as far as possible, be aligned and integrated with other Bank requirements for project progress reporting and monitoring, including project outcome monitoring and reporting. For example, when semi-annual progress reporting is required, the FMR should be an integral part of these reports.
Ø As far as possible, borrowers are not required to provide the Bank with information already available to the Bank. An example is the procurement information on contracts above the prior-review threshold.
Ø Wherever possible, common reporting and monitoring arrangements should be agreed with other donors involved in the project (see paragraph 37).
B. Contents of Financial Monitoring Reports
8. The format and content of FMRs should be determined as part of project appraisal (reflecting assessments of the financial management systems, procurement arrangements, and the overall review and assessments by the TL), and be agreed at negotiations. Other donors involved in the project should be invited to participate in the discussions (see paragraph 37).
9. Timing of Financial Management Arrangements. In all cases, adequate financial management arrangements, including the ability to produce a timely FMR, should be in place by loan effectiveness.
10. Required FMR Information. FMRs will include financial, physical progress, and procurement information. (Illustrative sample reports are shown in Annex A.) There should also be an introductory narrative discussion of project developments and progress during the period, to provide context to (or other explanations of) information reported in the financial, physical progress, and procurement sections.
a. Financial Reports. At a minimum, financial reports must include a statement showing for the period and cumulatively (project life or year to date) cash receipts by sources and expenditures by main expenditure classifications; beginning and ending cash balances of the project; and supporting schedules comparing actual and planned expenditures.

4
• Line Item Reporting. The line item reporting in the FMR should follow the borrower’s chart of accounts as far as possible, provided that it separately records all significant discrete activities, as determined during the financial management assessment and agreed at negotiation. Where the borrower’s chart of accounts does not provide the level of reporting detail needed for project monitoring, either it should be amended or the FMR should be prepared separately from the borrower’s project management system. This chart of accounts will normally reflect expenditure items which differ from disbursement categories.2
• Relationship Between FMRs and Annual Financial Statements. In drawing from the project management system, the cumulative FMRs over the project year will in many cases be able to be used as the project’s annual financial statements. This will result in more cost-effective reporting. It may also result in more cost-effective and timely auditing of the project annual financial statements, to the extent tha t FMRs may be reviewed as part of the auditor’s interim work on the annual financial statements.3
• Avoiding Parallel or Duplicative Systems. Two aspects are relevant to reducing the number of unnecessary reporting systems:
Ø To the extent possible, borrower financial management systems should be used for project management reporting. At project appraisal, therefore, the borrower and the Bank should evaluate and discuss the capacity of the borrower’s systems and the possibility of improvements that would enable the borrower to produce the FMR from the project management system. For example, the use of the borrower’s chart of accounts for the financial reports should be considered.
Ø If borrower financial management systems cannot be used, any separate or “ring fenced” accounting system developed for project management should also be capable of producing FMRs, rather than having them produced from a system that is separate from project management. Monitoring reports should normally draw on the more detailed information used by the implementing agency for project management.
b. Physical Progress Reports. Physical progress reports include narrative information and output indicators (agreed during project preparation) linking financial information with physical progress, and highlight issues that require attention. (See paragraphs 21 through 26 for guidance on monitoring physical progress.)
2 The borrower provides information by disbursement category to the Loan Department through withdrawal
applications. 3 The FMRs are unaudited reports, but may prove useful to auditors as they carry out their interim work. When
used for disbursements, the auditors must provide an opinion in the annual financial statements as to the eligibility of the expenditures financed by the Bank and the existence of adequate support documentation in the project entity’s files.

5
c. Procurement Reports. Procurement reports provide information on the procurement of goods, work, and related services, and the selection of consultants, and on compliance with agreed procurement methods. The reports compare procurement performance against the plan agreed at negotiations or subsequently updated, and highlight key procurement issues such as staffing and building borrower capacity. In addition to procurement progress, the reports include information on all authorized contract variations. Information on complaints by bidders, unsatisfactory performance by contractors, and any major contractual disputes may also be included.
11. FMRs for Small Operations. Where the value of the loan, credit, or grant does not exceed US$5 million, such as for learning and innovation loans (LILs), the relatively small amount of funds involved and the likely less complex nature of the project will normally enable more simplified forms of reporting to be adopted. Although reporting is still necessary on financial, physical progress, and procurement aspects, there will normally be fewer individual components and output indicators, resulting in simpler, less detailed reporting. Less frequent reporting may also be appropriate.
12. Scope of the FMR. The FMR encompasses the total project as described in the PAD, and not only the use of Bank funds. The FMR thus reflects all project activities, financing, and expenditures, including funds from other donors and contributions in kind such as labor and accommodation, irrespective of whether the project implementing agency controls the funds for a particular aspect of the project. If a borrower or a co-financier provides goods and services that it finances directly or to which contributions in kind are made, appropriate valuations should be undertaken to determine the amounts to be recorded in the accounts. If this information is not readily available, the FMR should not be delayed. Instead, a note to this effect should be included in the FMR, and the necessary information attached to a subsequent FMR, once available.4
13. Multiple Implementing Agencies. The reporting arrangements for a project with multiple implementing entities should be determined no later than appraisal, and agreed and documented at negotiations, along with the format and frequency of the FMRs. Ideally, a single FMR should be submitted for a project for each reporting period. For example, where two or more implementing entities each have responsibility for different components of a project and there is a central (coordinating) project unit and one special account (SA), the central project unit should prepare a consolidated FMR, covering the various implementing entities. However, there are situations where this may not be possible. For example, a project may have multiple implementing agencies, each with an SA and responsible for implementing the project in a separate zone, state, or province, and there may be no central project unit. Where this makes the preparation of a consolidated FMR infeasible, each implementing entity should prepare a separate FMR.
14. Currency of the FMR. The currency in which the reports will be prepared should be agreed at negotiations. FMRs should be prepared in the currency in which borrowers normally
4 FMRs are not required to provide procurement information on activities financed by other donors, although the
discussion of project progress should mention the status of these contracts and their impact on overall project progress.

6
keep their books of account. Where the accounts are maintained in a currency other than the currency of the SA, the issue of currency translation will arise. As a general rule, the opening and closing balances of the SA (and of any other bank accounts relating to the project that are held in a currency different from the books of account) should be translated at the rate ruling on the opening and closing dates, respective ly. Expenditures made out of the SA (and other bank accounts as mentioned above) should be stated at the rate ruling on the transaction dates. The actual exchange rates used should be disclosed in a note to the FMR.
15. Accounting Policies. There are two generally recognized accounting bases used by governments—cash and accrual accounting. 5 These accounting bases determine whether, how, and when to record or recognize transactions/events. The cash basis of accounting is normally acceptable for projects implemented by non-revenue-earning entities. The accrual basis is necessary where the management of liabilities requires specific attention, and where full-cost information (as opposed to cash payments) is needed. The full accrual basis is therefore required of all commercial/revenue-earning entities in receipt of Bank funds. In practice, different levels of government in the same country may use different bases of accounting, or modified versions thereof. However, only one basis of accounting should be applied to a project. Project accounting policies should be agreed at negotiations and also disclosed in a note to the FMR.
16. Project Planning. Effective project monitoring requires adequate project planning, including a financial plan. Without such plans there is no base against which to compare actual results. The planning process should start early during project preparation. As the project is developed, the plan becomes more specific and is expressed in the form of a guiding project implementation plan (PIP), which provides a basis for monitoring the project and identifying areas that require corrective action. The information in the initial PIP should include cost tables, physical output measures, and cost information. The PIP should be updated when significant changes to underlying assumptions or to project implementation occur, to ensure that it remains realistic.
17. Sound Project Implementation Plans. A good project implementation plan should include the following information:
• Financial projections or forecasts for the life of the project broken down by appropriate period, from which the annual budgets for the project should be developed;
• A procurement plan, including the activities and processes associated with the project (for instance, arrangements and process to secure the services of contractors);
• The format and content of, and the auditing arrangements for, project financial reports;
• Measures of physical progress and other monitorable indicators that can be validly related to costs; and
5 In addition to these accounting bases, governments also use commitment accounting. This basis, which is used
mainly for budgetary control, recognizes transactions when they are committed, for example, when an order is placed. This is not an acceptable basis for the preparation of FMRs.

7
• The criteria for fo llowing up variances between planned and actual costs and physical progress.
18. Financial Planning: First Steps. Financial planning starts with the cost information generated either by COSTAB software (used by the Bank for the preparation of project cost tables) or by other means, such as a spreadsheet. The Bank’s task team and borrower staff have joint responsibility for ensuring that this information is properly prepared. The cost tables should, where possible, be based on the borrower’s chart of accounts to ensure that project financial reports can also be prepared on this basis.6 Before project implementation, borrowers, with support as needed from Bank staff, should refine the cost information into detailed specifications for project activities, detailed schedules (including procurement plan), and expenditure budgets broken down by time periods, as appropriate. The budgeted expenditure for each quarter (or any other appropriate period) should reflect the project activities scheduled for the quarter (or period).
19. Revising Project Budgets. Planning figures need to remain realistic if reported variances are to be meaningful. Therefore, before the beginning of each fiscal year of the project, borrower staff should review, and revise as necessary, the project budget for the coming year, reflecting any updating of the PIP. This will avoid reporting variances that arise solely from project delays that have not been reflected in an updated PIP or budget. The revised budget should normally be sent to the TL at least two months before the beginning of the project fiscal year.
20. Variance Analysis. Financial reports depict variances between planned and actual costs. Similarly, physical progress monitoring reports and procurement reports show variances between planned and actual outputs and contracting, respectively. Significant variances should be analyzed, and explanations, together with the remedial actions to be taken, should be given in the reports. The level at which a variance is significant and requires further investigation or remedial action should be agreed during project preparation, either by setting a percentage level of variance or agreeing on those activities to be addressed. The cost of a small activity may vary by a large percentage, but its impact on the project as a whole may be relatively insignificant. Therefore, the level of variance that needs to be addressed could differ from one activity to another within the project, as well as between projects.
21. Monitoring Physical Progress. As noted in paragraph 7, monitoring expenditures in relation to physical progress is a key aspect of ensuring that project costs are under control. Physical progress monitoring requires data on project outputs that reflect the cost drivers of the project components. Some borrowers do not systematically collect such output data, and others need to strengthen their current systems for doing so. For this reason, identifying relevant outputs requires close attention during project preparation. This requires all of the following:
• A project design that identifies the project components and the set of activities to which outputs relate7;
6 The borrower’s chart of accounts may be the central government’s accounting system, or the chart of accounts
of the entity or agency that is responsible for project implementation. 7 An example is the Bank’s logical framework for overall project design and development which can be found in
the Bank’s Project Appraisal Document.

8
• An understanding of the link between outputs and costs; and
• A reliable means of recording and reporting outputs.
22. Designing Output Indicators. Although the nature of the project determines how physical progress will be monitored, output indicators should generally be designed to relate output to cost, as identifiable outputs of each project component (or activity) are usually directly linked to or drive costs. In some cases, monitoring indicators may be in the form of contract status information.
23. Monitoring Methodology. The method of relating outputs to cost is suitable where there is a readily measurable flow of reasonably homogeneous outputs that can be determined as the main cost drivers (for example, people trained, items supplied, cases assessed, treatments carried out, permits issued). However, where construction is a major component of the project, there may be no flow of outputs until the construction activities are completed. In this case, the use of contract information may be the appropriate basis for monitoring project progress. For some projects both methods may be used—for example, an education project may have a component for training teachers (units of output method) and another component for building a university (contract management method). Sometimes neither of these methods will be feasible, and a different approach, such as narrative information, may be appropriate.
24. Scope of Output Monitoring. Output monitoring needs to be approached realistically. It is not necessary for output measures to be developed for all project components and activities. Rather, attention might focus on measuring the outputs of key activities and on developing output information systems that can be expanded in coverage over time.
25. Project Outcome Measures. Project outcome measures, which indicate the project’s success in achieving development objectives—such as improving learning outcomes, changing target group practices or behaviors, or increasing agricultural production—are not normally an appropriate basis for relating to costs in FMRs. They are required for a different purpose, that of monitoring and evaluating project effectiveness and progress toward project development objectives. However, both output and outcome measures are part of the Bank’s logical framework for overall project design and management. These project development objective and outcome measures should also form part of the required monitoring and evaluation (M&E) plan for the project.
26. Timing of Indicator Determination. The development of output indicators for physical progress monitoring should be undertaken in conjunction with the development of output and outcome indicators for the M&E plan. This will avoid duplication as in some cases the same output indicators may be relevant for physical progress monitoring and M&E. 8
8 Further guidance on output and outcome measures is contained in the Bank’s Performance Monitoring
Indicators Handbook (1996).

9
C. Format of Financial Monitoring Reports
27. The FMR comprises a financial report, a physical progress report, and a procurement report. Although the FMR format is specific to each project, it is desirable to avoid an unnecessary number of differing formats. Borrowers may therefore wish to reach agreement with the Bank on a more standardized format that can be used across projects in the country, and especially for all projects within a particular sector. The format of the FMR should take account of the nature, size, and complexity of each project, while also ensuring that the Bank receives the information it requires for project monitoring. The format should be determined during project preparation, and be agreed at negotiations. For illustrative purposes, a number of sample FMRs are shown in Annex A.
28. Financial Reports. As far as possible, financial reports should be in a format that the borrower’s systems can produce, and this format must be acceptable to the Bank. Bank staff work with clients to identify such formats and in order to assist, where necessary, in developing arrangements to produce such reports.
29. Physical Progress Reports. These will vary in format, based on the nature of the project.
30. Procurement Reports. The main purpose of procurement reports is to facilitate project monitoring, including ex-post reviews of procurement. Procurement reports should be designed in a way that enables project implementation staff to improve the quality and reliability of procurement administration, taking into account the particular circumstances of each project and loan type. For example, for LILs or community-driven development projects, procurement reports may be less detailed than normally required. For some projects, a TL may wish to monitor every contract below the prior review threshold,9 while for others (for example, community-based operations), it may be preferable to set a minimum threshold for reporting to the Bank so as to avoid an excessively long report.
D. Submission of Financial Monitoring Reports
31. The frequency of preparation of FMRs and their submission to the Bank should be determined at the project appraisal stage and agreed at negotiations, and should coincide, as far as possible, with the submission of similar reports to the Bank. The minimum frequency of reporting should be every six months, but most projects would be expected to report quarterly.10 Complex, high-risk projects may require FMRs on a more frequent basis. The first FMR will
9 The Bank obtains information on contracts above the prior review threshold, and maintains this information in
its internal systems. However, in some cases it may be preferred by the borrower and the Bank to also include these contracts in the FMR, in order to provide a comprehensive view of all Bank-financed procurement in one report. Such a comprehensive report on procurement may not be required in every FMR, but it may be prove useful at certain key junctures, such as for the midterm review.
10 Many projects are required to submit semi-annual progress reports. When this is the case, every-other quarterly FMR could be integrated into the semi-annual report.

10
normally cover the period from the date of effectiveness to the end of the first full quarter after effectiveness.11
32. Timing of FMR Submission. The FMR should normally be submitted to the TL within 45 days of the end of the reporting period. If the FMR is not provided on a timely basis, the TL will follow this up with the borrower to determine the reason for the delay and the planned date of report submission. Late submission of FMRs to the Bank will normally lead to more intensive supervision by the Bank task team and may result in the application of legal remedies for noncompliance. Additionally, disbursements to the project will be delayed if the project is using report-based disbursements.
III. DISBURSEMENTS
33. Borrowers continue to have a choice between transaction-based and (streamlined) report-based disbursements. However, to be eligible for report-based disbursements borrowers must meet certain requirements. These requirements and other issues related to disbursement documentation are set out in Annex B.
IV. TRANSITIONAL ARRANGEMENTS
34. The requirement to provide the Bank with FMRs applies to all projects appraised from January 1, 2002. However, borrowers may also continue to use the standardized PMR format.
35. Projects Appraised Between July 1, 1998 and December 31, 2001.12 For projects appraised between July 1, 1998 and December 31, 2001, borrowers that have previously committed to preparing PMRs may request the Bank to agree to a process for converting to FMRs. Bank staff will work with borrower staff to determine and agree upon appropriate reporting arrangements.
36. Projects Currently Utilizing PMR-Based Disbursements. Borrowers disbursing on the basis of the standardized PMRs before January 1, 2002, may continue to do so. In this case, the requirements and procedures outlined in the relevant Disbursement Letter will continue to apply. Alternatively, borrowers may switch to the new FMRs comprising the basic reporting requirements described in these guidelines plus the additional reporting requirements for report-based disbursements, referred to in Annex B.
11 For projects with significant expenditures prior to loan/credit effectiveness, it may be preferable to have the first
FMR produced and submitted to the Bank prior to the first full quarter after effectiveness. Borrowers may also wish to submit FMRs prior to the first full quarter for other reasons, e.g. to get feedback from the Bank and other stakeholders regarding how the report can be improved, or to demonstrate the entity’s readiness for report-based disbursements.
12 These guidelines are not applicable to projects that were appraised prior to July 1, 1998, as these projects were not required to produce PMRs.

11
V. DONOR COORDINATION
37. Where a project is funded jointly by the Bank and other donors, and there is alignment of project preparation schedules, Bank staff will work with the other donors to coordinate the various capacity assessments, in order to streamline this process. Where appropriate, Bank and borrower staff should work to agree, to the extent practicable, on common format, content, and frequency of progress reports to be submitted to donors. By reducing multiple reporting, harmonization may reduce both borrower and donor costs.

ANNEX A
SAMPLE FINANCIAL MONITORING REPORTS
1. This annex provides five illustrative examples of Financial Monitoring Reports (FMRs), as follows:
• Government of “Atlantis” Education Project
• “Appletonia” Urban Highway Project
• “Pacifica” Social Safety Net Project
• “Plutonia” Tax Administration Project
• “Hibernia” Education LIL (example of a small operation)
2. While adaptations to these formats may be agreed between the Bank and borrowers, these adaptations should not reduce the core content of the reports to a level below the minimum necessary for project monitoring by the Bank. It is also expected that many borrowers will wish to have consistent reporting formats within their country, or in certain sectors, and this aim will be supported by the Bank.
3. Table 3 in Annex B lists the additional information needed to support report-based disbursements.
4. The Bank and borrowers may agree that additional information should be added to these formats. Examples of such additional information include updated forecasts of expenditure, schedules of assets (or asset categories) financed by the Bank, an analysis of Bank financing by loan disbursement category, year-to-date financial results, supporting schedules or notes that provide a more detailed analysis of key activity areas or one or more line items in the expenditure reports, and fuller narrative explanations of performance and actions to be taken to address identified problem areas. Some of the sample reports provided here suggest ways of integrating this type of additional information with the core reports.
5. Borrowers that provide the information set out in the PMRs introduced in 1998, fully satisfy the requirements of FMRs.

ANNEX A Sample I
Page 1 of 8
FINANCIAL MONITORING REPORTS - SAMPLE 1
GOVERNMENT OF ATLANTIS EDUCATION SECTOR IMPROVEMENT PROJECT
Contents
1. Discussion of Project Progress
2. Sources and Uses of Funds Statement
3. Uses of Funds by Project Activities (supports the Sources/Uses of Funds)
4. Physical Progress Report - physical outputs
5. Physical Progress Report - status of large works and services
6. Procurement Monitoring Report - narrative and tables
[This provides an example of an education project that includes significant construction activities, equipment purchases, and training. The Sources and Uses of Funds Statement includes a cash forecast for the next six months, to facilitate project planning and monitoring. Physical progress is monitored by units of output, where practical, and by contract/work progress for construction activities.]

ANNEX A Sample I
Page 2 of 8
DISCUSSION OF PROJECT PROGRESS
GOVERNMENT OF ATLANTIS EDUCATION SECTOR IMPROVEMENT PROJECT
FMR as part of progress reporting
1. The attached reports provide information on the progress of the project in terms of financial activity, key output measures, and procurement for the January-March quarter. The FMRs for the periods ending in June and December are incorporated into the larger semi-annual progress report. A comprehensive report of project progress will be prepared in preparation for the midterm review of the project.
Comments on the FMR (including explanation of significant variances)
2. All project components are at least partially completed. The attached Physical Progress Reports show progress in terms of output, for some activities, and work progress for others. As agreed during project appraisal, only the key project activities, and/or those that lend themselves to such reporting, are included in the physical progress reports. Below is a discussion of progress on major project activities.
3. Activity 1a: New Decentralized MIS - The costs in the financial reports reflect the purchase of servers for the Ministry of Education, the purchase and installation of 50 computers in district offices and some software purchase and installation. Before any district office can be fully linked, some additional programming is required at the central level, software must be fully installed at the district offices, and all IT staff must be trained (6 of 30 staff have been trained to date). It is still planned for the system to "go live" in March 2002, although in the district of Heravora, the unstable political situation may delay implementation.
4. Activity 1b: Construction of New District Offices - Construction of buildings 1-5 is expected to be on schedule and within cost estimates. Building 6 will be completed early, but will be above cost estimates due to heavy rains at the project site in November 2000. The contract for buildings 7-10 was signed March 28, 2001.
5. Component 2: Increasing Access - Rehabilitation of secondary schools is proceeding as planned. Construction of 50 community-managed primary schools is ahead of schedule, as the general contractor's modular design has resulted in efficiencies and economies of scale. Forty schools are complete and 24 of these are already being used.
6. Component 3: Teacher and Principal Development - Courses are proceeding as planned, with the main variance being in the cost of the management training for principals, the price for which was about 10% higher than planned. The training services were procured in accordance with World Bank procedures, with the No Objection received from the Bank Task Team Leader on October 5, 1999.
7. Component 4: Project Management - Costs of project management significantly exceeded the plan during the quarter due to the payment of back-pay to 3 employees whose salary could not be paid in previous months due to contractual delays. Cumulative costs in this component are in line with the plan and the PAD amounts.

ANNEX A Sample I
Page 3 of 8
Forecast: Next6 months
Cash ReceiptsGovernment Funds 24,000 260,000 75,000
IBRD Funds 129,795 623,245 175,000Total Financing 153,795 883,245 250,000
Less: Expenditures by ComponentInstitutional Strengthening 94,695 569,045 185,000
Increasing Access 60,000 220,000 24,251Teacher and Principal Development 2,500 17,450 5,500
Project Management 1,600 6,500 2,952Other (including Loan Fee) - 12,250 12,000
Total Expenditures 158,795 825,245 229,703 Receipts Less Expenditures (5,000) 58,000 20,297
Add: Foreign Exchange Difference (1,000) (14,000) 0Net change in Cash (6,000) 44,000 20,297
Opening Cash Balances
Project Bank Account 2,000 0 4,000 IBRD/IDA Special Account 48,000 0 40,000
Total Opening Cash 50,000 0 44,000Add: Net change in cash (6,000) 44,000 20,297 Net Cash Available 44,000 44,000 64,297
Closing Cash Balances Project Bank Account 4,000 4,000 14,297
IBRD/IDA Special Account 40,000 40,000 50,000Total Closing Cash Balances 44,000 44,000 64,297
- Closing balance of SA: 1 US$= 14.9 APS;
Government of Atlantis: Education Sector Improvement Project
World Bank (IBRD) Loan No. 1234-ATL
- IBRD funds received and any foreign currency expenditures made, are converted at the rate of exchange on the date of the transaction. The weighted average of these rates since project inception is approximately 14.5.
Sources and Uses of Funds
Quarter Cumulative
Notes: /i. The following rates were used for conversion: - Opening balance of SA in Quarter: 1 US$= 14.7 APS;
for the Quarter ended March 31, 2001in Atlantic Pesos (APs) 000's

ANNEX A Sample I
Page 4 of 8
Note: /i The exchange rates applicable to planned expenditures is 15 Aps/1US$. For actual expenditures, foreign currency payments are translated to Aps at the rate in effect on the date of the transaction. See Also the notes to the Sources and Uses of Funds Statement. /ii The items under "Project Activities" are those agreed with the World Bank at the time of appraisal, and as stated in the PAD. /iii Includes office rent, utility bills, office supplies, and other small expenditures /iv This reflects the revisions agreed to during the midterm review of December, 2000.
Quarter Cumulative PAD: Life of Revised Project Component/Activity /ii Planned Actual Variance Planned Actual Variance Project PAD /iv
1. Institutional Strengtheninga. New Decentralized MIS 10,000 5,000 5,000 18,300 12,250 6,050 15,300 18,300b. Construction of District Offices 42,500 54,000 -11,500 220,000 325,000 -105,000 530,000 730,000c. Technical Assistance 40,000 34,500 5,500 220,000 214,000 6,000 452,050 249,050d. Professional Training 100 95 5 1,650 295 1,355 1,650 1,650e. Overseas Fellowships 4,000 1,100 2,900 19,000 17,500 1,500 51,000 51,000Sub-total 96,600 94,695 1,905 478,950 569,045 -90,095 1,050,000 1,050,0002. Increasing Accessa. Secondary Schools Rehabilitation 27,250 25,000 2,250 200,000 95,000 105,000 290,000 300,000b. New Community-Managed Prim. Schools 20,450 35,000 -14,550 100,000 125,000 -25,000 150,000 150,000Sub-total 47,700 60,000 -12,300 300,000 220,000 80,000 440,000 450,0003. Teacher and Principal Developmenta. Teacher Training 1,000 2,500 -1,500 9,200 9,500 -300 23,500 13,500b. Management Training for Principals 1,500 0 1,500 6,800 7,950 -1,150 15,000 15,000Sub-total 2,500 2,500 0 16,000 17,450 -1,450 38,500 28,500
4. Project Management a. Staff Costs 200 850 -650 4,400 4,500 -100 10,000 10,000b. Other /iii 500 750 -250 1,800 2,000 -200 5,000 5,000Sub-total 700 1,600 -900 6,200 6,500 -300 15,000 15,0005. Other (including Loan Fee) 0 0 0 12,000 12,250 -250 12,000 12,000
Total Project Expenditure 147,500 158,795 -11,295 813,150 825,245 -12,095 1,555,500 1,555,500
Government of Atlantis: Education Sector Improvement Project World Bank (IBRD) Loan No. 1234-ATL
Uses of Funds by Project Activity--For the Quarter ended March 31, 2001
(in Atlantic Pesos (APs) 000's) /i

ANNEX A Sample I
Page 5 of 8
Par 1: Units of Output / i Component/ Units of Total CostsActivity No. Project Component/Activity /Output Output APS '000 Output /ii APS '000 Comments
1 Institutional Strengthening Output Cost1d Professional Training
Technical courses 20 1,200 5 160 25% 13% Workshops 15 450 2 55 13% 12%
1e Overseas Fellowships Masters Degree Program 10 6,000 4 2,800 40% 47% Doctorate Degree Program 25 45,000 5 10,000 20% 22%
3 Teacher and Principal Development3a Teacher Training
Refresher courses 15 4,500 10 2,500 67% 56% Workshops 30 9,000 22 7,000 73% 78%
3b Management Training for Principals
School Management Courses 20 15,000 8 7,950 40% 53% See discussionNotes:
Government of Atlantis: Education Sector Improvement Project
World Bank (IBRD) Loan No. 1234-ATLPhysical Progress Report
/ i This schedule includes certain non-construction activities that can be measured by units of output. Construction activities and major research projects are included in Part 2 of these Physical Progress Reports.
Cumulative to Date Actual as a % of total planned for project life
(Actual) Units of Costs
For the Quarter ending March 31, 2001
/ii Includes only completed workshops, courses, fellowships, etc. Therefore costs reported here will in some cases appear to be high relative to outputs, since the costs include partially completed items.
Total for Project Life

ANNEX A Sample I
Page 6 of 8
Component/ Activity No. Project Component/Activity /Output
Cost to date as a % of Planned Total Cost /1
Comments
Cost (APS '000) Completion Date Cost (APS '000)
Output /2
1 Institutional Strengthening1b New District Education Offices
Districts 1-2: Buildings A&B 140,000 10/31/2002 120,000 80% completed 86% Districst 3-5: Buildings C, D & E 250,000 6/30/2003 100,000 45% completed 40%
District 6: Building F 100,000 12/31/2001 105,000 90% completed 105%expected completion June '01
Districts 7-10: Building G, H, I & J 240,000 1/31/2004 0 Contract Signed 0% contract signed 3/28/01
1c Technical Assistance
Physical Facilities Planning 150,000 10/13/2000 160,000 100%
Completed 107%
Design & Dev. of Academic Program for: - Agricultural Studies 30,050 6/30/2002 14,000 40% Completed 47% - Conflict Resolution 69,000 6/30/2002 60,000 80% Completed 87%
2 Education Qualitycompletion date now 9/30/03
2a Sec. Schools Rehabilitation (20 schools)
300,000 6/30/2003 55,000 5 completed 27%
25,000 11 in progress average 22% complete
2b Community-managed Primary Schools 150,000 6/30/2003 120,250 40 completed 83% ahead of schedule
(50 one and two-room schools) 4,750 2 in progressNotes:
/2 Based on a combination of certification from contractors and inspection of works, goods, or services by project management. Where multiple units are involved, the Output figure is a weighted average. This calculation was discussed and agreed with the World Bank during project appraisal.
PART 2: CONTRACT/ WORK PROGRESS
Government of Atlantis: Education Sector Improvement Project
World Bank (IBRD) Loan Number 1234-ATLPhysical Progress Report
/1 Costs to date represent the cash payments made to contractors. Since mobilization advances typically are for 20% of the contract amount, costs are generally overstated for projects in the early stages of completion. Since 10% of contracts are maintained as retention amounts, costs of contracts that are near 100% completion may be slightly understated.
For the Quarter ending March 31, 2001
Progress to dateOriginal Plan to Completion

ANNEX A Sample I
Page 7 of 8
PROCUREMENT REPORTS Government of Atlantis Atlantis Education Sector Improvement Project World Bank Loan No: 1234-ATL Procurement Status as of March 31, 2001 Part I, A Descriptive Summary: The procurement function has improved in the last six months, but there have been some particular implementation problems, as explained below.
1. Procurement staffing : An additional person with works experience has been hired by the PIU, and thus the project is fully staffed in the procurement function, with two professional staff and one assistant. The new staff member will attend the Bank-sponsored Procurement of Works training in October. He will be responsible for all refurbishing contracts of the IT centers.
2. Complaints by bidders, consultants, and end users: Complaints were received from two bidders for the refurbishing of the Main IT center. Both bidders complained that the financial working capital requirement stated in the bid document was too high, and even though they are fully capable of performing the contract and have done so in the past, they will not be able to participate in the competition as they do not meet the criteria. We have asked the Bank to reconsider this requirement.
3. Contract amendments, variations orders: In buildings B and C, due to the requirements of the District Fire Marshal, a sprinkler system has to be installed and some design changes are being made to increase the number of the Fire exit doors. This will be covered by an amendment to the contract.
4. Unsatisfactory performance by contractors/suppliers/consultants: The installation of the Education Information System is behind schedule. This will affect the overall implementation of the project. The supplier is blaming the consultant for system design, and the client for long delays in decision making. This is a major concern and will be discussed during the upcoming visit of the Bank’s Procurement Specialist.
5. Disputes which may lead to contractual claims, cancellation of contracts, arbitration or legal remedies: The issue stated in ‘4’ above is a potential contractual problem and may lead to claims by the contractor.
Part II, Tables (format as agreed during project preparation) :
Table 1. Procurement of Goods Table 2. Procurement of Works Table 3. Selection of Consultants

ANNEX A Sample I
Page 8 of 8
ATLANTIS EDUCATION SECTOR IMPROVEMENT PROJECT: PROCUREMENT MONITORING TABLES
TABLE 1: Procurement of Goods (contracts not subject to prior review but above US$ 25,000)------------ TIME SCHEDULE (Dates) ------------
REF# Description Estimate (US$) Procm'tStart Doc
Prep. Advertise Bid Invitation Bid Opening Evaluation Contract Final Contract Amt Supplier Method Complete Signed delivery US$ Name
23132 Software & install 60,000 NCB Plan 6/2/2000 6/20/2000 7/5/2000 9/10/2000 10/5/2000 10/30/2000 11/30/2000
Actual 6/15/2000 6/30/2000 7/20/2000 9/20/2000 10/15/2000 11/5/2000 12/30/2000 52,000Sell Computer Inc.
23452 3 Servers & install 249,000 NCB Plan 7/3/2000 8/5/2000 9/10/2000 10/15/2000 11/5/2000 11/30/2000 1/10/2001
Actual 6/25/2000 7/30/2000 9/15/2000 10/25/2000 11/20/2000 12/14/2000 1/30/2001 250,000DVW Traders Ltd.
23453 computers & install 220,000 NCB Plan 8/5/2000 9/10/2000 10/15/2000 11/30/2000 12/25/2000 1/20/2001 3/5/2001
Actual 8/5/2000 9/15/2000 10/20/2000 12/5/2000 12/30/2000 1/20/2001 3/10/2001 210,000 MW Computers
23498 2 servers & install 150,000 IS Plan 5/3/2001 6/15/2001 6/30/2001 7/25/2001 TABLE 2: Procurement of Works (not subject to prior review but above US$ 100,000)
------------ TIME SCHEDULE (Dates) ------------REF# Description Estimate (US$) Procm't Start Doc Advertise Bid Invitation Bid Evaluation Contract Complete Contract Amt Contractor
Method Preparation Opening Complete Signed Construction US$ Name32567 District7-10, Bldg I 1,250,000 NCB Plan 7/5/2000 8/10/2000 9/20/2000 11/30/2000 1/25/2001 3/28/2001 1/3/2004
Actual 8/15/2000 9/30/2000 10/15/2000 12/30/2000 2/15/2001 3/28/2001 1,350,000CCC Construction
32589 2 Sec. Schools Rehab 760,000 NCB Plan 6/10/2002 7/25/2002 9/15/2002 11/25/2002 12/30/2002 1/15/2003 6/30/2003Actual
32591 District3-5, Bldg E 1,350,000 NCB Plan 6/10/2002 7/25/2002 9/15/2002 11/25/2002 12/30/2002 1/15/2003 6/30/2003Actual
32595 5 Primary Schools 1,250,000 NCB Plan 6/10/2002 7/25/2002 9/15/2002 11/25/2002 12/30/2002 1/15/2003 6/30/2003Actual
TABLE 3: Selection of Consultants (not subject to prior review but above US$25,000) /I------------ TIME SCHEDULE (Dates) ------------
REF# Description Estimate (US$) Selection Advertise Start RFP Doc Send out Tech Prop T Evaluation Final Eval Contract Complete Contract Amt Cons/FirmMethod Preparation RFP Opening Complete Complete Signed Assignment US$ Name
42510 6 - IT Staff trained 50,000 QBS Plan 8/5/2000 7/30/2000 9/5/2000 10/15/2000 11/20/2000 12/15/2000 12/25/2000 1/30/2001Actual 8/5/2000 7/30/2000 9/5/2000 10/15/2000 11/20/2000 12/15/2000 12/25/2000 1/30/2001 50,000 GBM
42650 Professional Trng 51,000 QBS Plan 9/10/2000 8/15/2000 10/15/2000 11/25/2000 12/20/2000 1/18/2001 2/5/2001 4/30/2001Actual 10/10/2000 9/12/2000 10/17/2000 11/29/2000 12/30/2000 1/25/2001 2/15/2001 52,000 B. Andersen
42659 O/seas Fellowship 45,000 IndividualPlan 9/20/2000 10/25/2000 11/30/2000 12/10/2000 12/30/2001Actual 9/15/2000 10/30/2000 11/30/2000 12/14/2000 45,000 Mr. Xxxx
42660 Teacher Training 180,000 QCBS Plan 10/15/2000 9/25/2000 11/25/2000 1/10/2001 1/30/2001 2/20/2001 2/28/2001 4/30/2001Actual 10/15/2000 9/30/2000 11/30/2000 1/15/2001 2/15/2001 2/28/2001 3/5/2001 175,000 Trainers Inc.
Notes: 1. Prior review thresholds: Goods US$250,000, Works US$1.5 million, Consultants $200,000 for firms and $50,000 for individuals. 2. Exchange rate used for contract expected to be in local currency: US$1 = 14.5 Aps.

ANNEX A Sample II
Page 1 of 9
FINANCIAL MONITORING REPORTS—SAMPLE 2
Appletonia Urban Transport II
Contents
1. Discussion of Project Progress (including procurement issues)
2. Statement of Receipts and Payments
3. Uses of Funds by Project Activities
4. Output Monitoring (Physical Progress) Report
5. Procurement Status Report - Goods and Works
[This example illustrates an infrastructure—intensive project, in which most expenditures are for civil works and goods. The borrower chose to show the Sources and Uses of Funds Statement by disbursement category, broken down further by type of expenditure. Expenditures by component and activity are shown in the detail schedule. Physical progress reporting is more detailed than in most projects, and provides a clear linkage to project activities. Most of the expenditures are via large contracts and thus much of the dollar-value of procurement is subject to prior review by the Bank.]

ANNEX A Sample II
Page 2 of 9
APPLETONIA URBAN TRANSPORT II:
FINANCIAL MONITORING REPORT (FMR): APRIL 1—JUNE 30, 2001
DISCUSSION OF PROJECT PROGRESS
FMR as part of Progress Reporting
1. The attached reports provide information on the progress of the project in terms of financial activity, key output measures, and the status of procurement for contracts below the Bank’s prior review thresholds.
Comments on information in this FMR (including explanation of variances)
2. The following is a brief discussion of the project components, to provide further information on the tables which follow:
• Component 1: Road Infrastructure—Road works began a few months later than planned, but are now fully underway. Quality is considered to be satisfactory. The report from GSV Consultants on the first phase of the works has been completed in draft and will be finalized by 31 August, for discussion during the Bank’s planned mission of mid-September.
• Component 2: Traffic Management—Activities under this component are proceeding generally as planned. However, costs are above plan for the Traffic Signal System, as a result of the contract price obtained during the procurement process. Institutional strengthening has not yet commenced, as the Traffic Management Bureau has not yet been formally established.
• Component 3: Public Transport—This component is expected to be completed within the anticipated costs, but 26 months behind schedule, as explained in previous FMRs.
• Component 4: Road Maintenance—The Road Maintenance Commission was established on 27 April, 2001. Maintenance activities have begun on the SandSpring and PuntaFlaca roads.
• Component 5: Environmental Protection—The key equipment for this component has been procured, and will be distributed to the appropriate authorities. The report by Enviro Consultants LLC of 25 May, 2001 provides further details of the progress of this component.
• Component 6: Technical Assistance—Training and study tours under this component are proceeding faster than originally planned, and are within original cost estimates. They are expected to conclude in July 2001 (see Output Monitoring Report).

ANNEX A Sample II
Page 3 of 9
Procurement
3. Procurement capacity of the project unit has improved since the last report. Two of the procurement staff attended the procurement workshop conducted in Appletonia by the Bank and are now able to prepare evaluation reports. No complaints were received from bidders during the reporting period.
4. Two variation orders were issued to the site clearance contractor, to include some areas that are to be used for temporary office facilities.
5. Negotiations with the consultant who has been selected for “Institutional Strengthening” component are not progressing well. This component is already behind schedule and it may be necessary to terminate the negotiations and invite the firm which was ranked second. This issue has been mentioned to the Bank and will be discussed in the upcoming supervision mission.

ANNEX A Sample II
Page 4 of 9
ReceiptsIDA Funds 264,857 659,268 Government Funds 72,185 139,894 Frutonia Development Bank 50,329 50,329 Total Receipts 387,371 849,491
PaymentsCivil WorksSite clearance and preparation 42,175 86,510 Construction of road works 153,764 315,401 Construction of railway overpass and underpass 33,765 69,259 Other 35,352 80,948
265,056 552,118 GoodsRoad maintenance equipment 21,857 44,833 Area traffic control equipment 35,629 73,082 Environmental monitoring equipment 55,839 114,537 IT equipment 6,825 13,999 Other equipment and materials 12,589 17,389
132,739 263,841 Consultants and trainingTraining and study tours 5,882 12,065 Consultants 7,893 16,190
13,775 28,255 Total Payments 411,570 844,214
Excess of Receipts over Payments (24,199) 5,277 Opening cash balancesProject Bank Account 25,879 - IBRD/IDA Special Account 3,597 -
29,476 Net Available Cash 5,277 5,277 Comprising:Project Bank Account 2,698 2,698 IBRD/IDA Special Account 2,579 2,579 Total 5,277 5,277 Exchange Rate: 1 AR = 10 US dollars
Quarter Cumulative
GOVERNMENT OF THE COMMONWEALTH OF APPLETONIA
CREDIT NO. 4321-APPSTATEMENT OF RECEIPTS AND PAYMENTS
URBAN TRANSPORT PROJECT II
For the Quarter ending 30 June, 2001in Appletonian Rupees (ARs)

ANNEX A Sample II
Page 5 of 9
PAD2.6882 Note Current Cumulative Current Cumulative Current Cumulative Life of
Project Components and Activities Quarter To-Date Quarter To-Date Quarter To-Date Project
1. Road Infrastructure 256,636 434,136 315,000 517,500 58,364 83,364 1,080,000 1,192,500 a. Road works 219,996 362,879 275,000 450,000 55,004 87,121 950,000 1,050,000 b. Railway overpass and underpass 34,218 57,831 30,000 50,000 (4,218) (7,831) 100,000 110,000 c. Interchanges 2,422 13,426 10,000 17,500 7,578 4,074 30,000 32,500 2. Traffic Management 41,097 70,423 45,000 90,000 3,903 19,577 201,500 209,000a. Bicycle system improvement 9,524 17,814 12,500 25,000 2,976 7,186 50,000 52,500 b. Pedestrian system improvement 1,194 3,571 2,500 5,000 1,306 1,429 17,500 20,000 c. Traffic facilities on primary roads 13,911 20,845 10,000 20,000 (3,911) (845) 37,500 35,000 d. Traffic signal system 10,022 15,298 7,500 17,500 (2,522) 2,202 27,500 40,000 e. Parking management 6,446 12,895 5,000 15,000 (1,446) 2,105 32,500 25,000 f. Railway station forecourt improvement - - - - - - 18,500 18,500 g. Institutional strengthening - - 7,500 7,500 7,500 7,500 18,000 18,000 3. Public Transport - 91,607 - 98,500 - 6,893 183,000 183,000a. Bus terminal reconstruction - 65,817 - 70,000 - 4,183 125,000 125,000 b. Bus stop reconstruction - 20,364 - 22,500 - 2,136 48,000 48,000 c. Computer management system - 5,426 - 6,000 - 574 10,000 10,000 4. Road Maintenance 34,120 118,153 39,000 157,500 4,880 39,347 255,000 255,000a. Maintenance of existing roads 25,618 69,312 30,000 100,000 4,382 30,688 175,000 175,000b. Road maintenance management system improvement 5,487 23,478 6,000 30,000 513 6,522 50,000 50,000 c. Design/supervision/management 3,015 25,363 3,000 27,500 (15) 2,137 30,000 30,000 5. Environment Protection 70,588 114,202 75,000 120,000 4,412 5,798 157,500 157,500a. Environment monitoring equipment provision 23,818 57,619 25,000 60,000 1,182 2,381 75,000 80,000 b. Noise mitigation 17,856 23,019 20,000 25,000 2,144 1,981 35,000 32,500 c. Pollution control facilities 28,914 33,564 30,000 35,000 1,086 1,436 47,500 45,000 6. Technical Assistance 9,129 21,119 7,500 19,250 (1,629) (1,869) 26,000 26,000a. Overseas training 5,126 12,875 4,000 12,000 (1,126) (875) 16,000 16,000 b. Local training 756 1,347 500 1,250 (256) (97) 2,500 2,500 c. Research and studies 3,247 6,897 3,000 6,000 (247) (897) 7,500 7,500 TOTAL PROJECT EXPENDITURE 411,570 849,640 481,500 1,002,750 69,930 153,110 1,903,000 2,023,000
* This column reflects a re-costing of the project done in January 2001.
Exchange Rate: 1 AR = 10 US dollars
Revised Life of Project*
VARIANCE
in Appletonian Rupees (ARs)
ACTUAL PLANNED
GOVERNMENT OF THE COMMONWEALTH OF APPLETONIA
CREDIT NO. 4321-APPUses of Funds by Project Activity for the Quarter ending 30 June, 2001
URBAN TRANSPORT PROJECT II

ANNEX A Sample II
Page 6 of 9
No Description Actual Planned Actual Planned Actual as % of Plan
Total Cost Comple-tion Date
Total Cost Completion Date
1 Road Infrastructurea. Road works
Design 90% 90% 35,819 36,000 99% 40,000 Sep-01 40,000 Mar-00Civil Works - site clearance 75% 85% 256,817 275,000 93% 325,000 Sep-02 300,000 Jan-01Civil Works - construction 15% 25% 70,243 126,000 56% 555,000 Aug-02 505,000 Dec-00Civil Works - finishing 0% 10% 0 13,000 0% 130,000 Apr-02 105,000 Oct-00
b. Railway overpass and underpassDesign 90% 90% 15,629 16,000 98% 17,000 Oct-01 17,000 Feb-00Civil Works 40% 35% 42,202 38,500 110% 93,000 May-02 83,000 Aug-00
c. InterchangesDesign 100% 100% 4,219 4,250 99% 4,250 Dec-00 4,250 Feb-00Civil Works 30% 50% 9,207 13,250 69% 28,250 Feb-02 25,750 Sept-00
2 Traffic Managementa Bicycle system improvement 35% 50% 17,814 25,000 71% 52,500 Mar-02 50,000 Dec-99b Pedestrian system improvement 25% 12.50% 3,571 5,000 71% 20,000 Mar-02 17,500 Dec-99c Traffic facilities on primary roads 60% 55% 20,845 20,000 104% 35,000 Aug-01 37,500 Mar-00d Traffic signal system 55% 60% 15,298 17,500 87% 40,000 Dec-01 27,500 Mar-00e Parking management 40% 45% 12,895 15,000 86% 25,000 Mar-02 32,500 Mar-00f Railway forecourt - - - - 18,500 Mar-02 18,500 Apr-00g Institutional strengthening - 40% - 7,500 0% 18,000 Mar-02 18,000 Jul-00
3 Public Transporta Bus terminal reconstruction 50% 55% 65,817 70,000 94% 125,000 Mar-02 125,000 Jan-00b Bus stop reconstruction 40% 40% 20,364 22,500 91% 48,000 Mar-02 48,000 Jan-00c Computer management system 50% 60% 5,426 6,000 90% 10,000 Mar-02 10,000 Jan-00
4 Road Maintenancea Maintenance of existing roads 40% 60% 69,312 100,000 69% 175,000 Mar-02 175,000 Jun-00b Management system improvement 50% 60% 23,478 30,000 78% 50,000 Mar-02 50,000 Jun-00c Design/supervision/management 75% 80% 25,363 27,500 92% 30,000 Mar-02 30,000 Jun-00
5 Environment Protectiona Equipment provision 68% 72% 57,619 60,000 96% 80,000 Sep-02 75,000 Sep-02b Noise mitigation 65% 65% 23,019 25,000 92% 32,500 Sep-02 35,000 Sep-02c Pollution control 67% 67% 33,564 35,000 96% 45,000 Sep-02 47,500 Sep-02
6 Technical Assistancea Overseas training 6 tours 5 tours 12,875 12,000 107% 16,000 Sep-02 16,000 Jul-01b Local training 350 hours 300 hours 1,347 1,250 108% 2,500 Sep-02 2,500 Jul-01c Research and studies 100% 80% 6,897 6,000 115% 7,500 May-01 7,500 Jul-01
/I Costs as shown in the Uses of Funds statement
Revised OriginalProject Activity Physical Progress to Date Cost to Date /I Plan to Completion
in Appletonian Rupees (ARs)
GOVERNMENT OF THE COMMONWEALTH OF APPLETONIAURBAN TRANSPORT PROJECT II
CREDIT NO. 4321-APP
as at 30 June, 2001OUTPUT MONITORING REPORT

ANNEX A Sample II
Page 7 of 9
APPLETONIA: URBAN HIGHWAY IITABLE 1: Procurement of Goods (not subject to prior review)
------------ TIME SCHEDULE (Dates) ------------
REF# Description Estimate (US$) Procm'tStart Doc
Prep. Advertise Bid Invitation Bid Opening Evaluation Contract Final Contract Amt Supplier Method Complete Signed delivery AR Name
Computers, printers 50,000 NS Plan 7/5/2000 9/10/2000 10/5/2000 10/30/2000 11/30/2000Actual 7/20/2000 9/20/2000 10/15/2000 11/5/2000 12/10/2000 6,000 xxx
Software and hardware 75,000 NS Plan 9/10/2001 10/15/2001 11/5/2001 11/30/2001 1/10/2002Actual
Database system 100,000 NCB Plan 8/5/2001 9/10/2001 10/15/2001 11/30/2001 12/25/2001 1/20/2002 3/5/2002Actual
Prior review required for all contracts above US$250,000Exchange rate US$10 = AR 1

ANNEX A Sample II
Page 8 of 9
TABLE 2: Procurement of Works (not subject to prior review)
------------ TIME SCHEDULE (Dates) ------------REF# Description Estimate (US$) Procm't Start Doc Advertise Bid Invitation Bid Evaluation Contract Complete Contract Amt Contractor
Method Preparation Opening Complete Signed Construction US$ Name
Plan 7/5/2000 8/10/2000 9/20/2000 11/30/2000 1/25/2001 3/28/2001 4/20/2001Site Clrearance-Road 75,000 NCB Actual 8/15/2000 9/30/2000 10/15/2000 12/30/2000 2/15/2001 3/28/2001 75,000 CCC Construction
Land finishing-Road 100,000 NCB Plan 6/10/2002 7/25/2002 8/15/2002 9/25/2002 10/20/2002 11/5/2002 11/30/2002Actual
Site Clrearance-Rail 120,000 NCB Plan 7/5/2000 8/10/2000 9/20/2000 11/30/2000 1/25/2001 3/28/2001 4/20/2001 125,000 XXX constructionActual 8/15/2000 9/30/2000 10/15/2000 12/30/2000 2/15/2001 3/28/2001 4/15/2001
Land finishing-Rail 175,000 NCB Plan 6/10/2002 7/25/2002 8/15/2002 9/25/2002 10/20/2002 11/5/2002 11/30/2002Actual
PlanActual
Prior Review required for all contracts above US$ 0.5 millionExchange rate US$10 = AR 1

ANNEX A Sample II
Page 9 of 9
APPLETONIA: URBAN HIGHWAY II
TABLE 3: Selection of Consultants (not subject to prior review)------------ TIME SCHEDULE (Dates) ------------
REF# Description Estimate (US$) Selection Advertise Start RFP Doc Send out Tech Prop T Evaluation Final Eval Contract Complete Contract Amt Cons/FirmMethod Preparation RFP Opening Complete Complete Signed Assignment US$ Name
Traffic Advisor QBS 150,000 Plan 8/5/2000 7/30/2000 9/5/2000 10/15/2000 11/20/2000 12/15/2000 1/15/2001 6/30/2001Actual 8/5/2000 7/30/2000 9/15/2000 10/30/2000 11/30/2000 12/30/2000 1/25/2001 150,000 ABC Advisors
O/Sea Training INDIVIDUAL 50,000 Plan 8/15/2001 10/15/2001 1/18/2002 2/5/2002 7/30/2002Actual
Environtal Advisor QBS 180,000 Plan 9/10/2000 9/20/2000 10/25/2000 11/25/2000 12/15/2000 12/25/2000 12/30/2000 12/30/2001Actual 9/10/2000 9/15/2000 10/30/2000 11/30/2000 12/15/2000 12/10/2000 12/15/2000 12/30/2001 180,000 Env Management
Researcher INDIVIDUAL 25,000 Plan 9/25/2000 11/25/2000 2/20/2001 2/28/2001 4/30/2001Actual 9/30/2000 11/30/2000 2/28/2001 3/5/2001 5/15/2001 25,000 Ms. YYY
Prior review required for firm contracts above $200,000 and individual above $50,000Exchange rate US$1 = AR 1

ANNEX A Sample III Page 1 of 7
FINANCIAL MONITORING REPORTS—SAMPLE 3
PACIFICA SOCIAL SAFETY NET PROJECT
Contents
1. Discussion of Project Progress
2. Sources and Uses of Funds Statement
3. Uses of Funds by Expenditure Type
4. Output Monitoring Report
5. Procurement Report
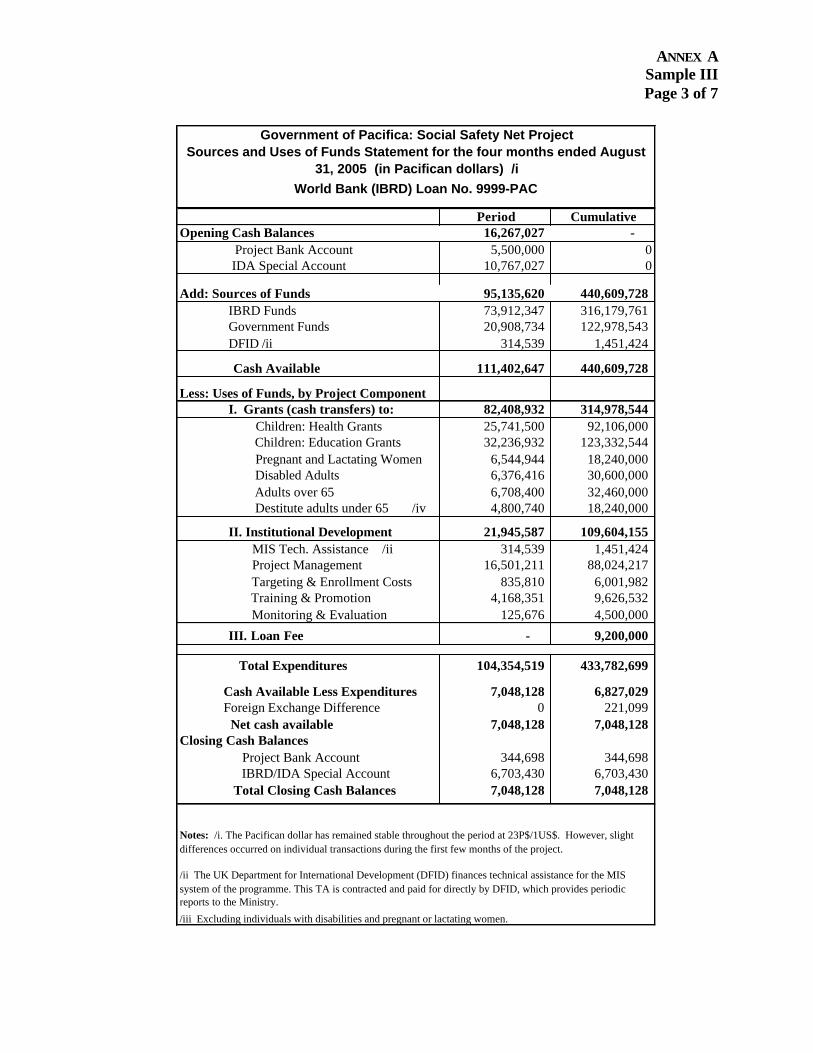
[This illustrates a project whose disbursements are primarily cash transfers to poor families with children, pregnant mothers, disabled adults, and senior citizens. The project activities are the types of grants and the types of institutional development, including project management. The Uses of Funds schedule is by disbursement category, with a breakdown of costs to especia lly show the details of project management expenditures. The grants are the heart of the project and thus the physical progress report focuses on the number of beneficiaries and average amount of the cash transfers made, compared to target amounts. Procurement is minimal, as the grants are paid based on beneficiary eligibility. Most contracts are for services and there are no construction activities.]

ANNEX A Sample III Page 2 of 7
PACIFICA SOCIAL SAFETY NET PROJECT
FINANCIAL MONITORING REPORT (FMR): MAY - AUGUST 2005
DISCUSSION OF PROJECT PROGRESS
FMR as part of progress reporting
1. The attached reports provide information on the progress of the project in terms of financial activity, key output measures, and procurement. They form part of overall project progress reporting which also includes:
• A technical audit of the grant program; and
• A report on all key performance indicators.
2. The latter two reports are produced every four months, which is the same frequency as the FMR. In addition, certain information is produced annually and for the Bank's midterm review of the project, which is scheduled for September, 2006. The most recent annual report was prepared as of March 31, 2005.
Comments on the FMR
3. The financial and output reports show that project progress is accelerating. It is expected that in the next period, targets for the number of grant recipients will be met, except for Health grants to children, which have been reduced due to non-compliance with the program’s requirements. This issue will be discussed with the World Bank mission planned for early December 2005.
4. Administrative costs relative to cash transfers have been high due to the slowness in fully implementing some aspects of the program, and because MIS and other equipment costs are relatively high at the beginning of the program. This ratio is expected to decline, although individual periods may be high if they include equipment purchases. This is due to the use of the cash basis of accounting which does not spread the cost of asset purchases over the life of the project. The cumulative figures in the Output Monitoring report provide a more realistic picture of the trend of administrative costs.
Explanation of Largest Variances (see Uses of Funds Report)
5. Processing Equipment has been purchased on schedule, although at a slightly higher price than planned, since an additional district office has been added. MIS equipment purchases have been below expected cost. Expenditures on consultants' services are below plan because the program began later than planned, and because some consultants were not immediately available. In addition, it was decided that local office staff could handle some tasks that had previously been allocated to consultants. Some of these factors also reduced the amount of training required. However, training is expected to accelerate as more consultants come on board.
ANNEX A Sample III Page 3 of 7
Period CumulativeOpening Cash Balances 16,267,027 -
Project Bank Account 5,500,000 0 IDA Special Account 10,767,027 0
Add: Sources of Funds 95,135,620 440,609,728IBRD Funds 73,912,347 316,179,761Government Funds 20,908,734 122,978,543DFID /ii 314,539 1,451,424
Cash Available 111,402,647 440,609,728
Less: Uses of Funds, by Project ComponentI. Grants (cash transfers) to: 82,408,932 314,978,544 Children: Health Grants 25,741,500 92,106,000 Children: Education Grants 32,236,932 123,332,544 Pregnant and Lactating Women 6,544,944 18,240,000 Disabled Adults 6,376,416 30,600,000 Adults over 65 6,708,400 32,460,000 Destitute adults under 65 /iv 4,800,740 18,240,000
II. Institutional Development 21,945,587 109,604,155 MIS Tech. Assistance /ii 314,539 1,451,424 Project Management 16,501,211 88,024,217 Targeting & Enrollment Costs 835,810 6,001,982 Training & Promotion 4,168,351 9,626,532 Monitoring & Evaluation 125,676 4,500,000
III. Loan Fee - 9,200,000
Total Expenditures 104,354,519 433,782,699
Cash Available Less Expenditures 7,048,128 6,827,029 Foreign Exchange Difference 0 221,099 Net cash available 7,048,128 7,048,128
Closing Cash Balances Project Bank Account 344,698 344,698 IBRD/IDA Special Account 6,703,430 6,703,430
Total Closing Cash Balances 7,048,128 7,048,128
Notes: /i. The Pacifican dollar has remained stable throughout the period at 23P$/1US$. However, slight differences occurred on individual transactions during the first few months of the project.
/ii The UK Department for International Development (DFID) finances technical assistance for the MIS system of the programme. This TA is contracted and paid for directly by DFID, which provides periodic reports to the Ministry.
/iii Excluding individuals with disabilities and pregnant or lactating women.
Government of Pacifica: Social Safety Net ProjectSources and Uses of Funds Statement for the four months ended August
31, 2005 (in Pacifican dollars) /iWorld Bank (IBRD) Loan No. 9999-PAC

ANNEX A Sample III Page 4 of 7
Period Cumulative PADDisb. Categories and Expend. Type /ii Planned Actual Variance Planned Actual Variance Project Life
1. Goods
Vehicles and Equipment 1,500,000 1,436,543 63,457 11,960,000 10,343,567 1,616,433 11,960,000 Promotional Materials 138,000 153,423 (15,423) 552,000 965,432 (413,432) 1,380,000
Local Office Materials 805,000 787,547 17,453 3,220,000 2,643,336 576,664 8,050,000 Enrollment Materials 161,000 49,898 111,102 644,000 756,423 (112,423) 1,610,000
Payment Forms 1,058,000 785,912 272,088 4,232,000 5,245,559 (1,013,559) 10,580,000 Training materials 1,840,000 1,543,267 296,733 7,360,000 2,433,321 4,926,679 18,400,000
MIS System Hardware and Software 4,500,000 2,547,834 1,952,166 21,900,000 11,322,431 10,577,569 23,920,000 Processing Machinery 2,398,765 998,785 1,399,980 22,300,000 23,432,876 (1,132,876) 32,890,000
Sub-total 12,400,765 8,303,209 4,097,556 72,168,000 57,142,945 15,025,055 108,790,000
2. Grants As detailed in Sources & Uses Stmt. 97,650,000 82,408,932 15,241,068 390,600,000 314,978,544 75,621,456 1,490,630,000
Sub-total 97,650,000 82,408,932 15,241,068 390,600,000 314,978,544 75,621,456 1,490,630,000
3. Consultant Services
Central Unit Consultants 1,733,625 1,645,736 87,889 6,934,500 7,234,569 (300,069) 15,410,000 Local Office Consultants 4,347,000 3,564,901 782,099 17,388,000 14,657,437 2,730,563 43,470,000
Monitoring and Evaluation 1,518,000 125,676 1,392,324 6,072,000 4,500,000 1,572,000 15,180,000 MIS Technical Assistance 462,875 314,539 148,336 1,851,500 1,451,424 400,076 5,290,000
Training Services 1,219,000 1,132,114 86,886 4,876,000 2,345,674 2,530,326 12,190,000 Workshops 552,000 219,658 332,342 2,208,000 1,238,769 969,231 5,520,000
Targeting 1,840,000 3,589,885 (1,749,885) 7,360,000 9,567,883 (2,207,883) 18,400,000 Enrollment Services 1,219,000 989,646 229,354 4,876,000 3,590,990 1,285,010 12,190,000 Transaction Fees 2,425,806 2,060,223 365,583 9,703,225 7,874,464 1,828,761 37,030,000
Sub-total 15,317,306 13,642,378 1,674,928 61,269,225 52,461,210 8,808,015 164,680,000 4. Loan Fee
As charged at loan effectiveness 0 0 0 9,200,000 9,200,000 0 9,200,000Sub-total 0 0 0 9,200,000 9,200,000 0 9,200,000
Total Project Expenditure 125,368,071 104,354,519 21,013,552 533,237,225 433,782,699 99,454,526 1,773,300,000
/ii As shown in Annex 3 of the Project Appraisal Document (PAD).
Notes: /I See note /I in the Sources and Uses of Funds statement.
Government of Pacifica
World Bank Loan No. 9999-PAC
for the four months ended August 31, 2005 (in Pacifican dollars) /I
Uses of Funds by Category and Expenditure Type
Social Safety Net Project

ANNEX A Sample III Page 5 of 7
Indicator Total Average Actual Target Actual Target Payments Payment Period To Date
/ii /iii 1. Average number of children receiving transfers every 2 months 137,910 160,000 128,944 160,000 215,438,544 417 (22,090) (31,056) - Health Grants 65,500 80,000 59,500 80,000 92,106,000 387 (14,500) (20,500) - Education Grants 72,410 80,000 69,444 80,000 123,332,544 444 (7,590) (10,556)2. Average number of eligible adults receiving transfers regularly every 2 months 50,000 57,000 60,000 57,000 99,540,000 498 (7,000) 3,000 - Pregnant and Lactating Women 14,448 17,000 10,000 17,000 18,240,000 456 (2,552) (7,000) - Disabled adults 12,552 13,000 15,000 13,000 30,600,000 510 (448) 2,000 - Adults over 65 12,400 12,500 15,000 12,500 32,460,000 541 (100) 2,500 - Destitute adults under 65 /v 10,600 14,500 10,000 14,500 18,240,000 456 (3,900) (4,500)
3. Administrative costs as a percentage of overall costs /vi 21.0% 15.0% 18.6% 15.0% N/A N/A N/A N/A
Notes: /i: This report provides activity information for the project from inception to the latest reporting date. For a discussion of when and how to use this report, see the Bank's FMR Guidelines and the program's Operational Manual. /ii As reported in the Sources and Uses of Funds statement. /iii Average Payment is equal to the total cumulative cost divided by the total number of beneficiary payments (average number of beneficiaries x the number of cycles paid) for the relevant grant category. /iv As shown in the financial reports, the exchange rate is 23 Pacifican dollars per 1US$. /v. Excluding individuals with disabilities and pregnant or lactating women. /vi. Institutional Development costs as a percentage of total costs (excluding Loan Fee), as shown in the Sources and Uses of Funds Statement.
Government of Pacifica
Output Monitoring Report World Bank Loan No. 9999-PAC
Period Project to date Variance in # of beneficiaries
Social Safety Net Project
for the period May 1 - August 31, 2005(in number of recipients and Pacifican dollars) /iv

ANNEX A Sample III Page 6 of 7
GOVERNMENT OF PACIFICA: SOCIAL SAFETY NET PROJECT
WORLD BANK LOAN NO: 9999-PAC: PROCUREMENT STATUS AS OF AUGUST 31, 2005
Part I: Descriptive Summary
1. All procurement relates to Goods and Consultants, and most is subject to prior review by the World Bank. Bank-financed contracts that are not subject to prior review but whose (expected or actual) value is above US$25,000, are included in the attached tables.
2. Procurement staffing : The project continues to operate with a Procurement Specialist and Procurement Assistant. An international specialist has provided support for organizing the procurement function—her assignment was completed at the end of 2004.
3. Complaints by bidders, consultants, and end users : There are no outstanding complaints.
4. Contract amendments, variations orders: The contract for the purchase of payment forms has been increased by 8% due to the international increase in paper costs. This is further discussed in the last World Bank Aide Memoire, dated August 14, 2005.
5. Unsatisfactory performance by contractors/suppliers/consultants : The materials provided for training of district office staff in the use of the MIS system, were not considered satisfactory. The contractor has agreed to improve them per our suggestions, at no additional cost.
6. Disputes which may lead to contractual claims, cancellation of contracts, arbitration or legal remedies: None noted.
Part II: Tables (format as agreed during project preparation):
Table 1. Procurement of Goods Table 2. Selection of Consultants

ANNEX A Sample III Page 7 of 7
PACIFICA SOCIAL SAFETY NET PROJECT: PROCUREMENT MONITORING TABLES
As of August 31, 2005
TABLE 1: Procurement of Goods (contracts not subject to prior review but above US$ 25,000)------------ TIME SCHEDULE (Dates) ------------
REF# Description Estimate (US$) Procm't Start Doc Prep. Advertise Bid Invitation Bid Opening Evaluation Contract Final Contract Amt Supplier Method Complete Signed delivery US$ Name
G04 12 personal computers 60,000 NCB Plan 7/2/2004 7/24/2004 8/13/2004 10/2/2004 10/26/2004 11/5/2004 11/30/2004Actual 7/15/2004 7/26/2004 8/17/2004 10/14/2004 10/31/2004 11/30/2004 12/30/2004 52,000 ABC Computer
G07 3 Servers & install 129,000 NCB Plan 7/3/2004 8/5/2004 9/10/2004 10/15/2004 11/5/2004 11/30/2004 1/10/2005Actual 6/25/2004 7/30/2004 9/15/2004 10/25/2004 11/20/2004 12/14/2004 1/30/2005 250,000 DJB Traders Ltd.
TABLE 2: Selection of Consultants (not subject to prior review but above US$25,000) ------------ TIME SCHEDULE (Dates) ------------
REF# Description Estimate (US$) Selection Start RFP Doc Advertise Send out Tech Prop T Evaluation Final Eval Contract Complete Contract Amt Cons/FirmMethod Preparation RFP Opening Complete Complete Signed Assignment US$ Name
C02 Monitoring & Eval. TA 50,000 Least-Cost Plan 7/30/2004 8/5/2004 9/5/2004 10/15/2004 11/20/2004 12/15/2004 12/26/2004 1/30/2004Selection Actual 7/30/2004 8/5/2004 9/3/2004 10/14/2004 11/17/2004 12/15/2004 12/28/2004 1/30/2004 50,000 M&E & Co.
C07 Financial Audit 51,000 Least Cost Plan 8/15/2004 9/10/2004 10/15/2004 11/25/2004 12/20/2004 1/18/2004 2/5/2004 4/30/2004Selection Actual 9/12/2004 10/10/2004 10/17/2004 11/29/2004 12/30/2004 1/25/2005 2/15/2005 5/30/2005 52,000 RKS & Co.
C09 Procurement Support 45,000 Individual Plan 9/20/2004 10/25/2004 11/30/2004 12/10/2004 12/30/2004Actual 9/15/2004 10/30/2004 11/30/2004 12/14/2004 12/30/2004 45,000 J. Schwarz
C11 District Office Training 180,000 QCBS Plan 3/25/2005 4/15/2005 5/25/2005 7/10/2005 7/30/2005 8/20/2005 8/28/2005 10/30/2005Actual 3/25/2005 4/15/2005 5/30/2005 7/15/2005 8/15/2005 8/28/2005 175,000 C&J Inc.
Notes1. Prior review thresholds: Goods US$150,000, Consultants $100,000 for firms and $50,000 for individuals. The first three Goods contracts, of any amount, were also subject to prior review.2. Exchange rate used for contracts expected to be in local currency: US$1 = 23 Pacifican dollars.3. There are no civil works in the project.

ANNEX A Sample IV Page 1 of 7
FINANCIAL MONITORING REPORTS—SAMPLE 4
PLUTONIA TAX ADMINISTRATION PROJECT
Contents
1. Discussion of Project Progress (including procurement)
2. Receipts and Payments by Funding Source
3. Uses of Funds by Project Activities (supporting schedule to Receipts and Payments)
4. Physical Progress Report
5. Procurement Report
[This illustrates a public sector modernization project. Project objectives are centered on improving the efficiency of tax administration and ultimately, increasing tax collection.
The financial reports include a breakdown of project expenditures by funding source, which may be desired in some projects. Reporting is every four months as this coincides with the tax authority reporting cycle. Reporting is in US dollars, as the borrower found this to be simpler.]

ANNEX A Sample IV Page 2 of 7
PLUTONIA TAX ADMINISTRATION PROJECT
FINANCIAL MONITORING REPORT (FMR): MAY 1—AUGUST 31, 2000
BRIEF DISCUSSION OF PROJECT PROGRESS
FMR as part of Progress Reporting
1. The attached reports provide information on the progress of the project in terms of financial activity, key output measures, and the status of procurement for contracts below the Bank’s prior review thresholds. Additional information is provided by Hannekker Consultants in their semi-annual reports on the Strengthening the Institution component, and by the annual report of project progress provided to the World Bank and other stakeholders, which covers a wider range of project performance than what is presented in this FMR.
Comments on information in this FMR (including explanation of variances)
2. The following is a brief discussion of the project components, to provide further information on the tables which follow:
3. Component 1: Improving the Legal Framework—Implementation of this component has been slowed by the sudden death of the partner- in-charge of the consulting firm, which was to begin its work on August 15, 2000. Other staff in the firm have been assigned to ensure start-up of these activities by October 15.
4. Component 2: Broadening the Tax Base—No costs were incurred in this component during the period. The allocation of Taxpayer Identification Numbers (TINs) has begun to accelerate and should reach the planned figure of 300,000 by August 31, 2004. Most of the remaining project costs for this activity are expected to be incurred in early 2001, when final upgrades are made to the software. Surveys and Security Printing of Drivers Licenses are expected to be carried out, as originally planned, beginning in January 2002.
5. Component 3: Strengthening the Institution—Computerization and staff training in methods of the Institutional Tax Authority (ITA) are now proceeding as planned. Although major computer systems are still to be procured, staff have received useful training using the prototype systems.
6. Component 4: Infrastructure Improvements—Equipment purchases have been delayed since the original procurement process was not considered to be in accordance with Bank guidelines, and thus the Bank did not give the No Objection. A new process has been initiated, with close guidance from a Bank Procurement Specialist.
7. Unallocated: This represents a contingency reserve which appears in Schedule 1 of the Loan Agreement. No allocations of this amount to other disbursement categories are considered necessary in the near future.

ANNEX A Sample IV Page 3 of 7
Procurement
8. There is no separate narrative discussion of Procurement in this FMR, as no substantial changes have occurred since the last FMR. The next FMR will include a specific discussion of Procurement, as in previous reports.

ANNEX A Sample IV Page 4 of 7
GOP IBRD Total GOP IBRD Total
Receipts 62,112 1,219,315 1,281,427 444,317 3,529,314 3,973,631
Less: Payments
Improving the Legal Framework 0 0 0 0 0 0Broadening the Tax Base 0 0 0 345,333 390,000 735,333
Strengthening the Institution 10,000 543,331 553,331 41,685 778,714 820,399Infrastructure Improvements 0 470,000 470,000 0 1,590,000 1,590,000
Other 0 0 0 0 0Total Payments 10,000 1,013,331 1,023,331 387,018 2,758,714 3,145,732
Excess of Receipts over Payments 52,112 205,984 258,096 57,299 770,600 827,899
Add: Foreign Exchange Difference/ii 9,556 9,556 13,898 13,898Net cash inflow (outflow) 61,668 205,984 267,652 71,197 770,600 841,797
Add: Opening Cash Balances Project Bank Account- Govt. Funds 9,529 9,529 0 0 0
Project Bank Acct - IBRD Funds /iii 0 0 0 0
IBRD Special Account 564,616 564,616 0 0 0 Total Opening Cash 9,529 564,616 574,145 0 0 0Opening Cash + Net Cash Inflow 71,197 770,600 841,797 71,197 770,600 841,797
Closing Cash Balances
Project Bank Account- Govt. Funds 71,197 71,197 71,197 71,197 Project Bank Acct - IBRD Funds /iii 45,253 45,253 45,253 45,253
IBRD Special Account 725,347 725,347 725,347 725,347 Total Ending Cash 71,197 770,600 841,797 71,197 770,600 841,797
Notes:
/I. Exchange Rate Used on local-currency transactions and balances: 1 US$ =805 Plutonian plutos/ii. The foreign exchange difference is attributable to conversion of some Government counterpart funding at a different rate from /i above
Government of Plutonia
Receipts and Payments by Funding Source IBRD Loan No. 98765-PLU
Tax Revenue Authority - Tax Administration Project
(in US Dollars) /I for the four months ended August 31, 2000
/iii. Funds are transferred on a monthly basis from the Special Account to the Project Account for IBRD-eligible local currency expenditures expected to be made in the coming 30 days.
CumulativeFour months

ANNEX A Sample IV Page 5 of 7
PADProject Components and Activities Planned Actual Variance Planned Actual Variance Project Life
1. Improving the Legal Framework1.1. Update, review, consolidate and print Tax laws 0 0 0 0 0 0 650,0001.2 Establish Harmonized Tax Appeals macinery 0 0 0 0 0 0 50,0001.3 Provide Reg. Framework for Taxpayer ID No. System 0 0 0 0 0 0 50,000Sub-total 0 0 0 0 0 0 750,0002. Broadening the Tax Base 0 0
2.1 Taxpayer ID Number System 0 0 818,200 735,333 82,867 1,195,0002.2 Surveys for Identifying new sources of revenue 0 0 0 0 0 0 200,0002.3 Security Printing of Drivers Licences 0 0 0 0 0 0 0Sub-total 0 0 0 818,200 735,333 82,867 1,395,0003. Strengthening the Institution3.1 Computerization and Data Communication 266,800 267,102 (302) 584,600 289,396 295,204 6,798,0003.2 Staff Training and ITA 400,000 281,926 118,074 687,000 526,700 160,300 7,533,0003.3 TA/Consulting Services 0 0 0 0 0 0 2,326,0003.4 Taxpayer Education, Manuals, Guides and Library 4,303 4,303 0 4,303 4,303 0 2,061,000Sub-total 671,103 553,331 117,772 1,275,903 820,399 455,504 18,718,0004. Infrastructure Improvements 0 04.1 Equipment 0 0 0 417,000 0 417,000 7,705,0004.2 Buildings 450,000 470,000 (20,000) 1,600,000 1,590,000 10,000 9,720,000Sub-total 450,000 470,000 (20,000) 2,017,000 1,590,000 427,000 17,425,000
5. Unallocated 0 0 0 0 0 0 5,789,0000 0
Total Project Expenditure 1,121,103 1,023,331 97,772 4,111,103 3,145,732 965,371 44,077,000NOTE
/i. Exchange Rate used on local-currency transactions and balances: 1 US$ =805 Plutonian plutos
Four Months Cumulative
Government of PlutoniaTax Revenue Authority - Tax Administration Project
(in US Dollars) /I
IBRD Loan No. 98765-PLUUses of Funds by Project Activities
for the four months ended August 31, 2000
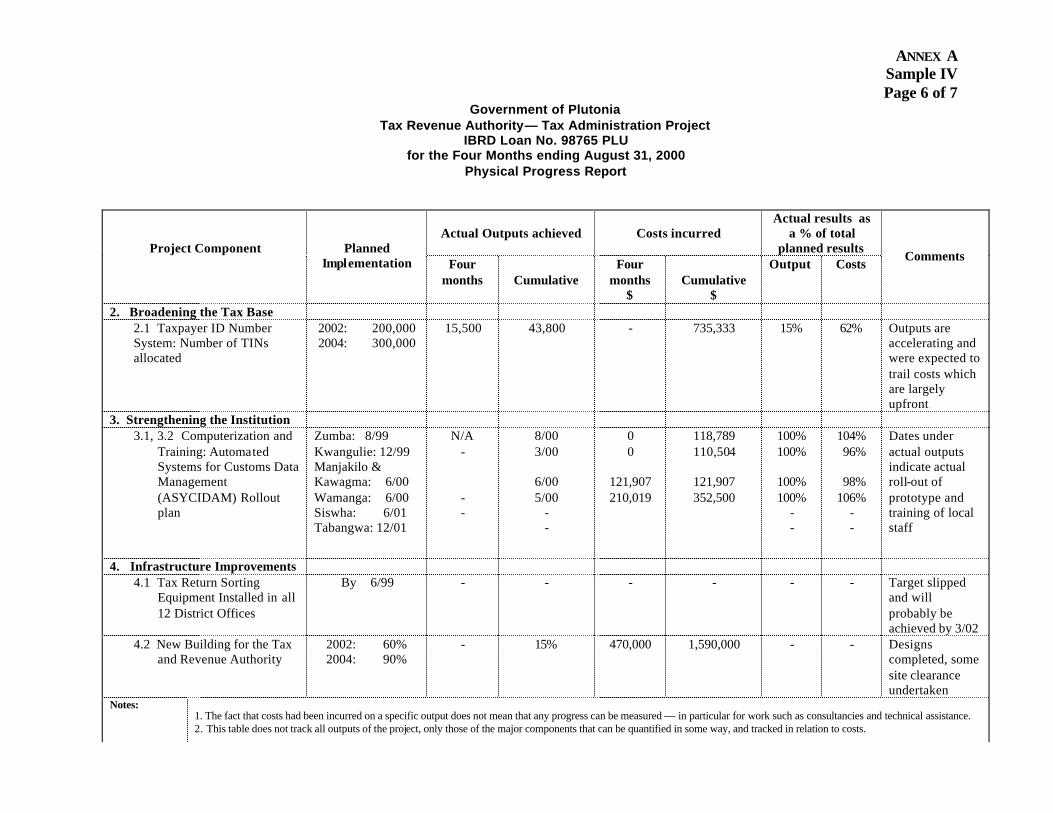
ANNEX A Sample IV Page 6 of 7
Government of Plutonia Tax Revenue Authority— Tax Administration Project
IBRD Loan No. 98765 PLU for the Four Months ending August 31, 2000
Physical Progress Report
Actual Outputs achieved Costs incurred Actual results as
a % of total planned results Project Component Planned
Implementation Four months
Cumulative
Four months
$
Cumulative
$
Output Costs Comments
2. Broadening the Tax Base 2.1 Taxpayer ID Number System: Number of TINs allocated
2002: 200,000 2004: 300,000
15,500 43,800 - 735,333 15% 62% Outputs are accelerating and were expected to trail costs which are largely upfront
3. Strengthening the Institution 3.1, 3.2 Computerization and
Training: Automated Systems for Customs Data Management (ASYCIDAM) Rollout plan
Zumba: 8/99 Kwangulie: 12/99 Manjakilo & Kawagma: 6/00 Wamanga: 6/00 Siswha: 6/01 Tabangwa: 12/01
N/A - - -
8/00 3/00
6/00 5/00
- -
0 0
121,907 210,019
118,789 110,504
121,907 352,500
100% 100%
100% 100%
- -
104% 96%
98% 106%
- -
Dates under actual outputs indicate actual roll-out of prototype and training of local staff
4. Infrastructure Improvements 4.1 Tax Return Sorting
Equipment Installed in all 12 District Offices
By 6/99
- - - - - - Target slipped and will probably be achieved by 3/02
4.2 New Building for the Tax and Revenue Authority
2002: 60% 2004: 90%
- 15% 470,000 1,590,000 - - Designs completed, some site clearance undertaken
Notes:
1. The fact that costs had been incurred on a specific output does not mean that any progress can be measured — in particular for work such as consultancies and technical assistance. 2. This table does not track all outputs of the project, only those of the major components that can be quantified in some way, and tracked in relation to costs.

ANNEX A Sample IV Page 7 of 7
PLUTONIA TAX ADMINISTRATION PROJECT: PROCUREMENT MONITORING TABLES
TABLE 1: Procurement of Goods (contracts not subject to prior review but above US$ 25,000)------------ TIME SCHEDULE (Dates) ------------
REF# Description Estimate (US$) Procm't Start Doc Prep. Advertise Bid Invitation Bid Opening Evaluation Contract Final Contract Amt Supplier Method Complete Signed delivery US$ Name
G 123 Sorting bins for tax returns 37,582 NCB Plan 7/3/1999 8/5/1999 9/10/1999 10/15/1999 11/5/1999 11/30/1999 1/10/2000Actual 6/25/1999 7/30/1999 9/15/1999 10/25/1999 11/20/1999 12/14/1999 1/30/2000 42,500 Plastic Mart Ltd.
G 136 Printers for Tax Authority 50,000 NCB Plan 8/5/2000 9/10/2000 10/15/2000 11/30/2000 12/25/2000 1/20/2001 3/5/2001Actual 8/5/2000 8/26/2000
G 139 Paper for tax Forms 125,000 IS Plan 5/3/2001 6/15/2001 6/30/2001 7/25/2001
Actual
TABLE 2: Procurement of Works (not subject to prior review but above US$ 100,000)
All works procurement is expected to be subject to prior review.
TABLE 3: Selection of Consultants (not subject to prior review but above US$10,000) /I------------ TIME SCHEDULE (Dates) ------------
REF# Description Estimate (US$) Selection Advertise Start RFP Doc Send out Tech Prop T Evaluation Final Eval Contract Complete Contract Amt Cons/FirmMethod Preparation RFP Opening Complete Complete Signed Assignment US$ Name
42510 Training of Staff on MIS 50,000 Fixed Budget Plan 8/5/2000 7/30/2000 9/5/2000 9/10/1999 10/15/1999 11/5/1999 12/10/1999 1/30/2000Actual 8/5/2000 7/30/2000 9/5/2000 9/15/1999 10/25/1999 11/20/1999 12/14/1999 1/31/2000 50,000 Ace & Co.
42650 Initial TA for Data Review 51,000 Fixed Budget Plan 9/10/2000 8/15/2000 10/15/2000 11/25/2000 12/20/2000 1/18/2001 2/5/2001 4/30/2001Actual
42659 Local Support for Legal 45,000 Indiviidual Plan 9/20/2000 10/25/2000 11/30/2000 12/10/2000 12/30/2001Review Actual
Notes1. Prior review thresholds: Goods US$200,000, Works US$ 500,000, Consultants $200,000 for firms and $50,000 for individuals. As the project is mostly large contracts, very few are included in this report.2. Exchange rate used for contract expected to be in local currency: US$1 = 14.5 Aps.
ANNEX A Sample V
Page 1 of 5
FINANCIAL MONITORING REPORTS—SAMPLE 5
GOVERNMENT OF HIBERNIA EDUCATION PROJECT
Learning and Innovation Loan
Contents
1. Sources and Uses of Funds
2. Uses of Funds by Project Activities (supporting schedule)
3. Procurement Progress Report
4. Review of Physical Progress
[This illustrates an FMR for a small operation, in this case financed by a Learning and Innovation Loan (LIL). Reporting is less detailed, and physical progress is discussed primarily in narrative form. Procurement reports contain only a few contracts, as most contracts are either very small or are subject to prior review. Frequency of reporting is every six months.]

ANNEX A Sample V
Page 2 of 5
Project Financing
Government Funds 24,000 260,000 IBRD Funds 36,000 320,000
Total Financing 60,000 580,000 Less: Uses
Salaries 21,500 151,000 Vehicles running costs 5,000 38,000
Office rental 3,500 26,000 Consulting services 40,000 275,000
Printing - - Advertising and outreach - 5,000
Office running costs 18,000 60,000 Other 750 3,750
Sub-total 88,750 558,750 Net cash flow (28,750) 21,250
Add: Opening Cash Balances Project Bank Account 2,000 0
IDA Special Account 48,000 050,000 0
Net Cash Available at End of Period 21,250 21,250 Closing Cash Balances
Project Bank Account 6,000 6,000 IDA Special Account 15,250 15,250
Total Closing Cash Balance 21,250 21,250
Quarter Cumulative
Notes: /I. The following rates were used for conversion: 1 US$ =1.1HPS (Opening and Closing balances of SA); 1 US$ =1.112 HPS (IDA Funds received during quarter)
Government of Hibernia
World Bank Loan No.1234-HIB
For the six months ending March 31, 2001Sources and Uses of Funds
(in Hibernian pesos (HPS) /I
Education Project (Learning and Innovation Loan)

ANNEX A Sample V
Page 3 of 5
Quarter Cumulative PAD /ii
Planned Actual Variance Planned Actual Variance Project Life
1. New primary education policya. Research and analysis of past experience 25,000 25,000 0 175,000 200,000 -25,000 300,000
b. Consultative processes 16,000 12,000 4,000 60,000 55,000 5,000 500,000c. Operating costs of policy secretariat 10,000 13,000 -3,000 60,000 95,000 -35,000 200,000
Sub-total 51,000 50,000 1,000 295,000 350,000 -55,000 1,000,000
2. Pilot application of new teaching methodologies
a. Pilot in Amazonia region 0 0 0 0 0 0 100,000
b. Pilot in Oceania region 15,000 0 15,000 80,000 40,000 40,000 200,000c. Pilot in Africana region 36,000 35,000 1,000 125,000 120,000 5,000 200,000
Sub-total 51,000 35,000 16,000 205,000 160,000 45,000 500,000
3. Public awareness program
a. Media consultancy 22,500 3,000 19,500 200,000 40,000 160,000 350,000b. Printing and distribution costs 3,000 0 3,000 40,000 0 40,000 400,000
c. Public notices and advertisements 500 0 500 5,000 5,000 0 150,000Sub-total 26,000 3,000 23,000 245,000 45,000 200,000 900,000
4. Other 0 750 -750 2,000 3,750 -1,750 100,000
Total Project Expenditure 128,000 88,750 39,250 747,000 558,750 188,250 2,500,000
/ii The PAD figures were converted into local currency using the average exchange rate for the project life to date
Government of Hibernia
World Bank Loan No. 1234-HIB
Uses of Funds by Project Activity
Project Components/Activities /i
For the six months ending March 31, 2001
Notes:
Education Project (Learning and Innovation Loan)
(in Hibernian pesos (HPS) /I
/i The items under "Project Activities" are those agreed between the Borrower and the Bank at the time of appraisal, and as stated in the PAD.

ANNEX A Sample V
Page 4 of 5
------------ TIME SCHEDULE (Dates) ------------
Description Est. HPS Procm'tStart Doc
Prep. Advertise Issue RFPTechnical Proposal
Technical Evaluation
Final Evaluation Contract Final
Contract Amt Supplier
Method Opening Complete Complete Signed delivery HPS NameMedia consultancy 150,000 QCBS Plan 4/2/2000 4/20/2000 5/5/2000 7/10/2000 8/5/2000 8/15/2000 8/30/2000 6/30/2001
Actual 6/15/2000 6/30/2000 7/20/2000 9/20/2000 10/15/2000 11/25/2000 12/5/2000 12/30/2001 180,000 MedConsult
Education and research 100,000 QCBS Plan 7/3/2000 8/5/2000 9/10/2000 10/15/2000 11/5/2000 11/20/2000 11/30/2000 1/10/2002
Actual 6/25/2000 7/30/2000 9/15/2000 10/25/2000 11/20/2000 12/2/2000 12/14/2000 1/30/2002 120,000 EdRes Inc.
------------ TIME SCHEDULE (Dates) ------------
DescriptionEstimate
(US$) Procm't Start Doc AdvertiseBid
Invitation Bid Evaluation Contract FinalContract
Amt ContractorMethod Preparation Opening Complete Signed Delivery US$ Name
Printing of policy documents 200,000 NCB Plan 7/5/2000 8/10/2000 9/20/2000 11/30/2000 1/25/2001 3/28/2001 1/3/2004 175,000 ABC Co.
Actual 8/15/2000 9/30/2000 10/15/2000 12/30/2000 2/15/2001 - - -
Procurement of Goods (not subject to prior review but above HPS 25,000)
Selection of Consultants (not subject to prior review but above HPS 25,000)
Prior review threshold for consultancy assignments is HPS 200,000, for Goods HPS 300,000. Exchange rate is 1US$=1.1 HPS.
Government of Hibernia
World Bank Loan No. 1234-HIBProcurement Status Report at March 31, 2001
Education Project (Learning and Innovation Loan)

ANNEX A Sample V
Page 5 of 5
GOVERNMENT OF HIBERNIA
EDUCATION PROJECT (LEARNING AND INNOVATION LOAN)
WORLD BANK LOAN NO .1234-HIB
REVIEW OF PHYSICAL PROGRESS
For the six months ending March 31, 2001
Component
Cum. Exp. (HSP)
% of planned total cost
Progress made 1. New primary education policy
350,000 35% With the exception of operating costs of the policy secretariat, implementation of this component of the project is on track. Policy research and analysis is more than two-thirds complete, and will be finished during the next quarter. As this information becomes available, the consultative process, which is presently in its early stages, will increase dramatically in the next few months. The operating costs of the policy secretariat are 50% above budget, without a satisfactory explanation. An investigation has been launched, and the results will be available in mid-May.
2. Pilot application of new teaching methodologies
160,000 32% The Amazonia pilot is due to commence in September of this year. No expenditure has been incurred to date. The Oceania pilot was three months late in starting, resulting in actual expenditure to date being less than that planned. Measures have been taken to get it back on track during the next quarter. The Africana pilot is on track, and will be finished on schedule in July. Early results are encouraging (described in more detail in a separate report), and have been fed into planning for the pilots in the other two regions.
3. Public Awareness Program
45,000 5% The public awareness program is substantially behind schedule. This is largely accounted for by serious problems in the procurement of the media consultancy contract, which took several months to be satisfactorily resolved. The consultants have now commenced work, have delivered their inception report, and are proceeding in accordance with an approved revised schedule. The delay in the award of this contract explains the delay in commencing printing and distribution of documentation. There is now a risk that the completion date of the overall project will be delayed. On the recommendation of the media consultants, the government has approved a target of reaching 200,000 households, and progress on meeting this target will be monitored in future progress reports.
4. Other activities 4,000 4% No item of significance to report. Total 559,000 22% The overall budget for the project is not expected to be
exceeded.

ANNEX B PAGE 1 OF 3
DISBURSEMENT DOCUMENTATION FOR INVESTMENT LOANS1
1. These Financial Management Report (FMR) Guidelines provide new flexibility for disbursement processing for Borrowers that (a) are assessed to have adequate FM capacity and procedures in place at the time of the FM assessment and maintain an adequate FM rating during project supervision, (b) submit timely, quality FMRs, and (c) submit timely, quality independent project audits. These Borrowers will have a choice of transaction-based or report-based disbursement, while Borrowers that do not meet (or continue to meet) these criteria will use transaction-based disbursement only.
2. The Bank disburses funds to support the development objectives of approved projects. When Borrowers request payment on a loan, they submit a withdrawal application. 2 Borrowers must also submit supporting documentation to the Bank to demonstrate that disbursements are for eligible project expenditures, pursuant to legal agreements and applicable Bank policies.
3. The key differences between transaction-based and report-based disbursement are (a) the timing of submission of supporting documentation and (b) the nature of that documentation. Table 1 details the timing of supporting documentation submission, by disbursement method.
Table 1: Timing Of Submission Of Supporting Documentation,
By Disbursement Method
Disbursement Method
Transaction-based Disbursement
Report-based Disbursement
Title of Supporting Document Submission
Before each disbursement, with the Withdrawal
Application
After each disbursement, with the subsequent
Special Account replenishment request
After one or more disbursements,
with the subsequent Financial Monitoring
Report Reimbursement √ - √ Direct payment √ - √ Special account replenishment*
-
√
√
Special commitment**
-
-
-
Notes: * No supporting documentation is needed to request initial deposit to the Special Account. ** No supporting documentation is needed for payment under Special Commitments. (For the issuance of the Special Commitment, copies of the proposed documentary credit are needed.)
4. Transaction-based disbursement requires submission of supporting documentation each time the Borrower requests disbursement of loan proceeds from the Bank (with the exception of 1 The O.P./B.P. 12 series is being updated, and Disbursement Guidelines and related procedure manuals are being
prepared. These will supercede the Disbursement Handbook (1992), Disbursement Procedures Manual (July 1998), and Loan Administration Change Initiative (LACI) Implementation Handbook , World Bank, Loan Department, September 1998.
2 For the purpose of this Annex, “loan” refers to IBRD loans, IDA credits, or recipient-executed trust funds administered by the Bank.

ANNEX B PAGE 2 OF 3
the initial deposit to the Special Account). For reimbursements or direct payments, supporting documentation is submitted with the withdrawal application before disbursement is made. For Special Account arrangements, supporting documentation for each disbursement is submitted with the subsequent replenishment request, enabling the Bank to confirm past eligible expenditures before the next advance is made.
5. Report-based disbursement offers more flexibility. Under report-based disbursement arrangements, a forecast of project expenditures is agreed between the Borrower and the Bank, covering the current and next FMR reporting period. Thereafter, aggregate disbursement requests not exceeding this forecast amount are payable by the Bank upon demand by the Borrower. Supporting documentation for these disbursements is submitted with the subsequent FMR and reviewed by the Bank to confirm eligible expenditures during the period covered by the FMR. The FMR also gives a new forecast for the next two FMR reporting periods.
6. Report-based disbursement arrangements are intended to: (a) facilitate disbursements of the size and frequency needed by Borrowers for smooth project implementation, (b) speed disbursements by reducing the processing time for most withdrawal applications and avoiding disbursement interruptions while FMRs are being reviewed by the Bank, (c) reduce transaction costs for Borrowers related to the submission of supporting documentation for disbursements, and (d) promote integrated monitoring of project financial management by linking the review of supporting documentation for disbursements with that of physical progress and procurement.
7. Table 2 outlines the supporting documentation required for transaction-based disbursement.
Table 2: Documentation Requirements For
Transaction-Based Disbursement
Reimbursement • For contracts above the prior review threshold: Ø Summary Sheet and full supporting documentation
− Invoice from the supplier − Evidence of payment to the supplier − Proof of shipment of goods or delivery of services
• For contracts below the prior review threshold: Ø Statement of Expenditure (supporting documentation as noted above
is retained by the PIU for inspection by the Bank, upon request) Direct Payment • For goods: Invoice from the supplier and proof of shipment of goods
• For services: Payment certificate and proof of delivery of services
Special Account (SA) Replenishment
• SA reconciliation statement • SA bank statement • Reimbursement documentation (as noted above)

ANNEX B PAGE 3 OF 3
8. Table 3 outlines documentation requirements for report-based disbursement.1 These requirements apply to FMRs submitted every three of four months. For projects where it is agreed that FMRs may be submitted less frequently (e.g., semi-annually), supporting documentation for report-based disbursements would need to be submitted quarterly.
Table 3: Documentation Requirements For
Report-Based Disbursement
FMR
incl
udes
• Required minimum FMR content on financial, procurement and physical progress, plus: • Statements containing Institutional Information Ø Source of supply information
u For contracts above the prior review threshold: − the contractor/consultant’s name, nationality, and (where applicable) the zip
code* − the amount disbursed under each contract
u For contracts below the prior review threshold: aggregate disbursements by country of supply
Ø Breakdown of aggregate dis bursements by legal disbursement category and disbursement percentage
• Special Account reconciliation statement • Special Account bank statement • Forecast of expenditures for the next two FMR reporting periods
Note: * It is planned to clarify Form 384 formats, so this information can be captured directly when contracts are first recorded by the Bank in SAP, whereupon it would not need to be provided separately in the FMRs nor recorded in the Loan Administration System.
9. For detailed information on disbursement documentation requirements, please contact your Disbursement Officer in the Loan Department.
1 It is important to note that Borrowers may continue to use existing PMR formats, which are sufficient for
report-based disbursement.