financial leverage and firm value
TRANSCRIPT

Financial leverage and firm value
Kuben Rayan
27526977
A research project submitted to the Gordon Institute of Business
Science, University of Pretoria, in partial fulfilment of the requirements
for the degree of Master of Business Administration.
13 November 2008
©© UUnniivveerrssiittyy ooff PPrreettoorriiaa

ii
Abstract
The capital structure debate has been live for decades, with the key
point of contention for many researchers being whether capital
structure positively or negatively impacts firm value. Much of the
literature on this question takes its departure from the seminal writings
of Modigliani and Miller (1958) and their Theorem of Irrelevance. Many
researchers have subsequently argued their case for and against the
optimal value capital structure. The purpose of this research is to
evaluate whether in a South African context an increase in financial
leverage positively or negatively impacts firm value. Furthermore,
given the high level and volatility of the current local interest rate
market, this report also considers how the volatility of the local interest
rate impacts on capital structure.
This research was conducted using secondary data sourced from the
McGregor BFA database for the period 1998-2007. The sample
included 113 Johannesburg Stock Exchange (JSE) listed firms, which
were stratified by industry in order to distinguish between different
industries dynamics in this regard. Regression analysis was carried
out for both tests
It was found that an increase in financial leverage is negatively
correlated with firm value. The study on the impact of interest rates on
capital structure proved to be inconclusive.

iii
Declaration
I declare that this research project is my own work. It is submitted in
partial fulfilment of the requirements for the degree of Master of
Business Administration at the Gordon Institute of Business Science,
University of Pretoria. It has not been submitted before for any other
degree or examination in any other University. I further declare that I
have obtained the necessary authorisation and consent to carry out
this research.
Kuben Rayan
27526977 13 November 2008

iv
Acknowledgments
First and most importantly, I would like to thank my wife Preveni and
my daughter Megan for their love, support, sacrifice and patience
during this two year sojourn. I could not have made it without them
and love them both, as well as the little one on the way.
I thank Max Mackenzie my supervisor for his invaluable support,
advice and patience during this incredible last lap of the journey.
Having him as a supervisor greatly assisted in getting to the job done.
Thank you to Romalin Nagan, my study mate, for his support and
assistance during this last year.
Thank you to Suren Kasil, for his assistance with the data.
I thank the staff at the Information centre, especially Monica Sonqishe
and Beulah Muller, for their kind assistance.
Finally I would thank management, the faculty and all the staff at
GIBS, including the cleaning staff and security, for doing what they do.
It’s been a pleasure and a privilege due to their efforts.

v
Table of Contents
1. Definition of the Problem ............................................................................... 1
1.1 Research Title ............................................................................................. 1 1.2 Research problem ....................................................................................... 1 1.3 Research aim .............................................................................................. 5
2. Theory and Literature Review ....................................................................... 6
2.1 Leverage and capital structure .................................................................... 6 2.2 Optimal capital structure. ............................................................................. 6 2.3 Capital structure theory ............................................................................... 8
2.3.1 Pecking order theory .............................................................................................. 10
2.3.2 Trade off theory ...................................................................................................... 11
2.3.3 Agency cost theory ................................................................................................. 13
2.3.4 Life stage theory ..................................................................................................... 16
2.3.5 Information Asymmetry Theory .............................................................................. 17
2.4 The influence of industry on capital structure ............................................ 18 2.5 The Influence of Interest rates on capital structure. ................................... 20 2.6 The influence of firm level characteristics on capital structure. ................. 21
2.6.1 Profitability .............................................................................................................. 22
2.6.2 Growth .................................................................................................................... 22
2.6.3 Asset Structure ....................................................................................................... 23
2.6.4 Firm Size ................................................................................................................ 23

vi
2.6.5 Firm Risk ................................................................................................................ 23
2.6.6 Taxation ................................................................................................................. 24
2.7 Literature summary ................................................................................... 25
3. Research Hypothesis ................................................................................... 27
3.1 Hypothesis 1:............................................................................................. 27 3.2 Hypothesis 2:............................................................................................. 27
4. Research Methodology ................................................................................ 28
4.1 Introduction ............................................................................................... 28 4.2 Population and Unit of Analysis ................................................................. 28
4.2.1 Population .............................................................................................................. 28
4.2.2 Unit of Analysis ...................................................................................................... 29
4.3 Sample Size and Selection ....................................................................... 29 4.4 Data collection ........................................................................................... 30 4.5 Proposed data analysis ............................................................................. 31
4.5.1 Debt/ Equity (D/E) Ratio ......................................................................................... 33
4.5.2 Return on Assets (ROA) ........................................................................................ 33
4.5.3 Return on Equity (ROE) ......................................................................................... 33
4.5.4 Operating Profit Margin .......................................................................................... 34
4.5.5 Earnings per Share (EPS) and Price Earnings (P/E) Ratio .................................... 34
4.5.6 Economic Value Added (EVA) ............................................................................... 34
4.6 Quantitative Analysis ................................................................................. 35 4.7 Potential research limitations .................................................................... 37

vii
5. Presentation of Results................................................................................ 38
5.1 Introduction ............................................................................................... 38 5.2 Hypothesis 1: Financial Leverage and Firm Value ................................... 38
5.2.1 Descriptive Statistics for Capital Structure ............................................................. 56
5.3 Hypothesis 2: Interest Rates and Capital Structure ................................... 56
5.3.1 Interest rates and capital structure no lag .............................................................. 56
5.3.1.1 Descriptive statistics for the impact of interest rate on capital structure. ............. 59
5.3.2 Interest rates and capital structure with one-year lag............................................. 62
5.3.2.1 Descriptive statistics for the impact of interest rates on capital structure. ........... 65
6. Analysis of Results ...................................................................................... 68
6.1 Introduction ............................................................................................... 68 6.2 Hypothesis 1: Financial Leverage and Firm Value ................................... 69
6.2.1 Financial leverage and firm value for the market ................................................... 69
6.2.2 Financial Leverage and firm value by industry ....................................................... 72
6.2.3 Conclusion of Hypothesis 1. ................................................................................... 74
6.3 Hypothesis 2: Interest rates and capital structure. ..................................... 74
6.3.1 Conclusion of Hypothesis 2 .................................................................................... 75
7. Conclusion .................................................................................................... 76
7.1 Capital Structure and Firm Value .............................................................. 76 7.2 Interest rates and firm value ...................................................................... 79 7.3 An Integrated approach to Optimal Capital structure ................................. 80 7.4 Recommendations for future research ...................................................... 84 7.5 Conclusion ................................................................................................ 86

viii
References ........................................................................................................ 87
Appendix A – Final Sample Selection ............................................................. 98
Annexure B – Complete Sample Data ........................................................... 102

1
1. Definition of the Problem
1.1 Research Title
Financial leverage and firm value
1.2 Research problem
According to Ward and Price (2006), a profitable business will experience a higher
Return on Equity (ROE) as borrowings increase. Ward and Price (2006) also
postulate the impact of debt or leverage, since a profitable firm is able to earn at
higher rate than it is paying for borrowed funds.
The above information could lead to the assumption that all firms should ensure
that their capital structures are greatly weighted towards a higher level of debt.
However there is a limit to the amount of debt a firm should take on (De Wet,
2004).
Debt and equity are the principle sources of funding for a business. The
proportional distribution of these two sources of funding depends on how a firm
decides to divide its cash flow between two broad categories: a fixed component
which is utilised for obligations toward debt capital and a residual component which

2
belongs to equity shareholders. Therefore a firm’s financial leverage affects the
firms value (Sharma, 2006).
Consider the following news headline from the Business Day “Debt has hit SA’s
largest non-food retailer, Edgars Consolidated Stores, hard, costing it R2,5bn and
contributing to the group’s R1,3bn loss for the year as it pays off its purchase debt”
(Mawson, 2008, p. 13). This example alludes to an instance of the negative impact
of high levels of debt on a company’s financial performance. However, contrary to
this headline, many companies consider debt to be an integral part of their growth
strategy.
Firer, Ross, Westerfield and Jordan (2004) state that investors expect a return for
bearing risk during the period that they own shares in a firm while foregoing a risk
free return in government treasury bonds. Such returns are in the form of future
dividend flows as well as capital appreciation as reflected by an expected increase
in share price.
Therefore one of the major objectives of financial management is maximising
shareholder value, and hence the relationship between capital structure and firm
value has become a key issue.
In addition, the interest rate has significant effects on the riskiness of debt. Below is
an excerpt from the Business Day that demonstrates the impact of interest rates.

3
“South Africa’s manufacturing output growth slowed sharply in May, official data
showed this week, suggesting the sector is under strain from higher interest
rates…..The Reserve Bank has raised rates by a cumulative five percentage points
since June 2006 as it grapples with spiralling inflation, and analysts say the higher
cost of borrowing is weighing on the productive sector and the economy as a
whole.” (Mapenzauswa, 2008, p. 11)
While there is no shortage of information on the positive effect of debt funding and
its capacity to accelerate growth, the above excerpt provides an indication of the
impact of increased interest rates not only on an industry but on the economy as a
whole. Ward and Price (2006) also state that while leverage is clearly effective, its
disadvantage is that as the interest rate increases the positive effect of leverage
declines to a point at which it becomes negative. South Africa has a history of a
volatile interest rate market, as depicted in figure 1. It would, therefore, be
interesting to evaluate the impact of the interest rate on both the capital structure
and the value of the firm.

4
Figure 1. – S.A. Prime overdraft lending rate.
Source: SA Reserve Bank, (2008)
Therefore a number of questions require an answer. What is the optimal capital
structure? At what point is a firm’s returns maximised and then managed to ensure
that it does not approach the point at which there is a negative impact on the firm?
Finally does optimal capital structure vary from industry to industry?
The aim of this research report is to analyse the relationship between capital
structure and firm value, particularly with regard to interest rates, given the volatility
in the South African interest rate environment. In addition, this report will undertake
0
5
10
15
20
25
30
Rate ‐%
Prime Overdraft Lending Rate
Series1

5
a comparison of capital structure across various industries in South Africa in order
to test whether they vary, and if so, how this impacts on firm value. Finally, an
attempt will be made to establish whether capital structure positively or negatively
impacts on firm value.
1.3 Research aim
The main objective of this research report is to investigate whether capital structure
positively influences the value of the firm. There have been similar studies in other
countries. One worth noting is a study conducted by Sharma (2006) which
suggests a direct correlation between financial leverage and firm value for firms in
the manufacturing industry in India in 2006.
The analysis will be conducted on all firms listed on the JSE excluding the banking
and mining industries for the period 1997 to 2007. First the analysis will attempt to
determine a direct correlation between financial leverage and firm value. Next, it
will attempt to identify a direct correlation between the firm’s capital structure and
the interest rates in South Africa over the ten year period so that both positive and
negative effects on the markets can be recorded. Finally the analysis will attempt to
understand the how capital structures have evolved over the period within the
various industries.

6
2. Theory and Literature Review
2.1 Leverage and capital structure
According to Ward and Price (2006), financial leverage is the proportion of capital
which is financed by debt as opposed to equity. Therefore the higher the leverage,
the higher the amount of debt in the capital structure of a firm. Firer, Ross,
Westerfield and Jordan, (2004) also state that capital structure refers to the relative
amounts of debt and equity a firm utilises to finance its operational activities.
2.2 Optimal capital structure.
An optimal debt/equity ratio is achieved when the value of a firm is maximised
while the cost of capital is minimised (Firer et al., 2004 and Erhardt and Brigham,
2003). In contrast, Myers (1984) holds that the various capital structure theories do
not explain actual financing behaviour and it is therefore presumptuous to advise
firms on optimal capital structure. However various researchers have found
evidence in support of a positive relationship between optimal capital structure and
a maximised firm value: Ward and Price (2006) indicate that an increased
debt/equity ratio in a profitable business increases shareholder returns, but also
increases risk. Sharma (2006) concludes that there is a direct correlation between

7
leverage and firm value. Lasher (2003) asserts that increased levels of debt
finance can result in increased earnings per share (EPS) and return on equity
(ROE). De Wet (2006) proves that a significant increase in value can be achieved
in moving closer to the optimal level of gearing and Fama and French (2002)
conclude that there should be a positive relation between debt ratio and firm
profitability. Contrary to this, Rajan and Zingales (1995) find a negative relationship
between debt and profitability.
Beattie, Goodacre and Thomson (2006) question the theoretical work on capital
structure, arguing that the practical applications of capital structure theory are
limited. A further ongoing debate poses the question of whether capital structure
influences firm value or vice versa. Margaritis and Psillaki (2007) find that an
inverse causal relationship exists between efficiency and leverage. They conclude
that the effect of efficiency on leverage is positive at low to mid-leverage levels and
negative at high leverage ratios. Finally, Stewart Myers, writing on optimal capital
structure in 2001, concludes that, “there is no universal theory of the debt-equity
choice and no reason to expect one” (Myers, 2001, p.81).

8
2.3 Capital structure theory
Most researchers on capital structure take as their point of departure the seminal
work of Modigliani and Miller (1958), who derived the Leverage Irrelevance
Theorem, concluding that capital structure does not impact firm value in an ideal
environment. Their assumption of an ideal financial environment excludes the
impact of tax, inflation and transaction costs. This theory, known as MMI, received
criticism from peers who question the validity of their theory given the fact that the
no firm actually operates in an environment without the impact of tax, inflation and
transactional costs.
This prompted Modigliani and Miller (1963) to issue a correction, which is referred
to as MMII. They still argue that a change in the debt/equity ratio does not impact
on firm value, however when taxes and other transaction costs are considered two
factors need to be acknowledged:
First, a firm’s weighted average cost of capital (WACC) decreases as it increases
its debt. Second, a firm’s cost of equity increases as it increases its debt since
shareholders bear higher business risk due to the increased possibility of
bankruptcy.

9
Given the great debate on capital structure, and adding to the aforementioned
Modigliani and Miller models (1958 & 1963), a number of theories have provided
further contributions.
Jou and Lee (2004) highlight some of the theories that will be further investigated.
They state that while MM1 claims that a firm’s financing decision is separate from
its investment decision under perfect market conditions, these two decisions are
linked through four sources of market imperfections:
1. Capital has some resale value and is more costly to purchase later.
2. Debt obligations are tax deductable with full loss offsets.
3. Conflicts of interest between equity and debt holders over the initial capacity
may arise because equity has limited liability.
4. There are certain costs incurred in the event of bankruptcy.
Consideration will now be given to various capital structure theories that have been
developed over a number of decades. The abovementioned points will also be
discussed in greater detail.

10
2.3.1 Pecking order theory
Myers and Majluf (1984) propose that the “pecking order” framework is based on
asymmetric information since managers have inside information on the future
prospect of the firm and act in the favour of existing shareholders. According to
pecking order theory firms prefer internal finance (from retained earnings) to
external finance, and when external finance is required, firms prefer debt before
equity. Myers (1984) modifies the strict pecking order hypothesis and suggests that
firms with many investment opportunities may decide to issue equity before it is
absolutely necessary.
The outcomes of empirical tests on pecking order theory are mixed. Shyam-
Sunder, and Myers (1999) find support for the pecking order hypothesis utilising
data from the New York Stock Exchange for various sectors, over the period 1971-
1989. Frank and Goyal (2003) observed little support for pecking order hypothesis
also using American publicly traded firms for the period 1971 to 1998, and argued
instead that net equity issues are more closely correlated with financing deficit than
are net debt issues. The pecking order hypothesis seems to be more applicable to
data prior to 1990 then post 1990. Fama and French (2005) examine the financing
decisions of many individual firms and observe that these decisions are in conflict
with the pecking order hypothesis. They also find that while equity is supposed to
be the last financing alternative, most firms issue some sort of equity every year.

11
Seifert and Gonenc (2008) in their study titled, The international evidence on
pecking order hypotheses , find little overall support for pecking order behaviour in
the US, UK and Germany for the period 1980 to 2004. They indicate that this is
largely attributed to the information asymmetry due to widespread ownership of
stock where insiders know more than outside investors. They find evidence to
support pecking order behaviour in Japan during the 1980s and 1990s. Ni and Yu
(2008), also find little support for pecking order theory amongst Chinese listed firms
in 2004. They conclude that in China, large companies follow the pecking order
hypothesis while small and medium companies do not.
2.3.2 Trade off theory
Myers (2001) postulates that debt offers firms a tax shield, and firms therefore
pursue higher levels of debt in order to gain the maximum tax benefit and
ultimately enhance profitability. However, high levels of debt increase the
possibility of bankruptcy.
The advantages of this approach include the possibility of deducting interest
payments from company tax (Modigliani and Miller, 1963). Kim (1978), states that
the disadvantage of debt is the potential cost of financial distress. Jensen and
Meckling (1976) add that an additional disadvantage is the agency costs for equity
holders and debt holders. To further substantiate this argument DeAngelo and
Masulis (1980) predict an inverse relationship between leverage and investment

12
tax shield, while the association between the corporate tax rate and the debt level
is expected to be positive. However Nagesh (2002), in his investigation into sixty
four JSE listed firms, finds a negative relation between the tax rate variable and the
extent of leverage. He also concludes that the trade-off between investment-
related tax shields and debt-related tax shields is unobserved.
Myers (1984) asserts that the trade-off approach implies that a firm’s leverage
reverts to a target or optimal level. Negesh (2002) states that Frank and Goyal
(2005) break Myers’ notion of trade-off into two parts:
1. The static trade-off theory, where a firm’s leverage is determined by a single
period trade-off.
2. Target adjustment behaviour, where the firm’s leverage gradually reverts to
the target over time.
More recently authors have developed a dynamic trade-off model in an attempt not
only to verify the prediction that leverage reverts to an optimal level, but also to
understand how quickly this adjustment is made (Hennessy and Whitehead, 2005).

13
2.3.3 Agency cost theory
Capital structure is influenced by firm management, which has a long term impact
on the firm’s capital structure. However, management might be tempted to pursue
personal incentives instead of maximising shareholder value (Myers, 2001).
Research in this area was initiated by Jensen and Meckling (1976), building on
earlier work by Fama and Miller (1972). They identified two types of conflicts: those
between shareholders and managers, and those between debt holders and equity
holders. They postulate that conflicts between shareholders and managers occur
since managers hold less than one hundred percent of the residual claim.
Managers do not capture the entire gain from these activities, but they do bear the
entire cost of these activities by foregoing expenditures that would benefit them
personally, for example. Therefore managers overindulge in personal pursuits at
the expense of maximising the value of the firm.
Harris and Raviv (1990) share a common concern regarding manager- shareholder
conflicts. They postulate that managers and shareholders may disagree over the
firm’s operating decisions. Managers tend to prefer to continue the firm’s
operations even if liquidation of the firm is preferred by shareholders. Stulz (1990)
support the manager-shareholder conflict argument from a different angle, stating
that managers look to invest all available funds even if paying out cash is more
suitable for shareholders.

14
All of the aforementioned offer mitigation to manager-shareholder conflict by
recommending the issuance of debt. Jensen and Meckling (1976) find that this
conflict is reduced and even mitigated relative to the percentage of equity the
manager holds in the firm. If the manager’s equity stake in the firm is held constant
while the level of debt increases, this results in an increase in the manager’s share
of equity, thereby mitigating the loss from conflict between the manager and the
shareholder. Jensen (1986) and Stulz (1990) add to the discussion on the
mitigation of manager-shareholder conflict by stating that since debt commits the
firm to pay out cash it reduces the amount of cash available for management to
engage in personal pursuits. Therefore, the mitigation of conflicts between
managers and equity holders constitutes one benefit of debt financing. Harris and
Raviv (1990) assert that debt gives debt holders, who are also investors in the firm,
the option of forcing liquidation if cash flows are poor. Grossman and Hart (1982)
offer a further benefit of debt financing, stating that bankruptcy is costly for
managers who are concerned with losing control and they should therefore focus
on efficient utilisation of firm resources to reduce the probability of bankruptcy.
Short-term debt maturity has the additional benefit of reducing agency costs since
in this instance management is more frequently monitored by underwriters and
debt holders. Stulz (2000) support this notion and Rajan and Winton (1995) concur
that short-term debt facilitates effective monitoring with minimum effort.

15
Capital structure is determined by trading off the benefits of debt against the costs
of debt (Harris and Raviv, 1991). Harris and Raviv (1990) also indicate that
investor control through bankruptcy requires additional costs in order to produce
information useful in the liquidation decision. Stulz (1990) asserts that debt
payments reduce free cash flow, thereby reducing funds available for investment in
profitable opportunities.
Several authors have pointed out that agency problems can be reduced by utilising
managerial incentive schemes, financial securities or stock ownership. Datta,
Iskandar-Data and Raman (2005) also prove that managerial stock ownership
improves the relationship between credit quality and debt maturity and between
growth opportunities and debt maturity. Their findings support Stulz’s (2000)
findings relating to the use of short term debt as a monitoring tool and are also
consistent with Johnson’s (2003) finding where that managers with high equity
ownership choose a higher proportion of short term debt.
The second type of conflict identified by Jensen and Meckling (1976) was the
conflict between debt holders and equity holders. They postulate that the debt
contract gives equity holders an incentive to invest sub-optimally. If firms are
successful and yield a large return above the cost of debt, the equity holders enjoy
most of the benefit, however if the firm fails, the debt holders bear most of the loss
due to limited liability. Denis and Milov (2002) contend that a firm’s decision to

16
borrow funds implies that it will be monitored by the debt holder and this constitutes
a control mechanism discretionally chosen by the firm. De Andres Alonso,
Inturriaga, Sanz and Gonzalez (2005) concur with this postulation in proposing that
this course of action is also a public signal of a commitment to self-regulation,
which reduces debt agency costs.
2.3.4 Life stage theory
“The basic premise of organisational life stage theory is that firms – in a similar
fashion to living organisms – progress through a set of life stages that starts at birth
and ends in death” (Frielinghaus, Mostert and Firer, 2005, p. 9).
According to Bender and Ward (1993) the capital structure of a firm may be
influenced by its life stage, since financing needs may change as a firm’s
circumstances do. They also maintain that business risk reduces over the life
stages of a firm, allowing financial risk to increase. Adizes (1979) concludes that
organisations have typical patterns of behaviour at each life stage. He observes
that organisation life stages are defined by the interrelationship of flexibility and
control, and concludes that they are not influenced by a company’s chronological
age, sales or the number of its assets (Aldizes, 1996).
Hovakimiam, Opler and Titman (2001) state that firms should use a higher ratio of
debt to fund assets, however for high growth opportunities more equity should be

17
utilised. They should therefore use progressively more debt in their debt to equity
ratio as they mature. Frielinghaus, Mostert and Firer (2005) also conclude that
capital structure life stage theory asserts that more debt should be utilised by firms
as they mature. However they also note that little has been done to test this theory
empirically. Finally, based on the scarcity of available information, life stage theory
suggests, in agreement with static trade-off theory, that debt ratios should follow a
low-high-low pattern over the life of a firm.
2.3.5 Information Asymmetry Theory
The information asymmetry theory of capital structure is credited to the work of
Ross (1977). He posits that firm managers possess more information about the
future prospects of the firm than the market. Therefore management’s choice of
capital structure may provide the market with signals of a firm’s future prospects.
Increasing leverage would signal to the market that a firm’s managers are
confident about servicing the interest charge, and are hence confident about the
future prospects of the firm. Therefore an increase in leverage would increase the
value of the firm since investors would deem this to be a positive signal of the size
and stability of future cash flows.
Fama and French (1988) disagreed with this notion, arguing that more profitable
firms tend to have lower levels of debt. In this case increasing debt would signal
poor future prospects for the firm, since future earnings will be impacted negatively

18
due to cash flow being used to service debt, reducing the amount or money
available to fund future development. Raju and Roy (2000) establish that the value
of available information contributing to firm profitability is higher for larger
companies and is higher for industry sectors where there is intense competition.
Therefore the release of credible information by managers affects the performance
of a firm and has an impact on the perceptions held by the external market about a
firm.
Finally, Liu (2006) asserts that there is an increase in monitoring of a firm as the
size of external financing increases. This serves as a mitigating factor against the
challenges of information asymmetry and agency costs as mentioned earlier. Stulz
(2000) and Rajan and Winton (1995) also support this notion. Implicitly, this lends
support to pecking order theory, where managers prefer internal funds before
looking outside of the firm to raise funds in capital markets.
2.4 The influence of industry on capital structure
Schwartz and Aronson’s (1967) research concludes that the capital structures of
firms in different industries are different from each other. They infer that capital
structure in an industry is influenced by operational risk and asset structure. They
also indicate that the capital structure in specific industry sectors over time is

19
dynamic, given a firm’s pursuit to maximise value. Porter (2004) also asserts that a
firm’s economic environment is associated with the industry in which it competes.
Barclay, Smith, and Watts (1995) find that leverage is high for regulated firms and
firms in low-tech industries, and is low in high-tech industries. Jensen and
Meckling (1976) state that industries in which opportunities for asset distribution
are more limited, will have higher levels of debt. Therefore regulated public entities,
banks, and firms in mature industries with few growth opportunities will be more
highly levered. They also maintain that firms for which slow or even negative
growth is optimal and that have large cash inflows from operations should have
more debt. Datta, Iskhandar-Datta and Raman (2005) agree and show that firm’s
with high growth opportunities have more long term debt in their capital structure.
However Jensen (1986) posit that firms with an abundance of good investment
opportunities can be expected to have low debt levels relative to firms in mature,
slow-growth, cash-rich industries. Powell’s (1996) research on how much does
industry matter, concludes that industry membership explains between seventeen
to twenty percent of the financial performance variance amongst firms. This
supports his argument that industries compete for capital and other resources and
that under certain conditions, firms in some industries could have a sustainable,
albeit shared, advantage.

20
Maio (2005) in his on optimal capital structure and industry dynamics concludes
the following:
1. Industries with high technology growth have lower average debt.
2. Industries with risky technology have lower average debt.
3. Industries with high bankruptcy costs have lower average debt.
4. Industries with high fixed operating costs have lower average debt.
5. Industries with high entry costs have higher average leverage.
2.5 The Influence of Interest rates on capital structure.
Ju and Ou-Yang (2006) posit that traditional capital structure models assume
constant risk-free interest rates. However Goldstein, Ju and Leland (2001) show
that optimal capital structure is very sensitive to the changes in the level of the
interest rate. They also claim that the interest rate is a key input in the dynamic
models on capital structure. Furthermore in their model, the trade-off between tax
shields and bankruptcy costs associated with debts yields an optimal capital
structure. Ju and Ou-Yang (2006) find that in addition to the long run mean of the
interest rate process, the volatility of the interest rate process and the correlation
between the interest rate process and a firm’s asset value play minor roles in
determining the debt maturity structure. Hyde (2007) states that changes in interest

21
rates will alter a firm’s financing costs, affecting the amount of loan interest and
principle payments, and ultimately impact a firm’s cash flows.
Choi, Elyasiani, and Kopecky (1992) and Choi, and Elyasiani (1997) investigate
the sensitivity of bank share returns to market, interest and exchange rates and
find that all significant interest rate betas are negative. Joseph (2002) in modelling
the impacts of interest rate and exchange rate changes on UK stock returns, his
study of UK stock returns finds that interest rates changes have a greater impact
on stock returns than changes in exchange rates. Finally Hyde (2007) concludes
that the industrial sectors in France and Germany are exposed to significant levels
of interest rate risk, while this is not the case in Italy. He also states that
unexpected changes in real interest rates contain significant information about
future cash flows and future excess returns.
2.6 The influence of firm level characteristics on capital structure.
A number of firm level characteristics have been identified in previous empirical
research. Amidu (2007) posits that theoretical constructs of any empirical research
are proxied indirectly through the use of firm level research. These include
profitability, growth, asset structure, firm size, firm risk and taxation.

22
2.6.1 Profitability
Firm financial performance has been identified as a potential determinant of capital
structure. According to the trade-off theory, profitable firms will incur more debt
since they are likely to have a high tax burden and a low risk of bankruptcy
(Ooi,1999). However, Myers (1984) argues that successful companies do not need
to place much dependence on external funding, since they rely on internal
reserves. Hence, there is a negative relationship between debt and profitability.
Titman and Wessels (1988) concur with this argument.
2.6.2 Growth
The relationship between growth and capital structure can be explained using
pecking order theory. Growing firms place a higher demand on internal reserves,
and as Marsh (1982) posits, firms with high growth will have relatively high debt
ratios. However Myers (1977) argues that the value of debt is inversely
proportionate to the ratio of the value of growth over the maximised market value of
the firm. Titman and Wessels (1988) add to the argument by stating that growth
opportunities are capital assets that add value to a firm, however since these
assets do not generate current taxable income they cannot be collateralised.
Therefore, they argue, there is a negative relationship between debt and a firm’s
growth opportunities.

23
2.6.3 Asset Structure
Asset structure is an important determinant of a firm’s capital structure. The degree
to which a firm’s assets are tangible should result in a firm having a greater
liquidation value (Harris and Raviv, 1991). Prior studies have proven that leverage
is positively associated with a firm’s assets. In agreement with this finding, Myers
(1977) states that tangible assets can support a higher level of debt than intangible
assets.
2.6.4 Firm Size
Titman and Wessels (1988) assert that larger firms are more diversified and are
therefore less susceptible to bankruptcy than smaller firms. Rajan and Zingales
(1995) also hold that there is a positive relationship between firm size and
leverage.
2.6.5 Firm Risk
Agency and bankruptcy costs are incentives for a firm not to exhaust the tax
benefits presented by debt. The more likely a firm is to be exposed to such costs,
the greater its incentive will be to reduce its level of debt. A firm’s operating risk
impacts on the likelihood of this exposure. Firms with relatively higher operating
risk have volatile earnings, and therefore a higher chance of defaulting. Such firms
will have incentives to have a lower leverage than firms with stable earnings.

24
Empirical evidence supports this by postulating a negative relationship between
risk and leverage (Ooi, 1999; Titman and Wessels, 1988).
2.6.6 Taxation
Authors on capital structure have given different interpretations on the impact of
taxation on corporate finance decisions. Mackie-Mason (1990), in his study on the
impact of tax on corporate financing decisions, provides evidence that tax has a
significant influence on choices between debt and equity. He concludes that
changes in the marginal tax rate should affect financing decisions. A firm with a
high tax shield is less likely to finance with debt, since tax shields lower the
effective marginal tax rate on interest deductions. Graham (1996) concludes that,
in general, taxes do affect corporate finance decisions, but the extent of this effect
is insignificant. On the other hand, DeAngelo and Masulis (1980) show that there
are alternative tax shields such as depreciation, research and development costs
and investment deductions that can substitute the role of debt. Titman and
Wessels (1988) conclude that the substitution effect is difficult to measure as
finding an accurate proxy for tax reduction that excludes the effect of economic
depreciation and expenses is arduous.

25
2.7 Literature summary
The literature review above provides a summary of the various views and theories
held with regard to capital structure. The theories considered here are as follows:
• Pecking order theory proposes that firms follow a hierarchy in their capital
structure choice, especially with regard to debt..
• Trade-off theory states that firms endeavour to maximise returns by
balancing the benefits of the tax shield that debt affords the firm against the
possibility of bankruptcy brought upon by increased debt.
• Agency cost theory asserts that the capital structure of a firm is influenced
by management personnel who are conflicted by their pursuit of personal
enrichment before the maximisation of shareholder value.
• Life-stage theory holds that a firm’s capital structure is influenced by the life
stage of the firm.
• Information asymmetry theory states that since managers have more
information on the future of the firm, their decisions on capital structure
could provide signals to the market on the firm’s future.
• The theory also establishes that a firm’s capital structure is influenced by
the industry it belongs to as well as the interest rate market.

26
An additional influence on capital structure is firm level characteristics including
profitability, growth, asset structure, firm size, firm risk and taxation.

27
3. Research Hypothesis
The research hypotheses below are based on accounting concepts and ratios
defined by Firer et al (2004).
3.1 Hypothesis 1:
The null hypothesis states that an increase in leverage (D/E ratio) for a firm
decreases firm value. The alternative hypothesis states that a change in leverage
(D/E ratio) for a firm increases firm value.
The proxy for firm value is Earnings Per Share (EPS), Price Earnings ratio (P/E),
Return on Equity (ROE), Return on Assets (ROA), Economic Value Added (EVA)
and Operating Profit Margin (OPM)
3.2 Hypothesis 2:
The null hypothesis states that an increase in interest rates has no impact on firm
leverage. The alternative hypothesis states that a change in interest rates does
have an impact on firm leverage.

28
4. Research Methodology
4.1 Introduction
The research methodology utilised was causal research. An attempt was made to
identify cause and effect relationships between financial leverage and firm value as
well as between the change in interest rates and capital structure (Zikmund, 2003).
The research method employed involved quantitative analysis of secondary data.
Information relating to the sample firms’ financial performance and capital structure
provided in the companies’ annual financial statements was sourced from the
McGregor BFA online database. The research analysis was confined to firms that
were listed on the Johannesburg Stock Exchange (JSE).
4.2 Population and Unit of Analysis
4.2.1 Population
According to Welman and Kruger (2005), population can be defined as individuals,
groups, organisations, human products and events and the conditions to which that
population is exposed. Therefore the proposed population of relevance was

29
companies listed on the JSE Main Board for July 2008. The total number of
companies listed on the main board of the JSE numbered 348 (JSE, 2008).
4.2.2 Unit of Analysis
The unit of analysis was a firm listed on the JSE.
4.3 Sample Size and Selection
According to Zikmund (2003) a sample is a subset from a larger population,
sampling involves any procedure that uses a portion of a population to infer
conclusion about the population.
From the total population the sample selected was stratified by industry sector in
order better to understand the characteristics of the homogenous subsets (Albright,
2006). Therefore the JSE data was categorised by industry sector. All firms listed
in the financial services sector, the mining sector and industrial metals sector were
removed. The reason for their removal is that financial services firms’ capital
structures are regulated with regard to their capital holding (Santos, 2001). The
data for the mining sector companies did not contain information critical to the
analysis, such as debt to equity ratios and Economic Value Added (EVA)

30
information. After the removal of the aforementioned firms a total of 206 firms
remained in the sample.
The next part of the selection required that all companies in the sample were listed
on the JSE for the period 1997 to 2007. An integral part of the analysis was to
conduct a longitudinal study over a ten year period in order to identify any existing
relationship between changes in interest rates and capital structure for South
African firms during that period. For this reason any firm listed for a period less
than 10 years was deleted from the sample.
After this selection process, the sample size was 113 firms. The final selection of
firms and their respective industries are listed in Appendix A.
4.4 Data collection
Secondary data was sourced to undertake the analysis. Financial stock exchange
data was obtained from McGregor BFA. McGregor is the pre-eminent provider of
stock market, fundamental research data and news. The information provided
includes standardised information including history since 1971. All standardisation
31
is carried out by the bureau for Financial Analysis. Therefore the information
provided is both comprehensive and accurate.
Information relating to local interest rates was sourced from the South African
Reserve Bank Website
4.5 Proposed data analysis
The use of quantitative analysis has become increasingly important. Quantitative
techniques are now considered an effective aid in solving management problems
(Richard, 1992). Capital Structure was the independent variable and all the
profitability and growth ratios, as well as the shareholder and market values, were
the dependant value.
Financial statements are useful, from an investor’s perspective, for predicting
future earnings, dividends and free cash flows. From a management perspective,
they provide insight into future conditions and provide a point of departure for
planning how best to effect improved performance (Erhardt and Brigham, 2006).
The financial performance of the sample firms has been analysed using the
technique of ratio analysis. Conducting comparisons using ratios avoids the
problem of comparing companies of different sizes (Firer et al., 2004). Ratios can

32
be grouped into the following five categories: profitability, solvency, liquidity,
financial efficiency and debt capacity.
The following paragraphs provide some theoretical background on the relevance of
financial ratios utilised as a measure of a firm’s financial performance. Based on
Atrill (2000), the following broad categories of ratios should be considered:
• Profitability Ratios – profitability ratios provide an insight into the degree of
success in creating wealth for the shareholders by assessing the effects of
liquidity, asset management and debt on operating results. The focus is on
bottom line net profit.
• Gearing Ratios - gearing ratios provide an indication of the capital structure
of the firm and provide information to assist in making financial decisions.
The relationship between the amount financed by the shareholders and the
amount contributed by outsiders has an impact of the degree of risk to the
firm.
• Investment Ratios – these ratios provide an indication of the returns and
performance of shares held in a firm. They are useful to both internal and
external stakeholders of the firm.
A more in-depth look into the respective ratios that are classified under the
aforementioned broad categories will now be considered.

33
4.5.1 Debt/ Equity (D/E) Ratio
The extent to which a firm uses debt funding or financial leverage has implications
for the firm. By raising funds through debt, shareholders are able to maintain
control without having to increase investment. If a firm earns more on investments
financed with debt than the interest due on debt, then shareholders returns are
leveraged (Erhardt and Brigham, 2006). Firer et al. (2004) state that capital
structure is the relative amount of debt and equity a firm utilises to finance its
operational activities. As mentioned previously, according to trade-off theory debt
offers the benefit of a tax shield, but also increases the likelihood of bankruptcy.
4.5.2 Return on Assets (ROA)
Return on assets is a measure of a firm’s profit generated relative to its investment
in assets. It provides an indication of whether a firm’s assets are under- or over-
utilised. It is thus an indicator of operating performance (Firer et al., 2004).
4.5.3 Return on Equity (ROE)
Return on equity measures the return investors derive as a result of investing in the
firm. Since it measures net profit after tax over total equity, it takes into
consideration all costs including the cost of debt and taxes (Firer et al., 2004). ROE
is therefore an important parameter for judging the performance of a company from

34
the shareholders point of view. In general, shareholders continue to stay invested
in a company as long as they are receiving a good return (Bardia, 2008).
4.5.4 Operating Profit Margin
The operating profit margin provides an indication of the profit derived from sales
prior to any operational costs. It provides amongst other things an indication of firm
efficiency (Firer et al., 2004).
4.5.5 Earnings per Share (EPS) and Price Earnings (P/E) Ratio
Firer et al. (2004) state that an earnings per share figure is derived when net profit
is expressed on a per share basis. The price earnings ratio provides an indication
of what the market is prepared to pay for a share based on their perception of the
quality of the future earnings of a firm (Firer et al., 2004; and Stern (1970).
4.5.6 Economic Value Added (EVA)
Economic Value Added (EVA) is used to evaluate the overall financial performance
of a firm. According to this concept, all companies that earn a higher return than
overall cost of capital (including the cost of equity) create value for shareholders,
while those firms that earn a lower return than overall cost of capital destroy
shareholder value (Bacidore, Boquist, Milbourn and Thakor, 1997). In simple
words, EVA is the difference between net operating profit after tax and the cost of

35
capital (Stern, 1990). EVA is the residual income after charging the cost of capital
provided by lenders and shareholders (Ehrbar and Stewart, 1999). Ottosson and
Weissenreider (1996) state that EVA will increase if:
• Operating profit grows without employing more capital.
• Further capital is introduced in profitable growth projects.
• Activities that do not cover the total cost of capital employed are
discontinued.
4.6 Quantitative Analysis
The study was carried out by quantitative analysis of financial information using
appropriate statistical techniques. The technique utilised in this study was
regression analysis.
Regression analysis was used to determine the relationship between the variation
in firm value and capital structure. Regression analysis is a statistical technique
that is used to determine the value relationship between a dependant and an
independent variable. Regression analysis is one of the most pervasive of all
statistical analysis methods due to its generality and applicability although it does
not account for cause- and-effect relationships (Albright, Winston and Zappe,

36
2006). The debt to equity ratio was used as a proxy for capital structure and the
following ratios were used for firm value: ROE, ROA, EPS, PE ratio, operating
margin and EVA.
This initial test was carried out on the entire sample size to gain insight into the
market. Analysis was also carried out by industry sector. The above sample data
and analysis was stratified by industry sector in order to establish the correlation
between firm value and capital structure according to industry sector.
Regression analysis was also carried out to establish the relationship between
capital structure and interest rates in South Africa over the last ten years. The
analysis sought to prove Goldstein et al.’s (2001) assertion that capital is very
sensitive to interest rate changes.
The various tests were conducted with a 95% confidence interval. The confidence
interval is the set of acceptable hypotheses or the level of probability associated
with an interval estimate (Zikmund, 2003).

37
4.7 Potential research limitations
The research conducted in this project had the following limitations:
• It was restricted to the financial data of firms listed on the JSE for the last
ten years (1997-2007). It therefore does not represent time periods beyond
this.
• In order to qualify to meet the criteria for inclusion in the sample firms had to
be listed on the JSE for the 10 year period assessed. This might have
resulted in sample bias (Zikmund, 2003).
• It will focus on companies listed on the JSE only and therefore does not
represent unlisted companies or companies listed on other stock
exchanges.
• The interest rate study lacked sufficient data points due to the availability of
annual results only.

38
5. Presentation of Results
5.1 Introduction
The results are presented below and are in the form of tables for ease of reference.
An attempt will be made to draw inferences from the data in relation to the
hypothesis previously set out.
5.2 Hypothesis 1: Financial Leverage and Firm Value
The results for the impact of leverage on firm value provide evidence that a
relationship does exist in the market. The results also point towards a negative
relationship between financial leverage and firm value. The independent variable,
financial leverage , represented by the debt-equity ratio was found to be correlated
with the dependant variable, represented by the following ratios, return on equity,
return on assets, earnings per share, economic value added, and operating profit
margin. The dependent and independent variables show a significant correlation.
However for some industries, the healthcare industry, for example, the results
indicate no significant correlation between the variables.
With regard to the various proxies for the firm value ratios, in general the ROE,
ROA, and OPM ratios show a significant correlation to the D/E ratio. However the
results for EVA in all cases show no significant correlation.

39
Regression analysis was conducted on data over the ten year period to determine
a correlation between the variables if any. The tests were all conducted using a
confidence level of 95%. According to Zikmund (2003), the confidence level
estimates a range within which the population mean is expected to fall. A
confidence level is a percentage that indicates the long-run probability that the
results will be correct. Therefore the first step is to check if the population mean is
below the 95% confidence interval. Thereafter, it is necessary to check whether the
correlation is positive or negative. This will be indicated by the sign in the
parameter estimate on the table: a positive sign will signify a positive relationship
and a negative sign will indicate an inverse relationship between the variable.
Finally, the actual percentage or decimal of the correlation coefficient determines
the degree to which the independent variable explains the dependant variable.
The tables below will provide the results for the market and thereafter the results
for the various industries will also be considered.

40
Table 1 – D/E and Firm Value for the Market
Dependant Variable
Industry Sample Size
Probability R-square
Parameter Estimate
ROE Market 113 0.0001 0.6500 -65.234 ROA Market 113 0.0001 0.0667 -1.6371 EVA Market 113 0.8015 0.0001 3,424 OPM Market 113 0.0280 0.0057 -1.105 EPS Market 113 0.0092 0.0060 -11014 PE Market 113 0.2480 0.0012 -0.0479
Return on Equity – At a significance level α = 5% there is a significant negative
correlation between the debt-equity ratio and return on equity. An increase in the
debt-equity ratio is associated with a decrease in the return on equity ratio. Finally
65% of the value of return on equity can be explained by the debt-equity ratio for
the market.
Return on Assets – At a significance level α = 5% there is a significant negative
correlation between the debt-equity ratio and return on assets. An increase in the
debt-equity ratio is associated with a decrease in the return on asset ratio. Finally,
6.67% of the value of return on equity can be explained by the debt-equity ratio for
the market.
Economic Value Added - At a significance level α = 5% there is no significant
correlation between the debt-equity ratio and return on assets for the market.

41
Operating Profit Margin – At a significance level α = 5% there is a significant
negative correlation between the debt-equity ratio and operating profit margin. An
increase in the debt-equity ratio is associated with a decrease in the operating
profit margin. Finally, 0.57% of the value of return on equity can be explained by
the debt-equity ratio for the market.
Earnings Per Share – At a significance level α = 5% there is a significant negative
correlation between the debt-equity ratio and earnings per share. An increase in
the debt-equity ratio is associated with a decrease in the earnings per share.
Finally, 0.6% of the value of earnings per share can be explained by the debt-
equity ratio for the market.
Price Earnings Ratio – At a significance level α = 5% there is no significant
correlation between the debt-equity ratio and the price earnings ratio for the
market.

42
Table 2 – D/E and Firm Value for the Basic Materials Sector
Dependant Variable
Industry Sample Size
Probability R-square
Parameter Estimate
ROE Basic Materials 5 0.0080 0.1752 -14.531 ROA Basic Materials 5 0.0067 0.1821 -10.605 EVA Basic Materials 5 0.0016 0.2379 -1,625,100 OPM Basic Materials 5 0.2871 0.0004 -9.284 EPS Basic Materials 5 0.9613 0.0000 3.906 PE Basic Materials 5 0.0334 0.0908 -30.146
Return on Equity – At a significance level α = 5% there is a significant negative
correlation between the debt-equity ratio and return on equity. An increase in the
debt-equity ratio is associated with a decrease in the return on equity ratio. Finally,
17.52% of the value of return on equity can be explained by the debt-equity ratio
for the basic materials sector.
Return on Assets – At a significance level α = 5% there is a significant negative
correlation between the debt-equity ratio and return on assets. An increase in the
debt-equity ratio is associated with a decrease in the return on asset ratio. Finally,
18.21% of the value of return on equity can be explained by the debt-equity ratio
for the basic materials sector.
Economic Value Added - At a significance level α = 5% there is a significant
negative correlation between the debt-equity ratio and EVA. An increase in the

43
debt-equity ratio is associated with a decrease in EVA. Finally, 23.7% of the value
of return on equity can be explained by the debt-equity ratio for the basic materials
sector.
Operating Profit Margin – At a significance level α = 5% there is a significant
negative correlation between the debt-equity ratio and operating profit margin. An
increase in the debt-equity ratio is associated with a decrease in the operating
profit margin. Finally, 0.04% of the value of return on equity can be explained by
the debt-equity ratio for the basic materials sector.
Earnings per Share – At a significance level α = 5% there is no significant
correlation between the debt-equity ratio and earnings per share for the basic
materials sector.
Price Earnings Ratio – At a significance level α = 5% there is a significant
negative correlation between the debt-equity ratio and the price earnings ratio. An
increase in the debt-equity ratio is associated with a decrease in the operating
profit margin. Finally, 9.08% of the value of the price earnings ratio can be
explained by the debt-equity ratio for the basic materials sector.

44
Table 3 – D/E and Firm Value for the Consumer Goods Sector
Dependant Variable
Industry Sample Size
Probability R-square
Parameter Estimate
ROE Consumer Goods 22 0.0001 0.8911 -88.181
ROA Consumer Goods 22 0.0001 0.3302 -1.601
EVA Consumer Goods 22 0.4980 0.0029 12,795
OPM Consumer Goods 22 0.3645 0.0052 -0.469
EPS Consumer Goods 22 0.2470 0.0061 -9.222
PE Consumer Goods 22 0.4475 0.0026 -0.2273
Return on Equity – At a significance level α = 5% there is a significant negative
correlation between the debt-equity ratio and return on equity. An increase in the
debt-equity ratio is associated with a decrease in the return on equity ratio. Finally,
89.11% of the value of return on equity can be explained by the debt-equity ratio
for the consumer goods sector.
Return on Assets – At a significance level α = 5% there is a significant negative
correlation between the debt-equity ratio and return on assets. An increase in the
debt-equity ratio is associated with a decrease in the return on asset ratio. Finally,
33.02% of the value of return on equity can be explained by the debt-equity ratio
for the consumer goods sector.

45
Economic Value Added - At a significance level α = 5% there is no significant
correlation between the debt-equity ratio and EVA for the consumer goods sector.
Operating Profit Margin – At a significance level α = 5% there is no significant
correlation between the debt-equity ratio and operating profit margin for the
consumer goods sector.
Earnings per Share – At a significance level α = 5% there is no significant
correlation between the debt-equity ratio and earnings per share for the consumer
goods sector.
Price Earnings Ratio – At a significance level α = 5% there is no significant
correlation between the debt-equity ratio and the price earnings ratio for the
consumer goods sector.

46
Table 4 – D/E and Firm Value for the Consumer Services Sector
Dependant Variable Industry Sample
Size Probability R-square
Parameter Estimate
ROE Consumer Services 31 0.0008 0.0569 -11.669
ROA Consumer Services 31 0.0015 0.0517 -4.0623
EVA Consumer Services 31 0.1525 0.0107 72,883
OPM Consumer Services 31 0.0001 0.0796 -4.721
EPS Consumer Services 31 0.0152 0.0203 -24.046
PE Consumer Services 31 0.0050 0.0411 -3.654
Return on Equity – At a significance level α = 5% there is a significant negative
correlation between the debt-equity ratio and return on equity. An increase in the
debt-equity ratio is associated with a decrease in the return on equity ratio. Finally,
5.69% of the value of return on equity can be explained by the debt-equity ratio for
the consumer services sector.
Return on Assets – At a significance level α = 5% there is a significant negative
correlation between the debt-equity ratio and return on assets. An increase in the
debt-equity ratio is associated with a decrease in the return on asset ratio. Finally,
5.17% of the value of return on equity can be explained by the debt-equity ratio for
the consumer services sector.

47
Economic Value Added - At a significance level α = 5% there is no significant
correlation between the debt-equity ratio and EVA for the consumer services
sector.
Operating Profit Margin – At a significance level α = 5% there is a significant
negative correlation between the debt-equity ratio and operating profit margin. An
increase in the debt-equity ratio is associated with a decrease in the operating
profit margin. Finally, 7.96% of the value of return on equity can be explained by
the debt-equity ratio for the consumer services sector.
Earnings Per Share – At a significance level α = 5% there is a significant negative
correlation between the debt-equity ratio and earnings per share. An increase in
the debt-equity ratio is associated with a decrease in the earnings per share.
Finally, 2.03% of the value of earnings per share can be explained by the debt-
equity ratio for the consumer services sector.
Price Earnings Ratio – At a significance level α = 5% there is a significant
negative correlation between the debt-equity ratio and the price earnings ratio. An
increase in the debt-equity ratio is associated with a decrease in the operating
profit margin. Finally, 4.11% of the value of the price earnings ratio can be
explained by the debt-equity ratio for the consumer services sector.

48
Table 5 – D/E and Firm Value for the Healthcare Sector
Dependant Variable
Industry Sample Size
Probability R-square
Parameter Estimate
ROE Health Care 3 0.9940 0.0000 0.094121 ROA Health Care 3 0.3412 0.0324 -4.838 EVA Health Care 3 0.2812 0.0413 -110,297 OPM Health Care 3 0.4182 0.0235 -3.240 EPS Health Care 3 0.1347 0.0781 -28.320 PE Health Care 3 0.0018 0.2995 7.511
Return on Equity – At a significance level α = 5% there no significant correlation
between the debt-equity ratio and return on equity for the healthcare sector.
Return on Assets – At a significance level α = 5% there is no significant
correlation between the debt-equity ratio and return on assets for the healthcare
sector.
Economic Value Added - At a significance level α = 5% there is no significant
correlation between the debt-equity ratio and EVA for the healthcare sector.
Operating Profit Margin – At a significance level α = 5% there is no significant
correlation between the debt-equity ratio and operating profit margin for the
healthcare sector.

49
Earnings per Share – At a significance level α = 5% there is no significant
correlation between the debt-equity ratio and earnings per share for the healthcare
sector.
Price Earnings Ratio – At a significance level α = 5% there is a significant positive
correlation between the debt-equity ratio and the price earnings ratio. An increase
in the debt-equity ratio is associated with a decrease in the operating profit margin.
Finally, 29.95% of the value of the price earnings ratio can be explained by the
debt-equity ratio for the healthcare sector.
Table 6 – D/E and Firm Value for the Industrials Sector
Dependant Variable
Industry Sample Size
Probability R-square
Parameter Estimate
ROE Industrials 41 0.0001 0.3213 -15.546 ROA Industrials 41 0.0117 0.0485 -0.752 EVA Industrials 41 0.5799 0.0009 (3,428) OPM Industrials 41 0.2350 0.0043 -1.645 EPS Industrials 41 0.1629 0.0047 -8.802 PE Industrials 41 0.9575 0.0000 -0.0596

50
Return on Equity – At a significance level α = 5% there is a significant negative
correlation between the debt-equity ratio and return on equity. An increase in the
debt-equity ratio is associated with a decrease in the return on equity ratio. Finally,
32.13% of the value of return on equity can be explained by the debt-equity ratio
for the industrials sector.
Return on Assets – At a significance level α = 5% there is a significant negative
correlation between the debt-equity ratio and return on assets. An increase in the
debt-equity ratio is associated with a decrease in the return on asset ratio. Finally,
4.85% of the value of return on equity can be explained by the debt-equity ratio for
the industrials sector.
Economic Value Added - At a significance level α = 5% there is no significant
correlation between the debt-equity ratio and EVA for the industrials sector.
Operating Profit Margin – At a significance level α = 5% there is no significant
correlation between the debt-equity ratio and operating profit margin for the
industrials sector.
Earnings per Share – At a significance level α = 5% there is no significant
correlation between the debt-equity ratio and earnings per share for the industrials
sector.

51
Price Earnings Ratio – At a significance level α = 5% there is no significant
correlation between the debt-equity ratio and the price earnings ratio for the
industrials sector.
Table 7 – D/E and Firm Value for the Oil & Gas Sector
Dependant Variable
Industry Sample Size
Probability R-square
Parameter Estimate
ROE Oil & Gas 1 0.0680 0.7229 -65.796 ROA Oil & Gas 1 0.0800 0.6936 -54.829 EVA Oil & Gas 1 0.0703 0.7171 -42,991,649 OPM Oil & Gas 1 0.1008 0.6469 -71.213 EPS Oil & Gas 1 0.1961 0.1991 2496.3 PE Oil & Gas 1 0.5042 0.0576 -3.523
Return on Equity – At a significance level α = 5% there no significant correlation
between the debt-equity ratio and return on equity for the oil and gas sector.
Return on Assets – At a significance level α = 5% there is no significant
correlation between the debt-equity ratio and return on assets for oil and gas
sector.

52
Economic Value Added - At a significance level α = 5% there is no significant
correlation between the debt-equity ratio and EVA for the oil and gas sector.
Operating Profit Margin – At a significance level α = 5% there is no significant
correlation between the debt-equity ratio and operating profit margin for the oil and
gas sector.
Earnings per Share – At a significance level α = 5% there is no significant
correlation between the debt-equity ratio and earnings per share for the oil and gas
sector.
Price Earnings Ratio – At a significance level α = 5% there is no significant
correlation between the debt-equity ratio and the price earnings ratio for the oil and
gas sector.
Table 8 – D/E and Firm Value for the Technology Sector
Dependant Variable
Industry Sample Size
Probability R-square
Parameter Estimate
ROE Technology 7 0.0001 0.2796 -107.229 ROA Technology 7 0.0001 0.2838 -12.294 EVA Technology 7 0.2845 0.0188 149,513 OPM Technology 7 0.0001 0.2848 -8.823 EPS Technology 7 0.5676 0.0042 6.022 PE Technology 7 0.8804 0.0003 -0.3988

53
Return on Equity – At a significance level α = 5% there is a significant negative
correlation between the debt-equity ratio and return on equity. An increase in the
debt-equity ratio is associated with a decrease in the return on equity ratio. Finally,
27.96% of the value of return on equity can be explained by the debt-equity ratio
for the technology sector.
Return on Assets – At a significance level α = 5% there is a significant negative
correlation between the debt-equity ratio and return on assets. An increase in the
debt-equity ratio is associated with a decrease in the return on asset ratio. Finally,
28.38% of the value of return on equity can be explained by the debt-equity ratio
for the technology sector.
Economic Value Added - At a significance level α = 5% there is no significant
correlation between the debt-equity ratio and return on assets for the technology
sector.
Operating Profit Margin – At a significance level α = 5% there is a significant
negative correlation between the debt-equity ratio and operating profit margin. An
increase in the debt-equity ratio is associated with a decrease in the operating
profit margin. Finally, 28.48% of the value of return on equity can be explained by
the debt-equity ratio for the technology sector.

54
Earnings per Share – At a significance level α = 5% there is no significant
correlation between the debt-equity ratio and earnings per share for the technology
sector.
Price Earnings Ratio – At a significance level α = 5% there is no significant
correlation between the debt-equity ratio and the price earnings ratio for the
technology sector.
Table 9 – D/E and Firm Value for the Telecommunications Sector
Dependant Variable
Industry Sample Size
Probability R-square
Parameter Estimate
ROE Telecoms 3 0.0541 0.3238 -10.612 ROA Telecoms 3 0.0289 0.2386 -13.03 EVA Telecoms 3 0.3716 0.0446 1,970,432 OPM Telecoms 3 0.5998 0.0156 -4.710 EPS Telecoms 3 0.9090 0.0005 -19.693 PE Telecoms 3 0.3450 0.0319 -6.360
Return on Equity – At a significance level α = 5% there no significant correlation
between the debt-equity ratio and return on equity for the telecommunications
sector.

55
Return on Assets – At a significance level α = 5% there is a significant negative
correlation between the debt-equity ratio and return on assets. An increase in the
debt-equity ratio is associated with a decrease in the return on asset ratio. Finally,
28.38% of the value of return on equity can be explained by the debt-equity ratio
for the telecommunications sector.
Economic Value Added - At a significance level α = 5% there is no significant
correlation between the debt-equity ratio and EVA for the telecommunications
sector.
Operating Profit Margin – At a significance level α = 5% there is no significant
correlation between the debt-equity ratio and operating profit margin for the
telecommunications sector.
Earnings per Share – At a significance level α = 5% there is no significant
correlation between the debt-equity ratio and earnings per share for the
telecommunications sector.
Price Earnings Ratio – At a significance level α = 5% there is no significant
correlation between the debt-equity ratio and the price earnings ratio for the
telecommunications sector.

56
5.2.1 Descriptive Statistics for Capital Structure
The discussion below provides some insight into the median capital structure for
the market by industry. Capital structure, as mentioned before, is represented by
the debt-equity ratio. The trends will be evaluated by industry in accordance with
the previous findings.
Figure 2: Median capital structure for the market
Source: McGregor BFA (2008)
0
0.1
0.2
0.3
0.4
0.5
0.6
0.7
0.8
0.9
1
1998 1999 2000 2001 2002 2003 2004 2005 2006 2007
Market
Market

57
Figure 2, above, provides an indication of the median capital structure for the
market. Over the ten year period the debt-equity ratio is at 75% in 1998, peaks in
2004 at 94% and moves down to 64% in 2007.

54
Figure 3: Median capital structure by industry.
Source: McGregor BFA (2008)
0
0.2
0.4
0.6
0.8
1
1.2
1.4
1.6
1.8
2
1998 1999 2000 2001 2002 2003 2004 2005 2006 2007
Basic Materials
Consumer Goods
Consumer Services
Healthcare
Industrials
Oil & Gas
Technology
Telecoms
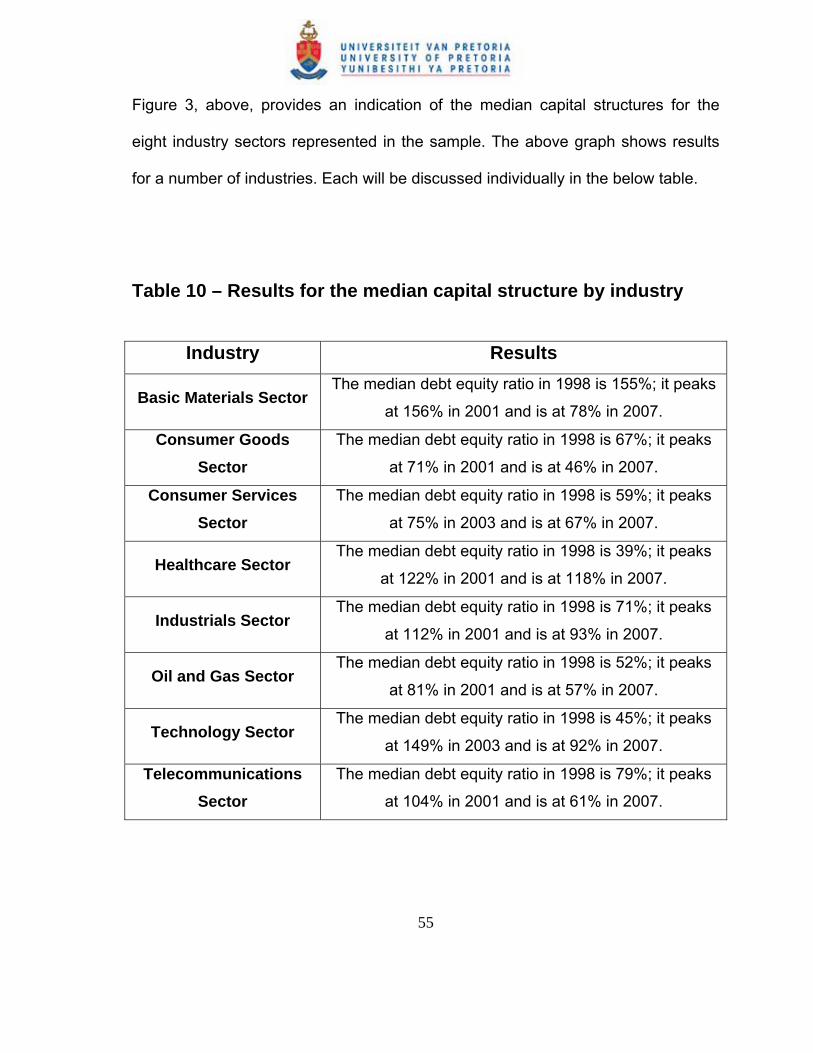
55
Figure 3, above, provides an indication of the median capital structures for the
eight industry sectors represented in the sample. The above graph shows results
for a number of industries. Each will be discussed individually in the below table.
Table 10 – Results for the median capital structure by industry
Industry Results
Basic Materials Sector The median debt equity ratio in 1998 is 155%; it peaks
at 156% in 2001 and is at 78% in 2007.
Consumer Goods Sector
The median debt equity ratio in 1998 is 67%; it peaks
at 71% in 2001 and is at 46% in 2007.
Consumer Services Sector
The median debt equity ratio in 1998 is 59%; it peaks
at 75% in 2003 and is at 67% in 2007.
Healthcare Sector The median debt equity ratio in 1998 is 39%; it peaks
at 122% in 2001 and is at 118% in 2007.
Industrials Sector The median debt equity ratio in 1998 is 71%; it peaks
at 112% in 2001 and is at 93% in 2007.
Oil and Gas Sector The median debt equity ratio in 1998 is 52%; it peaks
at 81% in 2001 and is at 57% in 2007.
Technology Sector The median debt equity ratio in 1998 is 45%; it peaks
at 149% in 2003 and is at 92% in 2007.
Telecommunications Sector
The median debt equity ratio in 1998 is 79%; it peaks
at 104% in 2001 and is at 61% in 2007.

56
5.3 Hypothesis 2: Interest Rates and Capital Structure
5.3.1 Interest rates and capital structure no lag
The results for the impact of interest rates on capital structure provide evidence
that no significant relationship exists between the two variables, both for the market
in general and the various sectors. Therefore, no inference can be made with
regard to a positive or a negative relationship between interest rates and capital
structure. The independent variable, which in this case is the interest rate, is
represented by the weighted annual average South African prime overdraft lending
rate. The dependant variable’s proxy is the debt-equity ratio.
The tables below will provide the results for the market and thereafter the results
for the various industries will be considered.

57
Table 11 – Interest Rates on Capital Structure
Dependant Variable
Industry Sample Size
Probability R-square
D/E Market 113 0.1766 0.0016 D/E Basic Materials 5 0.1116 0.0519 D/E Consumer Goods 22 0.2998 0.0049 D/E Consumer Services 31 0.6759 0.0006 D/E Health Care 3 0.8005 0.0023 D/E Industrials 41 0.4477 0.0014 D/E Oil & Gas 1 0.1040 0.2960 D/E Technology 7 0.2176 0.0194 D/E Telecommunications 3 0.2869 0.0404
Interest Rate: Market – At a significance level α = 5% there is no significant
correlation between interest rates and the debt-equity ratio for the market.
Interest Rate: Basic Materials Sector – At a significance level α = 5% there is no
significant correlation between interest rates and the debt-equity ratio for the basic
materials sector.
Interest Rate: Consumer Goods Sector– At a significance level α = 5% there is
no significant correlation between interest rates and the debt-equity ratio for the
consumer goods sector.

58
Interest Rate: Consumer Services Sector – At a significance level α = 5% there
is no significant correlation between interest rates and the debt-equity ratio for the
consumer services sector.
Interest Rate: Healthcare Goods Sector – At a significance level α = 5% there is
no significant correlation between interest rates and the debt-equity ratio for the
consumer goods sector.
Interest Rate: Industrials Sector – At a significance level α = 5% there is no
significant correlation between interest rates and the debt-equity ratio for the
industrials sector.
Interest Rate: Oil & Gas Sector – At a significance level α = 5% there is no
significant correlation between interest rates and the debt-equity ratio for the oil
and gas sector.
Interest Rate: Technology Sector – At a significance level α = 5% there is no
significant correlation between interest rates and the debt-equity ratio for the
technology sector.
Interest Rate: Telecommunications Sector – At a significance level α = 5% there
is no significant correlation between interest rates and the debt-equity ratio for the
telecommunications sector.

59
5.3.1.1 Descriptive statistics for the impact of interest rate on
capital structure.
In order to gain additional insight into any possible relationship between interest
rates and capital structure, the data was depicted graphically. Below are graphs for
three industries or sectors, the consumer goods sector, the consumer services
sector and the industrials sector. These three sectors contained the largest sample
sizes when the data was stratified by industry.
Figure 4: Interest rates on capital structure – consumer goods sector
Consumer Goods
1998_D /E1999_D /E
2000_D /E2001_D /E
2002_D /E2003_D /E
2004_D /E2005_D /E
2006_D /E2007_D /E
median CG (L) interest rates (R)
0.30
0.35
0.40
0.45
0.50
0.55
0.60
0.65
0.70
0.75
0.80
med
ian
CG
:
0.08
0.10
0.12
0.14
0.16
0.18
0.20
0.22
0.24
inte
rest
rate
s:

60
Figure 4 is a graphical depiction of interest rates on capital structure for the
consumer goods sector. The result displayed by the graph provides evidence in
support of the regression analysis finding that no significant correlation exists
between interest rates and capital structure for the consumer goods sector.
Figure 5: Interest rates on capital structure – consumer services sector
Consumer Services
1998_D /E1999_D /E
2000_D /E2001_D /E
2002_D /E2003_D /E
2004_D /E2005_D /E
2006_D /E2007_D /E
median CS (L) interest rates (R)
0.55
0.60
0.65
0.70
0.75
0.80
0.85
med
ian
CS
:
0.08
0.10
0.12
0.14
0.16
0.18
0.20
0.22
0.24
inte
rest
rate
s:

61
Figure 5 is a graphical depiction of interest rates on capital structure for the
consumer services sector. The result displayed by the graph provides evidence in
support of the regression analysis finding that no significant correlation exists
between interest rates and capital structure for the consumer services sector.
Figure 6: Interest rates on capital structure – industrials sector
Industrials
1998_D /E1999_D /E
2000_D /E2001_D /E
2002_D /E2003_D /E
2004_D /E2005_D /E
2006_D /E2007_D /E
median Ind (L) interest rates (R)
0.6
0.7
0.8
0.9
1.0
1.1
1.2
med
ian
Ind:
0.08
0.10
0.12
0.14
0.16
0.18
0.20
0.22
0.24
inte
rest
rate
s:

62
Figure 6 is a graphical depiction of interest rates on capital structure for the
industrials sector. The result displayed by the graph provides evidence in support
of the regression analysis finding that no significant correlation exists between
interest rates and capital structure for the industrials sector. For the period up to
2003 the interest rates tend downwards while the median capital structure for the
industry tends upwards. Thereafter the variable trend in directions shows no
significant correlation.
5.3.2 Interest rates and capital structure with one-year lag
A further test was conducted in which the debt-equity ratios were lagged by one
year in order to ascertain whether the relationship did in fact contain a lag. If this
were so, it would prove that the market reacts to a change in the interest rate in the
following financial year. Again the results proved that no significant relationship
existed between the interest rate variable and the capital structure variable.
The tables below will provide the results for the market. Thereafter the results for
the various industries will be considered.

63
Table 12 – Interest rate on Capital Structure with a one-year lag
Dependant Variable
Industry Sample Size
Probability R-square
D/E Market 113 0.6234 0.0002 D/E Basic Materials 5 0.2351 0.0326 D/E Consumer Goods 22 0.3767 0.0040 D/E Consumer Services 31 0.6884 0.0006 D/E Health Care 3 0.3285 0.0382 D/E Industrials 41 0.9692 0.0000 D/E Oil & Gas 1 0.0686 0.3978 D/E Technology 7 0.8480 0.0005 D/E Telecommunications 3 0.0662 0.1286
Interest Rate: Market - At a significance level α = 5% there is no significant
correlation between interest rates and the debt-equity ratio for the market.
Interest Rate: Basic Materials Sector – At a significance level α = 5% there is no
significant correlation between interest rates and the debt-equity ratio for the basic
materials sector.
Interest Rate: Consumer Goods Sector– At a significance level α = 5% there is
no significant correlation between interest rates and the debt-equity ratio for the
consumer goods sector.

64
Interest Rate: Consumer Services Sector – At a significance level α = 5% there
is no significant correlation between interest rates and the debt-equity ratio for the
consumer services sector.
Interest Rate: Healthcare Goods Sector – At a significance level α = 5% there is
no significant correlation between interest rates and the debt-equity ratio for the
consumer goods sector.
Interest Rate: Industrials Sector – At a significance level α = 5% there is no
significant correlation between interest rates and the debt-equity ratio for the
industrials sector.
Interest Rate: Oil & Gas Sector – At a significance level α = 5% there is no
significant correlation between interest rates and the debt-equity ratio for the oil
and gas sector.
Interest Rate: Technology Sector – At a significance level α = 5% there is no
significant correlation between interest rates and the debt-equity ratio for the
technology sector.
Interest Rate: Telecommunications Sector – At a significance level α = 5% there
is no significant correlation between interest rates and the debt-equity ratio for the
telecommunications sector.

65
5.3.2.1 Descriptive statistics for the impact of interest rates on
capital structure.
Figure 7: Interest rates on capital structure: one year lag – consumer goods sector
Figure 7 is a graphical depiction of interest rates on capital structure with a one-
year lag for the consumer goods sector. The result displayed by the graph provides
evidence in support of the regression analysis finding that no significant correlation
exists between interest rates and capital structure for the consumer goods sector.
Consumer Goods Lag1
1998_D /E1999_D /E
2000_D /E2001_D /E
2002_D /E2003_D /E
2004_D /E2005_D /E
2006_D /E2007_D /E
median CG lag1 (L) interest rates (R)
0.30
0.35
0.40
0.45
0.50
0.55
0.60
0.65
0.70
0.75
0.80
med
ian
CG
lag1
:
0.08
0.10
0.12
0.14
0.16
0.18
0.20
0.22
0.24
inte
rest
rate
s:

66
Figure 8: Interest rates on capital structure: one year lag – consumer
services sector
Figure 8 is a graphical depiction of interest rates on capital structure with a one-
year lag for the consumer services sector. The result displayed by the graph
provides evidence in support of the regression analysis that no significant
correlation exists between interest rates and capital structure for the consumer
services sector.
Consumer Services Lag1
1998_D /E1999_D /E
2000_D /E2001_D /E
2002_D /E2003_D /E
2004_D /E2005_D /E
2006_D /E2007_D /E
median CS lag1 (L) interest rates (R)
0.55
0.60
0.65
0.70
0.75
0.80
0.85
med
ian
CS
lag1
:
0.08
0.10
0.12
0.14
0.16
0.18
0.20
0.22
0.24
inte
rest
rate
s:

67
Figure 9: Interest rates on capital structure: one year lag – industrials sector
Figure 9 is a graphical depiction of interest rates on capital structure with a one-
year lag for the industrials sector. The result displayed by the graph provides
evidence in support of the regression analysis finding that no significant correlation
exists between interest rates and capital structure for the industrials sector. From
1998 to 2001 interest rates are on a downward trend while the median capital
structure for the industry is on an upward trend. Thereafter both the movement for
both variables shows no significant correlation.
Industrials lag1
1998_D /E1999_D /E
2000_D /E2001_D /E
2002_D /E2003_D /E
2004_D /E2005_D /E
2006_D /E2007_D /E
median Ind lag1 (L) interest rates (R)
0.6
0.7
0.8
0.9
1.0
1.1
1.2
med
ian
Ind
lag1
:
0.08
0.10
0.12
0.14
0.16
0.18
0.20
0.22
0.24
inte
rest
rate
s:

68
6. Analysis of Results
6.1 Introduction
The results presented in chapter five were based on the two hypotheses previously
postulated. With regard to the first hypothesis on the impact of financial leverage
and firm value, the results provide evidence to accept the null hypothesis.
Therefore, an increase in financial leverage results in a decrease in firm value.
Contrary to previous research conducted, a negative relationship was found to
exist in the context of the South African market for firms listed on the JSE for the
period 1998 to 2007.
An additional point to note is that the results also vary by industry sectors. This
accords with Porter’s (2004) assertion that a firm’s economic environment is
associated with the industry in which it competes.
For the second hypothesis on the impact of interest rates and capital structure, the
results were inconclusive since no significant correlation was found between the
variables. A number of possibilities could explain this result. This will be discussed
later in greater detail.

69
6.2 Hypothesis 1: Financial Leverage and Firm Value
Hypothesis 1:
The null hypothesis states that an increase in leverage (D/E ratio) for a firm
decreases firm value. The alternative hypothesis states that a change in leverage
increases firm value.
The proxy for firm value is Earnings per share (EPS), Price Earnings ratio (P/E),
Return on Equity (ROE), Return on Assets (ROA), Earnings Value Added (EVA)
and Operating Profit Margin (OPM)
6.2.1 Financial leverage and firm value for the market
The information in table 1 shows that four of the six variables that were proxies for
the firm value were negatively correlated with financial leverage for the market. The
two variables that show no significant correlation were EVA and the PE ratio.
This proves that there is an inverse relationship between financial leverage and
firm value. These findings are inconsistent with significant prior research including
Modigliani and Miller’s (1958) theory that a return on equity should be increased by
an increase in a firm’s level of debt. The findings also contradict the conclusions of
Sharma (2006), Fama and French (2002) all of whom conclude that there is a
direct relationship between leverage and firm value. Ward and Price (2006)

70
indicate that an increased debt-equity ratio increases shareholder returns.
However they claimed that this was the case for profitable businesses. In the
sample chosen no investigation was conducted into the actual profitability of the
firms. On the whole the data regarding all of the firm value ratios was positive.
Therefore, one could conclude that the firms in the sample were profitable although
the result did not concur with the Ward and Price (2006) study.
The results concur with the findings of Rajan and Zingales (1995) who find a
negative relationship between debt and profitability. A possible explanation for the
findings can be drawn from De Wet (2006) - who proved that significant amounts of
value can be unlocked in moving closer to the optimal level of gearing - and
Modigliani and Miller (1963), who conclude that a firms cost of equity increases as
the firm increases its debt. This would support the negative impact on ROE, and
EVA, provided that firms were not at their optimal level of debt. The actual
computation of whether the firms chosen for this study were in fact moving closer
to their optimal level of debt was not verified in this study. However the possibility
exists that the firms were not aligning their capital structure to its optimal level (De
Wet, 2006).
An additional explanation for the negative impact of capital structure on firm value
can be attributed to the firms in the sample pursuing debt to reduce their tax
burden, in line with trade off theory where Myers (2001) postulates that debt offers

71
a firm tax shields. Ooi (1999) also states that firms will employ more debt to
alleviate a high tax burden. Myers (1984) and Titman and Wessels (1998)
conclude that successful companies do not need to place much dependence on
external funding, since they can place reliance on internal reserves. Myers (1984)
concludes that there is a negative relationship between debt and profitability.
Based on the findings contained in the figure 2, the mean debt-equity ratios for the
market were found to be relatively high. For the ten year period under review, the
lowest median debt-equity ratio was above the 73% level for most of the years
except for 2007, when it reduced to 64%. A number of factors could explain this
and it can be attributed to both capital structure theory and macroeconomic factors.
Many of the firms in the sample have been in operation for a number of years. The
sample excludes any firms listed on the Alt-X, which has been in existence for a
relatively short period of time. A large percentage of the sample constitutes firms
from the industrial, consumer goods and consumer services sectors. These sectors
are relatively mature. Therefore, the high debt levels can be attributed to the
number of maturing firms in the sample. This is in line with the life stage theory
postulated by Bender and Ward (1993). The high levels of debt provide evidence of
firms represented in the sample that are maturing. With regard to the
macroeconomic influence, the stock market crash in the late 1990’s and the
waning of the dot com phenomenon of the early 2000’s, both of which would have
provoked a lack of confidence in the market, provide an explanation for the

72
increased debt levels in the early 2000’s. Firms increased their debt levels to
supplement their financing requirements.
A further contribution to the decision made by managers based on macroeconomic
factors over this period is compatible with Ross’s information asymmetry theory. In
an effort to provide the market with a positive signal about the future prospects of a
company, management bodies increased debt levels in the early 2000’s, as is
documented in figure 2. The increased debt levels indicated in figure 2 also
support Milov’s (2002) assertion that management’s commitment to self regulation
reduces debt agency costs, since increased levels of debt will be monitored more
closely by debt holders.
6.2.2 Financial Leverage and firm value by industry
The information contained in tables 2 to 9 for the eight industries represented in the
sample concurs with the findings of Porter (2004) and Schwartz and Aronson
(1967) that capital structures of firms in dissimilar industries are different. Figure 3
also lends support to this conclusion, showing that the median debt-equity ratio
differs from industry to industry.
The results for the various industries also differ. In most cases the firm value ratios
that showed a correlation proved to be negatively correlated with a change in
financial leverage, except for the healthcare industry. Again these differences

73
between the various industries lend support to Schwartz and Aronson’s (1967)
theory.
In table 5’s representation of the impact of financial leverage on firm value for the
healthcare sector, all the firm value ratios except for the PE ratio do not show a
significant correlation. The PE ratio in this instance is positively correlated with
capital structure. Also, figure 3 indicates that the debt-equity ratio for the healthcare
industry is relatively high. This can be attributed to the high investments in
research and development particular to this sector, the potential for high growth
with the introduction of a new drug to the market and the protection provided by
patents. This supports Datta et al. (2005) find that firms in with high growth
opportunities have more long term debt in their capital structure. It must also be
noted that a small sample size was used for this industry, which may have
contributed to five out of the six firm value variables not showing a correlation with
the debt-equity ratio. Tables 2 to 9 indicate that the majority of the industries
represented by small sample sizes show no correlation for most of the variables
tested. The oil and gas, telecommunications and healthcare sectors, all with small
sample sizes, showed a high percentage of no correlations for the respective
variables tested.

74
6.2.3 Conclusion of Hypothesis 1.
The null hypothesis is accepted.
The evidence from the results of this study show that a negative correlation exists
between capital structure and firm value for the market.
6.3 Hypothesis 2: Interest rates and capital structure.
Hypothesis 2:
The null hypothesis states that an increase in interest rates has no impact on firm
leverage. The alternative hypothesis states that a change in interest rates does
have an impact on firm leverage.
The results for the second hypothesis were inconclusive. The results do not concur
with the findings of Ju and Leland (2001) who posit that optimal capital structure is
very sensitive to the changes in the level of the interest rate.
A possible reason for these inconclusive results is that the financial results are
available annually, while changes to the interest rates occur more regularly than
this. If the debt-equity ratios were available more frequently, for example, quarterly,

75
more meaningful results could be achieved, since alterations in debt-equity levels
could be better tracked for their response to the change in interest rates.
The above hypothesis was also tested with a one-year lag in order to ascertain if
capital structure had a lagged response to the change in interest rates. However
these results were also inconclusive.
6.3.1 Conclusion of Hypothesis 2
The null hypothesis could neither be accepted nor rejected.
The result of this study is inconclusive, since no significant correlation exists
between the variables for the market as well as the various industries.

76
7. Conclusion
7.1 Capital Structure and Firm Value
The results of the study proved that capital structure negatively impacts firm value
and are in line with the findings of Rajan and Zingales (1995) and Myers (1984).
However, previous research on capital structure has found that an increase in
capital structure positively impacts on firm value (Ward and Price, 2006; Sharma,
2006; Firer et al, 2004). Most of the prior studies which proved a positive relation
were undertaken North America and Europe. These are mature markets compared
to South Africa. Furthermore, the underlying assumption for the Modigliani and
Miller (1958) theory is that the firms in question operate in an efficient market
environment. In the context of the global environment, the JSE might not fit into this
category. This could therefore explain the negative impact on firm value.
The results for the various industries as well as the median capital structure for the
industry prove that capital structure is different for different industries, in line with
the theory.
The debate on capital structure has been pertinent for decades, with plausible
arguments both for and against increased levels of financial leverage. What is
evident from this study is the complex nature of capital structure and its impact on
firm value. The number of ratios as proxies for firm value added to the complexity

77
of this study. Some of the ratios contained common elements which could cause
the results to be inaccurate. Given this, it is clear why Myers, an expert on the
subject matter, maintains that there is no universal theory on debt-equity choice
and no reason to expect one. He states that it is presumptuous to advise firms on
optimal capital structure. He argues further that management decisions are
impacted by interpretations of taxes, agency costs and information asymmetry
(2004). This is further complicated by the macroeconomic factors, which one
cannot ignore.
The recommendation this research report would offer to managers is to consider all
aspects regarding the impact of financial leverage on the firm. Given the volatility of
the South African interest rate market, many managers spend too much time
focusing on the cost at which debt can be undertaken. Therefore, much time is
spent on present value calculation to better negotiate the interest rate. Most often
managers seek to reduce the cost of their own business unit so as to maximise
their personal profit. However, given the complex nature and impact of financial
leverage on the firm, insufficient consideration is given to how the decision will
impact on maximising shareholder returns. This lends support to agency theory
(Fama and Miller 1972). The current financial crisis provides strong evidence of the
real impact the market could have on the future prospects of a firm. Many
international banks which, year ago were investment-grade entities have now had
their stock downgraded significantly, or in some instances, have ceased to exist.

78
This highlights the complexities of managing a firm’s capital structure in a way that
would serve a firm well even when the market is in turmoil.
An exact optimal capital structure is difficult to establish. A range exists wherein
capital structure could maximise firm value (De Wet, 2006). Therefore, managers
should acknowledge this range as well as the fact that it is different for each
industry. Finally, shareholders also need to understand this range so as to avoid
the pitfalls of agency theory. Advice has been provided in mitigation of agency
theory, by aligning management incentive schemes to firm performance (Data et
al., 2005); the flaw in the system is its short term focus. This is especially so when
it has to account for long term debt.
An additional issue that requires acknowledgement is that the data was stratified
by industry resulting in the reduction of some of the samples sizes to single digit
figures. The oil and gas sector only had one firm in the sample, although the reality
is that only one firm exists in this sector. These small sample sizes may have
contributed to the results’ failure to show a positive correlation.

79
7.2 Interest rates and firm value
Overall, the results for this study proved inconclusive. This was disappointing
given the nature of the South African interest environment as well the focus it
receives on a regular basis by both corporate South Africa and the consumer.
As mentioned earlier, the shortcomings in this study can be attributed to the lack of
data points since the financial ratios are extracted from the financial statements of
the firm which are published annually. Therefore there is only one result available
per year, while South Africa experiences multiple interest changes in the year (SA
Reserve bank, 2008).
Whilst the results provide very little information, the descriptive statistics provide
some insight into the dangers of too much leverage. The focus is on the dramatic
increase in interest rates and its impact not only on firms, but also on industries
and the economy as a whole as evidence by Mapenzauswa (2008). Locally, the
impact of the interest rate over the last year has resulted in many companies
defaulting on their debt as a result of financial distress. This lends credence to
Ward and Price (2006) and Myers (2001) who state that additional debt levels
increase the possibility of bankruptcy. The credit crunch over the last year in South
Africa was driven initially by an increase in interest rates and later by the stock

80
market crisis. This provides convincing proof of the negative impact of extending
beyond the optimal range of debt pointed out by De Wet (2006).
7.3 An Integrated approach to Optimal Capital structure
Based on the findings of prior research as well as the results of this study, it is
apparent that the subject of capital structure is complex. There a number of
theories as well as influences. The below model in figure 10 provides an indication
of both the complexity as well as a possible approach to understanding how best to
attempt the achievement of an optimal capital structure range.
It must be understood that the theories depicted in the model are by no means
exhaustive; however in the context of this particular study they are applicable. Note
must also be taken that it is extremely difficult to attain an absolute optimal capital
structure; it is therefore preferable to operate within an acceptable interval or range
(De Wet, 2006).

81
Figure 10: An Integrated Approach to Optimal Capital Structure.
Macro Economic Influence
Industry Influence
Firm Level Characteristic
Life Stage Theory
Pecking Order Theory
Optimal Capital Structure Range Trade Off Theory
Agency TheoryInformation Asymmetry

82
Figure 10, provides an integrated approach to capital structure, as mentioned
earlier there are a number of other theories and influences. In the context of this
study, the approach is follows: Firms might adopt various strategies to maximise
shareholder value, when capital structure is utilised as one of the tools toward
achieving maximised value, consideration needs to be given to the following, when
determining capital structure, pecking order theory (Myers and Majluf, 1894)
assists in understanding both the order as well as the various capital funding
options available to the firm. Trade off theory (Myers, 2001) provides for reduced
capital costs due to tax breaks; however one should take great care regarding the
risks associated with higher levels of debt. Since management are privy to
information about the future prospect of the firm (Ross, 1977), debt levels could be
increased or reduced to better position the firm to capture the expected value or to
buffer against a downturn in future prospects. Evidence from the theory also
suggests that a firms level of maturity will also impact on capital structure choice
(Bender and Ward, 1993), for example when a firm is relatively mature with low
growth prospects but still has high expectations for future cash earnings, higher
levels of debt should be considered, since holding onto shareholders cash will be
more costly than the cost of debt. In order to reduce the conflict referred to in
agency theory (Jensen and Meckling, 1976), shareholders could opt to increase
debt levels to ensure increased monitoring by banks. Increasing the debt levels of
a firm could provide the market with an indication of management’s confidence in

83
the future prospect of the firm as well as their ability to meet the future
commitments increased levels of debt provide.
Underlying all of the above is an understanding of the optimal capital structure
range or interval that a firm needs to move toward (De Wet, 2006), if this is not
achieved and great effort is taken to drive value based only on the above theories,
firm’s run the risk of reducing shareholder value rather than maximising value.
Three additional influences need mention; these include firm level characteristics,
industry influence and the macroeconomic influence. First, firm level characteristics
both influence and can be influence by capital structure decisions (Margaritis, and
Psillaki, 2007) these include, profitability, growth, asset structure, firm size, firm risk
and taxation. Second, the industry within which a firm finds itself impacts on capital
structure decisions, in order to remain competitive, management also need to
understand the dynamics of the industry since firms not only compete for clients,
but also for resources including capital (Porter, 2004). Third, the macroeconomic
impact includes changes in inflation, the exchange rate for those firms who
compete globally, as well as for those who source funding globally. A huge item in
this area is the interest rates; recent developments locally provide evidence in
support of the impact of increased levels of interest.

84
The above discussion provides an indication on the complexity of capital structure
decisions. This is further exacerbated by the dynamic interrelationship of the
abovementioned factors. Adjusting capital structure to derive a benefit provided by
one factor might cause more of a negative impact due to an imbalance caused by
a second factor. For example, If management are aware of great future prospects
for the firm, and are looking to increase market confidence, increasing debt levels
might provide a signal to the market, however the increased level of debt may well
result in the capital structure moving out of the optimal range, thereby increasing
the possibility of bankruptcy, as well as the cost of equity, since shareholders bear
this increased risk. (Modigliani and Miller, 1963)
7.4 Recommendations for future research
Future research into capital structure and firm value should consider a number of
factors. The method for sample selection needs to be revisited as the sample
contained some bias. Only firms for which at least ten years’ worth of data was
availably were considered for this study. Any firms that failed or delisted during the
term, as well as firms that were listed on the JSE for less than ten years were
excluded from the sample. Allowing all firms an equal chance at being selected
could yield different results.

85
Utilising ratios for the study also provided additional complexity. The use of actual
financial data from the company financials could also provide different results.
An entire study could be conducted to understand how a firm’s life impacts on its
capital structure decisions. This could prove useful to local management,
especially as South African companies compete in the global market and the local
market matures. Information could be extracted to understand more
comprehensively how capital structure can be optimised given the life stage of a
firm. This could ultimately increase firm value and shareholder returns.
Finally, a study could be undertaken similar to the one conducted by De Wet
(2006) to establish the range in which capital structure is optimal. Understanding
this range would be the foundation to decisions on capital structure.
With regard to an interest rates study, more data is needed. If quarterly results
were sourced this would provide more insight into the actions of managers in
relation to the multiple interest rates changes in the South African market.

86
7.5 Conclusion
The aim of this research was first to establish whether or not a relationship exists
between financial leverage and firm value. The findings indicate a correlation for
the market; however an inverse relationship exists between financial leverage and
firm value. The evidence from this study also showed that capital structures vary by
industry.
Finally the research set out to understand the relationship between interest rates
and capital structure, the results for which proved inconclusive.

87
References
Adizes, I. (1979) Organisational passages: diagnosing and treating lifecycle
problems of organisations. Organisational Dynamics, 8(1), 3-25.
Adizes, I. (1996) The 10 stages of corporate lifecycles. Inc., 18(14), 95-97.
Albright, S.C., Winston, W.L. & Zappe, C. (2006) Data Analysis & Decision Making.
3rd ed. Thomson South-Western: Mason. Ohio, USA.
Amidu, M. (2007) Determinants of capital structure of banks in Ghana: an empirical
approach. Baltic Journal of Management, 2(1), 67-79.
Atrill, P. (2000) Financial Management for Non Financial Managers. Prentice Hall.
England.
Bacidore, M.J., Boquist, A.J., Milbourn, T. and Thakor, V.A. (1997) EVA and Total
Quality Management. Journal of Applied Corporate Finance, 10(2).
Barclay, M. Smith, C.W., Watts, R.L. (1995) The determinants of corporate
leverage and dividend policies. Journal of Applied Corporate Finance, Vol. 7, 4-19.
Bardia, S.C. (2008) Evaluation of Financial Performance: A Dialectics. Icfai Journal
of Accounting Research, 7(1), 36-49.

88
Beattie, V., Goodacre, A. and Thomson, S.J. (2006) Corporate Financing
Decisions: UK Survey Evidence. Journal of Business Finance & Accounting, 33 (9
& 10), 1402-1434.
Bender, R., and Ward, K. (1993) Corporate Financial Strategy. Oxford:
Butterworth-Heinemann.
Choi, J.J., Elyasiani, E. and Kopecky, K.J. (1992) The sensitivity of bank stock
returns to market: interest and exchange risks, Journal of Banking and Finance,
Vol. 16, 983-1004.
Choi, J.J., Elyasiani, E. (1997) Derivative exposure and the interest rate and
exchange rate risks of US banks, Journal of Financial Services Research, Vol. 12,
267-86.
Datta, S., Iskandar-Datta, M., and Raman, K. (2005) Managerial ownership and the
maturity structure of corporate debt.The Journal of Finance, 50(5), 2333-2350.
De Andries Alonso, P., Iturriaga, F.J.L., Sanz, J.A., and Gonzalez E.V. (2005)
Determinants of bank debt in continental financial system: Evidence from Spanish
companies. The Financial Review, Vol. 40, 305-333.
DeAngelo, H. and Masulis, R. (1980) Optimal capital structure under corporate and
personal taxation. Journal of Financial Economics, Vol. 8, 3-29.

89
Denis, D. and Mihov, V. (2002) The choice among bank debt, non-bank private
debt and public debt: Evidence from new corporate borrowings. Journal of financial
Economics, 70, 3-28.
De Wet, J.H.vH. (2006) Determining the optimal capital structure: a practical
contemporary approach. Meditari Accountancy Research, 14(2), 1-16.
Ehrhardt, M.C., and Brigham, E.F. (2003) Corporate Finance – a focused
approach. Mason: Thomson.
Erbar, A. and Stewart, B. G. (1999) The EVA Revolution. Journal of Applied
Corporate Finance, 12(2).
Fama, E., and French, K. (1988) Taxes, financing decisions and firm value. The
Journal of Finance, 53(2), 819-844.
Fama, E., and French, K. (2002) Testing trade-off and pecking order predictions
about dividends and debt. The Review of Financial Studies, 15(1), 1-33.
Fama, E., and French, K. (2005) Financing decisions; who issues stock? Journal of
Financial Economics, 76(3), 549-582.
Fama, E.F., and Miller M.H. (1972) The Theory of Finance. Holt, Rinehart, and
Winston: New York.

90
Firer, C., Ross, S.A., Westerfield, R.W. and Jordan, B.D. (2004) Fundamentals of
Corporate Finance. 3rd ed. Berhshire: McGraw Hill.
Frank, M.Z., and Goyal, K. (2003) Testing pecking order of capital structure.
Journal of Financial Economics, 67, 217-248.
Frielinghaus, A., Mostert B., and Firer, C. (2005) Capital Structure and the firm’s
life stage. South African Journal of Business Management, 36(4), 9-18.
Graham, J.R. (1996) Proxies for the marginal tax rate. Journal of Financial
Economics, 42, 187-221.
Goldstein, R., Ju, N. and Lelend, H. (2001) An EBIT-based model of dynamic
capital structure. Journal of Business, 74, 483-512.
Grossman S.J., and Hart O.D. (1982) Corporate Financial Structure and
Managerial Incentives. In The Economics of Financial Uncertainty. Chicago.
University of Chicago Press.
Harrris, M., and Raviv, A. (1990) Capital structure and the informational role of
debt. Journal of Finance, 45, 321-349.
Harrris, M., and Raviv, A. (1991) The theory of capital structure. Journal of
Finance, 46(1) 297-335.

91
Hennessy, C.A., and Whitehead, T.M. (2005) Debt Dynamics. The Journal of
Finance, 60(3), 1129-1165.
Hovakimian, A., Opler, T., and Titman, S. (2001) The debt-equity choice. Journal of
Financial and Quantitative Analysis, 36(1), 1-24.
Hyde, S. (2007) The response of industry stock returns to market, exchange rate
and interest rate risks. Managerial Finance, 33(9), 693-709.
Jensen, M.C. (1986) Agency cost and free cash flow, corporate finance and
takeovers. American Economic Review, 76,323-339.
Jensen, M.C., and Meckling, W. (1976) The theory of the firm: Managerial
behaviour, agency costs, and capital structure. Journal of Financial Economics, 3,
305-360.
Johnson, S.A. (2003) Debt maturity and the effects of growth opportunities and the
liquidity risk on leverage. Review of Financial Studies. 16, 209-236.
Joseph, N. (2002), Modeling the impacts of interest rate and exchange rate
changes on UK stock returns. Derivatives Use, Trading and Regulation, Vol. 7,
306-23.

92
Jou, J-B., and Lee, T. (2004) Debt overhang, costly expandability and reversibility,
and optimal financial structure. Journal of Business Finance and Accounting, 31(7)
& (8), 1191-1222.
Ju, N. and Ou-Yang, H. (2006) Capital Structure, Debt Maturity, and Stochastic
Interest Rates. Journal of Business, 79(5), 2470-2502.
Kim E.H. (1978) A Mean-Variance Theory of Optimal Capital Structure and
Corporate Debt Capacity. The Journal of Finance, 33(1), 45-63.
Lasher, W.R. (2003) Practical Financial Management. 3rd edition. Mason Thomson.
Lui, Y. (2006) The sources of debt matter too. Journal of Financial and Quantitative
Analysis, 41(2), 295-316.
Margaritis, D. and Psillaki, M. (2007) Capital Structure and Firm Efficiency. Journal
of Business Finance & Accounting, 34(9) & (10), 1447-1469.
Mackie-Mason, J.K. (1990) Do taxes affect corporate finance decisions? The
Journal of Finance, 45, 1471-1493.
Marsh, P (1982) The choice between equity and debt: an empirical study. The
Journal of Finance, 37(1), 121-144.

93
Mapenzauswa, S. (2008) High interest rates spark slowdown in manufacturing.
Business Day, 12 July 2008, p.11.
Mawson, N. (2008) Edcon ‘hobbled by debt’ leading to loss. Business Day:
Companies and Markets, 30 May 2008, p.13.
Maio, J. (2005) Optimal Capital Structure and Industry Dynamics. Journal of
Finance, 60(6), 2621-2659.
Modigliani, F. and Miller, M. (1958) The Cost Capital, Corporation Finance and the
Theory of Investment. The American Economic Review, 48(3), 261-297.
Modigliani, F. and Miller, M. (1963) Corporate Income Taxes and the Cost of
Capital: A Correction. The American Economic Review, 53(3), 433-444.
Myers, S.C. (1977) Determinants of capital borrowing, Journal of Financial
Economics, 5, 147-175.
Myers, S. C. (1984) The Capital Structure Puzzle. The Journal of Finance, 39 (3)
575-592.
Myers, S. C. (2001) Capital Structure. Journal of Economic Perspectives, 15(2)
81-102.

94
Myers, S.C. and Majluf, N.S. (1984) Corporate financing and investment decisions
when firms have information and investors do not have. Journal of Financial
Economics, 13(2), 187-221.
Nagesh, M. (2002) Corporate tax and capital structure: some evidence and
implications. Investment Analysis Journal, 56(2).
Ni, J., and Yu, M. (2008) Testing Pecking-Order Theory. The Chinese Economy,
41(1), 97-113.
Ooi, J. (1999) The determinants of capital structure: evidence on UK property
companies. Journal of Property Investment and Finance, 17(5) 464-480.
Ottoson, E. and Weissenrieder, F. (1996) Cash Value Added - A New Method for
Measuring Financial Performance. Gothenburg University Working Paper
1996:1.Available from SSRN: http://ssrn.com/abstract=58436.
Porter, M.E. (2003) Competitive Strategy, Techniques for Analyzing Industries and
Competitors. Export ed. New York: Free Press.
Powell, T.M. (1996) How much does industry matter? An alternative empirical test.
Strategic Management Journal, 17(4), 323-334.

95
Rajan, R.G. and Zingales, L. (1995) What do we know about capital structure?
Some evidence from international data. The Journal of Finance, 50(5), 1421-1460.
Rajan, R., and Winton, A. (1995) Covenants and collateral as incentives to monitor.
Journal of Finance, 50, 1113-1146
Raju, J. S. and Roy, A. (2000) Market information and firm performance.
Management Science, 46(8), 1075-1084.
Richard, I.L. (1992) Quantitative Approaches to Management, 8th Edition,
McgrawHill Inc., Singapore.
Ross, S.A. (1977) The determination of financial structure: The incentive- signalling
approach. The Bell Journal of Economics, 8(1), 23-41.
SA Prime Overdraft Lending Rate History, SA Reserve Bank
http://www.reservebank.co.za/internet/Historicdata.nsf/Mainpage?OpenPage&Click
=42256DA4002CFF0E.29d44b91ee5b4df442256d860053d613/$Body/0.DF0
(Accessed 2008 /09/02)
Santos, J.A.C, (2001) Bank Capital Regulation in Contemporary Banking Theory: A
Review of Literature. Financial Markets, Institutions & Instrumentst, 10(2), 42-84.

96
Seifert, B., and Gonenc, H., (2008) The international evidence on pecking order
hypothesis. Journal of Multinational Financial Management, 18(3), 244-260.
Schwartz, E. and Aronson, J.R. (1967) Some Surrogate Evidence in Support of the
Concept of Optimal Financial Structure. Journal of Finance, 34(1), 150-153.
Sharma, A.K. (2006) Financial Leverage and Firm’s Value: A Study of Capital
Structure of Selected Manufacturing Sector Firms in India. The Business Review,
Cambridge, 6(2), 70-76.
Shyam-Sunder, L. and Myers, S.C. (1999) Testing static trade off against pecking
order models of capital structure. Journal of Financial Economics. 51, 219-244.
Stern J, (1990) One way to build value in your firm, executive compensation.
Financial Executive, November-December.
Stern, J.M. (1970) The case against maximising earnings per share. Financial
Analysts Journal, September-October, 107-112.
Stulz, R. (1990) Managerial discretion and optimal financing policies. Journal of
Financial Economics, 26, 3-27.
Stulz, R. (2000) Financial Structure, Corporate Finance and Economic Growth.
International Review of Finance, 1(1), 11-38.

97
Titman, S. and Wessels, R. (1988) The determination of capital structure choice.
Journal of Finance, 43(1), 1-19.
Ward, M. and Price. A, (2006) Turning Vision into Value. Pretoria: Van Schaik
Publishers.
Welman, J.C. and Kruger, S.J. (2001) Research Methodology. 2nd ed. Cape Town:
Oxford University Press.
Zikmund, W.G. (2003) Business Research Methods. 7th ed. Thomson Learning:
Mason. Ohio, USA

98
Appendix A – Final Sample Selection
No Instrument Full Name Instrument
Short Name
Instrument Ticker Symbol
Industry
1 ADVTECH LIMITED ADVTECH2 ADH Consumer Services
2 A E C I LIMITED A E C I AFE Basic Materials
3 ADCORP HOLDINGS LIMITED ADCORP ADR Industrials
4 AFGRI LIMITED AFGRI AFR Consumer Goods
5 AFRICAN AND OVERSEAS ENTERPRISES LD AF & OVR AOO Consumer Services
6 AFRICAN MEDIA ENTERTAINMENT
LIMITED AME AME Consumer Services
7 AFRICAN OXYGEN LIMITED AFROX AFX Basic Materials
8 ALLIED ELECTRONICS CORPORATION LD ALTRON ATN Industrials
9 ALLIED TECHNOLOGIES LIMITED ALTECH ALT Telecommunications
10 ARGENT INDUSTRIAL LIMITED ARGENT ART Industrials
11 ASPEN PHARMACARE HOLDINGS LIMITED ASPEN APN Health Care
12 ASTRAPAK LIMITED ASTRAPAK APK Industrials
13 AVI LIMITED A V I AVI Consumer Goods
14 AWETHU BREWERIES LIMITED AWETHU AWT Consumer Goods
15 BARLOWORLD LIMITED BARWORLD BAW Industrials
16 BASIL READ HOLDINGS LIMITED BASREAD BSR Industrials
17 BELL EQUIPMENT LIMITED BELL BEL Industrials
18 BOWLER METCALF LIMITED BOWCALF BCF Industrials
19 BUILDMAX LIMITED BUILDMAX BDM Industrials
20 CARGO CARRIERS LIMITED CARGO CRG Industrials
21 CASHBUILD LIMITED CASHBIL CSB Consumer Services
22 CAXTON CTP PUBLISHERS AND PRINTERS CAXTON2 CAT Consumer Services
23 CENMAG HOLDINGS LIMITED CENMAG CMG Industrials
24 CERAMIC INDUSTRIES LIMITED CERAMIC CRM Industrials
25 CITY LODGE HOTELS LIMITED CITYLDG CLH Consumer Services
26 COMAIR LIMITED COMAIR COM Consumer Services
27 COMBINED MOTOR HOLDINGS LIMITED CMH CMH Consumer Services
28 CONAFEX HOLDINGS SOCIETE ANONYME CONAFEX CNX Consumer Goods
29 CONTROL INSTRUMENTS GROUP LIMITED CONTROL CNL Industrials
30 CROOKES BROTHERS LIMITED CROOKES CKS Consumer Goods

99
No Instrument Full Name Instrument
Short Name
Instrument Ticker Symbol
Industry
31 CULLINAN HOLDINGS LIMITED CULINAN CUL Consumer Services
32 DATATEC LIMITED DATATEC DTC Technology
33 DELTA ELECTRICAL INDUSTRIES LIMITED DELTA DEL Industrials
34 DIMENSION DATA HOLDINGS PLC DIDATA DDT Technology
35 DISTELL GROUP LIMITED DISTELL DST Consumer Goods
36 DORBYL LIMITED DORBYL DLV Consumer Goods
37 DYNAMIC CABLES RSA LIMITED DYNAMIC DYM Technology
38 ELB GROUP LIMITED ELBGROUP ELR Industrials
39 Emergent Properties Limited EMERGENT EMG Consumer Goods
40 ENVIROSERV HOLDINGS LIMITED ENSERV ENV Industrials
41 EOH HOLDINGS LIMITED EOH EOH Technology
42 EXCELLERATE HOLDINGS LIMITED EXCELL EXL Industrials
43 FAMOUS BRANDS LIMITED FAMBRANDS FBR Consumer Services
44 FOSCHINI LIMITED FOSCHNI FOS Consumer Services
45 GOLD REEF RESORTS LIMITED GOLDREEF GDF Consumer Services
46 GRINDROD LIMITED GRINDROD GND Industrials
47 GROUP FIVE LIMITED GROUP 5 GRF Industrials
48 HOWDEN AFRICA HOLDINGS LIMITED HOWDEN HWN Industrials
49 HUDACO INDUSTRIES LIMITED HUDACO HDC Industrials
50 ILIAD AFRICA LIMITED ILIAD ILA Industrials
51 ILLOVO SUGAR LIMITED ILLOVO ILV Consumer Goods
52 IMPERIAL HOLDINGS LIMITED IMPERIAL2 IPL Industrials
53 INVICTA HOLDINGS LIMITED INVICTA IVT Industrials
54 ISA HOLDINGS LIMITED ISA ISA Technology
55 ITALTILE LIMITED ITLTILE ITE Consumer Services
56 JASCO ELECTRONICS HOLDINGS LIMITED JASCO JSC Industrials
57 JD GROUP LIMITED JDGROUP JDG Consumer Services
58 KAGISO MEDIA LIMITED KGMEDIA KGM Consumer Services
59 KING CONSOLIDATED HOLDINGS LIMITED KINGCO KNG Consumer Services
60 KWV BELEGGINGS BEPERK KWV BEL KWV Consumer Goods
61 LABAT AFRICA LIMITED LABAT LAB Industrials
62 MARSHALL MONTEAGLE HLDGS SOC
ANON MARSHALL MTE Industrials
61 LABAT AFRICA LIMITED LABAT LAB Industrials

100
No Instrument Full Name Instrument
Short Name
Instrument Ticker Symbol
Industry
63
MASONITE (AFRICA) LIMITED MASNITE MAS Industrials
64 MEDI‐CLINIC CORPORATION LIMITED MEDCLIN MDC Health Care
65 METAIR INVESTMENTS LIMITED METAIR MTA Consumer Goods
66 METROFILE HOLDINGS LIMITED METROFILE MFL Industrials
67 MOBILE INDUSTRIES LIMITED MOBILE MOB Industrials
68 MR PRICE GROUP LIMITED MR PRICE MPC Consumer Services
69 MTN GROUP LIMITED MTN GROUP MTN Telecommunications
70 MURRAY AND ROBERTS HOLDINGS
LIMITED M&R HLD MUR Industrials
71 MUSTEK LIMITED MUSTEK MST Technology
72 NAMPAK LIMITED NAMPAK NPK Industrials
73 NASPERS LIMITED NASPERS NPN Consumer Services
74 NETCARE LIMITED NETCARE NTC Health Care
75 NEW AFRICA INVESTMENT LIMITED NAIL NAI Consumer Services
76 NEW CLICKS HOLDINGS LIMITED NUCLIKS NCL Consumer Services
77 NICTUS BEPERK NICTUS NCS Consumer Services
78 NU‐WORLD HOLDINGS LIMITED NUWORLD NWL Consumer Goods
79 OCEANA GROUP LIMITED OCEANA1 OCE Consumer Goods
80 OMNIA HOLDINGS LIMITED OMNIA OMN Basic Materials
81 PALS HOLDING LIMITED PALS PAL Consumer Goods
82 PICK N PAY HOLDINGS LIMITED PIKWIK PWK Consumer Services
83 PICK N PAY STORES LIMITED PICKNPAY PIK Consumer Services
84 PRETORIA PORTLAND CEMENT COMPANY
LD PPC PPC Industrials
85 RAINBOW CHICKEN LIMITED RAINBOW RBW Consumer Goods
86 REUNERT LIMITED REUNERT RLO Industrials
87 REX TRUEFORM CLOTHING COMPANY LD REX TRUE ‐A‐ RTO Consumer Services
88 RICHEMONT SECURITIES AG RICHMON DR RCH Consumer Goods
89 SABMILLER PLC SAB SAB Consumer Goods
90 SAPPI LIMITED SAPPI SAP Basic Materials
91 SASOL LIMITED SASOL SOL Oil & Gas
92 SEARDEL INVESTMENT CORPORATION LD SEARDEL CP SER Consumer Goods
93 SETPOINT TECHNOLOGY HOLDINGS LD SETPOINT STO Industrials
94 SHOPRITE HOLDINGS LIMITED SHOPRIT2 SHP Consumer Services

101
No Instrument Full Name Instrument
Short Name
Instrument Ticker Symbol
Industry
95 SOVEREIGN FOOD INVESTMENTS LIMITED SOVFOOD SOV Consumer Goods
96 SPANJAARD LIMITED SPANJAARD SPA Basic Materials
97 SPESCOM LIMITED SPESCOM SPS Technology
98 SUN INTERNATIONAL LIMITED SUNINT SUI Consumer Services
99 SUPER GROUP LIMITED SUPRGRP SPG Industrials
100 TELKOM SA LIMITED TELKOM TKG Telecommunications
101 THE BIDVEST GROUP LIMITED BIDVEST BVT Industrials
102 THE DON GROUP LIMITED DON DON Consumer Services
103 TIGER BRANDS LIMITED TIGBRANDS TBS Consumer Goods
104 TONGAAT HULETT LIMITED TONGAAT TON Consumer Goods
105 TRANSPACO LIMITED TRNPACO TPC Industrials
106 TRENCOR LIMITED TRENCOR TRE Industrials
107 TRUWORTHS INTERNATIONAL LIMITED TRUWTHS TRU Consumer Services
108 UCS GROUP LIMITED UCS UCS Technology
109 VENTER LEISURE AND COMM TRAILERS LD VENTEL VTL Industrials
110 WESCO INVESTMENTS LIMITED WESCOB WES Consumer Goods
111 WILSON BAYLY HOLMES‐OVCON LIMITED WBHO WBO Industrials
112 WINHOLD LIMITED WINHOLD WNH Industrials
113 WOOLWORTHS HOLDINGS LIMITED WOOLIES WHL Consumer Services
Source: McGregor BFA (accessed: 2008/09/02)

102
Annexure B – Complete Sample Data
Please refer to attached CD on the back cover
Source: McGregor BFA (accessed: 2008/09/02)

Annexure B - Complete Sample Data
SA Prime Overdraft Interest Rates: 1998 ‐ 2007
Year Interest Rate1 1998 21.55%2 1999 18.22%3 2000 14.56%4 2001 13.80%5 2002 15.59%6 2003 15.17%7 2004 11.31%8 2005 10.64%9 2006 11.13%
10 2007 13.11%
Source: SA Reserve Bank (2008)
Instrument Full Name
Instrument Ticker Symbol Industry D/E EPS OPM PE ROA ROE EVA
1 ADVTECH LIMITED ADH Consumer Services 0.5689 32 18.4895 15.0313 27.454 28.7347 ‐27596.12 A E C I LIMITED AFE Basic Materials 0.7884 355 7.3623 21.8338 11.4718 11.45723 ADCORP HOLDINGS LIMITED ADR Industrials 0 0 0 0 0 0 88528.524 AFGRI LIMITED AFR Consumer Goods 2.5672 65.1 11.7388 10.722 10.3459 15.4339 44966.735 AFRICAN AND OVERSEAS ENTERPRISES LD AOO Consumer Services 0.1987 67.1 5.7902 0 11.4132 8.76176 AFRICAN MEDIA ENTERTAINMENT LIMITED AME Consumer Services 0.5655 278.8 31.609 10.7747 45.2614 37.2966 23725.727 AFRICAN OXYGEN LIMITED AFX Basic Materials 0.7557 157.2 23.1664 21.6985 22.457 23.411 213694.58 ALLIED ELECTRONICS CORPORATION LD ATN Industrials 0.5981 286 9.497 15.1049 21.3253 22.8175 481516
2007

9 ALLIED TECHNOLOGIES LIMITED ALT Telecommunications 0.4565 418 9.4395 15.7249 25 22.0088 22048210 ARGENT INDUSTRIAL LIMITED ART Industrials 0.5204 179.1 18.7753 9.7487 21.8788 21.5831 47931.7311 ASPEN PHARMACARE HOLDINGS LIMITED APN Health Care 1.1851 210.1 30.2147 18.1818 19.0292 32.3046 209614.112 ASTRAPAK LIMITED APK Industrials 0.9254 117.9 11.1205 11.7388 14.5557 19.9243 28076.6813 AVI LIMITED AVI Consumer Goods 0.4618 146.8 12.5876 13.8692 21.1085 18.3294 139383.714 AWETHU BREWERIES LIMITED AWT Consumer Goods 2.3842 0.6 ‐3.5169 40 ‐4.9702 18.3178 473.9715 BARLOWORLD LIMITED BAW Industrials 1.3647 1181.3 6.5839 10.4351 11.6781 19.8905 65715316 BASIL READ HOLDINGS LIMITED BSR Industrials 2.3614 158.5 9.3495 22.164 14.7056 33.0993 65831.4917 BELL EQUIPMENT LIMITED BEL Industrials 0.9809 384 10.9829 13.0391 17.6781 26.426 17618118 BOWLER METCALF LIMITED BCF Industrials 0.3987 53.3 17.6254 13.2458 20.879 19.2063 17086.7119 BUILDMAX LIMITED BDM Industrials 0.4441 15.4 7.9821 8.1818 13.7204 16.1688 2144.7120 CARGO CARRIERS LIMITED CRG Industrials 0.6994 83.1 12.5812 13.9952 11.9507 13.306 ‐529.0421 CASHBUILD LIMITED CSB Consumer Services 1.5891 528 5.6317 11.7595 18.8684 34.6338 85368.9822 CAXTON CTP PUBLISHERS AND PRINTERS CAT Consumer Services 0.2113 121.7 20.2587 15.0288 16.7199 16.222123 CENMAG HOLDINGS LIMITED CMG Industrials 0.3511 4.5 3.395 0 7.9692 5.984424 CERAMIC INDUSTRIES LIMITED CRM Industrials 0.3036 1250 22.5484 14.5832 22.5561 21.5155 87600.6125 CITY LODGE HOTELS LIMITED CLH Consumer Services 0.1529 419 52.2531 19.2315 39.5095 33.2907 112740.326 COMAIR LIMITED COM Consumer Services 1.6403 25.2 8.8023 12.1032 17.0137 25.6534 23193.2227 COMBINED MOTOR HOLDINGS LIMITED CMH Consumer Services 3.1133 174 3.5745 11.3678 14.6514 36.578 127870.928 CONAFEX HOLDINGS SOCIETE ANONYME CNX Consumer Goods 0.425 58 ‐13.5578 0 ‐8.7686 ‐10.765829 CONTROL INSTRUMENTS GROUP LIMITED CNL Industrials 0.4226 ‐65.7 ‐0.5507 ‐2.2222 ‐0.8207 108.6118 ‐102229.630 CROOKES BROTHERS LIMITED CKS Consumer Goods 0.112 222.9 20.7781 18.0081 12.3712 10.7964 ‐2090.7731 CULLINAN HOLDINGS LIMITED CUL Consumer Services 2.0411 3.2 9.1623 20.3125 10.0064 25.4317 18487.5232 DATATEC LIMITED DTC Technology 1.1085 295.6522 0.4737 11.3715 1.2422 1.541 ‐440930.933 DELTA ELECTRICAL INDUSTRIES LIMITED DEL Industrials 0.1792 ‐297.9 ‐44.6232 ‐4.2296 ‐24.1257 ‐31.55634 DIMENSION DATA HOLDINGS PLC DDT Technology 1.7979 38.6207 0.6728 21.0768 1.2514 2.3875 ‐548746.835 DISTELL GROUP LIMITED DST Consumer Goods 0.4729 391.5 16.0544 13.507 21.4164 21.5289 37735936 DORBYL LIMITED DLV Consumer Goods 0.3541 7.3 1.88 199.1781 2.4202 2.887637 DYNAMIC CABLES RSA LIMITED DYM Technology 0.6751 11.9 14.1333 7.8992 18.6475 15.8961 208.2738 ELB GROUP LIMITED ELR Industrials 1.7133 124.9 10.086 13.1145 16.4459 15.7455 19038.4239 Emergent Properties Limited EMG Consumer Goods 1.723 58 0 0 37.5903 86.039 ‐2999.6240 ENVIROSERV HOLDINGS LIMITED ENV Industrials 0.8605 92.5 16.5598 13.5027 16.7779 25.7619 24610.7841 EOH HOLDINGS LIMITED EOH Technology 0.7336 78.8 10.4857 11.0025 22.9004 24.6627 25981.0842 EXCELLERATE HOLDINGS LIMITED EXL Industrials 0.7455 8.6 6.9697 14.186 13.3451 10.7139 ‐2208.7543 FAMOUS BRANDS LIMITED FBR Consumer Services 0.6748 113.8 17.2351 13.9016 32.9854 28.705 56405.9544 FOSCHINI LIMITED FOS Consumer Services 0.6222 534.2 28.935 12.3343 30.9797 34.6359 740049.345 GOLD REEF RESORTS LIMITED GDF Consumer Services 0.4652 76.7 25.6534 43.4681 14.7912 6.0088 ‐23753.2346 GRINDROD LIMITED GND Industrials 1.5787 263.1 8.6584 8.6925 15.7183 37.6566 384105.447 GROUP FIVE LIMITED GRF Industrials 3.2143 283 5.8085 19.788 6.4843 14.5654 11423.1748 HOWDEN AFRICA HOLDINGS LIMITED HWN Industrials 1.8399 95.4 13.8959 9.9371 30.3125 70.0564 45391.8649 HUDACO INDUSTRIES LIMITED HDC Industrials 3.0234 604.5 15.9906 14.1704 10.127 22.6563 140281.550 ILIAD AFRICA LIMITED ILA Industrials 0.6614 168.4 8.2649 8.9727 24.7365 24.6526 151122.351 ILLOVO SUGAR LIMITED ILV Consumer Goods 1.1691 149.1 17.4899 12.8504 20.2323 29.1528 222131.652 IMPERIAL HOLDINGS LIMITED IPL Industrials 1.8736 1434.1 7.9228 10.2064 11.8431 22.1708 403112.253 INVICTA HOLDINGS LIMITED IVT Industrials 1.8012 260 15.7121 10.3538 15.0749 24.3741 93719.26

54 ISA HOLDINGS LIMITED ISA Technology 0.2463 5.9 30.6915 11.0169 27.9166 25.129655 ITALTILE LIMITED ITE Consumer Services 0.3755 1489.7 27.759 19.908 30.5742 28.6017 184475.556 JASCO ELECTRONICS HOLDINGS LIMITED JSC Industrials 0.5611 38.1 10.7686 7.9003 23.9057 20.8463 18002.5357 JD GROUP LIMITED JDG Consumer Services 0.5438 601.3 12.7915 10.765 17.9379 18.8979 244628.758 KAGISO MEDIA LIMITED KGM Consumer Services 0.1828 97.9 33.3742 16.2921 58.149 40.5543 85219.7959 KING CONSOLIDATED HOLDINGS LIMITED KNG Consumer Services 2.9119 6.9 1.7146 19.5652 5.7944 6.3987 ‐2249.4660 KWV BELEGGINGS BEPERK KWV Consumer Goods 0.0005 543.8 0 12.0596 ‐0.5241 21.0261 LABAT AFRICA LIMITED LAB Industrials 2.4997 ‐20.5 ‐8.1294 ‐0.7805 ‐6.6076 ‐264.8825 ‐14783.4762 MARSHALL MONTEAGLE HLDGS SOC ANON MTE Industrials 0.4689 74.4828 2.7253 23.0255 2.1511 2.3892 ‐39512.1563 MASONITE (AFRICA) LIMITED MAS Industrials 0.3276 549 12.1094 7.6594 14.8487 15.366264 MEDI‐CLINIC CORPORATION LIMITED MDC Health Care 0.7826 162.2 19.5749 16.0727 20.7101 28.1431 37755665 METAIR INVESTMENTS LIMITED MTA Consumer Goods 0.3656 124 10.3199 11.0806 16.5798 16.9549 18725.0266 METROFILE HOLDINGS LIMITED MFL Industrials 1.5408 13.9 33.0323 12.3022 34.718 50.3132 15622.6167 MOBILE INDUSTRIES LIMITED MOB Industrials 0.0014 17.2 0 11.7442 ‐0.126 17.413368 MR PRICE GROUP LIMITED MPC Consumer Services 0.8004 191.8 11.2026 14.9844 27.2678 36.3883 235891.269 MTN GROUP LIMITED MTN Telecommunications 0.6421 584.8 33.7029 21.9237 32.1036 22.42 638611370 MURRAY AND ROBERTS HOLDINGS LIMITED MUR Industrials 2.1557 329 7.9597 19.8176 11.1755 19.3099 486039.371 MUSTEK LIMITED MST Technology 2.3049 55.5 4.8581 17.3514 8.9959 11.4517 45124.1972 NAMPAK LIMITED NPK Industrials 0.7942 184.6 10.0527 11.3759 14.309 17.5641 9899473 NASPERS LIMITED NPN Consumer Services 0.4415 866 17.6842 20.0774 11.3373 9.4538 ‐64618074 NETCARE LIMITED NTC Health Care 1.4304 77.6 17.214 16.5979 9.3767 22.4347 ‐101077275 NEW AFRICA INVESTMENT LIMITED NAI Consumer Services 0.4559 ‐0.1 0 0 5.566 ‐0.252476 NEW CLICKS HOLDINGS LIMITED NCL Consumer Services 1.4719 106.1 5.3609 13.4307 14.8235 29.3559 178006.777 NICTUS BEPERK NCS Consumer Services 4.5061 4.9 4.5682 0 2.854 9.9205 ‐7509.6778 NU‐WORLD HOLDINGS LIMITED NWL Consumer Goods 0.2296 249.1 5.8435 12.5853 15.1076 15.608779 OCEANA GROUP LIMITED OCE Consumer Goods 0.5799 162.4 10.5428 13.0788 19.01 19.369480 OMNIA HOLDINGS LIMITED OMN Basic Materials 1.0566 558.2 7.9473 11.4421 16.3786 19.6578 85048.4181 PALS HOLDING LIMITED PAL Consumer Goods 1.4034 ‐68.9 ‐6.7355 ‐1.8433 ‐13.9834 ‐45.902 ‐7724.1182 PICK N PAY HOLDINGS LIMITED PWK Consumer Services 3.463 80.9 2.8655 18.4549 16.363 58.3561 680485.183 PICK N PAY STORES LIMITED PIK Consumer Services 3.5003 170.4 2.9768 19.9824 16.9996 61.8471 719486.884 PRETORIA PORTLAND CEMENT COMPANY LD PPC Industrials 0.9544 263 40.8013 17.6996 46.7092 60.8344 119041785 RAINBOW CHICKEN LIMITED RBW Consumer Goods 0.4164 169.5 14.3607 8.3599 24.1909 24.6888 239573.886 REUNERT LIMITED RLO Industrials 0.7823 272.4 10.268 25.4919 22.0525 25.9004 801822.487 REX TRUEFORM CLOTHING COMPANY LD RTO Consumer Services 0.1959 75.3 5.9645 0 11.7783 9.495888 RICHEMONT SECURITIES AG RCH Consumer Goods 0.2192 246.6019 2.0933 16.33 1.0904 1.5537 ‐876956.389 SABMILLER PLC SAB Consumer Goods 0.3474 846.8078 2.4288 18.4576 3.9036 1.5954 ‐800296790 SAPPI LIMITED SAP Basic Materials 2.062 565.5172 1.1154 19.0021 0.9336 1.6129 ‐476317291 SASOL LIMITED SOL Oil & Gas 0.5777 2537 26.9508 10.1644 22.4484 27.6385 783804492 SEARDEL INVESTMENT CORPORATION LD SER Consumer Goods 0.8054 22.7 3.432 32.6432 4.1739 3.2944 ‐152515.193 SETPOINT TECHNOLOGY HOLDINGS LD STO Industrials 0.6906 2.5 7.395 28 15.8068 ‐0.2808 ‐4507.8994 SHOPRITE HOLDINGS LIMITED SHP Consumer Services 1.8812 202.2 4.6 16.0732 15.4432 29.569 563606.595 SOVEREIGN FOOD INVESTMENTS LIMITED SOV Consumer Goods 0.7461 207.2 23.4243 6.6313 22.4035 29.0934 31414.6996 SPANJAARD LIMITED SPA Basic Materials 0.5312 18.3 2.8159 12.0219 5.1122 3.9867 ‐638.4497 SPESCOM LIMITED SPS Technology 2.9107 6.9 6.8448 20.1449 10.6914 45.2291 4461.3498 SUN INTERNATIONAL LIMITED SUI Consumer Services 1.376 829 28.8886 18.5971 25.7816 33.9864 317765.4

99 SUPER GROUP LIMITED SPG Industrials 1.6979 132.3 8.8959 11.61 13.3981 20.8804 150467.2100 TELKOM SA LIMITED TKG Telecommunications 0.6185 1710.7 28.7104 9.6399 27.5877 27.2538 7246647101 THE BIDVEST GROUP LIMITED BVT Industrials 1.4214 970 4.6065 14.6649 15.3621 25.4043 1282283102 THE DON GROUP LIMITED DON Consumer Services 0.8266 1.7 17.7011 33.5294 7.039 6.8349 ‐4759.53103 TIGER BRANDS LIMITED TBS Consumer Goods 0.509 1283 16.5794 14.5472 26.2203 38.2783 1253280104 TONGAAT HULETT LIMITED TON Consumer Goods 1.2425 58.1 ‐16.7944 157.2289 ‐14.1707 ‐56.3437 ‐463257.6105 TRANSPACO LIMITED TPC Industrials 1.5833 83 6.7391 9.6265 11.0364 18.0208 8379.99106 TRENCOR LIMITED TRE Industrials 0.9897 212.9 63.5821 13.1987 14.2612 20.7138 130483.8107 TRUWORTHS INTERNATIONAL LIMITED TRU Consumer Services 0.3303 248.6 33.2853 14.9517 50.3738 45.1128108 UCS GROUP LIMITED UCS Technology 0.5166 34.7 18.0099 13.0259 39.6699 39.5594 63547.4109 VENTER LEISURE AND COMM TRAILERS LD VTL Industrials 1.8888 8.7 10.6025 3.3333 13.5793 33.4923 2093.58110 WESCO INVESTMENTS LIMITED WES Consumer Goods 0.0344 2195 0 16.6296 8.7336 14.4816111 WILSON BAYLY HOLMES‐OVCON LIMITED WBO Industrials 2.7118 512.1 5.5175 20.3398 10.7752 27.5436 121046.8112 WINHOLD LIMITED WNH Industrials 1.6892 21.3 7.1899 7.1831 10.6166 12.352 5319.43113 WOOLWORTHS HOLDINGS LIMITED WHL Consumer Services 1.9398 127.8 10.3062 16.5415 17.188 29.7268 516241
Instrument Full Name
Instrument Ticker Symbol Industry D/E EPS OPM PE ROA ROE EVA
1 ADVTECH LIMITED ADH Consumer Services 0.5967 22.7 15.863 13.1278 25.2365 26.3814 672613.22 A E C I LIMITED AFE Basic Materials 0.7678 853 14.2382 7.9707 21.4581 25.47983 ADCORP HOLDINGS LIMITED ADR Industrials 0.8465 236.5 4.9622 12.0719 23.752 36.654 67234.384 AFGRI LIMITED AFR Consumer Goods 1.1554 37.2 8.8306 17.1237 13.4196 11.0071 ‐58748.915 AFRICAN AND OVERSEAS ENTERPRISES LD AOO Consumer Services 0.1888 35 6.0239 19.5429 10.4715 4.42026 AFRICAN MEDIA ENTERTAINMENT LIMITED AME Consumer Services 0.2834 208.2 27.0286 9.8463 54.324 31.482 16666.257 AFRICAN OXYGEN LIMITED AFX Basic Materials 0.6331 191.4 30.5059 15.8255 31.1668 41.4591 237002.28 ALLIED ELECTRONICS CORPORATION LD ATN Industrials 0.7192 189 7.8603 13.3651 16.233 16.8543 347708.29 ALLIED TECHNOLOGIES LIMITED ALT Telecommunications 0.5591 379 8.823 14.2744 20.2277 21.7728 15403510 ARGENT INDUSTRIAL LIMITED ART Industrials 0.4661 147.8 16.2486 9.0595 19.2024 18.2669 57736.0511 ASPEN PHARMACARE HOLDINGS LIMITED APN Health Care 0.6311 185.5 28.0737 18.9057 30.3863 41.1249 620431.812 ASTRAPAK LIMITED APK Industrials 0.9244 125.9 11.8363 11.4138 16.2495 21.4339 84192.3613 AVI LIMITED AVI Consumer Goods 0.4957 106.5 9.6467 13.5869 15.5177 14.0006 ‐51436.2814 AWETHU BREWERIES LIMITED AWT Consumer Goods 3.666 ‐1.2 ‐36.6443 ‐1.6667 ‐11.8507 19.9223 ‐1298.2315 BARLOWORLD LIMITED BAW Industrials 1.1282 1170.8 10.7358 11.288 14.7683 17.2434 498250.216 BASIL READ HOLDINGS LIMITED BSR Industrials 2.028 89.6 5.3611 13.8728 10.0414 27.9991 25489.9717 BELL EQUIPMENT LIMITED BEL Industrials 0.9681 252 10.6096 9.746 18.4188 24.7308 138928.218 BOWLER METCALF LIMITED BCF Industrials 0.4288 52.7 17.4111 13.093 23.2049 22.8865 21634.619 BUILDMAX LIMITED BDM Industrials 0.4188 9.4 5.8224 18.1915 10.9028 10.1278 ‐11009.1120 CARGO CARRIERS LIMITED CRG Industrials 0.5626 119.4 13.571 6.474 13.6249 16.2529 3426.0121 CASHBUILD LIMITED CSB Consumer Services 1.9693 366.7 5.0453 11.5435 15.4295 31.9417 64409.6822 CAXTON CTP PUBLISHERS AND PRINTERS CAT Consumer Services 0.2643 109 20.6369 13.3945 16.4894 15.81323 CENMAG HOLDINGS LIMITED CMG Industrials 0.6942 ‐16.7 7.2278 0 12.4174 11.300724 CERAMIC INDUSTRIES LIMITED CRM Industrials 0.2987 1080.7 26.1275 11.3103 24.6028 22.1599 90731.11
2006

25 CITY LODGE HOTELS LIMITED CLH Consumer Services 0.1924 341.7 49.9364 14.5215 36.3681 30.8506 96455.4426 COMAIR LIMITED COM Consumer Services 1.8648 19.7 7.6105 8.3756 14.1733 21.4095 30714.9727 COMBINED MOTOR HOLDINGS LIMITED CMH Consumer Services 1.9882 775.6 3.9066 12.999 16.3583 34.6139 128777.728 CONAFEX HOLDINGS SOCIETE ANONYME CNX Consumer Goods 0.297 ‐63.6923 ‐20.0567 ‐15.7005 ‐15.6621 ‐20.056329 CONTROL INSTRUMENTS GROUP LIMITED CNL Industrials 0.7752 ‐0.6 11.8937 ‐935 14.3298 16.1947 ‐18739.8330 CROOKES BROTHERS LIMITED CKS Consumer Goods 0.1255 222.6 21.1636 12.6864 12.6132 11.4383 936.9431 CULLINAN HOLDINGS LIMITED CUL Consumer Services 1.999 2.6 10.9623 15.7692 11.0922 26.6548 18881.5532 DATATEC LIMITED DTC Technology 1.1303 165.0307 0.3927 13.4823 1.159 1.2386 ‐468068.533 DELTA ELECTRICAL INDUSTRIES LIMITED DEL Industrials 0.115 ‐259.5 ‐13.348 ‐8.7052 ‐5.8185 ‐18.2302 ‐212170.234 DIMENSION DATA HOLDINGS PLC DDT Technology 1.7564 15.5039 0.3937 32.895 0.7697 1.1972 ‐874508.335 DISTELL GROUP LIMITED DST Consumer Goods 0.6169 271.5 13.6535 13.2597 16.9109 16.3401 199159.336 DORBYL LIMITED DLV Consumer Goods 0.4681 ‐176.1 50.089 ‐7.4162 86.389 126.119537 DYNAMIC CABLES RSA LIMITED DYM Technology 1.1451 14.7 10.7772 9.7279 22.3407 28.1228 4749.3538 ELB GROUP LIMITED ELR Industrials 2.2193 44.2 4.2136 16.2217 5.3483 1.1545 ‐1756.5239 Emergent Properties Limited EMG Consumer Goods 67.8487 ‐78.8 0 ‐2.6523 ‐86.7176 ‐5915.132 ‐3210.0540 ENVIROSERV HOLDINGS LIMITED ENV Industrials 0.8796 66.9 12.6579 8.3558 13.6299 23.5147 16378.8241 EOH HOLDINGS LIMITED EOH Technology 0.6959 63.4 11.3578 9.4795 24.716 24.8909 20753.7242 EXCELLERATE HOLDINGS LIMITED EXL Industrials 0.8554 5.1 3.3994 11.7647 7.7015 7.377 ‐12603.9843 FAMOUS BRANDS LIMITED FBR Consumer Services 0.5552 83.5 17.6942 14.3713 38.3029 28.5517 45429.6644 FOSCHINI LIMITED FOS Consumer Services 0.6876 463 27.3068 12.6717 29.854 37.6621 715952.545 GOLD REEF RESORTS LIMITED GDF Consumer Services 0.4138 127.4 32.4751 15.0785 28.3532 19.2333 12510046 GRINDROD LIMITED GND Industrials 1.1391 220.8 9.2109 6.7527 16.6487 37.9655 380532.247 GROUP FIVE LIMITED GRF Industrials 5.9315 193.2 4.4725 13.9907 5.3483 21.0721 19356.8448 HOWDEN AFRICA HOLDINGS LIMITED HWN Industrials 4.0535 25.3 11.9289 13.834 20.0578 53.8638 11113.2149 HUDACO INDUSTRIES LIMITED HDC Industrials 0.5828 532.5 12.9315 10.1333 20.4339 20.575 76253.0950 ILIAD AFRICA LIMITED ILA Industrials 0.7574 137.5 8.5076 9.2436 23.438 27.056 129673.351 ILLOVO SUGAR LIMITED ILV Consumer Goods 1.2641 104.2 14.8789 15.0384 17.6657 25.0929 464583.652 IMPERIAL HOLDINGS LIMITED IPL Industrials 2.086 1222.1 7.9863 11.2487 11.8012 22.4655 81829853 INVICTA HOLDINGS LIMITED IVT Industrials 1.9292 170 11.4593 10.4059 9.5572 17.5144 65504.5854 ISA HOLDINGS LIMITED ISA Technology 0.2888 6.1 19.5387 6.8852 32.5931 35.348355 ITALTILE LIMITED ITE Consumer Services 0.4055 1312.3 27.6265 14.6102 31.7816 30.4974 174508.456 JASCO ELECTRONICS HOLDINGS LIMITED JSC Industrials 0.4653 27.7 9.1336 8.0505 22.0498 16.9593 11324.2857 JD GROUP LIMITED JDG Consumer Services 0.6836 823.5 17.8742 7.7292 22.6155 27.4698 911638.658 KAGISO MEDIA LIMITED KGM Consumer Services 0.1658 83.3 35.0291 12.7971 62.6555 40.5038 101488.359 KING CONSOLIDATED HOLDINGS LIMITED KNG Consumer Services 2.6857 ‐8.8 2.3851 ‐18.4091 8.6565 16.018 ‐3703.6360 KWV BELEGGINGS BEPERK KWV Consumer Goods 0.0005 376.2 0 12.084 ‐1.0519 15.327661 LABAT AFRICA LIMITED LAB Industrials 1.0995 ‐7.3 9.5741 ‐2.0548 10.4683 ‐39.1702 ‐22365.2362 MARSHALL MONTEAGLE HLDGS SOC ANON MTE Industrials 0.5122 86.2595 0.8937 25.6551 1.0125 0.4853 ‐23743.9763 MASONITE (AFRICA) LIMITED MAS Industrials 0.222 294 7.2268 0 8.8497 8.658564 MEDI‐CLINIC CORPORATION LIMITED MDC Health Care 0.7878 86.3 18.7381 23.0127 24.9366 20.1706 289497.565 METAIR INVESTMENTS LIMITED MTA Consumer Goods 0.3405 3317 12.2895 8.5589 21.38 20.3426 86842.1666 METROFILE HOLDINGS LIMITED MFL Industrials ‐1.7373 24.1 29.1729 6.7635 34.247 ‐6.6542 66879.1967 MOBILE INDUSTRIES LIMITED MOB Industrials 0.0961 31.8 0 6.6667 7.4717 18.6596 ‐31638.3268 MR PRICE GROUP LIMITED MPC Consumer Services 0.7972 161.7 11.6373 13.0303 29.7603 38.2656 245698.969 MTN GROUP LIMITED MTN Telecommunications 0.5864 606.5 34.8367 12.9992 31.6377 27.4189 6986421

70 MURRAY AND ROBERTS HOLDINGS LIMITED MUR Industrials 2.0137 165 6.5313 14.6 7.6547 15.4806 222291.971 MUSTEK LIMITED MST Technology 2.2368 44.2 4.269 24.0498 7.2752 12.3258 74865.5372 NAMPAK LIMITED NPK Industrials 0.8067 151.2 10.519 11.4352 14.1541 15.4911 135589.973 NASPERS LIMITED NPN Consumer Services 1.0851 756 21.5419 16.2513 21.6173 44.8159 115569974 NETCARE LIMITED NTC Health Care 1.602 56.2 21.6367 21.637 7.5422 68.7187 66363.7875 NEW AFRICA INVESTMENT LIMITED NAI Consumer Services 0.2916 ‐4.2 0 0 0.7676 ‐9.021676 NEW CLICKS HOLDINGS LIMITED NCL Consumer Services 0.923 73.1 3.9869 13.9398 12.4482 15.4327 126718.777 NICTUS BEPERK NCS Consumer Services 5.3235 5.3 2.5918 8.4906 2.1089 6.8548 ‐2574.7778 NU‐WORLD HOLDINGS LIMITED NWL Consumer Goods 0.4122 378.3 7.4232 7.5628 16.2514 16.903679 OCEANA GROUP LIMITED OCE Consumer Goods 0.5538 112.8 3.9021 14.1578 7.7839 2.137 49093.8980 OMNIA HOLDINGS LIMITED OMN Basic Materials 0.9361 353.2 6.9713 12.2254 14.7749 15.101 24446.0881 PALS HOLDING LIMITED PAL Consumer Goods 0.5707 ‐19.8 ‐2.3538 ‐8.3333 ‐4.9078 ‐9.0368 ‐3996.1582 PICK N PAY HOLDINGS LIMITED PWK Consumer Services 3.5238 73.9 2.999 18.4032 17.5582 84.5972 587115.283 PICK N PAY STORES LIMITED PIK Consumer Services 3.569 153 3.141 19.9608 18.3903 82.7858 585349.684 PRETORIA PORTLAND CEMENT COMPANY LD PPC Industrials 0.8437 2259.5 41.1531 16.6532 44.4245 55.1128 102586885 RAINBOW CHICKEN LIMITED RBW Consumer Goods 0.484 144.5 14.3309 6.6021 23.9133 24.9918 188737.586 REUNERT LIMITED RLO Industrials 1.8411 524.6 16.6833 13.3797 25.8742 54.922 596164.787 REX TRUEFORM CLOTHING COMPANY LD RTO Consumer Services 0.1841 46.7 6.25 0 10.865 5.853788 RICHEMONT SECURITIES AG RCH Consumer Goods 0.2376 161.194 1.717 17.8419 0.8676 1.7351 ‐138493189 SABMILLER PLC SAB Consumer Goods 0.3591 671.4601 2.8418 18.0979 4.088 1.8348 ‐564804090 SAPPI LIMITED SAP Basic Materials 2.3838 ‐78.0142 0.4423 ‐122.6444 0.3967 ‐0.0407 ‐504438491 SASOL LIMITED SOL Oil & Gas 0.6761 2293 25.5465 10.8683 20.6967 19.814 257310892 SEARDEL INVESTMENT CORPORATION LD SER Consumer Goods 0.7886 74.2 1.5764 9.0296 2.1683 ‐1.7084 ‐113709.493 SETPOINT TECHNOLOGY HOLDINGS LD STO Industrials 1.0035 0.5 2.841 188 3.6612 ‐11.6897 ‐24331.0294 SHOPRITE HOLDINGS LIMITED SHP Consumer Services 1.845 146.7 4.5486 16.2031 15.704 29.3206 289590.795 SOVEREIGN FOOD INVESTMENTS LIMITED SOV Consumer Goods 0.9342 182.6 22.9367 5.0986 22.1939 30.7812 53777.3396 SPANJAARD LIMITED SPA Basic Materials 0.9782 3.1 1.0966 0 2.8433 1.5719 ‐1253.6297 SPESCOM LIMITED SPS Technology 1.6521 ‐24.9 ‐5.7985 ‐3.4538 ‐7.3214 ‐36.1659 ‐6577.1898 SUN INTERNATIONAL LIMITED SUI Consumer Services 0.7519 437 26.4809 19.0481 22.1279 30.2641 14956.6299 SUPER GROUP LIMITED SPG Industrials 1.794 106.88 9.1632 10.582 13.5401 23.4778 228525.5100 TELKOM SA LIMITED TKG Telecommunications 0.6994 1727.2 31.7301 9.1072 28.316 31.4829 7789250101 THE BIDVEST GROUP LIMITED BVT Industrials 1.4516 804.6 4.8711 12.1812 15.3693 26.7686 1353388102 THE DON GROUP LIMITED DON Consumer Services 0.9661 ‐1.6 7.5408 ‐14.375 2.348 ‐7.678 ‐12306.2103 TIGER BRANDS LIMITED TBS Consumer Goods 0.7871 1207 19.9238 12.2336 37.9716 50.7796 1209975104 TONGAAT HULETT LIMITED TON Consumer Goods 0.527 666.4 13.2773 16.3761 11.5508 14.5854 127691.3105 TRANSPACO LIMITED TPC Industrials 0.8606 58.8 1.6831 7.2959 2.6449 ‐4.7131 7471.3106 TRENCOR LIMITED TRE Industrials 2.156 232.8 42.3973 12.9124 8.3143 13.5465 2126.68107 TRUWORTHS INTERNATIONAL LIMITED TRU Consumer Services 0.3226 186.4 32.5996 11.883 48.5748 43.1342108 UCS GROUP LIMITED UCS Technology 0.4247 23.4 13.2138 7.5214 29.4897 27.7273 39560.32109 VENTER LEISURE AND COMM TRAILERS LD VTL Industrials 2.3012 8 8.9451 4.5 13.5631 37.2061 2856.66110 WESCO INVESTMENTS LIMITED WES Consumer Goods 0.0006 2913 0 13.0539 0.6462 14.3148111 WILSON BAYLY HOLMES‐OVCON LIMITED WBO Industrials 2.6364 357.5 5.3715 14.1734 10.6166 28.1391 75035.6112 WINHOLD LIMITED WNH Industrials 1.6693 18.5 6.2325 6.9189 9.7266 12.2417 ‐13043.52113 WOOLWORTHS HOLDINGS LIMITED WHL Consumer Services 2.0447 105 10.4835 13.0762 17.032 32.0301 474113.4

Instrument Full Name
Instrument Ticker Symbol Industry D/E EPS OPM PE ROA ROE EVA
1 ADVTECH LIMITED ADH Consumer Services 0.6738 15.7 13.9598 12.8662 19.2169 20.25 243240.62 A E C I LIMITED AFE Basic Materials 0.8036 482 8.8846 10.6307 13.6787 14.03573 ADCORP HOLDINGS LIMITED ADR Industrials 0.9877 195.1 4.3596 11.4095 20.4797 26.1047 39369.184 AFGRI LIMITED AFR Consumer Goods 1.4367 44.5 5.2362 12 8.9819 15.7816 69207.645 AFRICAN AND OVERSEAS ENTERPRISES LD AOO Consumer Services 0.2053 56.3 9.1343 11.5453 16.2861 ‐16.37166 AFRICAN MEDIA ENTERTAINMENT LIMITED AME Consumer Services 0.2178 163.3 26.8343 6.9871 75.3382 36.0568 11493.97 AFRICAN OXYGEN LIMITED AFX Basic Materials 0.7675 142.6 35.9365 16.3394 65.8283 79.5819 166465.18 ALLIED ELECTRONICS CORPORATION LD ATN Industrials 0.6725 161.2 6.7917 10.3846 13.9398 13.2848 333397.39 ALLIED TECHNOLOGIES LIMITED ALT Telecommunications 0.565 339 8.9878 12.7817 22.5486 20.6731 20678010 ARGENT INDUSTRIAL LIMITED ART Industrials 0.5821 126.6 16.0573 8.2385 19.5681 21.3474 50811.4111 ASPEN PHARMACARE HOLDINGS LIMITED APN Health Care 0.6977 144.7 27.622 16.6206 33.9864 45.8505 517252.512 ASTRAPAK LIMITED APK Industrials 1.1518 119.3 11.9323 9.3462 18.4595 25.0624 61655.0513 AVI LIMITED AVI Consumer Goods 0.4304 184 ‐8.7543 7.0109 ‐17.696 ‐23.5875 392907.114 AWETHU BREWERIES LIMITED AWT Consumer Goods 5.5646 ‐1.3 ‐158.9454 ‐1.5385 ‐32.3806 32.7476 ‐937.5315 BARLOWORLD LIMITED BAW Industrials 0.9432 893.6 9.1749 12.35 13.9791 15.4069 725341.116 BASIL READ HOLDINGS LIMITED BSR Industrials 6.9554 42.7 5.0581 7.3302 11.7023 74.809 28027.4317 BELL EQUIPMENT LIMITED BEL Industrials 1.3311 ‐11 1.0831 ‐87.4545 2.1174 ‐1.1722 ‐68862.0118 BOWLER METCALF LIMITED BCF Industrials 0.51 50.6 20.7401 11.3241 26.2091 25.8932 33940.7919 BUILDMAX LIMITED BDM Industrials 0.3857 15.2 2.9078 3.8158 5.2167 8.2211 ‐5929.8120 CARGO CARRIERS LIMITED CRG Industrials 0.7336 64.2 7.77 7.1651 10.5666 11.7209 290.9121 CASHBUILD LIMITED CSB Consumer Services 2.3094 347.5 5.6403 11.1914 16.3458 38.0577 65562.8522 CAXTON CTP PUBLISHERS AND PRINTERS CAT Consumer Services 0.2478 93.7 19.5884 11.4728 18.424 16.564423 CENMAG HOLDINGS LIMITED CMG Industrials 1.2701 0 1.9824 0 3.8099 ‐0.15924 CERAMIC INDUSTRIES LIMITED CRM Industrials 0.3301 964.5 25.4858 10.6916 24.3894 23.142 11641125 CITY LODGE HOTELS LIMITED CLH Consumer Services 0.2157 290.7 48.1496 13.1579 33.4942 29.0496 81662.926 COMAIR LIMITED COM Consumer Services 1.5938 17.3 7.3318 7.8035 15.5611 24.4362 77944.5527 COMBINED MOTOR HOLDINGS LIMITED CMH Consumer Services 1.9311 561.1 4.006 6.8972 15.9839 30.9217 86606.9228 CONAFEX HOLDINGS SOCIETE ANONYME CNX Consumer Goods 0.2101 ‐12.8205 ‐9.7935 0 ‐6.0834 ‐8.070329 CONTROL INSTRUMENTS GROUP LIMITED CNL Industrials 0.8447 28.3 9.7355 18.2686 12.3572 13.5263 11668.1330 CROOKES BROTHERS LIMITED CKS Consumer Goods 0.2061 37.7 6.4563 37.8515 3.4621 2.3748 ‐23725.731 CULLINAN HOLDINGS LIMITED CUL Consumer Services 1.7775 2.5 11.1564 20 13.1201 25.306732 DATATEC LIMITED DTC Technology 1.0413 23.1214 0.4285 40.5685 1.2128 2.1931 ‐409707.733 DELTA ELECTRICAL INDUSTRIES LIMITED DEL Industrials 0.1269 199.4 233.5679 16.319 64.9741 64.1472 ‐68749.9534 DIMENSION DATA HOLDINGS PLC DDT Technology 2.3125 8.9172 0.4558 48.4457 0.8599 0.9015 ‐857240.535 DISTELL GROUP LIMITED DST Consumer Goods 0.7113 245.8 13.2316 10.0488 15.8158 16.974 158250.836 DORBYL LIMITED DLV Consumer Goods 0.3836 275.6 6.4835 10.7801 12.5165 9.6474 45451.0937 DYNAMIC CABLES RSA LIMITED DYM Technology 0.8421 9.2 13.0334 4.0217 26.8835 33.0567 3305.7538 ELB GROUP LIMITED ELR Industrials 1.5551 35.4 2.1063 11.4407 2.7705 10.1702 ‐134.0139 Emergent Properties Limited EMG Consumer Goods 0.5489 ‐1.4 1.4537 ‐47.1429 1.6849 ‐0.5469 ‐854.5840 ENVIROSERV HOLDINGS LIMITED ENV Industrials 0.8228 51.1 10.1746 6.9863 11.1445 19.3362 26531.11
2005

41 EOH HOLDINGS LIMITED EOH Technology 0.9603 54 8.8726 7.7037 21.7376 26.7324 17837.1342 EXCELLERATE HOLDINGS LIMITED EXL Industrials 0.9453 8.3 5.389 7.9518 13.3235 13.0644 7125.7943 FAMOUS BRANDS LIMITED FBR Consumer Services 0.5863 58.6 18.9341 12.2867 43.3189 25.6531 38451.3144 FOSCHINI LIMITED FOS Consumer Services 0.7268 359.8 22.7246 10.1807 25.568 29.1793 417156.345 GOLD REEF RESORTS LIMITED GDF Consumer Services 0.1684 102.1 34.8791 14.0059 32.2338 22.1279 165025.646 GRINDROD LIMITED GND Industrials 1.344 185.3 13.1954 6.7998 20.7895 44.726 466666.247 GROUP FIVE LIMITED GRF Industrials 3.4154 151.6 3.9446 9.6306 6.7957 20.7301 ‐64662.6648 HOWDEN AFRICA HOLDINGS LIMITED HWN Industrials 0.7075 40.5 11.2614 11.8519 17.4804 15.609 ‐2422.9149 HUDACO INDUSTRIES LIMITED HDC Industrials 0.5525 415 12.7585 9.6964 21.1792 20.8453 83011.6550 ILIAD AFRICA LIMITED ILA Industrials 0.7986 110.6 9.2459 9.9819 24.0608 27.2293 118810.251 ILLOVO SUGAR LIMITED ILV Consumer Goods 1.3873 42.6 7.4315 19.2254 8.7314 5.1404 36945.252 IMPERIAL HOLDINGS LIMITED IPL Industrials 1.7288 1045.8 9.3052 9.6548 14.0013 26.026 533286.653 INVICTA HOLDINGS LIMITED IVT Industrials 0.8636 179 12.3801 8.3966 25.3035 30.6731 93393.3654 ISA HOLDINGS LIMITED ISA Technology 0.3679 3.6 10.0871 12.7778 19.5008 22.055555 ITALTILE LIMITED ITE Consumer Services 0.4564 1069.1 27.6401 12.445 29.7033 30.1667 144319.456 JASCO ELECTRONICS HOLDINGS LIMITED JSC Industrials 0.3342 16.3 7.0305 13.4356 17.9354 7.0292 7285.6557 JD GROUP LIMITED JDG Consumer Services 0.7165 704.7 18.8865 10.6286 22.6844 27.2299 887170.358 KAGISO MEDIA LIMITED KGM Consumer Services 0.1589 78.7 36.4686 14.4346 71.7567 44.520659 KING CONSOLIDATED HOLDINGS LIMITED KNG Consumer Services 3.7103 ‐0.1 0.816 ‐120 3.332 ‐3.389 ‐1364.2660 KWV BELEGGINGS BEPERK KWV Consumer Goods 0.0004 341.7 0 9.5932 7.3232 16.906561 LABAT AFRICA LIMITED LAB Industrials 1.299 ‐19.3 ‐27.4054 ‐1.2953 ‐27.4327 ‐90.0813 ‐27119.6262 MARSHALL MONTEAGLE HLDGS SOC ANON MTE Industrials 0.5307 152.8662 1.3719 9.8779 1.5425 1.1829 ‐10144.3963 MASONITE (AFRICA) LIMITED MAS Industrials 0.1843 188 4.342 8.6702 5.489 5.865364 MEDI‐CLINIC CORPORATION LIMITED MDC Health Care 0.2825 145.7 20.2808 10.4667 22.3499 20.3061 256367.365 METAIR INVESTMENTS LIMITED MTA Consumer Goods 0.3097 2597 11.5452 8.7605 18.2959 16.7958 53179.6366 METROFILE HOLDINGS LIMITED MFL Industrials ‐1.5261 29.6 26.6372 1.25 33.4477 ‐6.2067 51464.3167 MOBILE INDUSTRIES LIMITED MOB Industrials 0.1202 29.3 1014.7011 5.2901 6.6768 25.6177 ‐63546.7668 MR PRICE GROUP LIMITED MPC Consumer Services 0.6294 120.4 9.8548 9.7757 21.1503 25.4837 79942.5769 MTN GROUP LIMITED MTN Telecommunications 0.6528 425.6 56.7444 13.8087 47.8284 62.2489 510816570 MURRAY AND ROBERTS HOLDINGS LIMITED MUR Industrials 1.2387 142 5.665 9.8592 8.47 15.1013 127927.271 MUSTEK LIMITED MST Technology 1.9171 90.4 7.8532 11.2168 13.6779 16.8752 60846.9572 NAMPAK LIMITED NPK Industrials 0.6974 119.2 9.5398 13.1208 15.8549 14.9171 259229.473 NASPERS LIMITED NPN Consumer Services 0.8236 781 23.4884 9.7631 26.0356 39.2177 112273274 NETCARE LIMITED NTC Health Care 0.6986 60.3 17.9102 10.6136 22.7853 27.9747 505213.575 NEW AFRICA INVESTMENT LIMITED NAI Consumer Services 0.2143 ‐15 ‐19.8192 ‐5 ‐11.4365 ‐9.77376 NEW CLICKS HOLDINGS LIMITED NCL Consumer Services 1.2187 65.2 4.0089 13.1902 11.2587 15.2686 106848.377 NICTUS BEPERK NCS Consumer Services 1.6091 1.6 2.8942 37.5 2.2727 2.5868 ‐3343.978 NU‐WORLD HOLDINGS LIMITED NWL Consumer Goods 0.416 339.9 5.952 9.1292 15.2546 17.941179 OCEANA GROUP LIMITED OCE Consumer Goods 0.5547 109.8 7.2396 14.1985 13.1645 12.546580 OMNIA HOLDINGS LIMITED OMN Basic Materials 1.139 516.3 9.3386 8.5919 19.4044 24.6283 134207.781 PALS HOLDING LIMITED PAL Consumer Goods 0.2822 9.9 2.4834 11.7172 5.3032 3.7536 22.982 PICK N PAY HOLDINGS LIMITED PWK Consumer Services 0.0055 70.1 0 15.5635 167.3692 168.288983 PICK N PAY STORES LIMITED PIK Consumer Services 2.83 141.5 3.0848 16.4382 18.3083 58.426 532259.284 PRETORIA PORTLAND CEMENT COMPANY LD PPC Industrials 0.4621 1729.5 40.082 16.1399 49.1483 47.0362 808035.785 RAINBOW CHICKEN LIMITED RBW Consumer Goods 0.4129 77.9 8.5478 8.5494 17.3395 17.3699 78707.59

86 REUNERT LIMITED RLO Industrials 1.3749 406 13.9678 10.4729 26.3682 48.8161 635653.987 REX TRUEFORM CLOTHING COMPANY LD RTO Consumer Services 0.2023 62.5 9.2354 9.6 16.497 ‐15.321188 RICHEMONT SECURITIES AG RCH Consumer Goods 0.2501 136.2903 2.5854 14.205 1.2725 2.4 ‐464932789 SABMILLER PLC SAB Consumer Goods 0.4052 605.5901 2.9914 16.0703 4.591 2.8104 ‐242745790 SAPPI LIMITED SAP Basic Materials 1.634 44.586 ‐0.2472 166.9134 ‐0.2176 ‐1.7778 ‐445739691 SASOL LIMITED SOL Oil & Gas 0.676 1749 22.1624 10.2064 17.9306 23.5768 583876592 SEARDEL INVESTMENT CORPORATION LD SER Consumer Goods 0.7682 35.9 3.4591 10.0557 5.1749 5.0228 ‐155671.293 SETPOINT TECHNOLOGY HOLDINGS LD STO Industrials 0.7851 7.5 15.2024 10.4 27.0419 20.5039 2610.2594 SHOPRITE HOLDINGS LIMITED SHP Consumer Services 2.5801 120.3 3.1732 11.729 11.1122 26.8787 27123595 SOVEREIGN FOOD INVESTMENTS LIMITED SOV Consumer Goods 1.0711 124.2 16.196 5.0805 21.6568 31.4358 27212.3496 SPANJAARD LIMITED SPA Basic Materials 1.0926 10.3 1.7635 22.233 4.2047 3.9562 ‐686.697 SPESCOM LIMITED SPS Technology 1.0909 36.1 ‐19.491 2.964 ‐28.6834 ‐4.8051 ‐19644.3998 SUN INTERNATIONAL LIMITED SUI Consumer Services 0.7342 534 30.4683 11.7378 21.5051 21.7407 269526.199 SUPER GROUP LIMITED SPG Industrials 1.3571 129.5 9.28 8.3243 14.8756 21.2576 272595100 TELKOM SA LIMITED TKG Telecommunications 0.9585 1274.1 26.5464 8.8133 20.0631 24.6007 5253628101 THE BIDVEST GROUP LIMITED BVT Industrials 1.2845 686.6 5.136 10.536 17.6189 28.0905 1191752102 THE DON GROUP LIMITED DON Consumer Services 0.8568 0.5 3.188 28 0.8961 0.4332 ‐4958.8103 TIGER BRANDS LIMITED TBS Consumer Goods 1.2485 995 17.5934 13.8784 30.4593 48.3774 1144819104 TONGAAT HULETT LIMITED TON Consumer Goods 0.4281 452.4 11.0887 17.0623 9.7277 10.232 44771.2105 TRANSPACO LIMITED TPC Industrials 0.7145 80.2 8.9569 6.9576 12.0684 17.5928 8116.11106 TRENCOR LIMITED TRE Industrials 2.1942 262.3 58.7163 7.1712 11.178 21.8196 322569.1107 TRUWORTHS INTERNATIONAL LIMITED TRU Consumer Services 0.3681 144.8 29.8235 12.2238 38.4948 35.9301108 UCS GROUP LIMITED UCS Technology 0.3124 14.5 9.7626 9.3793 24.1465 15.5393 18624.54109 VENTER LEISURE AND COMM TRAILERS LD VTL Industrials 3.5032 2.5 4.3667 9.6 6.2694 18.239 938.69110 WESCO INVESTMENTS LIMITED WES Consumer Goods 0.0004 2849 0 7.1744 5.3532 15.0129111 WILSON BAYLY HOLMES‐OVCON LIMITED WBO Industrials 2.7722 251.5 4.1969 11.2843 8.8796 26.3094 92009.49112 WINHOLD LIMITED WNH Industrials 0.9607 14.9 4.0348 9.3289 9.9486 9.5695 ‐3865.61113 WOOLWORTHS HOLDINGS LIMITED WHL Consumer Services 2.0032 92.1 10.1942 11.1726 17.7028 37.4701 404373.9
Instrument Full Name
Instrument Ticker Symbol Industry D/E EPS OPM PE ROA ROE EVA
1 ADVTECH LIMITED ADH Consumer Services 0.6694 12 10.6103 9.8333 14.3382 15.628 135712.8
2 A E C I LIMITED AFE Basic Materials 0.7797 392 7.458 9.3954 11.6716 9.67373 ADCORP HOLDINGS LIMITED ADR Industrials 0.9004 164.5 4.8244 10.2675 23.1018 25.0216 12857.09
4 AFGRI LIMITED AFR Consumer Goods 0.9677 93.9 8.1299 6.3898 17.3704 19.8605 176531.8
5 AFRICAN AND OVERSEAS ENTERPRISES LD AOO Consumer Services 0.1841 20.8 2.1319 27.6923 3.8288 2.40446 AFRICAN MEDIA ENTERTAINMENT LIMITED AME Consumer Services 0.565 99.2 17.2239 6.0585 59.9896 27.9114 5716.83
7 AFRICAN OXYGEN LIMITED AFX Basic Materials 0.5412 187.5 21.9148 10.208 11.7268 23.0122 383366.4
8 ALLIED ELECTRONICS CORPORATION LD ATN Industrials 0.6113 139 7.5958 8.0504 13.6421 13.8182 152872
9 ALLIED TECHNOLOGIES LIMITED ALT Telecommunications 0.4392 302 11.0307 10.043 20.2302 19.9872 138768.4
2004

10 ARGENT INDUSTRIAL LIMITED ART Industrials 0.6066 106.2 16.037 3.2768 22.8546 23.1041 35632.22
11 ASPEN PHARMACARE HOLDINGS LIMITED APN Health Care 0.6106 103.7 26.2258 11.9961 36.4007 33.3414 381231.1
12 ASTRAPAK LIMITED APK Industrials 1.5289 93 13.3559 8.2151 19.8595 32.0954 40799.02
13 AVI LIMITED AVI Consumer Goods 0.4906 186.2 13.8794 9.3502 17.1068 18.1574 292634.2
14 AWETHU BREWERIES LIMITED AWT Consumer Goods 2.7647 ‐0.5 ‐111.499 ‐8 ‐25.5369 47.3482 ‐11.15
15 BARLOWORLD LIMITED BAW Industrials 1.0423 857.2 8.2568 8.9536 12.0312 13.6005 84208
16 BASIL READ HOLDINGS LIMITED BSR Industrials 30.8041 ‐179.4 ‐6.8085 ‐0.5351 ‐15.8438 ‐639.533 ‐107531.2
17 BELL EQUIPMENT LIMITED BEL Industrials 1.2636 ‐13 1.0516 ‐45 1.6692 ‐1.633 ‐104380.1
18 BOWLER METCALF LIMITED BCF Industrials 0.5031 39.4667 32.4029 10.4392 36.0422 36.874 16593.75
19 BUILDMAX LIMITED BDM Industrials 0.3058 ‐16.2 ‐8.7264 ‐0.6173 ‐15.3463 ‐19.3496 ‐20492.52
20 CARGO CARRIERS LIMITED CRG Industrials 1.0113 41.4 8.2036 7.8502 11.7548 12.0991 ‐3072.22
21 CASHBUILD LIMITED CSB Consumer Services 2.0435 251.4 5.5387 9.0334 15.833 31.6788 42738.72
22 CAXTON CTP PUBLISHERS AND PRINTERS CAT Consumer Services 0.2829 74.7 17.3034 10.9772 16.1874 14.314123 CENMAG HOLDINGS LIMITED CMG Industrials 1.2898 ‐6.5 1.4705 ‐1.2308 3.063 ‐11.783424 CERAMIC INDUSTRIES LIMITED CRM Industrials 0.3504 754 24.7601 8.8634 22.9018 22.2495 83561.61
25 CITY LODGE HOTELS LIMITED CLH Consumer Services 0.2379 240.1 47.2431 10.6081 29.9237 25.6142 63314.1
26 COMAIR LIMITED COM Consumer Services 1.9543 12.1 ‐6.2167 5.9504 ‐13.2468 ‐41.2832 23840.47
27 COMBINED MOTOR HOLDINGS LIMITED CMH Consumer Services 2.0249 341.9 3.4124 5.3524 12.9291 22.7193 40437.28
28 CONAFEX HOLDINGS SOCIETE ANONYME CNX Consumer Goods 0.2872 ‐13.245 ‐23.7324 ‐79.275 ‐14.954 ‐19.784429 CONTROL INSTRUMENTS GROUP LIMITED CNL Industrials 1.0437 29.1 9.0052 9.7595 19.0956 21.7495 20503.1
30 CROOKES BROTHERS LIMITED CKS Consumer Goods 0.1413 152.4 16.9152 12.2638 9.8135 8.6284 ‐11516.07
31 CULLINAN HOLDINGS LIMITED CUL Consumer Services 2.7728 3.6 13.9564 14.7222 12.6335 46.644132 DATATEC LIMITED DTC Technology 1.5682 ‐44 ‐0.17 ‐35.0682 ‐0.4302 ‐1.8488 ‐680778
33 DELTA ELECTRICAL INDUSTRIES LIMITED DEL Industrials 0.5483 220.8 12.1422 14.9909 11.6324 11.671134 DIMENSION DATA HOLDINGS PLC DDT Technology 2.0224 5.8442 0.0659 62.9688 0.1265 ‐2.0085 ‐699698.8
35 DISTELL GROUP LIMITED DST Consumer Goods 0.831 183.3 11.4694 8.2597 13.6497 14.0259 15877.87
36 DORBYL LIMITED DLV Consumer Goods 0.5038 199.3 10.1439 9.1621 17.3619 13.824 ‐7944.48
37 DYNAMIC CABLES RSA LIMITED DYM Technology 0.8245 10.7 8.0659 109.0654 18.9364 17.3544 3264.99
38 ELB GROUP LIMITED ELR Industrials 1.4491 59.1 2.405 7.8849 3.7046 7.4648 ‐13496.07
39 Emergent Properties Limited EMG Consumer Goods 0.7911 4.1 3.2485 17.0732 3.6175 1.5992 ‐705.86
40 ENVIROSERV HOLDINGS LIMITED ENV Industrials 0.8604 40.7 12.3026 7.4693 12.5233 21.6283 5997.49
41 EOH HOLDINGS LIMITED EOH Technology 1.0858 42.8 7.9947 6.7991 16.7396 28.3265 9023.46
42 EXCELLERATE HOLDINGS LIMITED EXL Industrials 0.7623 8.1 3.8302 3.5802 8.9914 7.9092 5525.4
43 FAMOUS BRANDS LIMITED FBR Consumer Services 0.5755 38.2 12.1627 7.3298 31.1266 17.4011 10420.69
44 FOSCHINI LIMITED FOS Consumer Services 0.5831 237.1 18.3243 8.0177 21.3506 22.5622 179239.7
45 GOLD REEF RESORTS LIMITED GDF Consumer Services 0.186 95.2 34.0255 13.0777 29.161 19.9628 145496
46 GRINDROD LIMITED GND Industrials 1.8543 618.4 21.1094 6.3422 24.3793 62.5446 427858
47 GROUP FIVE LIMITED GRF Industrials 3.3202 135.1 4.3542 7.5056 7.8153 21.4973 2235.74

48 HOWDEN AFRICA HOLDINGS LIMITED HWN Industrials 1.4049 38.3 13.3063 5.4308 20.74 21.832949 HUDACO INDUSTRIES LIMITED HDC Industrials 0.596 370.6 10.5473 8.6697 18.224 17.3568 67536.87
50 ILIAD AFRICA LIMITED ILA Industrials 0.8118 97.4 9.2087 10.1745 22.5148 27.2865 98453.69
51 ILLOVO SUGAR LIMITED ILV Consumer Goods 1.6999 76.9 11.6951 9.961 14.5147 20.0758 287921.6
52 IMPERIAL HOLDINGS LIMITED IPL Industrials 1.301 840.5 7.7555 8.1642 12.0332 18.7716 72093.8
53 INVICTA HOLDINGS LIMITED IVT Industrials 0.9795 163 11.3835 5.816 24.6284 31.8984 72003.73
54 ISA HOLDINGS LIMITED ISA Technology 1.7262 0.3 2.6157 3.3333 6.2207 12.511655 ITALTILE LIMITED ITE Consumer Services 0.4672 856.3 27.9143 9.0307 29.5702 30.1787 99455.61
56 JASCO ELECTRONICS HOLDINGS LIMITED JSC Industrials 0.5258 33.6 4.5934 2.5 10.6681 1.4682 ‐6340.54
57 JD GROUP LIMITED JDG Consumer Services 0.8786 522 14.9183 8.705 17.8373 21.0386 558830
58 KAGISO MEDIA LIMITED KGM Consumer Services 0.735 70.2 35.3633 10.7123 41.4692 60.548559 KING CONSOLIDATED HOLDINGS LIMITED KNG Consumer Services 3.2386 0.3 1.1262 16.6667 4.3782 ‐5.2661 ‐1023.92
60 KWV BELEGGINGS BEPERK KWV Consumer Goods 0.0004 254.3 0 7.2355 5.8779 13.762561 LABAT AFRICA LIMITED LAB Industrials 0.6232 ‐7.1 ‐4.7674 ‐4.9296 ‐3.6567 ‐9.8499 ‐99295.52
62 MARSHALL MONTEAGLE HLDGS SOC ANON MTE Industrials 0.6099 84.4156 ‐0.733 17.9706 ‐0.7855 ‐1.3927 ‐25979.33
63 MASONITE (AFRICA) LIMITED MAS Industrials 0.2179 85 2.7855 16.0235 3.4678 3.064264 MEDI‐CLINIC CORPORATION LIMITED MDC Health Care 0.3099 129.5 18.1645 9.5058 20.9051 19.5822 181638.7
65 METAIR INVESTMENTS LIMITED MTA Consumer Goods 0.449 2704 12.1622 6.581 19.735 19.5184 88142.2
66 METROFILE HOLDINGS LIMITED MFL Industrials ‐1.5881 ‐132.3 2.447 ‐0.0378 4.7797 26.6046 3640.02
67 MOBILE INDUSTRIES LIMITED MOB Industrials 0.1858 4.9 125.472 21.6327 1.296 3.8996 ‐95404.8
68 MR PRICE GROUP LIMITED MPC Consumer Services 0.694 89.1 8.33 8.3614 18.0432 21.1525 29882.73
69 MTN GROUP LIMITED MTN Telecommunications 0.3082 263.7 24.8335 12.3246 28.7753 18.6417 1918447
70 MURRAY AND ROBERTS HOLDINGS LIMITED MUR Industrials 1.2386 152 5.4167 8.7763 7.5389 18.5707 ‐73693.2
71 MUSTEK LIMITED MST Technology 1.6316 72.5 6.1516 10.2759 11.6925 10.864 123666.2
72 NAMPAK LIMITED NPK Industrials 0.7594 146.1 9.8139 9.5825 17.2636 17.9087 291663.4
73 NASPERS LIMITED NPN Consumer Services 1.595 302 10.0117 14.394 12.1118 11.6706 518175.3
74 NETCARE LIMITED NTC Health Care 0.7486 45.9 15.6833 10.5882 20.3959 23.3183 241426.4
75 NEW AFRICA INVESTMENT LIMITED NAI Consumer Services 0.2236 28.7 45.2493 0.4181 70.316 54.439576 NEW CLICKS HOLDINGS LIMITED NCL Consumer Services 1.1812 76.5 2.1547 9.9085 5.7209 ‐0.9145 138128.1
77 NICTUS BEPERK NCS Consumer Services 1.5687 1.1 3.5558 63.6364 3.1074 3.9156 ‐4777.19
78 NU‐WORLD HOLDINGS LIMITED NWL Consumer Goods 0.5368 281.3 6.0259 8.091 14.5233 16.809879 OCEANA GROUP LIMITED OCE Consumer Goods 0.6372 143.8 10.0727 11.064 17.6708 19.3999 85585.680 OMNIA HOLDINGS LIMITED OMN Basic Materials 1.1246 443.7 9.0582 5.8733 18.0548 23.2224 84369.63
81 PALS HOLDING LIMITED PAL Consumer Goods 0.3303 ‐40.3 ‐4.6926 ‐3.8213 ‐10.1883 ‐15.9037 ‐3898.62
82 PICK N PAY HOLDINGS LIMITED PWK Consumer Services 0.0071 59.3 0 13.0523 143.4139 144.42783 PICK N PAY STORES LIMITED PIK Consumer Services 2.4474 117.4 2.7404 14.5656 15.8598 44.313 369484.4
84 PRETORIA PORTLAND CEMENT COMPANY LD PPC Industrials 0.4367 1463.2 36.9699 12.2485 35.8223 33.6011 595511.1
85 RAINBOW CHICKEN LIMITED RBW Consumer Goods 0.3808 85.2 8.905 5.9155 18.6393 19.2599 108784.5

86 REUNERT LIMITED RLO Industrials 1.5961 277.5 12.5126 9.9964 28.2948 51.2864 387808.6
87 REX TRUEFORM CLOTHING COMPANY LD RTO Consumer Services 0.1878 24 2.0776 17.8333 3.7627 2.788488 RICHEMONT SECURITIES AG RCH Consumer Goods 0.3693 97.6744 1.2499 17.5174 0.6076 0.8231 ‐5499200
89 SABMILLER PLC SAB Consumer Goods 0.4408 485.443 2.0226 14.8359 3.1552 1.653 ‐4176686
90 SAPPI LIMITED SAP Basic Materials 1.5117 290.3226 0.6917 31.1619 0.5364 0.7315 ‐5051292
91 SASOL LIMITED SOL Oil & Gas 0.7155 934 15.8002 10.6606 13.3562 16.9583 1061514
92 SEARDEL INVESTMENT CORPORATION LD SER Consumer Goods 2.0519 60.6 6.0139 3.6304 9.058 13.1387 ‐34750.85
93 SETPOINT TECHNOLOGY HOLDINGS LD STO Industrials 0.7381 5.2 9.6935 6.1538 21.1324 12.0656 1498.41
94 SHOPRITE HOLDINGS LIMITED SHP Consumer Services 2.5224 79.9 3.163 11.3517 10.6651 26.1633 289379.6
95 SOVEREIGN FOOD INVESTMENTS LIMITED SOV Consumer Goods 1.1498 26.3 5.787 5.4753 8.6403 7.4183 ‐37.39
96 SPANJAARD LIMITED SPA Basic Materials 1.0082 29 9.8908 4.4483 24.042 34.7128 ‐558.67
97 SPESCOM LIMITED SPS Technology 1.083 63.1 10.2694 2.4564 21.7984 37.6218 31219.61
98 SUN INTERNATIONAL LIMITED SUI Consumer Services 0.5204 423 32.22 9.6738 21.8263 24.1492 ‐142202
99 SUPER GROUP LIMITED SPG Industrials 1.7037 123.8 10.0053 8.5864 17.3381 28.2871 149111.5
100 TELKOM SA LIMITED TKG Telecommunications 1.1886 863.6 21.5492 8.3708 16.7754 20.505 4672879
101 THE BIDVEST GROUP LIMITED BVT Industrials 1.3359 546.7 4.9596 9.7092 15.9001 25.4404 814287.4
102 THE DON GROUP LIMITED DON Consumer Services 0.3433 ‐1.1 ‐9.799 ‐10.9091 ‐13.8572 ‐18.9417 ‐5584.37
103 TIGER BRANDS LIMITED TBS Consumer Goods 1.4619 927 10.2826 10.329 22.6487 34.452 1146343
104 TONGAAT HULETT LIMITED TON Consumer Goods 0.5846 210.4 8.6694 24.7338 6.7183 5.1871 ‐322547.2
105 TRANSPACO LIMITED TPC Industrials 0.7435 71.8 10.039 5.195 17.5923 20.6673 11326.47
106 TRENCOR LIMITED TRE Industrials 2.8409 61.8 28.3232 21.5696 5.2502 3.9897 ‐153556.6
107 TRUWORTHS INTERNATIONAL LIMITED TRU Consumer Services 0.3204 110 28.006 8.9273 37.1542 34.7511108 UCS GROUP LIMITED UCS Technology 0.3091 11.9 7.9687 10.4202 19.1544 12.4331 5030.48
109 VENTER LEISURE AND COMM TRAILERS LD VTL Industrials 5.8515 1.2 3.0854 45 3.9296 10.0258 1451.5
110 WESCO INVESTMENTS LIMITED WES Consumer Goods 0.0024 2417 0 5.5275 4.5206 14.6193111 WILSON BAYLY HOLMES‐OVCON LIMITED WBO Industrials 2.5132 208.6 4.4823 8.6481 7.6691 24.8119 85386.42
112 WINHOLD LIMITED WNH Industrials 1.3433 23.1 6.1681 6.2338 14.7961 21.9417 8575.43
113 WOOLWORTHS HOLDINGS LIMITED WHL Consumer Services 0.8837 78.6 9.8171 9.0585 18.1809 23.3899 284521.9
Instrument Full Name
Instrument Ticker Symbol Industry D/E EPS OPM PE ROA ROE EVA
1 ADVTECH LIMITED ADH Consumer Services 0.7805 8.8 15.5112 8.6364 19.7813 23.6723 158167.42 A E C I LIMITED AFE Basic Materials 0.8592 356 7.9384 8.9073 11.9099 9.5833 ADCORP HOLDINGS LIMITED ADR Industrials 0.8221 96.4 2.5986 12.0228 12.6412 ‐4.5335 6849.344 AFGRI LIMITED AFR Consumer Goods 1.514 85.2 7.136 5.5751 12.8179 20.9429 213083.8
2003

5 AFRICAN AND OVERSEAS ENTERPRISES LD AOO Consumer Services 0.2149 73.8 5.776 5.4201 9.4328 8.48536 AFRICAN MEDIA ENTERTAINMENT LIMITED AME Consumer Services 0.8677 ‐0.5 8.0259 ‐10 26.7251 ‐14.7679 ‐2304.337 AFRICAN OXYGEN LIMITED AFX Basic Materials 0.6527 166.5 15.308 9.7598 22.0891 23.3238 272544.98 ALLIED ELECTRONICS CORPORATION LD ATN Industrials 0.6203 149.4 10.4656 5.5622 20.9064 20.9282 180342.79 ALLIED TECHNOLOGIES LIMITED ALT Telecommunications 0.5061 342.1 19.4386 6.3724 37.2546 45.3948 12450110 ARGENT INDUSTRIAL LIMITED ART Industrials 0.9465 83.6 10.2609 3.5287 15.5012 20.597 17998.211 ASPEN PHARMACARE HOLDINGS LIMITED APN Health Care 0.6448 79.1 23.9708 9.8609 38.4733 34.3628 297638.212 ASTRAPAK LIMITED APK Industrials 2.2735 73.8 10.9142 5.5962 16.7504 30.0219 14071.8713 AVI LIMITED AVI Consumer Goods 0.4831 196.1 15.9654 7.5625 19.0646 21.6237 500272.614 AWETHU BREWERIES LIMITED AWT Consumer Goods 2.163 ‐5.6 ‐382.9219 ‐1.0714 ‐61.0703 280.642 ‐5752.1615 BARLOWORLD LIMITED BAW Industrials 1.084 592.8 6.8607 9.8819 10.7053 11.9164 12046316 BASIL READ HOLDINGS LIMITED BSR Industrials 2.8846 18.1 12.6294 8.453 19.5337 44.4578 ‐10372.9317 BELL EQUIPMENT LIMITED BEL Industrials 0.9375 39 3.8242 18.4359 7.596 5.1534 41015.3718 BOWLER METCALF LIMITED BCF Industrials 0 0 0 0 0 019 BUILDMAX LIMITED BDM Industrials 0.2357 1.3 1.233 11.5385 1.9593 1.300720 CARGO CARRIERS LIMITED CRG Industrials 1.0446 14.7 4.6052 17.2109 6.5096 3.9085 ‐9321.5521 CASHBUILD LIMITED CSB Consumer Services 2.3074 196.8 5.2752 6.6514 15.3764 34.2573 35011.1322 CAXTON CTP PUBLISHERS AND PRINTERS CAT Consumer Services 0.2676 65.6 16.8152 9.0396 15.2566 11.600423 CENMAG HOLDINGS LIMITED CMG Industrials 1.3011 2.8 4.9052 2.8571 10.4617 4.243724 CERAMIC INDUSTRIES LIMITED CRM Industrials 0.4072 706.5 27.7016 8.9483 22.9255 24.6854 54904.0925 CITY LODGE HOTELS LIMITED CLH Consumer Services 0.3019 208.5 47.109 8.801 28.587 25.3465 41106.6526 COMAIR LIMITED COM Consumer Services 1.0125 6.5 ‐0.5555 12 ‐1.0573 ‐6.494 ‐36635.2227 COMBINED MOTOR HOLDINGS LIMITED CMH Consumer Services 2.1129 282.8 3.6828 4.1231 13.3502 22.2461 29759.7528 CONAFEX HOLDINGS SOCIETE ANONYME CNX Consumer Goods 0.1366 ‐55.7399 12.4903 ‐17.9405 0.7547 0.850129 CONTROL INSTRUMENTS GROUP LIMITED CNL Industrials 0.8769 28.6 5.4389 5.1748 12.0181 22.2197 14773.8930 CROOKES BROTHERS LIMITED CKS Consumer Goods 0.0648 257.7 25.9106 4.8467 16.0624 13.9172 4901.3131 CULLINAN HOLDINGS LIMITED CUL Consumer Services 1.7637 2.7 14.2377 11.4815 12.5967 52.218832 DATATEC LIMITED DTC Technology 1.2823 ‐74.1818 ‐0.553 ‐5.4865 ‐1.7954 ‐9.0676 ‐767457.533 DELTA ELECTRICAL INDUSTRIES LIMITED DEL Industrials 0.5405 369.5 20.743 10.0352 19.9665 19.595634 DIMENSION DATA HOLDINGS PLC DDT Technology 1.7393 ‐19.2857 ‐2.7092 ‐18.3037 ‐4.7443 ‐18.9442 ‐893461.335 DISTELL GROUP LIMITED DST Consumer Goods 0.9647 138.9 12.2226 8.4233 13.6496 14.2459 ‐38108.7436 DORBYL LIMITED DLV Consumer Goods 0.8257 289.4 11.5285 5.933 24.8219 33.8493 15576.5337 DYNAMIC CABLES RSA LIMITED DYM Technology 2.1445 6.2 6.9984 1.6129 10.4727 25.8007 1369.9238 ELB GROUP LIMITED ELR Industrials 1.5793 ‐5 ‐0.3512 ‐68.2 ‐0.4648 ‐2.6372 ‐18393.0639 Emergent Properties Limited EMG Consumer Goods 0.9155 3.3 4.623 18.1818 5.606 1.3156 ‐977.4840 ENVIROSERV HOLDINGS LIMITED ENV Industrials 0.859 35.7 12.2496 6.0224 13.1757 23.4834 8561.9841 EOH HOLDINGS LIMITED EOH Technology 0.5979 31.5 9.787 4.9206 23.3896 27.4081 7608.2442 EXCELLERATE HOLDINGS LIMITED EXL Industrials 0.5878 7 6.4202 2.7143 16.2358 7.42 469643 FAMOUS BRANDS LIMITED FBR Consumer Services 0.5475 25.8 9.2698 5.5814 24.7839 19.8915 711.5944 FOSCHINI LIMITED FOS Consumer Services 0.5392 162.2 14.8611 6.7139 17.1601 17.312 47297.9145 GOLD REEF RESORTS LIMITED GDF Consumer Services 0.387 65.1 30.0001 9.232 23.472 15.3183 94909.8246 GRINDROD LIMITED GND Industrials 2.0126 250.9 17.1163 4.5397 16.044 39.3954 66827.1247 GROUP FIVE LIMITED GRF Industrials 3.5016 111.3 3.7888 4.9775 7.422 21.264 4057.7948 HOWDEN AFRICA HOLDINGS LIMITED HWN Industrials 1.023 29.5 15.1134 4.7797 33.2248 16.939649 HUDACO INDUSTRIES LIMITED HDC Industrials 0.6449 365 10.3013 5.9562 19.7041 17.8086 83334

50 ILIAD AFRICA LIMITED ILA Industrials 0.7425 76.4 8.7837 6.7801 15.2611 17.2269 37780.1951 ILLOVO SUGAR LIMITED ILV Consumer Goods 1.8562 136.8 15.8676 5.0804 18.5715 30.8765 ‐43931.4452 IMPERIAL HOLDINGS LIMITED IPL Industrials 1.2662 700.2 8.4797 7.6521 12.9501 18.0144 19188053 INVICTA HOLDINGS LIMITED IVT Industrials 0.9841 136 12.5518 4.0441 24.7339 28.0803 57088.3954 ISA HOLDINGS LIMITED ISA Technology 1.3551 0.2 4.1436 5 14.7536 9.110255 ITALTILE LIMITED ITE Consumer Services 0.4316 656.6 23.4414 9.1334 27.8697 27.5478 75769.9756 JASCO ELECTRONICS HOLDINGS LIMITED JSC Industrials 1.2503 58 11.7422 2.6379 27.8317 52.2055 16965.6857 JD GROUP LIMITED JDG Consumer Services 0.9079 338.8 14.5323 8.9728 12.6921 13.635 80343.658 KAGISO MEDIA LIMITED KGM Consumer Services 0.5974 58.1 33.4536 6.9019 44.2928 53.570159 KING CONSOLIDATED HOLDINGS LIMITED KNG Consumer Services 11.6537 ‐3.9 ‐0.1225 ‐1.7949 ‐0.4693 ‐154.6014 ‐6472.3960 KWV BELEGGINGS BEPERK KWV Consumer Goods 0.0003 192.7 0 7.0265 6.2518 14.164761 LABAT AFRICA LIMITED LAB Industrials 0.5784 17.7 13.1683 2.7119 12.8422 20.4978 ‐32223.9462 MARSHALL MONTEAGLE HLDGS SOC ANON MTE Industrials 0.483 34.7222 1.7873 44.64 1.221 0.9701 ‐29584.7863 MASONITE (AFRICA) LIMITED MAS Industrials 0.288 189 6.2995 7.2593 7.3594 6.986464 MEDI‐CLINIC CORPORATION LIMITED MDC Health Care 0.2854 107 18.2136 7.0561 20.0241 18.9785 88845.6465 METAIR INVESTMENTS LIMITED MTA Consumer Goods 0.4599 2297 11.2678 5.9656 20.4968 19.802 100073.366 METROFILE HOLDINGS LIMITED MFL Industrials ‐8.1287 ‐383.8 ‐40.1594 ‐0.0495 ‐70.4749 292.465 ‐153334.367 MOBILE INDUSTRIES LIMITED MOB Industrials 0.1811 ‐8.6 79.9819 ‐10.4651 1.1381 ‐6.5185 ‐64822.268 MR PRICE GROUP LIMITED MPC Consumer Services 0.7566 71.5 7.8612 6.5315 16.5527 20.4655 84725.4569 MTN GROUP LIMITED MTN Telecommunications 0.3083 150.6 18.2221 8.1873 22.6739 11.3052 ‐65559.270 MURRAY AND ROBERTS HOLDINGS LIMITED MUR Industrials 1.2703 175 6.2544 6.5657 10.2982 22.056 200093.571 MUSTEK LIMITED MST Technology 1.6444 118.7 8.2927 4.3724 17.7522 20.0748 12188372 NAMPAK LIMITED NPK Industrials 0.9344 145.4 10.4616 8.597 18.7794 20.0882 219885.573 NASPERS LIMITED NPN Consumer Services 1.3502 ‐19 4.9953 ‐117.2105 5.7421 9.278 ‐114896974 NETCARE LIMITED NTC Health Care 0.7288 45.9 18.2068 9.0632 19.4123 21.4626 13053975 NEW AFRICA INVESTMENT LIMITED NAI Consumer Services 0.0631 151.9 25.6552 6.8203 9.7412 6.5579 ‐63066.176 NEW CLICKS HOLDINGS LIMITED NCL Consumer Services 0.9901 65.6 5.2495 10.0915 12.0341 13.3209 8997.377 NICTUS BEPERK NCS Consumer Services 3.4805 11.4 4.725 6.5789 6.1556 15.5108 2293.5878 NU‐WORLD HOLDINGS LIMITED NWL Consumer Goods 0.4107 200.8 5.5943 5.9861 14.0163 13.909179 OCEANA GROUP LIMITED OCE Consumer Goods 0.607 182.4 11.7888 9.0241 24.092 24.766680 OMNIA HOLDINGS LIMITED OMN Basic Materials 1.1381 631.9 17.7058 3.1271 31.5157 41.4986 162492.781 PALS HOLDING LIMITED PAL Consumer Goods 0.5671 121.8 22.2214 1.6256 37.7646 39.5544 3609.9582 PICK N PAY HOLDINGS LIMITED PWK Consumer Services 0.0071 27 0 19.5926 110.834 111.61783 PICK N PAY STORES LIMITED PIK Consumer Services 2.244 102.2 2.8583 12.5538 16.3336 45.4209 287092.384 PRETORIA PORTLAND CEMENT COMPANY LD PPC Industrials 0.5047 1154 33.267 10.3354 28.852 29.3435 341791.785 RAINBOW CHICKEN LIMITED RBW Consumer Goods 0.5119 106.2 6.5636 3.3333 14.8924 23.6326 131420.786 REUNERT LIMITED RLO Industrials 1.4491 183.5 11.5172 9.406 21.1054 25.5581 632961.887 REX TRUEFORM CLOTHING COMPANY LD RTO Consumer Services 0.2461 58.5 5.0011 6.1368 8.1325 6.905988 RICHEMONT SECURITIES AG RCH Consumer Goods 0.4082 106.0345 1.3344 11.2699 0.6807 1.4686 ‐495783089 SABMILLER PLC SAB Consumer Goods 0.384 414.1732 1.9659 11.7994 2.5368 1.5053 ‐823094590 SAPPI LIMITED SAP Basic Materials 1.5615 493.0556 0.9178 20.1235 0.6774 0.9781 ‐512091791 SASOL LIMITED SOL Oil & Gas 0.6896 1280 18.7096 6.8289 17.7926 23.3218 438457592 SEARDEL INVESTMENT CORPORATION LD SER Consumer Goods 2.8868 68.5 5.7068 4.8613 8.9026 13.452 55925.0493 SETPOINT TECHNOLOGY HOLDINGS LD STO Industrials 0.8967 3.6 9.8863 7.5 18.2014 8.0824 ‐2307.394 SHOPRITE HOLDINGS LIMITED SHP Consumer Services 2.9332 57.6 2.6683 9.9826 9.5706 24.1922

95 SOVEREIGN FOOD INVESTMENTS LIMITED SOV Consumer Goods 1.1701 34.3 6.7924 5.2478 9.3868 11.6812 ‐23664.6196 SPANJAARD LIMITED SPA Basic Materials 1.4706 12.6 2.1607 13.8095 6.2023 4.3643 ‐436.3697 SPESCOM LIMITED SPS Technology 2.5915 50.4 6.9631 2.2024 10.5907 42.0587 ‐27601.1598 SUN INTERNATIONAL LIMITED SUI Consumer Services 0.4924 ‐54 17.0955 ‐55.7037 10.9675 4.0896 ‐76259.7799 SUPER GROUP LIMITED SPG Industrials 1.7846 101.6 8.7282 5.502 15.1953 24.95 157655.7100 TELKOM SA LIMITED TKG Telecommunications 1.6694 314 15.9255 9.086 11.3431 8.8838 5480000101 THE BIDVEST GROUP LIMITED BVT Industrials 1.2016 479 4.8268 8.8601 16.3674 24.8136 715408.8102 THE DON GROUP LIMITED DON Consumer Services 0.3007 0.4 2.4343 15 2.962 3.6938 ‐1620.12103 TIGER BRANDS LIMITED TBS Consumer Goods 1.7724 777 10.7482 9.1223 23.0525 37.7072 785181.4104 TONGAAT HULETT LIMITED TON Consumer Goods 0.7054 ‐91.7 5.5801 ‐34.1549 4.4224 ‐0.9778 ‐692060.7105 TRANSPACO LIMITED TPC Industrials 0.7761 60.5 8.8565 3.8182 18.5086 19.2171 10916.58106 TRENCOR LIMITED TRE Industrials 2.4987 ‐108.2 9.601 ‐9.353 2.0476 ‐6.5396 ‐454525107 TRUWORTHS INTERNATIONAL LIMITED TRU Consumer Services 0.2874 85.7 23.8291 8.7048 29.8479 29.2634108 UCS GROUP LIMITED UCS Technology 0.4151 10.3 10.7904 7.9612 14.8787 11.2435 ‐16920.96109 VENTER LEISURE AND COMM TRAILERS LD VTL Industrials 11.9276 0.5 6.6876 24 8.5995 23.8776 ‐862.42110 WESCO INVESTMENTS LIMITED WES Consumer Goods 0.0253 ‐870.4 0.9956 ‐8.0423 2.9859 7.1047111 WILSON BAYLY HOLMES‐OVCON LIMITED WBO Industrials 2.5457 182 3.919 5.5549 7.0845 19.9811 16895.95112 WINHOLD LIMITED WNH Industrials 1.5645 16.4 5.7449 3.4146 15.818 21.6091 1169.17113 WOOLWORTHS HOLDINGS LIMITED WHL Consumer Services 0.8486 64.8 9.0976 9.1204 18.074 22.7936 148616.9
Instrument Full Name
Instrument Ticker Symbol Industry D/E EPS OPM PE ROA ROE EVA
1 ADVTECH LIMITED ADH Consumer Services 1.2299 5.3 ‐42.7208 6.6038 ‐49.8308 ‐137.4157 112682.82 A E C I LIMITED AFE Basic Materials 1.0866 340 8.2502 7.4706 12.3516 11.5053 ‐5291.373 ADCORP HOLDINGS LIMITED ADR Industrials 0.6769 110 ‐0.1431 5.7091 ‐0.6252 ‐16.6026 ‐9110.34 AFGRI LIMITED AFR Consumer Goods 0.7505 75 8.171 6.5867 14.79 16.5412 ‐893.995 AFRICAN AND OVERSEAS ENTERPRISES LD AOO Consumer Services 0.1663 34.4 2.6459 11.0465 4.4575 4.20666 AFRICAN MEDIA ENTERTAINMENT LIMITED AME Consumer Services 1.1087 ‐4 6.0421 ‐0.75 12.3046 ‐65.6697 9915.417 AFRICAN OXYGEN LIMITED AFX Basic Materials 0.7628 124.8 13.9374 10.5048 19.9787 20.6205 73699.838 ALLIED ELECTRONICS CORPORATION LD ATN Industrials 0.8689 129.5 7.4748 5.9382 10.8569 15.8354 ‐82837.249 ALLIED TECHNOLOGIES LIMITED ALT Telecommunications 0.8215 268.1 13.3929 7.6054 28.2325 26.4657 130218.910 ARGENT INDUSTRIAL LIMITED ART Industrials 0.9339 51.3 9.5484 3.1579 13.2297 16.6138 ‐7422.2911 ASPEN PHARMACARE HOLDINGS LIMITED APN Health Care 0.8532 64.6 25.5605 11.548 34.5805 36.1203 24003212 ASTRAPAK LIMITED APK Industrials 1.7646 59 10.8245 4.0508 17.6606 31.4434 19917.9313 AVI LIMITED AVI Consumer Goods 0.4612 157.9 14.3955 8.8094 16.2506 18.5495 8085.8814 AWETHU BREWERIES LIMITED AWT Consumer Goods 1.4243 1.3 14.2941 3.0769 7.5897 34.3345 106.6515 BARLOWORLD LIMITED BAW Industrials 1.0619 621.7 7.3002 9.4435 10.3302 13.4232 ‐975471.616 BASIL READ HOLDINGS LIMITED BSR Industrials 7.2516 8.7 7.065 20.1149 8.9606 19.8906 ‐2684.8617 BELL EQUIPMENT LIMITED BEL Industrials 0.8435 133 8.2359 7.1955 14.8545 17.5008 77776.9118 BOWLER METCALF LIMITED BCF Industrials 0.0994 33 27.4457 7.5152 32.8165 28.097519 BUILDMAX LIMITED BDM Industrials 0.2186 8.2 ‐0.7162 2.3171 ‐1.0814 ‐6.048920 CARGO CARRIERS LIMITED CRG Industrials 0.9068 40.6 6.8071 2.5616 9.9946 7.1624 ‐12561.74
2002

21 CASHBUILD LIMITED CSB Consumer Services 3.0394 108.9 3.4767 3.9578 9.3348 25.2461 14001.3422 CAXTON CTP PUBLISHERS AND PRINTERS CAT Consumer Services 0.2367 487 15.3612 10.7782 13.6727 11.090523 CENMAG HOLDINGS LIMITED CMG Industrials 1.6968 ‐2.5 2.0328 0 4.1749 ‐3.863624 CERAMIC INDUSTRIES LIMITED CRM Industrials 0.4619 621.9 28.45 11.5501 24.7389 26.74125 CITY LODGE HOTELS LIMITED CLH Consumer Services 0.3095 137.4 40.934 8.3916 21.975 18.115226 COMAIR LIMITED COM Consumer Services 0.9869 3.6 3.3656 20.8333 5.478 3.9882 ‐58910.9827 COMBINED MOTOR HOLDINGS LIMITED CMH Consumer Services 1.7248 233.4 2.9889 5.0171 15.0018 21.86528 CONAFEX HOLDINGS SOCIETE ANONYME CNX Consumer Goods 0.0484 10.5263 ‐280.6953 33.25 ‐4.6653 ‐4.966829 CONTROL INSTRUMENTS GROUP LIMITED CNL Industrials 0.9316 13.6 4.1698 7.2059 9.2032 10.0655 7326.4230 CROOKES BROTHERS LIMITED CKS Consumer Goods 0.064 150.6 19.9065 6.8924 10.6218 8.9433 ‐15048.5231 CULLINAN HOLDINGS LIMITED CUL Consumer Services 1.8377 2.7 13.7815 6.6667 12.3634 65.794232 DATATEC LIMITED DTC Technology 1.3283 265 0.4788 6.7962 1.065 ‐7.1122 ‐127339833 DELTA ELECTRICAL INDUSTRIES LIMITED DEL Industrials 0.4865 487.5 26.1233 10.7467 29.8786 27.9924 202978.934 DIMENSION DATA HOLDINGS PLC DDT Technology 0.6956 24.2105 ‐11.3267 11.6065 ‐19.3479 ‐38.3958 ‐180804635 DISTELL GROUP LIMITED DST Consumer Goods 1.0028 141.7 10.5205 9.2308 11.84 11.1198 ‐191094.736 DORBYL LIMITED DLV Consumer Goods 1.1245 334.2 3.3739 5.5147 7.445 10.4813 ‐47381.2137 DYNAMIC CABLES RSA LIMITED DYM Technology 2.878 ‐8.8 ‐16.6911 ‐2.7273 ‐33.7187 ‐286.1342 881.9738 ELB GROUP LIMITED ELR Industrials 1.275 68.8 5.1556 7.5727 30.1027 44.2579 ‐33467.4439 Emergent Properties Limited EMG Consumer Goods 0.9381 1.1 3.5345 45.4545 3.8073 0.4705 ‐1320.7640 ENVIROSERV HOLDINGS LIMITED ENV Industrials 1.0977 30.6 11.5059 4.1176 11.7839 24.2434 ‐6036.1541 EOH HOLDINGS LIMITED EOH Technology 0.7463 26.2 12.3679 4.3893 20.8106 28.0099 6328.142 EXCELLERATE HOLDINGS LIMITED EXL Industrials 0.5055 6.3 6.1004 8.5714 11.9811 7.7935 ‐2293.2243 FAMOUS BRANDS LIMITED FBR Consumer Services 0.4759 17.3 9.2396 6.2428 24.4598 14.155944 FOSCHINI LIMITED FOS Consumer Services 0.5694 87.9 11.6538 7.9522 12.4736 10.9253 ‐228316.445 GOLD REEF RESORTS LIMITED GDF Consumer Services 0.5512 50.3 29.6122 5.6859 19.4346 12.947746 GRINDROD LIMITED GND Industrials 2.4118 174.9 10.6461 3.705 12.0601 31.723647 GROUP FIVE LIMITED GRF Industrials 4.8617 102.9 3.2093 3.4305 5.6771 20.169348 HOWDEN AFRICA HOLDINGS LIMITED HWN Industrials 1.2369 7.9 10.5712 10.3797 22.6007 5.479449 HUDACO INDUSTRIES LIMITED HDC Industrials 0.7899 315.7 8.7718 5.255 17.3152 16.5564 13739.0850 ILIAD AFRICA LIMITED ILA Industrials 1.3135 62 8.2096 4.4516 21.5153 32.6235 33584.951 ILLOVO SUGAR LIMITED ILV Consumer Goods 1.5418 102.8 17.131 7.8307 17.0273 30.6835 ‐60856.6552 IMPERIAL HOLDINGS LIMITED IPL Industrials 1.1981 608.8 8.488 8.9258 12.3666 16.3359 ‐16436053 INVICTA HOLDINGS LIMITED IVT Industrials 1.1159 62 9.0106 4.9839 15.2334 17.1108 ‐12914.754 ISA HOLDINGS LIMITED ISA Technology 1.3534 ‐3.8 ‐11.1768 ‐0.2632 ‐52.6054 ‐260.256455 ITALTILE LIMITED ITE Consumer Services 0.6485 518.3 21.451 8.8269 23.9724 29.1192 52076.2756 JASCO ELECTRONICS HOLDINGS LIMITED JSC Industrials 2.8409 27.6 8.932 2.3551 17.2976 37.7633 ‐31536.2257 JD GROUP LIMITED JDG Consumer Services 1.0301 225.2 11.6336 7.349 11.3122 12.565258 KAGISO MEDIA LIMITED KGM Consumer Services 0.5429 42.1 31.573 6.2233 34.0263 43.119459 KING CONSOLIDATED HOLDINGS LIMITED KNG Consumer Services 4.1683 ‐2 ‐0.9216 ‐3.5 ‐3.096 ‐57.7495 ‐3481.7160 KWV BELEGGINGS BEPERK KWV Consumer Goods 0.0005 203.2 0 8.1348 6.9094 11.043761 LABAT AFRICA LIMITED LAB Industrials 0.6294 20.2 20.98 1.9307 23.1143 30.8009 17151.7262 MARSHALL MONTEAGLE HLDGS SOC ANON MTE Industrials 0.3051 52.6316 0.9968 26.6 0.512 0.2225 ‐48397.5363 MASONITE (AFRICA) LIMITED MAS Industrials 0.4986 193 5.7663 6.2694 9.9923 10.8747 4581.7964 MEDI‐CLINIC CORPORATION LIMITED MDC Health Care 0.2354 88.7 18.8407 7.4521 21.567 18.5807 24114.5465 METAIR INVESTMENTS LIMITED MTA Consumer Goods 0.675 1539 8.6181 8.3015 14.0704 15.1683 42004.67

66 METROFILE HOLDINGS LIMITED MFL Industrials 0.95 131.2 6.9346 6.2881 10.901 4.810267 MOBILE INDUSTRIES LIMITED MOB Industrials 0.1901 ‐18.2 78.2803 ‐3.6264 1.5563 ‐21.2899 ‐89242.8668 MR PRICE GROUP LIMITED MPC Consumer Services 0.8356 59.5 7.0729 7.4454 14.2138 20.6009 17324.7369 MTN GROUP LIMITED MTN Telecommunications 0.3122 71.3 14.9493 18.878 14.379 3.590270 MURRAY AND ROBERTS HOLDINGS LIMITED MUR Industrials 1.261 154 6.1358 5.9416 8.7128 19.0822 ‐219581.371 MUSTEK LIMITED MST Technology 1.8752 98 6.6771 3.551 15.6648 17.9244 34475.4972 NAMPAK LIMITED NPK Industrials 1.3064 138.6 9.6802 9.7691 10.714 13.7106 ‐366399.773 NASPERS LIMITED NPN Consumer Services 1.0822 ‐313 ‐1.8254 ‐4.3227 ‐1.5743 ‐138.1191 ‐216115874 NETCARE LIMITED NTC Health Care 0.8241 36.7 17.6589 8.0654 20.6392 24.0435 89653.1275 NEW AFRICA INVESTMENT LIMITED NAI Consumer Services 0.0657 ‐18.7 0 ‐30.3743 ‐1.2485 ‐2.2719 ‐114784.276 NEW CLICKS HOLDINGS LIMITED NCL Consumer Services 0.8831 70.3 5.0695 9.2603 12.2057 11.9664 28367.5777 NICTUS BEPERK NCS Consumer Services 2.3847 7.4 3.3112 18.9189 5.5138 10.5832 ‐385.8578 NU‐WORLD HOLDINGS LIMITED NWL Consumer Goods 0.4897 184.7 5.9572 5.9339 13.4142 14.577379 OCEANA GROUP LIMITED OCE Consumer Goods 0.6697 162 10.9281 9.4691 25.9153 27.460480 OMNIA HOLDINGS LIMITED OMN Basic Materials 0.9979 284.5 10.1619 3.4622 19.393 23.4079 ‐8714.9181 PALS HOLDING LIMITED PAL Consumer Goods 0.8372 80.7 14.4505 1.5613 29.5601 35.4783 8027.3682 PICK N PAY HOLDINGS LIMITED PWK Consumer Services 0.0071 21.8 0 20.2752 88.7763 89.403583 PICK N PAY STORES LIMITED PIK Consumer Services 1.7751 77.9 3.3001 13.5302 14.6909 31.2989 154295.484 PRETORIA PORTLAND CEMENT COMPANY LD PPC Industrials 0.4546 829.5 34.2736 9.4057 23.7184 25.979185 RAINBOW CHICKEN LIMITED RBW Consumer Goods 0.4265 60.3 5.1662 4.66 12.6268 17.9461 ‐4460.2986 REUNERT LIMITED RLO Industrials 1.3581 229.5 10.494 8.3704 18.0426 34.6226 21193987 REX TRUEFORM CLOTHING COMPANY LD RTO Consumer Services 0.1728 23.7 2.0124 13.2911 3.4288 2.954588 RICHEMONT SECURITIES AG RCH Consumer Goods 0.1756 154.902 0.8297 16.9527 0.6493 0.546989 SABMILLER PLC SAB Consumer Goods 0.5086 553.4091 1.9934 14.3727 1.9063 1.821790 SAPPI LIMITED SAP Basic Materials 1.4792 1031.579 0.9885 11.7684 0.7956 1.305491 SASOL LIMITED SOL Oil & Gas 0.7057 1544 24.59 7.1114 24.2183 31.579692 SEARDEL INVESTMENT CORPORATION LD SER Consumer Goods 4.8356 75.9 7.2203 3.1621 10.0145 17.9447 ‐27694.0193 SETPOINT TECHNOLOGY HOLDINGS LD STO Industrials 1.472 6.5 15.245 3.3846 29.4829 43.608894 SHOPRITE HOLDINGS LIMITED SHP Consumer Services 3.7735 70.7 2.6934 11.2023 9.135 27.742895 SOVEREIGN FOOD INVESTMENTS LIMITED SOV Consumer Goods 1.0263 49.3 9.5099 3.5294 10.513 14.852 ‐5242.0496 SPANJAARD LIMITED SPA Basic Materials 1.275 43.8 7.4161 4.2237 18.3377 22.6181 46.8597 SPESCOM LIMITED SPS Technology 4.0439 ‐111.5 ‐19.4933 ‐0.4574 ‐30.9313 ‐1278.326 ‐60495.6398 SUN INTERNATIONAL LIMITED SUI Consumer Services 0.5663 58 5.7387 48.069 2.7293 ‐10.288699 SUPER GROUP LIMITED SPG Industrials 1.5482 68.6 9.3004 8.1924 15.3444 16.49100 TELKOM SA LIMITED TKG Telecommunications 1.8679 414.9 17.1622 0 10.7145 11.007101 THE BIDVEST GROUP LIMITED BVT Industrials 1.172 436.2 4.9364 11.3939 14.3316 22.0252 154446102 THE DON GROUP LIMITED DON Consumer Services 0.3058 0.1 3.4534 40 4.4612 4.8647 ‐3917.54103 TIGER BRANDS LIMITED TBS Consumer Goods 2.4242 817 12.3422 8.7748 23.7799 49.9102 744745.2104 TONGAAT HULETT LIMITED TON Consumer Goods 0.4675 388.1 14.2553 12.3576 10.9503 8.7804 139065.1105 TRANSPACO LIMITED TPC Industrials 0.9376 37.5 7.6491 1.8933 15.0098 15.3686 1960.22106 TRENCOR LIMITED TRE Industrials 2.942 ‐230.3 ‐5.1458 ‐3.7473 ‐1.1552 ‐21.3527 ‐808908.1107 TRUWORTHS INTERNATIONAL LIMITED TRU Consumer Services 0.2145 63.5 22.0627 8.9291 32.2467 27.8744108 UCS GROUP LIMITED UCS Technology 0.1428 10.9 12.723 5.7798 16.961 10.1411 ‐2079.72109 VENTER LEISURE AND COMM TRAILERS LD VTL Industrials 21.2154 ‐3.3 ‐4.4774 ‐5.7576 ‐6.8426 ‐227.3458 ‐2728.6110 WESCO INVESTMENTS LIMITED WES Consumer Goods 0 0 0 0 0 0

111 WILSON BAYLY HOLMES‐OVCON LIMITED WBO Industrials 2.5194 144 3.3524 5.1042 6.0072 15.8988 6700.71112 WINHOLD LIMITED WNH Industrials 1.962 8.6 3.5884 4.7674 8.5742 11.3271 ‐8826.58113 WOOLWORTHS HOLDINGS LIMITED WHL Consumer Services 0.579 44 7.6725 9.7273 16.3489 11.5267 ‐147917.3
Instrument Full Name
Instrument Ticker Symbol Industry D/E EPS OPM PE ROA ROE EVA
1 ADVTECH LIMITED ADH Consumer Services 0.3364 6.2 1.5736 3.871 1.9095 ‐0.4522 ‐233848.22 A E C I LIMITED AFE Basic Materials 1.0883 243 ‐6.3899 7 ‐7.7448 ‐26.0601 24940.983 ADCORP HOLDINGS LIMITED ADR Industrials 0.3035 156 7.0129 6.1603 30.911 18.5051 ‐30773.844 AFGRI LIMITED AFR Consumer Goods 1.5352 80.5 8.0072 7.0683 10.8756 16.0114 28858.865 AFRICAN AND OVERSEAS ENTERPRISES LD AOO Consumer Services 0.1756 19.5 2.2797 18.5641 3.3165 3.7836 AFRICAN MEDIA ENTERTAINMENT LIMITED AME Consumer Services 1.1539 1.1 3.6172 1.8182 10.1198 0.8944 ‐7930.47 AFRICAN OXYGEN LIMITED AFX Basic Materials 0.7855 103.8 15.2619 11.3295 20.1732 21.1742 56495.488 ALLIED ELECTRONICS CORPORATION LD ATN Industrials 0.8629 101.5 9.2894 7.6847 13.9366 20.2236 1945.349 ALLIED TECHNOLOGIES LIMITED ALT Telecommunications 1.0446 223.1 11.8651 9.5204 25.4201 30.7919 82772.910 ARGENT INDUSTRIAL LIMITED ART Industrials 0.6266 44.9 10.3297 2.539 14.4998 14.5224 ‐8141.711 ASPEN PHARMACARE HOLDINGS LIMITED APN Health Care 1.3335 48.4 27.2275 12.4587 33.4776 51.0989 191572.212 ASTRAPAK LIMITED APK Industrials 2.3935 47.1 10.4362 3.8641 16.2613 32.429 6911.9113 AVI LIMITED AVI Consumer Goods 0.5274 100.7 10.3455 9.4141 12.4311 16.8469 7622.6414 AWETHU BREWERIES LIMITED AWT Consumer Goods 3.9104 ‐7.6 4.8214 ‐0.5263 7.354 ‐10.3465 ‐6428.9615 BARLOWORLD LIMITED BAW Industrials 1.0649 499 4.4623 10.1984 6.108 5.3979 ‐84456216 BASIL READ HOLDINGS LIMITED BSR Industrials 4.6176 ‐26.1 ‐3.6049 ‐3.7165 ‐5.7405 ‐70.3946 ‐60705.8617 BELL EQUIPMENT LIMITED BEL Industrials 0.7432 105 8.924 8.5333 12.642 14.888518 BOWLER METCALF LIMITED BCF Industrials 0.2114 25.6 26.5308 7.7344 29.4051 27.666819 BUILDMAX LIMITED BDM Industrials 1.3296 5.5 8.7278 2 10.2105 7.504120 CARGO CARRIERS LIMITED CRG Industrials 1.1233 9.7 3.0928 8.9691 4.1751 ‐2.458 ‐14901.221 CASHBUILD LIMITED CSB Consumer Services 2.5415 71.1 2.4171 2.9817 7.3266 13.3725 8713.5222 CAXTON CTP PUBLISHERS AND PRINTERS CAT Consumer Services 0.2241 475 13.6456 11.3705 13.5786 11.525323 CENMAG HOLDINGS LIMITED CMG Industrials 1.1953 2.7 4.4424 133.3333 10.5888 3.9724 CERAMIC INDUSTRIES LIMITED CRM Industrials 0.3614 479 26.8175 10.8079 25.473 28.202225 CITY LODGE HOTELS LIMITED CLH Consumer Services 0.8232 135.5 38.4443 6.2362 19.2921 18.7672 10711.326 COMAIR LIMITED COM Consumer Services 1.0243 22.1 11.7621 7.1041 17.5516 25.2189 ‐755.3327 COMBINED MOTOR HOLDINGS LIMITED CMH Consumer Services 1.7189 193.4 3.2139 4.4467 14.8177 24.668328 CONAFEX HOLDINGS SOCIETE ANONYME CNX Consumer Goods 0.1276 119.8198 1.9549 2.5455 0.4199 1.243229 CONTROL INSTRUMENTS GROUP LIMITED CNL Industrials 0.9569 ‐6.7 ‐1.3334 ‐10.2985 ‐2.448 ‐13.056130 CROOKES BROTHERS LIMITED CKS Consumer Goods 0.0905 127.3 17.9147 4.729 9.294 9.577931 CULLINAN HOLDINGS LIMITED CUL Consumer Services 4.9853 ‐0.6 ‐5.0812 ‐11.6667 ‐6.9465 ‐425.86532 DATATEC LIMITED DTC Technology 1.5602 325.2 8.5376 6.2177 18.7248 34.3214 ‐802209.633 DELTA ELECTRICAL INDUSTRIES LIMITED DEL Industrials 0.6751 448 30.9346 11.4152 28.7576 31.465834 DIMENSION DATA HOLDINGS PLC DDT Technology 0.2098 115.3153 ‐7.6352 9.2442 ‐9.6047 ‐5.923 ‐478310535 DISTELL GROUP LIMITED DST Consumer Goods 0.9082 106.8 ‐4.1391 6.6667 ‐4.7822 ‐18.0598 ‐180726.2
2001

36 DORBYL LIMITED DLV Consumer Goods 1.1413 203.2 1.8886 9.0108 4.3567 4.58937 DYNAMIC CABLES RSA LIMITED DYM Technology 0.9162 11.5 12.8555 2.2609 19.3514 19.797538 ELB GROUP LIMITED ELR Industrials 3.7848 138.1 2.9826 5.9884 5.0819 14.4544 ‐15044.239 Emergent Properties Limited EMG Consumer Goods 0.6977 ‐7.2 0.7274 ‐9.7222 0.7492 ‐2.9604 ‐1762.2940 ENVIROSERV HOLDINGS LIMITED ENV Industrials 1.1904 26.2 3.6766 4.6183 4.6084 2.9049 4467.3741 EOH HOLDINGS LIMITED EOH Technology 0.6975 20.5 15.6515 4.0488 28.7361 34.3073 6471.0442 EXCELLERATE HOLDINGS LIMITED EXL Industrials 0.3754 6 6.7845 8.6667 14.0278 9.2889 1933.743 FAMOUS BRANDS LIMITED FBR Consumer Services 0.5305 25 11.6858 4.36 32.9854 22.119744 FOSCHINI LIMITED FOS Consumer Services 0.4622 50.1 6.6969 10.519 6.852 6.3013 ‐375280.745 GOLD REEF RESORTS LIMITED GDF Consumer Services 0.0449 46.7 0 4.9893 11.4077 14.463246 GRINDROD LIMITED GND Industrials 1.4685 121.3 9.7761 3.7758 8.9407 17.64347 GROUP FIVE LIMITED GRF Industrials 3.3562 71.8 3.543 4.5961 6.8294 14.033748 HOWDEN AFRICA HOLDINGS LIMITED HWN Industrials 0.9906 ‐2.1 6.8336 ‐33.3333 12.6111 ‐7.749649 HUDACO INDUSTRIES LIMITED HDC Industrials 0.88 224.1 9.5775 5.0022 15.2974 18.2757 368.850 ILIAD AFRICA LIMITED ILA Industrials 1.3568 32.3 6.5581 3.6842 17.1091 26.602 19890.3151 ILLOVO SUGAR LIMITED ILV Consumer Goods 1.728 67.5 14.4495 7.6148 13.2136 18.4838 ‐3493.8952 IMPERIAL HOLDINGS LIMITED IPL Industrials 1.1314 535 10.6473 12.2112 14.4059 17.2346 ‐230064.553 INVICTA HOLDINGS LIMITED IVT Industrials 0.9095 48 8.551 5.4375 13.476 15.0009 ‐24596.9154 ISA HOLDINGS LIMITED ISA Technology 2.0264 ‐11.3143 ‐22.3302 ‐0.5303 ‐34.1698 ‐113.911455 ITALTILE LIMITED ITE Consumer Services 0.6198 317 17.2276 11.7035 22.1706 25.7384 25571.0556 JASCO ELECTRONICS HOLDINGS LIMITED JSC Industrials 3.842 ‐43.2 ‐25.0538 ‐0.8102 ‐59.0804 ‐561.2211 ‐94271.7857 JD GROUP LIMITED JDG Consumer Services 1.2459 351.2 13.4636 11.0251 11.2508 14.643258 KAGISO MEDIA LIMITED KGM Consumer Services 0.4608 34.9 20.3422 8.3954 23.26 28.1956 26333.3559 KING CONSOLIDATED HOLDINGS LIMITED KNG Consumer Services 1.9903 ‐0.9 ‐1.9897 ‐8.8889 ‐6.9949 ‐9.3026 ‐7029.8860 KWV BELEGGINGS BEPERK KWV Consumer Goods 0.0006 150 0 6.78 1.0507 5.56961 LABAT AFRICA LIMITED LAB Industrials 0.688 9.1 14.585 1.8681 17.7884 19.939 ‐14178.8362 MARSHALL MONTEAGLE HLDGS SOC ANON MTE Industrials 0.3008 216.2162 3.825 5.5731 1.8048 2.6927 ‐47577.663 MASONITE (AFRICA) LIMITED MAS Industrials 0.4945 120 4.9322 4.6917 7.7171 7.6291 ‐15668.4364 MEDI‐CLINIC CORPORATION LIMITED MDC Health Care 0.2415 71.8 18.3987 8.8022 19.6221 16.5764 ‐1308.9465 METAIR INVESTMENTS LIMITED MTA Consumer Goods 0.4896 1588 9.8825 3.6713 15.4984 17.8593 16455.0166 METROFILE HOLDINGS LIMITED MFL Industrials 0.8973 157.3 10.2939 7.1519 10.6567 8.584667 MOBILE INDUSTRIES LIMITED MOB Industrials 0.2208 25.6 128.7714 3.0469 3.13 34.6696 ‐180152.568 MR PRICE GROUP LIMITED MPC Consumer Services 0.8619 38.6 5.369 7.0984 11.3161 15.9155 ‐6370.9969 MTN GROUP LIMITED MTN Telecommunications 0.2301 74.5 19.3024 25.5302 19.5864 4.724870 MURRAY AND ROBERTS HOLDINGS LIMITED MUR Industrials 1.6506 76 3.5185 7.9868 5.3067 12.7258 ‐289679.571 MUSTEK LIMITED MST Technology 1.637 56 5.0917 3.0179 11.0781 5.6615 ‐20154.3572 NAMPAK LIMITED NPK Industrials 1.4435 88.1 7.612 12.3383 10.1841 14.7386 ‐90533.9273 NASPERS LIMITED NPN Consumer Services 0.3895 ‐299 20.9009 ‐9.6856 16.4393 33.449 ‐315890374 NETCARE LIMITED NTC Health Care 1.2208 27.9 17.5265 7.3477 15.3589 20.6982 54112.6775 NEW AFRICA INVESTMENT LIMITED NAI Consumer Services 0.0621 179 0 3.838 20.5449 ‐1.9498 289162176 NEW CLICKS HOLDINGS LIMITED NCL Consumer Services 0.8812 60.3 6.6803 15.141 15.3199 17.2756 30537.4777 NICTUS BEPERK NCS Consumer Services 2.8185 14.9 3.5848 5.3691 9.9477 50.864 ‐188.0278 NU‐WORLD HOLDINGS LIMITED NWL Consumer Goods 0.5492 156.4 5.8227 6.087 13.8555 14.4565 ‐8988.1679 OCEANA GROUP LIMITED OCE Consumer Goods 0.9446 127.2 10.9353 8.2862 23.9793 29.040380 OMNIA HOLDINGS LIMITED OMN Basic Materials 1.9629 ‐1.28 2.9463 ‐267.1875 4.3933 ‐0.1968 ‐129725.2

81 PALS HOLDING LIMITED PAL Consumer Goods 1.1915 33.3 7.242 1.3514 12.4236 21.3606 604.8282 PICK N PAY HOLDINGS LIMITED PWK Consumer Services 0.4049 20.9 0 24.4976 55.7026 78.254683 PICK N PAY STORES LIMITED PIK Consumer Services 2.8366 63.9 3.3293 20.3912 13.3052 34.7305 105899.584 PRETORIA PORTLAND CEMENT COMPANY LD PPC Industrials 0.4055 709.7 28.0321 9.1715 19.7988 21.3078 27045.9285 RAINBOW CHICKEN LIMITED RBW Consumer Goods 0.3491 44.2 4.4452 4.0045 8.9962 10.183286 REUNERT LIMITED RLO Industrials 1.8336 176 10.7263 9.3409 17.7462 44.0464 136173.287 REX TRUEFORM CLOTHING COMPANY LD RTO Consumer Services 0.1722 12.3 1.3222 22.1138 1.9456 1.564288 RICHEMONT SECURITIES AG RCH Consumer Goods 0.155 1287.5 5.3627 13.8221 4.7707 2.353989 SABMILLER PLC SAB Consumer Goods 0.5885 435.2 1.459 12.824 1.497 0.654890 SAPPI LIMITED SAP Basic Materials 1.567 1018.018 0.7375 7.5824 0.6862 1.078291 SASOL LIMITED SOL Oil & Gas 0.8161 1236 26.7044 6.2468 22.3289 31.619992 SEARDEL INVESTMENT CORPORATION LD SER Consumer Goods 9.3213 37.1 5.3241 5.7412 5.4642 9.8925 ‐80505.3693 SETPOINT TECHNOLOGY HOLDINGS LD STO Industrials 3.6814 ‐3.1 ‐3.4583 ‐4.8387 ‐7.1909 ‐92.571894 SHOPRITE HOLDINGS LIMITED SHP Consumer Services 3.9159 58 1.8867 10.0345 5.7389 16.924295 SOVEREIGN FOOD INVESTMENTS LIMITED SOV Consumer Goods 0.7291 33.5 9.6451 3.7015 12.9819 14.5871 ‐2303.0396 SPANJAARD LIMITED SPA Basic Materials 1.7545 36.4 5.7694 6.456 15.0116 22.5067 ‐140.8697 SPESCOM LIMITED SPS Technology 1.5495 31.9 8.4263 8.3386 15.5794 29.4389 8538.1698 SUN INTERNATIONAL LIMITED SUI Consumer Services 0.5024 318 10.4898 11.2138 4.4638 ‐7.884299 SUPER GROUP LIMITED SPG Industrials 1.1445 94 13.5869 7.9894 22.7773 41.9915100 TELKOM SA LIMITED TKG Telecommunications 2.1578 312.5 15.9258 0 9.9026 8.8421101 THE BIDVEST GROUP LIMITED BVT Industrials 1.1259 365.4 5.3125 13.0569 16.6646 25.8672 268119.6102 THE DON GROUP LIMITED DON Consumer Services 4.8258 ‐0.5 ‐146.8723 ‐4 ‐51.3169 ‐337.6241 ‐14447.47103 TIGER BRANDS LIMITED TBS Consumer Goods 4.3151 611 13.7627 9.491 23.7136 73.1088 674451.5104 TONGAAT HULETT LIMITED TON Consumer Goods 0.6096 598.4 20.7381 8.6547 12.9449 12.987 ‐164031.3105 TRANSPACO LIMITED TPC Industrials 1.3351 ‐2.4 1.8973 ‐41.25 3.2306 ‐1.8949 ‐13031.45106 TRENCOR LIMITED TRE Industrials 2.2886 314.6 56.4705 3.0769 16.1035 34.6387 176678.3107 TRUWORTHS INTERNATIONAL LIMITED TRU Consumer Services 0.3264 44.2 18.525 11.81 23.4713 24.694108 UCS GROUP LIMITED UCS Technology 0.1171 11.3 23.7533 7.5221 23.5359 15.5114 201.24109 VENTER LEISURE AND COMM TRAILERS LD VTL Industrials 3.9869 ‐22.2 ‐17.9462 ‐0.2252 ‐42.0719 ‐306.4428 ‐10198.88110 WESCO INVESTMENTS LIMITED WES Consumer Goods 0.876 155 2.4578 57.8516 4.7143 5.8515 ‐414871.1111 WILSON BAYLY HOLMES‐OVCON LIMITED WBO Industrials 2.2631 113 4.3964 5.1858 7.7836 20.1734 27507.56112 WINHOLD LIMITED WNH Industrials 2.0885 5.4 2.745 3.7037 6.4149 5.3313 ‐11307.72113 WOOLWORTHS HOLDINGS LIMITED WHL Consumer Services 0.4794 32.3 6.7515 10.7121 12.5946 12.3752 ‐224520.1
Instrument Full Name
Instrument Ticker Symbol Industry D/E EPS OPM PE ROA ROE EVA
1 ADVTECH LIMITED ADH Consumer Services 0.3626 9.2 11.7936 3.1522 14.627 3.8521 ‐105814.82 A E C I LIMITED AFE Basic Materials 0.674 183 8.0546 6.847 8.757 8.0345 33689.413 ADCORP HOLDINGS LIMITED ADR Industrials 0.5246 192 10.7417 7.1406 33.453 30.5436 ‐21866.644 AFGRI LIMITED AFR Consumer Goods 0.4545 76.6 8.6906 5.0261 11.781 11.1035 ‐20295.215 AFRICAN AND OVERSEAS ENTERPRISES LD AOO Consumer Services 0.2032 67 6.8429 10.8806 10.0611 8.5705 ‐18421.98
2000

6 AFRICAN MEDIA ENTERTAINMENT LIMITED AME Consumer Services 1.5099 0.7 ‐6.3927 10 ‐19.2802 ‐119.629 ‐12476.447 AFRICAN OXYGEN LIMITED AFX Basic Materials 1.1015 93.9 14.1488 13.3227 17.1581 20.2665 23578.098 ALLIED ELECTRONICS CORPORATION LD ATN Industrials 0.7799 85.6 5.7579 8.6682 8.0494 ‐6.011 ‐34383.429 ALLIED TECHNOLOGIES LIMITED ALT Telecommunications 0.9448 153.3 4.3211 9.9804 8.2847 ‐17.272 ‐23796.6510 ARGENT INDUSTRIAL LIMITED ART Industrials 0.6236 37.8 10.541 3.3598 12.1071 12.8706 ‐11438.4311 ASPEN PHARMACARE HOLDINGS LIMITED APN Health Care 2.1658 33.8 21.5085 16.9822 24.0479 32.7602 135122.312 ASTRAPAK LIMITED APK Industrials 2.7888 44.8 ‐15.8493 5.692 ‐22.1045 ‐158.9217 10279.6813 AVI LIMITED AVI Consumer Goods 0.4916 90.1 6.648 7.1587 10.0691 12.4575 ‐165396.714 AWETHU BREWERIES LIMITED AWT Consumer Goods 11.9817 ‐22.1 ‐29.6037 ‐0.3167 ‐59.7445 ‐2593.243 ‐14250.3515 BARLOWORLD LIMITED BAW Industrials 0.8214 380.4 9.3313 11.6115 12.9354 17.8426 ‐877131.216 BASIL READ HOLDINGS LIMITED BSR Industrials 5.7207 ‐50.6 ‐2.8034 ‐1.2253 ‐5.9338 ‐40.5331 ‐54205.0617 BELL EQUIPMENT LIMITED BEL Industrials 0.8033 87 8.3409 7.8161 13.3256 16.3712 42548.0818 BOWLER METCALF LIMITED BCF Industrials 0.1295 18.3 25.302 6.3934 30.2252 24.833119 BUILDMAX LIMITED BDM Industrials 1.7075 ‐28.4 ‐3.4506 ‐0.5282 ‐4.0126 ‐41.762120 CARGO CARRIERS LIMITED CRG Industrials 1.2565 18.3 6.1024 6.776 7.6227 3.844 ‐15550.3321 CASHBUILD LIMITED CSB Consumer Services 2.9483 ‐4.7 0.4742 ‐65.9574 1.4752 ‐1.6629 ‐17129.0922 CAXTON CTP PUBLISHERS AND PRINTERS CAT Consumer Services 0.2478 398 6.6614 15.0628 7.5001 3.401723 CENMAG HOLDINGS LIMITED CMG Industrials 1.6661 4.2 ‐5.2825 4.7619 ‐10.3314 ‐61.266724 CERAMIC INDUSTRIES LIMITED CRM Industrials 0.3595 329.8 22.6526 10.7095 23.7821 26.537725 CITY LODGE HOTELS LIMITED CLH Consumer Services 0.9777 116.8 40.8902 6.1815 19.5059 19.8453 1181.4426 COMAIR LIMITED COM Consumer Services 1.1713 26.3 18.1655 8.9734 29.7939 40.975 48355.127 COMBINED MOTOR HOLDINGS LIMITED CMH Consumer Services 1.6426 145.4 3.2933 5.0894 14.8503 24.186728 CONAFEX HOLDINGS SOCIETE ANONYME CNX Consumer Goods 0.0865 116.6667 1.73 7.7143 0.423 0.946529 CONTROL INSTRUMENTS GROUP LIMITED CNL Industrials 0.73 6.8 9.6369 13.8235 12.8226 19.126730 CROOKES BROTHERS LIMITED CKS Consumer Goods 0.1029 105.1 50.6068 8.6965 26.1097 25.285231 CULLINAN HOLDINGS LIMITED CUL Consumer Services 3.0739 ‐0.8 ‐0.5501 ‐7.5 ‐0.7081 ‐17.0298 ‐32547.5832 DATATEC LIMITED DTC Technology 3.2991 351.6 0.3029 37.4573 0.5423 ‐20.0418 ‐899761.233 DELTA ELECTRICAL INDUSTRIES LIMITED DEL Industrials 0.736 326.2 19.4101 11.6217 24.5385 22.404134 DIMENSION DATA HOLDINGS PLC DDT Technology 0.1715 116.6667 ‐0.3323 59.7514 ‐0.2419 ‐0.5131 ‐535007035 DISTELL GROUP LIMITED DST Consumer Goods 0.9547 118.5 19.2309 7.443 19.9128 23.1288 ‐51906.6336 DORBYL LIMITED DLV Consumer Goods 1.173 313.9 3.8938 9.5158 8.8066 8.595837 DYNAMIC CABLES RSA LIMITED DYM Technology 0.2617 ‐76.9 10.3722 ‐0.3771 35.1702 33.366938 ELB GROUP LIMITED ELR Industrials 2.7902 ‐40.8 ‐0.7058 ‐13.3088 ‐1.0129 ‐13.3235 ‐63465.0239 Emergent Properties Limited EMG Consumer Goods 0.6801 ‐11.7 ‐1.1339 ‐4.4444 ‐1.028 ‐4.625 ‐2063.0940 ENVIROSERV HOLDINGS LIMITED ENV Industrials 0.6636 22.1 10.5625 2.8054 12.7701 20.771741 EOH HOLDINGS LIMITED EOH Technology 0.7809 16.1 12.1296 10.1863 20.8139 16.9484 3681.1342 EXCELLERATE HOLDINGS LIMITED EXL Industrials 0.3647 2.5333 1.3768 26.8421 2.139 1.2676 ‐1516.1443 FAMOUS BRANDS LIMITED FBR Consumer Services 0.6111 24 10.8812 6.7083 34.3659 25.345444 FOSCHINI LIMITED FOS Consumer Services 0.3182 100.1 12.6091 14.4555 12.6473 13.2912 ‐212466.745 GOLD REEF RESORTS LIMITED GDF Consumer Services 0.1366 48 0 3.0208 10.335 12.739246 GRINDROD LIMITED GND Industrials 1.9181 65.5 10.4156 4.0611 9.472 13.898947 GROUP FIVE LIMITED GRF Industrials 2.4151 42.1 2.222 4.5131 3.9585 5.5948 HOWDEN AFRICA HOLDINGS LIMITED HWN Industrials 0.8275 7.6 9.245 10.3947 14.9315 4.405249 HUDACO INDUSTRIES LIMITED HDC Industrials 0.8073 171.1 9.4239 4.3776 15.0256 17.996 ‐9177.1350 ILIAD AFRICA LIMITED ILA Industrials 1.5994 29.9 7.4987 2.1405 18.9676 30.9702 13446.87

51 ILLOVO SUGAR LIMITED ILV Consumer Goods 1.6282 61.6 7.9748 8.5877 6.4909 6.9015 18602.452 IMPERIAL HOLDINGS LIMITED IPL Industrials 1.3452 444 7.7556 12.1577 8.139 8.8703 ‐133748.653 INVICTA HOLDINGS LIMITED IVT Industrials 0.4784 38 8.4811 6.8684 10.9529 13.5006 ‐19196.954 ISA HOLDINGS LIMITED ISA Technology 0 0 0 0 0 055 ITALTILE LIMITED ITE Consumer Services 0.5434 254.8 16.0534 13.9914 24.8193 27.594456 JASCO ELECTRONICS HOLDINGS LIMITED JSC Industrials 1.5758 21 2.416 8.9048 3.6734 ‐6.0615 ‐38841.8257 JD GROUP LIMITED JDG Consumer Services 0.8707 257.1429 12.9201 17.7489 12.3932 11.542158 KAGISO MEDIA LIMITED KGM Consumer Services 0.3117 34.2 27.0246 6.6667 16.1186 23.2069 ‐7451.6959 KING CONSOLIDATED HOLDINGS LIMITED KNG Consumer Services 2.1747 1.4 ‐0.4482 14.2857 ‐1.6045 ‐7.6631 ‐4659.2660 KWV BELEGGINGS BEPERK KWV Consumer Goods 0.0413 164.2 0 7.43 5.883 13.838261 LABAT AFRICA LIMITED LAB Industrials 1.1026 10.5 ‐75.097 6.2857 ‐57.7859 ‐134.0103 ‐14538.1262 MARSHALL MONTEAGLE HLDGS SOC ANON MTE Industrials 0.4512 50 2.2349 24.96 1.124 1.0765 ‐53202.3763 MASONITE (AFRICA) LIMITED MAS Industrials 0.4597 12 1.1062 33.3333 1.6612 0.8722 ‐16517.8864 MEDI‐CLINIC CORPORATION LIMITED MDC Health Care 0.3571 58.3 18.1247 6.8611 18.9143 16.3828 ‐58788.6265 METAIR INVESTMENTS LIMITED MTA Consumer Goods 0.4733 1419 11.6609 2.2755 19.7926 21.234 26443.7966 METROFILE HOLDINGS LIMITED MFL Industrials 1.0627 147.3 5.3933 16.9925 4.3552 ‐0.362667 MOBILE INDUSTRIES LIMITED MOB Industrials 0.4983 13.5 79.078 1.7778 3.2368 ‐4.4608 ‐116712.768 MR PRICE GROUP LIMITED MPC Consumer Services 0.8027 43.5 6.2733 14.9885 14.0063 21.1659 10311.2969 MTN GROUP LIMITED MTN Telecommunications 1.1068 50.7 ‐71.877 82.8008 ‐73.965 ‐269.886770 MURRAY AND ROBERTS HOLDINGS LIMITED MUR Industrials 2.0032 36 ‐3.7206 8.9722 ‐8.7587 ‐43.0526 ‐489730.371 MUSTEK LIMITED MST Technology 1.2005 71.4 4.0753 4.958 7.7249 7.3612 ‐19843.1972 NAMPAK LIMITED NPK Industrials 1.4263 123.1 3.1804 10.6499 4.395 ‐3.8496 6423973 NASPERS LIMITED NPN Consumer Services 1.6585 ‐111 9.5921 ‐85.4414 7.5904 ‐20.9455 ‐134830874 NETCARE LIMITED NTC Health Care 0.9851 20.2 16.951 4.4059 15.0511 17.0129 ‐50623.8675 NEW AFRICA INVESTMENT LIMITED NAI Consumer Services 0.1505 18.96 0 8.6498 3.4989 2.2641 ‐956179876 NEW CLICKS HOLDINGS LIMITED NCL Consumer Services 1.0871 55.8 5.1822 19.9462 11.9942 15.2807 ‐2877.0477 NICTUS BEPERK NCS Consumer Services 4.0182 ‐2 0 ‐15 10.8314 12.2411 ‐231778 NU‐WORLD HOLDINGS LIMITED NWL Consumer Goods 0.621 134.8 7.6724 9.9258 13.2393 13.9764 ‐12843.1279 OCEANA GROUP LIMITED OCE Consumer Goods 1.0416 107.3 10.3679 6.4026 23.047 29.644880 OMNIA HOLDINGS LIMITED OMN Basic Materials 0 0 0 0 0 081 PALS HOLDING LIMITED PAL Consumer Goods 0.8854 11 3.9333 2.3636 8.6354 8.7493 ‐2563.0182 PICK N PAY HOLDINGS LIMITED PWK Consumer Services 0.3698 17 0 25 56.0944 76.835783 PICK N PAY STORES LIMITED PIK Consumer Services 3.0144 54.7 3.1572 20.1097 12.7024 33.9218 71957.1684 PRETORIA PORTLAND CEMENT COMPANY LD PPC Industrials 0.318 500.2 20.4622 10.2919 14.2885 15.060785 RAINBOW CHICKEN LIMITED RBW Consumer Goods 0.5015 5.4 2.2675 15.3704 4.2152 2.6006 ‐178978.886 REUNERT LIMITED RLO Industrials 1.2566 140.7 10.3891 8.408 16.0754 35.037 64346.9287 REX TRUEFORM CLOTHING COMPANY LD RTO Consumer Services 0.2017 53.8 5.9778 9.4796 8.8137 6.82588 RICHEMONT SECURITIES AG RCH Consumer Goods 0.1721 936.875 16.7283 16.3768 11.9985 7.087489 SABMILLER PLC SAB Consumer Goods 0.5377 348.4 23.3273 14.3456 25.5474 33.556590 SAPPI LIMITED SAP Basic Materials 1.4276 1057.971 2.1148 5.4803 2.0769 3.073391 SASOL LIMITED SOL Oil & Gas 0.4604 727 25.7822 6.4402 24.7716 24.056392 SEARDEL INVESTMENT CORPORATION LD SER Consumer Goods 1.1164 28.9 3.5997 4.7059 6.1499 8.6206 ‐71848.4693 SETPOINT TECHNOLOGY HOLDINGS LD STO Industrials 2.7861 5.8 ‐0.0745 4.4828 ‐0.1449 ‐76.157694 SHOPRITE HOLDINGS LIMITED SHP Consumer Services 2.6384 57.6 2.1043 11.8403 7.5402 22.731895 SOVEREIGN FOOD INVESTMENTS LIMITED SOV Consumer Goods 0.891 ‐4.5 3.3477 ‐16.4444 4.2513 ‐1.7667 ‐15215.99

96 SPANJAARD LIMITED SPA Basic Materials 2.4679 ‐3.3 2.5015 ‐74.2424 5.2796 ‐5.5929 ‐1611.297 SPESCOM LIMITED SPS Technology 2.9946 10.4 ‐51.4248 32.0192 ‐71.038 ‐402.6151 ‐8705.4398 SUN INTERNATIONAL LIMITED SUI Consumer Services 0.3568 266 13.3676 9.391 5.494 6.814899 SUPER GROUP LIMITED SPG Industrials 1.6054 85 9.086 9.5529 14.4563 28.745100 TELKOM SA LIMITED TKG Telecommunications 1.7278 306.6 18.0951 0 10.8144 12.0145101 THE BIDVEST GROUP LIMITED BVT Industrials 1.2939 310 2.5099 14.7903 8.2221 8.631102 THE DON GROUP LIMITED DON Consumer Services 0.7878 ‐2.8 3.5232 ‐1.4286 0.848 ‐9.8199 ‐50748.29103 TIGER BRANDS LIMITED TBS Consumer Goods 8.0808 602 ‐4.0398 9.6678 ‐7.877 ‐206.8024 735811.7104 TONGAAT HULETT LIMITED TON Consumer Goods 0.6249 507.9 15.6803 6.9443 9.8613 9.6527 ‐69608.1105 TRANSPACO LIMITED TPC Industrials 0.9432 50 6.0889 2.46 10.261 3.4344 3569.72106 TRENCOR LIMITED TRE Industrials 2.7137 165 8.0328 1.3939 2.4035 ‐4.7402 ‐379040.9107 TRUWORTHS INTERNATIONAL LIMITED TRU Consumer Services 0.3274 37.3 3.9548 14.6113 6.2704 ‐1.2831108 UCS GROUP LIMITED UCS Technology 0.1675 12.6 34.3111 11.9841 27.5322 20.0942 ‐1984.24109 VENTER LEISURE AND COMM TRAILERS LD VTL Industrials 0.6835 0.3 1.8884 43.3333 4.0496 1.1553 ‐1606.73110 WESCO INVESTMENTS LIMITED WES Consumer Goods 0.5188 59 0.8809 70.6102 1.754 0.2469 ‐569848.1111 WILSON BAYLY HOLMES‐OVCON LIMITED WBO Industrials 1.8333 88 5.2379 3.7841 10.7558 23.5318 7757.34112 WINHOLD LIMITED WNH Industrials 1.6174 7.8 4.4981 2.0513 9.658 13.8549 ‐9686.01113 WOOLWORTHS HOLDINGS LIMITED WHL Consumer Services 0.5244 27 6.1685 10.9259 11.1556 10.9207 ‐206301.9
Instrument Full Name
Instrument Ticker Symbol Industry D/E EPS OPM PE ROA ROE EVA
1 ADVTECH LIMITED ADH Consumer Services 0.3555 12.5 ‐73.8295 10.96 ‐41.4263 ‐66.0245 ‐224586.82 A E C I LIMITED AFE Basic Materials 0.7736 193 19.286 6.4922 25.3369 34.2596 24042.323 ADCORP HOLDINGS LIMITED ADR Industrials 1.551 151 ‐33.3036 15.9801 ‐89.1926 ‐268.634 ‐6361.684 AFGRI LIMITED AFR Consumer Goods 1.2208 82.3 11.1707 3.5358 12.9082 17.7123 54773.445 AFRICAN AND OVERSEAS ENTERPRISES LD AOO Consumer Services 0.2194 88.4 9.47 6.5158 12.6791 11.9026 ‐14460.956 AFRICAN MEDIA ENTERTAINMENT LIMITED AME Consumer Services 1.9071 2.6 8.5913 9.6154 13.4639 21.1329 6999.667 AFRICAN OXYGEN LIMITED AFX Basic Materials 1.1247 92 14.8032 11.0978 15.2385 19.0536 ‐12399.88 ALLIED ELECTRONICS CORPORATION LD ATN Industrials 0.7651 98.4 12.1904 6.1687 17.0846 8.9494 37690.429 ALLIED TECHNOLOGIES LIMITED ALT Telecommunications 0.9209 115.1 14.5807 10.808 23.7066 18.4705 85353.2810 ARGENT INDUSTRIAL LIMITED ART Industrials 0.6764 7.1 11.8 2.5352 13.5427 12.7726 ‐10987.7911 ASPEN PHARMACARE HOLDINGS LIMITED APN Health Care 2.3205 19.5 ‐10.5812 28.4615 ‐4.8553 ‐58.4568 61786.412 ASTRAPAK LIMITED APK Industrials 0.579 44.1 15.1621 4.0363 20.9757 15.2882 ‐17513.513 AVI LIMITED AVI Consumer Goods 0.5138 121.1 4.2921 6.1767 5.6261 5.6982 ‐840028.414 AWETHU BREWERIES LIMITED AWT Consumer Goods 1.1558 2.7 3.6116 7.7778 5.5373 10.2619 ‐11824.6215 BARLOWORLD LIMITED BAW Industrials 0.9801 319.7 9.748 9.4933 14.4196 24.6667 ‐110766616 BASIL READ HOLDINGS LIMITED BSR Industrials 3.2882 42.9 3.7102 9.2308 10.1187 31.0355 ‐1195.4717 BELL EQUIPMENT LIMITED BEL Industrials 0.5143 53 8.2051 6.7736 15.698 11.684518 BOWLER METCALF LIMITED BCF Industrials 0.3194 15.6 26.4026 5.4487 26.7086 26.331219 BUILDMAX LIMITED BDM Industrials 1.2168 ‐10.1333 1.8075 ‐4.1447 2.5704 ‐7.914620 CARGO CARRIERS LIMITED CRG Industrials 1.1147 39.8 10.2256 3.392 11.4817 8.1181 ‐12714.64
1999

21 CASHBUILD LIMITED CSB Consumer Services 2.47 45.2 1.969 7.2788 6.8038 10.5123 ‐1070.4822 CAXTON CTP PUBLISHERS AND PRINTERS CAT Consumer Services 0.4051 480 22.0226 11.3208 20.9578 25.167723 CENMAG HOLDINGS LIMITED CMG Industrials 0.6788 0.6 5.5945 86.6667 11.3913 0.480924 CERAMIC INDUSTRIES LIMITED CRM Industrials 0.4179 223.7 17.808 10.3129 17.5744 22.138225 CITY LODGE HOTELS LIMITED CLH Consumer Services 0.6201 144.1 48.2045 5.9889 17.6033 16.0251 ‐15130.7426 COMAIR LIMITED COM Consumer Services 1.4979 21 19.1569 8.0476 24.3674 40.6791 51548.5827 COMBINED MOTOR HOLDINGS LIMITED CMH Consumer Services 1.1194 115.3 3.4534 4.4926 20.0773 22.729828 CONAFEX HOLDINGS SOCIETE ANONYME CNX Consumer Goods 0.1579 64.0719 1.7197 13.2664 0.464 1.260429 CONTROL INSTRUMENTS GROUP LIMITED CNL Industrials 0.8678 14.9 ‐3.4849 5.3691 ‐3.614 ‐5.496530 CROOKES BROTHERS LIMITED CKS Consumer Goods 0.0861 158.4 21.3981 4.1856 11.8802 10.120731 CULLINAN HOLDINGS LIMITED CUL Consumer Services 3.6286 0.2 5.3498 40 6.0657 41.499932 DATATEC LIMITED DTC Technology 1.6506 266.5 ‐31.5983 37.6961 ‐44.6009 ‐152.747 ‐594463.633 DELTA ELECTRICAL INDUSTRIES LIMITED DEL Industrials 0.7301 232.6 20.844 10.8169 25.0636 26.98134 DIMENSION DATA HOLDINGS PLC DDT Technology 1.6495 81.7 ‐23.9976 30.3917 ‐32.2576 ‐180.3222 279688.635 DISTELL GROUP LIMITED DST Consumer Goods 1.0399 129.7 16.6617 5.5744 17.6781 20.8001 ‐17603.5336 DORBYL LIMITED DLV Consumer Goods 1.0171 227.7 4.651 7.5099 9.732 11.134437 DYNAMIC CABLES RSA LIMITED DYM Technology 2.7052 ‐47.1 ‐30.5864 ‐0.9766 ‐58.1529 ‐315.688338 ELB GROUP LIMITED ELR Industrials 2.4487 141.2 3.8014 3.1303 6.7871 15.2634 ‐63453.4439 Emergent Properties Limited EMG Consumer Goods 0.5562 ‐13.3 ‐1.2156 ‐6.1654 ‐1.0016 ‐5.0366 ‐2472.9240 ENVIROSERV HOLDINGS LIMITED ENV Industrials 1.0362 20.1 8.8462 4.5274 11.2587 22.4909 4893.141 EOH HOLDINGS LIMITED EOH Technology 0.6335 12.2 ‐30.1031 25 ‐46.1337 ‐85.342742 EXCELLERATE HOLDINGS LIMITED EXL Industrials 0.6048 2.4 2.7128 12.9167 5.0259 7.0629 ‐7234.8943 FAMOUS BRANDS LIMITED FBR Consumer Services 0.5609 21.5 10.8375 3.6279 31.9339 25.226844 FOSCHINI LIMITED FOS Consumer Services 0.3531 91.2 13.8647 13.3333 16.6826 13.6796 ‐131129.445 GOLD REEF RESORTS LIMITED GDF Consumer Services 0.4765 22.8 0 4.4298 4.8326 7.614746 GRINDROD LIMITED GND Industrials 2.2719 ‐59.3 ‐2.9635 ‐2.5126 ‐1.9268 ‐19.702847 GROUP FIVE LIMITED GRF Industrials 2.2028 84.2 4.2377 2.1496 7.6806 12.626248 HOWDEN AFRICA HOLDINGS LIMITED HWN Industrials 0.9021 3.9 6.5049 25.8974 10.976 2.413349 HUDACO INDUSTRIES LIMITED HDC Industrials 0.8946 141.5 7.6983 5.8233 12.2691 13.9393 ‐6977.0150 ILIAD AFRICA LIMITED ILA Industrials 3.4887 0 8.6119 0 18.7095 47.7261 7600.8851 ILLOVO SUGAR LIMITED ILV Consumer Goods 1.8916 98.4 23.2129 6.3923 18.8589 40.7253 155374.552 IMPERIAL HOLDINGS LIMITED IPL Industrials 1.2167 364.8 11.7165 15.8306 11.8593 11.4195 ‐251905.553 INVICTA HOLDINGS LIMITED IVT Industrials 0.489 45 9.0053 3.6 11.3684 16.5493 ‐11547.2654 ISA HOLDINGS LIMITED ISA Technology 1.2531 ‐1.4 ‐69.4107 ‐13.5714 ‐321.5751 ‐742.924755 ITALTILE LIMITED ITE Consumer Services 0.4763 180.4 14.0713 12.4667 22.9377 23.702456 JASCO ELECTRONICS HOLDINGS LIMITED JSC Industrials 0.7954 62.3 9.7403 11.3965 21.8373 21.9012 ‐17889.9357 JD GROUP LIMITED JDG Consumer Services 0.6027 253.1 17.556 14.8795 15.6443 17.598558 KAGISO MEDIA LIMITED KGM Consumer Services 0.0917 31.7 ‐87.8883 7.1609 ‐36.1591 ‐30.3291 ‐43052.1459 KING CONSOLIDATED HOLDINGS LIMITED KNG Consumer Services 2.6538 0.3 ‐60.9582 76.6667 ‐178.7088 ‐666.9433 ‐5610.0960 KWV BELEGGINGS BEPERK KWV Consumer Goods 0.0438 117.4 0 8.2283 6.2971 17.790661 LABAT AFRICA LIMITED LAB Industrials 1.4458 ‐33.9273 5.3249 ‐15.6511 3.9062 ‐7.6587 ‐6630.8262 MARSHALL MONTEAGLE HLDGS SOC ANON MTE Industrials 0.5498 255.0898 1.6527 2.7441 1.4701 1.7829 ‐45050.2663 MASONITE (AFRICA) LIMITED MAS Industrials 0.4534 50 3.0958 10.3 4.5056 3.0864 ‐13925.0564 MEDI‐CLINIC CORPORATION LIMITED MDC Health Care 0.4454 48.4 12.0227 5.2686 11.0862 6.3523 ‐99339.6565 METAIR INVESTMENTS LIMITED MTA Consumer Goods 0.3899 569 5.7968 4.4025 9.21 8.5273 ‐22070.59

66 METROFILE HOLDINGS LIMITED MFL Industrials 0.4176 105.2 78.8276 29.3536 78.7127 102.985867 MOBILE INDUSTRIES LIMITED MOB Industrials 0.4305 3.6 94.203 14.4444 6.2512 4.771 ‐97924.5668 MR PRICE GROUP LIMITED MPC Consumer Services 0.8647 30.9 5.8374 15.4045 15.7217 18.5277 ‐5477.4469 MTN GROUP LIMITED MTN Telecommunications 1.0708 25.1 ‐71.3653 37.3705 ‐60.4355 ‐148.017870 MURRAY AND ROBERTS HOLDINGS LIMITED MUR Industrials 1.3204 3 0.047 104 0.0899 ‐7.7523 ‐731732.271 MUSTEK LIMITED MST Technology 0.5788 86.4 9.0261 10.9375 21.7217 25.8642 ‐4641.6772 NAMPAK LIMITED NPK Industrials 0.6473 117.6 8.6329 11.5561 12.4248 13.1323 ‐7056673 NASPERS LIMITED NPN Consumer Services 5.5957 ‐12 ‐10.0784 ‐239.6667 ‐10.2717 ‐133.0509 ‐537604.774 NETCARE LIMITED NTC Health Care 1.0559 15.1 ‐12.5677 4.2384 ‐11.0068 ‐45.2081 ‐142234.475 NEW AFRICA INVESTMENT LIMITED NAI Consumer Services 0.2498 24 0 9.875 5.9157 7.2335 ‐513617676 NEW CLICKS HOLDINGS LIMITED NCL Consumer Services 1.2088 44.9 5.7018 18.1514 13.2025 19.4147 ‐22382.2177 NICTUS BEPERK NCS Consumer Services 3.5742 ‐53 0 ‐0.9434 ‐9.2663 ‐109.241 ‐8973.7578 NU‐WORLD HOLDINGS LIMITED NWL Consumer Goods 0.5798 105.9 6.655 10.8593 11.7831 12.2498 ‐15395.3179 OCEANA GROUP LIMITED OCE Consumer Goods 1.1936 92.3 9.9164 4.3337 23.7859 35.795680 OMNIA HOLDINGS LIMITED OMN Basic Materials 1.9115 118.8 8.4202 6.9865 9.9228 10.4776 ‐33506.1781 PALS HOLDING LIMITED PAL Consumer Goods 0.611 12.3 1.1333 2.5203 2.8043 ‐4.011 ‐647.7582 PICK N PAY HOLDINGS LIMITED PWK Consumer Services 0.3761 13.6 0 19.8529 57.0603 78.522783 PICK N PAY STORES LIMITED PIK Consumer Services 3.6195 43.7 2.6138 15.6979 11.1005 25.8733 42480.684 PRETORIA PORTLAND CEMENT COMPANY LD PPC Industrials 0.4361 391.9 13.7715 11.6407 11.0426 12.375285 RAINBOW CHICKEN LIMITED RBW Consumer Goods 0.4796 ‐0.9 1.5718 ‐42.2222 2.6413 ‐1.4847 ‐208791.786 REUNERT LIMITED RLO Industrials 2.0882 142.9 11.6395 5.4164 20.5158 59.3987 83299.4887 REX TRUEFORM CLOTHING COMPANY LD RTO Consumer Services 0.2127 83.4 8.7077 6.7626 11.6622 10.771388 RICHEMONT SECURITIES AG RCH Consumer Goods 0.5584 876.2376 0.9995 11.1511 2.194 1.208889 SABMILLER PLC SAB Consumer Goods 0.9112 315.9 17.3679 16.7521 20.6125 28.7609 ‐143206990 SAPPI LIMITED SAP Basic Materials 1.7747 456 8.1584 12.5197 6.6127 7.142991 SASOL LIMITED SOL Oil & Gas 0.382 402 21.439 10.204 17.0622 16.383692 SEARDEL INVESTMENT CORPORATION LD SER Consumer Goods 1.1082 10.3 1.9799 10.0971 3.4338 ‐1.8297 ‐100058.993 SETPOINT TECHNOLOGY HOLDINGS LD STO Industrials 1.0314 21.2 ‐23.971 9.3396 ‐38.7832 ‐150.254894 SHOPRITE HOLDINGS LIMITED SHP Consumer Services 3.6009 21.3 1.3974 37.8873 4.676 10.46795 SOVEREIGN FOOD INVESTMENTS LIMITED SOV Consumer Goods 0.7032 29.2 9.4176 5.7534 11.616 9.6043 ‐7751.7996 SPANJAARD LIMITED SPA Basic Materials 1.8464 10.9 5.7133 30.8257 11.6667 6.357 ‐1084.897 SPESCOM LIMITED SPS Technology 0.4705 80.4 ‐2.845 10.908 ‐4.1405 ‐14.0879 ‐19323.4298 SUN INTERNATIONAL LIMITED SUI Consumer Services 0.3782 329 19.5228 8.1337 7.677 9.624199 SUPER GROUP LIMITED SPG Industrials 1.0156 70.2 13.1743 17.151 14.9684 23.5363100 TELKOM SA LIMITED TKG Telecommunications 1.4118 418.8 19.7627 0 12.1023 15.6001101 THE BIDVEST GROUP LIMITED BVT Industrials 1.5912 261 ‐6.2315 19.1418 ‐12.374 ‐40.6352102 THE DON GROUP LIMITED DON Consumer Services 0.7677 ‐2.9 62.8471 ‐6.5517 13.1612 11.4708103 TIGER BRANDS LIMITED TBS Consumer Goods 1.2242 551 3.758 9.1452 7.3685 ‐15.165 139157.5104 TONGAAT HULETT LIMITED TON Consumer Goods 0.6932 486.7 8.9793 9.0323 5.7732 8.252 ‐316890105 TRANSPACO LIMITED TPC Industrials 1.4209 50.4 ‐27.2002 4.3651 ‐45.4555 ‐136.2187 4113.86106 TRENCOR LIMITED TRE Industrials 2.1018 41.1 18.5509 19.1241 5.3014 4.4263 ‐317660.8107 TRUWORTHS INTERNATIONAL LIMITED TRU Consumer Services 0.5986 28.2 11.1855 22.0922 18.1437 17.5054 ‐114134.5108 UCS GROUP LIMITED UCS Technology 0.2495 13 45.5352 21.4615 38.2479 29.1777 3535.45109 VENTER LEISURE AND COMM TRAILERS LD VTL Industrials 0.6104 ‐53.7 ‐88.6244 ‐0.3724 ‐135.221 ‐211.3707 ‐15405.68110 WESCO INVESTMENTS LIMITED WES Consumer Goods 0.4522 345 2.6153 11.5449 4.2362 4.1213 ‐441850.4

111 WILSON BAYLY HOLMES‐OVCON LIMITED WBO Industrials 1.8501 82.9 4.8993 3.5464 11.3077 27.8874 3016.26112 WINHOLD LIMITED WNH Industrials 1.5416 2.8 3.8161 6.0714 7.5046 4.0238 ‐15238.56113 WOOLWORTHS HOLDINGS LIMITED WHL Consumer Services 0.5407 30.6 7.8159 15.6209 15.5693 13.6323 ‐164555
Instrument Full Name
Instrument Ticker Symbol Industry D/E EPS OPM PE ROA ROE EVA
1 ADVTECH LIMITED ADH Consumer Services 0.1043 12.2 6.0708 24.0984 4.1837 ‐1.7202 ‐373861.62 A E C I LIMITED AFE Basic Materials 1.053 134 2.7759 5.7463 3.6524 ‐4.2852 ‐23195.883 ADCORP HOLDINGS LIMITED ADR Industrials 0.2347 102 10.2791 18.3725 22.128 9.9339 ‐139214 AFGRI LIMITED AFR Consumer Goods 1.2986 70.6 10.6859 6.1898 12.4243 18.357 33777.75 AFRICAN AND OVERSEAS ENTERPRISES LD AOO Consumer Services 0.1874 76 10.068 7.2632 13.1682 10.90656 AFRICAN MEDIA ENTERTAINMENT LIMITED AME Consumer Services 0.4907 4.5 ‐108.0376 15.5556 ‐151.2663 ‐210.1951 14634.667 AFRICAN OXYGEN LIMITED AFX Basic Materials 0.9574 71.4 16.1149 9.5658 15.7577 13.8988 ‐41139.998 ALLIED ELECTRONICS CORPORATION LD ATN Industrials 0.9926 78.3 12.0982 11.3027 17.3493 17.1279 ‐51793.129 ALLIED TECHNOLOGIES LIMITED ALT Telecommunications 0.9209 882 15.4589 14.2392 19.9308 23.3701 ‐5365.7610 ARGENT INDUSTRIAL LIMITED ART Industrials 0.6737 8.8 17.4489 3.5227 20.9181 24.4443 ‐5289.9411 ASPEN PHARMACARE HOLDINGS LIMITED APN Health Care 0.3932 ‐12.6 ‐17.5459 ‐11.9048 ‐31.4236 ‐120.503 ‐12361.0112 ASTRAPAK LIMITED APK Industrials 0.5078 37.7 15.5948 11.0875 20.2706 12.6086 ‐13134.9813 AVI LIMITED AVI Consumer Goods 0.5286 106.8 6.0509 7.3596 8.909 6.976 ‐870684.114 AWETHU BREWERIES LIMITED AWT Consumer Goods 0.2851 7.9 15.6637 11.2658 26.8526 15.5181 ‐1776.5915 BARLOWORLD LIMITED BAW Industrials 1.5447 321.5 6.1914 7.1073 8.8816 8.8314 ‐552375.716 BASIL READ HOLDINGS LIMITED BSR Industrials 4.4176 66.8 6.4115 4.0419 14.448 51.9118 23514.2317 BELL EQUIPMENT LIMITED BEL Industrials 2.2905 ‐60 0.2307 ‐3.3167 0.4045 ‐19.405118 BOWLER METCALF LIMITED BCF Industrials 0.4639 12 27.326 7.4167 26.8813 24.789219 BUILDMAX LIMITED BDM Industrials 0.5972 ‐7.9 ‐0.7311 ‐14.4304 ‐1.1318 ‐5.56420 CARGO CARRIERS LIMITED CRG Industrials 1.0136 24.5 8.6438 5.9592 11.4539 9.7016 ‐5014.5621 CASHBUILD LIMITED CSB Consumer Services 2.552 37.3 2.5248 10.5094 8.7495 12.8402 ‐2609.5522 CAXTON CTP PUBLISHERS AND PRINTERS CAT Consumer Services 0.5041 403.3 16.0234 14.8227 22.4678 22.849623 CENMAG HOLDINGS LIMITED CMG Industrials 0.5345 11.2 8.1266 5.3571 21.9136 9.610724 CERAMIC INDUSTRIES LIMITED CRM Industrials 0.4614 167.6 16.5351 14.5227 16.5859 21.170625 CITY LODGE HOTELS LIMITED CLH Consumer Services 0.6291 140.7 52.1883 9.7655 17.9102 16.7618 ‐15305.0526 COMAIR LIMITED COM Consumer Services 0.948 15 16.9467 0 32.9637 44.38127 COMBINED MOTOR HOLDINGS LIMITED CMH Consumer Services 1.5064 90.9 3.1811 4.5545 16.515 21.275328 CONAFEX HOLDINGS SOCIETE ANONYME CNX Consumer Goods 0.1277 55.2326 ‐9.3106 19.0105 ‐2.9472 ‐3.315329 CONTROL INSTRUMENTS GROUP LIMITED CNL Industrials 0.6993 9.8 13.6958 6.5306 17.9494 15.146630 CROOKES BROTHERS LIMITED CKS Consumer Goods 0.0763 135.2 32.9686 6.7973 15.4108 14.014131 CULLINAN HOLDINGS LIMITED CUL Consumer Services 0.959 3.1 6.6487 9.3548 8.7924 20.013832 DATATEC LIMITED DTC Technology 0.4742 86.8 8.1669 78.1452 12.8575 8.6235 ‐172293.633 DELTA ELECTRICAL INDUSTRIES LIMITED DEL Industrials 0.8347 181.9 17.635 11.0005 21.6069 21.180434 DIMENSION DATA HOLDINGS PLC DDT Technology 0.4346 51.7 10.3771 42.0503 18.0145 13.418335 DISTELL GROUP LIMITED DST Consumer Goods 0.8226 122.2 16.3168 6.3748 21.0171 21.7982 17705.82
1998

36 DORBYL LIMITED DLV Consumer Goods 0.6993 421.1 3.3971 6.2123 7.069 4.841337 DYNAMIC CABLES RSA LIMITED DYM Technology 1.9321 38.1 ‐56.7346 32.3097 ‐89.1613 ‐334.173738 ELB GROUP LIMITED ELR Industrials 2.1561 148.4 3.4213 3.1267 6.7615 14.2261 11533.3939 Emergent Properties Limited EMG Consumer Goods 0.6407 15.4 9.7968 15.3247 9.941 5.5008 ‐1556.2240 ENVIROSERV HOLDINGS LIMITED ENV Industrials 1.2925 9.4 3.5015 12.5532 4.6235 1.2238 ‐5587.8741 EOH HOLDINGS LIMITED EOH Technology 0 0 0 0 0 042 EXCELLERATE HOLDINGS LIMITED EXL Industrials 0.301 11 ‐28.4804 5.0909 ‐41.8712 ‐47.4915 ‐6162.7243 FAMOUS BRANDS LIMITED FBR Consumer Services 0.5999 17.5 11.8151 7.3714 32.6138 24.974844 FOSCHINI LIMITED FOS Consumer Services 0.4559 86.1 14.175 22.137 17.3167 14.3111 ‐90459.7245 GOLD REEF RESORTS LIMITED GDF Consumer Services 0.2802 ‐3.4286 ‐48.7333 ‐72.625 ‐23.2859 ‐39.929146 GRINDROD LIMITED GND Industrials 1.7733 50.1 7.9387 2.495 10.2571 5.43547 GROUP FIVE LIMITED GRF Industrials 2.6115 90.4 4.0387 3.0531 7.7876 9.712948 HOWDEN AFRICA HOLDINGS LIMITED HWN Industrials 0.9047 30.4 8.0344 2.3355 14.1404 10.023949 HUDACO INDUSTRIES LIMITED HDC Industrials 1.1433 162 7.2154 3.6543 14.0236 14.815 510.0550 ILIAD AFRICA LIMITED ILA Industrials 0.5166 19.0588 11.5402 3.4105 20.8079 13.8313 ‐11787.9651 ILLOVO SUGAR LIMITED ILV Consumer Goods 1.4444 100.4 18.5496 4.7112 19.9549 34.465 102840.252 IMPERIAL HOLDINGS LIMITED IPL Industrials 0.8584 284.8 8.6482 22.1524 10.0073 9.5307 ‐296270.453 INVICTA HOLDINGS LIMITED IVT Industrials 0.287 54 10.8924 9.4074 15.5861 18.868654 ISA HOLDINGS LIMITED ISA Technology 0.1485 5.8286 9.5661 17.1569 15.204 6.2863 ALTX55 ITALTILE LIMITED ITE Consumer Services 0.6118 125.5 11.6103 17.1873 18.4861 19.923156 JASCO ELECTRONICS HOLDINGS LIMITED JSC Industrials 0.7326 44.2 15.9009 6.4027 23.7867 27.2542 ‐784.3757 JD GROUP LIMITED JDG Consumer Services 0.8877 204.3 17.052 22.2859 16.4804 18.937458 KAGISO MEDIA LIMITED KGM Consumer Services 0.0521 19.725 18.6891 31.9392 4.9435 6.03359 KING CONSOLIDATED HOLDINGS LIMITED KNG Consumer Services 0.3197 17.3 ‐7.334 6.8786 ‐7.4746 ‐10.1573 ‐19543.9860 KWV BELEGGINGS BEPERK KWV Consumer Goods 0.0596 201.4 0 5.2781 8.1109 18.00761 LABAT AFRICA LIMITED LAB Industrials 1.2332 22.8 13.1241 8.3772 10.6412 7.1551 ‐3922.5562 MARSHALL MONTEAGLE HLDGS SOC ANON MTE Industrials 0.5363 25 0.7169 55.72 0.3675 ‐1.6128 ‐54111.963 MASONITE (AFRICA) LIMITED MAS Industrials 0.4732 108 4.727 3.9815 6.8212 6.8681 ‐12176.8664 MEDI‐CLINIC CORPORATION LIMITED MDC Health Care 0.3441 43 21.3155 9.3023 19.1007 18.0405 ‐36495.4765 METAIR INVESTMENTS LIMITED MTA Consumer Goods 0.4092 838 8.4375 2.2947 12.7851 13.0561 ‐19521.3566 METROFILE HOLDINGS LIMITED MFL Industrials 0.4438 66.1 ‐45.7243 60.5144 ‐37.9812 ‐59.085367 MOBILE INDUSTRIES LIMITED MOB Industrials 0.4604 17.9 89.5851 8.8827 7.1377 26.0514 ‐73904.0468 MR PRICE GROUP LIMITED MPC Consumer Services 0.6167 25.1 5.3713 19.4422 13.1833 12.9688 ‐36194.8469 MTN GROUP LIMITED MTN Telecommunications 0.7405 14.2 15.9046 58.3099 14.0845 11.203370 MURRAY AND ROBERTS HOLDINGS LIMITED MUR Industrials 1.2977 49 6.9252 14.3265 10.7701 16.5163 ‐623818.871 MUSTEK LIMITED MST Technology 0.6841 61.4 10.6651 16.2378 28.7918 35.5241 22525.8772 NAMPAK LIMITED NPK Industrials 0.5097 112 11.1763 7.0714 17.0603 18.1503 ‐20233673 NASPERS LIMITED NPN Consumer Services 0.5778 83 13.7029 47.1807 15.1335 9.5519 ‐106290.674 NETCARE LIMITED NTC Health Care 1.2042 13.4 14.2469 6.4179 11.3621 11.5228 ‐156712.675 NEW AFRICA INVESTMENT LIMITED NAI Consumer Services 0.2483 22.9 0 12.9258 4.3356 2.9848 ‐425018176 NEW CLICKS HOLDINGS LIMITED NCL Consumer Services 1.1315 33.9 5.6517 16.5487 11.4958 14.3795 ‐5652277 NICTUS BEPERK NCS Consumer Services 2.1488 ‐39.9 0 ‐2.7569 ‐5.3927 ‐43.3596 ‐6224.578 NU‐WORLD HOLDINGS LIMITED NWL Consumer Goods 0.7024 101.3 7.3396 26.7522 11.3503 11.636 ‐22436.879 OCEANA GROUP LIMITED OCE Consumer Goods 1.7971 80.5 10.2247 6.087 24.511 39.531 36662.8280 OMNIA HOLDINGS LIMITED OMN Basic Materials 1.8036 170.9 11.2617 4.1077 15.4904 22.2285 3823.54

81 PALS HOLDING LIMITED PAL Consumer Goods 0.3392 1.3 4.6202 45.3846 7.8657 3.5853 ‐3656.1782 PICK N PAY HOLDINGS LIMITED PWK Consumer Services 0.4437 11 0 29.2727 60.483 87.321783 PICK N PAY STORES LIMITED PIK Consumer Services 3.2043 36.4 2.174 21.0165 9.5679 19.032 69500.1984 PRETORIA PORTLAND CEMENT COMPANY LD PPC Industrials 0.4909 519.4 18.7025 6.1706 16.2358 18.307985 RAINBOW CHICKEN LIMITED RBW Consumer Goods 0.5203 ‐21 ‐12.1562 ‐1.0476 ‐19.3384 ‐31.3458 ‐36760486 REUNERT LIMITED RLO Industrials 1.0847 105.6 7.0556 4.2992 13.9196 22.3987 ‐53762.4887 REX TRUEFORM CLOTHING COMPANY LD RTO Consumer Services 0.1794 73.1 9.4522 8.6183 12.4298 9.799788 RICHEMONT SECURITIES AG RCH Consumer Goods 0.6507 621.0084 0.9647 10.0063 2.0809 1.020889 SABMILLER PLC SAB Consumer Goods 1.3831 653.5 13.6351 21.8516 19.6334 21.10990 SAPPI LIMITED SAP Basic Materials 1.5564 348 10.9355 6.3736 6.6294 7.83891 SASOL LIMITED SOL Oil & Gas 0.5252 340 20.3708 10.1941 14.4351 14.963592 SEARDEL INVESTMENT CORPORATION LD SER Consumer Goods 0.8973 34 5.5777 4.5294 10.2297 9.5898 ‐43363.5893 SETPOINT TECHNOLOGY HOLDINGS LD STO Industrials 0.576 16.1 9.0901 39.5652 16.6836 15.859994 SHOPRITE HOLDINGS LIMITED SHP Consumer Services 3.4075 46.1 2.2641 22.9935 6.8853 22.913195 SOVEREIGN FOOD INVESTMENTS LIMITED SOV Consumer Goods 0.7097 58.4 15.4338 5.3082 18.57 20.0926 33596 SPANJAARD LIMITED SPA Basic Materials 1.625 30.5 7.9899 13.4098 18.8862 23.0217 11.6997 SPESCOM LIMITED SPS Technology 0.5415 64.2 6.3729 12.6324 7.9156 2.0451 ‐26133.7698 SUN INTERNATIONAL LIMITED SUI Consumer Services 0.2662 431.7 58.1289 5.9532 26.4013 32.816199 SUPER GROUP LIMITED SPG Industrials 0.5239 52.3 9.6527 24.9522 12.6578 13.9578100 TELKOM SA LIMITED TKG Telecommunications 0.7917 452.1 26.6964 0 19.8818 16.818101 THE BIDVEST GROUP LIMITED BVT Industrials 0.4358 185.6 6.8933 26.9181 12.8408 13.6129102 THE DON GROUP LIMITED DON Consumer Services 0.5048 ‐18.7 ‐69.2795 ‐1.8182 ‐24.4731 ‐48.754 ‐64657.77103 TIGER BRANDS LIMITED TBS Consumer Goods 1.0678 500 9.0057 8.79 14.4927 12.2923 ‐221154.1104 TONGAAT HULETT LIMITED TON Consumer Goods 0.7185 566.7429 25.3062 6.5197 18.5412 23.8832 33235.74105 TRANSPACO LIMITED TPC Industrials 2.0338 40 10.6134 10.625 19.06 30.5418 ‐2707.14106 TRENCOR LIMITED TRE Industrials 1.7845 221.8 38.5221 8.7782 13.2078 25.8952 ‐176452.8107 TRUWORTHS INTERNATIONAL LIMITED TRU Consumer Services 0.596 34.1 13.2489 16.7449 23.3786 23.3198 ‐121574.6108 UCS GROUP LIMITED UCS Technology 0.2822 6.1 35.5896 22.623 16.8452 11.8429 ‐4602.5109 VENTER LEISURE AND COMM TRAILERS LD VTL Industrials 0.0986 3 3.4091 6 5.2095 3.7819 ‐4861.33110 WESCO INVESTMENTS LIMITED WES Consumer Goods 0.509 906 4.5892 2.1181 7.8904 6.1438 ‐213655.7111 WILSON BAYLY HOLMES‐OVCON LIMITED WBO Industrials 2.3348 56.4 4.946 9.1312 10.2823 24.0255 17401.83112 WINHOLD LIMITED WNH Industrials 1.4046 6.3 4.4369 4.4444 8.0364 9.4993 ‐12290.06113 WOOLWORTHS HOLDINGS LIMITED WHL Consumer Services 0.6892 35 5.9116 17.2857 10.5086 4.0385 6345.22