financial highlights - annualreports.com · ... during 2008, the company changed its inventory...
TRANSCRIPT

Financial Highlights
Increase Years ended March 31, 2016 2015 (Decrease) Net sales $1,275,360,000 $1,286,350,000 (0.9) % Net earnings (see note 1) 54,458,000 9,899,000 450.1 Stockholders' equity 405,174,000 351,730,000 15.2 Diluted earnings per share (see note 1) $ 5.42 $ 0.90 502.2 % Total stockholders' equity per equivalent common share (see note 2) 40.63 34.81 16.7 Note 1: During 2008, the Company changed its inventory valuation method from FIFO (first-in, first out) to LIFO (last-in, first out) which increased net earnings by $16.1 million, or $1.60 per diluted share, in 2016 and reduced net earnings by $6.9 million, or $0.63 per diluted share, in 2015. Note 2: Equivalent common shares are either common shares or, for convertible preferred shares, the number of common shares that the preferred shares are convertible into.
Description of Business
Seneca Foods Corporation conducts its business almost entirely in food packaging, which contributed about 98% of the Company's fiscal year 2016 net sales. Canned vegetables represented 68%, fruit products represented 20%, frozen fruit and vegetables represented 11% and fruit chip products represented 1% of the total food packaging net sales. Non-food packaging sales, which primarily related to the sale of cans and ends, and outside revenue from the Company's trucking and aircraft operations, represented 2% of the Company's fiscal year 2016 net sales.
Approximately 12% of the Company's packaged foods were sold under its own brands, or licensed trademarks, including Seneca®, Libby's®, Aunt Nellie's®, Cherryman®, READ®, and Seneca Farms®. About 52% of the packaged foods were sold under private labels and 25% was sold to institutional food distributors. The remaining 11% was sold under a contract packing agreement with B&G Foods North America, under the Green Giant label.
Marion, New York June 17, 2016
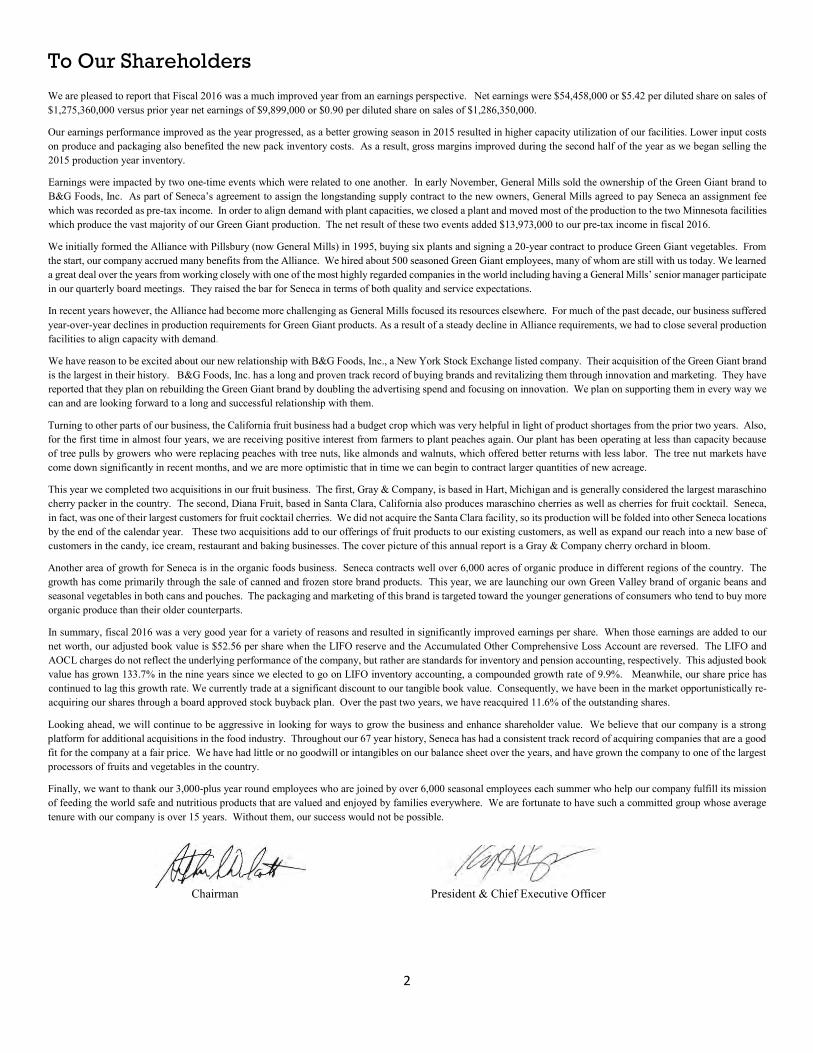
To Our Shareholders We are pleased to report that Fiscal 2016 was a much improved year from an earnings perspective. Net earnings were $54,458,000 or $5.42 per diluted share on sales of $1,275,360,000 versus prior year net earnings of $9,899,000 or $0.90 per diluted share on sales of $1,286,350,000.
Our earnings performance improved as the year progressed, as a better growing season in 2015 resulted in higher capacity utilization of our facilities. Lower input costs on produce and packaging also benefited the new pack inventory costs. As a result, gross margins improved during the second half of the year as we began selling the 2015 production year inventory.
Earnings were impacted by two one-time events which were related to one another. In early November, General Mills sold the ownership of the Green Giant brand to B&G Foods, Inc. As part of Seneca’s agreement to assign the longstanding supply contract to the new owners, General Mills agreed to pay Seneca an assignment fee which was recorded as pre-tax income. In order to align demand with plant capacities, we closed a plant and moved most of the production to the two Minnesota facilities which produce the vast majority of our Green Giant production. The net result of these two events added $13,973,000 to our pre-tax income in fiscal 2016.
We initially formed the Alliance with Pillsbury (now General Mills) in 1995, buying six plants and signing a 20-year contract to produce Green Giant vegetables. From the start, our company accrued many benefits from the Alliance. We hired about 500 seasoned Green Giant employees, many of whom are still with us today. We learned a great deal over the years from working closely with one of the most highly regarded companies in the world including having a General Mills’ senior manager participate in our quarterly board meetings. They raised the bar for Seneca in terms of both quality and service expectations.
In recent years however, the Alliance had become more challenging as General Mills focused its resources elsewhere. For much of the past decade, our business suffered year-over-year declines in production requirements for Green Giant products. As a result of a steady decline in Alliance requirements, we had to close several production facilities to align capacity with demand.
We have reason to be excited about our new relationship with B&G Foods, Inc., a New York Stock Exchange listed company. Their acquisition of the Green Giant brand is the largest in their history. B&G Foods, Inc. has a long and proven track record of buying brands and revitalizing them through innovation and marketing. They have reported that they plan on rebuilding the Green Giant brand by doubling the advertising spend and focusing on innovation. We plan on supporting them in every way we can and are looking forward to a long and successful relationship with them.
Turning to other parts of our business, the California fruit business had a budget crop which was very helpful in light of product shortages from the prior two years. Also, for the first time in almost four years, we are receiving positive interest from farmers to plant peaches again. Our plant has been operating at less than capacity because of tree pulls by growers who were replacing peaches with tree nuts, like almonds and walnuts, which offered better returns with less labor. The tree nut markets have come down significantly in recent months, and we are more optimistic that in time we can begin to contract larger quantities of new acreage.
This year we completed two acquisitions in our fruit business. The first, Gray & Company, is based in Hart, Michigan and is generally considered the largest maraschino cherry packer in the country. The second, Diana Fruit, based in Santa Clara, California also produces maraschino cherries as well as cherries for fruit cocktail. Seneca, in fact, was one of their largest customers for fruit cocktail cherries. We did not acquire the Santa Clara facility, so its production will be folded into other Seneca locations by the end of the calendar year. These two acquisitions add to our offerings of fruit products to our existing customers, as well as expand our reach into a new base of customers in the candy, ice cream, restaurant and baking businesses. The cover picture of this annual report is a Gray & Company cherry orchard in bloom.
Another area of growth for Seneca is in the organic foods business. Seneca contracts well over 6,000 acres of organic produce in different regions of the country. The growth has come primarily through the sale of canned and frozen store brand products. This year, we are launching our own Green Valley brand of organic beans and seasonal vegetables in both cans and pouches. The packaging and marketing of this brand is targeted toward the younger generations of consumers who tend to buy more organic produce than their older counterparts.
In summary, fiscal 2016 was a very good year for a variety of reasons and resulted in significantly improved earnings per share. When those earnings are added to our net worth, our adjusted book value is $52.56 per share when the LIFO reserve and the Accumulated Other Comprehensive Loss Account are reversed. The LIFO and AOCL charges do not reflect the underlying performance of the company, but rather are standards for inventory and pension accounting, respectively. This adjusted book value has grown 133.7% in the nine years since we elected to go on LIFO inventory accounting, a compounded growth rate of 9.9%. Meanwhile, our share price has continued to lag this growth rate. We currently trade at a significant discount to our tangible book value. Consequently, we have been in the market opportunistically re-acquiring our shares through a board approved stock buyback plan. Over the past two years, we have reacquired 11.6% of the outstanding shares.
Looking ahead, we will continue to be aggressive in looking for ways to grow the business and enhance shareholder value. We believe that our company is a strong platform for additional acquisitions in the food industry. Throughout our 67 year history, Seneca has had a consistent track record of acquiring companies that are a good fit for the company at a fair price. We have had little or no goodwill or intangibles on our balance sheet over the years, and have grown the company to one of the largest processors of fruits and vegetables in the country.
Finally, we want to thank our 3,000-plus year round employees who are joined by over 6,000 seasonal employees each summer who help our company fulfill its mission of feeding the world safe and nutritious products that are valued and enjoyed by families everywhere. We are fortunate to have such a committed group whose average tenure with our company is over 15 years. Without them, our success would not be possible.
Chairman President & Chief Executive Officer
2
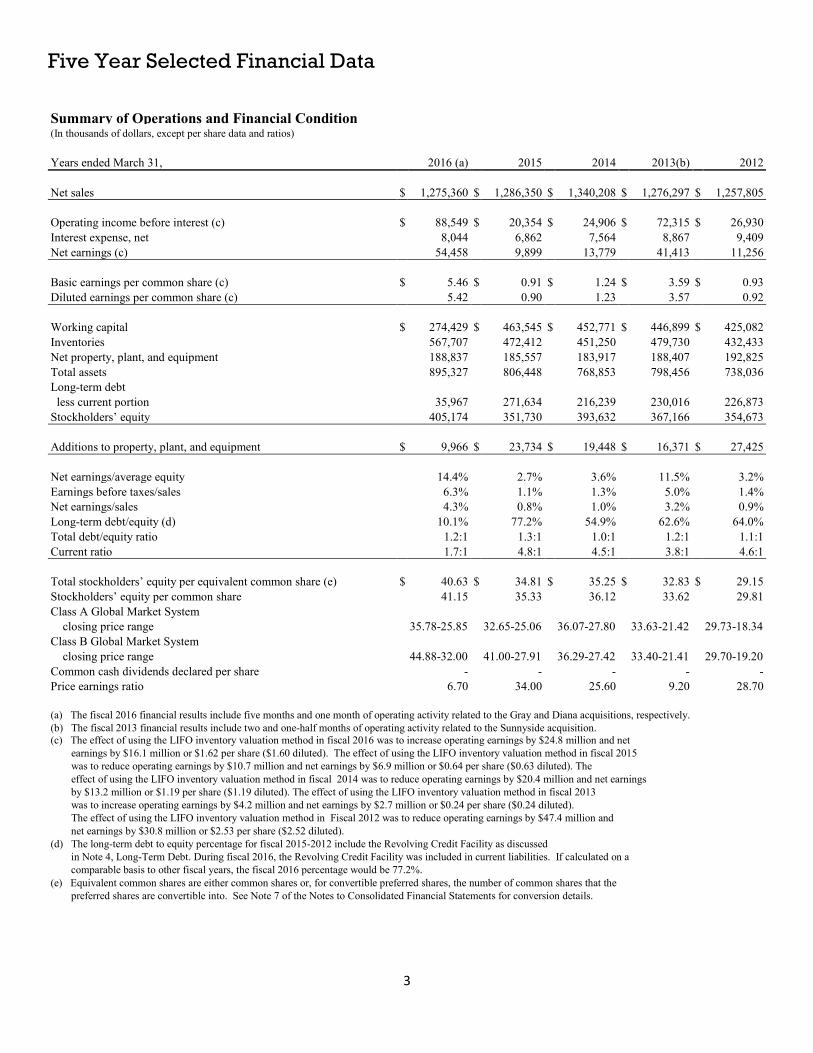
Five Year Selected Financial Data
Summary of Operations and Financial Condition(In thousands of dollars, except per share data and ratios)
Years ended March 31, 2016 (a) 2015 2014 2013(b) 2012
Net sales $ 1,275,360 $ 1,286,350 $ 1,340,208 $ 1,276,297 $ 1,257,805
Operating income before interest (c) $ 88,549 $ 20,354 $ 24,906 $ 72,315 $ 26,930 Interest expense, net 8,044 6,862 7,564 8,867 9,409 Net earnings (c) 54,458 9,899 13,779 41,413 11,256
Basic earnings per common share (c) $ 5.46 $ 0.91 $ 1.24 $ 3.59 $ 0.93 Diluted earnings per common share (c) 5.42 0.90 1.23 3.57 0.92
Working capital $ 274,429 $ 463,545 $ 452,771 $ 446,899 $ 425,082 Inventories 567,707 472,412 451,250 479,730 432,433 Net property, plant, and equipment 188,837 185,557 183,917 188,407 192,825 Total assets 895,327 806,448 768,853 798,456 738,036 Long-term debt less current portion 35,967 271,634 216,239 230,016 226,873 Stockholders’ equity 405,174 351,730 393,632 367,166 354,673
Additions to property, plant, and equipment $ 9,966 $ 23,734 $ 19,448 $ 16,371 $ 27,425
Net earnings/average equity 14.4% 2.7% 3.6% 11.5% 3.2% Earnings before taxes/sales 6.3% 1.1% 1.3% 5.0% 1.4% Net earnings/sales 4.3% 0.8% 1.0% 3.2% 0.9% Long-term debt/equity (d) 10.1% 77.2% 54.9% 62.6% 64.0% Total debt/equity ratio 1.2:1 1.3:1 1.0:1 1.2:1 1.1:1 Current ratio 1.7:1 4.8:1 4.5:1 3.8:1 4.6:1
Total stockholders’ equity per equivalent common share (e) $ 40.63 $ 34.81 $ 35.25 $ 32.83 $ 29.15 Stockholders’ equity per common share 41.15 35.33 36.12 33.62 29.81 Class A Global Market System closing price range 35.78-25.85 32.65-25.06 36.07-27.80 33.63-21.42 29.73-18.34 Class B Global Market System closing price range 44.88-32.00 41.00-27.91 36.29-27.42 33.40-21.41 29.70-19.20 Common cash dividends declared per share - - - - - Price earnings ratio 6.70 34.00 25.60 9.20 28.70
(a) The fiscal 2016 financial results include five months and one month of operating activity related to the Gray and Diana acquisitions, respectively. (b) The fiscal 2013 financial results include two and one-half months of operating activity related to the Sunnyside acquisition. (c) The effect of using the LIFO inventory valuation method in fiscal 2016 was to increase operating earnings by $24.8 million and net (d) earnings by $16.1 million or $1.62 per share ($1.60 diluted). The effect of using the LIFO inventory valuation method in fiscal 2015 (d) was to reduce operating earnings by $10.7 million and net earnings by $6.9 million or $0.64 per share ($0.63 diluted). The (d) effect of using the LIFO inventory valuation method in fiscal 2014 was to reduce operating earnings by $20.4 million and net earnings (d) by $13.2 million or $1.19 per share ($1.19 diluted). The effect of using the LIFO inventory valuation method in fiscal 2013 (d) was to increase operating earnings by $4.2 million and net earnings by $2.7 million or $0.24 per share ($0.24 diluted). (d) The effect of using the LIFO inventory valuation method in Fiscal 2012 was to reduce operating earnings by $47.4 million and (d) net earnings by $30.8 million or $2.53 per share ($2.52 diluted). (d) The long-term debt to equity percentage for fiscal 2015-2012 include the Revolving Credit Facility as discussed (d) in Note 4, Long-Term Debt. During fiscal 2016, the Revolving Credit Facility was included in current liabilities. If calculated on a (d) comparable basis to other fiscal years, the fiscal 2016 percentage would be 77.2%. (e) Equivalent common shares are either common shares or, for convertible preferred shares, the number of common shares that the (d) preferred shares are convertible into. See Note 7 of the Notes to Consolidated Financial Statements for conversion details.
3

Management’s Discussion and Analysis of Financial Condition and Results of Operations OVERVIEW Our Business Seneca Foods is one of North America’s leading providers of packaged fruits and vegetables, with facilities located throughout the United States. Its high quality products are primarily sourced from over 2,000 American farms. Seneca holds a large share of the retail private label, food service, and export canned vegetable markets, distributing to over 90 countries. Products are also sold under the highly regarded brands of Libby’s®, Aunt Nellie’s®, READ®, Cherryman® and Seneca labels, including Seneca snack chips. In addition, Seneca provides vegetable products under a contract packing agreement with B&G Foods North America, under the Green Giant label. During 2016, the Company acquired 100% of the stock of two businesses which pack and sell maraschino cherries, fruit cocktail cherries and glace or candied fruit products: Gray & Company (“Gray”) and Diana Fruit Co., Inc. (“Diana”). In 2016, fruit represented 20% of the Company’s sales including the acquisitions. The Company’s business strategies are designed to grow the Company’s market share and enhance the Company’s sales and margins and include: 1) expand the Company’s leadership in the packaged fruit and vegetable industry; 2) provide low cost, high quality fruit and vegetable products to consumers through the elimination of costs from the Company’s supply chain and investment in state-of-the-art production and logistical technology; 3) focus on growth opportunities to capitalize on higher expected returns; and 4) pursue strategic acquisitions that leverage the Company’s core competencies. All references to years are fiscal years ended March 31 unless otherwise indicated. Restructuring During 2016, the Company recorded a restructuring charge of $10.4 million related to the closing of a plant in the Northwest of which $0.2 million was related to severance cost, $5.1 million was related to asset impairments (contra fixed assets), and $5.1 million was related to other costs ($3.6 related to operating lease costs). During 2016, the Company reduced the costs of the plant closing in the Midwest, started in 2015, by $0.1 million, mostly related to severance costs. During 2015, the Company recorded a restructuring charge of $1.4 million related to the closing of a plant in the Midwest and the realignment of two other plants, one in the Midwest and the other in the Northwest, of which $0.8 million was related to severance cost, $0.3 million was related to equipment costs (contra fixed assets), and $0.3 million was related to equipment relocation costs. During 2013, the Company implemented a product rationalization program and recorded a restructuring charge of $3.5 million for related equipment costs (contra fixed assets), lease impairment costs (net of realizable value), and certain inventory costs. During 2014, the Company adjusted the costs of the product rationalization program, started in 2013, by $0.5 million, mostly related to equipment costs. These charges are included under Plant Restructuring in the Consolidated Statements of Net Earnings. Divestitures, Other Charges and Credits Other operating income in 2016 included a gain of $24.3 million related to a contractual payment received in conjunction with a relationship transfer agreement with General Mills. The Company reversed a provision for the Prop 65 litigation of $0.2 million and reduced an environmental accrual by $0.1 million. The Company also recorded a gain of $0.4 million from the sale of other fixed assets.
4

Management’s Discussion and Analysis of Financial Condition and Results of Operations
Other operating income in 2015 included a gain of $5.0 million related to a contractual payment received in connection with the closing of a Midwest plant and a charge of $0.3 million related to environmental costs related to a Company-owned plant in New York State. The Company also recorded a gain of $0.1 million from the sale of other fixed assets.
Other operating income in 2014 included a gain of $2.9 million from a break-up fee earned as a result of the Company being named the stalking horse bidder in an attempt to acquire substantially all the operating assets of Allens, Inc. in a bankruptcy court supervised auction, a gain of $0.7 million from the sale of two aircraft and a gain of $0.1 million as a result of adjustments related to the purchase of Sunnyside. The Company also recorded a loss of $0.5 million on the disposal of a warehouse located in Sunnyside, Washington and a net gain of $0.2 million from the sale of other fixed assets.
Liquidity and Capital Resources
The Company’s primary cash requirements are to make payments on the Company’s debt, finance seasonal working capital needs and to make capital expenditures. Internally generated funds and amounts available under the revolving credit facility are the Company’s primary sources of liquidity, although the Company believes it has the ability to raise additional capital by issuing additional stock, if it desires.
Revolving Credit Facility
The Company completed the closing of a five-year revolving credit facility (“Revolver”) on July 20, 2011. During 2016, the Company exercised $75.0 million for the in-season facility and $100.0 million for the off-season facility of the remaining $150.0 million accordion feature of its existing revolving credit facility pursuant to the Second Amended and Restated Loan and Security Agreement dated July 20, 2011. Maximum borrowings under the Revolver total $400.0 million from April through July and $475.0 million from August through March. The Revolver balance as of March 31, 2016 was $271.6 million and is included in Current Portion of Long-Term Debt in the accompanying Consolidated Balance Sheet due to the Revolver’s July 20, 2016 maturity. In order to maintain availability of funds under the facility, the Company pays a commitment fee on the unused portion of the Revolver. The Revolver is secured by the Company’s accounts receivable and inventories and contains a financial covenant and borrowing base requirements. The Company utilizes its Revolver for general corporate purposes, including seasonal working capital needs, to pay debt principal and interest obligations, and to fund capital expenditures and acquisitions. Seasonal working capital needs are affected by the growing cycles of the vegetables and fruits the Company packages. The majority of vegetable and fruit inventories are produced during the months of June through November and are then sold over the following year. Payment terms for vegetable and fruit produce are generally three months but can vary from a few days to seven months. Accordingly, the Company’s need to draw on the Revolver may fluctuate significantly throughout the year.
The Company is in the process of negotiating a replacement line of credit that is expected to be in place prior to the maturity of the existing Revolver. Although subject to change, the agreement being negotiated provides for a five-year term, a $400.0 million facility amount that is seasonally adjusted to $500.0 million, and interest based upon LIBOR-based spread. Closing of this new credit facility is subject to normal and customary documentation and closing conditions.
The Company believes that cash flows from operations and availability under its new Revolver will provide adequate funds for the Company’s working capital needs, planned capital expenditures and debt service obligations for at least the next 12 months.
Seasonality
The Company’s revenues typically are higher in the second and third fiscal quarters. This is due, in part, because the Company sells, on a bill and hold basis, Green Giant canned and frozen vegetables to B&G Foods at the end of each pack cycle, which typically occurs during these quarters. B&G Foods buys the product from the Company at cost plus an equivalent case tolling fee. See the Critical Accounting Policies section for further details. The Company’s non-Green Giant sales also exhibit seasonality with the third fiscal quarter generating the highest sales due to increased retail sales during the holiday season.
5

Management’s Discussion and Analysis of Financial Condition and Results of Operations
The seasonality of the Company’s business is illustrated by the following table:
First Quarter
Second Quarter
Third Quarter
Fourth Quarter
Year ended March 31, 2016:Net sales $226,258 $313,202 $432,198 $303,702Gross margin 20,899 29,073 53,382 44,041Net earnings 2,968 6,522 31,123 13,845Inventories (at quarter end) 482,556 761,703 631,181 567,707Revolver outstanding (at quarter end) 197,350 304,468 309,211 271,592
Year ended March 31, 2015:Net sales $240,043 $312,161 $456,207 $277,939Gross margin 17,341 17,133 26,435 23,454Net earnings (loss) (107) (578) 7,819 2,765Inventories (at quarter end) 467,290 731,527 547,149 472,412Revolver outstanding (at quarter end) 180,050 302,220 255,000 233,000 Short-Term Borrowings
During 2016 and 2015, the Company entered into some interim lease notes which financed down payments for various equipment ordersat market rates. As of March 31, 2016, these interim notes had not been converted into operating leases since the equipment was notyet delivered. These notes, which total $0.4 million and $9.9 million as of March 31, 2016 and 2015, respectively, are included in notespayable in the accompanying Consolidated Balance Sheets. These notes are expected to be converted into operating leases within thenext twelve months. Until then, they bear interest at an annual rate of 1.94% in 2016 and 1.67% in 2015.
The maximum level of short-term borrowings during 2016 was affected by the two acquisitions totaling $38.3 million and the higherinventory due to the large pack totaling $95.2 million. During 2015, the maximum level of short-term borrowings was affected by the50% investment in Truitt Bros. Inc. of $16.2 million, which took place in April 2014, and the purchase of treasury stock totaling $33.5million. Details of the acquisitions are outlined in Note 2 of the Notes to Consolidated Financial Statements.
General terms of the Revolver include payment of interest at LIBOR plus an agreed upon spread.
The following table documents the quantitative data for Short-Term Borrowings during 2016 and 2015:
Fourth Quarter Year Ended 2016 2015 2016 2015
(In thousands) Reported end of period:
Revolver outstanding $271,592 $233,000 $271,592 $233,000 Weighted average interest rate 1.95% 1.92% 1.95% 1.92%
Reported during period: Maximum Revolver $321,000 $263,627 $323,980 $323,646 Average Revolver outstanding $304,104 $252,013 $260,886 $234,726 Weighted average interest rate 1.92% 1.93% 1.93% 1.63%
6

Management’s Discussion and Analysis of Financial Condition and Results of Operations
Long-Term Debt
At March 31, 2016, the Company has two mortgages outstanding for $14.6 million, and four industrial revenue bonds ("IRBs"), totaling $22.6 million. As discussed in Note 4 of the Notes to Consolidated Financial Statements, the Company classified its Revolver balance as current portion of long-term debt at March 31, 2016. On August 1, 2013, the Company paid a final $36.7 million principal payment due on a secured note payable to John Hancock Life Insurance Company. The Company issued a $1.5 million new economic development note during 2014. The Company did not issue any significant long-term debt in 2016 and 2015, other than the Revolver.
As of March 31, 2016, scheduled maturities of long-term debt in each of the five succeeding fiscal years and thereafter are presented below. The March 31, 2016 Revolver balance of $271.6 million is presented as being due in fiscal 2017, based upon the Revolver’s July 20, 2016 maturity date (in thousands):
2017 $279,5722018 7,9042019 3,0342020 2,5312021 7,019Thereafter 15,479Total $315,539
Restrictive Covenants
The Company’s debt agreements, including the Revolver, contain covenants that restrict the Company’s ability to incur additional indebtedness, pay dividends on the Company’s capital stock, make other restricted payments, including investments, sell the Company’s assets, incur liens, transfer all or substantially all of the Company’s assets and enter into consolidations or mergers. The Company’s debt agreements also require the Company to meet a minimum fixed charge coverage ratio. The Revolver also contains borrowing base requirements related to accounts receivable and inventories. These financial requirements and ratios generally become more restrictive over time and are subject to allowances for seasonal fluctuations. The most restrictive financial covenant in the debt agreements is the fixed charge coverage ratio within the Master Reimbursement Agreement with Wells Fargo, which relates to the Secured Industrial Revenue Development Bonds. In connection with the Company’s decision to adopt the LIFO method of inventory accounting, effective December 30, 2007, the Company executed amendments to its debt agreements, which enable the Company to compute its financial covenants as if the Company were on the FIFO method of inventory accounting. The Company was in compliance with all such financial covenants as of March 31, 2016.
Capital Expenditures
Capital expenditures in 2016 totaled $9.9 million and were equipment replacements and other improvements, and cost saving projects but no major projects in 2016. Capital expenditures in 2015 totaled $26.2 million and there were two major projects in 2015 as follows: 1) $7.5 million to complete a warehouse project in Sunnyside, Washington started in 2014, and 2) $2.1 million to buyout a Clyman, Wisconsin equipment lease. Capital expenditures in 2014 totaled $17.0 million and included $7.6 million towards the completion of a pouch building project in Janesville, Wisconsin, and $3.6 million for the start of a warehouse project in Sunnyside, Washington, equipment replacements and other improvements, and cost saving projects.
7

Management’s Discussion and Analysis of Financial Condition and Results of Operations Accounts Receivable In 2016, accounts receivable increased by $6.2 million or 8.8% versus 2015, due to higher sales volume in the fourth quarter of 2016 compared to 2015 and the cherry businesses we added in 2016. In 2015, accounts receivable decreased by $7.1 million or 9.3% versus 2014, due to the impact of decreased sales volume in the fourth quarter of 2015 compared to 2014. Inventories In 2016, inventories increased by $95.3 million primarily reflecting the effect of higher finished goods quantities and higher work in process quantities and the $24.8 million LIFO reserve decline. The LIFO reserve balance was $139.3 million at March 31, 2016 versus $164.1 million at the prior year end. In 2015, inventories increased by $21.1 million primarily reflecting the effect of higher finished goods quantities and higher work in process quantities. The LIFO reserve balance was $164.1 million at March 31, 2015 versus $153.4 million at the prior year end. The Company believes that the use of the LIFO method better matches current costs with current revenues. Critical Accounting Policies
In October 2015, the Company, B&G Foods North America (“B&G”), General Mills, Inc. and GMOL entered into a Relationship Transfer Agreement. Pursuant to the terms of the Relationship Transfer Agreement (i) the Company consented to the assignment by GMOL of the Second Amended and Restated Alliance Agreement (“Alliance Agreement”) and certain related agreements to B&G in connection with the sale by GMOL of its Green Giant and Le Sueur businesses to B&G, (ii) effective upon such assignment, each of the Company and General Mills have released the other party from any future obligations under the Alliance Agreement and certain related agreements; (iii) GMOL paid Seneca for this assignment $24.3 million at the closing of the sale of GMOL’s Green Giant and Le Sueur business to B&G. The effective date of the assignment was November 2, 2015. Subsequent to that date, the Company and B&G have entered into a Contract Packing Agreement that replaced the Alliance Agreement. During the year ended March 31, 2016, the Company sold for cash, on a bill and hold basis, $126.1 million of Green Giant finished goods inventory to GMOL and B&G. As of March 31, 2016, $58.8 million of this product, included in 2016 sales, remained unshipped. At the time of the sale of the Green Giant vegetables, title of the specified inventory transferred. The Company believes it has met the criteria required by the accounting standards for bill and hold treatment.
Trade promotions are an important component of the sales and marketing of the Company’s branded products and are critical to the support of the business. Trade promotion costs, which are recorded as a reduction of net sales, include amounts paid to encourage retailers to offer temporary price reductions for the sale of the Company’s products to consumers, amounts paid to obtain favorable display positions in retail stores, and amounts paid to retailers for shelf space in retail stores. Accruals for trade promotions are recorded primarily at the time of sale of product to the retailer based on expected levels of performance. Settlement of these liabilities typically occurs in subsequent periods primarily through an authorized process for deductions taken by a retailer from amounts otherwise due to the Company. As a result, the ultimate cost of a trade promotion program is dependent on the relative success of the events and the actions and level of deductions taken by retailers for amounts they consider due to them. Final determination of the permissible deductions may take extended periods of time. The Company assesses its long-lived assets for impairment whenever there is an indicator of impairment. Property, plant, and equipment are depreciated over their assigned lives. The assigned lives and the projected cash flows used to test impairment are subjective. If actual lives are shorter than anticipated or if future cash flows are less than anticipated, a future impairment charge or a loss on disposal of the assets could be incurred. Impairment losses are evaluated if the estimated undiscounted value of the cash flows is less than the carrying value. If such is the case, a loss is recognized when the carrying value of an asset exceeds its fair value.
8

Management’s Discussion and Analysis of Financial Condition and Results of Operations Obligations and Commitments As of March 31, 2016, the Company was obligated to make cash payments in connection with its debt, operating and capital leases, and purchase commitments. The effect of these obligations and commitments on the Company’s liquidity and cash flows in future periods are listed below. All of these arrangements require cash payments over varying periods of time. Certain of these arrangements are cancelable on short notice and others require additional payments as part of any early termination. Contractual Obligations March 31, 2016 2022 2017 2018-19 2020-21 and beyond Total (In thousands) Long-term debt $279,572 $10,938 $ 9,550 $15,479 $315,539 Interest 3,408 2,401 1,677 2,313 9,799 Operating lease obligations 43,392 72,395 51,163 28,918 195,868 Purchase commitments 183,564 — — — 183,564 Capital lease obligations 243 526 583 3,879 5,231
Total $510,179 $86,260 $62,973 $50,589 $710,001 In addition, the Company’s defined benefit plan has an unfunded pension liability of $37.8 million which is subject to certain actuarial assumptions. The unfunded status decreased by $17.2 million during 2016 reflecting the actual fair value of plan assets and the projected benefit obligation as of March 31, 2016. This unfunded status reduction was recognized via the actual gain on plan assets and the decrease in accumulated other comprehensive loss of $3.5 million after the income tax benefit of $2.4 million. The increase in projected benefit obligation was a function of using the full yield curve approach, an increase in the discount rate from 4.15% to 4.36% and the change to using an updated mortality table. During 2016, the Company converted to the 2006 base rates from the RP-2014 mortality study with the Blue Collar adjustment, with a generational projection of future mortality improvements from 2006 using Scale MP-2015 for calculating the pension obligation in 2016 and the related pension expense in 2017. Effective March 31, 2016, the Company elected to change the approach used to calculate the service and interest cost components of the net periodic benefit cost for it pension and postretirement benefit plans to provide a more precise measurement of service and interest costs. Historically the Company calculated the service and interest cost components utilizing a single weighted-average discount rate derived from the yield curve used to measure the benefit obligation at the beginning of the period. Going forward the new estimate utilizes a full yield curve approach in the estimation of these components by applying the specific spot rates along the yield curve used in determination of the benefit obligation to their underlying projected cash flows. The change does not affect the measurement of pension and postretirement obligations and is accounted for as a change in accounting estimate, which is applied prospectively.
Plan assets increased from $157.9 million as of March 31, 2015 to $176.2 million as of March 31, 2016 due to a continued recovery in market conditions and the $23.1 million contribution by the Company. The Company made this contribution to maintain its funding status at an acceptable level. During 2016, the Company entered into new operating leases of approximately $57.4 million, based on the if-purchased value, which was primarily for agricultural and packaging equipment.
Purchase commitments represent estimated payments to growers for crops that will be grown during the calendar 2016 season.
Due to uncertainties related to uncertain tax positions, the Company is not able to reasonably estimate the cash settlements required in future periods. The Company has no off-balance sheet debt or other unrecorded obligations other than operating lease obligations and purchase commitments noted above.
9

Management’s Discussion and Analysis of Financial Condition and Results of Operations Standby Letters of Credit The Company has standby letters of credit for certain insurance-related requirements. The majority of the Company’s standby letters of credit are automatically renewed annually, unless the issuer gives cancellation notice in advance. On March 31, 2016, the Company had $13.2 million in outstanding standby letters of credit. These standby letters of credit are supported by the Company’s Revolver and reduce borrowings available under the Revolver. Cash Flows In 2016, the Company’s cash and cash equivalents decreased by $2.0 million, which is due to the net impact of $39.2 million provided by operating activities, $47.6 million used in investing activities, and $6.4 million provided by financing activities. Operating Activities Cash provided by operating activities increased to $39.2 million in 2016 from $19.4 million in 2015. The increase is primarily attributable to an increase in net earnings and a decrease in other current assets (mostly lease deposits), partially offset by an increase in inventories in 2016 versus 2015. The 2016 LIFO credit of $24.8 million resulted in a decrease in the tax payment deferral of $8.9 million. During 2016, the Company made a $23.1 million contribution to its pension plan compared to a $0.4 million contribution in the previous year. The 2016 net earnings reflect the effect of a $24.3 million payment received from General Mills related to a relationship transfer agreement. Cash provided by operating activities decreased to $19.4 million in 2015 from $55.6 million in 2014. The decrease is primarily attributable to increased inventories, exclusive of LIFO, and a decrease in net earnings in 2015 versus 2014, partially offset by a decrease in accounts receivable and a decrease in other current assets (mostly lease deposits). The 2015 LIFO charge of $10.7 million resulted in an increase in the tax payment deferral of $3.7 million. The cash requirements of the business fluctuate significantly throughout the year to coincide with the seasonal growing cycles of vegetables and fruits. The majority of the inventories are produced during the packing months, from June through November, and are then sold over the following year. Cash flow from operating activities is one of the Company’s main sources of liquidity. Investing Activities Cash used in investing activities was $47.6 million for 2016, principally reflecting capital expenditures and two acquisitions totaling $38.8 million. Capital expenditures aggregated $9.9 million in 2016 versus $26.2 million in 2015. The decrease was primarily attributable to the fact there were no large projects in 2016. Cash used in investing activities was $42.1 million for 2015, principally reflecting capital expenditures and a purchase of an equity method investment of $16.2 million. Capital expenditures aggregated $26.2 million in 2015 versus $17.0 million in 2014. The increase was primarily attributable to more large projects in 2015. There were two major projects in 2015 as follows: 1) $7.5 million to complete a warehouse project in Sunnyside, Washington started in 2014, and 2) $2.1 million to buyout a Clyman, Wisconsin equipment lease. Financing Activities Cash provided by financing activities was $6.5 million in 2016 representing a net increase in the Revolver of $22.6 million partially offset by a partial payoff of interim funding of $9.5 million and the purchase of $6.3 million of treasury stock during 2016 versus $33.5 million purchased in 2015. Cash provided by financing activities was $19.5 million in 2015 representing a net increase in the Revolver of $55.6 million partially offset by a partial payoff of interim funding of $2.4 million and the purchase of $33.5 million of treasury stock during 2015 versus $0.7 million purchased in 2014.
10

Management’s Discussion and Analysis of Financial Condition and Results of Operations RESULTS OF OPERATIONS Classes of similar products/services: 2016 2015 2014 (In thousands) Net Sales: Green Giant * $ 144,310 $ 161,993 $ 177,881 Canned vegetables 746,501 754,556 753,318 Frozen 94,710 94,648 107,109 Fruit 253,658 234,918 264,549 Snack 12,336 11,667 11,496 Other 23,845 28,568 25,855 Total $1,275,360 $1,286,350 $1,340,208 * Green Giant includes canned and frozen vegetables exclusively for GMOL or B&G
Fiscal 2016 versus Fiscal 2015 Net sales for 2016 decreased $11.0 million, from $1,286.4 million to $1,275.4 million. The decrease primarily reflects a $0.7 million increase in Snack sales, a $19.0 million increase in fruit sales in part due to the October 2015 Gray acquisition and the February 2016 Diana acquisition, a $17.7 million decrease in Green Giant sales, a $8.3 million decrease in canned vegetables sales and a $4.7 million decrease in other sales. The decrease in sales is attributable to decreased sales volume of $11.1 million partially offset by higher selling prices/more favorable sales mix of $0.1 million. The slightly increased selling prices/more favorable sales mix is primarily due to canned and frozen vegetables. Cost of product sold as a percentage of sales decreased from 93.4% in 2015 to 88.4% in 2016 primarily as a result of a $24.6 million LIFO charge decrease in 2016, due to lower commodity and steel costs, and somewhat higher selling prices in 2016 versus 2015. Selling, general and administrative expense was 5.8% of sales in 2016 and 5.2% of sales in 2015. This increase is due in part to higher employment costs in 2016 than 2015. Other operating income in 2016 included a gain of $24.3 million related to a contractual payment received in conjunction with a relationship transfer agreement with General Mills. The Company reversed a provision for the Prop 65 litigation of $0.2 million and reduced an environmental accrual by $0.1 million. The Company also recorded a gain of $0.4 million from the sale of other fixed assets. Plant restructuring costs, which are described in detail in the Restructuring section of Management’s Discussion and Analysis of Financial Condition and Results of Operations, increased from $1.4 million in 2015 to $10.3 million in 2016. The $10.3 million was mostly due to the closing of a plant in the Northwest. Interest expense, net, increased from $6.9 million in 2015 to $8.0 million in 2016 due to the higher average Revolver borrowings in 2016 versus 2015 due to the two acquisitions in 2016 and the higher inventories in 2016 than 2015. As a result of the aforementioned factors, pre-tax earnings increased from $14.1 million in 2015 to $80.5 million in 2016. The effective tax rate was 32.3% in 2016 and 29.9% in 2015. Of the 2.4 percentage point increase in the effective tax rate for the year, the major contributor to this increase is with the federal credits for Research and Development, Work Opportunity Tax Credit and fuel. These credits are largely fixed and with the significant increase in pre-tax earnings for 2016, these credits are a smaller percentage of pre-tax earnings in comparison to 2015. This accounts for 2.0 percent of the increase.
11

Management’s Discussion and Analysis of Financial Condition and Results of Operations Fiscal 2015 versus Fiscal 2014 Net sales for 2015 decreased $53.9 million, from $1,340.2 million to $1,286.3 million. The decrease primarily reflects a $15.9 million decrease in GMOL sales, a $29.6 million decrease in fruit sales, a $12.5 million decrease in frozen sales, a $1.2 million increase in canned vegetables sales and a $2.7 million increase in other sales. The decrease in sales is attributable to decreased sales volume of $95.5 million partially offset by higher selling prices/more favorable sales mix of $41.6 million. The increased selling prices/more favorable sales mix is primarily due to canned fruit. Cost of product sold as a percentage of sales increased from 93.2% in 2014 to 93.5% in 2015 primarily as a result of higher commodity costs and the impact of lower production volume with fixed costs, partially offset by a $9.7 million LIFO charge decrease in 2015 versus 2014. Selling, general and administrative expense was unchanged at 5.2% of sales in 2015 and 2014. Other operating income in 2015 included a gain of $5.0 million related to a contractual payment received in connection with the closing of a Midwest plant, a charge of $0.3 million related to environmental costs related to a Company-owned plant in New York State. The Company also recorded a gain of $0.1 million from the sale of other fixed assets. Other operating income in 2014 included a gain of $2.9 million from a break-up fee earned as a result of the Company being named the stalking horse bidder in an attempt to acquire substantially all the operating assets of Allens, Inc. in a bankruptcy court supervised auction, a gain of $0.7 million from the sale of two aircraft and a gain of $0.1 million as a result of adjustments related to the purchase of Sunnyside. The Company also recorded a loss of $0.5 million on the disposal of a warehouse located in Sunnyside, Washington and a net gain of $0.2 million from the sale of other fixed assets. Plant restructuring costs, which are described in detail in the Restructuring section of Management’s Discussion and Analysis of Financial Condition and Results of Operations, increased from $0.5 million in 2014 to $1.4 million in 2015. This $1.4 million charge was mostly due to the closing of a plant in the Midwest in 2015. Product rationalization costs incurred in 2013 were adjusted in 2014. Interest expense, net, decreased from $7.6 million in 2014 to $6.9 million in 2015 due to the continuing pay down of higher cost debt in 2015 partially offset by higher average Revolver borrowings in 2015 versus 2014. As a result of the aforementioned factors, pre-tax earnings decreased from $17.3 million in 2014 to $14.1 million in 2015. The effective tax rate was 29.9% in 2015 and 20.5% in 2014. Of the 9.4 percentage point increase in the effective tax rate for the year, the major contributors to this increase are the following items, 1) the establishment of a valuation allowance related to the New York State investment tax credit, 2) with lower pre-tax earnings, the permanent items have a larger impact on the effective rate, and 3) less federal credits generated in the current year compared to the prior year. The impact of these increases was partially offset by the manufacturer’s deduction being a higher percentage of current year earnings than the prior year.
12

Management’s Discussion and Analysis of Financial Condition and Results of Operations Recently Issued Accounting Standards In May 2014, the FASB issued ASU 2014-09, Revenue from Contracts with Customers, which requires an entity to recognize the amount of revenue to which it expects to be entitled for the transfer of promised goods or services to customers. The ASU will replace most existing revenue recognition guidance in U.S. GAAP when it becomes effective. The new standard will be effective for the Company on April 1, 2018 (beginning of fiscal 2019). Early adoption is permitted. The standard permits the use of either the retrospective or cumulative effect transition method. The Company is evaluating the effect that ASU 2014-09 will have on its consolidated financial statements and related disclosures. The Company has not yet selected a transition method nor has it determined the effect of the standard on its ongoing financial reporting. The Company does not anticipate a material impact on the Company's financial position, results of operations or cash flows as a result of this change. In November 2015, the FASB issued ASU 2015-17, Balance Sheet Classification of Deferred Taxes which requires that all deferred tax liabilities and assets of the same tax jurisdiction or a tax filing group, as well as any related valuation allowance, be offset and be presented as a single noncurrent amount in a classified balance sheet. This standard is effective for the Company for fiscal years beginning after December 15, 2017 (beginning of fiscal 2019). Early adoption is permitted. The Company adopted this standard during 2016 on a prospective basis. Prior periods were not retrospectively adjusted. In February 2016, the FASB issued Accounting Standards Update No. 2016-02, Leases. The new standard establishes a right-of-use (“ROU”) model that requires a lessee to record a ROU asset and a lease liability on the balance sheet for all leases with terms longer than 12 months. Leases will be classified as either finance or operating, with classification affecting the pattern of expense recognition in the income statement. The new standard is effective for fiscal years beginning after December 15, 2018 (beginning fiscal 2020), including interim periods within those fiscal years. A modified retrospective transition approach is required for lessees for capital and operating leases existing at, or entered into after, the beginning of the earliest comparative period presented in the financial statements, with certain practical expedients available. While we are still evaluating the impact of our pending adoption of the new standard on our consolidated financial statements, we expect that upon adoption we will recognize ROU assets and lease liabilities and that the amounts could be material.
13

Management’s Discussion and Analysis of Financial Condition and Results of Operations QUANTITATIVE AND QUALITATIVE DISCLOSURES ABOUT MARKET RISK Interest Rate Risk The Company maintained $8.6 million in cash equivalents as of March 31, 2016. As a result of its regular borrowing activities, the Company’s operating results are exposed to fluctuations in interest rates, which it manages primarily through its regular financing activities. The Company uses a revolving credit facility with variable interest rates to finance capital expenditures, acquisitions, seasonal working capital requirements and to pay debt principal and interest obligations. In addition, long-term debt includes secured notes payable. Long-term debt bears interest at fixed and variable rates. With $283.5 million in average variable-rate debt during fiscal 2016, a 1% change in interest rates would have had a $2.8 million effect on interest expense. The following table provides information about the Company’s financial instruments that are sensitive to changes in interest rates. The table presents principal cash flows and related weighted average interest rates by expected maturity date. Weighted average interest rates on long-term variable-rate debt are based on rates as of March 31, 2016.
Interest Rate Sensitivity of Long-Term Debt and Short-Term Investments March 31, 2016 (In thousands)
P A Y M E N T S B Y Y E A R Total/ Estimated Weighted Fair 2017 2018 2019 2020 2021 Thereafter Average Value Fixed-rate L/T debt: Principal cash flows $ 7,980 $2,844 $3,034 $2,531 $2,344 $ 2,584 $ 21,317 $ 21,256 Average interest rate 5.98 % 6.62 % 6.67 % 6.71 % 6.61 % 6.87 % 6.58 % Variable-rate L/T debt: Principal cash flows $271,592 $5,060 $ - $ - $4,675 $12,895 $294,222 $294,222 Average interest rate 1.95 % 3.02 % - % - % 3.02 % 3.02 % 2.03 % Average Revolver debt: Principal cash flows $260,886 $260,886 Average interest rate 1.93 % Short-term investments: Average balance $ 5,656 $ 5,656 Average interest rate 0.21 % Commodity Risk The materials that the Company uses, such as vegetables, fruits, steel, ingredients, and packaging materials, as well as the electricity and natural gas used in the Company’s business, are commodities that may experience price volatility caused by external factors including market fluctuations, availability, weather, currency fluctuations, and changes in governmental regulations and agricultural programs. These events may result in reduced supplies of these materials, higher supply costs, or interruptions in the Company’s production schedules. If prices of these raw materials increase and the Company is not able to effectively pass such price increases along to its customers, operating income will decrease. With $183.6 million in produce costs expected during 2017, a 1% change would have a $1.8 million effect on inventory costs. A 1% change in steel unit costs would equate to a $0.9 million cost impact. The Company does not currently hedge or otherwise use derivative instruments to manage interest rate or commodity risks.
14
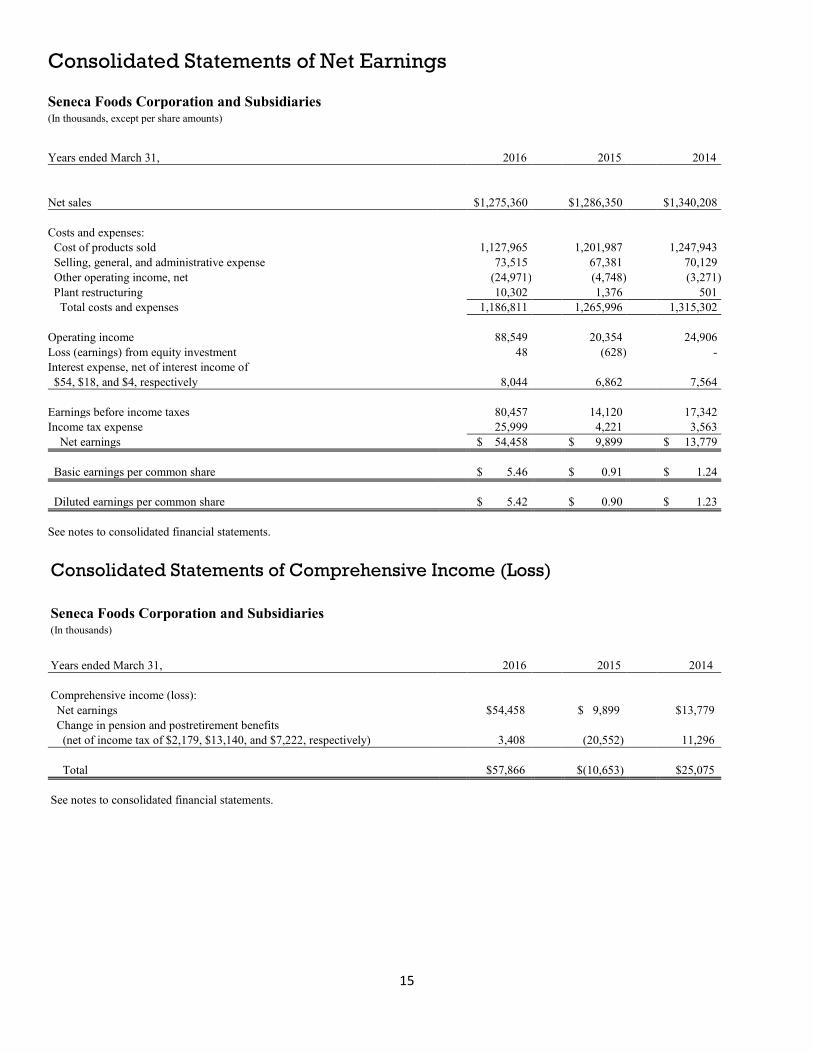
Consolidated Statements of Net Earnings
Seneca Foods Corporation and Subsidiaries (In thousands, except per share amounts)
Years ended March 31, 2016 2015 2014 Net sales $1,275,360 $1,286,350 $1,340,208 Costs and expenses: Cost of products sold 1,127,965 1,201,987 1,247,943 Selling, general, and administrative expense 73,515 67,381 70,129 Other operating income, net (24,971) (4,748) (3,271) Plant restructuring 10,302 1,376 501 Total costs and expenses 1,186,811 1,265,996 1,315,302
Operating income 88,549 20,354 24,906 Loss (earnings) from equity investment 48 (628) - Interest expense, net of interest income of $54, $18, and $4, respectively 8,044 6,862 7,564 Earnings before income taxes 80,457 14,120 17,342 Income tax expense 25,999 4,221 3,563 Net earnings $ 54,458 $ 9,899 $ 13,779 Basic earnings per common share $ 5.46 $ 0.91 $ 1.24 Diluted earnings per common share $ 5.42 $ 0.90 $ 1.23 See notes to consolidated financial statements.
Consolidated Statements of Comprehensive Income (Loss) Seneca Foods Corporation and Subsidiaries (In thousands) Years ended March 31, 2016 2015 2014 Comprehensive income (loss): Net earnings $54,458 $ 9,899 $13,779 Change in pension and postretirement benefits (net of income tax of $2,179, $13,140, and $7,222, respectively) 3,408 (20,552) 11,296 Total $57,866 $(10,653) $25,075 See notes to consolidated financial statements.
15

Consolidated Balance Sheets
Seneca Foods Corporation and Subsidiaries (In thousands) March 31, 2016 2015 Assets Current Assets: Cash and cash equivalents $ 8,602 $ 10,608 Accounts receivable, less allowance for doubtful accounts of $111 and $145, respectively 76,788 70,591 Assets held for sale 5,025 - Inventories: Finished products 366,911 301,705 In process 17,122 10,167 Raw materials and supplies 183,674 160,540 567,707 472,412 Deferred income taxes, net - 6,997 Other current assets 15,765 27,439 Total Current Assets 673,887 588,047 Deferred income tax asset, net 12,897 14,829 Other assets 19,706 18,015 Property, plant, and equipment: Land 22,430 20,971 Buildings and improvements 204,944 200,739 Equipment 359,927 347,169 587,301 568,879 Less accumulated depreciation and amortization 398,464 383,322 Net property, plant, and equipment 188,837 185,557 Total Assets $895,327 $806,448 Liabilities and Stockholders’ Equity Current Liabilities: Notes payable $ 402 $ 9,903 Accounts payable 67,410 68,859 Accrued vacation 11,792 11,347 Accrued payroll 9,438 6,344 Other accrued expenses 27,627 23,732 Current portion of long-term debt and capital lease obligations 279,815 2,530 Income taxes payable 2,974 1,787 Total Current Liabilities 399,458 124,502 Long-term debt, less current portion 35,967 271,634 Pension liabilities 37,798 54,960 Other liabilities 11,942 3,622 Capital lease obligations, less current portion 4,988 - Total Liabilities 490,153 454,718 Commitments and contingencies Stockholders’ Equity: Preferred stock 1,344 2,119 Common stock 3,023 3,010 Additional paid-in capital 97,373 96,578 Treasury stock, at cost (65,709) (61,277) Accumulated other comprehensive loss (28,396) (31,804) Retained earnings 397,539 343,104 Total Stockholders’ Equity 405,174 351,730 Total Liabilities and Stockholders’ Equity $895,327 $806,448 See notes to consolidated financial statements.
16
Consolidated Statements of Cash Flows
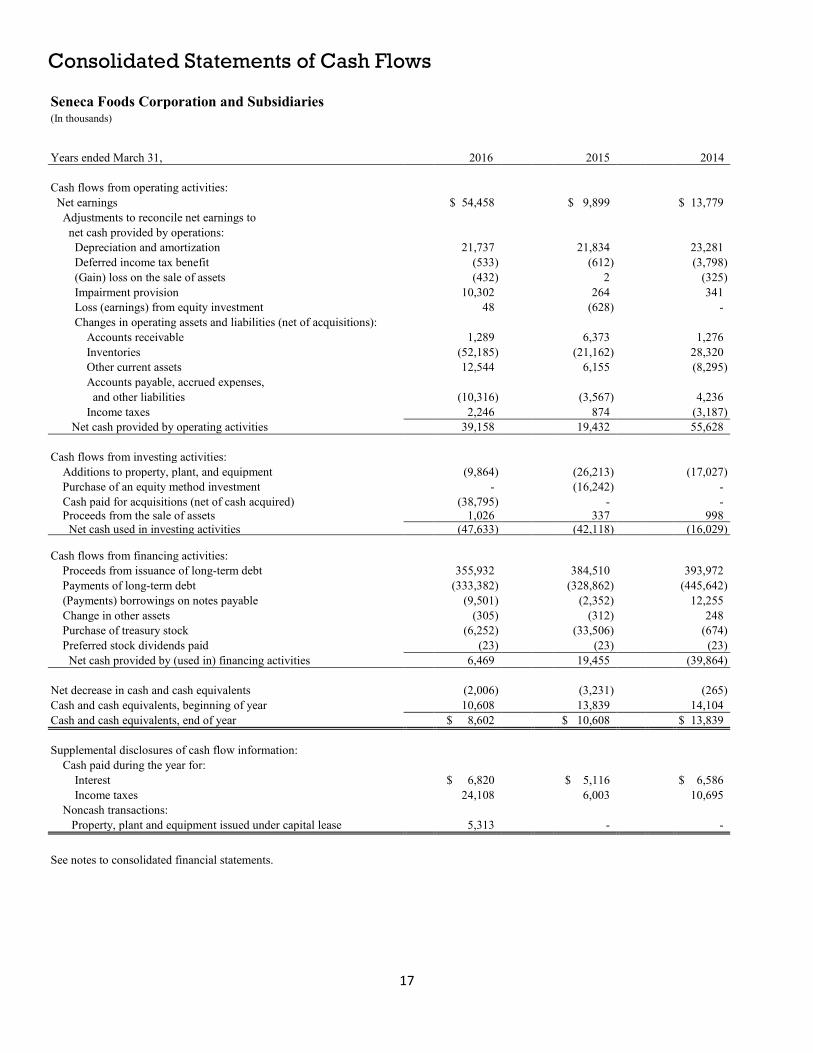
Seneca Foods Corporation and Subsidiaries (In thousands) Years ended March 31, 2016 2015 2014 Cash flows from operating activities: Net earnings $ 54,458 $ 9,899 $ 13,779 Adjustments to reconcile net earnings to net cash provided by operations: Depreciation and amortization 21,737 21,834 23,281 Deferred income tax benefit (533) (612) (3,798) (Gain) loss on the sale of assets (432) 2 (325) Impairment provision 10,302 264 341 Loss (earnings) from equity investment 48 (628) - Changes in operating assets and liabilities (net of acquisitions): Accounts receivable 1,289 6,373 1,276 Inventories (52,185) (21,162) 28,320 Other current assets 12,544 6,155 (8,295) Accounts payable, accrued expenses, and other liabilities (10,316) (3,567) 4,236 Income taxes 2,246 874 (3,187) Net cash provided by operating activities 39,158 19,432 55,628 Cash flows from investing activities: Additions to property, plant, and equipment (9,864) (26,213) (17,027) Purchase of an equity method investment - (16,242) - Cash paid for acquisitions (net of cash acquired) (38,795) - - Proceeds from the sale of assets 1,026 337 998 Net cash used in investing activities (47,633) (42,118) (16,029) Cash flows from financing activities: Proceeds from issuance of long-term debt 355,932 384,510 393,972 Payments of long-term debt (333,382) (328,862) (445,642) (Payments) borrowings on notes payable (9,501) (2,352) 12,255 Change in other assets (305) (312) 248 Purchase of treasury stock (6,252) (33,506) (674) Preferred stock dividends paid (23) (23) (23) Net cash provided by (used in) financing activities 6,469 19,455 (39,864) Net decrease in cash and cash equivalents (2,006) (3,231) (265) Cash and cash equivalents, beginning of year 10,608 13,839 14,104 Cash and cash equivalents, end of year $ 8,602 $ 10,608 $ 13,839 Supplemental disclosures of cash flow information: Cash paid during the year for: Interest $ 6,820 $ 5,116 $ 6,586 Income taxes 24,108 6,003 10,695 Noncash transactions: Property, plant and equipment issued under capital lease 5,313 - - See notes to consolidated financial statements.
17

Consolidated Statements of Stockholders' Equity
Seneca Foods Corporation and Subsidiaries(In thousands, except share amounts)
AccumulatedAdditional Other
Preferred Common Paid-In Treasury Comprehensive RetainedStock Stock Capital Stock Loss Earnings
Balance March 31, 2013 $5,422 $2,955 $93,069 $(31,204) $(22,548) $319,472Net earnings - - - - - 13,779Cash dividends paidon preferred stock - - - - - (23)
Equity incentive program - - 100 - - -Stock issued for profit sharing plan - - 4 - - -Contribution of 401(k) match - - - 1,984 - -Purchase of treasury stock - - - (674) - -Preferred stock conversion (90) 3 87 - - -Change in pension and postretirement
benefits adjustment (net of tax $7,222) - - - - 11,296 -Balance March 31, 2014 5,332 2,958 93,260 (29,894) (11,252) 333,228Net earnings - - - - - 9,899Cash dividends paidon preferred stock - - - - - (23)
Equity incentive program - - 100 - - -Stock issued for profit sharing plan - 1 56 - - -Contribution of 401(k) match - - - 2,123 - -Purchase of treasury stock - - - (33,506) - -Preferred stock conversion (3,213) 51 3,162 - - -Change in pension and postretirement
benefits adjustment (net of tax $13,140) - - - - (20,552) -Balance March 31, 2015 2,119 3,010 96,578 (61,277) (31,804) 343,104Net earnings - - - - - 54,458Cash dividends paidon preferred stock - - - - - (23)
Equity incentive program - - 33 - - -Contribution of 401(k) match - - - 1,820 - -Purchase of treasury stock - - - (6,252) - -Preferred stock conversion (775) 13 762 - - -Change in pension and postretirement
benefits adjustment (net of tax $2,179) - - - - 3,408 -
Balance March 31, 2016 $1,344 $3,023 $97,373 $(65,709) $(28,396) $397,539
Preferred Stock Common Stock
6% 10%Cumulative Par Cumulative Par 2003 Series
Value $.25 Value $.025 Participating Participating Class A Class BCallable at Par Convertible Convertible Par Convertible Par Common Stock Common Stock
Voting Voting Value $.025 Value $.025 Par Value $.25 Par Value $.25Shares authorized and designated:March 31, 2016 200,000 1,400,000 90,826 500 20,000,000 10,000,000
Shares outstanding:March 31, 2014 200,000 807,240 90,901 257,790 8,735,714 2,013,953March 31, 2015 200,000 807,240 90,826 50,500 7,926,280 1,967,958March 31, 2016 200,000 807,240 90,826 500 7,918,069 1,894,599Stock amount $50 $202 $1,084 $8 $2,519 $504
See notes to consolidated financial statements.
18
Notes to Consolidated Financial Statements
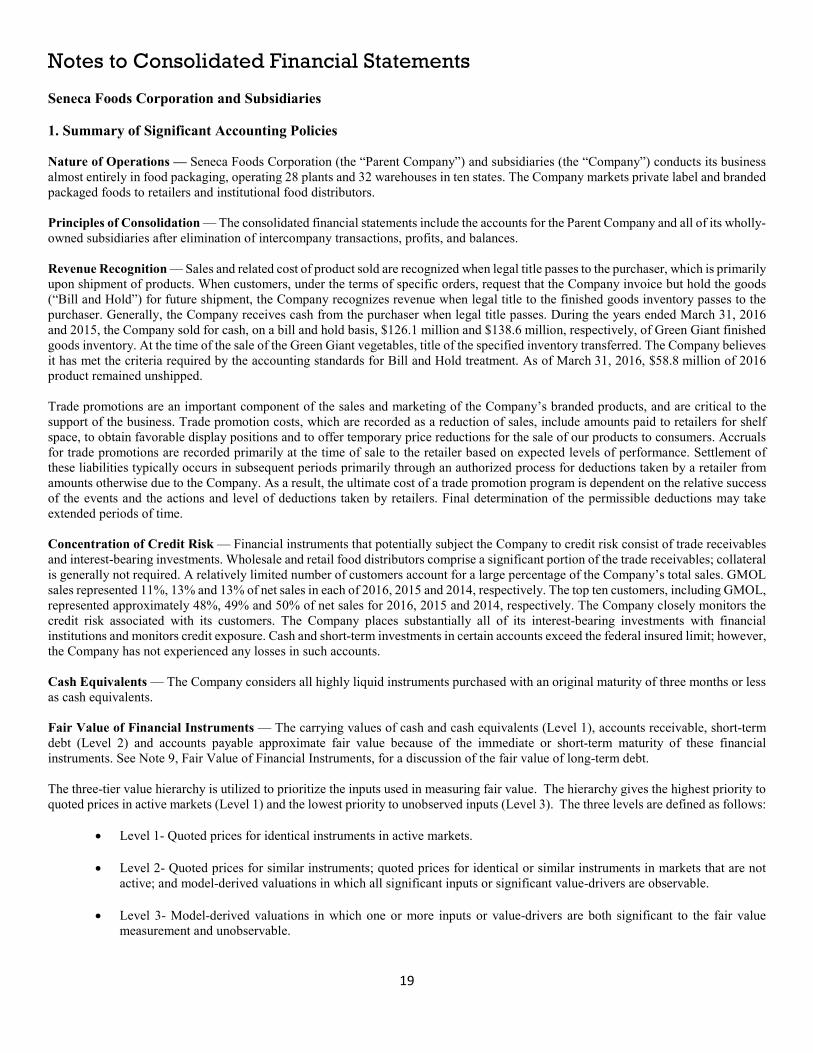
Seneca Foods Corporation and Subsidiaries 1. Summary of Significant Accounting Policies Nature of Operations — Seneca Foods Corporation (the “Parent Company”) and subsidiaries (the “Company”) conducts its business almost entirely in food packaging, operating 28 plants and 32 warehouses in ten states. The Company markets private label and branded packaged foods to retailers and institutional food distributors. Principles of Consolidation — The consolidated financial statements include the accounts for the Parent Company and all of its wholly-owned subsidiaries after elimination of intercompany transactions, profits, and balances. Revenue Recognition — Sales and related cost of product sold are recognized when legal title passes to the purchaser, which is primarily upon shipment of products. When customers, under the terms of specific orders, request that the Company invoice but hold the goods (“Bill and Hold”) for future shipment, the Company recognizes revenue when legal title to the finished goods inventory passes to the purchaser. Generally, the Company receives cash from the purchaser when legal title passes. During the years ended March 31, 2016 and 2015, the Company sold for cash, on a bill and hold basis, $126.1 million and $138.6 million, respectively, of Green Giant finished goods inventory. At the time of the sale of the Green Giant vegetables, title of the specified inventory transferred. The Company believes it has met the criteria required by the accounting standards for Bill and Hold treatment. As of March 31, 2016, $58.8 million of 2016 product remained unshipped. Trade promotions are an important component of the sales and marketing of the Company’s branded products, and are critical to the support of the business. Trade promotion costs, which are recorded as a reduction of sales, include amounts paid to retailers for shelf space, to obtain favorable display positions and to offer temporary price reductions for the sale of our products to consumers. Accruals for trade promotions are recorded primarily at the time of sale to the retailer based on expected levels of performance. Settlement of these liabilities typically occurs in subsequent periods primarily through an authorized process for deductions taken by a retailer from amounts otherwise due to the Company. As a result, the ultimate cost of a trade promotion program is dependent on the relative success of the events and the actions and level of deductions taken by retailers. Final determination of the permissible deductions may take extended periods of time. Concentration of Credit Risk — Financial instruments that potentially subject the Company to credit risk consist of trade receivables and interest-bearing investments. Wholesale and retail food distributors comprise a significant portion of the trade receivables; collateral is generally not required. A relatively limited number of customers account for a large percentage of the Company’s total sales. GMOL sales represented 11%, 13% and 13% of net sales in each of 2016, 2015 and 2014, respectively. The top ten customers, including GMOL, represented approximately 48%, 49% and 50% of net sales for 2016, 2015 and 2014, respectively. The Company closely monitors the credit risk associated with its customers. The Company places substantially all of its interest-bearing investments with financial institutions and monitors credit exposure. Cash and short-term investments in certain accounts exceed the federal insured limit; however, the Company has not experienced any losses in such accounts. Cash Equivalents — The Company considers all highly liquid instruments purchased with an original maturity of three months or less as cash equivalents. Fair Value of Financial Instruments — The carrying values of cash and cash equivalents (Level 1), accounts receivable, short-term debt (Level 2) and accounts payable approximate fair value because of the immediate or short-term maturity of these financial instruments. See Note 9, Fair Value of Financial Instruments, for a discussion of the fair value of long-term debt. The three-tier value hierarchy is utilized to prioritize the inputs used in measuring fair value. The hierarchy gives the highest priority to quoted prices in active markets (Level 1) and the lowest priority to unobserved inputs (Level 3). The three levels are defined as follows:
• Level 1- Quoted prices for identical instruments in active markets.
• Level 2- Quoted prices for similar instruments; quoted prices for identical or similar instruments in markets that are not active; and model-derived valuations in which all significant inputs or significant value-drivers are observable.
• Level 3- Model-derived valuations in which one or more inputs or value-drivers are both significant to the fair value measurement and unobservable.
19

Notes to Consolidated Financial Statements
Deferred Financing Costs — Deferred financing costs incurred in obtaining debt are amortized on a straight-line basis over the term of the debt, which is not materially different than using the effective interest rate method. As of March 31, 2016, there were $0.1 million of unamortized financing cost included in other current assets and $0.1 million of unamortized financing costs included in other assets on the Consolidated Balance Sheets.
Inventories — Substantially all inventories are stated at the lower of cost; determined under the last-in, first-out (“LIFO”) method; or market.
Income Taxes — The provision for income taxes includes federal and state income taxes currently payable and those deferred because of temporary differences between the financial statement and tax basis of assets and liabilities and tax credit carryforwards. The Company uses the flow-through method to account for its investment tax credits.
The Company evaluates the likelihood of realization of its net deferred income tax assets by assessing its valuation allowance and by adjusting the amount of such allowance, if necessary. The factors used to assess the likelihood of realization are the Company’s forecast of future taxable income, the projected reversal of temporary differences and available tax planning strategies that could be implemented to realize the net deferred income tax assets.
Current rules on the accounting for uncertainty on income taxes prescribe a minimum recognition threshold for a tax position taken or expected to be taken in a tax return that is required to be met before being recognized in the financial statements. Those rules also provide guidance on derecognition, measurement, classification, interest and penalties, accounting in interim periods, disclosure and transition. The Company recognizes interest and penalties accrued on unrecognized tax benefits as well as interest received from favorable settlements within income tax expense.
Shipping and Handling Costs — The Company includes all shipping and handling costs billed to customers in net sales and the corresponding costs in cost of products sold. The shipping and handling costs billed to customers in net sales were $38.3 million, $38.8 million and $41.3 million in 2016, 2015, and 2014, respectively.
Advertising Costs — Advertising costs are expensed as incurred. Advertising costs charged to operations were $2.0 million, $1.7 million and $1.5 million in 2016, 2015 and 2014, respectively.
Accounts Receivable and Doubtful Accounts — Accounts receivable is stated at invoice value, which is net of any off invoice promotions. A provision for doubtful accounts is recorded based upon an assessment of credit risk within the accounts receivable portfolio, experience of delinquencies (accounts over 15 days past due) and charge-offs (accounts removed from accounts receivable for expectation of non-payment), and current market conditions. Management believes these provisions are adequate based upon the relevant information presently available.
Earnings per Common Share — The Company has three series of convertible preferred stock, which are deemed to be participating securities that are entitled to participate in any dividend on Class A common stock as if the preferred stock had been converted into common stock immediately prior to the record date for such dividend. Basic earnings per share for common stock is calculated using the “two-class” method by dividing the earnings attributable to common stockholders by the weighted average of common shares outstanding during the period. Restricted stock is included in all earnings per share calculations.
Diluted earnings per share is calculated by dividing earnings attributable to common stockholders by the sum of the weighted average common shares outstanding plus the dilutive effect of convertible preferred stock using the “if-converted” method, which treats the contingently-issuable shares of convertible preferred stock as common stock.
20
Notes to Consolidated Financial Statements
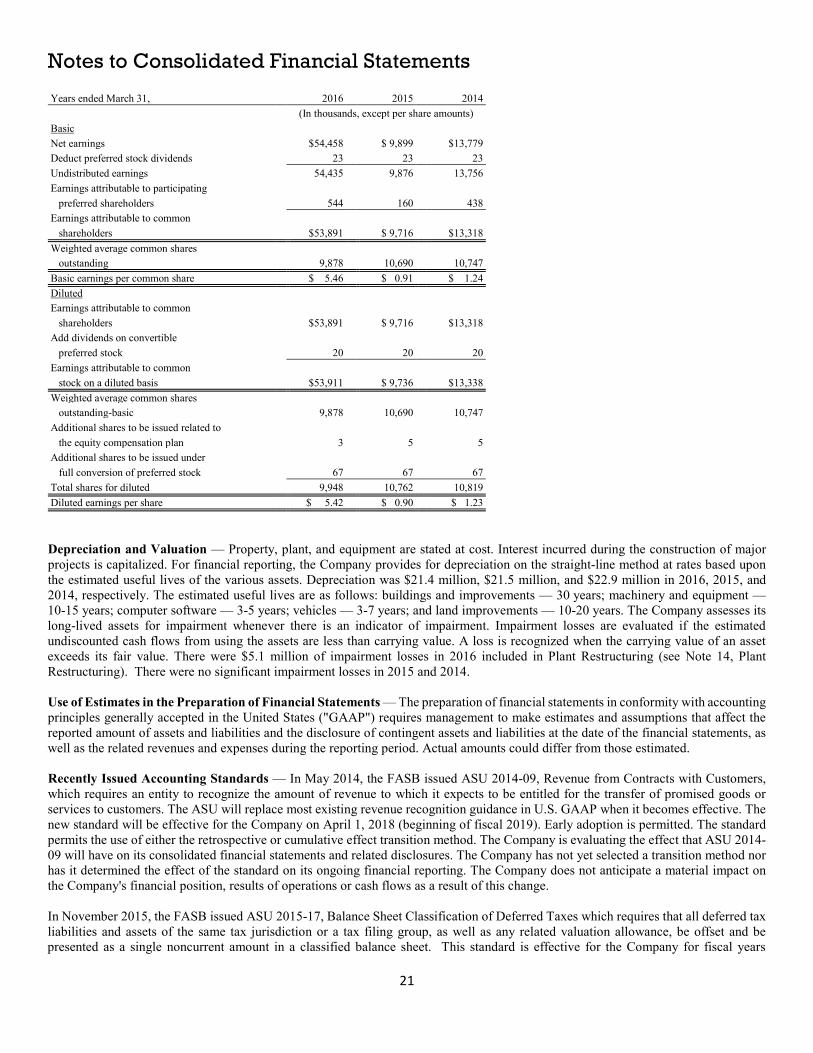
Years ended March 31, 2016 2015 2014 (In thousands, except per share amounts) Basic Net earnings $54,458 $ 9,899 $13,779 Deduct preferred stock dividends 23 23 23 Undistributed earnings 54,435 9,876 13,756 Earnings attributable to participating preferred shareholders 544 160 438 Earnings attributable to common shareholders $53,891 $ 9,716 $13,318 Weighted average common shares outstanding 9,878 10,690 10,747 Basic earnings per common share $ 5.46 $ 0.91 $ 1.24 Diluted Earnings attributable to common shareholders $53,891 $ 9,716 $13,318 Add dividends on convertible preferred stock 20 20 20 Earnings attributable to common stock on a diluted basis $53,911 $ 9,736 $13,338 Weighted average common shares outstanding-basic 9,878 10,690 10,747 Additional shares to be issued related to the equity compensation plan 3 5 5 Additional shares to be issued under full conversion of preferred stock 67 67 67 Total shares for diluted 9,948 10,762 10,819 Diluted earnings per share $ 5.42 $ 0.90 $ 1.23
Depreciation and Valuation — Property, plant, and equipment are stated at cost. Interest incurred during the construction of major projects is capitalized. For financial reporting, the Company provides for depreciation on the straight-line method at rates based upon the estimated useful lives of the various assets. Depreciation was $21.4 million, $21.5 million, and $22.9 million in 2016, 2015, and 2014, respectively. The estimated useful lives are as follows: buildings and improvements — 30 years; machinery and equipment — 10-15 years; computer software — 3-5 years; vehicles — 3-7 years; and land improvements — 10-20 years. The Company assesses its long-lived assets for impairment whenever there is an indicator of impairment. Impairment losses are evaluated if the estimated undiscounted cash flows from using the assets are less than carrying value. A loss is recognized when the carrying value of an asset exceeds its fair value. There were $5.1 million of impairment losses in 2016 included in Plant Restructuring (see Note 14, Plant Restructuring). There were no significant impairment losses in 2015 and 2014. Use of Estimates in the Preparation of Financial Statements — The preparation of financial statements in conformity with accounting principles generally accepted in the United States ("GAAP") requires management to make estimates and assumptions that affect the reported amount of assets and liabilities and the disclosure of contingent assets and liabilities at the date of the financial statements, as well as the related revenues and expenses during the reporting period. Actual amounts could differ from those estimated. Recently Issued Accounting Standards — In May 2014, the FASB issued ASU 2014-09, Revenue from Contracts with Customers, which requires an entity to recognize the amount of revenue to which it expects to be entitled for the transfer of promised goods or services to customers. The ASU will replace most existing revenue recognition guidance in U.S. GAAP when it becomes effective. The new standard will be effective for the Company on April 1, 2018 (beginning of fiscal 2019). Early adoption is permitted. The standard permits the use of either the retrospective or cumulative effect transition method. The Company is evaluating the effect that ASU 2014-09 will have on its consolidated financial statements and related disclosures. The Company has not yet selected a transition method nor has it determined the effect of the standard on its ongoing financial reporting. The Company does not anticipate a material impact on the Company's financial position, results of operations or cash flows as a result of this change. In November 2015, the FASB issued ASU 2015-17, Balance Sheet Classification of Deferred Taxes which requires that all deferred tax liabilities and assets of the same tax jurisdiction or a tax filing group, as well as any related valuation allowance, be offset and be presented as a single noncurrent amount in a classified balance sheet. This standard is effective for the Company for fiscal years
21
Notes to Consolidated Financial Statements
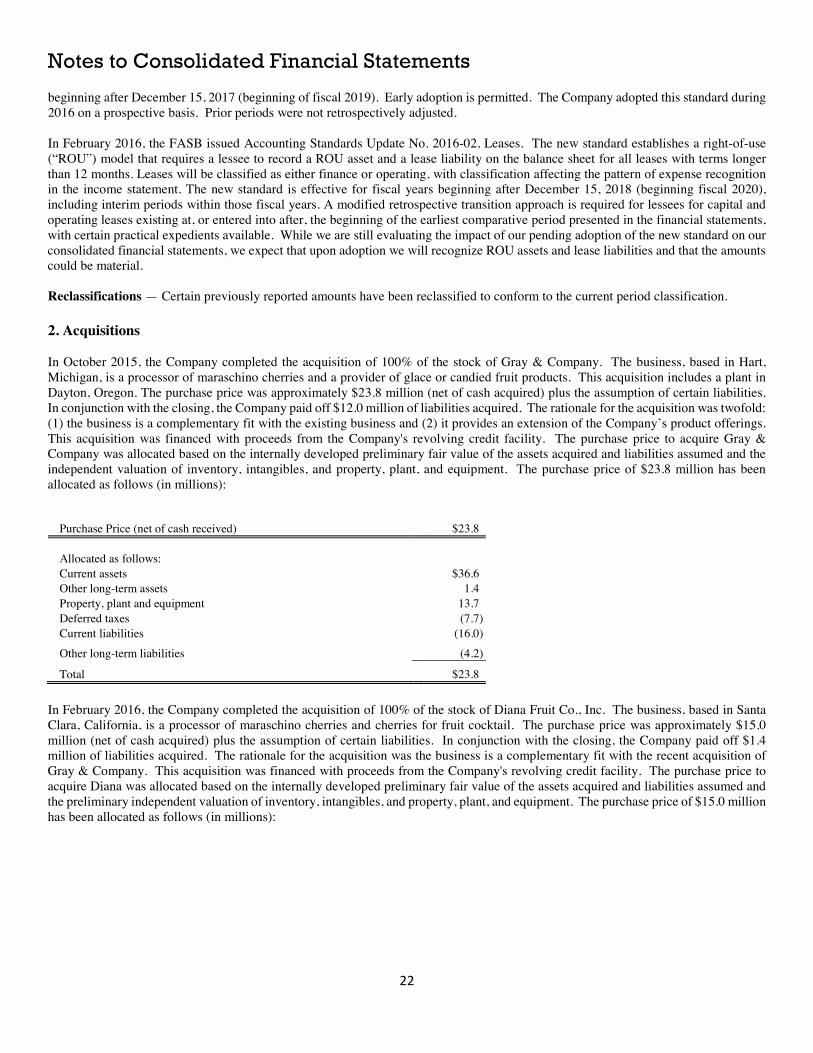
beginning after December 15, 2017 (beginning of fiscal 2019). Early adoption is permitted. The Company adopted this standard during 2016 on a prospective basis. Prior periods were not retrospectively adjusted. In February 2016, the FASB issued Accounting Standards Update No. 2016-02, Leases. The new standard establishes a right-of-use (“ROU”) model that requires a lessee to record a ROU asset and a lease liability on the balance sheet for all leases with terms longer than 12 months. Leases will be classified as either finance or operating, with classification affecting the pattern of expense recognition in the income statement. The new standard is effective for fiscal years beginning after December 15, 2018 (beginning fiscal 2020), including interim periods within those fiscal years. A modified retrospective transition approach is required for lessees for capital and operating leases existing at, or entered into after, the beginning of the earliest comparative period presented in the financial statements, with certain practical expedients available. While we are still evaluating the impact of our pending adoption of the new standard on our consolidated financial statements, we expect that upon adoption we will recognize ROU assets and lease liabilities and that the amounts could be material. Reclassifications — Certain previously reported amounts have been reclassified to conform to the current period classification. 2. Acquisitions
In October 2015, the Company completed the acquisition of 100% of the stock of Gray & Company. The business, based in Hart, Michigan, is a processor of maraschino cherries and a provider of glace or candied fruit products. This acquisition includes a plant in Dayton, Oregon. The purchase price was approximately $23.8 million (net of cash acquired) plus the assumption of certain liabilities. In conjunction with the closing, the Company paid off $12.0 million of liabilities acquired. The rationale for the acquisition was twofold: (1) the business is a complementary fit with the existing business and (2) it provides an extension of the Company’s product offerings. This acquisition was financed with proceeds from the Company's revolving credit facility. The purchase price to acquire Gray & Company was allocated based on the internally developed preliminary fair value of the assets acquired and liabilities assumed and the independent valuation of inventory, intangibles, and property, plant, and equipment. The purchase price of $23.8 million has been allocated as follows (in millions):
Purchase Price (net of cash received) $23.8 Allocated as follows: Current assets $36.6 Other long-term assets 1.4 Property, plant and equipment 13.7 Deferred taxes (7.7) Current liabilities (16.0)
Other long-term liabilities (4.2)
Total $23.8 In February 2016, the Company completed the acquisition of 100% of the stock of Diana Fruit Co., Inc. The business, based in Santa Clara, California, is a processor of maraschino cherries and cherries for fruit cocktail. The purchase price was approximately $15.0 million (net of cash acquired) plus the assumption of certain liabilities. In conjunction with the closing, the Company paid off $1.4 million of liabilities acquired. The rationale for the acquisition was the business is a complementary fit with the recent acquisition of Gray & Company. This acquisition was financed with proceeds from the Company's revolving credit facility. The purchase price to acquire Diana was allocated based on the internally developed preliminary fair value of the assets acquired and liabilities assumed and the preliminary independent valuation of inventory, intangibles, and property, plant, and equipment. The purchase price of $15.0 million has been allocated as follows (in millions):
22

Notes to Consolidated Financial Statements
Purchase Price (net of cash received) $15.0 Allocated as follows: Current assets $16.8 Other long-term assets 0.5 Property, plant and equipment 0.9 Deferred taxes 0.4 Current liabilities (3.6)
Total $15.0 The Company’s Consolidated Statement of Net Earnings for the year ended March 31, 2016 includes five months of the acquired Gray & Company and one month of Diana Fruit operating results which amounted to Net Sales of $25.5 million and Net Loss of $1.7 million. If Gray and Diana had been acquired at the beginning of the year ended March 31, 2015, total Net Sales would be $1,324.8 million (unaudited) for 2016 and $1,363.7 million (unaudited) for 2015 and Net Earnings would have been $54.2 million (unaudited) for 2016 and $8.6 million (unaudited) for 2015.
In April 2014, the Company purchased a 50% equity interest in Truitt Bros. Inc. ("Truitt") for $16.2 million. The purchase agreement grants the Company the right to acquire the remaining 50% ownership of Truitt in the future under certain conditions. Truitt is known for its industry innovation related to packing shelf stable foods in trays, pouches and bowls. Truitt has two state-of-the-art plants located in Oregon and Kentucky. This investment is included in Other Assets in the Consolidated Balance Sheets as of March 31, 2016 and is accounted for using the equity method of accounting.
3. Short-Term Borrowings The Company completed the closing of a five-year revolving credit facility (“Revolver”) on July 20, 2011. During 2016, the Company exercised $75.0 million for the in-season facility and $100.0 million for the off-season facility of the remaining $150.0 million accordion feature of its existing revolving credit facility pursuant to the Second Amended and Restated Loan and Security Agreement dated July 20, 2011. Maximum borrowings under the Revolver total $400.0 million from April through July and $475.0 million from August through March. The Revolver balance as of March 31, 2016 was $271.6 million and is included in Current Portion of Long-Term Debt in the accompanying Consolidated Balance Sheet due to the Revolver’s July 20, 2016 maturity, with a weighted average interest rate of 1.95% (LIBOR plus a spread). The Revolver is secured by accounts receivable and inventories with a carrying value of $644.6 million. The Company had $13.2 million and $11.0 million of outstanding standby letters of credit as of March 31, 2016 and 2015, respectively, which reduces borrowing availability under the Revolver. See Note 4, Long-Term Debt, for additional comments related to the Revolver.
The Company is in the process of negotiating a replacement line of credit that is expected to be in place prior to the maturity of the existing Revolver. Although subject to change, the agreement being negotiated provides for a five-year term, a $400.0 million facility amount that is seasonally adjusted to $500.0 million, and interest based upon LIBOR-based spread. Closing of this new credit facility is subject to normal and customary documentation and closing conditions.
During 2016 and 2015, the Company entered into some interim lease notes which financed down payments for various equipment orders at market rates. As of March 31, 2016, these interim notes had not been converted into operating leases since the equipment was not yet delivered. These notes, which total $0.4 million and $9.9 million as of March 31, 2016 and 2015, respectively, are included in notes payable in the accompanying Consolidated Balance Sheets. These notes are expected to be converted into operating leases within the next twelve months. Until then, they bear interest at an annual rate of 1.94% in 2016 and 1.67% in 2015.
23
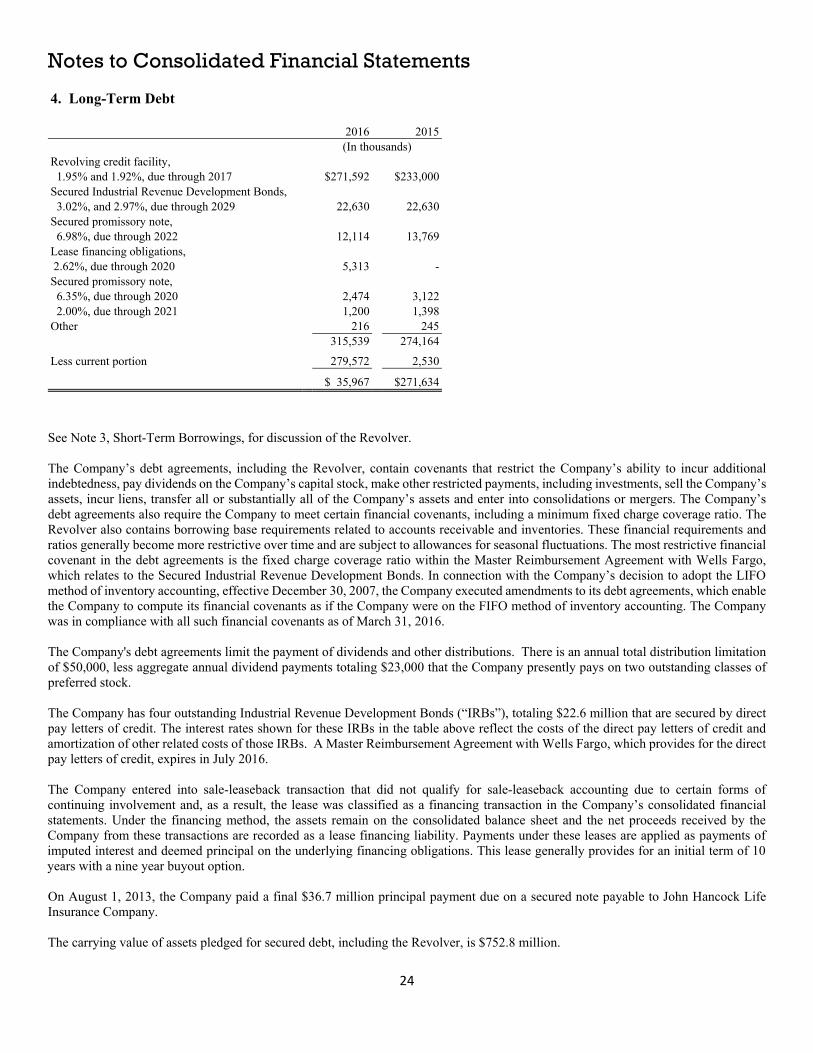
Notes to Consolidated Financial Statements
4. Long-Term Debt
2016 2015(In thousands)
Revolving credit facility,1.95% and 1.92%, due through 2017 $271,592 $233,000
Secured Industrial Revenue Development Bonds, 3.02%, and 2.97%, due through 2029 22,630 22,630
Secured promissory note,6.98%, due through 2022 12,114 13,769
Lease financing obligations,2.62%, due through 2020 5,313 -
Secured promissory note,6.35%, due through 2020 2,474 3,1222.00%, due through 2021 1,200 1,398
Other 216 245315,539 274,164
Less current portion 279,572 2,530
$ 35,967 $271,634
See Note 3, Short-Term Borrowings, for discussion of the Revolver.
The Company’s debt agreements, including the Revolver, contain covenants that restrict the Company’s ability to incur additionalindebtedness, pay dividends on the Company’s capital stock, make other restricted payments, including investments, sell the Company’sassets, incur liens, transfer all or substantially all of the Company’s assets and enter into consolidations or mergers. The Company’sdebt agreements also require the Company to meet certain financial covenants, including a minimum fixed charge coverage ratio. TheRevolver also contains borrowing base requirements related to accounts receivable and inventories. These financial requirements andratios generally become more restrictive over time and are subject to allowances for seasonal fluctuations. The most restrictive financialcovenant in the debt agreements is the fixed charge coverage ratio within the Master Reimbursement Agreement with Wells Fargo,which relates to the Secured Industrial Revenue Development Bonds. In connection with the Company’s decision to adopt the LIFOmethod of inventory accounting, effective December 30, 2007, the Company executed amendments to its debt agreements, which enablethe Company to compute its financial covenants as if the Company were on the FIFO method of inventory accounting. The Companywas in compliance with all such financial covenants as of March 31, 2016.
The Company's debt agreements limit the payment of dividends and other distributions. There is an annual total distribution limitationof $50,000, less aggregate annual dividend payments totaling $23,000 that the Company presently pays on two outstanding classes ofpreferred stock.
The Company has four outstanding Industrial Revenue Development Bonds (“IRBs”), totaling $22.6 million that are secured by directpay letters of credit. The interest rates shown for these IRBs in the table above reflect the costs of the direct pay letters of credit andamortization of other related costs of those IRBs. A Master Reimbursement Agreement with Wells Fargo, which provides for the directpay letters of credit, expires in July 2016.
The Company entered into sale-leaseback transaction that did not qualify for sale-leaseback accounting due to certain forms ofcontinuing involvement and, as a result, the lease was classified as a financing transaction in the Company’s consolidated financialstatements. Under the financing method, the assets remain on the consolidated balance sheet and the net proceeds received by theCompany from these transactions are recorded as a lease financing liability. Payments under these leases are applied as payments ofimputed interest and deemed principal on the underlying financing obligations. This lease generally provides for an initial term of 10years with a nine year buyout option.
On August 1, 2013, the Company paid a final $36.7 million principal payment due on a secured note payable to John Hancock LifeInsurance Company.
The carrying value of assets pledged for secured debt, including the Revolver, is $752.8 million.
24

Notes to Consolidated Financial Statements
Debt repayment requirements for the next five fiscal years are (in thousands): Years ending March 31: 2017 $279,572 2018 7,904 2019 3,034 2020 2,531 2021 7,019 Thereafter 15,479
Total $315,539
5. Leases The Company had a new capital lease in fiscal 2016 and no capital leases as of March 31, 2015. The new capital lease is a building lease that bears an interest rate of 5.2%. The cost is $5.3 million and the accumulated amortization is $0.1 million. Leased assets under capital leases consist of the following: 2016 2015 Land $ - $ - Buildings 5,313 - Equipment - - 5,313 - Less accumulated amortization 89 - $5,224 $ - The Company has operating leases expiring at various dates through 2030. Operating leases generally provide for early purchase options one year prior to expiration.
The following is a schedule, by year, of minimum operating and capital lease payments due as of March 31, 2016 (in thousands):
Years ending March 31: Operating Capital 2017 $ 43,392 $ 507 2018 38,649 507 2019 33,746 507 2020 28,784 507 2021 22,379 507 2022-2030 28,918 4,943 Total minimum payment required $195,868 $7,478 Less interest 2,247 Present value of minimum lease payments 5,231 Amount due within one year 243 Long-term capital lease obligation $4,988 Lease expense in fiscal 2016, 2015 and 2014 was $51.4 million, $49.6 million and $43.9 million, respectively.
25

Notes to Consolidated Financial Statements
6. Income Taxes The Company files a consolidated federal and various state income tax returns. The provision for income taxes is as follows: 2016 2015 2014 (In thousands) Current: Federal $24,579 $4,380 $7,238 State 1,953 453 123 26,532 4,833 7,361 Deferred: Federal (689) (925) (3,231) State 156 313 (567) (533) (612) (3,798) Total income taxes $25,999 $4,221 $ 3,563
A reconciliation of the expected U.S. statutory rate to the effective rate follows: 2016 2015 2014 Computed (expected tax rate) 35.0 % 35.0 % 35.0 % State income taxes (net of federal tax benefit) 2.7 2.9 3.4 State tax credits (0.9) (8.7) (1.6) Federal credits (0.4) (2.4) (3.6) Manufacturer’s deduction (3.9) (5.0) (4.6) (Reversal of) addition to uncertain tax positions 0.2 (1.0) (0.8) State VDA/Nexus Changes - - (1.7) Other permanent differences not deductible (0.2) 0.7 0.5 Change in valuation allowance 0.1 9.9 (2.1) Tax effect of pension contribution - - 0.4 Other (0.3) (1.5) (4.4) Effective income tax rate 32.3 % 29.9 % 20.5 % The effective tax rate was 32.3% in 2016 and 29.9% in 2015. Of the 2.4 percentage point increase in the effective tax rate for the year, the major contributor to this increase is with the federal credits for Research and Development, Work Opportunity Tax Credit and fuel. These credits are largely fixed and with the significant increase in pre-tax earnings for 2016, these credits are a smaller percentage of pre-tax earnings in comparison to 2015. This accounts for 2.0 percent of the increase.
The following is a summary of the significant components of the Company's deferred income tax assets and liabilities as of March 31:
2016 2015 (In thousands) Deferred income tax assets: Future tax credits $ 3,807 $ 4,021 Inventory valuation - 2,348 Employee benefits 3,174 3,009 Insurance 881 816 Other comprehensive loss 18,154 20,335 Interest 21 46 Prepaid revenue 571 701 Other 2,804 1,364 Pension - 1,372 Severance 3 256 29,415 34,268 Deferred income tax liabilities: Property basis and depreciation difference 9,330 9,129 481(a) adjustment 880 1,281 Inventory valuation 1,247 - Intangibles 235 - Earnings from equity investment 69 245 Pension 2,896 - 14,657 10,655 Valuation allowance - non-current 1,861 1,787 Net deferred income tax asset $12,897 $21,826
26
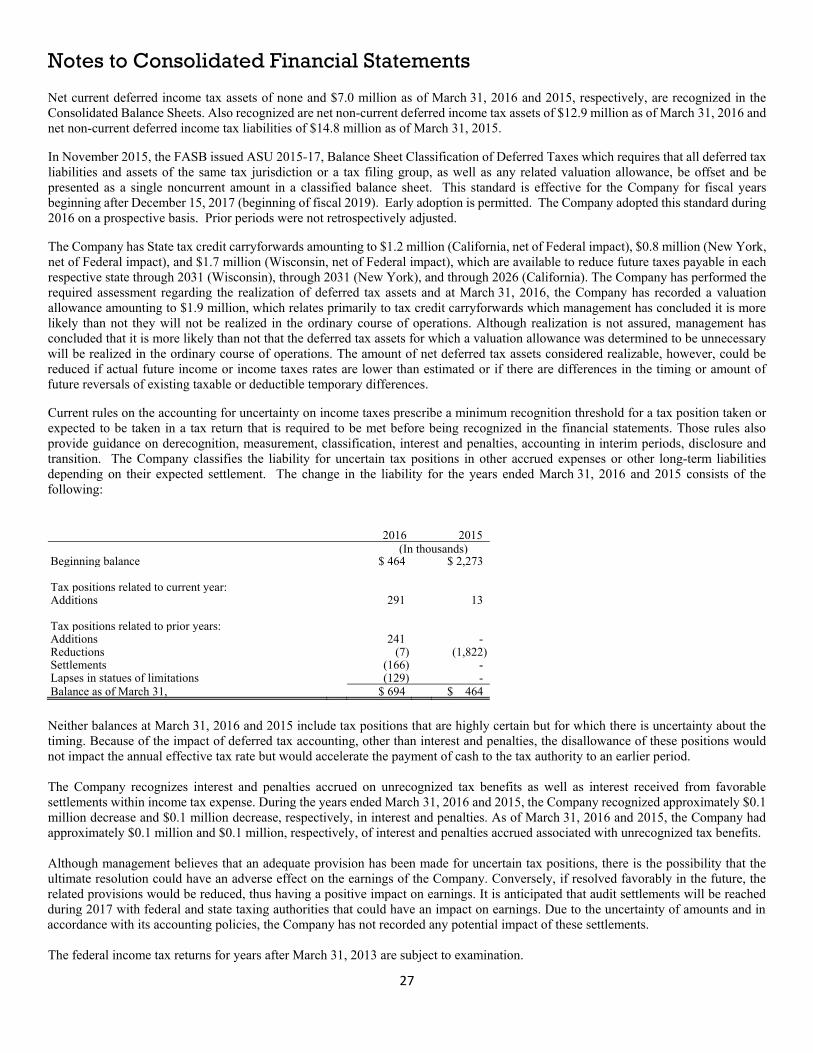
Notes to Consolidated Financial Statements
Net current deferred income tax assets of none and $7.0 million as of March 31, 2016 and 2015, respectively, are recognized in theConsolidated Balance Sheets. Also recognized are net non-current deferred income tax assets of $12.9 million as of March 31, 2016 andnet non-current deferred income tax liabilities of $14.8 million as of March 31, 2015.
In November 2015, the FASB issued ASU 2015-17, Balance Sheet Classification of Deferred Taxes which requires that all deferred taxliabilities and assets of the same tax jurisdiction or a tax filing group, as well as any related valuation allowance, be offset and bepresented as a single noncurrent amount in a classified balance sheet. This standard is effective for the Company for fiscal yearsbeginning after December 15, 2017 (beginning of fiscal 2019). Early adoption is permitted. The Company adopted this standard during2016 on a prospective basis. Prior periods were not retrospectively adjusted.
The Company has State tax credit carryforwards amounting to $1.2 million (California, net of Federal impact), $0.8 million (New York,net of Federal impact), and $1.7 million (Wisconsin, net of Federal impact), which are available to reduce future taxes payable in eachrespective state through 2031 (Wisconsin), through 2031 (New York), and through 2026 (California). The Company has performed therequired assessment regarding the realization of deferred tax assets and at March 31, 2016, the Company has recorded a valuationallowance amounting to $1.9 million, which relates primarily to tax credit carryforwards which management has concluded it is morelikely than not they will not be realized in the ordinary course of operations. Although realization is not assured, management hasconcluded that it is more likely than not that the deferred tax assets for which a valuation allowance was determined to be unnecessarywill be realized in the ordinary course of operations. The amount of net deferred tax assets considered realizable, however, could bereduced if actual future income or income taxes rates are lower than estimated or if there are differences in the timing or amount offuture reversals of existing taxable or deductible temporary differences.
Current rules on the accounting for uncertainty on income taxes prescribe a minimum recognition threshold for a tax position taken orexpected to be taken in a tax return that is required to be met before being recognized in the financial statements. Those rules alsoprovide guidance on derecognition, measurement, classification, interest and penalties, accounting in interim periods, disclosure andtransition. The Company classifies the liability for uncertain tax positions in other accrued expenses or other long-term liabilitiesdepending on their expected settlement. The change in the liability for the years ended March 31, 2016 and 2015 consists of thefollowing:
2016 2015 (In thousands)
Beginning balance $ 464 $ 2,273
Tax positions related to current year:Additions 291 13
Tax positions related to prior years:Additions 241 -Reductions (7) (1,822)Settlements (166) -Lapses in statues of limitations (129) -Balance as of March 31, $ 694 $ 464 Neither balances at March 31, 2016 and 2015 include tax positions that are highly certain but for which there is uncertainty about thetiming. Because of the impact of deferred tax accounting, other than interest and penalties, the disallowance of these positions wouldnot impact the annual effective tax rate but would accelerate the payment of cash to the tax authority to an earlier period.
The Company recognizes interest and penalties accrued on unrecognized tax benefits as well as interest received from favorablesettlements within income tax expense. During the years ended March 31, 2016 and 2015, the Company recognized approximately $0.1million decrease and $0.1 million decrease, respectively, in interest and penalties. As of March 31, 2016 and 2015, the Company hadapproximately $0.1 million and $0.1 million, respectively, of interest and penalties accrued associated with unrecognized tax benefits.
Although management believes that an adequate provision has been made for uncertain tax positions, there is the possibility that theultimate resolution could have an adverse effect on the earnings of the Company. Conversely, if resolved favorably in the future, therelated provisions would be reduced, thus having a positive impact on earnings. It is anticipated that audit settlements will be reachedduring 2017 with federal and state taxing authorities that could have an impact on earnings. Due to the uncertainty of amounts and inaccordance with its accounting policies, the Company has not recorded any potential impact of these settlements.
The federal income tax returns for years after March 31, 2013 are subject to examination.
27

Notes to Consolidated Financial Statements
7. Stockholders’ Equity
Preferred Stock — The Company has authorized three classes of preferred stock consisting of 200,000 shares of Six Percent (6%)Voting Cumulative Preferred Stock, par value $0.25 (“6% Preferred”); 30,000 shares of Preferred Stock Without Par Value to be issuedin series by the Board of Directors, none of which are currently designated or outstanding; and 8,200,000 shares of Preferred Stock with$.025 par value, Class A, to be issued in series by the Board of Directors (“Class A Preferred”). The Board of Directors has designatedfour series of Class A Preferred including 10% Cumulative Convertible Voting Preferred Stock—Series A (“Series A Preferred”); 10%Cumulative Convertible Voting Preferred Stock—Series B (“Series B Preferred”); Convertible Participating Preferred Stock; andConvertible Participating Preferred Stock, Series 2003.
The Convertible Participating Preferred Stock and Convertible Participating Preferred Stock, Series 2003 are convertible at the holders’option on a one-for-one basis into shares of Class A Common Stock, subject to antidilution adjustments. These series of preferred stockhave the right to receive dividends and distributions at a rate equal to the amount of any dividends and distributions declared or madeon the Class A Common Stock. No dividends were declared or paid on this preferred stock in fiscal 2016, 2015 or 2014. In addition,these series of preferred stock have certain distribution rights upon liquidation. Upon conversion, shares of these series of preferredstock become authorized but unissued shares of Class A Preferred and may be reissued as part of another series of Class A Preferred.As of March 31, 2016, the Company has an aggregate of 6,708,674 shares of non-designated Class A Preferred authorized for issuance.
The Convertible Participating Preferred Stock has a liquidation preference of $12 per share and a stated value of $11.931 per share. There were 90,826 shares outstanding as of March 31, 2016 after conversions of no shares into Class A Common Stock during the year.The Convertible Participating Preferred Stock, Series 2003 was issued as partial consideration of the purchase price in the ChiquitaProcessed Foods acquisition. The 967,742 shares issued in that 2003 acquisition were valued at $16.60 per share which represented thethen market value of the Class A Common Stock into which the preferred shares were immediately convertible. This series has aliquidation preference of $15.50 per share and has 500 shares outstanding as of March 31, 2016 after conversion of 50,000 shares intoClass A Common Stock during the year.
There are 407,240 shares of Series A Preferred outstanding as of March 31, 2016 which are convertible into one share of Class ACommon Stock and one share of Class B Common stock for every 20 shares of Series A Preferred. There are 400,000 shares of Series BPreferred outstanding as of March 31, 2016 which are convertible into one share of Class A Common Stock and one share of Class BCommon Stock for every 30 shares of Series B preferred. There are 200,000 shares of 6% Preferred outstanding as of March 31, 2016which are callable at their par value at any time at the option of the Company. The Company paid dividends of $20,000 on the Series Aand Series B Preferred and $3,000 on the 6% Preferred during each of fiscal 2016, 2015 and 2014.
Common Stock — The Class A Common Stock and the Class B Common Stock have substantially identical rights with respect to anydividends or distributions of cash or property declared on shares of common stock, and rank equally as to the right to receive proceedson liquidation or dissolution of the Company after payment of the Company’s indebtedness and liquidation right to the holders ofpreferred shares. However, holders of Class B Common Stock retain a full vote per share, whereas the holders of Class A CommonStock have voting rights of 1/20th of one vote per share on all matters as to which shareholders of the Company are entitled to vote.During 2016, there were no shares of Class B Common Stock issued in lieu of cash compensation under the Company's Profit SharingBonus Plan.
Unissued shares of common stock reserved for conversion privileges of designated non-participating preferred stock were 33,695 ofboth Class A and Class B as of March 31, 2016 and 2015. Additionally, there were 91,326 and 141,326 shares of Class A reserved forconversion of the Participating Preferred Stock as of March 31, 2016 and 2015, respectively.
Treasury Stock — During 2016, the Company repurchased $2.6 million, or 90,500 shares of its Class A Common Stock and $2.6million, or 73,459 shares of its Class B Common Stock. As of March 31, 2016, there is a total of $65.7 million, or 2,281,550 shares, ofrepurchased stock. These shares are not considered outstanding. The Company contributed $1.8 million or 64,254 treasury shares forthe 401(k) match in 2016 as described in Note 8, Retirement Plans.
28

Notes to Consolidated Financial Statements
8. Retirement Plans The Company has a noncontributory defined benefit pension plan (the “Plan”) covering all employees who meet certain age-entry requirements and work a stated minimum number of hours per year. Annual contributions are made to the Plan sufficient to satisfy legal funding requirements. The following tables provide a reconciliation of the changes in the Plan’s benefit obligation and fair value of plan assets over the two-year period ended March 31, 2016 and a statement of the unfunded status as of March 31, 2016 and 2015: 2016 2015 (In thousands) Change in Benefit Obligation Benefit obligation at beginning of year $212,908 $170,478 Service cost 10,502 8,515 Interest cost 8,902 8,236 Plan amendments - 952 Actuarial (gain) loss (11,340) 30,556 Benefit payments and expenses (6,936) (5,829) Benefit obligation at end of year $214,036 $212,908 Change in Plan Assets Fair value of plan assets at beginning of year $157,948 $154,650 Actual gain on plan assets 2,126 8,777 Employer contributions 23,100 350 Benefit payments and expenses (6,936) (5,829) Fair value of plan assets at end of year $176,238 $157,948 Unfunded Status $ (37,798) $ (54,960) The unfunded status decreased by $17.2 million during 2016 reflecting the actual fair value of plan assets and the projected benefit obligation as of March 31, 2016. This unfunded status reduction was recognized via the actual gain on plan assets and the decrease in accumulated other comprehensive loss of $3.5 million after the income tax benefit of $2.2 million. The increase in projected benefit obligation was a function of using the full yield curve approach, an increase in the discount rate from 4.15% to 4.36% and the change to using an updated mortality table. During 2016, the Company converted to the 2006 base rates from the RP-2014 mortality study with the Blue Collar adjustment, with a generational projection of future mortality improvements from 2006 using Scale MP-2015 for calculating the pension obligation in 2016 and the related pension expense in 2017. Effective March 31, 2016, the Company elected to change the approach used to calculate the service and interest cost components of the net periodic benefit cost for it pension and postretirement benefit plans to provide a more precise measurement of service and interest costs. Historically the Company calculated the service and interest cost components utilizing a single weighted-average discount rate derived from the yield curve used to measure the benefit obligation at the beginning of the period. Going forward the new estimate utilizes a full yield curve approach in the estimation of these components by applying the specific spot rates along the yield curve used in determination of the benefit obligation to their underlying projected cash flows. The change does not affect the measurement of pension and postretirement obligations and is accounted for as a change in accounting estimate, which is applied prospectively.
Plan assets increased from $157.9 million as of March 31, 2015 to $176.2 million as of March 31, 2016 due to a continued recovery in market conditions and the $23.1 million contribution by the Company. The Company made this contribution to maintain its funding status at an acceptable level.
29

Notes to Consolidated Financial Statements
2016 2015 (In thousands) Amounts Recognized in Accumulated Other Comprehensive Pre-Tax Loss Prior service cost $ (843) $ (952) Net loss (45,248) (50,883) Accumulated other comprehensive pre-tax loss $(46,091) $(51,835)
Pension and post retirement plan adjustments, net
of tax (In thousands) Accumulated Other Comprehensive Loss Balance at March 31, 2015 $(31,804) Other comprehensive loss before reclassifications 3,408 Reclassified from accumulated other comprehensive loss - Net current period other comprehensive loss 3,408 Balance at March 31, 2016 $(28,396) The following table provides the components of net periodic benefit cost for the Plan for fiscal years 2016, 2015, and 2014: 2016 2015 2014 (In thousands) Service cost $ 10,502 $ 8,515 $ 7,752 Interest cost 8,902 8,236 7,592 Expected return on plan assets (11,685) (11,360) (9,938) Amortization of net loss 3,854 350 2,434 Prior service cost 109 - - Net periodic benefit cost $ 11,682 $ 5,741 $ 7,840 The Plan’s accumulated benefit obligation was $195.3 million at March 31, 2016, and $188.5 million at March 31, 2015. Prior service costs are amortized on a straight-line basis over the average remaining service period of active participants. Gains and losses in excess of 10% of the greater of the benefit obligation and the market-related value of assets are amortized over the average remaining service period of active participants. The assumptions used to measure the Company’s benefit obligation and pension expense are shown in the following table: 2016 2015 Discount rate - projected benefit obligation 4.36 % 4.15 % Discount rate - pension expense 4.15 % 4.85 % Expected return on plan assets 7.25 % 7.25 % Rate of compensation increase 3.00 % 3.00 %
30
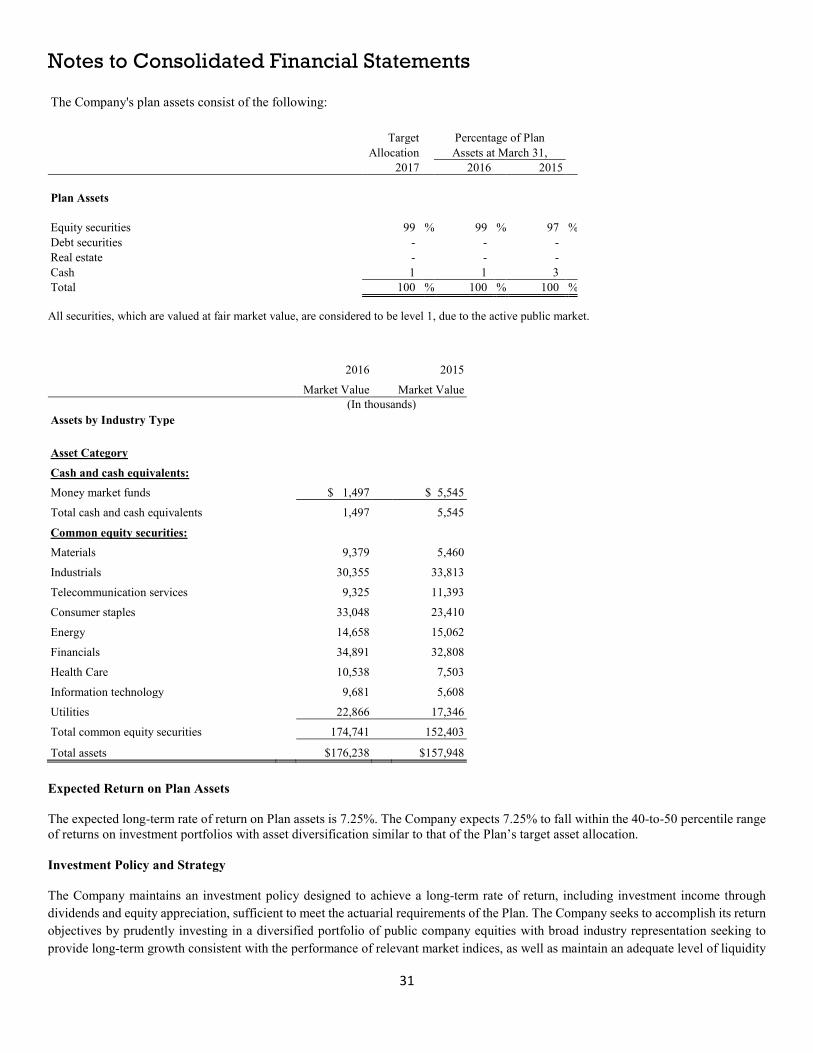
Notes to Consolidated Financial Statements
The Company's plan assets consist of the following: Target Percentage of Plan Allocation Assets at March 31, 2017 2016 2015 Plan Assets Equity securities 99 % 99 % 97 % Debt securities - - - Real estate - - - Cash 1 1 3 Total 100 % 100 % 100 % All securities, which are valued at fair market value, are considered to be level 1, due to the active public market.
2016 2015
Market Value Market Value (In thousands) Assets by Industry Type Asset Category
Cash and cash equivalents:
Money market funds $ 1,497 $ 5,545
Total cash and cash equivalents 1,497 5,545
Common equity securities:
Materials 9,379 5,460
Industrials 30,355 33,813
Telecommunication services 9,325 11,393
Consumer staples 33,048 23,410
Energy 14,658 15,062
Financials 34,891 32,808
Health Care 10,538 7,503
Information technology 9,681 5,608
Utilities 22,866 17,346
Total common equity securities 174,741 152,403
Total assets $176,238 $157,948 Expected Return on Plan Assets The expected long-term rate of return on Plan assets is 7.25%. The Company expects 7.25% to fall within the 40-to-50 percentile range of returns on investment portfolios with asset diversification similar to that of the Plan’s target asset allocation. Investment Policy and Strategy The Company maintains an investment policy designed to achieve a long-term rate of return, including investment income through dividends and equity appreciation, sufficient to meet the actuarial requirements of the Plan. The Company seeks to accomplish its return objectives by prudently investing in a diversified portfolio of public company equities with broad industry representation seeking to provide long-term growth consistent with the performance of relevant market indices, as well as maintain an adequate level of liquidity
31

Notes to Consolidated Financial Statements
for pension distributions as they fall due. The strategy of being fully invested in equities has historically provided greater rates of return over extended periods of time. The Company’s gain on plan assets during 2016 was 1.4% as compared to the S&P 500 unaudited loss (including dividends) of (1.3)%. Plan assets include Company common stock with a fair market value of $18.4 million as of March 31, 2016 and $14.4 million as of March 31, 2015.
Cash Flows Expected contributions for fiscal year ending March 31, 2017 (in thousands): Expected Employer Contributions $ - Expected Employee Contributions - Estimated future benefit payments reflecting expected future service for the fiscal years ending March 31 (in thousands):
2017 $ 6,799 2018 7,394 2019 7,964 2020 8,577 2021 9,324 2022-2024 57,417 401(k) Plans The Company also has employees’ savings 401(k) plans covering all employees who meet certain age-entry requirements and work a stated minimum number of hours per year. Participants may make contributions up to the legal limit. The Company’s matching contributions are discretionary. Costs charged to operations for the Company’s matching contributions amounted to $1.8 million, $2.3 million, and $2.3 million in fiscal 2016, 2015, and 2014, respectively. In fiscal 2016, the matching contribution included $1.8 million of treasury stock. In fiscal 2015, the matching contribution included $2.2 million of treasury stock and $0.1 million of cash match. The stock portion of the matching contribution is valued at current market value while the treasury stock is valued at cost. Multi-employer Plan The Company contributes to the Teamsters California State Council of Cannery and Food Processing Unions, International Brotherhood of Teamsters Pension Fund (Western Conference of Teamsters Pension Plan# 91-6145047/001) ("Teamsters Plan") under the terms of a collective-bargaining agreement with some of its Modesto, California employees. The term of the current collective bargaining agreement is June 1, 2015 through June 30, 2018. For the fiscal years ended March 31, 2016, March 31, 2015 and March 31, 2014, contributions to the Teamsters Plan were $2.5 million, $2.4 million and $2.4 million, respectively. The contributions to this plan are paid monthly based upon the number of hours worked by covered employees. They represent less than 5% of the total contributions received by this plan during the most recent plan year. The risks of participating in multi-employer plans are different from single-employer plans in the following aspects: (a) assets contributed to a multi-employer plan by one employer may be used to provide benefits to employees of other participating employers, (b) if a participating employer stops contributing to the multi-employer plan, the unfunded obligations of the plan may be borne by the remaining participating employers and (c) if the Company chooses to stop participating in the plan, the Company may be required to pay a withdrawal liability based on the underfunded status of the plan. The Teamsters Plan received a Pension Protection Act “green” zone status for the plan year beginning January 1, 2015. The zone status is based on information the Company received from the plan and is certified by the plan’s actuary. Among other factors, plans in the green zone are at least 80 percent funded.
32

Notes to Consolidated Financial Statements
9. Fair Value of Financial Instruments The carrying amount and estimated fair values of the Company's debt are summarized as follows: 2016 2015 Carrying Estimated Carrying Estimated Amount Fair Value Amount Fair Value (In thousands) Long-term debt, including
current portion $315,539 $ $315,478 $274,164 $274,999
Capital leases, including current portion $ 5,231 $ $ 5,076 $ - $ -
The estimated fair value for long-term debt and capital leases is determined by the quoted market prices for similar debt (comparable to the Company’s financial strength) or current rates offered to the Company for debt with the same maturities which is Level 2 from the fair value hierarchy. Since quoted prices for identical instruments in active markets are not available (Level 1), the Company makes use of observable market based inputs to calculate fair value, which is Level 2.
10. Inventories Effective December 30, 2007 (beginning of 4th quarter of Fiscal Year 2008), the Company changed its inventory valuation method from the lower of cost, determined under the FIFO method, or market to the lower of cost, determined under the LIFO method, or market. In the high inflation environment that the Company was experiencing, the Company believed that the LIFO inventory method was preferable over the FIFO method because it better compares the cost of current production to current revenue. The effect of LIFO was to increase net earnings by $16.1 million in 2016, reduce net earnings by $6.9 million in 2015, and reduce net earnings by $13.2 million in 2014, compared to what would have been reported using the FIFO inventory method. The increase in earnings per share was $1.62 ($1.60 diluted) in 2016, reduce earnings per share was $0.64 ($0.63 diluted) in 2015, and reduce earnings per share was $1.19 ($1.19 diluted) in 2014. During 2014, certain inventory quantities accounted for on the LIFO method were reduced, resulting in the liquidation of certain quantities carried at costs prevailing in prior years. The impact on net earnings of these liquidations was no impact in 2016 and 2015, and an increase of $4.8 million during 2014. The inventories by category and the impact of using the LIFO method are shown in the following table: 2016 2015 2014 (In thousands) Finished products $467,337 $414,154 $418,368 In process 25,855 22,651 16,056 Raw materials and supplies 213,790 199,674 170,210 706,982 636,479 604,634 Less excess of FIFO cost over LIFO cost 139,275 164,067 153,384 Total inventories $567,707 $472,412 $451,250 11. Other Operating Income and Expense Other operating income in 2016 included a gain of $24.3 million related to a contractual payment received in conjunction with a relationship transfer agreement with General Mills. The Company reversed a provision for the Prop 65 litigation of $0.2 million and reduced an environmental accrual by $0.1 million. The Company also recorded a gain of $0.4 million from the sale of other fixed assets. Other operating income in 2015 included a gain of $5.0 million related to a contractual payment received in connection with the closing of a Midwest plant and a charge of $0.3 million related to environmental costs related to a Company-owned plant in New York State. The Company also recorded a net gain of $0.1 million from the sale of other fixed assets.
Other operating income in 2014 included a gain of $2.9 million from a break-up fee earned as a result of the Company being named the stalking horse bidder in an attempt to acquire substantially all the operating assets of Allens, Inc. in a bankruptcy court supervised auction, a gain of $0.7 million from the sale of two aircraft and a gain of $0.1 million as a result of adjustments related to the purchase
33

Notes to Consolidated Financial Statements
of the Sunnyside facility. The Company also recorded a loss of $0.5 million on the disposal of a warehouse located in Sunnyside, Washington and a net gain of $0.2 million from the sale of other fixed assets.
12. Segment Information The Company manages its business on the basis of two reportable segments — the primary segment is the packaging and sale of fruits and vegetables and secondarily, the packaging and sale of snack products and finally, other products. The Company markets its product almost entirely in the United States. Export sales represented 8.5%, 9.0%, and 9.2% of total sales in 2016, 2015, and 2014, respectively. In 2016, 2015, and 2014, the sale of Green Giant vegetables accounted for 11%, 13%, and 13% of net sales, respectively. “Other” in the table below represents activity related to can sales, trucking, seed sales, and flight operations. Fruit and Vegetable Snack Other Total (In thousands) 2016: Net sales $1,239,179 $12,336 $23,845 $1,275,360 Operating income 87,120 1,164 265 88,549 Interest expense, net 7,923 18 103 8,044 Income tax expense 25,551 372 76 25,999 Identifiable assets 888,968 2,697 3,662 895,327 Capital expenditures 9,232 52 682 9,966 Depreciation and amortization 20,438 351 948 21,737 2015: Net sales $1,246,115 $11,667 $28,568 $1,286,350 Operating income 18,865 779 710 20,354 Interest expense, net 6,778 12 72 6,862 Income tax expense 3,775 225 221 4,221 Identifiable assets 798,640 3,235 4,573 806,448 Capital expenditures 22,177 157 1,400 23,734 Depreciation and amortization 20,445 367 1,022 21,834 2014: Net sales $1,302,857 $11,496 $25,855 $1,340,208 Operating income 22,365 872 1,669 24,906 Interest expense, net 7,415 27 122 7,564 Income tax expense 3,118 189 256 3,563 Identifiable assets 761,078 3,770 4,005 768,853 Capital expenditures 17,339 - 2,109 19,448 Depreciation and amortization 21,842 394 1,045 23,281 The fruit and vegetable segment, consisting of Green Giant, canned fruit and vegetables and frozen products, represented 99%, 99% and 99% of assets and 100%, 102% and 93% of pre-tax earnings in 2016, 2015 and 2014, respectively.
Classes of similar products/services: 2016 2015 2014 (In thousands) Net Sales: Green Giant * $ 144,310 $ 161,993 $ 177,881 Canned vegetables 746,501 754,556 753,318 Frozen 94,710 94,648 107,109 Fruit 253,658 234,918 264,549 Snack 12,336 11,667 11,496 Other 23,845 28,568 25,855 Total $1,275,360 $1,286,350 $1,340,208 * Green Giant includes canned and frozen vegetables exclusively for GMOL or B&G Foods.
34

Notes to Consolidated Financial Statements
13. Legal Proceedings and Other Contingencies In the ordinary course of its business, the Company is made a party to certain legal proceedings seeking monetary damages, including proceedings involving product liability claims, workers’ compensation along with other employee claims, tort and other general liability claims, for which it carries insurance, as well as patent infringement and related litigation. The Company is in a highly regulated industry and is also periodically involved in government actions for regulatory violations and other matters surrounding the manufacturing of its products, including, but not limited to, environmental, employee, and product safety issues. While it is not feasible to predict or determine the ultimate outcome of these matters, the Company does not believe that an adverse decision in any of these legal proceedings would have a material adverse impact on its financial position, results of operations, or cash flows.
In June 2010, the Company received a Notice of Violation of the California Safe Drinking Water and Toxic Enforcement Act of 1986, commonly known as Proposition 65, from the Environmental Law Foundation ("ELF"). This notice was made to the California Attorney General and various other government officials, and to 49 companies including Seneca Foods Corporation whom ELF alleges manufactured, distributed or sold packaged peaches, pears, fruit cocktail and fruit juice that contain lead without providing a clear and reasonable warning to consumers. Under California law, proper notice must be made to the State and involved firms at least 60 days before any suit under Proposition 65 may be filed by private litigants like ELF. That 60-day period has expired and to date neither the California Attorney General nor any appropriate district attorney or city attorney has initiated an action against the Company. However, private litigant ELF filed an action against the Company and 27 other named companies on September 28, 2011, in Superior Court of Alameda County, California, alleging violations of Proposition 65 and seeking various measures of relief, including injunctive and declaratory relief and civil penalties. The Company, along with the other named companies, vigorously defended the claim. A responsive answer was filed, the discovery process was completed and a trial on liability was held beginning in April of 2013 in accordance with court schedules. The trial was completed on May 16, 2013 and, on July 15, 2013 the judge issued a tentative and proposed statement of decision agreeing with the Company, and the other defendants, that the “safe harbor” defense had been met under the regulations relating to Proposition 65 and the Company will not be required to place a Proposition 65 warning label on the products at issue in the case. The trial decision was finalized and the decision was appealed by ELF with a filing dated October 3, 2013. The California Court of Appeal, First Appellate District, Division One unanimously rejected the appeal by ELF in a decision dated March 17, 2015. ELF filed a petition for review with the California Supreme Court on April 28, 2015, and the petition was denied on July 8, 2015. With the successful defense of the case, the remedies portion of the case was not litigated and the denial of review by the California Supreme Court ended the action. Our portion of legal fees in defense of this action have been sizable, as would be expected with litigation resulting in trial, and the appeal, but have not had a material adverse impact on the Company’s financial position, results of operations, or cash flows.
35

Notes to Consolidated Financial Statements
14. Plant Restructuring
During 2016, the Company recorded a restructuring charge of $10.4 million related to the closing of a plant in the Northwest of which $0.2 million was related to severance cost, $5.1 million was related to asset impairments (contra fixed assets), and $5.1 million was related to other costs ($3.6 related to operating lease costs). During 2016, the Company reduced the costs of the plant closing in the Midwest, started in 2015, by $0.1 million, mostly related to severance costs. In accounting for the closing of the facility in the Northwest, the Company reevaluated the treatment for one of its operating leases at the closed facility and determined the transaction should have originally been recorded as a lease financing liability. The Company performed an analysis of the error as to the impact on the Consolidated Balance Sheets and Statement of Net Earnings in each of the previous years it was unrecorded in accordance with SEC Staff Accounting Bulletin No. 99. Based on this analysis, the Company determined that the impact was not material to the consolidated financial statements and no prior periods were adjusted. The Company adjusted the financial statements as of March 31, 2016 by recording a finance lease asset of $5.6 million and lease financing liability of $5.3 million. See Note 4 for the lease finance obligation.
During 2015, the Company recorded a restructuring charge of $1.4 million related to the closing of a plant in the Midwest and the realignment of two other plants, one in the Midwest and the other in the Northwest, of which $0.8 million was related to severance cost, $0.3 million was related to equipment costs (contra fixed assets), and $0.3 million was related to equipment relocation costs.
During 2013, the Company implemented a product rationalization program and recorded a restructuring charge of $3.5 million for related equipment costs (contra fixed assets), lease impairment costs (net of realizable value), and certain inventory costs. During 2014, the Company adjusted the costs of the product rationalization program, started in 2013, by $0.5 million, mostly related to equipment costs.
The following table summarizes the restructuring and related asset impairment charges recorded and the accruals established during 2014, 2015 and 2016: Long-Lived Asset Other Severance Charges Costs Total (In thousands) Balance March 31, 2013 $ 20 $ 1,174 $ 307 $ 1,501 Charge to expense - 341 160 501 Cash payments/write offs (10) (1,515) (467) (1,992) Balance March 31, 2014 10 - - 10 Charge to expense 842 264 270 1,376 Cash payments/write offs (137) - - (137) Balance March 31, 2015 715 264 270 1,249 Charge to expense 162 5,065 5,075 10,302 Cash payments/write offs (877) (354) (1,448) (2,679) Balance March 31, 2016 $ - $ 4,975 $ 3,897 $ 8,872 15. Related Party Transactions A small percentage (less than 1% in fiscal 2016, 2015 and 2014) of vegetables supplied to the Company’s New York packaging plants are grown by a director of Seneca Foods Corporation, which supplied the Company approximately $1.0 million, $0.8 million, and $1.1 million pursuant to a raw vegetable grower contract in fiscal 2016, 2015 and 2014, respectively. The Chairman of the Audit Committee reviewed the relationship and determined that the contract was negotiated at arm's length and on no more favorable terms than to other growers in the marketplace.
16. Assets Held For Sale
On April 23, 2016, the Company entered into a listing agreement to sell one of the Company’s northwest processing facilities. The Company expects this facility to be sold within the next 12 months. In conjunction with this potential sale, the assets held for sale at March 31, 2016, which are property, plant and equipment, total $5.0 million which represented 0.6% of total assets on the Consolidated Balance Sheet.
36

Report of Independent Registered Public Accounting Firm
Board of Directors and Stockholders Seneca Foods Corporation Marion, New York
We have audited the accompanying consolidated balance sheets of Seneca Foods Corporation as of March 31, 2016 and 2015 and the related consolidated statements of net earnings, comprehensive income (loss), stockholders’ equity, and cash flows for each of the three years in the period ended March 31, 2016. These financial statements are the responsibility of the Company’s management. Our responsibility is to express an opinion on these financial statements based on our audits.
We conducted our audits in accordance with the standards of the Public Company Accounting Oversight Board (United States). Those standards require that we plan and perform the audit to obtain reasonable assurance about whether the financial statements are free of material misstatement. An audit includes examining, on a test basis, evidence supporting the amounts and disclosures in the financial statements, assessing the accounting principles used and significant estimates made by management, as well as evaluating the overall financial statement presentation. We believe that our audits provide a reasonable basis for our opinion.
In our opinion, the consolidated financial statements referred to above present fairly, in all material respects, the financial position of Seneca Foods Corporation at March 31, 2016 and 2015, and the results of its operations and its cash flows for each of the three years in the period ended March 31, 2016 in conformity with accounting principles generally accepted in the United States of America.
We also have audited, in accordance with the standards of the Public Company Accounting Oversight Board (United States), Seneca Foods Corporation’s internal control over financial reporting as of March 31, 2016, based on criteria established in Internal Control — Integrated Framework (2013) issued by the Committee of Sponsoring Organizations of the Treadway Commission (COSO) and our report dated June 8, 2016 expressed an unqualified opinion thereon.
Milwaukee, Wisconsin June 8, 2016
37
Management's Annual Report on Internal Control Over Financial Reporting Our management is responsible for establishing and maintaining adequate internal control over the Company’s financial reporting (as defined in Rules 13a-15(f) and 15d-15(f) under the Exchange Act). Because of its inherent limitations, internal control over financial reporting may not prevent or detect all misstatements. Projections of any evaluation of effectiveness to future periods are subject to the risk that controls may become inadequate because of changes in conditions, or that the degree of compliance with the policies or procedures may deteriorate.
Our management assessed the effectiveness of the Company’s internal control over financial reporting as of March 31, 2016. In making this assessment, our management used the criteria set forth by the Committee of Sponsoring Organizations of the Treadway Commission (COSO) in Internal Control-Integrated Framework (2013). Based on our assessment, management believes that, as of March 31, 2016, our internal control over financial reporting is effective based on those criteria. In conducting the Company’s evaluation of the effectiveness of its internal control over financial reporting, the Company excluded the acquisitions of Gray & Company (Gray) and Diana Fruit Co., Inc. (Diana) which were completed October 30, 2015 and February 16, 2016, respectively. Gray constituted 4.0% of total assets and Diana constituted 1.9% of total assets, respectively, as of March 31, 2016, and Gray constituted 1.8% and (2.8)% of revenues and net earnings (loss), respectively, and Diana constituted 0.2% and (0.3)% of revenues and net earnings (loss), respectively, for the year then ended March 31, 2016. Refer to Note 2, Acquisitions to the consolidated financial statements for further discussion of the Gray and Diana acquisitions and their impact on the Company’s consolidated financial statements.
The Company’s independent registered public accountant has issued its report on the effectiveness of the Company’s internal control over financial reporting. Their report appears on the next page.
38

Report of Independent Registered Public Accounting Firm on Internal Control Over Financial Reporting
Board of Directors and Stockholders Seneca Foods Corporation Marion, New York
We have audited Seneca Foods Corporation’s internal control over financial reporting as of March 31, 2016, based on criteria established in Internal Control-Integrated Framework (2013) issued by the Committee of Sponsoring Organizations of the Treadway Commission (the COSO criteria). The Company’s management is responsible for maintaining effective internal control over financial reporting and for its assessment of the effectiveness of internal control over financial reporting included in the Form 10-K, Management’s Annual Report on Internal Control Over Financial Reporting. Our responsibility is to express an opinion on the Company’s internal control over financial reporting based on our audit.
We conducted our audit in accordance with the standards of the Public Company Accounting Oversight Board (United States). Those standards require that we plan and perform the audit to obtain reasonable assurance about whether effective internal control over financial reporting was maintained in all material respects. Our audit included obtaining an understanding of internal control over financial reporting, assessing the risk that a material weakness exists, and testing and evaluating the design and operating effectiveness of internal control based on the assessed risk. Our audit also included performing such other procedures as we considered necessary in the circumstances. We believe that our audit provides a reasonable basis for our opinion.
A company’s internal control over financial reporting is a process designed to provide reasonable assurance regarding the reliability of financial reporting and the preparation of financial statements for external purposes in accordance with generally accepted accounting principles. A company’s internal control over financial reporting includes those policies and procedures that (1) pertain to the maintenance of records that, in reasonable detail, accurately and fairly reflect the transactions and dispositions of the assets of the company; (2) provide reasonable assurance that transactions are recorded as necessary to permit preparation of financial statements in accordance with generally accepted accounting principles, and that receipts and expenditures of the company are being made only in accordance with authorizations of management and directors of the company; and (3) provide reasonable assurance regarding prevention or timely detection of unauthorized acquisition, use, or disposition of the company’s assets that could have a material effect on the financial statements.
Because of its inherent limitations, internal control over financial reporting may not prevent or detect misstatements. Also, projections of any evaluation of effectiveness to future periods are subject to the risk that controls may become inadequate because of changes in conditions, or that the degree of compliance with the policies or procedures may deteriorate.
As indicated in the accompanying Item 9A, Management’s Report on Internal Control over Financial Reporting, management’s assessment of and conclusion on the effectiveness of internal control over financial reporting did not include the internal controls of Gray & Company, which was acquired on October 30, 2015, and Diana Fruit Co., Inc., which was acquired on February 16, 2016 and which are included in the consolidated balance sheets of Seneca Foods Corporation as of March 31, 2016, and the related consolidated statements of net earnings, comprehensive income, stockholders’ equity, and cash flows for the year then ended. Gray & Company constituted 4.0% of total assets and Diana Fruit Co., Inc. constituted 1.9% of total assets, respectively, as of March 31, 2016, and Gray & Company constituted 1.8% and (2.8)% of revenues and net earnings (loss), respectively, and Diana Fruit Co., Inc. constituted 0.2% and (0.3)% of revenues and net earnings (loss), respectively, for the year then ended March 31, 2016. Management did not assess the effectiveness of internal control over financial reporting of Gray & Company or Diana Fruit Co., Inc. because of the timing of the acquisitions which was completed on October 30, 2015 and February 16, 2016, respectively. Our audit of internal control over financial reporting of Seneca Foods Corporation also did not include an evaluation of the internal control over financial reporting of Gray & Company and Diana Fruit Co.
In our opinion, the Company maintained, in all material respects, effective internal control over financial reporting as of March 31, 2016, based on the COSO criteria.
We have also audited, in accordance with the standards of the Public Company Accounting Standards Board (United States), the consolidated balance sheets of Seneca Foods Corporation as of March 31, 2016 and 2015, and the related consolidated statements of net earnings, comprehensive income (loss), stockholders’ equity and cash flows for each of the three years in the period ended March 31, 2016 and our report dated June 8, 2016 expressed an unqualified opinion thereon.
Milwaukee, Wisconsin
June 8, 2016
39

Shareholder Information and Quarterly Results
The Company’s common stock is traded on The NASDAQ Global Stock Market. The 8.0 million Class A outstanding shares and 1.9 million Class B outstanding shares are owned by 188 and 192 shareholders of record, respectively. The high and low closing prices of the Company’s common stock during each quarter of the past two years are shown below:
Class A: 2016 2015 Quarter High Low High Low First $31.63 $27.60 $32.65 $27.55 Second 31.09 26.00 31.80 28.08 Third 31.00 25.85 29.99 25.06 Fourth 35.78 26.90 30.08 25.25
Class B: 2016 2015 Quarter High Low High Low First $34.93 $32.00 $35.99 $27.91 Second 43.85 32.00 32.97 30.30 Third 36.00 32.00 33.25 30.40 Fourth 44.88 32.00 41.00 30.50
Common Stock Performance Graph
The graph below shows the cumulative, five year total return for the Company’s Common Stock compared with the NASDAQ Market Total U.S. Return Index (which includes the Company) and a peer group of companies (described below).
Performance data assumes that $100.00 was invested on March 31, 2011, in the Company’s Class A Common Stock, the NASDAQ Market, and the peer group. The data assumes the reinvestment of all cash dividends and the cash value of other distributions. Stock price performance shown in the graph is not necessarily indicative of future stock price performance. The companies in the former peer group are Fresh Del Monte, Hanover Foods Corporation, John B. Sanfilippo & Son Inc., Treehouse Foods, Inc. and Hain Celestial Group, Inc. The new peer group adds B&G Foods Inc. and keeps all the members of the former peer group. The peer group members are in related food businesses, but not necessarily direct competitors in canning.
40

Shareholder Information and Quarterly Results
As of March 31, 2016, the most restrictive credit agreement limitation on the Company’s payment of dividends, to holders of Class A or Class B Common Stock is an annual total limitation of $50,000, reduced by aggregate annual dividend payments totaling $23,000 that the Company presently pays on two outstanding classes of preferred stock. Payment of dividends to common stockholders is made at the discretion of the Company’s Board of Directors and depends, among other factors, on earnings; capital requirements; and the operating and financial condition of the Company. The Company has not declared or paid a common dividend in many years.
Quarterly Results
The following is a summary of the unaudited interim results of operations by quarter:
First Second Third Fourth (In thousands, except per share data)
Year ended March 31, 2016: Net sales $226,258 $313,202 $432,198 $303,702 Gross margin 20,899 29,073 53,382 44,041 Net earnings 2,968 6,522 31,123 13,845 Basic earnings per common share 0.30 0.65 3.12 1.39 Diluted earnings per common share 0.29 0.65 3.10 1.38
Year ended March 31, 2015: Net sales $240,043 $312,161 $456,207 $277,939 Gross margin 17,341 17,133 26,435 23,454 Net (loss) earnings (107) (578) 7,819 2,765 Basic (loss) earnings per common share (0.01) (0.05) 0.72 0.26 Diluted (loss) earnings per common share (0.01) (0.05) 0.71 0.26
Earnings for the fourth quarter have historically reflected adjustments of previously estimated raw material cost and production levels. Due to the dependence on the fruit and vegetable yields of the Company's food packaging, interim costing must be estimated.
41
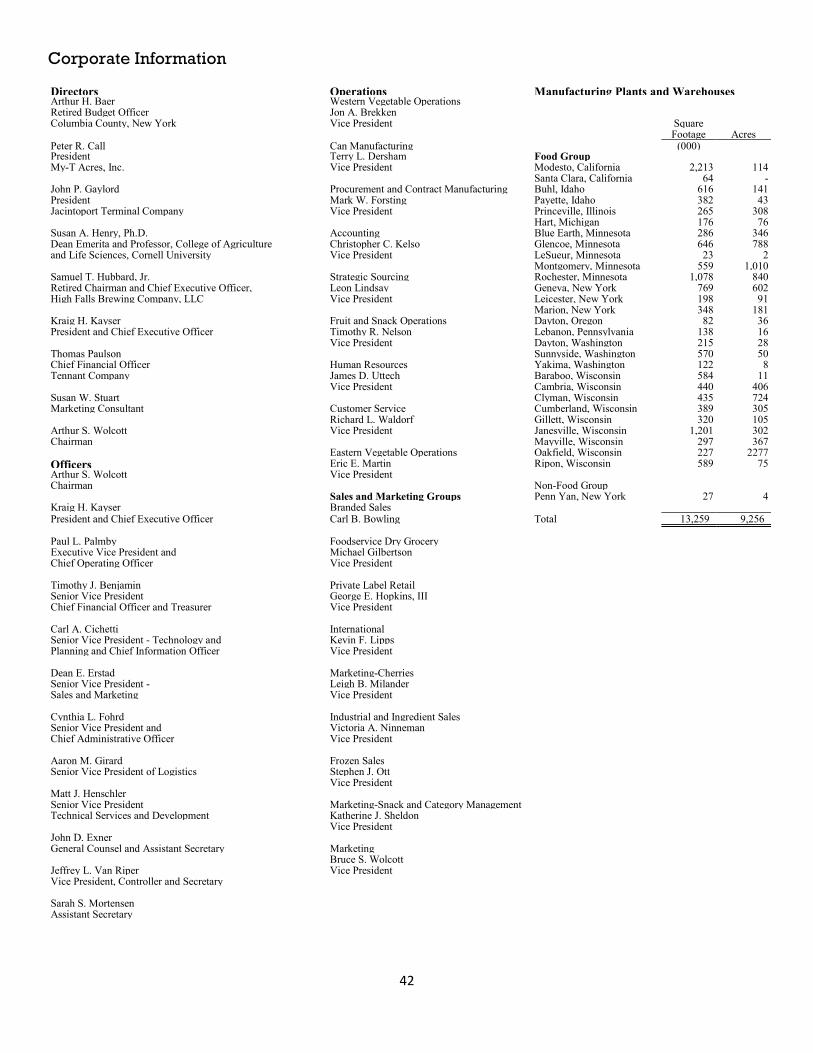
Corporate Information
Directors Operations Manufacturing Plants and Warehouses Arthur H. Baer Western Vegetable Operations Retired Budget Officer Jon A. Brekken Columbia County, New York Vice President Square
Footage Acres Peter R. Call Can Manufacturing (000) President Terry L. Dersham Food Group My-T Acres, Inc. Vice President Modesto, California 2,213 114
Santa Clara, California 64 - John P. Gaylord Procurement and Contract Manufacturing Buhl, Idaho 616 141 President Mark W. Forsting Payette, Idaho 382 43 Jacintoport Terminal Company Vice President Princeville, Illinois 265 308
Hart, Michigan 176 76 Susan A. Henry, Ph.D. Accounting Blue Earth, Minnesota 286 346 Dean Emerita and Professor, College of Agriculture Christopher C. Kelso Glencoe, Minnesota 646 788 and Life Sciences, Cornell University Vice President LeSueur, Minnesota 23 2
Montgomery, Minnesota 559 1,010 Samuel T. Hubbard, Jr. Strategic Sourcing Rochester, Minnesota 1,078 840 Retired Chairman and Chief Executive Officer, Leon Lindsay Geneva, New York 769 602 High Falls Brewing Company, LLC Vice President Leicester, New York 198 91
Marion, New York 348 181 Kraig H. Kayser Fruit and Snack Operations Dayton, Oregon 82 36 President and Chief Executive Officer Timothy R. Nelson Lebanon, Pennsylvania 138 16
Vice President Dayton, Washington 215 28 Thomas Paulson Sunnyside, Washington 570 50 Chief Financial Officer Human Resources Yakima, Washington 122 8 Tennant Company James D. Uttech Baraboo, Wisconsin 584 11
Vice President Cambria, Wisconsin 440 406 Susan W. Stuart Clyman, Wisconsin 435 724 Marketing Consultant Customer Service Cumberland, Wisconsin 389 305
Richard L. Waldorf Gillett, Wisconsin 320 105 Arthur S. Wolcott Vice President Janesville, Wisconsin 1,201 302 Chairman Mayville, Wisconsin 297 367
Eastern Vegetable Operations Oakfield, Wisconsin 227 2277 Officers Eric E. Martin Ripon, Wisconsin 589 75 Arthur S. Wolcott Vice President Chairman Non-Food Group
Sales and Marketing Groups Penn Yan, New York 27 4 Kraig H. Kayser Branded Sales President and Chief Executive Officer Carl B. Bowling Total 13,259 9,256
Paul L. Palmby Foodservice Dry Grocery Executive Vice President and Michael Gilbertson Chief Operating Officer Vice President
Timothy J. Benjamin Private Label Retail Senior Vice President George E. Hopkins, III Chief Financial Officer and Treasurer Vice President
Carl A. Cichetti International Senior Vice President - Technology and Kevin F. Lipps Planning and Chief Information Officer Vice President
Dean E. Erstad Marketing-Cherries Senior Vice President - Leigh B. Milander Sales and Marketing Vice President
Cynthia L. Fohrd Industrial and Ingredient Sales Senior Vice President and Victoria A. Ninneman Chief Administrative Officer Vice President
Aaron M. Girard Frozen Sales Senior Vice President of Logistics Stephen J. Ott
Vice President Matt J. Henschler Senior Vice President Marketing-Snack and Category Management Technical Services and Development Katherine J. Sheldon
Vice President John D. Exner General Counsel and Assistant Secretary Marketing
Bruce S. Wolcott Jeffrey L. Van Riper Vice President Vice President, Controller and Secretary
Sarah S. Mortensen Assistant Secretary
42

Corporate Information
43
Forward Looking Statements Except for the historical information contained herein, the matters discussed in this annual report are forward-looking statements as defined in the Private Securities Litigation Reform Act (PSLRA) of 1995. The Company wishes to take advantage of the “safe harbor” provisions of the PSLRA by cautioning that numerous important factors, which involve risks and uncertainties, including but not limited to economic, competitive, governmental, and technological factors affecting the Company’s operations, markets, products, services and prices, and other factors discussed in the Company’s filings with the Securities and Exchange Commission, in the future, could affect the Company’s actual results and could cause its actual consolidated results to differ materially from those expressed in any forward-looking statement made by, or on behalf of, the Company. Shareholder Information For investor information, including comprehensive earnings releases: http://www.senecafoods.com/investors Annual Meeting The 2016 Annual Meeting of Shareholders will be held on Friday, July 29, 2016, beginning at 12:45 PM (EDT) at the Company’s offices at 3736 South Main Street, Marion, New York. A formal notice of the meeting, together with a proxy statement and proxy form, will be mailed to shareholders of record as of June 17, 2016. How To Reach Us Seneca Foods Corporation 3736 South Main Street Marion, New York 14505 (315) 926-8100 www.senecafoods.com/investors [email protected] Additional Information Annual Report and Other Investor Information A copy of the Company’s Annual Report on Form 10-K for the fiscal year ended March 31, 2016, as filed with the Securities and Exchange Commission, will be provided by the Company to any shareholder who so requests in writing to: Jeffrey L. Van Riper Seneca Foods Corporation 3736 South Main Street Marion, New York 14505 (315) 926-8100 This annual report is also available online at http://www.senecafoods.com/investors Foundation/Contribution Requests Seneca Foods Foundation Cynthia L. Fohrd 3736 South Main Street Marion, New York 14505 (315) 926-8100 [email protected] Independent Registered Public Accounting Firm BDO USA, LLP Milwaukee, Wisconsin General Counsel Bond, Schoeneck & King, PLLC Buffalo, New York Transfer Agent and Registrar Computershare 211 Quality Circle, Suite 210 College Station, TX 77845 (800) 622-6757 (US, Canada, Puerto Rico) (781) 575-4735 (Non-US) www.computershare.com/investor Corporate Governance www.senecafoods.com/investors/corporate-governance Code of Business Ethic www.senecafoods.com/code-ethics Hotline (800) 213-9185

Reserved For Notes
44