final thesis to hard printed (23-08-2014)
TRANSCRIPT
Ghana Technology University College
Graduate School
Coventry University, London
Faculty of Engineering and Computing
MSc in Supply Chain Management
Project:
The relationship between Key Performance Indicators
(KPIs) and Customer Perceived Quality of Service (QoS): A
Case Study of MTN Ghana
Submitted by: Ahmed Abdulai Tijani Dua
(COVSCM0512002)
Project Supervisor: Ing. Yaw Yawson
May, 2014
i

Declaration
This thesis was submitted as part fulfillment for the award of an MSc degree in Supply Chain
Management
The work is the result of my own investigations. All sections of the content and results, which
were obtained from other workers/sources, are fully referenced. I know that cheating and
plagiarism constitute a violation of Ghana Technology University College and Coventry
University regulations and will be dealt with accordingly.
Signed: …………………… Signed:…………………..............
Ahmed Abdulai Tijani Dua ING YAW YAWSON
(Student) (Supervisor)
Date Date
ii

Table of Contents
CHAPTER ONE..........................................................................................................................................1
1. Background of the Study.....................................................................................................................1
1.1. Statement of the Problem.............................................................................................................4
1.2. Research Questions......................................................................................................................5
1.3. Objectives of the study................................................................................................................5
1.4. Significance of the study..............................................................................................................5
1.5. Scope and Limitation...................................................................................................................6
1.6. Company Profile..........................................................................................................................6
1.6.1. About MTN Group..............................................................................................................6
1.7. Organization of Research.............................................................................................................8
CHAPTER TWO.........................................................................................................................................9
2.1. Introduction.................................................................................................................................9
2.2. The Cellular Concept.................................................................................................................10
2.3. Generations of Mobile Networks...............................................................................................10
2.3.1. The Physical Architecture of a Cellular System.................................................................11
2.3.2. Operation of the Cellular System.......................................................................................12
2.3.3. Mobile Unit Initialization:.................................................................................................13
2.4. Service Quality Standards in the Telecom Industry...................................................................14
2.5. Quality of Service Trends in Ghana...........................................................................................17
2.6. Telecom Service Quality Regulation in Ghana..........................................................................18
2.7. Customers Perception of Quality...............................................................................................20
2.8. Measuring Quality of Service (QoS)..........................................................................................21
2.8.1. Service Profit Chain Model................................................................................................22
2.8.2. The SERVQUAL Model....................................................................................................23
2.9. The Five Gaps in the SERVQUAL Model.................................................................................25
2.10. Key Performance Indicators (General Concept)....................................................................26
2.10.1. KPIs in Telecom Industry..................................................................................................28
2.10.2. Measuring KPIs.................................................................................................................30
2.11. Review of Research by Nimako et al, 2010...........................................................................31
2.11.1. Summary of the Study.......................................................................................................31
iii
2.11.2. Findings from Nimako et al’s study...................................................................................32
2.11.3. Concerns on Nimako et al’s Study.....................................................................................32
CHAPTER THREE...................................................................................................................................34
3.1. Introduction...............................................................................................................................34
3.2. Research approach.....................................................................................................................34
3.3. Study Population........................................................................................................................35
3.3.1. Geographical Area.............................................................................................................35
3.4. Sampling and Sampling Procedure............................................................................................36
3.4.1. Sampling size.....................................................................................................................38
3.4.2. Proportional Sampling Techniques....................................................................................38
3.5. Data Collection..........................................................................................................................38
3.5.1. Types of Data.....................................................................................................................39
3.6. Research Tools..........................................................................................................................40
3.6.1. Questionnaires...................................................................................................................40
3.6.1.1. Pre-test...........................................................................................................................41
3.6.2. Interviews..........................................................................................................................42
3.7. Research Strategy......................................................................................................................43
3.8. Purpose of Research..................................................................................................................44
3.9. Ethical Consideration.................................................................................................................45
3.9.1. Research Ethics..................................................................................................................45
3.9.2. Plagiarism..........................................................................................................................46
3.10. Challenges of the Research....................................................................................................46
3.11. Chapter Summary..................................................................................................................46
CHAPTER FOUR.....................................................................................................................................48
4. Introduction.......................................................................................................................................48
4.1. Data Analysis.................................................................................................................................48
4.2. Response Rate............................................................................................................................48
4.3. DEMOGRAPHIC ANALYSIS OF RESPONDENTS...............................................................49
4.3.1. Distribution by Sex............................................................................................................49
4.3.2. Age Distribution of Respondents.......................................................................................50
4.3.3. Occupation Distribution of Respondents............................................................................51
4.3.4. Income Bracket Distribution of Respondents.....................................................................52
iv

4.3.5. Education Level Distribution of Respondents....................................................................53
4.3.6. Distribution of Respondents by Subscription Plan.............................................................54
4.4. Subscriber Perceived Quality of Service....................................................................................55
4.4.1. Research Questionnaire 1: It is easier to place a call using MTN. (Call setup Success Rate)55
4.4.2. Research Questionnaire 2: Calls are successful to the end of the call. (Call Drop Rate)....59
4.4.3. Research Questionnaire 3: The Network is always available. (Network Capacity)............62
4.4.4. Research Questionnaire 4: The quality of the call good enough (Quality).........................64
4.4.4.1. The Network Statistics on Call Quality..........................................................................66
4.4.5. Research Questionnaire 4: The network is available everywhere in Ghana (Coverage).....67
4.4.6. Research Questionnaire 5: The customer Service is readily available and are always willing to assist..................................................................................................................................70
4.4.7. Research Questionnaire 6: I will recommend the network to another person.....................71
4.4.8. Research Question One: What criteria is used in measuring customer perception of Quality of Service (QoS)................................................................................................................................73
4.4.9. Research Question Two: What KPIs are monitored by the Network Service Providers.....74
4.4.10. Does KPIs measurements correlate with customer perceptions of Quality........................74
4.5. Chapter Summary..................................................................................................................77
CHAPTER FIVE.......................................................................................................................................78
SUMMARY, CONCLUSION AND RECOMMENDATIONS.........................................................78
5.1. SUMMARY...........................................................................................................................78
5.2. CONCLUSION......................................................................................................................80
5.3. Recommendations..................................................................................................................84
Appendix I : Questionnaires......................................................................................................................85
AGE Distribution......................................................................................................................................85
Bibliography..............................................................................................................................................89
v
List of Figures
Figure 2-1 Physical Architecture of a Cellular System (a) 23
Figure 2-2 Physical Architecture of a Cellular System (b)............................................................23
Figure 3-1 the map of Greater Accra.............................................................................................46
Figure 4-1 Pie Chart Showing Distribution of Respondents by Gender.......................................59
Figure 4-2 Showing the Distribution of Respondents by Age.......................................................60
Figure 4-3 Occupation Distribution of Respondents.....................................................................61
Figure 4-4 Income Bracket Distribution of Respondents..............................................................62
Figure 4-5 Education Level Distribution of Respondents.............................................................63
Figure 4-6 Distribution of Respondents by Subscription Plan......................................................64
Figure 4-7 Subscriber Perception on Call Setup Success Rate......................................................65
Figure 4-7 Subscriber Perception on Call Setup Success Rate.....................................................66
Figure 4-8 CSSR Statistics from Network Provider......................................................................67
Figure 4-9 Subscriber Perception of CDR.....................................................................................69
Figure 4-10 CDR Statistics from Network Service Provider........................................................70
Figure 4-11 Subscriber Perception of Network Capacity..............................................................72
Figure 4-12 Network Capacity Statistics from Network Service Provider...................................73
Table 4-13 Subscriber Perception on Call Quality........................................................................74
Figure 4-13 Subscriber Perception on Call Quality.......................................................................75
Figure 4-14 BER Statistics from Network Service Provider.........................................................76
Table 4-15 Subscriber Perception on Network Coverage.............................................................77
vi

Figure 4-15 Subscriber Perception on Network Coverage............................................................77
Table 4-16 Subscriber Perception on Customer Service...............................................................79
Figure 4-16 Subscriber Perception on Customer Service..............................................................79
Table 4-17 Subscriber's Willingness to recommend the Network Service Provider.....................80
Figure 4-17 Subscriber's Willingness to recommend the Network Service Provider...................81
vii

List of Tables
Table 2-1 NCA KPI Standards......................................................................................................32
Table 4-1 Table Showing Respondents by Gender.......................................................................64
Table 4-2 Showing the Distribution of Respondents by Age........................................................65
Table 4-3 Occupation Distribution of Respondents......................................................................66
Table 4-4. Income Bracket Distribution of Respondents..............................................................67
Table 4-5 Education Level Distribution of Respondents..............................................................68
Table 4-6 Distribution of Respondents by Subscription Plan.......................................................68
viii

List of Abbreviations
GSM-Global System for Mobile Communications
NCA-National Communication Authority
CDR-Call Drop Rates
KPI-Key Performance Indicator
QoS-Quality of Service
QoE-Quality of Experience
ITU-T-International Telecommunication Union - Telecommunication
CST-Call Setup Time
CCR-Call Congestion Rate
CHR-Call Handover Rate
ISO-International Standard Organization
QA-Quality Assurance
MSC-Mobile Switching Centre
PSTN-Public Switch Telephone Networks
BS-Base Station
BTS-Base Transceiver Station
ix

UE-User Equipment
MUI-Mobile Unit Initialization
MOC-Mobile Originated Call
NOC-Network Originated Call
MIN:Mobile Identification Number
ESN-Electronic Serial Number
MSISDN-Mobile Station ISDN
MTSO-Mobile Telephone Switching Office
IETF- Internet Engineering Task Force
SDCCH-Standalone Dedicated Control Channel
GCT-Ghana Chamber of Telecommunications
CSSR-Call Set-up Success Rate
PDP-Packet Data Protocol
BER-Bit Error Rate
HOSR-Handover Success Rate
CS-Customer Satisfaction
FACTS: FAST Access Content Trend Statistics
x

Abstract
This study investigates the relationship between Key Performance Indicators of mobile service
providers and Customer Perceived Quality of Service in the telecommunication industry with a
focus on Mobile Telecommunication Network (MTN) Ghana. A total of 452 respondents
participated in the study. Research questions and objectives were set, alongside the hypothesis
that were formulated and tested. Descriptive statistics comprising the simple percentage and
tables were used for data presentation and analysis. Pretest with 10 respondents and the
supervisor for the study were employed in testing our hypotheses. The study revealed that KPIs
and Customer Perceived Quality of Service (QoS) has direct correlation and that there is positive
relationship between KPIs and Customer Perceived Quality of Service (QoS). The researcher
concluded by making the the following recommendation;
Further study should consider expanding the sample size, subscriber base of the network under
review might not necessarily provide the bases for conclusions on the performance of the
network service provider. It is also recommended that future research should include the other
five network service providers in the study, this research was limited in scope to only one
network service provider. It is also recommended that Network Providers should consider getting
feedback from their subscriber since their perceptions on quality can serve as a guide to improve
the quality of services rendered to subscribers, Regulators should also consider carrying out
random survey to solicit for subscriber perceptions on the quality of service rendered to
subscribers. Another recommendation is to review the customer service department.
Finally, the research recommended that Future researchers should consider participating in KPI
measurements to get first hand primary data from which inferences should be made
xi
Keywords: Key Performance Indicators, Mobile Service Providers, Customer, Service, Customer
Perceived Quality of Service (QoS), Service Quality, Quality of Experience (QoE)
xii
Dedication
I lovingly dedicate this thesis to all who seek to better society in the little that they can do.
xiii

Acknowledgement
I would not have been able to accomplish this piece without good health granted by the almighty
Allah, the direction of my department and lecturers, support from family and friends and the
support of all participating respondents.
I want to express my deepest gratitude to my supervisor ING YAW YAWSON for his advice
and counseling in conducting this research.
I would like to express my sincere gratitude to my parents Alhaji Abdulai Dua and Madam
Azumi Dua who has been supportive throughout my education. This research report cannot pass
without acknowledging the contributions of Rafiatu Ahmed Tijani Dua My wife and Jamal-deen
Dua, and friends Patrick Aboku and Pascal N. Ametorwogo who have all been of varying
support throughout this project.
Finally, this research is dedicated to the Almighty Allah who granted the wisdom, health and
strength to me and all those who supported me in conducting this research
xiv

CHAPTER ONE
INTRODUCTION
1. Background of the Study
The mobile telephone industry has grown with marked successes the world over and Ghana is no
exception. In 1991 the world experienced its first GSM network which later became known as
the second generation mobile telephony. Like every new technology, GSM was met with
challenges; however, this was to change for the better in the subsequent years that followed its
introduction. Africans are not exception to the telephone penetration that is moving swiftly
around us. With the introduction of cellular mobile network in sub Saharan Africa in 1992,
Ghana became one of the continent’s most competitive markets with over 6 operators, which
includes, MTN, Vodafone, Bharti Airtel, Millicom (Tigo) . The latest is the Nigeria’s Globacom
as the sixth one in 2012. The competitive nature among the operators has since brought about the
reduction of voice and data price.
In Ghana alone, with a total of six (6) mobile network operators and approximately over twenty
eight million (28,419,649) active subscribers, the mobile telephone industry is no doubt one of
the most competitive industries in Ghana. According to December2013 Telecom Subscription
report, Ghana had a total population size of 25,627,787 and a subscriber base of 28,026,482
different active mobile lines registered with the various mobile operators (National
Communication Authority, 2014) . The statistics revealed more than one network raising issues
about service quality and customer satisfaction.
1

As a service oriented industry, issues relating to the quality of service rendered has become a
very crucial part of the business. Quality of service has increasingly become a matter deserving
review especially with increasing sophistication of customers. According to the NCA’s February
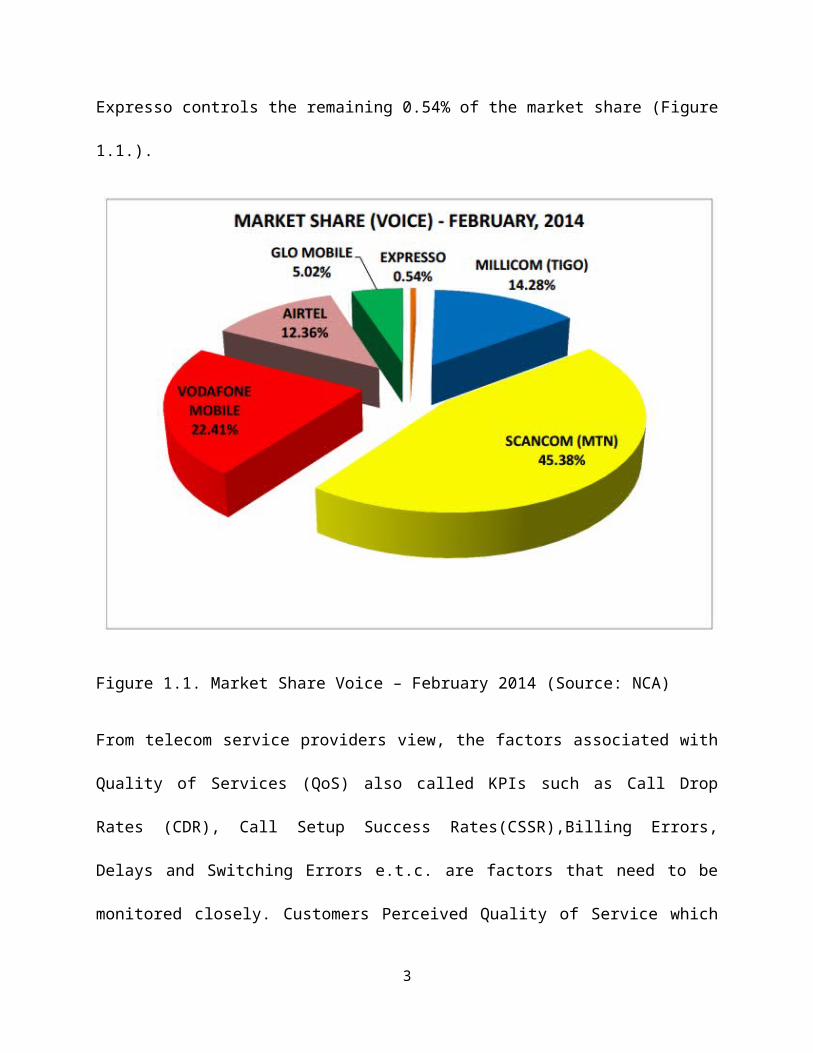
mobile voice market share report (National Communication Authority, 2014), 45.38% of the
market share is owned by Scancom (MTN), followed by Vodafone Mobile with 22.41% and
Airtel with 12.36%. Millicom the operators of Tigo hold about 14.28% and Glo Mobile having
about 5.02%. Expresso controls the remaining 0.54% of the market share (Figure 1.1.).
Figure 1.1. Market Share Voice – February 2014 (Source: NCA)
From telecom service providers view, the factors associated with Quality of Services (QoS) also
called KPIs such as Call Drop Rates (CDR), Call Setup Success Rates(CSSR),Billing Errors,
2

Delays and Switching Errors e.t.c. are factors that need to be monitored closely. Customers
Perceived Quality of Service which are based on the customer’s perception of quality also
requires close attention if network operators must retain existing customers and/or attract new
ones.
Quality of Service (QoS) from the Telecom’s perspective is defined as the ability of a network to
provide service at an assured service level (Soldani, Li, & Cuny, 2007). The customers
perceived QoS also called Quality of Experience (QoE) is a measure of the level to which a
particular system meets the expectation of its users (Mostafa & Zeadally, 2012). While QoS was
originally intended for measuring customer-oriented metrics, it is now limited to network
perspective (Lehnert, 2011) measured using Key Performance Indicators. However, Brennan et
al maintain that QoS is a broader term for measuring service quality by attempting to split QoS
into objective and subjective Quality of Experience (QoE) (Brennan, Fleck II, & van der Meer,
Dec 23, 2010). They further indicate that while objective QoE measures QoS in terms of
measurable service, network and application performance metrics, subjective QoE models
quality as perceived by humans in terms of emotions, service billing and experience (Brennan,
Fleck II, & van der Meer, Dec 23, 2010).
According to the International Telecommunication Union - Telecommunication Standardization
(ITU-T), customer perceived Quality of Service is defined as the overall acceptability of an
application or service, as perceived subjectively by the end user. While these definitions of QoS
and QoE remain a matter of contention between several authorities, for the sake of this research
study, the following differentiation and understanding of the terminologies will be adopted for
clarity of purpose and the avoidance of any ambiguities. QoE is the term used to describe
customers perceptions of the performance of a service and Network Quality of service, on the
3

other hand QoS is the ability of the network to provide a service at an assured service level
(Soldani, Li, & Cuny, 2007) measured using KPIs.
KPIs are parameters used to measure QoS whereas QoE which reflects the customer’s
perceptions or satisfaction are measured using different models such as SERVQUAL.
This study seeks to determine the relationship between Key Performance Indicators such as call
drop rate (CDR), call setup success rate (CSSR), call congestion rate (CCR) and call handover
rate (CHR) and perceived customer Quality of Service in the mobile telephone industry in
Ghana.
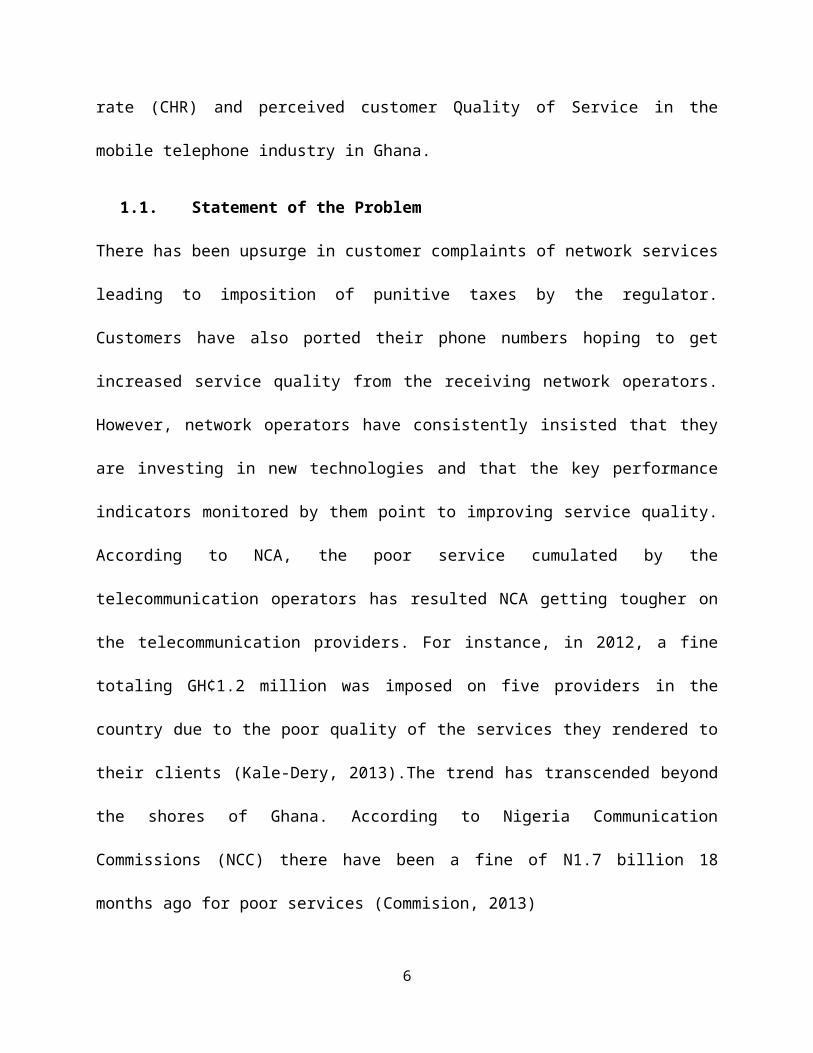
1.1. Statement of the Problem
There has been upsurge in customer complaints of network services leading to imposition of
punitive taxes by the regulator. Customers have also ported their phone numbers hoping to get
increased service quality from the receiving network operators. However, network operators
have consistently insisted that they are investing in new technologies and that the key
performance indicators monitored by them point to improving service quality. According to
NCA, the poor service cumulated by the telecommunication operators has resulted NCA getting
tougher on the telecommunication providers. For instance, in 2012, a fine totaling GH¢1.2
million was imposed on five providers in the country due to the poor quality of the services they
rendered to their clients (Kale-Dery, 2013).The trend has transcended beyond the shores of
Ghana. According to Nigeria Communication Commissions (NCC) there have been a fine of
N1.7 billion 18 months ago for poor services (Commision, 2013)
4
1.2. Research Questions
The study seeks to unravel the answers to questions such as:
What is the criteria for measuring customer’s perception of Quality of Service (QoS) of
telecom mobile services
What Key Performance Indicators are used by the Telecom Providers to measure Quality
of Service
Does a Key Performance Indicator measurement correlate the customer’s perception of
Quality of service (QoS).
1.3. Objectives of the study
The objectives of this study are:
1. To establish the criteria for and the customer’s perception of Quality of Service (QoS)
2. To investigate Key Performance Indicators (KPI) used to monitor Quality of Services
from the Telecom Providers view point
3. To establish and assess the relationship between these KPIs and customers’ perceived
quality of service in the mobile telecom industry in Ghana
1.4. Significance of the study
Telecommunication service providers will find the results of this research useful as it will
provide them with information about their subscribers regarding their responses to their quality
of service. It will also provide them (telecom companies) with the basics for further research into
their KPIs. Customers will find the results of this research useful in understanding how they are
served for calls they make.
5

Students and other researchers will also find information obtained from this research useful in
their quest for information and knowledge on Key Performance Indicators and Customer
Perceived Quality of service in the telecommunication industry. The same is applicable to
professionals in the industry.
1.5. Scope and Limitation
Although this research will be carefully carried out and expected to achieve its objectives, there
are expected unavoidable limitations. First, due to limitations in time and funding, the research
was conducted on a small sample of the target population, this results of the research is limited in
terms of its generalization.
Second, due to limited access to data and information from the telecom company under review,
the researcher had to contend with the limited information that was available for analysis, hence,
data used in this analysis cannot be said to be exhaustive and as further research in this regard
will be necessary for a more conclusive findings.
Finally, the research does not cover other performance indicators used by regulators and other
network service providers except those used by the network provider under study (MTN Ghana).
It does not cover the entire geographical area covered by MTN Ghana and as such is limited in
its application or representation of all subscribers to MTN.
1.6. Company Profile
1.6.1. About MTN Group
MTN, the leading provider of telecommunications services in Africa and the Middle East,
entered the Ghanaian market following the acquisition of Investcom in 2006. MTN’s overriding
mission is to be a vehicle for Ghana’s economic growth and development, helping to promote
6
Ghana’s strong development potential from the provision of world-class telecommunications
products and services, through to innovative and sustainable corporate social investment
initiatives (MTN Ghana, 2014).
MTN is the market leader in the increasingly competitive mobile telecommunications industry in
Ghana with over 12 million subscribers and offering its valued subscribers a range of exciting
products and services under Postpaid and Prepaid subscriptions. MTN’s network coverage is
extensive. It covers all 10 regional capitals, major cities and many rural and remote areas. The
company continues to invest heavily in infrastructure to expand its coverage and capacity across
the country (MTN Ghana, 2014)
Launched in 1994 and according to (MTN Ghana, 2014), the MTN Group is a leading emerging
market operator, connecting subscribers in 22 countries in Africa, Asia and the Middle East. The
MTN Group is listed on the JSE Securities Exchange in South Africa under the share code:
“MTN.” As of 30 June 2013, MTN recorded 201.5 million subscribers across its operations in
Afghanistan, Benin, Botswana, Cameroon, Cote d’Ivoire, Cyprus, Ghana, Guinea Bissau, Guinea
Republic, Iran, Liberia, Nigeria, Republic of Congo (Congo Brazzaville), Rwanda, South Africa,
Sudan, South Sudan, Swaziland, Syria, Uganda, Yemen and Zambia. MTN’s brand is the most
valuable in Africa, and is ranked in the top 100 brands worldwide. MTN’s shares constitute the
biggest primary listing on the JSE – Africa’s largest stock exchange. (MTN Ghana, 2014).
7

1.7. Organization of Research
Presentation of the research is done in a five chapters; beginning with background to the study,
its significance, scope, questions, company profile and objectives. Review of existing literature
and works by other scholars in the industry is covered in chapter two. Chapter three presents the
research methodology describing how the research process was carried out. Presentations of the
data collection including analysis are considered in chapter four. Finally, the conclusion and
suggestions are covered in chapter five.
8
CHAPTER TWO
LITERATURE REVIEW
2.1. Introduction
Quality is defined as the totality of characteristics of an entity that bear on its ability to satisfy
stated or implied needs (Antony et al, 2009). This issue of Quality has gained prominence lately
especially those pertaining to services and become a fundamental way of managing any business
anywhere for market growth and profitability in the service Industry (Sinha, 2000) Service
consumers are demanding more from their service providers much as statutory regulatory bodies
mandated to ensure standards are met in the domain within which they are mandated to regulate.
The Telecom Industry being a full-fledged service oriented industry is not spared the ordeal of
having to satisfy on the one hand sophisticated customer and on the other hand meet their licence
agreements with their regulators. This phenomenon raises the issues of service quality in the
industry.
The collective effect of the performance levels of all parameters considered pertinent to a service
is described as services quality (Oodan, 2014). The parameters for monitoring and ensuring
service quality differ from the customer’s and service provider’s viewpoints, in other words
Industry to Industry and Customer to Customer (Oodan, 2014) and each of such parameters may
have different priorities and performance level requirements by different segment of users
(Oodan, 2014) and regulators.
The Standards of service quality in the Telecom Industry is agreed upon by bodies such as the
International Standard Organization (ISO), International Telecommunication Union (ITU)
9
(Oodan, 2014) and the respective regulatory bodies of the countries within which the service
providers operate.
Service quality especially as perceived by the customer or subscriber is particularly important for
the service provider as this information can serve as a guide to ensure Quality Assurance (QA)
and as well avoid problems with the regulators.
2.2. The Cellular Concept
A cellular network or a mobile network is a radio network which provides wireless network
service for mobile users (Matin, 2014)
A radio network is made up of cells and cells are a small geographical area which is served by at
least one Base Station (BS). A Base Station is a fixed location transceiver which provides
wireless connectivity for mobile users (Matin, 2014).
2.3. Generations of Mobile Networks
First generation
First generation operated on analog telecommunication technologies. First Generation Networks
denoted as 1G offered up to 56kbps of speed of connection and was in use since 1980s
Second Generation
Second Generation (2G) networks Operated on digital telecommunication technologies and has
been in existence since 1991 using Global System Mobile Communication (GSM). Time
Division Multiple Access (TDMA) and Coded Division Multiple Access (CDMA) technologies
are both used over 2G to increase capacity.
Third Generation
10

Third Generation Networks (3G) have been in operation since 2002 and is capable of transferring
data at a minimum speed of 200kbps. Variations include 3.5G, 3.7G both used to increase
capacity up to megabytes (Mbps). Applications like wireless voice telephony, mobile internet
access, fixed wireless internet access, video calls, mobile TV all operate on the 3G technology.
Fourth Generation
Fourth Generation (4G) extends the capabilities of 3G networks in addition to providing mobile
intra-broad band internet access to laptops with USB wireless modems, to smartphones and other
mobile devices. Advanced versions of 4G include LTE. (Matin, 2014)
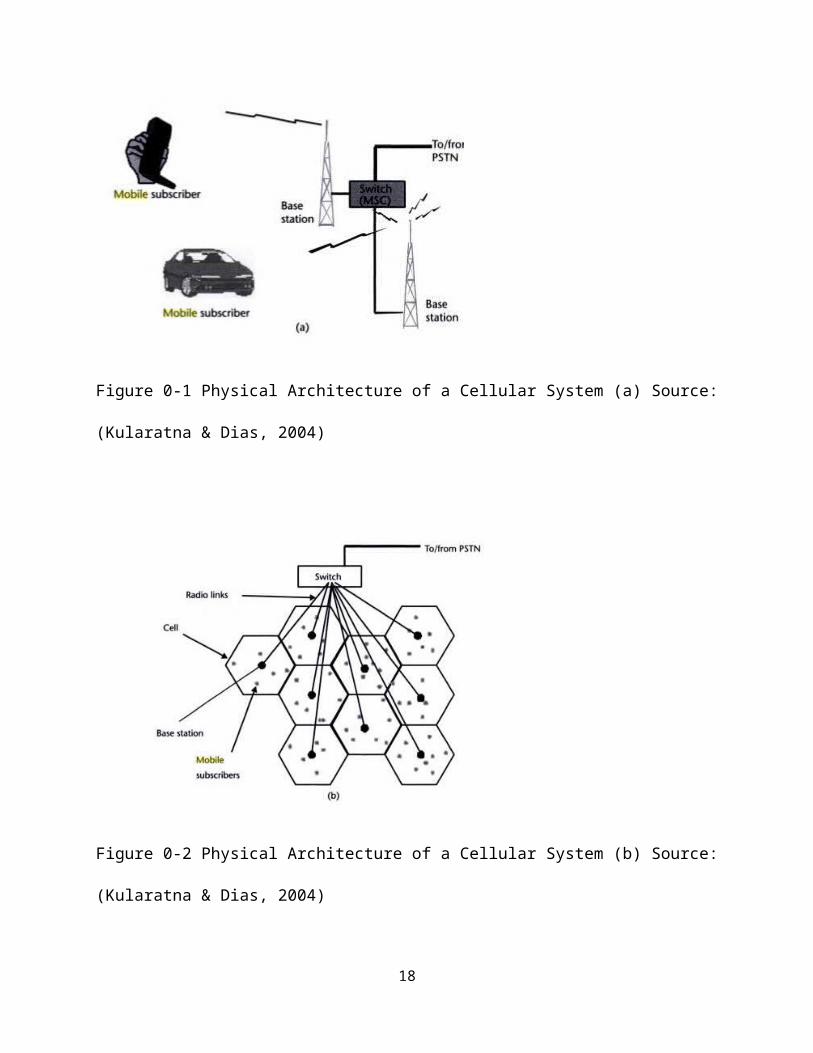
2.3.1. The Physical Architecture of a Cellular System
The cellular mobile systems have the following fundamental elements
1. Mobile Unit
2. Cell site Base Station (BTS/BS)
3. Mobile Switching Centre (MSC)
4. PSTN (Public Switch Telephone Networks)
(Figure 1.2. Physical Architecture of a Cellular System)
11

Figure 0-1 Physical Architecture of a Cellular System (a) Source: (Kularatna & Dias, 2004)
Figure 0-2 Physical Architecture of a Cellular System (b) Source: (Kularatna & Dias, 2004)
12

2.3.2. Operation of the Cellular System
A Cell is define as an active connection used to exchange user data e.g. Voice or IP Packet
between the User Equipment (UE) and the network (Kreher, 2006). Calls are synonymous to
Mobile Communication, which also refers to the conversation established between two
subscribers at two different locations with hand held equipment (Arokiamary, 2009). Even
though, mobile communication has extended beyond voice calls, the concept of voice calls will
be used to explain the operations of the cellular network.
In the operation of the system for having a mobile communication, there are 4 Parts along with
handover mechanisms
1. Mobile Unit Initialization
2. Mobile Originated Call
3. Network Originated Call
4. Call terminations and a handover procedure
Each mobile unit has two unique numbers: The mobile identification number (MIN) and the
electronic serial number (ESN). MIN is the mobiles phone number also called mobile station
ISDN (MSISDN) that is programmable (Kularatna & Dias, 2004). Assigned ESN at the time of
manufacturing. This two numbers are used for proper billing and preventing fraudulent use.
Apart from these IDs, the unit also has a system identification number assigned by the cellular
network used to identify the system to which the mobile unit is subscribed (Kularatna & Dias,
2004)
13

2.3.3. Mobile Unit Initialization:
It refers to the processes involved between when a mobile device is switch on and when it
established network connection. The process involves the mobile device scanning designated set-
up channel, selecting a channel with a strong signal and locking on to it. The device received a
System Identification Number (SIN) from the selected channel, which continuously broadcast it.
The device is then transmits its MIN and ESN to the Base Station. The Base Station then
assigned a pair of shared control channels to the device. The device then tune to the assigned
channels, which continuously broadcast system information and incoming calls, alerts. This is
refers to as self-location scheme and it is used in the idle state of the device (Kularatna & Dias,
2004).
2.3.3.1. Mobile Originated Calls:
When a subscriber pressed the send button, a request is send to the based station through the
reverse control channel obtained during initialization. The cell site received the request and
passes it onto the Mobile Telephone Switching Office (MTSO) for authorization. The MTSO
would then select an available voice channel for the call (Kularatna & Dias, 2004).
2.3.3.2. Network Originated Call:
These are initiated by the MTSO, which uses relevant search algorithm to find the destination
device and using the strongest channel, and initiate a user alert (Arokiamary, 2009).
2.3.3.3. Call Termination:
Once the communication is over the respective voice channel are made free and the call is
terminated (Arokiamary, 2009).
14

2.3.3.4. Handover:
The aim of handover procedure is to maintain a call in progress irrespective of the movement of
the mobile device. When the mobile device moved from one Base cell to another, the call in
progress is handed over from the originating based cell to a new-based cell (Arokiamary, 2009)
2.4. Service Quality Standards in the Telecom Industry
By its general meaning in everyday language, the term ‘Standard’ is not helpful (Andelin,
Garcia, & Clair, 1992) and despite the diverse meaning and interpretations it represents, the
definition by the Oxford Dictionary will be adopted in this study. The Oxford English Dictionary
Define Standard as a required or agreed level of quality or attainment (Eren, 2005)
Standards are usually agreed upon and subscribed to by groups, organizations and countries such
as ISO, ITU enforced the regulators whose principal role according to Oodan is to interpret the
government’s charter for the sector (Oodan, 2014).
Like Quality, Quality of Service has different definitions and descriptions. Below are a few
sampled definitions by some standards organizations as a set of quality requirements on the
collective behaviour of one or more objects -ISO and ITU (ISO 95) (Mellouk, Tran, & Hoceini,
2013).The demand for networked real-time services grows, so does the need for shared networks
to provide deterministic delivery services. Such deterministic delivery services demand that both
the source application and the network infrastructure have the ability to request, setup and
enforce the delivery of the data. Collectively these services are referred to as bandwidth
reservation and Quality of Service. -IETF (SHE 97b) (Mellouk, Tran, & Hoceini, 2013).A
collective measure of the level of service delivered to the customer (OFO) (Mellouk, Tran, &
Hoceini, 2013).
15

In the Telecom Industry, QoS in the network perspective is measured technically using Key
Performance Indicators (National Communication Authority, 2014) KPIs provide a tool that
makes QoS both measurable and standardized and to avoid the subjective predisposition of
measuring Quality. To make effective strategic decisions especially regarding citing of cell sites
etc. service providers must keep the measurements of their KPIs up to date. This accession is
well elaborated by Parmentor, who maintains that KPIs represent a set of measures focusing on
those aspects of organizational performance that are the most critical for the current and future
success of organizations (Parmenter, 2011).
In Ghana Standards as monitored by the NCA is provided for by constitution in the National
Communication Authority Act 524, 1996 (Refer Appendix I). The KPIs provided for in the NCA
act are shown as follows:
Table 2-1 NCA KPI Standards
KPI Standard(Ghana)SDCCH 1%Call Setup Time <10 sec in 95% of casesVoice Call Drop Rate 3%Call Congestion Rate <1%
It must however be made clear that QoS cannot be measured from the network providers point of
view alone. This accession is emphasized by (Oodan,2014) that since Quality and QoS affects all
three players in the industry i.e. service providers, regulators and subscribers (Antony, Oodan;
Keith, Ward; Catherine, Savolaine; Mahmoud, Daneshmand; Peter, Hoath, 2009), it must be
measured from the perspectives of all three.
16

QoS from the customer’s perspective will reflect factors that enable or disable the customer’s
ability to place and maintain calls, hearing the other party in a call and transparent bill systems.
From the service providers view point, QoS will usually take place in the form of counters such
as the number of connect failed calls by the number of total placed calls etc.
2.5. Quality of Service Trends in Ghana
From 26,086,795 in the beginning of 2013 to 28,026482 at the end of 2013, the NCA described
2013 as a good year for the telephone network service providers (National Communication
Authority, 2014) .However, despite the growth of the subscriber base and with a penetration rate
of over 100%, the quality of service cannot be said to have grown with the expansion of the
subscriber base.
It is not uncommon to hear subscribers on the street attribute reasons like “network problem”,
“congestion” e.tc. to problems associated with their communication needs. In June 2013,
Business Ghana (Business Ghana, 2014) carried a news item entitled “Mobile phone users angry
with Telco’s for poor service”. The news item stated how Ghana Telecom subscribers were
complaining of poor service by the Telecom Network Operators. The industry players in turn
attributed reasons such as breaking of cables by contractors, stealing of cables, frequent power
outages and high fees charged by landowners, account for the problems (Business Ghana, 2014)
The interest thing about the above news item is that it is no longer news to complain of network
problems or challenges with placing phone calls in Ghana. This phenomenon is still lingering
despite the fact that the National Communication Authority has penalised the telecom operators
on several occasions (National Communication Authority, 2014). The most recent NCA report
17
on the Quality of service by the six telecom operators in Ghana is the last Quarter report for
2013.
The NCA report showed that in relation to SDCCH congestion rate measured only Vodafone and
tigo were in compliance with the standard of <1%, all other networks failed and were penalised.
Again apart from Vodafone and tigo, all other network providers failed to meet the required
standard of <10 sec in 95 of cases for call setup time. The measurements for call congestion rate
revealed that MTN, Vodafone and Glo were in compliance with the others failing to meet the
required standard of =<1%. In the area of voice call drop rate, espresso failed to meet the
standard of 3% with all other service providers meeting the requirements (National
Communication Authority, 2014)
All the six network service providers faulted in one way or the other in the measurements of the
identified KPIs and were penalised by the NCA.
Factors that affect QoS from Telecom operators include cable cuts, uneven landscapes, poor or
inadequate infrastructure etc. The National Ghana Chamber of Telecommunications (GCT)
attributes line cuts as one of the reasons for the network services issues. The GCT says
Telecommunication companies in Ghana last year (2013) experienced a depressing 30 per cent
increase in cable cuts (Adrenalin Media, 2012) According to the GCT three-quarters of the cuts
occur during road construction, followed by small-scale illegal mining, which is responsible for
10 per cent of cuts. The rest are theft, vandalism and bushfires. Telecommunication companies
have bemoaned the spate of cable cuts, which significantly affect the delivery of services
(Adrenalin Media, 2012)
18

2.6. Telecom Service Quality Regulation in Ghana
As the mobile penetration rate (100.4% as at 2012) continue to improve (Nii & Dowuona, 2013)
and subscribers get more sophisticated coupled with the boom of smart devices and demand for
both voice and data communication increases by the day, Telecom Service Providers cannot but
ensure that the customers/subscribers perception of the Quality of their Services are within
acceptable limits.
Another driving force to ensure conformity to standards and meeting customers’ expectations is
the continued increasing competition between network service providers. For example, in Ghana
alone, for a population of 25 million people, there are over 5 telecom service providers
competing.
In 2013 alone the National Communication Authority had charged the mobile Service Providers
in Ghana to a sum of GH₵1.2 million as penalties for non-conformance to standards (National
Communication Authority, 2014). On some occasions, the Key Performance Indicator values
measured by the service provider are in tandem with the subscribers perceived Quality of Service
(Craighead, 2009).
Quality of Service is important in the Telecom Industry in order to keep existing and attract new
subscribers. According to the National Communication Authority (NCA), Cellular Mobile
Network Service Providers are required to maintain certain minimum Quality of Service of Key
Performance Indicators per their licence conditions (NCA, 2010).
The National Communication Authority as the regulatory body in Ghana Conducts quarterly
Quality of Service Monitoring of the Cellular Networks in the country. This monitoring
measures KPIs including:
19
1. Stand-Alone Dedicated Control Channel (SDCCH) -Congestion is defined as the
probability of failure of accessing a stand-alone dedicated control channel during call
setup. SDCCH congestion rate should be equal to or less than one percent (1%)
2. Call Setup Time is the period of time elapsing from the sending of a complete destination
address (target telephone number) to the setting up of a call to the receiving terminal.
CST should not be less than 10 sec in 95% of cases
3. Call Congestion Rate (NCA, 2013) is the probability of failure of accessing a traffic
channel during call setup and the traffic channel and should be equal to or less than 1%
(=<1%)
4. Voice Call Drop Rate is the probability of a call terminating without any of the users will
and should be equal to or less than 3% (=<3%) (Refer Table 1.1). (QUALITY OF
SERVICE, 2013)
These KPI’s and their respective thresholds for compliance are assessed as part of the cellular
mobile licence obligations (NCA, 2014).
2.7. Customers Perception of Quality
Services are meant for and expected to be consumed by the customer/subscriber. Perceived QoS
is the customer’s perception of the overall quality or superiority of a product or service with
respect to its intended purpose relative to alternatives (Zeithaml V. A., 2010). Due to the
intangibility of Quality (Zeithaml V. A., 2010).it poses a big challenge in measurement as it is
ultimately influenced by experiences of the customer.
20

According to Zeithaml, unlike products such as phones and automobiles the criteria used by
customers to evaluate Quality may be complex and difficult to capture precisely (Zeithaml V. A.,
2010) .
The customer’s perception of quality is different from the service provider’s more methodical
and technical tool based and calculated measurements of service quality. While the customer’s
perception is more subjective, the service provider uses more objective means of determining the
various key indicators of quality (KPIs). For example, the customer will determine Quality of
Service (QoS) by the cost of making calls, responsiveness of customer service, and the ability to
place a call, stay connected and as well as the other party.
2.8. Measuring Quality of Service (QoS)
A challenging topic in contemporary quality management theory and practice, service quality
continues to be a challenge for marketers and researchers alike. Compared to products, services
are not easily measured, tested or controlled for quality. Particular reasons include the fact that
service quality is difficult to measure because:
• Service is intangible i.e. it cannot easily be measured, tested or verified
• Services are perishable
• Standards cannot be easily set
• Service quality is more difficult for customers to measure
• Reliance on subjective experience among others
Different researchers have proposed different measurement models for quality measurement, key
among which include Service Profit Chain Model by Heskett et al and SERVQUAL proposed by
21
Parasuraman, Zeithaml and Berry in the 1980s. Both group of research proposed models and
how these models can be used to measure quality by relying on customer experience and
expectations. The purpose of this research is to measure or determine the quality of services
offered by telecom network operators viewed through the lens of a subscriber as against the
values obtained by using network tools to obtain KPIs.
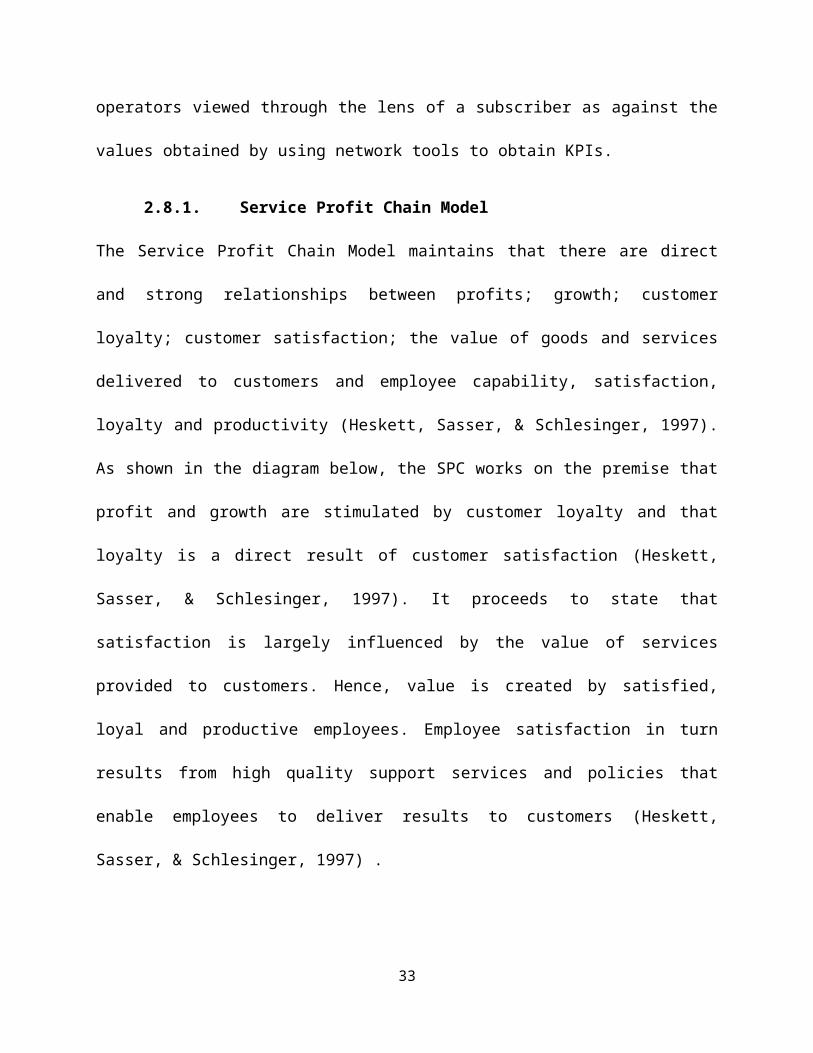
2.8.1. Service Profit Chain Model
The Service Profit Chain Model maintains that there are direct and strong relationships between
profits; growth; customer loyalty; customer satisfaction; the value of goods and services
delivered to customers and employee capability, satisfaction, loyalty and productivity (Heskett,
Sasser, & Schlesinger, 1997). As shown in the diagram below, the SPC works on the premise
that profit and growth are stimulated by customer loyalty and that loyalty is a direct result of
customer satisfaction (Heskett, Sasser, & Schlesinger, 1997). It proceeds to state that satisfaction
is largely influenced by the value of services provided to customers. Hence, value is created by
satisfied, loyal and productive employees. Employee satisfaction in turn results from high quality
support services and policies that enable employees to deliver results to customers (Heskett,
Sasser, & Schlesinger, 1997) .
22
value is Central to the chain in the customer value equation, which suggest that the value of
goods and services delivered to customers is equivalent to the results created for them as well as
the quality of the processes used to deliver the results, all in relation to the price of a service to
the customer and other costs incurred by the customer in acquiring the service (Heskett, Sasser,
& Schlesinger, 1997) .
2.8.2. The SERVQUAL Model
SERVQUAL is a service quality frame works developed by Parasuraman, Ziethaml and Berry
with the aim of measuring quality in services quality.
The SERVQUAL as proposed by Parasurman, Zeithaml and Berry in 1988 works on the
assumption that customer are able to evaluate the services rendered by a service organization by
comparing their perception of quality with their expectations. This measurement model is
applicable in the service industries including telecom, Banking etc. and involves a set of five
dimensions namely Tangibles; Reliability; Responsiveness; Assurance; Empathy. Figure 1.3
23
The five dimensions as explained below are also made up of sub dimensions which are specific
to each industry.
Tangibles include appearance of physical facilities, equipment, personnel and written materials.
For example tangibles in the telecom industry will include customer service departments,
appearance and dress code of the customer service personnel, company facilities such as MAST
locations and other visible materials which serve to pose confidence in the organization by
customers
Reliability according to Parasuraman et al refers to the ability of an organization to perform the
promised service in a dependably and accurate fashion. Customers in the telecom industry for
example assess reliability of a telecom company by its network availability, how easy it is to
purchase and load credit, network coverage and stability. Compromise in any of these factors
will result in loss of reliability.
Responsiveness refers to willingness to help customers and provide prompt services. A telecom
organizations ability to respond to customer complains, the visibility of customer service
department and personnel as well as their attitude all constitute responsiveness. Organizations
that are able to assist troubled customers and provide reliable services and explanations for
unexpected network interruptions for example are considered more responsive.
Assurance- customers always want to be assured of the capabilities of their service providers to
provide them (Customers) with the services they so subscribe to. Service providers could ensure
and provide their assurance through their employees by ensuring their employees demonstrate a
higher level of knowledge and inspire trust and confidence.
24

Empathy includes easy access, caring, good communication, customer understanding and
individualized attention provided by the service provider.
Figure 2-3 SERVQUAL Model
2.9. The Five Gaps in the SERVQUAL Model
Gap 1: The difference between management perceptions of what customers expect and what
customers really do expect
Gap 2: The difference between management perceptions and service quality specifications - the
standards gap
25

Gap 3: The difference between service quality specifications and actual service delivery - are
standards consistently met?
Gap 4: The difference between service delivery and what is communicated externally - are
promises made consistently fulfilled?
Gap 5: The difference between what customers expect of a service and what they actually
receive
The gaps and quality dimensions identified in the SERVQUAL framework provide an avenue to
address the difficulties/challenges that service organizations and researchers encounter in an
attempt to measure quality.
In using the SEVQUAL model a five-point scale ranging from five (strongly agree) to one
(strongly disagree) accompany a set of statements (Zeithaml, Parasuraman, & Berry, 1990)
representing each researchable item in the research area. Another Model introduced in this study
is using the Likert Scale. According to Broadersen Likert item is a statement that the respondent
is asked to evaluate (Broadersen, 2008) and according to Trendowicz since a likert scale requires
an odd number of levels , (Trendowicz, 2013) recommended using a five-point Likert scale
which ranges from Strongly disagree to Strongly agree. Juxtaposing the two models. The study is
said to use five-point Likert scale ranging from five (strongly agree) to one (strongly disagree)
This research will attempt to use the SERVQUAL model to measure quality of service provided
by telecom companies in Ghana.
26

2.10. Key Performance Indicators (General Concept)
Quality of Service from the perspectives of the network operator or regulators is expressed
technically using measurements of the Key Performance Indicators. Unlike the customer to
whom Quality of Service are expressed using non-technical terms or whose understanding of
quality are expressed by their perceptions, Service providers using measurements of KPIs to
determine Quality of Service.
According to (Parmenter, 2011), KPIs represent a set of measures focusing on those aspects of
organizational performance that are the most critical for the current and future success of the
organization. Due to the critical role KPIs play in the organization they must be measured
frequently. Parmenter recommends daily measurement.
Parmenter identifies seven characteristics of KPIs, and there are;
1. nonfinancial measurements i.e. they are not expressed in monetary terms
2. measured frequently
3. acted on by senior management team
4. must be understood by all staff and corrective action requires the action of all staff
5. have significant impact on the critical success factors of the organization
6. has positive impact on the organization
7. ties responsibility to the individual or team
Because KPIs have a critical impact on the success or failure of the organization, they must
emanate from the strategic goals of the enterprise and cascade throughout the organization
(Institute, 2010).
27

What these KPIs are, how they relate to subscriber experience and how they are measured in
mobile networks are key in this research process and are being discussed shortly. In the
telecommunication Industry, identified parameters are used to measure critical KPIs. These
include Call Drop Rate, Call Congestion Rate, Call setup Success Rate, Call Setup Time and
SDCCH.
2.10.1. KPIs in Telecom Industry
2.10.1.1. Coverage
Coverage is normally expressed as location probability usually given as a percentage of the
coverage time; coverage is also expressed as either outdoor or indoor.
Outdoor coverage is measured by drive test equipment (Mishra, Advanced Cellular Network
Planning and Optimisation: 2G/2.5G/3G...Evolution to 4G, 2004) using a test Phone attached to
a laptop with GPS Capability. The test phones automate a series of calls and measure a set
variables including signal strength (coverage) in dBm (Mishra, Advanced Cellular Network
Planning and Optimisation: 2G/2.5G/3G...Evolution to 4G, 2004). Indoor coverage is measured
in much the same way except that, the measurements are done within buildings and considering
the challenges related to accessibility and speed, indoor coverage is approximated by adding a
margin for “building penetration loss”. (Mishra, Advanced Cellular Network Planning and
Optimisation: 2G/2.5G/3G...Evolution to 4G, 2004) Coverage is measured in dBm.
2.10.1.2. Capacity
Capacity: Capacity of a network means how many subscribers can the network support, this can
be measured by ‘network blocking’ (Mishra, Advanced Cellular Network Planning and
28

Optimisation: 2G/2.5G/3G...Evolution to 4G, 2004) . Network blocking is expressed as a
percentage of the capacity time.
Like coverage, capacity can be measured using a drive test. Capacity can also be determined by
using network statistics, which is considered as a correct picture of network blocking (Mishra,
Advanced Cellular Network Planning and Optimisation: 2G/2.5G/3G...Evolution to 4G, 2004).
2.10.1.3. Call set-up success Rate
Call set-up success Rate: Because CSSR takes into account interference and fading and comes
closest to subscriber experience it’s also measured as a KPI. Drive test can be used to measure
CSSR but network statistics is a much accurate measure for it (Mishra, Advanced Cellular
Network Planning and Optimisation: 2G/2.5G/3G...Evolution to 4G, 2004). CSSR is expressed
as a percentage. The counterpart of CSSR is 2G, 3G, and 2.5G networks are PDP. A good CSSR
is in average of 98 to 99%
CSSR/PDP can be affected by the subscriber’s subscription plan and could be barred or denied,
certain services, which might register as failures and contaminate networks statistics.
2.10.1.4. Dropped call rate
Dropped call rate. The termination of a call not requested by any of the parties in the call. DCR
is a characteristic of radio networks. Drop call rates can be affected by coverage, interference
and/or capacity (Mishra, Advanced Cellular Network Planning and Optimisation:
2G/2.5G/3G...Evolution to 4G, 2004). DCR can be measured using network statistics or a drive
test. Average is before 1 and 2%
29
2.10.1.5. Call Quality
Call Quality. Call quality measurement can be services specific or independent of the service and
are classed as a measure from 0-7 with 0 being the best and 7 being the worst. It is based on the
measurement of the Bit Error Rate (BER). Voice quality of 0 comes near to land line quality, 2
and 3 have perceptible distortion , 4 has some amount of distortion conversation call still take
place at quality 5 level depending on the abilities of the parties, 6 and 7 means no useful voice
conversation is possible
2.10.1.6. Handover Success Rate
Handover Success Rate: For a user to experience a seamless call a subscriber is handed over to
the next cell when subscriber reaches the cell boundary. An extensive measurement and
signaling protocol ensures that these handover is smooth and unnoticeable by subscriber even
though sometimes handovers can fail. Handover failures can be a major cause of quality
degradation in service or may lead to call drop. Due to its importance, handover success rate is
often specified as a key performance indicator. Handover can also be triggered by other variables
such as Capacity, call quality, and mobile speed. Average handover success rate is 95% (Mishra,
Advanced Cellular Network Planning and Optimisation: 2G/2.5G/3G...Evolution to 4G, 2004)
2.10.1.7. Call set-up time.
Call set-up time. Refers to the time it takes for a subscriber to get in to a call. It is measured from
when the subscriber presses the dial button to when the dial tone is heard. In addition, it is
measured using drive testing. Mobile to PSTN call have call set-up time of four (4) seconds and
eight (8) seconds for mobile to mobile (Mishra, Advanced Cellular Network Planning and
Optimisation: 2G/2.5G/3G...Evolution to 4G, 2004)
30

2.10.2. Measuring KPIs
KPIs are measured using Drive Testing and Network Statistics.
2.10.2.1. Drive Testing
The advantage of drive testing is that, the precise geographical information is available and the
testing does not depend on the vendor supplying the equipment. Drive testing is expensive,
however and limited to the availability of roads and accessible buildings in the case of indoor
coverage
2.10.2.2. Network statistics:
Events on the network such as call set-ups, handing over and call quality are counted by
counters set on the networks. Network management systems collect this data and with the help of
special reporting tools give an idea of the performance of the system as a whole. Networks
statistics gives more accurate and comprehensive picture of network performance (Mishra,
Advanced Cellular Network Planning and Optimisation: 2G/2.5G/3G...Evolution to 4G, 2004)
2.11. Review of Research by Nimako et al, 2010
(Nimako et al,2010) conducted a research in Ghana on a similar area entitled: Overall Customer
Satisfaction in Ghana’s Mobile Telecommunication Networks: Implementations for Management
and Policy. The following section seeks to analyse and review their findings.
2.11.1. Summary of the Study
The above research sort to empirically assess and analyse overall Customer Satisfaction (CS)
with service quality delivered by Mobile Telecom Networks (MTNs) in Ghana. The researchers
sort to answer the following research questions:
31

1. How can overall customer with service quality be described in Ghana’s MTNs with and
without respect to customer’s mobile telecom network
2. Do the ratings of customer satisfaction among MTNs in Ghana differ
3. Do the ratings of male and female customers regarding their satisfaction with service
delivery of MTNs in Ghana differ?
The study was a survey using structured questionnaire administered to a total of 1000 selected
subscribers from four (4) mobile telecom networks in 2008 with a response rate of 93.7%. MTNs
considered for the research included MTN, Milicom Ghana Ltd, Kasapa Telecom Ltd (now
expresso), and one touch GSM Services Ghana.
2.11.2. Findings from Nimako et al’s study
Irrespective of mobile telecom network in Ghana, all the four tools or measures pointed out that
Customer Satisfaction is low and not equal to or better than desired or expectation so the
customers are not satisfied with service quality delivered by MTNs in Ghana
The study also indicated that despite the competitive nature of the industry, some MTNs are
better placed in terms of customer satisfaction than others and that customers’ satisfaction of
service delivery differed from provider to provider.
Finally, they found and concluded that female subscribers are less satisfied as compared to their
male counterparts.
2.11.3. Concerns on Nimako et al’s Study
Much as the results obtained from Nimako et al was revealing and informative it fell short of the
following concerns.
32

The sample could not have been representative of the entire subscriber population of all four
network service providers in Ghana. Using their own judgement without scientific proof for the
choice of a sample size makes it challenging to generalize the findings of the research.
Factors such as culture, level of education and income level are key in determining the
satisfaction level of individuals. Hence using a town to represent a whole zone which could
comprise different cultural persuasions could give misleading results. More so, analysing
subscriber satisfaction based on their educational level and income level could have yielded
different results compared to their conclusion.
Secondly, before coming up with the said conclusions which are only indicative of the
customer’s satisfaction, it would have been necessary to study values have been scientifically
measured such as the Key Performance Indicators (KPI) to use as a benchmark. This was lacking
in the research by Nimako et al.
In conclusion, much as Nimako et al’s results are very informative and revealing, consideration
of the above such as scientifically determining the sample size, analysing satisfaction level in
relation to educational and income levels would have increased the confidence level of their
research.
33
CHAPTER THREE
RESEARCH METHODOLOGY
3.1. Introduction
In this chapter, the methodology used in the research is outlined beginning with the research
approach, followed by study of the population, sampling and sampling procedure followed by
Data collection. The Research tools and research strategy are discussed as well, Purpose of the
research and Ethical consideration is considered. The challenges of the research and issues on
plagiarism are further discussed in the chapter. The chapter concludes with methods used for
data analysis and chapter summary.
3.2. Research approach
The choice of data gathering techniques and/or tools is dependent on whether the research
process adopts an inductive or deductive theoretical approach. According to Bryman and Bell,
the deductive approach involves a clear, logical sequence of developing hypothesis from an
existing theory and subjecting it to empirical scrutiny through data gathering. The approach,
which is also referred to as theory testing is considered as the general orientation to the link
between theory and research. (Bryman & Bell, 2011)
The inductive approach on the other hand involves gathering data first and analyzing it to
develop theory. In this approach, theory is the outcome of the research as opposed to the
deductive approach where research is the outcome of theory (Bryman & Bell, 2011).
The SERVQUAL model is used as main concept to assess service quality and customer
perceived quality of service. This means that perceived customer could be measured using the
various service quality dimensions. This is because it is important to be aware of how customers
34

perceived service quality in Telecommunication industries and the factors that affect these
perceptions (Daniel & Berinyuy, 2010).
This research adopts an inductive approach by first collecting relevant data from sources in the
Telecom Industry in Ghana on Key Performance Indicators (KPIs) and Customer Perceived
Quality of Service, analyzing them to formulate conclusions on the role it plays on quality of
service as far as customer.
3.3. Study Population
A population comprises all elements from which a sample is to be taken (Köhl, Magnussen, &
Marchetti, 2006) . The study (sample) population is the aggregation of population from which
the sample is actually selected (Babbie, 2012). The accessible population is the group of research
participants who are available to the researcher for participation in the research (Johnson &
Christense, 2010). According to (Turner et al,2001) it was decided that a target sample of 452
respondents should be sought . According to (Curry, 1984) using the rule of thumb, an adequate
sample of MTN subscribers of 45,200 in Greater Accra Region would be a random sample of 1%
or 452 subscribers. In the course of this research, the researcher had to contend with the
population of subscribers within the geographical area indicated in the next section due to time
and other constraints.
3.3.1. Geographical Area
In this study and for the purpose of achieving the objective of this study the target population
includes MTN subscribers in Parts of Greater Accra region including Ga East, West, and South
as shown in Figure 1 below. The total population of Greater Accra according to the Ghana
Statistical Service as at the last census in 2010 is 4,010,054 representing 16.3% (Service, 2012).
35

Figure 0-3 The map of Greater Accra
3.4. Sampling and Sampling Procedure
Sampling involves examining a small portion of the total population for judging the nature or
quality of the whole population. According to Proctor, once a researcher has decided to collect
primary data, the next task is to obtain a sample of respondents that is representative of the target
population of interest (Proctor, 2005). (Saunders et al,2009) describe sampling techniques as a
mechanism that enable a research to reduce the amount of data needed for a study by considering
only data from a smaller representation of an entire population or group (Saunders et al,2009) .
According to (Saunders et al 2009) The process of selecting a sample to represent a population in
primary data collection can be based on either probability or non-probability. They describe
probability sampling as a sampling technique where the chances of each case being selected from
the population is deterministic and equal for all cases and whereas for non-probability samples ,
36
the propability of each case being selected from the total population is not known and it is
impossible to answer research questions or to address objectives that require you to make
statistical inferences about the characteristics of the population (Saunders, Philip, & Thornhill,
2009)
This research has an estimated population of 45,200. By Curry’s design, the sample size of 452
is applicable.
According to (Curry, 1984) a sample size of 452 uses 1 % of the target population. This research
therefore selected 452 respondents as a sample size used in the analysis
Table 3-1 shows below.
Table 3-1 ; Population and Sampling(%) 1
Source based on Curry 1984
In this research, there will be two separate data gathering processes for the quantitative data
using interviews and questionnaires respectively. The questionnaire administered to a random
37
sample (Probability) of 452 MTN subscribers in parts of Greater Accra region of Ghana. Due to
the few numbers of the technical practitioners and professionals in the area of KPI, all of them
numbering three (3) were interviewed on separate schedules.
3.1.1. Sampling size
The study population includes all MTN Subscribers within the Geographical area above. In a
similar study to determine customer satisfaction level among mobile telecom subscribers in
Ghana by Nimako et al (2010), sample size of 1000 was used out of a target population of 7.6
million (Nimako et al, 2010). In this study, a population size of 452 was used out of a target
population of 45,200 (Curry, 1984). This number was picked from Curry’s Table because it
reflects the limit of our budget and the time to distribute the questionnaire to MTN subscribers
within the study area. For this, the research is limited in scope to only MTN subscribers within
the greater Accra region with a target population of forty five thousand two hundred (45,200).
3.1.2. Proportional Sampling Techniques
This study selected 452 respondents as a sample sized used in the analysis. The detail breakdown is as follows.
Ga East 30%-136
Ga South 30%-136
Ga West 40%-180
3.2. Data Collection
In collecting data during the research process, the researcher relied on both primary and
secondary data sources. According to (Proctor, 2005), secondary data is a summary, coalition
38
and/or synthesis of existing research findings previously produced by other researchers (Proctor,
2005).
Unlike secondary data, primary data is more reliable and gathered to meet the needs of the
particular research problem. Since primary data is firsthand information, it is more reliable.
Nonetheless, primary research is relatively more expensive, time consuming and generally more
difficult to conduct than secondary research (Zikmund et al,2011).
During the course of this research, secondary data was collected from FACTS. Primary data was
also gathered from subscribers in the telecom industry under study. More data was also collected
from customers that were considered as the primary beneficiaries of the systems put in place to
ensure Customer perceived quality of service was achieved. Data was collected using
questionnaires and structured interview questions.
3.2.1. Types of Data
Two types of data that can be gathered in conducting primary research include qualitative and
quantitative data. Qualitative data is widely used for research that does not have subject research
findings to quantification and is often used to examine the attitudes, feelings and motivations of
respondents/subjects. According to Proctor, qualitative data is largely used in exploratory
research to gather large amount of information/data from an amiable sample size. (Proctor, 2005)
Quantitative data is that which is quantifiable in numerical terms and often used in descriptive
research conducted through surveys. Quantitative research is easier to replicate and may require
relatively less amounts of information from a respondent. However, quantitative research is
relatively less probing, more time consuming and relatively more labor intensive to conduct.
39

Quantitative data was gathered in the course of this research through questionnaire and interview
sessions with practitioners and professionals in the telecom industry.
3.3. Research Tools
Tools used in the course of this research to collect involved questionnaires, interviewees and
other data gathering tools.
3.3.1. Questionnaires
A questionnaire can be described as a set of prepared questions designed to generate data
necessary from a respondent in accomplishing the objectives of a research project. This data
collection instrument is usually predetermined, standardized and structured. The questionnaire is
constructed in advance, the same questions are asked all respondents and respondents are usually
required to choose from a list of responses offered by the researcher.
The main variable in the questionnaire was customer perceived Quality of service. The objective
was to determine the customer’s perception and rating of service provided by their service
provider. According to (Shlash Mohammad & Mohammad Alhamadani, 2011) the main form of
data collection was questionnaire. The criteria developed in this study are into two sections. The
first section contains the demography of the respondents including gender, educational level,
occupation and age. The second section includes; the five constructs measuring of SERVQUAL
as proposed by Parasuraman et al. (1988). It is the instrument used to measure service quality
and the five-point Likert Scales and According to (Johnson, Gooding, Wood, Taylor, Pratt, &
Tarrier, 2010) Responses are scored on a five point scale ranging from “Strongly Disagree”,
“Disagree”, “Neutral”, “Agree”, to “Strongly Agree”. The third sections are the instrument used
40

is FACTS (Fast Access Content Trend Statistics) an instrument used in gathering the KPIs from
the telecommunication industry in this case MTN.
Questionnaires enable the researcher to reach out to a larger audience over a broader
geographical area at a lower cost. It is also highly reliable because the respondents cannot alter
the answers/questions.
However, its disadvantages include the fact that it does not allow respondents to elaborate,
expand, classify and illustrate their answers. Respondents are also not allowed the chance to ask
for clarification and may misunderstand the questions, which affect the validity of the
information they give. (Proctor, 2005)
3.3.1.1. Pre-test
According to (Babbie, 2012), pretesting is the measurement of a dependent variable among
subjects. It refers to a trial administration of an instrument to identify flaws. To test the
suitability of the questionnaire and the scale to determining the feasibility of the study, a pre-test
was conducted using a pilot study include a pilot sample of 10 respondents. Pilot study is the
preliminary study of the universe to get an early idea about the study (Babbie, 2012). The pre-
test experience and the results helped in finalizing the questionnaire and to plan the process of
data collection. It also enabled the researcher to make the questionnaire more clear, predictable
and informative. The researcher also met his supervisor and had discussion with him regarding
the questionnaire and he approved it. These discussions gave a lot of insight to the researcher,
which helped in going about with the study. As a result of the pre-test and discussion, few items
that were ambiguous were deleted.
41
3.3.2. Interviews
According to Saunders et al (2009), interviews could either be highly formalized and structured,
using standardized questions for each respondent or informal and unstructured conversation.
They are purposeful discussions between two or more people used for gathering valid and
reliable data that are relevant to research objectives or questions
Interviews can be structured, semi-structured or unstructured as in-depth depending on the level
of formality and structure. Structured interview involve the use of predetermined and
standardized questions referred to as interviews administered questionnaires. Semi-structured
interviews are non-standardized but have a list of themes and questions to be covered, although
they may vary from interview to interview. Unstructured interviews are informal and used to
explore in-depth a general area in the area of interest of the researcher. There is no
predetermined list of questions to work through in this situation, although the researcher needs to
have a clear idea about the aspect(s) that is to be explored (Saunders, Philip, & Thornhill, 2009)
One major advantage of interviews over questionnaires is that it allows respondents to seek
clarification if questions are not understood, leading to more appropriate and relevant responses
enhancing validity of the mechanism. On the contrary, the interviewer’s presence may influence
the respondent to give more socially accepted responses to fit the occasion.
Data on KPIs measures or strategies that are being put in place to manage KPIs and Customer
perceived quality of service through semi-structured interviews of professionals of
telecommunication industries. These interviews will be conducted face to face with a theme of
questions to guide the discussion to ensure that data gathered is relevant to the research
objectives.
42
3.4. Research Strategy
Many strategies can be employed in conducting research of this kind. Experiment, survey and
case study are three of these strategies that could be employed in conducting descriptive,
explanatory and exploratory research.
Experiment is used in determining the casual relationship between two variables, whether a
change in one independent variable causes a change on other dependent variables. Experiments
are most prominent among natural scientist and tend to be used in explanatory and exploratory
research in answering the how and why questions of research problems.
Surveys is a popular strategy in business and management research used in gathering large
amounts of data from sizable populations in answering the questions of who, where, what and
how much in conducting research. Surveys are commonly associated with deductive research
and are comparatively easy to explain and understand. In surveys, data is often collected by
administering questions to a sample of a population and are often used for exploratory and
descriptive research. Surveys provide a quick, inexpensive, efficient and accurate means of
assessing information about the population. Meanwhile, they are also exposed to sampling errors
and respondent errors including; non-response, response bias and deliberate falsification.
Survey is a direct opposite of experiments because while experiments control all extraneous
variables, the boundaries between the phenomenon being studied and the context within which it
is being studied are not evident in a case study. It is often used in explanatory and exploratory
research in answering the questions of what, how and even why of a phenomenon. The primary
advantage of case study is that it pays meticulous attention to detail. It also allows the researcher
43
to carefully study the order of events and concentrates on identifying the relationship between
functions.
The study used quantitative research strategy simply because it is appropriate to answer the
research questions. This strategy will permit the study to measure variables derived from the
SERVQUAL model adequately and came out with fine differences between people in terms of
assessing their perceptions about service quality. This will also give us a yardstick for making
these distinctions and provide the basis for more precise estimates of degree of relationship
between variables. This gives the research findings high reliability and validity (Daniel &
Berinyuy, 2010)
The first part of this research was a survey which was used to determine the opinion of
subscribers and their verdict on their level of satisfaction regarding issues relating to KPIs and
Customer perceived Quality of service according to their subscription plan. This was achieved by
using questionnaire as a research tool distributed using random sampling techniques.
Other quantitative data was also achieved by analysis of records obtained and achieved from
subscribers. This was reviewed and included in the results and analysis presented in chapter four.
Data was also obtained through interviews with experts in the area of Key Performance
Indicators metrics gathered to ascertain whether what has been gathered for further improvement
in quality of service to subscribers in the telecom industry in Ghana is achieved.
3.5. Purpose of Research
The classification of research purposes that are often used by researchers include: Exploratory,
Explanatory and Descriptive (Saunders, Philip, & Thornhill, 2009). In exploratory studies, the
objective is to seek new insight or find out what is happening to clarify a researchers
44
understanding of a problem. These types of research normally begin with a broad focus and
narrows down as the research progresses. Explanatory studies normally seek to establish causal
relationship between two variables.
This research process employs all three perspectives as far as the purpose of research is concern.
At different levels, the research employs one of three perspectives. First is the descriptive part,
which is aimed at obtaining a clear understanding of QoS and Customer Perceived Quality of
service models and framework.
Second, the process of gathering and analyzing primary data was exploratory because it is a
process of finding out QoS trends in the Telecom Industry in Ghana by researching into existing
information and also interviewing experts in the field.
3.6. Ethical Consideration
Researcher made it a responsibility to ensure that the design research is both methodologically
sound and morally defensible to all those who are involved. (Saunders, Philip, & Thornhill,
2009)
3.6.1. Research Ethics
. The following issues were also taken in to consideration and respondents were made fully
aware;
That their identity and privacy was protected
That their participation was expected to be voluntary and that their right to withdraw at
any time was reserved
That they had to give their consent and deception was completely avoided
That their responses was treated with confidentially and anonymity
45
3.6.2. Plagiarism
While being true to the original content, most of the works of others the study used are
paraphrased by the researcher to suit the study and acknowledgement given accordingly.
3.7. Challenges of the Research
Below were some potential challenges, how they affected the outcome of the research and how
best they were controlled.
1. There was a challenge with getting access to interviewees from expert in the KPIs in
MTN.
2. There were likely to be challenges with getting up to 452 respondents to complete the
questionnaires within the limited period for the dissertation. Therefore, the researcher
seeked assistance from Skype, Google drive and other relevant technological tools in
order to help with administering the questionnaires. Some respondents were also likely
not to respond and return the questionnaire due to their nature of work.
3. The cost of lengthy phone call in conducting interviews will also have posed financial
challenge. Therefore, the research conducted the interviews on Skype, Google drive, and
other media where the interviewee was willing to help reduce cost.
3.8. Chapter Summary
The study used questionnaire to collect data by conducting a continuous investigation of Key
Performance Indicators and their relationship with Customer perceived Quality of Service
provided to mobile subscribers. The primary data analyzed are Customer perceived Quality of
Service provided to subscribers.
46

Scholarly journal articles and books on Key Performance Indicators and Customers Perceived
Quality of Services in telecommunication, network quality of service were reviewed
The study examines the relationship between KPIs and Customer perceived quality of service for
mobile subscribers. Data will be observed from two main sources in order to obtain the necessary
grounds to draw conclusions and/or provide suggestions. The first source is the network
providers and the second being users/ subscribers. Data collected from the network provider will
be computational data such as Key Performance Indicators (KPIs). This data was gathered
through review of existing records/data and interviews with relevant stakeholders such as
engineers and customer service officers. Data collected from users included subjective user
experiences obtained through surveys through the distribution of questionnaires and interviews.
The research adopted a descriptive approach to research methods. Data collection was achieved
through the use of survey questionnaires distributed randomly at selected locations across the
capital. A total sample size of 452 questionnaires will be distributed with an optimistic return
rate of 99% expected to be achieved.
Excel and SPSS was employed extensively in analyzing data. Other tools such as Microsoft
draw, calculators and Google drive will be employed to assist in data analysis as well where
necessary.
47

CHAPTER FOUR
DATA PRESENTATION AND ANALYSIS
4. Introduction
4.1. Data Analysis
In order to investigate the subject under study, the research sourced information from two main
sources. These included administering questionnaires to target respondents and KPIs records
over the same period under review. Hence, the chapter is divided conceptually into two sections
with the first part attempting to describe the distribution of the target population. The second
section attempts to establish the relationship between the customers perceived quality of services
and data gathered by the operator also known as the Key Performance Indicators
The first objective of the study was to gather information relating to subscribers’ perceived
Quality of Service (QoS).
The second objective was to make presentation and analysis of data obtained from the operator
(MTN).
4.2. Response Rate
With a research population of about Forty Five Thousand Two Hundred (45,200), In this study,
a population size of Four Hundred and Fifty Two (452) was used out of a target population of
45,200 (Curry, 1984) constituting 1% of the target population.
48
Four Hundred and fifty two (452) questionnaires were administered to MTN subscribers in the
Greater Accra Region. Four Hundred and fifty two (452) responses were received within the
period of one Month , out of which 452 were considered.
The response rate for the survey was hundred (100%). Therefore the actual responses used for
this analysis was one hundred percentage (100%) .
4.3. DEMOGRAPHIC ANALYSIS OF RESPONDENTS
4.3.1. Distribution by Sex
Out of the 452 respondents, 52.21% were male and the remaining 47.79% were females
49
Figure 4.1.Table 4-2 Table Showing Respondents by Sex
Gender Respondents PercentageMale 236 52.21Female 216 47.79TOTAL 452 100.00
Gender Respondents PercentageMale 236 52.21Female 216 47.79TOTAL 452 100.00
Male52%
Female48%
Gender Distribution of Respondents
Figure 4-4 Pie Chart Showing Distribution of Respondents by Sex
4.3.2. Age Distribution of Respondents
The Figure 4.2 below represents the age range of respondents. Majority of the respondents
representing 40.71% of the respondents were between 21 and 30 years old while 8% of the
respondents were 20 years and below. Thirty eight percent (38%) of the respondents aged
between 31 and 40 years old. Thirteen percent (13%) were 40 years above.
50

Table 4-3 Showing the Distribution of Respondents by Age
Description Respondents Percentage20 and Below 36 7.9621-30 184 40.7131-40 172 38.05Above 40 60 13.27Total 452 100.00
Description Respondents Percentage20 and Below 36 7.9621-30 184 40.7131-40 172 38.05Above 40 60 13.27Total 452 100.00
20 and Below8%
21-3041%
31-4038%
Above 40
13%
Age Distribution of Respondents
Figure 4-5 Showing the Distribution of Respondents by Age
4.3.3. Occupation Distribution of Respondents
Out of the 452 respondents, 33.63% were public/civil servants, 25.66% were private sector
workers and students made up of 21.24% .The rest were Business Persons (non-formal workers)
making up the remaining 19.47% (Table 4.3. and Figure 4.3.).
51

Table 4-4 Occupation Distribution of Respondents
Occupation Respondents PercentageStudent 96 21.24Business Person 88 19.47Public Servant/Civil Servant 152 33.63Private Sector 116 25.66TOTAL 452 100.00
Occupation Respondents PercentageStudent 96 21.24Business Person 88 19.47Public Servant/Civil Servant 152 33.63Private Sector 116 25.66TOTAL 452 100.00
Student21%
Business Person19%
Public Servant/Civil Ser-
vant34%
Private Sector26%
Occupation Distribution of Respodents
Figure 4-6 Occupation Distribution of Respondents
4.3.4. Income Bracket Distribution of Respondents
Figure 4.4 below shows the income bracket distribution of the respondents. 39.82% earned
500GHS and below. 30.97 % earned above 1000 GHS and 17.7% earned between 500 and 1000.
The remaining 11.50 % did not specify their income levels.
52

Table 4-5. Income Bracket Distribution of Respondents
Income Bracket Respondents Percentages500 and Below 180 39.82500-1000 80 17.70Above 1000 140 30.97Not applicable 52 11.50TOTAL 452 100.00
Income Bracket Respondents Percentages500 and Below 180 39.82500-1000 80 17.70Above 1000 140 30.97Not applicable 52 11.50TOTAL 452 100.00500 and Below
40%
500-100018%
Above 100031%
Not applicable12%
Income Level Distribution of Respondents
Figure 4-7 Income Bracket Distribution of Respondents
4.3.5. Education Level Distribution of Respondents
Figure 4.5 below shows the Educational Level distribution of the respondents. Out of 452
respondents, 67.26% were in tertiary, 13.27% were from SHS, 8.85% were from Post SHS level,
7.96% were from JHS level and the remaining 2.65% recorded None (Table 4.5. and Figure
4.5.).
53

Table 4-6 Education Level Distribution of Respondents
None 12 2.65JHS 36 7.96SHS 60 13.27Post SHS 40 8.85Tertiary 304 67.26TOTAL 452 100.00
None 12 2.65JHS 36 7.96SHS 60 13.27Post SHS 40 8.85Tertiary 304 67.26TOTAL 452 100.00
3%8%
13%
9%
67%
Education Level Distribution of Respondents
12345
Figure 4-8 Education Level Distribution of Respondents
4.3.6. Distribution of Respondents by Subscription Plan
Figure 4.6 below shows the subscription plan of the respondents. Out of a total respondents of
452, 84.07% were prepaid subscribers whilst the remaining postpaid subscribers respondents
were 15.92% (Table 4.6. and Figure 4.6.).
54

Table 4-7 Distribution of Respondents by Subscription Plan
Suscription Plan Respondents PercentagePrepaid 380 84.071Postpaid 72 15.929TOTAL 452 100.000
Suscription Plan Respondents PercentagePrepaid 380 84.071Postpaid 72 15.929TOTAL 452 100.000
Prepaid84%
Postpaid16%
Suscription Plan Distribution of Respondents
Figure 4-9 Distribution of Respondents by Subscription Plan
4.4. Subscriber Perceived Quality of Service
The subscriber perceived Quality of Service (QoS) is assessed using the SERVQUAL Model
4.4.1. Research Questionnaire 1: It is easier to place a call using MTN. (Call setup
Success Rate)
The purpose of this question was to sort the subscribers perception on call setup success rate
(CSSR) using the MTN network. Call Setup Success Rate refers to the time it takes for a
subscriber to get in to a call (Mishra, Advanced Cellular Network Planning and Optimisation:
2G/2.5G/3G...Evolution to 4G, 2004).
55

Out of 452 respondents 60.2% said, it was easier to place a successful call on MTN. However,
120 respondents representing 26.6% of the total respondents said placing successful calls on the
network was not successful.
Figure 4.7 shows that Call setup success rate was largely successful since a mean of 3.40 is
showing positive responds
Table 4-10 Subscriber Perception on Call Setup Success Rate
It is easier to place a call using MTN(CSSR)
Frequency PercentValid Percent
Cumulative Percent
Valid Strongly Disagree
36 7.8 8.0 8.0
Disagree 84 18.1 18.6 26.5
Neutral 60 12.9 13.3 39.8
Agree 208 44.8 46.0 85.8
Strongly Agree 64 13.8 14.2 100.0
Total 452 97.4 100.0
Missing System 12 2.6
Total 464 100.0
56

Figure 4-7 Subscriber Perception on Call Setup Success Rate
4.4.1.1. CSSR Statistics from Network Provider (KPI)
Over the same period under review, network statistics (secondary data) shows that, an average of
99.38% of calls generated over the Second Generation (2G) network and 99.37 of calls generated
over the Third Generation network within the network were largely successful.
Juxtaposing the responses with the results obtained from the network provider using network
statistics as shown in the table below, it indicates that over the same period under study the
average CSSR for both 2G and 3G was 99.37 (Figure 4.8).
57
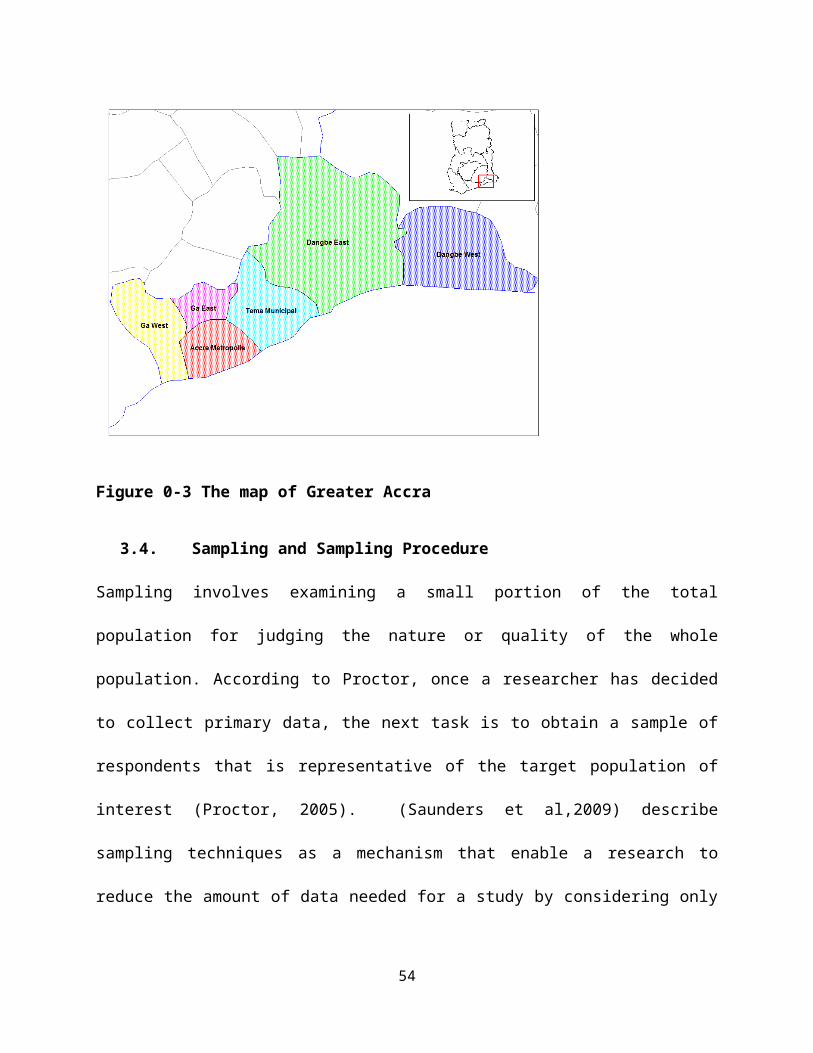
December Jan Feb March
2G Results 99.4 99.27 99.46 99.39
3 G Results 99.45 99.29 99.44 99.29
Average 99.43 99.28 99.45 99.34
90.591.592.593.594.595.596.597.598.599.5
CSSR Statistics From Network ProviderP
erce
nta
ge o
f C
SS
R
Figure 4-11 CSSR Statistics from Network Provider
4.4.1.2. Relationship between Subscriber Perception and Network Statistics
on CSSR
With an industry standard for CSSR being within an average of 98 and 99%, it can be established
that the majority (60.2%) of subscribers have a perception that CSSR largely correlate that it is
easier to place a call using MTN from the network statistics report.
(26.6%) however said that, the network statistics report confirms the minority group of
respondents indicated that CSSR was bad under the period of study.
3.40 mean shows largely that the subscriber perception on call set up success rate was successful.
58

4.4.2. Research Questionnaire 2: Calls are successful to the end of the call. (Call
Drop Rate)
Call Drop Rate (CDR) refers to the termination of a call not requested by any of the parties in the
call (Mishra, 2004). The purpose of this question was to determine the perception of the
subscribers on placing a call and staying on the call until the end of the conversation.
As with CDR, 56.7% of the respondents agreed that calls remain active to the end of the
conversation while 31.9% disagreed. (Table 4.10.)
This generated a mean of 3.23 from Figure 4-10. It can therefore be concluded that majority of
the respondents 56.7% are satisfied with calls that are successful to the end of the call.
Table 4-12 Subscriber Perception of CDR
All calls placed stay active until the end of the call (CDR)
Frequency PercentValid Percent
Cumulative Percent
Valid Strongly Disagree
40 8.6 8.8 8.8
Disagree 104 22.4 23.0 31.9
Neutral 52 11.2 11.5 43.4
Agree 224 48.3 49.6 92.9
Strongly Agree 32 6.9 7.1 100.0
Total 452 97.4 100.0
Missing System 12 2.6
Total 464 100.0
59

Figure 4-13 Subscriber Perception of CDR
4.4.2.1. CDR Statistics from the Network Provider
Data from the network statistics obtained for CDR from the network operator as presented below
revealed that the CDR over the period under review averages for 2G 1.56% and 0.86 for 3G and
a total average of 1.11.
60
December Jan Feb March
2G Results 1.41 1.32 1.31 1.38
3 G Results 0.94 0.80 0.80 0.89
0.5
1.5
CDR Statistics From Network Service ProviderCD
R
Figure 4-14 CDR Statistics from Network Service Provider
4.4.2.2. Relationship between Subscriber Perception and Network Statistics
on CDR
Industry standards for CDR according to Mishra are between 1 and 2% (Mishra,2004).
According to the NCA, CDR in Ghana should be =<3%. However, network statistics report
indicates that the network CDR (1.11%) falls within recommended standards and supports the
56.7% of respondents who said calls remain active throughout the conversation.
The trends revealed by both the subscriber perception and network statistics are that network
statistics on CDR correlate with the subscriber perception of calls are successful to the end of the
call. This generated a mean of 3.23 from the Figure 4-10. It can therefore be concluded that
majority of the respondents representing 56.7% are satisfied with success of calls.
61

4.4.3. Research Questionnaire 3: The Network is always available. (Network
Capacity)
Network capacity means the number of subscribers the network can support (Mishra, 2004). A
higher capacity indicates that the network can support a larger number of subscribers and the
opposite is true.
The survey revealed that 45.1% of the respondents said that the network is always available
indicating a high capacity of the network for the existing number of subscribers during the period
under review. However, 36.3% of the respondents disagreed about the network capacity
Table 4.11.
This generated a mean of 3.11 from Figure 4.11.It can therefore be concluded that majority of
the respondents 45.1% agreed with capacity of the network is always available.
Table 4-11 Subscriber Perception of Network Capacity
The network is always available(Capacity)
Frequency PercentValid Percent
Cumulative Percent
Valid Strongly Disagree
48 10.3 10.6 10.6
Disagree 116 25.0 25.7 36.3
Neutral 84 18.1 18.6 54.9
Agree 148 31.9 32.7 87.6
Strongly Agree 56 12.1 12.4 100.0
Total 452 97.4 100.0
Missing System 12 2.6
Total 464 100.0
62

Figure 4-15 Subscriber Perception of Network Capacity
4.4.3.1. Network Capacity for Network Statistics
For the same period under review Network statistics shows an average of 61194.31 Figure 4.13.
A detailed review of the network capacity statistics shows that in January, the capacity of the
network increased from 60386.01 to 61193, which subsequently dropped to 60688.40 in
February 2014. In March however, the capacity increased to 62509.81.
63

December Jan Feb March
2G Results 60386.01 61193.00 60688.40 62509.81
59250.00
59750.00
60250.00
60750.00
61250.00
61750.00
62250.00
62750.00
Network Capacity Statistices From Network Service ProviderP
erce
nta
ge o
f N
etw
ork
Cap
acit
y
Figure 4-16 Network Capacity Statistics from Network Service Provider
4.4.3.2. Relationship of Subscriber Perception on Network Capacity to
Network Statistics
The perception of the subscriber will be determined by the period within which the subscriber is
basing his/her judgment on the availability/capacity of the network. However, averagely, the
network capacity of 61194.31 over the period could affect the availability of the network to the
subscriber and thus influence their perception either positively or negatively depending on the
number of subscribers at the location under review during the period.
This generated a mean of 3.11 from the graphical representation above Figure 4-12. It can
therefore be concluded that majority of the respondents representing 45.1% largely agreed that
capacity is good.
4.4.4. Research Questionnaire 4: The quality of the call good enough (Quality)
Even though call quality can be independent of the service provider as call quality is affected by
extraneous factors such as the environment, terrain and the weather, the subscriber still measures
64
call quality as a service provided by the network provider. Call quality is classed as a measure
from 0 through to 7 Bit Error Rate (BER) with 0 being the best and 7 being the worse.
Majority of the respondents (40.7%) rated the network under review disagreed while 36.9%
agreed (Table 4.14. Figure 4.15)
This generated a mean of 2.94 from Figure 4.15. . It can therefore be concluded that majority of
the respondents (40.7%) disagreed that the perception of the network call quality is poor.
Table 4-17 Subscriber Perception on Call Quality
The service provides quality for money (Call quality)
Frequency Percent
Valid Percent
Cumulative Percent
Valid Strongly Disagree
32 6.9 7.1 7.1
Disagree 152 32.8 33.6 40.7
Neutral 101 21.8 22.3 63.1
Agree 147 31.7 32.5 95.6
Strongly Agree 20 4.3 4.4 100.0
Total 452 97.4 100.0
Missing System 12 2.6
Total 464 100.0
65

Figure 4-18 Subscriber Perception on Call Quality
4.4.4.1. The Network Statistics on Call Quality
Results from Network Statistics obtained from the network operator indicated an average of 4.72
BER. It reveals that the network services has not been of best quality as a standard indicates that
an average of 4 BER comes with an amount of conversation distortions (Mishra, 2004) .
66

December Jan Feb March
Results 9.77 3.18 2.97 2.95
0.51.52.53.54.55.56.57.58.59.5
BER Statistics From Network Service ProviderBi
t Er
ror
Rate
Figure 4-19 BER Statistics from Network Service Provider
4.4.4.2. Relationship between Subscriber Perception and Network Statistics
on Call Quality
The network statistics result confirms the majority of the respondents (40.7%) perception that the
network quality over the period under review was unsatisfactory. The trend suggested that
subscriber perceptions relating to call quality can be used as a true determinant of call quality. It
can also be suggested that network call quality of the network under review has been largely of
poor quality during the period under review, this can be correlated by the graphical
representation of the mean of 2.94 signifying that subscriber perception of call quality is poor.
4.4.5. Research Questionnaire 4: The network is available everywhere in Ghana
(Coverage)
The purpose of this survey question was to determine the subscriber’s perception of the
availability of the network under review within a certain geographical area. Coverage is the
67

geographical area in which a wireless network provider offers cellular service for mobile phone
subscribers.
Out of the 452 respondents, 61.0% said the network under review largely agreed that coverage in
the geographical area of the research is good, while 31.0% disagreed that the network is not
available everywhere in Ghana. Figure 4.12.
Since, the network under review does not measure or keep statistics on coverage, the researcher
relied solely on the subscribers’ perception on coverage. The mean of 3.35 from the graphical
representation (Fig 4-18) under this review largely agreed that the network is available
everywhere in Ghana.
Table 4-20 Subscriber Perception on Network Coverage
The network is available everywhere in Ghana(Coverage)
Frequency PercentValid Percent
Cumulative Percent
Valid Strongly Disagree
52 11.2 11.5 11.5
Disagree 88 19.0 19.5 31.0
Neutral 36 7.8 8.0 38.9
Agree 200 43.1 44.2 83.2
Strongly Agree 76 16.4 16.8 100.0
Total 452 97.4 100.0
Missing System 12 2.6
Total 464 100.0
68

Figure 4-21 Subscriber Perception on Network Coverage
69

4.4.6. Research Questionnaire 5: The customer Service is readily available and are
always willing to assist
This question sort to determine the subscriber perception on the quality of customer service
offered by the network under review.
The results revealed from Table 4.19 that majority of the subscribers (49.6%) perceives the
customer service of the network service provider are unwilling to assist subscribers while 35.3%
think the customer service is good . The Figure 4.20.
This generated a mean of 2.82 (Figure 4.20). It can therefore be concluded that majority of the
respondents (49.6%) agreed that customer service provided by customer service is poor.
Table 4-22 Subscriber Perception on Customer Service
The Customer service is readily available and are always willing to assist
Frequency PercentValid Percent
Cumulative Percent
Valid Strongly Disagree
56 12.1 12.4 12.4
Disagree 168 36.2 37.2 49.6
Neutral 68 14.7 15.0 64.6
Agree 120 25.9 26.5 91.2
Strongly Agree 40 8.6 8.8 100.0
Total 452 97.4 100.0
Missing System 12 2.6
Total 464 100.0
70
Figure 4-23 Subscriber Perception on Customer Service
4.4.7. Research Questionnaire 6: I will recommend the network to another person
The purpose of this research question was to sort for the overall perception of the subscriber on
the network under review. 46.0% of the subscribers said overall they were likely to recommend
the network to others while 34.5% said they would not recommend others to use the network
services Table 4.21 and from Figure 4-22 with a mean of 3.06 subscribers are largely likely to
recommend the network to another person.
71
Table 4-24 Subscriber's Willingness to recommend the Network Service Provider
I will recommend MTN to another person
Frequency PercentValid Percent
Cumulative Percent
Valid Strongly Disagree
52 11.2 11.5 11.5
Disagree 104 22.4 23.0 34.5
Neutral 88 19.0 19.5 54.0
Agree 180 38.8 39.8 93.8
Strongly Agree 28 6.0 6.2 100.0
Total 452 97.4 100.0
Missing System 12 2.6
Total 464 100.0
72
Figure 4-25 Subscriber's Willingness to recommend the Network Service Provider
DISCUSSION OF RESULTS
4.4.8. Research Question One: What criteria is used in measuring customer
perception of Quality of Service (QoS).
Guided by this question, the study sort to understand the criteria involved in measuring QoS
from the subjective perception of subscriber. SERVQUAL as the single most reliable method of
measuring customer’s perception of quality is extensively used in the course of the research.
Thus, guided by this principle, the questionnaire was fashioned to take care of the various tenets
of SERVQUAL while adapting it to meet the other aspects of the research objective.
73
4.4.9. Research Question Two: What KPIs are monitored by the Network Service
Providers
The next part of the study was to determine KPIs used by network service provider in
determining the Quality of the service provided to subscribers. The answer to this question was
achieved during interview sessions with professionals in the industry and secondary data
obtained from the operator. The following sections reports on the various trends and
relationships observed on each of the KPIs monitored by the network service providers.
1. CSSR: used to measure or determine successful call setups over a period.
2. CDR: used to determine call drop rate
3. Handover Success Rate: is used to experience a seamless call a subscriber is handed over
to the next cell when subscriber reaches the cell boundary.
4. Call Quality: Used to measure the quality of voice calls during a call session
5. Coverage: Used to measure area within which network service is available to subscribers
6. Capacity: Used to measure the number subscribers in the network can support measured
by network blocking
These KPIs are routinely monitored by the network service provider using two measuring
techniques namely drive tests and network statistics.
4.4.10. Does KPIs measurements correlate with customer perceptions of Quality
The trends observed from data obtained from both primary and secondary data revealed a general
direct correlation between subscriber perceptions and the results obtained from the network
operator. The following section enunciates these correlations individually.
74
CSSR – The study revealed that there is a strong correlation between KPI measurement of CSSR
and subscriber perception on call set up quality. The assertion is supported by the fact that
99.38% of 2G and 99.37% of 3G call setups were generally successful which falls within the
standard of 98 and 99% these measurement also agreed by a majority of respondents (60.18%)
and a mean of 3.40 showing that majority of the respondents agreed that CSSR was largely
successful.
CDR – There is a strong relationship between subscriber perceptions and KPI readings obtained
from network statistics and drive test results. Industry standards are between 1 and 2% to which
the network recorded 1.11% average. This means the network recorded a good call drop rate,
which was supported by majority of the respondents (56.7%) and a mean of 3.23 showing that
majority of the respondents agreed that CDR was largely successful.
Capacity- There is a strong relationship between subscriber perceptions and KPI readings
obtained from network statistics results. Majority of the respondents (45.1%) recorded a good
network availability, this is largely been backed by a mean of 3.11 showing that majority of the
respondents agreed that the capacity is good
Call Quality – The study showed that the relationship between the call quality network statistics
and the subscriber’s perception of quality of calls could be clouded by other factors which is
beyond the scope of this research. Even though majority (40.7%) of the respondents said the call
quality over the period was bad, 36.9% thought otherwise. The near splits of perceptions
correlate the network statistics results, which indicated an average of 4.72 BER, which false
short of an average standard of 7 BER (Mishra, Advanced Cellular Network Planning and
Optimisation: 2G/2.5G/3G...Evolution to 4G, 2004). Starting from 9.77 BER and dropping to
75

2.95 BER in March 2014, the near split of opinions on call quality can be associated with the
quality recorded over the period. This does not affect the conclusion that the results obtained
from network statistics and drive test does not influence subscriber perceptions on call quality.
The mean of 2.94 narrowly shows that the perception of call quality is poor.
On Network Coverage, majority of the respondents agree largely that the network under review
has good coverage within the area under review. This perception was distributed by 61.0% of the
respondents representing the majority under study confirmed good network coverage whilst 31.0
respondent otherwise. This study under review revealed that a mean of 3.35 was realized and
largely showed that network coverage under the study was largely good.
The perception of the respondents on customer service of the network service provider under
study is that the customer service offered to subscribers is largely poor. This perception was
shared by 49.6% of the respondents representing a majority of the entire 452 respondents in the
study as against 35.3% who think otherwise. A mean of 2.82 of the respondents largely
perceived that customer service was not readily available.
The final intervening question in the questions had the objective of obtaining the general
perception of the respondents on the network under review. Majority of the respondents (46.0%)
said they were likely to recommend the network to others while 34.5% think otherwise. A mean
of 3.06 under study of the respondents largely recommend MTN to other subscribers.
76

4.5. Chapter Summary
Analysis of the research results both primary from the survey and interviews conducted as well
as data obtained from secondary sources such as the data on network statistics and drive tests
results were discussed in the chapter.
In the course of the chapter, data was analyzed for trends and relationships as well as reasons for
such relationships.
Primary data was obtained with the assistance of a questionnaire and interviews. Secondary data
was obtained from the network’s routine network statistics reports and drive test results. These
three sources of data served as the bases of all trends, relationships, conclusions and subsequent
recommendations made in the course of the research.
77
CHAPTER FIVE
SUMMARY, CONCLUSION AND RECOMMENDATIONS
4.6. SUMMARY
This study “The relationship between Key Performance Indicators (KPIs) of Mobile Service
Providers and Customer Perceived Quality of Service (QoS)” sort to determine and establish the
relationship between subscriber perception on the quality of service and the various KPIs
monitored by the network service provider.
The study began with an introduction and thorough investigation into the architecture of mobile
telecommunication technologies. It was sectioned into five chapters beginning with chapter one
where background of the study, problem statement and justification for the research study was
presented. Other Relevant aspects of the research including the objectives, purpose and research
questions were established in chapter one as well. In chapter two, review of relevant literature
relating to the subject areas was elaborately done. Areas discussed included a review of past
studies of peer-reviewed journals on mobile network technologies including the generations and
architecture of mobile telecommunications networks. The methodologies used in the research
study were discussed in chapter three. The research made use of an appropriate data collecting
instruments such as questionnaires and, interviews. Desk review of secondary data and existing
reports were also used. Data obtained using these techniques were carefully reviewed and
analyzed in chapter four.
The study among other things sort to answer the following questions
78

What is the criteria for measuring customer’s perception of Quality of Service (QoS) of
telecom mobile services
What Key Performance Indicators are used by the Telecom Providers to measure Quality
of Service
Does Key Performance Indicator measurements correlate the customer’s perception of
Quality of service (QoS).
A survey, which involved a set of questions, organized into a structured questionnaire were
administered using a random sampling technique in the area under review was done to serve as a
source of primary data for review purposes. The area under review included suburbs in the
greater Accra region of Ghana specifically in the Ga East, West and South.
The criteria for selecting respondents required that respondents should be MTN subscribers and
of the age capable of understanding the questions and answering them accordingly.
Interview sessions with professionals also helped the researcher to understand basic concepts in
the subject area. Professionals included were those directly involved in the measurement and
analysis of KPIs. Three (3) professionals were interviewed in three (3) separate sessions.
Secondary data from routine network statistics and drive tests were also analyzed and served as
the bases for all comparative analysis carried out.
79
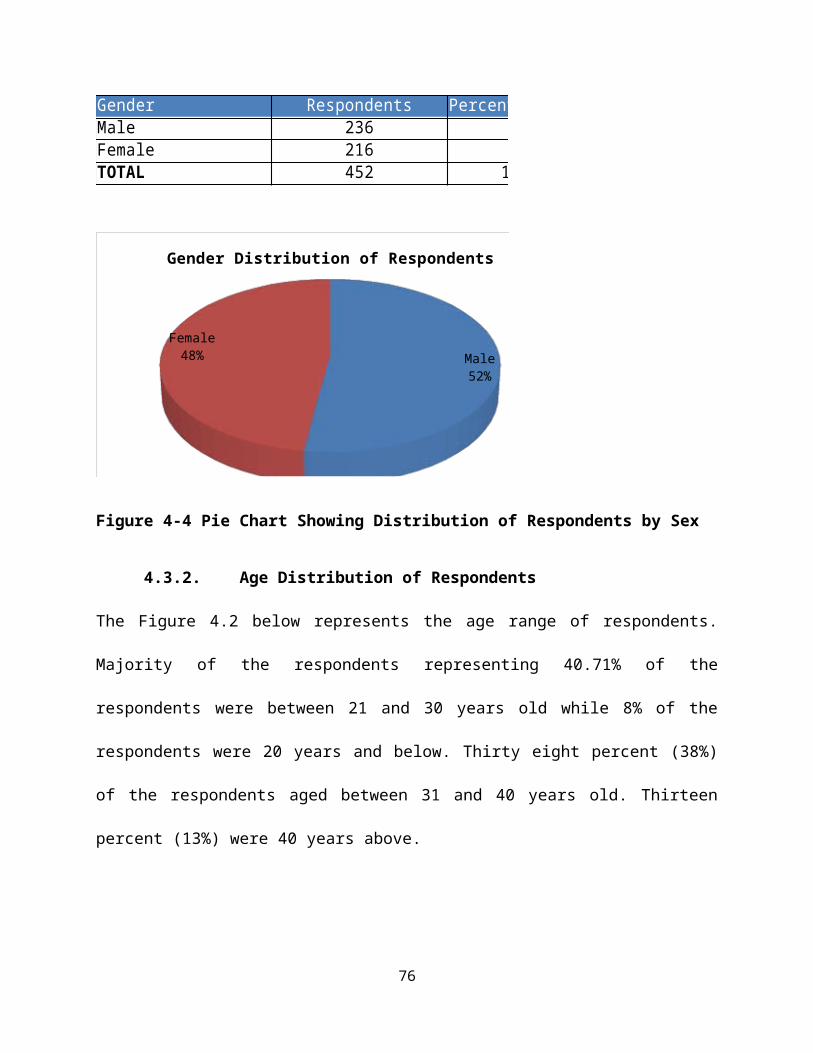
4.7. CONCLUSION
By the end of the research project and based on trends and relationships observed from data
available at the disposal of the researcher, the following conclusions were arrived. Using the
initial research questions discussed in chapter one of this report.
Question 1:What is the criteria for measuring customer’s perception of Quality of Service (QoS)
of telecom mobile services ?
SERVQUAL as the single most reliable method of measuring customer’s perception of quality is
extensively used in the course of the research. Thus, guided by this principle, the questionnaire
was fashioned to take care of the various tenets of SERVQUAL while adapting it to meet the
other aspects of the research objective.
Question 2:What Key Performance Indicators are used by the Telecom Providers to measure
Quality of Service ?
The following sections reports on the various trends and relationships observed on each of the
KPIs monitored by the network service providers.
1. CSSR: used to measure or determine successful call setups over a period.
2. CDR: used to determine call drop rate
3. Handover Success Rate: is used to experience a seamless call a subscriber is handed over
to the next cell when subscriber reaches the cell boundary.
4. Call Quality: Used to measure the quality of voice calls during a call session
80
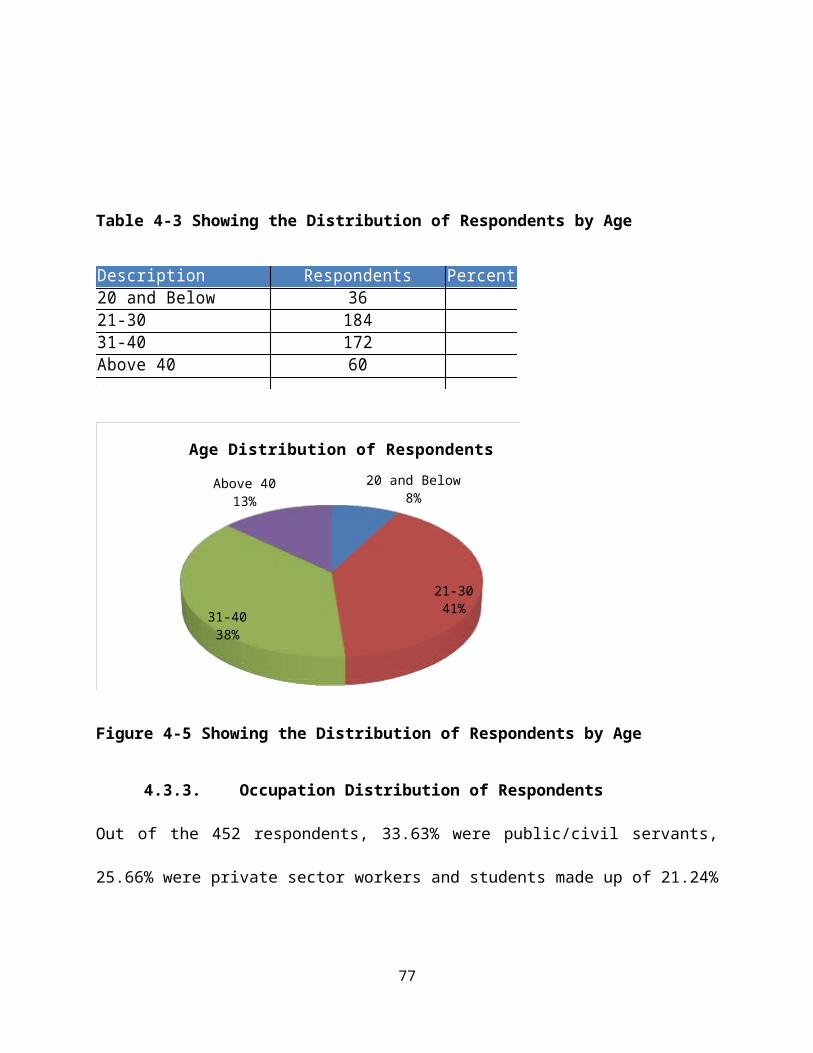
5. Coverage: Used to measure area within which network service is available to subscribers
6. Capacity: Used to measure the number subscribers in the network can support measured
by network blocking
These KPIs are routinely monitored by the network service provider using two measuring
techniques namely drive tests and network statistics.
Question 3:Does a Key Performance Indicator measurement correlate the customer’s perception
of Quality of service (QoS).
CSSR – The study revealed that there is a strong correlation between KPI measurement of CSSR
and subscriber perception on call set up quality.
The assertion is supported by the fact that 99.38% of 2G and 99.37% of 3G call setups were
generally successful which falls within the standard of 98 and 99% these measurement also
agreed by a majority of respondents (60.18%) and a mean of 3.40 showing that majority of the
respondents agreed that CSSR was largely successful.
CDR – There is a strong relationship between subscriber perceptions and KPI readings obtained
from network statistics and drive test results. Industry standards are between 1 and 2% to which
the network recorded 1.11% average. This means the network recorded a good call drop rate,
which is supported by majority of the respondents (56.7%) and a mean of 3.23 showing that
majority of the respondents agreed that CDR was largely successful.
Capacity- There is a strong relationship between subscriber perceptions and KPI readings
obtained from network statistics results. Majority of the respondents (45.1%) recorded a good
81

network availability, this is largely been backed by a mean of 3.11 showing that majority of the
respondents agreed that the capacity is good
Call Quality – The study showed that the relationship between the call quality network statistics
and the subscriber’s perception of quality of calls can be clouded by other factors which is
beyond the scope of this research. Even though majority (40.7%) of the respondents said the call
quality over the period was bad, 36.9% thought otherwise. The near splits of perceptions
correlate the network statistics results, which indicated an average of 4.72 BER, which false
short of an average standard of 7 BER (Mishra, 2004). Starting from 9.77 BER and dropping to
2.95 BER in March 2014, the near split of opinions on call quality can be associated with the
quality recorded over the period. This does not affect the conclusion that the results obtained
from network statistics and drive test do influence subscriber perceptions on call quality. The
mean of 2.94 shows that the perception of call quality is poor.
On Network Coverage, majority of the respondents agree largely that the network under review
has good coverage within the area under review. This perception was distributed by 61.0% of the
respondents representing the majority under study confirmed good network coverage whilst 31.0
respondent otherwise. This study under review revealed that a mean of 3.35 was realized and
was largely showed that network coverage under the study was largely good.
The perception of the respondents on customer service of the network service provider under
study is that the customer service offered to subscribers is largely poor. This perception was
shared by 49.6% of the respondents representing a majority of the entire 452 respondents in the
study as against 35.3% who think otherwise. A mean of 2.82 of the respondents largely
perceived that customer service was not readily available.
82
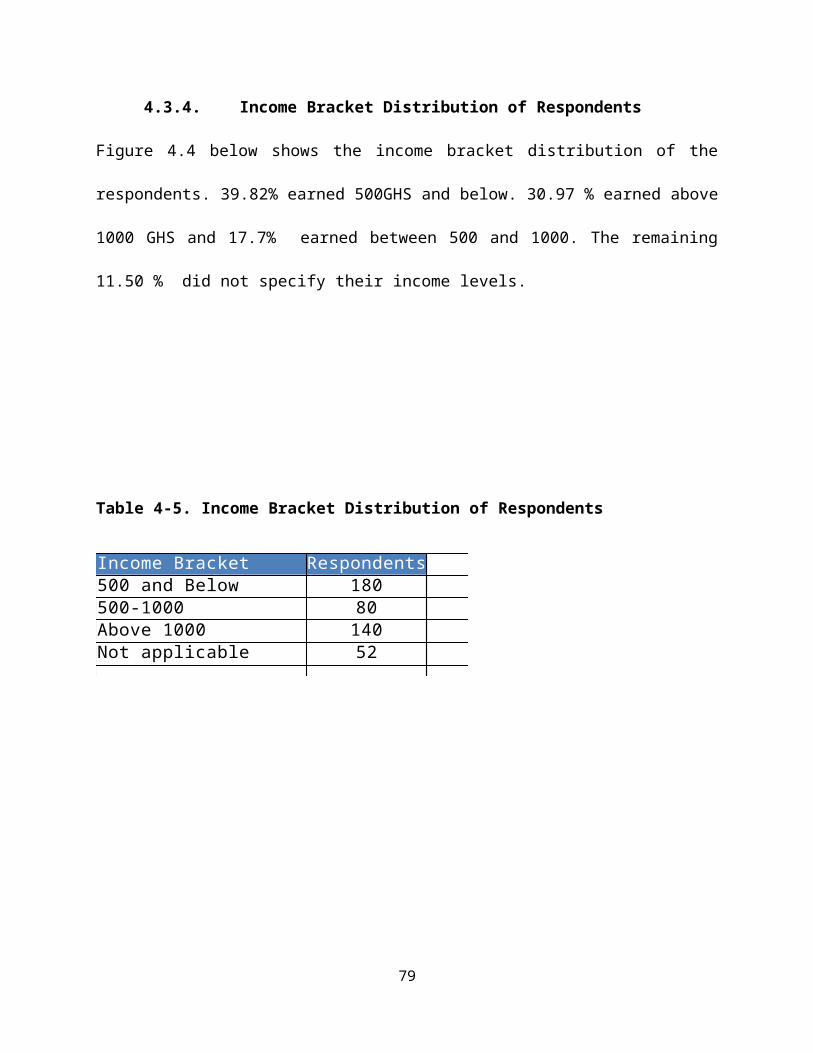
The final question in the questions had the objective of obtaining the general perception of the
respondents on the network under review. Majority of the respondents (46.0%) said they were
likely to recommend the network to others while 34.5% think otherwise. A mean of 3.06 under
study of the respondents largely recommend MTN to other subscribers.
83
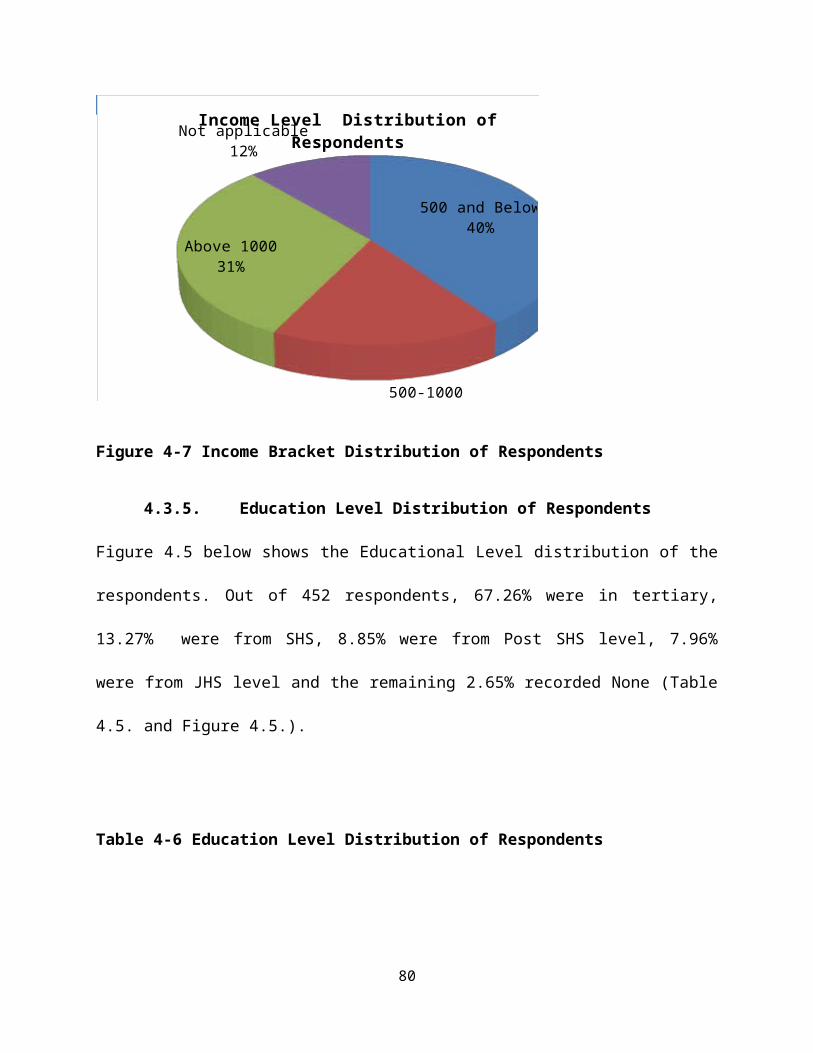
4.8. Recommendations
The researcher admits that, the study did not involve the entire subscriber base of the network
under review; it might not necessarily provide the bases for conclusions on the performance of
the network service provider. Hence future research should consider expanding the population
and /sample size.
The study was also limited in scope to only one network service provider. To get a true reflection
of the subject area, future research should include the other five network service providers in the
study. This will also reduce biases introduced by subscribers having multiple SIM cards
The network providers should not limit the assessment of quality of service to the measurement
of KPIs which measurement is on the cell level, rather they should get tools that can measure
individual subscribers using subscribers Mobile Station – ISDN (MSISDN), they should consider
getting feedback from their subscriber since their perceptions on quality can serve as a guide to
improve the quality of services rendered to subscribers, this also applies to the regulators. Instead
of relying on equipment and measurement devices, regulators should also consider carrying out
random survey to solicit for subscriber perceptions on the quality of service rendered to
subscribers
It is also recommended that the network provider should consider reviewing their customer
service department
Finally, this research is not conclusive as it relies largely on subscriber perceptions and historical
(secondary data) from the network operators. Future researchers should consider participating in
KPI measurements to get first hand primary data from which inferences should be made.
84
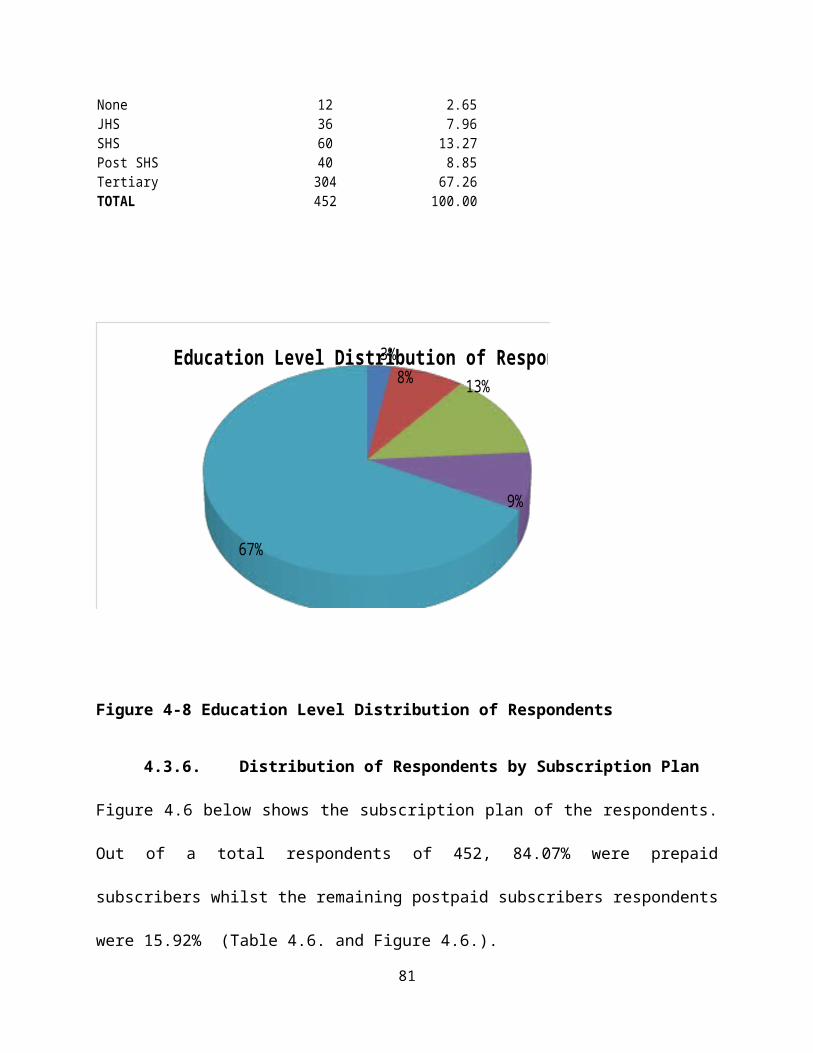
Appendix I : Questionnaires
Section A. Demographic Information
AGE Distribution
o 20 and below
o 21-30
o 31-40
o Above 40
Sex
o Male
o Female
o Other
Occupation
o Student
o Business Person
o Public Servant/Civil Servant
o Private Sector
Income Bracket
o 500 and Below
o 500-1000
o Above 1000
o Not applicable
85

Education Level
o None
o JHS
o SHS
o Post SHS
o Tertiary
Your Subscription Plan
o Prepaid
o Postpaid
How long have you been using MTN account
o Under 1 year
o 1-5 years
o 5-10 years
o Above 10 years
86

Section B: Customer Perceived Quality of Service using SERVQUAL Model
1. Research Questionnaire 1 .It is easier to place a call using MTN(Call setup Success
Rate)
o Strongly Agree
o Agree
o Neutral
o Disagree
o Strongly Disagree
2. Research Questionnaire 2 . All calls placed stay active until the end of the call (Call
Drop Rate)
o Strongly Agree
o Agree
o Neutral
o Disagree
o Strongly Disagree
3. Research Questionnaire 3. The network is always available (Congestion Rate)
o Strongly Agree
o Agree
o Neutral
o Disagree
o Strongly Disagree
4. The customer Service is readily available and are always willing to assist
87

o Strongly Agree
o Agree
o Neutral
o Disagree
o Strongly Disagree
5. The network is available everywhere in Ghana (Coverage)
o Strongly Agree
o Agree
o Neutral
o Disagree
o Strongly Disagree
6. The service provides quality for money (Call quality)
o Strongly Agree
o Agree
o Neutral
o Disagree
o Strongly Disagree
7. I will recommend MTN to another person
o Strongly Agree
o Agree
o Neutral
o Disagree
88

o Strongly Disagree
Bibliography
Adrenalin Media. (2012). GHANA CHAMBER OF TELECOMMUNICATIONS M-Powering People . Simpacting Lives. Retrieved April 15, 2014, from http://www.telecomschamber.org/: http://www.telecomschamber.org/
Andelin, J., Garcia, L., & Clair, K. S. (1992, March). Global Standards: Building Blocks for the Future. Retrieved April 20, 2014, from http://www.strategicstandards.com/files/GlobalStandards.pdf: http://www.strategicstandards.com/files/GlobalStandards.pdf
Antony, Oodan; Keith, Ward; Catherine, Savolaine; Mahmoud, Daneshmand; Peter, Hoath. (2009). Telecommunications Quality of Service Management. IET.
Arokiamary, V. J. (2009). Cellular and Mobile Communication. Technical Publications .
Babbie, E. (2012). The practice of social research. Cengage Learning.
Brennan, B., Fleck II, J., & van der Meer, S. ( Dec 23, 2010). Modelling Autonomic Communication Environments: 5th IEEE International Workshop, MACE 2010, Niagara Falls, Canada, October 28, 2010, Proceedings. Springer.
Broadersen, D. J. (2008). Predictors of peer Leader success as strengths counsellors in a First-year seminar. ProQuest.
Bryman, A., & Bell, E. (2011). Business Research Methods 3e. OUP Oxford.
Business Ghana. (2014, April 02). Business Ghana. Retrieved April 15, 2014, from http://www.businessghana.com/portal/index.php: http://www.businessghana.com/portal/index.php
Commision, N. C. (2013, December 16). Nigerian government to prosecute telecom providers for poor service delivery- Minister. Retrieved April 15, 2014, from http://www.premiumtimesng.com/news/151566-nigerian-government-prosecute-telecom-providers-poor-service-delivery-minister.html: http://www.premiumtimesng.com/news/151566-nigerian-government-prosecute-telecom-providers-poor-service-delivery-minister.html
Craighead, G. (2009). High-Rise Security and Fire Life Safety. Butterworth-Heinemann.
89

Curry, J. (1984). Populations and Sampling; Sample Size Rule of Thumb. Retrieved April 20, 2014, from http://www.napce.org/documents/research-design-yount/07_Sampling_4th.pdf: http://www.napce.org/documents/research-design-yount/07_Sampling_4th.pdf
Daniel, C. N., & Berinyuy, L. P. (2010). Using the SERVQUAL Model to assess Service Quality and Customer Satisfaction. Spring semester.
Eren, H. (2005). Wireless Sensors and Instruments: Networks, Design, and Applications. CRC Press.
Heskett, J. L., Sasser, W. E., & Schlesinger, L. A. (1997). Service Profit Chain. Simon and Schuste.
Institute, E. T. (2010). Telecommunication System (UMTS); LTE ; Telecommunication Management; KPI for UMTS and GSM(3GPP TS 32.410 Version 9.0.0 Release 9);). European Telecommunication Standard Institute.
James L. Heskett; W. Earl Sasser; Leonard A. Schlesinger;. (n.d.).
Johnson, B., & Christense, L. (2010). Educational Research: Quantitative, Qualitative, and Mixed Approaches. SAGE.
Johnson, J., Gooding, P. A., Wood, A. M., Taylor, P. J., Pratt, D., & Tarrier, N. (2010). Resilience to suicidal ideation in psychosis: Positive self-appraisals buffer the impact of hopelessness. Behaviour Research and Therapy.
Kale-Dery, S. (2013, December 16). Mobile phone boom, telcos and poor service. Retrieved April 15, 2014, from http://graphic.com.gh/business/business-news/14246-mobile-phone-boom-telcos-and-poor-service.html: http://graphic.com.gh/business/business-news/14246-mobile-phone-boom-telcos-and-poor-service.html
Köhl, M., Magnussen, S. S., & Marchetti, M. ( 2006). Sampling Methods, Remote Sensing and GIS Multiresource Forest Inventory. Springer.
Kreher, R. (2006). UMTS Performance Measurement:The practical Guide to KPI's for the UTRAN Environment. John Wiles & Sons.
Kularatna, N., & Dias, D. (2004). Essentials of Modern Telecommunications Systems. Artech House.
Lehnert, R. (2011). Energy aware communications: 17th International Workshop, Eunice 2011, Dresden, Germany, September 5-7,2011 Proceedings. Dresden: Springer.
Matin, M. A. (2014). Handbook of Reseame 1rch on Progressive Trends in Wireless Communications and Networking, Volu. IGI Global.
Mellouk, A., Tran, H. A., & Hoceini, S. (2013). Quality-of-Experience for Multimedia. John Wiley & Sons.
Mishra, A. R. (2004). Advanced Cellular Network Planning and Optimisation: 2G/2.5G/3G...Evolution to 4G. John Wiley and Sons Ltd.
90

Mishra, A. R. (2007). Advanced Cellular Network Planning and Optimisation: 2G/2.5G/3G...Evolution to 4G. John Wiley and Sons Ltd.
Mostafa, H., & Zeadally, S. (2012). Media Networks: Architectures, Applications and Standards. CRC Press.
MTN Ghana. (2014, April 01). About Us. Retrieved April 15, 2014, from http://www.mtn.com.gh/about-mtn: http://www.mtn.com.gh/about-mtn
National Communication Authority. (2014, February). Mobile Voice Market Share for February, 2014. Retrieved April 15, 2014, from http://www.nca.org.gh/downloads/Telecom_Voice_Subscription_FEB_2014_1.pdf: http://www.nca.org.gh/downloads/Telecom_Voice_Subscription_FEB_2014_1.pdf
National Communications Authority. (2011). 5 Telcos Punished - For providing poor services. Retrieved April 15, 2014, from http://www.nca.org.gh/73/34/News.html?item=222: http://www.nca.org.gh/73/34/News.html?item=222
NCA. (2010, August 05). National Communications Authority. Retrieved April 16, 2014, from http://www.nca.org.gh/downloads/QoS%20Central%20and%20Western_August_2010.pdf: http://www.nca.org.gh/downloads/QoS%20Central%20and%20Western_August_2010.pdf
Nii , S., & Dowuona, N. (2013, February 4). Mobile penetration cross 100% in Ghana. Retrieved April 16, 2014, from http://business.myjoyonline.com/pages/news/201302/100891.php: http://business.myjoyonline.com/pages/news/201302/100891.php
Nimako, S. G., Azumah , F. K., Donkor , F., & Veronica, A.-B. (2010). Overall Customer Satisfaction in Ghana’s Mobile Telecommunication Networks: Implications for Management and Policy. ATDF .
Oodan, A. (2014). Telecommunications Quality of Service Management. IET.
Parmenter, D. (2011). Key Performance Indicators: Developing, Implementing,and Using Winning KPIs. John Wiley & Sons.
Proctor, T. (2005). Essentials of Marketing Research. Financial Times/Prentice Hall.
QUALITY OF SERVICE. (2013). QUALITY OF SERVICE (QoS) MONITORING OF CELLULAR MOBILE VOICE SERVICES. Retrieved April 15, 2014, from http://www.nca.org.gh/downloads/QoS/QoS_Trends_04_13.pdf: http://www.nca.org.gh/downloads/QoS/QoS_Trends_04_13.pdf
Saunders, M., Philip, L., & Thornhill, A. (2009). Research Methods for Business Students Fifth Edition. Princtice Hall.
Service, G. S. (2012). 2010 Population and Housing Census. Ghana Statistical Service.
91
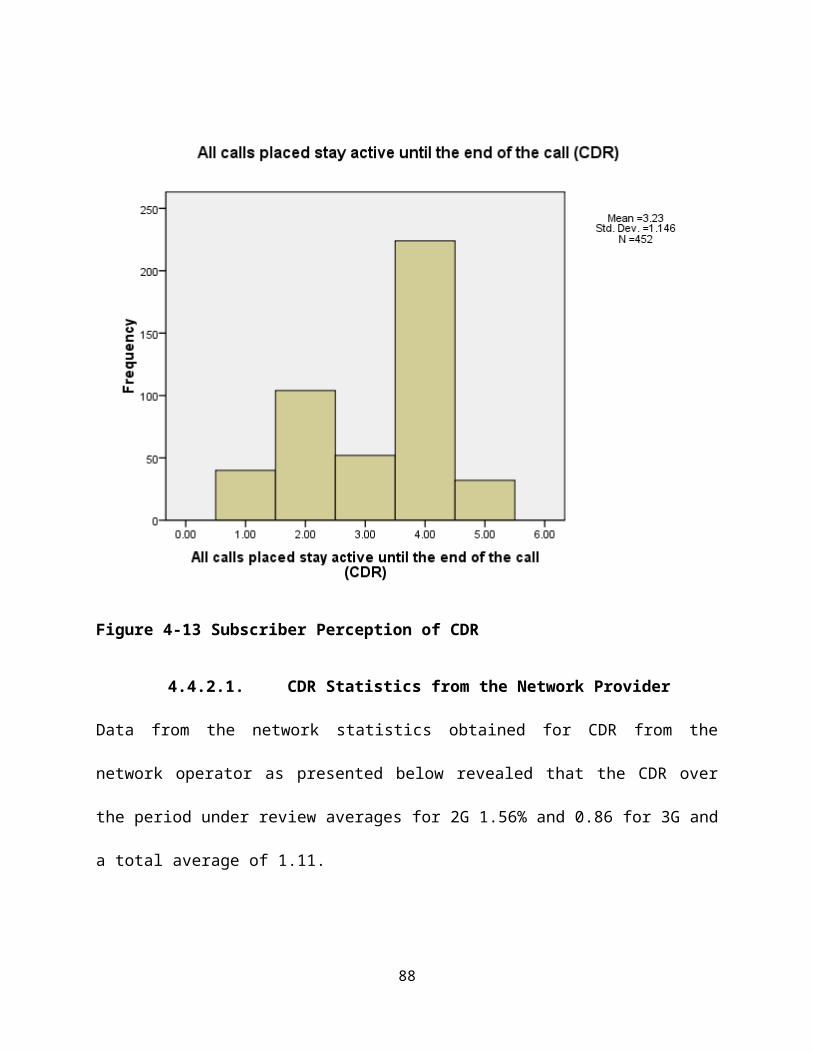
Shlash Mohammad, A., & Mohammad Alhamadani, S. (2011). Service Quality Perspectives and Customer Satisfaction in Commercial Banks Working in Jordan. Middle Eastern Finance and Economics(14), 65.
Sinha, M. N. (2000). The Best on Quality. ASQ Quality Press.
Soldani, D., Li, M., & Cuny, R. (2007). QoS and QoE management in UNTS Cellular Systems. John Willey and Sons.
Trendowicz, A. (2013). Software Cost Estimation , Bench Marking and Risk Assesment, The software Decision-makers' Guide to predicatable Software Development. Springer.
Turner, K., Bateman, I. J., & Adger, W. N. (2001). Economics of Coastal and Water Resources: Valuing Environmental Functions. Springer.
Zeithaml, V. A. (2010). Delivering Quality Service. Simon and Schuster.
Zeithaml, V. A., Parasuraman, A., & Berry, L. L. (1990). DELIVERING QUALITY SERVICE : Balancing Customer Perceptions and Expectations. The Free Press.
Zikmund, W. G., Babin, B. J., Carr, J. C., & Griffin , M. (2011). Business research methods. Thomson/South-Western.
92