final sampling and analysis plan for remediation of operable unit
TRANSCRIPT

Westinghouse Non-Proprietary Class 3
FINALSAMPLING AND ANALYSIS PLAN
forREMEDIATION OF OPERABLE UNIT I
Revision 1.5
Hematite Decommissioning ProjectWestinghouse Former Fuel Cycle Facility
Hematite, Missouri
Prepared for:
Westinghouse
Westinghouse Electric Company LLCHematite Facility3300 State Road PFestus, MO 63028
March 2015
v4/l,riX f.,+*.rrNicole L. Nowak
(Quality Assurance Manager)
O 2015 Westinghouse Electric Company LLCAll Rights Reserved
Kelle/S. Davis. P.E.(Engin'eering Manager)
Smes H. Miller. P.E.(ESH Manager)
ll
EO-11-001

WestinghouseField Sampling Plan
Operable Unit I
CERTIFICATION
This Sampling and Analysis Plan has been prepared under the direction of the registeredProfessional Engineer under the laws of the State of Missouri whose signature and seal are
affixed below.
Kelley S. Davis
Date:
Missouri PE Registration No.: PE-2007002774Expiration D ate: 12 I 3 | /201 5
$U,"rlx!#!:,
#ffi

Field Sampling Plan Operable Unit 1
SAMPLING AND ANALYSIS PLAN TABLE OF CONTENTS
FIELD SAMPLING PLAN Section Title
1 Introduction 2 Project Objectives 3 Data Quality Objectives 4 Field Activities 5 Sample Handling Procedures 6 Data Validation and Reporting 7 Project Documents and Records 8 References QUALITY ASSURANCE PROJECT PLAN 1 Project Management 2 Measurement / Data Acquisition 3 Assessment and Oversight 4 Data Validation and Usability 5 References

Field Sampling Plan Operable Unit 1
REVISION LOG
Revision No. Date Reference Notes
Draft HEM-11-108
Draft submittal and responses. HEM-11-MDNR-0920-301
0
02/22/2012
HEM-12-29
Initial issuance.
HEM-12-72
HEM-12-110
HEM-12-MDNR-0507-224
HEM-12-MDNR-0830-493
1
12/05/2012
HEM-12-120
See correspondence for explanation of revision.
HEM-12-164
HEM-12-MDNR-0917-528
HEM-13-MDNR-0102-1
1.1
05/09/2013
HEM-13-62 See correspondence for explanation of revision.
HEM-13-MDNR-0618-473
1.2
07/29/2013 HEM-13-82
See correspondence for explanation of revision.
1.3
10/09/2014
HEM-14-76 See correspondence for explanation of revision.
HEM-14-MDNR-1020-138
1.4
01/14/2015
HEM-14-81 See correspondence for explanation of revision. Administratively corrected typographical errors and formatting throughout. HEM-15-MDNR-0102-1
1.5 HEM-15-15 See correspondence for explanation of revision.
Field Sampling Plan Operable Unit 1
i
SAMPLING AND ANALYSIS PLAN
for REMEDIATION OF OPERABLE UNIT 1
Part 1 FIELD SAMPLING PLAN
Hematite Decommissioning Project
Westinghouse Former Fuel Cycle Facility Hematite, Missouri
Field Sampling Plan Operable Unit 1
ii
TABLE OF CONTENTS
1. INTRODUCTION ...................................................................................................................... 1
1.1. SITE HISTORY AND DESCRIPTION ................................................................................................................ 1
1.2. PROJECT OVERVIEW .................................................................................................................................... 2
1.3. QUANTITIES OF VOC-IMPACTED MATERIAL ............................................................................................... 3 1.4. PROJECT ORGANIZATION AND FUNCTION .................................................................................................... 3
1.5. TRAINING REQUIREMENT AND CERTIFICATION ........................................................................................... 3
2. PROJECT OBJECTIVES........................................................................................................... 5 3. DATA QUALITY OBJECTIVES .............................................................................................. 7
3.1. DEFINE THE PROBLEM ................................................................................................................................. 7
3.2. IDENTIFY THE GOAL OF THE STUDY ............................................................................................................ 8
3.3. IDENTIFY INFORMATION INPUTS .................................................................................................................. 8 3.4. DEFINE THE BOUNDARIES OF THE STUDY .................................................................................................... 8
3.5. DEVELOP THE ANALYTICAL APPROACH ...................................................................................................... 8
3.6. SPECIFY PERFORMANCE OR ACCEPTANCE CRITERIA ................................................................................. 10
3.7. DEVELOP THE PLAN FOR OBTAINING DATA .............................................................................................. 11
4. FIELD ACTIVITIES ................................................................................................................ 12
4.1. EXCAVATION FIELD SCREENING ............................................................................................................... 12
4.2. SAMPLING APPROACH ............................................................................................................................... 13 4.2.1. Sampling of Excavation Lifts ............................................................................................................... 13
4.2.2. Sampling of Temporary Stockpiles ...................................................................................................... 14
4.2.3. Remediation Goals ............................................................................................................................... 14
4.2.4. Confirmation Sampling ........................................................................................................................ 14
4.2.5. Field QC Samples ................................................................................................................................ 15
4.2.6. Data Evaluation ................................................................................................................................... 16 4.3. SAMPLE COLLECTION METHODOLOGY...................................................................................................... 16
4.3.1. Collection of Headspace Samples ........................................................................................................ 16
4.3.2. Collection of Samples for VOC Analysis ............................................................................................. 16
4.3.3. Collection of Samples for PAH Analysis .............................................................................................. 17
4.3.4. Collection of Samples for Arsenic Analysis ......................................................................................... 17

Field Sampling Plan Operable Unit 1
iii
4.4. SAMPLING FOR WASTE CHARACTERIZATION ............................................................................................ 17
4.5. SAMPLING OF IMPORTED MATERIALS ....................................................................................................... 18
5. SAMPLE HANDLING PROCEDURES ................................................................................. 22
5.1. SAMPLE IDENTIFICATION .......................................................................................................................... 22 5.2. SAMPLE CUSTODY ..................................................................................................................................... 22
5.3. SAMPLE PACKING ...................................................................................................................................... 23
5.4. INVESTIGATION DERIVED WASTE ............................................................................................................. 23
5.5. HEALTH AND SAFETY ................................................................................................................................ 23
6. DATA VALIDATION AND REPORTING ............................................................................ 24
6.1. LABORATORY REVIEW .............................................................................................................................. 24
6.2. LABORATORY REPORTING ......................................................................................................................... 24 6.3. DATA REVIEW AND VALIDATION .............................................................................................................. 24
6.4. DATA VALIDATION REPORT ...................................................................................................................... 27
6.5. CORRECTIVE ACTION ................................................................................................................................ 27
6.5.1. Immediate Corrective Action ............................................................................................................... 28
6.5.2. Long-Term Corrective Action .............................................................................................................. 28 6.5.3. Out of Control Situations ..................................................................................................................... 28
6.5.4. Laboratory Corrective Procedures ...................................................................................................... 29
6.5.5. Field Situations .................................................................................................................................... 29
7. PROJECT DOCUMENTS AND RECORDS .......................................................................... 30
7.1. LABORATORY REPORTS ............................................................................................................................ 30
7.2. QUALITY CONTROL ................................................................................................................................... 30
8. REFERENCES ......................................................................................................................... 32 8.1. CITED REFERENCES ................................................................................................................................... 32 8.2. DEVELOPMENTAL REFERENCES (NON-CITED) .......................................................................................... 33

Field Sampling Plan Operable Unit 1
iv
List of Tables
Table 1-1 – Estimated Quantities Table 2-1 – Remediation Goals Table 2-2 – Excavation Depth Summary Table 3-1 – Screening and Sampling Frequency Table 4-1 – Summary of Field Screening Determinations During Excavation Table 4-2 – Areas of Concern, Chemical Constituents of Concern and Corresponding Survey
Units Table 4-3 –Analytical Methods, Sample Containers, Preservation, and Holding Times Table 4-4 – Geotechnical and Chemical Testing Requirements Table 4-5 – Laboratory Method Detection Limits, Routine Reporting Limits and
Remediation Goals Table 5-1 – Sample Nomenclature Table 6-1 – Data Review and Validation Process Table 6-2 – Validation Criteria Table 7-1 – Project Documents and Records Table 8a,8b – Water Level Elevations (ft amsl) in Monitoring Wells Screened in the
Sand/Gravel HSU at the Hematite Facility
List of Figures
Figure 1 – Project Organization Structure Figure 2 – Site Location Figure 3 – Hematite Decommissioning Project Features Figure 4 – Areas of Concern and Survey Unit Areas Figure 5 – Initial Limits of Excavation Figure 6 – Sand/Gravel HSU Phreatic Surface by Survey Unit

Field Sampling Plan Operable Unit 1
v
LIST OF ACRONYMS AND ABBREVIATIONS AOC Area of Concern ASTM American Society for Testing and Materials CERCLA Comprehensive Environmental Response, Compensation, and Liability Act CFR Code of Federal Regulations CoC Constituents of Concern COC Chain of Custody Record DCGL Derived Concentration Guidance Levels DQI Data Quality Indicators DQO Data Quality Objectives DVR Data Validation Report EDD Electronic Data Deliverable EPA United States Environmental Protection Agency FID Flame Ionization Detector FS Feasibility Study FSP Field Sampling Plan g Grams HDPE High Density Polyethylene HDP Hematite Decommissioning Project HAZWOPER Hazardous Waste Operations and Emergency Response LCS/LCSD Laboratory Control Sample / Laboratory Control Sample Duplicate ID Identification LLMW Low Level Mixed Waste MDL Method Detection Limit MDNR Missouri Department of Natural Resources mg/kg Milligrams per Kilogram mL Milliliter MoDOT Missouri Department of Transportation MPC Measurement Performance Criteria MRBCA Missouri Risk Based Corrective Action MS/MSD Matrix Spike / Matrix Spike Duplicate NELAP National Environmental Laboratory Accreditation Program NRC U.S. Nuclear Regulatory Commission OU-1 Operable Unit 1 OSHA Occupation Safety and Health Administration PAH Poly Aromatic Hydrocarbons PCE Tetrachloroethylene PID Photoionization Detector ppm Part per Million QA Quality Assurance QAPP Quality Assurance Project Plan QC Quality Control RCRA Resource Conservation and Recovery Act RDWP Remedial Design Work Plan RG Remediation Goal RI Remedial Investigation ROD Record of Decision RPD Relative Percent Difference RL Reporting Limit SAP Sampling and Analysis Plan

Field Sampling Plan Operable Unit 1
vi
SIM Selected Ion Monitoring SOP Standard Operating Procedure SVE Soil Vapor Extraction TATs Turn Around Times TCE Trichloroethylene TCLP Toxicity Characteristic Leaching Procedure TVA Toxic Vapor Analyzer USC United States Code USCS Unified Soil Classification System VOC Volatile Organic Compounds VOCTA VOC Treatment Area WMMTP Waste Management, Minimization and Treatment Plan

Field Sampling Plan Operable Unit 1
EO-11-001 1 December 2012
1. INTRODUCTION
This Sampling and Analysis Plan (SAP) has been prepared for the Hematite Decommissioning Project (HDP) at the Westinghouse Hematite Site in Hematite, Missouri to describe the chemical sampling and analytical protocols to support the remediation of Operable Unit 1 (OU-1). The SAP is comprised of two plans – the Field Sampling Plan (FSP) and Quality Assurance Project Plan (QAPP). This document is the FSP, which comprises part one of the SAP for Remediation of OU-1, and details the procedures that ensure data obtained during sampling are of acceptable and verifiable quality to achieve the project Data Quality Objectives (DQO). Part two of the SAP, the QAPP, follows the FSP and is included in this submittal.
1.1. Site History and Description
The Westinghouse Hematite Site is located at 3300 State Road P in Jefferson County, Missouri near the unincorporated village of Hematite (Figure 2). The Westinghouse Hematite property consists of 228 acres, with the primary operations for nuclear fuel manufacturing historically conducted within approximately 8 acres of the property. Nuclear-related operations began in 1956. Various entities owned and operated the facility, prior to the Westinghouse acquiring it in 2000.
Throughout its history, uranium and compounds from enriched uranium were produced at the site for use in the production fuel for nuclear reactors. Secondary activities included uranium scrap recovery and limited work with thorium compounds. Before 1974, most operations were related to work for the U.S. Government. After 1974, operations focused on commercial fuel production. The Site is currently undergoing decommissioning in accordance with U.S. Nuclear Regulatory Commission (NRC) regulations and other applicable federal and state regulations. Site decommissioning features are shown in Figure 3.
The State of Missouri has been involved in regulatory and remedial aspects at the Hematite Site since groundwater characterization began in 1996. In 2002, Westinghouse and the Missouri Department of Natural Resources (MDNR) entered into a Letter Agreement which provided MDNR oversight of certain studies and response actions in accordance with the National Oil and Hazardous Substances Contingency Plan under the requirements of the Comprehensive Environmental Response, Compensation, and Liability Act (CERCLA), 42 United States Code (U.S.C.) §§ 9601 et seq. In 2008, MDNR and Westinghouse entered into a Consent Decree and the Letter Agreement was terminated. The Consent Decree provides for MDNR oversight of those portions of the investigation and selection of the remedy for OU-1 that is not pre-empted by the Atomic Energy Act of 1954, as amended.
Beginning in 2004 with oversight by MDNR, Westinghouse prepared a Remedial Investigation (RI), a Human Health Risk Assessment, and a Screening-Level Ecological Risk Assessment. MDNR approved these reports as they relate to OU-1 on July 19, 2007. Using these studies as a basis, Westinghouse then prepared a Feasibility Study (FS) for OU-1, which MDNR approved on December 21, 2007. Westinghouse developed a Proposed Plan from the approved FS, which, following public review and comment, served as the basis for selecting a Site Remedy in the EO-09-001, Record of Decision (ROD) Operable Unit 1, Buried Waste, Impacted Soils, and Sediment (Reference 5). The ROD was signed in July 2009. Based upon the remedy selected in

Field Sampling Plan Operable Unit 1
EO-11-001 2 December 2012
the ROD, EO-10-002, Remedial Design Work Plan, (RDWP) Operable Unit 1, Former Fuel Cycle Facility (Reference 6) was completed.
This FSP addresses the sample collection and analysis to be conducted during the remediation of OU-1. This document discusses the field and laboratory protocols used to ensure DQO are met.
This document does not address the treatment of soils and sediments impacted by volatile organic compounds (VOC). If on-site VOC treatment as described in the RDWP (Reference 6) is utilized, a separate Waste Analysis Plan will be developed by the remedial contractor to describe the procedures and DQO used to meet treatment standards.
1.2. Project Overview
The remedial action for this project is comprised of the exhumation of impacted soil, waste and sediment to meet the remediation goals (RGs) that support unlimited use and unrestricted exposure and either treatment of removed soils to standards that allow on-site reuse or disposal of impacted soils at permitted off-site facilities.
The Selected Remedy for OU-1 at the Site is comprised of the following:
• Excavate buried waste to meet the chemical RG and radiological Derived Concentration Guideline Levels (DCGL), and dispose impacted materials at permitted off-site facilities;
• Excavate impacted soil to meet the chemical RG and radiological DCGL, and either treat the soil to meet standards that allow on-site reuse, or dispose of impacted soil at permitted off-site facilities; and,
• Excavate impacted sediment to meet the chemical RG and radiological DCGL and dispose of impacted sediment at permitted off-site facilities.
To the extent practicable, the Selected Remedy provides for treatment of the source materials constituting principal threat waste and associated impacted soil and sediment. The Selected Remedy provides the flexibility to allow treatment of low-level mixed waste (LLMW) that is radioactive and hazardous at permitted off-site facilities.
This project addresses remediation of soils at the Hematite Site, including those associated with the following areas:
• Burial Pits; • Evaporation Ponds; • Former Septic System Leach Field; • Soils Beneath Building; • Limestone Storage and Limestone Fill Areas; • Outdoor and Shallow Surface Areas; • Red Room Roof Burial Area; • Site Pond; and • Underground Utilities
The extent of excavation in these areas is estimates based upon characterization samples collected to date. Figure 5 shows the proposed initial extent of excavation and the associated remediation areas.

Field Sampling Plan Operable Unit 1
EO-11-001 3 October 2014
1.3. Quantities of VOC-Impacted Material
Table 1-1 below lists the current volume estimates for VOC-impacted soils associated with each remediation area.
Table 1-1 Estimated Quantities
Remediation Area Estimated Volume VOC-Impacted Material (cubic feet) 1
Tons2
Burial Pits 60,000 3,000 Evaporation Pond 4,210 210 Slabs and Soil Beneath Slabs 18,330 917 Red Room Roof Burial Area, Cistern Burn Pit, and Wood Barn Floor
0 0
Former Leach Field 0 0 Spent Limestone 0 0 Site Pond 0 0 Total Volume 82,540 4,127 1 Westinghouse, Remedial Design Work Plan, Operable Unit 1, August 12, 2011. (Reference 6) 2 Conversion factor of 1.35 tons per cubic yard
1.4. Project Organization and Function
Figure 1 reflects the current project organization. The ROD (Reference 5) and the RDWP (Reference 6) provides the project description, background information, and the remediation approach. The sample matrices for this project are soil and/or solids in a soil-like matrix. Samples are potentially contaminated with VOC, specifically tetrachloroethylene (PCE) and trichloroethylene (TCE). Additional chemical constituents of concern (CoC) include polyaromatic hydrocarbons (PAH) and arsenic.
Laboratories utilized for this project will have National Environmental Laboratory Accreditation Program (NELAP) certification, as well as any additional state certifications, as needed. In addition, Westinghouse will audit the laboratory using the Corporate Quality Assurance Plan and will be subject to the evaluation and approval process as required by HDP procedures. At a minimum, the contracted laboratory will provide the required laboratory certifications, current reporting limits (RL) and method detection limit (MDL) studies for the duration of sampling activities.
1.5. Training Requirement and Certification
Personnel assigned to this project will be qualified and capable of completing their assigned duties. Personnel will meet the minimum training requirements as specified in Section 7.3.7.5 of HDP-PO-EHS-001, Health and Safety Plan (Reference 8) NOTE. Requirements for site-specific training (e.g., General Employee Training and Radiation Worker Training) are contained in HDP-PO-GM-002, Training Plan (Reference 9). This plan details requirements for unescorted site access, entry into Radioactive Material Areas, annual requalification, and retention of training records.
Personnel performing OU-1 remediation activities will have completed the initial 24-hour or 40-hour (as appropriate) Hazardous Waste Operations and Emergency Response (HAZWOPER) _______________________ NOTE: Replaced statement per MDNR correspondence dated October 20, 2014, condition #4 (HEM-14-MDNR-1020-138).

Field Sampling Plan Operable Unit 1
EO-11-001 4 December 2012
training and hold a current Occupations Health and Safety Administration (OSHA) 8-hour refresher certificate. Supervisory personnel will have completed the supervisory training required by 29 Code of Federal Regulations (CFR) 1910.120. Documentation of OSHA training will be available for on-site personnel.
Additional training requirements will be based on the job function. Personnel assigned to a job category will train in accordance with approved procedures and lesson plans, and will demonstrate their capabilities to perform assigned tasks by the completion of practical training exercises.

Field Sampling Plan Operable Unit 1
EO-11-001 5 July 2013
2. PROJECT OBJECTIVES
The objective of the Project is to remediate material at the site such that the applicable RG as shown in Table 2-1 are achieved. Data obtained will verify the following:
• The excavations removed the chemical contamination to below the RG, subject to special conditions listed below.
• Soil and waste to be disposed of is acceptable to the disposal facility • Onsite soil designated for reuse as backfill is acceptable for backfill • Off-site borrow material to be used for backfilling excavations has been
adequately characterized and determined to be acceptable
DQO have been established to ensure compliance to project objectives. Section 3 of this FSP discusses the DQO in detail.
Table 2-1 Remediation Goals
Constituents of Concern Remediation Goals for OU-1 milligram / kilogram (mg/kg) Basis of Remediation Goal
Surface Soil
Subsurface Soil
Sediment MRBCA Table B-1 Lowest Default target Levels 1
Volatile Organic Compounds (VOC) cis-1,2-Dichloroethylene 0.521 0.521 --- Groundwater Protection pathway trans-1,2-Dichloroethylene 1.10 1.10 --- Groundwater Protection pathway Trichloroethylene (TCE) 0.141 0.141 --- Groundwater Protection pathway Tetrachloroethylene(PCE) 0.141 0.141 --- Groundwater Protection pathway Vinyl Chloride 0.0192 0.0192 --- Groundwater Protection pathway Polynuclear Aromatic Hydrocarbons (PAH) Benzo(a)Anthracene 6.12 --- --- Groundwater Protection pathway Benzo(a)Pyrene 0.62 --- --- Soil Direct Contact pathway Benzo(b)Fluoranthene 6.19 --- --- Soil Direct Contact pathway Indeno(1,2,3-cd)Pyrene 3.77 --- --- Soil Direct Contact pathway Total PAH2 --- --- 2.0 Metals Arsenic 9.6 --- --- Calculated from background data. 1 As described in the ROD, RG are based on Missouri Risk-Based Corrective Action (MRBCA) default target levels for future residential use of the Hematite Site. Departmental Missouri Risk-Based Corrective Action Technical Guidance Appendix B (Reference 4) is available online: dnr.mo.gov/env/hwp/mrbca/techguidance.htm. 2Total PAH is the sum of the concentrations of 13 specific PAH
Special Conditions: The chemical RGs for OU-1 will be applied to soil and sediment above the groundwater table. For purposes of applying RG in OU-1, the groundwater table is defined by the phreatic surface associated with the groundwater within the sand and gravel unit and not by saturated fine-grained soil. The phreatic surface of the Sand/Gravel Hydrostratigraphic Unit (HSU) is based on field measurements of the water level in monitoring wells whose screened interval includes the Sand/Gravel HSU. FSP Table 8 contains the measured water levels for wells located within the

Field Sampling Plan Operable Unit 1
EO-11-001 6 July 2013
Hematite Facility (a term defined in the RDWP). The locations of these monitoring wells and the Survey Unit Areas are identified in FSP Figure 6. The water level measurements for all of the wells that are within or on the border of a survey unit are included in the average water level that is listed under the Survey Unit number. A box on Figure 6 for each well lists its average and minimum water level of the associated monitoring well. Table 8 also contains the spreadsheet results for the average water level measurement in each survey unit. For survey units without wells, the phreatic surface was interpreted from the average water levels in adjacent survey units and the southeasterly direction of flow (lower phreatic surface to the southeast) in the Sand/Gravel HSU. For Survey Unit LSA-10-06, the average was adjusted to 416 ft amsl since water levels in Well BP-055 appeared to be skewed high.
Although the ROD and RDWP identify principal threat waste to be burial pit waste, it is prudent to give DNAPLs, if encountered or indicated, special consideration in determining the vertical extent of an excavation. If DNAPL continues to be encountered at or below phreatic surface of the Sand/Gravel HSU, then the excavation will be continued until dewatering becomes problematic. Due to the very low hydraulic permeability of the silty clay soils, the seepage flow rate into the excavation is expected to be low. If dewatering in a specific location becomes problematic (e.g., requires flow rates that exceed the current on-site treatment plant throughput or inflow causes excess sloughing of sidewalls), excavation will be terminated.
In addition to the dewatering problem, there is a maximum depth beyond which excavation should not be attempted to prevent heaving and blow-in at the bottom of excavation pits from subsurface pressure. This depth is established at 412 ft above mean sea level (amsl), or approximately 22 ft below ground surface (bgs). This determination is based on geotechnical considerations and the anticipated elevation of the piezometric head in the sand and gravel unit directly below the excavation. The maximum depth of 412 amsl is based on geotechnical considerations, the anticipated elevation of the piezometric head in the sand, the gravel unit directly below the excavation, the bottom of silty clay elevation of 402 ft above mean sea level (amsl), and a piezometric surface elevation of 418 ft amsl. The imminent heaving condition is determined by balancing the water pressure force at the silty clay base against the weight of the saturated silty clay above it to the excavation pit bottom.
Excavation depths of 412 amsl or of asml values from Figure 6 will be measured in the field using civil survey methods.
The determination of DNAPL presence will be based on a combination of visual analysis, screening analysis, and laboratory analysis.
• Laboratory Sample Results: PCE results exceeding 400 ppm, TCE results exceeding 1000 ppm, and, when both PCE and TCE are non-trivially present, the weighted sum of the fractions (SOF) exceeding 1.0. The SOF is calculated by the following equation. Non-trivial presence is based on the sample result exceeding 10 percent of the DNAPL value. Before excavation is discontinued, screening results will be confirmed by definitive data (laboratory analytical data) from the Project’s contracted laboratory.
𝑆𝑆𝑆 = 𝑃𝑃𝑃 𝑃𝐶𝐶𝐶𝐶𝐶𝐶𝐶𝐶𝐶𝐶𝐶𝐶400 𝑝𝑝𝑝
+ 𝑇𝑃𝑃 𝑃𝐶𝐶𝐶𝐶𝐶𝐶𝐶𝐶𝐶𝐶𝐶𝐶1000 𝑝𝑝𝑝

Field Sampling Plan Operable Unit 1
EO-11-001 6a October 2014
• Visual analysis: Stained soil, DNAPL pooling, significant oil-like sheen on ponded groundwater in the excavation. Based on site soil characteristics (clay) it is unlikely that pools of DNAPL will be encountered.
• Screening analysis: Given laboratory turnaround times and costs, a screening method is necessary to inform field remediation. To that end, colorimetric gas detector (preferred) or PID will be used for screening purposes for VOCs. The initial screening value will be the relative response of the colorimetric gas detector that corresponds to laboratory sample results indicating DNAPL of 400 ppm for PCE unless a laboratory sample result identifies TCE or a mixture of PCE and TCE. If TCE is identified, then the colorimetric gas detector setpoint will become 1000 ppm. If a mixture of PCE and TCE (both greater than 10 percent of the total) is identified, then a weighted average of the relative contributions and DNAPL setpoints will be used to derive a DNAPL setpoint for the mixture.
Concentrations of PCE/TCE will be assigned according to their relative response on a colorimetric gas detection tube. The results of spiked samples or soil samples using both colorimetric gas detection and GC/MS analysis will be used to establish a relationship between colorimetric responses to the GC/MS concentrations of PCE/TCE.
As a backup if the colorimetric gas detector is unavailable, PID headspace measurements will be used to screen for DNAPLs. PID headspace results of 400 ppm (assumed to be PCE DNAPL) will be used initially to identify DNAPLs. Adjustments to the 400 ppm setpoint will be made as described above for the colorimetric gas detector based on a laboratory sample result.
Table 2-2 summarizes the excavation depth requirements relative to soil exceeding the RGs or indications of DNAPL. All excavation activities will be performed per HDP-WP-OPS-505, Excavation and Exhumation (Reference 7).
Table 2-2. Excavation Depth Summary Excavation Depths Subsequent Actions
0’ to Phreatic surface a Continue excavation unless chemical RGs are met Phreatic surface a Discontinue excavation unless DNAPL is
indicated b Phreatic surface to 412 amsl Excavate where DNAPL is indicated and
dewatering is not problematic b Deeper than 412 amsl Discontinue excavation a defined by Figure 6 (average well water level in amsl for each survey unit) b DNAPL is screened by (1) visual sighting of DNAPL pooling, significant oil-like sheen on ponded groundwater in the excavation, or stained soil; or (2) screening results exceeding 400 ppm, modified as necessary based a laboratory sample result as described in Section 2.0. Before excavation is discontinued, screening results will be confirmed by definitive data (laboratory analytical data) from the Project’s contracted laboratory.

Field Sampling Plan Operable Unit 1
EO-11-001 7 December 2012
3. DATA QUALITY OBJECTIVES
The objective of the chemical measurement data is to generate sufficient information to determine the presence or absence of contaminants within the media of the site and evaluate the effectiveness of remediation activities. To meet this objective, data acquired during the sample collection phase must be defensible. The quality objectives for the chemical data specify the quality of the data needed to enable project personnel to make project decisions (i.e., the decision to determine the effectiveness of contaminant removal). DQO has been created through an integrated process used to define data quality requirements based on the intended use of the data. DQO are qualitative and quantitative statements that:
• Clarify the project objectives; • Define the data required for the studies; • Determine the appropriate method of data collection; and • Specify the level of decision errors acceptable for establishing the quantity and
quality of data needed to support the project decisions
The overall quality assurance (QA) objective for this project is to obtain data that ensures the remediation has been effective and comply with the RG requirements.
To meet this objective, data must be defensible. The seven steps of the DQO process that achieve this objective as defined in the EPA QA/G-4, Guidance on Systematic Planning Using the Data Quality Objective Process (Reference 1) are:
• Define the Problem • Identify the Goal of the Study • Identify Information Inputs • Define the Boundaries of the Study • Develop the Analytical Approach • Specify Performance or Acceptance Criteria • Develop the Plan for Obtaining Data
The DQO process as it applies to this project is detailed in the following sections.
3.1. Define the Problem
The Westinghouse Hematite Site manufactured nuclear fuel components and assemblies from 1956 until 2001, when the facility ceased production in June 2001, after approximately 47 years of operation under various owners. The Site is currently undergoing decommissioning in accordance with NRC regulations and other applicable federal and state regulations.
Upon completion of decommissioning activities, the Site will be available for unrestricted release. Planned decommissioning activities at this facility include remediation of soils. During a site investigation in 1996 and subsequent sampling, MDNR detected VOC, including PCE and TCE above drinking water levels in monitoring wells located on and nearby the site. Based on these findings, it was determined that a removal action might be appropriate.

Field Sampling Plan Operable Unit 1
EO-11-001 8 July 2013
3.2. Identify the Goal of the Study
A ROD (Reference 5) signed in July 2009 with the State of Missouri, outlined the remedial actions to remove the chemical constituents. The ROD encompasses OU-1, which includes the buried wastes, impacted soil, and impacted sediment at the site. Table 4-2 identifies the area of concern (AOC). The ROD established chemical clean up objectives in the form of remediation goals (Table 2-1) for chemical CoC at the Site. Data collected must be of sufficient quality and quantity to verify the achievement of these goals. These RG pertain to the soil and sediment that will remain at the conclusion of remedial actions, the off-site borrow soil to be used as backfill, and onsite soil that may be re-used as backfill.
The decisions to be made are the following:
• Have excavations removed chemically contaminated soil at or below chemical RG as described in Section 2.0?
• Are the soil and waste to be disposed of acceptable to the disposal facility? • Are on-site soils designated for reuse as backfill acceptable for backfill? • Is off-site borrow material brought on-site for backfilling of excavations
acceptable?
3.3. Identify Information Inputs
Information inputs include field screening data and laboratory analytical data. Screening results will drive decisions on segregation in the field. Results for the laboratory analyses will drive decisions on the suitability of reusing materials.
3.4. Define the Boundaries of the Study
The ROD (Reference 5) and the RDWP (Reference 6) discuss the physical boundaries for soil excavation as shown in Figure 4. The excavations shown correspond with the areas of concern (AOC) identified through the Remedial Investigation/Feasibility Study (RI/FS) conducted at the Site.
3.5. Develop the Analytical Approach
To achieve the specific goals to support the overall project, the analytical approach must have the ability to confirm samples comply with remediation goals and to determine appropriate waste disposal methods. The Project’s analytical approach includes a pre-confirmatory screening and confirmatory sampling program within specific sampling locations and intervals.
3.5.1 Pre-confirmatory Screening
Pre-confirmatory screens will include screening the excavation areas for VOC. The instrument used in the pre-confirmatory screens is a field Photo-Ionization Detector (PID) or Flame Ionization Detector (FID). Techniques for the use of the PID/FID are detailed in HDP-PR-EM-021, Performing Field Screening Measurements using a PID and FID (Reference 13) and Section 4.1 of this FSP.
It is anticipated that the PID/FID will provide VOC readings at detectable levels of two (2) parts per million (ppm). The action levels provided in Table 4-1 are refined using headspace sampling and the required analysis at an off-site laboratory. Section 4 of this FSP provides guidance for

Field Sampling Plan Operable Unit 1
EO-11-001 9 July 2013
obtaining additional measurements based upon initial screening results. Screening locations exceeding action levels will be marked and delineated. Marked and delineated areas are excluded from further sampling until additional excavation is performed and screening results indicate it is appropriate to proceed to the actions described in Section 3.5.2 of this FSP.
The colorimetric gas detector may be used in lieu of the PID/FID for pre-confirmatory screening of potential reuse material. Concentrations of PCE/TCE will be assigned according to their relative response on a colorimetric gas detection tube. The results of spiked samples or soil samples using both colorimetric gas detection and GC/MS analysis will be used to establish a relationship between colorimetric responses to the GC/MS concentrations of PCE/TCE. The corresponding set points will be established for a laboratory result of 0.141 mg/kg of PCE or TCE.
The results from the pre-confirmatory screening do not determine suitability for reuse material; it is a tool to streamline delineation and segregation of soil and sediment material. No material is deemed remediated or acceptable for reuse without definitive data (laboratory analytical data) from the Project’s contracted laboratory.
3.5.2 Confirmatory Sampling Program
Definitive data from the Project’s contracted laboratory is a part of the confirmatory sampling. Confirming the completion of remediation activities is determined with the analytical results from the laboratory.
Analytical results from the laboratory for each CoC will be compared to their corresponding RG. Soil samples submitted to the laboratory for measurements of VOC will be analyzed by Method 8260B; for PAH by Method 8270C or D (using selected ion monitoring [SIM] if necessary to meet RL goals); or for arsenic by Method 6010B or C. Soil samples submitted to the laboratory may also or alternatively be analyzed for toxicity characteristic leaching procedure (TCLP) VOC by Method 1311/8260B to determine if off-site disposal as hazardous or mixed waste is necessary (trip blanks will be analyzed by 8260B only; trip blanks will not be required for TCLP VOC analyses). The waste acceptance criteria from the facility accepting the waste will determine the need for any additional testing of such material.
The Project uses the results to evaluate the effectiveness of remediation and determine appropriate disposal or re-use procedure. Table 2-1 lists the CoC and RG for the Project.
3.5.3 Sample Layout
Sampling of the survey grids may be performed for partial or full areas depending upon the field conditions and availability for sampling. Figure 4 shows the proposed delineation of survey units.
Each AOC delineates into survey grids of approximately 2000 square meters (m2) in accordance with the final status survey designed for radiological areas. The typical layout for in-situ screening and ex-situ sampling locations is either a sampling depth not exceeding 12” and sampling area not exceeding 1,000 m2 or a sampling depth not exceeding 6” and area not exceeding 2,000 m2.
Confirmation samples will be collected at an equivalent volume of 400 yd3 of soil material.

Field Sampling Plan Operable Unit 1
EO-11-001 10 July 2013
Field screening measurements will be performed using one sample per 25-foot grid of the survey unit. Personnel will not screen grid locations marked on identified radiological hot spots or areas exceeding radiological reuse.
Table 3-1 denotes the sampling frequencies.
3.6. Specify Performance or Acceptance Criteria
If the applicable RG (see Table 2-1) are not achieved, then additional remediation is indicated. Because the impact of designating samples “clean” inaccurately has more severe consequences than over-remediating (the risk to human health and the ecology versus the risk of over-spending on remediation activities), the baseline assumption is that samples do not meet the RG. The number of samples necessary to support the decision to release a survey unit is based upon the analyte and method-specific quality control (QC) criteria that minimizes the possibility of an area inaccurately designated as “clean.”
• Null Hypothesis: The analyte soil concentrations exceed the applicable remediation goal.
• Alternative Hypothesis: The analyte soil concentrations do not exceed the applicable remediation goal.
In accordance to EPA QA/G-4 (Reference 1), the project must be willing to accept the likelihood of making decision errors. A decision error occurs when the null hypothesis is rejected when it is true, or accepted when it is false. These types of errors classify as Type I and Type II. The significance of making a Type I decision error (α) was set at 0.05. This equates to a 5% chance of incorrectly releasing a survey unit. The significance of making a Type II error (β) was set at 0.1. This equates to a 10% chance of incorrectly failing an investigation area and continuing excavation as described in Section 2.0.
In order to determine the number of samples necessary to estimate the mean with the preceding tolerance, the standard deviation for post-remediation was estimated using site characterization data. These parameters along with guidance contained in EPA QA/G-9, Guidance for Data Quality Assessment: Practical Methods for Data Analysis (Reference 2) were used to determine the samples size. Table 3-1 represents the screening and sampling frequency for each confirmation volume.

Field Sampling Plan Operable Unit 1
EO-11-001 11 December 2012
Table 3-1 Screening and Sampling Frequency
Parameter Methodology Frequency Sampling Type
VOC Screening
Walkover Survey
Photoionization Detector and/or Flame Ionization Detector
1 sample per 25-foot node grid
Direct Samplinga
Headspaceb
Polyaromatic Hydrocarbons (PAH)
SW846, 8270C or D 4 Composite
(15 Grab per composite)
Arsenic (As) SW846, 6010B or C 4 Composite
(15 Grab per composite)
Volatile Organic Compounds (VOC)
SW846, 8260B 12 Discrete
a PID/FID measurements are performed at 30-second intervals from within 3 to 6 inch divots into the surface area undergoing screen b For PID/FID screening locations that exceed action levels of 2 ppm, headspace sampling is performed. Additional headspace sampling is performed on 10% of all locations of PID/FID nondetects for each survey unit.
3.7. Develop the Plan for Obtaining Data
Areas to be screened and excavated are identified in Table 4-2. Field screening will assess the presence or absence of VOC prior to sampling in an effort to streamline delineation of areas and segregate materials. HDP-PR-EM-019 (Reference 11) describes the sampling methodology for soils.
Where warranted by conditions in the field, field screen readings may provide a measurable check that triggers sampling for laboratory analyses.
Samples that receive the subsequent laboratory analysis will be analyzed using laboratory methods to determine if the concentrations of CoC are below the RG. Personnel will collect soil samples for VOC per EPA Method 5035A (Reference 3) using an EPA-approved equivalent sampling device. Personnel will collect soil samples for PAH and/or arsenic analysis using disposable or decontaminated sampling equipment.
Field duplicates and MS/MSD pairs will be obtained for each sample batch for each sampling methodology. Field duplicates will be obtained at a rate of one per 10 method-specific samples. Triplicate volume for matrix spike / matrix spike duplicate (MS/MSD) analysis will be collected at a rate of one per 20 method specific samples. Remediation will continue until the laboratory analytical results indicate soil meets the RG requirement for VOC, PAH, and arsenic.

Field Sampling Plan Operable Unit 1
EO-11-001 12 July 2013
4. FIELD ACTIVITIES
4.1. Excavation Field Screening
The following provides the general approach to performing excavation field screening for determining gross indication of compliance to the RG for VOC. Field screening will be conducted using a PID/FID in accordance with HDP-PR-EM-021 (Reference 13). Table 4-2 describes the areas to be screened. In conjunction with the PID/FID measurements, a visual inspection will be performed to locate any signs of soil staining and to identify any buried waste items. As discussed in FSP Section 3.5.1, colorimetric gas detection may be used in lieu of PID/FID for screening purposes against the RGs.
The general approach for excavations area will be to establish survey units. Survey units will be approximately 2000 m2 (but no more than 2200 m2) in accordance with the final status survey designed for radiological analyses, (Figure 4) depending on location and shape of the AOC. Smaller excavation areas may be marked and screened based upon prevailing field conditions. The corners of the excavation will be delineated utilizing stakes, paint, or other visual markers. The edges of the excavation will be marked each 25-foot increment. At each node (intersection) of the survey unit, the personnel will push a t-handle rod through the soil to create a hole, inserts the probe into the hole, and pause for approximately 30 seconds and observe the PID/FID measurements. The highest PID/FID reading measured over the thirty seconds will be recorded in a field logbook for the survey unit.
Any PID/FID result exceeding 2 ppm through the direct reading shall be considered a positive result. This action level may be adjusted during the course of soil remediation in order to reduce false positive/negative indications and reduce/increase soil treatment and handling, as warranted. Table 4-1 provides a summary of determinations and actions based upon field screening results.
The Project will supplement the pre-confirmatory screening with headspace sampling and subsequent laboratory analysis at randomly selected screening locations from the PID/FID 25-foot node grid. The headspace sample and the laboratory analysis is a randomly selected location at ten percent of the initial PID screens. This will be a measurable check against false detects and will ensure PID/FID nondetects are accurately profiled as described in Section 4. The PID response will be compared against samples from laboratory data. Correlation will be obtained and charted to indicate PID’s reliability to signal the absence/presence of VOC. A strong correlation (correlation coefficient ≥ 0.90 or consistent relative percent difference) allows effective decision-making regarding segregation of materials.
Note: The approach may be adjusted if the correlation between laboratory data and PID response demonstrates over- or under-reporting PID/FID results. Any other use of the correlation is contingent upon MDNR approval.
Ex-situ samples will be collected per the technique designated for the required analyses (see Section 4.2.2 and HDP-PR-EM-019 (Reference 11) to determine the final status of the material.

Field Sampling Plan Operable Unit 1
EO-11-001 13 October 2014
Table 4-1 Summary of Field Screening Determinations During Excavation
Activity Result Action(s)
PID/FID Screen Walkover Survey
Nondetect (reading < 2ppm 2) Perform headspace sample and subsequent laboratory analysis on randomly selected locations at a 10% rate
Detect ≥ 2 ppm Perform headspace sample at a 100% rate
Headspace Sample
Nondetect None/Delineate Area1
Detect ≥ 2 ppm < 10 ppm3 Stockpile material for ex-situ sampling Detect ≥ 10 ppm <500 ppm4 At the discretion of HDP Waste Management, excavate
and segregate for ex situ sampling. Material exceeding the RG will be staged for waste disposal.
Detect ≥500 ppm Segregate material for 40 CFR 261.24 Analysis 1Reuse material is subject to additional radiological and visual screening (to locate trash / debris) before final disposition dependent on these other requirements. Material will not be moved from the active excavations within the AOC to the lay-down area (outside OU1) prior to off-site definitive data clearly demonstrating compliance to the RG. 2Screening limit of 2 ppm based upon the detection limit of 0.1 ppm resolution of the MultiREA PID/FID, or equivalent screening instrument for VOC and the estimated outdoor air exposure point concentration utilizing Worksheet 3.6, Exposure Point Model Worksheet, of EO-05-003, Baseline Human Health Risk Assessment for the Westinghouse Hematite Site. 3Screening limit of 10 ppm based upon sample handling protocol for worker safety and the estimated outdoor air exposure point concentration for residual VOC contamination greater than RG for TCE and PCE. 4 Screening limit of 500 ppm based upon the limitation of the Waste Acceptance Criteria of the Designated Disposal Facility as potentially hazardous waste. Note: No materials deemed <RG based on screening data alone.
The sidewalls and bottom of the excavation area will be sampled as noted in Section 4.2.4. The Project will not make a final determination to cease remediation without definitive data from the laboratory.
In some AOC, excavation areas may be of varying size and at varying depths, depending upon prevailing field conditions, as previously discussed. Details regarding each excavation will be recorded with the other field data. Laboratory data will be used to determine when remediation of an AOC is complete, as described in the FSP and the QAPP. Field screening will be used to limit and direct field activities, as appropriate. Over-excavation is not planned.
4.2. Sampling Approach
4.2.1. Sampling of Excavation Lifts
In situ sampling may be performed during VOC screening of the areas designated for removal prior to excavation. Section 4.1 discusses VOC screening. After screening is complete, in situ sampling for laboratory analysis will be performed in the manner similar to confirmation samples and obtained according to Section 4.2 and HDP-PR-EM-019 (Reference 11).
Samples will be obtained at a frequency of four (4) multi-aliquot composite samples for arsenic and PAH and 12 discrete samples for VOC per approximately 1000 m2. Samples will be obtained from a triangular grid pattern with a randomly selected start location within the area. Samples will be obtained at random intervals from surface up to 1-foot in depth. This approach will allow for 1-foot lifts of the approximately 1000 m2 areas to be predetermined to demonstrate compliance to the RGs prior to excavation and removal. Excavation and removal will not proceed until comparison of laboratory data to the RG and subsequent data validation.

Field Sampling Plan Operable Unit 1
EO-11-001 14 March 2015
4.2.2. Sampling of Temporary Stockpiles
Ex situ sampling of excavated soils, producing nondetect PID/FID results may be performed after excavation and segregation. Excavated soils will be placed in an area designated for temporary stockpile of reuse materials. A minimum of three (3) VOC grab samples and one (1) arsenic/PAH composite sample for laboratory analysis will be collected from each 100 yd3 of reuse material per the technique designated for the required analyses (see HDP-PR-EM-019, Reference 11). Approximately 400 yd3 of stockpiled material will be allowed to accrue pending receipt of laboratory results. Upon receipt of laboratory results material meeting the RG will be consolidated with previously sampled material. Material exceeding the RG will be staged for waste disposal. All wastes will be analyzed per the requirements of the waste acceptance facility.
4.2.3. Remediation Goals
Table 2-1 previously identified remediation goals.
4.2.4. Confirmation Sampling
The objective of the confirmation sampling is to collect an appropriate number of samples within excavations from locations that accurately represent the final condition. The sampling to verify RG requirements will occur concurrently within excavated operable units. Additional excavation after an excavation area has passed confirmation sampling does not necessitate reconfirmation sampling if only radiological conditions prompted the additional excavation.
To accomplish the objective, samples will be obtained from a triangular grid pattern with a randomly selected start location. Sample quantities were determined with statistical analyses performed using historical data (see Section 3.6). The number of random samples will afford a population that supports the conclusion that the AOC has been remediated and the mean concentration of chemical constituents at the AOC does not exceed the RG with a 95 percent confidence. A minimum of four (4) multi-aliquot composite confirmation samples for arsenic and PAH, and a minimum of twelve (12) discrete samples for VOC is required for each 2000 m2 area. Samples for PAH and arsenic will be composited as described in Sections 4.3.3 and 4.3.4. Samples for VOC will collected as described in Section 4.3.2. In addition to the samples collected from the base of the excavation, at least two samples (multi-aliquot for PAHs/As and discrete for VOCs) will be collected from each sidewall or 2000 m2 per survey unit for those sidewalls that delineate the excavation area(s). The samples will be biased based on field observations to an area most likely to be impacted by lateral migration (e.g., porous soil type, visual staining). Sidewalls that will be removed during subsequent excavation of adjacent areas will not be surveyed or sampled.
Biased sampling may be conducted if field observations indicate a potential area within the excavation that may be impacted. Conditions that may lead to biased sampling include preferential pathways for contaminant migration (porous soil) or visual discoloration of soil. These biased sample location will be collected and analyzed the same as the systematic confirmation samples. If no biased approach is identified, sample starting locations will be selected at random.
The Project will notify MDNR when an excavation has been identified as having potentially achieved RG based upon screening data. Given the information, MDNR will have the opportunity to collect additional samples at their discretion. MDNR will possess data collected from the excavations prior to backfilling.
Field Sampling Plan Operable Unit 1
EO-11-001 15 December 2012
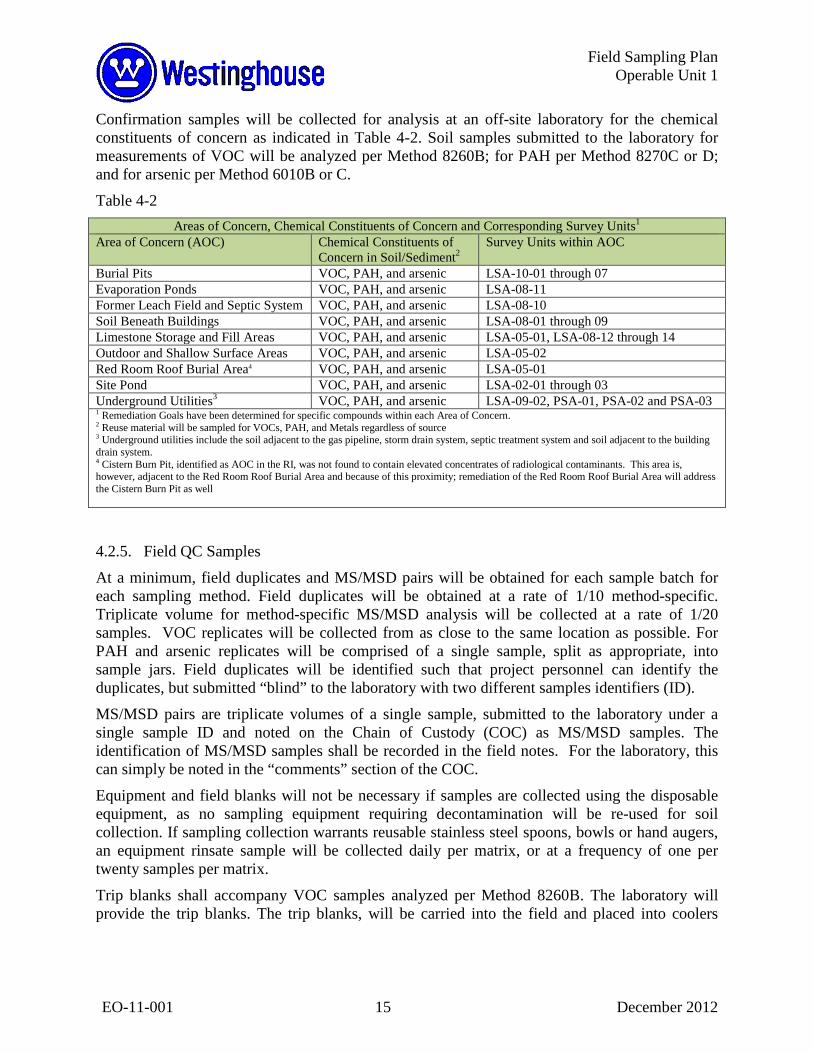
Confirmation samples will be collected for analysis at an off-site laboratory for the chemical constituents of concern as indicated in Table 4-2. Soil samples submitted to the laboratory for measurements of VOC will be analyzed per Method 8260B; for PAH per Method 8270C or D; and for arsenic per Method 6010B or C.
Table 4-2 Areas of Concern, Chemical Constituents of Concern and Corresponding Survey Units1
Area of Concern (AOC) Chemical Constituents of Concern in Soil/Sediment2
Survey Units within AOC
Burial Pits VOC, PAH, and arsenic LSA-10-01 through 07 Evaporation Ponds VOC, PAH, and arsenic LSA-08-11 Former Leach Field and Septic System VOC, PAH, and arsenic LSA-08-10 Soil Beneath Buildings VOC, PAH, and arsenic LSA-08-01 through 09 Limestone Storage and Fill Areas VOC, PAH, and arsenic LSA-05-01, LSA-08-12 through 14 Outdoor and Shallow Surface Areas VOC, PAH, and arsenic LSA-05-02 Red Room Roof Burial Area4 VOC, PAH, and arsenic LSA-05-01 Site Pond VOC, PAH, and arsenic LSA-02-01 through 03 Underground Utilities3 VOC, PAH, and arsenic LSA-09-02, PSA-01, PSA-02 and PSA-03 1 Remediation Goals have been determined for specific compounds within each Area of Concern. 2 Reuse material will be sampled for VOCs, PAH, and Metals regardless of source 3 Underground utilities include the soil adjacent to the gas pipeline, storm drain system, septic treatment system and soil adjacent to the building drain system. 4 Cistern Burn Pit, identified as AOC in the RI, was not found to contain elevated concentrates of radiological contaminants. This area is, however, adjacent to the Red Room Roof Burial Area and because of this proximity; remediation of the Red Room Roof Burial Area will address the Cistern Burn Pit as well
4.2.5. Field QC Samples
At a minimum, field duplicates and MS/MSD pairs will be obtained for each sample batch for each sampling method. Field duplicates will be obtained at a rate of 1/10 method-specific. Triplicate volume for method-specific MS/MSD analysis will be collected at a rate of 1/20 samples. VOC replicates will be collected from as close to the same location as possible. For PAH and arsenic replicates will be comprised of a single sample, split as appropriate, into sample jars. Field duplicates will be identified such that project personnel can identify the duplicates, but submitted “blind” to the laboratory with two different samples identifiers (ID).
MS/MSD pairs are triplicate volumes of a single sample, submitted to the laboratory under a single sample ID and noted on the Chain of Custody (COC) as MS/MSD samples. The identification of MS/MSD samples shall be recorded in the field notes. For the laboratory, this can simply be noted in the “comments” section of the COC.
Equipment and field blanks will not be necessary if samples are collected using the disposable equipment, as no sampling equipment requiring decontamination will be re-used for soil collection. If sampling collection warrants reusable stainless steel spoons, bowls or hand augers, an equipment rinsate sample will be collected daily per matrix, or at a frequency of one per twenty samples per matrix.
Trip blanks shall accompany VOC samples analyzed per Method 8260B. The laboratory will provide the trip blanks. The trip blanks, will be carried into the field and placed into coolers

Field Sampling Plan Operable Unit 1
EO-11-001 16 July 2013
containing samples for VOC analysis. Trip blanks identify VOC contamination introduced during sample handling in the field and/or in transit. Two to three vials shall be used for each trip blank; at no time are these vials to be opened by the field crew.
No QC samples will be analyzed solely to determine waste acceptance criteria, unless otherwise designated by the waste acceptance facility or regulators.
4.2.6. Data Evaluation
Any location where the laboratory analytical sample result exceeds a RG will be marked in the field. Additional excavation to remove the impacted material will be based on the established grid (survey unit) system (Figure 4). Where a grid node has exceeded the RG, the adjacent grid nodes will be sampled and the process repeated until the limit of the “hot spot” requiring removal have been defined. The new excavation surface will be sampled after hot spot removal. The chemical RG for OU-1 will be applied to soil and sediment at depths as described in Section 2.0.
4.3. Sample Collection Methodology
4.3.1. Collection of Headspace Samples
Headspace samples will be collected using a stainless steel spoon, spade, or equivalent, and placed into a disposable, sealable bag. The bag will equilibrate for a minimum of 15 minutes before being screened.
Headspace measurements will be obtained by puncturing the top of the bag with the PID/FID probe, minimizing the potential for ambient air to enter the bag. The probe will remain in the bag for approximately 30 seconds, or until the measurement stabilized. The stabilized measurement will be recorded in the field logbook. In the event that the measurement does not stabilize in the allotted 30 seconds, the highest reading will be recorded. The procedure for the use of the PID/FID is HDP-PR-EM-021 (Reference 13).
4.3.2. Collection of Samples for VOC Analysis
Samples for VOC will be collected per Method 5035A (Reference 3). Samples will be obtained using an EPA-approved volumetric sampling device (i.e. lock n load syringe) to extract 5-gram (g) aliquot plug of soil that will be added directly to a pre-weighed gas-tight vial. A single sample will comprise of a set of replicates: Two (2) 5g soil aliquots in a 40 millimeter (mL) vial of deionized water, where one is reserved for repeat analysis; one 5g soil aliquot without deionized water in the event of high concentrations needing dilutions; and, one vial of soil for percent moisture determination. The samples will be cooled (4±2˚C) and submitted to the laboratory within a 48 hour hold time from collection for preservation (laboratory will preserve samples by freezing per EPA Method 5035A). The laboratory will be capable of achieving reporting limits that are below the remediation goals for comparison. Table 4-3 shows the analytical method, sample containers and hold times. Sampling will be conducted in accordance with HDP-PR-EM-019 (Reference 11).

Field Sampling Plan Operable Unit 1
EO-11-001 17 December 2012
4.3.3. Collection of Samples for PAH Analysis
PAH samples will be collected in the field using disposable bowls and spoons; stainless steel spoons, hand augers; or Westinghouse approved equivalent. Although unlikely to cause analytical interference for PAHs, contact with plastics including gloved hands, will be avoided for collection of samples for Method 8270C/D analysis as a best-management field practice. Each sample will be a multi-aliquot composite from a minimum of 15 locations within the survey area. Aliquots for a sample will be roughly equal volume, deposited in the mixing bowl. The soil sample will be homogenized, and after thorough mixing, the sample will be transferred to a glass container.
The container shall be labeled according to procedures and submitted to the laboratory for analysis using EPA SW846, Method 8270C or D. The laboratory will be capable of achieving reporting limits that are below the remediation goals for comparison. Table 4-3 shows the analytical method, sample containers, and holding times for the verification samples to be collected. Sampling is in accordance to HDP-PR-EM-019 (Reference 11).
4.3.4. Collection of Samples for Arsenic Analysis
Arsenic samples will be collected in the field using baggies; stainless steel spoons, hand augers; or Westinghouse approved equivalent. Because aluminum can cause wavelength interference (and false positive results) for arsenic, the specific metal of concern at this site, reusable equipment made of aluminum will not be used for collection of samples for metals analysis. Each sample will be a multi-aliquot composite from a minimum of 15 locations within the survey area. Aliquots for a sample will be roughly equal volume, deposited in the mixing bowl. The soil sample will be homogenized and after thorough mixing, the sample will be transferred to a glass container.
The container will be labeled according to procedures and submitted to the laboratory for analysis using EPA SW846, Method 6010B/C. The laboratory will be capable of achieving reporting limits that are below the remediation goals for comparison. Table 4-3 shows the analytical method, sample containers, and holding times for the verification samples to be collected. Sampling will be conducted in accordance with HDP-PR-EM-019 (Reference 11).
4.4. Sampling for Waste Characterization
Where possible, existing laboratory data will be utilized to characterize soils requiring excavation and disposal and to prepare waste profiles for disposal facility approval. In cases where sufficient characterization testing has not been completed prior to initiating excavation activities, four soil aliquots will be randomly collected from VOC-contaminated material, placed into the sample container(s), and submitted for laboratory analysis. The sampling of VOC-contaminated soil may coincide with the radiological sampling required to meet waste disposal requirements. If necessary, stockpiled materials may be submitted to the laboratory for analysis of VOCs, PAHs, RCRA metals via the toxicity characteristic leach procedure (TCLP), depending on the CoC within the excavation area. The laboratory analytical results will be compared to the 40 CFR Part 261 (hazardous waste regulations) to determine if the soil is characterized as hazardous or non-hazardous. The results will also be utilized to prepare waste profiles for submission to the disposal facility prior to disposal.

Field Sampling Plan Operable Unit 1
EO-11-001 18 January 2015
Table 4-3 Analytical Methods, Sample Containers, Preservation, and Holding Times 1
Parameter Method Container Preservation Holding Time
Volatile Organic Compounds
SW846, 8260B
2 x 40mL pre-weighed, gas-tight sealed vial containing deionized water
Cool 4ºC ±2ºC Frozen to < -7˚C upon laboratory receipt
48 hours to preserve 14 days for analysis from preservation
1 x 40mL pre-weighed, gas-tight sealed vial
Cool 4ºC ±2ºC Frozen to < -7˚C upon laboratory receipt
48 hours to preserve 14 days for analysis from preservation 1 sample container for
moisture determination
Polynuclear Aromatic Hydrocarbons (PAH)
SW846, 8270C/D
1x 8 ounce glass at a minimum Cool 4ºC ±2ºC
Samples extracted within 14 days and extracts analyzed within 40 days following extraction.
Target Analyte List Metals
SW846, 6010B/7000
1x 8 ounce glass at a minimum
Cool 4ºC HNO3, pH < 2 upon laboratory receipt
180 days, Hg 48 days
Trip Blanks (water) 2 SW846, 8260B
2 -3x 40mL , gas-tight sealed vial
HCl to pH< 2 Cool 4ºC ±2ºC 7 days
1 If equipment rinsates are needed, field personnel will coordinate with the laboratory to ensure that 2x 1L containers are available for PAH (cool to 4°C) and HDPE or other suitable containers with appropriate preservative are provided for metals analyses. Requirements for VOC rinsates are the same as the container requirement for trip blanks. For VOC rinsates, ensure no headspace > pea-size is present and that vials are not over-filled to maintain the integrity of the pre-filled preservative.
2Trip blanks provided by the laboratory
4.5. Sampling of Imported Materials
Backfill materials include both on-site soils determined to meet DCGL and RG (with or without treatment) and imported off-site soils. Fill material used at depths greater than 1 foot, compared to final site contours, will be considered deep backfill material. Topsoil includes select imported off-site soils and on-site soils that exhibit characteristics of a suitable vegetative growth medium.
Imported backfill will consist of suitable soil materials from one or more sources approved in advance by Westinghouse. Such sources include Missouri Department of Transportation (MoDOT) approved commercial local materials supplier or any excavated surface or subsurface soil that was tested for chemical and radioactivity content and found to be suitable for use as backfill material. Suitable imported soil materials designed for use as deep backfill include acceptable cohesive and cohesion-less materials defined under the American Society for Testing and Materials (ASTM) D-2487 Unified Soil Classification System (USCS) as SM, SC, ML, and CL. Borderline soil, as defined by USCS, which are a result of the combination of any soil classified as suitable, will be classified as suitable. USCS classification will be determined by geotechnical testing, as outlined below in Table 4-4.
Deep backfill materials will be visually inspected to be free from debris, roots, brush, sod, organic or frozen materials, asphalt, concrete, or rocks. Sporadic isolated rocks of a size small
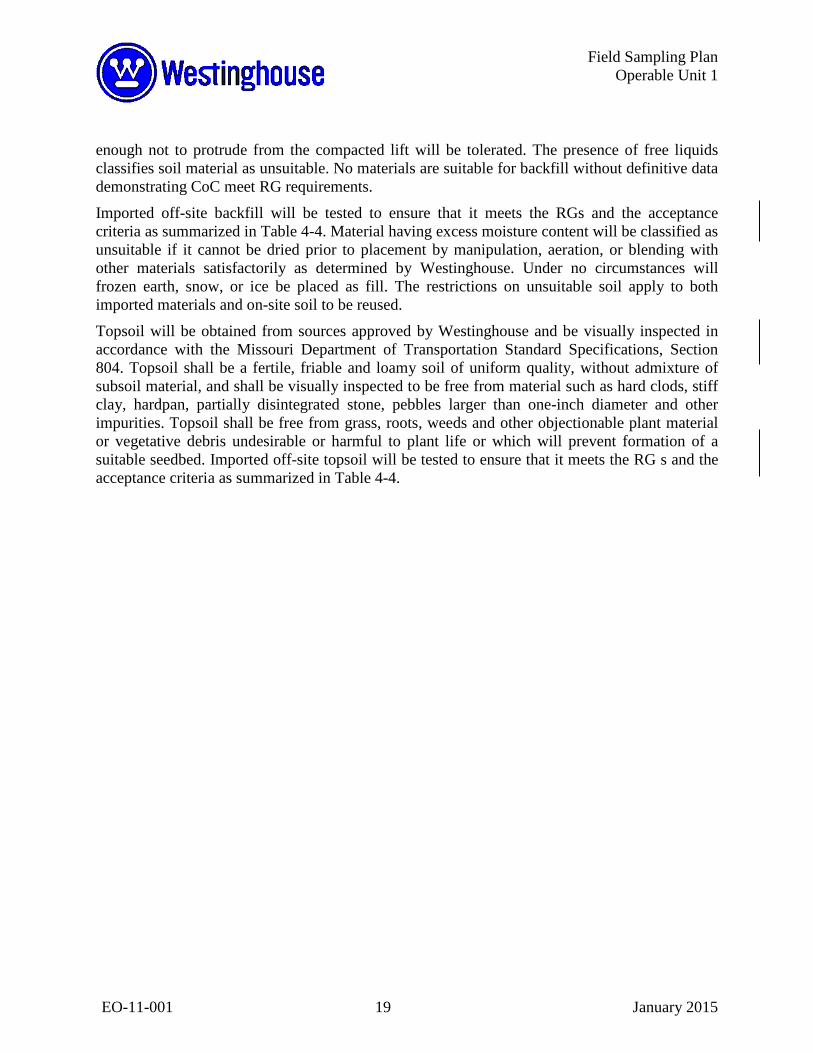
Field Sampling Plan Operable Unit 1
EO-11-001 19 January 2015
enough not to protrude from the compacted lift will be tolerated. The presence of free liquids classifies soil material as unsuitable. No materials are suitable for backfill without definitive data demonstrating CoC meet RG requirements.
Imported off-site backfill will be tested to ensure that it meets the RGs and the acceptance criteria as summarized in Table 4-4. Material having excess moisture content will be classified as unsuitable if it cannot be dried prior to placement by manipulation, aeration, or blending with other materials satisfactorily as determined by Westinghouse. Under no circumstances will frozen earth, snow, or ice be placed as fill. The restrictions on unsuitable soil apply to both imported materials and on-site soil to be reused.
Topsoil will be obtained from sources approved by Westinghouse and be visually inspected in accordance with the Missouri Department of Transportation Standard Specifications, Section 804. Topsoil shall be a fertile, friable and loamy soil of uniform quality, without admixture of subsoil material, and shall be visually inspected to be free from material such as hard clods, stiff clay, hardpan, partially disintegrated stone, pebbles larger than one-inch diameter and other impurities. Topsoil shall be free from grass, roots, weeds and other objectionable plant material or vegetative debris undesirable or harmful to plant life or which will prevent formation of a suitable seedbed. Imported off-site topsoil will be tested to ensure that it meets the RG s and the acceptance criteria as summarized in Table 4-4.

Field Sampling Plan Operable Unit 1
EO-11-001 20 January 2015
Table 4-4 Geotechnical and Chemical Testing Requirements
Deep Backfill Soil Required Test Testing Frequency Acceptance Criteria
Laboratory Classification (ASTM D 2487) 1 per source USCS SM, SC, ML, and CL,
plus borderline soil. Sieve Analysis with
Hydrometer (ASTM D 422)
1 per source Consistent with acceptable soil classifications
Liquid Limit, Plastic Limit and Plasticity Index of Soils (ASTM
D 4318) 1 per source Consistent with acceptable soil
classifications
Chemical Testing1: VOC, PCB, Pesticides (EPA SW-846)
(Reference 3);
Commercial Supplier: 1 per source per 5,000 yd3
Non-Commercial Supplier: 1 per source per
3,000 yd3
On-site Material: 1 per 100 yd3
MRBCA default criteria for residential soil (RG).
Chemical Testing: Metals
(EPA SW-846)
Commercial Supplier: 1 per source per 5,000 yd3
Non-Commercial Supplier: 1 per source per
3,000 yd3
On-site Material: 1 per 100 yd3
MRBCA default criteria for residential soil (RG) Except:
Arsenic: Average concentration ≤ 9.6 mg/kg
Beryllium: ≤ 2 mg/kg Lead: ≤ 90 mg/kg
Topsoil Required Test Testing Frequency Acceptance Criteria
Visual Inspection 1 every 2,000 yd3 Missouri Department of Transportation Section 804
Chemical Testing1: VOC, PCB, Pesticides (EPA SW-846)
(Reference 3)
Commercial Supplier: 1 per source per 5,000 yd3
Non-Commercial Supplier: 1 per source per 3,000 yd3
On-site Material: 1 per 100 yd3
MRBCA (Reference 4) default criteria for residential soil (RG)
Chemical Testing: Metals
(EPA SW-846)
Commercial Supplier: 1 per source per 5,000 yd3
Non-Commercial Supplier: 1 per source per
3,000 yd3
On-site Material: 1 per 100 yd3
MRBCA default criteria for residential soil (RG) Except:
Arsenic: Average concentration ≤ 9.6 mg/kg
Beryllium: ≤ 2 mg/kg Lead: ≤ 81 mg/kg
1 Sampling for PCB and Pesticides will not be performed for onsite material.

Field Sampling Plan Operable Unit 1
EO-11-001 21 December 2012
For the laboratory analytical data to be utilized, the detection and reporting limits need to be lower than the corresponding RG. Table 4-5 shows the laboratory method detection limits, the routine reporting limits and the Project approved remediation goals.
Table 4-5 Laboratory Method Detection Limits, Routine Reporting Limits and Remediation Goals1
Chemical Name Method Detection Limits (mg/kg)
Routine Reporting Limits (mg/kg)
Remediation Goals (mg/kg)
Volatile Organic Compounds (VOC) by EPA SW846, 8260B cis-1,2-Dichloroethylene 0.000597 0.005 0.521 trans-1,2-Dichloroethylene 0.000943 0.005 1.10 Trichloroethylene (TCE) 0.000385 0.005 0.141 Tetrachloroethylene (PCE) 0.000322 0.005 0.141 Vinyl Chloride 0.000428 0.010 0.0192 Polynuclear Aromatic Hydrocarbons (PAH) by SW846, 8270C/D Benzo(a)Anthracene 0.033 0.33 6.12 Benzo(a)Pyrene 0.033 0.33 0.62 Benzo(b)Fluoranthene 0.033 0.33 6.19 Indeno (1,2,3-cd)Pyrene 0.033 0.33 3.77 Total PAH2 --- --- 2.0 Metals by SW846, 6010B/C Arsenic 0.32 1.0 9.6
1Table Q-10 through Q-15 of the RI/FS QAPP contain the MDL and RL for all compound reported by the analytical method. This table is included to assess the MDL and RL against the remediation goals contained in the ROD. 2Total PAH applies to the sediment within the site pond.

Field Sampling Plan Operable Unit 1
EO-11-001 22 December 2012
5. SAMPLE HANDLING PROCEDURES
5.1. Sample Identification
Westinghouse has established the following nomenclature for the identification of samples collected during decommissioning. The nomenclature will be unique in order to distinguish decommissioning samples from earlier characterization samples, in process excavation samples, or the samples collected throughout the project. Table 5-1 presents the sample nomenclature.
Table 5-1
MS/MSD pairs will be indicated with a notation on the COC.
A single identifier is required per sample, regardless of how many containers collected or how many analyses requested for that sample. Specifics for each sample collected will be recorded, at a minimum, in the field logbook or on field forms with adequate information that each sample can be tied back with both ID and field notations to location represented, depth (if applicable), sample type, and date and time collected.
5.2. Sample Custody
The following section details custody procedures, as well as related procedures, involved in sample handling. The applicable portions of the HDP-PR-QA-006, Chain of Custody (Reference 14) will also be followed.
Sample Nomenclature
Sample Group Number
AOC Number
Survey Area Number
Survey Unit
Number1
Sample Identification
Number
Sample Type
# # # # # # L # # # # # # # # Four digit auto-generated sequential number
Two digit number AOC number 00 = Site Pond 03 = Burial Pits 04 = Evaporation
Ponds 05 = Former Leach
Field and Septic System
06 = Soil Beneath Buildings
L = Open Land Survey Area Plus the two digit number corresponding to the Survey Area Codes
Two digit number corresponding with the Survey Unit
Sequential number beginning with 01
Two character string indicating sample type SO = Soil TB = Trip Blank MS = Matrix Spike MSD = Matrix Spike
Duplicate HS = Headspace
Sample None = Field
Duplicate2
Example (Soil Sample Identification 120 collected in Survey Unit LSA-10-01 within the Burial Pit AOC)
2 4 7 0 0 3 L 0 0 0 0 1 2 SO 1Prior to confirmation sample collection Survey Area and Survey Unit designations are not applicable. The value “L00” should be used in the Survey Area field and the value ‘00’ should be used in the survey unit field. 2No character string used for field duplicate. The field duplicate is a blind sample to the laboratory

Field Sampling Plan Operable Unit 1
EO-11-001 23 October 2014
All sample shipments will be accompanied by the COC identifying the contents. This record will be used to document the transfer of sample custody from the sampler, to the courier, and finally to the analytical laboratory.
The COC ensures that samples can be traced from the time of field collection to receipt at the analytical laboratory. The original COC is shipped with the samples by placing it with the samples in the shipping container (or by giving to the courier). The initiator of the COC retains a copy. Information required for the COC includes:
Type and sample matrix
• Analytical methods • Sample number • Signature of sampler • Date and time of sample collection • Project name, location, and address • Signatures of persons involved in the chain of possession
5.3. Sample Packing
Samples collected using Method 5035A are ready to be packed following collection. Trip blanks (provided by the laboratory upon request) will be placed in each cooler containing samples for VOC. Two or three vials per trip blank will be enclosed (multiple vials representing a single trip blank). Arsenic/PAH will be collected into glass jars. VOC will be collected in gas-tight sealed vials. As appropriate, the sample containers will be kept upright in the cooler, with space between sample containers. When warranted, the samples will include packing material placed around the samples. to prevent breaking of containers. Ice or gel packs will be placed around the sample containers to provide uniform cooling during shipping. A sufficient amount of ice will be used to ensure cooling of the samples. A custody seal will be placed on the cooler lid, dated, and initialed.
5.4. Investigation Derived Waste
Investigation derived waste will consist of used personnel protective equipment, and will be managed in accordance with HDP-PR-WM-921, Control and Management of Investigation Derived Waste (Reference 16).
5.5. Health and Safety
All site activities will be conducted in accordance with the HDP-PO-EHS-001 (Reference 8).

Field Sampling Plan Operable Unit 1
EO-11-001 24 December 2012
6. DATA VALIDATION and REPORTING
6.1. Laboratory Review
The laboratory will perform three levels of review to evaluate data generation and reduction. Each level of review requires evaluation of the data quality based on the results of the QC data and the professional judgment of the data reviewer. The levels of laboratory review performed for all laboratory data are described below:
Level I – Consists of a review of the quality of the analytical work. The analyst who performed the test performs the Level I review. At a minimum, this review ensures that:
• Sample preparation and analytical results information are correct; • Appropriate standard operating procedures (SOP) were followed; • QC samples are within established limits; • Data transfers were verified; and • Documentation is correct and complete.
Level II – Consists of a technical review of the quality of the analytical work. Personnel who have not performed the test and have documented training for the standard analytical requirements will perform it. The purpose of this review is to provide an independent, complete peer review of the analytical data package. Level II review requires the review of calibration data, QC sample results, and analytical results.
Level III – Consists of a total overview of the data package by a QC officer, supervisor, or other laboratory designee with documented training on Level III review. Level III review includes the following:
• Spot check of raw data; • Review of manual integrations and calculations; • Review of the sample receipt information; and • Final report verification to ensure compliance with project-specific requirements.
Any errors will be corrected and documented. A different individual will perform each level of review. The percentage of data reviewed for each of the three levels will be specified by standard laboratory procedures.
6.2. Laboratory Reporting
Because samples results will be initially reported on expedited turn-around-times (TAT), preliminary data will be received via email with QC summaries only. Full data packages with summary sheets and raw data will follow on CD or will be available for upload from a laboratory portal. Any required electronic data deliverable (EDD) will accompany the data package.
6.3. Data Review and Validation
Preliminary data will be evaluated when received from the laboratory via email and any QC outliers that can be ascertained will be evaluated. If it can be determined with information
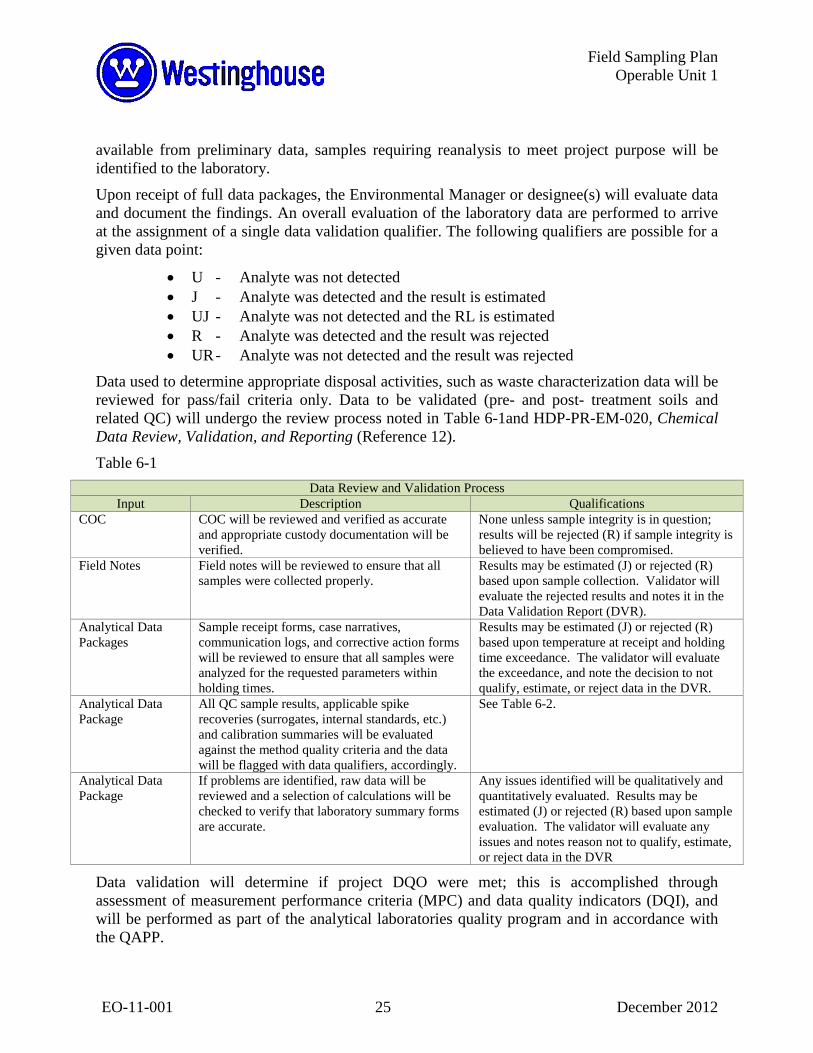
Field Sampling Plan Operable Unit 1
EO-11-001 25 December 2012
available from preliminary data, samples requiring reanalysis to meet project purpose will be identified to the laboratory.
Upon receipt of full data packages, the Environmental Manager or designee(s) will evaluate data and document the findings. An overall evaluation of the laboratory data are performed to arrive at the assignment of a single data validation qualifier. The following qualifiers are possible for a given data point:
• U - Analyte was not detected • J - Analyte was detected and the result is estimated • UJ - Analyte was not detected and the RL is estimated • R - Analyte was detected and the result was rejected • UR - Analyte was not detected and the result was rejected
Data used to determine appropriate disposal activities, such as waste characterization data will be reviewed for pass/fail criteria only. Data to be validated (pre- and post- treatment soils and related QC) will undergo the review process noted in Table 6-1and HDP-PR-EM-020, Chemical Data Review, Validation, and Reporting (Reference 12).
Table 6-1 Data Review and Validation Process
Input Description Qualifications COC
COC will be reviewed and verified as accurate and appropriate custody documentation will be verified.
None unless sample integrity is in question; results will be rejected (R) if sample integrity is believed to have been compromised.
Field Notes
Field notes will be reviewed to ensure that all samples were collected properly.
Results may be estimated (J) or rejected (R) based upon sample collection. Validator will evaluate the rejected results and notes it in the Data Validation Report (DVR).
Analytical Data Packages
Sample receipt forms, case narratives, communication logs, and corrective action forms will be reviewed to ensure that all samples were analyzed for the requested parameters within holding times.
Results may be estimated (J) or rejected (R) based upon temperature at receipt and holding time exceedance. The validator will evaluate the exceedance, and note the decision to not qualify, estimate, or reject data in the DVR.
Analytical Data Package
All QC sample results, applicable spike recoveries (surrogates, internal standards, etc.) and calibration summaries will be evaluated against the method quality criteria and the data will be flagged with data qualifiers, accordingly.
See Table 6-2.
Analytical Data Package
If problems are identified, raw data will be reviewed and a selection of calculations will be checked to verify that laboratory summary forms are accurate.
Any issues identified will be qualitatively and quantitatively evaluated. Results may be estimated (J) or rejected (R) based upon sample evaluation. The validator will evaluate any issues and notes reason not to qualify, estimate, or reject data in the DVR
Data validation will determine if project DQO were met; this is accomplished through assessment of measurement performance criteria (MPC) and data quality indicators (DQI), and will be performed as part of the analytical laboratories quality program and in accordance with the QAPP.

Field Sampling Plan Operable Unit 1
EO-11-001 26 December 2012
Once full data packages are received, QC sample results, applicable spike recoveries (surrogates, internal standards, etc.) and calibration summaries will be evaluated against the method quality criteria and the data will be flagged with data qualifiers, accordingly, as noted in Table 6-2.
Table 6-2 Validation Criteria
QC Sample Frequency MPC Action Method Blank 1/Batch of 20 or fewer
samples No compounds > RL; If there are no detects in samples, or they are
> 5x (10x for common contaminants) blank level, no qualifications are required. Otherwise, results in samples may be qualified as non-detect (U) with annotation (B)
Trip Blank 2/Cooler containing samples for 5035A/8260B
No compounds > RL If there are no detects in samples, or they are > 5x (10x for common contaminants) blank level, no qualifications are required. Otherwise, results in samples may be qualified as non-detect (U) with annotation (B)
Laboratory Control Sample/ Laboratory Control Sample Duplicate (LCS/LCSD)
1/Batch of 20 or fewer samples
Laboratory acceptance criteria
Flag values outside control criteria (J/UJ), if appropriate (non-detect results associated with high bias recoveries may not require qualification).
MS/MSD
1/Batch of 20 or fewer samples
Laboratory acceptance criteria
Evaluate data and determine if a matrix effect is or analytical error is indicated. Flag values outside control criteria (J/UJ), if appropriate (non-detect results associated with high bias recoveries may not require qualification). Additionally, unless believed to be representative of a greater area, only the parent sample is qualified.
Surrogate Standard
All field and QC Samples Laboratory % Recovery Limits
Flag values outside control criteria (JUJ), if appropriate (non-detect results associated with high bias recoveries may not require qualification).
Internal Standard All field and QC Samples Method criteria Flag reported values (J/UJ) outside control criteria.
Calibrations Continuing calibration 1/Analysis Batch Initial calibration following instrument maintenance or as needed
Method criteria Flag reported values (J/UJ) outside control criteria
Rejection of data will depend upon professional judgment and the comparison of outlier values against the RG. If any data is rejected, a full explanation will be given as to why the data was rejected, as well as any corrective actions that may become necessary.

Field Sampling Plan Operable Unit 1
EO-11-001 27 December 2012
6.4. Data Validation Report
The Data Validator will evaluate data received from the laboratory and document the findings in a data validation report (DVR). The DVR will be reviewed for both technical accuracy and quality in reporting prior to submission to the client. The DVR will address the following:
Sample Receipt
• COC • Receipt of Condition • Holding Times • Case Narratives
Blanks
• Method Blanks • Trip Blanks
Calibrations
• Initial Calibrations • Continuing Calibrations
Spikes
• LCS/LCSD • MS/MSD • Surrogates • Internal Standards
Field duplicates
Reporting limits
Completeness
• Field Completeness • Analytical Completeness
Conclusions (impact of any outliers upon project DQO).
6.5. Corrective Action
Problems or potential system problems will be detected through calibration check samples, QC samples, and performance audits.
Corrective action resulting from evaluation of analytical data may include, but is not limited to:
• Re-analyzing the samples • Evaluating and amending sampling and analytical procedures • Accepting data with an acknowledged level of uncertainty

Field Sampling Plan Operable Unit 1
EO-11-001 28 December 2012
• Re-sampling and analysis, if the completeness of the data set or intended use of the data is insufficient to meet DQO
If the above corrective actions deem unacceptable, an alternate laboratory may be selected to perform necessary or appropriate verification analyses.
6.5.1. Immediate Corrective Action
Any equipment and instrument malfunctions will require immediate corrective actions. The laboratory QC charts are working tools that identify appropriate immediate corrective actions when a control limit is exceeded. The actions taken shall be noted in field or laboratory logbooks, but no other formal documentation is required unless further corrective action is necessary. These on-the-spot corrective actions will be applied daily as necessary. Affected measurements will be retaken as soon as possible. If sufficient sample quantity is available, the laboratory will re-analyze affect samples. Otherwise, additional sampling may be conducted to fill the data gap.
6.5.2. Long-Term Corrective Action
Standard QC procedures, control charts, and/or performance or system audits may identify the need for long-term corrective action. Any quality problem that cannot be solved by immediate corrective action falls into the long-term category.
The essential steps in a long-term corrective action system are:
• Identification and definition of the problem; • Investigation and determination of the cause of the problem; • Determination and implementation of a corrective action to eliminate the
problem; and • Verification that the corrective action has eliminated the problem.
Documentation of the problem is important in corrective action. The responsible person may be an analyst, the laboratory Quality Manager, the laboratory Project Chemist, or the laboratory Project Manager.
The Environmental Manager or designee will document the required corrective action for field activities. For chemical data, the appropriate laboratory personnel will document the required corrective action. The Project will discuss the corrective action with the prior to implementation if the severity of the problem warrants such discussion.
6.5.3. Out of Control Situations
A value outside the control limits or an outlier by statistical testing will be considered an out-of-control situation. Failure to meet calibration criteria, record keeping omissions, improper sampling technique, and improper storage or preservation of samples are all conditions that affect data quality and require investigation and correction. The Project will take immediate action to find the problem, recalibrate, and re-analyze the samples.

Field Sampling Plan Operable Unit 1
EO-11-001 29 December 2012
6.5.4. Laboratory Corrective Procedures
When the Project detects an out-of-control situation, the analyst, lab team leader(s), and lab manager will investigate to determine the cause and document the actions taken. The laboratory will discard data acquired concurrently with this condition and samples re-analyzed unless the investigation of the problem proves that the analysis was in control.
After the laboratory and/or the Project institutes the corrective actions, the systems performance will be rigorously checked before continuing sample analysis. No analysis will resume if the calibration check samples are outside of the method limits. The problem is diagnosed, the system fixed, and the calibration rechecked before analysis is resumed. The laboratory will document and maintain records in the laboratory maintenance book for any corrective actions associated with the Project.
6.5.5 Field Situations
Any sampling problems or deficiencies (i.e., improper sampling procedures, documentation, decontamination, or packaging procedures) detected will be corrected immediately. The deficiency and corrective action will be recorded in the field logbook. A summary of any issues will also be included in the remedial action completion report submitted to the MDNR.

Field Sampling Plan Operable Unit 1
EO-11-001 30 December 2012
7. PROJECT DOCUMENTS AND RECORDS
7.1. Laboratory Reports
The laboratory data reports will consist of complete data packages that will contain complete documentation and all raw data to allow independent data reduction and validation of analytical results from laboratory bench sheets, and instrument raw data outputs. Each laboratory data report will include the following:
• Case narrative identifying the laboratory analytical batch number; • matrix and number of samples included; • analyses performed; • analytical methods used; and • description of any problems or exceedance of QC criteria and corrective action
taken.
The laboratory manager or their designee must sign the narrative.
Table 7-1 lists the project documents and the location of the assessment of the information addressed in the documentation.
Table 7-1 Project Documents and Records
Sample Collection Documents and Records
On-site Documents and Records
Off-site Documents and Records
Data Assessment Documents
Field notes pertaining to sample collection
On-site log-books and COC
COC, scanned copies in electronic project file
DVR
Analytical Results Preliminary data via email
Sample receipt forms, case-narratives, analytical data
DVR
Data Assessment Records
Emails and recorded conversations between project field personnel and the Chemist
Analytical laboratory and in the Chemist’s electronic project file
DVR
Archived Records and Data
At locations designated by the PM, with access for appropriate project personnel
In the electronic project files, and at locations designated by the PM, with access for appropriate project personnel
Documented deliverables
7.2. Quality Control
To ensure the validity of data from the sampling and analysis program, field QC samples will be collected and submitted for analysis. Field QC samples will consist of field duplicate samples, field equipment rinsate blank samples (if applicable), trip blank samples, MS/MSD. Field duplicates will be collected at a rate of one per 10 samples to be submitted for laboratory analysis. No equipment rinsates are needed in association with samples collected using non-reusable sampling device. For arsenic/PAH samples, if non-disposable sampling equipment is

Field Sampling Plan Operable Unit 1
EO-11-001 31 December 2012
used, field equipment rinsate blank samples will be collected at a frequency of one per 20 field samples to be submitted for laboratory analysis.
Trip blank samples will be provided by the laboratory, shipped with the sample containers, and returned unopened to the laboratory in sample coolers containing multiple samples for VOC analysis. Trip blanks will be carried into the field when field samples are collected in order be subjected to the same conditions as the field samples.
MS/MSD samples will be collected at frequency of one per 20 field samples to be submitted for laboratory analysis. The COC will identify the samples collected for MS/MSD analysis. Additional sample volume will be provided as necessary to the laboratory for MS/MSD analysis. MS/MSD samples are investigative samples that will be analyzed by the laboratory to evaluate analytical accuracy and precision relative to the sample matrices.

Field Sampling Plan Operable Unit 1
EO-11-001 32 October 2014
8. REFERENCES
8.1. CITED REFERENCES
1. EPA QA/G-4, Guidance on Systematic Planning using the Data Quality Objectives Process, February 2006.
2. EPA QA/G-9, Guidance for Data Quality Assessment: Practical Methods for Data Analysis
3. EPA SW-846 4th Edition, Test Methods for Evaluating Solid Waste, Physical/Chemical Methods.
4. MRBC (latest update). Departmental Missouri Risk-Based Corrective Action Technical Guidance, June 20, 2006.
5. EO-09-001 Record of Decision Operable Unit 1, Buried Waste, Impacted Soils, and Sediment, May 2009
6. EO-10-002 Remedial Design Work Plan, Operable Unit 1, Former Fuel Cycle Facility, August 2011
7. HDP-WP-OPS-505, Excavation and Exhumation
8. HDP-PO-EHS-001, Health and Safety Plan
9. HDP-PO-GM-002, Training Plan
10. HDP-PO-WM-900, Waste Management and Transportation Plan
11. HDP-PR-EM-019, Chemical Verification and Confirmation Sampling
12. HDP-PR-EM-020, Chemical Data Review, Validation, and Reporting
13. HDP-PR-EM-021, Performing Field Screening Measurements Using a PID and FID
14. HDP-PR-QA-006, Chain of Custody
15. HDP-PR-WP-906, Waste Classification, Sample Analysis, and Reporting
16. HDP-PR-WM-921, Control and Management of Investigation Derived Waste

Field Sampling Plan Operable Unit 1
EO-11-001 33 December 2012
8.2 DEVELOPMENTAL REFERENCES (NON-CITED)
1. EPA/540/G-91/009, Management of IDW During Site Inspections, May 1991.
2. EPA-540-R-08-01, National Functional Guidelines for Superfund Organic Methods Data Review, June 2008.
3. EPA QA/G-5, Guidance for Quality Assurance Project Plans, December 2002.
4. EPA QA/G-8, Guidance on Environmental Data Verification and Data Validation, January 2008.
5. EPA QA/R-5, EPA Requirements for QA Project Plans, March 2001, May 2006
6. MDNR-QAPP-PA/SI, MDNR. Quality Assurance Project Plan for Pre-Remedial / Pre-Removal Site Assessment, Revision 4, September 2004.
7. On-Site Waste Handling and Treatment, Operable Unit 1, Westinghouse Hematite Site, April 2008

Field Sampling Plan Operable Unit 1
EO-11-001 34 December 2012
Figure 1 Project Organization Structure

Field Sampling Plan Operable Unit 1
EO-11-001 35 December 2012
Figure 2 Site Location

Field Sampling Plan Operable Unit 1
EO-11-001 36 December 2012
Figure 3 Hematite Decommissioning Project Features

Field Sampling Plan Operable Unit 1
EO-11-001 37 December 2012
Figure 4 Areas of Concern and Survey Unit Areas

Field Sampling Plan Operable Unit 1
EO-11-001 38 December 2012
Figure 5 Initial Limits of Excavation

Field Sampling Plan Operable Unit 1
EO-11-001 39 July 2013
Figure 6 – Sand/Gravel HSU Phreatic Surface by Survey Unit

Field Sampling Plan Operable Unit 1
EO-11-001 40 July 2013
Table 8a. Water Level Elevations (ft amsl) in Monitoring Wells Screened in the Sand/Gravel HSU at the Hematite Facility
LSA-07-01 LSA-08-02 LSA-08-04 LSA-08-06 LSA-08-07 LSA-08-08 LSA-08-09 LSA-08-10 LSA-08-11
NB-50 WS-23 BD-01 BD-02 BD-03 BD-05 BD-06 BD-13 BD-14 BD-15 BD-04 BD-16 BD-07 BD-08 DM-02 GW-T OA-19 EP-15 LF-08 LF-09 BD-100 BD-101 EP-14 EP-16 EP-18A GW-U
8/27/1996 - - - - - - - - - - - - - - - - - - - - - - - - - -
11/18/1998 - 422.35 - - - - - - - - - - - - - - - - - - - - - - - -
2/8/1999 - 428.43 - - - - - - - - - - - - - - - - - - - - - - - -
5/11/1999 - 424.23 - - - - - - - - - - - - - - - - - - - - - - - -
8/9/1999 - 421.41 - - - - - - - - - - - - - - - - - - - - - - - -
1/22/2002 - 422.26 - - - - - - - - - - - - - - - - - - - - - - - -
6/3/2002 - - - - - - - - - - - - - - - - - - - - - - - - - -
12/3/2004 424.63 428.07 426.39 423.32 425.35 426.02 426.73 419.09 415.83 432.30 419.01 420.60 418.76 427.59 426.22 - 426.27 414.62 415.24 413.86 - - 414.87 414.52 419.58 -
6/25/2007 417.68 419.97 - 419.97 419.32 - 417.41 412.69 414.15 - 415.35 - - 415.84 417.60 - - - - 410.19 - - 410.52 410.05 - -
9/17/2007 416.22 417.53 - 417.75 415.37 - 414.41 412.04 413.38 - 414.60 - - 412.18 418.08 - - - - 409.86 - - 409.63 409.71 - -
9/19/2007 - - - - - - - - - - - - - - - - - - - - - - - - - -
12/3/2007 415.31 417.71 - 416.94 414.42 - 413.12 411.52 412.57 - 413.54 - - 411.79 412.77 - - - - 409.39 - - 409.72 409.54 - -
3/3/2008 420.38 422.21 - 421.21 417.49 - 419.72 413.90 415.61 - 416.65 - - 418.14 419.28 - - - - 411.75 - - 411.66 411.70 - -
6/20/2008 420.80 423.55 - 423.37 418.32 - 421.60 414.85 416.98 - 417.57 - - 420.05 422.02 - - - - 412.78 - - 413.90 412.75 - -
9/11/2008 420.05 422.96 - - 419.91 - 422.78 414.59 416.27 - 418.95 - - - 426.57 - - - - 412.03 - - 412.39 411.99 - -
12/5/2008 417.44 419.69 - - - - - 412.36 413.86 - - - - - 417.05 - - - - 409.95 - - 411.26 409.87 - -
3/6/2009 421.44 425.12 - - - - - 414.40 416.16 - - - - - 426.95 - - - - 411.54 - - 411.89 411.54 - -
3/25/2009 - - - - - - - - - - - - - - - - - - - - - - - - - -
3/26/2009 - - - - - - - - - - - - - - - - - - - - - - - - - -
3/27/2009 - 423.90 - - - - - - - - - - - - - - - - - - - - - - - -
3/30/2009 - - - - - - - - - - - - - - - - - - - - - - - - - -
3/31/2009 - - - - - - - - - - - - - - - - - - - - - - - - - -

Field Sampling Plan Operable Unit 1
EO-11-001 41 July 2013
Table 8a. Water Level Elevations (ft amsl) in Monitoring Wells Screened in the Sand/Gravel HSU at the Hematite Facility
LSA-07-01 LSA-08-02 LSA-08-04 LSA-08-06 LSA-08-07 LSA-08-08 LSA-08-09 LSA-08-10 LSA-08-11
NB-50 WS-23 BD-01 BD-02 BD-03 BD-05 BD-06 BD-13 BD-14 BD-15 BD-04 BD-16 BD-07 BD-08 DM-02 GW-T OA-19 EP-15 LF-08 LF-09 BD-100 BD-101 EP-14 EP-16 EP-18A GW-U
4/1/2009 - - - - - - - - - - - - - - - - - - - - - - - - - -
6/10/2009 - - - - - - - - - - - - - - - - - - - - - - - - - -
6/22/2009 422.12 425.68 - - - - - 415.62 417.47 - - - - - 427.83 - - - - 413.04 - - 413.37 413.01 - -
9/9/2009 - - - - - - - - - - - - - - - - - - - - - - - - - -
9/25/2009 - - - - - - - - - - - - - - - - - - - - - - - - - -
9/28/2009 418.67 421.09 - 421.33 416.94 - 418.77 413.17 414.80 - 415.92 - - 417.32 424.45 416.26 - - - 410.53 - - 410.83 410.39 - 410.36
11/4/2009 - - - - - - - - - - - - - - - - - - - - - - - - - -
12/1/2009 - - - - - - - - - - - - - - - - - - - - - - - - - -
12/2/2009 - - - - - - - - - - - - - - - - - - - - - - - - - -
12/7/2009 421.83 425.60 - 421.92 418.57 - 422.96 414.73 416.59 - 417.77 - - 421.26 426.40 419.63 - - - 411.91 - - 412.28 411.87 - 411.83
2/19/2010 - - - - - - - - - - - - - - - - - - - - - - - - - -
2/22/2010 - - - - - - - - - - - - - - - - - - - - - - - - - -
2/23/2010 - - - - - - - - - - - - - - - - - - - - - - - - - -
3/17/2010 421.21 424.85 - 421.82 418.37 - 422.45 414.50 416.37 - 417.49 - - 420.87 425.64 419.48 - - - 411.79 - - 412.22 411.78 - 411.78
6/4/2010 - - - - - - - - - - - - - - - - - - - - - - - - - -
6/7/2010 - - - - - - - - - - - - - - - - - - - - - - - - - -
6/21/2010 419.62 422.65 - 421.91 417.26 - 420.48 413.57 415.31 - 416.47 - - 418.93 424.76 417.89 - - - 410.90 - - 411.25 410.81 - 410.79
9/16/2010 420.15 423.07 - 421.89 417.89 - 420.57 414.13 415.93 - 417.06 - - 419.27 426.20 418.40 - - - 411.48 - - 411.73 411.44 - 411.36
11/15/2010 - - - - - - - - - - - - - - - - - - - - - - - - - -
11/16/2010 - - - - - - - - - - - - - - - - - - - - - - - - - -
12/13/2010 418.92 - - 420.38 417.18 - 419.01 413.24 419.98 - 416.13 - - 417.47 424.66 415.87 - - - 410.65 - - 411.38 410.64 - 410.63
12/28/2010 - - - - - - - - - - - - - - - - - - - - - - - - - -

Field Sampling Plan Operable Unit 1
EO-11-001 42 July 2013
Table 8a. Water Level Elevations (ft amsl) in Monitoring Wells Screened in the Sand/Gravel HSU at the Hematite Facility
LSA-07-01 LSA-08-02 LSA-08-04 LSA-08-06 LSA-08-07 LSA-08-08 LSA-08-09 LSA-08-10 LSA-08-11
NB-50 WS-23 BD-01 BD-02 BD-03 BD-05 BD-06 BD-13 BD-14 BD-15 BD-04 BD-16 BD-07 BD-08 DM-02 GW-T OA-19 EP-15 LF-08 LF-09 BD-100 BD-101 EP-14 EP-16 EP-18A GW-U
2/21/2011 419.84 - - 421.29 417.94 - 421.68 413.94 415.37 - 417.04 - - 419.93 425.56 418.79 - - - 411.15 - - 411.49 411.11 - 411.09
3/21/2011 - - - - - - - - - - - - - - - - - - - - - - - - - -
3/22/2011 - - - - - - - - - - - - - - - - - - - - - - - - - -
6/20/2011 421.14 - - 432.18 418.63 - 421.98 414.64 - - 417.68 - - 420.69 - 419.65 - - - 412.36 - - 412.46 412.45 - 412.25
8/8/2011 - - - - - - - - - - - - - - - - - - - - - - - - - -
8/9/2011 - - - - - - - - - - - - - - - - - - - - - - - - - -
8/25/2011 - - - 423.83 - - - - - - - - - - - - - - - - - - - - - -
9/16/2011 - - - 423.56 416.27 - - - - - 415.20 - - - - - - - - - - - - - - -
9/19/2011 417.65 - - 424.21 416.30 - - 412.65 - - 415.48 - - 415.64 - 415.01 - - - 410.03 - - 410.74 409.96 - 409.92
9/22/2011 - - - 424.89 416.17 - - - - - 416.25 - - - - - - - - - - - - - - -
9/26/2011 - - - - 416.40 - - - - - - - - - - - - - - - - - - - - -
9/27/2011 - - - 428.49 - - - - - - 415.58 - - - - - - - - - - - - - - -
9/30/2011 - - - 423.00 416.03 - - - - - 415.25 - - - - - - - - - - - - - - -
10/5/2011 - - - 422.86 415.96 - - - - - 415.25 - - - - - - - - - - - - - - -
10/12/2011 - - - 422.66 416.01 - - - - - 415.25 - - - - - - - - - - - - - - -
10/20/2011 - - - 424.19 416.01 - - - - - 415.21 - - - - - - - - - - - - - - -
10/25/2011 - - - 422.65 416.14 - - - - - 415.38 - - - - - - - - - - - - 409.92 - -
11/2/2011 - - - 422.99 415.67 - - - - - 415.25 - - - - - - - - - - - - - - -
11/11/2011 - - - 431.51 - - - - - - - - - - - - - - - - - - - - - -
11/14/2011 - - - - 416.65 - - - - - 415.93 - - - - - - - - - - - - - - -
11/15/2011 - - - 423.84 416.46 - 416.85 - - - 415.70 - - 415.52 - - - - - - - - - - - -
11/16/2011 - - - 422.10 416.20 - 416.70 - - - 415.44 - - 415.33 - - - - - - - - - - - -
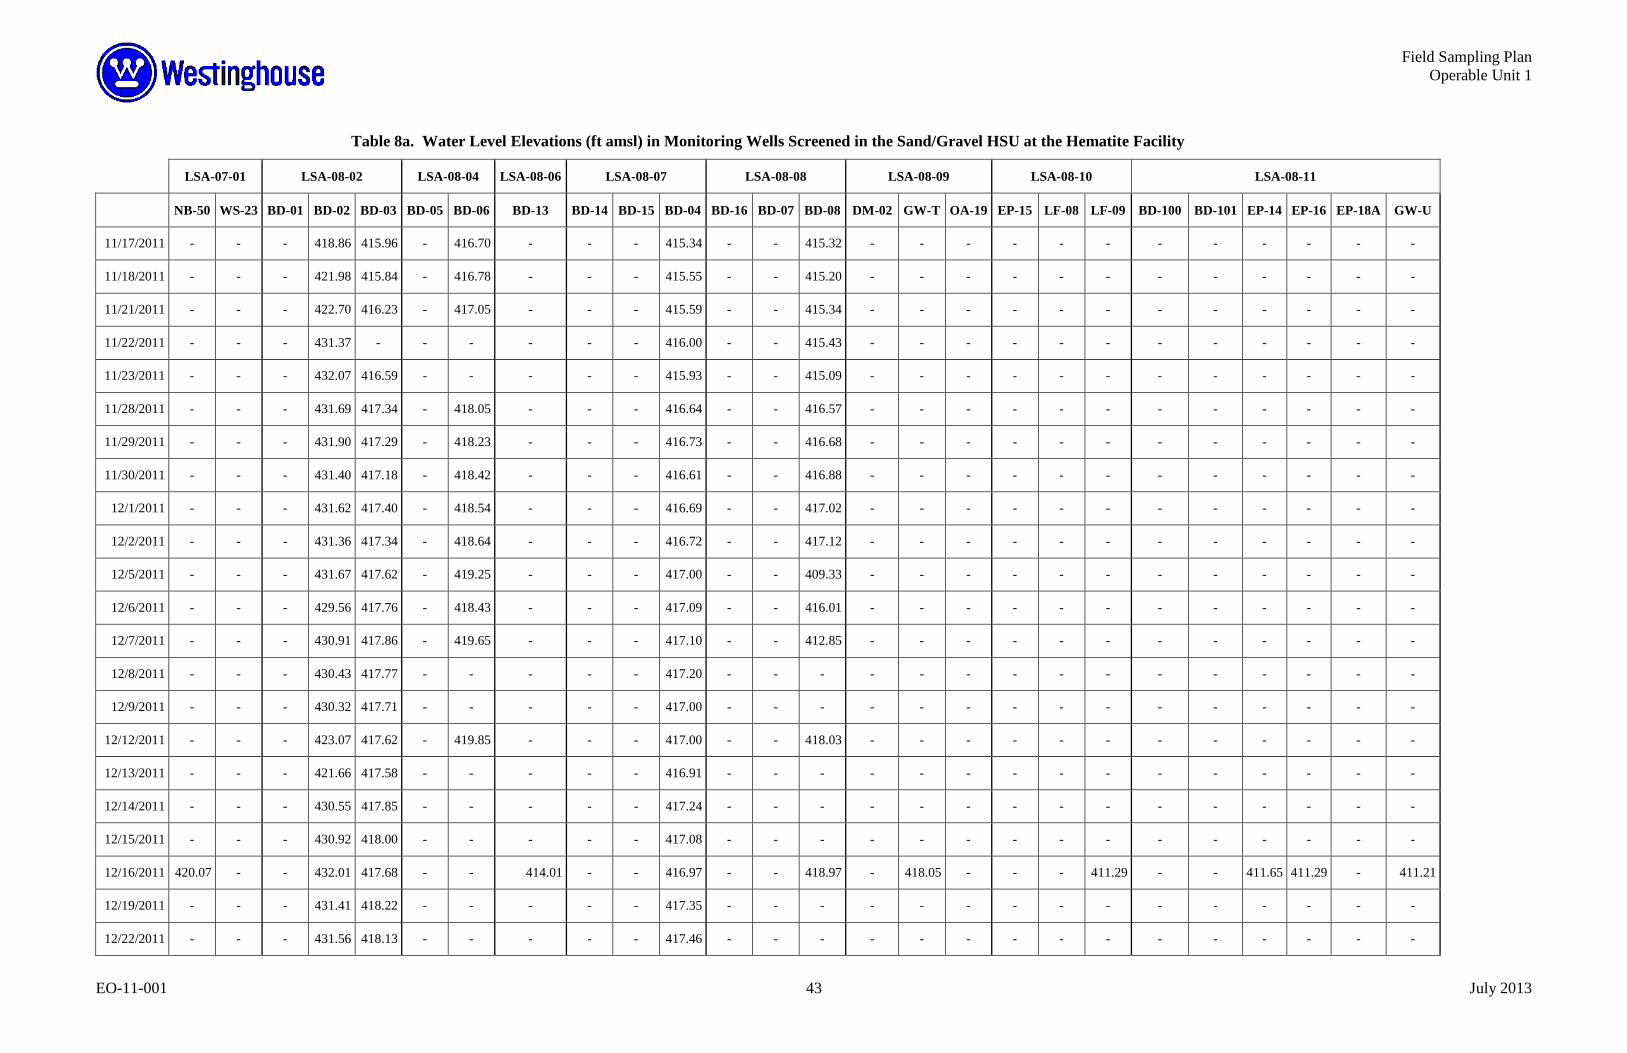
Field Sampling Plan Operable Unit 1
EO-11-001 43 July 2013
Table 8a. Water Level Elevations (ft amsl) in Monitoring Wells Screened in the Sand/Gravel HSU at the Hematite Facility
LSA-07-01 LSA-08-02 LSA-08-04 LSA-08-06 LSA-08-07 LSA-08-08 LSA-08-09 LSA-08-10 LSA-08-11
NB-50 WS-23 BD-01 BD-02 BD-03 BD-05 BD-06 BD-13 BD-14 BD-15 BD-04 BD-16 BD-07 BD-08 DM-02 GW-T OA-19 EP-15 LF-08 LF-09 BD-100 BD-101 EP-14 EP-16 EP-18A GW-U
11/17/2011 - - - 418.86 415.96 - 416.70 - - - 415.34 - - 415.32 - - - - - - - - - - - -
11/18/2011 - - - 421.98 415.84 - 416.78 - - - 415.55 - - 415.20 - - - - - - - - - - - -
11/21/2011 - - - 422.70 416.23 - 417.05 - - - 415.59 - - 415.34 - - - - - - - - - - - -
11/22/2011 - - - 431.37 - - - - - - 416.00 - - 415.43 - - - - - - - - - - - -
11/23/2011 - - - 432.07 416.59 - - - - - 415.93 - - 415.09 - - - - - - - - - - - -
11/28/2011 - - - 431.69 417.34 - 418.05 - - - 416.64 - - 416.57 - - - - - - - - - - - -
11/29/2011 - - - 431.90 417.29 - 418.23 - - - 416.73 - - 416.68 - - - - - - - - - - - -
11/30/2011 - - - 431.40 417.18 - 418.42 - - - 416.61 - - 416.88 - - - - - - - - - - - -
12/1/2011 - - - 431.62 417.40 - 418.54 - - - 416.69 - - 417.02 - - - - - - - - - - - -
12/2/2011 - - - 431.36 417.34 - 418.64 - - - 416.72 - - 417.12 - - - - - - - - - - - -
12/5/2011 - - - 431.67 417.62 - 419.25 - - - 417.00 - - 409.33 - - - - - - - - - - - -
12/6/2011 - - - 429.56 417.76 - 418.43 - - - 417.09 - - 416.01 - - - - - - - - - - - -
12/7/2011 - - - 430.91 417.86 - 419.65 - - - 417.10 - - 412.85 - - - - - - - - - - - -
12/8/2011 - - - 430.43 417.77 - - - - - 417.20 - - - - - - - - - - - - - - -
12/9/2011 - - - 430.32 417.71 - - - - - 417.00 - - - - - - - - - - - - - - -
12/12/2011 - - - 423.07 417.62 - 419.85 - - - 417.00 - - 418.03 - - - - - - - - - - - -
12/13/2011 - - - 421.66 417.58 - - - - - 416.91 - - - - - - - - - - - - - - -
12/14/2011 - - - 430.55 417.85 - - - - - 417.24 - - - - - - - - - - - - - - -
12/15/2011 - - - 430.92 418.00 - - - - - 417.08 - - - - - - - - - - - - - - -
12/16/2011 420.07 - - 432.01 417.68 - - 414.01 - - 416.97 - - 418.97 - 418.05 - - - 411.29 - - 411.65 411.29 - 411.21
12/19/2011 - - - 431.41 418.22 - - - - - 417.35 - - - - - - - - - - - - - - -
12/22/2011 - - - 431.56 418.13 - - - - - 417.46 - - - - - - - - - - - - - - -

Field Sampling Plan Operable Unit 1
EO-11-001 44 July 2013
Table 8a. Water Level Elevations (ft amsl) in Monitoring Wells Screened in the Sand/Gravel HSU at the Hematite Facility
LSA-07-01 LSA-08-02 LSA-08-04 LSA-08-06 LSA-08-07 LSA-08-08 LSA-08-09 LSA-08-10 LSA-08-11
NB-50 WS-23 BD-01 BD-02 BD-03 BD-05 BD-06 BD-13 BD-14 BD-15 BD-04 BD-16 BD-07 BD-08 DM-02 GW-T OA-19 EP-15 LF-08 LF-09 BD-100 BD-101 EP-14 EP-16 EP-18A GW-U
12/27/2011 - - - 431.88 418.62 - - - - - 417.63 - - - - - - - - - - - - - - -
1/3/2012 - - - 427.68 418.45 - - - - - 417.83 - - - - - - - - - - - - - - -
1/11/2012 - - - - - - - - - - - - - - - - - - - - - - - - - -
1/17/2012 - - - - - - - - - - - - - - - - - - - - - - - - - -
1/24/2012 - - - - - - - - - - - - - - - - - - - - - - - - - -
2/1/2012 - - - - - - - - - - - - - - - - - - - - - - - - - -
2/7/2012 - - - - - - - - - - - - - - - - - - - - - - - - - -
2/15/2012 - - - - - - - - - - - - - - - - - - - - - - - - - -
2/21/2012 - - - - - - - - - - - - - - - - - - - - - - - - - -
2/27/2012 - - - - - - - - - - - - - - - - - - - - - - - - - -
3/5/2012 - - - - - - - - - - - - - - - - - - - - - - - - - -
3/13/2012 - - - - - - - - - - - - - - - - - - - - - - - - - -
3/19/2012 420.61 - - - - - - - - - - - - - - 418.81 - - - - - - - - - 411.73
3/20/2012 - - - - - - - - - - - - - - - - - - - - - - - - - -
3/27/2012 - - - - - - - - - - - - - - - - - - - - - - - - - -
4/10/2012 - - - - - - - - - - - - - - - - - - - - - - - - - -
4/17/2012 - - - - - - - - - - - - - - - - - - - - - - - - - -
4/24/2012 - - - - - - - - - - - - - - - - - - - - - - - - - -
5/1/2012 - - - - - - - - - - - - - - - - - - - - - - - - - -
5/8/2012 - - - - - - - - - - - - - - - - - - - - - - - - - -
5/15/2012 - - - - - - - - - - - - - - - - - - - - - - - - - -
5/22/2012 - - - - - - - - - - - - - - - - - - - - - - - - - -
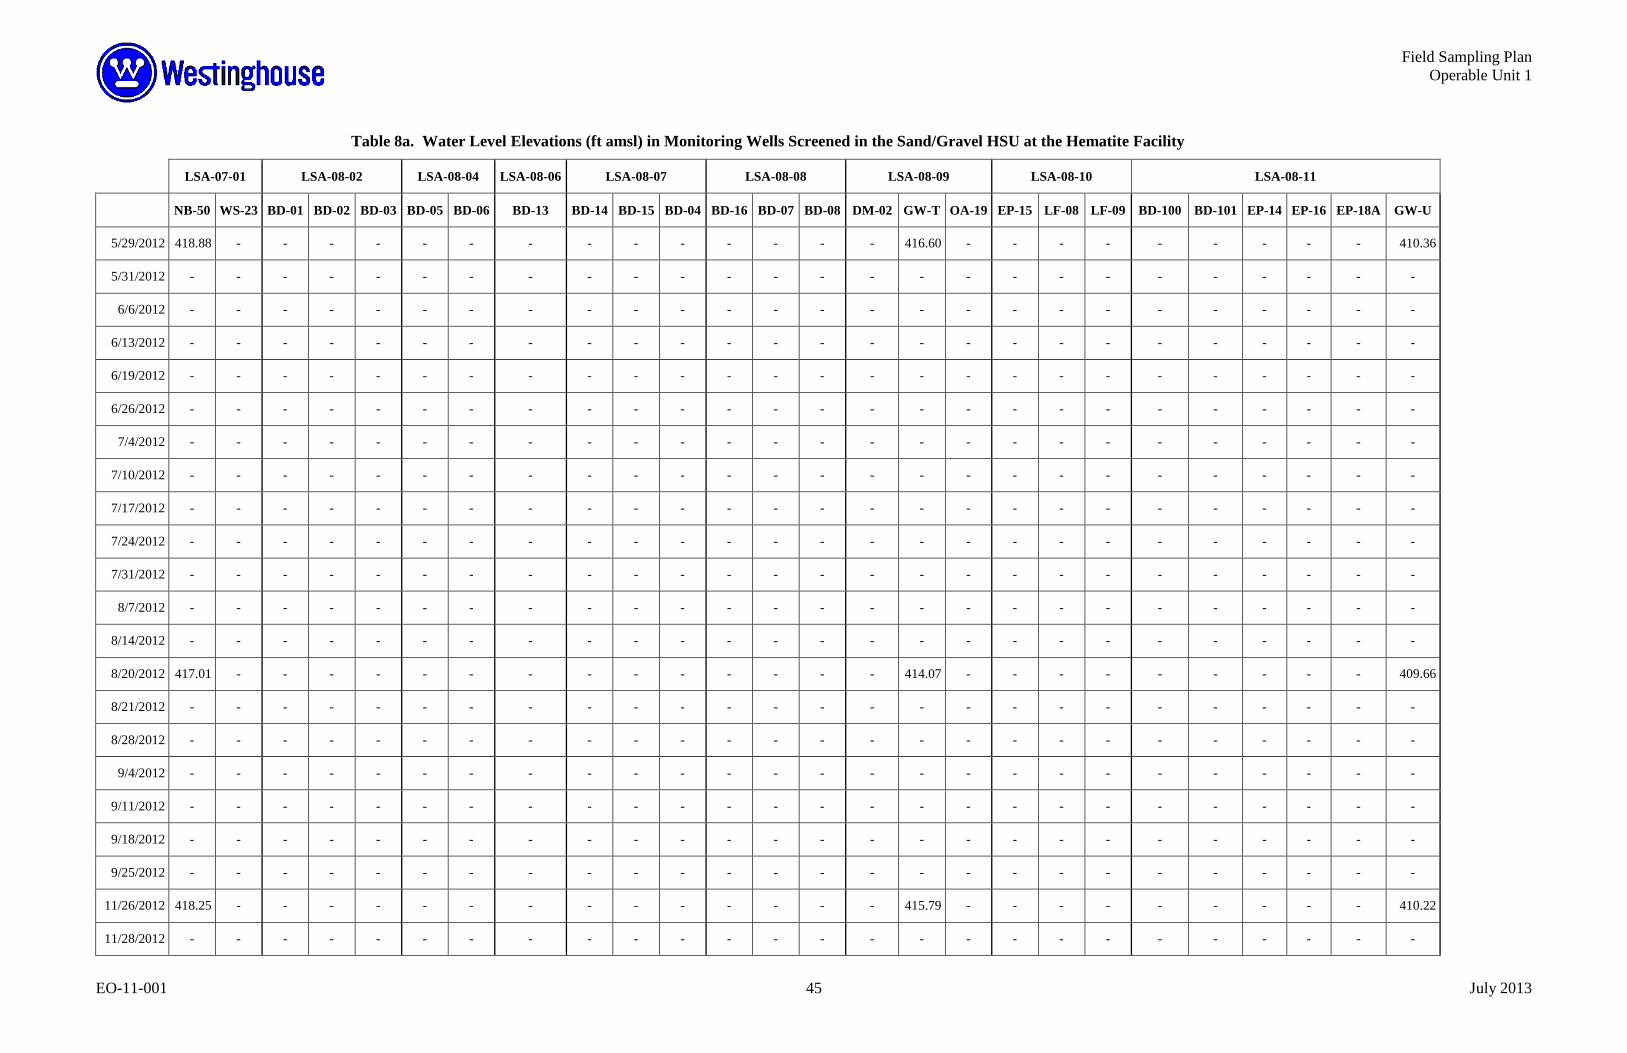
Field Sampling Plan Operable Unit 1
EO-11-001 45 July 2013
Table 8a. Water Level Elevations (ft amsl) in Monitoring Wells Screened in the Sand/Gravel HSU at the Hematite Facility
LSA-07-01 LSA-08-02 LSA-08-04 LSA-08-06 LSA-08-07 LSA-08-08 LSA-08-09 LSA-08-10 LSA-08-11
NB-50 WS-23 BD-01 BD-02 BD-03 BD-05 BD-06 BD-13 BD-14 BD-15 BD-04 BD-16 BD-07 BD-08 DM-02 GW-T OA-19 EP-15 LF-08 LF-09 BD-100 BD-101 EP-14 EP-16 EP-18A GW-U
5/29/2012 418.88 - - - - - - - - - - - - - - 416.60 - - - - - - - - - 410.36
5/31/2012 - - - - - - - - - - - - - - - - - - - - - - - - - -
6/6/2012 - - - - - - - - - - - - - - - - - - - - - - - - - -
6/13/2012 - - - - - - - - - - - - - - - - - - - - - - - - - -
6/19/2012 - - - - - - - - - - - - - - - - - - - - - - - - - -
6/26/2012 - - - - - - - - - - - - - - - - - - - - - - - - - -
7/4/2012 - - - - - - - - - - - - - - - - - - - - - - - - - -
7/10/2012 - - - - - - - - - - - - - - - - - - - - - - - - - -
7/17/2012 - - - - - - - - - - - - - - - - - - - - - - - - - -
7/24/2012 - - - - - - - - - - - - - - - - - - - - - - - - - -
7/31/2012 - - - - - - - - - - - - - - - - - - - - - - - - - -
8/7/2012 - - - - - - - - - - - - - - - - - - - - - - - - - -
8/14/2012 - - - - - - - - - - - - - - - - - - - - - - - - - -
8/20/2012 417.01 - - - - - - - - - - - - - - 414.07 - - - - - - - - - 409.66
8/21/2012 - - - - - - - - - - - - - - - - - - - - - - - - - -
8/28/2012 - - - - - - - - - - - - - - - - - - - - - - - - - -
9/4/2012 - - - - - - - - - - - - - - - - - - - - - - - - - -
9/11/2012 - - - - - - - - - - - - - - - - - - - - - - - - - -
9/18/2012 - - - - - - - - - - - - - - - - - - - - - - - - - -
9/25/2012 - - - - - - - - - - - - - - - - - - - - - - - - - -
11/26/2012 418.25 - - - - - - - - - - - - - - 415.79 - - - - - - - - - 410.22
11/28/2012 - - - - - - - - - - - - - - - - - - - - - - - - - -

Field Sampling Plan Operable Unit 1
EO-11-001 46 July 2013
Table 8a. Water Level Elevations (ft amsl) in Monitoring Wells Screened in the Sand/Gravel HSU at the Hematite Facility
LSA-07-01 LSA-08-02 LSA-08-04 LSA-08-06 LSA-08-07 LSA-08-08 LSA-08-09 LSA-08-10 LSA-08-11
NB-50 WS-23 BD-01 BD-02 BD-03 BD-05 BD-06 BD-13 BD-14 BD-15 BD-04 BD-16 BD-07 BD-08 DM-02 GW-T OA-19 EP-15 LF-08 LF-09 BD-100 BD-101 EP-14 EP-16 EP-18A GW-U
12/5/2012 - - - - - - - - - - - - - - - - - - - - - - - - - -
12/11/2012 - - - - - - - - - - - - - - - - - - - - - - - - - -
12/19/2012 - - - - - - - - - - - - - - - - - - - - - - - - - -
12/27/2012 - - - - - - - - - - - - - - - - - - - - 413.62 - - - - -
1/4/2013 - - - - - - - - - - - - - - - - - - - - - 407.43 - - - -
1/16/2013 - - - - - - - - - - - - - - - - - - - - 414.83 413.41 - - - -
1/23/2013 - - - - - - - - - - - - - - - - - - - - 414.78 413.50 - - - -
1/31/2013 - - - - - - - - - - - - - - - - - - - - 416.89 414.90 - - - -
2/7/2013 - - - - - - - - - - - - - - - - - - - - 406.32 415.19 - - - -
2/14/2013 - - - - - - - - - - - - - - - - - - - - 415.50 414.44 - - - -
Well Avg. 419.6 423.0 426.4 425.9 417.4 426.0 419.2 414.0 415.7 432.3 416.4 420.6 418.8 417.0 423.1 417.5 426.3 414.6 415.2 411.3 413.7 413.1 411.8 411.3 419.6 410.9
Well Min. 415.3 417.5 426.4 416.9 414.4 426.0 413.1 411.5 412.6 432.3 413.5 420.6 418.8 409.3 412.8 414.1 426.3 414.6 415.2 409.4 406.3 407.4 409.6 409.5 419.6 409.7
Survey Unit Avg. 421 422 419 414 416 417 421 412 412

Field Sampling Plan Operable Unit 1
EO-11-001 47 July 2013
Table 8b. Water Level Elevations (ft amsl) in Monitoring Wells Screened in the Sand/Gravel HSU at the Hematite Facility
LSA-08-12 LSA-08-13 LSA-09-01 LSA-09-02 LSA-10-01 LSA-10-02 LSA-10-04 LSA-10-05 LSA-10-06 LSA-10-07
NB-39 NB-74 GW-S GW-Z GW-D PL-04 WS-32 BP-22A PL-04 NB-39 NB-74 WS-23 BP-015 WS-25 BP-17 BP-040 WS-27 BP-20A BP-055 BP-21 GW-BB NB-61 WS-29
8/27/1996 - - - - - - - - - - - - - - - - - - - - - - -
11/18/1998 - - - - - - 412.95 - - - - 422.35 - 425.73 - - 418.50 - - - - - 413.37
2/8/1999 - - - - - - 419.76 - - - - 428.43 - 427.79 - - 424.95 - - - - - 420.08
5/11/1999 - - - - - - 413.53 - - - - 424.23 - 426.09 - - 419.19 - - - - - 414.01
8/9/1999 - - - - - - 412.35 - - - - 421.41 - 425.34 - - 418.38 - - - - - 412.88
1/22/2002 - - - - - - - - - - - 422.26 - 425.08 - - 417.06 - - - - - 412.56
12/3/2004 415.41 415.18 - - - 415.79 416.18 415.69 415.79 415.41 415.18 428.07 - 427.58 422.96 - 422.45 - - - - 418.36 416.70
6/25/2007 - 410.61 - - - - 411.62 410.90 - - 410.61 419.97 - 421.56 417.01 - 414.66 411.98 - 410.62 - - 411.18
9/17/2007 - 410.13 - - - - 410.34 409.99 - - 410.13 417.53 - 420.72 414.48 - 412.10 409.92 - 409.84 - - 410.01
12/3/2007 - 409.40 - - - - 409.58 409.29 - - 409.40 417.71 - 417.62 411.88 - 410.24 408.95 - 409.06 - - 409.07
3/3/2008 - 412.28 - - - - 412.37 412.92 - - 412.28 422.21 - 425.75 421.05 - 417.64 413.47 - 412.80 - - 412.87
6/20/2008 - 413.37 - - - - 412.61 414.75 - - 413.37 423.55 - 425.08 420.24 - 417.57 414.16 - 413.75 - - 413.00
9/11/2008 - 412.74 - - - - 413.24 413.15 - - 412.74 422.96 - 425.84 420.78 - 417.94 413.68 - 413.00 - - 413.67
12/5/2008 - 410.64 - - - - 411.06 410.99 - - 410.64 419.69 - 423.44 418.51 - 415.19 411.66 - 410.94 - - 411.64
3/6/2009 - 412.57 - - - - 413.32 413.31 - - 412.57 425.12 - 425.18 421.84 - 418.60 414.04 - 413.23 - - 414.09
3/6/2009 - - - - - - - - - - - - - - - - - - - - - - 413.99
3/27/2009 - - - - - - - - - - - 423.90 - - - - - - - - - - -
3/30/2009 - - - - - - - - - - - - - 426.31 - - 420.10 - - - - - -
3/31/2009 - - - - - - - - - - - - 426.00 - - 421.90 - - - - - - 414.95
4/1/2009 - - - - - - - - - - - - - - - - - - 428.13 - - - -
6/10/2009 - - - - - - - - - - - - - - - - - - - - - - 413.79
6/22/2009 - 413.73 - - - - 414.30 414.17 - - 413.73 425.68 425.79 426.53 422.30 421.53 419.58 414.76 428.57 414.05 - - 414.72
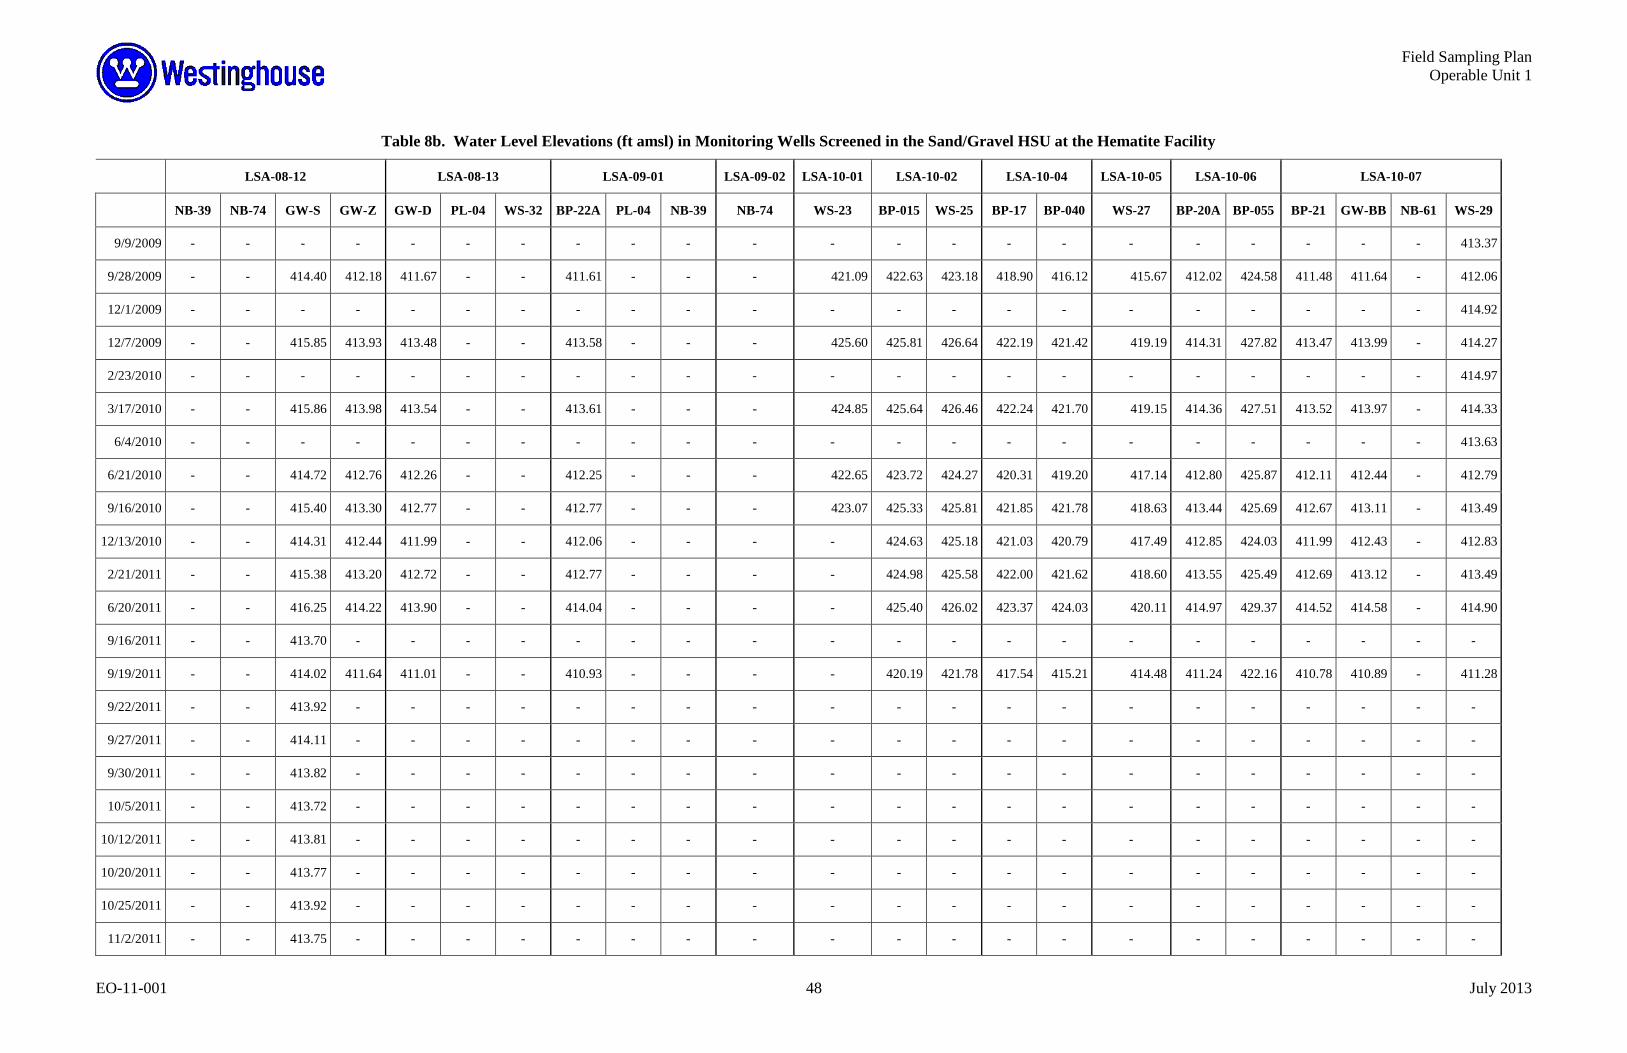
Field Sampling Plan Operable Unit 1
EO-11-001 48 July 2013
Table 8b. Water Level Elevations (ft amsl) in Monitoring Wells Screened in the Sand/Gravel HSU at the Hematite Facility
LSA-08-12 LSA-08-13 LSA-09-01 LSA-09-02 LSA-10-01 LSA-10-02 LSA-10-04 LSA-10-05 LSA-10-06 LSA-10-07
NB-39 NB-74 GW-S GW-Z GW-D PL-04 WS-32 BP-22A PL-04 NB-39 NB-74 WS-23 BP-015 WS-25 BP-17 BP-040 WS-27 BP-20A BP-055 BP-21 GW-BB NB-61 WS-29
9/9/2009 - - - - - - - - - - - - - - - - - - - - - - 413.37
9/28/2009 - - 414.40 412.18 411.67 - - 411.61 - - - 421.09 422.63 423.18 418.90 416.12 415.67 412.02 424.58 411.48 411.64 - 412.06
12/1/2009 - - - - - - - - - - - - - - - - - - - - - - 414.92
12/7/2009 - - 415.85 413.93 413.48 - - 413.58 - - - 425.60 425.81 426.64 422.19 421.42 419.19 414.31 427.82 413.47 413.99 - 414.27
2/23/2010 - - - - - - - - - - - - - - - - - - - - - - 414.97
3/17/2010 - - 415.86 413.98 413.54 - - 413.61 - - - 424.85 425.64 426.46 422.24 421.70 419.15 414.36 427.51 413.52 413.97 - 414.33
6/4/2010 - - - - - - - - - - - - - - - - - - - - - - 413.63
6/21/2010 - - 414.72 412.76 412.26 - - 412.25 - - - 422.65 423.72 424.27 420.31 419.20 417.14 412.80 425.87 412.11 412.44 - 412.79
9/16/2010 - - 415.40 413.30 412.77 - - 412.77 - - - 423.07 425.33 425.81 421.85 421.78 418.63 413.44 425.69 412.67 413.11 - 413.49
12/13/2010 - - 414.31 412.44 411.99 - - 412.06 - - - - 424.63 425.18 421.03 420.79 417.49 412.85 424.03 411.99 412.43 - 412.83
2/21/2011 - - 415.38 413.20 412.72 - - 412.77 - - - - 424.98 425.58 422.00 421.62 418.60 413.55 425.49 412.69 413.12 - 413.49
6/20/2011 - - 416.25 414.22 413.90 - - 414.04 - - - - 425.40 426.02 423.37 424.03 420.11 414.97 429.37 414.52 414.58 - 414.90
9/16/2011 - - 413.70 - - - - - - - - - - - - - - - - - - - -
9/19/2011 - - 414.02 411.64 411.01 - - 410.93 - - - - 420.19 421.78 417.54 415.21 414.48 411.24 422.16 410.78 410.89 - 411.28
9/22/2011 - - 413.92 - - - - - - - - - - - - - - - - - - - -
9/27/2011 - - 414.11 - - - - - - - - - - - - - - - - - - - -
9/30/2011 - - 413.82 - - - - - - - - - - - - - - - - - - - -
10/5/2011 - - 413.72 - - - - - - - - - - - - - - - - - - - -
10/12/2011 - - 413.81 - - - - - - - - - - - - - - - - - - - -
10/20/2011 - - 413.77 - - - - - - - - - - - - - - - - - - - -
10/25/2011 - - 413.92 - - - - - - - - - - - - - - - - - - - -
11/2/2011 - - 413.75 - - - - - - - - - - - - - - - - - - - -

Field Sampling Plan Operable Unit 1
EO-11-001 49 July 2013
Table 8b. Water Level Elevations (ft amsl) in Monitoring Wells Screened in the Sand/Gravel HSU at the Hematite Facility
LSA-08-12 LSA-08-13 LSA-09-01 LSA-09-02 LSA-10-01 LSA-10-02 LSA-10-04 LSA-10-05 LSA-10-06 LSA-10-07
NB-39 NB-74 GW-S GW-Z GW-D PL-04 WS-32 BP-22A PL-04 NB-39 NB-74 WS-23 BP-015 WS-25 BP-17 BP-040 WS-27 BP-20A BP-055 BP-21 GW-BB NB-61 WS-29
11/14/2011 - - 414.52 - - - - - - - - - - - - - - - - - - - -
11/16/2011 - - 414.12 - - - - - - - - - - - - - - - - - - - -
11/21/2011 - - 414.20 - - - - - - - - - - - - - - - - - - - -
11/28/2011 - - 415.24 - - - - - - - - - - - - - - - - - - - -
12/1/2011 - - 415.42 - - - - - - - - - - - - - - - - - - - -
12/6/2011 - - 413.70 - - - - - - - - - - - - - - - - - - - -
12/9/2011 - - 415.19 - - - - - - - - - - - - - - - - - - - -
12/14/2011 - - 415.78 - - - - - - - - - - - - - - - - - - - -
12/16/2011 - - 415.23 413.19 412.59 - - 412.65 - - - - 424.82 425.55 419.86 421.92 418.81 413.45 422.37 412.58 413.08 - 413.96
12/19/2011 - - 415.98 - - - - - - - - - - - - - - - - - - - -
12/22/2011 - - 416.12 - - - - - - - - - - - - - - - - - - - -
12/27/2011 - - 416.47 - - - - - - - - - - - - - - - - - - - -
1/3/2012 - - 416.21 - - - - - - - - - - - - - - - - - - - -
1/11/2012 - - 416.20 - - - - - - - - - - - - - - - - - - - -
1/17/2012 - - 415.55 - - - - - - - - - - - - - - - - - - - -
1/24/2012 - - 414.94 - - - - - - - - - - - - - - - - - - - -
2/1/2012 - - 416.18 - - - - - - - - - - - - - - - - - - - -
2/7/2012 - - 416.29 - - - - - - - - - - - - - - - - - - - -
2/15/2012 - - 416.30 - - - - - - - - - - - - - - - - - - - -
2/21/2012 - - 416.33 - - - - - - - - - - - - - - - - - - - -
2/27/2012 - - 415.64 - - - - - - - - - - - - - - - - - - - -
3/5/2012 - - 415.27 - - - - - - - - - - - - - - - - - - - -

Field Sampling Plan Operable Unit 1
EO-11-001 50 July 2013
Table 8b. Water Level Elevations (ft amsl) in Monitoring Wells Screened in the Sand/Gravel HSU at the Hematite Facility
LSA-08-12 LSA-08-13 LSA-09-01 LSA-09-02 LSA-10-01 LSA-10-02 LSA-10-04 LSA-10-05 LSA-10-06 LSA-10-07
NB-39 NB-74 GW-S GW-Z GW-D PL-04 WS-32 BP-22A PL-04 NB-39 NB-74 WS-23 BP-015 WS-25 BP-17 BP-040 WS-27 BP-20A BP-055 BP-21 GW-BB NB-61 WS-29
3/13/2012 - - 415.33 - - - - - - - - - - - - - - - - - - - -
3/19/2012 - - 414.63 414.04 413.61 - - - - - - - - - - - - - - - 416.97 - -
3/20/2012 - - 416.38 - - - - - - - - - - - - - - - - - - - -
3/27/2012 - - 416.23 - - - - - - - - - - - - - - - - - - - -
4/10/2012 - - 415.71 - - - - - - - - - - - - - - - - - - - -
4/17/2012 - - 416.08 - - - - - - - - - - - - - - - - - - - -
4/24/2012 - - 416.30 - - - - - - - - - - - - - - - - - - - -
5/1/2012 - - 415.95 - - - - - - - - - - - - - - - - - - - -
5/8/2012 - - 415.52 - - - - - - - - - - - - - - - - - - - -
5/15/2012 - - 415.35 - - - - - - - - - - - - - - - - - - - -
5/22/2012 - - 414.84 - - - - - - - - - - - - - - - - - - - -
5/29/2012 - - 414.22 412.30 411.72 - - - - - - - - - - - - - - - 411.74 -
5/31/2012 - - 413.58 - - - - - - - - - - - - - - - - - - - -
6/6/2012 - - 414.21 - - - - - - - - - - - - - - - - - - - -
6/13/2012 - - 413.97 - - - - - - - - - - - - - - - - - - - -
6/19/2012 - - 413.87 - - - - - - - - - - - - - - - - - - - -
6/26/2012 - - 413.77 - - - - - - - - - - - - - - - - - - - -
7/4/2012 - - 413.59 - - - - - - - - - - - - - - - - - - - -
7/10/2012 - - 413.47 - - - - - - - - - - - - - - - - - - - -
7/17/2012 - - 413.38 - - - - - - - - - - - - - - - - - - - -
7/24/2012 - - 413.42 - - - - - - - - - - - - - - - - - - - -
7/31/2012 - - 413.25 - - - - - - - - - - - - - - - - - - - -

Field Sampling Plan Operable Unit 1
EO-11-001 51 July 2013
Table 8b. Water Level Elevations (ft amsl) in Monitoring Wells Screened in the Sand/Gravel HSU at the Hematite Facility
LSA-08-12 LSA-08-13 LSA-09-01 LSA-09-02 LSA-10-01 LSA-10-02 LSA-10-04 LSA-10-05 LSA-10-06 LSA-10-07
NB-39 NB-74 GW-S GW-Z GW-D PL-04 WS-32 BP-22A PL-04 NB-39 NB-74 WS-23 BP-015 WS-25 BP-17 BP-040 WS-27 BP-20A BP-055 BP-21 GW-BB NB-61 WS-29
8/7/2012 - - 413.64 - - - - - - - - - - - - - - - - - - - -
8/14/2012 - - 413.29 - - - - - - - - - - - - - - - - - - - -
8/20/2012 - - 413.71 411.18 410.64 - - - - - - - - - - - - - - - 410.28 - -
8/21/2012 - - 413.65 - - - - - - - - - - - - - - - - - - - -
8/28/2012 - - 413.38 - - - - - - - - - - - - - - - - - - - -
9/4/2012 - - 412.79 - - - - - - - - - - - - - - - - - - - -
9/11/2012 - - 414.19 - - - - - - - - - - - - - - - - - - - -
9/18/2012 - - 414.33 - - - - - - - - - - - - - - - - - - - -
9/25/2012 - - 414.41 - - - - - - - - - - - - - - - - - - - -
11/26/2012 - - 412.63 412.10 411.45 - - - - - - - - - - - - - - - 411.59 - -
11/28/2012 - - 414.33 - - - - - - - - - - - - - - - - - - - -
12/5/2012 - - 413.94 - - - - - - - - - - - - - - - - - - - -
12/11/2012 - - 413.97 - - - - - - - - - - - - - - - - - - - -
12/19/2012 - - 413.74 - - - - - - - - - - - - - - - - - - - -
12/27/2012 - - 412.83 - - - - - - - - - - - - - - - - - - - -
1/16/2013 - - 415.74 - - - - - - - - - - - - - - - - - - - -
1/23/2013 - - 415.50 - - - - - - - - - - - - - - - - - - - -
1/31/2013 - - 417.99 - - - - - - - - - - - - - - - - - - - -
2/7/2013 - - 416.81 - - - - - - - - - - - - - - - - - - - -
2/14/2013 - - 416.23 - - - - - - - - - - - - - - - - - - - -
Well Avg. 415.4 412.1 414.8 412.9 412.4 415.8 413.1 412.6 415.8 415.4 412.1 423.0 424.6 424.9 420.0 420.6 417.8 412.9 426.0 412.3 412.8 418.4 413.5
Well Min. 415.4 409.4 412.6 411.2 410.6 415.8 409.6 409.3 415.8 415.4 409.4 417.5 420.2 417.6 411.9 415.2 410.2 409.0 422.2 409.1 410.3 418.4 409.1

Field Sampling Plan Operable Unit 1
EO-11-001 52 July 2013
Table 8b. Water Level Elevations (ft amsl) in Monitoring Wells Screened in the Sand/Gravel HSU at the Hematite Facility
LSA-08-12 LSA-08-13 LSA-09-01 LSA-09-02 LSA-10-01 LSA-10-02 LSA-10-04 LSA-10-05 LSA-10-06 LSA-10-07
NB-39 NB-74 GW-S GW-Z GW-D PL-04 WS-32 BP-22A PL-04 NB-39 NB-74 WS-23 BP-015 WS-25 BP-17 BP-040 WS-27 BP-20A BP-055 BP-21 GW-BB NB-61 WS-29
Survey Unit Avg. 414 413 413 412 423 425 420 418 416 413

Quality Assurance Project Plan Operable Unit 1
i
SAMPLING AND ANALYSIS PLAN for
REMEDIATION OF OPERABLE UNIT 1
Part 2 QUALITY ASSURANCE PROJECT PLAN
Hematite Decommissioning Project
Westinghouse Former Fuel Cycle Facility Hematite, Missouri

Quality Assurance Project Plan Operable Unit 1
ii
Table of Contents (QA/R-5 Element A2) 1. PROJECT MANAGEMENT ..................................................................................................... 1
1.1 Background/Introduction ............................................................................................................................... 1 1.2 Project/Task Organization (QA/R-5 Element A4) ......................................................................................... 2
1.2.1 Westinghouse Project Director .............................................................................................................. 2 1.2.2 Project Manager (PM) ........................................................................................................................... 2 1.2.3 Health and Safety Manager (HS Manager) ............................................................................................ 3 1.2.4 Environmental Manager (EM) ............................................................................................................... 3 1.2.5 Quality Assurance Manager (QA Manager) .......................................................................................... 4 1.2.6 Field Supervisor (FS) ............................................................................................................................. 4 1.2.7 Technical Staff ....................................................................................................................................... 4 1.2.8 Field labor .............................................................................................................................................. 5
1.3 Problem Definition/Background (QA/R-5 Element A5) ............................................................................... 5 1.3.1 Project/Task Description (EPA QA/R-5 Element A6) ........................................................................... 6
1.4 Data Quality Objectives (QA/R-5 Element A7) ............................................................................................ 7 1.4.1 Step 1: – Define the Problem ................................................................................................................. 8 1.4.2 Step 2: – Identify the Goals of the Study ............................................................................................... 8 1.4.3 Step 3: – Identify Information Inputs ..................................................................................................... 9 1.4.4 Step 4: – Define the Boundaries of the Study ........................................................................................ 9 1.4.5 Step 5: – Develop the Analytical Approach ........................................................................................... 9 1.4.6 Step 6: – Specify Performance or Acceptance Criteria ........................................................................ 10 1.4.7 Step 7: – Develop the Plan for Obtaining Data .................................................................................... 12
1.5 Data Quality Assessment ............................................................................................................................. 13 1.6 Definition of Criteria ................................................................................................................................... 13
1.6.1 Verification and Confirmation Soil Samples ....................................................................................... 13 1.6.2 Sampling Requirements ....................................................................................................................... 13 1.6.3 Sampling for Waste Characterization .................................................................................................. 13 1.6.4 Sampling for Backfill Requirements.................................................................................................... 13 1.6.5 Collection of Samples for VOC Analysis ............................................................................................ 14 1.6.6 Collection of Samples for PAH and Arsenic Analysis ........................................................................ 14 1.6.7 Sample Reporting Limits and Remediation Goals ............................................................................... 14 1.6.8 Precision .............................................................................................................................................. 14 1.6.9 Accuracy .............................................................................................................................................. 15 1.6.10 Completeness ....................................................................................................................................... 17 1.6.11 Representativeness and Comparability ................................................................................................ 18
1.7 Special Training/Certification (QA/R-5 Element A8) ................................................................................. 18 1.8 Documentation and Records (QA/R-5 ElementA9) .................................................................................... 19
1.8.1 Laboratory Records.............................................................................................................................. 20 2. MEASUREMENT/DATA ACQUISITION (qa/r-5 Element B) ............................................. 21
2.1 Sampling Design .......................................................................................................................................... 21 2.2 Sampling Procedures (QA/R-5 Element B2) ............................................................................................... 21 2.3 Sample Handling and Custody (QA/R-5 Element B3) ................................................................................ 21 2.4 Chemical Analytical Methods (QA/R-5 Element B4) ................................................................................. 23 2.5 Quality Control Samples (QA/R-5 Element B5) ......................................................................................... 24
2.5.1 Field Duplicate Procedures .................................................................................................................. 24 2.5.2 Matrix Spike (MS) ............................................................................................................................... 24 2.5.3 Matrix Spike Duplicate (MSD) ............................................................................................................ 25 2.5.4 Rinsate Blanks ..................................................................................................................................... 25 2.5.5 Trip Blanks .......................................................................................................................................... 25
2.6 Instrument Equipment Testing, Inspection, and Maintenance (QA/R-5 Element B6) ................................. 25 2.7 Calibration Procedures (QA/R-5 Element B7) ........................................................................................... 26 2.8 PID Calibration and QC ............................................................................................................................... 26 2.9 Inspection/Acceptance Requirements for Supplies and Consumables (QA/R-5 Element B8) .................... 27

Quality Assurance Project Plan Operable Unit 1
iii
2.10 Non-Direct Measurements (QA/R-5 Element B9) ....................................................................................... 28 2.11 Data Management (QA/R-5 Element B10) .................................................................................................. 28
3. ASSESSMENT AND OVERSIGHT (QA/R-5 Element C) ..................................................... 30 3.1 Assessments and Response Actions (QA/R-5 Element C1) ........................................................................ 30
4. DATA VALIDATION AND USABILITY (QA/R-5 Element D) .......................................... 31 4.1 Laboratory Review and Reporting ............................................................................................................... 31 4.2 Project Data Review and Reporting (QA/R-5 Element D1) ........................................................................ 32
4.2.1 Analytical Results ................................................................................................................................ 32 4.2.2 Laboratory Analytical Data Report Package ....................................................................................... 32
4.3 Data Validation (QA/R-5 Element D2) ....................................................................................................... 33 4.4 Data Validation Report ............................................................................................................................... 36 4.5 Corrective Action (QA/R-5 Element D3) .................................................................................................... 37
4.5.1 Immediate Corrective Action ............................................................................................................... 37 4.5.2 Long-Term Corrective Action ............................................................................................................. 37 4.5.3 Out of Control Situations ..................................................................................................................... 38 4.5.4 Laboratory Corrective Procedures ....................................................................................................... 38 4.5.5 Field Situations .................................................................................................................................... 39
5. REFERENCES ......................................................................................................................... 40 5.1 Cite References ............................................................................................................................................ 40 5.2 Developmental References (non-cited) ........................................................................................................ 41
LIST OF TABLES
Table 1-1: Operable Unit 1 Remediation Goals
Table 1-2: Areas of Concern, Chemical Constituents of Concern and Corresponding Survey Units
Table 1-3: Laboratory Method Detection Limits, Routine Reporting Limits and Remediation Goals
Table 1-4: Blank Evaluation Table 1-5: Project Documents and Records
Table 4-1: Data Review and Validation Process
Table 4-2: Validation Criteria
LIST OF FIGURES
Figure 1: Project Organizational Structure

Quality Assurance Project Plan Operable Unit 1
iv
Distribution List (EPA QA/R-5 Element A3) Title Organization HDP Project Director Westinghouse Electric Company LLC
Project Coordinators for HDP Consent Decree MDNR
NRC Program Manager for HDP U.S. Nuclear Regulatory Commission
Administrative Record for HDP Festus Library

Quality Assurance Project Plan Operable Unit 1
EO-11-001 1 December 2012
1. PROJECT MANAGEMENT
1.1. Background/Introduction
The Westinghouse Hematite Former Fuel Cycle Facility is located at 3300 State Road P in Jefferson County, Missouri near the unincorporated village of Hematite. The Westinghouse Hematite property consists of 228 acres, with the primary operations for nuclear fuel manufacturing historically being conducted within approximately 8 acres of the property. As used throughout this Quality Assurance Project Plan (QAPP), and consistent with the Remedial Investigation (RI) Report and Record of Decision (ROD), the “Hematite Facility” refers to the historical primary operations area as well as Site Pond and Burial Pit Area, while the “Hematite Site” refers to the Hematite Facility plus other areas that were the focus of investigations based on potential impacts by previous operations.
Nuclear-related operations at the Hematite Facility began in 1956 after the purchase of the property by Mallinckrodt Chemical Works (Mallinckrodt) and granting of a license by the U.S. Atomic Energy Commission for possession of radioactivity. In addition to Mallinckrodt, various entities owned and operated the Hematite Facility over the years before Westinghouse acquired it in 2000. The license has been continuously maintained via the U.S. Nuclear Regulatory Commission through revisions and amendments over the years.
Throughout its history, uranium and compounds from enriched uranium were produced at the site for use in the production fuel for nuclear reactors. Secondary activities included uranium scrap recovery and limited work with thorium compounds. Before 1974, most operations were related to work for the U.S. Government. After 1974, operations focused on commercial fuel production. The Site is currently undergoing decommissioning in accordance with Nuclear Regulatory Commission (NRC) regulations and other applicable federal and state regulations.
The State of Missouri has been involved in regulatory and remedial aspects at the Hematite Site since groundwater characterization began in 1996. In 2002, Westinghouse and Missouri Department of Natural Resources (MDNR) entered into a Letter Agreement, which, among other things, provided for MDNR oversight of certain studies and response actions in accordance with the National Oil and Hazardous Substances Contingency Plan under the requirements of the Comprehensive Environmental Response, Compensation, and Liability Act (CERCLA), 42 United States Code (U.S.C.) §§ 9601 et seq. In 2008, MDNR and Westinghouse entered into a Consent Decree, and the Letter Agreement was terminated. The Consent Decree provides for MDNR oversight of those portions of the investigation and selection of the remedy for OU-1 that is not pre-empted by the Atomic Energy Act of 1954, as amended.
Beginning in 2004 with oversight by MDNR, Westinghouse prepared a RI, a Human Health Risk Assessment, and a Screening-Level Ecological Risk Assessment. MDNR approved these reports as they relate to Operable Unit 1 on July 19, 2007. Using these studies as a basis, Westinghouse then prepared a Feasibility Study (FS) for Operable Unit 1 (OU-1), which MDNR approved on December 21, 2007. Westinghouse developed a Proposed Plan from the approved FS which, following public review and comment, served as the basis for selecting a Site Remedy in the

Quality Assurance Project Plan Operable Unit 1
EO-11-001 2 December 2012
Operable Unit 1 ROD. The ROD for OU-1was signed in July 2009. Based upon the remedy selected in the ROD, EO-10-002, Remedial Design Work Plan, Operable Unit 1, Former Fuel Cycle Facility (Reference 7) was completed.
This QAPP is part two of the Sampling and Analysis Plan (SAP) for Remediation of Operable Unit 1, and discusses the quality assurance (QA) methods to be used to ensure Data Quality Objectives (DQO) are met.
This document does not address the treatment of soils and sediments affected by volatile organic compounds (VOC). If on-site VOC treatment as described in the Remedial Design Work Plan (RDWP) (Reference 7) is utilized, a separate Waste Analysis Plan will be developed by the remedial contractor to describe the procedures and DQO used to meet treatment standards.
1.2. Project/Task Organization (QA/R-5 Element A4)
The organizational structure for the Hematite Decommissioning Project (HDP) is shown on Figure 1. The Project will be performed within the management and organizational structure described below. Responsibilities of key individuals are shown in the following subsections. Additional staff, along with applicable subcontractors may be utilized as appropriate
1.2.1. Westinghouse Project Director
The Westinghouse Project Director will proactively maintain communications with MDNR and the local government/community organizations. The Project Director is the primary contact for the Project within the Westinghouse organization. The Project Director provides direction to the management team and project team, as well as routine contact with the contractor Project Manager.
1.2.2. Project Manager (PM)
The PM is responsible for overall project planning and execution, including, but not limited to, the following:
• Review project work, safety, and QA plans to ensure they contain appropriate provisions and are adequate to control work planned for this project;
• Ensure project personnel properly execute the requirements of the plans;
• Maintain responsibility for the health and safety of all project personnel;
• Manage assigned project tasks within their scope, schedules and budget;
• Ensure project deliverables meet or exceed Westinghouse requirements;
• Collaborate with the field supervisor in selecting appropriate field staff and technical resources in support of project tasks;
• Serve as the project interface between Westinghouse, subcontractors, and regulatory agencies involved with the work effort;

Quality Assurance Project Plan Operable Unit 1
EO-11-001 3 December 2012
• Communicate project requirements to team members;
• Authorize the assignment of project staff; and,
• Manage assigned resources to complete this project. 1.2.3. Health and Safety Manager (HS Manager)
The HS Manager reports directly to the Westinghouse Project Director. HS Manager ensures the Health and Safety Plan (HASP) is followed and Site personnel are appropriately trained in its provisions. The HS Manager is also responsible for ensuring compliance with applicable Occupational Safety and Health Administration (OSHA) regulations. The HS Manager is available as a resource to answer project personnel questions/concerns regarding any potential safety issues. In addition, the HS Manager is responsible to:
• Ensure employees have the necessary experience, training, and qualifications;
• Observe and evaluate employee safety performance;
• Conduct periodic safety inspections, and conduct accident investigations and prepare accident reports as necessary;
• Review project tasks and work plans to ensure no undue hazards are posed;
• Monitor project operations to assess safety implications arising out of potentially changing conditions; and,
• Advise the appropriate management team regarding potential safety issues. 1.2.4. Environmental Manager (EM)
The EM reports directly to the Westinghouse Project Director. The EM serves as the primary point of contact and control concerning sampling and analytical activities in compliance with the SAP. The EM is also responsible for ensuring compliance with applicable U.S. Environmental Protection Agency (USEPA) and MDNR regulations and permits. The EM is available as a resource to answer project personnel questions/concerns in order to manage issues to minimize harm to the environment. In addition, the EM is responsible to:
• Ensure technical staff are experienced and trained to perform sampling and analysis activities associated in the SAP;
• Conduct periodic environmental inspections and investigations; Review project tasks and work plans to ensure no undue environmental hazards are posed;
• Monitor sampling and analysis activities to assess environmental implications; and,
• Advise appropriate management team regarding potential environmental hazards.

Quality Assurance Project Plan Operable Unit 1
EO-11-001 4 December 2012
1.2.5. Quality Assurance Manager (QA Manager)
As an independent party, the QA Manager ensures all elements of the QAPP are implemented. QA Manager serves as the programmatic oversight of the quality assurance program as it relates to the SAP. The QA Manager reports all results of oversight to the appropriate management team. In addition, the QA Manager is responsible to:
• Advise the Westinghouse Project Director and team members on QA matters;
• Conduct or arrange surveillance of activities;
• Conduct or arrange required QA training; and
• Track the implementation of QA requirements.
1.2.6. Field Supervisor (FS)
The FS reports to the PM and is responsible to:
• Prepare and review project documents;
• Assign duties to project staff and orient the staff to the needs and requirements of this scope of work;
• Supervise project team performance and day-to-day field operations;
• Ensure major project deliverables are reviewed for technical accuracy and completeness prior to their release;
• Ensure field personnel receive necessary training on the requirements of the Decommissioning Plan, SAP, QAPP, HASP, and other project documents, as well as applicable regulatory issues;
• Ensure the requirements of the SAP are implemented;
• Routinely communicate project status, progress, and/or problems to the PM; and,
• Proactively respond to Quality Assurance/Quality Control (QA/QC) needs.
1.2.7. Technical Staff Technical staff will be assigned to perform project tasks as necessary. Technical staff will be experienced professionals possessing the expertise and technical competence required to effectively and efficiently perform project tasks. The PM is responsible for ensuring that technical staff members meet the minimum requirements of the job tasks prior to initiation of the remedial actions. Qualifications for technical staff members will be determined on a case-by-case basis, depending on the type of work for which the individuals are selected.

Quality Assurance Project Plan Operable Unit 1
EO-11-001 5 December 2012
1.2.8. Field labor
Contractor field labor will be trained on site procedures and will follow requirements specified in the SAP. Field labor may also include geologists, scientists, drillers, health physics technicians, and engineers.
1.3. Problem Definition/Background (QA/R-5 Element A5)
All radiological aspects of the Site are under the jurisdiction of the NRC, which will oversee the HDP remediation. Westinghouse has completed and submitted a Decommissioning Plan to describe the methods necessary to achieve license termination. This document, however, is not written to cover the radiological remediation, but instead focuses on the chemical contamination that was identified during the characterization efforts.
Results of previous investigations revealed the presence of VOC in soil and groundwater. Other identified chemical constituents of concern (CoC) are arsenic and polyaromatic hydrocarbons (PAH) that are found in surface soil at the Facility and PAH that are present in Site Pond sediment.
For OU-1, described as the buried waste, impacted soil and impacted sediment, CoC have been investigated through the RI/FS process. Those contaminants found to be of risk to human health or the environment was evaluated in the FS and Proposed Plan, where a remediation alternative was selected. As described in the ROD (Reference 6), RG for constituents of concern in soil and sediment are based on the Missouri Risk-Based Corrective Action (MRBCA) (Reference 3) default target levels for future residential use of the Hematite Site. These RG for OU-1 at the Hematite Site are shown in Table 1-1.

Quality Assurance Project Plan Operable Unit 1
EO-11-001 6 October 2014
Table 1-1
Operable Unit 1 Remediation Goals CONSTITUENTS OF
CONCERN REMEDIATION GOALS FOR
OU-1 (mg/kg) BASIS OF REMEDIATION
GOAL Surface
Soil Subsurface
Soil Sediment MRBCA Table B-1
Lowest Default Target Levels Volatile Organic Compounds (VOC)
cis-1,2 Dichloroethylene 0.521 0.521 --- Groundwater Protection pathway trans-1,2 Dichloroethylene 1.10 1.10 --- Groundwater Protection pathway Trichloroethylene (TCE) 0.141 0.141 --- Groundwater Protection pathway Tetrachloroethylene (PCE) 0.141 0.141 --- Groundwater Protection pathway Vinyl Chloride 0.0192 0.0192 --- Groundwater Protection pathway
Polynuclear Aromatic Hydrocarbons (PAH) Benzo(a)Anthracene 6.12 --- --- Groundwater Protection pathway Benzo(a)Pyrene 0.62 --- --- Soil Direct Contact pathway Benzo(b)Fluoranthene 6.19 --- --- Soil Direct Contact pathway Indeno (1,2,3-cd)Pyrene 3.77 --- --- Soil Direct Contact pathway Total PAH1 --- --- 2.0
Metals Arsenic2 9.6 --- --- Calculated from background data. 1Total PAH is the sum of the concentrations of 13 specific PAH.
1.3.1. Project/Task Description (EPA QA/R-5 Element A6)
The objective of this project is to remediate material at the Site such that the applicable RG as shown in Table 1-1 are achieved. Data will be obtained to verify the following:
• The excavations removed the chemical contamination to below the RG, as described in FSP Section 2.0.
• Soil and waste to be disposed of is acceptable to the disposal facility • Onsite soil designated for reuse as backfill is acceptable for backfill • Off-site borrow material to be used for backfilling excavations has been
adequately characterized and determined to be acceptable
Data Quality Objectives (DQO) has been established to ensure that the project objectives are met. These DQO are discussed in Section 1.4 of this QAPP and Section 3.0 of the FSP.
Chemically impacted soil and sediment located below the water table are not addressed under OU-1. For OU-1, excavations will not extend below the local groundwater table to remove soil or sediment that is solely impacted by VOC/PAH. The decision to discontinue excavation prior to achieving RG will be based on Section 2.0 of the Field Sampling Plan. All excavation activities will be performed per Excavation and Exhumation HDP-WP-OPS-505 (Reference 8).

Quality Assurance Project Plan Operable Unit 1
EO-11-001 7 July 2013
All laboratories utilized for this project will have National Environmental Laboratory Accreditation Program (NELAP) certification, as well as any additional state certifications, as needed. In addition, the laboratory will be audited by Westinghouse using the Corporate Quality Assurance Plan and will be subject to the evaluation and approval process as required by HDP procedures. At a minimum, the required laboratory certifications, current reporting limits (RL), and method detection limit (MDL) studies for the subcontract laboratory will be provided for the duration of sampling activities.
1.4. Data Quality Objectives (QA/R-5 Element A7)
The objective of the chemical measurement data is to generate sufficient information to determine the presence or absence of contaminants within the media of the Site and evaluate the effectiveness of remediation activities. To meet this objective, data acquired during the sample collection phase must be defensible. The quality objectives for the chemical data specify the quality of the data needed to enable project personnel to make project decisions (i.e., the decision to determine the effectiveness of contaminant removal, etc.). DQO are created through an integrated process used to define data quality requirements based on the intended use of the data. DQO are qualitative and quantitative statements that:
• Clarify the project objectives; • Define the data required for the studies; • Determine the appropriate method of data collection; and • Specify the level of decision errors acceptable for establishing the quantity and
quality of data needed to support the project decisions.
The overall Quality Assurance (QA) objective for this project is to obtain data that ensure that the remediation has been effective and the RG have been achieved.
To meet this objective, data must be defensible. The seven steps of the DQO process that achieve this objective as defined in the Guidance on Systematic Planning Using the data Quality Objective Process, EPA QA/G-4 (Reference 1) are:
• Define the Problem • Identify the Goal of the Study • Identify Information Inputs • Define the Boundaries of the Study • Develop the Analytical Approach • Specify Performance or Acceptance Criteria

Quality Assurance Project Plan Operable Unit 1
EO-11-001 8 December 2012
• Develop the Plan for Obtaining Data The DQO process as it applies to this project is detailed in the following sections.
1.4.1. Step 1: – Define the Problem
The Westinghouse Hematite Site manufactured nuclear fuel components and assemblies from 1956 until 2001, when the facility ceased production in June 2001, after approximately 47 years of operation under various owners. The Site is currently undergoing decommissioning in accordance with NRC regulations and other applicable federal and state regulations.
Planned decommissioning activities at this facility include remediation of soils. During a site investigation by MDNR in 1996 and subsequent sampling, VOC, including PCE and TCE above drinking water levels, were detected in monitoring wells located on and nearby the Site. Based on these findings, it was determined that a removal action might be appropriate (Former Fuel Cycle Facility Non-Time Critical Removal Action Memorandum, Westinghouse, Reference 5).
1.4.2. Step 2: – Identify the Goals of the Study
A ROD was signed with the State of Missouri in July 2009 outlining the remedial actions to be taken to remove the chemical constituents. The ROD encompasses OU-1, which includes the buried wastes, impacted soil, and impacted sediment at the Site. 1-2 identifies the AOCs to be remediated. The ROD established chemical clean up objectives as remediation goals (Table 1-1) for CoC at the Site. Data collected must be of sufficient quality and quantity to verify the achievement of these goals.
These RG pertain to the soil and sediment that will remain at the conclusion of remedial actions, the off-site borrow soil to be used as backfill, and onsite soil that may be re-used as backfill. The chemical characteristics of waste materials destined for processing and/or disposal will also be determined to ensure the Waste Acceptance Criteria (WAC) of the selected disposal facility are met and either directly placed in the landfill or treated and then placed in the landfill.
The decisions to be made are the following:
• Have excavations removed chemically contaminated soil to at or below RG?
• Are the soil and waste to be disposed of acceptable to the disposal facility? • Are on-site soils designated for reuse as backfill acceptable for backfill? • Is off-site borrow material brought on-site for backfilling of excavations
acceptable?
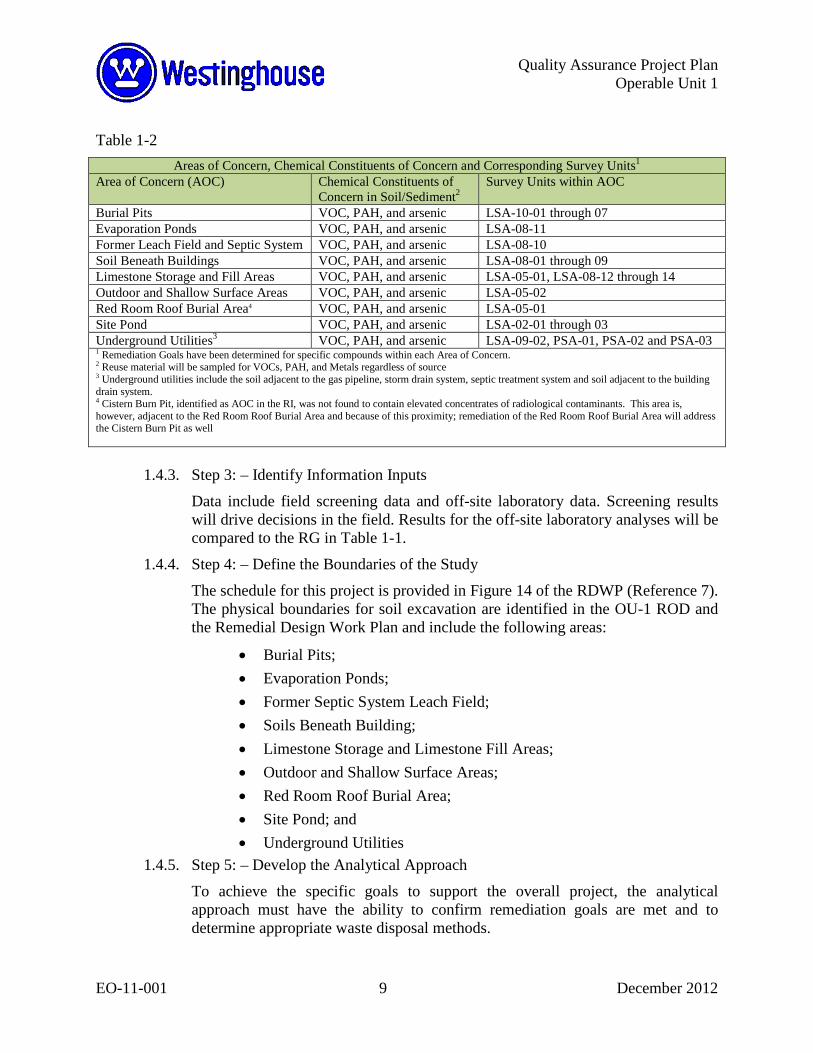
Quality Assurance Project Plan Operable Unit 1
EO-11-001 9 December 2012
Table 1-2 Areas of Concern, Chemical Constituents of Concern and Corresponding Survey Units1
Area of Concern (AOC) Chemical Constituents of Concern in Soil/Sediment2
Survey Units within AOC
Burial Pits VOC, PAH, and arsenic LSA-10-01 through 07 Evaporation Ponds VOC, PAH, and arsenic LSA-08-11 Former Leach Field and Septic System VOC, PAH, and arsenic LSA-08-10 Soil Beneath Buildings VOC, PAH, and arsenic LSA-08-01 through 09 Limestone Storage and Fill Areas VOC, PAH, and arsenic LSA-05-01, LSA-08-12 through 14 Outdoor and Shallow Surface Areas VOC, PAH, and arsenic LSA-05-02 Red Room Roof Burial Area4 VOC, PAH, and arsenic LSA-05-01 Site Pond VOC, PAH, and arsenic LSA-02-01 through 03 Underground Utilities3 VOC, PAH, and arsenic LSA-09-02, PSA-01, PSA-02 and PSA-03 1 Remediation Goals have been determined for specific compounds within each Area of Concern. 2 Reuse material will be sampled for VOCs, PAH, and Metals regardless of source 3 Underground utilities include the soil adjacent to the gas pipeline, storm drain system, septic treatment system and soil adjacent to the building drain system. 4 Cistern Burn Pit, identified as AOC in the RI, was not found to contain elevated concentrates of radiological contaminants. This area is, however, adjacent to the Red Room Roof Burial Area and because of this proximity; remediation of the Red Room Roof Burial Area will address the Cistern Burn Pit as well
1.4.3. Step 3: – Identify Information Inputs
Data include field screening data and off-site laboratory data. Screening results will drive decisions in the field. Results for the off-site laboratory analyses will be compared to the RG in Table 1-1.
1.4.4. Step 4: – Define the Boundaries of the Study
The schedule for this project is provided in Figure 14 of the RDWP (Reference 7). The physical boundaries for soil excavation are identified in the OU-1 ROD and the Remedial Design Work Plan and include the following areas:
• Burial Pits; • Evaporation Ponds; • Former Septic System Leach Field; • Soils Beneath Building; • Limestone Storage and Limestone Fill Areas; • Outdoor and Shallow Surface Areas; • Red Room Roof Burial Area; • Site Pond; and • Underground Utilities
1.4.5. Step 5: – Develop the Analytical Approach
To achieve the specific goals to support the overall project, the analytical approach must have the ability to confirm remediation goals are met and to determine appropriate waste disposal methods.
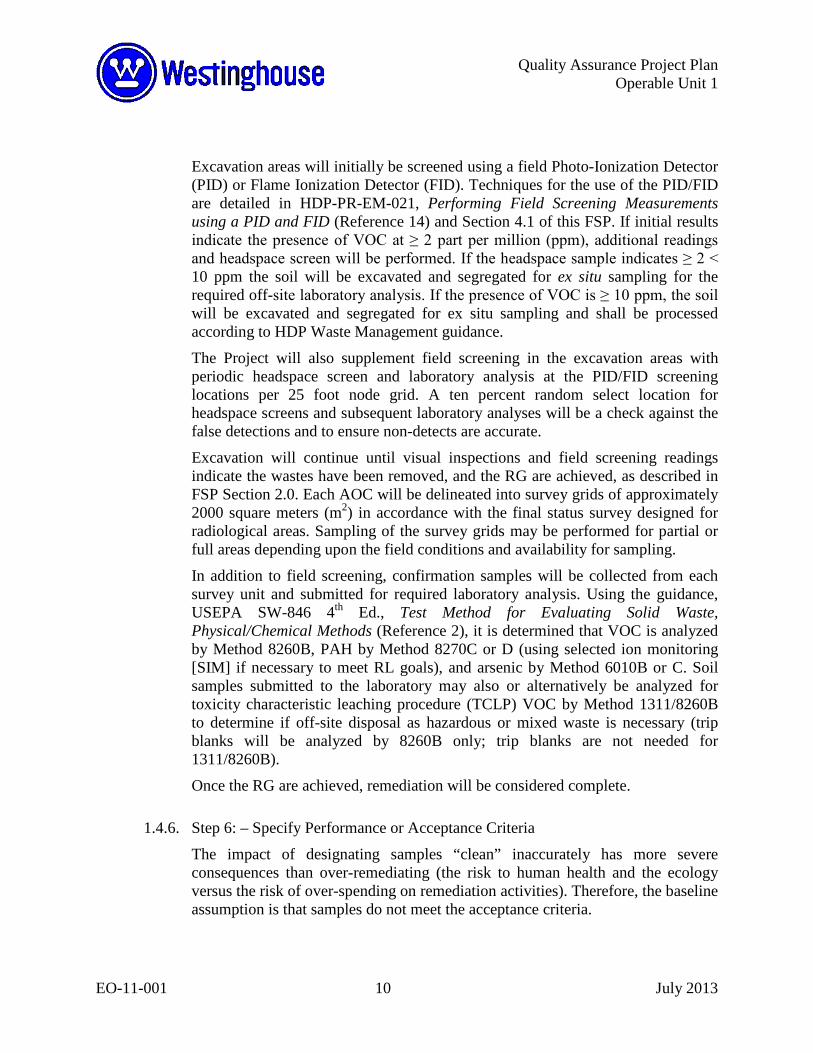
Quality Assurance Project Plan Operable Unit 1
EO-11-001 10 July 2013
Excavation areas will initially be screened using a field Photo-Ionization Detector (PID) or Flame Ionization Detector (FID). Techniques for the use of the PID/FID are detailed in HDP-PR-EM-021, Performing Field Screening Measurements using a PID and FID (Reference 14) and Section 4.1 of this FSP. If initial results indicate the presence of VOC at ≥ 2 part per million (ppm), additional readings and headspace screen will be performed. If the headspace sample indicates ≥ 2 < 10 ppm the soil will be excavated and segregated for ex situ sampling for the required off-site laboratory analysis. If the presence of VOC is ≥ 10 ppm, the soil will be excavated and segregated for ex situ sampling and shall be processed according to HDP Waste Management guidance.
The Project will also supplement field screening in the excavation areas with periodic headspace screen and laboratory analysis at the PID/FID screening locations per 25 foot node grid. A ten percent random select location for headspace screens and subsequent laboratory analyses will be a check against the false detections and to ensure non-detects are accurate.
Excavation will continue until visual inspections and field screening readings indicate the wastes have been removed, and the RG are achieved, as described in FSP Section 2.0. Each AOC will be delineated into survey grids of approximately 2000 square meters (m2) in accordance with the final status survey designed for radiological areas. Sampling of the survey grids may be performed for partial or full areas depending upon the field conditions and availability for sampling.
In addition to field screening, confirmation samples will be collected from each survey unit and submitted for required laboratory analysis. Using the guidance, USEPA SW-846 4th Ed., Test Method for Evaluating Solid Waste, Physical/Chemical Methods (Reference 2), it is determined that VOC is analyzed by Method 8260B, PAH by Method 8270C or D (using selected ion monitoring [SIM] if necessary to meet RL goals), and arsenic by Method 6010B or C. Soil samples submitted to the laboratory may also or alternatively be analyzed for toxicity characteristic leaching procedure (TCLP) VOC by Method 1311/8260B to determine if off-site disposal as hazardous or mixed waste is necessary (trip blanks will be analyzed by 8260B only; trip blanks are not needed for 1311/8260B).
Once the RG are achieved, remediation will be considered complete.
1.4.6. Step 6: – Specify Performance or Acceptance Criteria
The impact of designating samples “clean” inaccurately has more severe consequences than over-remediating (the risk to human health and the ecology versus the risk of over-spending on remediation activities). Therefore, the baseline assumption is that samples do not meet the acceptance criteria.

Quality Assurance Project Plan Operable Unit 1
EO-11-001 11 July 2013
• Null Hypothesis: The analyte soil concentrations exceed the applicable
remediation goal. • Alternative Hypothesis: The analyte soil concentrations do not exceed the
applicable remediation goal.
In accordance to USAEPA QA/G-4 (Reference 1), the Project must be willing to accept the likelihood of making decision errors. A decision error occurs when the null hypothesis is rejected when it is true, or accepted when it is false. This type of errors classifies an expected performance in order to estimate number of required samples.
As for the performance criteria, the significance of making a Type I error (α value) will be set at 0.05 unless a less restrictive value is approved by MDNR. The Type II error (β value) will initially be set at 0.10. The value may be, adjusted by HDP after weighing the resulting change in the number of required sample locations against the risk of unnecessarily investigating and/or remediating survey units that are truly below the remediation goals. The minimum number of samples collected from a survey unit is based on these parameters and an evaluation of the site characterization data.
As for the acceptance criteria, Table 1-3 provides how the Project will evaluate the effectiveness of remediation and the performance of the laboratory. The Method Detection Limits (MDL) is the smallest concentration that can be demonstrated to be different than zero at a 99% confidence level. A substance detected at or above the MDL can be stated with a 99% confidence that it is present (1% chance of a false positive). The MDL is a statistically derived number. The Reporting Limits (RL) is the lowest concentration for which calibration is performed.
For nondetect results, the RL will be compared to the RG. In the event that matrix interference increases RLs > RG, nondetect results will be compared to the RG. RLs are low enough, in relation to RG, that this will likely only be applicable to vinyl chloride.
Detections for target compounds will be compared to the RG for this Project, which are listed in Table 1-3.
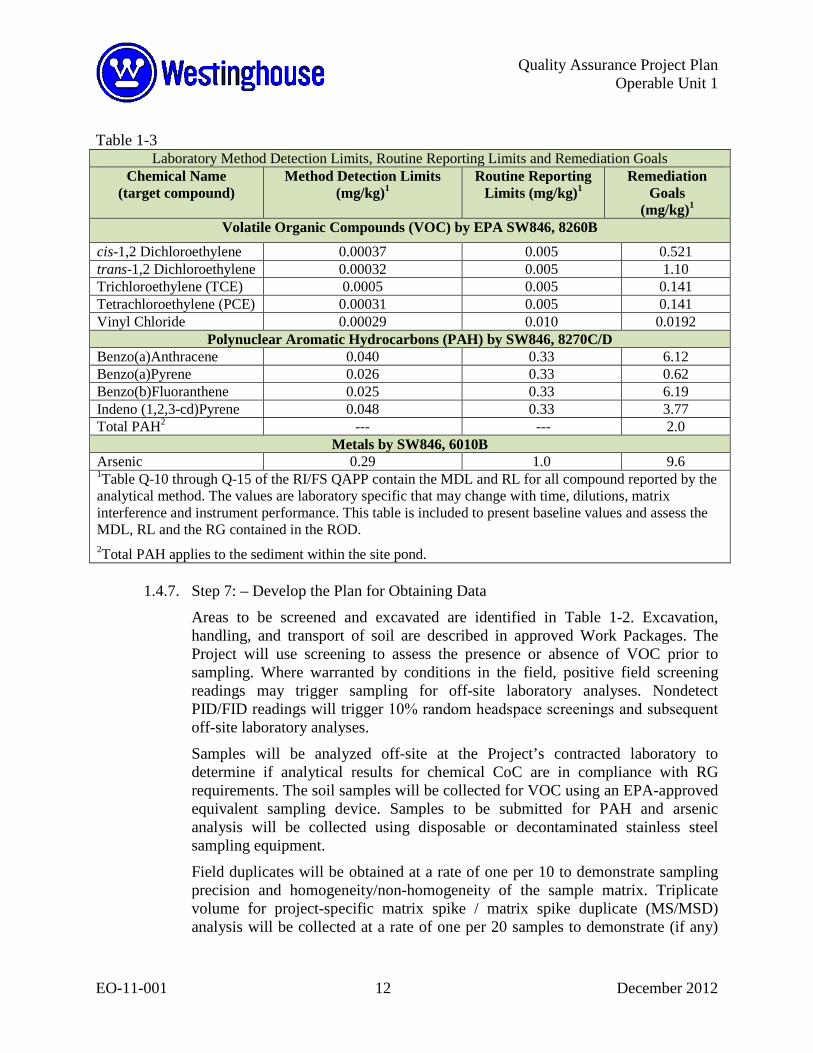
Quality Assurance Project Plan Operable Unit 1
EO-11-001 12 December 2012
Table 1-3 Laboratory Method Detection Limits, Routine Reporting Limits and Remediation Goals
Chemical Name (target compound)
Method Detection Limits (mg/kg)1
Routine Reporting Limits (mg/kg)1
Remediation Goals
(mg/kg)1 Volatile Organic Compounds (VOC) by EPA SW846, 8260B
cis-1,2 Dichloroethylene 0.00037 0.005 0.521 trans-1,2 Dichloroethylene 0.00032 0.005 1.10 Trichloroethylene (TCE) 0.0005 0.005 0.141 Tetrachloroethylene (PCE) 0.00031 0.005 0.141 Vinyl Chloride 0.00029 0.010 0.0192
Polynuclear Aromatic Hydrocarbons (PAH) by SW846, 8270C/D Benzo(a)Anthracene 0.040 0.33 6.12 Benzo(a)Pyrene 0.026 0.33 0.62 Benzo(b)Fluoranthene 0.025 0.33 6.19 Indeno (1,2,3-cd)Pyrene 0.048 0.33 3.77 Total PAH2 --- --- 2.0
Metals by SW846, 6010B Arsenic 0.29 1.0 9.6 1Table Q-10 through Q-15 of the RI/FS QAPP contain the MDL and RL for all compound reported by the analytical method. The values are laboratory specific that may change with time, dilutions, matrix interference and instrument performance. This table is included to present baseline values and assess the MDL, RL and the RG contained in the ROD. 2Total PAH applies to the sediment within the site pond.
1.4.7. Step 7: – Develop the Plan for Obtaining Data
Areas to be screened and excavated are identified in Table 1-2. Excavation, handling, and transport of soil are described in approved Work Packages. The Project will use screening to assess the presence or absence of VOC prior to sampling. Where warranted by conditions in the field, positive field screening readings may trigger sampling for off-site laboratory analyses. Nondetect PID/FID readings will trigger 10% random headspace screenings and subsequent off-site laboratory analyses.
Samples will be analyzed off-site at the Project’s contracted laboratory to determine if analytical results for chemical CoC are in compliance with RG requirements. The soil samples will be collected for VOC using an EPA-approved equivalent sampling device. Samples to be submitted for PAH and arsenic analysis will be collected using disposable or decontaminated stainless steel sampling equipment.
Field duplicates will be obtained at a rate of one per 10 to demonstrate sampling precision and homogeneity/non-homogeneity of the sample matrix. Triplicate volume for project-specific matrix spike / matrix spike duplicate (MS/MSD) analysis will be collected at a rate of one per 20 samples to demonstrate (if any)

Quality Assurance Project Plan Operable Unit 1
EO-11-001 13 December 2012
matrix interference on the target analytes. Remediation will continue until the analysis indicates that soil meets the target RG.
1.5. Data Quality Assessment
The DQO discussed in this QAPP will be met by ensuring that the following analytical objectives are met. These analytical objectives are:
• To collect and analyze samples under controlled situations using standard methods. • To obtain usable and defensible analytical results. The following sections discuss the steps that will be taken to ensure the validity of the data acquired during the Hematite Site work. The representativeness of the measurement data is a function of the sampling strategy and will be achieved by following the procedures discussed in the FSP for OU-1. The quality of the analytical results is a function of the analytical system and will be achieved by using standard methods and the quality control system discussed in this section. The basis for assessing precision, accuracy, completeness, representativeness, and comparability is discussed in the following subsections.
1.6. Definition of Criteria
This section defines how project analytical measurement data objectives will be assessed during the Hematite Site work. The intent of this effort is to identify where the residual chemical concentrations meet or exceed the remediation goals, identify if waste is acceptable for shipment, and to determine if soil can be used as backfill.
1.6.1. Verification and Confirmation Soil Samples
Sample collection methodology is discussed in Section 4.2 of the FSP.
1.6.2. Sampling Requirements
Sampling requirements are based on the CoC for each AOC, and the included survey units are shown in Table 4-2.
1.6.3. Sampling for Waste Characterization
Sample collection methodology is discussed in Section 4.4 of the FSP.
1.6.4. Sampling for Backfill Requirements
Sample collection methodology is discussed in Section 4.5 of the FSP.

Quality Assurance Project Plan Operable Unit 1
EO-11-001 14 December 2012
1.6.5. Collection of Samples for VOC Analysis
Sample collection methodology is discussed in Section 4.3 of the FSP.
1.6.6. Collection of Samples for PAH and Arsenic Analysis
Sample collection methodology is discussed in Section 4.3 of the FSP.
1.6.7. Sample Reporting Limits and Remediation Goals
For the analytical data to be utilized for verification, the MDL and RL need to be lower than the corresponding RG. Table 4-5 identifies the laboratory MDL, the routine RL and the HDP-approved RG. The reporting limits of the laboratory are below the remediation goals and therefore are sufficient for validation purposes.
1.6.8. Precision
Precision measures the reproducibility of repetitive measurements. Precision is strictly defined as the degree of mutual agreement among independent measurements as the result of the repeated application of the same process under similar conditions. Analytical precision is a measurement of the variability associated with duplicate (2) or replicate (more than 2) analyses of the same sample in the laboratory and is determined by analysis of matrix spike duplicates or laboratory control sample duplicates. Total precision is a measurement of the variability associated with the entire sampling and analysis process. It is determined by analysis of duplicate or replicate field samples and includes all possible sources of variability. Precision will be calculated for this work using the relative percent difference (RPD) between field and laboratory duplicates, LCS/LCSD and MS/MSD pairs as follows:
RPD = [(x1 – x2) / (x1 + x2 / 2)] x 100
Where:
x1 = concentration of Sample 1 of duplicate
x2 = concentration of Sample 2 of duplicate
For the purposes of the Project, laboratory limits are adequate for assessing LCS/LCSD and MS/MSD precision. LCSD analysis is not required when MS/MSD pairs are analyzed. Therefore, if an LSCD is not analyzed by the laboratory, an overall assessment of precision will be made using MS/MSD and field duplicate RPD. MS/MSD and field duplicate results may be influenced by matrix effects, which cannot be controlled. As such, in the absence of LCS/LCSD pairs, the precision assessment reflects project-specific conditions.

Quality Assurance Project Plan Operable Unit 1
EO-11-001 15 December 2012
If LCS/LCSD RPDs exceed criteria, the affected analytes will be qualified (J/UJ) in the associated samples. If MS/MSD RPDs exceed criteria, the affected analytes will be qualified (J/UJ) in the parent sample. The professional judgment of the validator will be used to determine if qualification of other project samples is needed; all such decisions will be documented.
For field duplicates, if one or more values are nondetect, the RL will be used for calculating the RPD. Analytes with field duplicate RPD is greater than 50% will be qualified (J/UJ) for the field duplicate pair. The professional judgment of the validator will be used to determine if qualification of other project samples is needed; all such decisions will be documented.
Additionally, professional judgment will be used to determine the usability of data. This assessment is dependent on the degree of QC exceedance, whether or not there is a potential high or low sample result bias, whether or not associated sample results are significant compared to RG, and if the sample is critical to the investigation findings. If data quality problems arise, the analytical laboratory will be notified for corrective action, as appropriate.
1.6.9. Accuracy
Accuracy is a statistical measurement of correctness, and includes components of random error (variability due to imprecision) and systematic error. It therefore reflects the total error associated with a measurement. A measurement is accurate when the value reported does not differ from the true value. Analytical method accuracy is typically measured by determining the percent recovery of known target analytes that are spiked into a field sample (a matrix spike) or reagent water or soil (laboratory control sample) before extraction, at known concentrations. Bias in terms of “percent of recovery” is evaluated to determine the accuracy. Surrogate compound recovery is another spiking technique used to assess method accuracy for each sample analyzed. The stated accuracy objectives apply to spiking levels at five times the method detection limits or higher. The individual methods provide equations for acceptance criteria at lower spiking levels.
Accuracy is calculated for specific sampling or analytical batches, and the associated sample results must be interpreted considering these specific measures. An additional consideration in applying accuracy and precision is the concentration level of the samples; a procedure capable of producing the same value within 50 percent would be considered precise for low-level (near the detection limit) analyses of minor constituents, but would be unacceptable, and possibly useless, for major constituents at high concentrations.

Quality Assurance Project Plan Operable Unit 1
EO-11-001 16 December 2012
Spikes
The procedure for assessing LCS/LCSD, MS/MSD (if analyzed), and surrogate spike samples are as follows:
Percent Recovery (%R) = (Cs – Cu)/T x 100
Where:
Cs = measured concentration in spike sample Cu = measured concentration in unspiked sample T = true or certified concentration of the spike
Accuracy goals will be met if individual LCS/LCSD, MS/MSD, and surrogate recoveries are within laboratory limits. Recoveries indicating a high bias have no impact upon the usability of nondetect values in the associated field samples.
Usability of data outside project goals for accuracy is dependent on the degree of QC exceedance, whether or not there is a potential for high or low sample result bias, whether or not associated sample results are significant when compared to RG, and if the sample is critical to the investigative findings.
Accuracy will also be evaluated from blanks.
Blanks
Sources of contamination may vary from laboratory solvents and water, to lab and field equipment. Analysis of lab and field blanks may help identify these sources of contamination. Actions regarding unsuitable blanks results depend on the circumstances and origin of the blank. Qualification of sample data should be based upon comparison with the associated blank.
Identify any blank samples in which target analytes are detected. If no target
analytes are detected in the blanks samples, no action is needed. If target analytes are detected in the blanks, assess the analyte(s), concentration(s), and associated field samples for potential problems with data interpretation. Professional judgment is essential. Blank data must be carefully evaluated to determine whether or not there is an inherent variability in the data (see Table 1-4).

Quality Assurance Project Plan Operable Unit 1
EO-11-001 17 December 2012
Table 1-4 Blank Evaluation3
Blank Result Sample Result Action/Qualifier No target analytes No target analytes in the
blank No action needed
≥ RL
< RL If the sample detect associated with blank contamination is < RL (i.e. a “J” value as reported by the laboratory) and is ≤ 5x1 the blank concentration, then the sample result is qualified as a non-detect (U) at the RL.
>RL If the sample detect associated with blank contamination is > RL and is ≤ 5x1 the blank concentration, then the sample result is qualified as an estimated non-detect (UJ) and the RL is raised to the concentration detected in the sample.
Gross contamination Positive > 10x blank results may qualify all results with “R” flag
1<10x for common laboratory contaminants, HDP-PR-EM-021, Chemical Data Review, Validation, and Reporting (Reference 13) Note that nondetect results (U/UJ) with RLs > RG are considered to have exceeded RG, regardless of whether the original result is U or the U/UJ qualifier is applied at validation, 2(USEPA Contract Laboratory Program National Functional Guidelines for Superfund Organic Methods Data Review, EPA-540-R-08-01, June 2008 and USEPA Contract Laboratory Program National Functional Guidelines for Inorganic Superfund Data Review, OSWER 9240.1-51, EPA 540-R-10-011, January 2010)
1.6.10. Completeness
Completeness is calculated from the aggregation of validated data for each method for any particular sampling event. Data that are qualified as rejected (R) will be counted against completeness criteria unless there are acceptable alternate data points. QC parameters evaluated to assess completeness include holding times; surrogate recoveries; LCS/LCSD (and, if analyzed, MS/MSD) recoveries and RPD; and field duplicate RPD. Sample results that do not meet relevant criteria due to substantiated matrix effects; are re-analyzed past holding time due to QC corrective actions; and/or are “J” qualified because values are below the reporting limit will be considered usable and will not count against the completeness assessment.
For each method and each survey unit, the number of valid results, divided by the number of individual analyte results initially planned for (expressed as a percentage) determines the completeness for the data set.
The field completeness goal for the Project is 90 percent. The analytical completeness goal is 90 percent. Completeness of the sample data collected will be calculated according to the following equation:
Quality Assurance Project Plan Operable Unit 1
EO-11-001 18 October 2014
Completeness (C) = V/E x 100%
Where (for field completeness):
C = percent completeness of field effort
V = number of samples obtained
E = number of samples expected
Where (for analytical completeness):
C = percent completeness of analytical effort
V = amount of valid analytical data obtained
E = total amount of analytical data
The field completeness goal is believed to be adequate to account for unforeseen field conditions while assuring adequate to data are collected to meet the DQO. The analytical completeness goal of 90 percent is adequate to ensure that project goals are accurately assessed while accounting for real-world variances in analytical processes.
1.6.11. Representativeness and Comparability
The representativeness and comparability of data will be assessed by evaluating whether or not sample collection and analytical procedures were followed, to include calculating the RPD of field duplicates. An expression of confidence through the field duplicate results will demonstrate representativeness for an over-all impact to the project objectives (example: Poor reproducibility when all target compounds are well below RG is unlikely to have an adverse impact on project objectives).
1.7. Special Training/Certification (QA/R-5 Element A8)
Personnel assigned to the Project will be qualified and capable of completing their assigned duties. The HS Manager ensures personnel will meet the minimum training requirements as specified in the HDP-PO-EHS-001, Health and Safety Plan (Reference 9).
Personnel performing OU-1 remediation activities will have completed the initial 24-hour or 40-hour (as appropriate) Hazardous Waste Operations and Emergency Response (HAZWOPER) training and hold a current Occupations Health and Safety Administration (OSHA) 8-hour refresher certificate. Supervisory personnel will have completed the supervisory training required by 29 Code of Federal Regulations (CFR) 1910.120. HS Manager will maintain documentation of OSHA training will be available for on-site personnel, demonstrating all training requirements are satisfied.
Quality Assurance Project Plan Operable Unit 1
EO-11-001 19 December 2012
Requirements for site specific training (i.e., General Employee Training and Radiation Worker Training) are contained in the HDP-PO-GM-002, HDP Training Plan (Reference 10). This plan details requirements for unescorted site access, entry into Radioactive Material Areas, annual requalification, and retention of training records.
Additional training requirements will be based on the job function. Personnel assigned to a job category will be trained in accordance with approved procedures and lesson plans, and will demonstrate their capabilities to perform assigned tasks by the completion of practical training exercises. HDP will maintain the records of training and qualification to allow verification of the appropriate training of personnel.
1.8. Documentation and Records (QA/R-5 ElementA9)
This QAPP summarizes HDP measurements, defines data quality indicators, and specifies data quality objectives. Field and laboratory procedures developed for the HDP are followed and revised as needed. Alternate contractor procedures may be used in lieu of HDP procedures provided they are reviewed and accepted by Westinghouse prior to implementation. Revisions made to procedures during the project are noted and archived for traceability.
Records will be prepared in dark ink and shall be clear, neat, accurate, and concise. Pre-prepared forms shall be used whenever available to collect information such as survey data or instrument analysis results. When a procedure has defined a form for a specific purpose, the PM may authorize generation of the proper method of documentation.
Controlled records shall be maintained in accordance with HDP-PR-QA-009, Records Management (Reference 4). The HDP records management program meets NRC and ISO requirements for the long-term storage of records including document workflow, delivery, and storage processes. Controlled records produced by subcontractors and suppliers will submitted to HDP and managed in accordance with HDP-PR-QA-008, Document Control (Reference 18). The Quality Assurance Manager is responsible for providing the most current copies of the QAPP and related procedures to the individuals listed on page v.
Record corrections will be completed by drawing a single line through the error and making the correction adjacent to the error. The line out shall be initialed and dated by the individual making the correction.
Relevant and appropriate project information will be retained in project files. The information contained in these files may include, but is not necessarily limited to the following items:
• Chain-of-custody (COC) records; • Field notes and information;

Quality Assurance Project Plan Operable Unit 1
EO-11-001 20 December 2012
• Correspondence and telephone memoranda; • Meeting notes; • Laboratory information; sample receipt forms; • Data Validation Reports; • Reference information; • Audit information; and • Sampling Reports. These files will be retained for a minimum of five years in Westinghouse project files.
Project documents and the location of the assessment of the information addressed in the documentation are listed below in Table 1-5.
Table 1-5 Project Document and Records
Project Documents Records Location Information Addressed
Sample Collection Documents and Records
On-site Documents and Records
Off-site Documents and Records Data Assessment Documents
Field notes pertaining to sample collection
On-site log-books and COC
COC, scanned copies in electronic project file
DVR
Analytical Results Preliminary data via email
Sample receipt forms, case-narratives, analytical data
DVR
Data Assessment Records
Emails and recorded conversations between project field personnel and the Chemist
Analytical laboratory and in the Chemist’s electronic project file
DVR
Archived Records and Data
At locations designated by management, with access for appropriate project personnel
In the electronic project files, and at locations designated by the PM, with access for appropriate project personnel
Documented deliverables
1.8.1. Laboratory Records
The laboratory data reports will consist of complete data packages that will contain complete documentation and all raw data to allow independent data reduction and validation of analytical results from laboratory bench sheets, and instrument raw data outputs. Each laboratory data report will include the following:
• case narrative identifying the laboratory analytical batch number; • matrix and number of samples included; • analyses performed; • analytical methods used; and • description of any problems or exceedance of QC criteria and corrective
action taken.
The laboratory manager or their designee must sign the narrative.

Quality Assurance Project Plan Operable Unit 1
EO-11-001 21 December 2012
2. MEASUREMENT/DATA ACQUISITION (QA/R-5 ELEMENT B)
2.1. Sampling Design
The types and numbers of samples required are discussed in the FSP for OU-1.
2.2. Sampling Procedures (QA/R-5 Element B2) The accuracy of data is dependent upon well-conceived and carefully implemented sampling and analysis procedures. The details of the required sampling procedures are provided in the FSP and site policy and procedures. This plan presents the procedures with which samples will be collected or measurements made during the execution of the project. Applicable sampling procedures include:
HDP-PR-EM-019 Chemical Verification and Confirmation Sampling HDP-PR-EM-020 Chemical Data Review, Validation, and Reporting HDP-PR-EM-021 Performing Screening Measurements using a PID and FID HDP-PR-QA-006 Chain of Custody HDP-PR-WM-921 Control and Management of Investigation Derived Waste Changes in Procedures
Field conditions may require minor and/or major changes to the FSP and/or QAPP. Any changes to the procedures detailed in the FSP and QAPP will be performed in accordance with HDP-PR-GM-010, Document Requirements (Reference 19). Changes to laboratory procedures will be documented in the laboratory case narrative.
Acquisition of Samples
Sampling will be performed as discussed in the Section 4.2 through 4.5 of FSP (see also Table 4-3 and 4-4 of the FSP) and in accordance with approved project procedures as applicable.
Samples shall be adequately marked for identification from the time of collection and packaging through shipping and storage. Marking shall be on a sample label attached to the sample container. Sample identification shall be in accordance with the naming convention specified in the FSP.
2.3. Sample Handling and Custody (QA/R-5 Element B3)
Sample handling and custody requirements are discussed in the Section 5 of the FSP for OU-1 and in the HDP-PR-QA-006, Chain of Custody Procedure (Reference 15). The methods and references for collecting samples are provided in the FSP. Reagents, preservation procedures, and analytical holding times will be in accordance with published analytical methods and USEPA SW-846, 4th Ed., Test Method for Evaluating Solid Waste, Physical/Chemical Methods (Reference 2).

Quality Assurance Project Plan Operable Unit 1
EO-11-001 22 December 2012
Following sample collection in the field, samples will be placed into coolers with ice. The coolers will then be transferred to a sample storage area. The sample storage area will be locked when not in use. The samples will be placed inside a refrigerator for storage, or prepared for shipment per Section 5.3 of FSP. Prior to sample shipment, health physics must evaluate the sample containers performing radiological surveys of radioactive materials per HDP procedures. HDP will perform radiological surveys of sample shipments to ensure compliance with the requirements of 10 CFR 20 and 49 CFR for the shipment of radioactive materials.
NOTE: Samples may remain in the refrigerator for storage, including overnight until the samples are prepared for shipment.
Sample custody is detailed in Section 5 of the FSP and the HDP Chain of Custody (COC) procedure (Reference 15). All sample shipments will be accompanied by the COC identifying the contents. The original COC will be shipped with the samples by placing it with the samples in the shipping container (or by giving to the courier). HDP will retain a copy of the COC.
Once the samples reach the laboratory custodial responsibility is transferred to the Laboratory Sample Manager to assure that the appropriate procedures and methods are followed. The contracted laboratory’s Quality Assurance Plan (QAP) will detail the laboratory COC and sample storage procedures. The samples shall be checked against information on the COC form for anomalies. The condition, temperature, and appropriate preservation of samples shall be checked and documented on the COC form. The occurrence of any anomalies in the received samples and their resolution shall be documented in laboratory records. All sample information shall then be entered into a tracking system, and unique analytical sample identifiers shall be assigned. A copy of this information shall be reviewed by the laboratory for accuracy.
Specific instructions concerning the analysis specified for each sample shall be communicated to the analysts. Analytical batches shall be created, and laboratory QC samples shall be introduced into each batch. Standard operating procedures (SOP) describing sample control and custody shall be maintained by the laboratory.
The laboratory will keep final evidence files containing all relevant and appropriate project sample information. This sample information includes, but is not limited to the following items:
• COC records; • Sample log-in receipt forms; • Copies of laboratory sheets; • Copies of bench sheets; • Instrument raw data printouts; • Chromatograms; and,

Quality Assurance Project Plan Operable Unit 1
EO-11-001 23 December 2012
• Pertinent correspondence memoranda. Dedicated field logbooks will be used throughout the Project to document field activities. Supplies and reagents (source and lot numbers, if appropriate) used for field measurements will be recorded in the field logbooks.
2.4. Chemical Analytical Methods (QA/R-5 Element B4)
The analytical laboratory contracted to perform all chemical analyses under the SAP is TestAmerica St. Louis, which holds National Environmental Laboratory Accreditation Program (NELAP) certification for all applicable methods.
All samples collected will be analyzed using USEPA analytical methods 8260B, 8270C/D SIM, and 6010B/C. The methods are for routine analysis to detect VOC, PAH, and arsenic, respectively. The methods are described in detail in USEPA SW-846 4th Ed (Reference 2). Routine analytical services are performed using standard EPA-approved methodology. In some cases, modification of standard approved methods may be necessary to provide accurate analyses of particularly complex matrices. The laboratory method detection limit and reporting limit is attained contingent upon instrument sensitivity and sample matrix effects. In order to meet the Project remediation goals, the laboratory may be required to modify SW-846 analytical methods primarily through increasing sample volume preparation and concentrating the extract, if possible. Specific laboratory method modifications will be considered on a case-by-case basis and will be governed by the laboratory standard operating procedures (SOP):
• ST-MT-0001, GCMS Semi-Volatile Analysis [SW-846 8270D; EPA 625]
• ST-MT-0002, Determination of Volatile Organics by GC/MS [SW-846 8260B;
EPA 624; DW 524.2]
• ST-MT-0003, Inductively Couple Plasma Atomic Emission Spectroscopy,
Spectrometric Method For Trace Element Analysis [SW-846 6010C; Method
200.7]
All SOP(s) specific to the Project are readily available to the Quality Assurance Manager. Non-routine analyses may also include methods established by the state, American Society for Testing & Materials (ASTM), or equipment manufacturers. The laboratory will inform HDP of any proposed method, receive approval for method and document method. Sample type, source, and the governing regulatory agency requiring the analysis will determine the method utilized.
All standards used in the laboratory are traceable to certified reference materials. Commercially prepared standard materials are purchased from vendors with an accompanying Certificate of Analysis that documents the standard purity. If a standard

Quality Assurance Project Plan Operable Unit 1
EO-11-001 24 December 2012
cannot be purchased from a vendor that supplies a Certificate of Analysis, the purity of the standard is documented by analysis. The receipt of all reference standards must be documented by the TestAmerica St. Louis. Reference standards are labeled with a unique Standards Log generated Standard Identification Number and expiration date. All documentation received with the reference standard is retained as a QC record and references the Standards Log Standard Identification Number.
2.5. Quality Control Samples (QA/R-5 Element B5)
Field duplicates, MS, MSD, and rinsate blanks (if required) will be collected and submitted to the analytical laboratory to provide a means to assess the quality of the data resulting from the field sampling program. Field duplicate samples will be analyzed to check for sampling and laboratory reproducibility. Rinsate blanks will be used as a measure of contamination of samples from the sampling equipment if non-disposable equipment is used. MS/MSD pairs and LCS will be analyzed to assess if recoveries falling outside acceptance windows are attributable to sample matrix interferences and not to laboratory analytical errors, as well as to measure the accuracy of the analysis. MS/MSD or LCS/LCSD RPD per CoC will be analyzed to evaluate laboratory reproducibility or precision as well as project-specific matrix effects.
Definitive data documentation will be obtained from the laboratories and will be retained within the project files for a minimum of 5 years from the time of receipt from the laboratory.
2.5.1. Field Duplicate Procedures
A field duplicate is an environmental sample, which is divided into two separate aliquots. The aliquots are processed separately and the results compared to evaluate the effects of the matrix on the precision of the analysis. Results are expressed as RPD between the duplicate aliquot analyzed. Duplicate field samples will be obtained at a rate of 1 per 10 environmental samples or one per batch of samples (whichever is greater) and submitted to the contract lab as blind samples.
2.5.2. Matrix Spike (MS)
An MS is an environmental sample to which known concentrations of analytes have been added. The MS is taken through the entire analytical procedure and the recovery of the analytes calculated. Results are expressed as percent recovery of the known amount spiked. The MS is used to evaluate the effect of the sample matrix on the accuracy of the analysis. In addition, MSD will be obtained. In order to verify that poor recoveries (recoveries out of control limits) are due to matrix effect and not lab error for either the MS/MSD, the laboratory will run a blank (deionized water) spiked at the same level as the MS (LCS). The lab must be able to prove that poor spike recoveries are not a result of lab error. Matrix spike analysis will be conducted at a rate of one per matrix per batch of 20

Quality Assurance Project Plan Operable Unit 1
EO-11-001 25 December 2012
samples, and will be designated as an MS/MSD on the COC by field sampling personnel. Extra sample volume will be collected for matrix spike samples. A determination will be made in the field concerning representative matrices.
2.5.3. Matrix Spike Duplicate (MSD)
An MSD is the same environmental sample as the MS, which is spiked with known concentrations of analytes. The two spiked aliquots are processed separately and the results compared to evaluate the effects of the matrix on the precision and accuracy of the analysis. Results are expressed as RPD between the duplicate samples analyzed and percent recovery. MSD will be analyzed at a rate of one per batch of 20 samples, and will be designated on the COC by field sampling personnel. Extra sample volume will be collected for matrix spike duplicate samples.
2.5.4. Rinsate Blanks
If sampling equipment is reusable, a rinsate blank is prepared in the field by pouring "clean" deionized, distilled (i.e., laboratory provided analyte free) or High Performance Liquid Chromatography (HPLC) grade water over or through a sample collection device or equipment after it has been decontaminated. A rinsate blank is sometimes referred to as an equipment blank or wash blank. A rinsate blank is prepared at a frequency of one per day of sampling in which non-dedicated equipment is used for sample collection or handling and is analyzed for the analytes being sampled by the non-dedicated sampling equipment.
2.5.5. Trip Blanks
Each cooler containing VOC samples must have a trip blank for VOC analysis. Trip blanks are identified by date and sequentially numbered when multiple trip blanks are required on any day. Trip blanks will be provided by the analytical laboratory and will travel with VOC samples as they are collected in the field.
2.6. Instrument Equipment Testing, Inspection, and Maintenance (QA/R-5 Element B6) The laboratory purchases the most technically advanced analytical instrumentation based on accuracy, dependability, efficiency and sensitivity. The laboratory is furnished with all items of sampling, preparation, analytical testing and measurement equipment necessary to correctly perform the chemical analyses under this QAPP for which the laboratory has capabilities. Each piece of equipment is capable of achieving the required accuracy and complies with specifications relevant to the method being performed. Before being placed into use, the equipment (including sampling equipment, if applicable) is calibrated, tested and checked to establish that it meets its intended specification. A list of equipment per analytical methods is specified in laboratory SOPs reference above.

Quality Assurance Project Plan Operable Unit 1
EO-11-001 26 December 2012
The laboratory follows a well-defined maintenance program to ensure proper equipment operation and to prevent the failure of laboratory equipment or instrumentation during use. Routine preventive maintenance procedures, such as cleaning and replacements, should be performed according to the procedures outlined in the manufacturer's manual. Manufacturer’s instructions for equipment use are readily accessible to QA Manager.
Equipment is only operated and maintained by authorized and trained personnel.
2.7. Calibration Procedures (QA/R-5 Element B7) Instrumentation used on the Project will be maintained and calibrated to manufacturer’s specifications to ensure that required traceability, sensitivity, accuracy, and precision of the equipment/instruments are maintained. A project file will be kept on equipment used in field screening analysis. Current instrument calibration/maintenance records kept on site for review and inspection will include, at a minimum, the following:
• Name of the equipment; • Equipment identification (model and serial number); • Manufacturer; • Data of Calibration; and • Calibration Due Date. Instruments will be checked daily in order to ensure that the calibration is current (i.e., not expired). Written records of daily checks will be maintained and filed in the project file.
2.8. PID Calibration and QC
On a monthly basis, the instrument will be checked for electronic calibration and adjusted as necessary. Appropriate standards will be used for establishing instrument settings. If non-compliant instrument performance is noted, the instrument will be checked following the manufacturer’s trouble-shooting procedures. Copies of instrument specific calibration and maintenance records will be placed into bound notebooks and stored by the Environmental Manager (or designee). A review of the records will be conducted daily (during field operations) to identify any problems with instrumentation. Details of calibration operations will be described in the contractor procedures.
A positive response check (bump test) will be performed on a daily basis. For a positive response check, use the cap of an indelible pen or other similar source. Calibration gas will be provided per the manufacturer. Typically for chlorinated compounds calibration gases consist of isobutylene and a zero gas. The field operator must be certain not to draw water or other foreign matter into the instrument as that can cause internal damage. Daily tasks for care and maintenance include the following:

Quality Assurance Project Plan Operable Unit 1
EO-11-001 27 July 2013
• Calibrate the PID with the proper calibration gas every day before use; • Document calibration in the project field logbook and the projects calibration log
book; • Perform a positive response check once per day to ensure that the PID is functioning
properly; • Place the intake port of the PID near the source from which you want to take a
reading (e.g., grid node on the excavation); • A VOC value will appear as a number in parts per million volume (ppmV) on display
of the meter; • Record PID reading in the field logbook and on other appropriate field forms (e.g.,
field logbooks). If the PID does not respond to the positive response check, it will be removed from service until repaired and a replacement will be used. Headspace measurements taken with the defective instrument will be repeated with the replacement instrument and a notation will be entered into the logbook. As discussed in FSP Section 3.5.1, colorimetric gas detection may be used in lieu of PID/FID for screening purposes against the RGs.
2.9. Inspection/Acceptance Requirements for Supplies and Consumables (QA/R-5 Element B8) No field laboratory is in use or planned for this Project. ST-QAM Revision 4, TestAmerica Quality Assurance Manual (QAM) (Reference 20) details the laboratory acceptance specifications.
Field and laboratory supplies, consumables, quantities, and vendor information are verified to meet requirements prior to use. The laboratory specifies the grade of reagent that must be used in applicable procedures. If the quality of the reagent is not specified, analytical reagent grade will be used. It is the responsibility of the analyst to check the procedure carefully for the suitability of the grade of reagent.
Chemicals must not be used past the manufacturer’s expiration date and must not be used past the expiration time noted in a method’s SOP. If expiration dates are not provided, the laboratory may contact the manufacturer to determine an expiration date. The laboratory assumes a five year expiration date on inorganic dry chemicals and solvents unless noted otherwise by the manufacturer or by the reference source method. Chemicals/solvents should not be used past the manufacturers or SOP(s) expiration date. An expiration date cannot be extended if the dry chemical/solvent is discolored or appears otherwise physically degraded, the dry chemical/solvent must be discarded. Wherever possible, standards must be traceable to national or international standards of measurement or to national or international reference materials.
Compressed gases in use are checked for pressure and secure positioning daily. The minimum total pressure must be 500 psig or the tank must be replaced. To prevent a tank from going to dryness, close observation of the tank gauge must take place as pressure

Quality Assurance Project Plan Operable Unit 1
EO-11-001 28 December 2012
decreases towards 500 psig, or the tank must be replaced. The quality of the gases must meet method or manufacturer specification or be of a grade that does not cause any analytical interference.
Water used in the preparation of standards or reagents must have a specific conductivity of less than 1- μohm/cm (or specific resistivity of greater than 1.0 megohm-cm) at 25˚C. The specific conductivity is checked and recorded daily. If the water’s specific conductivity is greater than the specified limit, the laboratory may purchase reagent grade (or other similar quality) water for use in the laboratory. This water must be certified “clean” by the supplier for all target analytes or otherwise verified by the laboratory prior to use. This verification is documented.
Standard lots are verified before first time use if the laboratory switches manufacturers or has historically had a problem with the type of standard.
Purchased bottleware used for sampling must be certified clean and the certificates must be maintained. If uncertified sampling bottleware is purchased, all lots must be verified clean prior to use. This verification must be maintained.
Records of manufacturer’s certification and traceability statements are available upon request. These records include date of receipt, lot number (when applicable), and expiration date (when applicable).
2.10. Non-Direct Measurements (QA/R-5 Element B9) Data from file reviews, interviews, and historical assessments will be filed in site files for the HDP. Results from field sampling programs will be utilized to verify non-direct measurements (e.g., interviews and historical assessments).
2.11. Data Management (QA/R-5 Element B10)
Analytical data generated by the laboratory will be submitted to the Environmental Manager (or designee) and will include an electronic data deliverable (EDD). The EDD will be submitted in Microsoft® Excel®1 software format via email. The Environmental Manager (or designee) will properly format the Excel® spreadsheet in a database system to prevent import file errors. The database system is designed to perform various queries of the data for reporting requirements.
The laboratory deliverables will include a preliminary data package with a case narrative that briefly describes the number of samples, the analyses, and noteworthy analytical difficulties or QA/QC issues associated with the submitted samples. This preliminary data report will include signed COC forms, sample receipt forms, analytical data, and QC summaries including method blanks, LCS/LCSD, MS/MSDs, field duplicate and other
1 Microsoft® Excel®, Microsoft ® and Excel® are either registered trademarks or trademarks of Microsoft Corporation in the United States and/or other countries.

Quality Assurance Project Plan Operable Unit 1
EO-11-001 29 December 2012
applicable QC. This preliminary data report will also include all sample results and associated calculations (i.e., %R and RPD) for the previously mentioned parameters.
The full data report will be provided via compact disk (CD) is also required to be submitted by the laboratory and meet reporting for raw data deliverables. Data required in this submittal but not limited to the preliminary data report, initial and continuing calibration check standards, performance and interference checks, calibration parameters, internal standards, preparation and instrument logs, and any relevant instrument printouts.
The laboratory deliverables, including EDD(s) will be reviewed in compliance with HDP-PR-EM-020, Chemical Data Review, Validation, and Reporting (Reference 13). All data will be validated as documentary evidence of established data assessment and method performance criteria detailed in Section 4.0 of the QAPP.
After all reviewed and validated data is complete; the data package(s), EDD(s) and associated reports will be archived on-site, as a record. The records will be managed in accordance with HDP-PR-QA-008, Document Control (Reference 18) and HDP-PR-QA-009, Records Management (Reference 4). The official repository of documents generated or received by HDP is the Enterprise Document Management System (EDMS). Document Control department is responsible for uploading documents to EDMS. QA Manager will be responsible for protection and maintenance of the document control program for the Project.
The QA Manager will ensure the processes used will foster quality work and enable checkpoints of control in various points of the Project. HDP SharePoint may be utilized as the online controlled point of access to the current versions of HDP policies and procedures. The Project’s contracted laboratory policies and procedures are available upon request.

Quality Assurance Project Plan Operable Unit 1
EO-11-001 30 December 2012
3. ASSESSMENT AND OVERSIGHT (QA/R-5 ELEMENT C)
3.1. Assessments and Response Actions (QA/R-5 Element C1) Success of the Project will be evaluated in terms of assessing the following: 1) accuracy, precision, completeness, representatives and comparability of acquired data; 2) extent to which data can be used to develop conclusions; and 3) relevance of project conclusions to overall project objectives.
The assessments are qualitative reviews of different aspects of project work (e.g., field audits and laboratory audits) to check on the use of appropriate QC measures and the functioning of the QA system. Determinations for the Project assessments will be performed under the direction of the QA Manager. Assessment tools shall include performance evaluations, data quality assessments, field audits, and project reviews. Project review shall include team meetings held on a quarterly basis to discuss the laboratory performance evaluations, field audits, and data validation findings to assess analytical data quality. The Project team includes the Environmental Manager, Quality Assurance Manager and Data Validator. Any findings will be entered into the Westinghouse Corrective Actions Process (CAPs) for the tracking of resolution.
The following reports will document the applicable findings and status of assessments:
• HDP-PR-EM-020-2, Data Validation Report (Reference 13) – assess analytical data quality following the receipt of complete laboratory data package
• Environmental Management Monthly Report – reviews and evaluations on the status of sampling and analysis activities provided approximately the 15th of each month
• HDP Closure Report – project review of data and actions in support of site closure provided to MDNR after RG achieved and closure is recommended.

Quality Assurance Project Plan Operable Unit 1
EO-11-001 31 December 2012
4. DATA VALIDATION AND USABILITY (QA/R-5 ELEMENT D)
Data validation serves three main purposes:
• It determines compliance with methods, procedures, and contract requirements for sampling and analysis defined in the QAPP
• It qualifies data for further use to ensure data are not inappropriately used;
• It serves as a check on a laboratory to ensure they are meeting contractual deliverables and regulatory requirements; and
• It establishes due diligence and allows errors to be addressed sooner in a program, so that the impact will be less than if the errors were detected later.
Data validation will be performed per HDP-PR-EM-020 (Reference 13) and documented in a Data Validation Report.
The contracted laboratory will present all of the data (including QC parameters and raw data) in the laboratory data package. The contracted laboratory will send a copy of this data package to the Project on CD. The details of this package are provided in the following sections.
4.1. Laboratory Review and Reporting
The laboratory will perform three levels of review to evaluate data generation and reduction. The levels of laboratory review are described below.
Level I – Consists of a review of the quality of the analytical work. The analyst who performed the test performs the Level I review.
Level II – Consists of a technical review of the quality of the analytical work. It is performed by personnel who did not perform the test and have documented training for the method and laboratory standard analytical requirements. The purpose of this review is to provide an independent, complete peer review of the analytical data package.
Level III – Consists of a total overview of the data package by a QC officer, supervisor, or other laboratory designee with documented training on Level III review.
Any errors will be corrected and documented at the laboratory. Each level of review will be performed by a different individual. The percentage of data reviewed for each of the three levels will be specified by the contracted laboratory SOP.
Samples results will be initially reported on expedited turn-around-times (TAT), preliminary data report will be received via email containing case narrative that briefly describes the number of samples, the analyses, and noteworthy analytical difficulties or QA/QC issues associated with the submitted samples. At a TAT approved by the Environmental Manager (or designee), full data report package to include raw data will

Quality Assurance Project Plan Operable Unit 1
EO-11-001 32 December 2012
follow on CD and be available for upload from a laboratory portal. Any required EDD will accompany the data package.
4.2. Project Data Review and Reporting (QA/R-5 Element D1)
During the Project, the data deliverables to be submitted are listed in this section. All data shall be submitted to the Environmental Manager (or designee). Preliminary data (abbreviated data report) will be evaluated when received from the laboratory via email. If it can be determined with information available from preliminary data, samples that meet project purpose will be identified to the Project. Samples requiring reanalysis will be identified to the laboratory.
4.2.1. Analytical Results
Analytical results with laboratory quality control/internal check data will be delivered as soon after the preliminary package as practically achievable.
• Reported analytes should be bracketed by an established calibration curve;
• The lab should analyze an additional low standard at or near the Project RL;
• Batches of samples analyzed shall be bracketed by appropriate calibration verification standard; and
• Corrective action procedures implemented are to be documented, summarize within the case narrative.
Nondetects (ND) is not an acceptable form of data reporting. Results that are below the laboratory’s quantitation limit shall be reported as less than their RL.
4.2.2. Laboratory Analytical Data Report Package
A data package shall be submitted to the Environmental Manager (or designee) for review for completeness and verification that the Project’s RG were met.
This deliverable shall contain at a minimum all of the items listed below to allow the Environmental Manager (or designee) to perform an adequate data evaluation (data shall be presented in tabular format whenever possible):
• Sample Identification - Prepare a tabular presentation that matches the contract laboratory sample identifications to the field identification numbers assigned to each sample.
• Sample Receipt Forms - Provide copies from all sample shipments received at the contract laboratory.
• COC Record Forms - P reported. Report any dilution factors, as well as date of extraction (if applicable) and date of analysis for each sample.
• Internal QC Reports - For each analytical batch, report a complete set of QC results. At a minimum, Internal QC samples shall be analyzed at rates specified in the methods.

Quality Assurance Project Plan Operable Unit 1
EO-11-001 33 December 2012
• At a minimum, the following Internal QC results shall be submitted: 1.) Laboratory Blanks (Method Blanks) - Report all analytes for each
laboratory blank analyzed per sample batch.
2.) Surrogate Spike Samples - Report recoveries with all organic method reports, where applicable (i.e. when the method requires surrogate spikes). Also specify the control limits for surrogate spike results, and the concentration used for the spike.
3.) Matrix Spike Samples - Report recoveries for all organic and inorganic analyses. Also, specify the control limits for matrix spike results, each method, and matrix. General sample results shall be designated as corresponding to a particular matrix spike sample.
4.) Field, Laboratory and/or Matrix Spike Duplicate Pairs - Report the RPD for each duplicate pair and the analyte/matrix-specific control limits.
5.) Laboratory Control Samples - When run for a method's internal QC, report the results of the LCS with the corresponding project sample data. Also, specify the control limits for the LCS.
4.3. Data Validation (QA/R-5 Element D2)
Upon receipt of full data packages, the Data Validator will validate 100% of the data which includes all QC, sample and method parameters. 10% of the data will be validated to include all calibrations and calculations of each method analyzed. An overall evaluation of the laboratory data is performed to arrive at the assignment of a single data validation qualifier. The following qualifiers are possible for a given data point:
• U - Analyte was not detected • J - Analyte was detected and the result is estimated • UJ - Analyte was not detected and the reporting limit is estimated • R - Analyte was detected and the result was rejected • UR - Analyte was not detected and the result was rejected
Data used to determine appropriate disposal activities, such as waste characterization data will be reviewed for pass/fail criteria only Data to be validated (pre- and post- treatment soils and related QC) will undergo the review process noted in Table 4-1below.
• provide copies from all sample shipments received by the contract laboratory.
• General Data Reports - For each analytical method run, report results of all analytes for each sample (concentration detected or less than the specific quantization limit). On the sample's data sheets, clearly identify the specific analytical batch the sample belongs to and the corresponding QC data

Quality Assurance Project Plan Operable Unit 1
EO-11-001 34 December 2012
Table 4-1 Data Review and Validation Process
Input Description Qualifications COC
COC a will be reviewed and verified as accurate and appropriate custody documentation will be verified.
None unless sample integrity is in question; results will be rejected (R) if sample integrity is believed to have been compromised.
Field Notes
Field notes will be reviewed to ensure that all samples were collected properly.
Results may be estimated (J) or rejected (R) based upon sample collection. The impact of rejected results will be evaluated by the validator and the reason for the decision to not qualify, estimate, or reject data will be described in the DVR.
Analytical Data Packages
Sample receipt forms, case narratives, communication logs, and corrective action forms will be reviewed to ensure that all samples were analyzed for the requested parameters within holding times.
Results may be estimated (J) or rejected (R) based upon temperature at receipt and holding time exceedance. The impact of the exceedance will be evaluated by the validator and the reason for the decision to not qualify, estimate, or reject data will be described in the DVR.
Analytical Data Package
All QC sample results, applicable spike recoveries (surrogates, internal standards, etc.) and calibration summaries will be evaluated against the method quality criteria and the data will be flagged with data qualifiers, accordingly.
See Table 4-2
Analytical Data Package
If problems are identified, raw data will be reviewed and a selection of calculations will be checked to verify that laboratory summary forms are accurate.
Any issues identified will be qualitatively and quantitatively evaluated. Results may be estimated (J) or rejected (R) based upon sample evaluation. The impact of any issues will be evaluated by the validator and the reason for the decision to not qualify, estimate, or reject data will be described in the DVR.
Data validation is performed to determine if Project DQO were met; this is accomplished through assessment of measurement performance criteria (MPC) and data quality indicators (DQI), and will be performed as part of the analytical laboratories quality program and in accordance with the QAPP.
Once full data packages are received, QC sample results, applicable spike recoveries (surrogates, internal standards, etc.) and calibration summaries will be evaluated against the method quality criteria and the data will be flagged with data qualifiers, accordingly, as noted in Table 4-2.

Quality Assurance Project Plan Operable Unit 1
EO-11-001 35 December 2012
Table 4-2 Validation Criteria
QC Sample Frequency MPC Action Method Blank 1/Batch of 20 or fewer
samples No compound > RL
If sample results < 5x (10x) of the blank results, the samples shall be qualified as non-detect “U/UJ” flag with an annotation “B” [probable contamination therefore, nondetect]. Method and rinsate blanks are expected not to contain any target analytes with concentrations greater than the reported detection limit with the possible exception of common laboratory contaminants. If sample >5x (10x) evaluate for gross contamination; otherwise, no qualification needed
Trip Blank 2-3/Cooler containing samples for 5035A/8260B
Same as Method Blank
Same as Method Blank
LCS/LCSD
1/Batch of 20 or fewer samples
Laboratory acceptance criteria
Flag values outside control criteria (J/UJ), if appropriate (non-detect results associated with high bias recoveries may not require qualification).
MS/MSD
1/Batch of 20 or fewer samples
Laboratory acceptance criteria
Evaluate data and determine if a matrix effect is or analytical error is indicated. Flag values outside control criteria (J/UJ), if appropriate (non-detect results associated with high bias recoveries may not require qualification). Additionally, unless believed to be representative of a greater area, only the parent sample is qualified.
Surrogate Standard
All field and QC Samples
Laboratory % Recovery Limits
Flag values outside control criteria (J/UJ) if appropriate (non-detect results associated with high bias recoveries may not require qualification).
Internal Standard
All field and QC Samples
Method criteria Flag reported values (J/UJ) outside control criteria.
Calibrations Continuing calibration 1/Analysis Batch Initial calibration following instrument maintenance or as needed
Method criteria Flag reported values (J/UJ) outside control criteria

Quality Assurance Project Plan Operable Unit 1
EO-11-001 36 December 2012
Rejection of data will depend largely upon professional judgment and the comparison of outlier values against the RG. If any data are rejected, a full explanation will be provided, as well as any corrective actions that may become necessary. The EM (or designee) will have the authority to reject data.
Field, matrix and laboratory duplicate results will be assessed based upon the RPD between values. Laboratory control spiked samples will be based upon the percent recovery (%R) of spiked analytes. MS/MSD data will be assessed based upon the percent recovery of spiked analytes. Data completeness will be assessed based upon the amount of valid data obtained from a particular measurement system. See Sections 1.6.8 through 1.6.11 for discussions regarding how to perform these calculations and assessments.
4.4. Data Validation Report
The Data Validator will evaluate data received from the laboratory and document the findings in a Data Validation Report (Reference 13). The DVR will be reviewed for both technical accuracy and quality in reporting prior to submission to the client. The DVR will address the following:
Sample Receipt
• COCs • Sample Receipt • Holding Times • Case Narratives
Blanks
• Method Blanks • Trip Blanks • Rinsate Blanks
Calibration
• Initial Calibration • Continuing Calibration
Spikes
• LCS/LCSD • MS/MSD • Surrogates • Internal Standards
Field duplicates
Reporting Limits/Method Detection Limit
Completeness

Quality Assurance Project Plan Operable Unit 1
EO-11-001 37 December 2012
• Field Completeness • Analytical Completeness
Conclusions (impact of any outliers upon Project DQO)
4.5. Corrective Action (QA/R-5 Element D3)
Problems or potential system problems are detected through calibration check samples, QC samples, and performance audits.
Corrective action resulting from evaluation of analytical data may include, but is not limited to:
• Re-analyzing the samples • Evaluating and amending sampling and analytical procedures • Accepting data with an acknowledged level of uncertainty • Re-sampling and analysis, if the completeness of the data set or intended use of
the data is insufficient to meet DQO.
If the above corrective actions are deemed unacceptable, an alternate laboratory may be selected to perform necessary or appropriate verification analyses.
4.5.1. Immediate Corrective Action
Any equipment and instrument malfunctions will require immediate corrective actions. The laboratory QC charts are working tools that identify appropriate immediate corrective actions to be taken when a control limit is exceeded. The actions taken should be noted in field or laboratory logbooks, but no other formal documentation is required unless further corrective action is necessary. These on-the-spot corrective actions will be applied daily as necessary. Affected measurements will be retaken as soon as possible. Affected laboratory samples will be re-analyzed if sufficient sample quantity is available. Otherwise, additional sampling may be conducted to fill the data gap.
4.5.2. Long-Term Corrective Action
The need for long-term corrective action may be identified by standard QC procedures, control charts, and/or performance or system audits. Any quality problem that cannot be solved by immediate corrective action falls into the long-term category.
The essential steps in a long-term corrective action system are:
• Identification and definition of the problem; • Investigation and determination of the cause of the problem;

Quality Assurance Project Plan Operable Unit 1
EO-11-001 38 December 2012
• Determination and implementation of a corrective action to eliminate the problem; and
• Verification that the corrective action has eliminated the problem. Documentation of the problem is important in corrective action. The responsible person may be an analyst, the laboratory Quality Manger, the Laboratory Project Chemist, or the laboratory Project Manager.
For field activities, the required corrective action will be documented by the Environmental Manager (or designee). For chemical data, the required corrective action will be documented by the appropriate laboratory personnel. The corrective action will be discussed with the client prior to implementation if the severity of the problem warrants such discussion.
4.5.3. Out of Control Situations
A value outside the control limits or classified as outlier by statistical testing is considered an out-of-control situation. Failure to meet calibration criteria, record keeping omissions, improper sampling technique, and improper storage or preservation of samples are all conditions that affect data quality and require investigation and correction. Immediate action will be taken to find the problem, recalibrate, and re-analyze the samples.
4.5.4. Laboratory Corrective Procedures
When an out-of-control situation is detected, the analyst, lab team leader(s), and lab manager will investigate to determine the cause and document the actions taken. Data acquired concurrently with this condition are discarded and samples re-analyzed unless the investigation of the problem proves that the analysis was in control.
After the corrective actions are instituted, the systems performance is rigorously checked before continuing sample analysis. No analysis is started if the calibration check samples are outside of the method limits. The problem is diagnosed, the system fixed, and the calibration rechecked before analysis is resumed. Corrective actions associated with the Project are documented and records are maintained in the laboratory maintenance book.
The selected laboratory’s QAP will describe the corrective action procedures used by the laboratory to eliminate problems in the analytical systems. Problems that cannot be resolved by the analysts, laboratory managers, or QA officers will be brought to the attention of the PM. The PM will determine the corrective action to be taken, if any.

Quality Assurance Project Plan Operable Unit 1
EO-11-001 39 December 2012
The laboratory personnel will assess laboratory QC samples, if applicable, and re-analyze samples which do not meet QC criteria prior to expiration of hold times, when possible. Corrective actions for samples not meeting QC criteria may include re-analysis, or re-sampling and analysis. Laboratory personnel use Corrective Action Report forms to document identification and resolution of defects. These report forms are kept on file in the laboratory QA files.
4.5.5. Field Situations
Any sampling problems or deficiencies (i.e., improper sampling procedures, documentation, decontamination, or packaging procedures) detected will be corrected immediately. The deficiency and corrective action will be recorded in the field logbook. A summary of any issues will also be included in the remedial action completion report submitted to the MDNR.
The need for corrective action, if any, will be based upon predetermined limits for acceptability for all aspects of sample collection and analysis. Predetermined limits for acceptability may include, but are not limited to, historical data, laboratory control spike sample results, and experience using the analytical procedures for measurement in relation to the specific methodologies. By following standard QA/QC procedures, problems which could result in erroneous data should be detected. The need for corrective action may be determined by the samplers, analysts, supervisors, QA personnel, laboratory managers and/or PMs.
The detection of system and performance problems and the corrective actions procedures to be used in the field during sample collection and data measurement will be documented in the field logbooks and placed in the project files. Any problems that cannot be resolved by the sampler or field manager will be brought to the attention of the Westinghouse Project Director. The Westinghouse Project Director will determine the corrective action to be taken, if any.
If a system or performance audit uncovers problems requiring corrective action, the corrective action will be initiated upon approval of the responsible supervisor(s). Documentation of corrective actions will be made in a letter report to the Westinghouse Project Director.
Quality Assurance Project Plan Operable Unit 1
EO-11-001 40 October 2014
5. REFERENCES
5.1. Cite References
1. USEPA QA/G-4, Guidance on Systematic Planning Using the Data Quality Objectives Process, February 2006.
2. USEPA SW-846 4th Ed, Test Method for Evaluating Solid Waste, Physical/Chemical Methods.
3. Missouri Department of Natural Resources (latest update)Departmental Missouri Risk-Based Corrective Action Technical Guidance, June 2006
4. HDP-PR-QA-009, Records Management
5. Former Fuel Cycle Facility Non-Time Critical Removal Action Memorandum, circa 2003, Westinghouse Electric Company LLC
6. EO-09-001, Record of Decision Operable Unit 1, Buried Waste, Impacted Soils, and Sediment, May 2009
7. EO-10-002, Remedial Design Work Plan, Operable Unit 1, Former Fuel Cycle Facility, August 2011
8. HDP-WP-OPS-505, Excavation and Exhumation
9. HDP-PO-EHS-001, Health and Safety Plan
10. HDP-PO-GM-002, Training Plan
11. HDP-PO-WM-900, Waste Management and Transportation Plan
12. HDP-PR-EM-019, Chemical Verification and Confirmation Sampling
13. HDP-PR-EM-020, Chemical Data Review, Validation, and Reporting
14. HDP-PR-EM-021, Performing Field Screening Measurements Using a PID and FID
15. HDP-PR-QA-006, Chain of Custody
16. HDP-PR-WP-906, Waste Classification, Sample Analysis, and Reporting
17. HDP-PR-WM-921, Control and Management of Investigation Derived Waste
18. HDP-PR-QA-008, Document Control

Quality Assurance Project Plan Operable Unit 1
EO-11-001 41 December 2012
19. HDP-PR-GM-010, Document Requirements
20. ST-QAM Revision 4, TestAmerica Quality Assurance Manual
5.2. Developmental References (non-cited)
1. QA/R-5, EPA Requirements for QA Project Plans, March 2001.
2. QA/G-5, Guidance for Quality Assurance Project Plans, December 2002.
3. QA/G-8, Guidance on Environmental Data Verification and Data Validation, January 2008.
4. MDNR-QAPP-PA/SI, Quality Assurance Project Plan for Pre-Remedial / Pre-Removal Site Assessment, Revision 4, September 2004.

Quality Assurance Project Plan Operable Unit 1
EO-11-001 42 December 2012
FIGURES

Quality Assurance Project Plan Operable Unit 1
EO-11-001 43 October 2014
Figure 1
Project Organizational Structure