remediation work plan and sampling and analysis …remediation work plan and sampling and analysis...
TRANSCRIPT

Remediation Work Plan and Sampling and Analysis Plan 1ICS Soil Remediation and RemovalBloomington, IndianaJuly 2010
R E M E D I A T I O N W O R K P L A NA N D
S A M P L I N G A N D A N A L Y S I S P L A N
F O R T H E
S E D I M E N T A N D S O I L F L O O D P L A I N E X C A V A T I O N A N DR E M O V A L
A T T H E
L E M O N L A N E L A N D F I L L S I T EI L L I N O I S C E N T R A L S P R I N G
B L O O M I N G T O N , I N D I A N A
Civil Action Number: IP 81-448-C, “Agreed Amendment to the Consent DecreeProviding for Remedial Actions at Neal’s Landfill, Lemon Lane Landfill and Bennett’s Dump and Addressing General Matters”, USA et al. v. CBSCorporation et al., United States District Court for the Southern District ofIndiana, Indianapolis, Division, entered July 24, 2009.
Prepared by:
CBS Corporation20 Stanwix Street
Pittsburgh, Pennsylvania 15222
July 2010

Remediation Work Plan and Sampling and Analysis Plan 2ICS Soil Remediation and RemovalBloomington, IndianaJuly 2010
T A B L E O F C O N T E N T S
Page No.
1.0 Introduction ..........................................................................................................6
2.0 Site Background .................................................................................................. 62.1 Description and Site History .................................................................... 7
2.1.1 Illinois Central Spring Emergence (EM) Area Description.............82.1.2 Swallow Hole (SH) Description .....................................................92.1.3 Quarry Springs (QS) Area Description............................................9
2.2 Previous Site Investigation Activities........................................................112.2.1 ICS Emergence (EM) Area Previous Sample Results ...................112.2.2 Swallow Hole (SH) Area Previous Sample Data...........................122.2.3 Quarry Springs Area Previous Sample Results .............................12
3.0 Project Organization and Administration ........................................................... 133.1 Organizations, Roles, and Responsibilities ............................................. 133.2 Project Meetings and Reporting ............................................................. 163.3 Project Schedule .................................................................................... 17
4.0 Remedial Objectives ..............................................................................................174.1 Cleanup Criteria ..................................................................................... 174.1.1 Final Drainageway Criteria .................................................................... 184.1.2 Non-Drainageway Criteria ..................................................................... 18
5.0 Technical Approach........................................................................................... 185.1 Pre-Remediation Activities .................................................................... 19
5.1.1 Clearing..........................................................................................195.1.2 Delineation Grid Sampling ............................................................19
5.1.2.1 Phase 1 Emergence Area Delineation Sampling ...............205.1.2.2 Quarry Springs Area Delineation Sampling ......................205.1.2.3 Swallow Hole Area Delineation Sampling ........................21
5.1.3 New ICSTF Effluent Line..............................................................215.1.4 New Quarry A Culvert...................................................................22
5.2 Mobilization and Site Setup ................................................................... 225.3 Soil Removal Approach ......................................................................... 22
5.3.1 Emergence Area ......................................................................... 225.3.1.1 French Drain Installation ...................................................24
5.3.2 Quarry Springs Area................................................................... 245.3.3 Swallow Hole Area .................................................................... 28
6.0 Delineation and Verification Sampling and Re-excavation................................. 306.1 Pre-Excavation Grid Delineation Sampling...............................................316.2 Grid Bottom Verification Sampling...........................................................326.3 Final Drainage Way Verification Sampling ..............................................326.4 Stockpile Sampling ................................................................................ 33
Remediation Work Plan and Sampling and Analysis Plan 3ICS Soil Remediation and RemovalBloomington, IndianaJuly 2010
T A B L E O F C O N T E N T S ( C O N T I N U E D )Page No.
7.0 Waste Transportation and Disposal.................................................................... 337.1 Transportation ............................................................................................347.2 Inspections .................................................................................................347.3 Scale Operations and Truck Log Records .................................................347.4 Manifesting and Placarding .................................................................... 357.5 Disposal Facilities .................................................................................. 357.6 Solid Waste and Fuel Spills .......................................................................35
8.0 Water Management ........................................................................................... 368.1 Diversion of Clean Storm Water ............................................................ 37
8.1.1 Diversion of Quarry Springs Water ...............................................378.2 Retention and Treatment of Potentially Impacted Water......................... 388.3 Spill Prevention and Control .................................................................. 39
9.0 Air Monitoring .................................................................................................. 39
10.0 Site Restoration ................................................................................................. 3910.1 Grading and Seeding .............................................................................. 3910.2 Erosion Controls .................................................................................... 4010.3 Fencing .................................................................................................. 40
11.0 Project Closeout and Completion Report ........................................................... 40

Remediation Work Plan and Sampling and Analysis Plan 4ICS Soil Remediation and RemovalBloomington, IndianaJuly 2010
Appendix A.
Sampling and Analysis Plan
Page No.
A1.0 Introduction............................................................................................................42
A2.0 Data Quality Objectives.........................................................................................42A.2.1 Stating the Problem....................................................................................42A.2.2 Identifying the Decision.............................................................................43A.2.3 Identifying Inputs to the Decision .............................................................43A.2.4 Defining the Boundaries of the Study........................................................43A.2.5 Developing a Decision Rule ......................................................................46A.2.6 Specifying Limits on Decision Errors........................................................46A.2.7 Optimizing the Design ...............................................................................46
A.3.0 Soil Sampling Procedures ......................................................................................49A.3.1 Pre-Excavation Grid Delineation Sampling...............................................49A.3.2 Grid Bottom Verification Sampling and Reexcavation .............................50A.3.3 Final Drainage Way Verification Sampling ..............................................51A.3.4 Stockpile Sampling ....................................................................................51
A.4.0 Quality Control Samples........................................................................................52
A.5.0 Personnel and Equipment Decontamination..........................................................53
A.6.0 Investigation-Derived Waste .................................................................................53
A.7.0 Sample Management..............................................................................................54A.7.1 Sample Identification System ....................................................................54A.7.2 Sample Containers, Preservatives, and Holding Times .............................55A.7.3 Sample Labeling ........................................................................................55A.7.4 Sample Shipping ........................................................................................55A.7.5 Sample Custody .........................................................................................55A.7.6 Field Sampling Logbook............................................................................55
A.8.0 Laboratory Analysis...............................................................................................56
A.9.0 Data Validation and Reporting ..............................................................................56A.9.1 Data Validation ..........................................................................................56A.9.2 Data Reporting ...........................................................................................57
References

Remediation Work Plan and Sampling and Analysis Plan 5ICS Soil Remediation and RemovalBloomington, IndianaJuly 2010
T A B L E O F C O N T E N T S ( C O N T I N U E D )
List of Tables
Table 1. Soil and Sediment Sampling PCB Results for the Emergence AreaTable 2. Soil and Sediment Sampling PCB Results for the Swallow Hole AreaTable 3. Soil and Sediment Sampling PCB Results for the Quarry Springs AreaTable 4. IC Emergence Area - Grid Sampling ResultsTable 5. IC Quarry Springs Area - Grid Sampling ResultsTable 6 IC Shallow Hole Area–Grid Sampling ResultsTable 7 Sample Requirements
List of Figures
Figure 1. Site Location MapFigure 2. General Site AreaFigure 3. Existing FeaturesFigure 4. PCB Soil Results, Emergence AreaFigure 5. PCB Soil Results, Shallow Hole AreaFigure 6. PCB Soil Results, Quarry Springs AreaFigure 7. Project ScheduleFigure 8. Conceptual Remediation Site LayoutFigure 9. New ICSTF Effluent LineFigure 10. French Drain LayoutFigure 11a. French Drain DesignFigure 11b. French Drain DesignFigure 12. IC Emergence Grid Sampling PlanFigure 13. IC Emergence Excavation PlanFigure 14. IC Emergence Constructed Drainage Channel and Final Grading PlanFigure 15. Shallow Hole Grid Sampling and Excavation PlanFigure 16. Quarry Springs Grid Sampling and Excavation PlanFigure 17. Swallow Hole Final Drainage Channel and Final Grading PlanFigure 18. Quarry Springs Final Drainage Channel and Final Grading Plan

Remediation Work Plan and Sampling and Analysis Plan 6ICS Soil Remediation and RemovalBloomington, IndianaJuly 2010
1.0 Introduction
The purpose of this work plan and SAP is to provide a plan for the work required at theLemon Lane Landfill site (LLL) by the Consent Decree Amendment (CDA) and theassociated Record of Decision Amendment (RODA) and Statement of Work (SOW).Collectively, the CDA/RODA/SOW will be referred to as the CDA (Reference 1) in thisdocument. The CDA details the final remedial actions and monitoring requirements forthe LLL site. One of those requirements is to sample the soils and sediments in theIllinois Central Spring (ICS) emergence area (EM), the Swallow Hole (SH) area and theQuarry Springs (QS) area.
The LLL site has been separated into operable units. The first operable unit was thesource control operable unit (OU1). The remediation of OU1 occurred in 2000 inaccordance with a negotiated SOW (Reference 2). The recently entered CDA sets forththose actions required for the final two operable units at the site. OU2 addressesgroundwater at the site and OU3 addresses sediments.
A sampling plan for the Delineation of the Emergence area, (Reference 4), has beenpreviously approved by EPA. This plan contains a Remediation Work Plan and aSampling and Analysis Plan for the sediment and soil removal in the three areas,EM/SH/QS. It specifies the verification sampling required in the EM and SH areas andthe delineation and verification sampling required in the QS area. This plan is based onthe“Remedial Design/Remedial Action Work Plan Operable Units 2 and 3 Site Groundwater and Sediments, Lemon Lane Landfill Site, Bloomington, Monroe County,Indiana” submitted by CBS to the EPA in January 2010. (Reference 5)
This plan contains the following:
Site description/history Project Organization Performance objectives General construction approach Site environmental controls Cleanup confirmation methods Sampling and Analysis Plan
This Plan is supported by and intended to be used in conjunction with the QualityAssurance Project Plan (QAPP) (Reference 6) for the Bloomington Sites.
2.0 Site Background
The EM/SH/QS areas are associated with LL Landfill, which is a National Priority List(NPL) site with the EPA ID No. IND980794341. LL Landfill is part of a Consent Decree(CD) entered on August 27, 1985, in Civil Action No. IP 83-9-C and IP 81-448-C. Theremedy required by the 1985 decree was later modified. The final remedies required forthe site are included in the 2009 CDA.
LL Landfill is located on the northwest side of the city of Bloomington in Monroe County,Indiana as shown in Figure 1. The relationship between LL Landfill and the ICSEM/SH/QS locations are shown on Figure 2. OU2 and OU3 remedial actions are to becarried out at the site of the groundwater discharge impacted by the site, the IllinoisCentral Spring (ICS) which is located about 2,500 feet southeast of the landfill.

Remediation Work Plan and Sampling and Analysis Plan 7ICS Soil Remediation and RemovalBloomington, IndianaJuly 2010
2.1 Description and Site History
The City of Bloomington operated the Lemon Lane Landfill from 1950 to 1964 as amunicipal waste landfill. It was also used as a repository for industrial debris and waste.Electrical capacitors containing PCBs from the Westinghouse Bloomington plant weredeposited there from 1958 to 1964 by contracted local waste haulers. The City closed thelandfill in 1964 and partially covered the landfill with soil.
Investigations at the site began as early as 1976. Extensive site sampling began in theearly 1980s. The site was placed on the NPL in 1983, at which time the initial site cleanupactivities began.
The 1985 consent decree required interim measures at the site and detailed final remedialand closure activities. The final landfill remedy was modified in 2000. At that time the sitewas divided into operable units. The first operable unit, OU1 was designated as the sourcecontrol operable unit. The remedy specified for OU1 involved the landfill area.
The remedy for OU1 was prescribed in the Statement of Work (SOW) for OU1 (Reference2). The work required in the SOW resulted in the following:
Excavation and off site disposal of 80,087 tons of PCB contaminated materialgreater than or equal to 50 parts per million (ppm)
Excavation and transportation of a total of 4,402 capacitors offsite forincineration.
Consolidation of 40,000 cubic yards of landfill material within the final cappedarea to shrink the size of the landfill to approximately 9 acres.
Installation of a RCRA Subtitle C compliant cap over the remaining landfillmaterial. The cap consists of 6-inches of topsoil, 18-inches of clean granular fill,a geocomposite drainage layer, 40 millimeter thick geomembrane, geosyntheticclay layer and perimeter drainage and stormwater retention pond.
Installation of 4 piezometers into the landfill to determine if the landfill waste isgetting wet by backflooding.
Clean up of areas outside the landfill boundary.
Implementation of a Groundwater Monitoring Plan and Cap Inspection Plan
Illinois Central Spring (ICS) is located approximately a half mile southeast of LL Landfillas shown on Figure 2. ICS has been proven to be the outlet for groundwater impactedby the landfill. ICS discharges through a railroad culvert to an area known as theSwallow Hole Area (SH). As the name implies, this area is a low spot that containsseveral swallow holes. These swallow holes route surface water back below thesurface. At non-storm conditions, the swallow holes in this area pass all the water fromICS to the subsurface. However, during storms, these swallow holes cannot passenough flow and the area floods.

Remediation Work Plan and Sampling and Analysis Plan 8ICS Soil Remediation and RemovalBloomington, IndianaJuly 2010
As the SH area floods, it overflows through a culvert to the Quarry Springs (QS) area.The QS area is so named because quarrying was done historically in the general vicinityand there are also several springs in the area. These springs have been proven to bethe discharge points for the waters which sink into the swallow holes in the SH area.The QS area is drained by a 36 inch culvert which routes storm water to the headwatersof Clear Creek near the intersection of Third and Adams Streets.
In 1999, the USEPA began construction of a Spring Treatment Facility (STF) in theswallow hole area to capture the water emanating from the ICS emergence, treat it forPCBs and then discharge the treated water to the stream upstream of the swallow hole.Some areas in the flood plain of ICS emergence (EM) area were covered with fill during theconstruction of the STF.
In spring 2000, the EPA STF went into operation with the capability to treat up to1000 gpm. Flows greater than 1000 gpm were bypassed in an untreated state. In 2001the EPA completed construction of storage tanks at the treatment plant. With the tanks,the facility has the capacity to continuously treat 1000 gpm and store up to four acre-feetof water when flows exceed 1000 gpm. This plant is currently operated by CBS.
The EM/SH/QS areas are all prone to flood during large storm events when ICS springflow can rise by several orders of magnitude and culverts/swallow holes clog orotherwise cannot pass all the spring flow. During these flood events, solids entrained inthe spring flow are settled out. These solids are contaminated with PCBs which thencontaminates the flood plain.
The ICS EM/SH/QS areas have been sampled several times beginning as early as1982. ICS was fenced by EPA in 1985. By the mid 1990s this fence had fallen intodisrepair. Based on a sampling event in 1995, the flood plains associated with the EMand SH areas were fenced by Westinghouse to prevent access to nearby residentsThe PCB levels found at the QS area did not warrant fencing.
Most of the property in these areas had been owned by various railroads. In 1997, therail lines were abandoned by CSX Railroad. The SH area property became the propertyof the City of Bloomington and the IC emergence area was sold to Renaissance Rentals.Some of the property north and west of the IC emergence is owned by ValhallaCemetery. The QS area is largely owned by an adjacent church and DavidKleindorfer,the owner of an adjacent hardware store.
2.1.1 Illinois Central Spring Emergence (EM) Area Description
The Emergence Area (EM) is the area fenced immediately around the ICS emergenceflood plain. This encompasses about 1 acre. The general topography of the area is amoderately sloped valley oriented from northwest to southeast which is truncated by arailroad berm along the southern boundary. Figure 3 shows the area and the approximatelocation of the fence. Most of this area is wooded with extensive underbrush.
The main spring emergence is located near the southern boundary of the area. There areoverflow springs up the hill to the west of the main emergence. During non-stormconditions, the flow from ICS averages about 30 gallons per minute (gpm). During intensestorms, with wet pre-storm conditions, flows can exceed 4000 gpm. PCB levels in springwater ranges from 4 to 20 ppb during non-storm conditions to over 1000 ppb during peakstorm periods.

Remediation Work Plan and Sampling and Analysis Plan 9ICS Soil Remediation and RemovalBloomington, IndianaJuly 2010
In the early 1990s, a depression formed to the north of the ICS emergence. It appears thisdepression was formed because storm water from the underlying conduit had pushedabove the top of rock and eroded the soils. In 2008, additional depressions were forming tothe northeast of this original depression and the original depression has grown larger.
During the construction of the STF in 1999, a storm water diversion berm was installed todivert surface water runoff from the north and east and keep it separate from the ICSemergence water which is sent to the STF. The diverted storm water collects in a low areaand is directed through the bypass piping, bypassing the inlet to the STF. This storm waterbypass sump was sampled, regraded and filled during the construction of the STF.
2.1.2 Swallow Hole (SH) Description
The Swallow Hole (SH) area and associated floodplain is the fenced area just south of theSTF. The size of the area is approximately 1 acre. Figure 3 shows the features andtopography of the area. The general topography of the area is that of a low lying, wide,shallow valley running from west-northwest to east-southeast, between the old railroadberms on the west, south and east perimeters of the area. On the north perimeter ofSwallow Hole area, the ground rises up the slope of the fill that was placed to build theSTF. Most of this area is wooded with extensive underbrush.
The area begins where the ICS water emerged from the old railroad culvert just south ofthe railroad tracks before construction of the STF. In addition to waters which flow fromICS, this area also receives surface water drainage from the IC emergence area, andsurface water drainage from the immediate swallow hole area. Before the ICS wasdiverted as part of the construction of the STF, the ICS water flowed on the surface in asmall stream channel for approximately 300 feet and then, at low flows, the water wasrouted to the subsurface via the swallow hole. The small stream channel is a few feet widewith a bottom generally on top of bedrock with a few areas of deeper soft sediments,especially near the swallow hole.
At high flows, the swallow hole can not drain all the flow and flooding occurs in the areasoutheast of the swallow hole, depositing contaminated sediments. There are a numberof channels which route storm flow from the SH towards the overflow culvert. Thefloodwater is relieved through a culvert under the embankment that releases the water tothe QS A area. The culvert invert is higher than some of the low spots which causes apond to form in the SH area. CBS has observed that the flood prone area in the SH area islimited to below about the 810 foot amsl elevation.
Since the year 2000, when the EPA built STF went into operation, the PCB loading to theSH area has been drastically reduced. However, the STF discharges the treated water tothis area and the dynamics of flooding during storms still occurs.
2.1.3 Quarry Springs (QS) Area Description
The Quarry Springs area is southeast of the SH area, across the ICSTF access road, asshown in Figure 3. Within the QS area the Illinois Central Stream (ICS) flow which sankinto the swallow holes in the SH area re-emerges at four springs in the QS area and flowsalong the surface to a 36” city sewer culvert.

Remediation Work Plan and Sampling and Analysis Plan 10ICS Soil Remediation and RemovalBloomington, IndianaJuly 2010
The four springs are designated Quarry A, Quarry B and Quarry C and Rinker Spring. Thelocations of the springs and their relationship to the SH and QS areas are shown onFigure 3. The floodplain area around the Quarry Springs is approximately 1.5 acres in size.The general topography of the area is that of a low lying, wide, shallow valley running fromthe culvert outlet at Quarry A southeast to the entrance of the combined 36 inch stormsewer culvert. Within this flood plain are small stream channels that normally contain theflows from the various springs except in very large storm events or when the 36 inchdischarge culvert becomes blocked by debris.
The topography of the QS area rises from the QS stream channels, up the railroad berm tothe ICSTF access road on the west side of the area. On the north, east and southperimeters of the area, the topography rises out of the low lying area, up the slope of fillplaced during development of the area. The area is not as heavily wooded as the EM andSH areas, but does contain extensive underbrush.
The QS stream channels are a few feet wide and have little soft sediment material. Thereis mostly just a thin layer of coarse gravel, sand and stone on bedrock. Exceptions to thisare areas that can routinely pond, for example in front of the 36 inch exit culvert. This areain front of the 36 inch exit culvert has been blocked several times by beavers and this hasallowed more sediment to accumulate in this area.
As indicated above, Quarry A and B Springs are fed directly by the swallow holes in the SHarea. The flows at Quarry A and B Springs follow closely the flow at ICS during non-stormconditions. Under low flow conditions, when ICS flow is less than 500 gpm, Quarry B isthe main resurgence of the water from the SH area. Quarry B is actually on the west sideof the abandoned railroad tracks which is now the ICSTF access road. It was pipedthrough a culvert to the eastern side between 1949 and the early 1980s. The area onthe west side was then filled for development.
During large storm events when the ICS flow is greater than 500 gpm, the swallow holes inthe SH area cannot pass all the storm flow and therefore a pond forms at the downstreamend of the SH area at the entrance to the culvert which runs under the ICSTF access roadto the QS area. During storms, most of the water entering the QS area enters as surfaceflow through this culvert near the Quarry A Spring. However, some water does still sink intothe swallow holes and emerges at both Quarry A and B Springs.
PCB levels in Quarry A and B Springs have dropped since the EPA built the STF. ThePCB levels in these springs are currently from 0.5 to 2 ppb.
Rinker Spring is a much smaller spring emanating from under the trailer park to the north ofthe Quarry Springs area. Flows in Rinker Spring are typically less than 10 gpm during non-storm conditions. During large storms flow can approach 100 gpm. PCB levels in RinkerSpring are comparable to levels in Quarry A and B Springs.
Quarry C emerges from the ground approximately 200 feet east of the STF access road.Quarry C is an intermittent spring that runs only in wet weather and forms a pond as shownon Figure 3. Dye tracing has shown that Quarry C is not connected with ICS waters andtherefore not influenced by swallow hole water flows. Sampling has shown that Quarry C isnot contaminated. PCB levels in this spring are non-detect at less than 0.1 ppb.
The small stream channels from all four springs eventually combine and flow to the southinto the 36 inch storm water culvert. The combined QS waters currently form the

Remediation Work Plan and Sampling and Analysis Plan 11ICS Soil Remediation and RemovalBloomington, IndianaJuly 2010
headwaters of Clear Creek at the outlet of this stormwater culvert near South AdamsStreet.
When there is blockage at the entrance to the 36 inch storm water culvert, the QS waterscan pond during storm events. The ponded waters have been observed to back up andflow east via a small surface channel towards the intersection of South Adams and ThirdStreet at the rear ofHinkle’sRestaurant.
2.2 Previous Site Investigation Activities
2.2.1 ICS Emergence (EM) Area Previous Sample Results
Table 1 lists the historical PCB soil/sediment sample results for the ICS emergence. Figure4 presents the data showing the locations of most of these samples. The first samplestaken from the ICS emergence area were in February 1982 by the City of Bloomington.The highest PCB levels were 360 ppm from near the ICS emergence.
Since that time, soil/sediment samples have also been taken in 1983, 1991, 1994, 1995,1999, 2004 and 2008.
Note that the pre-1995 soil and the pre-2004 sediment data are listed on the table butnot all shown on the figure. The reasons for this are:
The pre-2004 sediment samples were all taken within 20 feet of the emergence.The possible exception to this is the 1982 sediment samples taken by the City ofBloomington (CBU). The map scale depicting the 1982 CBU data makes it toodifficult to pinpoint the location. Putting all the pre-2004 sediment sample resultson the figure would make it too busy and is unnecessary since they were alltaken at essentially the same location.
The pre-1995 soil data were also taken by the CBU. Again the scale of the mapprovided showing the sample locations makes it difficult to pinpoint their location.
Additionally, in 1995 some soil data was generated using immuno-assay (IA) kits. ThisIA data is listed on the table but not shown on the figure.
The most extensive sampling occurred in 1995 and 2004. The 1995 samples were used toestablish a clean perimeter to site the fence. The fence was conservatively placed basedon those results.
The data show the following:
The flood plain is generally to the east-north east of the main emergence and thePCB levels greater than 1 ppm in the floodplain are generally below an elevation of826 to 827 feet amsl.
PCB levels greater than 10 ppm are generally restricted to active flow channels forspring water or to one particular area of the northwest–southeast oriented valley
The 2004 and 2008 results stand out in that they identify a hot spot in soils with PCB levelsjust over 100 ppm. This hot spot area is to the east of the eroded depression area. It is not

Remediation Work Plan and Sampling and Analysis Plan 12ICS Soil Remediation and RemovalBloomington, IndianaJuly 2010
clear why there would be a hot spot in this area. The two potential conceptual models for ahot spot in this location are preferential settling of storm sediments at this location and/or upflow of contaminated water from underlying conduits during large storm events from whichthe soils could sorb higher levels of PCBs. The Phase 1 EM sample results, as discussedin Section 5.1.2.1, seem to disprove the up flow from underlying conduits theory.Whichever mechanisms are in play, this data showed a need for further delineation of thishot spot especially since this area may be within the final surface water drainage way.
2.2.2 Swallow Hole (SH) Area Previous Sample Data
Table 2 lists the historical PCB soil/sediment sample results for the SH Area. Figure 5shows the locations of the recent relevant data. The first samples taken from the ICSemergence and SH area were in February 1982 by the City of Bloomington. The highestPCB levels at that time were 65 ppm from the extreme northwest corner where the ICSwaters enter the area.
Since that time, soil/sediment samples have also been taken in 1983, 1991, 1994, 1995,1999, 2004 and 2008. The most extensive sampling occurred in 1995 and 2004. Becauseof the sample results obtained by Normandeau Associates at the SH (165 ppm) inNovember 1994 and by Westinghouse in May 1995, the decision was made to fence thisarea.
The 2004 and 2008 sample results are thought to best represent present day conditions. Inthe last ten years since 2000 the clean treated water emanating from the ICSTF has likelyflushed away much of the earlier sediments, especially in the drainage channels. Theaverage PCB content in the stream channel sediments in this area, based on the 2004results, was 34 ppm. While the average PCB level in the flood plain soils in this areabased on the 2004 results, is 8.7 ppm. Generally, the higher levels of PCBs are found inthe small stream channels that contain either the low flow stream or storm overflow. Theflood plain appears to have contamination mostly in the upper 6 inches. Contaminationis limited to elevations below 810 feet amsl which appears to be the limits of the floodprone area.
2.2.3 Quarry Springs Area Previous Sample Results
Table 3 lists the historical PCB soil/sediment sample results for the QS area. Figure 6shows the locations of the recent relevant data. The first samples in this area were taken in1983. There also were soil/sediment samples taken in 1991, 1994, 1995, 1999, 2004 and2008. The most extensive sampling occurred in 1995 and 2004.
The average PCB content in the stream channel sediments in this area, based on the 2004results, was 6.9 ppm. While the average PCB level in the flood plain soils in this area,based on the 2004 results, is 2.9 ppm. There were no PCB samples with results greaterthan 50 ppm in 2004. Generally, the highest PCB levels were found in the stream channelcarrying flow from Quarry A and Quarry B Springs.
The previous results show that the most heavily contaminated materials are found in thestream channel sediments with generally lower amounts of contamination found as youprogress further and higher away from the main stream channel. This pattern ofcontamination is most likely due to a lesser frequency of inundation as you progress higherin the flood plain.

Remediation Work Plan and Sampling and Analysis Plan 13ICS Soil Remediation and RemovalBloomington, IndianaJuly 2010
Reference 5,“Remedial Design/Remedial Action Work Plan Operable Units 2 and 3 Site Groundwater and Sediments, Lemon Lane Landfill Site, Bloomington, Monroe County,Indiana”, CBS, January 2010contains a more extensive discussion of the variousinvestigations that occurred in the ICS areas over the years.
3.0 Project Organization and Administration
3.1 Organizations, Roles, and Responsibilities
CBS Corporation is the corporate entity responsible for implementation of the provisionsof the CDA. The CBS Project Director has overall responsibility for his/her company’s involvement in the project. The CBS Onsite Representative will report to the ProjectDirector. The CBS Onsite Representative will be responsible for implementation andcompletion of the project on behalf of CBS. Other key roles on this project are the SiteRemediation Contractor hired by CBS to execute the work described in the RWP and thegovernment oversight agency. The key roles and personnel are:
Project DirectorCBS Corporation Russ Cepko 412-642-2569
CBS Onsite RepresentativeCBS Corporation Ray Taylor 724-433-7438
Site Health and Safety CoordinatorPSARA Technologies, Inc. Christina L. Whitehead 513-403-2342
Site Remediation Contractor (To be determined)Site Superintendent (To be determined)Transportation Coordinator (To be determined)
Site Sampling LeaderPSARA Technologies, Inc. Scott Spesshardt 513-603-0213
Government AgencyU.S. EPA Region 5 Thomas Alcamo 312-886-7278
Other SubcontractorsAnalytical Laboratory Heritage Environmental Services 317-390-3128
Pace Analytical Services, Inc. 317-875-5894Disposal Sites
TSCA: Heritage Subtitle C Landfill, Roachdale, IN, orEQ Landfill, Belleville, MI.
Special Waste: Southside Landfill, Indianapolis, IN.
3.1.1 Project Director
The Project Director will have overall responsibility to meet the project objectives andquality standards and can commit staff and financial resources to the project as required.The Project Director, or designee, will represent CBS at meetings with the U.S. EPA.

Remediation Work Plan and Sampling and Analysis Plan 14ICS Soil Remediation and RemovalBloomington, IndianaJuly 2010
3.1.2 CBS Onsite Representative
The CBS Onsite Representative will have overall responsibility for all aspects of theremediation project and will report directly to the Project Director. The OnsiteRepresentative or his designee will have direct supervision of the Site RemediationContractor and Site Sampling Leader and will ensure that all remediation activities areperformed in accordance with the RWP and pursuant to the master schedule. TheOnsite Representative or his designee will:
Hold daily project meetings with the remediation contractor and the samplingcontractor to coordinate sampling and water management activities with theexcavation progress.
Document work progress and identify problems or special circumstances tobe addressed by the Project Director.
be responsible for maintaining all field files, project tracking, and
prepare daily and weekly progress reports.
Review and approve Remediation Contractor, Sampling Contractor andDisposal facility invoices
serve as the day-to-day point of contact with the U.S. EPA On-SceneCoordinator (OSC) or his designee
serve as the day-to-day point of contact with the remediation Contractor andSite Sampling Leader.
3.1.3 Site Health and Safety Coordinator
The Site Health and Safety Coordinator (HSC) will have primary responsibility for thedaily implementation of the Health and Safety Plan (HASP) at the site. The HSC orhis/her designee will oversee all health and safety issues associated with excavation, airmonitoring, site inspections, decontamination of equipment and personnel, and materialsleaving the site. The HSC will verify proper training of all site personnel and will havethe authority to require the use of personal protective equipment as outlined in theHASP. The HSC will have stop work authority if methods or practices are unsafe in heropinion. A copy of the HASP is provided in Appendix B.
3.1.4 Site Remediation Contractor
The Site Remediation Contractor will be the corporate entity responsible forimplementation of all work specified in the contract documents. The Site RemediationContractor will report directly to the CBS Onsite Representative or his designee. TheSite Remediation Contractor will be responsible for overseeing all operations related todemolition, excavation, construction, handling, transportation, and disposal of materialsfrom the site. The Site Remediation Contractor will be responsible for ensuring that allwork activities are performed in accordance with the requirements of the RWP and theHASP.

Remediation Work Plan and Sampling and Analysis Plan 15ICS Soil Remediation and RemovalBloomington, IndianaJuly 2010
3.1.5 Site Superintendent
The Site Superintendent will be a member of the Site Remediation Contractor’s staff assigned full time to this project. The Site Superintendent will direct all remediationoperations by the Site Remediation Contractor and will be the day-to-day point of contactfor coordination with the Onsite Representative or his designee. The SiteSuperintendent will be responsible to assign and coordinate all Site RemediationContractor work crews and equipment to complete the scope of work in accordance withthe RWP and master schedule for the project.
3.1.6 Transportation Coordinator
The Transportation Coordinator will be a member of the Site Remediation Contractor’s staff responsible for all operations related to scheduling, loading, transportation, anddisposal of wastes and other materials from the site, including labeling, manifesting, andplacarding waste shipments in accordance with all applicable U.S. Department ofTransportation (DOT) rules and regulations. The Transportation Coordinator willmaintain a daily truck log for each load of TSCA or Special Waste shipped, as describedin Section 7.3.
3.1.7 Site Sampling Leader
The Site Sampling Leader will be responsible for leading and coordinating the variousday-to-day sampling and remediation activities with the Site Remediation Contractor andanalytical laboratory during the project. The Site Sampling Leader will also beresponsible for any water storage and water sampling required and for any supplementalwater treatment required. The Site Sampling Leader will report to the CBS OnsiteRepresentative. The Site Sampling Leader will:
Coordinate and track all soil and water confirmation and delineation samplingon the project.
Responsible for waste water storage, sampling and any supplemental watertreatment system, if required.
Observe and evaluate survey work performed by the Site RemediationContractor.
Observe the progress of the work and evaluate site conditions for compliancewith the provisions of the RWP and the HASP.
Evaluate remediation compliance for personnel air monitoring per the HASP
Perform and track any general or perimeter air monitoring required
Attend daily project meetings to coordinate sampling and water managementactivities with the excavation progress.
Coordinate all soil and water sampling activities with the remediationcontractor
Coordinate sample pickup and overnight sample result reports from the lab

Remediation Work Plan and Sampling and Analysis Plan 16ICS Soil Remediation and RemovalBloomington, IndianaJuly 2010
responsible for maintaining all field sampling and sample result files
3.1.8 Government Agency
The U.S. EPA Remedial Project Manager (RPM) is the U.S. EPA Regional point ofcontact and will represent the EPA in the administration of the CDA. This person, or hisdesignee, will participate in the development of the objectives and requirements of theField Sampling Plans (FSP) for the project and will review all plans, procedures, andverification data developed on this project.
3.1.9 Other Subcontractors
Other subcontractors will be identified as they are selected. Other subcontractors maycontract directly with CBS, the Site Sampling Leader or with the Site RemediationContractor where approved by the Project Director or his designee. Subcontractors willinclude analytical laboratories, trucking firms, soil testing firms, and a host of suppliers.
3.2 Project Meetings and Reporting
3.2.1 Project Meetings
Project meetings will consist of daily meetings between the CBS Onsite Representativeor his designee and the Site Remediation Contractor and Site Sampling Leader. Dailymeetings will be used to review work recently completed and work planned for the day.
Weekly meetings will be held as appropriate with the CBS Onsite Representative, theSite Superintendent (on behalf of the Site Remediation Contractor), the Site SamplingLeader, the EPA OSC or his designee, and other government participants. Weeklyprogress meetings will be held to discuss the overall progress of the work, task-specificproblems or issues that may develop in the course of the project, health and safetyissues including perimeter and personnel air monitoring results, projections ofanticipated progress for the upcoming week, and the overall project schedule. Alsoduring these meetings, CBS will present any recommended changes to this Work Planto the government parties for their approval. The CBS Onsite Representative or hisdesignee will ensure that all issues raised in these meetings are addressed in a timelymanner and that decisions made in the weekly meetings are clearly and conciselydocumented in the weekly progress summary report.
CBS may modify the frequency of these meetings with approval of USEPA inconsultation with the other governmental parties. Telephone calls may be substituted formeetings if agreed upon by CBS and USEPA.
3.2.2 Project Reports
Project reporting will consist of Daily Progress Reports to the CBS Project Director andWeekly Progress Reports to the U.S. EPA OSC. Daily progress reports will consist of abrief narrative of the day’s activities and will be issued electronically to the Project Director. Weekly progress reports will be a summary of work completed for the weekand will address problems encountered and the overall schedule for the project. Thereport will be distributed electronically to the Project Director and their oversight staff, theSite Remediation Contractor, and the OSC or his designee.

Remediation Work Plan and Sampling and Analysis Plan 17ICS Soil Remediation and RemovalBloomington, IndianaJuly 2010
3.3 Project Schedule
The schedule for completing this work involves a sequence of interrelated critical-pathtasks. The Cleanup of the ICS Emergence, Swallow Hole and Quarry Springs Areasand the installation of the new effluent line must be completed by December 19, 2010,pursuant to the schedule in the CDA (Reference 1). Figure 7 provides a proposedproject schedule for the remediation and site restoration activities. The remediationproject described in this Work Plan is to be initiated in mid-July 2010 and completed inmid-September 2010. This remediation project will be completed by mid-September,2010 to allow the ICSTF plant expansion to begin.
The schedule in Figure 7 also shows the EM area being completed by the middle ofAugust. It is desired to have the EM area remediation completed before ICSTFrefurbishment work in the ICSTF SRS sump begins.
The initiation of the excavation in the Swallow Hole and Quarry Springs area will becontingent upon the completion of the installation of the new Effluent Line from theICSTF which is separate from this project. The new Effluent Line will divert the plantdischarge and clean storm water bypass from the Emergence area around the SH andQS areas, allowing the remediation to be done without the risk of flooding. Storm watercan collect locally, though, and will be handled separately. The EM/SH/QS remediationwill be done during the dry summer conditions to minimize water handling and localflooding problems.
Also, as part of the Effluent Line installation, and therefore before the EM/SH/QSremediation, the pathway of the new effluent line through areas of contamination withinthe Swallow Hole and Quarry Springs areas will be verified clean to the full depth ofinstallation or to the top of bedrock.
The selected Site Remediation Contractor will provide his own schedule during thebid/contractor selection phase of the project. However the contractors schedule will berequired to show the EM area completed by mid-August and the SH and QS areas doneby mid-September. The CBS Onsite Representative or his designee will be responsiblefor tracking the progress of those activities.
4.0 Remedial Objectives
The CDA contains remedial action objectives (RAOs) for this project. The RAOsprovide a general description of what the cleanup will accomplish. Under USEPAguidelines, the continuing release of PCBs from the ICS spring system connected to theLLL has produced unacceptable risks to human health and the environment. Accordingto the CDA, the RAO’s for operable unit three (sediments) is to reduce the amount of PCB mass in sediments that may be released to Clear Creek.
4.1 Cleanup Criteria
For the soil and sediment remediation at the ICS emergence, Swallow Hole and QuarrySprings areas there are two sets of cleanup criteria per the CDA, one for finaldrainageway areas and one for non drainageway areas.

Remediation Work Plan and Sampling and Analysis Plan 18ICS Soil Remediation and RemovalBloomington, IndianaJuly 2010
The cleanup criteria will include both not-to-exceed values for individual delineation,verification or stockpile sample results and separate averages for individual drainageways and non-drainage way areas. Separate non-drainage way and drainage wayaverages will be calculated for each area, EM, SH and QS.
The non-drainageway average will include verification sample results and delineationresults representing soils remaining within an area within any grid where PCBs weredetected. Delineation and verification sample results for stockpiled materials returnedas backfill within an area will also be included in the non-drainageway averagecalculation.
The drainage way average will be determined by the results of the composite surfacesamples taken along the surface of the final drainage channel after it is constructed.Delineation sample results are not to be used in the drainage way average, only the finalcomposite samples.
4.1.1 Final Drainageway Criteria
The cleanup criteria are 1 ppm PCBs on average with a not-to-exceed of 5 ppm PCBs infinal drainage ways. Final drainage ways will be constructed in each of the three areasand sampled separately from the general non-drainage way grids shown in the figures.
4.1.2 Non-Drainageway Criteria
The cleanup criteria in non-drainage way areas are 5 ppm PCBs on average with a not-to-exceed concentration of 10 ppm.
5.0 Technical Approach
There are 3 separate work areas to be remediated under this plan, the ICS EmergenceArea (EM), the Swallow Hole Area (SH) and the Quarry Springs Area (QS). Figure 3shows the relationship of the three areas. The EM area is separated from the other sitesby active railroad tracks and therefore will require separate access.
After remediation, the ICS emergence area will continue to contain the contaminantsource (i.e. the ICS Spring Emergence) and therefore access to this area will continue tobe controlled. However, it is anticipated that the final fenced foot print will be reduced.The site features which will continue to be within the final fence line are:
The small stream channels directly fed by the ICS spring A new French drain through the area of the erosion driven depressions ICSTF plant intake structures and storm water bypass intake area The lower portion of the site access road and parking area The steep hillside to the west which will contain a new rip rap drainage channel the steep railroad berm to the south of the emergence
It is proposed that the cleanup goals will not be applied to certain portions within the finalfenced area of the ICS emergence such as active stream channels, because continuingcontamination from active sources to this area will continue for the foreseeable future.Also final grading will be such that any water draining over these possibly contaminatedareas will be collected and sent to the ICSTF for treatment. The area around the newFrench drain will be maintained within the fence line but will be cleaned up and graded to
Remediation Work Plan and Sampling and Analysis Plan 19ICS Soil Remediation and RemovalBloomington, IndianaJuly 2010
drain toward the clean storm water bypass area. Figure 14 shows the proposed finalfence line at the ICS emergence area.
This remediation will be done in the summer in dry conditions to minimize floodingproblems. The general sequence of events in each area will include:
Clearing and grubbing Establishing a grid to determine excavation boundaries Removal of soils and sediments Confirmation of clean bottoms Backfilling with clean soils and grading to establish final drainage ways
5.1 Pre-Remediation Activities
5.1.1 Clearing
The Swallow Hole and Quarry Springs areas are heavily vegetated. General Siteclearing of all three areas occurred before mobilization for excavation. Clearing wasperformed in early spring before the growing season became established, to allow easieraccess and to limit the amount of clearing required. To minimize spreadingcontaminated soils the sites was cleared without pulling up large root balls. Brush andtrees were cut off just above ground level. The brush and small trees were chipped andshredded and set aside for reuse as mulch during site restoration. Large trees were cutdown and stacked or left standing and will be worked around if not in a final drainageway. Stacked trees will be chipped later.
The Quarry Springs area was initially cleared sufficiently to allow access for delineationsampling and to allow equipment access for installing the new effluent line. Once thesampling results showed the areas that will be excavated, general clearing wasperformed as required. This clearing also occurred before mobilization for excavation.Some additional clearing may occur after mobilization as required for the site setup.
In the Emergence area, general clearing over the French drain installation area and overthe grids that are determined to require excavation based on the delineation samplingwas performed before mobilization for excavation. Again, some additional clearing mayoccur after mobilization as required for the site setup.
In the SH and QS areas, stretches of the creek channel that are suspected to have deepsediments were probed to determine the depths.
5.1.2 Delineation Grid Sampling
Phase 1 delineation grid sampling occurred in the Emergence Area from March 15 to 17,2010. Phase 2 sampling in the EM area occurred on April 1, 2010. Sampling wasperformed according to the approved Emergence Area SAP (Reference 4).
Delineation grid sampling according to this Work Plan / SAP started in the QS Area onApril 28 to 30, 2010 and in the SH Area on May 20 to 24, 2010 and was completed onJune 10, 2010.

Remediation Work Plan and Sampling and Analysis Plan 20ICS Soil Remediation and RemovalBloomington, IndianaJuly 2010
5.1.2.1 Emergence Area Delineation Sampling
During the week of March 15, 2010 the Phase 1 delineation sampling grid was laid out inthe Emergence Area as shown on Figure 12. The general Emergence Area wassegregated into 30 foot grids and samples were taken in 6 inch intervals down to 12inches. In the area of the local depressions and the known hot spot area where the2008 samples were over 100 ppm, the grid size was reduced to 15 feet and the grabsamples were taken in 12 inch intervals to bedrock. All samples from the surface to 3feet deep and the sample at bedrock were analyzed. The samples in between, if any,were archived. Table 4 shows the Phase 1 sample results.
Table 4 and Figure 13 show that only surface contamination from 0 to 1 foot depth wasfound. Eight of the 15’x15’ ED grids are shown to be contaminated above the non-drainage way cleanup criteria of <10 ppm. Six of these contaminated grids are on thePhase 1 grid layout perimeter. Therefore according to the EM SAP, new step out gridswere established and sampled to establish a clean perimeter next to the contaminatedgrids.
Figure 12 shows the six new Phase 2 perimeter (step out) grids that were added andsampled according to the EM SAP (Reference 4). Core samples from 0 to 1’ wereanalyzed from the center of each of these six grids. Table 4 shows all the results werebelow the cleanup criteria, thereby establishing a clean perimeter.
5.1.2.2 Quarry Springs Area Delineation Sampling
Initial delineation grid sampling in the QS Area occurred on April 28 to 30, 2010, after theinitial version of this plan was issued to the USEPA. Sampling was performed accordingto the SAP included in Appendix A. Additional delineation sampling occurred during theweek of May 17 and on June 9, 2010. The general area was segregated into 63 grids asshown in Figure 16 and samples were taken in 6 inch intervals down to a clean bottom.Perimeter grids were added as required to establish a clean perimeter.
Twenty foot grids were positioned at the exit of the Quarry A culvert to determine soilthat would need to be removed to replace the culvert. Three samples, DEX01 thru 03,were taken at the inlet and outlet of the new Quarry A culvert and at the new effluent lineoutlet into the southern Quarry Springs area to determine if soil would need to beremoved to install the new Quarry A culvert and the Effluent Line.
Results of the delineation sampling are shown in Figure 16 and listed in Table 5. Ninegrids were found to contain PCB content greater than the non-drainage way criteria of>10 ppm. One grid, Z4, near the Quarry A outlet, contains PCB >10 ppm down to adepth of 18 inches. Figure 16 also shows 2 grids, J7 and K7, within the Quarry C pondthat contain PCBs over the drainage way limit of 5 ppm at the surface. Three grids, J2,A6 and B6, through which the final drainage way channel will run contain PCB results>5ppm, but < 10 ppm, in the 0-6” or 6-12” intervals.
Figure 16 and Table 5 show that no TSCA material was discovered in the QuarrySprings area and a clean perimeter and clean bottom were determined around all thecontaminated intervals.

Remediation Work Plan and Sampling and Analysis Plan 21ICS Soil Remediation and RemovalBloomington, IndianaJuly 2010
5.1.2.3 Swallow Hole Area Delineation Sampling
Delineation grid sampling in the SH Area occurred on May 20 to 24 and again on June10, 2010. The SH area was initially segregated into thirty foot grids below the 810 ftamsl elevation which was historically shown to be the extent of the flood plaincontamination (see Figure 5). Samples were initially taken in 6 inch intervals down to 12inches. During the phase 2 sampling on June10th, deeper samples were taken in 6 inchintervals where required to establish a clean bottom.Perimeter half grids, 15’ x 30’, were also added as required to establish a clean perimeter.
A total of 81 grids were sampled in the SH area as shown in Figure 15. Table 6 showsthe results of the delineation sampling. Eight grids were found to contain a total of 117cys of TSCA material (>50 ppm). Nineteen grids were found to contain material withPCB content between 10 and 50 ppm. This material will be excavated and disposed ofas low-level PCB Special Waste. Six grids through which the final drainage way channelwill run contain PCB results >5 ppm, but < 10 ppm, in the 0-6” or 6-12” intervals. This soil will be excavated across the width of the final drainage channel plus 2 additional feeton each side and repositioned outside of the channel.
Of 32 SH grids requiring excavation, 25 grids require excavation 6” deep, 6 grids require excavation 12” deep, and one grid,L4, contains Special Waste to 18” deep.
As shown in Figure 6, four additional subsurface samples are required to complete theSH delineation, SH-M4-1.0-2.0, L3-1.0-1.5, L5-1.0-1.5 and B10-0.5 to 1.0. These are allin grids with a clean surface and that are currently not to be excavated. The adjacentinterval in the next grid over is above the clean criteria and will therefore be excavated.
Instead of mobilizing a sampling team to the site to obtain only 4 samples, these final 4delineation samples will be obtained when mobilization for the excavation occurs.
5.1.3 New ICSTF Effluent Line
The ICSTF currently discharges treated water into the existing creek channel in the SHarea as shown in Figure 15. The storm bypass from the clean side of the EM area isalso currently directed to the existing SH area creek channel. More contaminated ICSwater previously flowed through the existing SH and QS creek channels before theinstallation of the ICSTF.
The CDA requires that the ICSTF discharge line be enclosed and routed through oraround the SH and QS area to prevent future ICSTF discharge water from sinking intothe swallow holes. This will prevent re-contamination of the clean plant dischargewaters by contaminated sediments in the subterranean conduit system connected to theswallow holes.
As indicated above, mobilization for excavation of the SH and QS areas will becontingent upon the installation and operation of the new Effluent line. This will allow theICSTF discharge and EM storm water bypass to be routed around the SH and QSexcavation areas. The new effluent line will bypass the SH and QS areas and carry theICSTF discharge directly to the existing 36 inch storm water culvert that runs underAdams St from the QS area as shown on Figure 9.

Remediation Work Plan and Sampling and Analysis Plan 22ICS Soil Remediation and RemovalBloomington, IndianaJuly 2010
The Effluent Line routing was changed from south of the SH to north of the SH area dueto the amount of bedrock removal required. As shown in Figure 9 the new Effluent lineenters the southern end of the QS area near the entrance to the existing 36 inch culvert.The pathway for the new effluent line into the QS area was sampled during the QSdelineation and found to be clean. Sample DEX03 was 0.98 ppm. Therefore the areawhere the new Effluent Line enters the QS area does not require remediation before theEffluent Line is installed.
5.1.4 New Quarry A Culvert
When the new Effluent Line is installed between the QS and SH areas it will cross themain plant access road. At the same time that this effluent line is installed across theplant access road, a new deeper culvert for Quarry A will be installed under the plantaccess road to prevent flooding on the SH side entrance to the culvert. The new culvertwill be 2.7 ft lower than the existing culvert so that the new drainageway will be abovethe invert elevation of the QA culvert, (803 ft amsl) and therefore water will not pond atthe entrance to the culvert.
This work is also part of a separate project.
5.2 Mobilization and Site Setup
The schedule in Figure 7 shows that the EM area will be prepared for excavation first, asthe new permanent plant effluent line is being completed at its US end, between theICSTF and SH area. Initially any additional clearing and grubbing required in the EMarea will be performed. Then access roads will be built and stockpile areas and load outareas prepared for the EM area. The site preparation crew will then move on to the QSArea as excavation begins in the EM area. The SH area will be prepared after the QSarea.
Figure 8 shows a conceptual site setup for the remediation. Stockpile areas for the threeareas are designated in the eastern section of the EM area, to the north and south of theSwallow Hole area and in the southwestern part of the QS area as shown on Fig 8. Asite access road will be constructed along the southern perimeter of the SH samplinggrid connecting to the ICS plant access road. An access road for the QS area will bebuilt from the ICS plant access road as shown in Fig 8. For the EM area a stockpile areaand the separate access road turn around will be located as shown in Fig 8.
Frac tanks will be set up in front of the ICSTF as shown in Figure 8. As discussed inSection 8.0, storm water from the open excavations will either be pumped directly intothe ICSTF inlet sump for treatment or collected in frac tanks and pumped into the ICSTFinlet sump when capacity allows.
5.3 Soil Removal Approach
5.3.1 Emergence Area
This area will be accessed separately from the SH/QS area by the existing EM accessroad shown in Figure 12. The emergence soils and sediments above the non-drainageway cleanup goal will be removed with earth moving equipment such asbackhoes and/or track excavators. Storm water diversion berms, silt fences and/or hay

Remediation Work Plan and Sampling and Analysis Plan 23ICS Soil Remediation and RemovalBloomington, IndianaJuly 2010
bales will be used during construction to minimize the impact of storm water drainagedown the valley.
Recent grid sampling results per the grid system shown in Figure 12 are shown in Table4. Figure 13 shows the grid layers that will be removed based on the sample results.
Table 4 and Figure 13 show that only surface contamination from 0 to 1’ depth was found in any of the sampling grids. Eightof the 15’x15’ ED grids are shown to be excavated from 0 to 1’for disposal. Two of the grid layers comprised of approximately30 ton of soil are above 50 ppm and will therefore be disposed of as TSCA. Six gridlayers comprised of approximately 90 ton are between 10 and 50 ppm and will bedisposed of as Special Waste.
Three grids are shown to be excavated from 0 to 1’ and stockpile sampled to confirm their PCB content. These grids contained 2008 sample results up to 130 ppm at thesurface, as shown in Figure 4. The recent Phase I results for these grids were all <5ppm. It may be that the surface contamination was flushed away by storm water flow inthe last couple years. In any case, because of the inconsistency, the 25 cubic yards of 0to 1ft surface layers in these 3 grids will be stockpiled and sampled per the stockpilesampling procedure in Section 6.4. The stockpile material will be disposed of or reusedas backfill based on the stockpile results.
Figure 12 shows six new Phase 2 perimeter (step out) grids that were added andsampled according to the EM SAP (Reference 4). They were all below the cleanupcriteria and therefore established a clean perimeter next to the contaminated grids.Areas within the new proposed fenceline which drain to the ICSTF inlet will not beremediated.
All the grids will be excavated one foot as required to meet the <10 ppm NTE / <5 ppmaverage criteria based on the grid sample delineation results. The 1 to 2’ depth delineation sample in each of eleven Phase 1 grids excavated to a one foot depth meetsthe non-drainageway clean up standard. However 10% of the grids excavated fordisposal will be re-sampled for verification per Section 6.0. The grids selected forverification will be those containing the highest PCB content to be excavated. Therefore,since 8 grids will be excavated for disposal in the EM area, the resulting surface in onegrid, grid ED-22 at 98.9 ppm, will be confirmed clean with a post-excavation verificationsample taken per Section 6.2.
Clean stockpile soils, if any, may be set aside and reused as backfill based on itsdelineated PCB content. During backfilling and grading the clean overburden will beplaced in a drainage way or non-drainage way according to the delineated PCB result.
After the French Drain is installed as discussed below in Section 5.3.1.1, the FinalDrainage Channel will be roughed in as shown in Figure 14. The 6 foot wide path of thedrainage channel as shown in Figure 14 will then be laid over the general grid systemshown in Figure 12. Where the drainage channel crosses any grid which contains PCBlevels between 5 and 10 ppm, the drainage way dirt plus 2 additional feet on each sidewill be removed to be placed as backfill in a non-drainage way area. Clean imported fillor dirt from grids with low sample results will be used to construct the drainage way, ifadditional fill is required.

Remediation Work Plan and Sampling and Analysis Plan 24ICS Soil Remediation and RemovalBloomington, IndianaJuly 2010
Figure 12 shows that the path of the Final drainage way channel is preliminarily plannedto traverse grid DW-7. Table 4 shows the PCB content of the 0 to 6” layer is 7.04 ppm. Therefore if the final location of the drainage way channel is through DW-7, the 6” surface soil will be removed across the full 6 foot width of the channel plus 2 additionalfeet on each side for the full length of DW-7. The 6 to 12” sample in DW-7 is 3.27 ppmwhich meets the drainageway NTE limit of 5 ppm.
Grids 6' wide by 50' long will be set up along the constructed channel. Surface grabsamples will be taken per Section 6.3 and composited to verify the <5 ppm NTE / <1ppm average in the drainage way is achieved. If the average is above 1ppm, the gridlayers with the highest PCB content (between 1 and 5 ppm) will be removed andreplaced with clean fill until the average is less than or equal to 1 ppm.
5.3.1.1 French Drain Installation
After contaminated soil/sediment removal, and before the final drainage way is installed,the top of rock will be exposed in the area of eroded depressions. A perforated drainpipe network surrounded with gravel (French drain) will be constructed at the top of rockleading to the spring emergence to allow storm water which may emerge from the top ofrock to flow into the spring emergence area without eroding additional soils.
After the French drain is constructed, a stabilization fabric will be placed over the drain.The drain will be backfilled with clean soil to match surrounding grade. Thereconstructed area will then be sloped and bermed if necessary to allow storm surfaceflows from clean areas of the natural valley to bypass the ICS collection area and flow tothe existing clean storm water bypass collection culvert. Figures 10, 11a and 11b showthe French Drain layout and details.
After the French drain installation is complete the final constructed drainage way will befinish graded and sodded.
5.3.2 Quarry Springs Area
As indicated above, the new permanent plant effluent line will have been installed andwill be in operation before the QS excavation is started. This will divert the plantdischarge and the clean emergence area storm water bypass from the QS area to preventflooding during excavation.
In both the 2004 and 2010 sampling events, all soil PCB results in the QS area werebelow 50 ppm with the arithmetic average at less than 5 ppm. The highest valueobtained was 48 ppm. The highest PCB values were within the existing streamchannels with much lower values in the flood plain between the stream channels andnear the opening to the existing 36 inch culvert.
The delineation sampling grids shown in Figure 16 were sampled according to the SAPcontained in Appendix A of this plan. Results of this sampling are shown in Figure 16and listed in Table 5. The delineation sample results as shown in Figure 16 will guidegrid excavation.
Upon mobilization, excavation of the area will begin from the clean perimeter proceedinginward. The flood plain soils will be removed based on the grid sample results ascompared to the non drainage way criteria. Six grids were found to contain PCB content

Remediation Work Plan and Sampling and Analysis Plan 25ICS Soil Remediation and RemovalBloomington, IndianaJuly 2010
>10 ppm in onlythe 0 to 6” interval. Two grids at the Quarry A spring culvert outlet werefound to contain PCBs >10 ppm in the 0 to 12” intervaland one grid, Z4, near the QuarryA outlet, contains PCB >10 ppm down to a depth of 18 inches. These grid intervals willbe excavated and disposed of as low level PCB Special Waste.
Figure 16 also shows 2 grids within the Quarry C pond that contain PCBs over thedrainage way limit of 5 ppm. These full grid intervals will be removed to 6” and repositioned outside of the pond or final drainage way. Three grids, J2, A6 and B6,through which the final drainage way channel will run contain PCB results >5ppm, but<10 ppm, in the 0-6” or 6-12” intervals. This soil will be excavated across the width ofthe final drainage channel plus 2 additional feet on each side and repositioned outside ofthe channel.
As with the Emergence and Swallow Hole areas, 10% of the excavated grids are to besampled for verification. Since 8 grids are to be excavated, one grid will be sampled forverification. The grid containing the highest PCB content to be removed is grid A5 at34.9 ppm, as shown in Table 5. Therefore this grid will be re-sampled for verificationafter it is excavated one foot.
To prevent driving on dirty surfaces and spreading contamination, the excavationprocess will work from a clean perimeter and work inward. Each contaminated perimetergrid will be excavated from the clean area outside the perimeter. All grid excavation perdelineation sample results, and any required confirmation sampling and re-excavations willbe completed in a grid before excavation equipment is permitted to drive onto the surface ofthe cleaned grid to perform the creek excavation or access the next adjacent dirty grid.
The width of all of the existing drainage channels will be scraped to bedrock and the removedsoils will be stockpile sampled to determine final disposition. It is anticipated that anycontaminated soils will be sent to a non-TSCA landfill. Areas of the creek channels with deepsediments, such as in the Rinker and Quarry A spring branch, may not be excavated all theway to bedrock but only to a clean surface as shown by final drainage way samplingaccording to Section A.3.3.
After the excavation and stream scraping are complete, the pathway for the newdrainage way will be laid out. It is anticipated that the path will follow the existingchannel stream channels fed by the QS spring flows as shown on Fig 18.
Pre-remediation work involved:
Initial clearing as required for sampling access. Laying out the 30 foot grid system over the floodplain area as shown on Fig 16. The gridded area within the Quarry Springs area is about 1 acre. Figure 16 shows
the grid layout that was sampled and the grids that will be excavated as a result ofthat sampling.
The area around the grids to be excavated and along the creek channels wascleared. Vehicles that were used were light enough to not disturb the surface soilmore than 6” deep.The brush and small trees were chipped and set aside for reuseas mulch. Larger trees were cut and will be set aside or left standing and will beworked around if outside of existing or final drainage channels. Stacked trees willbe chipped later.

Remediation Work Plan and Sampling and Analysis Plan 26ICS Soil Remediation and RemovalBloomington, IndianaJuly 2010
The remediation excavation will involve:
After mobilization, perform any additional clearing required. Route a temporary clean access road to the grids to be excavated as shown in
Figure 16. Keep the access road on clean material, taking into account the surfaceslope and creek beds.
Prepare a stockpile area and loadout pile as shown in Figure 8. Dam the new culvert that runs from the Swallow Hole (SH) area under the ICSTF
access road to the QS area to minimize storm flows from Quarry A (QA) spring. Berm around the existing swallow holes in the SH area to contain surface water
within the SH area to minimize storm flows from QA and Quarry B (QB) springs fromthe re-emerging swallow hole waters.
Install sumps and divert spring flows from the QS springs as required. Contain and pump or divert Quarry A spring flows to the sump at the
downstream end of the Quarry A existing flow channel.o Assume <3 gpm normal flow / up to 20 gpm storm flow with SH area
flows dammed off. (Flows would be up to 250 gpm during storms if theSH water was allowed to sink in swallow holes and thru QA culvert.)
Install a sump at the Rinker Spring emergence Contain and pump or divert Rinker spring flows to the sump at the downstream
end of the Quarry A existing flow channelo Assume 3 to 5 gpm normal flow.o Assume up to 50 gpm storm flow.
Remediate grids to the <10 ppm limit up to and across the Quarry A existingdrainage channel.
o As the grids are scraped, 10% confirmation sampling will be performed,with results expedited for next morning delivery. The underlying residualsurface will be sampled for verification per Section 6.2.
o Contain rain water collected in any disturbed grid that requiresconfirmation sampling until it is shown to be clean. Pump thecontained water directly to the ICSTF SRS sump or stage in frac tanksfor treatment.
o Prevent water from grid excavations that require confirmation samplingfrom flowing into existing creek channels and on downstream until thegrid is confirmed clean.
Once the grids containing the existing Quarry A creek channel are confirmedclean, backfill up to and around the creek channel if required to contain stormwater within the creek channel during the channel scrape.
Straddle the creek channel, if possible, with the excavator on clean surfaces andscrape it to bedrock or to a confirmed clean bottom, starting at the US end.
o Scraped materials will be stockpiled and sampled per Section 6.4 todetermine final disposition.
o Contain rain water collected in the disturbed section of the existing creekchannel for treatment.
o Contain rain water falling on stockpiles until they are confirmed clean. Build the final constructed drainage channel including the rip rap spillway per
Figure 18 with clean soil for sidewalls and bottom (where required) thru theexisting Quarry A creek channel that will be reused for the new final drainagechannel.

Remediation Work Plan and Sampling and Analysis Plan 27ICS Soil Remediation and RemovalBloomington, IndianaJuly 2010
o Remove soils in grids A6 and B6 with PCBs between 5 and 10 ppm forthe width of the final drainage channel plus 2 additional feet on each sideand reposition outside of the drainage way.
o Confirm per Section 6.3 that the new constructed channel is clean fromthe QA emergence to the existing channel from Quarry C (QC).
o After confirmed allow water from QA to run thru the new final QA drainagechannel to the intersection with the existing creek channel from QC.
Remediate grids to the <10 ppm limit up to and across the Rinker Spring existingdrainage channel controlling storm water as above.
Once the grids containing the existing Rinker creek channels are confirmedclean, straddle the creek channel and scrape and stockpile the creek bed tobedrock or to a confirmed clean bottom, starting at the US end.
Build the final constructed drainage channel with clean soil for sidewalls and bottom(where required) in the section of the existing Rinker creek channel that will be reusedfor the new final drainage channel, to the intersection with the final QA drainagechannel.
o Confirm the new constructed channel is clean. Allow the water from Rinker Spring to flow through the new Rinker and QA final
drainage channel to the existing drainage ditch Excavate the remainder of the contaminated grids to the east of the QA final drainage
channel and south to the QC spring.
Dig a sump at QC spring or use the existing pond as a sump to collect the flow fromQC.
o Assume minimal flow, <1 gpm Pump water from QC sump to existing drainage ditch past the intersection with QA
final drainage channel Excavate grids K7 and J7 to 6” and placeoutside of pond or drainage channel. Scrape from QC pond or sump to intersection with QA final drainage channel.
o Contain rain water collected in the disturbed section of the existing creekchannel for treatment.
Build final constructed drainage channel with clean soil for sidewalls and bottom(where required) from the QC emergence to the intersection with the QA finaldrainage channel.
Confirm the new constructed channel is clean.
Dig a sump at the intersection of QA and QC final drainage channels and pump waterdirectly to the 36” culvert
Dig a sump at QB and pump water directly to 36”culvert o Assume <3 gpm normal flow / up to 20 gpm storm flow if Westplex and SH
flows are diverted.o Assume up to 250 gpm storm flow if Westplex flows enter QB.
Scrape channel from the sump at the intersection of QA and QC final drainagechannels to the 36” culvert.
Take care to not damage the outlet of the new effluent line at the entrance to the 36” culvert.
Scrape the channel from QB to meet the channel from the intersection of QA and QC Build final constructed drainage channel with clean soil for sidewalls and bottom
(where required) from the QC/QA intersection sump and from the QB sump to the36”culvert.

Remediation Work Plan and Sampling and Analysis Plan 28ICS Soil Remediation and RemovalBloomington, IndianaJuly 2010
o Remove soils in grid J2 with PCBs between 5 and 10 ppm for the widthof the final drainage channel plus 2 additional feet on each side andreposition outside of the drainage way.
Confirm the new constructed channel is clean. If the average is above 1ppm, the grid layers with the highest PCB content
(between 1 and 5 ppm) will be removed and replaced with clean fill until theaverage is less than or equal to 1 ppm.
After the final constructed drainage way is confirmed clean, it will be finishgraded and sodded.
Extend the riprap spillway from the Effluent line outfall to the inlet to the 36” culvert as shown on Figure 18.
Open all the sumps and allow flow through the new drainage channels fromQA/QB/QC/ and Rinker springs.
Excavate any remaining contaminated grids. Backfill and final grade the flood plains to drain to the final constructed drainage ways. Restore and seed the flood plains.
5.3.3 Swallow Hole Area
After the Quarry Springs area is remediated, the swallowhole area will be excavated.Site clearing and site preparation activities, such as building access roads and preparingstockpile areas will have been done previously as shown on the schedule in Figure 7.
The swallowhole area was heavily overgrown, flood prone and consistentlycontaminated within the stream channels and the flood plain up to an elevation of about810 feet amsl. The ICSTF currently discharges treated water directly into the existingcreek channel in the SH area as shown in Figure 3. The storm bypass from the cleanside of the EM area is also currently directed to the SH area.
As indicated above, the new Effluent line and new Quarry A culvert will be installedunder a separate project before remediation of the SH area. The SH area was alsocleared before mobilization for remediation.
The Swallow Hole grid area has been delineated for excavation. The 81 full and partialdelineation sampling grids shown in Figure 15 were sampled during the week of May 17and on June 10, according to the SAP contained in Appendix A of this plan. Results ofthis sampling are shown in Figure 15 and listed in Table 6. The delineation sampleresults as shown in Figure 16 will guide grid excavation.
Upon mobilization, excavation of the area will begin from the clean perimeter proceedinginward. The flood plain soils will be removed based on the grid sample results ascompared to the non drainage way criteria.
As with the Emergence and Quarry Springs areas, 10% of the excavated grids are to bere-sampled for verification. Since 27 grids in the SH are to be excavated for disposal, 3grids containing the highest PCB content next to the residual surface will be sampled forverification after they are excavated, grids E9, O3 and P3.
Two 50 foot long segments of the existing creek channels were found to be TSCA duringthe 2004 sampling. These will be scraped 1 foot deep and disposed of as TSCA. The

Remediation Work Plan and Sampling and Analysis Plan 29ICS Soil Remediation and RemovalBloomington, IndianaJuly 2010
residual surface layer will be sampled per Section 6.3 and confirmed to be below theTSCA limit. After the TSCA is removed the remaining existing creek channels will bescraped, stockpiled and sampled per Section 6.4 for final disposition. The upstreamdrainage channel to the main swallow holes will be scraped to bedrock and stockpiled.The overflow channels, as shown on Figure 15 will be scraped to 6 inches, stockpiledand sampled for disposition. The residual creek surfaces will be sampled per Section6.3 to verify they meet the cleanup criteria.
To prevent driving on dirty surfaces and spreading contamination, the excavationprocess will work from a clean perimeter inward like the QS area.
Pre-remediation work involved:
Clearing the area entire area below an elevation of 810 feet amsl manually or bymeans that would minimize surface disruption. Vehicles used were light enough tonot disturb the surface soil more than 6” deep.The brush and smaller trees werechipped and set aside for reuse as mulch. Larger trees were cut and set aside forstacking or future chipping or left in place and will be worked around.
The remediation excavation will involve:
After mobilization, perform any additional clearing required. Route a temporary clean access road along the southwest perimeter as close to the
perimeter line as possible, taking into account the surface slope as shown on Figure15.
Prepare a stockpile and load out area as shown in Figure 8. Re-establish the grid system as shown on Figure 15 for excavation. Dam the new culvert that runs from the SH area under the ICSTF access road to the
QS area, if not already done. Berm around the existing swallow holes, if not already done, to contain surface water
within the excavation area for collection and treatment. Excavate grids above the non-drainageway cleanup level as determined by the
delineation sampling. Start excavation along the southwest perimeter while keepingexcavators and haul trucks always on a clean surface outside the southwestperimeter line. There are more than 18 - 30’ grids along the southwest perimeter.
10% of the excavated grids, as indicated above, will have confirmation samplingperformed, with results expedited for next morning delivery. The underlying residualsurface will be sampled for verification per Section 6.0.
Re-scrape grids that do not pass the non-drainage way criteria an additional 6”.Equipment will not be permitted on a verified grid until confirmation samples verify itis clean.
The area below 810’ is about 1 acre.Fig 15 shows about 81 - 30’x30’ gridsandpartial grids of which 26 will be excavated for disposal.
Once a perimeter grid is excavated and verified clean, if required, the excavator canbe moved onto it to scrape the existing creek channels or to access adjacent grids tothe northeast, working from clean inward.
Excavate two 50’ TSCAcreek segments 1’ deep, as shown on Figure 15. After the US TSCA creek segment is removed the remaining US drainage channel
(green and red on Figure 15) will be scraped to bedrock (320’lg) and stockpilesampled. Possibly stream lengths with thicker sediments, such as the upstream

Remediation Work Plan and Sampling and Analysis Plan 30ICS Soil Remediation and RemovalBloomington, IndianaJuly 2010
grids, B9, C9, and D9, will be scraped to a confirmed clean bottom per Section 6.3rather than to bedrock
After the DS TSCA creek segment is removed the existing overflow channels (blueon Fig 15)(760’lg) will be scraped 6” and stockpiled. Channel bottoms and stockpiles will be confirmed per Section 6.0.
Areas of the creek channels with deep sediments may not be excavated all the wayto bedrock but only to a clean surface as shown by final drainage way verificationsampling per Section 6.3.
Stockpile sample results will determine whether to dispose of creek channel soilsas TSCA or special waste, or to reuse them as backfill. Based on 2004 sampleresults, it is anticipated that most of these materials will be disposed of in a non-TSCA landfill.
After all soils are removed, the 8 swallowholes as shown on Fig 15 will begrouted. Swallowholes will be excavated toa 5’x5’ bedrock surface. A groutplug will be placed in any apparent bedrock openings to seal them. A groutlayer will be applied to the bedrock surface. The scraped material will bestockpile sampled for disposition.
The swallowholes willthen be backfilled with compacted clay in 12” lifts. The new drainage channel will be constructed as shown in Figure 17 to the new
culvert leading to Quarry A. Soils will be removed in grids that the final drainagechannel runs through that have PCBs between 5 and 10 ppm, as shown onFigure 15. Soils will be removed for the width of the final drainage channel plus2 additional feet on each side and repositioned outside of the drainage way.
The bedrock surface can be used as the bottom of the new drainage channelwhere possible, however a downward slope will be maintained to prevent poolsfrom forming in the final channel. Only clean backfill from offsite or onsite soilsthat are known to meet the drainage way criteria will be used for the newdrainage channel sidewalls and bottom, where required.
Final fill and grading will be done per Figure 17. After the Final Drainage Channel is built obtain and analyze verification samples
in the SH channel per Section 6.3. Remove and replace any soils that do not meet the drainageway criteria of NTE
5 ppm / 1ppm average max. After the final drainage way channel is confirmed clean, sod the sidewalls and
the bottom if it is not on bedrock. Open the culvert to the QS area for surface drainage. Restore and seed the final graded surfaces.
6.0 Delineation and Verification Sampling and Reexcavation
Extensive delineation sampling has been performed in these three areas over the years,as indicated in Section 2. The lateral extent of contamination has generally beenestablished in each flood plain area. During this project various forms of additional soilsampling and analysis will be performed. The EM, SH and QS areas were furtherdelineated before grid excavation to determine disposition. The EM area grid layoutwas delineated according to the SAP in Reference 4 and as shown in Figure 12. TheSH and QS area were similarly further delineated according to Section 6.1 and AppendixA in this document and as shown in Figures 15 and 16, respectively.
Pre-excavation vertical delineation was generally completed in all three areas. 10% ofexcavated grids where the remaining layer has already been characterized to be clean

Remediation Work Plan and Sampling and Analysis Plan 31ICS Soil Remediation and RemovalBloomington, IndianaJuly 2010
by a delineation result will be verified clean by verification sampling performed accordingto Section 6.2. The grids with the highest PCB level excavated next to the residual soillayer will be verified. Section 5.3 indicated which grids will be sampled for verification ineach area.
However, if the remaining layer after excavation had not been previously delineated,additional grid bottom verification sampling will be required (according to Section 6.2) todocument and verify that the remediation has been completed.
Soils in the existing drainage channels (other than known TSCA segments) in the SHand QS areas will be scraped and stockpile sampled per Section 6.4. Excavationverification sampling will be performed on the underlying surface per Section 6.3 if aresidual soil layer is to be left at the bottom of the channel.
Elongated grids will be laid out over the final constructed surface drainage ways andsampled according to Section 6.3 to verify that these surfaces satisfy the drainage wayclean criteria.
Table 7 lists the number of each different type of sample that will be taken in each areaand also lists the sample requirements. Sampling procedures are summarized in theSAP, which is provided in Appendix A. Soil samples will be obtained according to theQAPP Field Procedure FP-16, Soil Sampling. The decontamination procedure isdescribed in Section A.5 and waste handling procedures are described in Section A.6 ofthe SAP in Appendix A and conform to the 2010 QAPP revision 9.
6.1 Grid Delineation Sampling
The QS, SH and EM areas were delineated before mobilization for excavation.Sampling and analysis was performed in accordance with Appendix A in this document.The grid layouts for the EM, SH and QS areas are shown in Figures 12, 15 and 16,respectively.
A hand auger or soil probe is used to obtain the samples. In each grid, a grab sample istaken from the center. If an existing drainage channel ran through a grid, the samplelocation was offset to be outside of the drainage channel. The channels will be scrappedand stockpile sampled and verified separately, as discussed below.
Each grab is initially advanced in 12 inch lifts with a hand auger which is fitted with aninternal plastic sleeve. The sleeve contains the sample. After removing the sleeve fromthe auger, the sleeve is sliced along its length and the 0 to 6 inch and the 6 to 12 inchportions removed. Deeper 6 inch segments were sampled as required to obtain a cleanbottom.
As each sample is removed from the sleeve by the field technician, the technicianvisually inspects the sample to provide qualitative descriptions of color, texture, odor,presence of plants or animals, presence of sediments or clay, or other relevant fieldobservations, and notes them in the field logbook. The depth of soil in each sleeve isnoted.
Larger pieces of stone and any debris such as vegetation and roots are removed fromthe sample and discarded. The remaining sample is homogenized. The sample isplaced into a 4 ounce pre-cleaned bottle that is labeled in accordance with the QAPP

Remediation Work Plan and Sampling and Analysis Plan 32ICS Soil Remediation and RemovalBloomington, IndianaJuly 2010
field procedure requirements, and prepared for shipment to the laboratory. The samplesare submitted to the laboratory for EPA Method 8082 PCB analysis, as described inSection A.8 of this Plan.
After the collection of each core sample, all sampling equipment that has come intocontact with the soil samples (scoops, spatulas, mixing pans, etc.) are thoroughlycleaned to avoid cross contamination.
After receiving results for all initial grid samples, additional samples were taken to closeout all results above the not to exceed standard. If a sample is above the not to exceedvalue on a perimeter grid, then a step out from the grid boundary was made and asample taken at the depth in question.
6.2 Grid Bottom Verification Sampling and Re-excavation
To verify the success of the remediation, soil samples will be collected and analyzedfrom the bottom of 10% of excavated grids that have been previously delineated to aclean surface.
In addition, if a particular grid is excavated to a depth that has not been characterized bya delineation sample result, then a 6 inch composite sample from the next underlyinginterval will be taken for verification.
For 30’ x 30’ grids, bottom samples will comprise a composite of four grab samplesrandomly collected from the four quadrants of that grid. Since 15’ x 15’ grids are equivalent to a quandrant of a 30’ square grid, only one grab will be taken in the center of the15’ square grids. The number of grabs comprising a partial 30’ grid will be based on the relative area of the partial grid to a full 30’ grid (i.e. the verification sample for half of a full grid will be comprised of 2 grabs).
Several 30’ grids have the existing creek channel running through them. None of thefour grabs will be taken in the width of the creek channel that will be scraped andstockpile sampled, separately, as indicated in Section 6.4 below.
The results of the composite sample will be compared to the non-drainageway not-to-exceed value of 10 ppm. If the verification sample analytical result exceeds thecorresponding not-to-exceed value, then an additional6” lift of soil will be removedfollowed by additional verification sampling. Material may be removed from the entiregrid, or the quadrant grab samples may be analyzed separately and the excavation maythen focus on one or more sub-grids as appropriate.
6.3 Final Drainage Way and Excavated Creek Channel Verification Sampling
Existing drainage channels not excavated all the way to bedrock and the finalconstructed drainage way channels will be sampled according to this procedure. Grids50' long, the width of the drainage way will be set up along the channel. In sections ofthe channel where the sidewalls are made up of fill, five 0 to 6" surface grab samples willbe taken, spaced at 10’ apart along the center of each drainage way grid andcomposited to verify the <5 ppm NTE / <1 ppm average in the drainage way is achieved.
In sections of the channel where the sidewalls are made up of native soil, 6 grabs will bestaggeredalong the 50’ length, 2 in each sidewall where there is native soil and 2 in the

Remediation Work Plan and Sampling and Analysis Plan 33ICS Soil Remediation and RemovalBloomington, IndianaJuly 2010
center. All sidewall and center grabs within a 50’ section will be composited into one composite sample for analysis.
If the bottom of the constructed channel is on bedrock, the surface grabs will bestaggered at 10’ intervals along both sidewalls. Again, all sidewall and center grabswithin a 50’ section will be composited into one composite sample for analysis.
If this composite sample result is >5 ppm the drainageway will be excavated 6” deep over the50’ length and the width of the channel plus 2 extra feet on each side. Thesidewalls will be in native soil in 800’ of the total 1470’ of final constructed drainageway.
The remaining bottom of the two 50 ft long TSCA channels and the overflow channels inthe SH area will also be verified according to this procedure. If the bottom of thechannel is not within the Final Drainage way path, the verification sample is onlyrequired to meet the non-drainage way clean criteria, NTE 10 ppm. These sampleresults will be included in the non-drainage way average for the SH area.
The first 30’ of the existing channel from the Quarry C pond to Hinkle’s Restaurant wascomposite sampled as a drainage way grid during delineation and was found to beclean.
6.4 Stockpile Sampling
The nominal stockpile size for sampling will be up to 120 cubic yards. Ten grab sampleswill be randomly collected from each stockpile at various depths and thoroughlyhomogenized. A composite sample will be obtained from the mixture for analysis ofPCBs. This composite will be compared with the drainage way and non-drainage waycleanup criteria for final disposition.
If the composite sample result is greater than 10 ppm it will be disposed off site. If lessthan 50 ppm it will be sent as Special Waste. If greater than 50 ppm the stockpile will besent off as TSCA.
If the stockpile PCB level of < 5 ppm is not exceeded, the stockpile will be consideredsuitable for use as backfill in either a non-drainage way or drainage way, depending onthe area average. If the analysis shows that the PCB level is between 5 and 10 ppm,the material will be suitable for use as backfill only in non-drainage way areas, againdepending on the area average.
These data will be used to determine area average PCB concentrations prior toplacement to ensure that the average cleanup criteria will be met.
7.0 Waste Transportation and Disposal
The general approach to transporting and disposing of waste from this project involvesloading soil into dump trucks and shipping it to a permitted disposal facility. The SiteRemediation Contractor’s Transportation Coordinator will coordinate the transportation of all shipments of regulated waste from the site.

Remediation Work Plan and Sampling and Analysis Plan 34ICS Soil Remediation and RemovalBloomington, IndianaJuly 2010
7.1 Transportation
Contracts will be placed with one or more waste transporters subject to approval byCBS. The waste transporters may be contracted by CBS separately, through thedisposal facility, or through the Site Remediation Contractor. The transporter’s DOT safety record will be a key component of the transporter selection process.
Daily coordination with the waste transporter will ensure an adequate number of trucksare available each day, Monday through Friday. A route map will be posted showing theroute that the loaded trucks will take from the site to each permitted disposal facility.Trucks will be staged in a manner that will expedite daily loading and movement. Alltrucks will comply with DOT requirements.
7.2 Inspections
All trucks will be inspected as they arrive at the site to ensure that they are sound andempty prior to being loaded. Empty trucks will be lined prior to loading. As soon as atruck is filled, it will be covered with a tarp, dispatched to the disposal facility, unloaded,and returned to the site. An adequate supply of liners and tarps will be maintained onsite throughout the project. Unsuitable or dirty trucks will be rejected and not permittedon site.
7.3 Scale Operations and Truck Log Records
Onsite Site Truck Scales will probably not be used because of the low volume ofmaterial, which will mainly be Special Waste. Very little TSCA material is expected fromthis site. Also, use of one truck scale would be problematic because of the separateaccesses to the EM area and the SH/QS areas. Truck loads will be estimated on sitevisually and by the number of excavator buckets loaded. Actual calibrated scale weightswill be obtained from the landfills.
If temporary truck scales are used, however, they will be calibrated before first use. Thecalibrated truck scales would be utilized to monitor the amount of material beingtransported offsite on a daily basis. Each truckload of contaminated material would beweighed on these scales prior to being transported to a permitted disposal facility.
The empty tare weight of each truck would be recorded and loaded weight tickets foreach truck would be collected.
Regardless of a scale being used, a unique and sequential tracking number would beassigned to each load, and a tally of the weight placed in each truck would bemaintained. A daily summary will be prepared of all trucks loaded and dispatched eachday. At a minimum, an electronic waste tracking spreadsheet will provide the followinginformation:
Trucking company name; Truck identification number; Unique sequential load number; Manifest number; Tare weight of the truck (if a scale is used);

Remediation Work Plan and Sampling and Analysis Plan 35ICS Soil Remediation and RemovalBloomington, IndianaJuly 2010
Loaded (estimated) weight of the truck; Time of departure from the site; and, Name of the destination landfill.
The CBS Onsite Representative or his designee will be responsible for the managementof records associated with waste transportation and disposal on this project. The CBSOnsite Representative’s designee and the Site Remediation Contractor will each maintain a complete set of records associated with waste shipment and disposal (e.g.,load tickets, landfill receipts, and manifests). In addition, electronic spreadsheet tableswill be maintained in accordance with the format specified by the CBS OnsiteRepresentative’s designee. All electronic files will be backed up on a separatecomputer, a memory stick, satellite hard drive, or other suitable device at the end ofeach work day. All project records will be turned over to CBS at the conclusion of theproject.
7.4 Manifesting and Placarding
State of Indiana or Federal manifests will be used for all shipments of regulated wastefrom the site. The site EPA identification number site will appear on each manifest, andthe truck weights determined at the scales or estimated will be used to complete themanifests. Manifests will be prepared by the Site Remediation Contractor’s Transportation Coordinator and signed by the CBS Onsite Representative or hisdesignee on behalf of CBS. Manifest and load numbers will be logged into a manifesttracking system. All dump trucks will be properly placarded before leaving the site.Placards will be placed on the sides and back of each truck and will comply with DOTspecification HM-126F.
7.5 Disposal Facilities
All disposal facilities shall be selected contracted by CBS, subject to the approval of theU.S. EPA. Only those materials that are contaminated with PCBs above the sitecleanup levels will be shipped offsite. The preferred disposal facility for material withPCB content >50 ppm is the Heritage Subtitle C Landfill in Roachdale, Indiana. Thismaterial would be disposed of under the Megarule, 40 CFR Part 761.61, with theapproval of EPA Region 5.
The Site Remediation Contractor will ship all PCB wastes to the following permitteddisposal facilities:
TSCA waste: Heritage Subtitle C Landfill, Roachdale, Indiana, orEQ Landfill, Belleville, Michigan.
Special waste: Southside Landfill, Indianapolis, Indiana.
7.6 Solid Waste and Fuel Spills
7.6.1 Solid Waste Spills
Wherever possible, trucks will be parked on solid ground during loading. Trucks may nottravel across disturbed or partially excavated areas in which the truck tires mayencounter impacted soils.

Remediation Work Plan and Sampling and Analysis Plan 36ICS Soil Remediation and RemovalBloomington, IndianaJuly 2010
Any soil spillage that occurs during truck loading operations will be promptly cleaned upto prevent vehicles from tracking the material away from the excavation. To preventspillage during hauling, trucks will be loaded such that at least 6 in. of freeboard ispresent around the entire rim of the truck bed.
A secondary containment liner will be placed at the truck loading area to collect anyaccidental spillage during loading operations. Site Remediation Contractor personnelwill be responsible for promptly cleaning any spillage from the liner to prevent trucksfrom tracking through any spilled soils prior to leaving the site.
7.6.2 Fuel and Lubricant Spills
All fuels will be stored in a designated fuel storage area in accordance with OSHAregulation 29 CFR 1926.152. The fuel storage area will be clearly marked, will includeadequate secondary containment, and will be barricaded to prevent vehicle accidents.Fire extinguishers, absorbent pads, oil dry, and plastic shovels will be stored in theimmediate area for use in the event of a spill.
8.0 Water Management
The management of storm water and other water encountered during remediation isdivided into four components:
1) The diversion of site runoff away from areas with known contamination todiversion channels or sumps;
2) The retention of any storm water that comes in contact with potentiallyimpacted soil or debris;
3) The collection, storage and transfer of potentially impacted storm water orgroundwater from the collection areas to the ICSTF wastewater treatmentsystem; and
4) Wastewater treatment.
The primary objective of this plan is to divert the flow of runoff from rainfall events awayfrom contaminated material and to minimize the accumulation of storm water in areascontaining contaminated materials.
Storm and groundwater that accumulates in site excavations or that comes in contactwith contaminated materials will be collected and treated on site. These areas includethe open excavations and stockpile, decontamination, or truck loading areas. Stormwater will be diverted around these areas using berms, sandbags, or other controlmeasures as much as possible. Storm water that falls on or runs onto a controlled areawill be collected, pumped to temporary storage tanks, and held there until it can be sentto the ICSTF for treatment.
Alternately the collected water may be sampled to determine if the batch can bedischarged without treatment (i.e. PCB <0.3 ppb).
Due to the capacity limits of the ICSTF, it may become necessary to mobilize a portablewater treatment system on site to treat the collected water. This system would typically

Remediation Work Plan and Sampling and Analysis Plan 37ICS Soil Remediation and RemovalBloomington, IndianaJuly 2010
consist of a settling tank and a sand and/or bag filter system followed by primary andsecondary carbon treatment vessels incorporating granular activated carbon. Thewastewater treatment area will be constructed with a high-density polyethylene (HDPE)liner, a perimeter berm, and a water collection sump.
8.1 Diversion of Clean Storm Water
Runoff flow from rainfall events will be diverted away from site excavations to minimizethe accumulation of storm water in the excavations, stockpile areas, and other workzones. To accomplish this, temporary earthen berms will be constructed around anyopen excavation or stockpile area that appears to lie in the natural drainage path. Thepurpose is to prevent storm water runoff from coming in contact with potentiallycontaminated material. Any storm water that does come in contact with contaminatedmaterials will be contained, collected and treated on site.
Storm water that can be diverted on clean surfaces away from site excavations andother contaminated areas will be discharged to existing surface drainage ditches on thesite.
8.1.1 Diversion of Quarry Springs Water
The ICSTF currently discharges treated water from the Illinois Central Stream (ICS) intothe existing creek channel in the SH area as shown in Figure 15. The storm bypassfrom the clean side of the EM area is also currently directed to the existing SH areacreek channel. This water normally sinks into the swallow holes in the SH area and re-emerges at two springs in the QS area, Quarry A (QA) and Quarry B (QB) springs andflows along the surface to a 36” city sewer culvert. Quarry A and B Springs are fed directly by the swallow holes in the SH area and by the Quarry A culvert which carriessurface flow from the SH area to the QA spring.
The QS area contains four springs, altogether. Besides QA and QB there is Quarry C(QC) and Rinker Spring. The locations of the springs and their relationship to the SH andQS areas are shown on Figure 3.
Under low flow conditions, Quarry B is the main resurgence of the water from the SHarea. Quarry B is actually on the west side of the abandoned railroad tracks which isnow the ICSTF access road. It was piped through a culvert to the eastern side of the RRtracks between 1949 and the early 1980s. The area on the west side was then filled forconstruction of the Westplex development.
During large storm events, the swallow holes in the SH area cannot pass all the stormflow and therefore a pond forms at the downstream end of the SH area at the entranceto the QA culvert which runs under the ICSTF access road to the QS area. Duringstorms, most of the water entering the QS area enters as surface flow through thisculvert near the Quarry A Spring. However, some water does still sink into the swallowholes and emerges at both Quarry A and B Springs.
A new ICSTF effluent line is planned and will be installed and put into operation beforethe SH and QS remediation. The new effluent line will contain and route all the flow fromthe EM area and the ICSTF plant around the SH and QS areas to prevent this waterfrom sinking into the swallow holes. The new effluent line will bypass the SH and QSareas and carry the ICSTF discharge directly to the existing 36 inch storm water culvert

Remediation Work Plan and Sampling and Analysis Plan 38ICS Soil Remediation and RemovalBloomington, IndianaJuly 2010
that runs under Adams St from the QS area as shown on Figure 9. This will prevent re-contamination of the clean plant discharge waters by contaminated sediments in thesubterranean conduit system connected to the swallow holes.
Therefore after the new effluent line is put into service, the flows in the QS springs willbe reduced. Rain falling and collecting on the surface within the bathtub-like SwallowHole area swale itself will still be able to flow thru the swallow holes and Quarry A culvertto the Quarry A and Quarry B springs. A large part of the storm flow at QB spring willstill come from a 12” drainage pipe which discharges from the Westplex development across the ICSTF access road from the QS area and runs along the surface into abeehive surface drain and into the Quarry B culvert to the QB spring as shown in Figure16.
After the installation of the new Effluent line, the flows in QA and QB are projected to beabout 5 gpm normally and up to 250 gpm, each, during a major summer storm (2” in 24 hours). The flow at Rinker Spring is assumed to be about 5 gpm normally and up to 50gpm during a major storm. The flows from these springs will be contained and divertedaround excavations during the remediation of the QS area.
The storm flow at QA will be reduced by blocking off the culvert from the SH area to QAand by berming off the surface flow in the SH area from the main swallow holes. If thiswater is trapped in the bathtub-like SH area, QA storm flows should be reduced to about20 gpm, greatly reducing the amount of water that must be diverted around any channelexcavation downstream of QA during a storm. The water contained in the SH areawould be contained and will ultimately be sent to the ICSTF inlet sump for treatment.During the subsequent excavation within the SH area the culvert at QA and the swallowholes in the SH area will continue to be dammed off and bermed to contain storm water.
If the surface flow off of the Westplex development is contained and piped into one ofthe manholes for the new effluent line, it will be carried to the 36” culvert separatelyandthe QB spring storm flows should also be greatly reduced from about 250 gpm to about20 gpm. This again reduces the amount of water that must be diverted around anychannel excavation downstream of QB.
The Contractor has the option to contain and divert up to 250 gpm at the QB culvertduring storm conditions or to divert the Westplex flow so that only up to about 20 gpm ofstorm flows will need to be contained and diverted around channel excavationsdownstream of QB during storms.
Spring flows from Quarry A, B and C and Rinker Springs will continue to flow through thenew final drainageway channels that will be constructed through the Quarry Springs areaafter the remediation is complete.
Section 5.3.2 presents a conceptual scenario for diverting the creek flows as the QSarea drainage channels are excavated.
8.2 Retention and Treatment of Potentially Impacted Water
All accumulated surface water and groundwater in the open soil excavations will bepumped to the holding tanks and treated as necessary to continue soil excavation. Inthe SH area and other swale type areas where storm water runs across or into

Remediation Work Plan and Sampling and Analysis Plan 39ICS Soil Remediation and RemovalBloomington, IndianaJuly 2010
contaminated or suspect areas that have not been confirmed clean, the water will becontained and stored for treatment thru the ICSTF.
Removal of accumulated sub-grade water or groundwater will be accomplished usingsump pumps. Where the potential for overflow of an excavation exists due to stormwater run-on, sump pumps will be installed prior to the rainfall event and connecteddirectly to the holding tanks staged at the site.
Soils of unknown PCB content that are being excavated to be stockpile sampled, suchas the existing creek channel sediments, will be treated as contaminated until confirmedas clean. They will be placed on poly sheeting and bermed to contain any water thatcomes in contact. After a stockpile is confirmed clean it may be removed from the polysheeting and staged on a clean surface for use as backfill.
8.3 Wastewater Spill Prevention and Control
The Site Remediation Contractor will mobilize all necessary pumps, hoses, storagecontainers, vacuum, and other equipment needed to respond to any incidental release ofwastewater and to remove, containerize, and manage all liquids recovered during awastewater spill.
As mentioned previously, the frac tank area and the wastewater treatment area, ifneeded, will be constructed on an HDPE liner, with a perimeter berm, and a watercollection sump to collect and remove any spilled wastewater.
9.0 Air Monitoring
The vast majority of waste at this site will be non-TSCA Special Waste, less than 50 ppmPCBs. Because of the very low PCB levels and small volume of any TSCA impactedsoil at this site, perimeter air monitoring may not be required. Instead, a “no visual dust” standard may be monitored and enforced at the perimeter of the project work area.
Under this protocol, if an excavation or loading operation is deemed to be in violation,excavation or loading procedures will be modified or water sprays will be employed.
Air monitoring is still currently being evaluated by the government regulators. Therequirements set forth by the government parties will be implemented.
10.0 Site Restoration
Following completion of soil excavation and all other remediation activities, the site willbe restored to a condition required by the CDA and mutually agreed to between CBS,the U.S. EPA and the site owners. Any incidental surface debris and other wastegenerated during remediation shall be collected and disposed of at a municipal solidwaste landfill or otherwise as appropriate.
10.1 Grading and Seeding
Soil excavations will be backfilled with clean clay soil as necessary to provide for sitedrainage and minimize the potential for ponding and infiltration of water into thebackfilled excavations. Approximately 1500 cubic yards of clean clay and top soil from

Remediation Work Plan and Sampling and Analysis Plan 40ICS Soil Remediation and RemovalBloomington, IndianaJuly 2010
the Effluent Line trench excavation project will be staged on site for use as backfill forthis ICS flood plain remediation project.
Site restoration will involve grading of the finished soil surface within and around thethree ICS areas to drain to the southeast. Rough grading of exposed soils, including allbackfilled soil excavations, will be performed in general accordance with Figures 14, 17and 18. These figures show proposed finish grade contours across and around theareas to direct drainage to the final constructed drainageway channels.
Left over clean soil stockpiles and left over backfill from the effluent line will be spreadout around the site to allow drainage. Tree trunks left on site from the clearing will bechipped. Clean trunks and rootballs will be shredded. The shredded chips will bespread out around the site as surface mulch.
In all fill areas, backfill and overburden soils will be spread or placed in up to12-in. looselifts and compacted. All graded areas will be seeded and mulched. Following seeding,straw, hydromulch, or the mulched brush pile will be placed over the area to promoteseed germination and the development of grass cover.
After the final drainage way channel is confirmed clean, sod will be installed in the newlyfinal constructed drainage way channels on the sidewalls and the bottom if it is not onbedrock.
10.2 Erosion Controls
Following the completion of final grading and seeding as discussed in Section 10.2, theSite Remediation Contractor will apply erosion control netting over graded areas that aresusceptible to erosion. In addition, the Site Remediation Contractor will install siltfencing or may use straw bales at the outfall into existing storm water control structuresand surface ditches to collect silt and other sediment. Following installation, the CBSOnsite Representative or his designee and the Parties will inspect allerosion/sedimentation controls. The Site Remediation Contractor will install anyadditional erosion/sedimentation controls as deemed necessary by the CBS OnsiteRepresentative, his designee, or the Government Representatives.
10.3 Fencing
Existing gates and fencing around the EM area will be relocated as shown on Figure 13.The fence around the SH area will be taken down as required for access and stored forlater reuse as security around the ICSTF plant. Any damage to gates or fencing that isto stay in place that is caused by the Site Remediation Contractor or its subcontractorsduring the project will be repaired prior to demobilization from the site.
11.0 Project Closeout and Completion Report
At the conclusion of the project, a punch list of action items will be prepared. All work onthe punch list will be completed to the satisfaction of the CBS Onsite Representative orhis designee, the Parties, and the U.S. EPA prior to final demobilization from the site.Following completion of all remediation activities described herein, CBS will prepare acomprehensive project report that summarizes all work performed as part of thisremediation project. Specifically, the report will include a discussion of pre-excavationdelineation activities, excavation activities, final quantities and disposition of removed

Remediation Work Plan and Sampling and Analysis Plan 41ICS Soil Remediation and RemovalBloomington, IndianaJuly 2010
wastes, verification sampling procedures and results, final area averages, restorationactivities, and water treatment. The completion report will include color-coded post-excavation verification sampling data maps depicting final excavation depths. Extensivedocumentation consisting of, but not limited to, the following items will be available forreview but not included in the report:
Sample logs; Chain-of-custody records; Certificates of analysis; Sampling progress maps; Excavation progress maps; Daily safety logs; Daily tailgate safety meeting records; Photo documentation; Shipping manifests; Disposal receipts; Destruction certificates; and,
Within 60 days of the completion of all work specified in the RWP, CBS will submit a finalcompletion report to the U.S. EPA.

Remediation Work Plan and Sampling and Analysis Plan 42ICS Soil Remediation and RemovalBloomington, IndianaJuly 2010
Appendix A.
Sampling and Analysis Plan
A.1.0 Introduction
The purpose of this Sampling and Analysis Plan (SAP) is to provide a plan for thesampling work required at the Lemon Lane (LL) Landfill Site by the consent decreeamendment (CDA).
The CDA details a set of final remediation and monitoring requirements for the LLLandfill Site. One of those requirements is to sample the soils and sediments in theIllinois Central Spring (ICS) emergence area (EM), the Swallow Hole (SH) area and theQuarry Springs (QS) area.
This document describes the sampling and analysis procedures for performing soil andsediment sampling in and around the ICS EM/SH/QS areas. This Plan is derived from aprevious SAP document (Reference 3) which was submitted to the EPA in August 2009.Comments received on the August 2009 plan from EPA and IDEM on September 15,2009 have been addressed in this plan. A sampling plan for the Delineation of theEmergence area, (Reference 4), has been previously approved by EPA. Phase I and 2sampling of the EM area has been performed as discussed in Section 5.1.2.1. Table 4and Figure 13 show the Phase 1 and 2 results.This Plan is supported by and intended to be used in conjunction with the QualityAssurance Project Plan (QAPP), Revision 9 (Reference 6) for the Bloomington Sites.
A.2.0 Data Quality Objectives
This section shows how the Data Quality Objective (DQO) process was applied for thisPlan. The DQO process focuses studies by clarifying vague objectives and limiting thenumber of decisions that must be made (Reference 7). The process enables data usersand technical experts to specify data requirements prior to collection events. It providesa convenient way to document activities and decisions, to communicate the datacollection design to others, and to give the data user confidence that the data collectedsupport the decisions concerning remediation and redevelopment of the site. Finally, theDQO process is designed to save resources by streamlining the study process andmaking data collection operations more resource-effective.
A.2.1 Stating the Problem
The conceptual model for the EM/SH/QS areas involves the following:
ICS is the emergence of groundwater contaminated with PCBs from historicaloperations at Lemon Lane Landfill.
During non-storm conditions, the ICS waters flow along the surface in definedchannels to the SH area and then sink back underground. These waters then re-emerge to the surface primarily at Quarry A and B Springs with some inputpossibly to Rinker Spring. The defined channels carrying these flows have been

Remediation Work Plan and Sampling and Analysis Plan 43ICS Soil Remediation and RemovalBloomington, IndianaJuly 2010
contaminated with PCBs.
During storm conditions, flooding can occur in all three areas due to flowrestrictions from culvert blockage or the inability of the swallow holes to pass themuch higher flows of water. The flooding deposits contaminated sedimentsoutside the normal stream channels in the flood plain.
These areas are heavily vegetated, undeveloped, flood prone and have some moderateslopes. Therefore, they are likely to remain undeveloped. However, there areresidential areas near by so future exposure scenarios could involve trespassers beingexposed to contaminated soils and sediments. The USEPA has determined that PCBsare the contaminant of concern.
The USEPA has determined that removal of contaminated sediments and soils isnecessary to protect human health and the environment. The USEPA has set targetcleanup goals for these areas as follows:
For areas that will serve as final drainage ways: 1 ppm PCBs as an areaarithmetic average with a 5 ppm not to exceed limit for any one sample
For final non-drainage way areas: 5 ppm PCBs as an area arithmetic averagewith a not to exceed limit of 10 ppm for any one sample.
A.2.2 Identifying the Decision
Based on the EPA set cleanup criteria for these areas, the decision statements are asfollows:
Determine if the average PCB value is greater than 1 ppm in soils/sediments offinal drainage ways or determine if any one grid is greater than 5 ppm PCBs in afinal drainage way. If either of these conditions exists, then remove the offendingmaterials.
Determine if the average PCB value is greater than 5 ppm in soil/sediments offinal non-drainage ways or determine if any one grid is greater than 10 ppmPCBs in a final non-drainage way area. If either of these conditions exists, thenremove the offending material.
A.2.3 Identifying Inputs to the Decision
The data needed to support the decision is the PCB content of residual soils andsediments in these areas. The PCB reporting limits need to be less than 1 ppm on a dryweight basis to allow proper quantitation to the lowest action limit.
A.2.4 Defining the Boundaries of the Study
The boundaries of the study refer to the area, depth and temporal aspects of thesampling plan. The study areas can be bounded by the previous sample results and the

Remediation Work Plan and Sampling and Analysis Plan 44ICS Soil Remediation and RemovalBloomington, IndianaJuly 2010
physical realities of the areas. Specifically, since the main mechanism of contaminationmigration in these areas are spring flows in channels and deposition throughout thefloodplain during large storm events, the area of investigation can be limited to streamchannels and flood plains below elevations that previous sampling has shown is notcontaminated.
A.2.4.1Emergence Area
For the IC emergence (EM) area, this area is bounded by the fenced area and anelevation of approximately 827 feet amsl. Previous data shows that soils sampled abovethis elevation consistently have been less than 1 ppm PCBs. The existing fence wassited where sampling results showed a reliably clean perimeter.
Within the EM area, there are several areas that should be considered as not requiringadditional sampling for various reasons. These would include:
There are two small channels that extend from the existing spring emergences tothe plant intake. One of these is the normal low flow emergence channel and theother is a major storm overflow spring channel. These channels will remain activein the future and will be continually contaminated by untreated spring flows.There is no need to sample and remove material from these small lengths ofchannel since they will be continually re-contaminated.
The lower portion of the gravel access road/parking area. This roadway area wassampled, remediated and constructed in 1999. This area has not flooded sincethe 1999 construction.
The steep hillside to the west and steep railroad berm to the south of the mainemergence. These areas are not flood prone to any extent and the areas whichmay have seen some flood waters over the years are very small. These areaswill remain within the fence for the foreseeable future and will drain to the ICSTFinlet sump.
Within the existing fenced area are also the intake structures for the ICS STF.
These four areas described above will require continued access restrictions for theforeseeable future and should remain fenced off from the general public. However,outside these areas, after removing soils greater than the cleanup standard, the fencingcan be removed and access restored to the property owners. Sampling and removalinside the future smaller fenced area that will restrict access to the above areas shouldnot be required at this time except in the area of the hot spot indicated in Section 2.2 andin the final constructed drainage way. Table 4 and Figure 12 show the sampling resultsin this area. Figure 13 shows the grids that will be removed based on the results.
Based on both historical and the delineation sample results, the depth of contaminationover 5 ppm outside stream channels is typically restricted to the surface interval up toabout 12 inches.
From a timing perspective, much of the existing data which was taken in 2004 or earlierand in active flood prone areas or the eroded depression area may not be representativeof current conditions.

Remediation Work Plan and Sampling and Analysis Plan 45ICS Soil Remediation and RemovalBloomington, IndianaJuly 2010
There are also existing and developing depressions above the main emergence asshown in Fig 10. These are occurring from erosive flows at the top of rock during stormevents. The area of eroded depressions is also causing additional sediment loading tothe water treatment plant. The erodible materials at the top of rock near the emergenceand overflow springs will be removed and a French drain will be installed to reduce flowrestrictions near the emergence as shown in Figure 10.
Fig 14 shows the area of the Emergence area that has been determined to be fenced toprevent access to the active spring channels and water treatment related structures.
A.2.4.2Swallow Hole Area
This area was heavily overgrown, flood prone and consistently contaminated within thestream channels and the flood plain up to about 810 feet asml. The final remedialactions outlined in the CDA require an extension of the STF discharge line around thisarea to prevent future STF discharge water from sinking into the swallow holes. This isbeing done to prevent re-contamination of the plant discharge by subterraneancontaminated sediments in the conduit system fed by the swallow holes. Known activeswallow holes in this area will be grouted.
The existing fence around the SH area, was originally located based on sampling toensure the fence would be in areas with less than 1 ppm PCBs and out of flood proneareas. Based on the 2004 sample results, PCB levels greater than 1 ppm are restrictedto elevations below 810 feet amsl. Therefore the focus of future sampling andremediation in the SH area will be within the existing fence and below an elevation of810 feet amsl. The depth of contamination, outside defined channels is typically limitedto the top 6 inches. The depth of non-drainageway contamination was determinedduring delineation and verification sampling. Within channels, it appears that thecontamination is the full depth of the soft sediment layer. A shallower depth ofcontamination in existing drainage channels may be determined by verification sampling.
A.2.4.3Quarry Springs Area
At the QS area, the previous sampling has shown that most of the contamination islimited to:
The existing stream channels from the Quarry A area, from the Rinker Springarea and the channel formed from the combination of these two headed towardsthe 36 inch storm culvert
The low flood plain between the two channels
The small flood plain immediately north of the 36 inch storm water culvert.
The Quarry B Spring emergence
There are areas of fill that define the limits of flooding to the east of the Rinker Channeland to the southeast of the entire area. To the west, the flood prone areas are boundedby the hillside descending from the STF access road which extends almost to the QuarryA stream channel.

Remediation Work Plan and Sampling and Analysis Plan 46ICS Soil Remediation and RemovalBloomington, IndianaJuly 2010
Based on field observations in the QS area, the above areas are the only areas subjectto flow and/or flooding. The exception to this is that there is a channel which runs fromthe south end of the Quarry C ponding area to the east/southeast towards HinklesRestaurant. This channel carries flood overflows periodically during major storm events ifthe 36 inch culvert is partially blocked. Eight composite samples taken in 2004 showedthis channel to have no PCB levels greater than 1 ppm. This was confirmed during therecent QS delineation sampling as shown in Figure 16 and Table 5. Since the vastmajority of storm flows this channel has seen since 2004 would be comprised of cleanwater discharged by the STF, it is assumed that this channel would be as clean as orcleaner than in 2004.
A.2.5 Developing a Decision Rule
The decision rule set in the CDA for these areas requires:
If the average PCB value is greater than 1 ppm in soils/sediments of finaldrainage ways or if any one grid is greater than 5 ppm PCBs in a final drainageway, then remove the offending materials.
If the average PCB value is greater than 5 ppm in soils/sediments of non-finaldrainage ways or if any one grid is greater than 10 ppm PCBs in a non drainageway area, then remove the offending materials.
A.2.6 Specifying Limits on Decision Errors
The EPA has specified the method of showing achievement of the cleanup goal. Bothan arithmetic average is to be met in an area and a not to exceed value for any one gridor individual sample in an area. Delineation, verification or stockpile sample results forsoils that will remain on site will be compared with the not to exceed limits for drainageway and non-drainage way compliance. The arithmetic average of all such sampleresults within non-drainage way areas will be shown to satisfy the average requirements.In the final drainage ways the average of the verification composite sample results overthe length of each individual constructed drainageway will be used to determinecompliance with the average cleanup criteria of 1 ppm.
The actual cleanup requirements in the CDA do not require comparison of a UCL to thecleanup standard. Therefore actual minimum sample numbers will be driven by theconfirmation data such as the final not to exceed values achieved.
A.2.7 Optimizing the Design
The above DQO steps have been applied to this sampling effort to provide estimatedparameters that will achieve project goals. This process has yielded:
An area of sampling concern for each of the three areas of interest
Approximate depths of interest in each area
The sampling design for each area will be optimized taking these parameters asguidance along with the physical realities of each area and the anticipated order ofoperations.

Remediation Work Plan and Sampling and Analysis Plan 47ICS Soil Remediation and RemovalBloomington, IndianaJuly 2010
A.2.7.1 ICS Emergence Area
The Emergence Area has a separate SAP (Reference 4) for delineation purposes.Delineation sampling was performed per the separate EM SAP. Figure 12 and Table 4show the sampleresults that were obtained.
It is anticipated that the final fenced foot print around the Emergence Area will bereduced. The site features which will be included in the final footprint are:
The existing small stream channels directly fed by each spring The area of erosion driven depressions The STF plant intake structures and storm water bypass intake area The steep hillside to the west and the steep railroad berm to the south of the
emergence
Several of the above areas will continue to have active sources and/or are very smalland relatively inaccessible such as the steep hillsides to the west and south. Since thesurface water draining over the contaminated areas will be collected and sent to theICSTF for treatment, it is proposed that the cleanup goals not be applied and that nofurther sampling be performed in the active channels and the steep hillsides. Nosampling is also proposed for the gravel access road since this area was remediatedand then constructed in 1999 and no flooding has occurred on this road since then.
Outside these areas, a 30 foot grid was placed in the flood prone valley up to 827 feetamsl. Samples were taken in 6 inch intervals down to 12 inches in the center of eachgrid. Additionally, in the known hot spot area, where the 2004 or 2008 samples wereover 100 ppm, and in the area of eroded depressions the grid size was reduced to 15feet and the initial samples will be taken in 12 inch intervals to bedrock. A layout of thissampling approach is shown in Figure 12. Table 4 lists the delineation results. Figure13 shows the grids that will be excavated to the clean criteria for non-drainageways.Figure 13 also shows the grids that were sampled to establish a clean perimeter. Thedrainageway will be constructed separately and sampled separately to confirm it clean tothe drainage way criteria.
Note that some portion of the valley leading to the storm water bypass piping will be afinal drainage way. The final size and preliminary location of the final drainage way isshown on Fig 14. Once the final drainage way is constructed, 6’ wide by 50’ long gridswill be laid out along the full length. Each grid will be sampled from 0-6”to a not–to-exceed limit of 5 ppm. All these sample results along the final drainageway will becompared to the not-to-exceed value of 5 ppm and also averaged and compared to theaverage limit of 1ppm.
The layout depicted in Figure 13 can be used to estimate the number of samples whichwill be generated to calculate the final average level of residual PCBs in the non-drainageway. There are 17 - 30 foot grids and 28 - 15 foot grids shown on Figure 14.Each 30 foot grid will initially generate at least 1 sample result and each 15 foot grid willinitially generate at least 4 sample results. The actual final data set used to compare theaverage to the cleanup standards will vary and include stockpile results and some finalconfirmation data as well.

Remediation Work Plan and Sampling and Analysis Plan 48ICS Soil Remediation and RemovalBloomington, IndianaJuly 2010
A.2.7.2 The Swallow Hole (SH) Area
The Swallow Hole grid area will be delineated before mobilization for excavation. Theconceptual approach to both contamination removal and sampling to support thatremoval is outlined in Section 5.3.3.
A 30 foot square grid pattern will be placed over the entire area below anelevation of 810 feet amsl as shown in Fig 15 and sampled for delineation beforeremediation .
10% of the excavated grids will have confirmation sampling performed according toSection A.3.2 with results expedited for next morning delivery.
Two 50’ TSCA creek segments as shown on Figure 15 will be excavated1’ deep andthe residual surfaces will be verification sampled per section A.3.3.
After the TSCA creek segments are removed the remaining US drainage channel(green and red on Figure 15) will be scraped to bedrock or to a confirmed cleanbottom and the existing overflow channels (blue on Fig 15) will be scraped 6”. Thechannel bottoms will be confirmed clean by composite samples along 50’ segments per section A.3.3. The scraped material will be stockpiled and stockpile sampled fordisposition per Section A.3.4.
Areas of the creek channels with deep sediments may not be excavated all the wayto bedrock but only to a clean surface as shown by final drainage way samplingaccording to Section A.3.3.
The swallow holes will be excavated as indicated in Section 5.3.3. Theexcavated material will be stockpile sampled per Section A.3.4.
After all soils are removed and the swallow holes grouted, final fill and gradingand the construction of the new drainage way will be completed as shown in Fig17.
As in the emergence area, once the final drainage way is constructed, 50’ longgrids the width of the constructed drainage channel will be laid out along the fulllength. Each grid will be sampled according to Section A.3.3 with resultscompared to the drainage way clean limit of not–to-exceed 5 ppm. All thecomposite sample results along the final drainageway will be averaged andcompared to the average drainage way limit of 1ppm.
If the average is above 1ppm, the grid layers with the highest PCB content(between 1 and 5 ppm) will be removed and replaced with clean fill until theaverage is less than or equal to 1 ppm.
A.2.7.3 The Quarry Springs Area
The previous sample data for this area showed that all 2004 data was below 50 ppmwith the arithmetic average at less than 5 ppm and the highest value at 48 ppm. Thehighest PCB values were within the stream channels with much lower values in the floodplain between the stream channels and near the 36 inch culvert.
The Quarry Springs area remediation, as described in Section 5.3.2, will be similar to theapproaches used in the Swallow hole and Emergence areas. The QS area was clearedand grid sampled upfront, before mobilization for remediation. Fig 16 and Table 5 showthe grid layout and sample results. Samples were initially taken in 6 inch intervals downto 12 inches in the center of each grid. During delineation some grids were sampleddeeper, as required to obtain clean bottoms.

Remediation Work Plan and Sampling and Analysis Plan 49ICS Soil Remediation and RemovalBloomington, IndianaJuly 2010
The pathway for the new drainage way will be laid out. It is anticipated that the path willfollow the existing channel stream fed by Quarry A Spring as shown on Fig 16.
Upon mobilization the flood plain soils will be removed based on the 30 foot grid sampleresults as compared to the non drainage way criteria. 10% of the excavated grids thatwere delineated to a clean interval will have confirmation sampling performed according toSection A.3.2. All grids excavated beyond the depth of a clean delineation sample, willrequire an additional verification sample.
The width of the existing drainage channels will be scraped to bedrock and the removedsoils will be stockpile sampled per Section A.3.4 to determine final disposition. Areas ofthe creek channels with deep sediments may not be excavated all the way to bedrockbut only to a clean surface as shown by drainage way sampling according to SectionA.3.3.
A conceptual layout of the new drainage way and the sample grid for the flood plain areais shown in Figure 16.
A.3.0 Soil Sampling Procedures
To verify the success of the remediation, various forms of additional soil sampling andanalysis will be performed during this project as indicated earlier. First, additional griddelineation sampling may be performed. Second, post-excavation verification sampleswill be collected and analyzed from the bottom of grids containing unknown levels ofPCBs and 10% of excavated surfaces previously delineated to clean. Third, post-excavation drainage way composite samples will be taken over 50 ft channel segments.Finally, verification sampling will be conducted to characterize stockpiled material.Clean stockpiled soils may be returned to the excavated areas as backfill.
Figure 7 lists the number of the various types of samples in each area and also thesample requirements. Soil samples will be obtained according to the QAPP FieldProcedure FP-16, Soil Sampling. The decontamination procedure is described inSection A.5 and waste handling procedures are described in Section A.6.
A.3.1 Pre-Excavation Grid Delineation Sampling
Extensive delineation sampling has been performed in these three areas over the years,as indicated in Section 2. The lateral extent of contamination has generally beenestablished in each flood plain area. Additional Pre-excavation grid delineationsampling was performed in all areas.
Pre-excavation grid delineation sampling involves using a hand auger or soil probe toobtain samples.
In each grid, a grab sample will be taken from the center. If an existing drainagechannel runs through a grid, the sample location will be offset to be outside of thedrainage channel. The channels will be scrapped and stockpile sampled and verifiedseparately, as discussed below.
Each grab will be advanced in 12 inch lifts with a hand auger which is fitted with aninternal plastic sleeve. The sleeve will contain the sample. After removing the sleevefrom the auger, the sleeve will be sliced along its length and the 0 to 6 inch and the 6 to

Remediation Work Plan and Sampling and Analysis Plan 50ICS Soil Remediation and RemovalBloomington, IndianaJuly 2010
12 inch portions removed. Deeper samples will be taken in 6 inch intervals if required toobtain a clean bottom.
As each sample is removed from the sleeve by the field technician, the technician willvisually inspect the sample to provide qualitative descriptions of color, texture, odor,presence of plants or animals, presence of sediments or clay, or other relevant fieldobservations, and will note them in the field logbook. The depth of soil in each sleevewill also be noted.
Larger pieces of stone and any debris such as vegetation and roots will be removedfrom the sample and discarded. The remaining sample will be homogenized. Thesample will be placed into a 4 ounce pre-cleaned bottle that is labeled in accordancewith the QAPP field procedure requirements, and prepared for shipment to thelaboratory. The samples will be submitted to the laboratory for PCB analysis asdescribed in Section A.8 of this Plan.
After the collection of each core sample, all sampling equipment that has come intocontact with the soil samples (scoops, spatulas, mixing pans, etc.) will be thoroughlycleaned to avoid cross contamination.
A.3.2 Grid Bottom Verification Sampling and Re-excavation
Vertical delineation has generally been done to 12 inches to obtain a clean bottom. In afew Delineation has shown only surface contamination, typically only to 6 to 12”. Gridswith surface contamination to be excavated have typically been delineated to a cleanlevel. 10% of grids to be excavated to a clean delineation result will be verified clean bythis sampling procedure. Also, if the remaining layer after excavation had not beenpreviously delineated, an additional bottom verification sample will be required todocument and verify that the remediation has been completed in that grid.
For 30’ x 30’ grids, bottom samples will comprise a composite of four grab samplesrandomly collected from the four quadrants of that grid. Since 15’ x 15’ grids are equivalent to a quadrant of a 30’ square grid, only one grab will be taken in the center of the 15’ square grids. The number of grabs comprising a partial 30’ grid will be based on the relative area of the partial grid to a full 30’ grid (i.e. the verification sample for half of a full grid will be comprised of 2 grabs). CBS may choice to take two separate 0-6 inchand 6-12 inch composite verification samples at the same time. These will be made upof four 12 inch cores from the center of the 4 quadrants of the 30 ft grid.
Several 30’ grids have the existing creek channel running through them. None of the four grabs will be taken in the width of the creek channel that will be scraped to bedrockand stockpile sampled as indicated in Section 6.4 below.
The 0-6 inch composite will be analyzed first. If the PCBs in that sample meet thecleanup criteria, then the 6 to 12 inch grab will not be analyzed. If the 0-6” sample exceeds the clean up limit the 6 to 12 sample will be analyzed and handled accordingly.A clean bottom verification sample will be achieved in 10% of grids excavated to asurface that was delineated as clean.
The results of the composite sample will be compared to the non-drainageway not-to-exceed value of 10 ppm. If the analytical result exceeds the corresponding not-to-exceed value, material may be removed from the entire grid, or the quadrant grab

Remediation Work Plan and Sampling and Analysis Plan 51ICS Soil Remediation and RemovalBloomington, IndianaJuly 2010
samples may be analyzed separately and the excavation may then focus on one or moresub-grids as appropriate.
If the verification sample exceeds the not-to-exceed cleanup criteria then an additionallift of6” of soil will be removed followed by additional verification sampling.
A.3.3 Drainage Way and Excavated Creek Channel Verification Sampling
Existing drainage channels not excavated all the way to bedrock and the finalconstructed drainage way channels will be sampled according to this procedure. Grids50' long, the width of the drainage way will be set up along the channel. In sections ofthe channel where the sidewalls are made up of fill, five 0 to 6" surface grab samples willbe taken, spaced at 10’ apart along the center of each drainage way grid andcomposited to verify the <5 ppm NTE / <1 ppm average in the drainage way is achieved.
In sections of the channel where the sidewalls are made up of native soil, 6 grabs will bestaggeredalong the 50’ length, 2 in each sidewall where there is native soil and 2 in thecenter. All sidewall and center grabs within a 50’ section will be composited into one composite sample for analysis.
If the bottom of the constructed channel is on bedrock, the surface grabs will bestaggered at 10’ intervals along both sidewalls. Again, all sidewall and center grabswithin a 50’ section will be composited into one composite sample for analysis.
If this composite sample result is >5 ppm the drainageway will be excavated 6” deep over the 50’ length and the width of the channel plus 2 extra feet on each side. Thesidewalls will be in native soil in 800’ of the total 1470’ of final constructed drainageway.
The remaining bottom of the two 50 ft long TSCA channels and the overflow channels inthe SH area will also be verified according to this procedure. If the bottom of thechannel is not within the Final Drainage way path, the verification sample is onlyrequired to meet the non-drainage way clean criteria, NTE 10 ppm. These sampleresults will be included in the non-drainage way average for the SH area.
The first 30’ of the existing channel from the Quarry C pond to Hinkle’s Restaurant wassampled as a drainage way grid and compared to the drainage way not to exceed limit of5 ppm. This composite sample result from the upstream end of the existingdrainageway was 0.86 ppm, confirming it is still clean.
A.3.4 Stockpile Sampling
The nominal stockpile size for overburden sampling will be up to 120 cubic yards.Ten grab samples will be randomly collected from each stockpile at various depths andthoroughly homogenized. A composite sample will be obtained from the mixture foranalysis of PCBs. This composite will be compared with the drainage ditch and non-drainage ditch cleanup criteria.
If the composite sample result is greater than 10 ppm it will be disposed off site. If lessthan 50 ppm it will be sent as Special Waste. If greater than 50 ppm the stockpile will besent off as TSCA.

Remediation Work Plan and Sampling and Analysis Plan 52ICS Soil Remediation and RemovalBloomington, IndianaJuly 2010
If the stockpile composite level is less than 5 ppm, the stockpile will be consideredsuitable for use as backfill in either a non-drainage way or drainage way, depending onthe area average. If the analysis shows that the PCB level is between 5 and 10 ppm,the material will be suitable for use as backfill only in non-drainage way areas, againdepending on the area average.
These data will be used to determine area average PCB concentrations prior toplacement to ensure that the average cleanup criteria will be met.
A.4.0 QUALITY CONTROL SAMPLES
Quality control (QC) samples will be analyzed to assess the quality of the data resultingfrom the field sampling program. Three types of QC samples will be collected:
Duplicate Samples Rinseate Blanks MS/MSDs Samples
Duplicate Samples: Duplicate samples will be collected periodically to check thelaboratory analyses for consistency. Duplicates will be collected during sampling eventsat a frequency of one duplicate per ten samples collected. Duplicate samples will beobtained by equally dividing a sufficient amount of the homogenized composite or grabsample to perform the required analyses. Duplicate samples will be transferred to thelaboratory in pre-cleaned glass jars and submitted for analysis.
Rinseate Blanks: Rinseate blanks will be collected to ensure that all samplingequipment is being properly decontaminated between sampling events. Rinseatesamples will be collected in the field at a frequency of one per day. Rinseate sampleswill be collected by pouring distilled, deionized, or “analyte-free” water over the decontaminated sampling equipment and collecting it in a one liter amber glass samplecontainer. Sampling personnel will not be told which equipment to sample until afterdecontamination procedures have been completed at the end of the day.
MS/MSD Samples: MS/MSD samples provide information about the effect of the samplematrix on the sample preparation and measurement methodology. These samplesdocument the bias and precision of a method. The precision of the method is a varianceof the analytical techniques. MS/MSD samples are considered laboratory QC samples.
Volume for one MS/MSD sample will be collected for every batch of up to twentysamples or fewer per matrix (soil or water) sampled. The sample that will be used toprepare the MS/MSD samples will be indicated on the chain of custody. The laboratorywill prepare the MS/MSD samples from the original volume of sample collected. At least40 grams of sediment or soil will be collected for each sample indicated for MS/MSDsample preparation.
The rate of collection for the QC samples applies to the entire ICS EM area covered bythis plan, not to each sub-area (EM, SH, QS) individually.
CBS will allow the government parties to take split and/or duplicate samples of anysamples collected by CBS or its contractors or agents.

Remediation Work Plan and Sampling and Analysis Plan 53ICS Soil Remediation and RemovalBloomington, IndianaJuly 2010
A.5.0 PERSONNEL AND EQUIPMENT DECONTAMINATION
This section provides the general guidelines for the decontamination of personnel andsampling equipment. A portable decontamination area will be established at the site tocontain liquid and solid waste generated during the decontamination of equipment andpersonnel between sampling locations. All waste generated from decontamination willbe containerized and disposed of properly.
Soil sampling equipment (e.g., scoops, trowels, and mixing bowls) will be cleaned priorto collecting each composite or grab sample to prevent cross contamination. Allequipment will be decontaminated using the following five-step procedure as describedin Field Sampling Procedure FP-2 in Volume I, Appendix B, of the QAPP:
1. Scrub and wash with laboratory-grade detergent.2. Rinse with tap water.3. Rinse with deionized water.4. Rinse with isopropanol (wash bottle).5. Rinse with deionized water.
The following decontamination procedures will be performed by site personnel aftercompletion of tasks whenever the potential for contamination exists. When leaving thecontaminated area:
Disposable latex booties are to be worn over boots in the sampling area. Removeand discard when leaving area.
Remove disposable coveralls (e.g., Tyveks) and discard.
Remove latex gloves and discard. If sediment samples are being taken directlywith the sampling personnel’s gloved hand, gloves will be changed between each composite sample.
At the end of the work day, shower entire body, including hair, either at the worksite or at home.
A.6.0 INVESTIGATION-DERIVED WASTES
It is anticipated that the investigation-derived waste (IDW) that may be generated duringthe field investigation may include the following items:
Personal protective equipment (PPE)–including disposable coveralls, gloves,booties, and other PPE
Disposable equipment–which may include plastic sheeting and equipmentcovers, aluminum foil, broken or unused sample containers, sample containerboxes, tape, and other related items
Decontamination fluids - any spent solvents and wash water

Remediation Work Plan and Sampling and Analysis Plan 54ICS Soil Remediation and RemovalBloomington, IndianaJuly 2010
Packing and shipping materials
Unused sediment or soil sample material
Solid nonhazardous IDW, which includes PPE, disposable equipment, and packing andshipping materials, will be disposed of as solid waste in a dumpster or similar container.Rinse water from decontamination of sampling equipment, which does not contain anyorganic solvents that were used for decontamination, will be disposed of in the ICSTFinlet sump.
Spent organic solvents used for decontamination will be containerized separately fromthe aqueous decontamination fluid wastes. In accordance with USEPA regulations,containers will be labeled and disposed of by CBS at an appropriate treatment anddisposal facility within 90 days of generation.
Any unused sediment or soil material, such as that adhering to the sampling equipmentand material collected but not used for analysis will be returned to the creek sedimentbed or bank in the same area that it was collected.
A.7.0 SAMPLE MANAGEMENT
Field personnel are responsible for the identification, preservation, packaging, handling,shipping, and storage of samples obtained in the field such that all samples can bereadily identified and will retain, to the extent possible, in situ characteristics to bedetermined through analysis. All samples collected will be tracked by preparing andusing a sample chain-of-custody form as described in Field Procedure FP-12 in VolumeI, Appendix B, of the QAPP.
A.7.1 Sample Identification System
Each sample, including duplicates and blank QC samples, will be identified with a uniquesample number. This number will provide easy identification of the sample in field logs,field data sheets, analytical reports, chain-of-custody forms, and project reports.
Sample numbers will be assigned in accordance with the procedures in the BloomingtonProject Data Management Program. A listing of sample identification numbers will bemaintained in the Bloomington Project sampling logbook. Each sample number willconsist of two components that are described below:
A two-digit project identification code (e.g., EM for Emergence, SH for SwallowHole, QS for Quarry Spring)
A four-digit sequential sample number
Sample numbers will not be repeated. Duplicate samples will not be distinguished withinthe sample numbers, but will be distinguished through the sample identification withinthe sample tracking and data management systems. This is done to eliminate potentialbias in the analyses of the samples.
Remediation Work Plan and Sampling and Analysis Plan 55ICS Soil Remediation and RemovalBloomington, IndianaJuly 2010
A.7.2 Sample Containers, Preservatives and Holding Times
Upon collection, samples will be transferred directly into the appropriate samplecontainer. Only pre-cleaned sampling containers supplied by the laboratory will be used.All samples will be cooled to 4°C immediately upon collection and maintained at thistemperature during sample shipment.
A.7.3 Sample Labeling
Samples will be labeled at the time of sample collection by affixing a self-stick label tothe sample container. All sample labels will include the following information:
Project name Unique sample identification number (see Section 7.1) Date and time the sample was collected Initials of the sample collector Sampling location and sample description
A.7.4 Sample Shipping
All samples collected during this project will be properly labeled and packaged forcourier pickup or shipment by overnight courier to the offsite laboratory. Glasscontainers will be secured in sturdy coolers to prevent breakage during transport. Ice inleak-proof bags will be placed in the coolers to preserve the samples at 4°C. Coolerswill be secured with tape and labeled to ensure the samples are not disturbed duringtransportation. A chain-of-custody seal(s) will be attached so that any attempts atopening or tampering will result in a broken seal.
A.7.5 Sample Custody
The sample chain of custody tracks the life of a sample from collection to analysis. Arecord of the sample custody will be maintained to establish and document samplepossession during collection, shipment, laboratory receipt, and laboratory analysis. Thisdocumentation will be evidenced on a chain-of-custody record by the signatures of theindividuals collecting, shipping, and receiving each sample. Procedures for samplehandling, shipping, and transfer of custody are described in Section 3.0 of Volume I ofthe QAPP.
A.7.6 Field Sampling Logbook
A field sampling logbook, as described in Field Sampling Procedure FP-1, will beinitiated at the start of the first onsite sampling activity and maintained to recordsampling activities throughout this remediation project. The field sampling logbook is acontrolled document that becomes part of the permanent site file. The logbook willconsist of a bound notebook with consecutively numbered pages that cannot beremoved. All data entries will be recorded using a non-erasable ink pen.

Remediation Work Plan and Sampling and Analysis Plan 56ICS Soil Remediation and RemovalBloomington, IndianaJuly 2010
The following items will be included in the daily entries in the field sampling logbook:
Date of activities Arrival and departure of sampling personnel and observers Field sampling activities Individual sample description (color, consistency, odor, etc.) Individual sample location (sediment and soils) Sample pick-up, including chain-of-custody form number, carrier, date and time Unusual events during sampling Health and safety issues related to sampling Weather conditions
Field Procedure FP-1 of of the QAPP discusses field logbook record keeping.
In addition to the field logbook, data also will be recorded daily on spreadsheets and sitemaps for communication to the remediation contractor and onsite representatives.
A.8.0 LABORATORY ANALYSIS
Pace Laboratories in Indianapolis, Indiana, has been selected as the analyticallaboratory for this plan. Samples will be submitted to Pace for analysis via hand deliveryor overnight courier.
All samples will be analyzed for PCBs in accordance with EPA Method 8082 (SW-846).No data packages are provided for sample results greater than 55 ppm that will bedisposed of as TSCA.
Sample results at less than 55 ppm PCB will have a full data package provided by thelab and with results reported on a dry basis. Material with full QC results less than 50ppm dry can be disposed of as non-TSCA waste.
The laboratory will transmit preliminary analytical results via facsimile or email. Originalfinal data reports will be forwarded in the mail.
MS/MSD sample analyses will be required at the laboratory for each batch of thesediment sample matrices and one for each batch of soil samples. Additional samplevolume may be required for the field duplicates and MS/MSD samples as indicated inSection A.4.0.
Pace Laboratory Standard Operating Procedures for performing these analyses areincluded in Volume I, Appendix A, Laboratory Procedures, of the QAPP.
A.9.0 DATA VALIDATION AND REPORTING
A.9.1 Data Validation
Data validation begins with the laboratory analyst and continues until the data arereported. Individual analysts will verify the completion of the appropriate data forms toensure the completeness and correctness of data acquisition and reduction. All in-laboratory data validation will be conducted in accordance with methods delineated inthe USEPA’s "Test Methods for Evaluating Solid Waste, Physical/Chemical Methods"

Remediation Work Plan and Sampling and Analysis Plan 57ICS Soil Remediation and RemovalBloomington, IndianaJuly 2010
(SW-846), and “Manual for Chemical Analysis of Water and Wastes" (EPA 600/4-79-020).
CBS will perform additional data validation of analytical results. The data will bereviewed to ensure holding times are met, matrix spike recoveries are within acceptableranges, and blank sample results do not exceed acceptable concentrations. If PCBs aredetected in the blanks, the data will be evaluated on a case-by-case basis to assess theeffect on the project objective. When determined to be necessary, corrective actions,such as reanalysis or resampling and analysis, will be evaluated and implemented.
The quality assurance (QA) objectives for precision, accuracy, representativeness,completeness, and comparability of the data for this project are specified in the QAPP.Full data validation will be performed in accordance with the QAPP on 100 percent of thedata which will be used to support confirmation that the cleanup objectives have beenmet.
Field data will be recorded on the appropriate field record form or in a bound fieldsample logbook. All field data will be verified and reviewed by the Field SamplingManager.
A.9.2 Data Reporting
All results will be reported by the laboratory to the Field Sampling Leader or his designeeby sample batch and will be certified by the laboratory. Preliminary results will beforwarded by email or facsimile. Data turnaround time is two weeks following laboratoryreceipt of samples for delineation samples. Verification samples will have preliminaryresults reported the morning after courier pickup.
All reports and documentation required, including QC results will be clearly labeled withthe laboratory sample number and associated field sample number.
The analytical results will be adjusted for dry weight concentrations for sample resultsthat were screened at <55 ppm PCB. Color-coded, delineation maps showing final dryweight sample results will be generated for the Final Report.
Analytical results for PCBs will be given in units of mg/kg for solids and µg/L for liquidsamples. In addition to the analytical results and QC data, details regarding thecorrective actions taken and a discussion of any necessary modifications of theprotocols established in the referenced methods will be included in the final data report.Following completion of the field investigation and chemical analyses, CBS will preparea letter report that will include the following elements:
Observations made during collection of field samples.
Summary of any variances from the sampling plan or field sampling procedures,and the potential impact on data usability.
Tabulation and field maps of the analytical results, with cross-referencing to thesampling stations.
Discussion of the results determining if PCB content is consistent across anelevation within each separate flood plain. This will allow sediment removal to be

Remediation Work Plan and Sampling and Analysis Plan 58ICS Soil Remediation and RemovalBloomington, IndianaJuly 2010
performed, if necessary, within specified flood plain elevation contours. If PCBcontent and depth is not consistent across flood plain elevations within eacharea, additional delineation sampling may be required.

Remediation Work Plan and Sampling and Analysis Plan 59ICS Soil Remediation and RemovalBloomington, IndianaJuly 2010
References
1. “Agreed Amendment to the Consent Decree Providing for Remedial Actions at Neal’s Landfill, Lemon Lane Landfill and Bennett’s Dump and Addressing General Matters”, United States District Court for the Southern District of Indiana, Indianapolis, Division, entered July 24, 2009.,
2. “Statement of Work for the Remedial Action at Lemon Lane Landfill OU1” (USEPA May 2000)
3. “Sampling and Analysis Plan for Delineation of Contaminated Soils and Sediments - Illinois Central Spring, Swallow Hole and Quarry Springs Area,Associated with the Lemon Lane Landfill, Bloomington Indiana”, CBS, August 24, 2009
4. “Sampling and Analysis Plan for Delineation of Contaminated Soils and Sediments at Illinois Central Spring Emergence Area, Associated with the LemonLane Landfill, Bloomington Indiana”, CBS, December 18, 2009
5. “Remedial Design/Remedial Action Work Plan Operable Units 2 and 3 Site Groundwater and Sediments, Lemon Lane Landfill Site, Bloomington, MonroeCounty, Indiana”, CBS, January 2010
6. “Amendment 9 to the Bloomington Project QAPP”, CBS, February2010.
7. “Guidance for the Data Quality Objectives Process” (EPA QA/G-4, USEPA 2000)
Remediation Work Plan and Sampling and Analysis Plan 60ICS Soil Remediation and RemovalBloomington, IndianaJuly 2010
Table 1: ICS Emergence Area Previous DataSample
Date Sediments SoilsSample
Date Sediments SoilsSample
Date Sediments Soils1982 360 0.2 1999 26 2004 0.15 J1982 4.5 1999 6.8 2004 2.11982 9 1999 <1 2004 1.21983 5.8 1999 3.4 2004 < 0.131991 22 1999 2.1 2004 6.01991 58 1999 4.1 2008 71991 21 1999 <1 2008 61994 37.4 1999 <1 2008 1301995 28 6.4 1999 <1 2008 291995 17 3.4 1999 <1 2008 1301995 39 14.4 1999 <1 2008 791995 56 19.1 1999 <1 2008 261995 57 6 1999 10 2008 241995 1400 <1 1999 <1 2008 1201995 293 <1 1999 <1 2008 9.41995 107 133 1999 <1 2008 6.21995 500 56.7 1999 <1 2008 7.31995 27 2004 7.3 15 2008 5.71995 <1 2004 6 4.31995 4.2 2004 69.5 8.61995 <1 2004 4.1 2.41995 <1 2004 1.7 J 1.41995 <1 2004 9.5 2001995 107 2004 2.6 77.51995 >20 2004 10 4.21995 11.7 2004 171995 20 2004 641995 10.6 2004 1201995 30.8 2004 1.31995 133 20041995 3.6
Notes:1. All data is ppm dry basis.2. The bolded italicized data for soils in 1995 is immuno assay data3. Dupes are not shown separately. Rather the average for that location is shown.4. Some data that reflects sediment samples taken at the emergence in 2005 and 2006
for bench scale testing is not reflected.

Remediation Work Plan and Sampling and Analysis Plan 61ICS Soil Remediation and RemovalBloomington, IndianaJuly 2010
Table 2: Swallow Hole-Fence Area 2 Previous DataSample
Date Sediments SoilsSample
Date Sediments SoilsSample
Date Sediments Soils1982 65 1995 100 2004 12 0.501983 2.5 1995 <.8 2004 22 421991 7.8 1995 <.8 2004 9.9 6.91991 11 1995 13.7 2004 9.6 271991 17 1995 >20 2004 33 0.741991 4.1 1995 42.8 2004 10 0.261991 14 1995 21 2004 47 9.21991 6.7 1995 10 2004 130 0.25 J1991 14 1995 <.8 2004 0.18 J1991 2.5 1995 2004 141991 3.8 1995 2004 0.401994 165 2004 28 0.14 J 2004 < 0.131995 1100 <1 2004 25 2.8 2004 451995 950 <1 2004 27 5.1 2004 471995 275 <1 2004 24 28 2004 1.91995 270 <1 2004 44 14 1999 <11995 1100 <1 2004 48 0.64 1999 <11995 98 <1 2004 68 0.76 1999 <11995 130 <1 2004 41 1.0 1999 <11995 130 <1 2004 32 < 0.12 1999 <11995 25 <1 2004 23 13 1999 <11995 10 <1 2004 38 23 1999 <11995 8.4 <1 2004 21 1.0 1999 <11995 11 <1 2004 32 0.40 1999 <11995 <1 2004 34 < 0.13 1999 3.51995 <1 2004 35 < 0.13 1999 3.41995 <1 2004 39 < 0.161995 <1 2004 37 0.23 J1995 <1 2004 13 0.44
Note: All data is ppm dry basis

Remediation Work Plan and Sampling and Analysis Plan 62ICS Soil Remediation and RemovalBloomington, IndianaJuly 2010
Table 3: Quarry Springs Area Previous DataSample
Date Sediments SoilsSample
Date Sediments SoilsSample
Date Sediments Soils1981 0.5 2004 3.0 2.4 2004 < 0.161991 2.4 2004 4.6 7.1 2004 2.21991 0.69 2004 3.4 1.2 2004 0.881991 4.8 2004 2.4 0.12 J 2004 4.21991 0.56 2004 3.1 0.16 J 2004 4.61991 0.43 2004 3.1 4.2 2004 3.01991 1.6 2004 2.5 < 0.141991 0.87 2004 0.68 < 0.131991 0.58 2004 0.67 0.14 J1991 0.11 2004 0.24 J < 0.131991 0.61 2004 0.51 < 0.131991 5.4 2004 0.48 0.14 J1991 2.5 2004 0.24 J 8.41995 45.3 2004 0.74 0.351995 5.2 2004 0.83 191995 6.6 2004 0.34 281995 5.6 2004 0.28 < 0.151995 5.1 2004 6.1 < 0.131995 9.7 2004 3.6 6.21995 8.5 2004 3.0 < 0.131995 7.1 2004 48 0.671995 8 2004 25 0.471995 8.7 2004 37 < 0.131995 10 2004 16 < 0.131995 6.5 2004 < 0.161995 11 2004 < 0.161995 62 2004 1.8
Note: All data is ppm dry basis

Remediation Work Plan and Sampling and Analysis Plan 63ICS Soil Remediation and RemovalBloomington, IndianaJuly 2010
Table 4
IC Emergence AreaGrid Sampling Results
PCBs, ppm
15 x 15 Ft Grids
Sampling Interval, feet Bedrock IntervalGridID 0 - 1 1 - 2 2 - 3
bedrockInterval, ft
PCB Result,ppm
ED-01 0.06 ND ND 11 - 11.5 NDED-02 0.135 ND / ND ND 8 - 8.5 NDED-03 0.3 ND ND 15 - 16 ND / NDED-04 37 0.1 / 0.1 0.1 7 - 8 NDED-05 0.98 0.06 0.05 7 - 7.9 NDED-06 0.087 ND ND 11 - 12 NDED-07 0.5 0.1 / 0.1 0.8 6 - 7 NDED-08 5.3 0.15 ND 5 - 6 NDED-09 0.7 / 1.8 0.08 ND 10 - 11 1.18ED-10 2.6 0.15 0.06 8 - 9 0.45ED-11 0.4 0.07 / 0.1 0.14 8 - 8.8 0.44ED-12 0.48 ND ND 3 - 3.7 NDED-13 0.14 0.5 ND 11 - 12 2.26ED-14 35.6 0.05 7.4 4 - 5 NDED-15 23.2 0.5 na 1 - 1.8 0.5ED-16 1.6 0.8 0.08 8 - 8.2 0.1 / 0.1ED-17 4.75 0.06 0.06 8 - 8.2 NDED-18 9.4 1.85 ND 11 - 12 NDED-19 40.7 4.6 0.6 12 - 13 NDED-20 13.4 0.18 na 1 - 1.8 0.18ED-21 67.4 0.9 / 0.5 na 2 - 2.2 0.9ED-22 98.9 5.16 0.34 8 - 9 NDED-23 16.5 0.1 ND 8 - 8.5 NDED-24 1.53ED-25 0.2 / 0.3ED-26 0.1ED-27 0.3ED-28 2.51ED-29 0.48
-Special Waste Grid Interval, 10 ppm< PCB < 50 ppm
-TSCA Grid Interval, PCBs > 50 ppm
0.18 Bold result is at bedrock and therefore not the full depth intervalND Non Detectna not applicable

Remediation Work Plan and Sampling and Analysis Plan 64ICS Soil Remediation and RemovalBloomington, IndianaJuly 2010
Table 4 (continued)
IC Emergence AreaGrid Sampling Results
PCBs, ppm
30 x 30 Ft Grids
Sampling Interval, feetGrid ID 0 to 0.5 0.5 to 1.0DW-1 0.113DW-2 0.094DW-3 0.83DW-4 0.29DW-5 1.79DW-6 0.35DW-7 7.04 3.27DW-8 0.24DW-9 2.84 / 3.13DW-10 3.79DW-11 0.69DW-12 1.02DW-13 1.41DW-14 0.58DW-15 0.34DW-16 0.13 / 0.09DW-17 0.099

Remediation Work Plan and Sampling and Analysis Plan 65ICS Soil Remediation and RemovalBloomington, IndianaJuly 2010
Table 5
IC Quarry Springs AreaGrid Sampling Results
PCBs, ppm
Sampling Interval, feetSample
ID Grid ID 0 to 0.5 0.5 to 1.0 1.0 to 1.5 1.5 to 2.0
A3 1.3 / 0.94 0.64A4 0.74 1.2 0.9A5 26 34.9 0.742A6 6.7 0.439A7 1.1A8 ND / ND
AA5 2.2 3.1B5 NDB6 14 5.7 0.3B7 1.7B8 NDC6 8C7 NDC8 3.0 / 4.7D6 4.4 / 2.7D7 0.94 / 1.4D8 2.1E6 2.4E7 1.9F6 ND / NDF7 NDG6 NDG7 0.92H2 NDH3 NDH6 0.96H7 2.9I2 NDI3 NDI4 ND / NDI5 1.6I6 4.6I7 10.7 1.9I8 3.6J2 5.6 0.916J3 1.3J4 2.5J5 15.5 3.1

Remediation Work Plan and Sampling and Analysis Plan 66ICS Soil Remediation and RemovalBloomington, IndianaJuly 2010
Table 5 (continued)
IC Quarry Springs AreaGrid Sampling Results
PCBs, ppm
Sampling Interval, feetSample
ID Grid ID 0 to 0.5 0.5 to 1.0 1.0 to 1.5 1.5 to 2.0J6 0.75 / 0.62J7 8.8 0.133J8 NDK2 2.6K3 2.1K4 1.1K5 1.1K6 0.5K7 6.8 2.38K8 1.0 / 0.7L1 1.3L2 1.5L7 NDM1 0.58
DEX03 M1 0.98M2 1.1Y3 0.65 / ND NDY4 20.1 8.2 1.9Y5 1.7 1.8Y7 0.5
DEX02 Z3 13.5 1.1A00 Z4 19.6 11.7 11.1 4.63A0 Z6 15.6 0.7 0.4
Z7 15.4 0.214Z8 0.2
DEX01 16.6CSG 0.86
-Grid Interval, 5 ppm< PCB <10 ppm
-Special Waste Grid Interval, 10 ppm< PCB < 50 ppm
ND -Non Detect
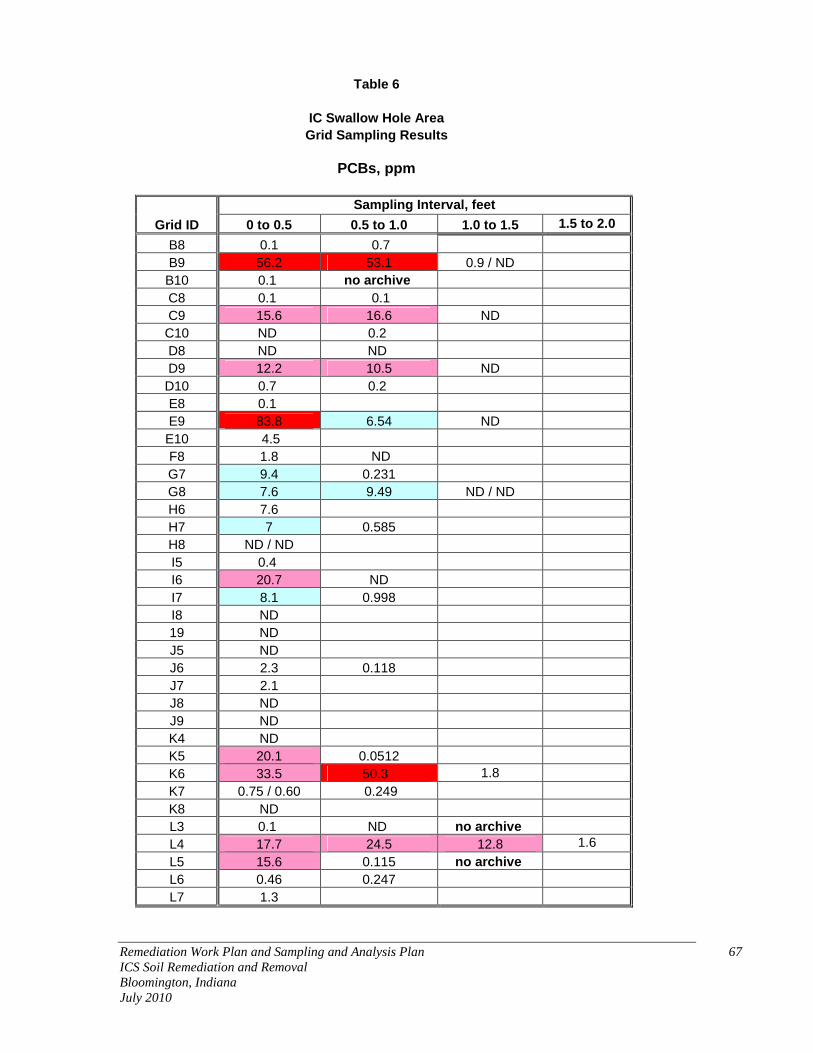
Remediation Work Plan and Sampling and Analysis Plan 67ICS Soil Remediation and RemovalBloomington, IndianaJuly 2010
Table 6
IC Swallow Hole AreaGrid Sampling Results
PCBs, ppm
Sampling Interval, feet
Grid ID 0 to 0.5 0.5 to 1.0 1.0 to 1.5 1.5 to 2.0
B8 0.1 0.7B9 56.2 53.1 0.9 / NDB10 0.1 no archiveC8 0.1 0.1C9 15.6 16.6 NDC10 ND 0.2D8 ND NDD9 12.2 10.5 NDD10 0.7 0.2E8 0.1E9 83.8 6.54 NDE10 4.5F8 1.8 NDG7 9.4 0.231G8 7.6 9.49 ND / NDH6 7.6H7 7 0.585H8 ND / NDI5 0.4I6 20.7 NDI7 8.1 0.998I8 ND19 NDJ5 NDJ6 2.3 0.118J7 2.1J8 NDJ9 NDK4 NDK5 20.1 0.0512K6 33.5 50.3 1.8K7 0.75 / 0.60 0.249K8 NDL3 0.1 ND no archiveL4 17.7 24.5 12.8 1.6L5 15.6 0.115 no archiveL6 0.46 0.247L7 1.3

Remediation Work Plan and Sampling and Analysis Plan 68ICS Soil Remediation and RemovalBloomington, IndianaJuly 2010
Table 6 (continued)
IC Swallow Hole AreaGrid Sampling Results
PCBs, ppm
Sampling Interval, feet
Grid ID 0 to 0.5 0.5 to 1.0 1.0 to 1.5 1.5 to 2.0
L8 NDM3 3.6M4 27.2 1.23 no archiveM5 5.2M6 3.7N2 0.56N3 82.5 0.371N4 2.5N5 15.8 0.2N6 5.7 0.307O2 0.72O3 94.1 2.42O4 2.3 / 3.1O5 34 1.16O6 11.5 0.231O7 NDP1 NDP2 6P3 85 0.83P4 45 3.27P5 13.1 0.386P6 47.7 0.096P7 NDQ1 NDQ2 NDQ3 54 / 47 0.455Q4 15.4 0.33Q5 36.1 / 32.3 1.07Q6 65.8 / 76.5 8.84 0.1Q7 0.3R2 0.81R3 1.6R4 30.1 0.525R5 41.6 1.84R6 15 / 19.8 0.109R7 0.1S3 0.87S4 4.9

Remediation Work Plan and Sampling and Analysis Plan 69ICS Soil Remediation and RemovalBloomington, IndianaJuly 2010
Table 6 (continued)
IC Swallow Hole AreaGrid Sampling Results
PCBs, ppm
Sampling Interval, feetGrid ID 0 to 0.5 0.5 to 1.0 1.0 to 1.5 1.5 to 2.0
S5 1.9S6 5.3 0.141T4 NDT5 0.56T6 ND / NDU6 ND
-Grid Interval, 5 ppm< PCB <10 ppm
-Special Waste Grid Interval, 10 ppm< PCB < 50 ppm
-TSCA Grid Interval, PCBs > 50 ppm
ND -Non Detect
no archive -sample will be taken upon mobilization

Remediation Work Plan and Sampling and Analysis Plan 70ICS Soil Remediation and RemovalBloomington, IndianaJuly 2010
Table 7Sample Requirements
Illinois Central Spring Flood Plain Remediation SamplingBloomington, Indiana
SampleDesignation
prefix
DelineationSamples(Actual)
Grid BottomVerificationSamples**
FinalDrainageway
CompositeSamples
StockpileCompositeSamples
Emergence Area EM 123 1 (ED-22) 4 1
Swallow Hole Area SH 147* 3 (E9, O3 & P3) 12 3overflow channels, 760' 15TSCA segments, 100' 2
Quarry Springs Area QS 101 1 (A5) 15 3
Totals 371 5 48 7
* includes 4 samples that will be taken during mobilization** Grids with the highest PCB content where post-excavation verification samples will be taken
Notes:1. Hold time for solids properly preserved can be up to 1 year until extract, 40 days for extract.2. Hold time for liquids is 7 days until extraction, 40 days for extract3. All samples are to be analyzed for Aroclor PCBs via EPA method 8082 and solids will also be
analyzed for percent solids to determine PCBs on a dry weight basis via Standard Methods 2540b.4. Sample containers will be amber glass, 4 oz for soil samples, 1 liter for liquids5. The samples are to be sent to Heritage Labs in Indianapolis.6. Solid samples will be extracted per EPA SW 846 35507. Liquid samples will be extracted per EPA SW 846 3510c8. All samples are to be chilled to 4 degrees C for preservation9. The reporting limit for all soils is 0.1 ppm and for liquids is 0.1 ppb. The solid reporting limit is
on a wet basis. Dry basis reporting limit is typically 20% higher.10. Duplicates will be collected at a frequency of one duplicate per ten samples collected.11. Rinseate samples will be collected in the field at a frequency of one per day.