final report on the collapse of the dallas cowboys indoor
TRANSCRIPT
NISTIR 7661
Final Report on the Collapse of the Dallas Cowboys Indoor Practice Facility, May 2, 2009
John L. Gross Joseph A. Main
Long T. Phan Fahim H. Sadek Stephen A. Cauffman
David P. Jorgensen

NISTIR 7661
Final Report on the Collapse of the Dallas Cowboys Indoor Practice Facility, May 2, 2009 John L. Gross Joseph A. Main
Long T. Phan Fahim H. Sadek Stephen A. Cauffman
Building and Fire Research Laboratory National Institute of Standards and Technology
David P. Jorgensen National Severe Storms Laboratory National Oceanic and Atmospheric Administration
January 2010
U.S. Department of Commerce Gary Locke, Secretary National Institute of Standards and Technology Patrick D. Gallagher, Director

iii
Disclaimer
Certain commercial entities, equipment, products, or materials are identified in this document in order to describe a procedure or concept adequately or to trace the history of the procedures and practices used. Such identification is not intended to imply recommendation, endorsement, or implication that the entities, products, materials, or equipment are necessarily the best available for the purpose. Nor does such identification imply a finding of fault or negligence by the National Institute of Standards and Technology.
Disclaimer
The policy of NIST is to use the International System of Units (metric units) in all publications. In this document, however, units are presented in metric units or the inch-pound system, whichever is prevalent in the discipline.
Disclaimer
Although this report discusses building codes and buildings built within the jurisdiction where those codes applied, NIST takes no position as to whether the design or construction of any building was compliant with any code.
Use in Legal Proceedings
No part of this report may be used in any suit or action for damages arising out of any matter mentioned in this report (15 USC 281a).
U.S. GOVERNMENT PRINTING OFFICE WASHINGTON: 2005 _________________________________________ For sale by the Superintendent of Documents, U.S. Government Printing Office Internet: bookstore.gpo.gov — Phone: (202) 512-1800 — Fax: (202) 512-2250 Mail: Stop SSOP, Washington, DC 20402-000

iv
This page intentionally left blank.
v
ABSTRACT
This report summarizes the National Institute of Standards and Technology (NIST) study of the collapse of the Dallas Cowboys indoor practice facility that occurred on the afternoon of May 2, 2009, during a severe thunderstorm. The indoor practice facility was a fabric-covered tubular steel frame structure, designed and constructed in 2003. The structure was upgraded in 2008 with additional purlins, reinforcements for some members, and a new fabric roof covering. The report reviews the wind environment during the storm and outlines the wind conditions, including wind speed and direction at the time and location of collapse. The report also details the NIST field reconnaissance, including the survey of the collapsed structure and of wind damage to the surrounding areas, eyewitness interviews, and information collected from the Dallas Cowboys organization and from the City of Irving, Texas. The survey identified collapse patterns and structural failure modes.
The report summarizes the analyses conducted to review the structural design of the practice facility under dead and wind loads, and to identify factors that might have contributed to the collapse. A two-dimensional structural model of a typical frame of the practice facility was developed and analyzed under various loading conditions. Specifically, the analyses included: (1) a Baseline Case that calculated the design demand-capacity ratios using wind loads specified in the ASCE 7-05 Standard and member capacities based on the AISC specifications to assess the ability of the structure to support design wind loads, (2) evaluation of the assumptions and calculations in the 2003 original design and 2008 upgrade to ascertain how those two designs differed from the Baseline Case, and (3) response of the structure to the wind conditions observed during the wind storm of May 2, 2009, to identify frame members that were overstressed and explain the observed failure modes.
The principal findings of this study are summarized in this report and include the definition of the wind environment that affected the practice facility on May 2, 2009, possible factors contributing to the collapse of the facility, and likely collapse sequence. The report concludes with a recommendation for action for improving the safety of fabric-covered frame structures and ensuring the adequate performance of such structures under design wind loads.
Keywords: Failure analysis, fabric-covered frame structures, microburst, steel structure, structural collapse, wind loads.

vi
This page intentionally left blank.
vii
TABLE OF CONTENTS
Abstract ......................................................................................................................................................... v
Table of Contents ........................................................................................................................................ vii
List of Figures .............................................................................................................................................. xi
List of Tables .............................................................................................................................................. xv
List of Acronyms and Abbreviations ........................................................................................................ xvii
Executive Summary ................................................................................................................................... xix
ES.1 Introduction ................................................................................................................................... xix
ES.2 Scope of Study .............................................................................................................................. xix
ES.3 Wind Environment on May 2, 2009 ............................................................................................. xxi
ES.4 Principal Findings ........................................................................................................................ xxii
ES.5 Recommendation ........................................................................................................................ xxiv
Chapter 1 Introduction .................................................................................................................. 1
1.1 Dallas Cowboys Indoor Practice Facility......................................................................................... 1
1.2 Structural Framing of Indoor Practice Facility ................................................................................ 3
1.3 Collapse of the Indoor Practice Facility on May 2, 2009 ................................................................ 5
1.4 Overview and Scope of the NIST Study .......................................................................................... 6
1.4.1 Field Reconnaissance and Data Collection .......................................................................... 6
1.4.2 Review of Wind Loads and Analysis of Structural Response .............................................. 7
1.5 Peer Review of Report ..................................................................................................................... 8
1.6 Organization of Report .................................................................................................................... 9
Chapter 2 Wind Environment on May 2, 2009 ........................................................................... 11
2.1 Meteorological Report ................................................................................................................... 11
2.2 Wind Damage Surveys .................................................................................................................. 12
2.2.1 NIST Field Reconnaissance ............................................................................................... 12
2.2.2 City of Irving Damage Survey ........................................................................................... 13
2.3 Storm Wind Data ........................................................................................................................... 18
2.3.1 Evolution of the May 2nd Storm from 3:00 PM to 3:40 PM ............................................. 18
2.3.2 NWS/ASOS Wind Information .......................................................................................... 19
2.3.3 Doppler Radar Information ................................................................................................ 23
2.3.4 Microburst Morphology ..................................................................................................... 24
Table of Contents
viii
2.3.5 Theoretical Maximum Microburst Winds .......................................................................... 25
2.4 Summary of the Wind Environment .............................................................................................. 26
Chapter 3 Field Reconnaissance and Damage Survey ............................................................ 29
3.1 Analysis of Video of the Collapse ................................................................................................. 29
3.2 Eyewitness Account of the Collapse .............................................................................................. 30
3.3 Survey of Collapsed Structure ....................................................................................................... 31
3.3.1 Pattern of Overall Collapse ................................................................................................ 31
3.3.2 Observed Failures ............................................................................................................... 34
Chapter 4 Review of Structural Design of Practice Facility ..................................................... 39
4.1 Design Bases for Wind .................................................................................................................. 39
4.1.1 Design Wind Loads Based on ASCE 7-98 and ASCE 7-05 Standard Provisions .............. 39
4.1.2 Review of the Design Wind Loads in the Original 2003 Design ....................................... 45
4.1.3 Review of the Design Wind Loads in the 2008 Upgrade ................................................... 47
4.2 Design Member Capacities ............................................................................................................ 50
4.2.1 Material Properties ............................................................................................................. 50
4.2.2 Effective Lengths ............................................................................................................... 51
4.2.3 Reinforcement – 2008 Upgrade .......................................................................................... 53
4.2.4 Capacity Calculation Assumptions ..................................................................................... 55
4.2.5 Design Member Capacity Sets ........................................................................................... 56
4.2.6 Member Capacity Comparison – Original 2003 Design .................................................... 59
4.2.7 Member Capacity Calculations – Nominal Strength .......................................................... 61
4.2.8 Connection Capacities ........................................................................................................ 61
Chapter 5 Structural Analysis of Practice Facility .................................................................... 63
5.1 Finite Element Model Development .............................................................................................. 63
5.2 Analysis Under Design Wind Loads – Baseline Case ................................................................... 67
5.3 Influence of Wind Load Assumptions ........................................................................................... 73
5.4 Influence of Member Capacity Assumptions ................................................................................. 76
5.5 Analysis Using Estimated Wind Loads on May 2, 2009 ............................................................... 77
5.6 Summary and Discussion of Analysis Results ............................................................................... 79
5.6.1 Analysis under Design Loads ............................................................................................. 79
5.6.2 Analysis under Estimated Loads on May 2, 2009 .............................................................. 81
Chapter 6 Findings ...................................................................................................................... 83

Table of Contents
ix
6.1 Wind Environment on May 2, 2009 .............................................................................................. 83
6.2 Possible Factors Contributing to Building Collapse ...................................................................... 83
6.3 Likely Collapse Sequence .............................................................................................................. 84
Chapter 7 Recommendations ..................................................................................................... 87
7.1 General ........................................................................................................................................... 87
7.2 NIST Recommendation ................................................................................................................. 88
REFERENCES ........................................................................................................................... 91
Appendix A LIST OF SUBJECT MATTER EXPERTS ................................................................. 93
Appendix B SAMPLE CAPACITY CALCULATION ..................................................................... 95

x
This page intentionally left blank.
xi
LIST OF FIGURES
Figure ES–1 Nomenclature ...................................................................................................................... xxii
Figure ES–2 Pattern of overall collapse of the north portion of the structure ........................................ xxiii
Figure 1–1 Exterior view from north of practice facility under construction .............................................. 2
Figure 1–2 Interior view from south of practice facility .............................................................................. 2
Figure 1–3 Typical steel gable frame of the practice facility ....................................................................... 3
Figure 1–4 Nomenclature and key features ................................................................................................. 3
Figure 1–5 Plan view showing cross bracing ............................................................................................... 4
Figure 1–6 Elevation and section views showing location of purlins and sway bracing ............................. 5
Figure 1–7 Overall view of collapsed structure after fabric had been removed .......................................... 6
Figure 2–1 Wind damage to tree limbs east of the collapsed structure ...................................................... 13
Figure 2–2 Wind damage to tree limb west of the collapsed structure ...................................................... 13
Figure 2–3 Locations of sites with wind damage in area surrounding the collapse site ............................ 15
Figure 2–4 Wind damage to neighborhoods surrounding the practice facility .......................................... 16
Figure 2–4 (Cont’d) Wind damage to neighborhoods surrounding the practice facility .......................... 17
Figure 2–5 Locations of ASOS stations (KDFW and KDAL) and TDWR stations (TDFW and TDAL). The collapse site is marked by an X ......................................................................... 20
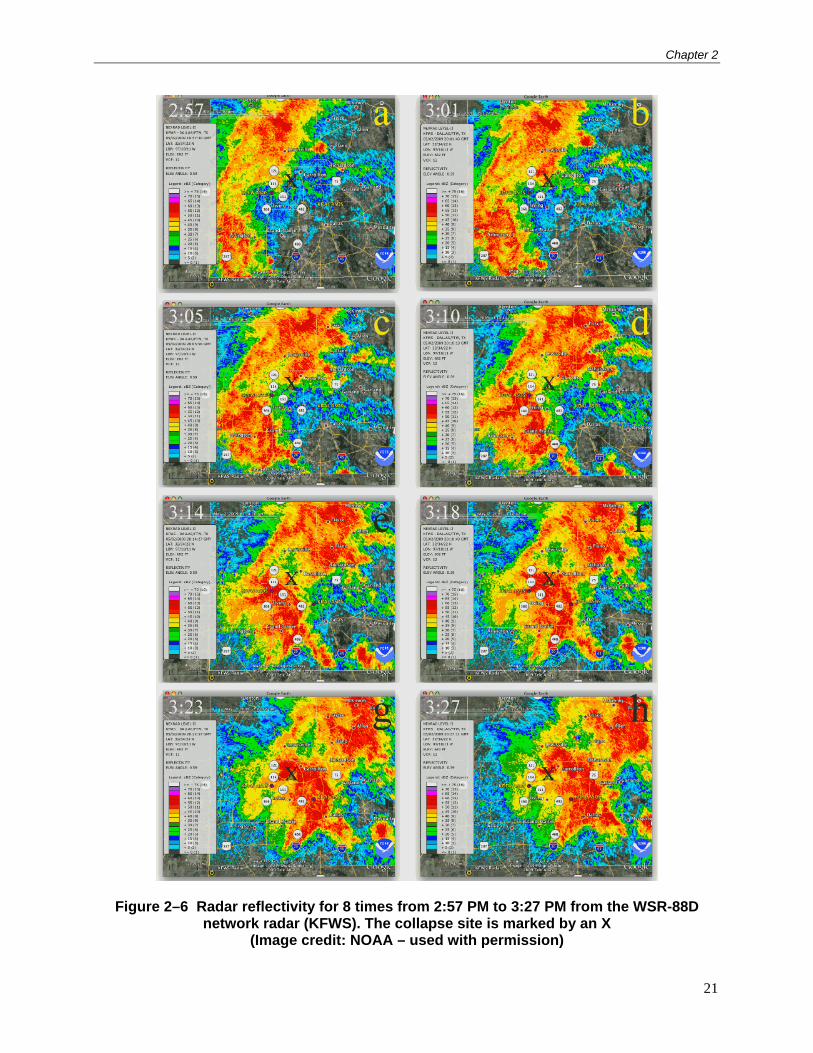
Figure 2–6 Radar reflectivity for 8 times from 2:57 PM to 3:27 PM from the WSR-88D network radar (KFWS). The collapse site is marked by an X .............................................................. 21
Figure 2–7 Wind speed (top) and direction (bottom) at the KDFW ASOS station ................................... 22
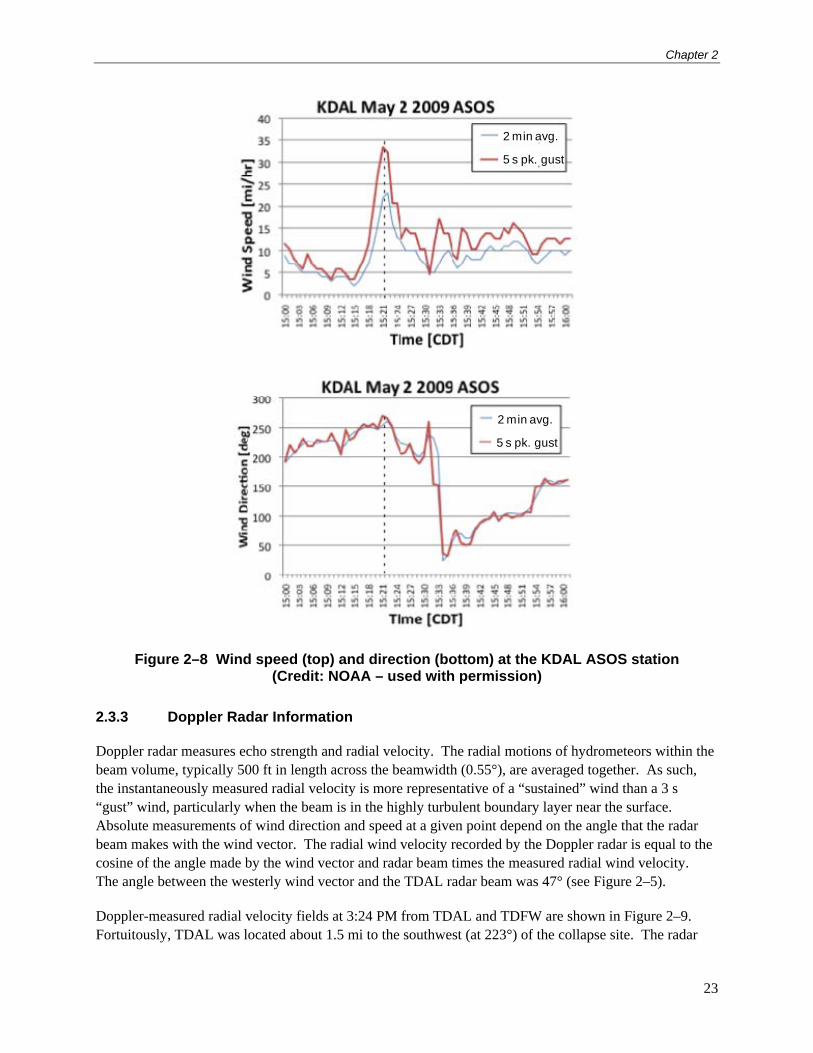
Figure 2–8 Wind speed (top) and direction (bottom) at the KDAL ASOS station .................................... 23
Figure 2–9 TDWR radial velocity plots from TDAL (left) and TDFW (right). Red colors indicate flow away from the radar, green colors indicate flow toward the radar. Location of the collapse site is designated as “Home” .................................................................................... 26
Figure 2–10 Idealized vertical cross section through a microburst (based on Caracena et al., 1989) ....... 26
Figure 3–1 Two frames from the video showing motion of inner fabric liner ........................................... 29
Figure 3–2 Two frames from the video showing swaying of the lights ..................................................... 30
Figure 3–3 Frame from the video showing opening of roll-up door .......................................................... 30
Figure 3–4 View of (a) southern and (b) northern portions of the collapsed structure .............................. 32
Figure 3–5 Pattern of overall collapse of the southern portion of the structure ......................................... 33
Figure 3–6 Pattern of overall collapse of the northern portion of the structure ......................................... 33
Figure 3–7 Fracture of inner and outer chords at the keystone .................................................................. 35
Figure 3–8 Keystone chords bent down (note roof is upside down) .......................................................... 35
Figure 3–9 Failure of inner chord near the splice at the west knees ........................................................... 36
List of Figures
xii
Figure 3–10 Failure of both outer leg chord and eaves chord .................................................................... 36
Figure 3–11 Out-of-plane buckling of inner chord in north portion of collapsed structure ....................... 37
Figure 3–12 Out-of-plane buckling of inner chords in north portion of collapsed structure ..................... 38
Figure 3–13 Failure of bracing cable connections: (a) intact, (b) failed .................................................... 38
Figure 4–1 Openings in the building envelope .......................................................................................... 42
Figure 4–2 External wind loads for wind normal to ridge: (a) maximum suction; (b) positive pressure on windward roof ..................................................................................................... 43
Figure 4–3 External wind loads for wind parallel to ridge, frame located within 66.4 ft from end frame: (a) maximum suction; (b) reduced suction ................................................................. 44
Figure 4–4 Wind loads due to internal pressure: (a) enclosed building; (b) partially enclosed building .................................................................................................................................. 45
Figure 4–5 External wind loads from the original 2003 design: (a) Case A; (b) Case B .......................... 47
Figure 4–6 External wind loads from the 2008 upgrade for wind normal to ridge: (a) Maximum suction; (b) reduced suction ................................................................................................... 49
Figure 4–7 External wind loads from the 2008 upgrade for wind parallel to ridge ................................... 49
Figure 4–8 Internal wind loads from the 2008 upgrade: enclosed building ............................................... 50
Figure 4–9 Selected unbraced lengths used in stability calculations ......................................................... 52
Figure 4–10 Reinforcement added in 2008 ................................................................................................ 53
Figure 4–11 Collapsed structure showing reinforcement added in the knee region .................................. 54
Figure 4–12 Schematic of inner knee ........................................................................................................ 62
Figure 5–1 Finite element model of a typical interior frame ..................................................................... 64
Figure 5–2 View of finite element model showing connection eccentricities ........................................... 64
Figure 5–3 Preload due to specified fabric tension of 50 plf ..................................................................... 66
Figure 5–4 Axial forces under load combination 1.2 D + 1.6 W4 (Red: compression; blue: tension; wind from left) ....................................................................................................................... 68
Figure 5–5 Bending moments under load combination 1.2 D + 1.6 W4 (Red: negative; blue: positive; wind from left) ........................................................................................................ 68
Figure 5–6 Shear forces under load combination 1.2 D + 1.6 W4 (Red: negative; blue: positive; wind direction is from the left) ............................................................................................... 69
Figure 5–7 Deflections under load combination 1.2 D + 1.6 W4 (Wind from left; deflections scaled up by a factor of 4) ................................................................................................................. 69
Figure 5–8 Demand-capacity ratios for moment-axial interaction (DCRP/M) under design wind load combinations C1 and C2 (Member Capacity Set B) ............................................................... 71
Figure 5–9 Demand-capacity ratios for axial force only (DCRP) under design wind load combinations C1 and C2 (Member Capacity Set B) .............................................................. 71
Figure 5–10 Demand-capacity ratios for shear force only (DCRV) under design wind load combinations C1 and C2 (added reinforcement is assumed to not affect shear capacities)............................................................................................................................... 72
xiii
Figure 5–11 Unfactored DCRP/M values for 60 mph wind normal to ridge (wind from left) ................... 78
Figure 5–12 Unfactored DCRV values with 60 mph wind normal to ridge (wind from left) .................... 79

xiv
This page intentionally left blank.
xv
LIST OF TABLES
Table 2–1 Observation stations used in this study ..................................................................................... 18
Table 4–1 Frame member properties ......................................................................................................... 55
Table 4–2 Member Capacity Sets .............................................................................................................. 57
Table 4–3 Member Capacity Set A ............................................................................................................ 57
Table 4–4 Member Capacity Set B ............................................................................................................ 58
Table 4–5 Member Capacity Set C ............................................................................................................ 59
Table 4–6 Comparison of member axial capacities calculated by NIST (Set A) and in the original 2003 designMember .............................................................................................................. 60
Table 4–7 Nominal Member Capacities (Set B with factors equal to 1.0) ............................................. 61
Table 5–1 Dead loads for a typical interior frame with bay spacing of 15 ft ............................................. 65
Table 5–2 Comparison of gust-effect factors calculated for rigid and flexible structures ......................... 66
Table 5–3 Frame deflections under unfactored wind load cases ............................................................... 72
Table 5–4 DCRs for selected member types under different assumptions in wind loads (Member Capacity Set B) ...................................................................................................................... 75
Table 5–5 DCRs for selected member types under different assumptions in member capacity calculations (for wind load combinations C1 and C2) ............................................................ 76

xvi
This page intentionally left blank.
xvii
LIST OF ACRONYMS AND ABBREVIATIONS
Acronyms
AISC American Institute of Steel Construction
AISI American Iron and Steel Institute
ASCE American Society of Civil Engineers
ASOS Automated Surface Observing System
ASTM ASTM International
CDT Central Daylight Time
CSA Canadian Standards Association
DCR Demand-Capacity Ratio
FAA Federal Aviation Administration
IBC International Building Code
LRFD Load and Resistance Factor Design
NIST National Institute of Standards and Technology
NOAA National Oceanic and Atmospheric Administration
NWS National Weather Service
SEI Structural Engineering Institute
TDWR Terminal Doppler Weather Radar
UBC Uniform Building Code
WI Wind Intensity
WSR Weather Service Radar
Abbreviations
plus or minus
dBZ decibels of equivalent reflectivity (Z) of a radar signal reflected off a remote object
ft foot
ft2 square foot
Fy yield strength
h hour
in inch
List of Acronyms and Abbreviations
xviii
kip a force unit equal to 1,000 pounds
ksi 1,000 pounds per square inch
lb pound
mi mile
min minute
mph miles per hour
plf pounds per linear foot
psf pounds per square foot
s second
xix
EXECUTIVE SUMMARY
ES.1 INTRODUCTION
This report documents the National Institute of Standards and Technology (NIST) response to the collapse of the Dallas Cowboys indoor practice facility. The practice facility was a gable-roofed steel frame structure measuring 204 ft by 406 ft in plan and 86 ft high at the ridge, with a tensioned fabric covering. The facility was designed and constructed in 2003, and in 2008 the structure was upgraded by reinforcing some members, adding purlins, and installing a new roof covering. The facility collapsed on the afternoon of May 2, 2009, during a severe thunderstorm, injuring 12 people, one seriously.
In response to this building collapse, NIST deployed a reconnaissance team that arrived at the collapse site on May 12, 2009, after the collapsed steel structure had been stabilized and the fabric covering had been removed. The reconnaissance team: (1) surveyed and documented the collapsed structure, (2) surveyed other wind damage in the area surrounding the site, and (3) collected relevant data and information on the structure from the Dallas Cowboys organization and the City of Irving, Texas. Based upon the initial field reconnaissance, NIST determined that sufficient information was available to conduct a study of the collapse.
The objectives of the NIST study were to (1) determine why and how the Dallas Cowboys practice facility collapsed and (2) identify areas for improvement to current building codes, standards, and practices for this type of structure. The NIST team conducted a thorough review of (1) the design drawings and calculations for the original 2003 design and the 2008 upgrade, and (2) observations from the damage survey. NIST also worked in collaboration with the National Oceanic and Atmospheric Administration (NOAA) National Severe Storms Laboratory to obtain and interpret relevant data on the storm with a view to estimating the wind conditions during the event. These steps were followed by an analytical study to review the structural design of the practice facility under dead and wind loads. The following sections summarize the NIST study, findings, and resulting recommendation.
ES.2 SCOPE OF STUDY
NIST deployed a reconnaissance team of three structural engineers to survey and document the collapse and obtain available documents related to the design and upgrade of the structure. The Dallas Cowboys organization granted NIST access to the site and provided information related to the original 2003 design, the 2008 upgrade, and the collapse on May 2, 2009. The NIST team also met with building officials of the City of Irving, Texas, and obtained documents related to the construction permits and occupancy approval for the practice facility. The building officials also provided NIST with photographs taken by the building department staff documenting wind damage to the area surrounding the facility.
The NIST team conducted telephone interviews with Summit Structures, LLC, the firm responsible for the structural design, fabrication, installation, and upgrade of the structure, and with Manhattan Construction, the company listed as the contractor in the building permit application, regarding their respective roles in the design, construction, and upgrade of the training facility.
Executive Summary
xx
The data that were collected by the NIST team for the purpose of this study included the following:
Design drawings and calculations (provided by the Dallas Cowboys organization), including
– The 2003 original design
– The 2008 structural upgrade and re-roofing
Building permit documentation (provided by the City of Irving, TX)
Photographic and videographic data
– Field reconnaissance and damage survey conducted by the NIST team
– Damage to surrounding areas provided by the City of Irving
– Video recording of the collapse of the facility provided by WFAA-TV
Interviews conducted by the NIST team included representatives of:
The Dallas Cowboys Organization (including an eyewitness to the collapse)
The City of Irving (Building Department)
Summit Structures, LLC
Manhattan Construction
A copy of the original 2003 design documents – described as the documents used for the building permit application – was obtained from the Dallas Cowboys organization. These documents carried the seal and signature of the Professional Engineer responsible for the design and included drawings and design calculations. The drawings identified the building as a Summit Structures Pinnacle Building Series 5 and included information on the gable frames, the layout of bracing and purlins between frames, types and layout of exterior and liner fabric, and details of the concrete corner caissons and grade beams. Design calculations included a summary of member capacities, wind load assumptions, and computer output of the structural analysis indicating the required strengths of the structural members. Additionally, NIST was provided with a set of design calculations covering the revised structural analysis conducted in 2008 as part of the structural upgrade and re-roofing, which was also signed by a Professional Engineer.
The NIST analytical study included (1) the development of a structural model of a typical frame of the practice facility and (2) analysis of the model under a variety of loading conditions. The analyses conducted were as follows:
First, a Baseline Case analysis was performed to calculate the demand-capacity ratios (DCRs) of the structural frame members and assess the ability of the structure, as built and reinforced, to support design wind loads. The design wind loads in this analysis were based on the provisions of the American Society

Executive Summary
xxi
of Civil Engineers (ASCE) Standard, ASCE 7-05. The member design strengths (or capacities) were calculated using the 2005 American Institute of Steel Construction (AISC) specifications. The analysis determined the extent to which the member demands exceeded their design capacities (design DCR values exceeding 1.0).
Next, a set of analyses was carried out to determine how the original 2003 design calculations and the 2008 upgrade calculations differed from those of the Baseline Case and to examine the influence of these differences on the resulting DCRs. A review of the wind loads used in the original 2003 design indicated that the design wind loads differed substantially from those based on the ASCE 7-05 Standard provisions (equivalent to the wind loads based on the ASCE 7-98 Standard used in the original design). The wind loads used in the 2008 upgrade also differed from those based on the ASCE 7-05 Standard provisions used in the upgrade. In addition, the member capacities used in the original 2003 design differed from values calculated by NIST (based on the AISC specifications) mainly due to differences in the underlying assumptions, in particular, the role of the roof fabric in providing lateral support to the frames.
Finally, an analysis was performed to determine the DCRs during the event and to identify structural members that were overstressed. The analysis used wind loads based on the wind conditions estimated to have affected the facility on May 2, 2009. These analysis results were consistent with and helped to explain the observed failure modes of the structure.
ES.3 WIND ENVIRONMENT ON MAY 2, 2009
The NIST team collected data from several sources to estimate the wind speed and direction at the time and location of collapse. In addition to observations of the collapsed practice facility, sources of data included:
1. A review of the Public Information Statement issued by the National Weather Service on May 2, 2009, indicating that a microburst had impacted the Valley Ranch area of far North Irving.
2. A survey of wind damage to trees and other structures within the Dallas Cowboys Complex.
3. Observations of wind damage in the neighboring areas by officials from the City of Irving.
4. Data from Advanced Surface Observing Station (ASOS) anemometers located at Dallas/Fort Worth International Airport and Love Field Airport.
5. Data from the Terminal Doppler Weather Radars for Dallas/Fort Worth International Airport and Love Field Airport.
The NOAA National Severe Storms Laboratory provided analysis of the data and estimated the range of maximum wind speeds possible with this storm. Taken together, the information outlined above indicates the following wind conditions at the time and location of the collapse:
Wind direction: The practice facility experienced the effects of a predominantly westerly lateral wind field (perhaps slightly west-southwesterly). The “stagnation point,” or the demarcation center of downdraft winds, was located about one mile southwest of the collapse site at the time of maximum near-surface winds.
Executive Summary
xxii
Wind speed: The best estimate of the maximum near-surface wind speed gusts at the collapse site was in the range of 55 mph to 65 mph.
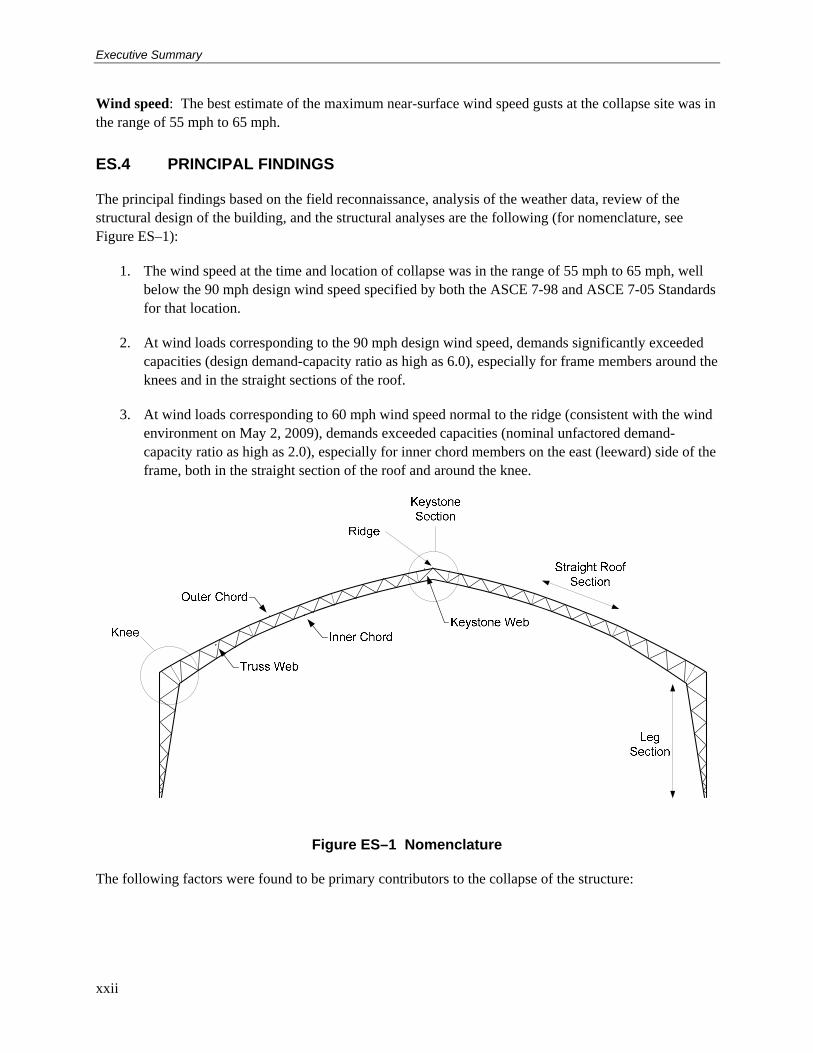
ES.4 PRINCIPAL FINDINGS
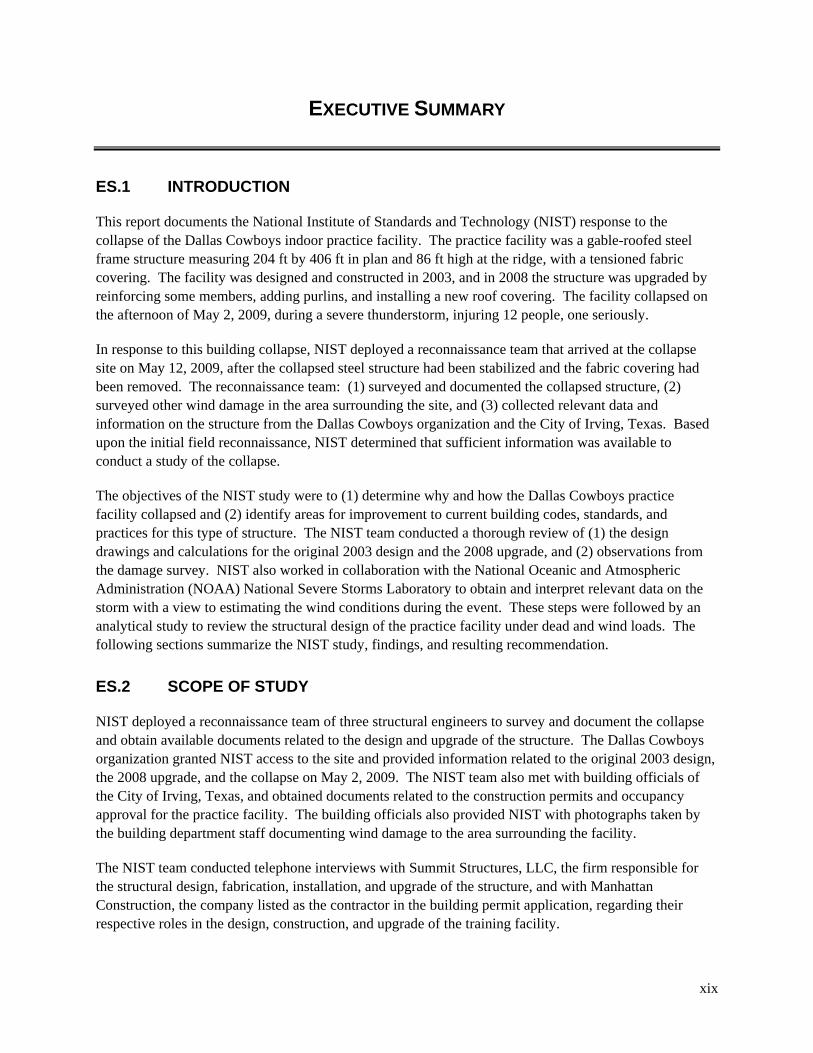
The principal findings based on the field reconnaissance, analysis of the weather data, review of the structural design of the building, and the structural analyses are the following (for nomenclature, see Figure ES–1):
1. The wind speed at the time and location of collapse was in the range of 55 mph to 65 mph, well below the 90 mph design wind speed specified by both the ASCE 7-98 and ASCE 7-05 Standards for that location.
2. At wind loads corresponding to the 90 mph design wind speed, demands significantly exceeded capacities (design demand-capacity ratio as high as 6.0), especially for frame members around the knees and in the straight sections of the roof.
3. At wind loads corresponding to 60 mph wind speed normal to the ridge (consistent with the wind environment on May 2, 2009), demands exceeded capacities (nominal unfactored demand-capacity ratio as high as 2.0), especially for inner chord members on the east (leeward) side of the frame, both in the straight section of the roof and around the knee.
Figure ES–1 Nomenclature
The following factors were found to be primary contributors to the collapse of the structure:
Executive Summary
xxiii
1. Wind loads used for both the original 2003 design and for the 2008 upgrade differed from wind loads calculated based on the provisions of both the ASCE 7-98 and ASCE 7-05 Standards, producing significantly lower design demands.
2. Frame member capacities reported in the original 2003 design were considerably larger than the capacities calculated by NIST based on the AISC specifications.
3. Details of joints, particularly at the knees of the frames, produced large bending moments and shear forces in the chords of the frame that were not considered in the design.
4. Reinforcements added in 2008 had a minimal effect as they affected only the compressive capacity of selected members; the most critical members were not reinforced.
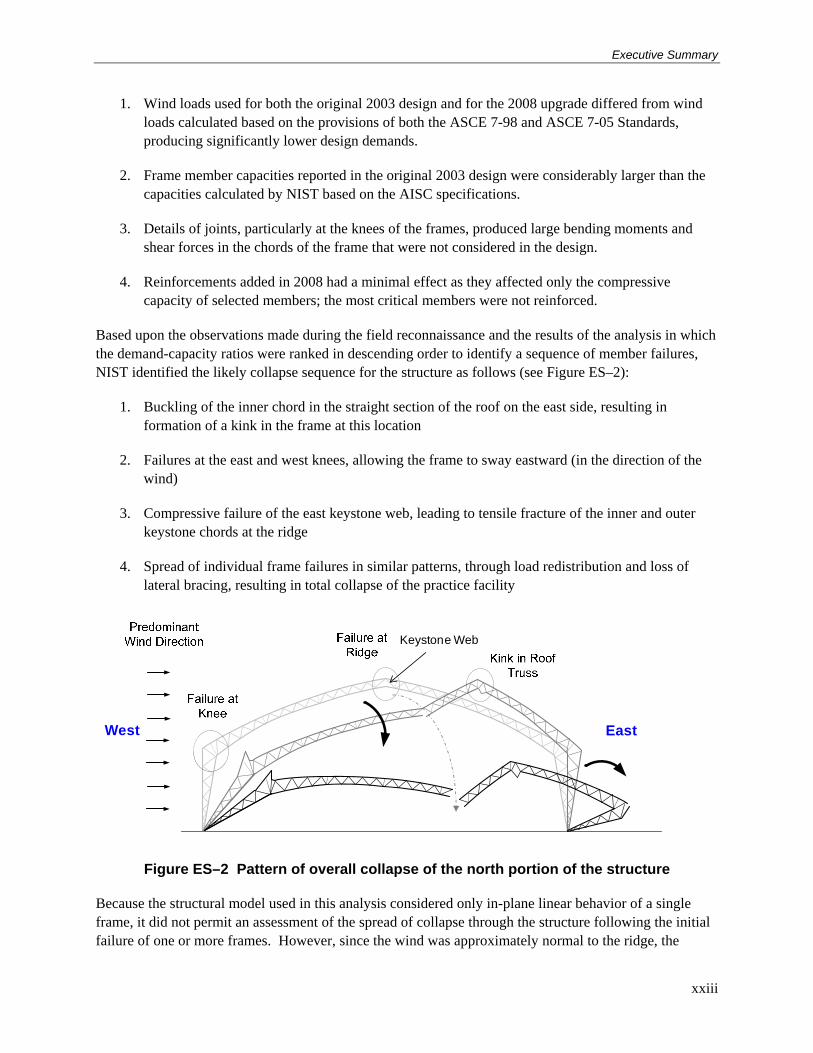
Based upon the observations made during the field reconnaissance and the results of the analysis in which the demand-capacity ratios were ranked in descending order to identify a sequence of member failures, NIST identified the likely collapse sequence for the structure as follows (see Figure ES–2):
1. Buckling of the inner chord in the straight section of the roof on the east side, resulting in formation of a kink in the frame at this location
2. Failures at the east and west knees, allowing the frame to sway eastward (in the direction of the wind)
3. Compressive failure of the east keystone web, leading to tensile fracture of the inner and outer keystone chords at the ridge
4. Spread of individual frame failures in similar patterns, through load redistribution and loss of lateral bracing, resulting in total collapse of the practice facility
Keystone Web
West East
Figure ES–2 Pattern of overall collapse of the north portion of the structure
Because the structural model used in this analysis considered only in-plane linear behavior of a single frame, it did not permit an assessment of the spread of collapse through the structure following the initial failure of one or more frames. However, since the wind was approximately normal to the ridge, the
Executive Summary
xxiv
loading on all interior frames was essentially the same, with local variations due to the turbulence of the wind field. The design of all interior frames was also identical, so that failure in any one frame would indicate that all other frames were simultaneously close to the point of failure. Failure in one or more frames would shift the load carried by the failed frames to adjacent frames, which would then become overloaded. Frame failures would also compromise the stability of adjacent frames through loss of lateral bracing provided by purlins, cross bracing, and sway bracing originally connected to a failed frame. Through these mechanisms, frame failures may have spread in both directions from the initially failed frames. Individual frames failed in similar patterns, as observed in the NIST damage survey, resulting in total collapse of the practice facility.
ES.5 RECOMMENDATION
Based on the findings of this study, NIST has identified a recommendation for improved safety of fabric-covered steel frame structures. NIST believes the recommendation is realistic, appropriate, and achievable within a reasonable period of time.
NIST recommends that fabric-covered steel frame structures be evaluated to ensure the adequate performance of the structural framing system under design wind loads. Of particular concern are (1) the use of the fabric covering to provide lateral bracing for structural frames, (2) determination of the appropriate enclosure classification in the calculation of internal pressures for design wind loads, and (3) the ability of the structural system, including the lateral bracing, to maintain overall structural integrity.
This recommendation is based on the following issues identified in the NIST study:
The design of the Dallas Cowboys indoor practice facility assumed that the tensioned exterior fabric provided lateral bracing for the frames. A review of the state of practice indicates that there is some disparity on this practice among designers and fabricators of this class of structures, as some rely on fabric to provide lateral support to the frames, while others do not. There is a need to evaluate and provide guidance on the appropriateness of using the fabric for lateral bracing of fabric-covered frame structures. A particular concern is the susceptibility of the fabric material to tearing due to a variety of reasons such as wind-borne debris during wind storms, accidental cuts during installation or maintenance, or degradation of the fabric tear strength due to environmental conditions, including ultraviolet exposure. In such cases, tearing of the fabric would compromise the stability of the structural frames, which would in turn threaten the integrity of the entire structural system. In addition, tears in the fabric could introduce unbalanced lateral loads on the frame members. Guidance is needed on how such loads should be considered in design.
The design of the Dallas Cowboys indoor practice facility assumed the building to be enclosed for the purpose of calculating internal wind pressures, despite the presence of vent and door openings around the building perimeter that would result in a classification as partially enclosed (if the vents were even partially open). While this was not the only difference in application of the ASCE 7-98 or ASCE 7-05 Standard wind load provisions, nor the most significant, it is highlighted because of the greater ambiguity surrounding the determination of which openings will exist in the finished structure and which need to be considered in determining the enclosure
Executive Summary
xxv
classification. There is a need to provide guidance on appropriate determination of enclosure classification for this class of structures. Designers should consider all openings in the building perimeter and the possibility that some or all openings might be open during a wind storm. Fabric-covered frame structures may be flexible, and large deformations of the building frames during wind events can render doors open, potentially resulting in a partially enclosed condition. In addition, a variety of circumstances could cause the fabric to tear, which could result in higher internal pressures during wind storms than those obtained if the fabric covering remained intact.
While the collapse initiated with overloading of one or more structural frames, the fact that these failures led to a total collapse of the practice facility suggests that the adequacy of the structural system, including the lateral bracing, to maintain overall structural integrity should be evaluated. Part of this evaluation involves consideration of the reliance on fabric for lateral bracing, as noted above. In addition, multiple failures of bracing cable connections were observed during the field reconnaissance, suggesting that these connection details did not develop the full capacity of the bracing cables. Similar to a tear in the exterior fabric, as discussed above, the failure of lateral bracing elements would compromise the stability of structural frames and could threaten the integrity of the entire structural system. There is a need to evaluate and provide guidance on approaches to enhance the integrity of fabric-covered steel frame structures.
Building owners, operators, and designers are strongly urged to act on this recommendation. Engineers should be able to design cost-effective retrofits to address any areas of concern that are identified by these evaluations.
Affected Standards: There is no US standard directly applicable to fabric covered structures. An ASCE/SEI standards committee has developed a standard pertaining to tensioned fabric structures which is in the process of being released. NIST has briefed the ASCE/SEI committee on the findings of this study and will provide technical support to the committee if they choose to develop a standard pertaining to fabric covered structures or expand their existing standard to address such structures.
Model Building Codes: The standard on tensioned fabric structures should be adopted in the IBC model building code by mandatory reference to, or incorporation of, the latest edition of the standard.

xxvi
This page intentionally left blank.
1
Chapter 1 INTRODUCTION
On Saturday, May 2, 2009, the area around Irving, Texas experienced a severe thunderstorm. Although the winds did little damage to homes and vegetation in the area, a fabric-covered structure that enclosed one of the practice fields at the Dallas Cowboys Valley Ranch Training Facility collapsed completely. Twelve people were injured, one seriously.
In response to the collapse, the National Institute of Standards and Technology (NIST) deployed a reconnaissance team, which arrived on the site on Tuesday, May 12, 2009, after the collapsed steel structure had been stabilized and the fabric covering removed. The reconnaissance team: (1) surveyed and documented the collapsed structure, (2) surveyed other wind damage in the area surrounding the site, and (3) collected relevant data and information on the structure from the Dallas Cowboys organization and the City of Irving, Texas. Based upon the initial field reconnaissance, NIST determined that sufficient information was available to conduct a study of the collapse.
The objectives of the NIST study were to (1) determine why and how the structure collapsed and (2) identify areas for improvement to current building codes, standards, and practices for this type of structure. This report summarizes the NIST study, including data collection and damage survey, as well as subsequent structural analyses, findings and recommendations.
1.1 DALLAS COWBOYS INDOOR PRACTICE FACILITY
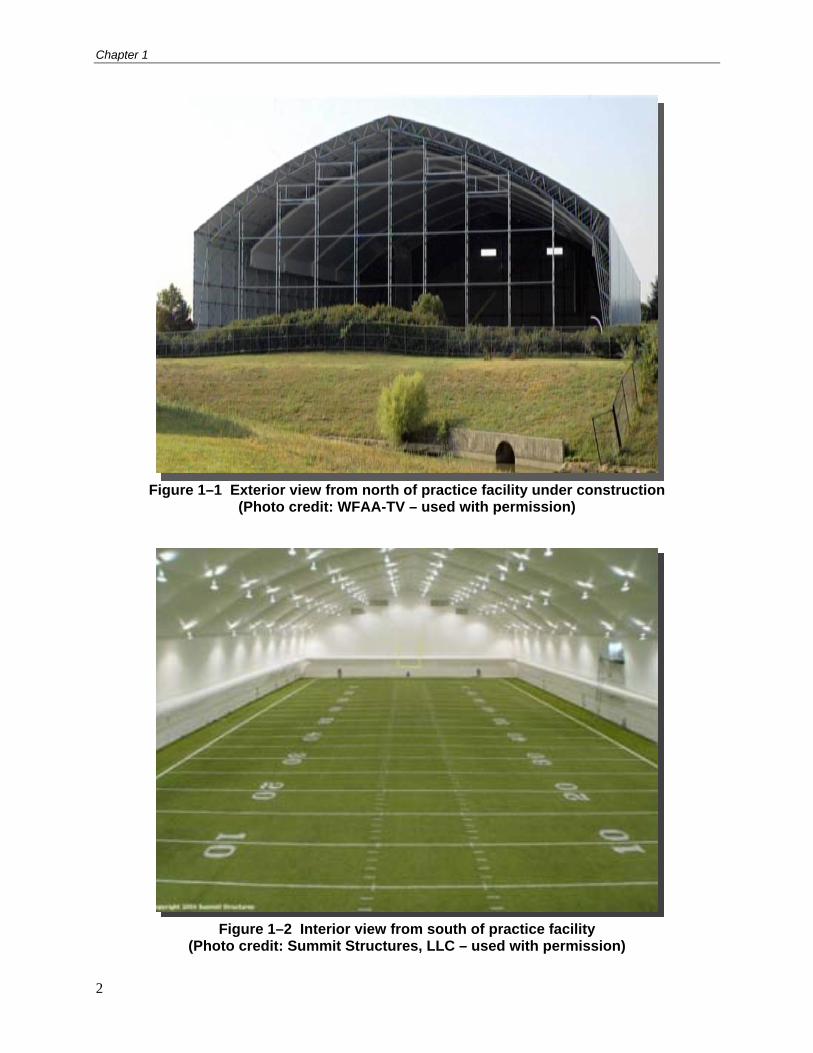
The Dallas Cowboys indoor practice facility at Valley Ranch, referred to hereinafter as the practice facility, was built in 2003. It was a gable-roof frame building, measuring 204 ft by 406 ft in plan and 86 ft high at the ridge. The facility was a tensioned fabric-covered frame structure. In addition to the exterior fabric, the interior of the facility was covered with a fabric liner. According to the International Building Code (IBC 2000), this building would be classified as a membrane-covered frame structure. Figure 1–1 is a photograph from the north of the practice facility during construction in 2003. It can be seen that the inner fabric liner had been partially installed. Figure 1–2 shows an interior view from the south of the completed covered practice field. Gable vents are visible in the north end wall. Additional vents were located on the south end wall; personnel access doors were located on all four walls; and two rollup doors were located on the south wall (see Figure 4–1).
Chapter 1
2
Figure 1–1 Exterior view from north of practice facility under construction (Photo credit: WFAA-TV – used with permission)
Figure 1–2 Interior view from south of practice facility (Photo credit: Summit Structures, LLC – used with permission)
Chapter 1
3
1.2 STRUCTURAL FRAMING OF INDOOR PRACTICE FACILITY
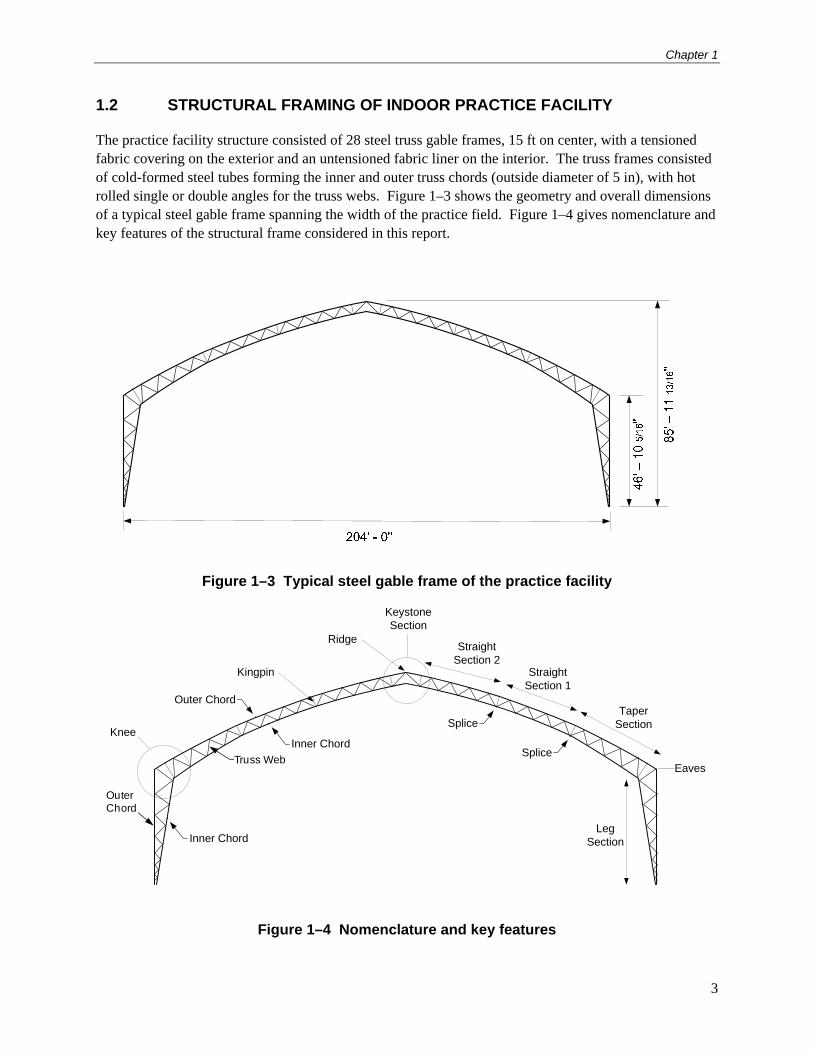
The practice facility structure consisted of 28 steel truss gable frames, 15 ft on center, with a tensioned fabric covering on the exterior and an untensioned fabric liner on the interior. The truss frames consisted of cold-formed steel tubes forming the inner and outer truss chords (outside diameter of 5 in), with hot rolled single or double angles for the truss webs. Figure 1–3 shows the geometry and overall dimensions of a typical steel gable frame spanning the width of the practice field. Figure 1–4 gives nomenclature and key features of the structural frame considered in this report.
Figure 1–3 Typical steel gable frame of the practice facility
Keystone Section
Ridge
Knee
Taper Section
Straight Section 1
Eaves
Inner Chord
Outer Chord
LegSectionInner Chord
Splice
Kingpin
Straight Section 2
SpliceTruss Web
Outer Chord
Figure 1–4 Nomenclature and key features
Chapter 1
4
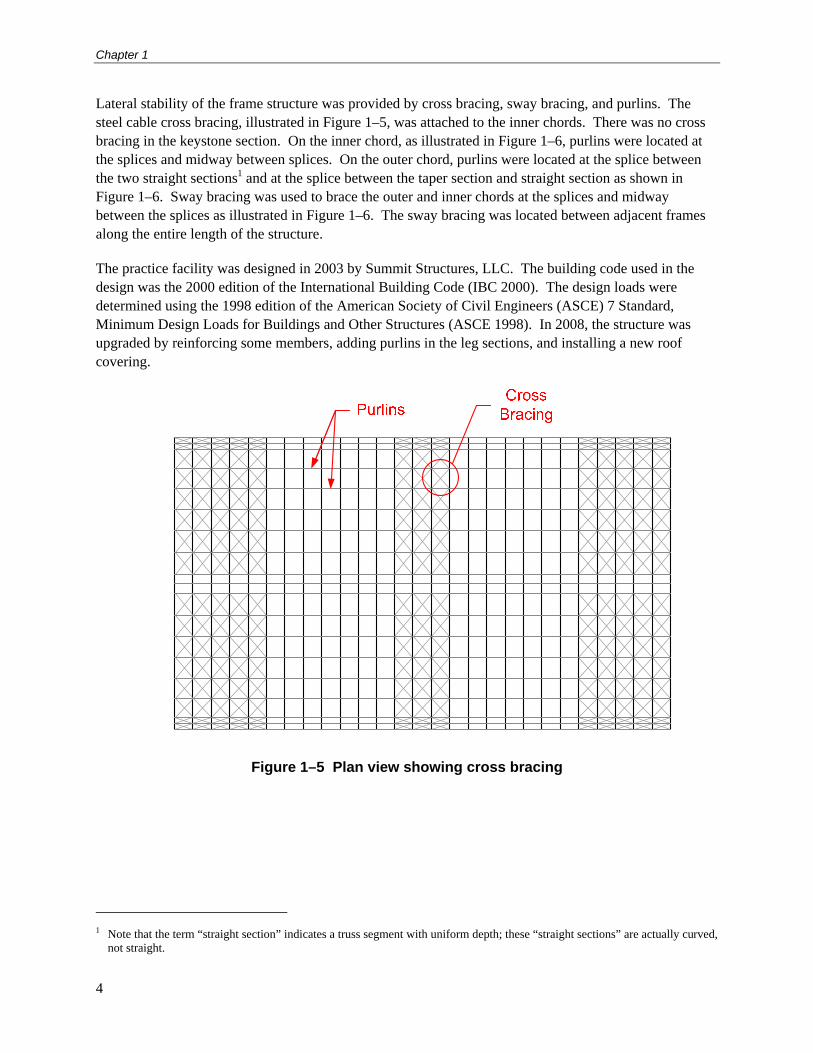
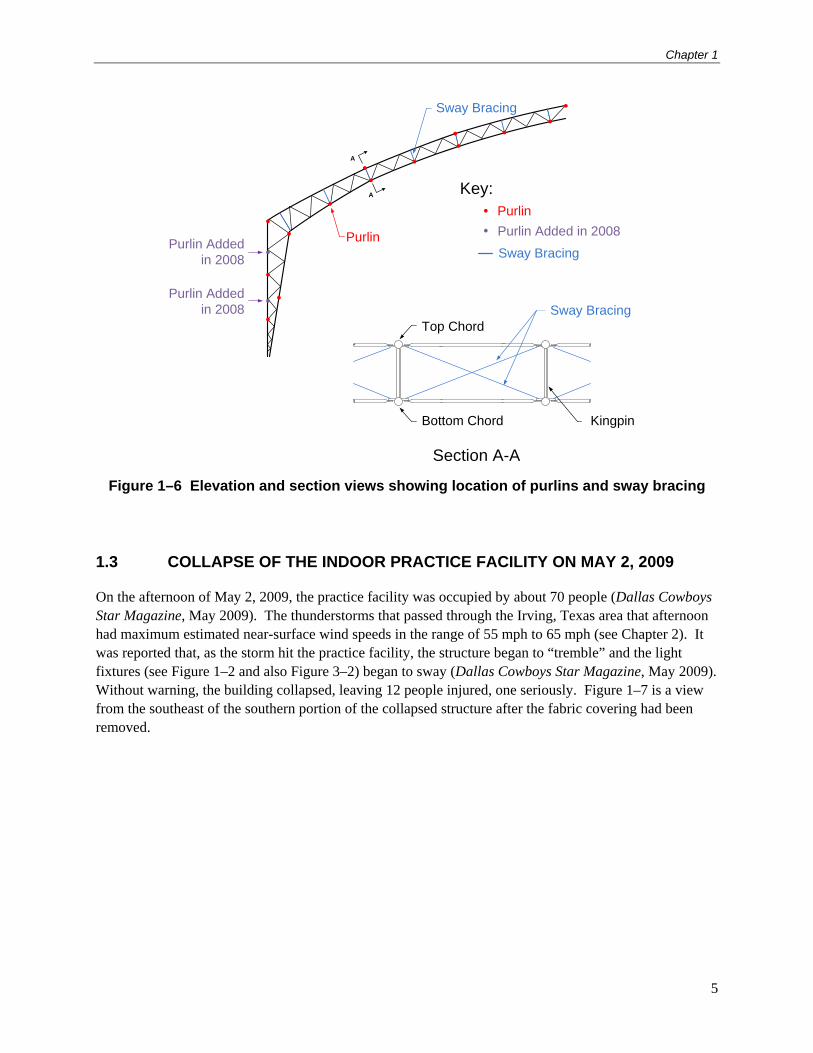
Lateral stability of the frame structure was provided by cross bracing, sway bracing, and purlins. The steel cable cross bracing, illustrated in Figure 1–5, was attached to the inner chords. There was no cross bracing in the keystone section. On the inner chord, as illustrated in Figure 1–6, purlins were located at the splices and midway between splices. On the outer chord, purlins were located at the splice between the two straight sections1 and at the splice between the taper section and straight section as shown in Figure 1–6. Sway bracing was used to brace the outer and inner chords at the splices and midway between the splices as illustrated in Figure 1–6. The sway bracing was located between adjacent frames along the entire length of the structure.
The practice facility was designed in 2003 by Summit Structures, LLC. The building code used in the design was the 2000 edition of the International Building Code (IBC 2000). The design loads were determined using the 1998 edition of the American Society of Civil Engineers (ASCE) 7 Standard, Minimum Design Loads for Buildings and Other Structures (ASCE 1998). In 2008, the structure was upgraded by reinforcing some members, adding purlins in the leg sections, and installing a new roof covering.
Figure 1–5 Plan view showing cross bracing
1 Note that the term “straight section” indicates a truss segment with uniform depth; these “straight sections” are actually curved,
not straight.
Chapter 1
5
Sway Bracing
Purlin Addedin 2008 Sway Bracing
Purlin
Purlin Addedin 2008
Purlin Added in 2008Purlin
Key:
Top Chord
Bottom Chord Kingpin
Sway Bracing
A
A
Section A-A
Figure 1–6 Elevation and section views showing location of purlins and sway bracing
1.3 COLLAPSE OF THE INDOOR PRACTICE FACILITY ON MAY 2, 2009
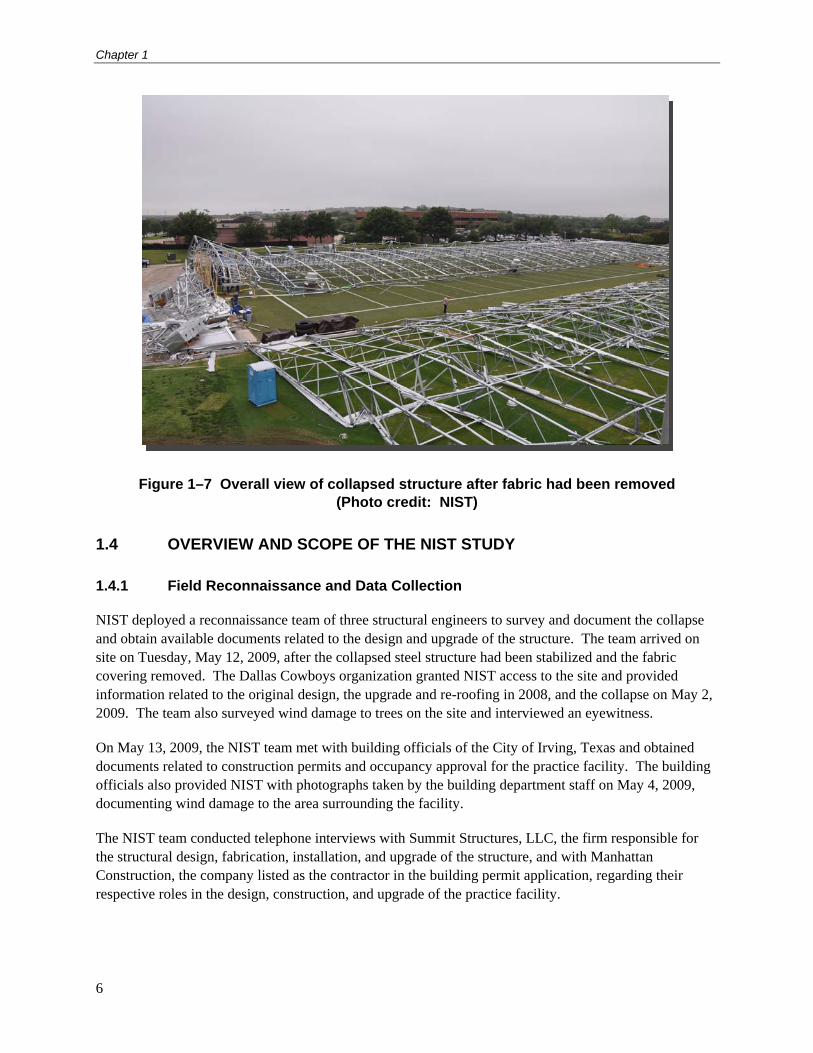
On the afternoon of May 2, 2009, the practice facility was occupied by about 70 people (Dallas Cowboys Star Magazine, May 2009). The thunderstorms that passed through the Irving, Texas area that afternoon had maximum estimated near-surface wind speeds in the range of 55 mph to 65 mph (see Chapter 2). It was reported that, as the storm hit the practice facility, the structure began to “tremble” and the light fixtures (see Figure 1–2 and also Figure 3–2) began to sway (Dallas Cowboys Star Magazine, May 2009). Without warning, the building collapsed, leaving 12 people injured, one seriously. Figure 1–7 is a view from the southeast of the southern portion of the collapsed structure after the fabric covering had been removed.
Chapter 1
6
Figure 1–7 Overall view of collapsed structure after fabric had been removed (Photo credit: NIST)
1.4 OVERVIEW AND SCOPE OF THE NIST STUDY
1.4.1 Field Reconnaissance and Data Collection
NIST deployed a reconnaissance team of three structural engineers to survey and document the collapse and obtain available documents related to the design and upgrade of the structure. The team arrived on site on Tuesday, May 12, 2009, after the collapsed steel structure had been stabilized and the fabric covering removed. The Dallas Cowboys organization granted NIST access to the site and provided information related to the original design, the upgrade and re-roofing in 2008, and the collapse on May 2, 2009. The team also surveyed wind damage to trees on the site and interviewed an eyewitness.
On May 13, 2009, the NIST team met with building officials of the City of Irving, Texas and obtained documents related to construction permits and occupancy approval for the practice facility. The building officials also provided NIST with photographs taken by the building department staff on May 4, 2009, documenting wind damage to the area surrounding the facility.
The NIST team conducted telephone interviews with Summit Structures, LLC, the firm responsible for the structural design, fabrication, installation, and upgrade of the structure, and with Manhattan Construction, the company listed as the contractor in the building permit application, regarding their respective roles in the design, construction, and upgrade of the practice facility.
Chapter 1
7
The data that were collected by the NIST team included:
Design drawings and calculations (provided by the Dallas Cowboys organization), including
– The 2003 original design (Summit Structures 2003a,b)
– The 2008 structural upgrade and re-roofing (S2 Specialty Structures 2008)
Building permit documentation (provided by the City of Irving, TX)
Photographic and videographic data including
– Field reconnaissance and damage survey conducted by the NIST team
– Damage to surrounding areas provided by the City of Irving
– Video recording of the collapse of the facility provided by WFAA-TV
Interviews conducted by the NIST team included representatives of:
The Dallas Cowboys Organization (including an eyewitness to the collapse)
The City of Irving (Building Department)
Summit Structures, LLC
Manhattan Construction
A copy of the original 2003 design documents – described as the documents used for the building permit application – was obtained from the Dallas Cowboys organization. These documents carried the seal and signature of the Professional Engineer responsible for the design and included drawings and design calculations. The drawings identified the building as a Summit Structures Pinnacle Building Series 5 and included information on the gable frames, the layout of bracing and purlins between frames, types and layout of exterior and liner fabric, and details of the concrete corner caissons and grade beams. Design calculations included a summary of member capacities, wind load assumptions, and computer output of the structural analysis indicating the required strengths of the structural members. Additionally, NIST was provided with a set of design calculations covering the revised structural analysis conducted in 2008 as part of the structural upgrade and re-roofing, which was also signed by a Professional Engineer.
1.4.2 Review of Wind Loads and Analysis of Structural Response
Following the field reconnaissance, NIST reviewed wind damage observations in the local area around the facility and worked in collaboration with the National Oceanic and Atmospheric Administration (NOAA) National Severe Storms Laboratory to obtain and interpret relevant meteorological data in order to develop an understanding of the wind conditions and estimate the wind speed and direction during the event (Chapter 2). NIST also reviewed observations obtained from the damage survey (Chapter 3), and conducted a thorough review of the design drawings and calculations from the original 2003 design and the 2008 upgrade (Chapter 4). These steps were followed by an analysis of the structural design of the
Chapter 1
8
building under dead and wind loads to identify factors that may have contributed to the collapse of the practice facility (Chapter 5). This portion of the study included (1) the development of a structural model of a typical frame of the practice facility (Section 5.1) and (2) analysis of the model under a variety of loading conditions (Sections 5.2 through 5.5). The analyses conducted within the framework of this study are as follows:
Baseline Case: First, an independent analysis was performed to calculate the design demand-capacity ratios (DCRs) of the structural frame members and assess the ability of the structure, as built and reinforced, to support the design wind loads (Section 5.2). The design wind loads in this analysis were based on the provisions of the ASCE 7-05 Standard, which was found to produce loads, for this structure, identical to those based on the ASCE 7-98 Standard (see Section 4.1.1). The member design strengths (or capacities) were calculated using the 2005 American Institute of Steel Construction (AISC) specifications (see Section 4.2.5). Both factored loads (from Section 2.3 of ASCE 7-98 and ASCE 7-05) and capacities were used in this analysis, from which the design DCRs were computed, providing estimates of the extent to which the design DCRs exceeded 1.0.
Next, a set of analyses was carried out to determine how the original 2003 design calculations and the 2008 upgrade calculations differed from those of the Baseline Case. A review of the wind loads used in the original 2003 design (Section 4.1.2) indicated that the design wind load calculations and assumptions differed from those of the Baseline Case, which was based on the ASCE 7-05 Standard provisions. The same was true for the 2008 upgrade (Section 4.1.3). In addition, the member capacities used in the original 2003 design (Section 4.2.6) differed from NIST calculated values mainly due to differences in the underlying assumptions, in particular, the role of the roof fabric in providing lateral support to the frames. Analyses were conducted (1) to examine the effect that differences in the wind load assumptions would have on the DCRs (Section 5.3), and (2) to examine the effect that variations in the member capacity assumptions would have on the DCRs (Section 5.4).
Finally, an analysis (Section 5.5) was performed to determine the unfactored DCRs at the time of the collapse, with the objective of identifying overstressed structural members. In this analysis, nominal (unfactored) loads and capacities were used. At the time of the collapse, the wind direction was determined to be predominantly westerly (normal to ridge) with the best estimate of the maximum near-surface wind speed gusts in the range of 55 mph to 65 mph (Section 2.4). The wind loads were determined according to the provisions of ASCE 7-05 for wind normal to ridge with a 3 s gust wind speed of 60 mph. A 60 mph wind speed was selected as it corresponds to the center of the estimated wind speed range. The member capacities in this analysis were those used in the Baseline Case with strength reduction factors set equal to 1.0. The results of this analysis were consistent with and helped to explain some of the failure modes that were observed during the field reconnaissance (Chapter 3).
1.5 PEER REVIEW OF REPORT
This report is a summary of the NIST study. The report was reviewed by individual subject matter experts from industry and academia (see Appendix A). NIST briefed the experts on all aspects of the NIST study on July 2, 2009. The experts subsequently provided valuable individual input and comments on the report.
Chapter 1
9
1.6 ORGANIZATION OF REPORT
The wind environment on May 2, 2009, is described in Chapter 2. Chapter 3 provides details of the NIST field reconnaissance, including descriptions of observed modes of failure and overall patterns of collapse. Chapter 4 presents a review of the structural design of the practice facility, including the original 2003 design and the 2008 upgrade, with particular emphasis on the design bases for wind loads and the design strengths (capacities) of the frame members and connections. Chapter 5 presents the structural analyses of a typical frame of the facility under dead and wind loads. Chapter 6 summarizes the major findings, and Chapter 7 presents a recommendation based on this study.

10
This page intentionally left blank.

11
Chapter 2 WIND ENVIRONMENT ON MAY 2, 2009
This chapter presents a review of the wind damage and environmental data associated with the severe thunderstorm that affected the Irving, Texas area and led to the collapse of the Dallas Cowboys indoor practice facility on the afternoon of May 2, 2009. The purpose of this review is to develop an understanding of the evolution of the thunderstorm and to provide an accurate estimation of the wind conditions, including the near-surface wind speed and direction at the time and location of the collapse, for use as input into the structural analysis. For that purpose, NIST worked in collaboration with the National Oceanic and Atmospheric Administration (NOAA) National Severe Storms Laboratory to obtain and interpret relevant meteorological data.
Section 2.1 presents a discussion of the Public Information Statement issued by the Dallas Fort Worth National Weather Service (NWS) Forecast Office on May 2, 2009. Section 2.2 presents a review of wind damage data including: (1) the collapsed practice facility and surrounding vegetation within the Dallas Cowboys complex in Valley Ranch documented by the NIST reconnaissance team on May 12, 2009; and (2) structures and vegetation in the surrounding neighborhoods documented by officials of the City of Irving on May 4, 2009. Section 2.3 presents an analysis of environmental data, including wind speed and direction data retrieved from two Automated Surface Observation System (ASOS) stations, one Weather Service Radar (WSR) site, and two Terminal Doppler Weather Radar (TDWR) sites. Section 2.4 summarizes the wind environment.
2.1 METEOROLOGICAL REPORT
Following the collapse of the practice facility, the National Weather Service (NWS) Forecast Office serving the Dallas-Fort Worth area conducted a damage survey of the neighborhood surrounding the facility and, approximately five hours after the collapse, issued the following Public Information Statement that provided information on the environmental conditions at the time of the collapse. Note that all times given in this report are Central Daylight Time (CDT).
PUBLIC INFORMATION STATEMENT NATIONAL WEATHER SERVICE FORT WORTH TX 842 PM CDT SAT MAY 2 2009 ...RESULTS OF VALLEY RANCH DAMAGE SURVEY... BASED ON A SURVEY OF THE ON-SITE DAMAGE...RADAR IMAGERY...AND EYEWITNESS REPORTS...THE NATIONAL WEATHER SERVICE DETERMINED THAT A MICROBURST IMPACTED THE VALLEY RANCH AREA OF FAR NORTH IRVING. MAXIMUM WINDS NEAR THE GROUND WERE ESTIMATED NEAR 70 MPH. RESEARCH HAS INDICATED THAT WIND SPEEDS IN HIGH WIND EVENTS OFTEN INCREASE CONSIDERABLY IN THE LOWEST FEW HUNDRED FEET ABOVE THE GROUND. THEREFORE...IT IS QUITE POSSIBLE THAT WINDS GREATER THAN 70 MPH AFFECTED THE UPPER PORTIONS OF THE DAMAGED STRUCTURES. A MICROBURST IS A SMALL...INTENSE DOWNDRAFT WHICH RESULTS IN A
Chapter 2
12
LOCALIZED AREA OF STRONG THUNDERSTORM WINDS. IN EXTREME CASES... MICROBURSTS CAN HAVE WINDS WHICH EXCEED 100 MPH.
In an effort to develop an accurate understanding of the wind environment affecting the practice facility at the time of the collapse, NIST contacted the Dallas-Fort Worth NWS Forecast Office to clarify the information contained in the Public Information Statement. The NWS Forecast Office provided the following clarifications concerning the wind environment at the time of the collapse:
The determination that a microburst impacted the Valley Ranch area was based solely on the damage survey, which was conducted within five hours of the collapse.
The damage survey and eyewitness interviews conducted by the NWS indicated that the winds were from due west, or just south of due west. (Debris, including that from the training facility and tree limbs in the surrounding neighborhoods, was blown from west to east.)
Data from the Terminal Doppler Weather Radar (TDWR), approximately 1.5 mi to the southwest of the facility (station name TDAL), revealed radial velocities ranging from 58 mph to 62 mph at approximately 267 ft above the ground.
The estimated maximum wind speed of 70 mph was based on a 3 s peak gust at an elevation between 10 ft and 35 ft above the ground. This estimate was based on the TDWR data and the “damage indicators” described in the Enhanced Fujita scale (http://www.spc.noaa.gov/efscale) that take into account the extent of nearby tree and structural/building damage.
2.2 WIND DAMAGE SURVEYS
2.2.1 NIST Field Reconnaissance
In addition to inspecting the collapsed Dallas Cowboys practice facility on May 12, the NIST reconnaissance team surveyed wind damage to trees and other structures within the Dallas Cowboys complex in Valley Ranch. The NIST team observed the following:
The practice facility collapsed generally from west to east (see Chapter 3, Figure 3–4), indicating predominantly westerly winds.
No other damage to surrounding buildings within the Dallas Cowboys complex was observed by NIST or reported by the Dallas Cowboys organization.
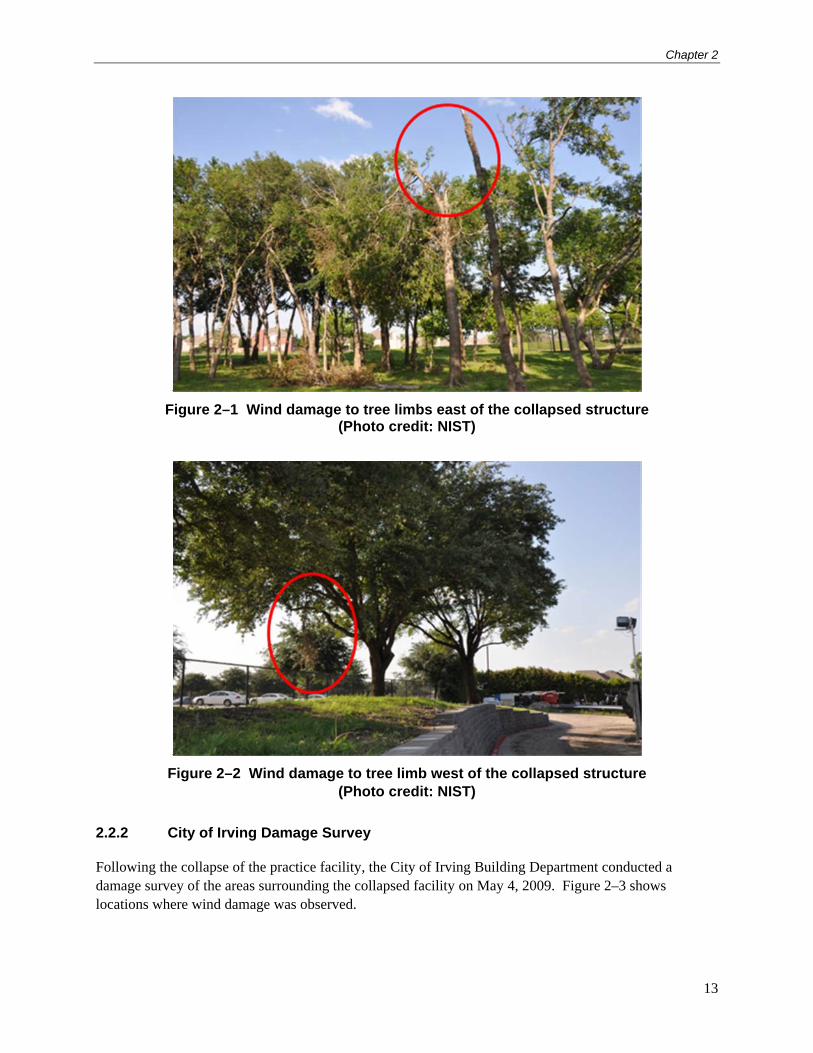
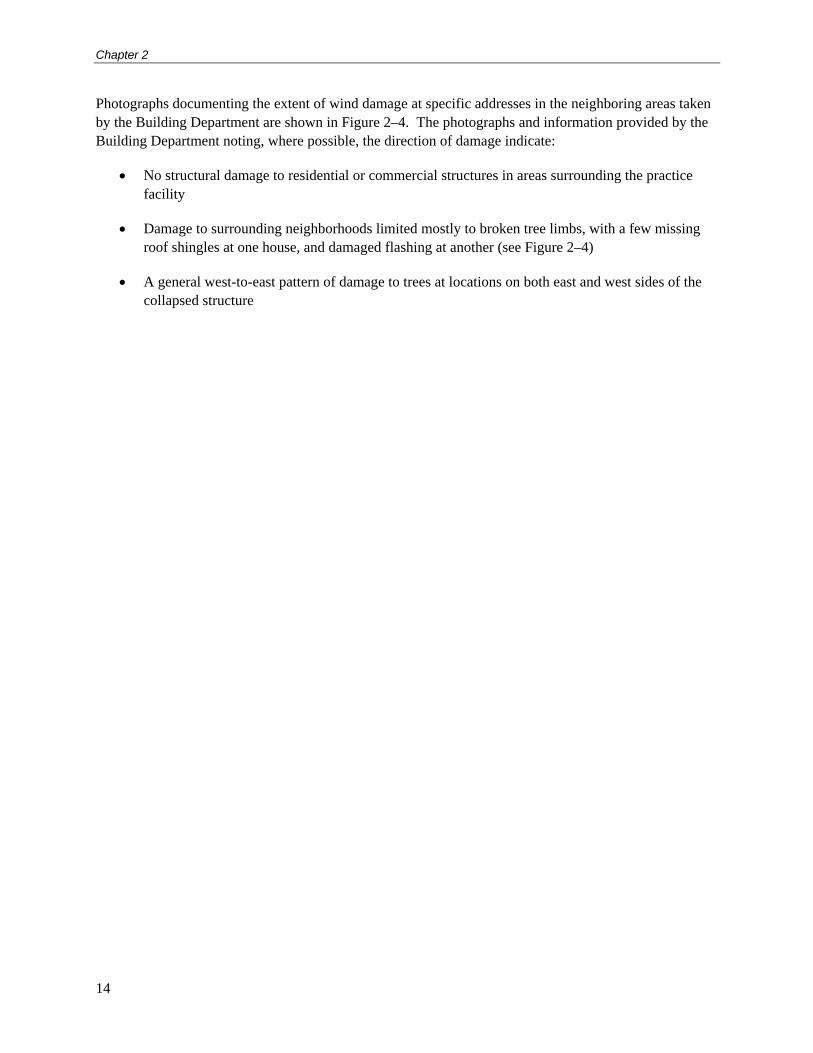
Minor damage to trees (broken limbs) east of the collapsed structure and one broken tree limb to the west were observed. Figure 2–1 and Figure 2–2 show the extent of wind damage to trees within the Dallas Cowboys complex to the east and west of the collapsed structure, respectively.
Chapter 2
13
Figure 2–1 Wind damage to tree limbs east of the collapsed structure (Photo credit: NIST)
Figure 2–2 Wind damage to tree limb west of the collapsed structure (Photo credit: NIST)
2.2.2 City of Irving Damage Survey
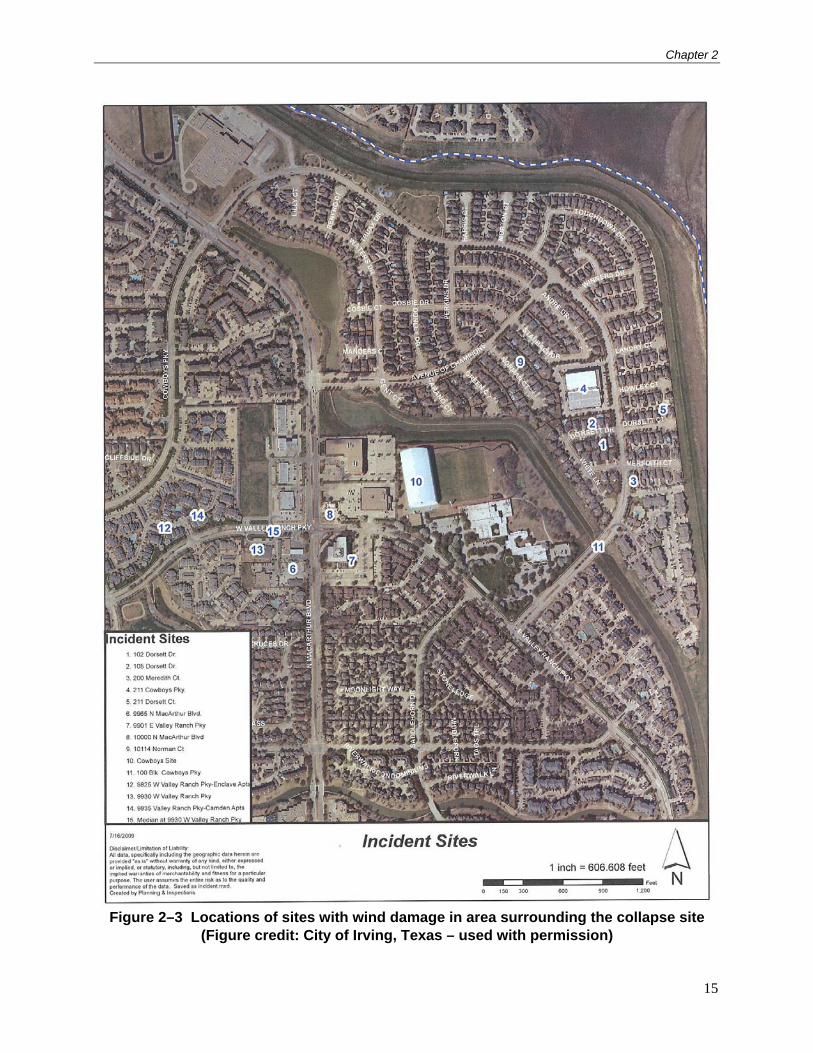
Following the collapse of the practice facility, the City of Irving Building Department conducted a damage survey of the areas surrounding the collapsed facility on May 4, 2009. Figure 2–3 shows locations where wind damage was observed.
Chapter 2
14
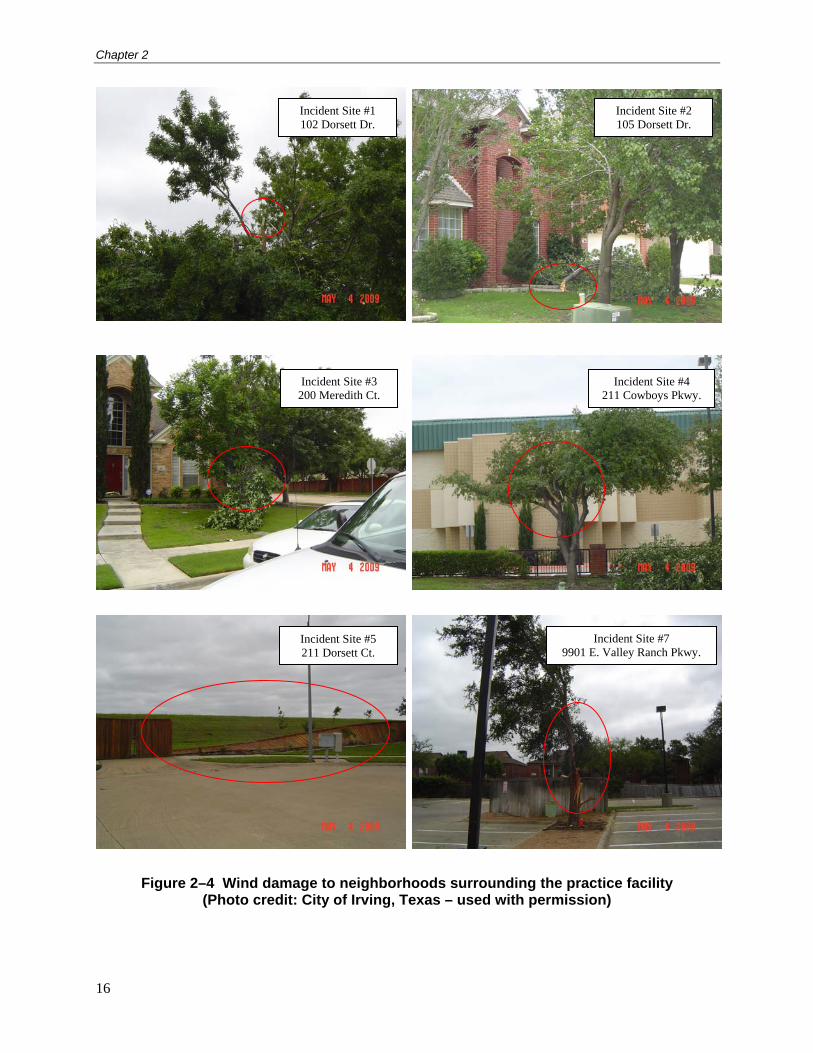
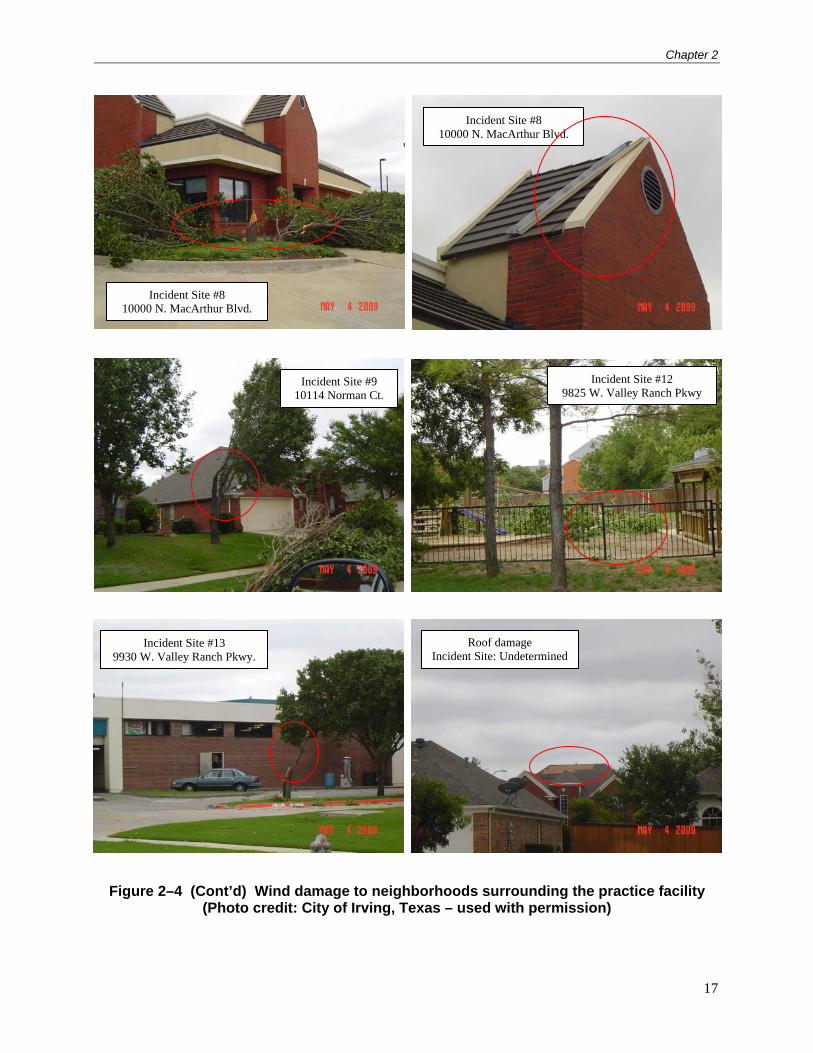
Photographs documenting the extent of wind damage at specific addresses in the neighboring areas taken by the Building Department are shown in Figure 2–4. The photographs and information provided by the Building Department noting, where possible, the direction of damage indicate:
No structural damage to residential or commercial structures in areas surrounding the practice facility
Damage to surrounding neighborhoods limited mostly to broken tree limbs, with a few missing roof shingles at one house, and damaged flashing at another (see Figure 2–4)
A general west-to-east pattern of damage to trees at locations on both east and west sides of the collapsed structure
Chapter 2
15
Figure 2–3 Locations of sites with wind damage in area surrounding the collapse site (Figure credit: City of Irving, Texas – used with permission)
Chapter 2
16
Figure 2–4 Wind damage to neighborhoods surrounding the practice facility (Photo credit: City of Irving, Texas – used with permission)
Incident Site #1 102 Dorsett Dr.
Incident Site #2 105 Dorsett Dr.
Incident Site #4 211 Cowboys Pkwy.
Incident Site #3 200 Meredith Ct.
Incident Site #5 211 Dorsett Ct.
Incident Site #7 9901 E. Valley Ranch Pkwy.
Chapter 2
17
Figure 2–4 (Cont’d) Wind damage to neighborhoods surrounding the practice facility (Photo credit: City of Irving, Texas – used with permission)
Incident Site #8 10000 N. MacArthur Blvd.
Incident Site #8 10000 N. MacArthur Blvd.
Incident Site #9 10114 Norman Ct.
Incident Site #12 9825 W. Valley Ranch Pkwy
Incident Site #13 9930 W. Valley Ranch Pkwy.
Roof damage Incident Site: Undetermined
Chapter 2
18
2.3 STORM WIND DATA
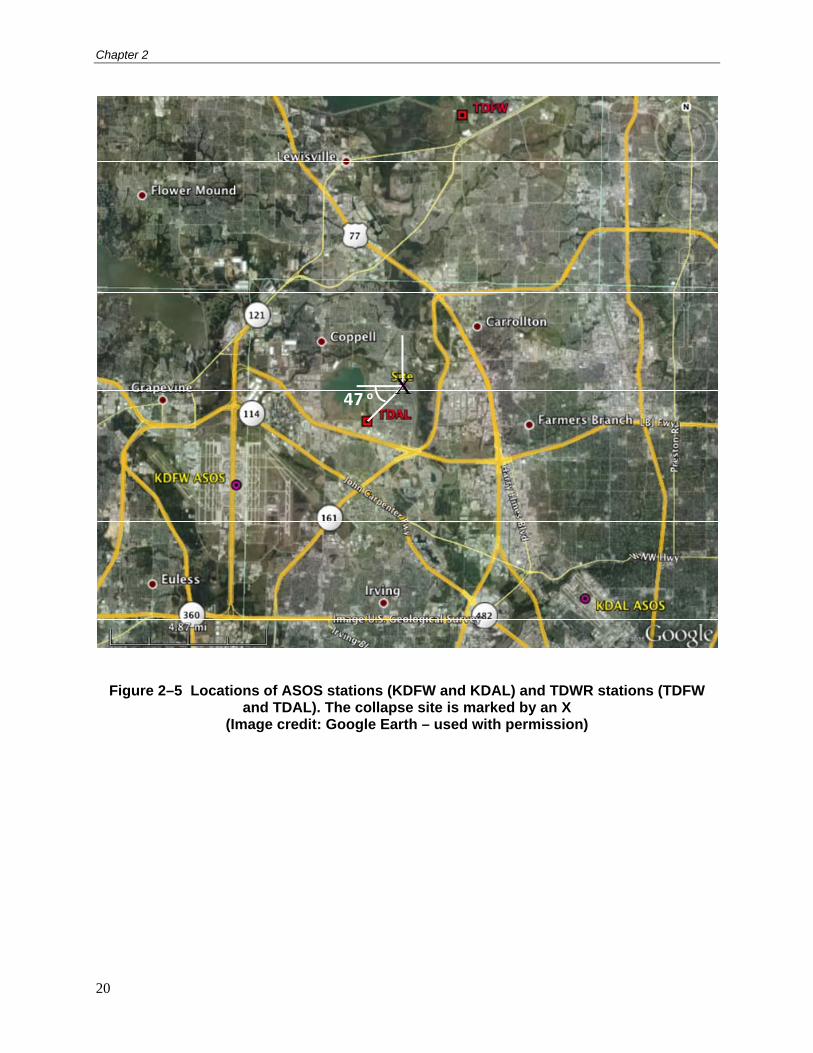
The NWS Dallas/Ft. Worth forecast office helped in identifying and collecting data used as input in estimating the magnitude of the near-surface wind speed and direction at the time and location of the collapse. Two sources of data were identified: (1) the Automated Surface Observing System (ASOS) stations at the Dallas/Ft. Worth airport (KDFW) and at the Love Field airport (KDAL); (2) Doppler radar stations: from the NWS Weather Service radar (WSR) WSR-88D radar station (KFWS), and from the FAA Terminal Doppler Weather Radar (TDWR) stations for the Dallas/Ft. Worth airport (TDFW) and Love Field airport (TDAL). Table 2–1 shows the locations (distances and directions) of the observing stations used in this study relative to the collapse site. Locations of these stations are shown in Figure 2–5. The ASOS instruments are installed, calibrated, and maintained by the NWS and provide 2-min average wind speeds (reported every minute) in addition to the strongest 5 s gust during the previous 2 min. The instruments are sited on towers, 32.8 ft above the ground.
Doppler radar measures reflectivity (proportional to rainfall rate) and radial velocity of hydrometeors (usually rain, snow, and frozen rain) along the slant range of the radar beam. All radar imagery displayed here is from the lowest elevation angles (<3.0°). The intensity of the radar “echo” or return is expressed in “reflectivity units” or Z, having units of mm6/m3. That is, the radar return is proportional to the sixth power of the hydrometeors diameter (for raindrops). Because of the large dynamic range of Z, it is usually expressed at 10×log10(Z) or dBZ. Reflectivity can be related to rainfall rate using an empirical equation.
Table 2–1 Observation stations used in this study
Station Range from collapse site
Direction from collapse site
Description
KDFW 6 mi 240° ASOS station at Dallas/Ft. Worth airport
TDFW 9 mi 12° TDWR radar for the Dallas/Ft. Worth
airport
KDAL 8.6 mi 139° ASOS station at Dallas Love Field airport
TDAL 1.5 mi 223° TDWR radar for the Dallas Love Field
airport
KFWS 33 mi 219° WSR-88D south of Ft. Worth
Note: 0o is North; 90o is East; 180o is South; 270o is West.
2.3.1 Evolution of the May 2nd Storm from 3:00 PM to 3:40 PM
The time evolution of the May 2, 2009 storm displayed as a sequence of KFWS reflectivity images is shown in Figure 2–6. The storm is evidenced by an arc-shaped radar echo that moved over the site generally in an east-northeast direction. In the first frame at 2:57 PM (Figure 2–6a) the storm is shown near the lower left hand corner of the plot as a large red area of reflectivity >50 dBZ. Subsequent frames,
Chapter 2
19
every 4 min or 5 min, show this mass of high reflectivity moving to the northeast. The storm moved over the collapse site (marked on the imagery in Figure 2–6 by a black “X”) from about 3:18 PM to about 3:27 PM. The overall motion of the storm (calculated by following the leading edge of the reflectivity from 02:57 PM to 03:40 PM) was 50.2 mph toward 056° (toward east-northeast).
2.3.2 NWS/ASOS Wind Information
Surface wind information, as recorded by the KDFW ASOS anemometer, is shown in Figure 2–7. Consistent with radar imagery shown in Figure 2–6, the storm began affecting the KDFW station at about 3:12 PM. The ASOS surface wind speed had been roughly 10 mph to 20 mph and veering from south-southwest (200°) to northerly (350°) during the previous 12 min as the storm approached. From about 3:12 PM to 3:18 PM the KDFW ASOS winds backed sharply to the west-southwest (250°) and increased to nearly 30 mph (gusts to nearly 45 mph). As the heavy rain moved off to the northeast, the winds returned to northerly and subsided before gradually turning back to south-southwesterly by about 3:40 PM. The time of minimum wind direction (250°) after the winds went northwesterly was 3:15 PM (short dashed vertical line in Figure 2–7), about 3 min before the peak wind speed. The wind direction at the time of the peak wind speed, which occurred at 3:18 PM, was roughly 270° or westerly (long-dashed vertical line in Figure 2–7).
The KDAL ASOS station, located farther to the east than KDFW, experienced the storm passage about 5 min to 6 min later. Because of the arc shape of the storm system the collapse site experienced storm passage at about the same time as KDAL as shown in the radar reflectivity imagery in Figure 2–6e (at 3:14 PM). Figure 2–8 shows the KDAL wind traces. As with KDFW, the winds slowly veered from 200° (south-southwest) to about 250° (west-southwest) prior to storm passage. Since KDAL was located closer to the apex of the bow, rather than on its northern side, the winds at the KDAL station did not veer nearly as much as they did at the KDFW station, only to about 250° (west-southwest). At about 3:17 PM wind speed abruptly increased from around 5 mph to about 23 mph, gusts to nearly 34 mph, at about 3:22 PM and went westerly briefly. Unlike KDFW, the peak wind and the peak westerly component occurred at the same time. Wind speeds decreased to between 10 mph and 15 mph after about 3:30 PM and shifted northeasterly, probably a reflection of outflow winds from the departing storm before gradually returning to southeasterly after about 3:55 PM.
In summary, the ASOS data showed maximum 5 s gust speeds of 45 mph (at 3:18 PM) and 34 mph (at 3:22 PM) at locations 6 mi to the southwest and 8.6 mi to the southeast of the collapse site, respectively. These wind speeds were measured at 32.8 ft elevation. At the time of maximum wind, the wind directions at both ASOS stations, which straddle the collapse site, were predominantly westerly. Note, however, that given the small-scale nature of typical microbursts (about 2 mi in diameter) and their rapidly evolving character, the wind speeds measured at the ASOS locations may not be representative of the actual wind speeds at the collapse site.
Chapter 2
20
47 oX
Figure 2–5 Locations of ASOS stations (KDFW and KDAL) and TDWR stations (TDFW and TDAL). The collapse site is marked by an X
(Image credit: Google Earth – used with permission)
Chapter 2
21
Figure 2–6 Radar reflectivity for 8 times from 2:57 PM to 3:27 PM from the WSR-88D network radar (KFWS). The collapse site is marked by an X
(Image credit: NOAA – used with permission)

Chapter 2
22
2 min average
5 s peak gust
2 min average5 s peak gust
Figure 2–7 Wind speed (top) and direction (bottom) at the KDFW ASOS station (Credit: NOAA – used with permission)
Chapter 2
23
2 min avg.
5 s pk. gust
2 min avg.
5 s pk. gust
Figure 2–8 Wind speed (top) and direction (bottom) at the KDAL ASOS station (Credit: NOAA – used with permission)
2.3.3 Doppler Radar Information
Doppler radar measures echo strength and radial velocity. The radial motions of hydrometeors within the beam volume, typically 500 ft in length across the beamwidth (0.55°), are averaged together. As such, the instantaneously measured radial velocity is more representative of a “sustained” wind than a 3 s “gust” wind, particularly when the beam is in the highly turbulent boundary layer near the surface. Absolute measurements of wind direction and speed at a given point depend on the angle that the radar beam makes with the wind vector. The radial wind velocity recorded by the Doppler radar is equal to the cosine of the angle made by the wind vector and radar beam times the measured radial wind velocity. The angle between the westerly wind vector and the TDAL radar beam was 47° (see Figure 2–5).
Doppler-measured radial velocity fields at 3:24 PM from TDAL and TDFW are shown in Figure 2–9. Fortuitously, TDAL was located about 1.5 mi to the southwest (at 223°) of the collapse site. The radar
Chapter 2
24
resolution is excellent at this short range. TDAL showed peak radial velocities near the site of 58 mph to 62 mph. The beam height, calculated from the elevation angle and earth curvature, is estimated to be about 267 ft above ground level (AGL) at the collapse site. Coincident measurements by TDFW were recorded at a higher elevation (about 535 ft) due to the longer range (9 mi, at 12°) and showed peak radial velocities of roughly 37 mph over the site. The stagnation point, or location of downdraft center, was southwest of the site during the period of strongest westerly winds as shown in the TDAL radar imagery (see Figure 2–9). It is difficult to follow the evolution of the stagnation point from the TDFW radar, because it moved nearly perpendicular to the radar beam at the site. Subsequent imagery from TDAL after 3:24 PM (not shown) showed the velocities weakening and the stagnation point remaining to the south and west of the site as the microburst faded.
If the winds at the collapse site followed the KDFW ASOS observations, the peak winds came from the west (also confirmed by the damage surveys). Assuming the winds at 267 ft AGL were also westerly, the estimated wind speed at 267 ft AGL over the collapse site can be computed from the TDAL data by dividing the radial velocity by the cosine of 47° or 0.682. Thus, if the winds at 267 ft AGL over the collapse site were truly westerly, the wind speed at this elevation would be 62/0.682 or about 90 mph. The near-surface wind speed, however, would be closer to 30 mph due to reductions in wind speed with decreasing altitude. Such reductions have been documented in other microburst observations and numerical simulations as explained in the next section.
The radial velocities relative to the stagnation point are not symmetric because the cells creating the microburst were moving with the speed of the storm, roughly estimated from the reflectivity motion to be 50 mph toward 056° (toward east-northeast).
2.3.4 Microburst Morphology
The ASOS wind plots and the TDWR data strongly suggest that the phenomenon that affected the collapse was a “microburst”, sometimes referred to as a “downburst”. Microbursts are small-scale phenomena, generally 2 mi to 3 mi in diameter. There may have been many microburst-producing cells along the leading edge of the major storm system shown in Figure 2–6. An idealized schematic vertical cross section through a microburst is shown in Figure 2–10.
Observations of the outflow depth and the height of maximum wind speeds within microbursts are difficult to obtain but numerical simulations and multiple Doppler radar research projects indicate that outflow depths are typically 1200 ft to 1500 ft, with the height of the outflow peak about 250 ft above the surface (Caracena et al. 1989). Sustained wind speeds decrease below this peak roughly linearly with decreasing height due to surface friction and mixing. Outflow winds from a microburst are highly turbulent. These estimates imply that the wind speed calculated from the peak radial velocity measured at the TDAL station at 3:24 PM at 267 ft AGL over the collapse site (Figure 2–9) of approximately 90 mph (after correction for beam angle effects) would be reduced to about 30 mph sustained wind speed (or about 42 mph gust speed using the typical gust factor of 1.4) near the height of the practice facility (86 ft), which is consistent with the KDFW ASOS observations. Because of the averaging that occurs across the beam volume by the Doppler radar, the radar radial velocities are largely representative of sustained winds, rather than individual wind gusts which are typically much smaller than the beam volume. Boundary layer turbulence and downward horizontal westerly momentum transport by the downdrafts
Chapter 2
25
would likely cause considerable variation in the strength of the near surface gusts, as seen by the KDFW and KDAL ASOS observations.
In summary, the TDWR data indicated a gust speed of about 42 mph at 86 ft elevation (the height of the structure) at the time of the collapse. Note, however, that given the uncertainty in the measurement as explained in the previous paragraph, the actual gust speeds can be higher than the value indicated by the TDWR data. The TDWR radar also indicated that the stagnation point of the microburst was to the southwest of the collapse site before and after the collapse occurred.
2.3.5 Theoretical Maximum Microburst Winds
Observations and numerical simulation of microbursts suggest that they are initiated as a result of frozen precipitation falling through the melting level. As the particles melt they cool the air and create negative buoyancy, which accelerates air downward. Air parcels will continue to be negatively buoyant as long as their virtual temperature remains colder than the environmental virtual temperature (i.e., the parcels are more dense). Below the melting level negative buoyancy is sustained by continued evaporation of rain. McCann (1994) developed an empirical formula for estimating maximum near-surface wind speeds (i.e., maximum possible gusts) from a microburst using the equation of vertical motion, the environmental lapse rate, mixing ratio, and the height of the melting level. McCann calibrated the equation using 18 microburst cases where good surface winds were available, including one case from Dallas (the microburst of August 2, 1985). The formula for wind intensity (WI) in mph is:
WI 5.75 HmRQ 2 30 QL 2QM
where Hm is the height of the melting level (km), RQ = QL/12 but not greater than 1; is the lapse rate (C/ km) from the surface to the melting level; QL the mixing ratio (g/kg) in the lowest 1 km above the surface; and QM the mixing ratio at the melting level. The factor 5.75 is the calibration factor to produce maximum surface wind speed in mph. All of the parameters can easily be estimated from a nearby environment balloon sounding.
For the calculation of WI for this case, the NWS KDFW balloon sounding launched at 6:35 PM on May 2, 2009, about 3 hours after the collapse, was used. The sounding was modified to account for the surface cooling that occurred as a result of the storm passage over KDFW. The KDFW ASOS data indicated about a 9 °C cooling with the storm passage so the reported surface temperature of the balloon sounding was adjusted upwards by 9 °C. Other parameters estimated from the sounding were HM = 4.0 km, Qm = 1.0 g/kg; QL = 14 g/kg; and = 6.9 °C/km. With these values, WI was calculated to be 63 mph. WI is most sensitive to lapse rate, since lapse rate is squared in the formula. Effectively, lapse rate from the surface to the freezing level is surface temperature divided by HM. Given the uncertainty in estimating surface temperature following the gust front passage the most reasonable estimate of WI would be in the range of 60 mph to 65 mph at the time of collapse.
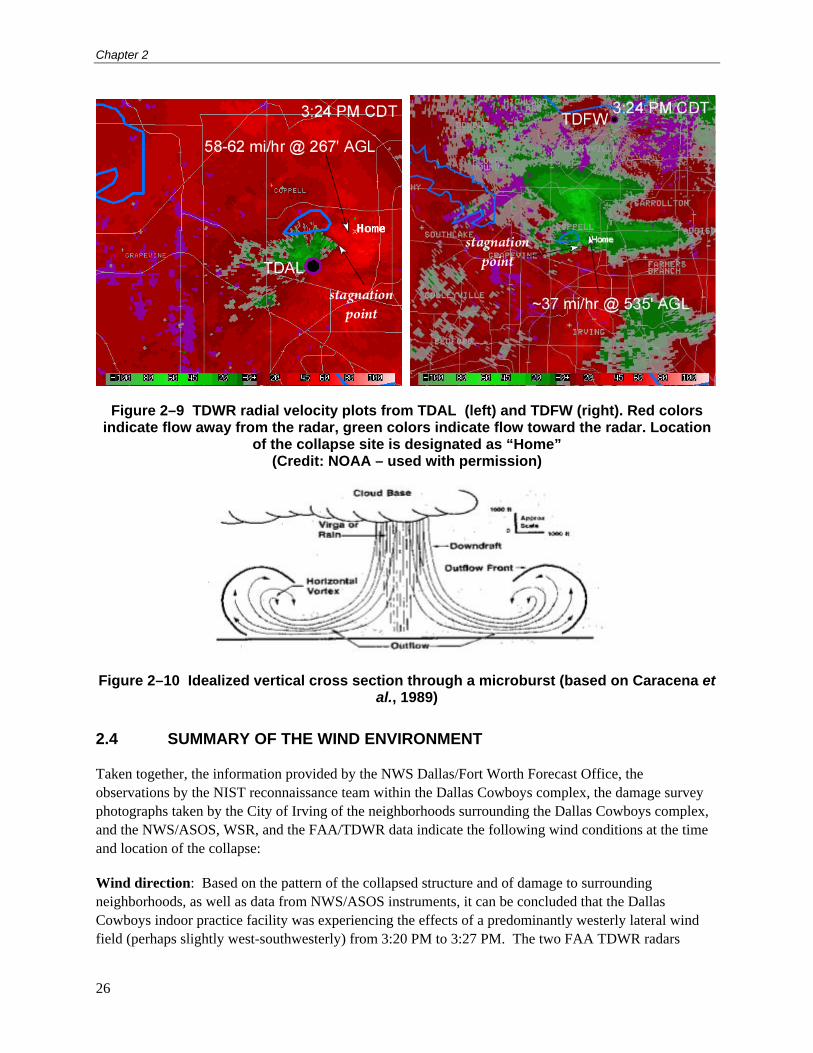
Chapter 2
26
Figure 2–9 TDWR radial velocity plots from TDAL (left) and TDFW (right). Red colors indicate flow away from the radar, green colors indicate flow toward the radar. Location
of the collapse site is designated as “Home” (Credit: NOAA – used with permission)
Figure 2–10 Idealized vertical cross section through a microburst (based on Caracena et al., 1989)
2.4 SUMMARY OF THE WIND ENVIRONMENT
Taken together, the information provided by the NWS Dallas/Fort Worth Forecast Office, the observations by the NIST reconnaissance team within the Dallas Cowboys complex, the damage survey photographs taken by the City of Irving of the neighborhoods surrounding the Dallas Cowboys complex, and the NWS/ASOS, WSR, and the FAA/TDWR data indicate the following wind conditions at the time and location of the collapse:
Wind direction: Based on the pattern of the collapsed structure and of damage to surrounding neighborhoods, as well as data from NWS/ASOS instruments, it can be concluded that the Dallas Cowboys indoor practice facility was experiencing the effects of a predominantly westerly lateral wind field (perhaps slightly west-southwesterly) from 3:20 PM to 3:27 PM. The two FAA TDWR radars
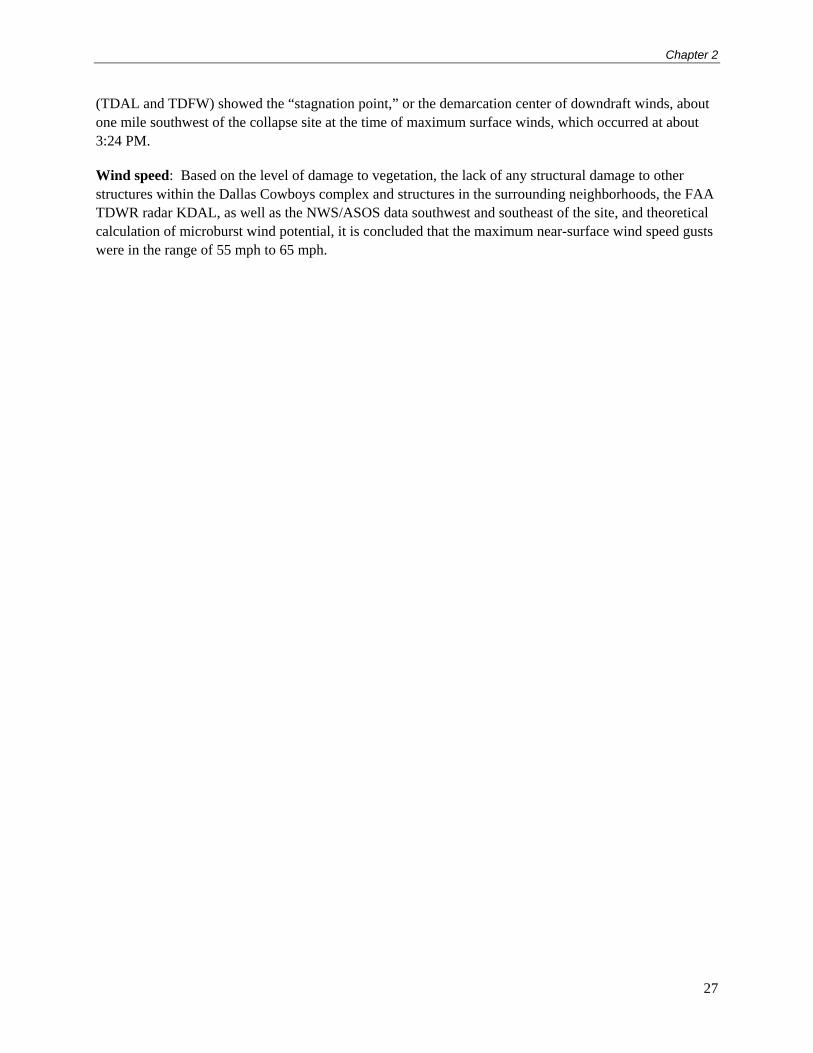
Chapter 2
27
(TDAL and TDFW) showed the “stagnation point,” or the demarcation center of downdraft winds, about one mile southwest of the collapse site at the time of maximum surface winds, which occurred at about 3:24 PM.
Wind speed: Based on the level of damage to vegetation, the lack of any structural damage to other structures within the Dallas Cowboys complex and structures in the surrounding neighborhoods, the FAA TDWR radar KDAL, as well as the NWS/ASOS data southwest and southeast of the site, and theoretical calculation of microburst wind potential, it is concluded that the maximum near-surface wind speed gusts were in the range of 55 mph to 65 mph.

28
This page intentionally left blank.
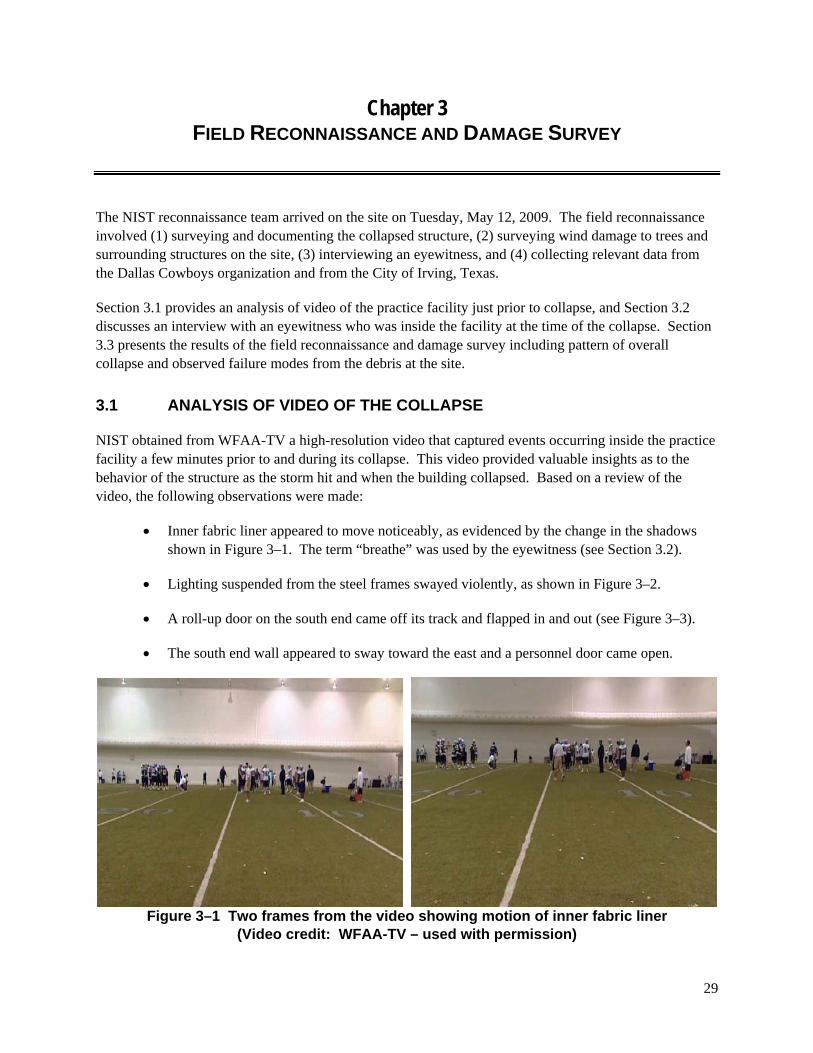
29
Chapter 3 FIELD RECONNAISSANCE AND DAMAGE SURVEY
The NIST reconnaissance team arrived on the site on Tuesday, May 12, 2009. The field reconnaissance involved (1) surveying and documenting the collapsed structure, (2) surveying wind damage to trees and surrounding structures on the site, (3) interviewing an eyewitness, and (4) collecting relevant data from the Dallas Cowboys organization and from the City of Irving, Texas.
Section 3.1 provides an analysis of video of the practice facility just prior to collapse, and Section 3.2 discusses an interview with an eyewitness who was inside the facility at the time of the collapse. Section 3.3 presents the results of the field reconnaissance and damage survey including pattern of overall collapse and observed failure modes from the debris at the site.
3.1 ANALYSIS OF VIDEO OF THE COLLAPSE
NIST obtained from WFAA-TV a high-resolution video that captured events occurring inside the practice facility a few minutes prior to and during its collapse. This video provided valuable insights as to the behavior of the structure as the storm hit and when the building collapsed. Based on a review of the video, the following observations were made:
Inner fabric liner appeared to move noticeably, as evidenced by the change in the shadows shown in Figure 3–1. The term “breathe” was used by the eyewitness (see Section 3.2).
Lighting suspended from the steel frames swayed violently, as shown in Figure 3–2.
A roll-up door on the south end came off its track and flapped in and out (see Figure 3–3).
The south end wall appeared to sway toward the east and a personnel door came open.
Figure 3–1 Two frames from the video showing motion of inner fabric liner
(Video credit: WFAA-TV – used with permission)
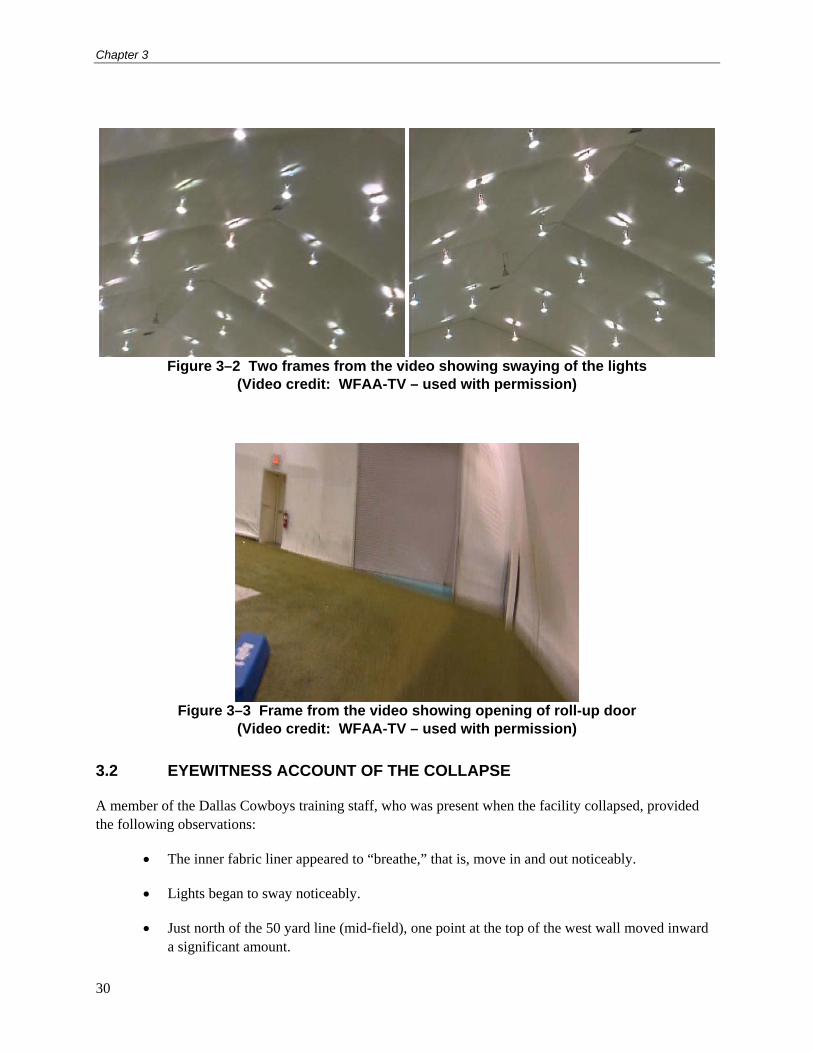
Chapter 3
30
Figure 3–2 Two frames from the video showing swaying of the lights
(Video credit: WFAA-TV – used with permission)
Figure 3–3 Frame from the video showing opening of roll-up door
(Video credit: WFAA-TV – used with permission)
3.2 EYEWITNESS ACCOUNT OF THE COLLAPSE
A member of the Dallas Cowboys training staff, who was present when the facility collapsed, provided the following observations:
The inner fabric liner appeared to “breathe,” that is, move in and out noticeably.
Lights began to sway noticeably.
Just north of the 50 yard line (mid-field), one point at the top of the west wall moved inward a significant amount.
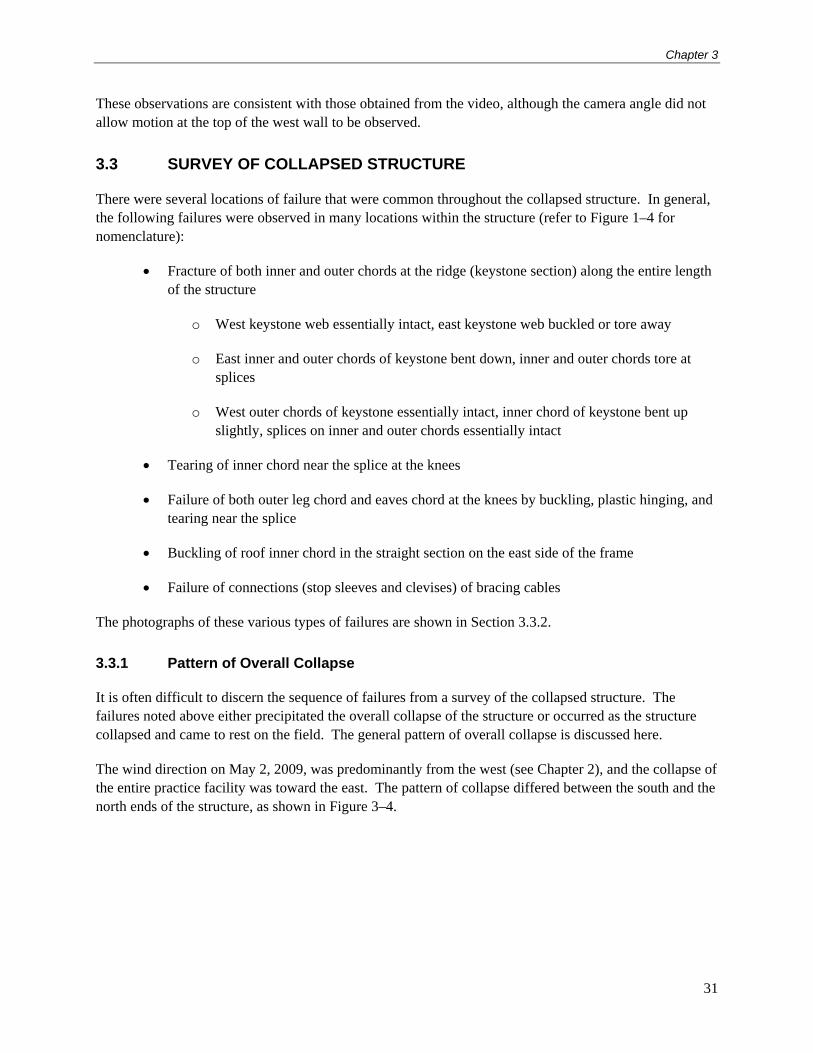
Chapter 3
31
These observations are consistent with those obtained from the video, although the camera angle did not allow motion at the top of the west wall to be observed.
3.3 SURVEY OF COLLAPSED STRUCTURE
There were several locations of failure that were common throughout the collapsed structure. In general, the following failures were observed in many locations within the structure (refer to Figure 1–4 for nomenclature):
Fracture of both inner and outer chords at the ridge (keystone section) along the entire length of the structure
o West keystone web essentially intact, east keystone web buckled or tore away
o East inner and outer chords of keystone bent down, inner and outer chords tore at splices
o West outer chords of keystone essentially intact, inner chord of keystone bent up slightly, splices on inner and outer chords essentially intact
Tearing of inner chord near the splice at the knees
Failure of both outer leg chord and eaves chord at the knees by buckling, plastic hinging, and tearing near the splice
Buckling of roof inner chord in the straight section on the east side of the frame
Failure of connections (stop sleeves and clevises) of bracing cables
The photographs of these various types of failures are shown in Section 3.3.2.
3.3.1 Pattern of Overall Collapse
It is often difficult to discern the sequence of failures from a survey of the collapsed structure. The failures noted above either precipitated the overall collapse of the structure or occurred as the structure collapsed and came to rest on the field. The general pattern of overall collapse is discussed here.
The wind direction on May 2, 2009, was predominantly from the west (see Chapter 2), and the collapse of the entire practice facility was toward the east. The pattern of collapse differed between the south and the north ends of the structure, as shown in Figure 3–4.
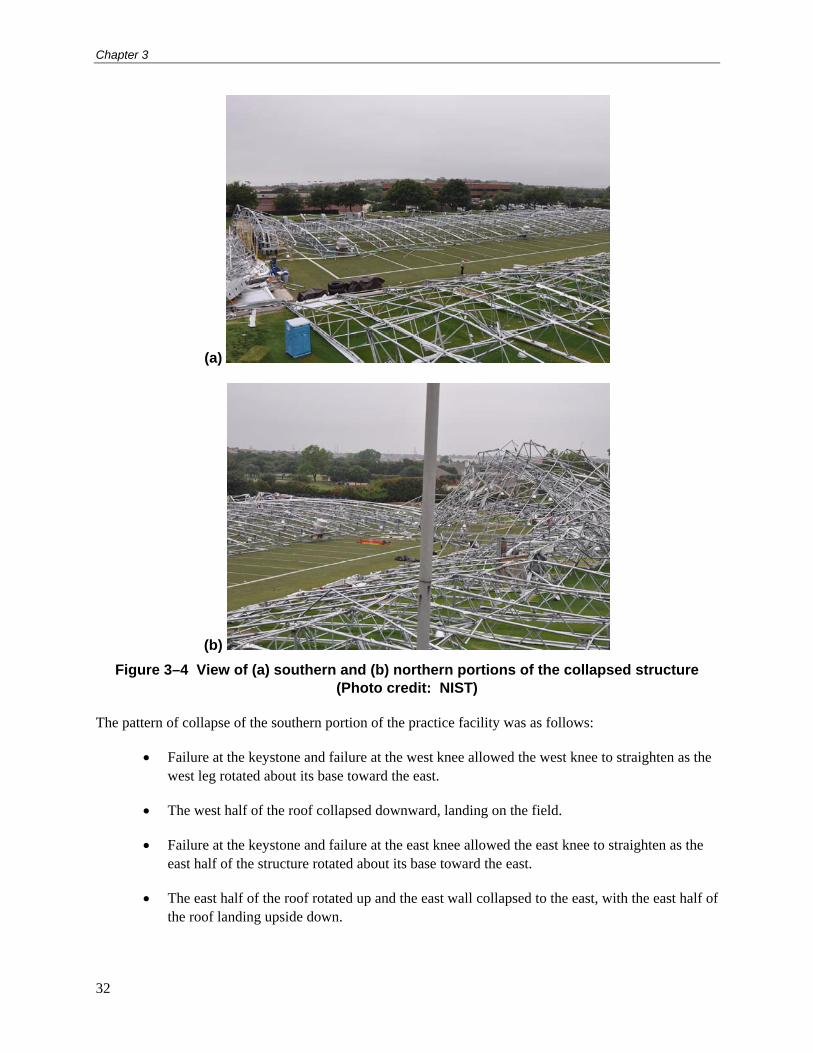
Chapter 3
32
(a)
(b)
Figure 3–4 View of (a) southern and (b) northern portions of the collapsed structure (Photo credit: NIST)
The pattern of collapse of the southern portion of the practice facility was as follows:
Failure at the keystone and failure at the west knee allowed the west knee to straighten as the west leg rotated about its base toward the east.
The west half of the roof collapsed downward, landing on the field.
Failure at the keystone and failure at the east knee allowed the east knee to straighten as the east half of the structure rotated about its base toward the east.
The east half of the roof rotated up and the east wall collapsed to the east, with the east half of the roof landing upside down.
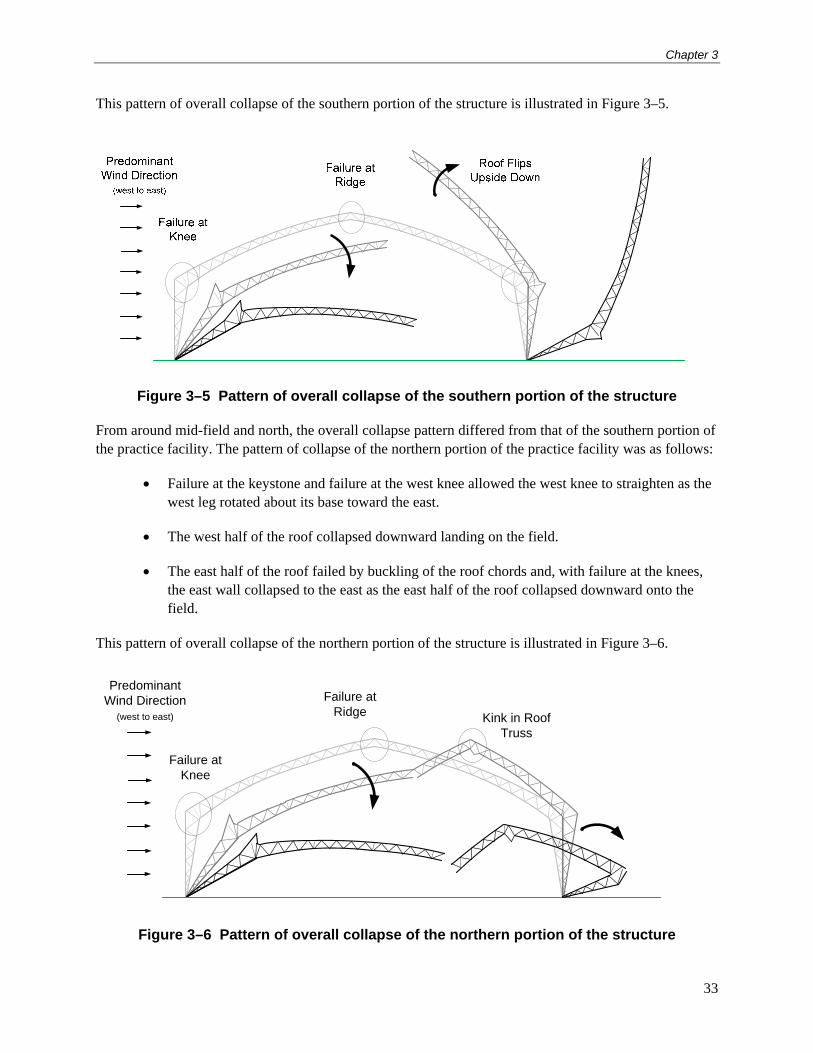
Chapter 3
33
This pattern of overall collapse of the southern portion of the structure is illustrated in Figure 3–5.
Figure 3–5 Pattern of overall collapse of the southern portion of the structure
From around mid-field and north, the overall collapse pattern differed from that of the southern portion of the practice facility. The pattern of collapse of the northern portion of the practice facility was as follows:
Failure at the keystone and failure at the west knee allowed the west knee to straighten as the west leg rotated about its base toward the east.
The west half of the roof collapsed downward landing on the field.
The east half of the roof failed by buckling of the roof chords and, with failure at the knees, the east wall collapsed to the east as the east half of the roof collapsed downward onto the field.
This pattern of overall collapse of the northern portion of the structure is illustrated in Figure 3–6.
Failure at Ridge
Failure at Knee
PredominantWind Direction
(west to east) Kink in Roof Truss
Figure 3–6 Pattern of overall collapse of the northern portion of the structure
Chapter 3
34
3.3.2 Observed Failures
Failure of the keystone chords at the ridge is shown in Figure 3–7. Failures of the chord members were consistent with ductile tensile fracture (e.g., showing no evidence of ovaling), and occurred beyond the tabs to which the ridge purlin was attached. The failures of the west and east halves of the keystone differed. On the west half, the outer chord remained essentially intact up to the location of the fracture while the inner chord bent up slightly. Note that this bending may have occurred as the west section of the roof hit the field upon collapse. The west keystone web was intact as were the west keystone splices. On the east half of the keystone, the inner and outer chords were bent down significantly, accompanied by tearing at the east splices (see Figure 3–8). Additionally, the west keystone web either buckled or detached from the collapsed structure.
Failures also occurred at the knees of the frames. The inner chords failed by tearing above the splice between the leg and taper sections. This is shown in Figure 3–9. The outer chords at the knees, both the outer leg chord and the outer taper chord, failed by plastic hinging and by tearing at the splices. These failures resulted in buckling of the outer chords, thereby allowing the knees to open up as seen in Figure 3–10.
Buckling of the inner chords in the straight section of the frames was observed in the northern portion of the structure as shown in Figure 3–11. The inner chords bucked out-of-plane in the approximate location of the “kink” shown in Figure 3–6. Figure 3–12 shows that lateral buckling of the inner chords was evident in many of the frames in the northern portion of the structure.
Finally, it was observed that many connections at the ends of the sway bracing and cross bracing failed. One such failure, where a swaged stop sleeve pulled off the end of a cable, is shown in Figure 3–13, where (a) shows an intact connection and (b) shows a failed connection.
The structural analyses in Chapter 5 will help to explain some of the failure modes reported in this chapter and shed light on the likely collapse sequence that is consistent with the field reconnaissance.
Chapter 3
35
Figure 3–7 Fracture of inner and outer chords at the keystone (Photo credit: NIST)
Figure 3–8 Keystone chords bent down (note roof is upside down) (Photo credit: NIST)
East outer chord of keystone bent “down”
Chapter 3
36
Figure 3–9 Failure of inner chord near the splice at the west knees (Photo credit: NIST)
Figure 3–10 Failure of both outer leg chord and eaves chord (Photo credit: NIST)
Buckled outer chord
Chapter 3
37
Figure 3–11 Out-of-plane buckling of inner chord in north portion of collapsed structure (Photo credit: NIST)

Chapter 3
38
Figure 3–12 Out-of-plane buckling of inner chords in north portion of collapsed structure (Photo credit: NIST)
(a) (b)
Figure 3–13 Failure of bracing cable connections: (a) intact, (b) failed (Photo credit: NIST)
39
Chapter 4 REVIEW OF STRUCTURAL DESIGN OF PRACTICE FACILITY
Documents obtained from the City of Irving, Texas indicate that the Dallas Cowboys practice facility was designed in accordance with the 2000 edition of the International Building Code (IBC 2000). Although at the time of the design, the building code in effect for the City of Irving was the Uniform Building Code (UBC 1997), the IBC 2000 was used with approval from the City since it contained provisions for membrane-covered frame structures (Chapter 31: Special Construction).
The practice facility was designed to resist gravity loads, preloads due to the tensioning of the fabric, snow loads, and wind loads. The design loads in the original 2003 design (Summit Structures 2003a,b) were calculated on the basis of the 1998 edition of the ASCE 7 Standard, Minimum Design Loads for Buildings and Other Structures (ASCE 1998), while in the 2008 upgrade of the facility (S2 Specialty Structures 2008), the loads were based on the 2005 edition of ASCE 7. For both the original 2003 design and the 2008 upgrade, a structural model of a typical frame was developed using STAAD.Pro software, and internal forces (demands) in frame members were computed under load combinations specified by ASCE 7-98 and ASCE 7-05, respectively. Member capacities were calculated and member designs were considered acceptable when the ratio of member demand to member capacity (design demand-capacity ratio) was less than or equal to 1.0.
In this chapter, Section 4.1 presents a review of the design wind loads. First, wind loads specified by ASCE 7 are presented, and then the loads used in the original 2003 design and the 2008 upgrade are reviewed. Section 4.2 provides a review of the design strengths of frame members.
4.1 DESIGN BASES FOR WIND
The design documents for the structure indicate that the wind loads were calculated using the provisions of the ASCE 7-98 Standard for the original 2003 design and the provisions of the ASCE 7-05 Standard for the 2008 upgrade. NIST found that for this structure, ASCE 7-98 and ASCE 7-05 yield identical design wind loads. However, as will be shown later in this chapter, the wind loads used in the original 2003 design differed from those used in the 2008 upgrade of the structure. Section 4.1.1 summarizes the design wind loads based on both ASCE 7-98 and ASCE 7-05 (Baseline Case), while Section 4.1.2 reviews the wind loads used in the original 2003 design, and Section 4.1.3 reviews the wind loads used in the 2008 upgrade.
4.1.1 Design Wind Loads Based on ASCE 7-98 and ASCE 7-05 Standard Provisions
The wind velocity pressure zq , evaluated at height z, is estimated using Equation (6-13) of the ASCE 7-98 Standard or Equation (6-15) of the ASCE 7-05 Standard as:
IVKKKq dztzz200256.0 psf (4.1)
Chapter 4
40
where: zK is the velocity pressure exposure coefficient, defined in Table 6-5 of ASCE 7-98 or Table 6-3 of ASCE 7-05 for exposure C (open terrain). For eave height z of 46.9 ft,
zK =1.074, and for mean roof height h of 66.4 ft, hK =1.156.
ztK is the topographic factor and is set equal to unity (Section 6.5.7.2 of ASCE 7-98 and ASCE 7-05).
dK is the wind directionality factor and is set equal to 0.85 based on Table 6-6 of ASCE 7-98 or Table 6-4 of ASCE 7-98.
V is the basic wind speed, in mph, obtained from the wind map (Figure 6-1 of ASCE 7-98 and ASCE 7-05), corresponding to a 3 s gust speed at 33 ft above ground in open terrain. For this site, V is set to 90 mph.
I is the importance factor and is set equal to 1.00 based on Table 6-1 of ASCE 7-98 and ASCE 7-05, considering occupancy category II (Table 1-1 of ASCE 7-98 and ASCE 7-05).
The velocity pressure qh at mean roof height h is thus calculated to be 20.5 psf, and qz at eave height is 19.0 psf. The design wind pressure p is determined using Equation (6-15) of ASCE 7-98 or Equation (6-17) of ASCE 7-05 Standard as:
)( piip GCqqGCp (4.2)
where: q = zq for windward walls evaluated at height z, and q = hq for leeward walls, side walls, and roofs.
iq is set equal to hq for estimating internal pressures for windward walls, side walls, leeward walls, and roofs for the case of an enclosed building and for negative internal pressures in the case of a partially enclosed building. For positive internal pressure evaluation in a partially enclosed building, qi is also conservatively set to qh.
G is the gust factor and is set equal to 0.85 based on Section 6.5.8.1 of ASCE 7-98 and ASCE 7-05. The fundamental frequency of the structure is discussed in Section 5.1, and it is shown that the structure is on the borderline between a rigid and flexible structure (fundamental frequency approximately equal to 1.0 Hz). As such, for this structure, values of G under both rigid and flexible assumptions are essentially equal, and the value of 0.85 is slightly conservative in both cases (see Table 5–2).
Cp is the external pressure coefficient and is determined from Figure 6-3 of ASCE 7-98 or Figure 6-6 of ASCE 7-05.
Chapter 4
41
(GCpi) is the internal pressure coefficient and is determined from Figure 6-7 of ASCE 7-98 or Figure 6-5 of ASCE 7-05 to be ±0.18 for enclosed buildings and ±0.55 for partially enclosed buildings2.
The first term in the right hand side of Equation (4.2) represents the external wind pressure, while the second term represents the internal pressure. For the external pressure, both ASCE 7-98 and ASCE 7-05 specify two wind directions: normal and parallel to ridge (see Figure 6-3 of ASCE 7-98 or Figure 6-6 of ASCE 7-05). Note that for the case of wind parallel to ridge, both standards specify wind pressure coefficients that depend on the horizontal distance from the windward edge. Because h / L ≤ 0.5 for this structure (L = 406 ft for wind parallel to ridge), the negative (uplift) external pressure coefficient Cp on the roof would be 0.9 for frames within a distance from the windward edge of 0 to h, 0.5 for frames within a distance of h to 2h, and 0.3 for frames located at a distance from the windward edge greater than 2h. Recall that for this structure h = 66.4 ft. Therefore, frames located within a horizontal distance of 66.4 ft from the end frame would be designed for a higher roof pressure than those in the interior of the structure. Since a single frame design is used for all interior frames (i.e., the same geometry and member cross sections), the frames would then be designed for the higher wind pressures close to the end frames.
Based on the enclosure criteria outlined in Section 6.2 of ASCE 7-98 and ASCE 7-05, the Dallas Cowboys practice facility would be classified as partially enclosed due to the presence of vents on the north and south end walls and on the roof of the building. The locations of the vents and doors are shown in Figure 4–1 , along with the areas of these openings estimated from the design drawings. The locations of the vents and doors were determined from aerial photographs of the structure as built, because differences from the design drawings were observed in the location of the openings.
The enclosure criteria outlined in Section 6.2 of ASCE 7-98 and ASCE 7-05 involve calculation of Ao, the total area of openings in a wall that receives positive external pressure, and Aoi, the sum of areas of openings in the building envelope (walls and roof) not including Ao. In the case of the north end wall receiving positive pressure, values of Ao = 250 ft2 and Aoi = 214 ft2 are obtained for the north wall with all vents considered open and all doors closed. These areas yield a ratio of Ao/Aoi = 1.17, which satisfies the specified criterion of Ao > 1.10Aoi for a partially enclosed building. The criteria for partially enclosed buildings also require that Ao > 4 ft2, and this condition is also satisfied. While no details were available about the operation of the vents, the criteria for a partially enclosed building would be satisfied even if as little as 2 % of the area of the vents was considered open. Based on the consideration of vent openings, this structure was determined to be partially enclosed for the purpose of calculating internal design wind pressures3.
While the preceding discussion considered all doors to be closed, there is also a possibility that some doors may open during a wind storm. The 2008 upgrade documents (S2 Specialty Structures 2008) state that “This structure should be maintained closed at all unused times to prevent the possibility of an
2 Note that the standard allows the use of a reduction factor for internal pressures in partially enclosed large volume buildings
(Section 6.5.11.1.1 of ASCE 7-98 and ASCE 7-05). For this structure the reduction factor would be about 0.96 and as a result the reduction was ignored in the wind load calculations.
3 This building would also satisfy the criteria for a partially enclosed building for the case of the south wall receiving positive pressure with the rollup doors open (e.g., with vents open and personnel doors closed). Note that for either the east or west wall receiving positive wind pressure, the criteria for partial enclosure are not met. However, because the enclosure classification in ASCE 7-98 and ASCE 7-05 applies to a building rather than to a specific load case, the worst case is considered in determination of the building enclosure classification.
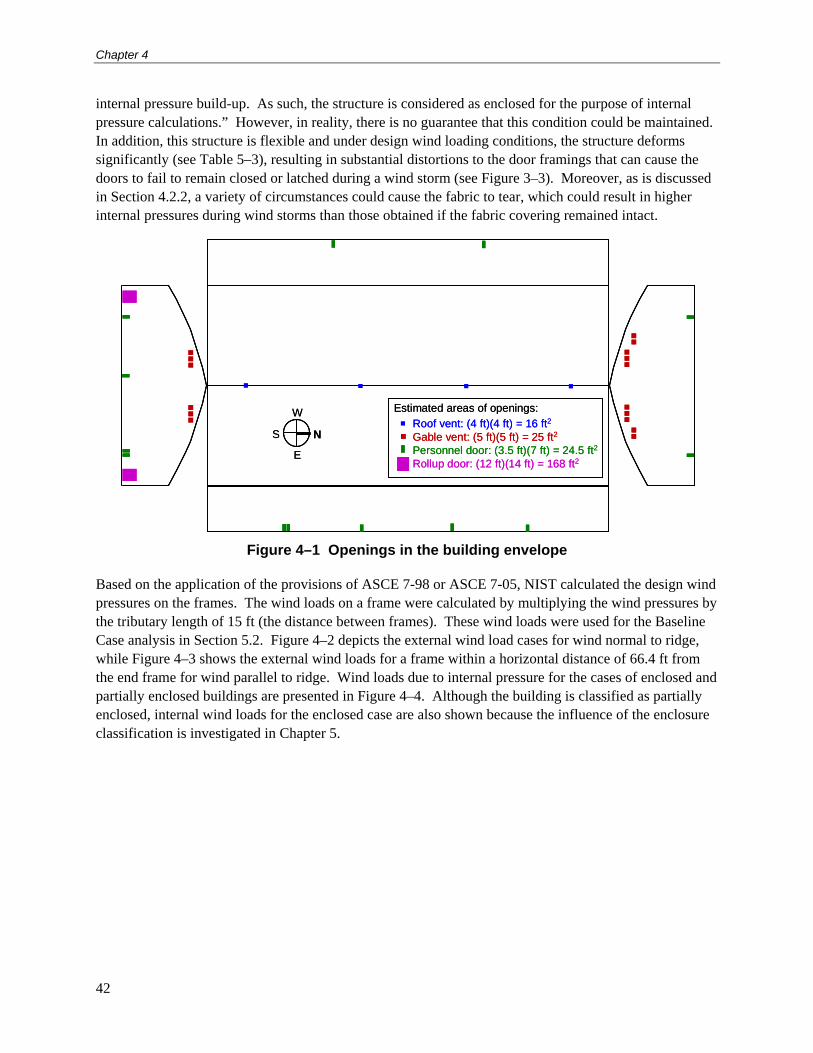
Chapter 4
42
internal pressure build-up. As such, the structure is considered as enclosed for the purpose of internal pressure calculations.” However, in reality, there is no guarantee that this condition could be maintained. In addition, this structure is flexible and under design wind loading conditions, the structure deforms significantly (see Table 5–3), resulting in substantial distortions to the door framings that can cause the doors to fail to remain closed or latched during a wind storm (see Figure 3–3). Moreover, as is discussed in Section 4.2.2, a variety of circumstances could cause the fabric to tear, which could result in higher internal pressures during wind storms than those obtained if the fabric covering remained intact.
Roof vent: (4 ft)(4 ft) = 16 ft2
Gable vent: (5 ft)(5 ft) = 25 ft2
Personnel door: (3.5 ft)(7 ft) = 24.5 ft2
Rollup door: (12 ft)(14 ft) = 168 ft2
Estimated areas of openings:
NS
E
WRoof vent: (4 ft)(4 ft) = 16 ft2
Gable vent: (5 ft)(5 ft) = 25 ft2
Personnel door: (3.5 ft)(7 ft) = 24.5 ft2
Rollup door: (12 ft)(14 ft) = 168 ft2
Estimated areas of openings:
NS
E
W
Figure 4–1 Openings in the building envelope
Based on the application of the provisions of ASCE 7-98 or ASCE 7-05, NIST calculated the design wind pressures on the frames. The wind loads on a frame were calculated by multiplying the wind pressures by the tributary length of 15 ft (the distance between frames). These wind loads were used for the Baseline Case analysis in Section 5.2. Figure 4–2 depicts the external wind load cases for wind normal to ridge, while Figure 4–3 shows the external wind loads for a frame within a horizontal distance of 66.4 ft from the end frame for wind parallel to ridge. Wind loads due to internal pressure for the cases of enclosed and partially enclosed buildings are presented in Figure 4–4. Although the building is classified as partially enclosed, internal wind loads for the enclosed case are also shown because the influence of the enclosure classification is investigated in Chapter 5.
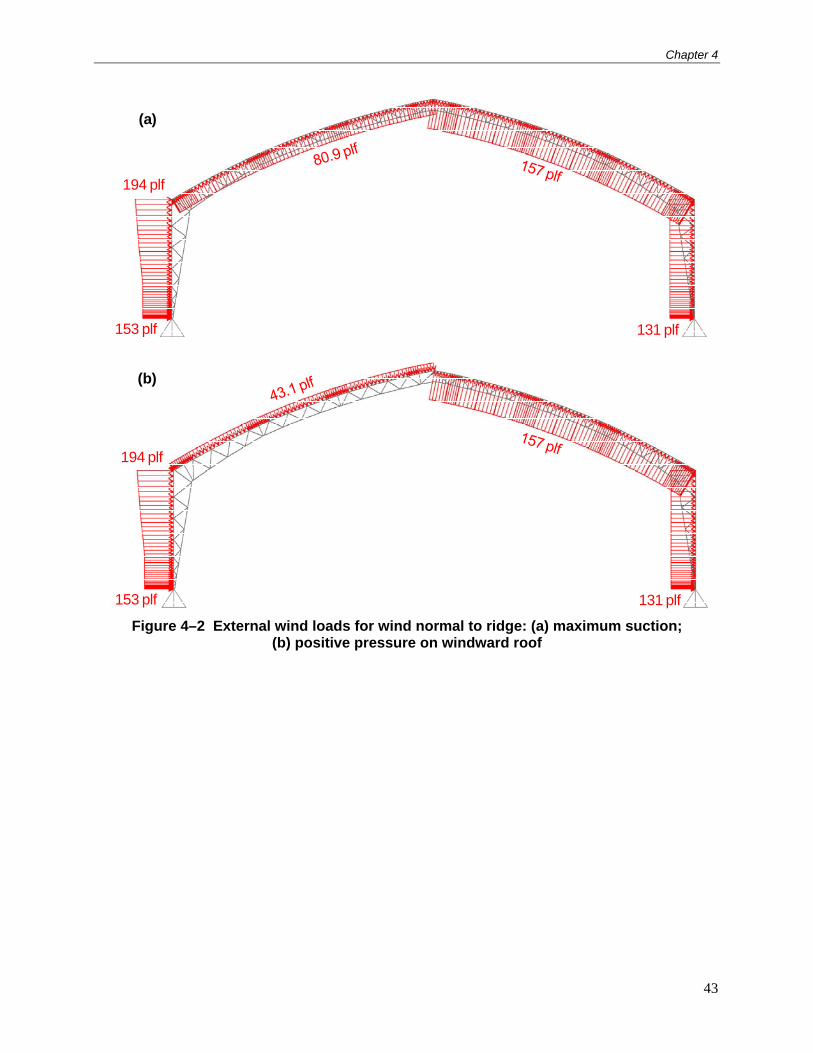
Chapter 4
43
(a)
(b)
131 plf
194 plf
153 plf
131 plf
194 plf
153 plf
Figure 4–2 External wind loads for wind normal to ridge: (a) maximum suction; (b) positive pressure on windward roof
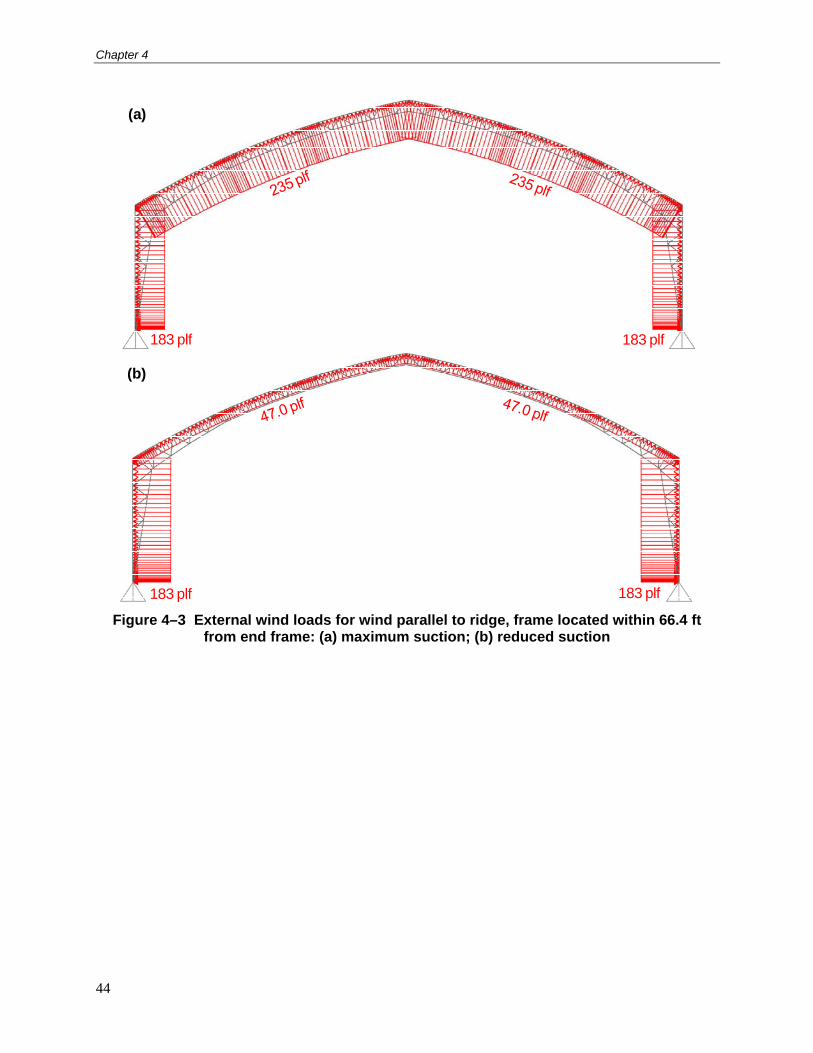
Chapter 4
44
(a)
(b)
183 plf183 plf
183 plf183 plf
Figure 4–3 External wind loads for wind parallel to ridge, frame located within 66.4 ft from end frame: (a) maximum suction; (b) reduced suction
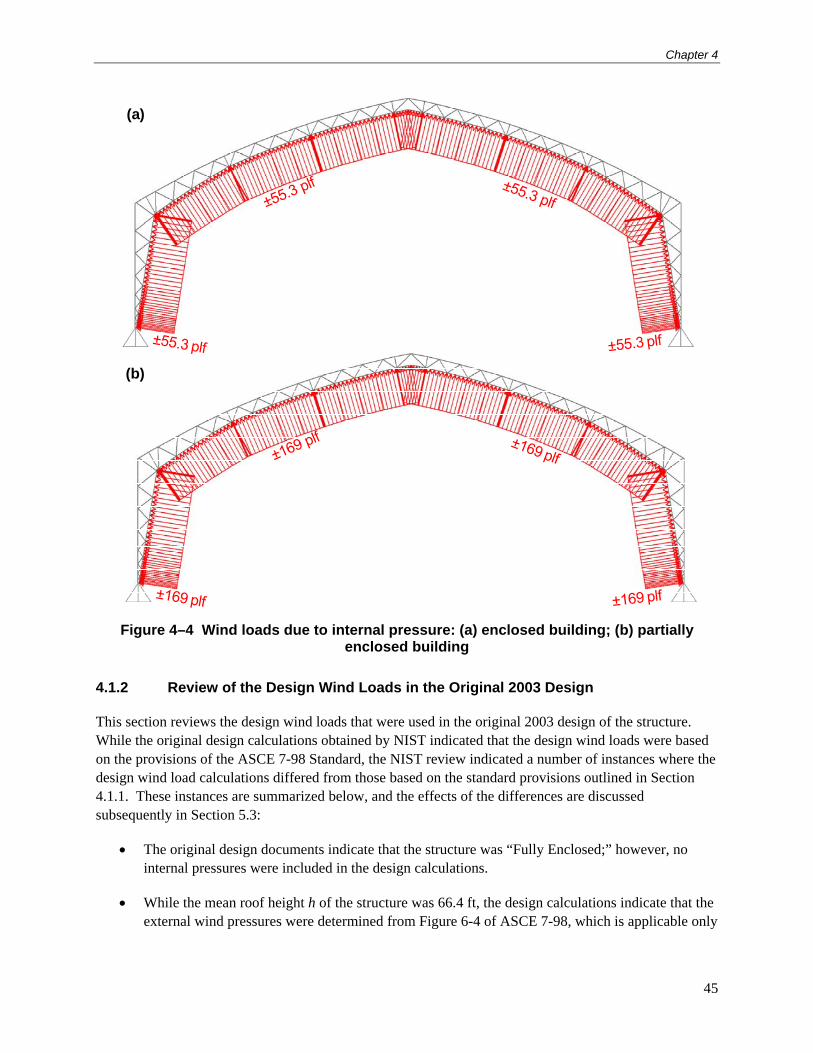
Chapter 4
45
(a)
(b)
Figure 4–4 Wind loads due to internal pressure: (a) enclosed building; (b) partially enclosed building
4.1.2 Review of the Design Wind Loads in the Original 2003 Design
This section reviews the design wind loads that were used in the original 2003 design of the structure. While the original design calculations obtained by NIST indicated that the design wind loads were based on the provisions of the ASCE 7-98 Standard, the NIST review indicated a number of instances where the design wind load calculations differed from those based on the standard provisions outlined in Section 4.1.1. These instances are summarized below, and the effects of the differences are discussed subsequently in Section 5.3:
The original design documents indicate that the structure was “Fully Enclosed;” however, no internal pressures were included in the design calculations.
While the mean roof height h of the structure was 66.4 ft, the design calculations indicate that the external wind pressures were determined from Figure 6-4 of ASCE 7-98, which is applicable only
Chapter 4
46
for h ≤ 60 ft (low-rise buildings). Figure 6-3 of ASCE 7-98 is applicable to all heights and should be used to determine the external wind pressure coefficients Cp for h > 60 ft.
Table 6-4 of ASCE 7-98, which was used to estimate the external wind pressure, specifies external wind pressure coefficients that depend on the horizontal distance from the windward edge. The table indicates higher wind pressures for frames close to the end walls. The design calculations, however, indicate that wind pressures on frames close to the end walls were not used and that the design was based on significantly smaller wind pressures applicable to frames further from the end walls.
The design calculations indicated that the importance factor I was set equal to 1.15 assuming an occupancy category IV (building was classified as “High Hazard”). This is a more conservative value than the value that was assigned in Section 4.1.1, which was consistent with occupancy category II.
Figure 4–5 shows the external wind loads that were used in the original 2003 design. Wind loads corresponding to Case A and Case B (for definition, see Table 6-4 of ASCE 7-98) are shown for a single frame of the structure. Comparing the wind load values in Figure 4–5 with those in Figure 4–2 and Figure 4–3, one observes that there are significant differences between the external wind loads from the original 2003 design and those based on the ASCE 7-98 Standard as outlined in Section 4.1.1. In addition, as noted above, internal pressures were not included in the original design calculations.

Chapter 4
47
160 plf160 plf
153 plf188 plf
(a)
(b)
Figure 4–5 External wind loads from the original 2003 design: (a) Case A; (b) Case B
4.1.3 Review of the Design Wind Loads in the 2008 Upgrade
This section reviews the wind loads that were used in the 2008 upgrade of the structure. While the upgrade calculations obtained by NIST indicated that the wind loads were based on the provisions of the ASCE 7-05 Standard, the NIST review indicated a number of instances where the wind load calculations differed from the standard provisions outlined in Section 4.1.1. These instances are summarized below, and the effects of the differences are discussed subsequently in Section 5.3:
As indicated in Section 4.1.1, for the case of wind parallel to ridge, Figure 6-6 of ASCE 7-05 specifies wind pressures that depend on the horizontal distance from the windward edge. Because h / L ≤ 0.5 for this structure, the negative (uplift) external pressure coefficient Cp
on the roof should be 0.9 for frames within a distance from the windward edge of 0 to 66.4 ft and 0.5 for frames within a distance of 66.4 ft to 132.8 ft. The 2008 upgrade calculations, however, indicate that wind pressures on frames close to the end walls (Cp = –0.9 on roof) were not used and the wind loads were instead based on significantly smaller wind pressures applicable to frames further from the end walls (Cp = –0.5 on roof).
Chapter 4
48
The 2008 upgrade calculations assumed a roof slope of 11° instead of the actual roof slope of 21° for calculation of external wind pressure coefficients. This resulted in consideration of only suction loads on the windward roof, while both negative pressure (suction) and positive pressure on the windward roof must be considered for the actual roof slope of 21°.
The 2008 upgrade used internal wind pressures based on the assumption that the structure is enclosed. However, as was shown in Section 4.1.1, this structure would be classified as partially enclosed due to the presence of vent and door openings (see Section 6.2 of ASCE 7-98 and ASCE 7-05).
The design calculations indicated that the importance factor I was set equal to 1.15 assuming an occupancy category IV (building was classified as “High Hazard” in one location and as “low hazard storage structure” in another). The usage of a 1.15 importance factor is more conservative than the value of unity that was assigned in Section 4.1.1.
Figure 4–6 shows the external wind load cases for wind normal to ridge as presented in the 2008 upgrade calculations, while Figure 4–7 shows the external wind loads for wind parallel to ridge. Figure 4–8 shows the internal wind loads for the case of an enclosed building, also from the 2008 upgrade calculations. Comparing these wind load values with those in Figure 4–2 to Figure 4–4, one observes that there are significant differences between the wind loads from the 2008 upgrade calculations and those based on the ASCE 7-05 Standard as outlined in Section 4.1.1.
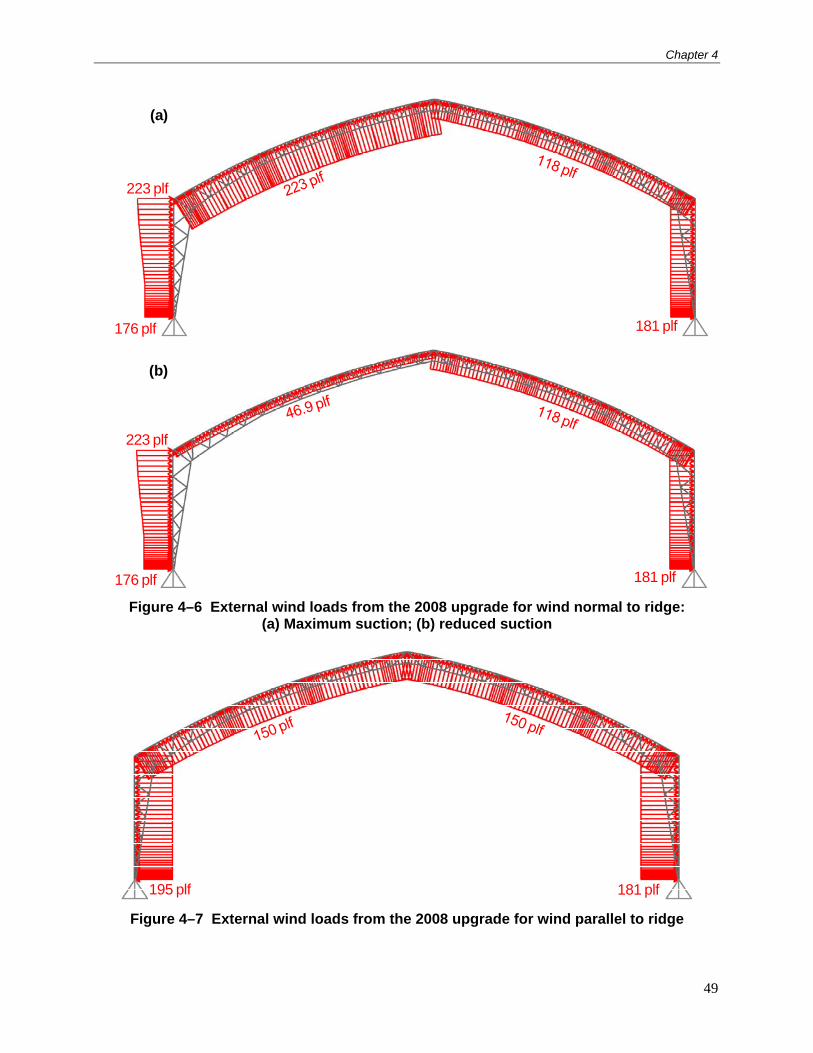
Chapter 4
49
181 plf176 plf
(a)
(b)
223 plf
181 plf176 plf
223 plf
Figure 4–6 External wind loads from the 2008 upgrade for wind normal to ridge: (a) Maximum suction; (b) reduced suction
181 plf195 plf
Figure 4–7 External wind loads from the 2008 upgrade for wind parallel to ridge
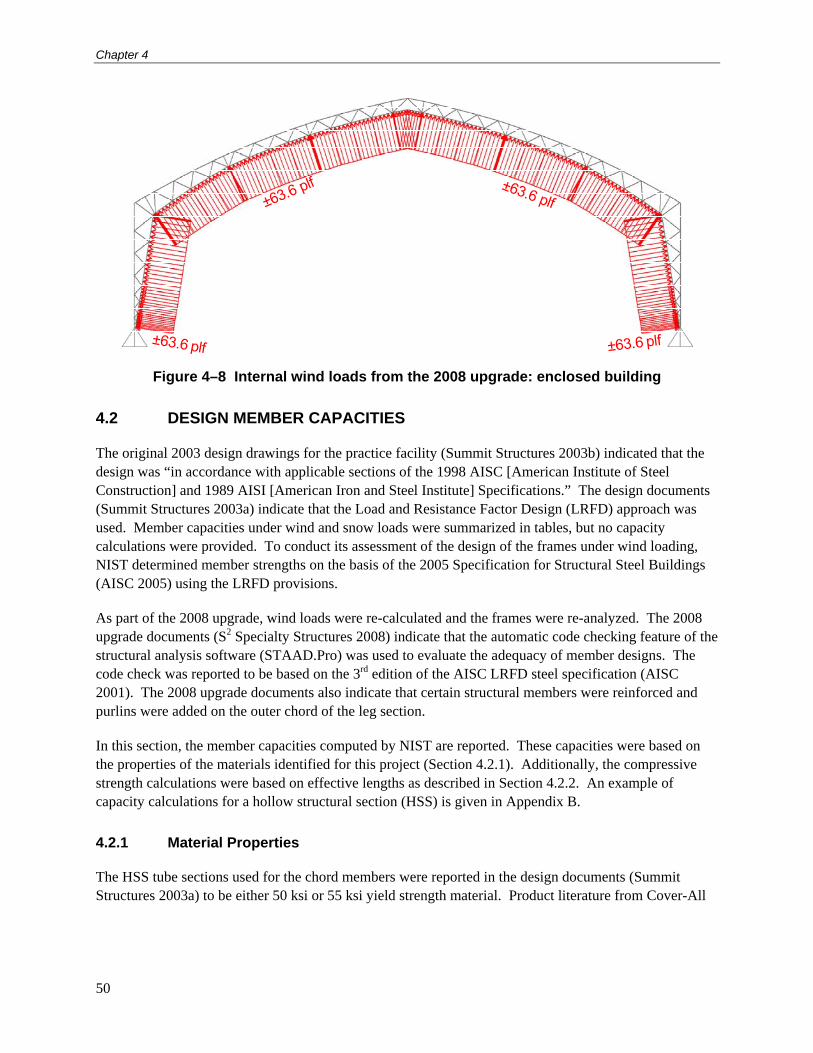
Chapter 4
50
Figure 4–8 Internal wind loads from the 2008 upgrade: enclosed building
4.2 DESIGN MEMBER CAPACITIES
The original 2003 design drawings for the practice facility (Summit Structures 2003b) indicated that the design was “in accordance with applicable sections of the 1998 AISC [American Institute of Steel Construction] and 1989 AISI [American Iron and Steel Institute] Specifications.” The design documents (Summit Structures 2003a) indicate that the Load and Resistance Factor Design (LRFD) approach was used. Member capacities under wind and snow loads were summarized in tables, but no capacity calculations were provided. To conduct its assessment of the design of the frames under wind loading, NIST determined member strengths on the basis of the 2005 Specification for Structural Steel Buildings (AISC 2005) using the LRFD provisions.
As part of the 2008 upgrade, wind loads were re-calculated and the frames were re-analyzed. The 2008 upgrade documents (S2 Specialty Structures 2008) indicate that the automatic code checking feature of the structural analysis software (STAAD.Pro) was used to evaluate the adequacy of member designs. The code check was reported to be based on the 3rd edition of the AISC LRFD steel specification (AISC 2001). The 2008 upgrade documents also indicate that certain structural members were reinforced and purlins were added on the outer chord of the leg section.
In this section, the member capacities computed by NIST are reported. These capacities were based on the properties of the materials identified for this project (Section 4.2.1). Additionally, the compressive strength calculations were based on effective lengths as described in Section 4.2.2. An example of capacity calculations for a hollow structural section (HSS) is given in Appendix B.
4.2.1 Material Properties
The HSS tube sections used for the chord members were reported in the design documents (Summit Structures 2003a) to be either 50 ksi or 55 ksi yield strength material. Product literature from Cover-All
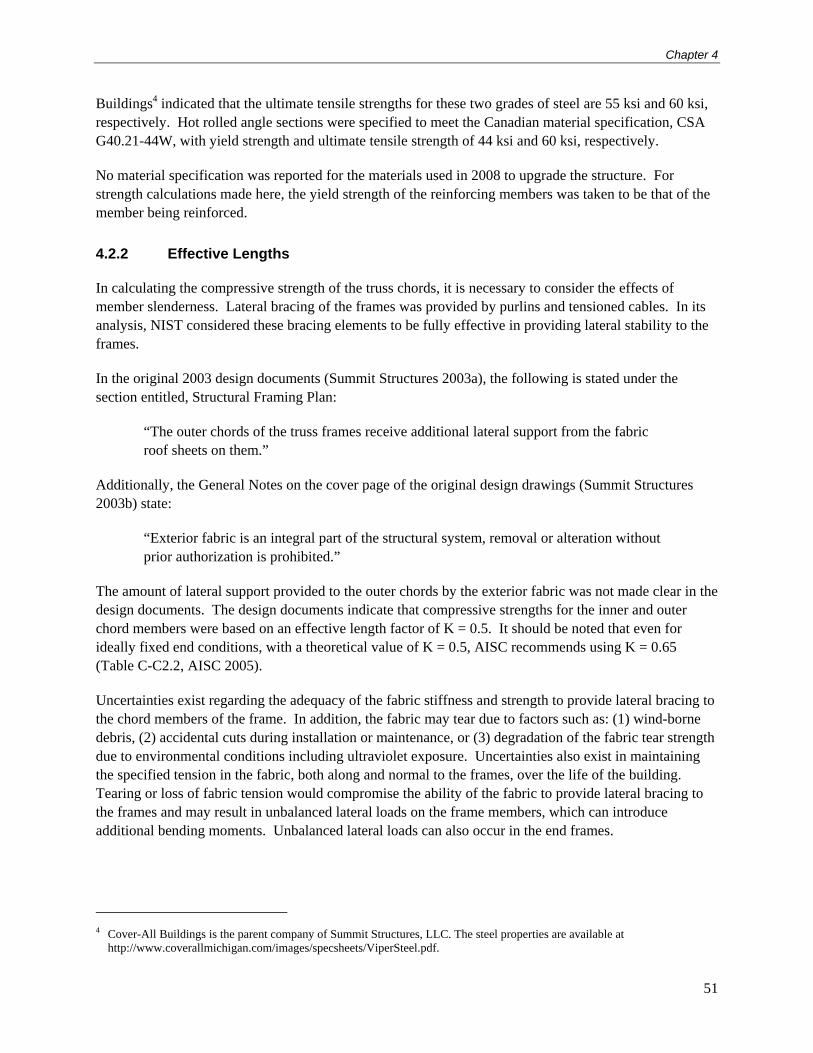
Chapter 4
51
Buildings4 indicated that the ultimate tensile strengths for these two grades of steel are 55 ksi and 60 ksi, respectively. Hot rolled angle sections were specified to meet the Canadian material specification, CSA G40.21-44W, with yield strength and ultimate tensile strength of 44 ksi and 60 ksi, respectively.
No material specification was reported for the materials used in 2008 to upgrade the structure. For strength calculations made here, the yield strength of the reinforcing members was taken to be that of the member being reinforced.
4.2.2 Effective Lengths
In calculating the compressive strength of the truss chords, it is necessary to consider the effects of member slenderness. Lateral bracing of the frames was provided by purlins and tensioned cables. In its analysis, NIST considered these bracing elements to be fully effective in providing lateral stability to the frames.
In the original 2003 design documents (Summit Structures 2003a), the following is stated under the section entitled, Structural Framing Plan:
“The outer chords of the truss frames receive additional lateral support from the fabric roof sheets on them.”
Additionally, the General Notes on the cover page of the original design drawings (Summit Structures 2003b) state:
“Exterior fabric is an integral part of the structural system, removal or alteration without prior authorization is prohibited.”
The amount of lateral support provided to the outer chords by the exterior fabric was not made clear in the design documents. The design documents indicate that compressive strengths for the inner and outer chord members were based on an effective length factor of K = 0.5. It should be noted that even for ideally fixed end conditions, with a theoretical value of K = 0.5, AISC recommends using K = 0.65 (Table C-C2.2, AISC 2005).
Uncertainties exist regarding the adequacy of the fabric stiffness and strength to provide lateral bracing to the chord members of the frame. In addition, the fabric may tear due to factors such as: (1) wind-borne debris, (2) accidental cuts during installation or maintenance, or (3) degradation of the fabric tear strength due to environmental conditions including ultraviolet exposure. Uncertainties also exist in maintaining the specified tension in the fabric, both along and normal to the frames, over the life of the building. Tearing or loss of fabric tension would compromise the ability of the fabric to provide lateral bracing to the frames and may result in unbalanced lateral loads on the frame members, which can introduce additional bending moments. Unbalanced lateral loads can also occur in the end frames.
4 Cover-All Buildings is the parent company of Summit Structures, LLC. The steel properties are available at
http://www.coverallmichigan.com/images/specsheets/ViperSteel.pdf.
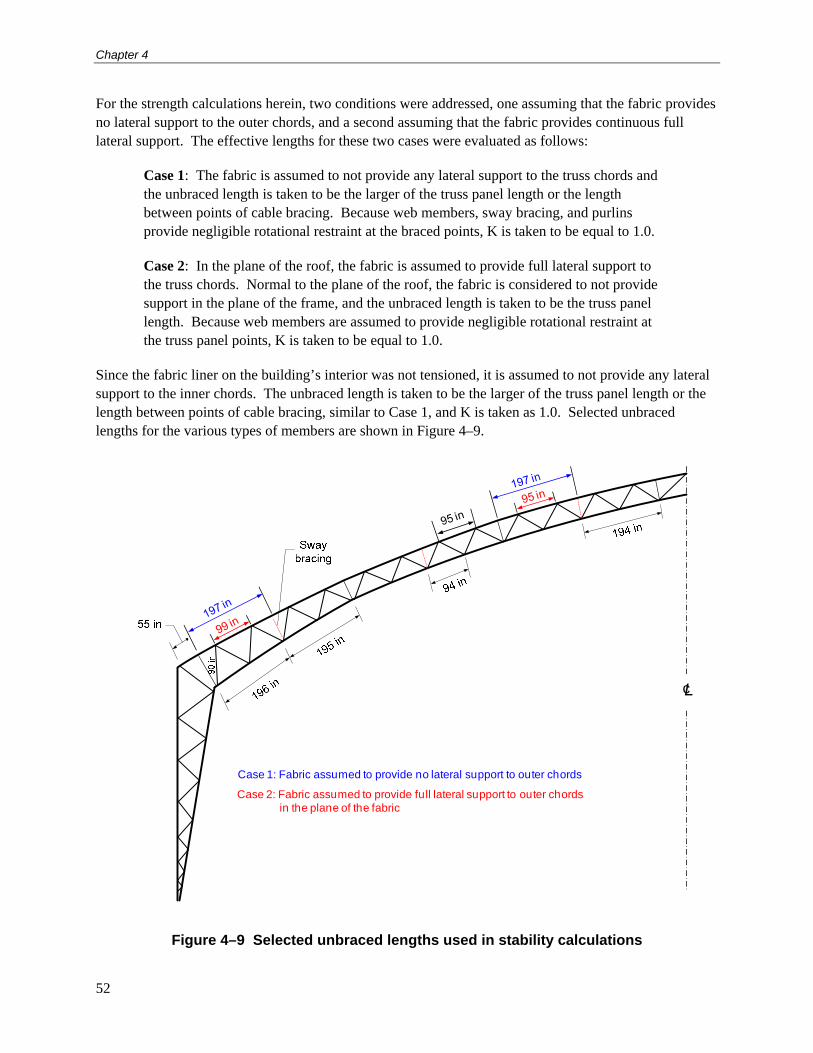
Chapter 4
52
For the strength calculations herein, two conditions were addressed, one assuming that the fabric provides no lateral support to the outer chords, and a second assuming that the fabric provides continuous full lateral support. The effective lengths for these two cases were evaluated as follows:
Case 1: The fabric is assumed to not provide any lateral support to the truss chords and the unbraced length is taken to be the larger of the truss panel length or the length between points of cable bracing. Because web members, sway bracing, and purlins provide negligible rotational restraint at the braced points, K is taken to be equal to 1.0.
Case 2: In the plane of the roof, the fabric is assumed to provide full lateral support to the truss chords. Normal to the plane of the roof, the fabric is considered to not provide support in the plane of the frame, and the unbraced length is taken to be the truss panel length. Because web members are assumed to provide negligible rotational restraint at the truss panel points, K is taken to be equal to 1.0.
Since the fabric liner on the building’s interior was not tensioned, it is assumed to not provide any lateral support to the inner chords. The unbraced length is taken to be the larger of the truss panel length or the length between points of cable bracing, similar to Case 1, and K is taken as 1.0. Selected unbraced lengths for the various types of members are shown in Figure 4–9.
cL
Case 1: Fabric assumed to provide no lateral support to outer chords
Case 2: Fabric assumed to provide full lateral support to outer chords in the plane of the fabric
Figure 4–9 Selected unbraced lengths used in stability calculations
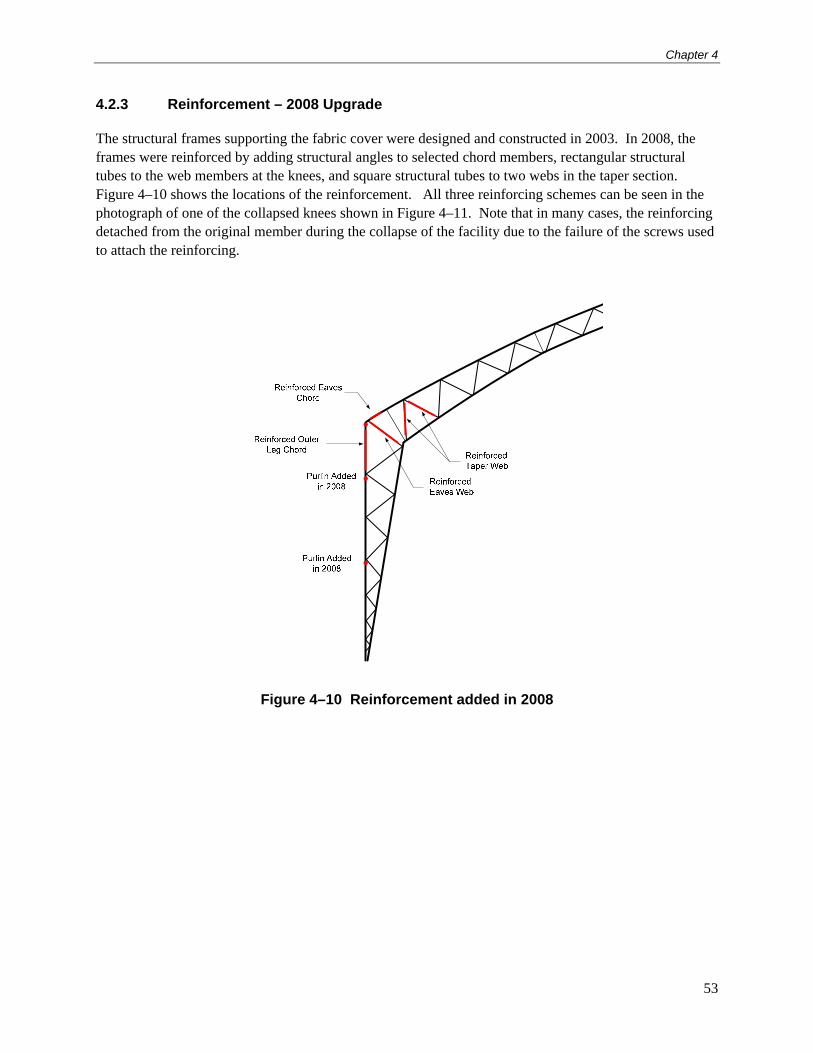
Chapter 4
53
4.2.3 Reinforcement – 2008 Upgrade
The structural frames supporting the fabric cover were designed and constructed in 2003. In 2008, the frames were reinforced by adding structural angles to selected chord members, rectangular structural tubes to the web members at the knees, and square structural tubes to two webs in the taper section. Figure 4–10 shows the locations of the reinforcement. All three reinforcing schemes can be seen in the photograph of one of the collapsed knees shown in Figure 4–11. Note that in many cases, the reinforcing detached from the original member during the collapse of the facility due to the failure of the screws used to attach the reinforcing.
Figure 4–10 Reinforcement added in 2008
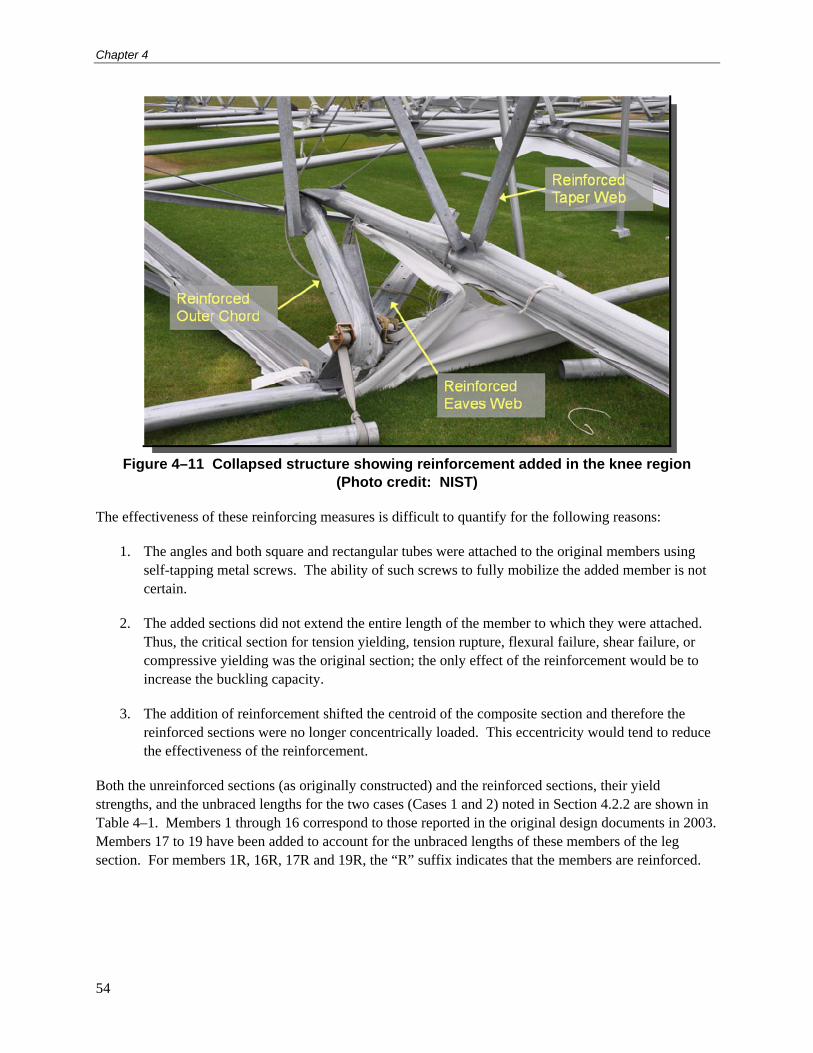
Chapter 4
54
Figure 4–11 Collapsed structure showing reinforcement added in the knee region (Photo credit: NIST)
The effectiveness of these reinforcing measures is difficult to quantify for the following reasons:
1. The angles and both square and rectangular tubes were attached to the original members using self-tapping metal screws. The ability of such screws to fully mobilize the added member is not certain.
2. The added sections did not extend the entire length of the member to which they were attached. Thus, the critical section for tension yielding, tension rupture, flexural failure, shear failure, or compressive yielding was the original section; the only effect of the reinforcement would be to increase the buckling capacity.
3. The addition of reinforcement shifted the centroid of the composite section and therefore the reinforced sections were no longer concentrically loaded. This eccentricity would tend to reduce the effectiveness of the reinforcement.
Both the unreinforced sections (as originally constructed) and the reinforced sections, their yield strengths, and the unbraced lengths for the two cases (Cases 1 and 2) noted in Section 4.2.2 are shown in Table 4–1. Members 1 through 16 correspond to those reported in the original design documents in 2003. Members 17 to 19 have been added to account for the unbraced lengths of these members of the leg section. For members 1R, 16R, 17R and 19R, the “R” suffix indicates that the members are reinforced.
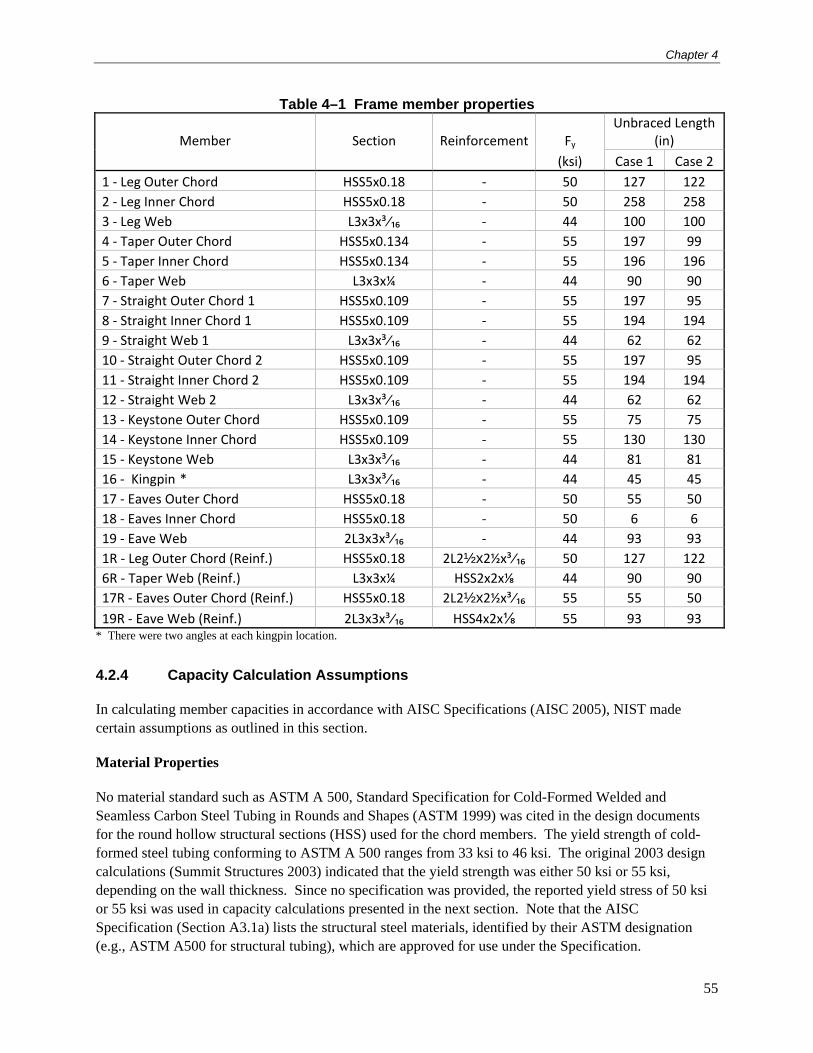
Chapter 4
55
Table 4–1 Frame member properties
Member Section Reinforcement Fy Unbraced Length
(in)
(ksi) Case 1 Case 2
1 ‐ Leg Outer Chord HSS5x0.18 ‐ 50 127 122
2 ‐ Leg Inner Chord HSS5x0.18 ‐ 50 258 258
3 ‐ Leg Web L3x3x³⁄₁₆ ‐ 44 100 100
4 ‐ Taper Outer Chord HSS5x0.134 ‐ 55 197 99
5 ‐ Taper Inner Chord HSS5x0.134 ‐ 55 196 196
6 ‐ Taper Web L3x3x¼ ‐ 44 90 90
7 ‐ Straight Outer Chord 1 HSS5x0.109 ‐ 55 197 95
8 ‐ Straight Inner Chord 1 HSS5x0.109 ‐ 55 194 194
9 ‐ Straight Web 1 L3x3x³⁄₁₆ ‐ 44 62 62
10 ‐ Straight Outer Chord 2 HSS5x0.109 ‐ 55 197 95
11 ‐ Straight Inner Chord 2 HSS5x0.109 ‐ 55 194 194
12 ‐ Straight Web 2 L3x3x³⁄₁₆ ‐ 44 62 62
13 ‐ Keystone Outer Chord HSS5x0.109 ‐ 55 75 75
14 ‐ Keystone Inner Chord HSS5x0.109 ‐ 55 130 130
15 ‐ Keystone Web L3x3x³⁄₁₆ ‐ 44 81 81
16 ‐ Kingpin * L3x3x³⁄₁₆ ‐ 44 45 45
17 ‐ Eaves Outer Chord HSS5x0.18 ‐ 50 55 50
18 ‐ Eaves Inner Chord HSS5x0.18 ‐ 50 6 6
19 ‐ Eave Web 2L3x3x³⁄₁₆ ‐ 44 93 93
1R ‐ Leg Outer Chord (Reinf.) HSS5x0.18 2L2½x2½x³⁄₁₆ 50 127 122
6R ‐ Taper Web (Reinf.) L3x3x¼ HSS2x2x⅛ 44 90 90
17R ‐ Eaves Outer Chord (Reinf.) HSS5x0.18 2L2½x2½x³⁄₁₆ 55 55 50
19R ‐ Eave Web (Reinf.) 2L3x3x³⁄₁₆ HSS4x2x⅛ 55 93 93 * There were two angles at each kingpin location.
4.2.4 Capacity Calculation Assumptions
In calculating member capacities in accordance with AISC Specifications (AISC 2005), NIST made certain assumptions as outlined in this section.
Material Properties
No material standard such as ASTM A 500, Standard Specification for Cold-Formed Welded and Seamless Carbon Steel Tubing in Rounds and Shapes (ASTM 1999) was cited in the design documents for the round hollow structural sections (HSS) used for the chord members. The yield strength of cold-formed steel tubing conforming to ASTM A 500 ranges from 33 ksi to 46 ksi. The original 2003 design calculations (Summit Structures 2003) indicated that the yield strength was either 50 ksi or 55 ksi, depending on the wall thickness. Since no specification was provided, the reported yield stress of 50 ksi or 55 ksi was used in capacity calculations presented in the next section. Note that the AISC Specification (Section A3.1a) lists the structural steel materials, identified by their ASTM designation (e.g., ASTM A500 for structural tubing), which are approved for use under the Specification.
Chapter 4
56
Member Section Properties
The AISC Specification (see Section B3.12) requires that the design wall thickness be used in member strength calculations involving the wall thickness of hollow structural sections (HSS). For tubes welded using the Submerged Arc Welding (SAW) process, the design wall thickness is taken as the nominal wall thickness. For tubes welded using the Electric Resistance Welding (ERW) process, the design wall thickness is taken as 0.93 times the nominal wall thickness. Since no specification was provided for the round HSS used for the chord members, NIST assumed the design wall thickness to be the nominal wall thickness as indicated in the original design documents (Summit Structures 2003a).
Participation of Reinforcement
For compressive strength of built-up members, the AISC Specification (see Section E6) applies to shapes that are interconnected by either bolts or welds. Since, in the 2008 upgrade, screws were used for attaching the reinforcing angles or rectangular HSS, the AISC provisions for built-up members could not be applied to calculate partial contribution of reinforcing elements. Consequently, two separate member capacity calculations were made: (1) assuming that the reinforcing elements did not contribute to the member strength and, (2) assuming that the reinforcing elements act fully compositely with the original member. As noted in Section 4.2.3, the reinforcing elements (angles or HSS tubes) added in the 2008 upgrade did not extend the entire length of the member to which they were attached. Thus, only the compressive capacity governed by member buckling was assumed to be affected by the reinforcement under the second assumption. Capacities for both assumptions are given in the next section.
4.2.5 Design Member Capacity Sets
All member capacity calculations reported in this section were based on the 2005 Specification for Structural Steel Buildings (AISC 2005) using LRFD provisions. As noted in Section 4.2.2, it is difficult to determine the degree to which the fabric provides lateral support (in the plane of the roof) to the outer chords. As such, capacity calculations were made assuming that (1) the roof fabric does not provide lateral restraint (Case 1), and (2) it provides full lateral restraint (Case 2). Similarly, as noted in Section 4.2.3, the effectiveness of the reinforcing added in 2008 is difficult to quantify. Therefore capacity calculations were made considering that (1) the reinforcement acts compositely with the original members to increase the buckling capacity, and (2) the reinforcement has no effect on the original member’s capacity. From these various assumptions, three member capacity sets (A, B, and C) were developed as shown in Table 4–2. The three sets represent factored capacities, i.e., nominal capacities multiplied by the relevant strength reduction factor . Member Capacity Sets A, B, and C will be used in the calculations of DCRs in Chapter 5.
In Member Capacity Set A, it is assumed that the fabric does not provide lateral support to the outer chord members. Since the fabric can tear, either accidently (during installation or use), or by wind-borne debris, and must be properly tensioned and maintained, it is conservative to assume that it does not act to provide lateral support to the outer chords. Further, since the effectiveness of the reinforcement added in 2008 was difficult to quantify, this set considers only the original member strength. Thus, Member Capacity Set A, shown in Table 4–3, represents the most conservative member capacities.
For Table 4–3 to Table 4–7, Pc(T) is the axial force capacity in tension, Pc(C) is the axial force capacity in compression, Mc is the bending moment capacity, and Vc is the shear force capacity.
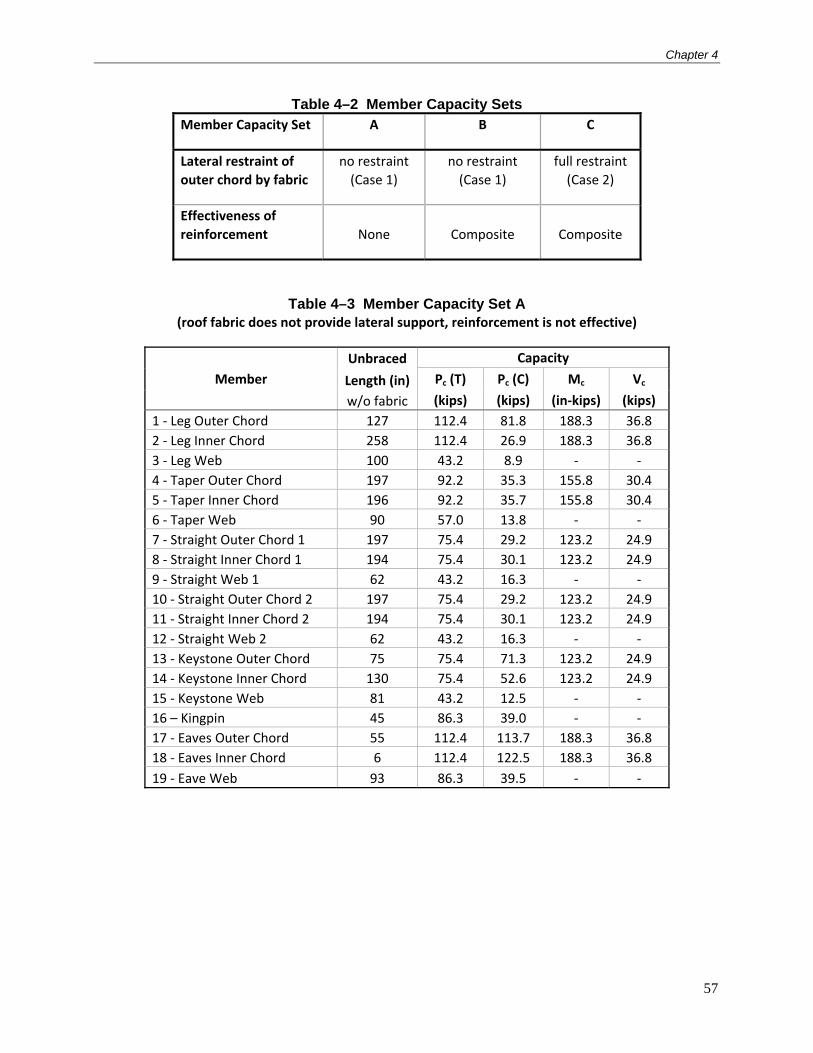
Chapter 4
57
Table 4–2 Member Capacity Sets Member Capacity Set A B C
Lateral restraint of
outer chord by fabric
no restraint
(Case 1)
no restraint
(Case 1)
full restraint
(Case 2)
Effectiveness of
reinforcement None Composite Composite
Table 4–3 Member Capacity Set A (roof fabric does not provide lateral support, reinforcement is not effective)
Member
Unbraced Capacity
Length (in) Pc (T) Pc (C) Mc Vc
w/o fabric (kips) (kips) (in‐kips) (kips)
1 ‐ Leg Outer Chord 127 112.4 81.8 188.3 36.8
2 ‐ Leg Inner Chord 258 112.4 26.9 188.3 36.8
3 ‐ Leg Web 100 43.2 8.9 ‐ ‐
4 ‐ Taper Outer Chord 197 92.2 35.3 155.8 30.4
5 ‐ Taper Inner Chord 196 92.2 35.7 155.8 30.4
6 ‐ Taper Web 90 57.0 13.8 ‐ ‐
7 ‐ Straight Outer Chord 1 197 75.4 29.2 123.2 24.9
8 ‐ Straight Inner Chord 1 194 75.4 30.1 123.2 24.9
9 ‐ Straight Web 1 62 43.2 16.3 ‐ ‐
10 ‐ Straight Outer Chord 2 197 75.4 29.2 123.2 24.9
11 ‐ Straight Inner Chord 2 194 75.4 30.1 123.2 24.9
12 ‐ Straight Web 2 62 43.2 16.3 ‐ ‐
13 ‐ Keystone Outer Chord 75 75.4 71.3 123.2 24.9
14 ‐ Keystone Inner Chord 130 75.4 52.6 123.2 24.9
15 ‐ Keystone Web 81 43.2 12.5 ‐ ‐
16 – Kingpin 45 86.3 39.0 ‐ ‐
17 ‐ Eaves Outer Chord 55 112.4 113.7 188.3 36.8
18 ‐ Eaves Inner Chord 6 112.4 122.5 188.3 36.8
19 ‐ Eave Web 93 86.3 39.5 ‐ ‐
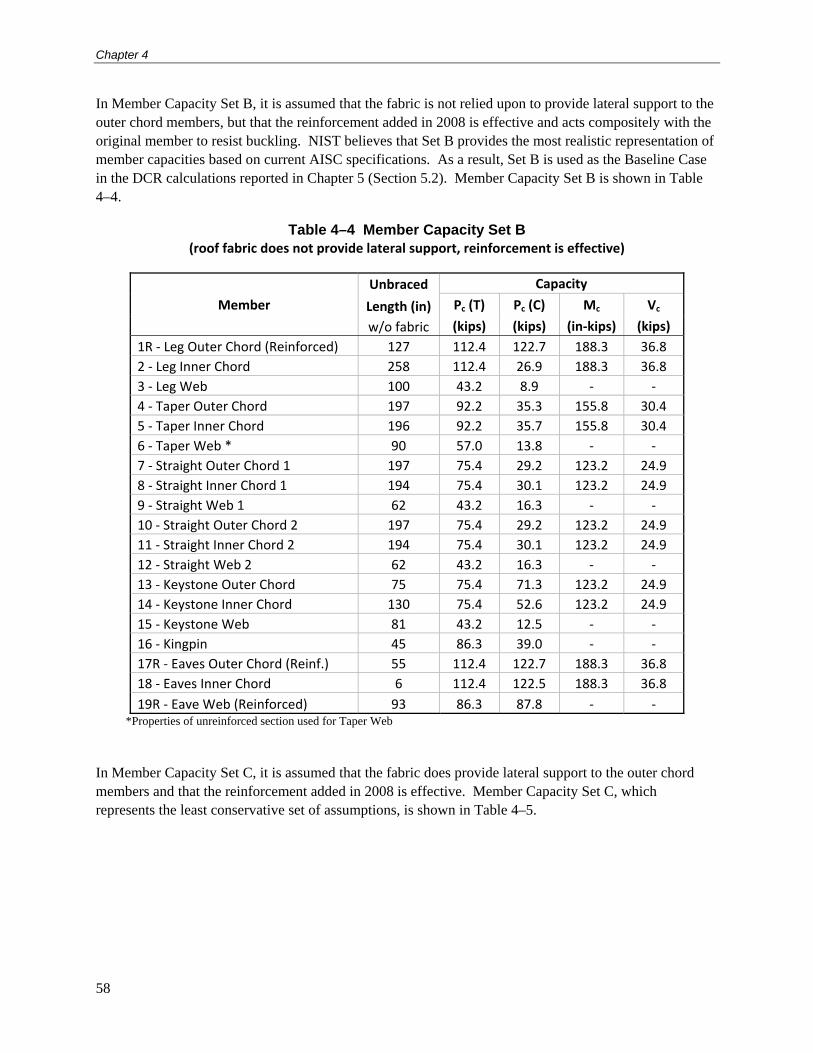
Chapter 4
58
In Member Capacity Set B, it is assumed that the fabric is not relied upon to provide lateral support to the outer chord members, but that the reinforcement added in 2008 is effective and acts compositely with the original member to resist buckling. NIST believes that Set B provides the most realistic representation of member capacities based on current AISC specifications. As a result, Set B is used as the Baseline Case in the DCR calculations reported in Chapter 5 (Section 5.2). Member Capacity Set B is shown in Table 4–4.
Table 4–4 Member Capacity Set B (roof fabric does not provide lateral support, reinforcement is effective)
Member
Unbraced Capacity
Length (in) Pc (T) Pc (C) Mc Vc
w/o fabric (kips) (kips) (in‐kips) (kips)
1R ‐ Leg Outer Chord (Reinforced) 127 112.4 122.7 188.3 36.8
2 ‐ Leg Inner Chord 258 112.4 26.9 188.3 36.8
3 ‐ Leg Web 100 43.2 8.9 ‐ ‐
4 ‐ Taper Outer Chord 197 92.2 35.3 155.8 30.4
5 ‐ Taper Inner Chord 196 92.2 35.7 155.8 30.4
6 ‐ Taper Web * 90 57.0 13.8 ‐ ‐
7 ‐ Straight Outer Chord 1 197 75.4 29.2 123.2 24.9
8 ‐ Straight Inner Chord 1 194 75.4 30.1 123.2 24.9
9 ‐ Straight Web 1 62 43.2 16.3 ‐ ‐
10 ‐ Straight Outer Chord 2 197 75.4 29.2 123.2 24.9
11 ‐ Straight Inner Chord 2 194 75.4 30.1 123.2 24.9
12 ‐ Straight Web 2 62 43.2 16.3 ‐ ‐
13 ‐ Keystone Outer Chord 75 75.4 71.3 123.2 24.9
14 ‐ Keystone Inner Chord 130 75.4 52.6 123.2 24.9
15 ‐ Keystone Web 81 43.2 12.5 ‐ ‐
16 ‐ Kingpin 45 86.3 39.0 ‐ ‐
17R ‐ Eaves Outer Chord (Reinf.) 55 112.4 122.7 188.3 36.8
18 ‐ Eaves Inner Chord 6 112.4 122.5 188.3 36.8
19R ‐ Eave Web (Reinforced) 93 86.3 87.8 ‐ ‐ *Properties of unreinforced section used for Taper Web
In Member Capacity Set C, it is assumed that the fabric does provide lateral support to the outer chord members and that the reinforcement added in 2008 is effective. Member Capacity Set C, which represents the least conservative set of assumptions, is shown in Table 4–5.
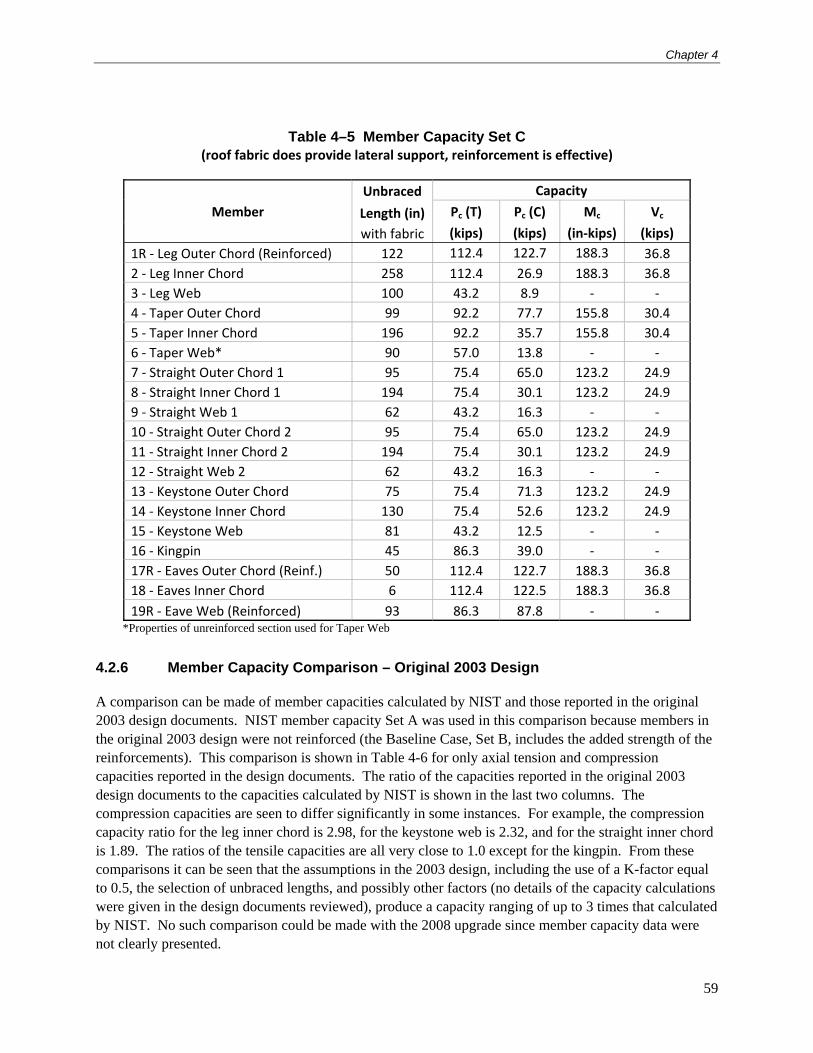
Chapter 4
59
Table 4–5 Member Capacity Set C (roof fabric does provide lateral support, reinforcement is effective)
Member
Unbraced Capacity
Length (in) Pc (T) Pc (C) Mc Vc
with fabric (kips) (kips) (in‐kips) (kips)
1R ‐ Leg Outer Chord (Reinforced) 122 112.4 122.7 188.3 36.8
2 ‐ Leg Inner Chord 258 112.4 26.9 188.3 36.8
3 ‐ Leg Web 100 43.2 8.9 ‐ ‐
4 ‐ Taper Outer Chord 99 92.2 77.7 155.8 30.4
5 ‐ Taper Inner Chord 196 92.2 35.7 155.8 30.4
6 ‐ Taper Web* 90 57.0 13.8 ‐ ‐
7 ‐ Straight Outer Chord 1 95 75.4 65.0 123.2 24.9
8 ‐ Straight Inner Chord 1 194 75.4 30.1 123.2 24.9
9 ‐ Straight Web 1 62 43.2 16.3 ‐ ‐
10 ‐ Straight Outer Chord 2 95 75.4 65.0 123.2 24.9
11 ‐ Straight Inner Chord 2 194 75.4 30.1 123.2 24.9
12 ‐ Straight Web 2 62 43.2 16.3 ‐ ‐
13 ‐ Keystone Outer Chord 75 75.4 71.3 123.2 24.9
14 ‐ Keystone Inner Chord 130 75.4 52.6 123.2 24.9
15 ‐ Keystone Web 81 43.2 12.5 ‐ ‐
16 ‐ Kingpin 45 86.3 39.0 ‐ ‐
17R ‐ Eaves Outer Chord (Reinf.) 50 112.4 122.7 188.3 36.8
18 ‐ Eaves Inner Chord 6 112.4 122.5 188.3 36.8
19R ‐ Eave Web (Reinforced) 93 86.3 87.8 ‐ ‐ *Properties of unreinforced section used for Taper Web
4.2.6 Member Capacity Comparison – Original 2003 Design
A comparison can be made of member capacities calculated by NIST and those reported in the original 2003 design documents. NIST member capacity Set A was used in this comparison because members in the original 2003 design were not reinforced (the Baseline Case, Set B, includes the added strength of the reinforcements). This comparison is shown in Table 4-6 for only axial tension and compression capacities reported in the design documents. The ratio of the capacities reported in the original 2003 design documents to the capacities calculated by NIST is shown in the last two columns. The compression capacities are seen to differ significantly in some instances. For example, the compression capacity ratio for the leg inner chord is 2.98, for the keystone web is 2.32, and for the straight inner chord is 1.89. The ratios of the tensile capacities are all very close to 1.0 except for the kingpin. From these comparisons it can be seen that the assumptions in the 2003 design, including the use of a K-factor equal to 0.5, the selection of unbraced lengths, and possibly other factors (no details of the capacity calculations were given in the design documents reviewed), produce a capacity ranging of up to 3 times that calculated by NIST. No such comparison could be made with the 2008 upgrade since member capacity data were not clearly presented.
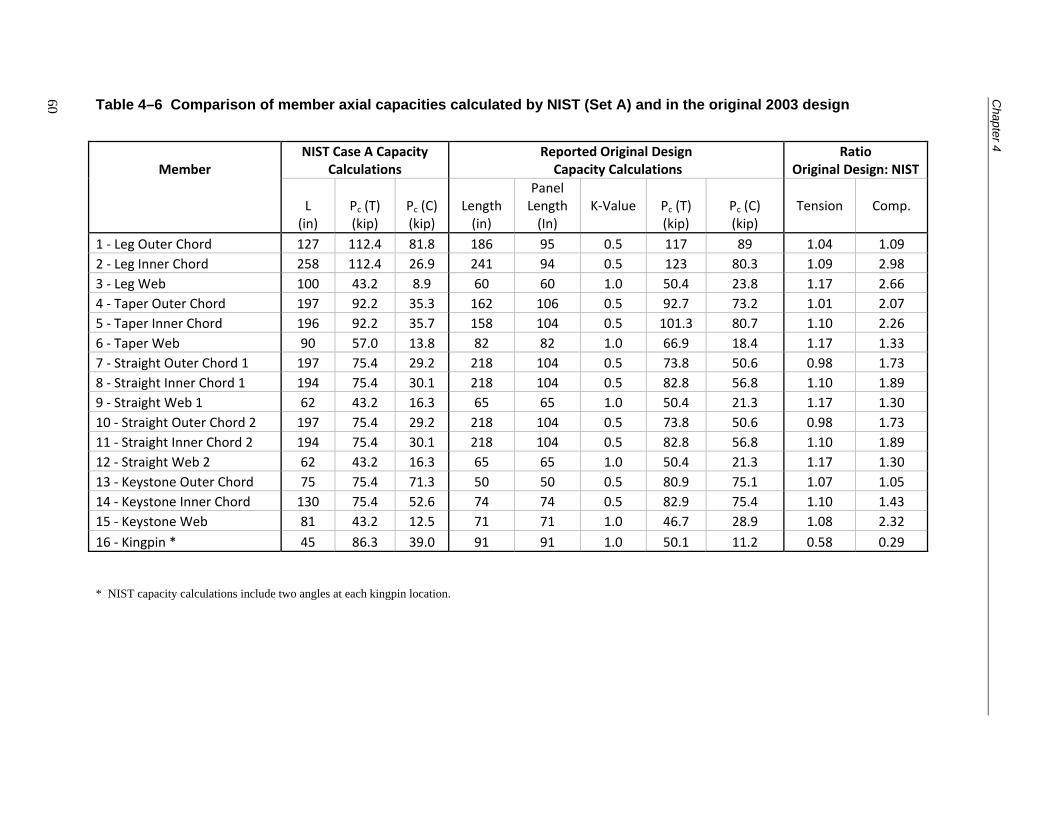
Cha
pter 4
60 Table 4–6 Comparison of member axial capacities calculated by NIST (Set A) and in the original 2003 design
* NIST capacity calculations include two angles at each kingpin location.
Member NIST Case A Capacity
Calculations Reported Original Design Capacity Calculations
Ratio Original Design: NIST
L (in)
Pc (T) (kip)
Pc (C) (kip)
Length (in)
Panel Length (In)
K‐Value
Pc (T) (kip)
Pc (C) (kip)
Tension
Comp.
1 ‐ Leg Outer Chord 127 112.4 81.8 186 95 0.5 117 89 1.04 1.09
2 ‐ Leg Inner Chord 258 112.4 26.9 241 94 0.5 123 80.3 1.09 2.98
3 ‐ Leg Web 100 43.2 8.9 60 60 1.0 50.4 23.8 1.17 2.66
4 ‐ Taper Outer Chord 197 92.2 35.3 162 106 0.5 92.7 73.2 1.01 2.07
5 ‐ Taper Inner Chord 196 92.2 35.7 158 104 0.5 101.3 80.7 1.10 2.26
6 ‐ Taper Web 90 57.0 13.8 82 82 1.0 66.9 18.4 1.17 1.33
7 ‐ Straight Outer Chord 1 197 75.4 29.2 218 104 0.5 73.8 50.6 0.98 1.73
8 ‐ Straight Inner Chord 1 194 75.4 30.1 218 104 0.5 82.8 56.8 1.10 1.89
9 ‐ Straight Web 1 62 43.2 16.3 65 65 1.0 50.4 21.3 1.17 1.30
10 ‐ Straight Outer Chord 2 197 75.4 29.2 218 104 0.5 73.8 50.6 0.98 1.73
11 ‐ Straight Inner Chord 2 194 75.4 30.1 218 104 0.5 82.8 56.8 1.10 1.89
12 ‐ Straight Web 2 62 43.2 16.3 65 65 1.0 50.4 21.3 1.17 1.30
13 ‐ Keystone Outer Chord 75 75.4 71.3 50 50 0.5 80.9 75.1 1.07 1.05
14 ‐ Keystone Inner Chord 130 75.4 52.6 74 74 0.5 82.9 75.4 1.10 1.43
15 ‐ Keystone Web 81 43.2 12.5 71 71 1.0 46.7 28.9 1.08 2.32
16 ‐ Kingpin * 45 86.3 39.0 91 91 1.0 50.1 11.2 0.58 0.29
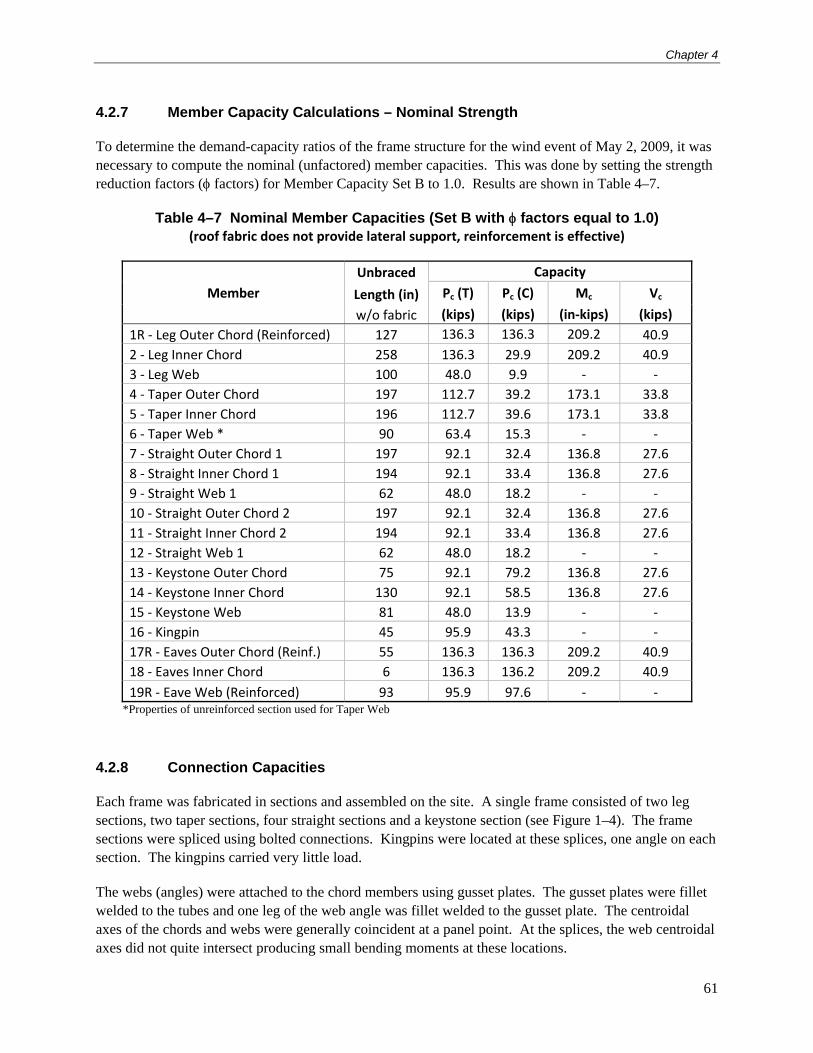
Chapter 4
61
4.2.7 Member Capacity Calculations – Nominal Strength
To determine the demand-capacity ratios of the frame structure for the wind event of May 2, 2009, it was necessary to compute the nominal (unfactored) member capacities. This was done by setting the strength reduction factors ( factors) for Member Capacity Set B to 1.0. Results are shown in Table 4–7.
Table 4–7 Nominal Member Capacities (Set B with factors equal to 1.0) (roof fabric does not provide lateral support, reinforcement is effective)
Member
Unbraced Capacity
Length (in) Pc (T) Pc (C) Mc Vc
w/o fabric (kips) (kips) (in‐kips) (kips)
1R ‐ Leg Outer Chord (Reinforced) 127 136.3 136.3 209.2 40.9
2 ‐ Leg Inner Chord 258 136.3 29.9 209.2 40.9
3 ‐ Leg Web 100 48.0 9.9 ‐ ‐
4 ‐ Taper Outer Chord 197 112.7 39.2 173.1 33.8
5 ‐ Taper Inner Chord 196 112.7 39.6 173.1 33.8
6 ‐ Taper Web * 90 63.4 15.3 ‐ ‐
7 ‐ Straight Outer Chord 1 197 92.1 32.4 136.8 27.6
8 ‐ Straight Inner Chord 1 194 92.1 33.4 136.8 27.6
9 ‐ Straight Web 1 62 48.0 18.2 ‐ ‐
10 ‐ Straight Outer Chord 2 197 92.1 32.4 136.8 27.6
11 ‐ Straight Inner Chord 2 194 92.1 33.4 136.8 27.6
12 ‐ Straight Web 1 62 48.0 18.2 ‐ ‐
13 ‐ Keystone Outer Chord 75 92.1 79.2 136.8 27.6
14 ‐ Keystone Inner Chord 130 92.1 58.5 136.8 27.6
15 ‐ Keystone Web 81 48.0 13.9 ‐ ‐
16 ‐ Kingpin 45 95.9 43.3 ‐ ‐
17R ‐ Eaves Outer Chord (Reinf.) 55 136.3 136.3 209.2 40.9
18 ‐ Eaves Inner Chord 6 136.3 136.2 209.2 40.9
19R ‐ Eave Web (Reinforced) 93 95.9 97.6 ‐ ‐ *Properties of unreinforced section used for Taper Web
4.2.8 Connection Capacities
Each frame was fabricated in sections and assembled on the site. A single frame consisted of two leg sections, two taper sections, four straight sections and a keystone section (see Figure 1–4). The frame sections were spliced using bolted connections. Kingpins were located at these splices, one angle on each section. The kingpins carried very little load.
The webs (angles) were attached to the chord members using gusset plates. The gusset plates were fillet welded to the tubes and one leg of the web angle was fillet welded to the gusset plate. The centroidal axes of the chords and webs were generally coincident at a panel point. At the splices, the web centroidal axes did not quite intersect producing small bending moments at these locations.
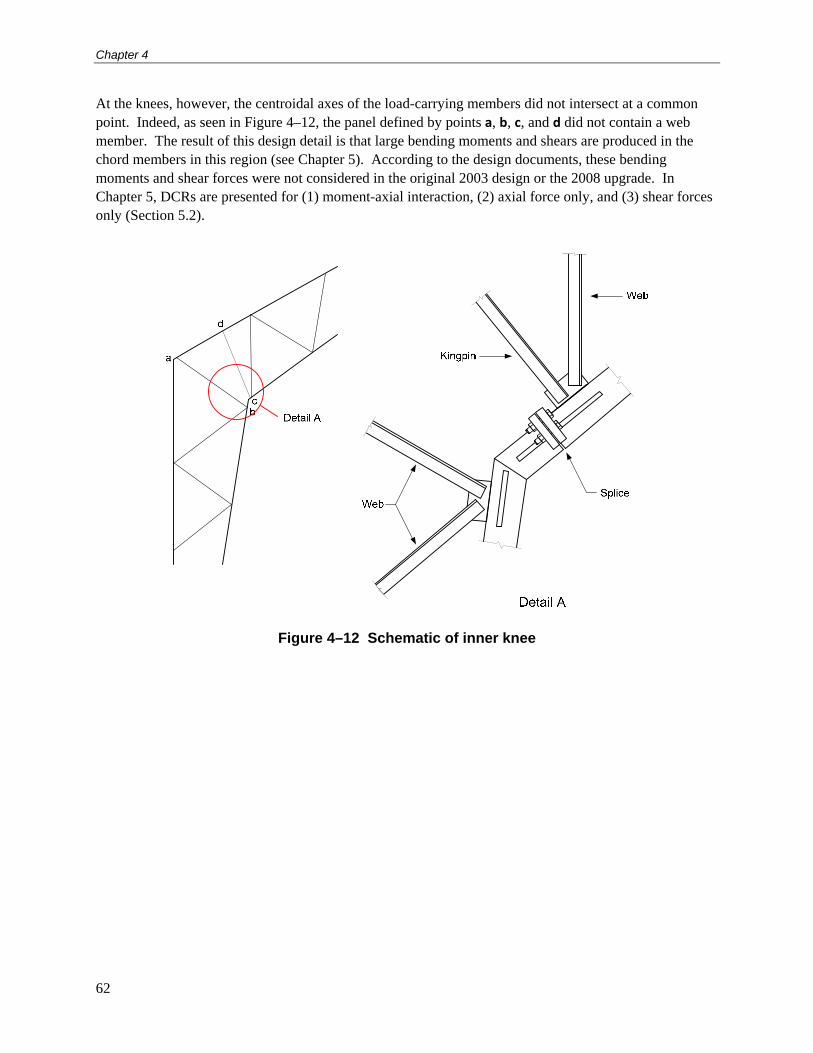
Chapter 4
62
At the knees, however, the centroidal axes of the load-carrying members did not intersect at a common point. Indeed, as seen in Figure 4–12, the panel defined by points a, b, c, and d did not contain a web member. The result of this design detail is that large bending moments and shears are produced in the chord members in this region (see Chapter 5). According to the design documents, these bending moments and shear forces were not considered in the original 2003 design or the 2008 upgrade. In Chapter 5, DCRs are presented for (1) moment-axial interaction, (2) axial force only, and (3) shear forces only (Section 5.2).
Figure 4–12 Schematic of inner knee
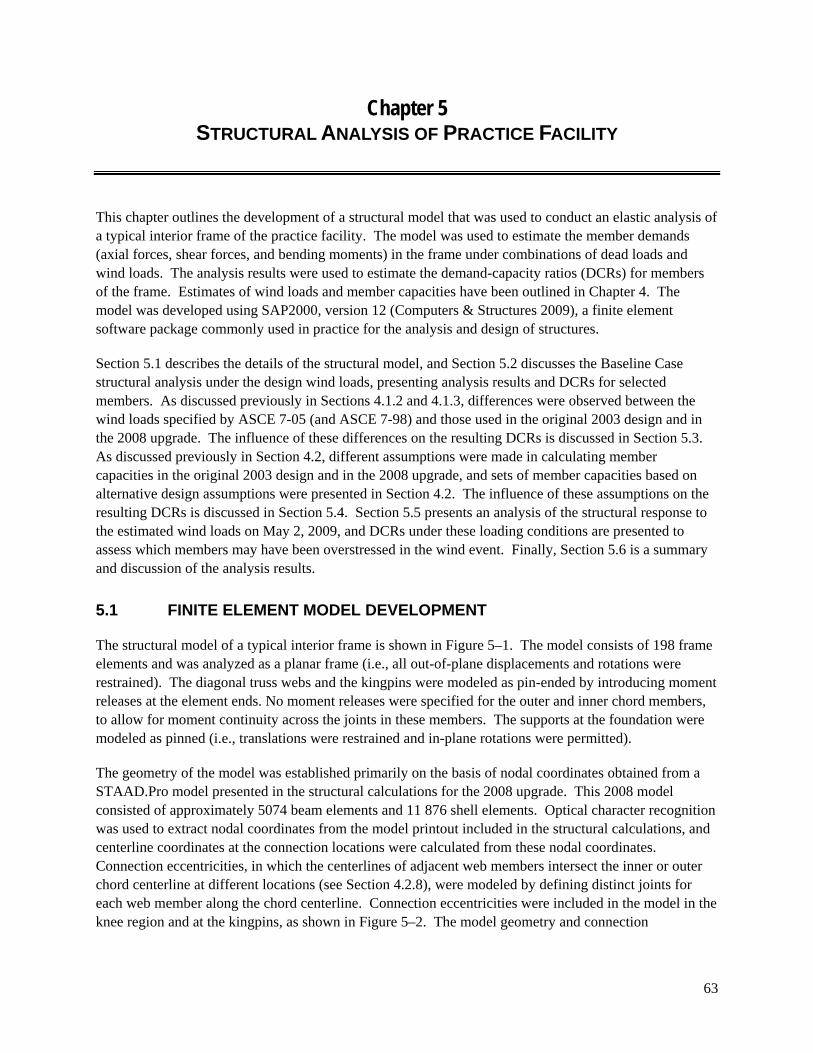
63
Chapter 5 STRUCTURAL ANALYSIS OF PRACTICE FACILITY
This chapter outlines the development of a structural model that was used to conduct an elastic analysis of a typical interior frame of the practice facility. The model was used to estimate the member demands (axial forces, shear forces, and bending moments) in the frame under combinations of dead loads and wind loads. The analysis results were used to estimate the demand-capacity ratios (DCRs) for members of the frame. Estimates of wind loads and member capacities have been outlined in Chapter 4. The model was developed using SAP2000, version 12 (Computers & Structures 2009), a finite element software package commonly used in practice for the analysis and design of structures.
Section 5.1 describes the details of the structural model, and Section 5.2 discusses the Baseline Case structural analysis under the design wind loads, presenting analysis results and DCRs for selected members. As discussed previously in Sections 4.1.2 and 4.1.3, differences were observed between the wind loads specified by ASCE 7-05 (and ASCE 7-98) and those used in the original 2003 design and in the 2008 upgrade. The influence of these differences on the resulting DCRs is discussed in Section 5.3. As discussed previously in Section 4.2, different assumptions were made in calculating member capacities in the original 2003 design and in the 2008 upgrade, and sets of member capacities based on alternative design assumptions were presented in Section 4.2. The influence of these assumptions on the resulting DCRs is discussed in Section 5.4. Section 5.5 presents an analysis of the structural response to the estimated wind loads on May 2, 2009, and DCRs under these loading conditions are presented to assess which members may have been overstressed in the wind event. Finally, Section 5.6 is a summary and discussion of the analysis results.
5.1 FINITE ELEMENT MODEL DEVELOPMENT
The structural model of a typical interior frame is shown in Figure 5–1. The model consists of 198 frame elements and was analyzed as a planar frame (i.e., all out-of-plane displacements and rotations were restrained). The diagonal truss webs and the kingpins were modeled as pin-ended by introducing moment releases at the element ends. No moment releases were specified for the outer and inner chord members, to allow for moment continuity across the joints in these members. The supports at the foundation were modeled as pinned (i.e., translations were restrained and in-plane rotations were permitted).
The geometry of the model was established primarily on the basis of nodal coordinates obtained from a STAAD.Pro model presented in the structural calculations for the 2008 upgrade. This 2008 model consisted of approximately 5074 beam elements and 11 876 shell elements. Optical character recognition was used to extract nodal coordinates from the model printout included in the structural calculations, and centerline coordinates at the connection locations were calculated from these nodal coordinates. Connection eccentricities, in which the centerlines of adjacent web members intersect the inner or outer chord centerline at different locations (see Section 4.2.8), were modeled by defining distinct joints for each web member along the chord centerline. Connection eccentricities were included in the model in the knee region and at the kingpins, as shown in Figure 5–2. The model geometry and connection
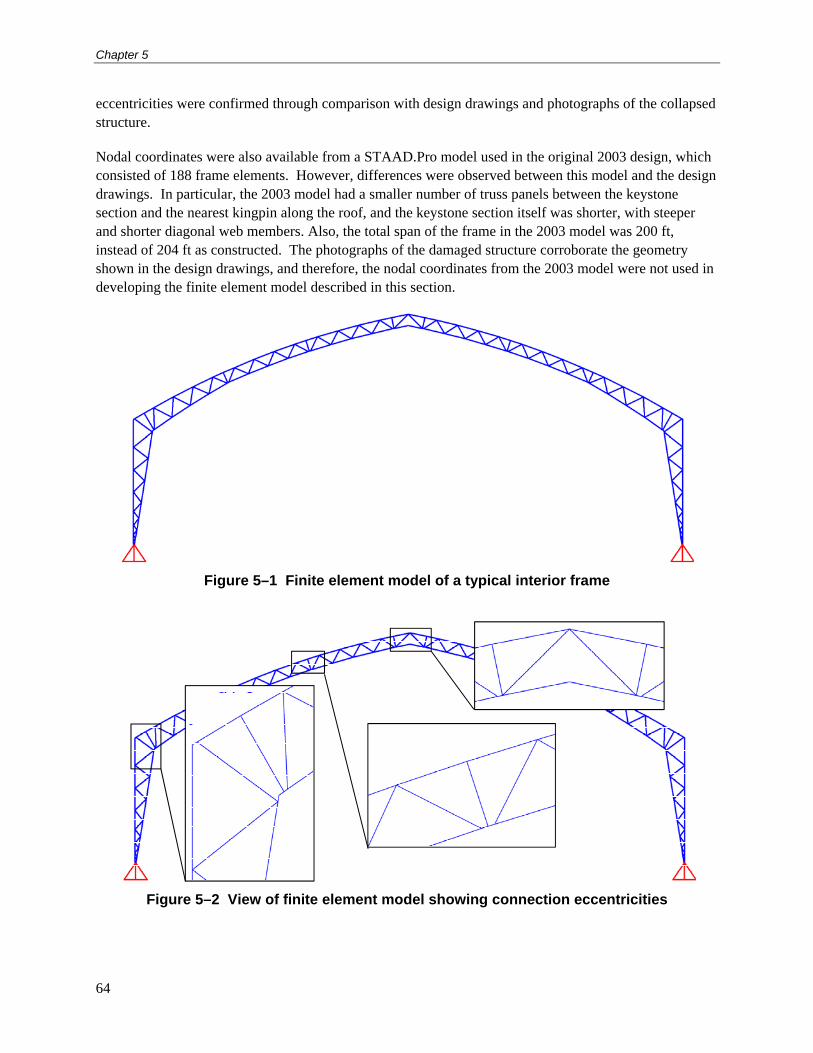
Chapter 5
64
eccentricities were confirmed through comparison with design drawings and photographs of the collapsed structure.
Nodal coordinates were also available from a STAAD.Pro model used in the original 2003 design, which consisted of 188 frame elements. However, differences were observed between this model and the design drawings. In particular, the 2003 model had a smaller number of truss panels between the keystone section and the nearest kingpin along the roof, and the keystone section itself was shorter, with steeper and shorter diagonal web members. Also, the total span of the frame in the 2003 model was 200 ft, instead of 204 ft as constructed. The photographs of the damaged structure corroborate the geometry shown in the design drawings, and therefore, the nodal coordinates from the 2003 model were not used in developing the finite element model described in this section.
Figure 5–1 Finite element model of a typical interior frame
Figure 5–2 View of finite element model showing connection eccentricities
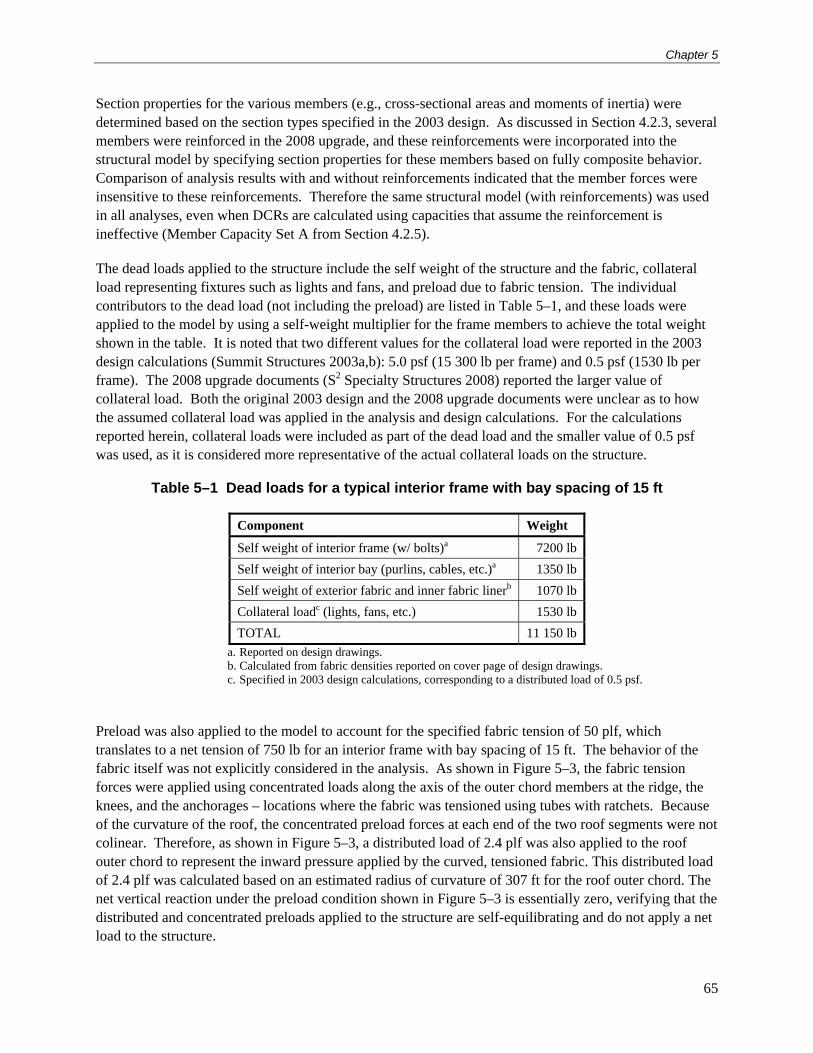
Chapter 5
65
Section properties for the various members (e.g., cross-sectional areas and moments of inertia) were determined based on the section types specified in the 2003 design. As discussed in Section 4.2.3, several members were reinforced in the 2008 upgrade, and these reinforcements were incorporated into the structural model by specifying section properties for these members based on fully composite behavior. Comparison of analysis results with and without reinforcements indicated that the member forces were insensitive to these reinforcements. Therefore the same structural model (with reinforcements) was used in all analyses, even when DCRs are calculated using capacities that assume the reinforcement is ineffective (Member Capacity Set A from Section 4.2.5).
The dead loads applied to the structure include the self weight of the structure and the fabric, collateral load representing fixtures such as lights and fans, and preload due to fabric tension. The individual contributors to the dead load (not including the preload) are listed in Table 5–1, and these loads were applied to the model by using a self-weight multiplier for the frame members to achieve the total weight shown in the table. It is noted that two different values for the collateral load were reported in the 2003 design calculations (Summit Structures 2003a,b): 5.0 psf (15 300 lb per frame) and 0.5 psf (1530 lb per frame). The 2008 upgrade documents (S2 Specialty Structures 2008) reported the larger value of collateral load. Both the original 2003 design and the 2008 upgrade documents were unclear as to how the assumed collateral load was applied in the analysis and design calculations. For the calculations reported herein, collateral loads were included as part of the dead load and the smaller value of 0.5 psf was used, as it is considered more representative of the actual collateral loads on the structure.
Table 5–1 Dead loads for a typical interior frame with bay spacing of 15 ft
Component Weight
Self weight of interior frame (w/ bolts)a 7200 lb
Self weight of interior bay (purlins, cables, etc.)a 1350 lb
Self weight of exterior fabric and inner fabric linerb 1070 lb
Collateral loadc (lights, fans, etc.) 1530 lb
TOTAL 11 150 lb
a. Reported on design drawings. b. Calculated from fabric densities reported on cover page of design drawings. c. Specified in 2003 design calculations, corresponding to a distributed load of 0.5 psf.
Preload was also applied to the model to account for the specified fabric tension of 50 plf, which translates to a net tension of 750 lb for an interior frame with bay spacing of 15 ft. The behavior of the fabric itself was not explicitly considered in the analysis. As shown in Figure 5–3, the fabric tension forces were applied using concentrated loads along the axis of the outer chord members at the ridge, the knees, and the anchorages – locations where the fabric was tensioned using tubes with ratchets. Because of the curvature of the roof, the concentrated preload forces at each end of the two roof segments were not colinear. Therefore, as shown in Figure 5–3, a distributed load of 2.4 plf was also applied to the roof outer chord to represent the inward pressure applied by the curved, tensioned fabric. This distributed load of 2.4 plf was calculated based on an estimated radius of curvature of 307 ft for the roof outer chord. The net vertical reaction under the preload condition shown in Figure 5–3 is essentially zero, verifying that the distributed and concentrated preloads applied to the structure are self-equilibrating and do not apply a net load to the structure.
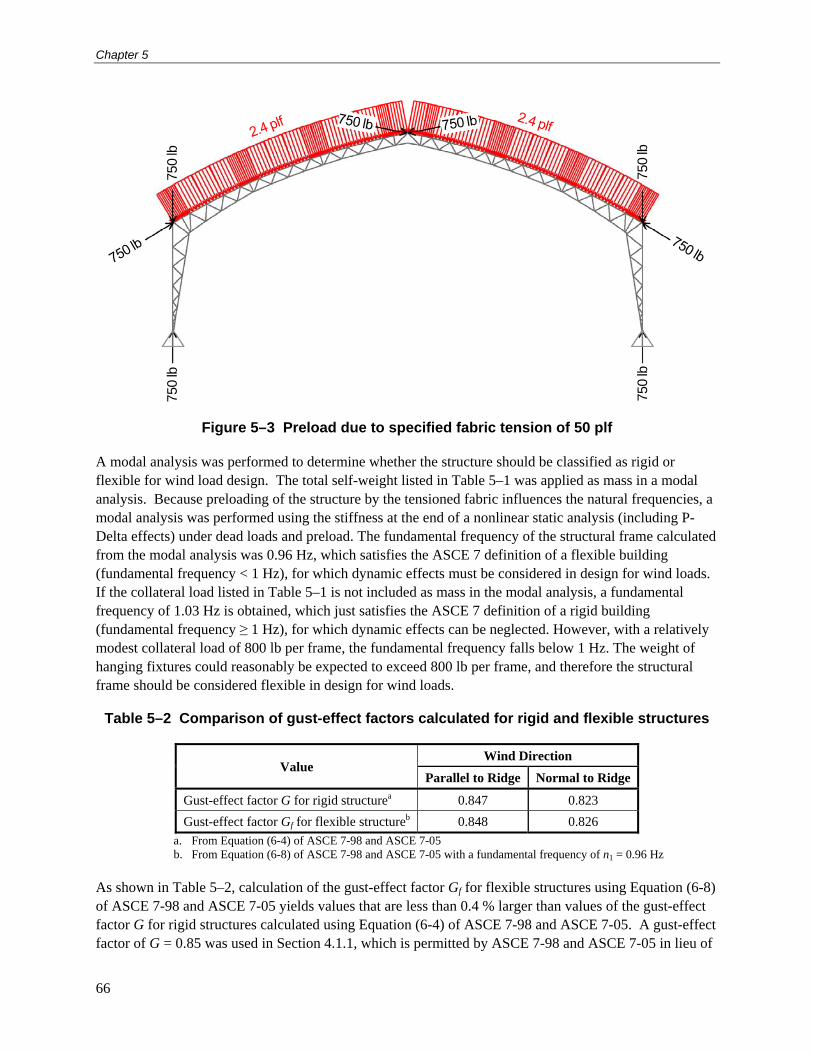
Chapter 5
66
750
lb75
0 lb
750
lb75
0 lb
Figure 5–3 Preload due to specified fabric tension of 50 plf
A modal analysis was performed to determine whether the structure should be classified as rigid or flexible for wind load design. The total self-weight listed in Table 5–1 was applied as mass in a modal analysis. Because preloading of the structure by the tensioned fabric influences the natural frequencies, a modal analysis was performed using the stiffness at the end of a nonlinear static analysis (including P-Delta effects) under dead loads and preload. The fundamental frequency of the structural frame calculated from the modal analysis was 0.96 Hz, which satisfies the ASCE 7 definition of a flexible building (fundamental frequency < 1 Hz), for which dynamic effects must be considered in design for wind loads. If the collateral load listed in Table 5–1 is not included as mass in the modal analysis, a fundamental frequency of 1.03 Hz is obtained, which just satisfies the ASCE 7 definition of a rigid building (fundamental frequency ≥ 1 Hz), for which dynamic effects can be neglected. However, with a relatively modest collateral load of 800 lb per frame, the fundamental frequency falls below 1 Hz. The weight of hanging fixtures could reasonably be expected to exceed 800 lb per frame, and therefore the structural frame should be considered flexible in design for wind loads.
Table 5–2 Comparison of gust-effect factors calculated for rigid and flexible structures
Value Wind Direction
Parallel to Ridge Normal to Ridge
Gust-effect factor G for rigid structurea 0.847 0.823
Gust-effect factor Gf for flexible structureb 0.848 0.826
a. From Equation (6-4) of ASCE 7-98 and ASCE 7-05 b. From Equation (6-8) of ASCE 7-98 and ASCE 7-05 with a fundamental frequency of n1 = 0.96 Hz
As shown in Table 5–2, calculation of the gust-effect factor Gf for flexible structures using Equation (6-8) of ASCE 7-98 and ASCE 7-05 yields values that are less than 0.4 % larger than values of the gust-effect factor G for rigid structures calculated using Equation (6-4) of ASCE 7-98 and ASCE 7-05. A gust-effect factor of G = 0.85 was used in Section 4.1.1, which is permitted by ASCE 7-98 and ASCE 7-05 in lieu of
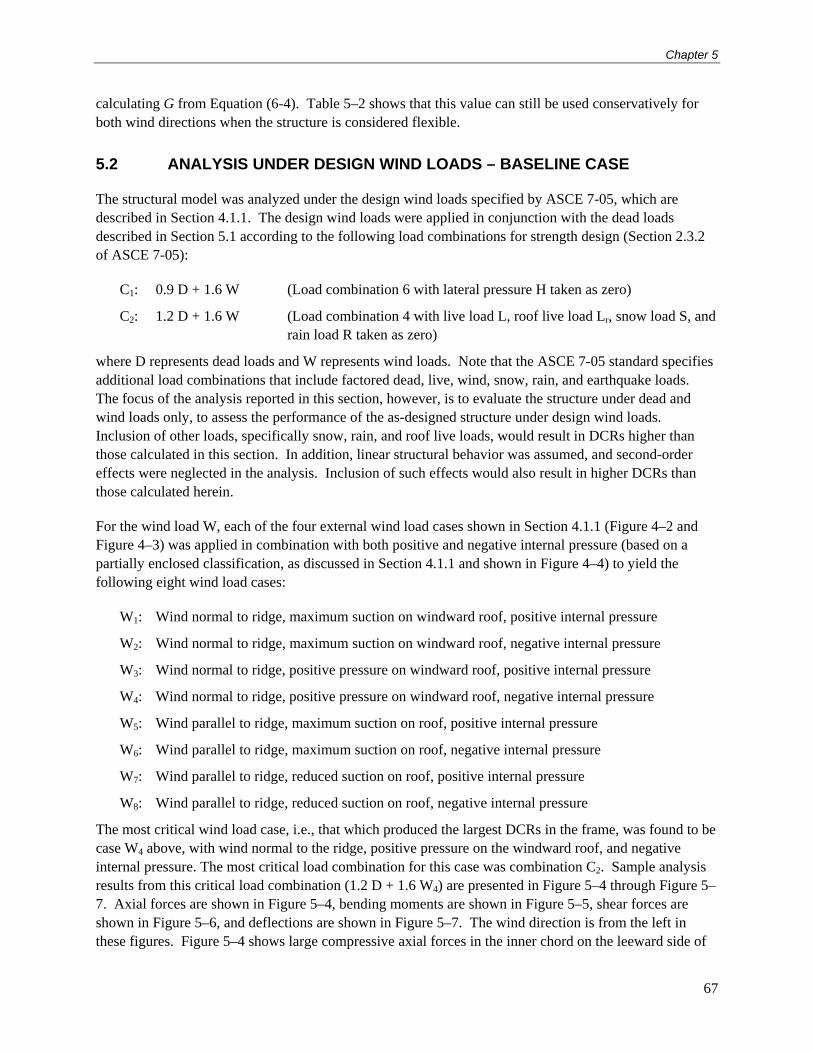
Chapter 5
67
calculating G from Equation (6-4). Table 5–2 shows that this value can still be used conservatively for both wind directions when the structure is considered flexible.
5.2 ANALYSIS UNDER DESIGN WIND LOADS – BASELINE CASE
The structural model was analyzed under the design wind loads specified by ASCE 7-05, which are described in Section 4.1.1. The design wind loads were applied in conjunction with the dead loads described in Section 5.1 according to the following load combinations for strength design (Section 2.3.2 of ASCE 7-05):
C1: 0.9 D + 1.6 W (Load combination 6 with lateral pressure H taken as zero)
C2: 1.2 D + 1.6 W (Load combination 4 with live load L, roof live load Lr, snow load S, and rain load R taken as zero)
where D represents dead loads and W represents wind loads. Note that the ASCE 7-05 standard specifies additional load combinations that include factored dead, live, wind, snow, rain, and earthquake loads. The focus of the analysis reported in this section, however, is to evaluate the structure under dead and wind loads only, to assess the performance of the as-designed structure under design wind loads. Inclusion of other loads, specifically snow, rain, and roof live loads, would result in DCRs higher than those calculated in this section. In addition, linear structural behavior was assumed, and second-order effects were neglected in the analysis. Inclusion of such effects would also result in higher DCRs than those calculated herein.
For the wind load W, each of the four external wind load cases shown in Section 4.1.1 (Figure 4–2 and Figure 4–3) was applied in combination with both positive and negative internal pressure (based on a partially enclosed classification, as discussed in Section 4.1.1 and shown in Figure 4–4) to yield the following eight wind load cases:
W1: Wind normal to ridge, maximum suction on windward roof, positive internal pressure
W2: Wind normal to ridge, maximum suction on windward roof, negative internal pressure
W3: Wind normal to ridge, positive pressure on windward roof, positive internal pressure
W4: Wind normal to ridge, positive pressure on windward roof, negative internal pressure
W5: Wind parallel to ridge, maximum suction on roof, positive internal pressure
W6: Wind parallel to ridge, maximum suction on roof, negative internal pressure
W7: Wind parallel to ridge, reduced suction on roof, positive internal pressure
W8: Wind parallel to ridge, reduced suction on roof, negative internal pressure
The most critical wind load case, i.e., that which produced the largest DCRs in the frame, was found to be case W4 above, with wind normal to the ridge, positive pressure on the windward roof, and negative internal pressure. The most critical load combination for this case was combination C2. Sample analysis results from this critical load combination (1.2 D + 1.6 W4) are presented in Figure 5–4 through Figure 5–7. Axial forces are shown in Figure 5–4, bending moments are shown in Figure 5–5, shear forces are shown in Figure 5–6, and deflections are shown in Figure 5–7. The wind direction is from the left in these figures. Figure 5–4 shows large compressive axial forces in the inner chord on the leeward side of
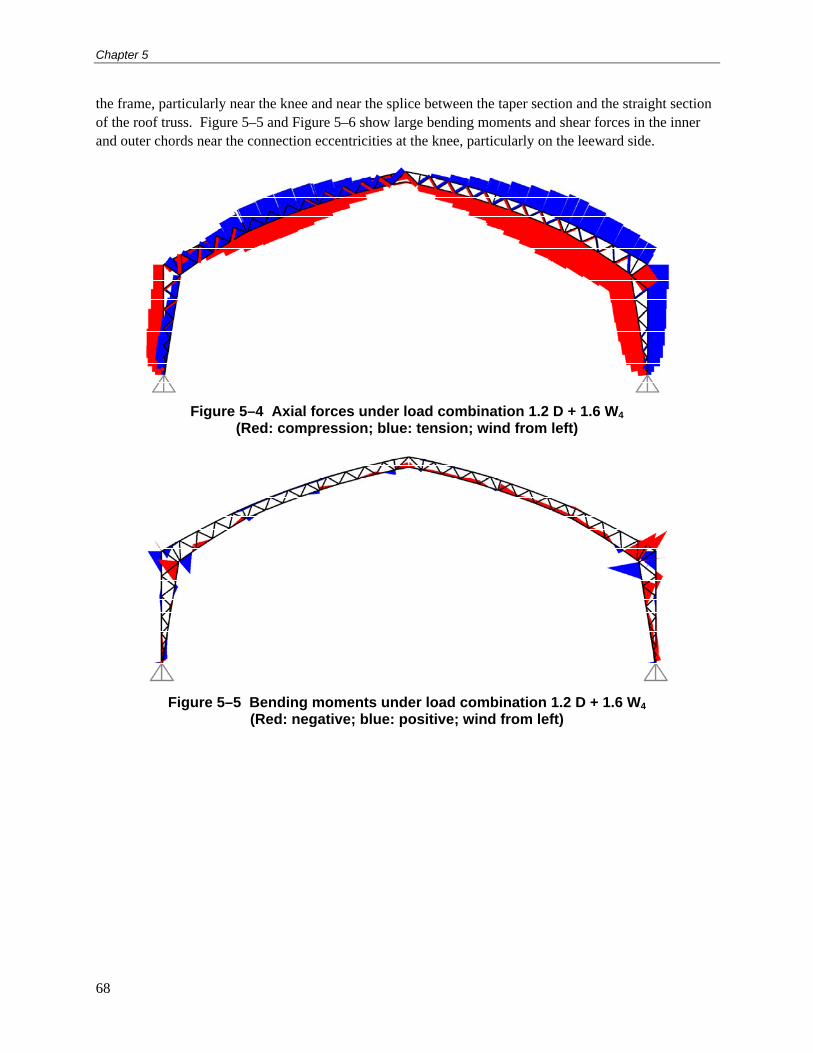
Chapter 5
68
the frame, particularly near the knee and near the splice between the taper section and the straight section of the roof truss. Figure 5–5 and Figure 5–6 show large bending moments and shear forces in the inner and outer chords near the connection eccentricities at the knee, particularly on the leeward side.
Figure 5–4 Axial forces under load combination 1.2 D + 1.6 W4 (Red: compression; blue: tension; wind from left)
Figure 5–5 Bending moments under load combination 1.2 D + 1.6 W4 (Red: negative; blue: positive; wind from left)
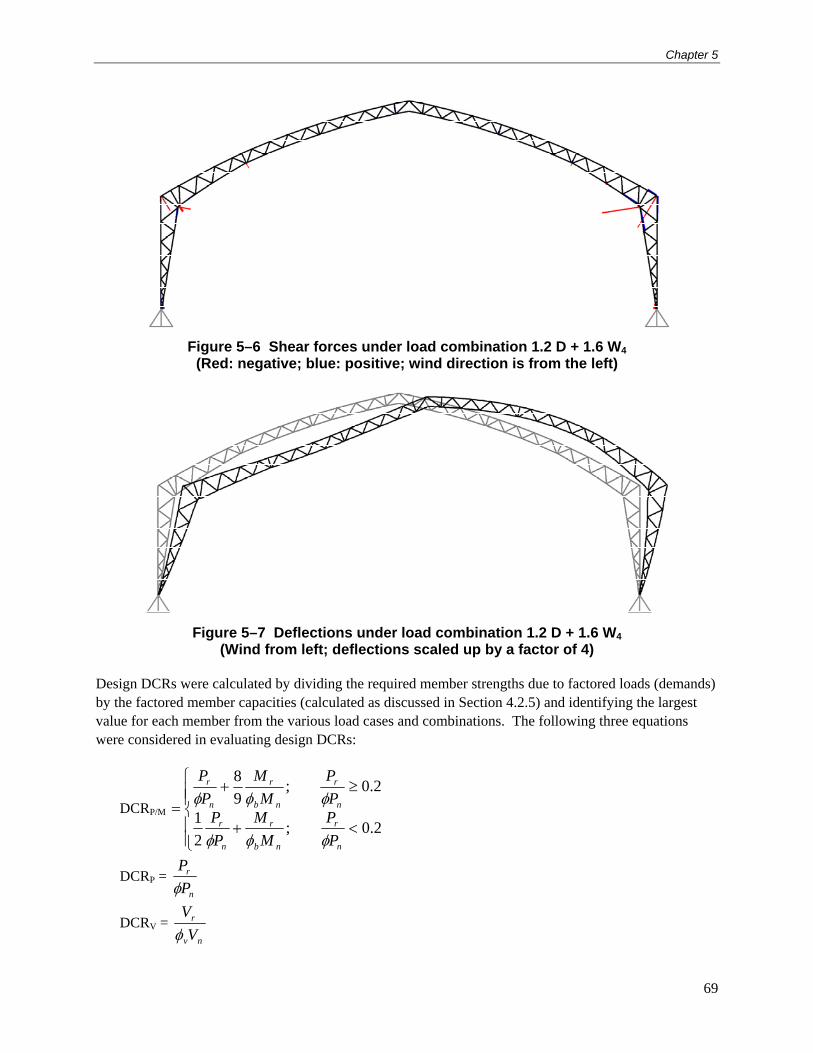
Chapter 5
69
Figure 5–6 Shear forces under load combination 1.2 D + 1.6 W4 (Red: negative; blue: positive; wind direction is from the left)
Figure 5–7 Deflections under load combination 1.2 D + 1.6 W4 (Wind from left; deflections scaled up by a factor of 4)
Design DCRs were calculated by dividing the required member strengths due to factored loads (demands) by the factored member capacities (calculated as discussed in Section 4.2.5) and identifying the largest value for each member from the various load cases and combinations. The following three equations were considered in evaluating design DCRs:
DCRP/M
2.0;2
1
2.0;9
8
n
r
nb
r
n
r
n
r
nb
r
n
r
P
P
M
M
P
PP
P
M
M
P
P
DCRP = n
r
P
P
DCRV = nv
r
V
V
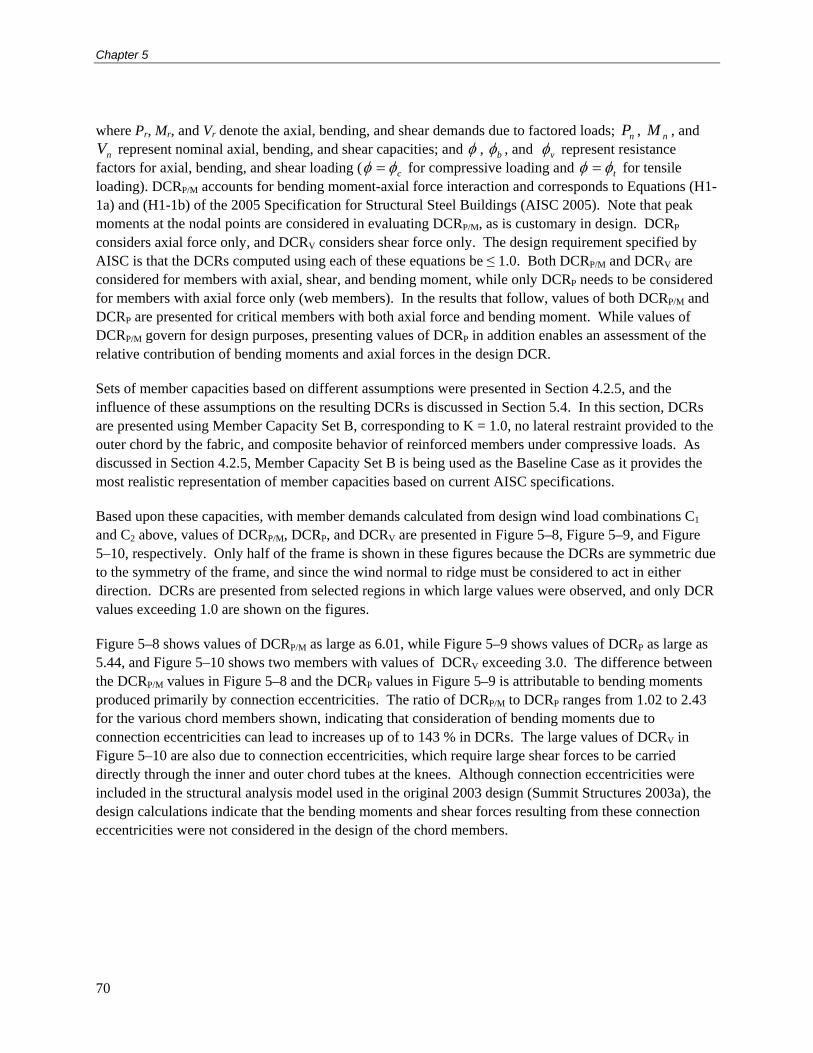
Chapter 5
70
where Pr, Mr, and Vr denote the axial, bending, and shear demands due to factored loads; nP , nM , and
nV represent nominal axial, bending, and shear capacities; and , b , and v represent resistance factors for axial, bending, and shear loading ( c for compressive loading and t for tensile loading). DCRP/M accounts for bending moment-axial force interaction and corresponds to Equations (H1-1a) and (H1-1b) of the 2005 Specification for Structural Steel Buildings (AISC 2005). Note that peak moments at the nodal points are considered in evaluating DCRP/M, as is customary in design. DCRP considers axial force only, and DCRV considers shear force only. The design requirement specified by AISC is that the DCRs computed using each of these equations be ≤ 1.0. Both DCRP/M and DCRV are considered for members with axial, shear, and bending moment, while only DCRP needs to be considered for members with axial force only (web members). In the results that follow, values of both DCRP/M and DCRP are presented for critical members with both axial force and bending moment. While values of DCRP/M govern for design purposes, presenting values of DCRP in addition enables an assessment of the relative contribution of bending moments and axial forces in the design DCR.
Sets of member capacities based on different assumptions were presented in Section 4.2.5, and the influence of these assumptions on the resulting DCRs is discussed in Section 5.4. In this section, DCRs are presented using Member Capacity Set B, corresponding to K = 1.0, no lateral restraint provided to the outer chord by the fabric, and composite behavior of reinforced members under compressive loads. As discussed in Section 4.2.5, Member Capacity Set B is being used as the Baseline Case as it provides the most realistic representation of member capacities based on current AISC specifications.
Based upon these capacities, with member demands calculated from design wind load combinations C1 and C2 above, values of DCRP/M, DCRP, and DCRV are presented in Figure 5–8, Figure 5–9, and Figure 5–10, respectively. Only half of the frame is shown in these figures because the DCRs are symmetric due to the symmetry of the frame, and since the wind normal to ridge must be considered to act in either direction. DCRs are presented from selected regions in which large values were observed, and only DCR values exceeding 1.0 are shown on the figures.
Figure 5–8 shows values of DCRP/M as large as 6.01, while Figure 5–9 shows values of DCRP as large as 5.44, and Figure 5–10 shows two members with values of DCRV exceeding 3.0. The difference between the DCRP/M values in Figure 5–8 and the DCRP values in Figure 5–9 is attributable to bending moments produced primarily by connection eccentricities. The ratio of DCRP/M to DCRP ranges from 1.02 to 2.43 for the various chord members shown, indicating that consideration of bending moments due to connection eccentricities can lead to increases up of to 143 % in DCRs. The large values of DCRV in Figure 5–10 are also due to connection eccentricities, which require large shear forces to be carried directly through the inner and outer chord tubes at the knees. Although connection eccentricities were included in the structural analysis model used in the original 2003 design (Summit Structures 2003a), the design calculations indicate that the bending moments and shear forces resulting from these connection eccentricities were not considered in the design of the chord members.
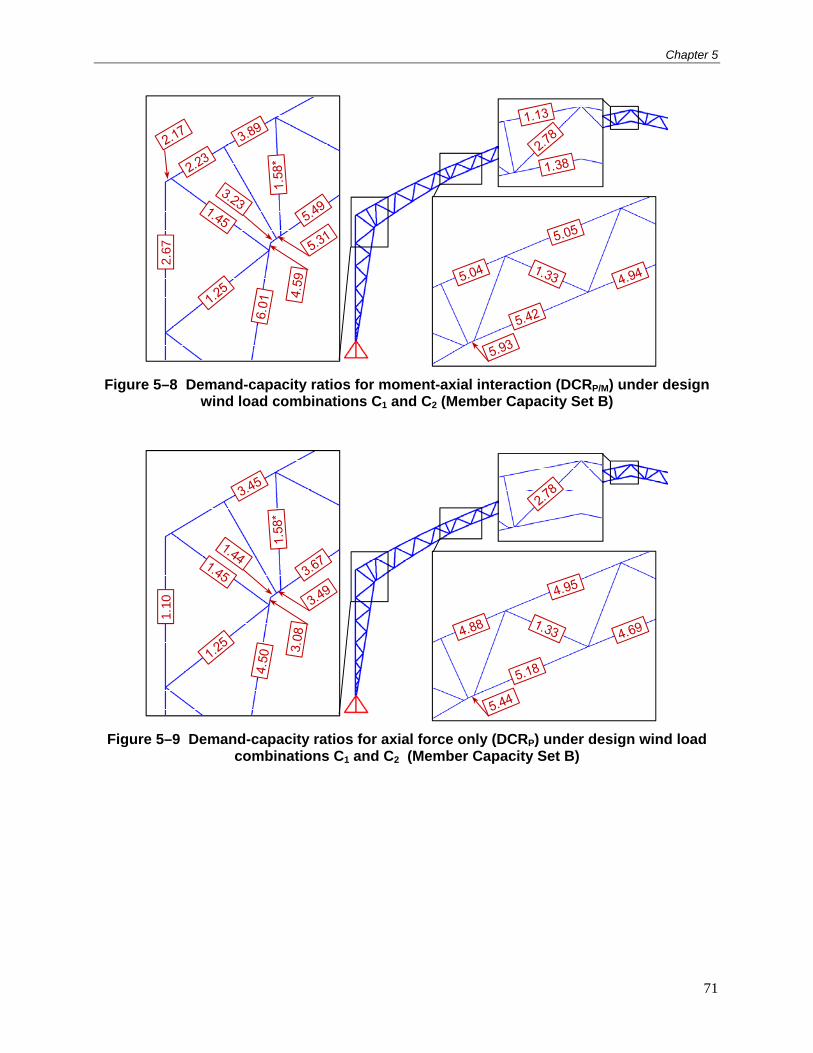
Chapter 5
71
2.67
Figure 5–8 Demand-capacity ratios for moment-axial interaction (DCRP/M) under design wind load combinations C1 and C2 (Member Capacity Set B)
1.10
Figure 5–9 Demand-capacity ratios for axial force only (DCRP) under design wind load combinations C1 and C2 (Member Capacity Set B)
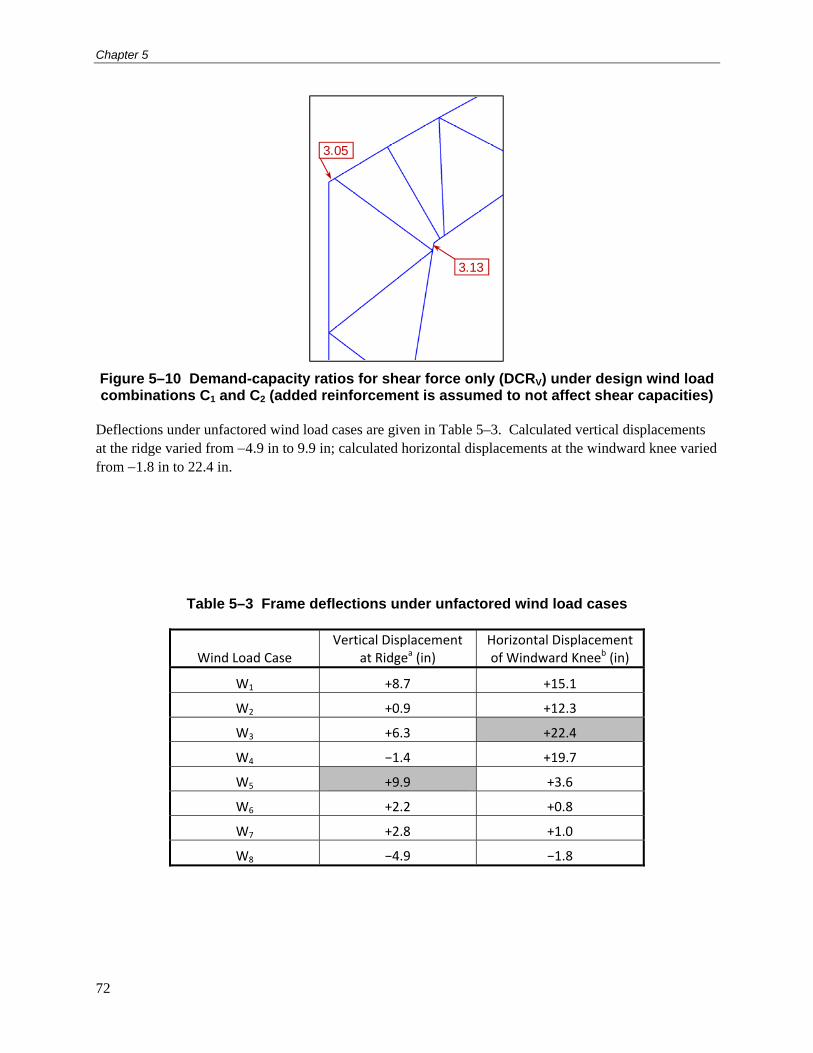
Chapter 5
72
3.13
3.05
Figure 5–10 Demand-capacity ratios for shear force only (DCRV) under design wind load combinations C1 and C2 (added reinforcement is assumed to not affect shear capacities)
Deflections under unfactored wind load cases are given in Table 5–3. Calculated vertical displacements at the ridge varied from 4.9 in to 9.9 in; calculated horizontal displacements at the windward knee varied from 1.8 in to 22.4 in.
Table 5–3 Frame deflections under unfactored wind load cases
Wind Load Case Vertical Displacement
at Ridgea (in) Horizontal Displacement of Windward Kneeb (in)
W1 +8.7 +15.1
W2 +0.9 +12.3
W3 +6.3 +22.4
W4 −1.4 +19.7
W5 +9.9 +3.6
W6 +2.2 +0.8
W7 +2.8 +1.0
W8 −4.9 −1.8
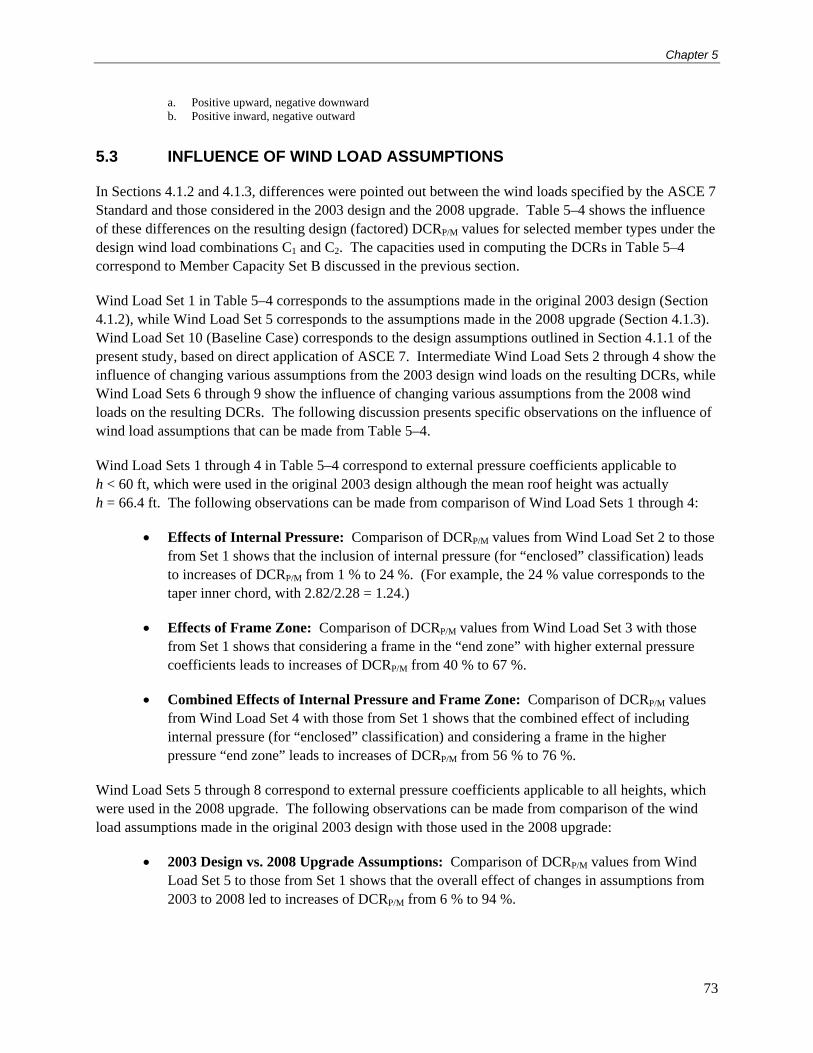
Chapter 5
73
a. Positive upward, negative downward b. Positive inward, negative outward
5.3 INFLUENCE OF WIND LOAD ASSUMPTIONS
In Sections 4.1.2 and 4.1.3, differences were pointed out between the wind loads specified by the ASCE 7 Standard and those considered in the 2003 design and the 2008 upgrade. Table 5–4 shows the influence of these differences on the resulting design (factored) DCRP/M values for selected member types under the design wind load combinations C1 and C2. The capacities used in computing the DCRs in Table 5–4 correspond to Member Capacity Set B discussed in the previous section.
Wind Load Set 1 in Table 5–4 corresponds to the assumptions made in the original 2003 design (Section 4.1.2), while Wind Load Set 5 corresponds to the assumptions made in the 2008 upgrade (Section 4.1.3). Wind Load Set 10 (Baseline Case) corresponds to the design assumptions outlined in Section 4.1.1 of the present study, based on direct application of ASCE 7. Intermediate Wind Load Sets 2 through 4 show the influence of changing various assumptions from the 2003 design wind loads on the resulting DCRs, while Wind Load Sets 6 through 9 show the influence of changing various assumptions from the 2008 wind loads on the resulting DCRs. The following discussion presents specific observations on the influence of wind load assumptions that can be made from Table 5–4.
Wind Load Sets 1 through 4 in Table 5–4 correspond to external pressure coefficients applicable to h < 60 ft, which were used in the original 2003 design although the mean roof height was actually h = 66.4 ft. The following observations can be made from comparison of Wind Load Sets 1 through 4:
Effects of Internal Pressure: Comparison of DCRP/M values from Wind Load Set 2 to those from Set 1 shows that the inclusion of internal pressure (for “enclosed” classification) leads to increases of DCRP/M from 1 % to 24 %. (For example, the 24 % value corresponds to the taper inner chord, with 2.82/2.28 = 1.24.)
Effects of Frame Zone: Comparison of DCRP/M values from Wind Load Set 3 with those from Set 1 shows that considering a frame in the “end zone” with higher external pressure coefficients leads to increases of DCRP/M from 40 % to 67 %.
Combined Effects of Internal Pressure and Frame Zone: Comparison of DCRP/M values from Wind Load Set 4 with those from Set 1 shows that the combined effect of including internal pressure (for “enclosed” classification) and considering a frame in the higher pressure “end zone” leads to increases of DCRP/M from 56 % to 76 %.
Wind Load Sets 5 through 8 correspond to external pressure coefficients applicable to all heights, which were used in the 2008 upgrade. The following observations can be made from comparison of the wind load assumptions made in the original 2003 design with those used in the 2008 upgrade:
2003 Design vs. 2008 Upgrade Assumptions: Comparison of DCRP/M values from Wind Load Set 5 to those from Set 1 shows that the overall effect of changes in assumptions from 2003 to 2008 led to increases of DCRP/M from 6 % to 94 %.
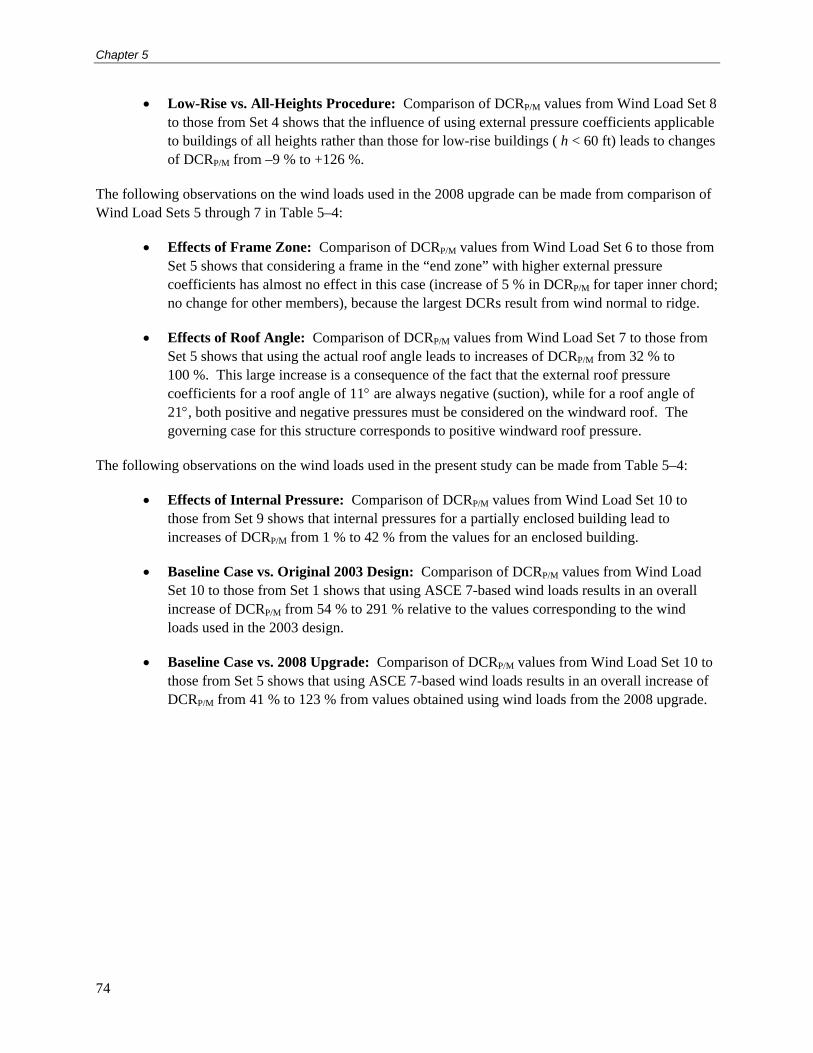
Chapter 5
74
Low-Rise vs. All-Heights Procedure: Comparison of DCRP/M values from Wind Load Set 8 to those from Set 4 shows that the influence of using external pressure coefficients applicable to buildings of all heights rather than those for low-rise buildings ( h < 60 ft) leads to changes of DCRP/M from –9 % to +126 %.
The following observations on the wind loads used in the 2008 upgrade can be made from comparison of Wind Load Sets 5 through 7 in Table 5–4:
Effects of Frame Zone: Comparison of DCRP/M values from Wind Load Set 6 to those from Set 5 shows that considering a frame in the “end zone” with higher external pressure coefficients has almost no effect in this case (increase of 5 % in DCRP/M for taper inner chord; no change for other members), because the largest DCRs result from wind normal to ridge.
Effects of Roof Angle: Comparison of DCRP/M values from Wind Load Set 7 to those from Set 5 shows that using the actual roof angle leads to increases of DCRP/M from 32 % to 100 %. This large increase is a consequence of the fact that the external roof pressure coefficients for a roof angle of 11 are always negative (suction), while for a roof angle of 21, both positive and negative pressures must be considered on the windward roof. The governing case for this structure corresponds to positive windward roof pressure.
The following observations on the wind loads used in the present study can be made from Table 5–4:
Effects of Internal Pressure: Comparison of DCRP/M values from Wind Load Set 10 to those from Set 9 shows that internal pressures for a partially enclosed building lead to increases of DCRP/M from 1 % to 42 % from the values for an enclosed building.
Baseline Case vs. Original 2003 Design: Comparison of DCRP/M values from Wind Load Set 10 to those from Set 1 shows that using ASCE 7-based wind loads results in an overall increase of DCRP/M from 54 % to 291 % relative to the values corresponding to the wind loads used in the 2003 design.
Baseline Case vs. 2008 Upgrade: Comparison of DCRP/M values from Wind Load Set 10 to those from Set 5 shows that using ASCE 7-based wind loads results in an overall increase of DCRP/M from 41 % to 123 % from values obtained using wind loads from the 2008 upgrade.
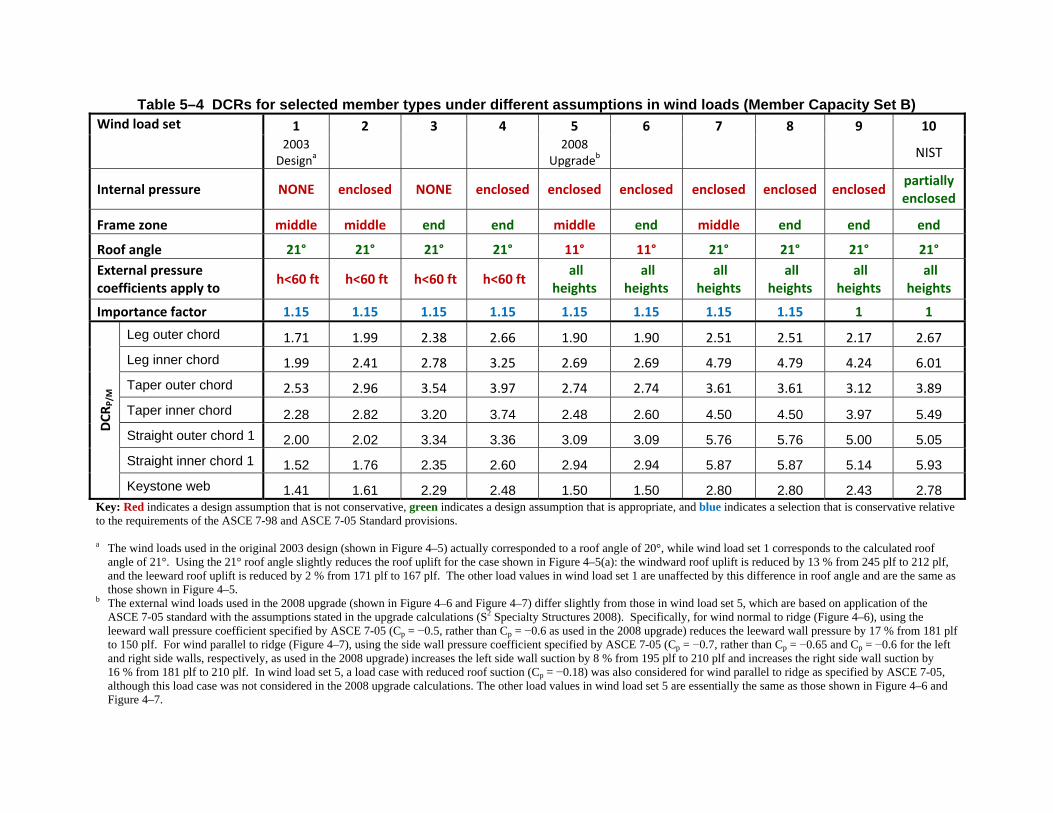
Table 5–4 DCRs for selected member types under different assumptions in wind loads (Member Capacity Set B) Wind load set 1 2 3 4 5 6 7 8 9 10
2003 Designa
2008Upgradeb
NIST
Internal pressure NONE enclosed NONE enclosed enclosed enclosed enclosed enclosed enclosedpartially enclosed
Frame zone middle middle end end middle end middle end end end
Roof angle 21° 21° 21° 21° 11° 11° 21° 21° 21° 21°
External pressure coefficients apply to
h<60 ft h<60 ft h<60 ft h<60 ft all
heights all
heights all
heights all
heights all
heights all
heights
Importance factor 1.15 1.15 1.15 1.15 1.15 1.15 1.15 1.15 1 1
DCRP/M
Leg outer chord 1.71 1.99 2.38 2.66 1.90 1.90 2.51 2.51 2.17 2.67
Leg inner chord 1.99 2.41 2.78 3.25 2.69 2.69 4.79 4.79 4.24 6.01
Taper outer chord 2.53 2.96 3.54 3.97 2.74 2.74 3.61 3.61 3.12 3.89
Taper inner chord 2.28 2.82 3.20 3.74 2.48 2.60 4.50 4.50 3.97 5.49
Straight outer chord 1 2.00 2.02 3.34 3.36 3.09 3.09 5.76 5.76 5.00 5.05
Straight inner chord 1 1.52 1.76 2.35 2.60 2.94 2.94 5.87 5.87 5.14 5.93
Keystone web 1.41 1.61 2.29 2.48 1.50 1.50 2.80 2.80 2.43 2.78 Key: Red indicates a design assumption that is not conservative, green indicates a design assumption that is appropriate, and blue indicates a selection that is conservative relative to the requirements of the ASCE 7-98 and ASCE 7-05 Standard provisions. a The wind loads used in the original 2003 design (shown in Figure 4–5) actually corresponded to a roof angle of 20°, while wind load set 1 corresponds to the calculated roof
angle of 21°. Using the 21° roof angle slightly reduces the roof uplift for the case shown in Figure 4–5(a): the windward roof uplift is reduced by 13 % from 245 plf to 212 plf, and the leeward roof uplift is reduced by 2 % from 171 plf to 167 plf. The other load values in wind load set 1 are unaffected by this difference in roof angle and are the same as those shown in Figure 4–5.
b The external wind loads used in the 2008 upgrade (shown in Figure 4–6 and Figure 4–7) differ slightly from those in wind load set 5, which are based on application of the ASCE 7-05 standard with the assumptions stated in the upgrade calculations (S2 Specialty Structures 2008). Specifically, for wind normal to ridge (Figure 4–6), using the leeward wall pressure coefficient specified by ASCE 7-05 (Cp = −0.5, rather than Cp = −0.6 as used in the 2008 upgrade) reduces the leeward wall pressure by 17 % from 181 plf to 150 plf. For wind parallel to ridge (Figure 4–7), using the side wall pressure coefficient specified by ASCE 7-05 (Cp = −0.7, rather than Cp = −0.65 and Cp = −0.6 for the left and right side walls, respectively, as used in the 2008 upgrade) increases the left side wall suction by 8 % from 195 plf to 210 plf and increases the right side wall suction by 16 % from 181 plf to 210 plf. In wind load set 5, a load case with reduced roof suction (Cp = −0.18) was also considered for wind parallel to ridge as specified by ASCE 7-05, although this load case was not considered in the 2008 upgrade calculations. The other load values in wind load set 5 are essentially the same as those shown in Figure 4–6 and Figure 4–7.
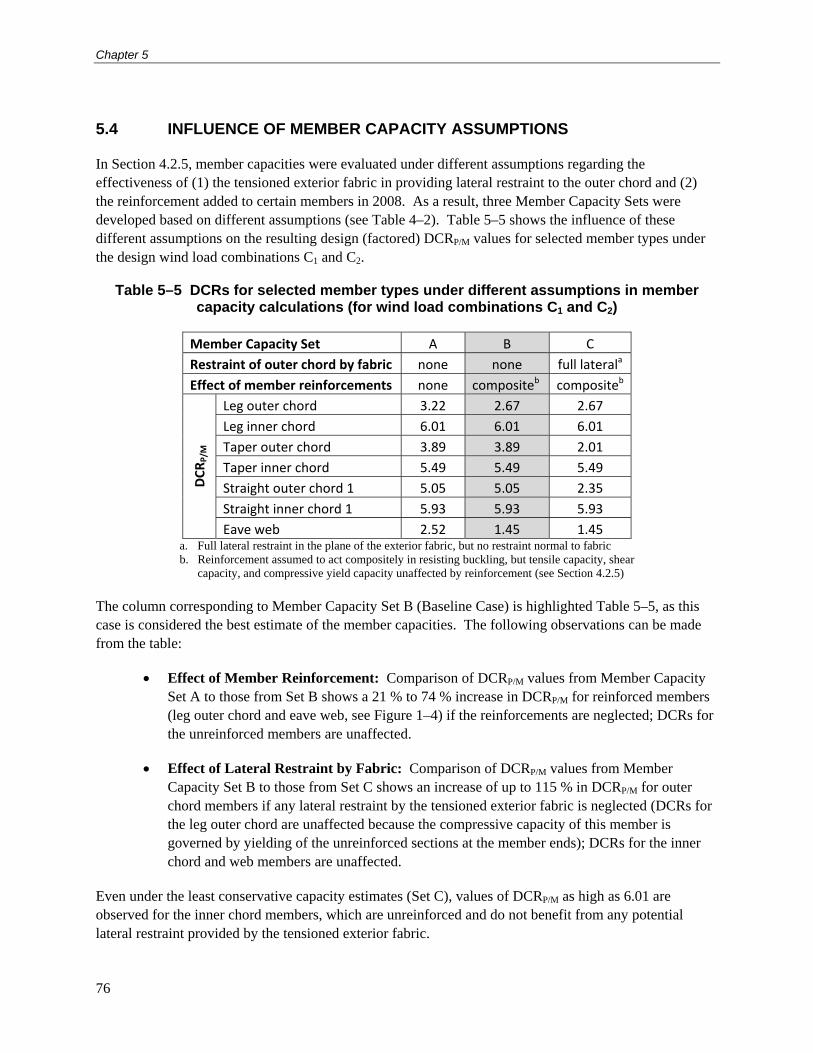
Chapter 5
76
5.4 INFLUENCE OF MEMBER CAPACITY ASSUMPTIONS
In Section 4.2.5, member capacities were evaluated under different assumptions regarding the effectiveness of (1) the tensioned exterior fabric in providing lateral restraint to the outer chord and (2) the reinforcement added to certain members in 2008. As a result, three Member Capacity Sets were developed based on different assumptions (see Table 4–2). Table 5–5 shows the influence of these different assumptions on the resulting design (factored) DCRP/M values for selected member types under the design wind load combinations C1 and C2.
Table 5–5 DCRs for selected member types under different assumptions in member capacity calculations (for wind load combinations C1 and C2)
Member Capacity Set A B C
Restraint of outer chord by fabric none none full laterala
Effect of member reinforcements none compositeb compositeb
DCRP/M
Leg outer chord 3.22 2.67 2.67
Leg inner chord 6.01 6.01 6.01
Taper outer chord 3.89 3.89 2.01
Taper inner chord 5.49 5.49 5.49
Straight outer chord 1 5.05 5.05 2.35
Straight inner chord 1 5.93 5.93 5.93
Eave web 2.52 1.45 1.45 a. Full lateral restraint in the plane of the exterior fabric, but no restraint normal to fabric b. Reinforcement assumed to act compositely in resisting buckling, but tensile capacity, shear
capacity, and compressive yield capacity unaffected by reinforcement (see Section 4.2.5)
The column corresponding to Member Capacity Set B (Baseline Case) is highlighted Table 5–5, as this case is considered the best estimate of the member capacities. The following observations can be made from the table:
Effect of Member Reinforcement: Comparison of DCRP/M values from Member Capacity Set A to those from Set B shows a 21 % to 74 % increase in DCRP/M for reinforced members (leg outer chord and eave web, see Figure 1–4) if the reinforcements are neglected; DCRs for the unreinforced members are unaffected.
Effect of Lateral Restraint by Fabric: Comparison of DCRP/M values from Member Capacity Set B to those from Set C shows an increase of up to 115 % in DCRP/M for outer chord members if any lateral restraint by the tensioned exterior fabric is neglected (DCRs for the leg outer chord are unaffected because the compressive capacity of this member is governed by yielding of the unreinforced sections at the member ends); DCRs for the inner chord and web members are unaffected.
Even under the least conservative capacity estimates (Set C), values of DCRP/M as high as 6.01 are observed for the inner chord members, which are unreinforced and do not benefit from any potential lateral restraint provided by the tensioned exterior fabric.
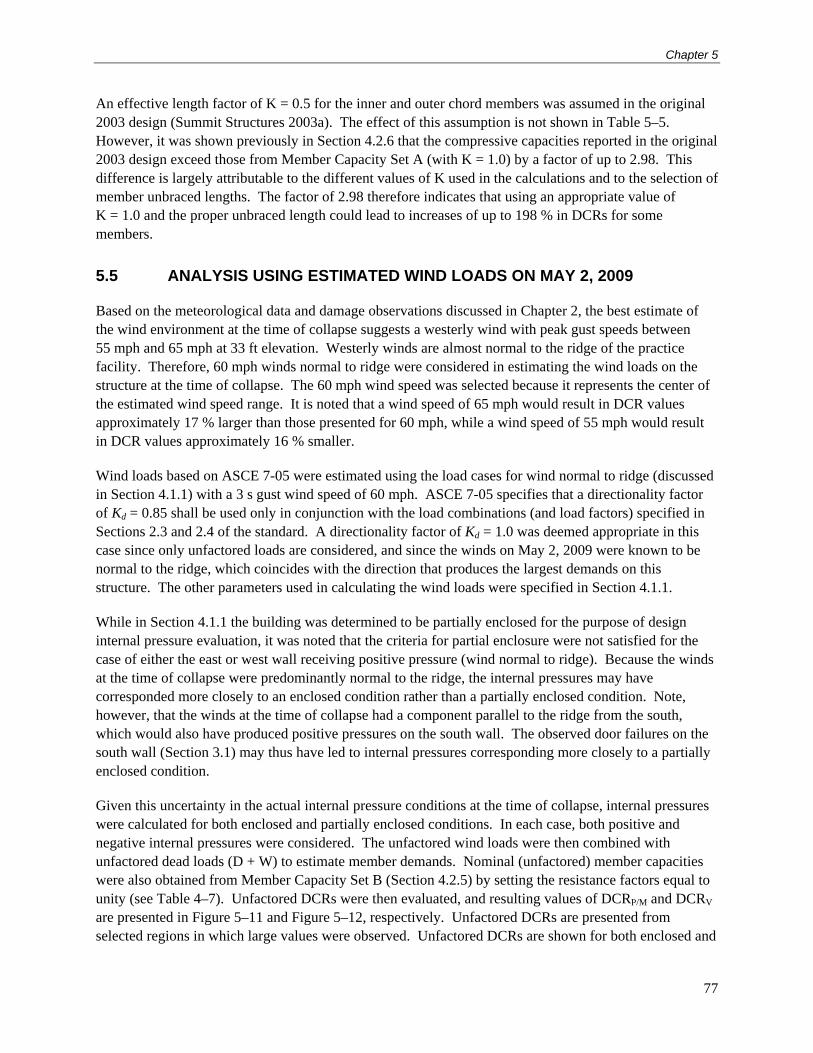
Chapter 5
77
An effective length factor of K = 0.5 for the inner and outer chord members was assumed in the original 2003 design (Summit Structures 2003a). The effect of this assumption is not shown in Table 5–5. However, it was shown previously in Section 4.2.6 that the compressive capacities reported in the original 2003 design exceed those from Member Capacity Set A (with K = 1.0) by a factor of up to 2.98. This difference is largely attributable to the different values of K used in the calculations and to the selection of member unbraced lengths. The factor of 2.98 therefore indicates that using an appropriate value of K = 1.0 and the proper unbraced length could lead to increases of up to 198 % in DCRs for some members.
5.5 ANALYSIS USING ESTIMATED WIND LOADS ON MAY 2, 2009
Based on the meteorological data and damage observations discussed in Chapter 2, the best estimate of the wind environment at the time of collapse suggests a westerly wind with peak gust speeds between 55 mph and 65 mph at 33 ft elevation. Westerly winds are almost normal to the ridge of the practice facility. Therefore, 60 mph winds normal to ridge were considered in estimating the wind loads on the structure at the time of collapse. The 60 mph wind speed was selected because it represents the center of the estimated wind speed range. It is noted that a wind speed of 65 mph would result in DCR values approximately 17 % larger than those presented for 60 mph, while a wind speed of 55 mph would result in DCR values approximately 16 % smaller.
Wind loads based on ASCE 7-05 were estimated using the load cases for wind normal to ridge (discussed in Section 4.1.1) with a 3 s gust wind speed of 60 mph. ASCE 7-05 specifies that a directionality factor of Kd = 0.85 shall be used only in conjunction with the load combinations (and load factors) specified in Sections 2.3 and 2.4 of the standard. A directionality factor of Kd = 1.0 was deemed appropriate in this case since only unfactored loads are considered, and since the winds on May 2, 2009 were known to be normal to the ridge, which coincides with the direction that produces the largest demands on this structure. The other parameters used in calculating the wind loads were specified in Section 4.1.1.
While in Section 4.1.1 the building was determined to be partially enclosed for the purpose of design internal pressure evaluation, it was noted that the criteria for partial enclosure were not satisfied for the case of either the east or west wall receiving positive pressure (wind normal to ridge). Because the winds at the time of collapse were predominantly normal to the ridge, the internal pressures may have corresponded more closely to an enclosed condition rather than a partially enclosed condition. Note, however, that the winds at the time of collapse had a component parallel to the ridge from the south, which would also have produced positive pressures on the south wall. The observed door failures on the south wall (Section 3.1) may thus have led to internal pressures corresponding more closely to a partially enclosed condition.
Given this uncertainty in the actual internal pressure conditions at the time of collapse, internal pressures were calculated for both enclosed and partially enclosed conditions. In each case, both positive and negative internal pressures were considered. The unfactored wind loads were then combined with unfactored dead loads (D + W) to estimate member demands. Nominal (unfactored) member capacities were also obtained from Member Capacity Set B (Section 4.2.5) by setting the resistance factors equal to unity (see Table 4–7). Unfactored DCRs were then evaluated, and resulting values of DCRP/M and DCRV are presented in Figure 5–11 and Figure 5–12, respectively. Unfactored DCRs are presented from selected regions in which large values were observed. Unfactored DCRs are shown for both enclosed and
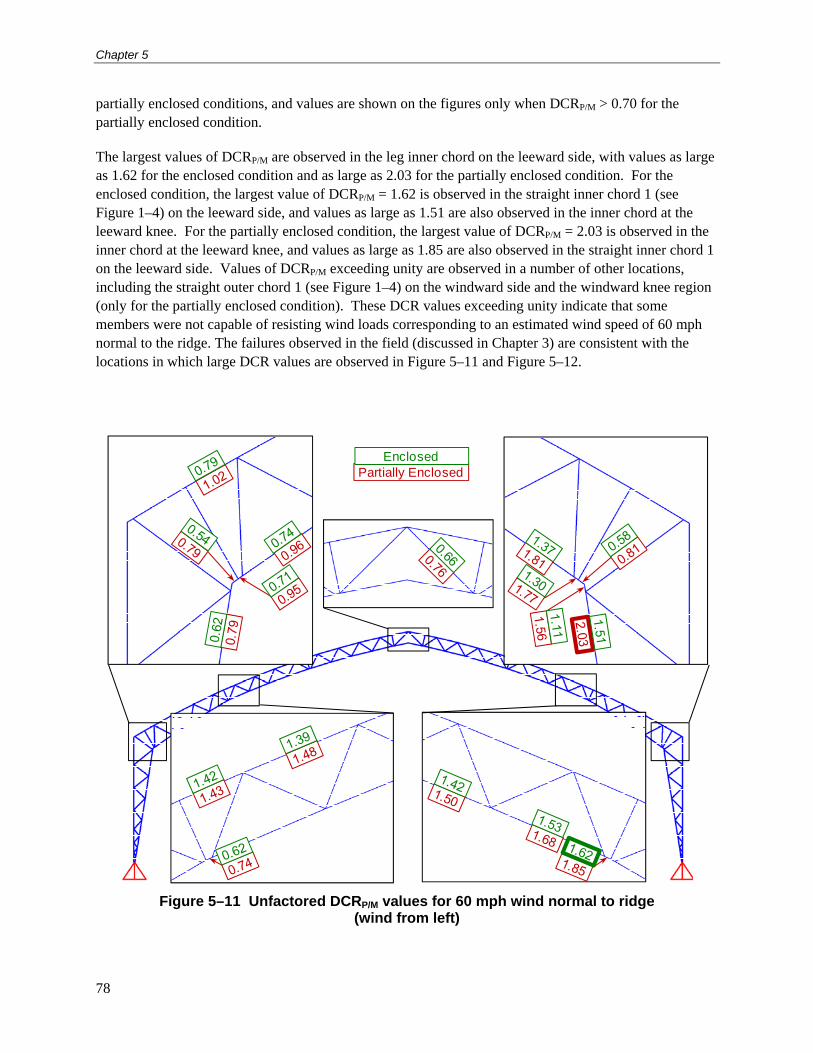
Chapter 5
78
partially enclosed conditions, and values are shown on the figures only when DCRP/M > 0.70 for the partially enclosed condition.
The largest values of DCRP/M are observed in the leg inner chord on the leeward side, with values as large as 1.62 for the enclosed condition and as large as 2.03 for the partially enclosed condition. For the enclosed condition, the largest value of DCRP/M = 1.62 is observed in the straight inner chord 1 (see Figure 1–4) on the leeward side, and values as large as 1.51 are also observed in the inner chord at the leeward knee. For the partially enclosed condition, the largest value of DCRP/M = 2.03 is observed in the inner chord at the leeward knee, and values as large as 1.85 are also observed in the straight inner chord 1 on the leeward side. Values of DCRP/M exceeding unity are observed in a number of other locations, including the straight outer chord 1 (see Figure 1–4) on the windward side and the windward knee region (only for the partially enclosed condition). These DCR values exceeding unity indicate that some members were not capable of resisting wind loads corresponding to an estimated wind speed of 60 mph normal to the ridge. The failures observed in the field (discussed in Chapter 3) are consistent with the locations in which large DCR values are observed in Figure 5–11 and Figure 5–12.
Partially EnclosedEnclosed
Figure 5–11 Unfactored DCRP/M values for 60 mph wind normal to ridge (wind from left)
Chapter 5
79
0.79
0.84
0.810.63
0.63
0.61
0.800.58
Partially EnclosedEnclosed
Figure 5–12 Unfactored DCRV values with 60 mph wind normal to ridge (wind from left)
The wind loads considered in this chapter were based on classification of the surrounding terrain as exposure category C (open terrain), as noted in Section 4.1.1. Exposure category C was specified in both the original design (Summit Structures 2003a,b) and the 2008 upgrade (S2 Specialty Structures 2008). This category is appropriate based on consideration of the open patches to the northwest and east of the structure (see Section C6.5.6 and Figures C6-8 and C6-9 of ASCE 7-05). However, it could be argued that exposure category B (suburban terrain) is appropriate for winds from the west, as observed at the time of collapse on May 2, 2009, due to the density of buildings in that direction. Using exposure category B rather than C would reduce the wind loads by about 24 %, with corresponding reductions in the unfactored DCR values presented in Figure 5–11 and Figure 5–12. The largest unfactored values of DCRP/M would be 1.65 for the partially enclosed condition and 1.27 for the enclosed condition, still significantly in excess of unity in both cases. This indicates that even under less conservative assumptions regarding the exposure category and the enclosure condition, member failures would be expected for the estimated wind speed of 60 mph normal to the ridge.
5.6 SUMMARY AND DISCUSSION OF ANALYSIS RESULTS
5.6.1 Analysis under Design Loads
The analysis under design wind load combinations yielded design DCRs exceeding 5.9 in the inner chord members of the frame, both near the knees and in the straight sections of the roof. The design DCRs greater than 1.0 are primarily due to (1) the differences between the wind loads based on the ASCE 7 Standard and those used in the original 2003 design and in the 2008 upgrade, (2) the differences between member capacities based on the AISC specification and those used in the original 2003 design and in the 2008 upgrade, and (3) connection eccentricities that resulted in large bending moments and shear forces in the adjacent chord members not considered in the original 2003 design or in the 2008 upgrade.
The influences of the differences in wind loads identified in Chapter 4 on design DCRs were investigated in Section 5.3. The differences between the original 2003 wind loads and those specified by ASCE 7-98
Chapter 5
80
led to an overall increase of up to 291 % in DCRs for some members; the most significant differences are as follows (ranked in descending order of their effect on DCRs):
Low-rise vs. all-heights procedure: External wind pressures were based on the procedure applicable to low-rise buildings (h < 60 ft) rather than the procedure applicable to all heights. Using the procedure applicable to all heights leads to an increase of up to 126 % in DCRs for the critical straight inner chord members.
Frame zone: External pressures were based on reduced pressure coefficients applicable to frames near the middle of the building rather than the higher pressure coefficients applicable to interior frames closest to the end walls. Using the higher pressure coefficients leads to an increase of up to 67 % in DCRs for some members.
Internal pressure: Internal pressure was not considered in the original design. Including internal pressure in the design for an enclosed building leads to an increase of up to 24 % in DCRs for some members. Including internal pressure in the design for a partially enclosed building would lead to even larger increases.
The differences between the wind loads used in the 2008 upgrade and those specified by ASCE 7-05 led to an overall increase of up to 123 % in DCRs for some members; the most significant differences are as follows (ranked in descending order of their effect on DCRs):
Roof angle: External wind pressures were based on a roof angle of 11° rather than the actual roof angle of 21°. Using the actual roof angle of 21° leads to an increase of up to 100 % in DCRs for some members.
Internal pressure: Internal pressures were based on the “enclosed” rather than the “partially enclosed” classification. Using internal pressures for a partially enclosed classification leads to an increase of up to 42 % in DCRs for some members.
The influences of the different member capacity assumptions were discussed in Chapter 4 and in Section 5.4, and the following assumptions were found to significantly affect the evaluation of effective lengths and compressive capacities:
Effective length: An effective length factor of K = 0.5 was used for the inner and outer chord members in the original 2003 design. Using the more appropriate value of K = 1.0 and appropriate member unbraced lengths could lead to increases of up to 198 % in DCRs for some members.
Lateral support provided by tensioned exterior fabric: The tensioned exterior fabric was assumed to provide lateral support to the outer chord members in the original 2003 design. Neglecting any lateral restraint provided by the exterior fabric leads to increases of up to 115 % in DCRs for some outer chord members.
Actual connection and splice details, as discussed in Section 4.2.8 and Section 5.2, amplified the demands in the chord members near the knees and at splice locations along the frame:
Chapter 5
81
Connection eccentricities: Bending moments and shear forces due to connection eccentricities were not considered in the original design of the chord members in 2003. Considering such bending moments and accounting for moment-axial interaction leads to increases of up to 143 % in DCRs for some inner chord members.
The reinforcement added to selected members in 2008 led to a reduction of up to 37 % in the resulting DCRs for some members (see Section 5.4). However, the members found to be most critical (i.e., having the largest DCRs) were not reinforced in the 2008 upgrade.
5.6.2 Analysis under Estimated Loads on May 2, 2009
Unfactored DCRs were calculated using ASCE 7-05 wind loads corresponding to 60 mph wind speeds normal to the ridge. These wind conditions are considered representative of those experienced by the structure at the time of collapse. DCRs were calculated with internal pressures corresponding to both enclosed and partially enclosed conditions because of uncertainties regarding the actual internal pressure condition at the time of collapse. For the enclosed condition, DCRs exceeding 1.5 were observed in the inner chord of the frame, both in the leg and taper sections near the leeward knee, and in the straight section of the leeward roof. For the partially enclosed condition, DCRs exceeding 1.8 were observed in these same regions. DCRs exceeding unity were also observed in the outer chord members in the straight section of the windward roof and, for the partially enclosed condition, near the windward knee. Note that unfactored DCR values exceeding unity indicate an overstress condition.
Based on the results of this analysis and the observations made in the damage survey, one can infer a possible collapse sequence for the structure. It should be noted that the wind loads considered in this analysis are only an approximation which is based on a uniform wind field, while thunderstorm wind conditions are highly turbulent. In addition, a linear analysis of a single frame was performed, and no redistribution of forces following local failures was considered in the analysis. The adequacy of the lateral bracing system for maintaining the stability of the frames was not explicitly evaluated because of the large DCRs found in the frame members under design conditions and under the estimated load conditions on May 2, 2009. Nevertheless, the analysis results presented here were consistent with the observed failures and eyewitness account.
Identification of members with the largest DCR values suggests that the collapse of a structural frame could have been initiated by failure of the inner chord on the leeward side of the frame, either in the leg section near the knee or in the straight section of the roof. Evidence of buckling of the inner chord in the straight section of the leeward roof was shown in Figure 3–11 and Figure 3–12. However, evidence of buckling of the leg inner chord was not observed in the field reconnaissance. Therefore, it is hypothesized that the collapse initiated by buckling of the inner chord in the straight section of the leeward roof. This is the location at which the largest and the second largest DCR values were observed for the enclosed condition and the partially enclosed condition, respectively. Buckling of the roof inner chord would have allowed the roof truss to kink, as illustrated in Figure 3–6. Formation of the kink in the roof truss would likely have been followed by failures at the leeward and windward knees, where members were also overstressed. Failures at both knees would then have allowed the frame to sway eastward, as illustrated in Figure 3–6. Such swaying of a single frame would be consistent with the eyewitness observation discussed in Section 3.2, of inward motion of a specific point along the top of the west wall just north of mid-field.
Chapter 5
82
Continued progression of failure would likely have led to compressive failure of the keystone web to the east of the ridge. As noted in Section 3.3, the east keystone webs were consistently observed to be either buckled or torn away. Failure of the east keystone web would then have allowed hinging and bending of the inner and outer keystone chords to the east of the ridge, as shown in Figure 3–8. Such hinging and bending may have occurred as the leeward roof was lifted upward by wind suction and as the windward roof was forced downward by positive pressure, as shown in the wind load case in Figure 4–2(a) for wind normal to ridge. This hinging may have then led to fracture of the inner and outer keystone chords at the ridge, as illustrated in Figure 3–7, allowing the two halves of the frame to separate. After separation at the ridge, the collapse proceeded as illustrated in Figure 3–5 and Figure 3–6 for frames in the southern and northern portions of the structure, respectively.
Because the structural model used in this analysis considers only in-plane linear behavior of a single frame, it does not permit an assessment of the spread of collapse through the structure following the initial failure of one or more frames. However, since the wind was approximately normal to the ridge, the loading on all interior frames was essentially the same, with local variations due to the turbulence of the wind field. The design of all interior frames was also identical, so that failure in any one frame would indicate that all other frames were simultaneously close to the point of failure. Failure in one or more frames would shift the load carried by the failed frames to adjacent frames, which would then become overloaded. Frame failures would also compromise the stability of adjacent frames through loss of lateral bracing provided by purlins, cross bracing, and sway bracing originally connected to a failed frame (see photo of a failed bracing cable connection in Figure 3–13). Through these mechanisms, frame failures may have spread in both directions from the initially failed frames. Individual frames failed in similar patterns, as observed in the NIST damage survey, resulting in total collapse of the practice facility.
While buckling failure of inner chord members was identified as most likely to have initiated the structural collapse, it is worth noting that overstress conditions (DCR values greater than 1.0) were also identified in outer chord members under the 60 mph wind loading of May 2, 2009. The outer chord members are of interest because it is these members that may or may not have received lateral support from the exterior fabric. The outer chord members were found to have DCRs as large as 1.5 for the case in which it is assumed that the exterior fabric does not provide lateral support, but only as large as 0.7 for the case in which it is assumed that the exterior fabric does provide lateral support. This comparison illustrates the importance of considering the role of the fabric in providing lateral support to compression members. For example, if the capacity of the inner chord members had been sufficient to support the loads on May 2, 2009, then the structure’s resistance to collapse would have depended on the ability of the outer fabric to provide lateral bracing.

83
Chapter 6 FINDINGS
This chapter presents a summary of the findings of the NIST study of the collapse of the Dallas Cowboys indoor practice facility. The principal findings based on the field reconnaissance, analysis of weather data, review of the structural design of the building, and the structural analyses are the following:
1. The wind speed at the time of collapse was in the range of 55 mph to 65 mph, well below the 90 mph design wind speed specified by both the ASCE 7-98 and ASCE 7-05 Standards for that location.
2. At wind loads corresponding to the 90 mph design wind speed, demands significantly exceeded capacities (design demand-capacity ratio as high as 6.0), especially for frame members around the knees and in the straight sections of the roof.
3. At wind loads corresponding to 60 mph wind speed normal to the ridge (consistent with the wind environment on May 2, 2009), demands exceeded capacities (nominal unfactored demand-capacity ratio as high as 2.0), especially for inner chord members of the frame both in the straight section of the leeward roof and around the leeward knee.
Section 6.1 summarizes the wind environment during the collapse of the facility and Section 6.2 presents possible factors contributing the collapse of the structure. Likely collapse sequence based on the damage survey and analysis results is presented in Section 6.3.
6.1 WIND ENVIRONMENT ON MAY 2, 2009
During the severe thunderstorm on May 2, 2009, the Dallas Cowboys indoor practice facility experienced the effects of a predominantly westerly lateral wind field from 3:20 to 3:27 PM. The “stagnation point” or the demarcation center of downdraft winds was about one mile southwest of the collapse site at the time of maximum surface winds at about 3:24 PM. The best estimate of the maximum near-surface gust wind speed was in the range 55 mph to 65 mph.
6.2 POSSIBLE FACTORS CONTRIBUTING TO BUILDING COLLAPSE
The following factors were found to be primary contributors to the collapse of the structure:
1. Wind loads used for both the original 2003 design and for the 2008 upgrade differed from wind loads calculated based on the provisions of both the ASCE 7-98 and ASCE 7-05 Standards, producing significantly lower design demands. The main sources for these differences are:
a. For the original 2003 design:
Chapter 6
84
i. Low-rise vs. all-heights procedure: Use of the approach for low-rise buildings (mean roof height less than 60 ft) instead of the approach that is applicable for all heights for the estimation of external wind pressure coefficients. The mean roof height of the structure was 66.4 ft.
ii. Frame zone: Calculation of external pressures using reduced pressure coefficients applicable to frames near the middle of the building rather than the higher pressure coefficients applicable to frames closest to the end walls.
iii. Internal wind pressure: Lack of consideration of internal pressures in the wind load calculations.
b. For the 2008 upgrade:
i. Roof angle: Use of a roof slope of 11o instead of the actual roof slope of 21o in estimating wind pressures.
ii. Internal wind pressure: Classification of the building as “fully enclosed” for internal pressure evaluation, while consideration of the vent and door openings around the perimeter of the structure results in a classification as “partially enclosed.” Loads calculated for partially enclosed buildings result in substantially higher internal wind pressures.
2. Frame member capacities in the original 2003 design were considerably larger than the capacities calculated by NIST based on the AISC LRFD specifications. The main sources of these differences were:
a. Effective length: Selecting an effective length factor of K = 0.5 for the inner and outer chord members instead of the more appropriate value of K = 1.0 and using member unbraced lengths that were not consistent with the design drawings.
b. Lateral support provided by tensioned exterior fabric: Assuming that the exterior fabric provided lateral bracing to the outer chord members of the frames.
3. Details of joints, particularly at the knees of the frames, produced large bending moments and shear forces in the chords of the frame that were not considered in the design.
4. Reinforcements added in 2008 had a minimal effect as they affected only the compressive capacity of selected members; the most critical members were not reinforced.
6.3 LIKELY COLLAPSE SEQUENCE
The following presents possible collapse mechanisms of the structure based on visual observation of the collapsed structure and the results of the NIST analysis.
1. Buckling of the inner chord in the straight section of the leeward roof (east side), resulting in formation of a kink in the frame at this location
Chapter 6
85
2. Failures at the leeward and windward knees, allowing the frame to sway eastward (in the direction of the wind)
3. Compressive failure of the east keystone web, leading to tensile fracture of the inner and outer keystone chords at the ridge
4. Spread of individual frame failures in similar patterns, through load redistribution and loss of lateral bracing, resulting in total collapse of the practice facility

86
This page intentionally left blank.
87
Chapter 7 RECOMMENDATIONS
7.1 GENERAL
The National Institute of Standards and Technology (NIST) is a non-regulatory agency of the Department of Commerce. NIST does not set building codes or standards, but provides technical support to the private sector and to other government agencies in the development of U.S. building and fire practice, standards, and codes. In addition to its research programs, NIST conducts failure investigations and reconnaissance of damage following natural disasters such as hurricanes, tornadoes, and earthquakes as these events provide opportunities to advance the understanding of how structures perform when subjected to extreme loads and to derive lessons that may lead to improvements in the performance and safety of structures in the future.
This study did not identify any deficiencies in the wind load provisions of the ASCE 7 Standard or in the strength design procedures for steel structures specified in the AISC LRFD design approach. However, the wind loads and capacities used in the design and upgrade of the facility differed from those based on these design standards. Wind speeds during the collapse of the Dallas Cowboys indoor practice facility were well below the 90 mph design wind speed specified in the ASCE 7 Standard. NIST calculations of wind loads and member capacities indicate that some members would have been overstressed under the wind loads calculated for a 60 mph wind speed.
There are many structures of this type that are currently in use or under construction. This type of structure is used in sports facilities, industrial and agricultural facilities, casinos, storage facilities, military installations, aircraft hangers, etc. The International Building Code (IBC) is a relevant model code that is applicable to the design of this type of structure. In particular, Chapter 31 of IBC on special construction has a Section (3102) that deals with membrane structures. Section 3102 of the code includes definitions, type of construction, allowable floor area and height, and engineering design where it refers the user to Chapter 16 of the code for structural loads. Chapter 16 in turn refers to the ASCE 7 Standard for calculating loads on the steel frame.
In addition, ASCE/SEI has a Tensioned Fabric Structures standards committee. This committee is presently developing a standard for this type of structure. NIST sees an opportunity for the new ASCE/SEI standard on tensioned fabric structures to provide valuable guidance to the designer on practices that enhance the safety of this type of structure under wind loads.
Based on the findings of this study, NIST has identified a recommendation for improved safety of fabric-covered steel frame structures. NIST believes the recommendation is realistic, appropriate, and achievable within a reasonable period of time.
Chapter 7
88
7.2 NIST RECOMMENDATION
NIST recommends that fabric-covered frame structures be evaluated to ensure the adequate performance of the structural framing system under design wind loads. Of particular concern are (1) the use of the fabric covering to provide lateral bracing for structural frames, (2) determination of the appropriate enclosure classification in the calculation of internal pressures for design wind loads, and (3) the ability of the structural system, including the lateral bracing, to maintain overall structural integrity.
This recommendation is based on the following issues identified in the NIST study:
The design of the Dallas Cowboys indoor practice facility assumed that the tensioned exterior fabric provided lateral bracing for the frames. A review of the state of practice indicates that there is some disparity on this practice among designers and fabricators of this class of structures, as some rely on fabric to provide lateral support to the frames, while others do not. There is a need to evaluate and provide guidance on the appropriateness of using fabric for lateral bracing of fabric-covered frame structures. A particular concern is the susceptibility of the fabric material to tearing due to a variety of reasons such as wind-borne debris during wind storms, accidental cuts during installation or maintenance, or degradation of the fabric tear strength due to environmental conditions including ultraviolet exposure. In such cases, tearing of the fabric would compromise the stability of the structural frames, which would in turn threaten the integrity of the entire structural system. In addition, tears in the fabric could introduce unbalanced lateral loads on the frame members. Guidance is needed on how such loads should be considered in design.
The design of the Dallas Cowboys indoor practice facility assumed the building to be enclosed for the purpose of calculating internal wind pressures, despite the presence of vent and door openings around the building perimeter that would result in a classification as partially enclosed (if the vents were even partially open). While this was not the only difference in application of the ASCE 7-98 or ASCE 7-05 Standard wind load provisions, nor the most significant, it is highlighted because of the greater ambiguity surrounding the determination of which openings will exist in the finished structure and which need to be considered in determining the enclosure classification. There is a need to provide guidance on appropriate determination of enclosure classification for this class of structures. Designers should consider all openings in the building perimeter and the possibility that some or all openings might be open during a wind storm. Fabric-covered frame structures may be flexible, and large deformations of the building frames during wind events can render doors open, potentially resulting in a partially enclosed condition. In addition, a variety of circumstances could cause the fabric to tear, which could result in higher internal pressures during wind storms than those obtained if the fabric covering remained intact.
While the collapse initiated with overloading of one or more structural frames, the fact that these failures led to a total collapse of the practice facility suggests that the adequacy of the structural system, including the lateral bracing, to maintain overall structural integrity should be evaluated. Part of this evaluation involves consideration of the reliance on fabric for lateral bracing, as noted above. In addition, multiple failures of bracing cable connections were observed during the field reconnaissance, suggesting that these connection details did not develop the full capacity of the bracing cables. Similar to a tear in the exterior fabric, as discussed above, the failure of lateral bracing elements would compromise the stability of structural frames and could threaten the
Chapter 7
89
integrity of the entire structural system. There is a need to evaluate and provide guidance on approaches to enhance the integrity of fabric-covered steel frame structures.
Building owners, operators, and designers are strongly urged to act on this recommendation. Engineers should be able to design cost-effective retrofits to address any areas of concern that are identified by these evaluations.
Affected Standards: There is no US standard directly applicable to fabric covered structures. An ASCE/SEI standards committee has developed a standard pertaining to tensioned fabric structures which is in the process of being released. NIST has briefed the ASCE/SEI committee on the findings of this study and will provide technical support to the committee if they choose to develop a standard pertaining to fabric covered structures or expand their existing standard to address such structures.
Model Building Codes: The standard on tensioned fabric structures should be adopted in the IBC model building code by mandatory reference to, or incorporation of, the latest edition of the standard.

90
This page intentionally left blank.
91
REFERENCES
AISC (2005). Load and Resistance Factor Design Specifications for Structural Steel Buildings, American Institute of Steel Construction, Chicago, IL.
ASCE 7-98 (1998). American Society of Civil Engineers, ASCE 7 Standard Minimum Design Loads for Buildings and Other Structures, Reston, VA.
ASCE 7-05 (2005). American Society of Civil Engineers, ASCE 7 Standard Minimum Design Loads for Buildings and Other Structures, Reston, VA.
ASTM A 500 (1999). Standard Specification for Cold-Formed Welded and Seamless Carbon Steel Structural Tubing in Round and Shapes, ASTM International, West Conshohocken, PA.
Caracena, F, R.L. Holle, and C.A. Doswell, III, 1989. Microbursts: A Handbook for Visual Identification. U.S. Department of Commerce, U.S. Government Printing Office, Washington, D.C., 20402, 1989-676-138, 35 pp.
Computers & Structures (2009). SAP2000: Linear and Nonlinear Static and Dynamic Analysis and Design of Three-Dimensional Structures: Basic Analysis Reference, Computers & Structures Inc., Berkeley, CA.
Dallas Cowboys Star Magazine (2009). 35(4), May 2009, Irving, TX.
IBC (2000). International Building Code, International Code Council, Falls Church, VA.
McCann, D.W. (1994). WINDEX—A New Index for Forecasting Microburst Potential, Weather Forecasting, 9, 532–541.
Summit Structures (2003a). Dallas Cowboys Structural Evaluation (SBS 106-03 204’), June 2003.
Summit Structures (2003b). Structural Design Drawings, Dallas Cowboys Practice Facility (SBS 106-03), June 2003.
S2 Specialty Structures (2008). ASCE 7-05 Structural Evaluation (PBS4 204’), April 2008.
UBC (1997). Uniform Building Code, International Conference of Building Officials, Whittier, CA.

92
This page intentionally left blank.
93
Appendix A LIST OF SUBJECT MATTER EXPERTS
The experts who provided individual external peer review to the report are:
Dr. James M. Fisher, P.E., Computerized Structural Design (CSD), Milwaukee, WI
– Dr. Fisher specializes in structural steel research and development and forensic investigations. He has spent a large part of his career investigating building systems and the study of economical structural framing systems. In recent years, he has become recognized as an authority in the performance of structures, the design of heavy industrial structures, the design of Metal Building Systems, and the design of light gage steel structures. Dr. Fisher is currently the Chairman of the AISC Committee on Specifications. He was formerly a vice president at CSD.
Mr. Richard C. Kaehler, P.E., Computerized Structural Design (CSD), Milwaukee, WI
– Mr. Kaehler specializes in structural and cold formed steel design. He has been responsible for structural failure investigations, structural testing, structural analysis and design, product research and vibration studies. He is responsible for many computer programs used by CSD and its clients. Mr. Kaehler is active in the production of published engineering reference documents, including substantial portions of recent editions of the AISI and AISC steel design manuals. He is currently a vice president at CSD.
Professor Kishor C. Mehta, P.E., Texas Tech University (TTU), Lubbock, TX
– Dr. Mehta is recognized nationally and internationally as an authority in the field of wind loads on structures and wind engineering. He has devoted the last thirty-eight years of his professional career to teaching, conducting research, offering short courses and seminars, and consulting for problems relating to wind loads. As chairman of the task committee on wind loads of the American National Standards Institute Committee A58 and of ASCE Committee ASCE 7, he played a major role in the development of the wind load provisions of ANSI A58.1-1982, ASCE 7-88, and ASCE 7-95. He was a board member of the American Association for Wind Engineering (AAWE; 1976-1984), and was elected President (1985-1989). He was Chairman of the International Association for Wind Engineering for a four-year term, 1999-2003 and organized the 11th
International Conference on Wind Engineering in June 2003. He is past chairman of the National Research Council Committee on Natural Disasters. Dr. Mehta is an Emeritus Professor of Civil Engineering at TTU and a member of the National Academy of Engineering.
Appendix A
94
Professor Douglas A. Smith, P.E., Texas Tech University (TTU), Lubbock, TX
– Dr. Smith is an associate professor at Texas Tech University and a member of the ASCE 7 Wind Loads Task Committee. He has a combination of experience and background in the areas of structural and wind engineering, statistical analyses, expert systems and has personally conducted windstorm-induced damage documentation for the Institute for Disaster Research. He has directed research on many projects, including area averaging effects for a roof purlin, wind loads on frames, site characterization for the Wind Engineering Research Field Laboratory (WERFL), integral scales measured at WERFL, wind damage prediction using Doppler radar, time domain modeling of wind-induced pressures and load factors for combined hurricane wind and surge levels. He is currently conducting research to establish uncertainties associated with model-to-full scale extrapolation of wind-induced pressure coefficients on low-rise buildings. In addition, Dr. Smith has over 10 years of practical experience in the analysis and design of industrial structures and foundations, particularly those related to power plant construction.
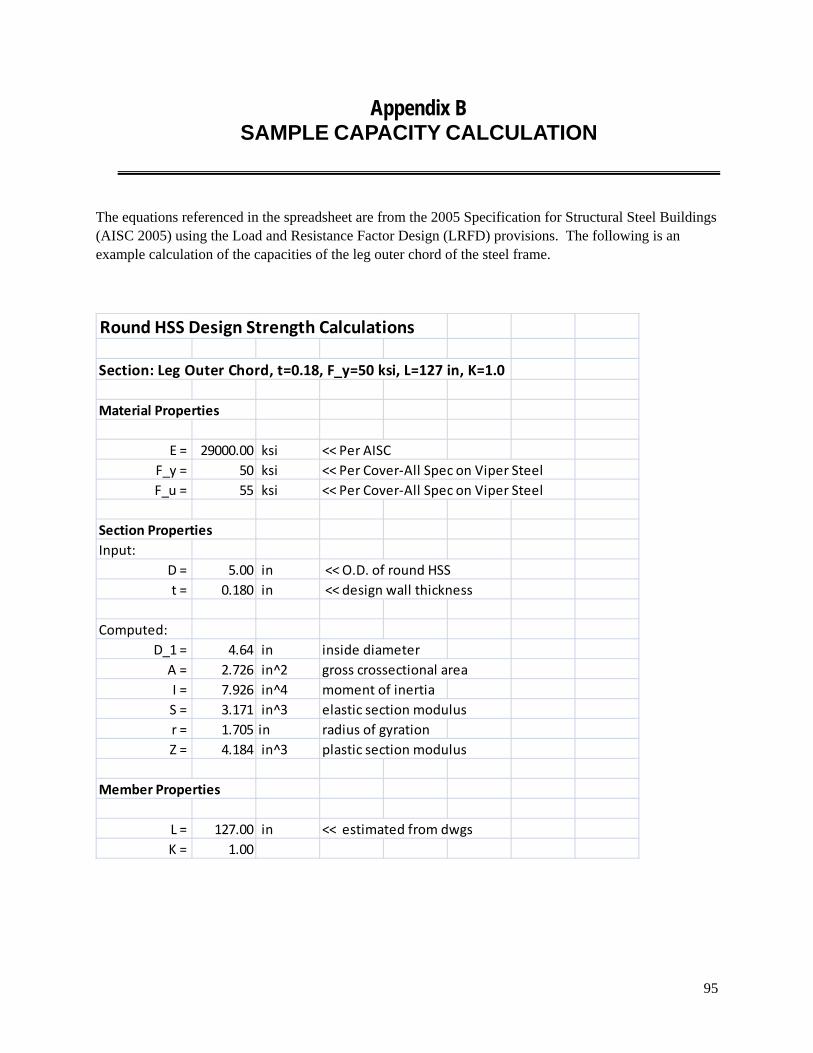
95
Appendix B SAMPLE CAPACITY CALCULATION
The equations referenced in the spreadsheet are from the 2005 Specification for Structural Steel Buildings (AISC 2005) using the Load and Resistance Factor Design (LRFD) provisions. The following is an example calculation of the capacities of the leg outer chord of the steel frame.
Round HSS Design Strength Calculations
Section: Leg Outer Chord, t=0.18, F_y=50 ksi, L=127 in, K=1.0
Material Properties
E = 29000.00 ksi << Per AISC
F_y = 50 ksi << Per Cover‐All Spec on Viper Steel
F_u = 55 ksi << Per Cover‐All Spec on Viper Steel
Section Properties
Input:
D = 5.00 in << O.D. of round HSS
t = 0.180 in << design wall thickness
Computed:
D_1 = 4.64 in inside diameter
A = 2.726 in^2 gross crossectional area
I = 7.926 in^4 moment of inertia
S = 3.171 in^3 elastic section modulus
r = 1.705 in radius of gyration
Z = 4.184 in^3 plastic section modulus
Member Properties
L = 127.00 in << estimated from dwgs
K = 1.00
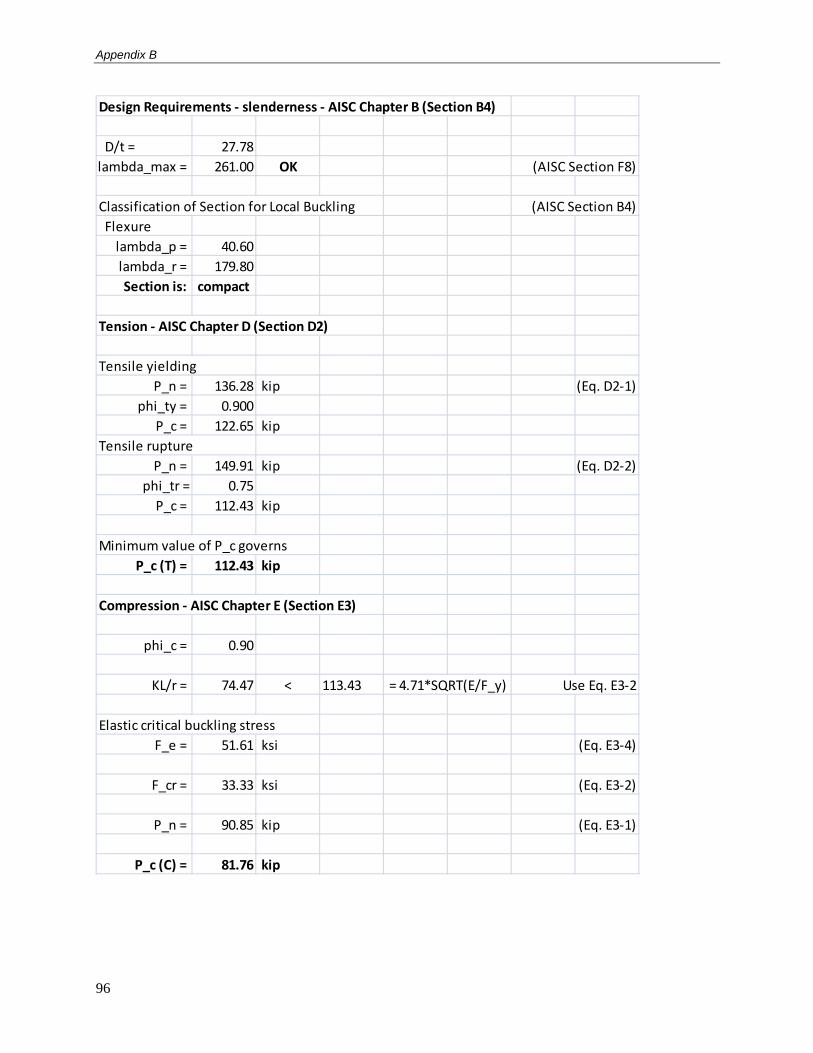
Appendix B
96
Design Requirements ‐ slenderness ‐ AISC Chapter B (Section B4)
D/t = 27.78
lambda_max = 261.00 OK (AISC Section F8)
Classification of Section for Local Buckling (AISC Section B4)
Flexure
lambda_p = 40.60
lambda_r = 179.80
Section is: compact
Tension ‐ AISC Chapter D (Section D2)
Tensile yielding
P_n = 136.28 kip (Eq. D2‐1)
phi_ty = 0.900
P_c = 122.65 kip
Tensile rupture
P_n = 149.91 kip (Eq. D2‐2)
phi_tr = 0.75
P_c = 112.43 kip
Minimum value of P_c governs
P_c (T) = 112.43 kip
Compression ‐ AISC Chapter E (Section E3)
phi_c = 0.90
KL/r = 74.47 < 113.43 = 4.71*SQRT(E/F_y) Use Eq. E3‐2
Elastic critical buckling stress
F_e = 51.61 ksi (Eq. E3‐4)
F_cr = 33.33 ksi (Eq. E3‐2)
P_n = 90.85 kip (Eq. E3‐1)
P_c (C) = 81.76 kip
Appendix B
97
Flexure ‐ AISC Chapter F (Section F8)
phi_b = 0.90
Check limiting slenderness ratio
0.45E/F_y = 261.00 OK (Section F8)
Yielding
M_n = 209.19 in‐kip (Eq. F8‐1)
Local buckling ‐ noncompact
(a) Compact sections N/A
(b) Noncompact sections
M_n = 228.04 in‐kip (Eq. F8‐2)
(c) Slender walls
F_cr = 344.52 ksi (Eq. F8‐4)
M_n = 1092.33 in‐kip (Eq. F8‐3)
Minimum value of M_n governs
M_n = 209.19 in‐kip
M_c = 188.27 in‐kip << fixed
Shear ‐ AISC Chapter G (Section G6)
phi_v = 0.90
F_cr = controls for D/t > 100 (G6‐2a)
F_cr = 154.51 controls for D/t > 100 (G6‐2b)
F_cr = 30.00 0.6F_y
Assume shear yielding governs
V_n = 40.88 kips (G6‐1)
V_c = 36.80 kips
Summary of design strengths
P_c (T) = 112.43 kips
P_c (C) = 81.76 kips
M_c = 188.27 in‐kip
V_c = 36.80 kips