final report - plataformaleds.org · dr. alejandro dávila, universidad autónoma de coahuila, ......
TRANSCRIPT

Final Report
of the
Coahuila Phase 2
State Climate Action Plan
Submitted to:
the Secretaria de Medio Ambiente (SEMA),
Border Environment Cooperation Commission (BECC), and the Mexico Low Emissions
Development Program (funded by the U.S. Agency for International Development (USAID) and
represented by the World Wildlife Fund (WWF)
By the:
Center for Climate Strategies (CCS)
January 2016

i
Table of Contents
Acknowledgments........................................................................................................................... ii
Members of the Coahuila Panel of Experts ................................................................................... iii
Members of the Climate Advisory Group……………………………………………………..... iv
Acronyms and Abbreviations ..........................................................................................................v
Executive Summary .................................................................................................................ExS-1
Chapter 1 – Background ............................................................................................................. 1-1
Chapter 2 – Inventory and Projections of Coahuila’s GHG Emissions ....................................... 2-1
Chapter 3 – Coahuila State Climate Action Plan (SCAP)- Phase 2
Chapter 4 – Energy Supply Sector ............................................................................................... 3-1
Chapter 5 – Residential, Commercial, and Industrial Sectors ..................................................... 4-1
Chapter 6 – Transportation and Land Use Sectors ...................................................................... 5-1
Chapter 7 – Agriculture, Forestry and Other Land Uses Sector .................................................. 6-1
Chapter 8 – Waste Management Sector ....................................................................................... 7-1
Appendices
A. Greenhouse Gas Emissions Inventory and Reference Case Projections .............................. A-1
B. Methodology for Micro-economic Analysis ......................................................................... B-1
C. Energy Supply Policy Recommendations .............................................................................C-1
D. Transportation and Land Use Policy Recommendations...................................................... D-1
E. Residential, Commercial, and Industrial Policy Recommendations ..................................... E-1
F. Agriculture, Forestry and Other Land Uses Policy Recommendations ................................. F-1
G. Waste Management Policy Recommendations. ................................................................... G-1

ii
Acknowledgments
The Coahuila Phase 2 State Climate Action Plan (SCAP) process was guided by a collaboration
of the Coahuila Partners. The Coahuila Partners included representatives of the Secretaria de
Medio Ambiente (SEMA), the Border Environment Cooperation Commission (BECC), the
Mexico Low Emissions Development (MLED) Program (funded by the U.S. Agency for
International Development (USAID) and represented by the World Wildlife Fund (WWF), and
the Center for Climate Strategies (CCS). The Coahuila Partners gratefully acknowledge the
following individuals and organizations that contributed significantly to the successful
completion of the Coahuila Phase 2 SCAP development process and the publication of this
report.
Great appreciation is due to the members of the Panel of Experts led by Dr. Alejandro Dávila
who provided valuable technical expertise and time to the effort. The members of the Panel of
Experts are listed on the following pages. The Coahuila Partners recognize the participants in the
first and second Advisory Group meetings convened by SEMA and held in Saltillo in July and
December 2015, and the participants in the Technical Working Groups.
The Coahuila Partners also wish to thank Alejandra Villalobos of SEMA for serving as the
liaison between SEMA and the Coahuila SCAP process.
The Coahuila Partners thank Thomas D. Peterson and CCS, with its dedicated team of
professionals, who contributed extraordinary amounts of time, energy, and expertise in providing
technical analysis, project management and facilitation services for the Coahuila SCAP process.
Special appreciation to CCS’s Mexico Project Manager Tom Looby and CCS’s Policy Analyst
Arianna Ugliano for their work throughout the process, to Stephen M. Roe for his leadership of
the technical analysis elements of the process, to Cecilia Sutter for administrative support
throughout the project. Also, the Coahuila Partners wish to acknowledge the invaluable
contributions of the following CCS technical team members: Holly Lindquist, Juan Maldonado,
Jackson Schreiber, Hal Nelson and Charles Varadin. Finally, the Coahuila Partners would like to
thank the donor and Partner organizations and their key staff that supported the service of CCS to
the Coahuila Partners, including, but not limited to:
Mario Vazquez, Tomas Balarezo, and Jairo Lopez of the BECC, and
Ricardo Troncoso and Cynthia Menendez of the MLED Program, and Mark Oven of Tetra
Tech, the MLED Program Manager.

iii
Members of the Coahuila Panel of Experts
Dr. Alejandro Dávila, Universidad Autónoma de Coahuila,
Local Coordinator and Transportation and Land Use Sector
Dr. Miriam Valdés Ibarra, Universidad Autónoma de Coahuila
Energy Supply and Residential, Commercial, Institutional and Industrial Sectors
Dr. Antonio Escamilla Díaz, Universidad Autónoma de Coahuila
Agriculture, Forestry and Other Land Use, and Waste Management Sectors

iv
Members of the Climate Advisory Group
Ing. Jorge Candelas Ramirez, Municipal Ecology
M. Samuel Colunga Urbina, COMIMSA
Dr. Jose Lauro Cortes Hernandez, COECYT
Juan Manuel Fraustro Leyva, Fondo Mexicano para la Conservación de la Naturaleza,
a.c.
Agustín González Grant, Lake Energy Network
Lorenzo Gonzales Merla, AHMSA
Raul Xavier Gonzalez Valdes, PROFEPA
Lic. Emilio Darwich Garza, PROPAEC
Ing. Carlos Galván Tello, Conafor
Ing. Hector David Guadalupe Ordaz Sabag, Met-Mex Peñoles
Avelino Hernández Corichi, COECYT
Ileana Hernández Javalera, U.A.A.A.N
Sergio Carlos Marines Gómez, Profauna
Juana María Mendoza Hernández, U.A.A.A.N
Ing. Jose A. Montoya, Lala Group Norma Yolanda Mota Palomino, UADEC
M.C Andrés Nájera Díaz, U.A.A.A.N
Ricardo René Ojinaga Rascón, SEGU
Dr. Amorita Ivonne Salas-Westphal, Juarez University
José Refugio Sandoval Rodríguez, State Congress
Ing. Carlos Alberto Sifuentes Lugo, CONANP
Raúl Fernando Tamez Robledo, SEMARNAT
M.C. Luis Mario Torres Espinoza, INIFAP
Francisco Valdés Perezgasga, Tecnologico de la Laguna
Dr. Jesús Valdés Reyna, U.A.A.A.N
v
Acronyms and Abbreviations
$/kWh pesos per kilowatt-hour
$/MM millions of pesos
$/MWh pesos per megawatt-hour
$/t pesos per metric ton
$/tCO2e pesos per metric ton of carbon dioxide equivalent
% per cent
AFOLU Agriculture, Forestry, and Other Land Use
AG Advisory Group
BAU business as usual
BC Baja California
BECC Border Environment Cooperation Commission
BRT bus rapid transit
Btu British thermal unit
CAFE corporate average fuel economy
CCC Council on Climate Change
CCI Cross-Cutting Issues
CCS Center for Climate Strategies
cf cubic feet
CH4 methane
CHP combined heat and power
CI custom industry
CNG compressed natural gas
CO Coahuila
CO2 carbon dioxide
CO2e carbon dioxide equivalent
CRF capital recovery factor
CY calendar year
DG distributed generation
DOE [United States] Department of Energy
DOT [United States] Department of Transportation
DSM demand-side management
EIA Energy Information Administration [US DOE]
EO Executive Order
EPA [United States] Environmental Protection Agency
EPS environmental portfolio standard
ES Energy Supply
EU European Union
FS fuel supply
FIT feed-in tariff
FOLU Forestry and Other Land Uses
ft foot
FY fiscal year

vi
gal gallon
GHG greenhouse gas
GJ gigajoule
GREET Greenhouse Gases, Regulated Emissions and Energy Use in Transportation
[model]
GSP gross state product
GTL gas to liquid
GWh gigawatt-hour [one million kilowatt-hours]
GWP Global Warming Potential
HDV heavy-duty vehicle
HFC hydrofluorocarbon
HOV high-occupancy vehicle
HVAC heating, ventilation, and air conditioning
I&F Inventory and Forecast
IECC International Energy Conservation Code
INEGI Mexico National Institute of Statistics and Geography
I-O Input-Output
IPCC Intergovernmental Panel on Climate Change
IPP independent power producer
IRP integrated resource planning
ITS intelligent transport system
kg kilogram
km kilometer
km/L kilometer/ liter
kV kilovolt
kW kilowatt
kWh kilowatt-hour
LandGEM Landfill Gas Emissions Model [US EPA]
LARCI Latin American Regional Climate Initiative
lb pound
LDV light-duty vehicle
LCOE levelized cost of energy or electricity
LED light-emitting diode
LEED Leadership in Energy and Environmental Design [Green Building Rating
System™]
LFG landfill gas
LFGcost Landfill Gas Cost model [US EPA]
LFGTE landfill gas-to-energy
LNG liquefied natural gas
LPG liquefied petroleum gas
m2 square meter
ME macro-economic
metric ton 1,000 kilograms or 22,051 pounds
MJ megajoule
MLED Mexico Low Emissions Development
MM million

vii
MMBtu millions of British thermal units
MP mathematical programming
mpg miles per gallon
MSW municipal solid waste
MW megawatt [one thousand kilowatts]
MWh megawatt-hour [one thousand kilowatt-hours]
N nitrogen
NAMA nationally appropriate mitigation action
N2O nitrous oxide
N/A not applicable
NF3 Nitrogen triflouride
NG natural gas
NGCC natural gas combined cycle
NGCT natural gas combustion turbine
NGO nongovernmental organization
NOx oxides of nitrogen
NPV net present value
O&M operation and maintenance
ODS ozone-depleting substance
PACE Property Assessment for Clean Energy
PBF Public Benefit Fund
PE Panel of Experts
PFC perfluorocarbon
PHEV plug-in hybrid electric vehicle
PM particulate matter
PM10 particulate matter less than 10 microns
POD policy option document
PS power supply
PV photovoltaic
R&D research and development
RCII Residential, Commercial, Institutional and Industrial
RFS renewable fuel standard
RPC regional purchase coefficient
RPS renewable portfolio standard
SBC systems benefit charge
SCAP State Climate Action Plan
SEMA Secretaria de Medio Ambiente
SF6 sulfur hexafluoride
SO2 sulfur dioxide
SOx oxides of sulfur
SOV single-occupant vehicle
sq ft square foot/feet
SUTs supply and use tables
t metric ton
Tg teragram [million metric tons]
TgCO2e teragrams of carbon dioxide equivalent

viii
T&D transmission and distribution
tC metric tons of carbon
tCO2 metric tons of carbon dioxide
tCO2e metric tons of carbon dioxide equivalent
tCO2e/MWh metric tons of carbon dioxide equivalent per megawatt-hour
TDM transportation demand management
TLU Transportation and Land Use
TOD transit-oriented development
TSM transportation system management
TWG Technical Work Group
USAID United States Agency for International Development
USEPA United States Environmental Protection Agency
VHT vehicle hours of travel
VKT vehicle-kilometers traveled
VMT vehicle miles traveled
VOC volatile organic compound
WIOD World Input-Output Database
WM Waste Management
WTE waste to energy
WW wastewater
WWF World Wildlife Fund
yr year

ExS-1
Executive Summary
Background
In June 2010 with funding from the Border Environment Cooperation Commission (BECC) the Center for Climate Strategies (CCS) completed an Inventory and Forecast (I&F) of
Greenhouse Gas emissions in the State of Coahuila (CO) and several other northern border states
of Mexico. Findings of this report are summarized in Chapter 2.
In 2011 BECC and CCS worked closely with the state of Coahuila Secretary of Environmental
Protection (Secretaria del Medio Ambiente (SEMA) to conduct a Phase 1 State Climate Action
Plan (SCAP) process in Coahuila. This Phase 1 process resulted in development of a set of
catalogs of 337 potential state climate action policies and a priority list of 56 policies drawn from
the catalogs for further analysis in Phase 2. The Phase 1 process is summarized in Chapter 1.
The policies developed during the course of the Phase 1 process in 2011 were reviewed and
considered in the early stage of the Phase 2 process which commenced at the beginning of 2015.
From the 56 policies identified at the end of the Phase 1 process SEMA and a local Panel of
Experts (PE) selected 17 policies to focus on in the Phase 2 process for Coahuila.
For the Phase 2 process the following entities came together as Partners in this collaborative
effort:
The Secretaria de Medio Ambiente (SEMA) is the state environmental agency for the state of
Coahuila for whom the SCAP has been prepared;
The Border Environment Cooperation Commission (BECC) is a sponsoring organization
which provided significant funding for the project;
The U.S. Agency for International Development (USAID)’s Mexico Low Emission
Development (MLED) Program is a second sponsoring organization which provided
significant funding for the effort;
The Center for Climate Strategies (CCS) is a non-profit entity that was contracted by BECC
and the MLED Program to perform technical, facilitative and project management services in
developing the Coahuila SCAP.
The objectives for the Coahuila Phase 2 SCAP process were established in the Scope of Work
(SOW) for CCS by BECC and the MLED Program at the outset of the process and are
summarized in Chapter 3. The primary objective was to enhance state capacity in climate
planning and analysis through a “learn by doing” approach directed by CCS. Another key
objective was to develop an initial SCAP for Coahuila that can be used to commence the state’s
GHG mitigation efforts by targeting the 17 climate mitigation policies selected for initial detailed
analysis. This secondary objective recognized that additional measures or strengthened versions
of the initial measures will likely be needed over time in pursuit of achieving the global, national
and state GHG reductions necessary to realize the GHG reduction levels anticipated in the recent
Paris Accord.

ExS-2
The multi-phase approach to developing the SCAP follows CCS’ step-wise approach to action
planning showed in Figure Ex-S-1 below. This step-wise process and the analytical toolkit that
supports its implementation are described in more detail in Chapter 1.
Figure ExS-1. Step-Wise Action Planning Approach
Through Phase 1 of the project, Steps 1 through 4 had been completed which included a GHG
baseline and a set of priority policies for inclusion in the CO SCAP. Phase 2 initiated work on
Step 5 and included the work through Step 9 to develop this final report on the SCAP.1 Work is
now underway on Step 10 which will involve the development of detailed implementation plans
for a sub-set of high priority policies selected by SEMA from the 17 SCAP policies analyzed in
Phase 2.
SEMA, BECC and MLED agreed early in the process that SEMA would be the entity to host the
Panel of Experts (PE) for the project, all who are associated with the Universidad Autónoma de
Coahuila in Saltillo. The PE was the entity designated to receive CCS’s training in policy design
and analysis. The capacity building process was designed from the outset to be a learn-by-doing
effort in which CCS trained the PE in the various technical analysis functions and then shared the
workload of actually conducting the technical analysis on the selected policy recommendations.
Chapter 3 includes a list of the Members of the PE and their sectors of expertise. It also includes
a summary of the training sessions provided to the PE and the Partner organizations.
Following completion of the Phase 2 Final Report, CCS will team up with SEMA and the
Partners on Step 10 of the planning process to conduct a detailed assessment of 3-5 of the
selected policies to chart out a more detailed implementation plan for these selected policies
using the SCAP as a foundation.
1 Note that a macroeconomic analysis of CO GHG mitigation policies was not included in this SCAP.
Step 1 Organization and Goals
Step 2 Baseline Development
Step 3 Policy Options Identification
Step 4 Policy Screening & Prioritization
Step 5 Initial Policy Option Design Specifications
Step 6 Direct (Micro) Impacts Assessment
Step 7 Policy Options Integration and Overlap
Step 8 Indirect (Macro) Impacts Assessment
Step 9 Final Recommendations & Report Transmittal
Step 10 Monitoring, Reporting, Evaluation, & Updating

ExS-3
Coahuila GHG Emissions Inventory & Forecast
The inventory and business as usual (BAU) forecast (or “baseline”) of GHG emissions was
constructed primarily from the 2010 GHG I&F prepared by CCS.2 As summarized in Figure
ExS-2 below, the baseline is economy-wide and includes annual emissions data for all sectors.
“Net” emissions indicate that these estimates include both sources and sinks of GHGs (e.g.
carbon sequestration in the Forestry sector).
Figure ExS-2. Coahuila’s Net GHG Emissions by Sector
All sectors of Coahuila’s economy were addressed in the baseline (see the materials provided in
Chapter 2 and Appendix A for more details). These follow the common categorization used in
national GHG reporting:
Energy Supply (ES): for Coahuila, this mainly addresses the Power Supply (PS)
subsector;
Residential, Commercial & Institutional (RCI): this covers emissions from fuel
combustion in buildings; Industry (I); this sector includes emissions from fuel combustion for industrial processes
and buildings, as well as non-combustion emissions that occur from industrial processes;
Transportation: most importantly fuel combustion in on-road vehicles, but also including
air, rail and marine vessels;
Agriculture, Forestry & Other Land Uses (AFOLU): the agricultural subsector covers
fuel combustion and non-combustion emissions associated with crop production and
2 Greenhouse Gas Emissions in Coahuila and Reference Case Projections 1990 – 2025, the Center for Climate
Strategies, June 2010. As discussed in further detail in a technical memorandum appended in Appendix A, the 2010
CCS baseline was extended to 2035. Therefore, the reader should expect some differences in the baseline values
shown in the body of this report as compared to the values shown in 2010 report provided in Appendix A.
0
10
20
30
40
50
60
1990 1995 2000 2005 2010 2015 2020 2025 2030 2035
Tg
CO
2e
Energy Supply Transportation RCI Industry AFOLU Waste Management
Inventory Forecast

ExS-4
livestock management; the forestry and other land use sector primarily covers carbon
sequestration; and
Waste Management (WM): this includes the solid waste management and wastewater
treatment subsectors.
The baseline estimates are presented in units of teragrams (Tg) of carbon dioxide equivalent
(CO2e) emissions (1 Tg is equal to 1 million metric tons). These estimates include all GHG
emissions within each sector and put them in common units based on their global warming
potential (GWP). For this study, GWP’s from the IPCC’s Second Assessment Report (SAR)
were used. As noted below, emissions for all GHGs required for reporting by the
Intergovernmental Panel on Climate Change (IPCC) were addressed; however, sources for all
GHGs were not identified:
Carbon dioxide (CO2);
Methane (CH4);
Nitrous oxide (N2O);
Hydrofluorocarbons (HFC);
Sulfur hexafluoride (SF6);
Perfluorocarbons (PFC); and
Nitrogen trifluoride (NF3).
As shown in Figure ExS-2, as well as Figure ExS-3 below, emissions are expected to double
from the year 2005 (27 TgCO2e) to the end of the planning period in 2030 (55 TgCO2e). The
emissions are shown on a “net” basis, meaning that carbon sinks have been subtracted from the
overall emissions totals (these carbon sinks occur in the AFOLU and WM sectors). As indicated
in the results shown in Figure ExS-3, the Energy Supply and Industry sectors are expected to
contribute to most of the emissions growth in Coahuila during the forecast period.3
Figures ExS-4 and ExS-5 provide GHG emissions normalized to population and economic
output (“carbon intensities”). On a per capita basis, due to a relatively low population and the
presence of heavy industry in the State, CO’s emissions are above the national levels. This
difference is expected to grow over time based on population and economic growth, industry
structure, and an electricity system with substantial coal-based generation. Net intensities include
an accounting of carbon sinks, while gross intensities exclude these.
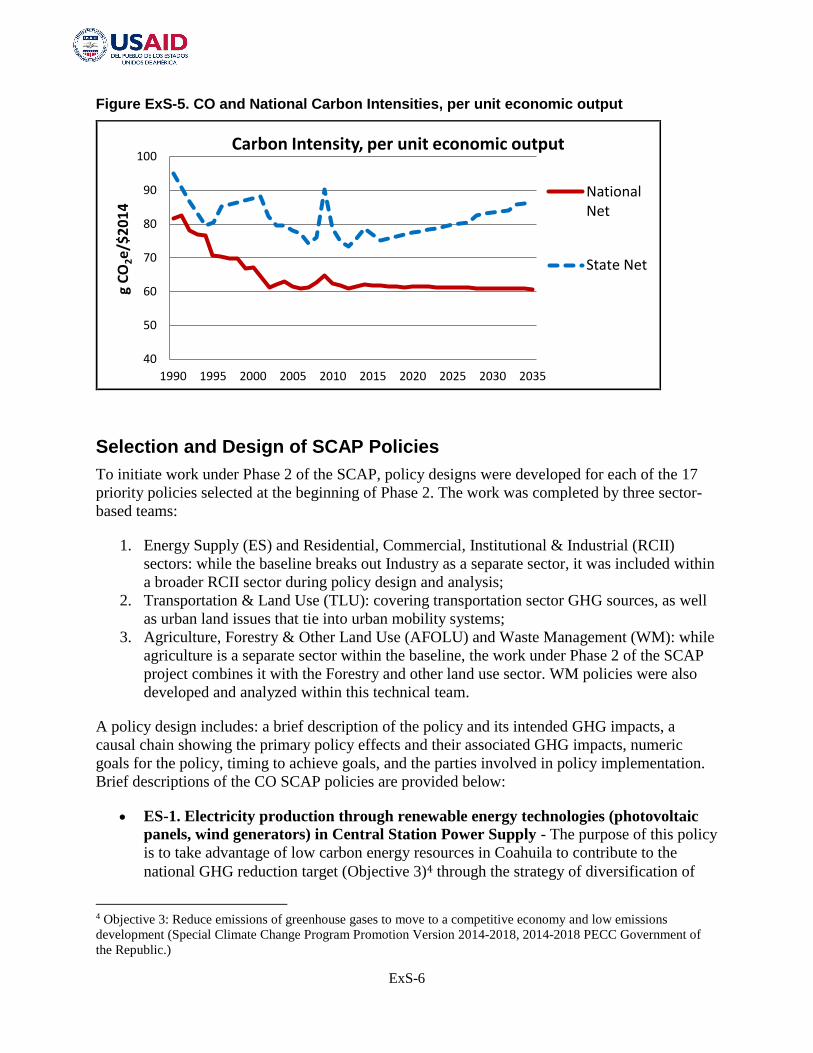
On the basis of economic output, due to the presence of heavy industry and the carbon intensity
of the electricity system in CO, the carbon intensity for the State is again higher than national
levels. Over time, the carbon intensity of Mexico’s economy is expected to decline slightly,
while Coahuila’s is expected to continue to increase due to both industrial growth and the carbon
intensity of electricity supply.
3 Note: the Federal government has recently indicated that it is studying the potential for decommissioning one of
the coal-fired power plants in the State. If this were to occur, there would be a significant impact on Coahuila’s
baseline, since any new generation to make up for this loss in capacity would most likely come from much cleaner
sources.

ExS-5
Figure ExS-2. Coahuila Net GHG Emissions Baseline by Sector
A more detailed break-down of Coahuila’s 2005 GHG emissions, as well as the overall GHG
baseline can be found in Chapter 2 and Appendix A.
Figure ExS-4. CO and National Carbon Intensities, per capita
0
10
20
30
40
50
60
1990 1995 2000 2005 2010 2015 2020 2025 2030 2035
TgC
O2e
WasteManagement
AFOLU
Industry
RCI
Transportation
Energy Supply
0.0
2.0
4.0
6.0
8.0
10.0
12.0
14.0
16.0
18.0
1990 1995 2000 2005 2010 2015 2020 2025 2030 2035
t C
O2e/
cap
ita
Carbon Intensity, per capita
StateGross
State Net
NationalNet
ExS-6
Figure ExS-5. CO and National Carbon Intensities, per unit economic output
Selection and Design of SCAP Policies
To initiate work under Phase 2 of the SCAP, policy designs were developed for each of the 17
priority policies selected at the beginning of Phase 2. The work was completed by three sector-
based teams:
1. Energy Supply (ES) and Residential, Commercial, Institutional & Industrial (RCII)
sectors: while the baseline breaks out Industry as a separate sector, it was included within
a broader RCII sector during policy design and analysis;
2. Transportation & Land Use (TLU): covering transportation sector GHG sources, as well
as urban land issues that tie into urban mobility systems;
3. Agriculture, Forestry & Other Land Use (AFOLU) and Waste Management (WM): while
agriculture is a separate sector within the baseline, the work under Phase 2 of the SCAP
project combines it with the Forestry and other land use sector. WM policies were also
developed and analyzed within this technical team.
A policy design includes: a brief description of the policy and its intended GHG impacts, a
causal chain showing the primary policy effects and their associated GHG impacts, numeric
goals for the policy, timing to achieve goals, and the parties involved in policy implementation.
Brief descriptions of the CO SCAP policies are provided below:
ES-1. Electricity production through renewable energy technologies (photovoltaic
panels, wind generators) in Central Station Power Supply - The purpose of this policy
is to take advantage of low carbon energy resources in Coahuila to contribute to the
national GHG reduction target (Objective 3)4 through the strategy of diversification of
4 Objective 3: Reduce emissions of greenhouse gases to move to a competitive economy and low emissions
development (Special Climate Change Program Promotion Version 2014-2018, 2014-2018 PECC Government of
the Republic.)
40
50
60
70
80
90
100
1990 1995 2000 2005 2010 2015 2020 2025 2030 2035
g C
O2e/
$2
01
4
Carbon Intensity, per unit economic output
NationalNet
State Net

ExS-7
the energy matrix production in the country (Strategy 3.2.1).5 This includes reducing
dependence on fossil fuels with high carbon content in electricity generation by
promoting installation of power plants that use renewable energy sources, specifically
wind and sun, thereby helping to reduce GHG emissions per megawatt (MW) generated.
This strategy is consistent with the State’s resources, as Coahuila receives a high level of
solar radiation (2.9 to 6.7 kWh/m2) with high potential for energy conversion. The state
can support diversification of electricity supply options by providing siting and
construction of new facilities and generation operations with primary renewable energy.
ES-2. In-situ electricity generation in residential buildings with photovoltaic panels - Towards 2020, the residential sector will be the eighth largest greenhouse gas emitter
and the second largest in black carbon. These emissions are associated with electricity
consumption of households. The costs of small-scale generation with photovoltaic panels
are lower than domestic rates, once the government subsidy is incorporated (e.g.
Mexico’s PROSOLAR Program).6 Also, the territory of Coahuila receives high levels of
solar radiation. Therefore, the implementation of economic and financial incentives will
boost the self-generation of solar photovoltaic electricity in the residential sector. The
implementation of this policy contributes to the reduction of GHG emissions related to
the consumption of electricity produced from fossil fuels. Similarly, it supports the
national strategy for distributed power generation in the domestic, commercial and
industrial sector (Strategy 3.4.3).
ES-3 In-situ electricity generation in public buildings with photovoltaic panels -
Electrical energy used in public buildings comes largely from fossil fuels with high
global warming potential. Therefore, the objective of this policy is to increase energy
efficiency in the institutional sector, taking advantage of the high incidence of solar
radiation of the entity, promoting the installation of photovoltaic panels in public
buildings in Coahuila to meet their electric energy requirements electric. With this
measure, besides reducing operating costs in the public sector, GHG emissions are
mitigated using cleaner and more efficient technologies to replace fossil fuels for power
generation.
ES-4. In-situ electricity generation in commercial and industrial buildings with
photovoltaic panels - The commercial and industrial sectors have increasingly
contributed to the increase of GHG emissions that alter the energy balance of the climate
system. Therefore, it is appropriate to move towards an energy model that considers the
consumption of electricity in commercial and industrial buildings by harnessing solar
energy. The auto-consumption of electricity produced by photovoltaic technologies will
contribute to savings in operating costs in commercial and industrial buildings, and
contribute to mitigation of GHG emissions, both by reducing dependence on non-
renewable fuels, and avoiding energy losses during transport and distribution of electrical
energy required in the commercial and industrial buildings of Coahuila.
5 Strategy 3.2.1: Promote the diversification of the energy matrix with public and private investment in generation
through clean energy (Special Climate Change Program Promotion Version 2014-2018, 2014-2018 PECC.
Government of the Republic). 6 Electricity generated from solar photovoltaics costs less than the MX tariff (electricity rate) for larger consumers.
For residential customers that use more than 75 kWh per 2 month billing cycle, the electricity tariff is $MX 2.86
kWh ($US 430/MWh), which is much more expensive than the estimated levelized costs of solar PV generation
used in the ES analysis.

ExS-8
ES-5. Encouragement of efficient cogeneration of electricity in industry - Electricity
cogeneration systems reach a much higher efficiency than conventional systems by
leveraging untapped waste heat and reducing unnecessary energy losses, enabling
considerable medium and long term savings (CONUEE and CRE, 2013). In Mexico,
regulation has been developed considering energy efficient cogeneration projects. In most
companies in the industrial sector, heat and electricity are essential inputs. When these
two forms of energy are required together in a production process, it is an opportunity to
implement cogeneration systems, which leads, simultaneously, to achieve greater
efficiency in the use of fossil fuels and produce less pollutant emissions per unit of useful
energy. This policy considers the promotion of efficient cogeneration systems according
to the productive structure of the state, where the impulse for cogeneration is
concentrated in the following sectors: Cement industry, steel industry and mining sector.
Cogeneration mode represents a viable option to contribute to energy sustainability by
increasing energy and economic efficiency of the company.
RCII-1. Increasing energy efficiency in new and existing construction buildings-
Building codes and standards - Construction and design modifications of a building can
contribute to increase energy efficiency, reducing energy demand to satisfy thermal
conditioning and lighting needs, improving inhabitants’ comfort, thus contributing to
mitigate deterioration of the environment. Within the framework of energetic
sustainability, this policy covers regulation of design, construction and major remodeling
of buildings, with the objective of building low carbon footprint “green buildings”. All of
this through enhancement, improvement, and adoption of regulations and standards that
promote thermal isolation technologies, installation of low-power consuming lighting
systems: halogen, compact-fluorescent (LFC) and light-emitting diode (LED) lamps, and
carbon sequestration activities (such as green roofs, vertical gardens, and urban gardens)
in new residential, commercial, institutional, and industrial buildings.
RCII-2. Increasing energy efficiency in new construction- Equipment (Appliances,
solar water heaters, flow water heaters) - Part of the emissions of GHG in the
residential, commercial, and institutional sectors (RCII) comes from the consumption of
electricity to satisfy the needs of lighting, water heating, thermal conditioning and
appliance operation. The goal of this policy is to increase energy efficiency in the RCI
sectors by reducing the energetic demand, supporting a decrease in GHG emissions from
generation, distribution and consumption of energy. (Note that industrial building
appliance efficiency is addressed in RCII-4). This policy promotes the following
measures specifically:
o Use of solar energy through installation of solar water heaters in households, thus
reducing consumption of liquefied petroleum gas (LPG), natural gas (NG) or
electricity for water-heating purposes.
o Encourage the use of flow water heaters, with the purpose of reducing the use of
LPG and NG.
o Acquisition of energy efficient appliances.
o Use of more energy efficient thermal conditioning equipment (e.g. mini-split
inverter).
This policy is complementary to policies 2, 3 and 4 of the Energy Sector, which consider
the installation of photovoltaic panels for in situ generation in residential, commercial,
industrial and institutional buildings.

ExS-9
RCII-3. Increasing energy efficiency in existing construction, excluding the
industrial sector - Equipment (Appliances, lighting, solar water heaters, flow water
heaters) - In this policy, GHG mitigation strategy is oriented to satisfy energetic needs
of existing buildings of RCI (Residential, Commercial, Institutional) sectors by replacing
high-energy-demanding technologies (electricity and gas) with more efficient ones. This
policy specifically promotes the following measures:
o Use of solar energy through installation of solar water heaters in households, thus
reducing consumption of liquefied petroleum gas (LPG), natural gas (NG) or
electricity for water heating purposes.
o Use of flow water heaters, with the purpose of reducing the use of LPG and NG.
o Acquisition of energy efficient appliances.
o Replacement of incandescent bulbs for efficient lighting systems: halogen,
compact-fluorescent (LFC) and light-emitting diode lamps (LED).
o Replacement of standard air-conditioning equipment for more energy efficient
thermal conditioning equipment (e.g. mini-split inverter).
RCII-4. Stimulating energy efficiency in the industrial sector with energy efficient
equipment and industrial process improvements - The Special Climate Change
Program (PECC, 2014) anticipates that for 2020, the industrial sector will be the third
GHG emission generator at a national level. The main polluting sources of this sector
come from the consumption of fossil fuels during manufacturing processes, especially in
the iron, steel and cement industries. Due to the presence of heavy industry in the
economy of Coahuila (including cement production and iron & steel industries) and
relatively high carbon content electricity production, the Industrial sector in the State
generates about 29% of the total GHG emissions. The purpose of this policy is to
implement regulations and incentives to decrease potential global warming through
greater energy efficiency of the industrial sector, through improvements in operation
processes, replacement and acquisition of low-energy consuming machinery and
equipment, as well as replacement of high-energy demanding technologies for industrial
operation (electricity and gas) for more efficient technologies (e.g. efficient motors,
sensors, controls and other electrical components, as well as efficient process-heat and
water-heating equipment).
TLU-1. Urban density index – Increase the urban density index (inhabitants/ hectare) of
the major metropolitan zones in the State. By 2035, the following increases in the urban
density index are targeted: Saltillo-Arteaga-Ramos Arizpe - 36%; La Laguna – 31%;
Monclova-Frontera – 25%; and Piedras Negras-Nava – 27%.
TLU-2. Sustainable urban mobility –Restructure the demand for the various modes of
transportation, that is, reduce the percentage of private passenger car use and increase the
relative participation in the use of mass public transportation, bicycling and walking.
Coahuila will join the national strategies that seek to design and implement a policy of
sustainable mobility for cities of 500,000 or more inhabitants, which aim to promote key
transportation projects that exhibit transit travel time reduction, socio-economic
profitability and improved environmental impact
TLU-3. Energy efficient government fleet - Increase participation of hybrid, pluggable
hybrid and electric vehicles in the State and local government fleet. This policy seeks to:
provide individuals who acquire them, tax incentives upon purchase and possession (e.g.
value added tax exemption) as well as special privileges for parking; support, together

ExS-10
with manufacturers of electric and hybrid cars with plants in the State, the development
of a network of charging stations.
AFOLU-1. Dairy cattle manure management - This policy proposes using manure
generated in the dairy farms of the state of Coahuila for the production of bio-fertilizer
and electricity, thus supporting the reduction in the use of fossil fuels in energy
generation. The focus will be in the Laguna Region, where under BAU conditions, it is
expected that only about 7% of dairy manure will be managed using anaerobic digestion
(AD) technologies that reduce methane emissions and produce renewable electricity.
Through implementation of this policy, 40% of dairy manure will be managed via
anaerobic digestion by 2025. The policy will target implementation of AD technology at
both large dairies (>1,500 head of cattle; 60% of targeted population) and medium-sized
dairies (500 – 1,500 head of cattle; 40% of targeted population).
AFOLU-2. Increase and maintenance of urban vegetation - Urban reforestation
includes complete restoration and maintenance of green areas with emphasis in rescuing
and preserving native species. This supports conservation and protection of the wide
genetic biodiversity in the State. Also, strategically-planted urban trees provide shade
and/or wind protection for buildings and thus can generate benefits in energy savings (in
CO, mostly lowering summer air conditioning costs). Additionally, urban trees capture
rain water, which reduces the amount of storm-water that ends up at water treatment
plants in areas with combined sewerage systems. The policy addresses incremental urban
tree plantings of 5,000 trees per year beginning in 2016 all the way through the planning
period of 2035. This results in a total expansion of the urban forest of the State of
100,000 trees (the equivalent of about 240 hectares of rural forest for the State). Further,
most of these new plantings (65%) will be strategically-sited to achieve energy savings
benefits.
AFOLU-3. Increase and conservation of vegetation in rural areas - Reforestation and
conservation of these forested lands promotes an increase in carbon dioxide sequestration
above the levels expected for the BAU landcover (e.g. grassland or brushland).
Additional benefits of reforestation include greater potential for the rescue of native
species, protection of biodiversity, and enhancement of water resources. Through
property acquisition or the establishment of conservation easements with property
owners, the goals of the policy are to reforest approximately 3,200 hectares per year
during the 20 year CO SCAP planning period (nearly 64,000 hectares total). Lands
targeted for conservation and reforestation will be at the rural-urban interface which will
indirectly influence more efficient land use and “smart growth”. Thus, this policy is
complementary to TLU-1 which seeks to achieve higher urban densities.
WM-1. Landfill methane utilization - This policy promotes the expansion of landfill
methane energy capture and utilization in the State. The policy expands the use of this
technology beyond BAU conditions which include the existing 1 mega-watt (MW)
methane collection and utilization project in Saltillo. Under the policy, the methane
collection and electricity generation capacity at Saltillo will be doubled to 2 MW by
2020. Also, by 2025, a 1 MW system will be constructed at the Torreon landfill. The
renewable electricity generated by methane from Coahuila’s landfills will be supplied to
the Federal Electricity Commission’s (CFE) public grid. Landfill gas capture and
utilization reduces direct CH4 emissions, and indirectly reduces fossil fuel use to produce

ExS-11
electricity for the public grid. It also generates local income and employment for landfill
operators.
WM-2. Water sanitation and reclamation for industrial processes and irrigation -
This policy promotes both an increase in the amount of wastewater (WW) collected for
centralized treatment, as well as increasing percentages of reclamation of wastewater for
industrial processes and irrigation of urban green areas and agricultural crops. The policy
will then: reduce the amount of GHG emissions and water pollution resulting from not
sanitizing wastewater under BAU conditions; reduce the amount of water consumed from
primary sources (e.g. surface or groundwater); and reduce the overall amount of energy
required for water use in industrial processes and irrigation purposes. Since the extension
of wastewater treatment collection and centralized treatment services will require an
increase in energy consumption as compared to BAU conditions, the policy will also
promote the application of renewable energy (photo-voltaic electricity generation) at
levels that will offset the increase in energy requirements (because of the expansion of
centralized treatment services and the associated energy use, without this aspect of the
policy, there would not likely be a net GHG benefit). Usage of reclaimed water for urban
green areas allows savings in consumption of water from aquifers, at the same time that
green areas in cities are preserved (see AFOLU-2). Drinking water supplies for the
population are also conserved.
Summary of Micro-Economic Analysis Methodology and Results
After a policy design had been completed, the information from that design was used as the
initial starting points for micro-economic analysis. Changes brought on by policy impacts can
include energy production, reduction in consumption of energy or materials, change in natural
resource management, industrial process changes, and changes to other activities that relate to
GHG emissions.
Micro-economic analysis of each policy involves two main components: net GHG and energy
impacts; and net direct societal costs. Estimates are prepared for each year of the planning
period. For the CO SCAP, the planning period extends from the first year of implementation
(generally 2016) to 2035. For net GHG impacts, analysts quantify the business as usual (BAU)
GHG emissions for the activity targeted by the policy (e.g. fossil fuel use, electricity use, landfill
methane generation). Then, estimates are prepared for the same activity, but with the impacts
expected through implementation of the policy. The net GHG emissions are then determined for
each year by subtracting the BAU emissions from the policy scenario emissions (a negative
value indicates a net reduction in GHGs).
Net direct societal costs are estimated in a similar manner as are net GHG impacts. BAU costs
are estimated for the activities affected by the policy. Then, the costs for implementing the policy
are determined. These typically include initial investment costs (e.g. capital expenditures for new
facilities or equipment), operations and maintenance costs, energy costs, materials costs,
government subsidies, and other costs. Net costs are determined by subtracting BAU costs from
the policy scenario costs. Chapter 3 and Appendix B provide much additional detail in the
methods used to conduct micro-economic (direct impacts) analysis.
ExS-12
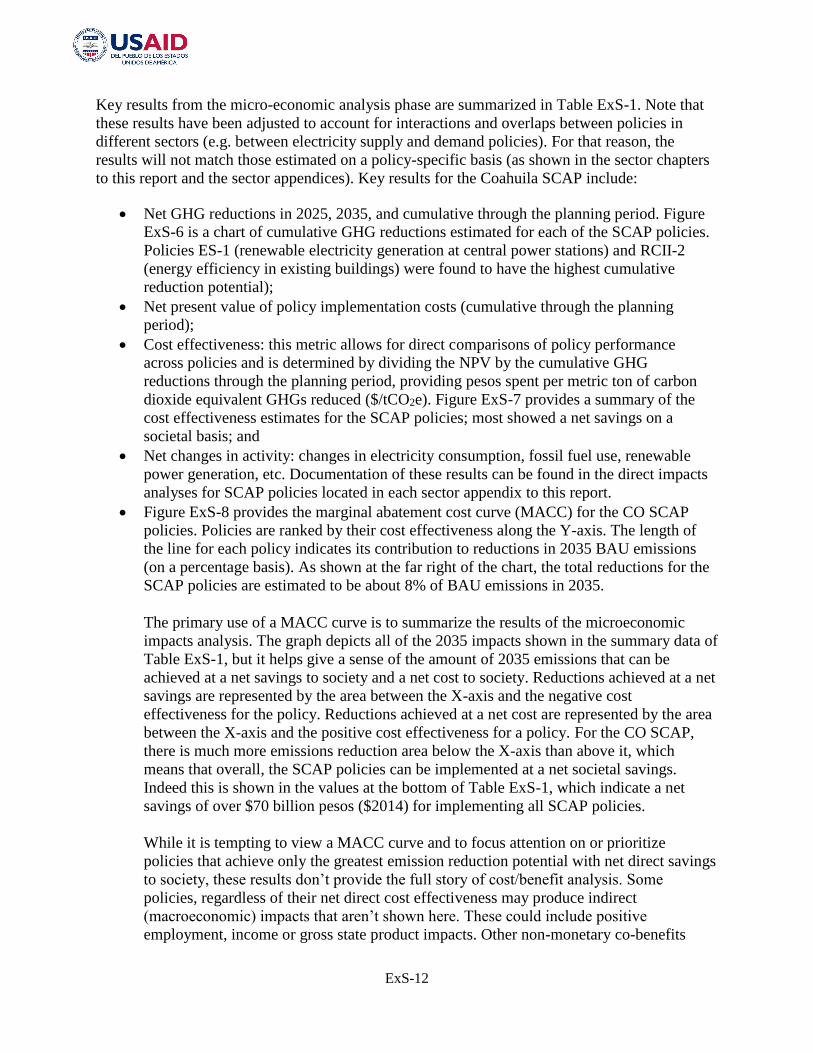
Key results from the micro-economic analysis phase are summarized in Table ExS-1. Note that
these results have been adjusted to account for interactions and overlaps between policies in
different sectors (e.g. between electricity supply and demand policies). For that reason, the
results will not match those estimated on a policy-specific basis (as shown in the sector chapters
to this report and the sector appendices). Key results for the Coahuila SCAP include:
Net GHG reductions in 2025, 2035, and cumulative through the planning period. Figure
ExS-6 is a chart of cumulative GHG reductions estimated for each of the SCAP policies.
Policies ES-1 (renewable electricity generation at central power stations) and RCII-2
(energy efficiency in existing buildings) were found to have the highest cumulative
reduction potential);
Net present value of policy implementation costs (cumulative through the planning
period);
Cost effectiveness: this metric allows for direct comparisons of policy performance
across policies and is determined by dividing the NPV by the cumulative GHG
reductions through the planning period, providing pesos spent per metric ton of carbon
dioxide equivalent GHGs reduced ($/tCO2e). Figure ExS-7 provides a summary of the
cost effectiveness estimates for the SCAP policies; most showed a net savings on a
societal basis; and
Net changes in activity: changes in electricity consumption, fossil fuel use, renewable
power generation, etc. Documentation of these results can be found in the direct impacts
analyses for SCAP policies located in each sector appendix to this report.
Figure ExS-8 provides the marginal abatement cost curve (MACC) for the CO SCAP
policies. Policies are ranked by their cost effectiveness along the Y-axis. The length of
the line for each policy indicates its contribution to reductions in 2035 BAU emissions
(on a percentage basis). As shown at the far right of the chart, the total reductions for the
SCAP policies are estimated to be about 8% of BAU emissions in 2035. The primary use of a MACC curve is to summarize the results of the microeconomic
impacts analysis. The graph depicts all of the 2035 impacts shown in the summary data of
Table ExS-1, but it helps give a sense of the amount of 2035 emissions that can be
achieved at a net savings to society and a net cost to society. Reductions achieved at a net
savings are represented by the area between the X-axis and the negative cost
effectiveness for the policy. Reductions achieved at a net cost are represented by the area
between the X-axis and the positive cost effectiveness for a policy. For the CO SCAP,
there is much more emissions reduction area below the X-axis than above it, which
means that overall, the SCAP policies can be implemented at a net societal savings.
Indeed this is shown in the values at the bottom of Table ExS-1, which indicate a net
savings of over $70 billion pesos ($2014) for implementing all SCAP policies.
While it is tempting to view a MACC curve and to focus attention on or prioritize
policies that achieve only the greatest emission reduction potential with net direct savings
to society, these results don’t provide the full story of cost/benefit analysis. Some
policies, regardless of their net direct cost effectiveness may produce indirect
(macroeconomic) impacts that aren’t shown here. These could include positive
employment, income or gross state product impacts. Other non-monetary co-benefits

ExS-13
could include improvements in air quality, water conservation, water quality, storm water
management, and quality of life (e.g. commute time, aesthetic improvements).

ExS-14
Table ExS-1. Summary of CO SCAP Micro-Economic Analysis of Policies and Results (Part 1)
Policy ID
Policy Name
2025 In-State
Annual Reductions (TgCO2e)
2035 In-State
Annual Reductions (TgCO2e)
Cumulative
In-State 2016-2035 (TgCO2e)
Cumulative
Total 2016-2035 (TgCO2e)
NPV Costs/ Savings
2016-2035 ($2014MM)
Cost Effectiveness
($2014/tCO2e)
ES-1. Electricity production through renewable energy technologies in Central Station Power Supply (0.92) (1.31) (18.5) (25) ($2,179) ($89)
ES-2. Photovoltaic energy in residential buildings (0.034) (0.054) (0.64) (0.82) ($304) ($369)
ES-3. Photovoltaic energy in public buildings (0.015) (0.021) (0.27) (0.35) ($124) ($352)
ES-4. Photovoltaic energy in commercial and industrial buildings (0.078) (0.15) (1.6) (2.1) ($983) ($458)
ES-5. Cogeneration in the industrial sector (0.12) (0.22) (2.4) (2.4) ($1,614) ($670)
Energy Supply Sector Totals (1.2) (1.8) (23) (30) ($5,203) ($172)
RCII-1. Building Codes and Standards (0.025) (0.049) (0.51) (0.65) ($855) ($1,311)
RCII-2.
Increasing energy efficiency in new construction - Equipment (Appliances, solar water heaters, flow water heaters). (0.014) (0.029) (0.29) (0.38) ($601) ($1,590)
RCII-3.
Increasing energy efficiency in existing construction, excluding industrial sector - Equipment (Appliances, lighting, solar water heaters, flow water heaters). (0.72) (1.2) (14) (18) ($21,262) ($1,206)
RCII-4. Energy Efficient Equipment and Processes in the Industrial Sector (0.18) (0.54) (4.3) (5.5) ($7,200) ($1,307)
Residential, Commercial, Industrial & Institutional Sector Totals (0.94) (1.8) (19) (24) ($29,918) ($1,238)
All values adjusted for intra- and inter-sector policy overlaps and interactions

ExS-15
Table ExS-1. Summary of CO SCAP Micro-Economic Analysis of Policies and Results (Part 2)
Policy ID
Policy Name
2025 In-State
Annual Reductions (TgCO2e)
2035 In-State
Annual Reductions (TgCO2e)
Cumulative In-State
2016-2035 (TgCO2e)
Cumulative Total
2016-2035 (TgCO2e)
NPV Costs/
Savings 2016-2035 ($2014MM)
Cost
Effectiveness ($2014/tCO2e)
TLU-1. Urban Density Index (0.068) (0.12) (1.3) (1.7) ($3,025) ($1,776)
TLU-2. Sustainable Urban Mobility (0.19) (0.35) (4.3) (5.6) ($30,201) $5,428
TLU-3. Energy Efficient Government Fleet (0.000051) (0.000088) (0.00095) (0.0012) $3.7 ($3,004)
Transportation & Land Use Sector Totals (0.26) (0.47) (5.6) (7.3) ($33,222) ($4,572)
AFOLU-1. Dairy Cattle Manure Management (0.026) (0.055) (0.74) (1.8) $285 $159
AFOLU-2. Urban Forestry (0.0024) (0.0066) (0.058) (0.061) $7.9 $130
AFOLU-3. Rural Forestry (0.042) (0.084) (0.88) (0.88) $115 $131
Agriculture, Forestry and Other Land Use Sector Totals (0.071) (0.15) (1.7) (2.7) $408 $150
WM-1. Landfill Methane Gas (0.13) (0.13) (2.1) (2.2) ($153) ($71)
WM-2. Water Sanitation and Reuse for Industrial Processes and Irrigation (0.037) (0.051) (0.76) (0.98) ($2,082) ($2,133)
Waste Management Sector Totals (0.17) (0.19) (2.9) (3.1) ($2,235) ($712)
Total Integrated Plan Results (2.6) (4.4) (53) (68) ($70,171) ($1,039) All values adjusted for intra- and inter-sector policy overlaps and interactions

ExS-16
Figure ExS-6. Cumulative GHG Reduction Potential by SCAP Policy
0
2
4
6
8
10G
HG
Re
du
ctio
ns
(Tg
CO
2e
)1825

ExS-17
Figure ExS-7. Cost Effectiveness of each SCAP Policy
$(5,428)
$3,004
($3,000)
($2,000)
($1,000)
$0
$1,000
$2,000
$3,000
Co
st E
ffe
ctiv
en
ess
($
20
14
/tC
O2e
)

ExS-18
Figure ExS-8. Marginal Abatement Cost Curve for the Coahuila SCAP
-$5,428
$3,004 TLU-2. Urban Mobility
WM-2. Water Sanitation & Reclamation
TLU-1: Urban Density Index
RCII-2. EE: New Construction
RCII-1. Building Codes & Standards
RCII-4: EE: Industrial Sector
RCII-3. EE: Existing Construction
ES-5. Cogeneration: Industrial Sector
ES-4. PV Energy: Com./Ind. Buildings ES-2. PV Energy: Residential Buildings
ES-3. PV Energy: Public Buildings
ES-1. Renewable Gen: Central Stations
WM.1. Landfill Gas Utilization
AFOLU-2. Urban Forestry
AFOLU-3. Rural Forestry
AFOLU-1. Dairy Manure Mgmnt.
TLU-3. Energy Efficient Gov. Fleet
0% 1% 2% 3% 4% 5% 6% 7% 8%
-$3,000
-$2,500
-$2,000
-$1,500
-$1,000
-$500
$0
$500
$1,000
$1,500
$2,000
Percentage Reduction of 2035 BAU GHG Emissions
Marg
inal C
ost
($/t
CO
2e
)

ExS-19
Key Findings and Recommendations
The PE, in consultation w/ the project Partners, developed the proposed priority policy
recommendations for detailed analysis in Phase 2. The Coahuila Climate Advisory Group (CAG)
endorsed these policies at their first meeting in July, 2015. These recommendations are presented
later in this summary and presented in more detail in the subsequent chapters and appendices.
They also determined that there would not be a policy recommendation for a proposed state
GHG reduction goal at this time. Some of the key results and highlights are:
As summarized above in Table ExS-1, there are 17 multi-sector policy recommendations
that were analyzed and which are included in this proposed SCAP;
As shown below in Table ExS-2, these policies were analyzed quantitatively and, if all
are implemented in a timely manner, are projected to result in a reduction of GHG
emissions in Coahuila of 4.4 TgCO2e in 2035 (8% of BAU forecasted emissions);
These policies are projected to have a net direct societal savings of over 70 billion pesos
($2014) cumulatively during the period of 2016 - 2035. The weighted-average cost-
effectiveness of these policies is expected to be -$1,039 ($2014/tCO2e);
During the course of the Phase 2 SCAP process, the CCS 2010 GHG Inventory and
Forecast was extended from 2025 to 2035 using simple trend analysis. These adjustments
were factored into the CAP baseline during the course of the quantification process for
the policy options (as a result, some minor differences in results as compared to those
shown in the original 2010 baseline provided in Appendix A should be expected). The
current GHG baseline indicates that the State’s net emissions will increase by over 80%
between 2010 and 2035 under business as usual conditions. Key sectors contributing to
this growth are ES (almost all of this from the power supply subsector), and Industry
(primarily, from the cement and iron & steel subsectors); and
An annual economy-wide GHG reduction of over 4 TgCO2e in 2035 seems like a
reasonable start towards GHG management in Coahuila (as compared to current
emissions levels of around 34 TgCO2e). However, due to expected steep emissions
growth, these reductions fail to bend the expected BAU emissions curve of the State. This
is shown graphically in Figure ExS-9 below. Additional work to update/refine the BAU
forecast is warranted, since in many cases, the emissions are forecasted using simple
techniques, including extrapolation of historic trends.7 However, strengthening of these
initial CAP policies and additions of others will certainly be needed in order to change
the future GHG trajectory in a more sustainable direction, as well as support Mexico to
meet any national commitments that come from the recent Paris Accord.
7 There have been recent discussions about whether one of the two coal plants in the State will be decommissioned.
This has not been factored in to the CO GHG baseline for this SCAP, and would have a significant impact on the
overall size of the State’s emissions pending an understanding of what types of generation would be used to make up
for the lost capacity.

ExS-20
Table ExS-2. Sector-level GHG Reductions for the CO SCAP
Net Emissions (TgCO2e)
1990 1995 2000 2005 2010 2015 2020 2025 2030 2035
Projected GHG Emissions 19 20 26 27 30 34 38 43 49 55
Reductions from Recent Actions 0.00 0.00 0.00 0.00 0.00 0.05 0.05 0.07 0.07 0.07
Projected GHG Emissions After Recent Actions 19 20 26 27 30 34 38 43 49 55
Plan Reductions: ES Sector 0.0 0.4 0.8 1.2 1.5 1.8
Projected Emissions with ES Policies 30 34 37 42 47 54
Plan Reductions: RCII Sector 0.0 0.3 0.6 0.9 1.4 1.8
Projected Emissions with ES/RCII Policies 30 34 37 41 46 52
Plan Reductions: TLU Sector 0.00 0.1 0.2 0.26 0.4 0.47
Projected Emissions with ES/RCII/TLU Policies 30 34 36 41 46 51
Plan Reductions: AFOLU Sector 0.0 0.0 0.0 0.07 0.1 0.15
Projected Emissions with ES/RCI/Industry/TLU/AFOLU Policies 30 34 36 41 46 51
Plan Reductions: WM Sector 0.00 0.1 0.1 0.17 0.2 0.19
Projected Emissions with All Policies 30 34 36 40 45 51
Total GHG Reductions from Plan Policies 0.0 0.9 1.7 2.6 3.5 4.4
Emissions After Quantified Plan Policies 19 20 26 27 30 33 36 40 45 51
Values in red are interpolated from micro-economic analysis results.
Figure ExS-9. Sector-level GHG Reductions for the CO SCAP
30
35
40
45
50
55
60
2010 2015 2020 2025 2030 2035
Tg C
O2e
BAU Emissions
After ES Policies
After RCII Policies
After TLU Policies
After AFOLUPolicies
After WMPolicies

ExS-21
Additional opportunities for reductions in the ES and RCII sectors are expected to be key
areas to begin bending the GHG emissions curve for Coahuila. A combination of
approaches addressing energy efficiency and renewable energy (both electricity and
fuels) will be needed, which could build off of this initial SCAP policy set. Other policies
should also be considered, including process input substitution in the cement and iron &
steel sectors. Additional mitigation opportunities in other sectors could also be explored,
especially in Transportation & Land Use. More details on the CO GHG emissions
baseline, SCAP policies, and the direct impacts analysis can be found in Chapters 2
through 9 of the report.
Following completion of the Phase 2 SCAP Report, several of the 17 policies analyzed
will receive a more detailed assessment to formulate specific implementation strategies,
including financing options, in a follow-up initiative by the Partners. For the balance of
policies, SEMA will be responsible for determining how to prioritize, finance and
promote their implementation.
Mexico’s Intentional Nationally-Determined Contribution (INDC) to the United Nations
Framework Convention on Climate Change (UNFCCC) includes an unconditional commitment
to reduce BAU GHG and black carbon (BC) emissions by 25% by 2030.8 This commitment
implies a 22% GHG reduction and a 51% BC reduction. The INDC is consistent with Mexico’s
intent to reduce GHG emissions by 50% by 2050 relative to a year 2000 baseline.
At the December 2015 Paris climate conference (COP21), 195 countries agreed that GHG
mitigation should reduce the expected increase in globally-averaged temperature to well below 2
degrees Celsius (ºC) and to aim for an increase of not more than 1.5 ºC, since this would
significantly reduce the risks and impacts of climate change.9 Collectively to date, the INDCs
submitted by all nations are not expected to keep temperature rise below the 2 ºC threshold.
Significant GHG reductions will be needed from each of Mexico’s states in order for the nation
to achieve its intended reduction targets. The carbon intensity charts provided in Chapter 2
(Figures 2-4 and 2-5) indicate that Coahuila’s emissions intensities (both per capita and per unit
of GDP) are higher than the nation as a whole. This implies that emission reductions in Coahuila
may need to be higher than for other states so that national commitments are met. Within this
context, this initial SCAP for Coahuila sets the stage for future development of additional
mitigation policies and potential strengthening of the policies adopted in this plan.
8
http://www4.unfccc.int/submissions/INDC/Published%20Documents/Mexico/1/MEXICO%20INDC%2003.30.2015
.pdf. (Mexico indicates that the commitments are subject to support from developed countries). 9 European Commission: http://ec.europa.eu/clima/policies/international/negotiations/future/index_en.htm.

1-1
Chapter 1 Background
Summary of Coahuila State Climate Action Plan – Phase 1
In June 2010 with funding from the Border Environment Cooperation Commission (BECC) the
Center for Climate Strategies (CCS) completed an Inventory and Forecast (I&F) of Greenhouse
Gas emissions in the state of Coahuila and several other northern border states of Mexico.
Findings of this report are summarized in Chapter 2.
Following the I&F report, the State of Coahuila Secretary of Environmental Protection
[Secretaria del Medio Ambiente (SEMA)] convened Phase 1 of the State Climate Action Plan
(SCAP) process for Coahuila. The Secretary of SEMA formed the Coahuila Climate Advisory
Group (CAG) to help guide the Phase 1 CAP process. A key objective of the Phase 1 process
was to identify a broad range of potential state climate actions and to narrow that broad list into a
set of high priority potential state GHG reduction policy actions for further detailed analysis in
Phase 2.
The objectives for the Coahuila Phase 2 SCAP process were established in the Scope of Work
(SOW) for CCS by BECC and the MLED Program at the outset of the process and are
summarized in Chapter 3. The essence of the objectives was to develop a SCAP for Coahuila and
to enhance State capacity in climate planning and analysis through a “learn by doing” approach
directed by CCS. The multi-phase approach to developing the SCAP follows CCS’ step-wise
approach to action planning showed in Figure 1-1 below. This step-wise process and the
analytical toolkit that supports its implementation are described in more detail in Chapter 3.
Through Phase 1 of the project, Steps 1 through 4 had been completed which included a GHG
baseline and a set of priority policies for inclusion in the CO SCAP. Phase 2 initiated work on
Step 5 and included the work through Step 9 to develop this final report on the SCAP.10 Work is
now underway on Step 10 which will involve the development of detailed implementation plans
for the first set of SCAP policies.
Initial meetings of the CAG were held in 2011. CCS assisted the CAG and SEMA in developing
the Coahuila Catalogs of Potential State Climate Action Policies.11 They contained 337 potential
policies for consideration in Coahuila. The CAG then set about the process of prioritizing the
policies for potential further detailed analysis in a Phase 2 climate planning process, to come
later. A total of 56 policies were selected by the CAG for further analysis.
The 10-Step Planning Process is supported by an Analytical Toolkit depicted in Figure 1-2
below. Components 1 (Baseline Tools) and 2 (Policy Catalogs) were developed and reviewed
during Phase 1 of the SCAP development process. Component 3 (Policy Screening & Selection)
10 Note that a macroeconomic analysis of CO GHG mitigation policies was not included in this SCAP. 11 “Catalogo De Politicas Publicas Para La Mitigacion Del Cambio Climatico” - Febrero 2011.

1-2
began during Phase 1 with the selection of the initial list of 56 priority policies for consideration.
Phase 2 of the SCAP process began with a further refinement of the policy priorities to focus on
17 key policies for detailed analysis in Phase 2. The focus of the work in Component 4 (Policy
Design & GHG Target Setting) was on establishing initial policy designs and GHG reduction
goals for each policy.
Figure 1-1. Step-Wise Action Planning Approach
Once the Coahuila Climate Advisory Group endorsed the 17 policies the direct impacts analysis
using Component 5 of the Toolkit (Micro-Economic Analysis Workbooks) proceeded. This work
was conducted in a learning-by-doing approach using sector-level experts provided by CCS and
their PE counterparts. CCS then completed the direct impacts assessment work of integrating the
results across policies into a set of economy-wide results (described in Chapter 3 of this report).
That work, as well as the economy-wide baseline data, was all completed within the Toolkit’s
Synthesis Module.
Following the CAG meetings CCS and SEMA concluded the Phase 1 work in Coahuila by
presenting the Final Report on the Coahuila Phase 1 SCAP process.12 All of these priorities
developed during the course of Phase 1 in 2011 were reviewed and considered as the Phase 2
Coahuila CAP process commenced in 2015. Following completion of the Phase 2 Final Report,
CCS will team up with SEMA and the Partners on Step 10 of the planning process to conduct a
detailed assessment of several selected high priority policies to chart out a more detailed
implementation plan for these selected policies using the SCAP as a foundation.
12 Plan Estatal Contra el Cambio Climatico de Coahuila, Agosto 2011.
Step 1 Organization and Goals
Step 2 Baseline Development
Step 3 Policy Options Identification
Step 4 Policy Screening & Prioritization
Step 5 Initial Policy Option Design Specifications
Step 6 Direct (Micro) Impacts Assessment
Step 7 Policy Options Integration and Overlap
Step 8 Indirect (Macro) Impacts Assessment
Step 9 Final Recommendations & Report Transmittal
Step 10 Monitoring, Reporting, Evaluation, & Updating

1-3
Figure 1-2. Action Planning Analytical Toolkit
ES – Energy Supply
RCI – Residential, Commercial & Institutional I – Industry
T – Transportation
TLU – Transportation & Land Use
AFOLU – Agriculture, Forestry & Other Land Use
WM - Waste Management
Synthesis Module:
GHG Reductions, Direct Costs, MACC, Comparison to Plan
Targets
1. Baseline Tools:
ES, RCI, I, T, AFOLU, WM
2. Policy Catalogs:
ES, RCI, I, TLU, AFOLU, WM
3. Policy Screening &
Selection
4. Policy Design &
GHG Target Setting
5. Micro-Economic Analysis
Workbooks:
ES, RCI, I, TLU, AFOLU, WM
6. Economy-Wide
Integration

2-1
Chapter 2 Inventory and Forecast (I&F) of GHG Emissions
2.1 GHG I&F Overview
The inventory and business as usual (BAU) forecast (or “baseline”) of GHG emissions was
constructed primarily from the 2010 GHG I&F prepared by CCS.13 As summarized in Figure 2-1
below, the baseline is economy-wide and includes annual emissions data for all sectors.
All sectors of Coahuila’s economy were addressed in the baseline (see the materials provided in
Appendix A for more details). These follow the common categorization used in national GHG
reporting:
Energy Supply (ES): for CO, this mainly addresses the Power Supply (PS) subsector;
all emissions estimates for the PS subsector shown here and used for SCAP analysis
purposes are provided on a consumption basis, rather than a direct (production) basis.
This means that only emissions associated with electricity consumed within the State
are included. Coahuila is a net exporter of power. Emissions associated with these
power exports are not included in the consumption-based estimates.
Residential, Commercial & Institutional (RCI): this covers emissions from fuel
combustion in buildings in all three subsectors;
Industry (I); this sector includes emissions from fuel combustion for industrial
processes and buildings, as well as non-combustion emissions that occur from
industrial processes;
Transportation: most importantly fuel combustion in on-road vehicles, but also
including air, rail and marine vessels;
Agriculture, Forestry & Other Land Use (AFOLU): the agricultural subsector covers
non-energy emissions associated with crop production and livestock management; the
forestry and other land use sector primarily covers carbon sequestration; due to data
limitations, emissions from fuel combustion in these sectors is included in the other
energy end use sectors above (most of this use is likely aggregated with the
Transportation sector); and
Waste Management (WM): this includes the solid waste management and wastewater
treatment subsectors; as with AFOLU, due to data limitations, emissions from fuel
combustion in these sectors is included in the other energy end use sectors above
(most of this use is likely aggregated with the Transportation sector).
13 Greenhouse Gas Emissions in Coahuila and Reference Case Projections 1990 – 2025, the Center for Climate
Strategies, June 2010. As discussed in further detail in a technical memorandum appended in Appendix A, the 2010
CCS baseline was extended to 2035. Therefore, the reader should expect some differences in the baseline values
shown in the body of this report as compared to the values shown in 2010 report provided in Appendix A.

2-2
Figure 2-1. Coahuila’s GHG Baseline
Sector
TgCO2e
1990 1995 2000 2005 2010 2015 2020 2025 2030 2035
Energy Supply 4.8 5.7 8.9 8.9 10 12 12 14 16 19
Transportation 1.8 2.2 2.4 2.7 3.4 3.9 4.3 4.7 5.1 5.5
RCI 0.88 0.89 0.94 0.87 0.79 0.82 0.85 0.89 0.94 0.99
Industry 9.2 9.9 13 13 14 16 19 21 24 27
AFOLU 1.5 1.2 0.79 0.93 1.1 1.3 1.4 1.6 1.8 2.0
Waste Management 0.45 0.50 0.54 0.59 0.64 0.69 0.73 0.77 0.82 0.87
TOTAL NET Emissions
19 20 26 27 30 34 38 43 49 55
The baseline estimates are presented in units of teragrams (Tg) of carbon dioxide equivalent
(CO2e) emissions (1 Tg is equal to 1 million metric tons). These estimates include all GHG
emissions within each sector and put them in common units based on their global warming
potential (GWP). For this study, GWP’s from the IPCC’s Second Assessment Report (SAR)
were used. As noted below, emissions for all GHGs required for national reporting by the
Intergovernmental Panel on Climate Change (IPCC) were addressed; however, sources for all
GHGs were not identified in Coahuila:
0
10
20
30
40
50
60
1990 1995 2000 2005 2010 2015 2020 2025 2030 2035
Tg
CO
2e
Energy Supply Transportation RCI Industry AFOLU Waste Management
3,462

2-3
Carbon dioxide (CO2);
Methane (CH4);
Nitrous oxide (N2O);
Hydrofluorocarbons (HFC);
Sulfur hexafluoride (SF6);14
Perfluorocarbons (PFC);15
Nitrogen trifluoride (NF3).16
2.2 Additional GHG Baseline Details
Data to support historical (inventory) estimates varied by sector; however, data were generally
available through 2008 when the baseline was originally constructed. Figure 2-2 below provides
a summary of the contribution of each gas to the total 2005 GHG emissions for CO. As shown,
CO2 is the dominant GHG contributing over 90% of the total emissions on a CO2e-weighted
basis. The chart also shows contributions of each gas from fuel combustion or non-combustion
sources. Fuel combustion emissions tend to dominate GHG baselines in most jurisdictions.
While these are also the majority in Coahuila (56%), non-fuel combustion emissions
contributions from industrial processes are key contributors (iron & steel, cement, and use of
carbonates).
Figure 2-2. 2005 Combustion and Non-Combustion Emissions by GHG
14 Although emissions would be expected to occur from electrical systems equipment that use this compound as an
insulator, no data were identified to generate emissions estimates. 15 No emissions sources were identified: e.g. electronics manufacturing that would use this compound as a cleaning
agent. 16 Same as for PFC above.
0 5 10 15 20 25
Carbon Dioxide
Methane
Hydrofluorocarbons
Nitrous Oxide
Nitrogen Trifluoride
Perfluorocarbons
Sulfur Hexafluoride
Fuel Combustion Other Sources
TgCO2e
56%44%
Percent of Total GHG Emissions
91%
5.7%
0.39%
2.6%
0.00%
0.00% Other Sources (12 Tg)
Fuel Combustion (15 Tg)
0.00%

2-4
SF6 emissions are not included for Coahuila due to data availability during the original
construction of the baseline; although some small level of emissions is expected within the
power supply subsector (it is used as an insulator within electrical equipment). Emissions of
PFCs and NF3 may also occur in small quantities (e.g. the electronics industry).
As shown in the chart and supporting table of Figure 2-1, as well as Figure 2-3 below, emissions
are expected to more than double from the year 2005 to the end of the planning period in 2035.
The emissions are shown on a “net” basis, meaning that carbon sinks have been subtracted from
the overall emissions totals (these carbon sinks occur in the AFOLU and WM sectors).17 As
indicated in the results shown in Figure 2-3, the ES and Industry sectors are expected to
contribute to most of the emissions growth in Coahuila during the forecast period. In fact,
emissions from both of these sectors are expected to double between the years 2005 and 2035.18
Figure 2-3. Coahuila’s Net GHG Baseline by Sector
Note: within Energy Supply, Power Supply emissions are shown on a consumption-basis (excluding emissions from net power exports).
Figures 2-4 and 2-5 provide emissions intensities on a per capita basis and per unit of economic
output basis, respectively. Due to a relatively low population and the presence of heavy industry
in the State, Coahuila’s carbon intensity is higher than the forecasted national carbon intensity
and is expected to remain higher on a per capita basis (note that these carbon intensity charts
exclude emissions associated with power exports). Carbon intensities are expected to increase
17 Note that since carbon sinks in CO are relatively small, GHG emissions presented on a net basis are similar to
those shown on a gross basis (i.e. sources only). 18 There have been recent discussions by the national government about the potential closure of one of the State’s 2
coal-fired power plants. This would have a significant impact on forecasted emissions; however, no changes to the
operation of these plants has been considered in this GHG baseline.
0
10
20
30
40
50
60
1990 1995 2000 2005 2010 2015 2020 2025 2030 2035
TgC
O2e
WasteManagement
AFOLU
Industry
RCI
Transportation
Energy Supply

2-5
sharply during the forecast period as economic output (and expected average personal income)
increase leading to higher levels of energy consumption. Since Coahuila has relatively low rates
of carbon sequestration, the State per capita carbon intensity is about the same whether measured
on a net or gross basis.
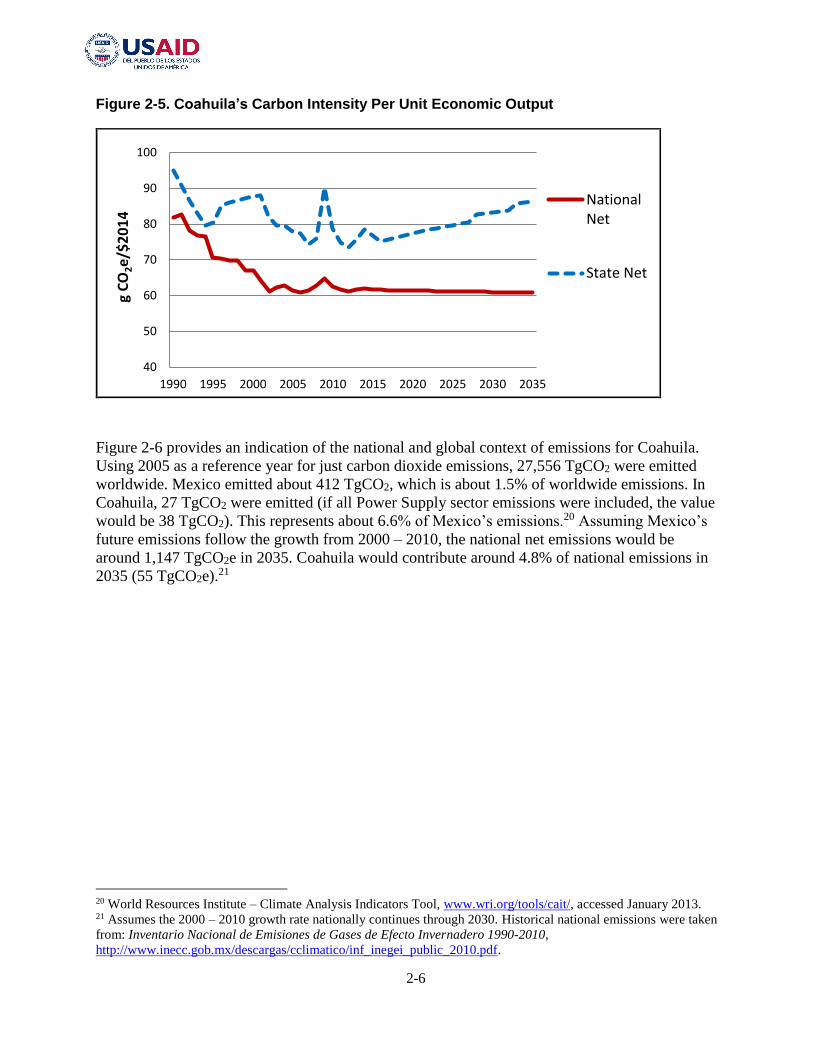
On an economic output basis, Coahuila’s carbon intensity is expected to continue to grow while
that of the nation is expected to decline slightly during the forecast period. It’s important to note
that these carbon intensities are currently based on a simple extrapolation of the most recent 10
years of gross state/national product estimates,19 not any sophisticated modeling of future
economic activity.
Figure 2-4. Coahuila’s Carbon Intensity Per Capita
19 State and national annual economic output data for 2003-2013 were available from INEGI:
http://www.inegi.org.mx/est/contenidos/proyectos/cn/pibe/.
0.0
2.0
4.0
6.0
8.0
10.0
12.0
14.0
16.0
18.0
1990 1995 2000 2005 2010 2015 2020 2025 2030 2035
t C
O2e/
cap
ita
State Gross
State Net
NationalNet
2-6
Figure 2-5. Coahuila’s Carbon Intensity Per Unit Economic Output
Figure 2-6 provides an indication of the national and global context of emissions for Coahuila.
Using 2005 as a reference year for just carbon dioxide emissions, 27,556 TgCO2 were emitted
worldwide. Mexico emitted about 412 TgCO2, which is about 1.5% of worldwide emissions. In
Coahuila, 27 TgCO2 were emitted (if all Power Supply sector emissions were included, the value
would be 38 TgCO2). This represents about 6.6% of Mexico’s emissions.20 Assuming Mexico’s
future emissions follow the growth from 2000 – 2010, the national net emissions would be
around 1,147 TgCO2e in 2035. Coahuila would contribute around 4.8% of national emissions in
2035 (55 TgCO2e).21
20 World Resources Institute – Climate Analysis Indicators Tool, www.wri.org/tools/cait/, accessed January 2013. 21 Assumes the 2000 – 2010 growth rate nationally continues through 2030. Historical national emissions were taken
from: Inventario Nacional de Emisiones de Gases de Efecto Invernadero 1990-2010,
http://www.inecc.gob.mx/descargas/cclimatico/inf_inegei_public_2010.pdf.
40
50
60
70
80
90
100
1990 1995 2000 2005 2010 2015 2020 2025 2030 2035
g C
O2e/
$2
01
4
NationalNet
State Net
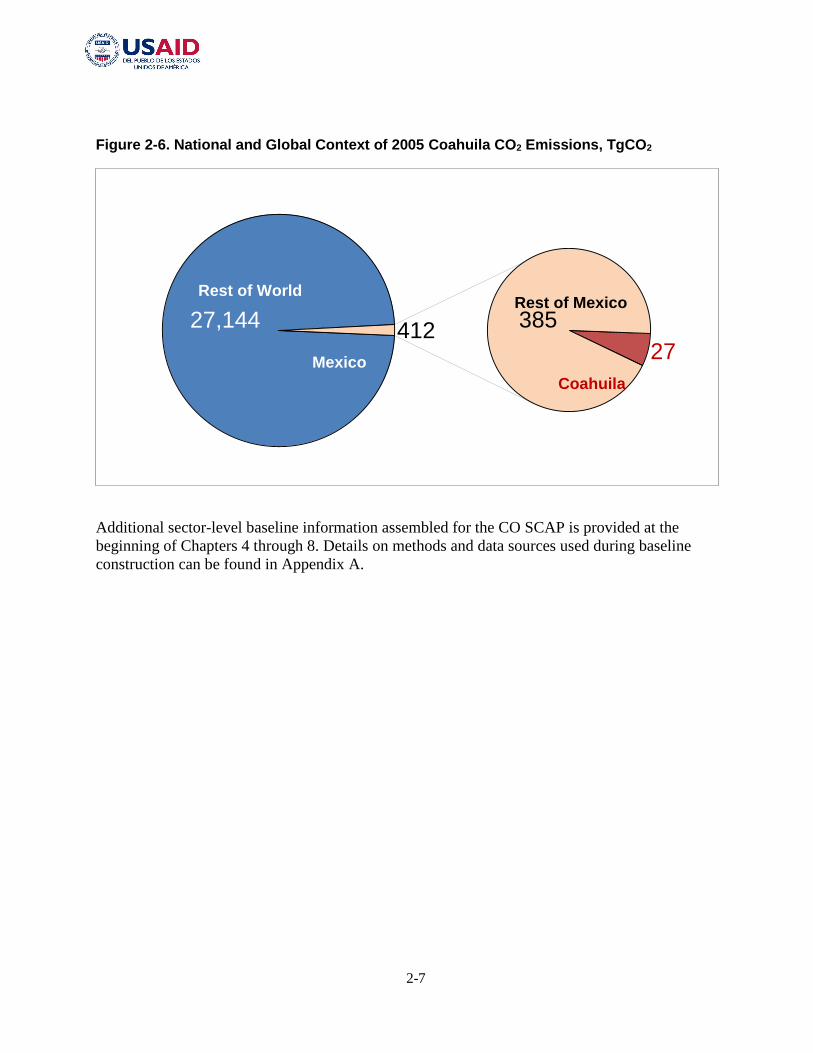
2-7
Figure 2-6. National and Global Context of 2005 Coahuila CO2 Emissions, TgCO2
Additional sector-level baseline information assembled for the CO SCAP is provided at the
beginning of Chapters 4 through 8. Details on methods and data sources used during baseline
construction can be found in Appendix A.
27,144
27
385412
Rest of World
Mexico
Rest of Mexico
Coahuila

3-1
Chapter 3 Coahuila State Climate Action Plan – Phase 2
3.1 Background and Objectives of the Phase 2 Process
Since 2009, the Border Environment Cooperation Commission (BECC) has been supporting the
border region on climate change related issues. During 2009-10, the Center for Climate
Strategies (CCS) collaborated with experts and institutions in the six Mexican border-states in
the development of greenhouse gas emissions inventories (initial year 1990) and forecasts to
2025 for Coahuila and the other border-states. These activities by CCS were carried out within a
framework of collaboration between BECC and the US Environmental Protection Agency
(EPA), and in coordination with Mexico’s National Institute of Ecology and Climate Change
(INECC).
In 2010 - 2011, BECC sponsored CCS in working with the states of Baja California, Sonora and
Coahuila in developing Phase 1 CAPs for each state. The Phase 1 State Climate Action Plan
(SCAP) process for Coahuila was described in Chapter 1. A key objective of the Phase 1 process
was to identify a list of high priority State GHG reduction policy options for further detailed
analysis in Phase 2. Selection of these priority policy options in the Phase 1 process in each State
was designed to set the stage for the detailed policy design and technical analysis to be
conducted in Phase 2.
For the Coahuila Phase 2 effort, the following objectives were agreed upon:
Enhance State capacity to conduct climate planning and analysis through a “learn by doing”
approach directed by CCS that includes policy design and direct impacts analysis (GHG
reductions and net societal costs) of mitigation policy options.
Develop an initial Coahuila SCAP which includes design and micro-economic level analysis
(direct GHG reductions and net societal costs/ savings) that can be used to commence the
State’s GHG mitigation efforts by targeting the 17 climate mitigation policies selected for
initial detailed analysis during Phase 1, recognizing that additional measures or stronger
versions of the initial measures will likely be needed over time. Now, with the Paris Accord
in place, the level of ambition for emissions reduction in both developed and developing
countries has become more widely known and accepted. Pursuit of Mexico’s contributions to
this global effort will require significant efforts by State governments. While State target
setting was not part of the Phase 2 effort, Coahuila is now positioned to assess its part in
achieving the global and national GHG reductions necessary to support the levels anticipated
in the recent Paris Accord.
Prepare a draft and final report of the Coahuila SCAP.

3-2
3.2 Participating Institutions
BECC financed and sponsored the Phase 1 level work in the three States described above. BECC
then teamed up with the U.S. Agency for International Development (USAID)/ Mexico Low
Emissions Development (MLED) Program to help finance and sponsor the Phase 2 process in
two States, Baja California and Coahuila. BECC and the MLED Program then engaged CCS to
assist in facilitating, training and providing technical support for the Phase 2 process. For the
Phase 2 Coahuila SCAP process, the following entities have joined together as Partners in this
collaborative effort:
The Secretaria de Medio Ambiente (SEMA) is the state environmental agency for the State
of Coahuila for whom the SCAP has been prepared;
The Border Environment Cooperation Commission (BECC) is a sponsoring organization
which provided significant funding for the project;
The USAID MLED Program is a second sponsoring organization which provided significant
funding for the effort;
The Center for Climate Strategies (CCS) is a non-profit entity that was contracted by BECC
and the MLED Program to perform technical, facilitative and project management services in
developing the Coahuila SCAP.
3.3 Panel of Experts - Members and CCS Training
One of the primary objectives of the Coahuila SCAP process was to help build State capacity in
the climate action planning process and in technical analysis associated with micro-economic
(direct) impacts analysis of GHG mitigation strategies. To this end, a local Panel of Experts (PE)
was formulated at the outset of the SCAP process. The capacity building process was designed
from the outset to be a learn-by-doing effort in which CCS trained the PE in policy design,
technical analysis, and other foundational topics, as needed (e.g. GHG baseline construction),
and then shared the workload of actually conducting the technical analysis of the selected policy
recommendations. Following is a list of the Members of the PE and their affiliations. Also
presented is a brief summary of the training initiatives provided to the PE by the CCS Team.
Members of the Coahuila Panel of Experts:
Dr. Alejandro Dávila, Universidad Autónoma de Coahuila, Local Coordinator and
Transportation and Land Use Sector
Dr. Miriam Valdés Ibarra, Universidad Autónoma de Coahuila, Energy Supply and
Residential, Commercial, Institutional and Industrial Sectors
Dr. Antonio Escamilla Díaz, Universidad Autónoma de Coahuila, Agriculture, Forestry
and Other Land Use, and Waste Management Sectors

3-3
CCS Training of the Panel of Experts:
CCS provided two in-person training sessions for the members of the PE and Partners
representatives. Following is a short summary of each of the training sessions:
Mitigation Policy Design Workshop: Four members of the CCS Team travelled to Saltillo to
provide the first training session in May 2015. The focus of this workshop was to provide
training to the Panel of Experts and other invited participants in the CCS step-wise SCAP
planning process. This included training in the development of the Policy Description, Policy
Design, Implementation Mechanisms, Related Policies and Programs in Place elements of
the Policy Option Template, as well as training in development of Causal Chains for each
policy option. This training session was designed to equip the PE members with the basic
understanding needed to develop the first half of the Policy Option Template for each policy
prior to embarking on the analytical process for the policies.
Climate Mitigation Policy Micro-Economic Analysis Workshop: Four members of the CCS
Team travelled to Saltillo for this training session that was held in July 2015. The focus of
this session was to provide detailed instruction in the micro-economic (direct impacts)
analysis of the policy options in each sector. Sessions addressed the Quantification Memo
(focusing on quantification of the net costs and GHG effects of micro-economic policy
impacts), Common Assumptions, formulation of Excel workbooks, the Data sources,
assumptions and methodology needs, exporting of results for macro-economic analysis, and
the data exports for inter-sector overlaps/integration analysis. It also included discussions
about the roles, assignments, division of labor and schedules for completion of tasks between
CCS and the PE.
In addition to the formal training sessions above, the CCS Sector leads spent extensive additional
time on phone calls working with their PE colleagues to train them in the details of policy
design, the micro analysis process including the development of Excel workbooks, and the
development of Policy Option templates for each policy, as well as coaching them and in
reviewing and commenting on the actual work of the PE members on individual policies.
3.4 Advisory Group and Technical Work Groups
Advisory Group
At the outset of the Phase 2 SCAP process SEMA formed an Advisory Group (AG) which was
responsible for participating as stakeholders in the process, and for reviewing and approving the
design of the policy options and the results of the analyses prepared by the PE and CCS. The AG
consists of 25 members which are specialists in climate change and in the various sectors. The
members come from the government, business, academia and civil society sectors. The AG
Members are listed in Chapter 1.
The first official meeting of the AG was held on July 15, 2015 to endorse the selection and
design of the highest priority policy options recommended by the Panel of Experts. The second
AG meeting was held on December 1, 2015 to endorse the full Policy Option Documents (PODs)
and the results of the micro-economic impact analysis of the policy options in each sector.

3-4
Technical Work Groups
At the outset of the Phase 2 SCAP process, five sector-based Technical Work Groups (TWGs)
were formed to help advise the AG and PE. They consisted of approximately 8 members each.
These individuals are knowledgeable persons regarding the social impacts of policies and are
specialists in their respective economic sectors. They are public officials of the three levels of
government, entrepreneurs, members of academia or of a civil society organization. The TWGs
held several meetings between the AG meetings and were consulted about the development of
the PODs for each sector and about the preliminary quantification results of the policies.
3.5 Overview of the Phase 2 Micro-Economic Analysis Methodology
Micro-economic (direct impacts) analysis addresses two main impacts for climate action
planning: net energy and GHG impacts; and net direct societal costs. CCS provided a “Principles
and Guidelines for Quantification of Policy Options” Technical Memorandum (see Appendix B)
to the PE that: outlined the overall approach for conducting the analysis of each policy, provided
examples of direct policy impacts that should be addressed, included example calculations of net
GHG and direct net societal costs, and established the following key planning metrics, concepts
and parameters:
Planning period: 2016 – 2035; although the initial year of implementation for any policy
might begin further into the future than 2016;
Net GHG reduction potential: expressed as teragrams (Tg; million metric tons) carbon
dioxide equivalent (CO2e) removed, including net effects of carbon sequestration or sinks,
measured as an incremental change against a forecasted business as usual (BAU) baseline;
where very small denominations of GHGs are involved use of metric tons (tCO2e);
Global warming potentials (GWPs): consistent with the GHG Baseline, 100-year GWPs for
each GHG from the IPCC Second Assessment Report;
Direct economic impacts: the two key analytical endpoints are cost effectiveness (expressed
as $/tCO2e removed); and net societal costs/savings, presented as the net present value (NPV)
of the stream of annualized costs/savings incurred to implement the policy over the planning
period; these analyses include avoided costs of policy options, such as energy savings and
avoided cost of investment in infrastructure or services from energy efficiency or other
measures;
Financial base year: 2014;
Discounting or time value of assets: 5 %/yr real and 7 %/yr nominal, applied to net flows of
costs or savings over the CO SCAP planning horizon (implementation year – 2035);
Full energy-cycle impacts22: for example, assessing embedded GHGs in the fuel supply, in
addition to those from fuel combustion (e.g. for gasoline, this includes the emissions
associated with petroleum extraction, processing and transport); and
Levelized costs: an averaging method for directly comparing the costs of one technology
against another.
22 Due to data limitations for Mexico, screening-level estimates were developed using upstream emission factors for
fuels based on US national data derived from the US Department of Energy Argonne National Labs GREET Model:
https://greet.es.anl.gov/.

3-5
See Appendix B for details. The appendix also discusses the difference between “stand-alone”
and integrated policy analysis results:
“Stand-Alone Results”- these results are quantified under the assumption that the policy is
the only one to be implemented, and the impacts are evaluated against business as usual
(BAU) conditions (e.g. as informed by the GHG Baseline);
Integrated Results – these separately address:
o Intra-sector integrated results: these results include adjustments to estimated GHG
reductions and costs in situations where policies within a sector overlap with one
another (e.g. a policy promoting energy efficient residential air conditioners and
another policy promoting improvements to residential building envelopes);
o Inter-sector integrated results: these results are adjusted for any interactions or
overlaps between policies in different sectors. The most common example here is for
electricity supply and demand policies. In a situation where the BAU electricity supply
system is significantly changed as a result of all supply and demand policies (e.g. the
carbon intensity of the marginal resource mix of the supply system has been lowered),
then the GHG impacts of the demand-side policies will need to be adjusted (in this
case, downward to account for the cleaner marginal resource mix). More is presented
on this topic specific to the CO SCAP later in this Chapter.
Figure 3-1 provides an example causal chain developed for one of the policies analyzed for the
SCAP (all policies are documented in the associated policy templates in Appendices C-G). The
causal chain identifies each of the intended and unintended policy impacts and the subsequent
energy and GHG impacts (green or red shaded boxes). The GHG impacts include those that were
quantified during micro-economic analysis (those with the star symbol).
In this example, implementation of the policy will: increase the installed capacity of renewable
generation resources (wind and solar photo-voltaic) at central power stations above BAU
conditions (first stage); this will result in an increase in renewable power generation in the
second stage as compared to BAU (second stage); as a result, there will be decrease (an offset) of
power generation required from fossil-based power plants (third stage). In the fourth stage,
emission reductions would occur at the fossil-based plants due to the generation offset (a direct
decrease in emissions, as it will occur at the point of combustion). Separately, due to the lower
fuel demands for fossil power plants (also in the fourth stage), there are additional indirect
reductions for the upstream fuel supply (e.g. coal, petroleum and natural gas extraction,
processing, and shipping/transmission).
An unintended consequence of the policy shown in the second series of links in the chain begins
in Stage 2. Indirectly, an emissions increase would occur during manufacturing and installation
of the renewable generation resources (although this increase may occur outside of Coahuila).
Also shown at the bottom of the fourth stage is another unintended impact of the policy. This
indicates that emissions would occur during decommissioning of both fossil fuel power plants
(potentially earlier than under BAU conditions) and for the new renewable resources targeted by
the policy (e.g. photo-voltaic panels or wind turbines and associated electrical equipment).
Depending on the size of the emissions impacts between decommissioning conventional plants
and new renewables, the resulting net GHG impact could be positive or negative. Impacts

3-6
without a star symbol are expected to be relatively small and/or temporary, and so were not
included in the direct impacts analysis.
Figure 3-1. Causal Chain of GHG Reductions for a Renewable Energy Policy
3.6 Summary of CO SCAP Micro-Economic Analysis Results
Table 3-1 below provides a summary of the micro-economic analysis for all SCAP policies.
These results have been adjusted for both intra- and inter-sector policy overlaps and interactions,
and for that reason, these results will not always match those shown for the policy-specific
analyses documented in Chapters 4 through 8. Intra-sector overlaps and interactions are those
that occur between policies in the same sector. Inter-sector overlaps and interactions occur
between policies in different sectors (see the respective sector chapters for details on overlaps
and interactions). Results for each policy include:
annual GHG reductions expected in 2025 and 2035;
2016 – 2035 cumulative in-State reductions;
2016 – 2035 total cumulative reductions;23
net present value (NPV) of direct societal costs or savings in million 2014 pesos;
cost effectiveness of the policy: calculated as the NPV divided by the total cumulative
GHG reductions.
Figure 3-2 and the associated tabular results below provide a summary of the SCAP policy
reductions by sector as compared to the GHG baseline. As shown in this chart, most of the
reductions are attributed to the ES and RCII sectors (about 79% of total cumulative GHG
23 For example, these include the upstream energy-cycle emissions that may not occur within the State’s boundaries.

3-7
reductions through 2035). TLU sector policies contribute about 11% of the total cumulative
GHG reductions through 2035. The AFOLU and WM sector policies are expected to contribute
another 10% in total cumulative GHG reductions through 2035. However, the expected GHG
reductions estimated for the SCAP policies are generally in line with the expected emission
contributions from each sector – combined, the Transportation, AFOLU and WM sectors are
expected to only contribute about 15% toward projected 2035 emissions.
The overall results shown in Figure 3-2 indicate that more work will be needed on GHG
mitigation in Coahuila before the expected emissions curve is flattened or pushed into a
downward trajectory (i.e. emissions are still far from peaking by 2035). Hence, more policies,
more stringent SCAP policies, or both will be needed.
Mexico’s Intentional Nationally-Determined Contribution (INDC) to the United Nations
Framework Convention on Climate Change (UNFCCC) includes an unconditional commitment
to reduce BAU GHG and black carbon (BC) emissions by 25% by 2030.24 This commitment
implies a 22% GHG reduction and a 51% BC reduction. The INDC is consistent with Mexico’s
intent to reduce GHG emissions by 50% by 2050 relative to a year 2000 baseline.
At the December 2015 Paris climate conference (COP21), 195 countries agreed that GHG
mitigation should reduce the expected increase in globally-averaged temperature to well below 2
degrees Celsius (ºC) and to aim for an increase of not more than 1.5 ºC, since this would
significantly reduce the risks and impacts of climate change.25 Collectively to date, the INDCs
submitted by all nations are not expected to keep temperature rise below the 2 ºC threshold.
Significant GHG reductions will be needed from each of Mexico’s states in order for the nation
to achieve its intended reduction targets. The carbon intensity charts provided in Chapter 2
(Figures 2-4 and 2-5) indicate that Coahuila’s emissions intensities (both per capita and per unit
of GDP) are higher than the nation as a whole. This implies that emission reductions in Coahuila
may need to be higher than for other states so that national commitments are met. Within this
context, this initial SCAP for Coahuila sets the stage for future development of additional
mitigation policies and potential strengthening of the policies adopted in this plan.
24
http://www4.unfccc.int/submissions/INDC/Published%20Documents/Mexico/1/MEXICO%20INDC%2003.30.2015
.pdf. (Mexico indicates that the commitments are subject to support from developed countries). 25 European Commission: http://ec.europa.eu/clima/policies/international/negotiations/future/index_en.htm.

3-8
Table 3-1. Summary of CO SCAP Micro-Economic Analysis of Policies and Results (Part 1)
Policy ID
Policy Name
2025 In-State
Annual
Reductions (TgCO2e)
2035 In-State
Annual
Reductions (TgCO2e)
Cumulative In-State
2016-2035 (TgCO2e)
Cumulative Total
2016-2035 (TgCO2e)
NPV Costs/ Savings
2016-2035 ($2014MM)
Cost Effectiveness
($2014/tCO2e)
ES-1.
Electricity production through renewable energy technologies (photovoltaic panels, wind generators) in Central Station Power Supply (0.92) (1.31) (18.5) (25) ($2,179) ($89)
ES-2. Photovoltaic energy in residential buildings (0.034) (0.054) (0.64) (0.82) ($304) ($369)
ES-3. Photovoltaic energy in public buildings (0.015) (0.021) (0.27) (0.35) ($124) ($352)
ES-4. Photovoltaic energy in commercial and industrial buildings (0.078) (0.15) (1.6) (2.1) ($983) ($458)
ES-5. Cogeneration in the industrial sector (0.12) (0.22) (2.4) (2.4) ($1,614) ($670)
Energy Supply Sector Totals (1.2) (1.8) (23) (30) ($5,203) ($172)
RCII-1. Building Codes and Standards (0.025) (0.049) (0.51) (0.65) ($855) ($1,311)
RCII-2.
Increasing energy efficiency in new constructions- Equipment (Appliances, solar water heaters, flow water heaters). (0.014) (0.029) (0.29) (0.38) ($601) ($1,590)
RCII-3.
Increasing energy efficiency in existing constructions, excluding industrial sector - Equipment (Appliances, lighting, solar water heaters, flow water heaters). (0.72) (1.2) (14) (18) ($21,262) ($1,206)
RCII-4. Energy Efficient Equipment and Processes in the Industrial Sector (0.18) (0.54) (4.3) (5.5) ($7,200) ($1,307)
Residential, Commercial, Industrial & Institutional Sector Totals (0.94) (1.8) (19) (24) ($29,918) ($1,238)
All values adjusted for intra- and inter-sector policy overlaps and interactions

3-9
Table 3-1. Summary of CO SCAP Micro-Economic Analysis of Policies and Results (Part 2)
Policy
ID Policy Name
2025 In-State
Annual Reductions (TgCO2e)
2035 In-State
Annual Reductions (TgCO2e)
Cumulative In-State
2016-2035 (TgCO2e)
Cumulative Total
2016-2035 (TgCO2e)
NPV Costs/ Savings
2016-2035 ($2014MM)
Cost Effectiveness
($2014/tCO2e)
TLU-1. Urban Density Index (0.068) (0.12) (1.3) (1.7) ($3,025) ($1,776)
TLU-2. Sustainable Urban Mobility (0.19) (0.35) (4.3) (5.6) ($30,201) $5,428
TLU-3. Energy Efficient Government Fleet (0.000051) (0.000088) (0.00095) (0.0012) $3.7 ($3,004)
Transportation & Land Use Sector Totals (0.26) (0.47) (5.6) (7.3) ($33,222) ($4,572)
AFOLU-1. Dairy Cattle Manure Management (0.026) (0.055) (0.74) (1.8) $285 $159
AFOLU-2. Urban Forestry (0.0024) (0.0066) (0.058) (0.061) $7.9 $130
AFOLU-3. Rural Forestry (0.042) (0.084) (0.88) (0.88) $115 $131
Agriculture, Forestry and Other Land Use Sector Totals (0.071) (0.15) (1.7) (2.7) $408 $150
WM-1. Landfill Methane Gas (0.13) (0.13) (2.1) (2.2) ($153) ($71)
WM-2. Water Sanitation and Reuse for Industrial Processes and Irrigation (0.037) (0.051) (0.76) (0.98) ($2,082) ($2,133)
Waste Management Sector Totals (0.17) (0.19) (2.9) (3.1) ($2,235) ($712)
Total Integrated Plan Results (2.6) (4.4) (53) (68) ($70,171) ($1,039)
All values adjusted for intra- and inter-sector policy overlaps and interactions

3-10
Figure 3-2. Coahuila SCAP GHG Policy Reductions by Sector
Net Emissions (TgCO2e)
Emissions/ Emissions Reduction
1990 1995 2000 2005 2010 2015 2020 2025 2030 2035
Projected GHG Emissions
19 20 26 27 30 34 38 43 49 55
Reductions from Recent Actions
0.00 0.00 0.00 0.00 0.00 0.05 0.05 0.07 0.07 0.07
Projected GHG Emissions After Recent Actions
19 20 26 27 30 34 38 43 49 55
Plan Reductions: ES Sector
0.0 0.4 0.8 1.2 1.5 1.8
Projected Emissions with ES Policies
30 34 37 42 47 54
Plan Reductions: RCII Sector
0.0 0.3 0.6 0.9 1.4 1.8
Projected Emissions with ES/RCII Policies
30 34 37 41 46 52
Plan Reductions: TLU Sector
0.00 0.1 0.2 0.26 0.4 0.47
Projected Emissions with ES/RCII/Industry/TLU Policies
30 34 36 41 46 51
Plan Reductions: AFOLU Sector
0.0 0.0 0.0 0.07 0.1 0.15
Projected Emissions with ES/RCI/Industry/TLU/AF Policies
30 34 36 41 46 51
Plan Reductions: WM Sector
0.00 0.1 0.1 0.17 0.2 0.19
Projected Emissions with All Policies
30 34 36 40 45 51
Total GHG Reductions from Plan Policies
0.0 0.9 1.7 2.6 3.5 4.4
Emissions After Quantified Plan Policies
19 20 26 27 30 33 36 40 45 51
30
35
40
45
50
55
60
2010 2015 2020 2025 2030 2035
Tg C
O2e
BAU Emissions
After ESPolicies
After RCIIPolicies
After TLUPolicies
After AFOLUPolicies
After WMPolicies

3-11
Net Emissions (TgCO2e)
Emissions/ Emissions Reduction
1990 1995 2000 2005 2010 2015 2020 2025 2030 2035
Values in red are interpolated from micro-economic analysis results.
Figure 3-3 provides the marginal abatement cost curve (MACC) for the CO SCAP policies.
Policies are ranked by their cost effectiveness along the Y-axis. The length of the line for each
policy indicates its contribution to reductions in 2035 BAU emissions (on a percentage basis). As
shown at the far right of the chart, the total reductions for the SCAP policies are estimated to be
about 8% of BAU emissions in 2035. Nearly all of these reductions are expected to come from
policies that achieve a net savings in societal costs (all policies to the left of AFOLU-2 in Figure
3-3).

3-12
Figure 3-3. Marginal Abatement Cost Curve for the Coahuila SCAP
-$5,428
$3,004 TLU-2. Urban Mobility
WM-2. Water Sanitation & Reclamation
TLU-1: Urban Density Index
RCII-2. EE: New Construction
RCII-1. Building Codes & Standards
RCII-4: EE: Industrial Sector
RCII-3. EE: Existing Construction
ES-5. Cogeneration: Industrial Sector
ES-4. PV Energy: Com./Ind. Buildings ES-2. PV Energy: Residential Buildings
ES-3. PV Energy: Public Buildings
ES-1. Renewable Gen: Central Stations
WM.1. Landfill Gas Utilization
AFOLU-2. Urban Forestry
AFOLU-3. Rural Forestry
AFOLU-1. Dairy Manure Mgmnt.
TLU-3. Energy Efficient Gov. Fleet
0% 1% 2% 3% 4% 5% 6% 7% 8%
-$3,000
-$2,500
-$2,000
-$1,500
-$1,000
-$500
$0
$500
$1,000
$1,500
$2,000
Percentage Reduction of 2035 BAU GHG Emissions
Marg
inal C
ost
($
/tC
O2e
)

3-13
3.7 Details on the Assessment of Inter-Sector Overlaps and Interactions
The most common area for inter-sector overlaps or interactions to take place is between the
policies in the Energy Supply sector and any in the demand sectors (i.e. all other sectors, but
most commonly RCII). Overlaps occur when two different policies are impacting the same
energy consuming activity, and therefore are double-counting the potential emission reductions.
A common interaction between electricity supply and demand relates to the initial (BAU)
assumptions about the carbon intensity and cost of the marginal resource mix and whether those
assumptions remain valid after implementation of all supply and demand policies. This re-
assessment of the marginal resource mix is addressed in detail in the subsection below.
Inter-sector overlaps identified in the CO SCAP policies are:
ES-3 [Photovoltaic (PV) Energy in Public Buildings] and ES-4 (PV Energy in
Commercial and Industrial Buildings) overlaps with the energy efficiency policies RCII-1
through RCII-3: the policy goals for PV energy production in ES-3 and ES-4 were
specified in terms of % of electricity consumption; and implementation of RCII-1
through -3 will reduce future consumption. Therefore, the amount of PV energy required
for implementing ES-3 and ES-4 is reduced along with the potential GHG reductions and
costs. The level of overlap for ES-3 and the RCII policies was much higher than that for
ES-4. For ES-3, the level of overlap was estimated to range from 3% in 2016 to 28% in
2035. For ES-4, the level of overlap was estimated to range from 1% in 2021 to 4% in
2035.
AFOLU-2 addressing urban forestry includes the energy savings benefits, and the
associated GHG benefits and implementation costs. These energy impacts for building
shading and wind protection overlap with impacts from policies RCII-2 and -3 that
address energy efficiency in residential and commercial buildings (via new codes and
standards and increased appliance efficiencies). Therefore, there is a potential for overlap
of policy impacts in places where AFOLU-2 and one or both of the RCII policies are also
being implemented.
For RCII-1 (building codes), these will apply to new buildings and major renovations of
existing buildings. Also, the policy doesn’t get fully ramped up until between 2025 and
2030. As a result, the amount of overlap is likely small, so no adjustments were made to
address overlaps.
For RCII-2 addressing energy efficient appliances, it was assumed that the reductions in
building energy intensity to be achieved by the policy would also reduce the expected
benefits of building shading/wind protection achieved by AFOLU-2. To develop the
estimates of the level of overlap, it was assumed that 50% of building energy intensity
reductions would be achieved via more efficient air conditioning equipment installed
through implementation of RCII-2. After accounting for the proportion of Coahuila’s
population that resides in hot versus cool climates and the percentage of electricity use
devoted to air conditioning, a level of overlap could be calculated for the AFOLU-2
electricity benefit. That overlap ranged from 1% in 2016 to 16% in 2035 (the electricity

3-14
reduction benefit of AFOLU-2 was reduced by this amount in the adjusted results). The
results of this inter-sector adjustment were included in the overall estimates of CO SCAP
direct impacts.
Re-assessment of the Marginal Resource Mix of Electricity Supply
Typically, this can occur when the demand sector policies are achieving reductions in power
demand through energy efficiency (EE) or are adding renewable energy (RE) resources to the
grid (demand sectors are RCII, TLU, AFOLU and WM). The impacts and costs of all of the
power related policies (both supply and demand) that reduce expected future loads on the
electrical grid are measured against a defined BAU “marginal resource mix”. The marginal
resource mix refers to the portion of the total electricity supply system that would respond to
changes in reduced demand on the grid (as a result of EE or new RE additions). Typically, the
marginal resource mix excludes sources that are considered “must run” supply sources, like
nuclear plants (these can’t be easily turned on/off or up/down; or for other reasons, would not be
shut down). Renewable resources (wind, solar, hydro, geothermal) are also often excluded from
the marginal resource mix, since the fuel to run them is essentially free. Marginal resources are
otherwise expected to be those plants with the highest running costs.
An important concept to understanding “in-State” reductions for electricity supply/demand
related impacts is to first recall that the GHG baseline for the Power Supply (PS) subsector is
constructed on a consumption basis. This means that emissions and emission reductions are
attributed to the point of electricity consumption, rather than the point of generation. The
baseline was constructed based on generation statistics for the State’s generation sources,
although Coahuila’s demand draws from a broader regional grid. Since, data were not available
as to which generation resources were associated with the State’s net exports, it was assumed
that the carbon intensity of exported power was equal to the average of power produced in the
State.
Figure 3-4 provides a summary of the net generation forecast for Coahuila’s generation
resources. As a comparison, the CFE forecast for net generation within the northeast region of
Mexico (Coahuila, Chihuahua, Durango, Nuevo Leon and Tamaulipas) is shown in Figure 3-5.
That forecast indicates a strong and growing reliance on natural gas combined-cycle
technologies.

3-15
Figure 3-4. Coahuila BAU Net Electricity Generation Forecast
Figure 3-5. CFE Generation Forecast for the Northeast Region
The second issue needed for understanding the estimations of “in-State” reductions from
electricity supply/demand relates to how the marginal resource mix for the electricity system is
defined. As noted above, the marginal resource mix refers to the portion of the electricity system
that will respond to each incremental increase or decrease in load. For the CO SCAP, the
marginal resource mix was defined to be made up primarily of natural gas combined-cycle
(NGCC) power plants with the remainder being a small amount of diesel-fired combustion
turbine plants. Overall, these plants have lower carbon intensities than the State’s average (due to
the presence of the two large coal plants). Since reductions in load brought about by energy
-
5,000
10,000
15,000
20,000
25,000
30,000
2010 2015 2020 2025 2030 2035
Ne
t G
Wh
Coal Natural Gas CC Diesel CT Hydro
-
20,000
40,000
60,000
80,000
100,000
120,000
140,000
2011 2016 2021 2026
Ne
t G
Wh
Conventional Thermal
Fluidized Bed
New Clean Generation
Wind
Hydroelectric
Combustion Turbine
NGCC
Conventional Coal

3-16
efficiency policies will first reduce generation from the marginal resource mix, the associated
emission reductions from such a policy will be lower than would be estimated using the average
carbon intensity for the State. Avoided generation costs from an EE policy would also be based
on the marginal resource mix, rather than the average generation costs for the State (marginal
resources tend to have higher running costs than baseload plants).
Finally, while we attribute all GHG reductions and costs to the point of electricity consumption,
it should be understood that, since the State is served by a much larger national grid, emission
reductions from reduced marginal resource generation requirements could also occur at plants
located outside of the State’s geographic boundaries. This could occur, for example, if all of the
marginal resources within the State were taken off-line to balance with load reductions, the
remaining base-load plants continued to operate at full capacity, and additional load reductions
were needed. In this case, the additional load reductions would need to come from out of State
plants on the margin. For regional load balancing considerations, these plants would likely be
located in nearby States associated with the regional mix shown in Figure 3-5.
For the CO SCAP, Figure 3-4 above shows the BAU net electricity generation forecast by fuel
type. In this figure, all of the natural gas and diesel based generation is considered to be the
marginal resource. This definition of the marginal resource is based on both running costs, as
well as the relative ease in ramping these plants up or down to match load (as compared to large
conventional coal plants).
For the SCAP policies, all GHG impacts were measured against a BAU carbon intensity for
natural gas and diesel generation. The carbon intensity of the Coahuila marginal resource mix
was estimated to be 0.532 tCO2e/MWh in 2016 with very little variability through 2035 (as
shown in Figure 3-6 below). Carbon intensities were derived using the net generation forecasts
and the GHG emissions per unit of generation from the ES baseline. Next to the CO marginal
resource mix, a comparison is provided for the marginal resources presumed for the northeast
region of Mexico (“MX marginal mix”). The MX marginal mix is expected to be even more
dominated by NGCC, but in addition to a small amount of combustion turbine use, there is also a
small amount of conventional thermoelectric plants (presumed to use fuel oil for this analysis).26
Carbon intensities of the two marginal resource mixes are similar with the MX mix estimated to
range from 9 to 13% lower than the CO mix.
26 Comisión Federal de Electricidad; Sistema de Información Energética, Secretaría de Energía, Evolución de la
generación bruta por tecnología y región al 2026, Servicio Público.

3-17
Figure 3-6. Carbon Intensities of the Coahuila and Mexico Regional Marginal Resource Mixes
To quantify the direct economic benefits of EE/RE policies, estimates of the avoided generation
costs for marginal resources were needed. The Coahuila marginal resource system costs were
estimated to be $1,792/MWh in 2016 and increasing to $2,807/MWh by 2035 (mostly due to
expected increases in natural gas pricing).27 These values are shown in Figure 3-7 along with
those for the MX marginal mix. The MX marginal mix costs are slightly lower than those for the
Coahuila mix. These run about 29% lower early in the forecast period to about 21% in 2035.
These lower costs are driven by the higher levels of NGCC in the MX marginal mix. Forecasted
natural gas prices are expected to be much lower than diesel and fuel oil through the planning
period (see Figure 3-8). Note that the calculations of both carbon intensity and avoided system
costs both assume a transmission and distribution (T&D) loss rate of 10.7% throughout the
forecast period (consistent with the ES baseline).
If the total system-wide impact of all SCAP policies (electricity savings + new generation – new
demand) exceeds the marginal resource mix, then the values used initially during the “stand-
alone” policy analysis for carbon intensity and avoided costs could require adjustment. These
adjustments would account for a different set of resources (in this case, resources beyond just
Coahuila’s natural gas and diesel sources) that would be turned down or decommissioned to
accommodate the changes in load brought about by implementation of the plan policies.
27 Generation Costs: source Section 4.4 of Costos y Parametros de Referencia para la Formulation de Proyectos de
Inversion del Sector Electrico, edition 32, CFE, 2012. Natural gas wholesale costs: natural gas selling price firsthand
in Pemex City, data through 2013. Forecasted based on 1.8%/yr annual growth rate in US supplies from US
Department of Energy, Energy Information Administration, Annual Energy Outlook 2014.
0.00
0.10
0.20
0.30
0.40
0.50
0.60
2016 2018 2020 2022 2024 2026 2028 2030 2032 2034
Car
bo
n In
ten
sity
(tC
O2e
/MW
h)
CO Marginal Mix MX Marginal Mix

3-18
Figure 3-7. Avoided Generation Costs for the Coahuila and Mexico Regional Marginal Resource Mixes
Figure 3-9 provides a comparison of the marginal resource mix and the total CO SCAP policy
electricity system impacts. “Total impacts” here refer to the sum of changes to system load
brought about by new energy efficiency and renewable energy projects (as well as any new
demand, such as greater vehicle electrification). Most of the EE/RE impacts come from policies
in the ES and RCII sectors; however, policies in other sectors also contribute (AFOLU-2, WM-
1).
As shown in Figure 3-9, the total impacts stay just below the marginal resource mix net
generation levels through the end of the planning period. Therefore, no adjustments were needed
to address needed changes to the definition of a marginal resource mix and the associated carbon
intensity and system costs of power production. As a result, no further adjustments were needed
to address inter-sector interactions/overlaps between electricity supply and energy demand
policies. Had the total electricity system impacts been higher than the generation levels of the
marginal resource mix, then a revision to our initial definition of marginal resources would have
been required. For Coahuila, this would mean including some coal-based generation within the
marginal resource mix.
$0
$500
$1,000
$1,500
$2,000
$2,500
$3,000
2016 2018 2020 2022 2024 2026 2028 2030 2032 2034
Avo
ide
d G
en
era
tio
n C
ost
($
/MW
h)
CO Marginal Mix
MX Marginal Mix

3-19
Figure 3-8. Wholesale Fuel Price Forecast for the CO SCAP Project
Figure 3-9. Total CO SCAP Electricity System Impacts Compared to the CO Marginal Resource Mix
0
50
100
150
200
250
300
350
400
2004 2009 2014 2019 2024 2029 2034
Wh
ole
sale
Pri
ce F
ore
cast
($
/GJ)
Gasoline
Diesel
LPG
Fuel Oil
Natural Gas
Coal
0
5
10
15
20
25
2016 2019 2022 2025 2028 2031 2034
GW
hM
illar
es
BAU NetElectricityGeneration
BAUMarginalResources
CAP SystemImpacts

3-20
As a sensitivity analysis for all policies with electricity supply or demand impacts, another set of
GHG reductions and net societal costs were derived using a different marginal resource mix that
would be more closely associated with the national grid, rather than for Coahuila-specific
generation resources. Following from the discussion above, and the regional generation statistics
shown in Figure 3-5, an MX regional marginal resource mix was defined to be made up of
mostly natural gas combined-cycle plants, but also including a small amount of combustion
turbine (presumed to be diesel-fired) and conventional thermal-electric generation (presumed to
be residual oil-fired). The carbon intensities and avoided generation costs are shown in Figures
3-6 and 3-7, respectively.
Table 3-2 below provides a summary of the results of this sensitivity assessment. Not
surprisingly, the biggest differences are in the ES and RCII sectors where policies with the
biggest electricity system impacts occur. Cumulative GHG reductions for these two sectors
would be about 10% less if the generation resources displaced through implementation of CAP
policies were better characterized by marginal resources in the MX regional mix than for CO-
specific marginal resources. Net societal savings would also be lower using the MX regional
marginal mix assumptions – about 8%.
While there are also some electricity system impacts associated with the TLU, AFOLU and WM
sector policies, the size of these impacts isn’t large enough to show a significant difference when
using the CO marginal mix versus the MX regional marginal mix. For both GHG reductions and
net societal savings, the total differences for all CO SCAP policies are about 9% each.
Table 3-2. Sensitivity Assessment of Differing Marginal Resource Assumptions
Sector
Cumulative Total Reductions (TgCO2e)
NPV Costs or (Savings) ($2014MM)
Cost Effectiveness ($2014/tCO2e)
CO Mix MX Mix CO Mix MX Mix CO Mix MX Mix
Energy Supply 30 27 (5,203) ($4,302) ($172) ($161)
RCII 24 22 (29,918) ($25,547) ($1,238) ($1,152)
TLU 7.3 7.3 ($33,222) ($32,687) ($4,572) ($4,498)
AFOLU 2.7 2.7 $408 $556 $150 $209
WM 3.1 3.1 ($2,235) ($2,188) ($712) ($702)
Total – All Sectors 68 62 ($70,117) ($64,168) ($1,039) ($1,368)
The initial take-away message from this sensitivity analysis could be that the total emission
reductions and savings estimated for the CO SCAP could be over-stated by up to 9% depending
on how the electricity supply system is adjusted as a result of implementation of all policies (i.e.
how much are Coahuila’s marginal resources adjusted as compared to the northeast region’s
marginal resources).

3-21
It is important to also consider here that the CO SCAP policies are being quantified without any
consideration for policies that could be implemented by other States in the region, which could
also serve to reduce generation requirements for the marginal mix of the region (including
Coahuila’s). To the extent that such policies are developed and implemented, there could be a
need to consider adding more resources to the regional marginal mix that would most likely be
higher in carbon intensity (e.g. coal-based generation). This would lead to greater GHG
reductions for any EE or RE policy (and potentially lower net savings, since these plants have
lower levelized generating costs).

4-1
Chapter 4 Energy Supply (ES) Sector
Sector Overview
The Energy Supply (ES) sector consists of three subsectors: Power Supply (PS), Heat Supply
(HS), and Fuel Supply (FS). According to the 2010 Coahuila Forecast, the Energy Supply sector
is projected to comprise 34 percent net greenhouse gas (GHG) emissions across all sectors by
2035. 28 Emissions growth in the sector from 1990-2035 is about 3.0 percent per year. As shown
in Figure 4-1, primary energy sources in the ES sector include power generation from fossil
fuels, primarily coal and natural gas (hydroelectric generation is almost too small to be seen at
the top of the chart).
Figure 4-1. Electricity Generation by Fuel Type in Coahuila
As of 2014, 95% of the total electricity generating capacity came from two coal plants located
near the town of Nava: Carbon II with a capacity of 1,400 MW and Rio Escondido (Jose Lopez
Portillo) with a generating capacity of 1,200 MW. 5% of the remaining capacity corresponds to a
28 The ES baseline data shown in this chapter are updated from the initial work done for Coahuila and documented
in Appendix A (i.e. the 2010 CCS GHG I&F report). The reader should expect to see slight differences in the values
shown in that earlier work.
0
5
10
15
20
25
30
1990 1995 2000 2005 2010 2015 2020 2025 2030 2035
Net
Ge
ner
atio
n (
GW
h)
Mill
ares
Natural Gas Diesel Coal Hydroelectric

4-2
combined cycle plant located in Ramos Arizpe, a hydroelectric plant located in the riverbed of
the Rio Grande, and one turbogas plant located in Monclova.
Diesel oil declined as a source of energy overall from 2000 through 2015. Natural gas expanded
from near 0 percent of supply in 1999 to almost 25 percent of projected supplies by 2035. This
corresponds to an increase in natural gas generation of over 6,250 GWh by 2035.
It should also be noted that exports make up about 50%% of Coahuila’s energy production
through 2025, which is seen in Figure 4-2.
Figure 4-2. Electricity Balance for Coahuila
Net electricity exports are positive during all years but are contingent on continued generation
from Coahuila’s coal fleet.
ES sector GHG emissions (Figure 4-3) play a major role in the projected growth rate of overall
emissions for Coahuila through 2035. A variety of low emissions policy actions are needed to
reduce ES sector emissions.
Figure 4-4 shows that with continued reliance on coal, the trend will be a high per capita-based
carbon intensity for in-State power production through 2035. Carbon intensity increases in part
because power generation is increasing faster than Coahuila population. Figure 4-4 shows that
Coahuila’s ratio is significantly higher than the national level.
Measures to reduce GHGs from the sector that were evaluated in this planning process include
shifts to renewable energy (solar and wind) and low emitting fossil supplies (natural gas) for
both centralized and distributed energy systems. The policy to diversify the centralized power
generation (ES-1) provide the majority of future emissions reduction options for the State with
over 64 percent of all supply-side policy options (discussed further below).
0
5
10
15
20
25
30
1990 1995 2000 2005 2010 2015 2020 2025 2030 2035
Ne
t G
en
era
tio
n (
GW
h)
Mill
ares
Exports Electricity Loss State Consumption

4-3
Figure 4-3. Power Supply Emissions – Consumption Based
Figure 4-4. Per Capita Carbon Intensity
In comparison, decentralized supply sources from other options (ES-2, -3, -4, & -5) do
significantly affect overall generation mix through 2035 (at almost 36%). They also provide
important stage-setting actions to support longer-term expansion of distributed renewable
generation. Additional supply-side measures could be added to the list of options evaluated in
this planning process and potentially include low-emitting practices for extraction and
distribution of natural gas (assessed using full energy-cycle effects), as well as continued
development and scale up of renewable-energy sources at the state and regional levels.
0
2
4
6
8
10
12
14
16
18
20
1990 1995 2000 2005 2010 2015 2020 2025 2030 2035
GH
G E
mis
sio
ns
(TgC
O2e)
Natural gas Diesel oil Coal
0
2
4
6
8
10
12
14
16
18
1990 1995 2000 2005 2010 2015 2020 2025 2030 2035
tCO
2e/
cap
ita
StateGross
State Net
NationalNet

4-4
In this report, supply-side shifts through ES policy actions can be viewed in combination with
demand reduction strategies for the Residential, Commercial, Industrial, and Institutional (RCII)
sector as an overall power sector strategy. Emissions baselines and demand-side policy options
for electricity uses of energy are addressed in a Chapter 5 of this report.
The alternatives for generating electricity in Coahuila from renewable sources are varied and all
are feasible to implement, however, the decision to use a particular measure should be based on
considering the costs involved in implementation, direct user benefits, and the broader impacts to
the State economy. Also, the use of renewable energy sources should do the following: not affect
the supply of electricity; should in any case, reduce dependence on imported energy; result in
savings for consumers; and simultaneously reduce emissions of greenhouse gases.
Key Challenges and Opportunities
Projected emissions growth rates for the ES sector in Coahuila are high, even though some of the
most carbon intense sources (fuel oil and diesel oil) have been all but eliminated as the natural
gas share of overall electricity supply expands dramatically. As a result, to stabilize and reduce
ES sector emissions, energy growth rates must be managed through demand side (RCII)
measures in combination with a significant supply side shift to low or zero carbon renewable
energy supplies, including future focus on improved natural gas extraction and distribution
practices to reduce the footprint associated with full energy-cycle use of natural gas.
Supply and demand management approaches for the sector will require a series of centralized
and decentralized supply measures that cut across a variety of state, local, and private systems.
Centralized power systems (power plants and the power grid) represent the largest immediate
opportunity for an emissions reduction impact, but decentralized sources of power could grow
quickly and broadly with policy and investment support and represent a major scale up
opportunity.
Presently, Coahuila lacks a statewide general policy to diversify the energy supply matrix. Such
a policy could be defined and developed (through policy option ES-1) to stimulate low carbon
shifts in centralized sources (power plants). Expanded planning and analysis could help address
policy and investment information needs necessary to support these shifts.
Distributed energy systems, such as residential and commercial solar power applications, also
will benefit from improved planning and analysis support for a rapid scale up of best practices at
the small local scale to full statewide levels. These actions must be tailored to local conditions
that vary considerably in Coahuila, and they will require local government and public-private
partnerships that may not currently exist, as well as new spending. In turn, this will require
expanded program capacity, outreach, technology cost controls, and investment channels.
Overview of Plan Recommendations and Estimated Impacts
Five policy options were evaluated for the ES sector. These include:

4-5
ES-1. Electricity production through renewable energy technologies (photovoltaic panels,
wind generators) in Central Station Power Supply. The purpose of this policy is to take
advantage of low carbon energy resources in Coahuila to contribute to the national GHG
reduction target (Objective 3)29 through the strategy of diversification of the energy
matrix production in the country (3.2.1).30 This includes reducing dependence on fossil
fuels with high carbon content in electricity generation,31 by promoting installation of
power plants that use renewable energy sources, specifically wind and sun, thereby
helping to reduce GHG emissions per mega-watt (MW) generated.
ES-2. In-situ electricity generation in residential buildings with photovoltaic panels. This
policy expands the generation and use of renewable energy in the residential sector of
Coahuila through the purchase and installation of photovoltaic panels and reduces the
emission of greenhouse gases associated with the consumption of electricity from fossil
fuels.
ES-3. In-situ electricity generation in public buildings with photovoltaic panels. This
policy expands the use and distribution of renewable energy in public buildings in
Coahuila for systems and facilities capable of producing their own energy.
ES-4. In-situ electricity generation in commercial and industrial buildings with
photovoltaic panels. This policy expands the use and distribution of renewable energy in
commercial and industrial buildings in Coahuila for systems and facilities capable of
producing their own energy (10% and 25% of electric power consumed in commercial
and industrial buildings is self-generated with rooftop solar photovoltaic panels by 2025
and 2035 respectively).
ES-5. Combined heat and power - Encouragement of efficient cogeneration of electricity
in industry. This policy encourages the cement, steel, and mining industries to employ
more efficient electricity cogeneration systems rather than conventional systems. CHPs
leverage untapped waste heat and reduce unnecessary energy losses, enabling
considerable medium and long term savings. Cogeneration mode represents a viable
option to contribute to energy sustainability by increasing energy and economic
efficiency of the company.
Table 4-1 below provides a summary of the results of the microeconomic analyses conducted for
each of the ES policies. These results are shown on a “stand-alone” basis, meaning that they
were evaluated against BAU conditions assuming that no other policies would be implemented.
These results indicate that the policy to diversify the state energy supply system toward
renewable and low emitting sources (ES-1) provides over 80 percent of all emissions reductions
29 Objective 3: Reduce emissions of greenhouse gases to move to a competitive economy and low emissions
development (Special Climate Change Program Promotion Version 2014-2018, 2014-2018 PECC Government of
the Republic.) 30 Strategy 3.2.1 Promote the diversification of the energy matrix with public and private investment in generation
through clean energy (Special Climate Change Program Promotion Version 2014-2018, 2014-2018 PECC.
Government of the Republic).

4-6
from the five options evaluated in this planning process. Overlapping effects within the sector
between centralize and decentralized supply sources are minimal due to the domination of
centralized sources, but this dynamic will likely shift in the future as decentralized renewable
sources become more broadly adopted.
Table 4-1. ES Microeconomic Analysis Summary: “Stand-Alone” Results
In-State GHG Impacts
Total GHG Impacts Base Year 2014$
Policy ID Policy Title
Annual CO2e Impacts
2035 Cumulative
2035 Cumulative
NPV 2016-2035
Cost Effectiveness
2025 Tg
2035 Tg TgCO2e TgCO2e $Million $/tCO2e
ES-1.
Renewable electricity production in Central Station Power Supply (0.92) (1.3) (19) (25) ($2,179) ($89)
ES-2. Photovoltaic energy in residential buildings (0.034) (0.054) (0.64) (0.82) ($304) ($369)
ES-3. Photovoltaic energy in public buildings (0.020) (0.029) (0.36) (0.46) ($166) ($359)
ES-4.
Photovoltaic energy in commercial and industrial buildings (0.079) (0.16) (1.7) (2.2) ($1,008) ($459)
ES-5. Cogeneration in the industrial sector (0.12) (0.22) (2.4) (2.4) ($1,614) ($670)
Totals (1.2) (1.8) (24) (30) ($5,270) ($173)
*Note: (Negative cost values) imply net savings to society and positive cost values imply net societal costs.
Overlaps Discussion
The interaction of the supply (ES) and demand (RCII) areas of electric power is significant in
terms of overlapping and combined effects of both types of policy actions.32 This includes, for
instance, effects on emissions reductions that affect supply-side measures. As demand reduction
takes place, supply shifts have a lesser effect on the reduced pool of power generation. In terms
of cost effectiveness, by combining ES options with positive net costs with RCII options with
negative net costs reduces the net cost of overall electricity sector actions. Taken together, ES
and RCII policy actions provide the largest share of overall emissions reduction opportunities
evaluated for policy options evaluated for all sectors. Inter-sector overlaps were addressed in
Chapter 3 above (these include interactions between ES and RCII policies).
Analysis of the impacts of ES measures is reported at a stand-alone (ES sector only with no
consideration of overlaps among ES policies) level in Table 4-1 above. Due to the low levels of
distributed generation, little overlap exists within the ES sector. Therefore, the results shown in
32 Traditionally, the Transportation, Agriculture, Forestry & Land Use, and Waste Management sectors have not also
been considered as sectors with supply- and demand-side electricity system impacts; however, policies and actions
in these sectors can also influence demand (positively or negatively). Examples include the increased power
demands of a transportation policy promoting electric vehicles or power production from biomass or waste
resources.
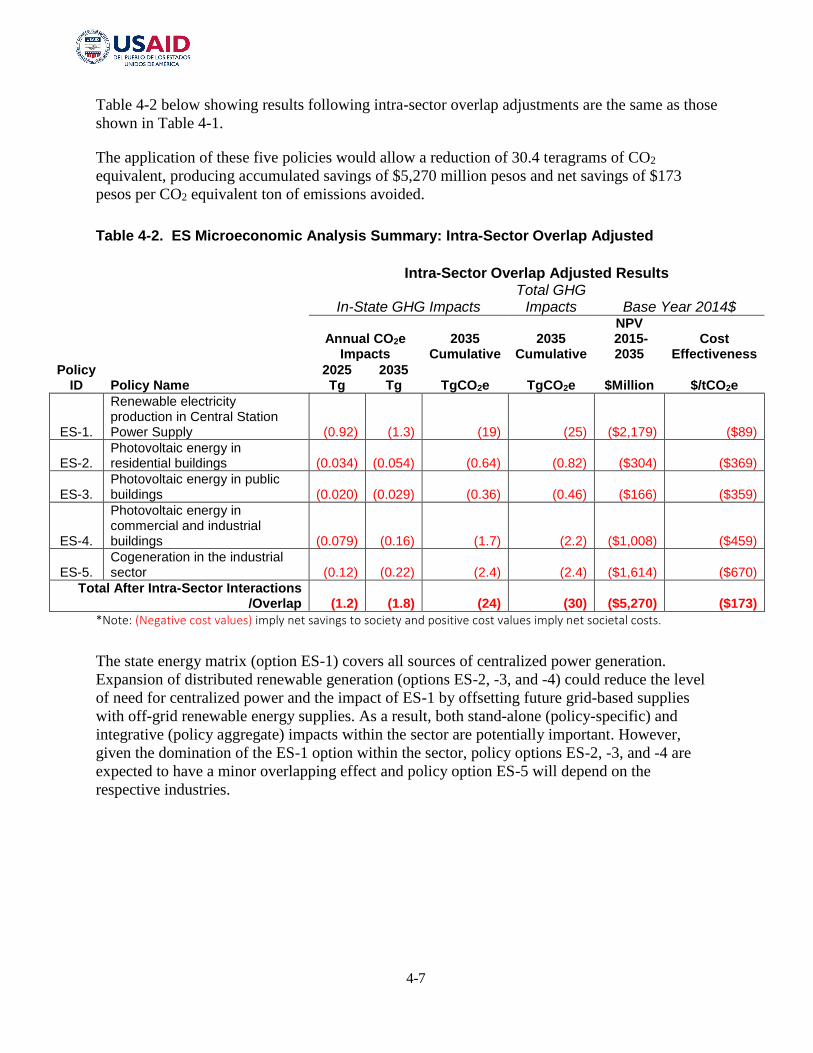
4-7
Table 4-2 below showing results following intra-sector overlap adjustments are the same as those
shown in Table 4-1.
The application of these five policies would allow a reduction of 30.4 teragrams of CO2
equivalent, producing accumulated savings of $5,270 million pesos and net savings of $173
pesos per CO2 equivalent ton of emissions avoided.
Table 4-2. ES Microeconomic Analysis Summary: Intra-Sector Overlap Adjusted
Intra-Sector Overlap Adjusted Results
In-State GHG Impacts Total GHG
Impacts Base Year 2014$
Policy ID Policy Name
Annual CO2e Impacts
2035 Cumulative
2035 Cumulative
NPV 2015-2035
Cost Effectiveness
2025 Tg
2035 Tg TgCO2e TgCO2e $Million $/tCO2e
ES-1.
Renewable electricity production in Central Station Power Supply (0.92) (1.3) (19) (25) ($2,179) ($89)
ES-2. Photovoltaic energy in residential buildings (0.034) (0.054) (0.64) (0.82) ($304) ($369)
ES-3. Photovoltaic energy in public buildings (0.020) (0.029) (0.36) (0.46) ($166) ($359)
ES-4.
Photovoltaic energy in commercial and industrial buildings (0.079) (0.16) (1.7) (2.2) ($1,008) ($459)
ES-5. Cogeneration in the industrial sector (0.12) (0.22) (2.4) (2.4) ($1,614) ($670)
Total After Intra-Sector Interactions /Overlap (1.2) (1.8) (24) (30) ($5,270) ($173)
*Note: (Negative cost values) imply net savings to society and positive cost values imply net societal costs.
The state energy matrix (option ES-1) covers all sources of centralized power generation.
Expansion of distributed renewable generation (options ES-2, -3, and -4) could reduce the level
of need for centralized power and the impact of ES-1 by offsetting future grid-based supplies
with off-grid renewable energy supplies. As a result, both stand-alone (policy-specific) and
integrative (policy aggregate) impacts within the sector are potentially important. However,
given the domination of the ES-1 option within the sector, policy options ES-2, -3, and -4 are
expected to have a minor overlapping effect and policy option ES-5 will depend on the
respective industries.

4-8
Similarly, RCII actions that reduce power demand could affect all ES options by reducing the
overall pool of power that undergoes shifts to low carbon or zero carbon supplies. The need to
address any integrative effects of ES and RCII demand-side measures are addressed in Chapter
3.
The final assessment of any additional electricity system impacts across all supply-demand
sectors was addressed in Chapter 3 (Section 3.7, in the assessment of marginal resource mix
assumptions). In summary, that assessment showed that the net electricity impacts of all CAP
policies (new generation + energy efficiency) were found to be below the total marginal resource
for the State. As a result, no adjustments were needed to account for changes needed to the
original definitional assumptions for the marginal resource mix. As discussed in Chapter 3, the
marginal resource mix was defined as all natural gas and diesel based production in the State.
This determination of no need to apply inter-sector integration adjustments assumes that the
policies would be successfully implemented at the level and timing specified by each policy
design.

4-9
Energy Supply Sector Policy Descriptions
Five ES policies were analyzed for the Coahuila SCAP. Following is a short summary of each
policy. Appendix C contains the detailed policy descriptions, policy designs, implementation
mechanisms, related policies/ programs in place, data sources/ assumptions/ methodologies,
causal chains, stand-alone analytic results, key uncertainties, feasibility issues and additional
benefits and costs for each policy.
ES-1. Renewable Electricity Production in Central Station Power Supply
The purpose of this policy is to take advantage of low carbon energy resources in Coahuila to
contribute to the national GHG reduction target (Objective 3)33 through the strategy of
diversification of the energy matrix production in the country (Strategy 3.2.1).34 This includes
reducing dependence on fossil fuels with high carbon content in electricity generation,35 by
promoting installation of power plants that use renewable energy sources, specifically wind and
solar photovoltaic (PV), thereby helping to reduce GHG emissions per megawatt (MW)
generated.
This strategy is consistent with the state’s resources, as Coahuila receives a high level of solar
radiation [2.9 to 6.7 kilowatt-hours per square meter (kWh/m2)] with high potential for energy
conversion. The state can support diversification of electricity supply options by providing siting
and construction of new facilities and generation operations with primary renewable energy.
ES-2. In-situ Electricity Generation in Residential Buildings with Solar PV Technology
By 2020, the residential sector will be the eighth largest greenhouse gas emitter and the second
largest in carbon black36 (PECC, 2014). These emissions are associated with electricity
consumption of households.
The costs of small-scale generation with photovoltaic panels are lower than domestic rates, once
the government subsidy is incorporated. Also, the territory of Coahuila receives high levels of
solar radiation. Therefore, the implementation of economic and financial incentives will boost
33 Objective 3: Reduce emissions of greenhouse gases to move to a competitive economy and low emissions
development (Special Climate Change Program Promotion Version 2014-2018, 2014-2018 PECC Government of
the Republic.) 34 Strategy 3.2.1 Promote the diversification of the energy matrix with public and private investment in generation
through clean energy (Special Climate Change Program Promotion Version 2014-2018, 2014-2018 PECC.
Government of the Republic). 35 95% of the total electricity generating capacity comes from two coal plants located near the town of Nava: Carbon
II with a capacity of 1,400 MW and Rio Escondido (Jose Lopez Portillo) with a generating capacity of 1,200 MW.
5% of the remaining capacity corresponds to a combined cycle plant located in Ramos Arizpe, a hydroelectric plant
located in the riverbed of the Rio Grande (within the limits of Coahuila and Texas) and one turbogas plant located in
Monclova. 36 Considering a global warming potential (GWP) of 20 years.

4-10
the self-generation of solar photovoltaic electricity in the residential sector.
The implementation of this policy contributes to the reduction of GHG emissions related to the
consumption of electricity produced from fossil fuels. Similarly, it supports the national strategy
for distributed power generation in the domestic, commercial and industrial sector (Strategy 3.4.3).
ES-3. In-situ Electricity Generation in Public Buildings with Solar PV Technology
Electrical energy used in public buildings comes largely from fossil fuels with high global
warming potential. Therefore, the objective of this policy is to increase distributed renewable
electricity generation in the institutional sector, taking advantage of the high incidence of solar
radiation of the entity, promoting the installation of photovoltaic panels in public buildings in
Coahuila to meet their electric energy requirements.
With this measure, besides reducing operating costs in the public sector, GHG emissions are
mitigated using cleaner and more efficient technologies (including reduced transmission and
distribution losses) to replace fossil fuels for power generation.
ES-4. In-situ Electricity Generation in Commercial and Industrial Buildings with Solar PV Technology
The commercial and industrial sectors have increasingly contributed to the increase of GHG
emissions that alter the energy balance of the climate system. Therefore, it is appropriate to move
towards an energy model that considers the consumption of electricity in commercial and industrial
buildings by harnessing solar energy.
The auto-consumption of electricity produced by photovoltaic technologies will contribute to
savings in operating costs in commercial and industrial buildings, and contribute to mitigation of
GHG emissions, both by reducing dependence on non-renewable fuels, and avoiding energy losses
during transport and distribution of electrical energy required in the commercial and industrial
buildings of Coahuila.
ES-5. Encouragement of Efficient Cogeneration of Electricity in Industry
Electricity cogeneration systems37 reach a much higher efficiency than conventional systems by
leveraging untapped waste heat and reducing unnecessary energy losses, enabling considerable
medium and long term savings (CONUEE and CRE, 2013). In Mexico, regulations have been
developed considering energy efficient cogeneration projects.
In most companies in the industrial sector, heat and electricity are essential inputs. When these
two forms of energy are required together in a production process, it is an opportunity to implement
37 According to the Law of Electric Energy Public Service, Article 36, Section II, Cogeneration is defined as the
production of electrical energy produced in conjunction with steam or other high thermal energy or both; when the
thermal energy that is not utilized in the process is used for the direct or indirect production of electric power or
when fuels produced during processes are used for direct or indirect power generation.

4-11
cogeneration systems, which leads, simultaneously, to achieve greater efficiency in the use of
fossil fuels and produce less pollutant emissions per unit of useful energy.
This policy considers the promotion of efficient cogeneration systems38 according to the
productive structure of the State, where the focus for cogeneration is concentrated in the
following sectors: Cement industry, steel industry and mining sector. Cogeneration technologies
represent a viable option to contribute to energy sustainability by increasing energy and
economic efficiency of the company.
38 Efficient Cogeneration is defined as the generation of electricity under the provisions of Section II of Article 36 of
the LSPEE, provided that the process has a higher minimum efficiency established by the CRE:
Capacity of the system Minimal efficiency (%)
Capacity >0.03-<0.5MW 5
Capacity >=0.05-<30MW 10
Capacity >=30-<100MW 15
Capacity >=100 20
Considering the net electricity generated in a system for a year (E), net useful thermal energy or heat generated in a
system and used in a production process for one year (H), the fossil fuel used in a system for one year (F), where the
electrical performance RE = E / F and the thermal efficiency RT = H / F. For more information check: 5 CRE (Feb.
22, 2011): http://www.sener.gob.mx/res/Acerca_de/REScalculoEficienciaCogeneracionEficienteCRE_220211.pdf.

5-1
Chapter 5 Residential, Commercial, Institutional and Industrial
(RCII) Sector
Sector Overview
The residential, commercial, institutional, and industrial sectors (RCII) sectors include building
related greenhouse gas (GHG) emissions as well as industrial sector emissions. There are three
categories of emissions associated with the RCII sectors: direct emissions, industrial process
emissions, and electricity sector emissions. First, the RCII sectors were directly responsible for
nearly 4.0 TgCO2e direct GHG emissions in 2015. Direct emissions from these sectors result
principally from the on-site combustion of natural gas, liquefied petroleum gas (LPG), and
industrial diesel oil. Direct emissions in the RCII sector produces GHG emissions when fuels are
combusted to provide space heating, process heating, and other applications.
Second, industrial sector emissions also include the release of CO2 and fluorinated gases
(hydrofluorocarbons, or HFCs, and perfluorocarbons, or PFCs) during industrial processing, the
leakage of HFCs from refrigeration and related equipment, and to a smaller degree, from the use
of sulfur hexafluoride (SF6) in the electricity supply sector (note: SF6 emissions associated with
electricity transmission and distribution equipment were not addressed in the current SCAP
baseline and are typically represented in the ES baseline).
Finally, in addition to direct emissions from combustion of fuels and industrial processes in the
RCII sectors, nearly all of the electricity sold in Coahuila is consumed in buildings as the result
of residential, commercial, institutional and industrial activity. Emissions associated with
producing the electricity consumed in Coahuila were over 10 TgCO2e GHG emissions in 2015.39
Fuel use, industrial process emissions, and electricity account for about 35% of the State’s total
net GHG emissions. Coahuila’s future GHG emissions therefore will depend significantly on
future trends in the consumption of both electricity and fuels in the RCII sectors.
Historical and projected BAU GHG emissions for fuel combustion in the RCII sector are
provided in Figure 5-1. Emissions from direct fuel combustion (LPG, petroleum, wood and
natural gas) are expected to increase by about 1.3% per year over the 2014-2035 period. Figure
5-2 shows the emissions associated with industrial processes (i.e. non-combustion emissions).
These emissions are expected to rise annually by about 2.6% between 2014 and 2035.
39 Net emissions here denote GHG emissions from all activities in Coahuila, adjusted for exports of electricity, and
including estimated “sinks” of GHGs in the Agriculture, Forestry & Other Land Use, and Waste Management
sectors.

5-2
Figure 5-1. RCII Fuel Combustion GHG Emissions Baseline
Figure 5-2. Industrial Process and Product Use Emissions
0.0
1.0
2.0
3.0
4.0
5.0
6.0
7.0
8.0
1990 1995 2000 2005 2010 2015 2020 2025 2030 2035
GH
G E
mis
sio
ns
(Tg
CO
2e)
Industrial - Natural Gas
Industrial - LiquefiedPetroleum Gases
Industrial - Diesel Oil
Residential - LiquefiedPetroleum Gases
Residential - Natural Gas
Residential - SolidBiofuels: Wood/WoodWasteCommercial - LiquefiedPetroleum Gases
0
5
10
15
20
25
1990 1995 2000 2005 2010 2015 2020 2025 2030 2035
GH
G E
mis
sio
ns
(Tg
CO
2e
)
ODSSubstitutes
LimestoneandDolomiteUse
LimeManufacture
Iron andSteelProduction

5-3
Figure 5-3 provides indirect (consumption-based) emissions estimates for electricity
consumption. These emissions account for electricity exports to other States.
Figure 5-3. Electricity GHG Baseline
As indicated in Figure 5-4, most electricity consumption occurs in the RCII sectors, so most of
the emissions associated with production of electricity can be attributed to the RCII sector.40 The
three sources of RCII emissions are forecasted to increase by approximately 3.0% annually
between 2014 and 2035, but this estimate masks large changes within emission sources. These
increases are due mainly to increases in forecasted electricity demand and the associated increase
in natural gas generation shown in Figure 5-3 (since the fraction of net exports decreases through
the forecast, the coal-based generation emissions also increase on a consumption basis).
Figure 5-4 shows most of the electricity consumption occurs within the industrial subsectors.
Roughly, three-quarters of consumption occurs in the industrial sector, while the bulk of the
other quarter occurs in the residential sectors.
40 Note that when a complete economy-wide GHG baseline is presented (such as those shown in Chapter 2), all
electricity emissions are attributed to the ES sector to avoid double-counting.
0
2
4
6
8
10
12
14
16
18
20
1990 1995 2000 2005 2010 2015 2020 2025 2030 2035
GH
G E
mis
sio
ns (
Tg
CO
2e)
Natural gas Diesel oil Coal

5-4
Figure 5-4. Electricity Sales by Sector
Key Challenges and Opportunities
The principal means to reduce RCII emissions in Coahuila focuses on improving energy
efficiency through measures such as building codes for new construction, more efficient
equipment (e.g. appliances, water heaters, etc.) for new construction as well as existing
construction, and more efficient equipment and processes for the industrial processing sector
(e.g. boilers, process heat systems, HVAC, motors, etc.). The state’s limited pursuit of energy
efficiency until recent years offers abundant opportunities to reduce emissions through programs
and initiatives to improve the efficiency of buildings, appliances, and industrial practices. The
advantages of having “low hanging fruit” in the form of low cost energy efficiency opportunities
in the RCII sectors are countered by an underdeveloped private sector that will likely be
responsible for scoping, implementing and evaluating energy efficiency projects. These green
collar jobs require special training and equipment that take time for firms within the State to
acquire.
Coahuila’s large industrial sector presents opportunities for cost effective demand reductions.
Industrial energy efficiency is typically relatively cheap compared to new sources of energy
supply, and energy efficiency can increase the competitiveness of firms in the State.
Overview of Plan Recommendations and Estimated Impacts
The Coahuila Climate Action Plan has identified significant opportunities for reducing GHG
emissions growth attributable to the RCII sectors. These include expanding or launching energy
0
5,000
10,000
15,000
20,000
25,000
2000 2005 2010 2015 2020 2025 2030 2035
Gig
aw
att
-hrs
Gran Industria (Industrial)
Mediana ind. (Industrial)
Agrícola
Servicios (Commercial)
Comercial (Commercial)
Doméstico (Residential)

5-5
efficiency programs for existing residential buildings, promoting high performance new
residential buildings, requiring state governments to implement green power
purchase/generation, improving industrial energy efficiency, and promoting the use of solar and
pass heaters for residential water heating needs.
The Plan recommends a set of four policy options for the residential, commercial, and industrial
sectors detailed in Table 5-1.41 The GHG emission reductions and costs per ton of GHG
reductions for all of these policies were quantified. The quantified policy recommendations
could lead to emissions savings from reference case projections of:
1.8 TgCO2e per year by 2035. A cumulative savings of almost 19 TgCO2e from 2014-
2035;
Net cost savings of approximately $30 billion pesos through 2035 on a net present value
basis. The weighted average cost savings of these policies is about $1,238 (pesos) per
metric ton of CO2e.
Table 5-1. RCII Microeconomic Analysis Summary: “Stand-Alone” Results
In-State GHG Impacts Total GHG
Impacts Base Year 2014$
Policy ID Policy Title
Annual CO2e Impacts
2035 Cumulative
2035 Cumulative
NPV 2016-2035
Cost Effectiveness
2025 Tg
2035 Tg TgCO2e TgCO2e $Million $/tCO2e
RCII-1. Building Codes and Standards (0.025) (0.049) (0.51) (0.65) ($855) ($1,311)
RCII-2. Increasing EE in new constructions- Equipment (0.014) (0.029) (0.29) (0.38) ($601) ($1,590)
RCII-3.
Increasing EE in existing constructions, excl. Ind. sector - Equipment (0.72) (1.2) (14) (18) ($21,262) ($1,206)
RCII-4.
EE Equipment and Processes in the Industrial Sector (0.18) (0.54) (4.3) (5.5) ($7,200) ($1,307)
Totals (0.94) (1.8) (19) (24) ($29,918) ($1,238)
*Note: (Negative cost values) imply net savings to society and positive cost values imply net societal costs.
41 The net cost savings are based on fuel expenditures, operations, maintenance, and administrative costs, and on
amortized, incremental equipment costs. All NPV values shown here are calculated using a 5% per year real
discount rate.

5-6
Overlaps Discussion
To assess the cumulative emission reductions for the policies in the RCII sector, it is necessary to
consider any potential overlaps among the policies that affect similar types of energy use. No
overlaps were identified within RCII policies (i.e. intra-sector overlaps). The RCII policies were
designed to cover separate end-uses and measures. For new construction, RCII-1 includes the
energy consuming end-uses associated with building energy codes such as building envelope and
heating, ventilating and air conditioning (HVAC), while RCII-2 includes only the energy
consumption associated with appliances in new buildings. RCII-3 excludes industrial sector
building energy-use (HVAC and lighting) as these are included in RCII-4. Therefore, each of the
stand-alone policy results are what can reasonably be expected for GHG reductions for the
individual policies, given their implementation schedule and assumptions in the analysis. Inter-
sector overlaps were addressed in Chapter 3 above (these include interactions between ES and
RCII policies).
To ensure no RCII sector overlaps, policies were compared in terms of the type of energy use
they target and the energy reduction measures each is expected to implement. Overlaps were
identified ahead of time, and quantified, so that the measures and sectors would not be redundant
to each other and therefore prevent double-counting of GHG emissions reductions. Since there
were no intra-sector overlaps or adjustments needed, the GHG reductions and costs shown in
Table 5-2 are the same as those shown in Table 5-1 above.
Table 5-2. RCII Microeconomic Analysis Summary: Intra-Sector Overlap Adjusted
Intra-Sector Overlap Adjusted Results
In-State GHG Impacts Total GHG
Impacts Base Year 2014$
Policy ID Policy Name
Annual CO2e Impacts
2035 Cumulative
2035 Cumulative
NPV 2015-2035
Cost Effectiveness
2025 Tg
2035 Tg TgCO2e TgCO2e $Million $/tCO2e
RCII-1. Building Codes and Standards (0.025) (0.049) (0.51) (0.65) ($855) ($1,311)
RCII-2. Increasing EE in new constructions - Equipment (0.014) (0.029) (0.29) (0.38) ($601) ($1,590)
RCII-3.
Increasing EE in existing constructions, excl. Ind. sector - Equipment (0.72) (1.2) (14) (18) ($21,262) ($1,206)
RCII-4.
EE Equipment and Processes in the Industrial Sector (0.18) (0.54) (4.3) (5.5) ($7,200) ($1,307)
Total After Intra-Sector Interactions/ Overlap (0.94) (1.8) (19) (24) ($29,918) ($1,238)
*Note: (Negative cost values) imply net savings to society and positive cost values imply net societal costs.

5-7
It is also common for inter-sector overlaps to occur between the RCII electricity demand-side
policies and the supply-side policies in the ES sector. For example, if the supply of electricity is
significantly different following implementation of ES policies than it was under BAU (i.e.
cleaner), then an adjustment to the carbon intensity of the electricity supply system might be
warranted. A description of the assessment for whether there was a need to make this adjustment
is included in Section 3.7. Briefly, the results indicated that the total change to the electricity
supply system brought on through implementation of all SCAP policies was not large enough to
exceed the total system marginal resource. Therefore, there was no need to make any inter-sector
overlap adjustments between the RCII and ES policies.
An interaction exists between the EE policies in the RCII sector and both ES-3 (PV in Public
Buildings) and ES-4 (PV in Commercial and Industrial Buildings). The ES PV generation policy
goals are presented in terms of energy consumption in the respective sector. For example, ES-3
has a goal to generate enough PV electricity to meet 60% of consumption in public buildings by
2035. Since, policies RCII-1 through RCII-3 will result in reductions in electricity consumption,
the amount of PV generation required to meet the ES policy goals is reduced (which leads to
lower GHG reduction potential). The degree of interaction was calculated, and the PV generation
requirements for ES-3 and ES-4 were reduced to account for that interaction. Those final results
are shown in the final results summaries of Chapter 3 and the Executive Summary of this report.
An inter-sector policy overlap was identified between AFOLU-2 (urban forestry) and RCII-1 and
RCII-2 which address higher efficiency buildings and the use of higher efficiency appliances,
including air conditioners. One of the benefits of AFOLU-2 is an energy savings for buildings
that will be shaded through an expansion of the urban tree canopy. This shading will reduce the
air conditioning (AC) energy requirements for each of these buildings, and as a result, the energy
savings (and GHG benefits) of both policies will not be additive. This overlap was adjusted for
by reducing the energy savings benefits of AFOLU-2. The electricity impacts of AFOLU-2 were
adjusted to account for the higher efficiency building shells and appliances resulting from RCII-1
and RCII-2. The overlap between AFOLU-2 and RCII was assumed to be 50% after full
implementation of the policies in 2035. The percent of building energy intensity that is
associated with AC was estimated to be 32% in 2035, consistent with the assumptions used for
RCII-1. This overlap results in a reduction of AFOLU-2 electricity impacts, GHG benefits and
associated electricity costs of 16% in 2035.
The policy recommendations described briefly below, and in more detail in Appendix D, result
not only in significant emission reductions and costs savings, but offer a host of additional
benefits as well. These benefits include savings to consumers and businesses on energy bills,
which can result in the reduction in spending on energy by low-income households; reduced
peak demand, electricity system capital and operating costs, risk of power shortages, energy
price increases, and price volatility; improved public health as a result of reduced pollutant and
particulate emissions by power plants; reduced dependence on imported fuel sources; and green
collar employment expansion and economic development.
For the RCII policies recommended by the SCAP to yield the levels of savings described here,
the policies must be implemented in a timely, aggressive, and thorough manner. This means, for
example, not only putting the policies themselves in place, but also attending to the development
of “supporting policies” that are needed to help make the recommended policies effective. While

5-8
the adoption of the recommended policies can result in considerable benefits to Coahuila’s
environment, security of energy supply, and the State’s consumers, careful, comprehensive, and
detailed planning and implementation, as well as consistent support, of these policies will be
required if these benefits are to be achieved.

5-9
Residential, Commercial, Institutional & Industrial (RCII) Policy Descriptions
Four RCII policies were analyzed for the Coahuila CAP. The following is a short summary of
each policy. Appendix D contains the detailed policy descriptions, policy designs,
implementation mechanisms, related policies/ programs in place, data sources/ assumptions/
methodologies, causal chains, stand-alone analytic results, key uncertainties, feasibility issues
and additional benefits and costs for each policy.
RCII-1. Increasing Energy Efficiency in New and Existing Construction - Building Codes and Standards
Construction and design modifications of a building can contribute to increase energy efficiency,
reducing energy demand to satisfy thermal conditioning and lighting needs, improving
inhabitants’ comfort, thus contributing to mitigate deterioration of the environment.
Within the framework of energetic sustainability, this policy covers regulation of design,
construction and major remodeling of buildings, with the objective of building low carbon
footprint “green buildings”. All of this through enhancement, improvement, and adoption of
regulations and standards that promote thermal isolation technologies, installation of low-power
consuming lighting systems: halogen, compact-fluorescent (LFC) and light-emitting diode
(LED) lamps, and carbon sequestration activities (such as green roofs, vertical gardens, and
urban gardens) in new residential, commercial, institutional, and industrial buildings.
RCII-2. Increasing Energy Efficiency in New Constructions - Equipment
Part of the emissions of GHG in the residential, commercial, and institutional sectors (RCII)
comes from the consumption of electricity to satisfy the needs of lighting, water heating, thermal
conditioning and appliance operation.
The goal of this policy is to increase energy efficiency in the RCI sectors by reducing the
energetic demand, supporting a decrease in GHG emissions from generation, distribution and
consumption of energy. (Note that industrial building appliance efficiency is addressed in RCII-
4). This policy promotes the following measures specifically:
Use of solar energy through installation of solar water heaters in households, thus
reducing consumption of liquefied petroleum gas (LPG), natural gas (NG) or
electricity for water-heating purposes.
Encourage the use of flow water heaters, with the purpose of reducing the use of LPG
and NG.
Acquisition of energy efficient appliances.

5-10
Use of more energy efficient thermal conditioning equipment (e.g. mini-split
inverter).
This policy is complementary to policies 2, 3 and 4 of the Energy Sector, which consider the
installation of photovoltaic panels for in situ generation in residential, commercial, industrial and
institutional buildings.
RCII-3. Increasing Energy Efficiency in Existing Construction – Equipment (Excluding Industrial Sector)
In this policy, GHG mitigation strategy is oriented to satisfy energetic needs of existing buildings
of RCI (Residential, Commercial, Institutional) sectors by replacing high-energy-demanding
technologies (electricity and gas) with more efficient ones. This policy specifically promotes the
following measures:
Use of solar energy through installation of solar water heaters in households, thus
reducing consumption of liquefied petroleum gas (LPG), natural gas (NG) or
electricity for water heating purposes.
Use of flow water heaters, with the purpose of reducing the use of LPG and NG.
Acquisition of energy efficient appliances.
Replacement of incandescent bulbs for efficient lighting systems: halogen, compact-
fluorescent (LFC) and light-emitting diode lamps (LED).
Replacement of standard air-conditioning equipment for more energy efficient
thermal conditioning equipment (e.g. mini-split inverter).
RCII-4. Stimulating Energy Efficiency in the Industrial Sector through Equipment and Industrial Process Improvement
The Special Climate Change Program anticipates that for 2020, the industrial sector will be the
third GHG emission generator at a national level. The main polluting sources of this sector come
from the consumption of fossil fuels during manufacturing processes, especially in the iron, steel
and cement industries.
Due to the sectorial structure of economy in Coahuila, where the machinery and equipment
production manufacturing sector stands out, in the iron and steel industries, as well as the metal-
mechanic, industry in the state generates 29% of the total emissions of GHG.
The purpose of this policy is to implement regulations and incentives to decrease potential global
warming through greater energy efficiency of the industrial sector, through improvements in
operation processes, replacement and acquisition of low-energy consuming machinery and
equipment, as well as replacement of high-energy demanding technologies for industrial
operation (electricity and gas) for more efficient technologies (e.g. replacement of incandescent

5-11
luminaries for efficient lighting systems: halogen, fluorescent-compact (LFC), and (LED) lamps;
solar water heaters, etc.

6-1
Chapter 6 Transportation and Land Use (TLU) Sector
Sector Overview
Activities represented in transportation and land use (TLU) sector include fuel combustion
emissions produced by light and heavy-duty on-road vehicles, as well as emissions produced by
aircraft, marine vessels and rail movements. Mitigation policies in the TLU sector take into
consideration direct emissions from vehicle exhaust as well as transportation system emissions
associated with the extraction, production and distribution of transportation fuels, most notably
oil distillates such as gasoline, diesel and aviation gasoline.
In 2010, total transportation emissions were estimated at 3.4 TgCO2e. The largest contributors
were on-road gasoline and on-road diesel combustion, accounting for 64% and 28% of total
sector emissions, respectively. The Transportation sector GHG baseline is shown in Figure 6-1
below.
Between 1990 and 2010, total transportation emissions increased by 84%. In this time period,
on-road diesel emissions increase by 103% and at a faster rate than on-road gasoline emissions,
which increased by 91%.
Total transportation emissions are expected to reach 5.6 TgCO2e by 2035 representing a 68%
increase from 2010. In 2035, on-road gasoline emissions are expected to account for 62% of total
sector emissions followed by on-road diesel (31%) and rail diesel (6%).
The crossing of heavy trucks is one of the highlights of the dynamics at the border, and in
addition to the economic benefits, this has also environmental and health impacts. Heavy diesel
vehicles, construction and agriculture machinery are the three largest GHG emitters in the
Mexican side of the border region.42 Note the GHG emissions associated with fuel sales on the
Mexican side of the border are included in Coahuila baseline; however, emissions from fuels
purchased on the US side of the border are not included.
42 Industrial Economics, Incorporated. 2007. Análisis de emisiones de diésel en la región fronteriza de México y
Estados Unidos. http://www.unep.org/transport/pcfv/PDF/dieselanalysis-Sp.pdf

6-2
Figure 6-1. Transportation GHG Emissions by Mode and Fuel Source
Key Challenges and Opportunities
Coahuila has substantial opportunities to reduce GHG emissions from transportation sources.
The principal approaches to reducing GHG emissions include:
increasing urban density;
shifting urban travel to more energy-efficient modes of transit; and
improving vehicle efficiency.
During the last fifty years, the national population not only tripled, but there has been a migration
from rural to urban settlements. By 2010, cities of more than 15,000 inhabitants accounted for
72% of the total national population (National Urban Development Program, 2014-2018, p. 3).
The accelerated rate of population growth in cities was followed by an expansion of urban areas
and a decrease in urban density. At the same time, there has been a drastic growth in the number
of vehicles in the State’s vehicle fleet. These trends reveal the disorderly growth of Mexican
cities, where urban mobility systems are increasingly dependent on the private car. Despite large
investments in road infrastructure, traffic congestion problems have continued to become more
acute, while the average distances traveled have increased exponentially. More cars are on roads
increasing total vehicle-kilometers traveled (VKT), at decreasing average speeds, producing
significant externalities in time, travel costs and GHG emissions.
Sustainable urban mobility systems seek to stop and reverse these trends, through qualitative and
quantitative diversification of mobility options. It seeks to ration car use by encouraging the use
of mass transit and non-motorized modes of transportation. For this, it is required to modernize
0.0
1.0
2.0
3.0
4.0
5.0
6.0
1990 1995 2000 2005 2010 2015 2020 2025 2030 2035
GH
G E
mis
sio
ns
(Tg
CO
2e)
Rail - Diesel
Aviation - Kerosene
Road Transportation –Natural Gas
Road Transportation -LPG
Road Transportation -Diesel
Road Transportation -Gasoline

6-3
mass transit systems, develop infrastructure for pedestrians and cyclists, and implement
beautification projects and expansion of green areas in roads, parks, gardens and other urban
spaces.
To encourage the purchase of electric, plug-in hybrid and hybrid cars, this policy seeks to:
incorporate this type of vehicles in the state and local governments’ fleets; provide individuals
who acquire them, tax incentives upon purchase (value added tax exemption and ISAN) and
possession (exemption for this concept) as well as special privileges for parking; support,
together with manufacturers of electric and hybrid cars with plants in the State, the development
of a network of charging stations.
Overview of Plan Recommendations and Estimated Impacts
Three policies were developed and analyzed for the TLU sector that are consistent with the
opportunities identified above.
TLU-1: Urban Density Index – Increase the urban density index (inhabitants/ hectare) of
the major metropolitan zones in the state (i.e., Saltillo-Arteaga-Ramos Arizpe, La
Laguna, Monclova-Frontera, Piedras Negras-Nava).
TLU-2: Sustainable Urban Mobility –Restructure the demand for the various modes of
transportation, that is, reduce the percentage of private passenger car use and increase the
relative participation in the use of mass public transportation, bicycling and walking.
TLU-3: Energy Efficient Government Fleet - Increase participation of hybrid, pluggable
hybrid and electric vehicles in the state’s fleet.
Table 6-1 provides a summary of the microeconomic analysis of CAP policies for the TLU
sector. These results are shown on a “stand-alone” basis, meaning any overlaps among policies
have not yet been taken into account.

6-4
Table 6-1. TLU Microeconomic Analysis Summary: “Stand-Alone” Results
In-State GHG Impacts
Total GHG Impacts Base Year 2014$
Policy ID Policy Title
Annual CO2e Impacts 2035
Cumulative 2035
Cumulative NPV
2015-2035 Cost
Effectiveness
2025 Tg 2035 Tg TgCO2e TgCO2e $Million $/tCO2e
TLU-1
Urban Density Index (0.068) (0.12) (1.3) (1.7) ($3,025) ($1,776)
TLU-2
Sustainable Urban Mobility (0.19) (0.35) (4.4) (5.6) ($30,338) ($5,390)
TLU-3
Energy Efficient Government Fleet (0.000051) (0.000088) (0.00095) (0.0012) $3.7 $3,004
Totals (0.26) (0.48) (5.7) (7.3) ($33,359) ($4,549)
*Note: (Negative cost values) imply net savings to society and positive cost values imply net societal costs.
Overlaps Discussion
It is not expected that TLU-3 will interact with other policies in the sector given that the policy
has an effect on a very narrow segment of the vehicle fleet in the state of Coahuila, namely, the
government vehicle fleet, which is not directly addressed by TLU-2 or TLU-1. Some overlap is
expected between TLU-1 and TLU-2 because greater urban densification in TLU-1 is likely to
induce less passenger vehicle travel, which will affect the mode shift from passenger vehicle
travel to public bus transit. For that reason, the cost and emission savings from gasoline from
TLU-2 are adjusted downward to account for less overall vehicle travel. This overlap increases
over the policy period; by 2030, TLU-2 gasoline reductions are adjusted downward by a factor of
1.9%, which is equivalent to the reduction in vehicle-kilometers traveled achieved by TLU-1.
The incorporation of plug-in electric vehicles to the State government fleet contemplated in TLU-3 will increase electricity demand. Policy scenario emissions from this marginal consumption of electricity is accounted for in the microeconomic analysis in order to evaluate the cost-effectiveness of this action. The relatively small additional increase in electricity demand for TLU-3 was taken into account in the integrative assessment described in Section 3.7 for electricity supply and demand. The TLU-3 impact did not result in any need to re-define the marginal electricity generation mix used during GHG impacts analysis.

6-5
Table 6-2. TLU Microeconomic Analysis Summary: Intra-Sector Overlap Adjusted
Intra-Sector Overlap Adjusted Results
In-State GHG Impacts Total GHG
Impacts Base Year 2014$
Policy ID Policy Name
Annual CO2e Impacts 2035
Cumulative 2035
Cumulative
NPV 2015-2035
Cost Effectiveness
2025 Tg 2035 Tg TgCO2e TgCO2e $Million $/tCO2e
TLU-1 Urban Density Index (0.068) (0.12) (1.3) (1.7) ($3,025) ($1,776)
TLU-2 Sustainable Urban Mobility (0.19) (0.35) (4.3) (5.6) ($30,201) ($5,428)
TLU-3 Energy Efficient Government Fleet (0.000051) (0.000088) (0.00095) (0.0012) $4 $3,004
Total After Intra-Sector Interactions /Overlap (0.26) (0.47) (5.6) (7.3) ($33,222) ($4,571)
*Note: (Negative cost values) imply net savings to society and positive cost values imply net societal costs.

6-6
Transportation and Land Use (TLU) Policy Descriptions
Three TLU policies were analyzed for the Coahuila CAP. Following is a short summary of each
policy. Appendix D contains the detailed policy descriptions, policy designs, implementation
mechanisms, related policies/ programs in place, data sources/ assumptions/ methodologies,
causal chains, stand-alone analytic results, key uncertainties, feasibility issues and additional
benefits and costs for each policy. The policy recommendations described briefly here not only
result in emission reductions and in some instances cost savings, but also offer a host of
additional benefits, such as reduced local air pollution; more livable, healthier communities; and
increased transportation choices. Policies seeking to improve travel choices and reduce VMT
would have the additional effect of reducing congestion and improving travel times and travel-
time reliability, while allowing vehicles to idle less and operate at speeds where they are more
efficient. Policies improving the efficiency of vehicles and supplying cleaner fuels would make
those miles driven less emissions-intensive. Overall, most policies produce significant fuel
savings, which results in savings directly to the driving public and to businesses. For TLU-1 and
TLU-2, these savings exceed any costs to comply with regulation or to implement new programs.
TLU-1. Increase Urban Density Index to Reduce Average Distance in Urban Transportation
The critical variable of efficient urban mobility is not the speed of transfers, but the average
distance traveled. During the last fifty years, as in the major metropolitan areas of the country, in
the state’s major cities, urban density has been drastically declining (in terms of inhabitants per
hectare). This policy would seek to contain first and then reverse the trend, allowing the creation
of more compact cities in which the average distance of daily transfers is reduced.
It is important to note that greater urban density does not require a substantial increase in the height
of buildings, as there are important land reserves in urbanized areas of the cities (e.g., in the state
capital, vacant lots account for nearly a quarter of the surface area of Saltillo). Raising property
tax in undeveloped areas would raise the cost of land speculation and thus encourage the practice
of urban infill to meet the needs of a growing population. Additionally, local zoning should allow
mix use developments, thus helping to reduce distance traveled in urban trips.
TLU-2. Promote Sustainable Urban Mobility Systems
The purpose of these measures is to modify the structure of daily transfers for clean or with
lower GHG emissions, while simultaneously reducing costs and travel times, improving the
aesthetics of public spaces, quality of life and economic competitiveness of cities. The expansion
of green areas would also enhance their ability to capture carbon.
As part of these actions, Coahuila will join the national strategies that seek to design and
implement a policy of sustainable mobility for cities of 500,000 or more inhabitants (Strategy
3.5.1 PECC), which aims to promote key transportation projects that exhibit transit travel time

6-7
reduction, socio-economic profitability and improved environmental impact. (Strategy 3.5.7,
PECC).
TLU-3. Increase Purchase and Use of Hybrid Electric Vehicles in Government Fleets
To encourage the purchase of electric, plug-in hybrid and hybrid cars, this policy seeks to:
incorporate this type of vehicles in the state and local governments’ fleets; provide individuals
who acquire them, tax incentives upon purchase (VAT exemption and ISAN) and possession
(exemption for this concept) as well as special privileges for parking; support, together with
manufacturers of electric and hybrid cars with plants in the state, the development of a network
of charging stations.

7-1
Chapter 7 Agriculture, Forestry and Other Land Uses (AFOLU)
Sector
Sector Overview
The AFOLU sector consists of two main subsectors: Agriculture; and Forestry & Other Land
Use. The agriculture subsector can be further disaggregated into crop production and livestock
management. GHG emissions from crop production come mainly from a group of sources
referred to as “managed soils”. Figure 7-1 provides the GHG emissions baseline for the
agriculture sector. The managed soils emissions include N2O emissions from nitrogen inputs to
crop soils and CO2 emissions from urea application and soil liming. In Coahuila, information on
urea application and soil liming were not identified during the 2010 baseline effort, and thus are
not included. In addition, emissions of N2O and CH4 from crop residue burning are expected to
add small amounts to the agriculture sector totals, however, data on this activity were also
lacking.
Figure 7-1. Coahuila Agriculture GHG Baseline
As indicated in Figure 7-1, emissions for the agriculture sector are expected to grow throughout
the forecast period due to continued growth in the livestock sector. Emissions from the livestock
management subsector include CH4 from manure management and from enteric fermentation
(mainly cattle). Figure 7-1 indicates that manure management emissions are very small
contributors to sector level emissions. This is due to both the climate of Coahuila, as well as the
0.0
0.5
1.0
1.5
2.0
2.5
1990 1995 2000 2005 2010 2015 2020 2025 2030 2035
GH
G E
mis
sio
ns (
Tg
CO
2e)
Managed Soils
ManureManagement
EntericFermentation

7-2
methods of manure management. Enteric fermentation emissions along with managed soils are
the predominant sources of GHGs for Coahuila.
Overall, the Agriculture sector contributes only a small amount of CO’s GHG emissions. In
2005, the sector contributed about 5% of state-wide emissions. This is expected to remain about
the same by 2035 under BAU conditions. It is important to note that these emission estimates
only include non-combustion sources. GHG emissions would also occur from the combustion of
fuels in agricultural equipment and processes. However, as is common in many inventory efforts,
a break-out of fuel combustion for the agricultural use was not available from the previous
inventory work conducted by CCS. The only exception was for liquefied petroleum gas (LPG)
combustion in agriculture (in 2005, about 0.02 TgCO2e were emitted). Diesel fuel is the most
common fuel for use in agriculture, especially crop production. The agricultural fuel usage is
assumed to be included in the fuel use data used to estimate the commercial or industrial fuel
use. Since a full accounting of fuel use could not be made for all fuels, the emissions were
excluded from Figure 7-1; however these are included in the total State-wide emissions
summaries elsewhere in this report.
The Forestry & Other Land Use (FOLU) GHG baseline is provided in Figure 7-2 below. In
contrast to the other sectors, FOLU is estimated to be net emissions sink in Coahuila. The net
emissions line shown in the chart indicates that as a result of carbon sequestration in the forestry
subsector, the overall net emissions for FOLU are about a half of a teragram. The forest carbon
(C) sequestration values address the accumulation of biomass in the State’s forests, net of losses
to disturbances (including fires) and wood harvests.
Additional sources of emissions in the FOLU sector are non-CO2 emissions (CH4 and N2O) from
wildfires and net carbon flux in perennial agriculture (i.e. orchards). These non-CO2 emissions
are too small to be seen in the chart. For wildfires, the CO2 emissions are biogenic and therefore
treated as neutral in terms of climate forcing, although they are netted out of the total forest C
sequestration estimates. The perennial agriculture emissions are also shown as negative,
indicating a net sequestration of CO2 from the atmosphere.
Urban forest carbon flux is a FOLU subsector that was not addressed in the previous CO baseline
work due to a lack of data. This subsector includes net sequestration of CO2 in urban trees. It is
not expected that urban forests would be a significant net source or sink in CO based on climate
and current urban cover; however, expansion of urban forest cover is a common policy objective
in many climate action plans and was analyzed as a policy for this CO Climate Action Plan (as
described later in this chapter).

7-3
Figure 7-2. Coahuila FOLU GHG Baseline
Key Challenges and Opportunities
While the AFOLU sector contributes little to the overall Coahuila emissions baseline, there are
opportunities for emissions reduction in other sectors that result from implementation of
agricultural and forestry policies. For example, renewable electricity production from anaerobic
digestion of livestock manure offsets power requirements from the electrical grid, which
indirectly reduces emissions from the electricity supply sector. Similarly, a policy that seeks to
expand urban forest canopies within the State not only produces GHG benefits through increased
carbon sequestration, but also reduces energy requirements for buildings that are shaded by the
new urban trees. This again reduces electricity requirements from the grid and offsets electricity
supply emissions.
It is these types of actions that offer the best opportunities for net GHG reductions and the
associated economic benefits in Coahuila. Additional areas for future consideration of policy
analysis in the AFOLU sector are soil carbon management and nutrient management. Aligned
with nutrient management is the implementation of new and more efficient crop production
technologies. These also offer potential for reducing emissions in other sectors, since due to
current data limitations, the fuel use for agriculture is included within the Transportation sector.
Overview of Plan Recommendations and Estimated Impacts
Three policies were developed and analyzed for the AFOLU sector that are consistent with the
opportunities identified above:
-0.70
-0.60
-0.50
-0.40
-0.30
-0.20
-0.10
0.00
0.10
1990 1995 2000 2005 2010 2015 2020 2025 2030 2035
GH
G E
mis
sio
ns
(Tg
CO
2e)
Forest C Sequestration Fires (non-CO2 emissions)
Perennial Woody Crops Net Emissions

7-4
AFOLU-1: Dairy Cattle Manure Management – This policy proposes using manure
generated in the dairy farms of the state of Coahuila for the production of biofertilizer
and electricity, thus supporting the reduction in the use of fossil fuels in energy
generation.
AFOLU-2: Urban Forestry – Urban reforestation includes complete restoration and
maintenance of green areas with emphasis in rescuing and preserving native species
which permits conservation and protection of the wide genetic biodiversity in the state.
Also, urban trees strategically planted to provide shade or wind protection for buildings
can generate benefits in energy savings (in CO, mostly lowering summer air conditioning
costs). Additionally, urban trees capture rain water, which reduces the amount of storm-
water that ends up at water treatment plants in areas with combined sewerage systems.
AFOLU-3: Rural Forestry - Reforestation and conservation of these forested lands
promotes an increase in carbon dioxide sequestration above the levels expected in BAU
landcover (e.g. grassland or brushland). Additional benefits of reforestation include
greater potential for the rescue of native species, protection of biodiversity, and
enhancement of water resources.
Table 7-1 below provides a summary of the results of the microeconomic analyses conducted for
each of the AFOLU policies. These results are shown on a “stand-alone” basis, meaning that
they were evaluated against BAU conditions assuming that no other policies would be
implemented. These results indicate that the total annual 2035 GHG reductions would be 0.15
TgCO2e and the cumulative reductions would be 1.7 TgCO2e from 2016-2030. Net societal
implementation costs would be 404 million pesos ($2014). Implementation costs for the suite of
policies (CE = $147) is fairly low for policies in the AFOLU sector, although the GHG reduction
potential was found to be modest.

7-5
Table 7-1. AFOLU Microeconomic Analysis Summary: “Stand-Alone” Results
In-State GHG Impacts Total GHG
Impacts Base Year 2014$
Policy ID Policy Title
Annual CO2e Impacts
2035 Cumulative
2035 Cumulative
NPV 2016-2035
Cost Effectiveness
2025 Tg 2035 Tg TgCO2e TgCO2e $Million $/tCO2e
AFOLU-1. Dairy Cattle Manure Managementa (0.026) (0.055) (0.74) (1.8) $285 $159
AFOLU-2. Urban Forestryb (0.0037) (0.0093) (0.085) (0.089) $4.2 $47
AFOLU-3. Rural Forestryc (0.042) (0.084) (0.88) (0.88) $115 $131
Totals (0.072) (0.15) (1.7) (2.8) $404 $147
*Note: (Negative cost values) imply net savings to society and positive cost values imply net societal costs. a Cost estimates exclude potential incremental value of bio-fertilizer.
b Full benefits for tree planting policies are not realized until the full life of the newly planted trees are considered. For example, in 2075, the CE = -MX$130, indicating a net savings to society.
c Full benefits for tree planting policies are not realized until the full life of the newly planted trees are considered. For example, in 2075, the CE = MX$27, indicating a much smaller cost to society.
Overlaps Discussion
No intra-sector overlaps were identified among the AFOLU policies. However, potential inter-
sector overlaps or interactions do exist among CO SCAP policies. For example, AFOLU-2
addressing urban forestry includes the energy savings benefits, and the associated GHG benefits
and implementation costs, for building shading and wind protection overlaps with policies RCII-
2 and -3 address energy efficiency in residential and commercial buildings (via new codes and
standards and increased appliance efficiencies). These overlaps are further discussed in Chapter
3 (Section 3.7).
The other area where there can be inter-sector interactions is in situations where an AFOLU
policy has an estimated electricity system impact (e.g. new renewable energy or energy
efficiency). Section 3.7 provides a discussion of how these types of electricity system
interactions were addressed for all sectors with policies that have electricity system impacts. The
AFOLU policies involved here are AFOLU-1 and -2. AFOLU-1 (dairy manure management)
implementation will result in additional renewable electricity being supplied to the grid, while
AFOLU-2 (urban forestry) will reduce building energy demand.
Another inter-sector overlap identified for the AFOLU sector policies is between AFOLU-2 and
RCII-1 (and potentially to a lesser extent RCII-2). The building energy savings impacts achieved
through implementation of AFOLU-2 (greater shading of buildings resulting in lower air
conditioning demands) overlaps with the energy reductions associated with greater air
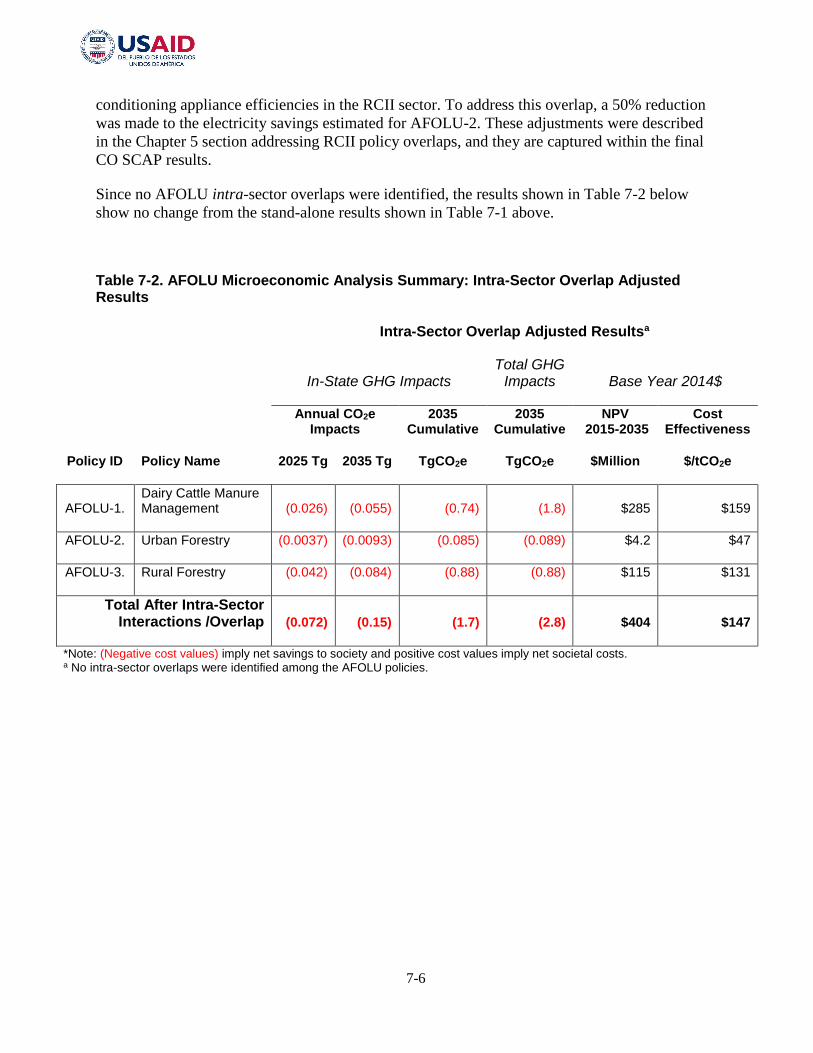
7-6
conditioning appliance efficiencies in the RCII sector. To address this overlap, a 50% reduction
was made to the electricity savings estimated for AFOLU-2. These adjustments were described
in the Chapter 5 section addressing RCII policy overlaps, and they are captured within the final
CO SCAP results.
Since no AFOLU intra-sector overlaps were identified, the results shown in Table 7-2 below
show no change from the stand-alone results shown in Table 7-1 above.
Table 7-2. AFOLU Microeconomic Analysis Summary: Intra-Sector Overlap Adjusted Results
Intra-Sector Overlap Adjusted Resultsa
In-State GHG Impacts Total GHG
Impacts Base Year 2014$
Policy ID Policy Name
Annual CO2e Impacts
2035 Cumulative
2035 Cumulative
NPV 2015-2035
Cost Effectiveness
2025 Tg 2035 Tg TgCO2e TgCO2e $Million $/tCO2e
AFOLU-1. Dairy Cattle Manure Management (0.026) (0.055) (0.74) (1.8) $285 $159
AFOLU-2. Urban Forestry (0.0037) (0.0093) (0.085) (0.089) $4.2 $47
AFOLU-3. Rural Forestry (0.042) (0.084) (0.88) (0.88) $115 $131
Total After Intra-Sector Interactions /Overlap (0.072) (0.15) (1.7) (2.8) $404 $147
*Note: (Negative cost values) imply net savings to society and positive cost values imply net societal costs. a No intra-sector overlaps were identified among the AFOLU policies.

7-7
Agriculture, Forestry and Other Land Uses (AFOLU) Policy Descriptions
Three AFOLU policies were analyzed for the Coahuila SCAP. Following is a short summary of
each policy. Appendix F contains the detailed policy descriptions, policy designs,
implementation mechanisms, related policies/ programs in place, data sources/ assumptions/
methodologies, causal chains, stand-alone analytic results, key uncertainties, feasibility issues
and additional benefits and costs for each policy.
AFOLU-1. Dairy Cattle Manure Management
This policy proposes using manure generated in the dairy farms of the state of Coahuila for the
production of bio-fertilizer and electricity, thus supporting the reduction in the use of fossil fuels
in energy generation. The focus will be in the Laguna Region, where under BAU conditions, it is
expected that only about 7% of dairy manure will be managed using anaerobic digestion (AD)
technologies that reduce methane emissions and produce renewable electricity. Through
implementation of this policy, 40% of dairy manure will be managed via anaerobic digestion by
2025. The policy will target implementation of AD technology at both large dairies (>1,500 head
of cattle; 60% of targeted population) and medium-sized dairies (500 – 1,500 head of cattle; 40%
of targeted population).
AFOLU-2. Increase and Maintenance of Urban Vegetation
Urban reforestation includes complete restoration and maintenance of green areas with emphasis
in rescuing and preserving native species. This supports conservation and protection of the wide
genetic biodiversity in the State. Also, strategically-planted urban trees provide shade and/or
wind protection for buildings and thus can generate benefits in energy savings (in CO, mostly
lowering summer air conditioning costs). Additionally, urban trees capture rain water, which
reduces the amount of storm-water that ends up at water treatment plants in areas with combined
sewerage systems.
The policy addresses incremental urban tree plantings of 5,000 trees per year beginning in 2016
all the way through the planning period of 2035. This results in a total expansion of the urban
forest of the State of 100,000 trees (the equivalent of about 240 hectares of rural forest for the
State). Further, most of these new plantings (65%) will be strategically-sited to achieve energy
savings benefits.
AFOLU-3. Increase and Conservation of Vegetation in Rural Areas
Reforestation and conservation of these forested lands promotes an increase in carbon dioxide
sequestration above the levels expected for the BAU landcover (e.g. grassland or brushland).
Additional benefits of reforestation include greater potential for the rescue of native species,
protection of biodiversity, and enhancement of water resources.

7-8
Through property acquisition or the establishment of conservation easements with property
owners, the goals of the policy are to reforest approximately 3,200 hectares per year during the
20 year CO SCAP planning period (nearly 64,000 hectares total). Lands targeted for
conservation and reforestation will be at the rural-urban interface which will indirectly influence
more efficient land use and “smart growth”. Thus, this policy is complementary to TLU-1 which
seeks to achieve higher urban densities.
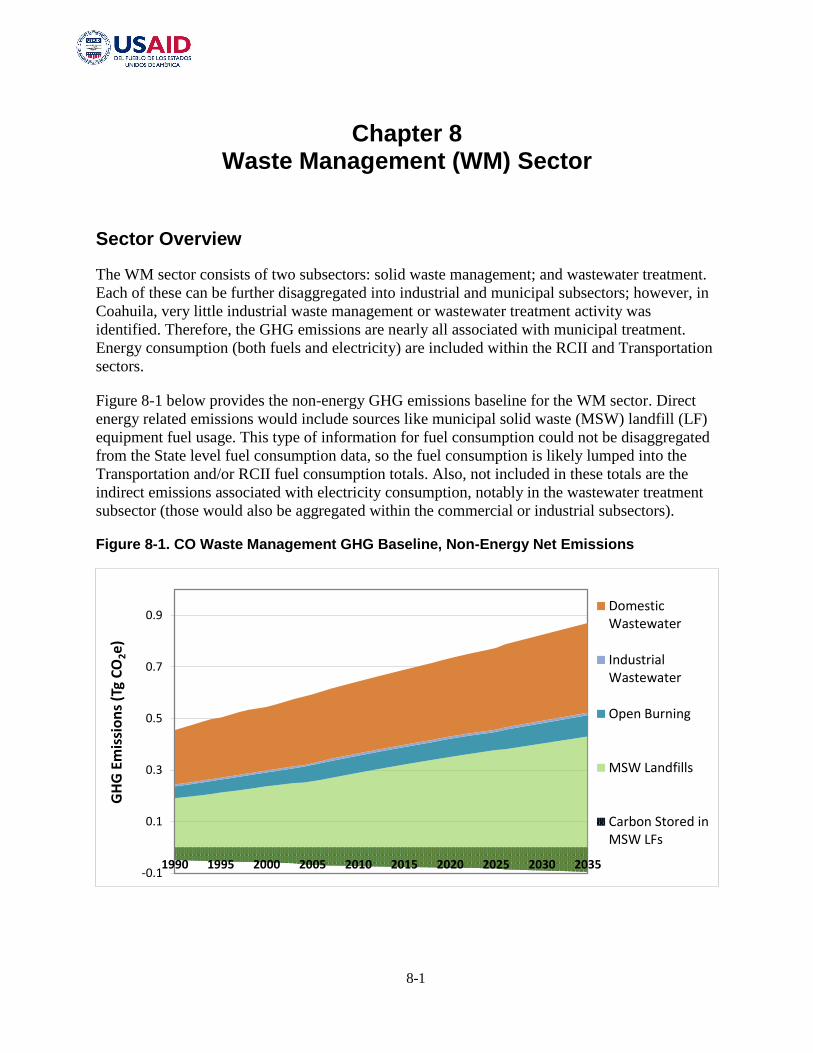
8-1
Chapter 8 Waste Management (WM) Sector
Sector Overview
The WM sector consists of two subsectors: solid waste management; and wastewater treatment.
Each of these can be further disaggregated into industrial and municipal subsectors; however, in
Coahuila, very little industrial waste management or wastewater treatment activity was
identified. Therefore, the GHG emissions are nearly all associated with municipal treatment.
Energy consumption (both fuels and electricity) are included within the RCII and Transportation
sectors.
Figure 8-1 below provides the non-energy GHG emissions baseline for the WM sector. Direct
energy related emissions would include sources like municipal solid waste (MSW) landfill (LF)
equipment fuel usage. This type of information for fuel consumption could not be disaggregated
from the State level fuel consumption data, so the fuel consumption is likely lumped into the
Transportation and/or RCII fuel consumption totals. Also, not included in these totals are the
indirect emissions associated with electricity consumption, notably in the wastewater treatment
subsector (those would also be aggregated within the commercial or industrial subsectors).
Figure 8-1. CO Waste Management GHG Baseline, Non-Energy Net Emissions
-0.1
0.1
0.3
0.5
0.7
0.9
1990 1995 2000 2005 2010 2015 2020 2025 2030 2035
GH
G E
mis
sio
ns
(Tg
CO
2e)
DomesticWastewater
IndustrialWastewater
Open Burning
MSW Landfills
Carbon Stored inMSW LFs

8-2
The emissions shown in Figure 8-1 represent net emissions, since biogenic carbon storage in
landfills is also included. Biogenic carbon here refers to food and garden waste. When biogenic
waste materials (food, lawn/garden waste, wood, paper) are placed in landfills, these materials
will likely take many decades to decompose. As a result, some level of carbon storage takes
place, and it is accounted for in the net emissions results shown in Figure 8-1. Standard
accounting procedures are to credit carbon storage for food and lawn/garden waste, but not for
other biogenic materials, such as wood and paper, since the sustainability of their sourcing is
uncertain. This carbon storage is estimated to be 0.07 TgCO2e in 2010 and is expected to grow to
0.09 TgCO2e in 2035.
Methane emissions from MSW landfills contribute about 50% of the gross emissions in 2010
(0.36 TgCO2e). The contributions from this source are expected to grow to about 54% (0.53
TgCO2e) by 2035. The other large contributor is domestic wastewater treatment (CH4 and N2O
emissions from the treatment process). Gross emissions contributions were about 39% in 2010
(0.28 TgCO2e) and are expected to contribute around 36% (0.35 TgCO2e) in 2035.
Overall, the WM sector contributes a small amount of the total State-wide emissions. The sector
contributed a little under 3% to the 2010 emissions totals, and in 2035, the contribution is
expected to be 2% of State-wide emissions. It is important to note that these emissions only
address non-energy emissions. Emissions associated with fuel combustion (e.g. for the
transportation of waste, landfill operations, etc.) or for electricity consumption (e.g. for
wastewater treatment processes) are included in the totals of the RCII and Transportation sectors.
Future work on the baseline should attempt to allocate the energy related emissions from these
sectors to the applicable WM subsectors.
Key Challenges and Opportunities
Within the solid waste management subsector, opportunities for reducing emissions are typically thought about in terms of the following hierarchy:
I. Solid waste source reduction: when generation is reduced, the emissions associated with all downstream management are reduced (e.g. waste combustion or landfilling); as are the emissions associated with the initial production and transportation of the waste material (upstream emissions);
II. Recycling: recycling a waste material will often reduce the overall emissions associated with the upstream production of materials and their subsequent downstream management in the waste stream;
III. Organics Management: examples include anaerobic digestion, composting, or other methods that reduce downstream management emissions as compared to conventional management methods (e.g. landfilling or combustion);
IV. Other Enhanced Downstream Management Approaches: these could include any number of methods to reduce emissions from conventional methods, including waste to energy projects, landfill gas utilization, and other technologies.
The solid waste policy selected for analysis in the CO SCAP addresses group IV in the solid waste management hierarchy above: extension of landfill gas management within the State.

8-3
For wastewater treatment, there are three general approaches in the hierarchy to managing emissions and energy use, and all of these have many alternatives:
I. Reducing Wastewater Generation: as with solid waste, for any reduced wastewater generation – a) less water has to be extracted, treated and distributed from the source, saving energy and emissions; and b) less wastewater has to be treated, also saving energy and emissions; so, this approach addresses any actions taken by residential, commercial, institutional, or industrial end users to reduce their initial consumption of water;
II. Re-Use or Reclamation of Wastewater: wastewater can often be re-used or reclaimed for another purpose; thereby, the overall energy and emissions associated with sourcing water and treating wastewater are reduced, as is the consumption of the primary water resource itself (e.g. surface or groundwater);
III. Reducing Process and/or Energy Emissions during Wastewater Treatment, including on-site renewable energy generation: many alternatives exist here with the most common being energy efficiency retrofits at wastewater treatment plants; however, other alternatives could include process improvements to reduce methane or nitrous oxide emissions, as well as the use of anaerobic digestion of organic wastes to generate methane for use as process heat or to generate electricity.
Policy WM-2 selected for the CO SCAP, Water Sanitation and Reclamation for Industrial Processes and Irrigation, comes from group II in the hierarchy above. More details on the WM policies and an assessment of their direct impacts is provided in the next section.
Overview of Plan Recommendations and Estimated Impacts
Two policies were developed and analyzed within the WM sector:
WM-1. Landfill Gas Management: This policy seeks to capture methane from the
landfills of Saltillo and Torreon to reduce GHG emissions and to generate electricity with
connection into the public grid;
WM-2. Water Sanitation and Reclamation for Industrial Processes and Irrigation: This
policy supports projects to increase the percentage of wastewater sanitation and the
subsequent re-use of wastewater. Increased re-use of wastewater for use in industry or for
irrigation purposes decreases energy use as compared to the use of potable water which
may be sourced and pumped from distant sources.
Table 8-1 below provides a summary of the results of the microeconomic analyses conducted for
each of the WM policies. These results are shown on a “stand-alone” basis, meaning that they
were evaluated against BAU conditions assuming that no other policies would be implemented.
These results indicate that the total annual 2035 in-State GHG reductions would be 0.17 TgCO2e
and the cumulative in-State reductions would be 2.9 TgCO2e from 2016-2035. Total reductions,
including in-State and potentially out of State reductions, produced by these policies would total
3.1 TgCO2e from 2016 – 2035. Implementation of both policies is estimated to result in net
societal savings upon full implementation of $2,234 million pesos ($2014). These savings are

8-4
presented on a net present value (NPV) basis using a financial base year of 2014. The net savings
produce a negative cost effectiveness (CE) value of -$712/tCO2e.
Table 8-1. WM Microeconomic Analysis Summary: “Stand-Alone” Results
In-State GHG Impacts Total GHG
Impacts Base Year 2014$
Policy ID Policy Title
Annual CO2e Impacts
2035 Cumulative
2035 Cumulative
NPV 2016-2035
Cost Effective
-ness
2025 Tg 2035 Tg TgCO2e TgCO2e $Million $/tCO2e
WM-1. Landfill Methane Gas (0.13) (0.13) (2.1) (2.2) ($153) ($71)
WM-2.
Water Sanitation and Reclamation for Industrial Processes and Irrigation (0.037) (0.051) (0.76) (0.98) $2,081 ($2,132)
Totals (0.17) (0.19) (2.3) (3.1) ($2,234) ($712)
*Note: (Negative cost values) imply net savings to society and positive cost values imply net societal costs.
Overlaps Discussion
No intra-sector overlaps were identified among the WM policies. Inter-sector overlaps or
interactions among CAP policies, however, do exist. Both policies will produce renewable
electricity that will either supplant on-site use or be supplied to the local grid. As a result, this
produces a possible interactive effect with the electricity supply-side policies. The overall CO
SCAP electricity supply and demand inter-sector integration assessment is provided in Section
3.5.
Since there were no intra-sector interactions or overlaps identified, the results shown in Table 8-
2 below show no change from the stand-alone results shown in Table 8-1 above.

8-5
Table 8-2. WM Microeconomic Analysis Summary: Intra-Sector Overlap Adjusted Results
In-State GHG Impacts Total GHG
Impacts Base Year 2014$
Policy ID Policy Name
Annual CO2e Impacts
2035 Cumulative
2035 Cumulative
NPV 2016-2035
Cost Effective-
ness
2025 Tg 2035 Tg TgCO2e TgCO2e $Million $/tCO2e
WM-1. Landfill Methane Gas (0.13) (0.13) (2.1) (2.2) ($153) ($71)
WM-2.
Water Sanitation and Reclamation for Industrial Processes and Irrigation (0.037) (0.051) (0.76) (0.98) $2,081 ($2,132)
Total After Intra-Sector Interactions/ Overlap (0.17) (0.19) (2.9) (3.1) ($2,234) ($712)
*Note: (Negative cost values) imply net savings to society and positive cost values imply net societal costs.

8-6
Waste Management (WM) Policy Descriptions
Two WM sector policies were analyzed for the Coahuila SCAP. Following is a short summary of
each policy. Appendix G contains the detailed policy descriptions, policy designs,
implementation mechanisms, related policies/ programs in place, data sources/ assumptions/
methodologies, causal chains, stand-alone analytic results, key uncertainties, feasibility issues
and additional benefits and costs for each policy.
WM-1. Landfill Methane Utilization
This policy promotes the expansion of landfill methane energy capture and utilization in the
State. The policy expands the use of this technology beyond BAU conditions which include the
existing 1 mega-watt (MW) methane collection and utilization project in Saltillo. Under the
policy, the methane collection and electricity generation capacity at Saltillo will be doubled to 2
MW by 2020. Also, by 2025, a 1 MW system will be constructed at the Torreon landfill. The
renewable electricity generated by methane from Coahuila’s landfills will be supplied to the
Federal Electricity Commission’s (CFE) public grid.
Landfill gas capture and utilization reduces direct CH4 emissions, and indirectly reduces fossil
fuel use to produce electricity for the public grid. It also generates local income and employment
for landfill operators.
WM-2. Water Sanitation and Reclamation for Industrial Processes and Irrigation
This policy promotes both an increase in the amount of wastewater collected for centralized
treatment, as well as increasing percentages of reclamation of wastewater for industrial processes
and irrigation of urban green areas and agricultural crops. The policy will then: reduce the
amount of GHG emissions and water pollutions resulting from not sanitizing wastewater under
BAU conditions; reduce the amount of water consumed from primary sources (e.g. surface or
groundwater); and reduce the overall amount of energy required for water use in industrial
processes and irrigation purposes.
Since the extension of wastewater treatment collection and centralized treatment services will
require an increase in energy consumption as compared to BAU conditions, the policy will also
promote the application of renewable energy (photo-voltaic electricity generation) at levels that
will offset the increase in energy requirements (because of the expansion of centralized treatment
services and the associated energy use, without this aspect of the policy, there would not likely
be a net GHG benefit). Usage of reclaimed water for urban green areas allows savings in
consumption of water from aquifers, at the same time that green areas in cities are preserved (see
AFOLU-2). Drinking water supplies for the population are also conserved.
