final q3-10 press (10 nov 2010)
TRANSCRIPT

November 11, 2010
Samart GroupSamart GroupQ3-2010
Audited Results

WATCHAI VILAILUCK
PRESIDENTSAMART CORPORATION PCL.

SIRICHAI RASAMEECHAN
EXECUTIVE VICE CHAIRMANSAMART CORPORATION PCL.

ICT SOLUTIONS
PAIROTE VAROPHAS
EXECUTIVE VICE CHAIRMANSAMART TELCOMS PCL.

MOBILE MULTIMEDIA
THANANAN VILAILUCK
PRESIDENT SAMART I-MOBILE PCL.

Samart Corporation PCLSamart Corporation PCLQ3-2010
Audited Results
November 11, 2010

Q3-2010 Consolidated Performance
4,499
3,755
139 193
0
500
1,000
1,500
2,000
2,500
3,000
3,500
4,000
4,500
Revenue Net Profit
Q3-09 Vs Q3-10Y-O-Y Q3-2010 Q3-2009
Revenues 3,755 4,499Net Profit 193 139
EPS 0.20 0.15
Total Assets 15,079 14,796Total Liabilities 9,520 9,919Equity 5,559 4,877
D/E (L/T debt) 0.11 0.21ROE (Annualized) 13.9% 11.4%ROA (Annualized) 5.1% 3.8%Revenues 17 %
Net Profit 39 %
Note: NP is excluded Minority Interest of subsidiaries
Drop in revenues >> Decreased on market average selling price from SIMNet Profit higher >> Improved GP from SIM&SAMTEL
>> Inventory management from SIM

4,354
3,755
145 193
0
500
1,000
1,500
2,000
2,500
3,000
3,500
4,000
4,500
Revenue Net Profit
Q2-10 Vs Q3-10Q-O-Q
Q3-2010 Consolidated Performance
Revenues 14 %Net Profit 33 %
Note: NP is excluded Minority Interest of subsidiaries
Drop in revenues >> From SIM&SAMTELNet Profit >> Higher GP from SIM&SAMTEL

Revenues - FlatNet Profit 59%
12,704 12,620
305 485
0
2,000
4,000
6,000
8,000
10,000
12,000
14,000
Revenue Net Profit
9M-09 Vs 9M-10Y-O-Y
9M-2010 Consolidated Performance
Note: NP is excluded Minority Interest of subsidiaries
Drop in revenues >> Remained flatNet Profit higher >> Improved GP from SIM&SAMTEL
>> Inventory management from SIM

Revenue & NP Contribution from Business Units
SIMSAMTELRelated
SIMSAMTELRelated
Revenue ContributionQ3-10
Net Profit ContributionQ3-10
55%27%
18%
34%
16%
50%
SAMART hold SIM 58.28%
SAMART hold SAMTEL 70.64%

Related BusinessesQ3-2010 Performance

191
182
198
203
170
175
180
185
190
195
200
205
Q4-2009 Q1-2010 Q2-2010 Q3-2010
Cambodia Air Traffic Services
Maintain 14,000 -15,000 flights per quarter
REVREV

49494954
20
25
30
35
40
45
50
55
60
Q4-2009 Q1-2010 Q2-2010 Q3-2010
Kampot Power Plant
KPP generating 16 MWe electricity
REVREV
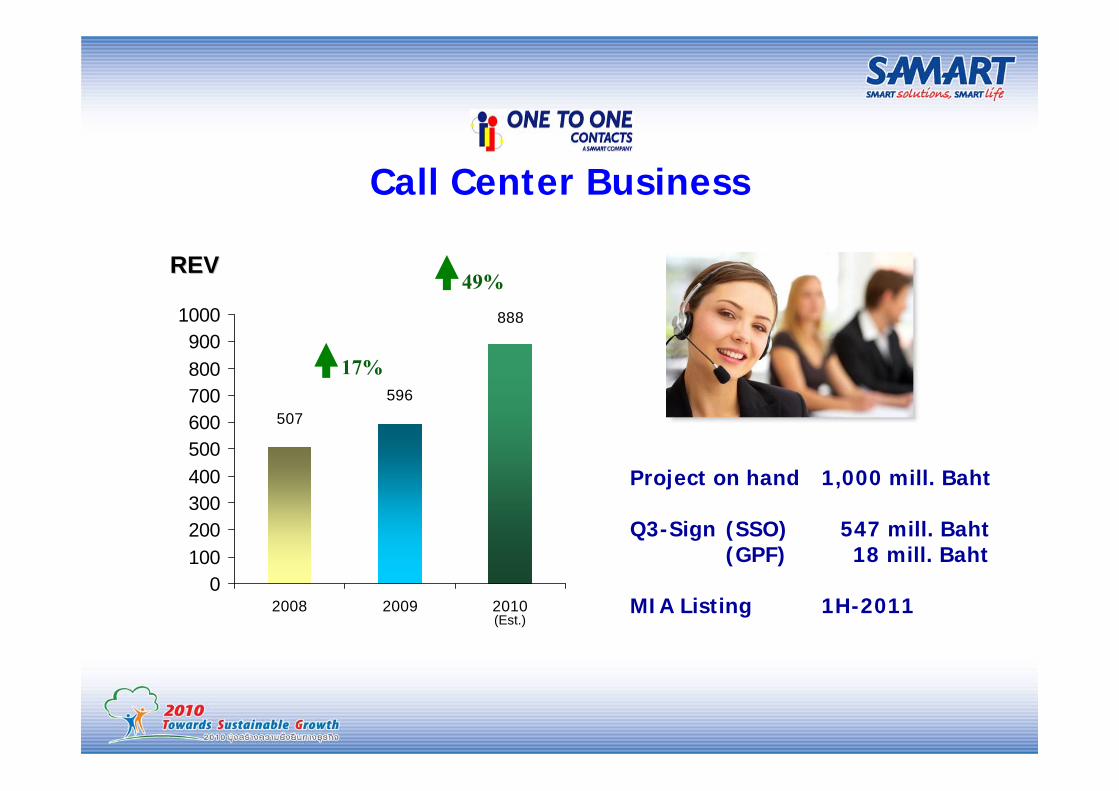
Call Center Business
Project on hand 1,000 mill. Baht
Q3-Sign (SSO) 547 mill. Baht(GPF) 18 mill. Baht
MIA Listing 1H-2011
888
596507
0100200300400500600700800900
1000
2008 2009 2010
REVREV
(Est.)
49%
17%

Vision & Security SystemTurnkey security solutions:
Customers:- Government Center- Bangkok Metropolitan Authority- AOT- TOT
Potential Opportunities:
- CTX Scanners- Govt Center Phase II- Chonburi Province Government
400
191
73
050
100150200250300350400450
2008 2009 2010
REVREV
(Est.)
109%
160%

Samart ISamart I--Mobile PCLMobile PCLQ3-2010
Audited Results
November 11, 2010

Q3-2010 Performance
2,524
2,058
34 51
0
500
1,000
1,500
2,000
2,500
3,000
Revenue Net Profit
Q3-2010 Q3-2009
Revenue 2,058 2,524Net Profit 51 34
EPS 0.012 0.008
Total Assets 5,760 6,046Total Liabilities 3,370 3,702Equity 2,390 2,344
D/E (L/T debt) 0.00 0.00ROE (ann.) 8.5% 5.8%ROA (ann.) 3.5% 2.2%
Q3-09 Vs Q3-10
Y-O-Y
Revenues 18 %Net Profit 50 %
Drop in revenues >> Decreased on market average selling price Net Profit higher >> Improved GP from mobile business and content business
>> Inventory management

2,048 2,058
31 51
0
500
1,000
1,500
2,000
2,500
Revenue Net Profit
Q2-10 Vs Q3-10Q-O-Q
Revenues - Flat
Net Profit 65%
Q3-2010 Performance
Drop in revenues >> Remained flat Net Profit higher >> Improved GP from mobile business
>> Inventory management

6,8586,364
90109
0
1,000
2,000
3,000
4,000
5,000
6,000
7,000
Revenue Net Profit
Revenues 7 %
Net Profit 21 %
9M-09 Vs 9M-10Y-O-Y
9M-2010 Performance
Revenue drop >> Avg. selling price decreased in mobile businessHigher NP >> Higher GP from Mobile business and inventory management

Handset Sold (Y-o-Y)HANDSET SOLDHANDSET SOLD 9M9M--20092009 9M9M--20102010
Domestic 2,089,342 2,417,916 unitsInternational 416,696 242,805 units
Total Handset Sold 2,506,308 2,660,751 units
Volume 6 %
83%
17%
DomesticInternational
91%
9%
DomesticInternational
Domestic vs. International Proportion
- Overall Growth in Mobile Business results from Continuous Domestic Growth.

Handset Sold (Units)
675,370 631,003782,969
938,562
745,197839,935 832,814
82,818
101,917215,425
100,724100,547
67,632 92,355
0
200,000
400,000
600,000
800,000
1,000,000
1,200,000
Q1-09 Q2-09 Q3-09 Q4-09 Q1-10 Q2-10 Q3-10
Domestic Inter
Q1-Q3 sold 2.50 M2009 sold 3.55 M
Q1-Q3 sold 2.66 M2010(est.) 3.70 M
Q4-10
1.04 M

Highlights
Total 567
Total 700
0
100
200
300
400
500
600
700
800
9M-2009 9M-2010
Content Sales (9 months)(Baht million)
Total Y-O-Y 24%
Non-Voice 113
Non-Voice 212
Voice 454 Voice 488
• Non-Voice Service : Steep Growth
• Voice Service : Steady Growth
Growth 88%
Growth 7.5%

MVNO Growth DriversStatus
Nature of business: Mobile Virtual Network OperatorSubscribers: 110,000 (Sep 10) (Postpaid 20% / Prepaid 80%)Expected sub by end 2010: 130,000 -150,000Current Position: No.1 3G MVNO in TOT Port and in Thailand
2010
2012
2011
• 3,000 Base Stations• Capacity 4 M Subs
• 5,220 Base Stations• Capacity 8 M Subs• 42 Mbps / 11 Mbps
• 550 Base Stations• Capacity 500K Subs• 7.2 Mbps / 1.6 Mbps
NetworkRollout Plan
110 k Subs
130-150 k Subs
125 k Subs
180 k Subs (Total TOT)
Q1 Q2 Q3 Q4Dec 09
- 80% of TOT Portfolio - Post paid 20% (Compared to Major Operators 10% )
Sep.10 Dec.10
i-mobile 3GX acquires 80% of TOT portfolio
i-mobile 3GX acquires 80% of TOT portfolio

Mobile Biz
Content Biz
Number One 3G MVNO in Thailand (80% of TOT’s portfolio)Hit 110,000 subscribers in Q3,10Segmented SIM Card : To launch 3GX Movie SIM with major
Total +24% Revenue Growth on Voice and Non-Voice service.
Q3 Y10 – Performance Highlight Summary
MVNO Biz
Increased Unit Sold ( 6 %) in Thailand MarketIncreased Market Share (28% to 31%)Average Price of i-Mobile Drops - 21% from THB 2,361 to 1,861

New product concept of iNew product concept of i--mobile phonemobile phone
Smart Feature Phone >>> MVNO ARPU Driven
Smart Phones & Gadget >>> 3G Content & Application Driven
email Facebook IMM Twitter
i-Note (7”- Android)with Digital Content
SNS Alert
Domestic Mobile Business Highlights
Android : i 651
Enhance mobile device with Social application, content altogether with affordable tariff plan
Android : i 691Android : i 810
App Portal

Currently Focus on Malaysia & Indonesia MarketCurrently Focus on Malaysia & Indonesia Market
International Mobile Business Highlights
Sri LankaMalaysia Indonesia IndiaBangladesh Cambodia IranSingapore Pakistan
Collaborate with Regional Operator Collaborate with Regional Operator -- AXIATAAXIATA
Penetrate products to more than 130 million subscribers of AXIATA’s
• Indonesia : Distribute through the largest Mobile Chain Store.
• Malaysia : Expansion of Channels coverage.
Introduce more smart phones and gadgets.
Regionally penetrate more volume through Regional Operator : AXIATA.

VDO Call Center & 3G VDO VAS to launchVDO Call Center & 3G VDO VAS to launch
Content Business Highlights
Call Center Service Horo Service Sport Service
• Dialing 4 digits call center no.• Service Enquiry for 3GX Users.
• Live Fortune Telling.• Horo on Demand.
• Live Sport.• Sport Hot Clip.
Evolution of 3G content via VDO Call Feature.

MVNO Business Highlights
Segmented SIM CardSegmented SIM Card Served various Segments
Movie SIM Music SIM Sport Traveling & Lifestyle
To penetrate in various focused market and increase market stickiness.
Unlimited Package for Smart Phones and GadgetUnlimited Package for Smart Phones and Gadget
i-Note (7”-Android) iPhone Blackberry
Unlimited Voice & Data
Tablet iPad
Offer Unlimited 3G Package for advanced devices.

Samart Samart TelcomsTelcoms PCLPCLQ3-2010
Audited Results
November 11, 2010

Q3-2010 Performance
1,433
1,026
92 94
0
200
400
600
800
1,000
1,200
1,400
1,600
Revenue Net Profit
Q3-09 Vs Q3-10Y-O-Y
Revenues 28%Net Profit 2%
6.9%6.3%ROA (Annualized)24.5%22.0%ROE (Annualized)
0.040.02D/E (L/T debt)
1,5021,705Equity3,8354,212Total Liabilities5,3375,916Total Assets
0.150.15EPS
9294Net Profit1,4331,026Revenues
Q3-2009Q3-2010Unit: Million
Note: NP is excluded Minority Interest of subsidiaries
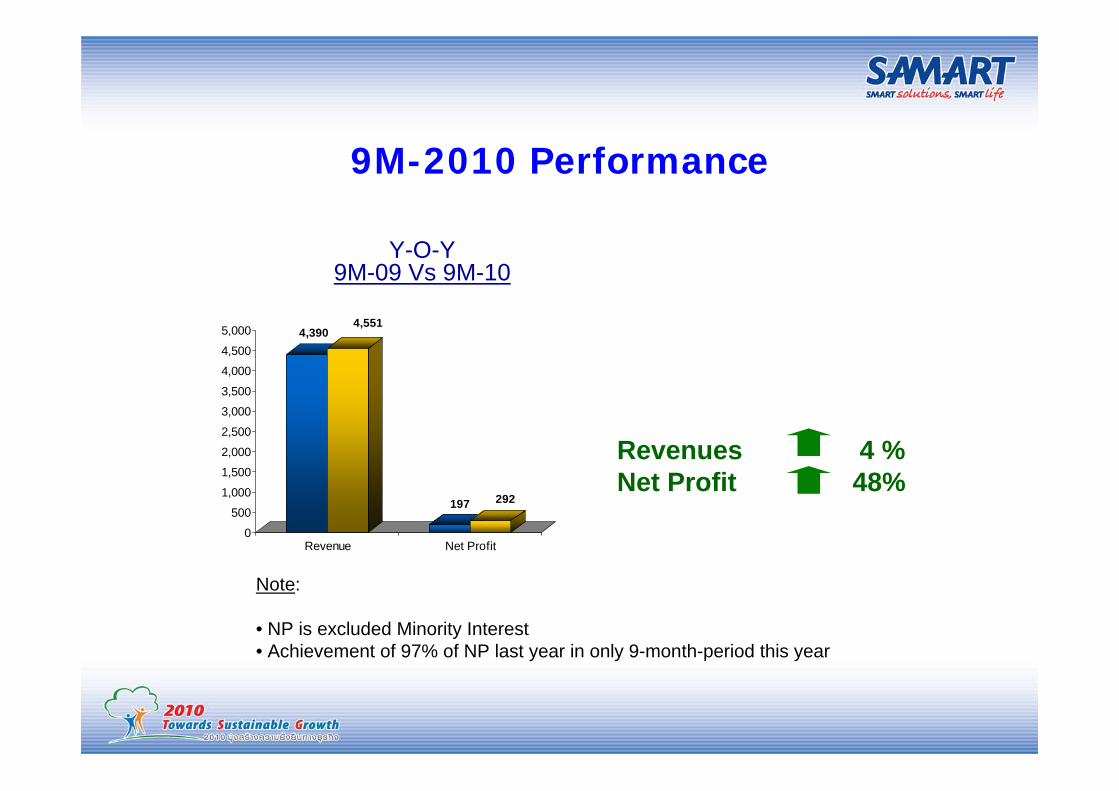
Revenues 4 %Net Profit 48%
4,3904,551
197 292
0
500
1,000
1,500
2,000
2,500
3,000
3,500
4,000
4,500
5,000
Revenue Net Profit
9M-09 Vs 9M-10Y-O-Y
9M-2010 Performance
Note:
• NP is excluded Minority Interest• Achievement of 97% of NP last year in only 9-month-period this year

SamtelSamtel Revenue: Govt. Clients DominateRevenue: Govt. Clients Dominate
20092008
13%
87%
Corporate Government
7%
93%
Corporate Government
9M-2010
5%
95%
Corporate Government

Project Summary Project Summary 20102010
• New Sign for Q3-10 > 1,000 MB
• Project signed in 2010 to date > 3,000 MB
Highlight Q3-10
• Number of projects on the list worth~ 3,200 MB• Y2010 is expected to break the highest record ever
Highlight Q4-10
MBProject Value Est. Rev Rec. in Est.Backlog Est. Rev Rec. in Est.Backlog
9M' 2010 End of 9M' 2010 Q4'2010 End of Y' 2010Signed Before 2010 5,261 2,449 2,812 466 2,346 New Sign for Q1 - 2010 1,541 1,121 420 311 108 New Sign for Q2 - 2010 377 145 232 232 - New Sign for Q3 - 2010 1,091 61 1,030 281 749 Major Project Signed in 9M 8,269 3,776 4,493 1,290 3,203 Miscelleneous Project 1,000 750 250 250 - Total Project Signed in 9M 9,269 4,526 4,743 1,540 3,203 Expected Sign for Q4 - 2010 3,200 - - 500 2,700 Total Project 12,469 4,526 4,743 2,040 5,903
Project name

Value of project on hand (As of Q3-2010) >>>Baht 4,743 mill
Expect to sign Q4-2010 >>> Baht 3,200 mill
Total Revenues 2010 (est.) >>> Baht 6,566 mill
SamtelSamtel Project StatusProject Status
Other Major Projects to be concluded soon:
• TOT 3G Network Expansion • NGN Network

