final project report - sccrtc.org · aashto guide for geometric design of transit facilities on...
TRANSCRIPT

Final Project ReportMonterey Bay Area Feasibility Study of Bus on Shoulder Operations on State Route 1 and the Monterey Branch Line
Monterey-Salinas TransitJune 26, 2018


Acknowledgements
Project Partners
Monterey-Salinas Transit (MST)
Transportation Agency for Monterey County (TAMC)
Association of Monterey Bay Area Governments (AMBAG)
California Department of Transportation (Caltrans)
Santa Cruz Metropolitan Transit District (METRO)
California Highway Patrol (CHP)
Santa Cruz County Regional Transportation Commission (SCCRTC)
Technical Advisory Committee
Monterey-Salinas Transit (MST)
Santa Cruz Metropolitan Transit District (METRO)
Transportation Agency for Monterey County (TAMC)
Santa Cruz County Regional Transportation Commission (SCCRTC)
California Department of Transportation (Caltrans) District 5
California Highway Patrol (CHP) Divisions 720 & 730
Association of Monterey Bay Area Governments (AMBAG)
City of Marina
City of Sand City
City of Seaside
City of Monterey
Fort Ord Reuse Authority (FORA)


i
Table of Contents
Chapter 1 Introduction and Summary................................................................................1-1Background – Legislation...............................................................................................................................................1-1
Plans and Policies – Monterey County ...........................................................................................................1-2Plans and Policies – Santa Cruz County .........................................................................................................1-3
Purpose of the Study ........................................................................................................................................................1-4The Bus-on-Shoulder Concept ...........................................................................................................................1-5Monterey Branch Rail Line..................................................................................................................................1-5
Study Partners/Outreach...............................................................................................................................................1-6Summary ..............................................................................................................................................................................1-7
Monterey County Alternatives...........................................................................................................................1-7Santa Cruz County Alternatives......................................................................................................................1-12Project Implementation and Next Steps .....................................................................................................1-17
Chapter 2 Literature Review ..............................................................................................2-1Bus-on-Shoulder ................................................................................................................................................................2-1
National Studies .......................................................................................................................................................2-1State-Sponsored Studies.......................................................................................................................................2-2TCRP Report 151 – A Guide for Implementing Bus-on-Shoulder (BOS) Systems.......................2-2TCRP Synthesis 64 Bus Use of Shoulders – A Synthesis of Transit Practice..................................2-5FHWA’s Use of Freeway Shoulders for Travel – A Guide for Planning, Evaluating, and Designing Part Time Shoulder Use as a Traffic Management Strategy............................................2-5AASHTO Guide for Geometric Design of Transit Facilities on Highways and Streets ...............2-5Minnesota Department of Transportation Bus Only Shoulder Guidelines.....................................2-6Transit Lane Demonstration Pilot Report – San Diego ...........................................................................2-7I-55 Bus-on-Shoulder Demonstration – In the Spirit of Time..............................................................2-7I-71 Cincinnati Left Shoulder Bus-on-Shoulder .........................................................................................2-8
Bus on Railroad Rights-of-Way ...................................................................................................................................2-8Los Angeles Orange Line Busway.....................................................................................................................2-8South Dade Busway................................................................................................................................................2-9Hartford-New Britain Busway ........................................................................................................................2-10
Chapter 3 Existing Conditions ............................................................................................3-1Background ..........................................................................................................................................................................3-1Study Area ............................................................................................................................................................................3-1Existing Traffic Conditions ............................................................................................................................................3-4
Highway Configuration .........................................................................................................................................3-4Traffic Volumes ........................................................................................................................................................3-4Travel Times and Speeds .....................................................................................................................................3-8Traffic Forecasts....................................................................................................................................................3-30
Existing Transit Conditions ........................................................................................................................................3-32Transit Services along Study Corridor ........................................................................................................3-32Weekday Transit Operations...........................................................................................................................3-39Transit Performance ...........................................................................................................................................3-42Transit Ridership on SR 1 .................................................................................................................................3-43

Table of Contents
ii
Geometric Design & Operating Guidelines ..........................................................................................................3-45Forms of Bus-on-Shoulder Concept..............................................................................................................3-45Existing Highway Geometrics..........................................................................................................................3-48Monterey Branch Line ........................................................................................................................................3-58
Chapter 4 Project Alternatives...........................................................................................4-1Monterey County ...............................................................................................................................................................4-1
Segment I: Reservation Road/SR 1 to Fremont Boulevard/SR 1 ......................................................4-2Segment II: Fremont Boulevard/SR 1 to SR 218 ......................................................................................4-6Segment III: SR 218 to Del Monte Avenue ................................................................................................4-10Segment IV: Casa Verde Way/SR 1 to Fremont Boulevard/SR 1....................................................4-12
Santa Cruz County ..........................................................................................................................................................4-15Right-Shoulder Alternatives ............................................................................................................................4-15Left-Side Alternative ...........................................................................................................................................4-24
Cost Estimates..................................................................................................................................................................4-26Methodology ...........................................................................................................................................................4-26Monterey County Cost Estimates...................................................................................................................4-28Santa Cruz County Cost Estimates.................................................................................................................4-28
Chapter 5 Evaluation of Alternatives .................................................................................5-1Evaluation Criteria and Methodology.......................................................................................................................5-1
Criteria .........................................................................................................................................................................5-1Methodology Overview.........................................................................................................................................5-2Alternatives and Timeframes.............................................................................................................................5-2
Evaluation Results.............................................................................................................................................................5-4Monterey County .....................................................................................................................................................5-4Santa Cruz County ................................................................................................................................................5-26
Appendix A – Cost Estimate
Appendix B – Benefit-Cost Calculations
List of Figures
Figure 1-1: Monterey County Study Area.........................................................................................................1-2Figure 1-2: Santa Cruz County Study Area and Planned Auxiliary Lane Improvements.............1-3Figure 1-3: Auxiliary Lane Concept ....................................................................................................................1-4Figure 1-4: Bus-on-shoulder Operation in Minneapolis ............................................................................1-5Figure 1-5: Orange Line Station............................................................................................................................1-6Figure 1-6: Depiction of Bus-on-Shoulder on SR 1 Southbound............................................................1-7Figure 1-7: Depiction of Bus on the Monterey Branch Line.....................................................................1-8Figure 1-8: Depiction of Bus on the Caltrans Pedestrian/Bicycle Trail ..............................................1-9

Table of Contents
iii
Figure 2-1: Bus-on-Shoulder in Minnesota .....................................................................................................2-1Figure 2-2: Shoulder Suitability Review Process..........................................................................................2-4Figure 2-3: SANDAG Bus-on-Shoulder Demonstration..............................................................................2-7Figure 2-4: I-71 Left Shoulder Bus-on-Shoulder...........................................................................................2-8Figure 2-5: Orange Line Station............................................................................................................................2-8Figure 2-6: South Dade Busway Station............................................................................................................2-9Figure 2-7: Dade Busway Showing Traffic Signals at a Street Crossing..............................................2-9Figure 2-8: Hartford-New Britain Busway Station....................................................................................2-10Figure 3-1: Bus-on-Shoulder Concept Focus Area – Santa Cruz County.............................................3-2Figure 3-2: Bus-on-Shoulder Concept Focus Area – Monterey County...............................................3-3Figure 3-3: State Route 1 Facility Type and Lanes in Each Direction – Santa Cruz County .......3-6Figure 3-4: State Route 1 Facility Type and Lanes in Each Direction – Monterey County .........3-7Figure 3-5: State Route 1 Travel Times for 2016 Weekdays – Monterey County........................3-10Figure 3-6: State Route 1 Travel Times for 2016 Weekdays – Santa Cruz County......................3-10Figure 3-7: Transit Operating Areas along SR 1 – Santa Cruz County ..............................................3-36Figure 3-8: Transit Operating Areas along SR 1 – Monterey County ................................................3-37Figure 3-9: Potential Bus-on-Shoulder Sites in Santa Cruz County ...................................................3-55Figure 3-10: Potential Bus-on-Shoulder Sites in Monterey County...................................................3-60Figure 4-1: Study Corridor Segments – Monterey County........................................................................4-2Figure 4-2: Monterey Segment I Options .........................................................................................................4-4Figure 4-3: Monterey Segment II Options........................................................................................................4-8Figure 4-4: Monterey Segment III Options ...................................................................................................4-11Figure 4-5: Monterey Option IV-A ....................................................................................................................4-14Figure 4-6: Santa Cruz Alternative 1 ...............................................................................................................4-18Figure 4-7: Santa Cruz Alternative 2 – Option A.........................................................................................4-21Figure 4-8: Santa Cruz Alternative 2 – Option B.........................................................................................4-23Figure 4-9: Santa Cruz Alternative 3 ...............................................................................................................4-25Figure 5-1: Freeway Speed versus Flow Relationship ...............................................................................5-9
List of Tables
Table 1-1: Evaluation Summary – Monterey County................................................................................1-10Table 1-2: Evaluation Summary – Santa Cruz County .............................................................................1-15Table 2-1: Shoulder Use by Buses: Geometric Design Criteria ...............................................................2-6Table 3-1: State Route 1 Road Attributes.........................................................................................................3-5Table 3-2: Study Corridor Daily Traffic Volumes..........................................................................................3-8Table 3-3: Study Corridor Travel Times ...........................................................................................................3-9Table 3-4: Weekday 50th Percentile (Median) Speeds –
Northbound AM (Monterey County)...............................................................................................3-13Table 3-5: Weekday 95th Percentile Speeds – Northbound AM (Monterey County) ................3-14Table 3-6: Weekday 50th Percentile (Median) Speeds –
Northbound PM (Monterey County)...............................................................................................3-15Table 3-7: Weekday 95th Percentile Speeds – Northbound PM (Monterey County).................3-16Table 3-8: Weekday 50th Percentile (Median) Speeds –
Southbound AM (Monterey County)...............................................................................................3-17

Table of Contents
iv
Table 3-9: Weekday 95th Percentile Speeds – Southbound AM (Monterey County).................3-18Table 3-10: Weekday 50th Percentile (Median) Speeds –
Southbound PM (Monterey County) ...............................................................................................3-19Table 3-11: Weekday 95th Percentile Speeds – Southbound PM (Monterey County) ..............3-20Table 3-12: Weekday 50th Percentile (Median) Speeds –
Northbound AM (Santa Cruz County) ............................................................................................3-22Table 3-13: Weekday 95th Percentile Speeds – Northbound AM (Santa Cruz County)............3-23Table 3-14: Weekday 50th Percentile (Median) Speeds –
Northbound PM (Santa Cruz County).............................................................................................3-24Table 3-15: Weekday 95th Percentile Speeds – Northbound PM (Santa Cruz County)............3-25Table 3-16: Weekday 50th Percentile (Median) Speeds –
Southbound AM (Santa Cruz County).............................................................................................3-26Table 3-17: Weekday 95th Percentile Speeds – Southbound AM (Santa Cruz County)............3-27Table 3-18: Weekday 50th Percentile (Median) Speeds –
Southbound PM (Santa Cruz County).............................................................................................3-28Table 3-19: Weekday 95th Percentile Speeds – Southbound PM (Santa Cruz County) ............3-29Table 3-20: State Route 1 Daily Traffic Forecasts......................................................................................3-31Table 3-21: Transit Services along Study Corridor ...................................................................................3-34Table 3-22: Distribution of Bus Lines in Focus Areas ..............................................................................3-38Table 3-23: Transit Operations during a Weekday...................................................................................3-40Table 3-24: Transit Performance in Peak Directions of Travel ...........................................................3-43Table 3-25: Weekday Transit Ridership on SR 1 in Peak Directions of Travel –
Monterey County .....................................................................................................................................3-44Table 3-26: Weekday Transit Ridership on SR 1 in Peak Directions of Travel –
Santa Cruz County...................................................................................................................................3-45Table 3-27: Typical Rights-of-Way – Santa Cruz County Focus Area................................................3-51Table 3-28: Typical Rights-of-Way – Monterey County Focus Area ..................................................3-56Table 4-1: Project Options’ Cost Estimates – Monterey County ..........................................................4-28Table 4-2: Project Alternatives’ Cost Estimates – Santa Cruz County...............................................4-29Table 5-1: Constructability Issues – Monterey County ..............................................................................5-6Table 5-2: 2016 Travel Time Analysis – Monterey County ......................................................................5-8Table 5-3: 2025 Travel Time Analysis – Monterey County ...................................................................5-10Table 5-4: Estimated Travel Time Savings by Alternative – Monterey County ............................5-12Table 5-5: Line 20 Operating Statistics – Monterey County..................................................................5-13Table 5-6: Line 20 Operating Cost Savings - Monterey County ...........................................................5-14Table 5-7: Incremental Annual Operating and Maintenance Costs – Monterey County...........5-14Table 5-8: Year 2025 Fleet Requirements – Monterey County............................................................5-15Table 5-9: Forecast Future Daily Ridership – Monterey County.........................................................5-17Table 5-10: Vehicle Miles of Travel Reduction – Monterey County...................................................5-18Table 5-11: Environmental Impact Review Summary – Monterey County....................................5-20Table 5-12: Incremental Capital Costs – Monterey County ...................................................................5-23Table 5-13: Cost-Benefit Summary – Monterey County..........................................................................5-25Table 5-14: Constructability Issues – Santa Cruz County.......................................................................5-27Table 5-15: Estimated Travel Time Savings – Santa Cruz County......................................................5-29Table 5-16: Operating Costs for Planned METRO Bus Services– Santa Cruz County.................5-30Table 5-17: Transit Operating Cost Savings – Santa Cruz County ......................................................5-31

Table of Contents
v
Table 5-18: Incremental Annual Operating Costs – Santa Cruz County...........................................5-31Table 5-19: Incremental Fleet Requirements – Santa Cruz County...................................................5-32Table 5-20: Forecast Year 2025 Daily Ridership – Santa Cruz County.............................................5-34Table 5-21: Incremental Vehicle Miles of Travel Reduction – Santa Cruz County ......................5-35Table 5-22: Environmental Impact Review Summary – Santa Cruz County..................................5-37Table 5-23: Incremental Capital Costs – Santa Cruz County .................................................................5-39Table 5-24: Benefit-Cost Summary – Santa Cruz County .......................................................................5-40


1-1
Chapter 1
Introduction and Summary
As the Monterey Bay area continues to grow, congestion and delay on State Route 1 (SR 1) in both
Monterey and Santa Cruz Counties is becoming more severe. This is being further exacerbated by
the strong Northern California economy. Monterey-Salinas Transit (MST) and Santa Cruz METRO
(METRO) buses using SR 1 contend with this congestion every day, diminishing the service
quality and reliability offered to riders and increasing costs of operation. Physical improvements
to the highway are difficult and can take many years due to lack of funding, environmental issues,
and freeway design complexities, as well as geographic constraints.
In response to these issues, MST, in partnership with the Transportation Agency for Monterey
County (TAMC), Association of Monterey Bay Area Governments (AMBAG), Caltrans, Santa Cruz
METRO, the California Highway Patrol (CHP), and the Santa Cruz County Regional Transportation
Commission (SCCRTC), is conducting this study to explore the potential for implementing bus-on-
shoulder operations on SR 1 in the areas that are found to be best suited to bus-on-shoulder
treatments. Under the right conditions, bus-on-shoulder treatments offer a relatively low-cost,
immediate means of providing buses with the ability to bypass freeway and highway congestion.
While not the ideal transportation solution, they have been proven to operate effectively and
safely when applied appropriately. In addition, this study explores the possibility of using the
Monterey Branch Line rail corridor for bus rapid transit (BRT) operations (see Error! Reference
source not found.). The study corridor extends from the Reservation Road/ Del Monte Boulevard
intersection in Marina to the intersection of Del Monte Avenue and English Avenue in Monterey, a
distance of 8.0 miles.
Background – Legislation California Assembly Bill No. 946 which was passed in 2013 authorizes the Monterey-Salinas
Transit District and the Santa Cruz Metropolitan Transit District to conduct a transit bus-only
program using the shoulders of certain state highways as transit bus-only traffic corridors,
subject to approval by the department (Caltrans) and the Department of the California Highway
Patrol.
California Assembly Bill No. 1746, which is currently under consideration, states that Monterey-
Salinas Transit, the Santa Cruz Metropolitan Transit District and a number of other transit
operators:
… may conduct a transit bus-only program using the shoulders of certain highways in the
state highway system within the areas served by the transit services of each entity, with
the approval of the department and the Department of the California Highway Patrol. The
department, the Department of the California Highway Patrol, and each participating
transit entity shall jointly determine the segments of each highway where it is
appropriate to designate the shoulders as transit bus-only traffic corridors, based upon
factors that shall include, but are not limited to, right-of-way availability and capacity,

Chapter 1 • Introduction and Summary
1-2
peak congestion hours, and the most heavily congested areas. Under the program, the
participating transit entities shall actively work with the department and the Department
of the California Highway Patrol to develop guidelines that ensure driver and vehicle
safety and the integrity of the infrastructure.
Figure 1-1: Monterey County Study Area
With the support of this legislation, MST and METRO embarked on this study to examine the
feasibility of bus-on-shoulder on SR 1.
Plans and Policies – Monterey County The Metropolitan Transportation Plan (MTP) and its Sustainable Communities Strategy (SCS) will
be released by the Association of Monterey Bay Area Governments in 2018. It identifies Bus Rapid
Transit in the SR 1 corridor as part of the year 2040 transit network plan, it also references this
bus-on-shoulder and branch line study as an ongoing effort. This plan will replace the current
Metropolitan Transportation Plan (MTP) and its Sustainable Communities Strategy (SCS) which
was adopted in 2014.
The Transportation Agency for Monterey County’s Measure X expenditure program includes the
Highway 1 Traffic Relief – Busway project which is described as follows: “Create a new rapid bus
corridor along Highway 1 between Monterey and Marina, with possible extensions to Castroville,

Chapter 1 • Introduction and Summary
1-3
utilizing the shoulder of the highway and/or portions of the parallel rail right-of-way, to provide a
way for buses to travel more rapidly than cars so that commuters spend less time in traffic.”
Plans and Policies – Santa Cruz County The SR 1 study corridor in Santa Cruz County extends from Morrissey Boulevard in the north to
Freedom Boulevard in the south, a distance of 7.5 miles. The planned SR 1 Auxiliary Lanes are
being implemented by the Santa Cruz County Regional Transportation Commission as part of the
Measure D funding program (see Figure 1-2). There are existing auxiliary lanes between the
Morrissey Boulevard and Soquel Avenue interchanges and between the 41st Avenue and Porter
Street interchanges.
Figure 1-2: Santa Cruz County Study Area and Planned Auxiliary Lane Improvements
Auxiliary lanes as shown conceptually in Figure 1-3 are short lane segments which extend along
the right side of the freeway between the on and off-ramps. They are very effective at increasing
the efficiency of the traffic weaving that occurs between ramps.
The first phase of the Measure D project will close the gap between the Soquel Avenue and 41st
Avenue interchanges. Further phases will extend the auxiliary lanes south to the State Park Drive
interchange. Ultimately the lanes will extend throughout the corridor to Freedom Boulevard, but

Chapter 1 • Introduction and Summary
1-4
currently planned or completed projects will provide auxiliary lanes all the way south to State
Park Drive.
The Association of Monterey Bay
Area Governments’ Metropolitan
Transportation Plan (MTP) and its
Sustainable Communities Strategy
(SCS) will be released in 2018 and
identifies Bus Rapid Transit in the
SR 1 corridor as part of the year
2040 transit network plan, it also
references this bus-on-shoulder and branch line study as an ongoing effort. This plan will replace
the current Metropolitan Transportation Plan (MTP) and its Sustainable Communities Strategy
(SCS) which was adopted in 2014.
The Santa Cruz County Regional Transportation Commission is conducting the Unified Corridor
Investment Study. The Unified Corridor Investment Study will examine which transportation
improvements work together to make the most effective use of the community’s north/south
transportation corridor including three parallel routes: SR 1, Soquel/Freedom, and the Santa Cruz
Branch Rail Line right-of-way. The study includes both HOV lanes and bus-on-shoulder
alternatives for the SR 1 corridor.
Santa Cruz METRO has indicated that it would consider providing a significant increase in bus
services using the SR 1 corridor between Santa Cruz and Watsonville if either bus-on-shoulder or
HOV lanes were implemented. The extent of the current congestion and delay on this section of
SR 1 is such that METRO purposely avoids using the freeway because of the low speeds and
uncertain conditions that are prevalent during long periods of the day.
Purpose of the Study The purpose of this study is to explore on a preliminary basis the concept of using bus-on-
shoulder operations on SR 1 in both Monterey and Santa Cruz Counties to enhance the operations
of MST and METRO buses during the periods of significant traffic congestion. The time savings
and improved transit reliability offered by the use of the shoulder should improve the transit
rider experience and attract new riders to transit, as well as reducing transit operating costs by
increasing speeds and improving reliability. The time savings will reduce the costs of providing
existing transit services and allow additional new services to be provided at a cost which is less
than that which would occur under current traffic conditions. In Monterey County, the option also
exists to provide a busway facility on the Monterey Branch Line rail right-of-way, which is owned
by the Transportation Agency for Monterey County. This study considers the use of the rail right-
of-way as one option for enhancing transit.
Figure 1-3: Auxiliary Lane Concept

Chapter 1 • Introduction and Summary
1-5
The Bus-on-Shoulder Concept Bus-on-shoulder refers to the
practice of allowing buses to use
the paved shoulder areas of
freeways to bypass areas of severe
traffic congestion. While the notion
of bus-on-shoulder conjures a
vision of buses flying by stalled
traffic on a narrow shoulder lane,
the reality is that bus-on-shoulder
involves operation of buses under
carefully defined and controlled
conditions. First, the shoulder area
has to meet certain criteria in terms
of its width, clearance, and
pavement strength. Second, the transit operators must receive training in how and when to
properly operate the bus on the freeway shoulder. Third, there are guidelines/rules as to what
traffic conditions/speeds must exist for a bus to be allowed to use the shoulder and how much
faster than the general freeway traffic the bus is allowed to operate. The bus-on-shoulder concept
is not new, it originated in this country in 1991 in Minnesota and has been implemented in a
number of locations since then, including San Diego, California. As a result, there is substantial
experience and research on bus-on-shoulder that can be used to inform the consideration of bus-
on-shoulder operations on SR 1 in Monterey and Santa Cruz counties.
1. The basic requirements for successful bus-on-shoulder operations include:
o Presence of buses – usually at least four buses per hour.
o Congested freeways – speeds of less than 35 miles per hour for right side shoulder use.
o Minimum 10-foot continuous shoulder of sufficient strength to support buses. Ideally,
the shoulder should be at least 12 feet wide to better protect protruding bus mirrors.
o Avoidance of multi-lane entrance and exit ramps and ramps with very high traffic
volumes (more than 1,000 vehicles per hour).
o Bus operators receive special training in how to operate on the shoulder and buses are
typically limited to a speed no more than 10 miles per hour faster than the general
freeway traffic.
o Special signage and driver education programs to inform motorists of the bus-on-
shoulder presence.
Monterey Branch Rail Line The concept of creating a bus facility on a railroad right-of-way is not new either, but it is not a
widely-used practice. Typically, a two-lane roadway designed exclusively for buses would be
developed within the right-of-way. Stations or stops would also be in the right-of-way, often
Figure 1-4: Bus-on-shoulder Operation in Minneapolis

Chapter 1 • Introduction and Summary
1-6
located near streets which cross the right-of-way. Where the right-of-way crosses an existing
street, a traffic signal would be used to allow buses to cross safely or a grade separation of the
busway and the cross-street would be constructed. The crossings are the most challenging part of
developing a busway in a railroad right-of-way, particularly where there are nearby streets
running parallel to the railroad right-of-way.
The Los Angeles Orange Line Busway is a
good example of a busway on an
abandoned railroad right-of-way. The
Los Angeles Metropolitan Transportation
Authority converted an 18-mile former
Southern Pacific Railroad right-of-way to a
busway in 2006. The project cost was
$327 million. The project was an instant
success, with ridership well exceeding the
projections. The line has 18 stations and
serves about 22,000 daily riders. Crossings
of public streets are signalized and at-grade.
Study Partners/Outreach The partner agencies for this project are:
▪ Transportation Agency for Monterey County
▪ Association of Monterey Bay Area Governments
▪ Caltrans
▪ Santa Cruz METRO
▪ California Highway Patrol, and
▪ Santa Cruz County Regional Transportation Commission
These project partners participated in a Technical Advisory Committee that also included the
cities of Marina, Sand City, Seaside and Monterey, as well as the Fort Ord Reuse Authority. This
group met several times during the course of the study to review and provide input for the study
as it progressed.
During the course of study, in-person meetings were held with the Fort Ord Reuse Authority and
with the Cities of Monterey, Sand City, Seaside and Marina. In each case, it was determined that
the bus-on-shoulder concept or use of the Monterey Branch Line for a busway was compatible
with their existing plans and policies, and in general would be supportive of their sustainability
goals in terms of transportation and the environment. The City of Monterey has studied the
feasibility of a bus rapid transit alignment paralleling Del Monte Avenue which would provide for
an extension of this project into the heart of Monterey. In Santa Cruz County meetings were held
with representatives of the Santa Cruz County Regional Transportation Commission.
Figure 1-5: Orange Line Station

Chapter 1 • Introduction and Summary
1-7
Summary A summary of the alternatives considered, and the results of the analysis and evaluation of the
alternatives is presented here with additional detail provided in Chapters 4 and 5.
Monterey County Alternatives Seven different alternatives were studied for the SR 1 Corridor in Monterey County including a
No-Build Alternative and an HOV Lane Alternative.
1. Southbound Bus–on-Shoulder – This alternative would provide bus-on-shoulder
operations on SR 1 between Del Monte Boulevard in Marina and Del Monte Avenue in
Monterey. Currently, congestion on this section of SR 1 occurs southbound in the
morning peak period, so the bus-on-shoulder operation would be southbound only. The
current shoulders in this segment are not the minimum 10 feet width needed for bus-
on-shoulder operations, they are typically in the 6-to-8-foot range. Thus, this project
would require shoulder widening. There are also four bridges that would either have to
be widened or the buses would need to leave the shoulder to bypass them. The
estimates of costs and time savings assume that there would not be any widening of
structures, as this type of construction would dramatically increase the costs of the
project, with only small improvements in travel time. There is also no connection to the
planned Intermodal Center at 8th Street in Fort Ord. The Intermodal Center would be the
western terminus of the planned Marina-Salinas Multimodal Corridor to Salinas.
Figure 1-6 - Depiction of Bus-on-Shoulder on SR-1 Southbound
2. Southbound Bus-on-Shoulder Plus Branch Line – This alternative involves
southbound AM peak period bus-on-shoulder operations between Del Monte Boulevard
in Marina and the Monterey Road, California Avenue, Fremont Boulevard intersection in
Sand City. From the Monterey Road, California Avenue, Fremont Boulevard intersection

Chapter 1 • Introduction and Summary
1-8
to Contra Costa Street in Sand City, a single lane, bi-directional busway (southbound in
the morning and northbound in the afternoon) would be developed in the Monterey
Branch Line right-of-way. Beyond Contra Costa Street the buses would operate on
Del Monte Boulevard all the way to Monterey. The busway would underpass the
Monterey Road, California Avenue, Fremont Boulevard intersection to avoid conflicts
with traffic at this complex set of intersections. The City of Seaside is currently studying
alternative solutions to this intersection, which could be a less costly approach as
compared with the cut-an-cover underpass, which would cost about $2.1 million. There
would be traffic signals or roundabouts at the three other street crossings in this area.
There is also no connection to the planned Intermodal Center at Fort Ord with this
alternative.
3. Branch Line – The Branch Line Alternative uses the rail right-of-way from
Reservation Avenue in Marina all the way to Contra Costa Street in Sand City, and then
uses Del Monte Boulevard to Monterey. The busway would be a single lane, bi-
directional facility which would operate southbound in the morning and northbound in
the afternoon, consistent with peak traffic flow directions. This alternative also provides
an underpass of the Monterey Road, California Avenue, Fremont Boulevard intersection
and it provides a connection to the Intermodal Center in Fort Ord via an existing
underpass of SR 1 that was a rail spur. This would allow a direct connection to the
future Marina-Salinas Multimodal Corridor.
Figure 1-7 – Depiction of Bus on the Monterey Branch Line

Chapter 1 • Introduction and Summary
1-9
4. Pedestrian/Bike Trail Plus Branch Line – This alternative is very similar to
Alternative 3 except that instead of using the rail right-of-way between Marina and
Sand City it uses the alignment of the Monterey Peninsula Recreational Trail. This is the
trail closest to SR 1 and there is another existing parallel recreational trail immediately
adjacent to the west. This alternative also provides an underpass of the Monterey Road,
California Avenue, Fremont Boulevard intersection and it provides a connection to the
Intermodal Center in Fort Ord.
Figure 1-8 - Depiction of Bus on the Caltrans Pedestrian/Bike Trail
5. Northbound Bus-on-Shoulder – This alternative serves a different purpose from the
others in that it is focused strictly on bus-on-shoulder operations on SR 1 in the
northbound direction between Casa Verde Avenue in Monterey and Fremont Boulevard
in the northern part of Sand City. The shoulder would need to be widened in several
areas and there are three structures that the buses would need to bypass by leaving the
shoulder and using the right traffic lanes.
6. No-Build – This alternative represents current conditions as a baseline for comparison
with the build alternatives. It is assumed that there will be some increases in bus service
in the corridor by year 2025 and that the Intermodal Center and Marina-Salinas
Multimodal Corridor would be in operation.
7. HOV Lanes – This alternative is hypothetical, as it is not included in any regional or
local plans. It was included for the purposes of providing a comparison of costs and
impacts. It would involve adding a new lane to SR 1 in each direction between Marina
and Monterey. The new lanes would accommodate buses, carpools, and other exempt
vehicles per the California motor vehicle code. It would involve extensive new

Chapter 1 • Introduction and Summary
1-10
construction in the freeway corridor including widening or lengthening of eight
structures at costs averaging from $25-$35 million for each bridge. There would not be
a connection to the Intermodal Center.
Table 1-1 presents a summary of the alternatives and their evaluation results. Some of the key
findings are:
▪ In general, the alternatives involving bus-on-shoulder (Alternatives 1, 2, and 5) do not
perform well compared to the others. Because the shoulders are not wide enough and
would have to be widened in most areas to accommodate the buses, the construction costs
are relatively high. The fact that buses would need to leave the shoulder to bypass
structures along the route somewhat defeats the purpose of trying to use the shoulder to
bypass traffic. Also, traffic conditions today are often not congested to the point where
speeds drop below 35 miles per hour, so bus-on-shoulder operations would not occur
every weekday. By year 2025, however, congestion is expected to be more severe and
would support bus-on-shoulder operations.
▪ The HOV Lane alternative also does not perform well primarily due to its high cost and
significant environmental impacts. A major concern would be the ability of buses to safely
and efficiently make the weaving movement to and from the freeway ramps, across the
general purpose traffic lanes and into the HOV lane.
▪ Compared to other alternatives, the Branch Line Alternative would be a strong performer.
Its cost is similar to the Bus-on-Shoulder Alternative, but it provides service in both
directions and has connections to the Intermodal Center and Marina-Salinas Multimodal
Corridor. It would have environmental impacts which would need to be addressed,
particularly in the areas of habitat preservation and biological resources. It also displaces
the parking and storage facilities for some existing businesses in Sand City, although they
are only leasing the use of the land on a temporary basis.
▪ Alternative 4, which displaces the Monterey Peninsula Recreational Trail, performs well
and is very similar to Alternative 3, the Branch Line Alternative. Displacing the trail may
prove to be a very difficult task even though there is an alternative parallel trail that
appears to be more heavily used.

Chapter 1 • Introduction and Summary
1-11
Table 1-1: Evaluation Summary – Monterey County
Alternatives
Evaluation Results
Co
nst
ruct
abili
ty Is
sue
s
Ave
rage
20
25
Tra
nsi
t Ti
me
Sav
ings
(min
ute
s)*
An
nu
al T
ran
sit
Op
era
tin
g C
ost
Sav
ings
(pe
rce
nt
of
exi
stin
g se
rvic
e c
ost
s)
20
25
An
nu
al O
pe
rati
ng
Co
sts
Co
mp
are
d t
o N
o-
Bu
ild
(mill
ion
s)*
Bu
ses
Re
qu
ire
d
(in
cre
ase
ove
r N
o-B
uild
)*
20
25
An
nu
al R
ide
r-sh
ip*
Co
nn
ect
ion
to
Inte
rmo
da
l C
en
ter?
Ve
hic
le M
iles
of
Trav
el
Re
du
ctio
n*
Envi
ron
me
nta
l Iss
ue
s**
Tota
l Cap
ita
l Co
sts*
Be
ne
fit/
Co
st R
atio
Ove
rall
Ass
ess
me
nt
1 Southbound Bus-on-Shoulder
Medium 7.1 3.1% $5.8 8 112,400 No 613,100 2 $35.0 0.18 +
2
Southbound Bus-on-Shoulder Plus Branch Line
Medium 10.1 4.3% $5.5 8 304,900 No 1,663,100 7 $32.1 0.25 ++
3 Branch Line Medium 15.9 6.8% $5.0 8 449,400 Yes 2,451,200 9 $33.4 0.66 +++
4 Pedestrian/Bike Trail Plus Branch Line
Medium 15.9 6.8% $5.0 8 449,400 Yes 2,451,200 10 $32.6 0.67 ++
5 Northbound Bus-on-Shoulder
Low 4.8 2.1% $5.2 8 240,800 N/A 1,313,400 3 $10.5 0.26 +
6 No-Build NA 0.0 0.0% $0.0 0 0 No 0 4 $0.0 N/A N/A
7 HOV Lanes High 14.2 6.1% $25.7 8 465,400 No 2,538,500 11 $449.7 0.07 +
Notes: * - Results are incremental to the No-Build Alternative, all costs are in 2017 dollars.
** - Score calculated the sum for all impact categories, using for each category: 2 points for significant, 1 point for possibly significant and 0 points for not
significant (see Table 5-11).

Chapter 1 • Introduction and Summary
1-12
Santa Cruz County Alternatives There are four build alternatives identified for Santa Cruz County, as well as a no-build
alternative. These alternatives are very much related to the planned implementation of auxiliary
lanes on SR 1 as part of the Measure D funding program. More detail and schematic maps are
provided in Chapter 4.
1. Interim Southbound Bus-on-Shoulder – Between Soquel Avenue and State Park Drive
the southbound right shoulder is generally wide enough to allow bus-on-shoulder
operations. In the northbound direction the right shoulders are consistently too narrow
to allow bus-on-shoulder operations. Southbound, there would be a gap from the
41st Avenue interchange to the Capitola Avenue overcrossing where buses would need
to merge back into the rightmost freeway lane in order to avoid narrow, 6 to 8 foot wide
shoulders under or over existing structures. In this section the Bay Ave overcrossing has
shoulders that are wide enough, but both the Wharf Rd undercrossing and the
Capitola Avenue overcrossing have narrow shoulders. The next segment of bus-on-
shoulder operations would extend from south of the Capitola Avenue overcrossing to
the State Park Drive interchange. The final segment would be between the south
railroad bridge and the Freedom Boulevard interchange. Overall, the bus-on-shoulder
alternative includes about 4.2 miles on shoulders in a 7.5 mile distance. The gaps
between these segments are long enough so that buses could merge back into the right
traffic lane to bypass the gap area and then return to the shoulder after the structure or
other obstacle has been passed. Some widening of shoulder areas would be needed in
portions of the corridor to support bus-on-shoulder operations This alternative is called
“interim” because it was envisioned that it could be implemented prior to the first phase
of the auxiliary lanes project, although bus-on-shoulder operations could continue on
the portions of the freeway south of where the auxiliary lanes end, until the time when
the auxiliary lanes are funded and constructed.
2. Bus-on-Right-Shoulder with Auxiliary Lanes – There are two variations to this
alternative, both of which would extend from Morrissey Boulevard to State Park Drive
and would be implemented after or with the construction of each phase of the auxiliary
lanes project. As part of the Highway 1 Corridor Investment Program, southbound and
northbound auxiliary lanes will be constructed at the following locations:
o Auxiliary Lane 1: Between Soquel Avenue and 41st Avenue interchanges
o Auxiliary Lane 2: Between Porter Street and Park Avenue interchanges
o Auxiliary Lane 3: Between Park Avenue and State Park Drive interchanges
o Auxiliary Lane 4: Between State Park Drive and Rio Del Mar Boulevard interchanges
o Auxiliary Lane 5: Between Rio Del Mar Boulevard and Freedom Boulevard
interchanges
It is important to note that the Auxiliary Lane 4 and 5 phases are considered more as
long-range improvements. They are not currently funded by Measure D and they
Chapter 1 • Introduction and Summary
1-13
require significant mainline reconstruction and railroad bridge replacements. The
estimated cost of these phases is $124.6 million. This amount would have to be raised
before bus-on-shoulder operations could occur south of the State Park Drive
interchange.
Auxiliary Lane 1 will be starting construction by year 2021, Auxiliary Lanes 2 and 3 will
begin construction by year 2023-24, but this is contingent upon the availability of funds.
The construction timeframe for Auxiliary Lanes 4 and 5 is currently unavailable, but it is
definitely beyond the year 2025 time frame. The interim bus-on-shoulder alternative
was developed to provide improved transit operations in the southbound direction
prior to the implementation of the auxiliary lanes.
As part of the auxiliary lane project, the right shoulders in either direction will be
improved and widened and should be 10 feet wide in most areas which will be wide
enough for bus-on-shoulder operation. Some improvements may be necessary to clear
roadside obstacles and assure adequate width in all areas, to allow safe bus-on-shoulder
operations. The two options are:
Option A: Hybrid-Auxiliary Lanes – Auxiliary lanes are essentially short freeway
lane segments between on- and off-ramps. They reduce congestion and improve
operations by facilitating traffic movements to and from the ramps. The speeds in
auxiliary lanes tend to be slightly higher than those in the regular freeway lanes.
The Hybrid-Auxiliary Lanes Alternative involves the buses using the auxiliary lanes
between interchanges and then transitioning to the shoulder through the
interchange area. These short shoulder areas would need to be specially marked
and signed to advise motorists that they are for use by buses (and emergency
stopping) only. Sufficient right-of-way is typically available at the interchanges, once
the auxiliary lane project is complete, except at the overcrossings of 41st Avenue and
State Park Drive. However, widening of shoulder pavement and pavement structure
enhancement may be required at a few locations.
Option B: Bus-on-Shoulder – As each stage of the auxiliary lane project is
constructed, a new shoulder will be provided on the right side of the freeway. As
currently planned, this shoulder width will be 10 feet in width in most areas which
is adequate for bus-on-shoulder operations. There may be locations where roadside
obstacles or other constraints require additional construction to accommodate bus-
on shoulder operations.
3. HOV Lane Project – Because Santa Cruz METRO’s planned primary use of SR 1 is to
operate express buses, non-stop, on SR 1 between Watsonville and Santa Cruz, their
preference was for left-side bus-on-shoulder operations to avoid conflicts with on and
off-ramps. However, the left-side shoulder on SR 1 was found to be too narrow to
provide the minimum 12 feet of width needed to support bus-on-shoulder operations
next to the freeway median. The most direct way to create this width would be to use
the space available on the right shoulder to shift the freeway lanes to the right and
thereby create the space needed for a wider median shoulder. This however, proved to
be impractical as it would eliminate the right shoulder in conflict with Caltrans’ design

Chapter 1 • Introduction and Summary
1-14
standards, requiring exceptions to the Caltrans design standards outlined in the
Highway Design Manual (HDM). As the right shoulder is essential for safety as a vehicle
refuge area. it is highly unlikely that these design exceptions would be acceptable. In
addition, in areas where structures limit the shoulder width, the buses would need to
weave into the left traffic lane from the left shoulder, which is a far more dangerous
maneuver than weaving in from the right shoulder. To address the desire for left side
bus operations, this HOV Lane Project Alternative was developed. It is an adaption of
the HOV Lane Alternative that was studied as part of the Measure D Program (see the
Tier I and Tier II Draft Environmental Impact Report/Environmental Assessment
https://sccrtc.org/external/hwy1corridorEnvDocs/01_Hwy_1_HOV_cover_pages_Oct_2
015_JA-TML_LP_GMG.pdf).
The project has been shortened to avoid some of the most costly and difficult obstacles,
but still requires widening of five freeway structures. This alternative would involve
adding a new HOV lane to SR 1 in each direction between Soquel Avenue and State Park
Drive. The new lane would accommodate buses, carpools and other exempt vehicles per
the California motor vehicle code.
3. No-Build Alternative – This alternative represents the existing conditions plus the
implementation of the Measure D auxiliary lanes project. No increase in bus transit service
on SR 1was assumed as METRO currently runs a limited number of routes on the freeway
due to the congestion and unreliable traffic conditions. Currently, the auxiliary lanes project
is programmed for the segment from Morrissey Boulevard to State Park Drive. The segment
from State Park Drive to Freedom Boulevard is not funded and will not be completed by the
year 2025. Because the alternatives that are dependent on the completion of the auxiliary
lanes would not be constructed prior to each phase of the auxiliary lane project, the No-
Build Alternative is assumed to terminate at State Park Drive. An additional $124.6 million
would be required to extend the auxiliary lanes from State Park Drive to Freedom
Boulevard, making this a very long-term project.
Table 1-2 provides a summary of the evaluation of these alternatives. Key conclusions include:
▪ Traffic Congestion – Congestion on this segment of SR 1 between Soquel Avenue and
Freedom Boulevard is quite severe in the northbound direction during the morning peak
period and the southbound direction in the afternoon peak period, which would justify bus-
on-shoulder operations.
▪ Alternative 1: Interim Southbound Bus-on-Shoulder – For the most part, the right and
left-side shoulders on this segment of SR 1 are not wide enough to support bus-on-shoulder
operations. The exception is the southbound shoulder where many areas do provide the
required 10-foot minimum. Alternative 1: Interim Southbound Bus-on-Shoulder option,
takes advantage of this opportunity. It performs well compared to the other alternatives.
The main question is one of phasing – does it make sense to pursue this project prior to the
implementation of the auxiliary lane project? This is a matter of timing and also whether
funds spent on the interim project could be expended in a way that benefits the upcoming
auxiliary lane project, which may be unlikely. Realistically, this alternative probably only
makes sense in the segment of southbound SR 1 between State Park Drive and Freedom

Chapter 1 • Introduction and Summary
1-15
Boulevard because the auxiliary lanes in the segments to the north will be completed too
soon for interim bus-on-shoulder to have benefit.
▪ Alternative 2 Option A: Hybrid-Auxiliary Lanes bus on right shoulder option offers a
relatively low-cost approach to providing bus-on-shoulder in both travel directions, as long
as the implementation of the bus-on-shoulder operations occurs in coordination with each
phase of the auxiliary lane project. The buses would use the new auxiliary lanes in the areas
between interchanges and would use the shoulders in the areas between the off-ramps and
on-ramps of the interchanges. This limits the need for shoulder improvements and does not
require the bus to use the shoulders between interchanges. This is a new concept – a
variation of the bus-on-shoulder practice – and it would have to be vetted fully with
Caltrans and the California Highway Patrol. It would be feasible to test the concept on an
existing section of the freeway with auxiliary lanes. The costs would mostly be for signage
and pavement markings. In some locations the shoulder areas on bridges or under
structures may not be wide enough for bus operations and the buses would have to merge
back into the general purpose lanes to bypass these obstacles. This is a standard bus-on-
shoulder operating practice. This option involves less weaving movements by the buses as
compared with Option B.
▪ Alternative 2 Option B: Bus-on-shoulder Alternative is a version of Alternative 2A
which makes use of the new 10-foot wide right shoulder that comes as part of the auxiliary
lane project both between interchanges and in the areas between the off-ramps and on-
ramps of the interchanges. The costs would mostly be for signage and pavement markings.
It is possible that the costs could be reduced if the shoulder improvements needed were
designed and implemented at the same time as the auxiliary lane project. This would
essentially create an integrated auxiliary lane/bus-on-shoulder project. In some locations
the shoulder areas on bridges or under structures may not be wide enough for bus
operations and the buses would have to merge back into the general purpose lanes to
bypass these obstacles. This is a standard bus-on-shoulder operating practice.

Chapter 1 • Introduction and Summary
1-16
Table 1-2: Evaluation Summary – Santa Cruz County
Alternatives
Evaluation Results
Co
nst
ruct
abili
ty Is
sue
s
Ave
rage
20
25
Tra
nsi
t Ti
me
Sav
ings
(min
ute
s)*
An
nu
al T
ran
sit
Op
era
tin
g C
ost
Sav
ings
(pe
rce
nt
of
exi
stin
g se
rvic
e c
ost
s)
20
25
An
nu
al O
pe
rati
ng
Co
sts
Co
mp
are
d t
o N
o-
Bu
ild
(mill
ion
s)*
Bu
ses
Re
qu
ire
d
(in
cre
ase
ove
r N
o-B
uild
)*
20
25
An
nu
al R
ide
rsh
ip*
Ve
hic
le M
iles
of
Trav
el
Re
du
ctio
n*
Envi
ron
me
nta
l Iss
ue
s**
Tota
l Cap
ita
l Co
sts
(mill
ion
s)*
Be
ne
fit/
Co
st R
atio
Ove
rall
Ass
ess
me
nt
1. Interim Bus-on-Shoulder Southbound
Soquel Avenue to State Park Drive
Low 8.8 10.0% $2.7 12 555,000 3,531,800 8 $14.1 0.20 +
2. Bus on Right Shoulder with Auxiliary Lanes
A. Hybrid-Auxiliary Lanes - Morrissey Blvd. to Freedom Blvd.
Low 16.5 6.0% $2.5 12 1,365,000 8,686,400 0 $7.9 1.38 +++
B. Bus-on-shoulder - Morrissey Blvd. to Freedom Blvd.
Medium 18.0 20.0% $2.4 12 1,372,500 8,734,100 0 $8.1 1.69 +++
3. HOV Lane Project
Soquel Avenue to State Park Drive
High 12.7 22.0% $19.1 27 1,965,000 12,504,600 18 $364.1 0.06 +
4. No-Build Project
Existing Highway with Auxiliary Lanes - Morrissey Blvd. to State Park Drive
N/A 8.4 9.0% $0 0 0 0 9 $0 N/A N/A
Notes: * - Results are incremental to the No-Build Alternative, all costs are in 2017 dollars.
** - Score calculated the sum for all impact categories, using for each category: as 2 points for significant, 1 point for possibly significant and 0 points for not
significant (see Table 5-22)

Chapter 1 • Introduction and Summary
1-17
▪ Alternative 3 – HOV Lanes is a substantial construction project requiring widening or
lengthening of five structures and acquisition of new right-of-way. It was identified as
having the potential for significant environmental impacts, including visual impacts,
reduction of sensitive habitat, and displacement of businesses and residential units. It was
not very cost effective in terms of transit use as compared to the other alternatives.
Project Implementation and Next Steps The above findings suggest several additional elements of consideration that could lead to
successful implementation of bus-on-shoulder or bus rapid transit improvements in both
counties. Additional steps are suggested to help support project implementation.
Monterey County
▪ Inadequate Shoulders – Unfortunately, the right-side shoulders on SR 1 in the study
corridor are not consistently wide enough to support bus-on-shoulder. Traffic demand and
congestion has become an issue, southbound, on weekday mornings, but the problem is not
as severe northbound in the afternoon peak period. Costly shoulder widening would be
required. As a result, the bus-on-shoulder alternatives had a poor benefit-cost ratio.
Segment I -Option A – the southbound bus-on-shoulder operation between Del Monte
Boulevard/SR 1 interchange in Marina and Fremont Boulevard/SR 1 interchange in Sand
City would be the most cost-effective location for an initial bus-on-shoulder project, yet its
benefit cost ratio would still be well below 1.0.
▪ Use of the Monterey Branch Line – The analysis suggests that using the branch line for a
bi-directional busway could be cost-effective as compared to a bus-on-shoulder project on
SR 1 in Monterey County. Environmental impacts are a concern, but many of these same
impact types would occur with widening the freeway shoulder. Since the Transportation
Agency for Monterey County owns the branch line’s right-of-way, this project is much more
straightforward than either widening the shoulder of SR 1 or displacing the Monterey
Peninsula Recreational Trail between Marina and Sand City. Still with a cost-benefit ratio of
less than one, the project is not fully cost-effective. One way to address this would be to
consider a phased project. The first segment from Reservation Road in Marina to the
intersection of Monterey Road/California Avenue/Fremont Boulevard in Sand City is more
cost-effective than the alternative as a whole, with about a 0.82 benefit-to-cost ratio as
compared to 0.66 for the whole project. It is possible with further study and refinement
that the benefit-to-cost ratio could be improved further.
▪ Widening of SR 1 – A widening of SR 1 in the study area would involve significant
environmental impacts and related costs. If a widening involving additional lanes were to
occur, environmental considerations would likely dictate that it be in the form of HOV
Lanes. This analysis showed HOV lanes not to be a very effective approach to improving
transit in the corridor.

Chapter 1 • Introduction and Summary
1-18
Santa Cruz County
▪ Inadequate Shoulders - Unfortunately, the right-side and left-side shoulders on SR 1 in the
study corridor are not consistently wide enough to support bus-on-shoulder. Also, they
may not have the structural depth and configuration to support long term bus operations.
Traffic demand and congestion has become severe in the peak travel directions. Costly
shoulder widening would be required. As a result, even though the ridership demand
estimates were strong, the bus-on-shoulder alternatives had a poor benefit-cost ratio.
▪ Coordination with the Auxiliary Lane Project – The auxiliary lane project represents a
great opportunity to implement bus-on-shoulder as each phase of the project is completed,
it will provide shoulders that are suitable for bus-on-shoulder operations. Implementation
of bus-on-shoulder improvements in Santa Cruz County should be tied to the
implementation of the auxiliary lanes. Coordination of the two projects to allow an
integrated roll out of the auxiliary lanes that were designated to accommodate bus-on-
shoulder would be a cost-effective strategy. Both the auxiliary lane and bus-on-shoulder
improvements could occur as a single project, with phases for each segment of the freeway
moving south from Santa Cruz. Making this happen could prove beneficial in the long run.
In order for this to happen, the bus-on-shoulder improvement would have to go through its
own environmental clearance process separate from the Tier II 41st/Soquel Avenue
auxiliary lanes project. The first phase is scheduled to begin construction in 2021, so
coordination of bus-on-shoulder improvements should begin soon it order to integrate the
two projects.
▪ Hybrid-Auxiliary Lanes – The bus on right shoulder Alterative 2- Option A, which involves
buses using the auxiliary lanes between interchanges instead of the shoulder is superior in
terms of operations to Alternative 2 – Option B, which involves continuous use of the new
shoulders provided by the auxiliary lane project. This is because bus operations and
conflicts with traffic are simplified, with buses operating in the auxiliary lanes rather than
on the shoulder for most of the distance in Option A. Whereas in Option B buses must
weave out of the shoulder into the auxiliary lane before each interchange.
▪ HOV Lanes – Implementing HOV lanes on SR 1 is a long-term goal of the Santa Cruz County
Regional Transportation Commission and it supports METRO’s objectives for improved
transit service in the corridor. Unlike in Monterey County, the longer distance METRO
buses will travel on the freeway will mitigate the concerns about buses having to weave
across the freeway lanes to get in or out of the HOV lanes. However, because of the high
cost of this project and the current lack of funding, it would be appropriate to pursue in the
near-term the Alternative 2- Option A – Hybrid-Auxiliary Lanes, which can be implemented
with relatively little cost once the auxiliary lanes are in place.
Next Steps
▪ Monterey County – This analysis suggests that MST should pursue Alternative 3 – the bi-
directional busway on the Monterey Branch line. This is the most cost-effective alternative.
It is also supported by funding from the Measure X program administered by the
Transportation Agency for Monterey County. The first step would be to get acceptance of
this study from the partner agencies. Then, the next step would be to initiate the

Chapter 1 • Introduction and Summary
1-19
preliminary engineering and environmental studies. The Technical Advisory Committee set
up for this project could continue to function for this next phase.
▪ Santa Cruz County – METRO should coordinate closely with the Santa Cruz County
Regional Transportation Commission to further explore planning the auxiliary lane
program to include bus-on-shoulder operations. The would allow bus-on-shoulder
operations to commence as each phase of the auxiliary lane program is constructed.
METRO should began work to get Caltrans and California Highway Patrol acceptance of the
bus-on-shoulder proposal consistence with the prevailing legislation that is in place.
▪ Advanced Technology – Two developing technologies should be considered in the
development of either bus-on-shoulder or busway projects. The first is vehicle-to-
infrastructure technology. One of the major concerns with bus-on-shoulder operations is
conflicts with vehicles using on- and off-ramps. Ramp metering combined with vehicle-to-
infrastructure communications between the buses and the ramp metering controllers
would allow on-ramp traffic to be stopped as a bus crosses the point where the on-ramp
merges with freeway. Note that to date, this technology has not been used with bus-on-
shoulder applications as there is no record of actual safety problems related to on-ramp
traffic accidents involving buses using the shoulder. An alternative to ramp-metering would
be a signal on the on-ramp which would only be activated when a bus is approaching on the
shoulder, stopping on-ramp traffic momentarily. This would not require the major ramp
modifications often involved with ramp metering. However, actual bus-on-shoulder
operating experience around the country has shown no ramp controls are needed to assure
safe operations. With a busway operation, traffic signals at crossing locations can be
activated by on-board technology in the buses, limiting the impact to traffic at the nearby
intersections. Ramp metering is not currently planned or funded in either County.
The second innovation is autonomous buses. The development of these buses is occurring
at a rapid pace and demonstrations of smaller shuttle buses with various levels of
autonomous operational capabilities are occurring in a number of locations, including one
in the Bishop Ranch business park in San Ramon, California. A controlled environment such
as a busway would be ideal for an autonomous bus operation. Use of these buses in a bus-
on-shoulder application would be more complex, but not infeasible. Autonomous buses
would reduce labor requirements, allowing more buses to be operated with the same
number of personnel. This would result in a more cost-effective transit service. Ridership is
highly dependent on service frequency and with autonomous buses, METRO and/or MST
could offer higher frequencies without the cost penalty associated with traditional bus
operations. In the timeframe in which a busway project could be implemented it is highly
likely that revenue service tested autonomous buses would be available. There may also be
special federal or state funding for this type of innovative technology application.


2-1
Chapter 2
Literature Review
This chapter is a summary of the current literature and case studies regarding both the practices
of bus-on-shoulder operations and bus use of railroad rights-of-way.
Bus-on-Shoulder Bus-on-shoulder refers to the practice of allowing buses to use the paved shoulder areas of
freeways to bypass areas of severe traffic congestion. While the notion of bus-on-shoulder
conjures a vision of buses flying by stalled traffic on a narrow shoulder lane, the reality is that
bus-on-shoulder involves operation of buses under carefully defined and controlled conditions.
First, the shoulder area has to meet certain criteria in terms of its width, clearance and pavement
strength. Secondly, the transit operators must receive training in how and when to properly
operate the bus on the freeway shoulder. Finally, there are guidelines/rules as to what traffic
conditions/speeds must exist in order for the bus to be allowed to use the shoulder and how
much faster than the traffic the bus is allowed to operate. The bus-on-shoulder concept is not
new, it originated in this country in 1991 in Minnesota and has been implemented in a number of
locations since then including San Diego, California. As a result, there is substantial experience
and research on bus-on-shoulder that can be used to inform the consideration of bus-on-shoulder
operations on Highway 1 in Monterey and Santa Cruz counties.
There are four national studies and three state-sponsored studies of bus-on-shoulders of
relevance to this MST study.
National Studies ▪ Transit Cooperative Research Program Report 151
– A Guide for Implementing Bus-on-Shoulder
Systems (the most comprehensive of the studies)
▪ Transit Cooperative Research Program Synthesis
Report 64 – A Synthesis of Transit Practice
▪ FHWA’s Use of Freeway Shoulders for Travel – A
Guide for Planning, Evaluating and Designing Part-
time Shoulder use as a Traffic Management Strategy
▪ American Association of State Highway and
Transportation Officials – Guide for Geometric
Design of Transit Facilities on Highways and Streets
Figure 2-1: Bus-on-Shoulder in Minnesota

Chapter 2 • Literature Review
2-2
State-Sponsored Studies ▪ Minnesota Department of Transportation Bus Only Shoulder Guidelines
▪ Caltrans Transit Lane Demonstration Pilot Report (San Diego)
▪ I-55 Bus-on-Shoulder Demonstration – In the Spirit of Time (Chicago)
The Minnesota guidelines are often the basis for agencies to tailor their own guidelines as
Minnesota has the largest and one of the oldest bus-on-shoulder operations as well as the most
time proven. The Caltrans report describes the only California bus-on-shoulder application in
San Diego, and the Chicago I-55 report describes a left-side shoulder bus-on-shoulder project.
TCRP Report 151 – A Guide for Implementing Bus-on-Shoulder (BOS) Systems Transit Cooperative Research Program Report 151 – A Guide for Implementing Bus-on-Shoulder
(BOS) Systems provides the most comprehensive reference for bus-on-shoulder implementation.
It was published in 2012 and describes:
▪ Current North American practice;
▪ Common shoulder operations issues;
▪ Guidelines for operations based on experience and surveys of both drivers and passengers;
▪ Design considerations;
▪ Traffic operations guidelines; and
▪ A general framework for decision-making.
The Transit Cooperative Research Program is part of the National Academy of Sciences
Transportation Research Board whose research is largely funded by state DOTs. Report 151
included case studies of bus-on-shoulder projects in Minneapolis-St. Paul Twin Cities Area;
Miami; San Diego; New Jersey; Ottawa; Columbus, Ohio; and Atlanta, Georgia. This report
preceded implementation of bus-on-shoulder projects in Raleigh, North Carolina (Research
Triangle), Kansas City, Chicago, and Colorado. The TCRP team, however, provided inputs to these
new projects being planned, with the exceptions of the very recent bus-on-shoulder project in
Denver. All the bus-on-shoulder projects were for the right-side shoulders, except for the
Cincinnati and Chicago projects which both used the left-side shoulders.
A collaborative approach to the planning, design, and operations involving all stakeholders was
found to be very important to the successful implementation of bus-on-shoulder projects. Each
project tended to involve different traffic, transit, physical highway features, climate, geology, and
agency operating practices, and the collaborative approach helped to recognize these features. It
is one of the reasons a “one-size fits all” rigid template for design and operations was not
recommended by this research.
Bus-on-shoulder projects have proven to be popular with bus passengers and the communities
that have implemented them, and the bus drivers that operate on the shoulders feel that they are

Chapter 2 • Literature Review
2-3
good projects. Typically, they are not the ideal bus priority or corridor capacity enhancement
option, but because they utilize current right-of-way they are low-cost, low-impact, and relatively
easy to implement. The Transit Cooperative Research Program Report 151 found many
conclusions can be drawn from current bus-on-shoulder operations:
1. Bus priority treatments on freeways and arterials have operated successfully for about
50 years. They have increased the person-capacity of highway corridors and saved bus
passengers time without adversely affecting vehicle flow.
2. The concept of bus-on-shoulder has emerged in the past two decades. It has been
applied where bus volumes are too low to justify new bus lanes and/or roadway
geometry does not permit dedicated bus lanes.
3. With bus-on-shoulder, authorized buses can use the roadway shoulders (typically the
right-side shoulder) during peak hours only when the main freeway lanes are
congested.
4. Bus-on-shoulder has proven successful in many communities including metropolitan
regions of Minneapolis-St. Paul, San Diego, Miami, Cleveland, Columbus, Cincinnati,
Washington DC, Seattle, Atlanta, New Jersey, Wilmington, Ottawa, and Toronto.
5. Bus passengers save time while highway service levels remain unchanged.
6. Safety experience has been excellent even running on narrow 10-foot-wide shoulders.
7. The basic requirements for a successful bus-on-shoulder include:
o Presence of buses – usually at least four buses per hour.
o Congested freeways – speeds of less than 35 miles per hour for right side shoulders.
o Minimum 10-foot continuous shoulder of sufficient strength to support buses. Ideally,
the shoulder should be at least 12 feet to better protect protruding bus mirrors.
o Avoidance of multi-lane entrance and exit ramps and ramps with very high traffic
volumes (more than 1,000 vehicles per hour).
o Willingness of transit and roadway agencies (along with the MPO) to work together.
o Ability to obtain needed “design exceptions” from the Federal Highway
Administration.

Chapter 2 • Literature Review
2-4
Bus-on-shoulder operations should
be installed only after a careful
analysis of physical and operational
feasibility. Buses should be able to
safely enter and leave the lanes.
Shoulders should be wide and
strong; there should be no nearby
obstacles or protrusions.
Complementary corridor
improvements like park-and-ride
lots are desirable. Bus-on-shoulder
operations tend to be safer than
high-occupancy vehicle (HOV) and
general traffic use of shoulders as
bus operators are professionals and
receive special training as well as
monitoring. There are also far fewer
buses than HOVs and general traffic
vehicles which reduces risks and
potential blockages of the shoulder.
Report 151 summarized the
findings of passenger surveys
conducted for bus-on-shoulder
projects in the Twin Cities,
San Diego, Miami, and Cincinnati.
Passengers generally felt safe and
liked the shoulder operations for
travel time benefits. Often
passengers would encourage
drivers to use the shoulders when
traffic speeds slowed.
Report 151 also surveyed bus
drivers to understand their feelings
and concerns regarding bus-on-
shoulder. Drivers in the Twin Cities,
New Jersey, San Diego and Miami
were surveyed. Most felt that bus-on-shoulder operations were safe, shoulder widths generally
adequate, signage and markings were adequate, training was adequate, and that bus-on-shoulder
was a good concept. Bus driver input generally is sought particularly regarding speed protocols.
The national research found relatively little documentation of benefits, costs, and safety impacts.
Interestingly, the apparent reason for the absence of performance data is that no problems have
arisen, and the bus-on-shoulder concept appears intuitively beneficial. Passengers love it and bus
drivers think it is a good concept. Quantification of the benefits is also complicated by the widely
Figure 2-2: Shoulder Suitability Review Process Source: FHWA’s Use of Freeway Shoulders for Travel

Chapter 2 • Literature Review
2-5
fluctuating traffic conditions in congested corridors and by difficulty isolating bus-on-shoulder
benefits from the numerous other factors that influence patronage (e.g., service and fare
changes).
TCRP Synthesis 64 Bus Use of Shoulders – A Synthesis of Transit Practice Synthesis Report 64 was a precursor to Report 151 and focused on identifying where bus-on-
shoulder operations had been implemented and the resultant experience. Published in 2006, it
identified bus-on-shoulder operations in the Twin Cities area; Falls Church, Virginia; Burtonsville,
Maryland; Bethesda, Maryland; Seattle; Mountainside, New Jersey; Old Bridge, New Jersey;
Alpharetta, Georgia; Wilmington, Delaware; Miami; Toronto; Ottawa; Dublin; Wellington,
New Zealand; and San Diego, California, and provides brief overviews of these projects. The
project entailed a web survey of transit agencies, metropolitan planning organizations (MPOs),
departments of transportation (DOTs) and other transportation agencies with 71 responses
received to the survey (did not include enforcement agencies). The survey sought to identify bus-
on-shoulder projects, experience to date, and key concerns including seeking to identify loss of
shoulder functions, traffic safety issues and experience, physical design practice, legal issues, and
costs.
In general, the findings indicated that while bus-on-shoulder was not the ideal solution, it was
low cost, low impact and relatively easy and quick to implement. Safety experience was found to
be good and none of the bus-on-shoulder projects had been abandoned due to problems.
FHWA’s Use of Freeway Shoulders for Travel – A Guide for Planning, Evaluating, and Designing Part Time Shoulder Use as a Traffic Management Strategy Published in early 2016, this guide covers planning, design, implementation and day-to-day
operations of the full array of shoulder uses including bus, HOVs, and general traffic use of
freeway shoulders. It describes different forms of shoulder use, decision-making and preliminary
engineering issues, benefits assessments, safety analyses, environmental analyses, cost analyses
design considerations, implementation process, and day to day operations management. The
Guide also describes case study applications for ten cities, most of which are bus-on-shoulder
operations. The guide suggests a minimum 10-foot-wide shoulder is needed with 12 feet being
desired. The primary relevance of this report is that it provides comprehensive descriptions of
shoulder use design issues and day to day operations discussions.
AASHTO Guide for Geometric Design of Transit Facilities on Highways and Streets Published in 2014, this guide for geometric design describes the practice recommended by the
American Association of State Highway and Transportation Officials. It does not define minimum
standards, but instead it is intended as a guide. The American Association of State Highway and
Transportation Officials recognizes the potential travel time and reliability benefits that bus-on-
shoulder operations can provide. It suggests a 12-foot desired shoulder width.

Chapter 2 • Literature Review
2-6
Minnesota Department of Transportation Bus Only Shoulder Guidelines In partnership with the Minnesota Department of Transportation, Metro Transit began allowing
buses to use shoulders to bypass congestion in 1991. They currently allow more than 250 miles
of shoulders to be used by buses to bypass congestion. Their experience has been used by many
newer bus-on-shoulder project agencies as a template for proven practice. The Twin Cities
established operating protocols, signage and marking guidelines, and minimum design guides.
Their operation is entirely right-side shoulders. Table 2-1 summarizes some of their key design
guidelines set in 1997. Use of shoulders is restricted to only drivers that have received special
training.
Table 2-1: Shoulder Use by Buses: Geometric Design Criteria
Type of Highway: Urban Multi-Lane Freeway and Expressways;
Buses on Right Shoulder
Controlling Geometric Design Criteria
Mn/DOT Std. Notes
Design Speed, mph 35 mph Maximum speed for buses traveling on shoulder, as per operational policy
Shoulder Width (feet) 10
12
Minimum
Desirable for pavement longevity and added safety
Bridge Width (feet) 11.5 11.5’ wide shoulder is needed on bridges
Grades, maximum percent nc no change (nc) match existing roadway
Inslopes 1:6
If inslopes are not steeper than 1:6, inslopes may be steepened to 1:6.
If inslopes are steeper than 1:6, match existing, except in the following cases; if fill slope is steeper than 1:3 and higher than 2 feet, provide guardrail, unless there is 18 feet between the edge of shoulder and the point where the fill slope becomes steeper than 1:3.5.
Structural Capacity HS25 For new bridges, for existing bridges to allow shoulder use the shoulder must be structurally adequate (capable of carrying legal loads and does not appear on the inventory of inadequate bridges).
Horizontal Alignment, radius (feet)
nc no change (nc) match existing roadway
Vertical Alignment minimum K value (ft./deg.)
nc no change (nc) match existing roadway
Stopping Sight Distance (feet)
250’ Stopping Sight Distance based on 35 mph design speed
Cross Slope, (feet/feet) .02-.05 Mn/DOT Road Design Manual: Tbl. 4-4.03A, p. 4-4.0(3)
Superelevation max
Max. negative (feet/feet) .06-.04
for curves less than or equal to 8 degrees Mn/DOT Road Design Manual; p. 3-2.0 (2A)
Vertical Clearance 14’ AASHTO 1990 Policy on Geometric Design of Highways & Streets; p. 526 Tallest design vehicle is 10’-9”
Horizontal Clearance 0’ AASHTO 1990 Policy on Geometric Design of Highways & Streets; p. 586
2’ beyond edge of shoulder is preferable, as a minimum, place at the edge of shoulder

Chapter 2 • Literature Review
2-7
Transit Lane Demonstration Pilot Report – San Diego California allows Caltrans Districts to participate in pilot projects and in 2005, Caltrans
District 11, along with the San Diego Association of Governments and San Diego Metropolitan
Transit System, established bus-on-shoulder operations on SR-52 and I-805 near University
Town Centre. This was a right-shoulder project. The shoulder width was typically 10 feet, but
slightly narrower in some areas. Buses were allowed to use the shoulder only when general
traffic speeds were 35 mph or less, and then they were limited to a speed no more than 10 mph
faster than the traffic in the general-purpose lanes. The two-year long pilot project required a
one-year evaluation report. Caltrans evaluated the safety, freeway operations, and travel
time/reliability aspects of the project
and concluded that safety and freeway
operations impacts were negligible and
that shoulder operations provided
some limited benefits to transit. The
limited benefits were primarily due to
the 15-minute bus service that was
provided on the pilot segment. As
California’s Vehicle Code does not allow
for shoulder operations, the shoulder
was technically redefined to be a
transit-only lane for the purposes of the
pilot. The cost of implementing the 8-
mile bus-on-shoulder project was about
$100,000. As much as a five-minute
time savings was reported under the
most severe traffic conditions.
I-55 Bus-on-Shoulder Demonstration – In the Spirit of Time A technical paper was developed by the Chicago Regional Transportation Authority and AECOM
describing the implementation of a left-side shoulder project on Interstate 55 (also known as the
Stevenson Expressway) for the Transport Chicago 2011 Conference. The left-side shoulders are
12 feet or wider and Pace operates the bus services. Buses can only use the left shoulder when
speeds drop below 35 mph and are not permitted to run faster than 35 mph when using the
shoulder. Overhead gantry mounted signs designate the shoulder use. The bus-on-shoulder
project has been very successful and is currently being expanded, and more bus services are
being added.
Figure 2-3: SANDAG Bus-on-Shoulder Demonstration

Chapter 2 • Literature Review
2-8
I-71 Cincinnati Left Shoulder Bus-on-Shoulder Cincinnati also operates left-side
shoulder bus operations. Metro and the
Ohio DOT moved forward with the
implementation of the nation’s first left
shoulder bus-on-shoulder project. This
new bus-on-shoulder project began
operation in July 2007. It is about a 10-
mile segment of I-71 in the northeastern
part of the metropolitan area. The left-
side shoulders are generally 12-feet wide
with a rumble strip running down their
centers. This rumble strip was retained
during the first year when the service
was operated as a pilot program. Buses
can use the left shoulder when traffic slows to 30 mph and are allowed to run 15 mph faster than
traffic in the general lanes. Signage is very minimal.
Bus on Railroad Rights-of-Way The concept of creating a bus facility on a railroad right-of-way is not new either, but it is not a
widely-used practice. Typically, a two-lane roadway designed exclusively for buses would be
developed within the right-of-way. Stations or stops would also be in the right-of-way, often
located near streets which cross the right-of-way. Where the right-of-way crosses an existing
street, a traffic signal would be used to allow buses to cross safely, or a grade separation of the
busway and the cross-street would be constructed. The crossings are the most challenging part of
developing a busway in a railroad right-of-way, particularly where there are nearby streets
running parallel to the railroad right-of-way.
TCRP Report 117 Design, Operation and Safety of At-Grade Crossings of Exclusive Busways provides
guidelines on safe design and operation of at-grade crossings, which are one of the major
challenges for buses operating on railroad rights of way. The practice in Los Angeles for their
Orange Line and for Miami’s South Dade Busway are both described.
Los Angeles Orange Line Busway The Los Angeles Metropolitan
Transportation Authority converted an 18-
mile former Southern Pacific Railroad
right-of-way to a busway in 2006. The
project cost was $327 million. The project
was an instant success, with ridership well
exceeding the projections. The line has 18
stations and serves about 22,000 daily
riders. Crossings of public streets are
signalized and at-grade. During the first
year of operation there were problems
Figure 2-4: I-71 Left Shoulder Bus-on-Shoulder
Figure 2-5: Orange Line Station

Chapter 2 • Literature Review
2-9
with grade crossing accidents, but these diminished with improved signage and markings.
Motorists also had to adapt to the new situation. The project has specially designed buses with
doors on both sides to allow stops at median stations as shown in the photo. The project has been
so successful that Metro is considering expansion options and a possible conversion to light rail.
South Dade Busway Opened in 1997, this busway utilizes a former
Florida East Coast Railroad right-of-way. It is one
lane in each direction with at-grade crossings of
local streets. A bike path is located adjacent to the
busway in the busway right-of-way. Crossings are
signalized. The initial phase of the busway, which
consists of 8.3 miles, opened in 1997. The first
segment of the extension to Florida City, opened in
2005, and extended the busway five miles to
Naranja. The second and final segment of the
extension, which opened on December 16, 2007,
extends the busway another 6.5 miles south to Florida City, Miami-Dade County’s southernmost
municipality. There are 56 busway stations all of them right-side loading. A 10 percent time
savings was reported as compared to when the buses operated on the parallel US-1. Ridership
increased dramatically when the
project opened and has continued
to grow as this is a high growth
region of the county. There was a
major increase in bus frequency
which helped to encourage new
ridership. Accidents at
intersections has proved to be a
problem and modification to traffic
signals and signage was necessary.
Originally the signal system was
designed to allow the buses to
travel through the intersections at
45 mph without stopping. To
reduce the number and severity of
accidents the approach speed of the
buses has been reduced to 15 mph.
Figure 2-6: South Dade Busway Station
Figure 2-7: Dade Busway showing traffic signals at a street crossing

Chapter 2 • Literature Review
2-10
Hartford-New Britain Busway Subsequent to the Transit Cooperative Research
Program Report 117, the Hartford-New Britain
Busway opened in 2015; this busway shares a
portion of the right-of-way with Amtrak and
freight traffic. Much of it is elevated, but there are
three at-grade crossings. A bikeway is also
accommodated. It is about ten miles in length
with 10 stations and serves about 19,500 daily
riders. Most stations have passing lanes and are
side-platform designed. Five local and four
express routes operate along the busway. When
opened, the costs of operating the project were
much higher than expected and ridership was
below the projections. However, since then
ridership has increased and there is now discussion of an extension.
Figure 2-8: Hartford-New Britain Busway Station

3-1
Chapter 3
Existing Conditions
Background As the Monterey Bay area continues to grow, congestion and delay on SR 1 in both Monterey and
Santa Cruz Counties is becoming more severe. This is further exacerbated by the strong Northern
California economy. MST and METRO buses that use SR 1 must contend with this congestion
nearly every day, diminishing the service quality and reliability that they can offer their riders
and increasing their costs of operation. Physical improvements to the highway are difficult and
can take many years due to lack of funding, environmental issues, and geometric as well as
geographic constraints.
This chapter provides an overview of the existing transportation conditions in the study corridor
for both Monterey and Santa Cruz Counties. It addresses the current and projected future traffic
conditions, transit operations and ridership, and highway geometrics. For those interested in a
more comprehensive presentation and analysis should refer to a separate document entitled
Preliminary Analysis Report which was prepared as part of this study.
Study Area The study area of this project includes the portion of SR 1 located between the Cities of Monterey
and Santa Cruz. The northern limit of the study area is the Ocean Street interchange in the City of
Santa Cruz and the southern limit is the Carpenter Street intersection near the City of Carmel.
However, currently, the majority of MST and METRO bus lines running along SR 1 are operating
near the southern terminus of the study area (in Monterey County between Fremont Street and
SR 156 interchanges) and northern terminus (in Santa Cruz County between Main Street and
Ocean Street interchanges) of the study corridor, but not in the central portion of the corridor,
where only two MST bus lines operate providing limited service on weekdays. Therefore, for the
bus-on-shoulder concept, this study will focus on areas located near the northern and southern
termini of the study corridor. These focus areas of study of the bus-on-shoulder concept are
shown in Figure 3-1 and Figure 3-2. Additionally, this study focuses on providing the bus-on-
shoulder concept during weekday peak period conditions on typical weekday peak period
conditions, rather than weekends or holidays, since this is the time period when buses are most
likely to perceive maximum and regular benefits from shoulder operations. In Monterey County,
the study will also examine the potential for a bus only facility on the Monterey Branch Rail Line
which parallels SR 1 from SR 156 all the way to the City of Monterey.


Chapter 3 • Existing Conditions
3-2
Figure 3-1: Bus-on-Shoulder Concept Focus Area – Santa Cruz County


Chapter 3 • Existing Conditions
3-3
Figure 3-2: Bus-on-Shoulder Concept Focus Area – Monterey County

Chapter 3 • Existing Conditions
3-4
Existing Traffic Conditions Existing traffic conditions along the SR 1 study corridor are described in this section, including
lane configurations, traffic volumes, travel times, and operational issues. Currently documented
traffic forecasts are also discussed.
Highway Configuration SR 1, in the study area, includes sections classified as freeway, expressway, and conventional
highway. A summary of the study corridor attributes is included in Table 3-1, while the
distribution of number of lanes along the study corridor near the northern and southern termini
are illustrated in Figure 3-3 and Figure 3-4. The focus areas for bus-on-shoulder operations in
Monterey and Santa Cruz Counties are classified as freeway. Freeway sections in Santa Cruz
County are primarily four-lane segments, with a short six-lane section south of the SR 17
interchange. Similarly, freeway sections in Monterey County are primarily four-lane segments
(two lanes in each direction), with a six-lane segment between the north side of Seaside and the
south side of Marina. There are also highway sections (two to three miles long) north of
Watsonville that have a third lane in one of the travel directions.
Traffic Volumes Average annual daily traffic values along the study corridor are provided in Table 3-2. Highway
segments with the highest daily volumes are located in Santa Cruz County between Freedom
Boulevard and SR 17. There are also high-volume segments in Monterey County between Aguajito
Road and SR-68, and between Seaside and Marina.

Chapter 3 • Existing Conditions
3-5
Table 3-1: State Route 1 Road Attributes
County Limits of SR 1 Segment
Facility Type Number of
Lanes Auxiliary Lanes
Southern Northern
Monterey North of Carpenter Street,
Carmel
(PM 74.932)
Fremont Boulevard, Seaside
(PM 80.679) Freeway
2 in each direction
Munras Avenue – SR-68/Holman Highway (SB)
Fremont Street – SR 68/Salinas Highway (2 NB and SB lanes)
SR-68/Salinas Highway – Casa Verde Way (NB and SB)
Del Monte Avenue – Canyon Del Rey Boulevard (NB and SB)
Monterey Fremont Boulevard, Seaside (PM 80.679)
Del Monte Boulevard, Marina (PM 85.135)
Freeway 3 in each direction
-
Monterey Del Monte Boulevard, Marina (PM 85.135)
SR 156, Castroville (PM 91.019)
Freeway 2 in each direction
Molera Road/Nashua Road – SR 156 (NB and SB)
Monterey SR 156, Castroville (PM
91.019) SR 183, Castroville (PM
92.288) Expressway
1 in each direction
-
Monterey SR 183, Castroville (PM
92.288) Salinas Road (PM 101.443)
Conventional Highway
1 in each direction
-
Monterey Salinas Road (PM 101.443) Santa Cruz County Line
(PM 102.031) Freeway
2 in each direction
-
Santa Cruz Monterey County Line (PM
0.000) Airport Boulevard,
Watsonville (PM R3.181) Freeway
2 in each direction
-
Santa Cruz Airport Boulevard,
Watsonville (PM R3.181) Between Buena Vista Drive
and Mar Monte Avenue Freeway
NB 3 lanes
SB 2 lanes -
Santa Cruz Between Buena Vista Drive
and Mar Monte Avenue Larkin Valley Road (PM
R7.663) Freeway
NB 2 lanes
SB 3 lanes -
Santa Cruz Larkin Valley Road (PM
R7.663) Morrissey Boulevard (PM
15.822) Freeway
2 in each direction
Bay Avenue – 41st Avenue (NB and SB)
Soquel Drive – Morrissey Boulevard (NB and SB)
Santa Cruz Morrissey Boulevard (PM
15.822) SR 17 (PM 16.821) Freeway
3 in each direction
-
Santa Cruz SR 17 (PM 16.821) South of SR-9/River Street
(PM 17.456) Freeway
2 in each direction
-
Notes:
PM – Caltrans Postmile
NB – Northbound, SB – Southbound


Chapter 3 • Existing Conditions
3-6
Figure 3-3: State Route 1 Facility Type and Lanes in Each Direction – Santa Cruz County


Chapter 3 • Existing Conditions
3-7
Figure 3-4: State Route 1 Facility Type and Lanes in Each Direction – Monterey County

Chapter 3 • Existing Conditions
3-8
Table 3-2: Study Corridor Daily Traffic Volumes
County Limits of SR 1 Segment Average Annual Daily
Traffic (2015) Southern Limit Northern Limit
Monterey Ocean Avenue, Carmel SR-68/Holman Highway 46,100
Monterey SR-68/Holman Highway Aguajito Road 52,000
Monterey Aguajito Road SR-68/Salinas Highway 77,000
Monterey SR-68/Salinas Highway Del Monte Avenue, Monterey 58,000
Monterey Del Monte Avenue, Monterey Fremont Boulevard, Seaside 72,000
Monterey Fremont Boulevard, Seaside Imjin Parkway 83,000
Monterey Imjin Parkway Del Monte Boulevard, Marina 64,900
Monterey Del Monte Boulevard, Marina SR 156 47,000
Monterey SR 156 SR 183 17,700
Monterey SR 183 Santa Cruz/Monterey County Line 37,000
Santa Cruz Santa Cruz/Monterey County Line SR 129 37,000
Santa Cruz SR 129 SR 152 40,000
Santa Cruz SR 152 Larkin Valley Road 60,000
Santa Cruz Larkin Valley Road Freedom Boulevard 68,000
Santa Cruz Freedom Boulevard Bay Avenue 88,000
Santa Cruz Bay Avenue 41st Avenue 97,000
Santa Cruz 41st Avenue Soquel Avenue 88,000
Santa Cruz Soquel Avenue Morrissey Boulevard 94,000
Santa Cruz Morrissey Boulevard SR 17 86,000
Santa Cruz SR 17 SR-9/River Street 61,000
Santa Cruz SR-9/River Street Mission Street 47,000
Source: Caltrans, 2015 Traffic Volumes on California State Highways. (http://www.dot.ca.gov/trafficops/census/)
Travel Times and Speeds Travel speeds under weekday peak period conditions were evaluated all along the study corridor.
Even though data were compiled for the entire study area, the primary focus of operations
analysis, as mentioned above, was on the two focus areas located near the northern and southern
termini of the study corridor.
Speed Data
Travel time and speed analysis is based on data obtained from INRIX database for all midweek
days (Tuesday through Thursday) in year 2016. The INRIX data represent anonymous tracking of
trajectories based on signals from a sample of mobile devices (mobile phones and global
positioning system/GPS units). Speed data were obtained from the INRIX database for all 12
months (from January 1 to December 31) in year 2016. The raw speed data included every day of

Chapter 3 • Existing Conditions
3-9
the year, every segment between freeway interchanges or major cross streets, and is split into
designated time periods.
The initial analysis was based on five-minute intervals (12 speeds reported for each hour of the
day for each segment). The five-minute analysis was too variable to provide meaningful results
along the study corridor. Therefore, a second version of the data set was obtained with speeds
reported by 15-minute intervals (four speeds reported for each hour of the day for each
segment).
Speed Data Analysis
Traffic and congestion on SR 1 varies depending on the time of year and day of the week. This
analysis was focused on typical weekday peak period conditions, rather than weekends or
holidays, since this is the time period when buses are most likely to perceive maximum and
regular benefits from shoulder operations. Therefore, data were extracted for the midweek days
(Tuesday, Wednesday, and Thursday).
The INRIX data were separated into sections by county. The Monterey County section covers
approximately 28 miles between SR 68 in Monterey and Riverside Drive (SR 129) in Watsonville,
with primary focus on the southern area between SR 68 and SR 156. The Santa Cruz County
section is approximately 17 miles between Riverside Drive in Watsonville and River Street in
Santa Cruz. These two sections were further subdivided by direction and evaluated for the
morning (5 AM – 10 AM) and evening (3 PM – 7 PM) peak periods.
Determination of Representative Weekday Conditions
The total end-to-end corridor travel times for each county segment were calculated for each of
the approximately 156 midweek days and compared. Travel times along the study corridor at
various percentiles are reported in Table 3-3 and Figure 3-5 and Figure 3-6.
Table 3-3: Study Corridor Travel Times
Percentile of Days
Travel Times (minutes)
Northbound AM
(5 AM – 10 AM)
Northbound PM
(3 PM – 7 PM)
Southbound AM
(5 AM – 10 AM)
Southbound PM
(3 PM – 7 PM)
Monterey County – between SR 68 in Monterey and SR-156 in Castroville
50th (median) 27.8 35.1 42.5 34.8
85th 28.4 41.8 49.9 45.8
90th 28.5 43.5 51.0 48.0
95th 28.7 47.0 55.8 53.3
99th 35.3 58.1 80.7 69.5
Santa Cruz County - between Riverside Drive in Watsonville and River Street in Santa Cruz
50th (median) 37.6 19.7 17.5 45.2
85th 47.5 22.0 19.2 55.4
90th 49.5 22.8 19.8 60.1
95th 54.5 24.5 22.1 65.6
99th 85.1 55.8 33.0 80.8
Source: Kittelson & Associates based on INRIX data for all midweek days (Tuesday-Thursday) in 2016.

Chapter 3 • Existing Conditions
3-10
Figure 3-5: State Route 1 Travel Times for 2016 Weekdays – Monterey County
Figure 3-6: State Route 1 Travel Times for 2016 Weekdays – Santa Cruz County
0
10
20
30
40
50
60
70
80
90
50th 85th 90th 95th 99th
Tra
ve
l T
ime
(m
inu
tes)
Percentile of Weekdays
NB AM NB PM SB AM SB PM
0
10
20
30
40
50
60
70
80
90
50th 85th 90th 95th 99th
Tra
ve
l T
ime
(m
inu
tes)
Percentile of Weekdays
NB AM NB PM SB AM SB PM

Chapter 3 • Existing Conditions
3-11
The 50th percentile (median) condition provides a representation of average travel conditions,
but does not completely describe the range of congestion that travelers experience along the
study corridor. There is a large gap between the 95th and 99th percentile conditions, indicating
that the 99th percentile likely includes a number of days with atypical incident conditions. The
95th percentile travel time was therefore selected as the representative condition to determine
speed patterns for all but the worst days on the study corridor which presumably correspond to
major incidents.
For each segment, peak period, and direction, the travel time and speed profiles were evaluated
for several days that had travel times consistent with the 50th or 95th percentile corridor times.
Data days occurring during summer months were not included in the evaluation. The most
representative speed profiles were selected based on this comparison and evaluation. For the
Monterey County section, the focus was on the congestion profiles in the southern area between
SR 68 and SR 156.
Speed Contour Maps
Speed contour maps were prepared for each segment and 15-minute time period representing
the 50th (median) and 95th percentile travel time day for each corridor and time period. The
congestion and queues shown for the 95th percentile represent the typical maximum travel times
over what is experienced on weekdays during the course of a year (all but the worst five percent
of weekdays, which most likely include major incident conditions).
Speed profiles along the study area located in Monterey County are provided in Table 3-4
through Table 3-11. A discussion on traffic operations along the study corridor located in
Monterey County is provided below.
Northbound SR 1 in Monterey County
▪ AM Peak Period - While there was no significant congestion along northbound SR 1 on the
95th percentile travel time day during the AM peak period, there was minor congestion
occurring near SR-68 and between Merritt Street and Salinas Road that lasted for the entire
AM peak period.
▪ PM Peak Period - Three areas of congestion were observed along northbound SR 1 during
the PM peak period. They include:
• Minor congestion occurring around the SR-68 interchange that lasted the entire PM
peak period;
• Significant congestion that started around the SR 218 interchange at 3:30 PM and
extended as far back as the SR-68 before dissipating at around 6:45 PM; and
• Significant congestion between SR 156 and Salinas Road which lasted the entire PM
peak period.

Chapter 3 • Existing Conditions
3-12
Southbound SR 1 in Monterey County
▪ AM Peak Period - Three areas of congestion were observed along southbound SR 1 during
the AM peak period. They are as follows:
• Light congestion between Struve Road and Dolan Road that lasted the entire AM peak
period;
• Minor congestion around SR-68 that extended as far as Soledad Drive and lasted the
entire AM peak period; and
• Significant congestion starting near SR 218 at 7:30 AM and lasted until at least 10 AM
when it began to clear. At its peak (7:45 AM – 8:30 AM), this congestion extended to
Reservation Road.
▪ PM Peak Period - Two areas of congestion were observed along southbound SR 1 during
the PM peak period, including significant congestions:
• Between Salinas Road and Merritt Street which lasted the entire PM peak period, but
was the most critical starting around 5 PM, and
• Near SR-68 which lasted the entire PM peak period.
Overall, for the portion of the study corridor located within Monterey County, traffic operations
are worse along southbound SR 1 during the AM peak period and along northbound SR 1 during
the PM peak period.

Chapter 3 • Existing Conditions
3-13
Table 3-4: Weekday 50th Percentile (Median) Speeds – Northbound AM (Monterey County)
Time
Cape
nter
Str
eet
to S
R-
68 SR-6
8 to
Mun
ras
Ave
nue
Mun
ras
Ave
nue
to
Sole
dad
Dri
ve
Sole
dad
Dri
ve t
o
Agu
ajit
o Ro
ad
Agu
ajit
o Ro
ad t
o Sl
oat
Ave
nue
Sloa
t A
venu
e to
SR-
68
SR-6
8 to
Cas
a V
erde
Way
Casa
Ver
de W
ay t
o
Del
Mon
te A
venu
e
Del
Mon
te A
venu
e to
SR-2
18
SR-2
18 t
o Fr
emon
t
Boul
evar
d
Frem
ont
Boul
evar
d to
Ligh
tfig
hter
Dri
ve
Ligh
tfig
hter
Dri
ve t
o
1st
Ave
nue
1st
Ave
nue
to D
el
Mon
te B
oule
vard
Del
Mon
te B
oule
vard
to R
eser
vati
on R
oad
Rese
rvat
ion
Road
to
Del
Mon
te B
oule
vard
Del
Mon
te B
oule
vard
to M
oler
a Ro
ad
Mol
era
Road
to
SR-
156
SR-1
56 t
o M
erri
tt
Stre
et
Mer
ritt
Str
eet
to
Dol
and
Road
Dol
and
Road
to
Stru
ve
Road
Stru
ve R
oad
to S
alin
as
Road
Salin
as R
oad
to
Traf
ton
Road
Traf
ton
Road
to
Rive
rsid
e D
rive
5:00 50 57 64 64 60 58 60 54 61 63 67 68 62 64 66 61 64 62 54 53 53 59 58
5:15 50 57 64 60 60 59 68 60 58 60 71 74 72 72 71 66 70 64 56 53 54 59 58
5:30 50 57 64 65 60 62 61 64 64 64 66 69 69 71 70 59 69 67 62 58 57 69 66
5:45 50 57 64 65 60 62 60 64 64 64 62 65 65 67 66 59 61 62 53 53 56 65 65
6:00 49 59 65 66 62 61 61 62 68 69 72 67 68 69 67 60 57 63 54 48 52 61 62
6:15 49 57 62 62 61 60 65 65 65 66 70 67 75 75 74 71 71 63 47 51 52 61 62
6:30 49 59 62 60 60 60 69 68 65 66 70 72 71 70 70 67 64 63 48 49 51 61 62
6:45 49 59 65 62 61 61 65 65 62 63 70 72 72 71 73 72 68 68 48 35 53 65 67
7:00 40 52 61 62 60 57 57 62 61 62 66 67 68 68 68 62 61 61 46 46 57 64 65
7:15 40 52 61 62 60 60 60 62 61 60 70 68 68 70 68 32 58 56 53 53 55 63 65
7:30 40 52 60 60 60 61 61 62 61 60 66 68 68 69 67 66 64 61 55 54 57 64 64
7:45 40 52 61 60 60 60 60 61 58 61 63 68 65 65 66 66 66 61 55 53 56 66 65
8:00 46 58 61 60 60 60 60 61 59 62 63 65 69 69 68 63 61 60 53 55 57 71 71
8:15 43 57 60 60 60 60 60 61 59 59 63 63 61 63 66 64 61 60 52 52 54 62 64
8:30 45 57 60 60 60 60 59 60 61 63 64 65 65 66 67 64 63 61 53 51 54 61 63
8:45 39 54 60 60 60 60 59 66 70 68 73 65 64 65 66 65 63 62 52 52 53 60 65
9:00 31 53 60 59 60 60 65 66 65 71 67 73 72 72 69 64 62 49 48 50 53 61 62
9:15 56 56 60 60 60 60 64 64 64 70 70 68 67 70 70 67 64 51 51 55 56 64 63
9:30 30 56 60 60 60 58 61 57 62 65 65 67 66 67 71 68 66 58 54 53 57 65 63
9:45 41 53 59 60 59 57 57 50 59 64 63 64 66 64 64 65 64 60 53 53 54 66 65
10:00 46 57 60 60 60 59 60 60 59 66 70 72 69 71 68 70 71 56 51 54 56 67 67
Legend
Green Greater than 55 mph
Yellow 45 to 55 mph
Orange 35 to 45 mph
Red Less than 35 mph

Chapter 3 • Existing Conditions
3-14
Table 3-5: Weekday 95th Percentile Speeds – Northbound AM (Monterey County)
Time
Cape
nter
Str
eet
to S
R-
68 SR-6
8 to
Mun
ras
Ave
nue
Mun
ras
Ave
nue
to
Sole
dad
Dri
ve
Sole
dad
Dri
ve t
o
Agu
ajit
o Ro
ad
Agu
ajit
o Ro
ad t
o Sl
oat
Ave
nue
Sloa
t A
venu
e to
SR-
68
SR-6
8 to
Cas
a V
erde
Way
Casa
Ver
de W
ay t
o
Del
Mon
te A
venu
e
Del
Mon
te A
venu
e to
SR-2
18
SR-2
18 t
o Fr
emon
t
Boul
evar
d
Frem
ont
Boul
evar
d to
Ligh
tfig
hter
Dri
ve
Ligh
tfig
hter
Dri
ve t
o
1st
Ave
nue
1st
Ave
nue
to D
el
Mon
te B
oule
vard
Del
Mon
te B
oule
vard
to R
eser
vati
on R
oad
Rese
rvat
ion
Road
to
Del
Mon
te B
oule
vard
Del
Mon
te B
oule
vard
to M
oler
a Ro
ad
Mol
era
Road
to
SR-
156
SR-1
56 t
o M
erri
tt
Stre
et
Mer
ritt
Str
eet
to
Dol
and
Road
Dol
and
Road
to
Stru
ve
Road
Stru
ve R
oad
to S
alin
as
Road
Salin
as R
oad
to
Traf
ton
Road
Traf
ton
Road
to
Rive
rsid
e D
rive
5:00 50 54 60 60 60 60 64 68 67 66 64 65 63 63 61 58 61 59 54 54 54 63 68
5:15 51 54 59 59 59 60 61 63 63 64 64 65 63 63 61 62 62 59 54 54 54 62 54
5:30 51 54 59 59 59 60 61 63 62 63 63 66 61 63 64 63 61 58 53 54 54 59 60
5:45 51 54 59 59 59 60 61 63 62 59 61 64 60 64 64 64 62 53 49 53 54 62 65
6:00 47 53 62 63 63 60 65 63 64 62 59 61 59 61 64 62 63 64 52 53 54 62 64
6:15 47 55 61 61 61 60 66 65 65 65 67 66 64 65 71 67 61 61 51 51 51 65 65
6:30 47 55 61 61 60 61 68 67 66 63 55 67 68 69 66 66 71 66 46 36 46 61 61
6:45 47 53 62 63 62 65 65 65 64 65 37 62 61 64 64 63 62 64 22 25 43 61 64
7:00 44 57 64 65 64 64 64 72 71 70 56 69 69 69 67 64 62 61 23 32 46 62 65
7:15 44 57 64 65 64 64 64 72 75 69 67 72 71 69 68 71 73 60 45 47 54 63 64
7:30 44 55 64 65 64 64 64 70 74 67 65 67 69 70 67 69 64 62 57 54 55 63 64
7:45 45 54 64 61 60 61 65 67 67 69 71 64 61 62 62 63 58 67 54 54 52 61 63
8:00 40 51 61 59 55 58 59 56 59 59 62 64 67 68 67 68 58 66 53 53 54 62 64
8:15 41 50 57 57 55 51 54 58 64 63 61 64 64 64 62 63 61 65 54 52 54 62 64
8:30 47 56 60 60 60 60 71 66 67 67 66 65 64 65 64 63 61 57 54 52 55 62 64
8:45 45 55 60 60 59 61 62 65 62 65 64 66 65 66 65 64 68 59 53 54 56 63 65
9:00 45 57 60 60 60 60 59 65 62 67 63 63 61 61 61 62 60 54 53 53 54 60 61
9:15 42 50 56 57 57 57 58 59 57 61 62 64 62 66 65 61 61 60 51 52 55 60 59
9:30 45 57 59 59 60 58 61 60 60 61 63 64 63 65 65 63 64 53 52 53 56 66 68
9:45 46 56 60 60 60 53 61 61 58 61 64 66 64 66 67 68 67 55 53 54 56 64 66
10:00 42 54 60 60 60 60 63 62 62 64 64 67 62 63 63 66 66 46 54 55 57 62 65
Legend
Green Greater than 55 mph
Yellow 45 to 55 mph
Orange 35 to 45 mph
Red Less than 35 mph

Chapter 3 • Existing Conditions
3-15
Table 3-6: Weekday 50th Percentile (Median) Speeds – Northbound PM (Monterey County)
Time
Cape
nter
Str
eet
to S
R-
68 SR-6
8 to
Mun
ras
Ave
nue
Mun
ras
Ave
nue
to
Sole
dad
Dri
ve
Sole
dad
Dri
ve t
o
Agu
ajit
o Ro
ad
Agu
ajit
o Ro
ad t
o Sl
oat
Ave
nue
Sloa
t A
venu
e to
SR-
68
SR-6
8 to
Cas
a V
erde
Way
Casa
Ver
de W
ay t
o
Del
Mon
te A
venu
e
Del
Mon
te A
venu
e to
SR-2
18
SR-2
18 t
o Fr
emon
t
Boul
evar
d
Frem
ont
Boul
evar
d to
Ligh
tfig
hter
Dri
ve
Ligh
tfig
hter
Dri
ve t
o
1st
Ave
nue
1st
Ave
nue
to D
el
Mon
te B
oule
vard
Del
Mon
te B
oule
vard
to R
eser
vati
on R
oad
Rese
rvat
ion
Road
to
Del
Mon
te B
oule
vard
Del
Mon
te B
oule
vard
to M
oler
a Ro
ad
Mol
era
Road
to
SR-
156
SR-1
56 t
o M
erri
tt
Stre
et
Mer
ritt
Str
eet
to
Dol
and
Road
Dol
and
Road
to
Stru
ve
Road
Stru
ve R
oad
to S
alin
as
Road
Salin
as R
oad
to
Traf
ton
Road
Traf
ton
Road
to
Rive
rsid
e D
rive
15:00 37 52 58 60 56 59 61 62 60 62 65 68 70 69 69 67 64 50 41 52 52 59 61
15:15 44 54 58 59 56 58 61 59 52 57 62 61 62 66 66 61 63 56 40 51 52 60 61
15:30 40 56 59 59 58 58 58 62 61 62 65 63 65 66 65 63 62 57 47 51 53 62 61
15:45 38 54 60 59 59 60 62 57 43 53 65 68 66 68 65 63 62 57 49 49 50 59 61
16:00 42 57 60 60 57 50 43 29 18 44 65 64 64 67 66 64 64 33 44 52 52 60 65
16:15 38 54 60 50 19 17 16 13 19 41 65 69 72 66 66 64 61 19 46 45 47 61 64
16:30 41 51 39 22 17 19 17 14 23 44 67 69 68 69 67 65 61 19 42 33 46 63 64
16:45 42 53 41 25 17 16 15 14 16 46 65 66 67 70 70 68 63 25 31 26 38 63 64
17:00 40 57 54 34 17 16 13 13 16 46 64 65 64 68 68 63 63 54 21 21 40 67 73
17:15 45 55 60 43 17 17 14 11 13 47 67 67 64 68 70 68 66 43 18 35 35 66 69
17:30 43 54 60 56 16 14 14 13 15 43 68 68 69 69 70 67 64 36 22 33 35 65 66
17:45 42 51 60 58 52 22 21 17 18 41 66 68 70 68 70 66 66 57 26 28 38 65 66
18:00 34 56 60 59 58 32 27 31 27 45 65 69 70 68 71 68 65 39 32 25 39 65 67
18:15 43 53 60 57 56 47 48 68 66 60 67 71 70 70 66 65 69 37 40 40 39 62 65
18:30 41 57 60 59 59 59 65 65 66 65 70 69 70 72 69 65 65 36 37 44 41 63 61
18:45 40 53 59 58 50 48 54 59 56 66 71 67 63 63 66 66 69 51 56 53 53 70 67
19:00 42 53 62 61 56 60 65 63 65 71 69 72 70 73 71 69 69 58 53 55 54 70 73
Legend
Green Greater than 55 mph
Yellow 45 to 55 mph
Orange 35 to 45 mph
Red Less than 35 mph

Chapter 3 • Existing Conditions
3-16
Table 3-7: Weekday 95th Percentile Speeds – Northbound PM (Monterey County)
Time
Cape
nter
Str
eet
to S
R-
68 SR-6
8 to
Mun
ras
Ave
nue
Mun
ras
Ave
nue
to
Sole
dad
Dri
ve
Sole
dad
Dri
ve t
o
Agu
ajit
o Ro
ad
Agu
ajit
o Ro
ad t
o Sl
oat
Ave
nue
Sloa
t A
venu
e to
SR-
68
SR-6
8 to
Cas
a V
erde
Way
Casa
Ver
de W
ay t
o
Del
Mon
te A
venu
e
Del
Mon
te A
venu
e to
SR-2
18
SR-2
18 t
o Fr
emon
t
Boul
evar
d
Frem
ont
Boul
evar
d to
Ligh
tfig
hter
Dri
ve
Ligh
tfig
hter
Dri
ve t
o
1st
Ave
nue
1st
Ave
nue
to D
el
Mon
te B
oule
vard
Del
Mon
te B
oule
vard
to R
eser
vati
on R
oad
Rese
rvat
ion
Road
to
Del
Mon
te B
oule
vard
Del
Mon
te B
oule
vard
to M
oler
a Ro
ad
Mol
era
Road
to
SR-
156
SR-1
56 t
o M
erri
tt
Stre
et
Mer
ritt
Str
eet
to
Dol
and
Road
Dol
and
Road
to
Stru
ve
Road
Stru
ve R
oad
to S
alin
as
Road
Salin
as R
oad
to
Traf
ton
Road
Traf
ton
Road
to
Rive
rsid
e D
rive
15:00 43 55 60 60 54 52 65 48 49 57 66 66 65 67 69 65 62 40 46 24 45 63 63
15:15 41 55 60 60 57 57 57 52 37 54 63 66 65 67 67 67 61 40 45 18 41 63 63
15:30 37 53 60 59 47 48 45 20 16 42 63 65 62 64 65 64 62 40 24 16 44 61 62
15:45 42 57 58 40 17 17 16 14 14 43 65 65 65 67 66 62 63 40 20 19 48 70 65
16:00 39 54 20 18 13 14 11 14 15 44 64 64 66 67 66 63 64 15 19 28 48 63 65
16:15 37 36 22 14 15 10 10 9 11 38 64 65 65 67 67 70 71 17 23 27 50 60 62
16:30 23 13 9 16 17 16 13 11 15 44 64 68 67 72 69 65 63 11 25 30 49 62 62
16:45 26 17 9 14 22 10 10 12 17 42 65 67 68 69 67 65 65 8 17 32 49 62 64
17:00 35 21 7 12 12 13 12 10 13 41 62 67 67 68 66 63 71 19 20 23 52 66 65
17:15 28 17 10 11 21 19 18 12 12 41 63 67 64 68 64 62 65 18 26 24 49 65 67
17:30 31 17 6 20 16 15 20 14 17 46 65 70 65 68 68 62 64 11 19 26 50 71 67
17:45 38 25 10 15 17 18 15 20 17 42 64 68 67 68 68 66 67 9 16 32 51 64 65
18:00 42 48 15 23 18 20 19 15 15 47 65 69 63 64 72 66 61 9 18 32 51 68 67
18:15 43 54 60 54 30 16 13 18 18 43 65 66 68 72 70 68 63 27 21 29 52 71 73
18:30 44 56 60 60 46 24 17 19 20 44 62 66 65 70 68 65 62 44 28 36 45 69 64
18:45 46 57 60 60 57 55 63 64 59 61 62 65 63 66 63 64 62 58 31 27 52 64 63
19:00 37 57 60 60 55 59 57 59 60 60 66 66 61 67 68 68 68 59 51 46 53 62 64
Legend
Green Greater than 55 mph
Yellow 45 to 55 mph
Orange 35 to 45 mph
Red Less than 35 mph

Chapter 3 • Existing Conditions
3-17
Table 3-8: Weekday 50th Percentile (Median) Speeds – Southbound AM (Monterey County)
Time
Har
kins
Slo
ugh
Road
to R
iver
side
Dri
ve
Rive
rsid
e D
rive
to
Salin
as R
oad
Salin
as R
oad
to S
truv
e
Road
Stru
ve R
oad
to D
olan
d
Road
Dol
and
Road
to
Mer
ritt
Str
eet
Mer
ritt
Str
eet
to S
R-
156
SR-1
56 t
o M
oler
a
Road
Mol
era
Road
to
Del
Mon
te B
oule
vard
Del
Mon
te B
oule
vard
to R
eser
vati
on R
oad
Rese
rvat
ion
Road
to
Del
Mon
te B
oule
vard
Del
Mon
te B
oule
vard
to 1
st A
venu
e
1st
Ave
nue
to
Ligh
tfig
hter
Dri
ve
Ligh
tfig
hter
Dri
ve t
o
Frem
ont
Boul
evar
d
Frem
ont
Boul
evar
d to
SR-2
18
SR-2
18 t
o D
el M
onte
Ave
nue
Del
Mon
te A
venu
e to
Casa
Ver
de W
ay
Casa
Ver
de W
ay t
o SR
-
68 SR-6
8 to
Slo
at A
venu
e
Sloa
t A
venu
e to
Agu
ajit
o Ro
ad
Agu
ajit
o Ro
ad t
o
Sole
dad
Dri
ve
Sole
dad
Dri
ve t
o
Mun
ras
Ave
nue
Mun
ras
Ave
nue
to S
R-
68 SR-6
8 to
Car
pent
er
Stre
et
5:00 62 57 55 52 51 58 66 62 61 61 62 58 60 60 59 62 63 57 59 54 50 45 47
5:15 64 56 60 54 49 54 62 60 62 62 60 58 59 58 56 62 63 56 58 54 46 45 47
5:30 66 55 60 52 55 63 68 67 65 64 60 62 74 61 56 59 59 53 56 53 46 44 42
5:45 64 55 55 51 52 58 68 68 70 70 71 74 75 69 68 63 64 56 58 54 50 45 44
6:00 66 60 56 52 52 55 66 63 62 61 60 61 64 62 63 62 60 55 59 58 57 49 45
6:15 71 62 57 56 55 55 64 65 62 61 62 60 61 61 56 61 59 56 58 58 59 52 45
6:30 65 59 49 53 52 55 63 65 64 61 64 63 66 63 60 61 61 56 57 57 53 46 45
6:45 65 62 42 52 52 55 64 64 64 63 64 64 64 62 60 66 67 59 59 58 58 51 50
7:00 68 63 43 50 52 56 66 65 66 64 66 69 69 66 65 66 67 59 60 60 60 49 46
7:15 68 62 51 52 52 55 67 63 65 63 64 53 51 53 61 61 62 56 59 59 57 51 42
7:30 72 69 55 51 38 56 64 67 68 52 23 26 27 51 54 57 60 54 59 57 55 47 36
7:45 65 67 59 53 33 55 68 69 69 56 28 33 27 37 53 47 39 50 56 56 55 48 29
8:00 68 62 54 52 44 55 64 65 66 67 70 49 23 42 50 37 28 47 53 53 52 47 33
8:15 63 60 54 52 45 57 64 63 67 67 65 63 47 41 50 43 48 41 38 46 53 48 35
8:30 65 63 55 53 46 56 61 62 66 66 63 63 55 45 55 57 48 55 56 50 53 45 34
8:45 63 63 55 50 49 53 64 66 65 63 65 67 63 60 61 59 57 53 58 54 52 48 31
9:00 67 62 55 52 49 51 68 69 69 69 66 66 66 63 60 61 61 56 60 60 57 51 31
9:15 64 59 52 57 50 56 68 69 71 70 67 67 66 65 64 62 62 56 60 59 52 50 43
9:30 60 59 52 53 51 55 64 64 65 66 64 66 64 67 64 67 67 56 59 59 58 52 41
9:45 60 60 55 51 50 55 64 63 62 64 66 62 67 67 57 60 61 56 60 57 57 49 41
10:00 65 62 56 51 51 54 65 65 65 65 65 65 66 66 59 62 62 56 59 56 55 52 42
Legend
Green Greater than 55 mph
Yellow 45 to 55 mph
Orange 35 to 45 mph
Red Less than 35 mph

Chapter 3 • Existing Conditions
3-18
Table 3-9: Weekday 95th Percentile Speeds – Southbound AM (Monterey County)
Time
Har
kins
Slo
ugh
Road
to R
iver
side
Dri
ve
Rive
rsid
e D
rive
to
Salin
as R
oad
Salin
as R
oad
to S
truv
e
Road
Stru
ve R
oad
to D
olan
d
Road
Dol
and
Road
to
Mer
ritt
Str
eet
Mer
ritt
Str
eet
to S
R-
156
SR-1
56 t
o M
oler
a
Road
Mol
era
Road
to
Del
Mon
te B
oule
vard
Del
Mon
te B
oule
vard
to R
eser
vati
on R
oad
Rese
rvat
ion
Road
to
Del
Mon
te B
oule
vard
Del
Mon
te B
oule
vard
to 1
st A
venu
e
1st
Ave
nue
to
Ligh
tfig
hter
Dri
ve
Ligh
tfig
hter
Dri
ve t
o
Frem
ont
Boul
evar
d
Frem
ont
Boul
evar
d to
SR-2
18
SR-2
18 t
o D
el M
onte
Ave
nue
Del
Mon
te A
venu
e to
Casa
Ver
de W
ay
Casa
Ver
de W
ay t
o SR
-
68 SR-6
8 to
Slo
at A
venu
e
Sloa
t A
venu
e to
Agu
ajit
o Ro
ad
Agu
ajit
o Ro
ad t
o
Sole
dad
Dri
ve
Sole
dad
Dri
ve t
o
Mun
ras
Ave
nue
Mun
ras
Ave
nue
to S
R-
68 SR-6
8 to
Car
pent
er
Stre
et
5:00 65 59 59 54 53 56 60 59 61 61 57 62 64 60 59 60 60 57 60 56 52 46 46
5:15 64 49 64 63 53 57 62 64 64 62 61 60 60 60 59 60 60 55 58 56 52 47 45
5:30 60 58 59 56 56 59 64 65 67 65 66 65 65 64 62 65 62 57 60 60 55 55 52
5:45 63 57 57 53 54 57 61 62 64 64 65 65 63 62 62 60 60 54 59 57 54 54 54
6:00 61 58 55 52 53 59 64 62 63 63 62 61 56 58 58 59 59 55 59 56 54 48 45
6:15 64 59 60 55 54 56 62 62 61 64 60 68 66 63 62 62 62 56 59 56 53 43 43
6:30 68 59 57 56 54 58 64 64 64 64 62 63 61 66 64 66 66 57 59 58 56 49 49
6:45 65 59 55 53 55 58 64 63 65 66 67 65 62 61 58 59 59 55 58 56 53 48 47
7:00 63 57 54 51 52 57 61 61 62 62 62 64 66 63 58 71 62 57 60 58 53 48 43
7:15 66 59 49 50 52 56 63 61 62 60 50 46 37 37 51 58 59 57 59 59 56 50 43
7:30 63 63 41 51 51 57 63 62 59 28 17 18 17 29 49 62 62 54 58 58 58 52 43
7:45 63 61 50 51 51 57 66 67 60 15 11 12 16 27 48 56 50 52 56 59 59 50 43
8:00 67 68 57 51 53 58 65 64 61 12 8 12 15 23 46 56 54 53 56 56 55 46 44
8:15 63 59 55 52 52 59 64 63 61 16 12 13 16 26 49 59 62 55 59 58 57 50 49
8:30 69 66 54 52 51 56 60 62 62 21 9 13 17 30 51 61 60 55 60 58 57 49 48
8:45 65 60 54 49 50 60 65 62 61 20 17 15 15 28 51 56 58 54 59 59 60 53 52
9:00 64 61 56 52 51 58 67 64 64 38 17 15 17 27 52 62 60 53 58 58 59 46 43
9:15 63 60 55 50 52 57 63 64 65 66 44 21 17 27 47 58 59 55 58 57 55 46 40
9:30 59 58 56 52 52 56 65 65 67 66 63 36 20 37 50 56 57 43 56 58 57 51 45
9:45 61 63 54 50 51 56 67 66 66 69 46 62 34 27 47 60 58 53 58 58 55 48 44
10:00 61 64 56 52 51 56 66 66 66 71 73 71 60 39 53 62 59 54 58 58 57 51 48
Legend
Green Greater than 55 mph
Yellow 45 to 55 mph
Orange 35 to 45 mph
Red Less than 35 mph

Chapter 3 • Existing Conditions
3-19
Table 3-10: Weekday 50th Percentile (Median) Speeds – Southbound PM (Monterey County)
Time
Har
kins
Slo
ugh
Road
to R
iver
side
Dri
ve
Rive
rsid
e D
rive
to
Salin
as R
oad
Salin
as R
oad
to S
truv
e
Road
Stru
ve R
oad
to D
olan
d
Road
Dol
and
Road
to
Mer
ritt
Str
eet
Mer
ritt
Str
eet
to S
R-
156
SR-1
56 t
o M
oler
a
Road
Mol
era
Road
to
Del
Mon
te B
oule
vard
Del
Mon
te B
oule
vard
to R
eser
vati
on R
oad
Rese
rvat
ion
Road
to
Del
Mon
te B
oule
vard
Del
Mon
te B
oule
vard
to 1
st A
venu
e
1st
Ave
nue
to
Ligh
tfig
hter
Dri
ve
Ligh
tfig
hter
Dri
ve t
o
Frem
ont
Boul
evar
d
Frem
ont
Boul
evar
d to
SR-2
18
SR-2
18 t
o D
el M
onte
Ave
nue
Del
Mon
te A
venu
e to
Casa
Ver
de W
ay
Casa
Ver
de W
ay t
o SR
-
68 CA-6
8 O
n-Ra
mp
to C
A-
68 O
ff-R
amp
Sloa
t A
venu
e to
Agu
ajit
o Ro
ad
Agu
ajit
o Ro
ad t
o
Sole
dad
Dri
ve
Sole
dad
Dri
ve t
o
Mun
ras
Ave
nue
Mun
ras
Ave
nue
to S
R-
68 SR-6
8 to
Car
pent
er
Stre
et
15:00 65 66 57 55 52 56 68 72 73 72 72 71 68 64 67 69 65 63 60 59 59 47 44
15:15 62 62 55 50 51 57 67 68 68 71 70 72 68 68 61 63 63 63 59 59 59 50 35
15:30 65 64 56 51 49 55 63 66 67 68 64 66 64 62 57 62 63 63 59 58 53 52 33
15:45 69 70 55 51 51 53 63 66 69 65 69 64 67 60 52 63 62 61 59 58 56 52 32
16:00 70 72 59 51 45 55 65 66 64 68 68 68 71 72 63 67 65 64 60 58 57 50 24
16:15 66 67 55 42 49 55 69 64 67 66 68 69 70 69 62 63 62 60 60 58 58 51 33
16:30 66 65 38 32 49 55 67 67 64 65 67 68 68 71 67 67 66 64 60 58 59 49 30
16:45 68 65 24 37 50 56 69 67 69 69 70 73 70 70 69 67 63 62 60 60 60 52 37
17:00 63 60 26 46 48 58 71 69 69 70 70 72 71 67 70 69 69 65 60 58 58 49 38
17:15 74 67 23 39 50 59 67 66 65 68 70 68 66 65 59 62 61 61 59 60 60 36 47
17:30 64 64 21 37 51 57 65 64 65 69 67 66 65 66 67 68 58 56 57 57 59 21 36
17:45 65 64 22 27 52 57 70 67 68 65 62 65 68 66 64 62 63 62 61 60 58 44 48
18:00 65 72 23 29 52 58 68 70 73 72 75 74 69 71 68 64 62 63 61 60 60 54 47
18:15 65 65 35 43 52 63 73 67 69 68 67 69 67 69 64 69 69 69 60 60 60 56 51
18:30 69 53 57 55 48 63 72 70 71 69 67 68 66 61 57 64 65 65 60 60 60 54 46
18:45 63 64 49 51 38 59 71 70 72 74 65 69 70 59 55 58 61 61 59 59 59 53 42
19:00 64 64 46 52 32 53 65 65 66 73 54 62 61 62 60 62 63 62 62 59 60 54 48
Legend
Green Greater than 55 mph
Yellow 45 to 55 mph
Orange 35 to 45 mph
Red Less than 35 mph

Chapter 3 • Existing Conditions
3-20
Table 3-11: Weekday 95th Percentile Speeds – Southbound PM (Monterey County)
Time
Har
kins
Slo
ugh
Road
to R
iver
side
Dri
ve
Rive
rsid
e D
rive
to
Salin
as R
oad
Salin
as R
oad
to S
truv
e
Road
Stru
ve R
oad
to D
olan
d
Road
Dol
and
Road
to
Mer
ritt
Str
eet
Mer
ritt
Str
eet
to S
R-
156
SR-1
56 t
o M
oler
a
Road
Mol
era
Road
to
Del
Mon
te B
oule
vard
Del
Mon
te B
oule
vard
to R
eser
vati
on R
oad
Rese
rvat
ion
Road
to
Del
Mon
te B
oule
vard
Del
Mon
te B
oule
vard
to 1
st A
venu
e
1st
Ave
nue
to
Ligh
tfig
hter
Dri
ve
Ligh
tfig
hter
Dri
ve t
o
Frem
ont
Boul
evar
d
Frem
ont
Boul
evar
d to
SR-2
18
SR-2
18 t
o D
el M
onte
Ave
nue
Del
Mon
te A
venu
e to
Casa
Ver
de W
ay
Casa
Ver
de W
ay t
o SR
-
68 SR-6
8 to
Slo
at A
venu
e
Sloa
t A
venu
e to
Agu
ajit
o Ro
ad
Agu
ajit
o Ro
ad t
o
Sole
dad
Dri
ve
Sole
dad
Dri
ve t
o
Mun
ras
Ave
nue
Mun
ras
Ave
nue
to S
R-
68 SR-6
8 to
Car
pent
er
Stre
et
15:00 69 64 51 42 49 56 64 66 70 73 67 67 70 70 62 56 57 58 60 60 59 47 29
15:15 66 66 51 47 48 54 69 66 69 69 71 68 67 60 57 65 60 55 59 59 59 52 33
15:30 66 66 51 49 43 54 61 60 62 61 62 63 62 62 58 60 60 54 57 57 57 50 28
15:45 64 69 42 43 46 55 70 70 71 69 63 65 66 62 57 62 62 55 59 57 57 48 36
16:00 65 68 47 38 50 55 65 67 72 73 70 73 69 65 65 69 70 58 59 59 59 57 38
16:15 68 72 54 46 46 54 67 65 67 67 65 67 69 68 65 60 70 60 60 60 56 57 45
16:30 69 70 57 42 50 57 68 65 66 67 63 65 67 64 60 67 69 57 60 57 58 56 43
16:45 69 65 49 41 50 58 68 67 69 67 68 70 67 66 54 63 64 60 60 58 58 53 25
17:00 67 61 35 31 47 53 66 66 68 69 69 70 72 65 61 65 66 58 60 59 59 54 39
17:15 68 69 20 27 47 51 70 65 66 66 66 67 68 61 52 61 57 55 56 59 60 40 39
17:30 69 68 9 22 47 54 67 65 67 69 66 68 69 56 55 61 61 54 58 57 58 47 31
17:45 72 72 7 17 39 50 71 72 73 74 72 72 69 66 54 60 59 54 53 57 59 31 37
18:00 69 70 7 25 34 50 65 63 65 68 72 70 72 69 60 68 68 57 60 60 59 16 45
18:15 66 67 10 30 36 52 64 63 66 66 65 70 69 66 63 65 66 58 60 60 61 41 50
18:30 67 63 15 26 47 54 72 70 72 68 68 72 74 68 64 65 65 51 61 60 60 59 45
18:45 68 63 12 25 44 56 71 68 68 67 65 66 66 63 62 66 67 59 60 60 59 56 45
19:00 60 64 22 26 49 55 74 74 71 69 71 68 70 72 66 68 71 60 60 60 60 59 53
Legend
Green Greater than 55 mph
Yellow 45 to 55 mph
Orange 35 to 45 mph
Red Less than 35 mph

Chapter 3 • Existing Conditions
3-21
Speed profiles along the study area located in Santa Cruz County are provided in Table 3-12
through Table 3-19. A discussion on traffic operations along the study corridor located in
Santa Cruz County is provided below.
Santa Cruz County Northbound
▪ AM Peak Period - Traffic congestion was observed along northbound SR 1 at the following
locations in Santa Cruz County:
• Near SR 17 that started before 5 AM and ended after 10 AM; and
• Between Mar Monte Avenue and 41st Avenue starting around 7 AM and extending past
10 AM.
▪ PM Peak Period - Similar to the AM peak period, traffic congestion was observed along
northbound SR 1 during the PM peak period near SR 17 for the entire analysis period
(3 PM – 7 PM). Additionally, minor congestion was observed from Mar Monte Avenue to SR
17 between about 4:45 PM and 6 PM, with the worst congestion between Larkin
Valley Road and Rio Del Mar Boulevard (from 5 PM to 6 PM).
Santa Cruz County Southbound
▪ AM Peak Period - During a typical weekday, congestion was observed along southbound
SR 1 located in Santa Cruz County during the AM peak period at the following locations:
• Near SR 17 that lasted for the entire duration of the AM peak period; and
• Between Morrissey Boulevard and Bay Avenue from 7:45 AM to 9:30 AM.
PM Peak Period
During the PM peak period, congestion was observed along southbound SR 1 near SR 17.
Additionally, significant congestion was observed between SR 17 and Rio Del Mar Boulevard that
began before 3 PM and ended after 7 PM.
Overall, for the portion of the study corridor located within Santa Cruz County, traffic operations
are worse along northbound SR 1 during the AM peak period and along southbound SR 1 during
the PM peak period.

Chapter 3 • Existing Conditions
3-22
Table 3-12: Weekday 50th Percentile (Median) Speeds – Northbound AM (Santa Cruz County)
Time
Rive
rsid
e D
rive
to
Har
kins
Slo
ugh
Road
Har
kins
Slo
ugh
Road
to
SR-1
52
SR-1
52 t
o A
irpo
rt
Boul
evar
d
Air
port
Bou
leva
rd t
o
Buen
a V
ista
Dri
ve
Buen
a V
ista
Dri
ve t
o La
Selv
a D
rive
La S
elva
Dri
ve t
o La
rkin
Val
ley
Road
Lark
in V
alle
y Ro
ad t
o
Free
dom
Bou
leva
rd
Free
dom
Bou
leva
rd t
o
Rio
Del
Mar
Bou
leva
rd
Rio
Del
Mar
Bou
leva
rd
to S
tate
Par
k D
rive
Stat
e Pa
rk D
rive
to
Park
Ave
nue
Park
Ave
nue
to B
ay
Ave
nue
Bay
Ave
nue
to 4
1st
Ave
nue
41st
Ave
nue
to
Com
mer
cial
Way
Com
mer
cial
Way
to
Mor
riss
ey B
oule
vard
Mor
riss
ey B
oule
vard
to
Emel
ine
Ave
nue
Emel
ine
Ave
nue
to S
R-
17 SR-1
7 to
Riv
er S
tree
t
5:00 58 57 56 53 53 55 55 56 55 56 56 53 55 59 59 46 45
5:15 62 64 63 62 63 65 64 64 62 60 59 57 59 61 60 46 42
5:30 61 63 60 59 60 63 63 63 64 67 71 72 68 72 67 46 39
5:45 62 64 62 63 67 65 65 66 64 61 62 60 59 65 66 44 44
6:00 59 60 56 55 58 60 63 64 64 69 69 68 67 66 60 48 34
6:15 62 62 60 62 63 63 65 62 63 63 60 60 58 61 56 47 37
6:30 70 70 67 68 65 63 62 61 61 60 58 58 57 61 53 45 32
6:45 61 63 61 63 57 59 57 38 53 58 58 55 52 62 58 46 29
7:00 64 64 60 68 56 22 31 31 52 59 57 45 42 57 59 44 36
7:15 69 68 60 68 37 16 18 34 57 60 58 59 59 64 61 45 31
7:30 70 66 64 68 48 10 14 26 53 55 45 36 40 58 56 41 26
7:45 66 65 62 70 69 14 13 21 40 30 18 20 37 56 56 39 23
8:00 66 67 64 66 66 33 9 11 18 22 20 24 37 58 58 38 13
8:15 68 69 69 70 68 34 9 13 21 21 24 24 36 59 57 39 13
8:30 67 67 63 64 64 44 15 17 19 19 23 24 37 58 56 34 16
8:45 64 65 61 60 62 49 12 17 19 22 30 27 37 61 57 42 25
9:00 67 67 66 71 66 63 11 17 24 31 28 29 33 56 55 41 28
9:15 64 66 64 71 70 65 37 22 33 39 40 48 49 57 56 36 32
9:30 67 69 66 71 68 68 68 48 44 51 44 51 46 59 57 39 35
9:45 73 73 68 71 67 67 67 67 51 40 38 38 39 56 55 31 31
10:00 67 69 63 68 69 66 68 63 61 62 45 50 46 57 58 30 22
Legend
Green Greater than 55 mph
Yellow 45 to 55 mph
Orange 35 to 45 mph
Red Less than 35 mph

Chapter 3 • Existing Conditions
3-23
Table 3-13: Weekday 95th Percentile Speeds – Northbound AM (Santa Cruz County)
Time
Rive
rsid
e D
rive
to
Har
kins
Slo
ugh
Road
Har
kins
Slo
ugh
Road
to S
R-15
2
SR-1
52 t
o A
irpo
rt
Boul
evar
d
Air
port
Bou
leva
rd t
o
Buen
a V
ista
Dri
ve
Buen
a V
ista
Dri
ve t
o La
Selv
a D
rive
La S
elva
Dri
ve t
o La
rkin
Val
ley
Road
Lark
in V
alle
y Ro
ad t
o
Free
dom
Bou
leva
rd
Free
dom
Bou
leva
rd t
o
Rio
Del
Mar
Bou
leva
rd
Rio
Del
Mar
Bou
leva
rd
to S
tate
Par
k D
rive
Stat
e Pa
rk D
rive
to
Park
Ave
nue
Park
Ave
nue
to B
ay
Ave
nue
Bay
Ave
nue
to 4
1st
Ave
nue
41st
Ave
nue
to
Com
mer
cial
Way
Com
mer
cial
Way
to
Mor
riss
ey B
oule
vard
Mor
riss
ey B
oule
vard
to
Emel
ine
Ave
nue
Emel
ine
Ave
nue
to S
R-
17 SR-1
7 to
Riv
er S
tree
t
5:00 61 63 60 61 61 60 60 60 58 58 59 56 55 56 57 40 39
5:15 58 61 58 60 61 65 65 64 65 64 65 62 63 63 60 40 38
5:30 61 62 59 60 59 60 60 60 61 60 64 62 61 68 66 40 38
5:45 60 62 60 61 60 62 62 62 63 63 63 61 64 65 68 42 31
6:00 62 62 60 61 62 60 65 64 62 64 63 58 59 66 44 42 32
6:15 62 63 60 59 59 61 62 63 62 62 64 62 63 65 20 41 43
6:30 63 65 62 60 60 60 60 57 58 58 58 57 60 62 26 42 38
6:45 60 63 59 60 54 42 53 51 46 55 55 55 56 58 55 42 36
7:00 60 63 62 66 29 26 30 25 29 56 59 58 58 62 62 46 37
7:15 62 65 68 67 18 12 15 22 29 51 60 59 57 60 60 46 41
7:30 67 66 63 64 19 8 11 18 27 35 55 54 55 57 61 44 29
7:45 68 69 66 69 27 6 8 14 22 39 50 42 47 63 61 39 21
8:00 65 68 66 68 61 7 8 15 23 24 23 22 36 62 57 42 19
8:15 61 71 65 66 66 10 10 12 17 18 21 23 34 61 59 45 14
8:30 67 68 62 70 68 8 7 12 16 17 21 20 32 56 57 44 13
8:45 68 65 63 66 65 8 9 12 19 20 22 23 32 56 57 40 15
9:00 68 69 65 71 54 10 10 16 25 26 24 25 35 59 62 42 18
9:15 61 63 59 63 60 13 12 22 34 27 31 34 38 59 64 41 24
9:30 65 68 65 65 64 19 15 20 29 27 28 27 36 62 64 39 34
9:45 67 67 67 64 65 38 14 15 17 28 33 23 36 63 61 41 37
10:00 65 67 63 66 65 53 13 17 22 37 32 23 36 58 57 43 30
Legend
Green Greater than 55 mph
Yellow 45 to 55 mph
Orange 35 to 45 mph
Red Less than 35 mph

Chapter 3 • Existing Conditions
3-24
Table 3-14: Weekday 50th Percentile (Median) Speeds – Northbound PM (Santa Cruz County)
Time
Rive
rsid
e D
rive
to
Har
kins
Slo
ugh
Road
Har
kins
Slo
ugh
Road
to S
R-15
2
SR-1
52 t
o A
irpo
rt
Boul
evar
d
Air
port
Bou
leva
rd t
o
Buen
a V
ista
Dri
ve
Buen
a V
ista
Dri
ve t
o La
Selv
a D
rive
La S
elva
Dri
ve t
o La
rkin
Val
ley
Road
Lark
in V
alle
y Ro
ad t
o
Free
dom
Bou
leva
rd
Free
dom
Bou
leva
rd t
o
Rio
Del
Mar
Bou
leva
rd
Rio
Del
Mar
Bou
leva
rd
to S
tate
Par
k D
rive
Stat
e Pa
rk D
rive
to
Park
Ave
nue
Park
Ave
nue
to B
ay
Ave
nue
Bay
Ave
nue
to 4
1st
Ave
nue
41st
Ave
nue
to
Com
mer
cial
Way
Com
mer
cial
Way
to
Mor
riss
ey B
oule
vard
Mor
riss
ey B
oule
vard
to
Emel
ine
Ave
nue
Emel
ine
Ave
nue
to S
R-
17 SR-1
7 to
Riv
er S
tree
t
15:00 64 65 62 65 67 65 64 63 61 63 68 60 58 62 56 40 23
15:15 66 67 63 67 67 66 64 67 64 68 62 57 56 59 59 45 22
15:30 65 66 59 65 67 67 64 63 62 63 60 60 58 62 60 44 24
15:45 62 62 58 60 60 62 62 61 60 60 61 58 59 61 61 45 37
16:00 62 68 65 64 64 63 63 62 62 60 60 55 55 61 58 44 21
16:15 61 64 59 61 65 64 67 64 63 64 66 60 59 63 62 42 35
16:30 64 64 60 63 64 64 66 65 63 63 58 57 58 61 60 43 27
16:45 66 67 65 67 66 67 69 66 63 64 58 57 55 63 58 45 39
17:00 64 65 61 65 65 65 64 61 60 59 55 54 55 59 56 43 32
17:15 65 68 59 64 63 68 64 62 61 61 47 47 49 56 55 39 11
17:30 66 67 62 64 64 59 60 58 57 48 32 46 47 53 55 26 11
17:45 65 67 62 69 66 67 66 64 63 56 53 55 55 57 54 41 20
18:00 62 64 61 65 64 64 61 61 61 56 43 55 55 57 55 41 25
18:15 65 67 63 65 65 62 62 61 61 60 56 56 56 57 55 41 35
18:30 72 75 70 69 67 69 69 64 59 60 56 54 60 66 58 41 36
18:45 69 71 68 67 67 72 71 65 61 60 62 61 60 64 61 41 34
19:00 65 66 64 61 64 63 70 68 65 63 65 62 59 63 58 45 40
Legend
Green Greater than 55 mph
Yellow 45 to 55 mph
Orange 35 to 45 mph
Red Less than 35 mph

Chapter 3 • Existing Conditions
3-25
Table 3-15: Weekday 95th Percentile Speeds – Northbound PM (Santa Cruz County)
Time
Rive
rsid
e D
rive
to
Har
kins
Slo
ugh
Road
Har
kins
Slo
ugh
Road
to
SR-1
52
SR-1
52 t
o A
irpo
rt
Boul
evar
d
Air
port
Bou
leva
rd t
o
Buen
a V
ista
Dri
ve
Buen
a V
ista
Dri
ve t
o La
Selv
a D
rive
La S
elva
Dri
ve t
o La
rkin
Val
ley
Road
Lark
in V
alle
y Ro
ad t
o
Free
dom
Bou
leva
rd
Free
dom
Bou
leva
rd t
o
Rio
Del
Mar
Bou
leva
rd
Rio
Del
Mar
Bou
leva
rd
to S
tate
Par
k D
rive
Stat
e Pa
rk D
rive
to
Park
Ave
nue
Park
Ave
nue
to B
ay
Ave
nue
Bay
Ave
nue
to 4
1st
Ave
nue
41st
Ave
nue
to
Com
mer
cial
Way
Com
mer
cial
Way
to
Mor
riss
ey B
oule
vard
Mor
riss
ey B
oule
vard
to
Emel
ine
Ave
nue
Emel
ine
Ave
nue
to S
R-
17 SR-1
7 to
Riv
er S
tree
t
15:00 67 67 64 66 68 65 64 65 59 59 56 55 53 58 57 41 20
15:15 68 67 61 63 63 61 60 61 60 59 48 52 54 55 54 39 13
15:30 63 61 62 63 63 62 61 59 60 57 38 48 52 58 54 41 11
15:45 64 64 61 64 64 60 63 57 58 58 52 47 50 57 55 27 12
16:00 61 64 61 62 61 56 61 60 58 58 58 56 56 59 57 32 18
16:15 62 64 60 63 62 55 60 60 59 59 57 55 56 60 56 42 19
16:30 65 66 63 61 64 65 66 62 59 60 60 59 56 58 57 36 24
16:45 62 65 63 64 65 67 65 40 52 58 54 55 53 55 53 38 21
17:00 64 63 60 63 63 59 44 37 45 54 50 56 46 55 50 36 20
17:15 63 63 60 61 61 57 47 30 38 48 39 54 52 52 48 36 20
17:30 63 62 57 62 60 40 27 34 48 46 32 51 51 53 49 36 14
17:45 61 63 58 65 57 55 34 35 45 49 32 51 50 54 54 39 18
18:00 62 64 61 62 61 59 51 47 46 56 38 44 47 56 56 39 25
18:15 62 65 65 63 64 59 63 61 60 61 59 56 57 57 56 40 34
18:30 62 63 59 60 61 64 61 57 55 59 58 51 52 54 56 39 35
18:45 62 63 62 63 61 58 58 55 55 55 55 51 56 55 56 40 33
19:00 63 64 63 64 66 61 61 59 58 55 56 44 48 53 56 44 35
Legend
Green Greater than 55 mph
Yellow 45 to 55 mph
Orange 35 to 45 mph
Red Less than 35 mph

Chapter 3 • Existing Conditions
3-26
Table 3-16: Weekday 50th Percentile (Median) Speeds – Southbound AM (Santa Cruz County)
Time
Rive
r St
reet
to
SR-1
7
SR-1
7 to
Mor
riss
ey
Boul
evar
d
Mor
riss
ey B
oule
vard
to S
oque
l Dri
ve
Soqu
el D
rive
to
41st
Ave
nue
41st
Ave
nue
to B
ay
Ave
nue
Bay
Ave
nue
to P
ark
Ave
nue
Park
Ave
nue
to S
tate
Park
Dri
ve
Stat
e Pa
rk D
rive
to
Rio
Del
Mar
Bou
leva
rd
Rio
Del
Mar
Bou
leva
rd
to F
reed
om B
oule
vard
Free
dom
Bou
leva
rd t
o
Lark
in V
alle
y Ro
ad
Lark
in V
alle
y Ro
ad t
o
La S
elva
Dri
ve
La S
elva
Dri
ve t
o
Buen
a V
ista
Dri
ve
Buen
a V
ista
Dri
ve t
o
Air
port
Bou
leva
rd
Air
port
Bou
leva
rd t
o
SR-1
52
SR-1
52 t
o H
arki
ns
Slou
gh R
oad
5:00 43 65 65 65 66 62 65 60 62 59 63 62 63 60 63
5:15 43 66 65 68 68 66 68 67 68 66 71 69 70 66 70
5:30 48 58 64 61 67 67 67 65 67 66 69 70 73 69 68
5:45 48 60 65 65 60 62 65 63 63 62 67 64 68 67 68
6:00 40 58 62 62 58 60 64 66 64 64 68 57 67 66 68
6:15 41 64 64 63 61 62 63 61 63 61 65 65 66 63 66
6:30 43 62 63 63 65 66 69 69 66 66 69 65 64 61 69
6:45 41 63 63 61 59 60 65 67 63 63 64 64 64 62 67
7:00 37 56 63 65 64 65 66 64 70 67 70 69 72 65 71
7:15 40 57 63 65 65 65 68 67 69 68 70 67 69 72 68
7:30 45 62 62 62 61 63 65 63 64 63 67 67 66 63 66
7:45 35 65 49 51 43 56 60 62 65 65 70 69 67 63 67
8:00 30 59 45 37 29 41 58 58 60 60 65 63 64 62 64
8:15 38 59 64 53 46 53 63 56 61 54 62 64 65 61 64
8:30 41 60 61 57 55 60 62 59 62 60 65 65 68 71 71
8:45 31 58 62 54 55 57 68 60 66 61 71 67 66 62 66
9:00 39 60 62 63 61 62 65 60 63 61 69 69 69 64 66
9:15 28 62 61 58 58 59 61 57 60 60 68 67 69 63 67
9:30 26 62 62 59 56 58 61 59 63 61 65 67 69 66 67
9:45 39 65 64 59 56 60 61 59 62 58 62 66 66 62 65
10:00 39 65 64 63 61 59 62 58 60 59 63 66 68 63 72
Legend
Green Greater than 55 mph
Yellow 45 to 55 mph
Orange 35 to 45 mph
Red Less than 35 mph

Chapter 3 • Existing Conditions
3-27
Table 3-17: Weekday 95th Percentile Speeds – Southbound AM (Santa Cruz County)
Time
Rive
r St
reet
to
SR-1
7
SR-1
7 to
Mor
riss
ey
Boul
evar
d
Mor
riss
ey B
oule
vard
to
Soqu
el D
rive
Soqu
el D
rive
to
41st
Ave
nue
41st
Ave
nue
to B
ay
Ave
nue
Bay
Ave
nue
to P
ark
Ave
nue
Park
Ave
nue
to S
tate
Park
Dri
ve
Stat
e Pa
rk D
rive
to
Rio
Del
Mar
Bou
leva
rd
Rio
Del
Mar
Bou
leva
rd
to F
reed
om B
oule
vard
Free
dom
Bou
leva
rd t
o
Lark
in V
alle
y Ro
ad
Lark
in V
alle
y Ro
ad t
o
La S
elva
Dri
ve
La S
elva
Dri
ve t
o Bu
ena
Vis
ta D
rive
Buen
a V
ista
Dri
ve t
o
Air
port
Bou
leva
rd
Air
port
Bou
leva
rd t
o SR
-
152
SR-1
52 t
o H
arki
ns
Slou
gh R
oad
5:00 51 59 62 61 54 57 59 62 66 62 63 62 63 61 65
5:15 51 61 64 67 55 61 68 64 65 60 70 68 69 60 64
5:30 45 60 66 64 58 61 63 62 61 57 66 66 66 61 64
5:45 39 61 56 56 53 56 62 63 63 60 65 60 63 59 67
6:00 40 60 51 56 54 53 55 58 63 59 67 63 65 64 68
6:15 43 59 61 60 57 54 57 55 57 57 58 57 61 61 65
6:30 43 57 61 60 57 57 60 59 59 57 63 62 63 61 62
6:45 41 58 63 61 59 59 61 61 64 61 66 65 64 63 67
7:00 42 60 49 57 55 57 59 59 62 66 66 65 65 63 68
7:15 39 59 53 58 58 62 61 62 67 58 65 63 64 62 67
7:30 47 57 57 59 63 64 63 66 72 57 68 65 67 64 65
7:45 41 53 53 54 37 49 57 57 59 56 65 63 67 67 68
8:00 32 56 35 53 39 49 57 56 56 52 64 61 62 59 65
8:15 31 58 34 50 52 55 59 59 60 58 64 64 64 63 65
8:30 39 55 46 46 53 57 60 61 62 60 68 65 61 63 67
8:45 39 53 46 46 45 57 58 57 58 55 64 59 65 63 64
9:00 40 56 45 52 51 57 60 58 58 57 67 65 70 67 67
9:15 34 59 55 57 54 57 60 60 61 54 64 64 64 61 66
9:30 36 60 55 58 55 57 62 60 59 59 62 62 64 60 61
9:45 31 56 55 55 52 57 61 59 58 64 61 62 64 62 65
10:00 40 59 60 63 55 58 60 58 58 62 63 61 61 58 61
Legend
Green Greater than 55 mph
Yellow 45 to 55 mph
Orange 35 to 45 mph
Red Less than 35 mph

Chapter 3 • Existing Conditions
3-28
Table 3-18: Weekday 50th Percentile (Median) Speeds – Southbound PM (Santa Cruz County)
Time
Rive
r St
reet
to
SR-1
7
SR-1
7 to
Mor
riss
ey
Boul
evar
d
Mor
riss
ey B
oule
vard
to
Soqu
el D
rive
Soqu
el D
rive
to
41st
Ave
nue
41st
Ave
nue
to B
ay
Ave
nue
Bay
Ave
nue
to P
ark
Ave
nue
Park
Ave
nue
to S
tate
Park
Dri
ve
Stat
e Pa
rk D
rive
to
Rio
Del
Mar
Bou
leva
rd
Rio
Del
Mar
Bou
leva
rd
to F
reed
om B
oule
vard
Free
dom
Bou
leva
rd t
o
Lark
in V
alle
y Ro
ad
Lark
in V
alle
y Ro
ad t
o La
Selv
a D
rive
La S
elva
Dri
ve t
o Bu
ena
Vis
ta D
rive
Buen
a V
ista
Dri
ve t
o
Air
port
Bou
leva
rd
Air
port
Bou
leva
rd t
o SR
-
152
SR-1
52 t
o H
arki
ns
Slou
gh R
oad
15:00 32 55 18 34 24 41 61 61 62 60 70 67 67 63 65
15:15 42 67 27 16 15 41 60 62 66 64 74 70 71 62 73
15:30 41 59 21 14 18 39 44 39 59 55 69 66 65 62 68
15:45 39 58 13 15 15 26 30 30 60 57 73 68 64 66 72
16:00 25 64 13 14 12 27 25 30 58 55 66 65 64 61 63
16:15 30 59 10 11 10 19 24 30 61 59 69 67 66 63 68
16:30 38 63 16 13 8 13 28 37 61 59 67 65 65 62 67
16:45 34 55 11 10 19 18 33 36 55 56 65 64 67 66 71
17:00 42 54 10 10 15 20 23 32 61 60 67 67 68 66 69
17:15 52 51 8 5 15 16 22 29 66 57 69 66 69 64 68
17:30 37 41 6 5 6 16 21 28 67 52 70 66 69 65 63
17:45 35 40 6 5 8 16 22 34 58 54 67 65 65 56 66
18:00 40 38 7 8 11 24 23 34 56 53 66 66 68 61 65
18:15 40 47 18 12 13 19 22 31 57 54 67 62 64 56 64
18:30 40 55 25 17 24 32 29 27 58 60 66 65 65 62 65
18:45 37 59 47 19 22 34 39 31 60 63 69 64 61 58 62
19:00 38 59 59 40 32 46 55 32 58 54 67 59 56 54 60
Legend
Green Greater than 55 mph
Yellow 45 to 55 mph
Orange 35 to 45 mph
Red Less than 35 mph

Chapter 3 • Existing Conditions
3-29
Table 3-19: Weekday 95th Percentile Speeds – Southbound PM (Santa Cruz County)
Time
Rive
r St
reet
to
SR-1
7
SR-1
7 to
Mor
riss
ey
Boul
evar
d
Mor
riss
ey B
oule
vard
to
Soqu
el D
rive
Soqu
el D
rive
to
41st
Ave
nue
41st
Ave
nue
to B
ay
Ave
nue
Bay
Ave
nue
to P
ark
Ave
nue
Park
Ave
nue
to S
tate
Park
Dri
ve
Stat
e Pa
rk D
rive
to
Rio
Del
Mar
Bou
leva
rd
Rio
Del
Mar
Bou
leva
rd
to F
reed
om B
oule
vard
Free
dom
Bou
leva
rd t
o
Lark
in V
alle
y Ro
ad
Lark
in V
alle
y Ro
ad t
o
La S
elva
Dri
ve
La S
elva
Dri
ve t
o Bu
ena
Vis
ta D
rive
Buen
a V
ista
Dri
ve t
o
Air
port
Bou
leva
rd
Air
port
Bou
leva
rd t
o SR
-
152
SR-1
52 t
o H
arki
ns
Slou
gh R
oad
15:00 41 45 14 19 16 34 40 55 59 59 67 66 68 64 67
15:15 33 52 13 12 10 26 34 47 61 60 69 66 67 66 67
15:30 38 54 8 10 11 20 31 36 60 59 65 63 68 68 71
15:45 33 17 9 11 12 23 30 28 56 57 62 61 62 63 66
16:00 35 10 6 7 11 18 24 28 57 60 70 66 69 64 65
16:15 37 8 5 6 8 15 22 23 58 61 71 67 71 66 72
16:30 40 7 4 5 8 13 21 26 63 59 68 66 67 65 65
16:45 44 8 7 4 10 13 18 24 59 58 65 64 66 61 65
17:00 39 9 7 5 9 12 16 27 61 62 70 67 70 67 69
17:15 38 15 2 5 7 13 22 32 58 60 70 68 67 61 65
17:30 36 8 4 6 11 15 21 29 56 60 69 65 70 64 71
17:45 41 13 9 6 8 13 19 27 56 59 65 64 67 64 71
18:00 40 8 11 8 8 12 16 29 57 61 67 65 68 57 66
18:15 35 14 7 13 10 17 23 27 69 61 67 67 68 59 67
18:30 34 19 6 13 12 22 20 34 62 62 70 67 73 64 70
18:45 41 47 6 10 12 24 33 32 57 60 66 64 69 62 65
19:00 43 61 15 18 20 25 40 44 61 61 66 65 68 65 68
Legend
Green Greater than 55 mph
Yellow 45 to 55 mph
Orange 35 to 45 mph
Red Less than 35 mph

Chapter 3 • Existing Conditions
3-30
Traffic Forecasts Traffic forecasts for year 2040 were obtained from the Caltrans Transportation Concept Draft
Report for State Route 1, May 2017. These forecasts were derived from the regional travel
demand model maintained by AMBAG. The 2040 forecasts are summarized in Table 3-20. These
numbers provide a broad overview of the nature of the traffic growth that is anticipated in the
future in both counties.

Chapter 3 • Existing Conditions
3-31
Table 3-20: State Route 1 Daily Traffic Forecasts
County
Limits of SR 1 Segment Average Annual Daily Traffic
Southern Northern 2015A 2040B Percent Change
Monterey Ocean Avenue, Carmel SR-68/Holman Highway 46,100 47,500 3.0%
Monterey SR-68/Holman Highway Aguajito Road 52,000 56,400 8.5%
Monterey Aguajito Road SR-68/Salinas Highway 77,000 83,200 8.1%
Monterey SR-68/Salinas Highway Del Monte Avenue, Monterey 58,000 63,300 9.1%
Monterey Del Monte Avenue, Monterey Fremont Boulevard, Seaside 72,000 79,600 10.6%
Monterey Fremont Boulevard, Seaside Imjin Parkway 83,000 98,400 18.6%
Monterey Imjin Parkway Del Monte Boulevard, Marina 64,900 92,200 42.1%
Monterey Del Monte Boulevard, Marina SR 156 47,000 52,900 12.6%
Monterey SR 156 SR 183 17,700 20,200 14.1%
Monterey SR 183 Santa Cruz/Monterey County Line 37,000 40,000 8.1%
Santa Cruz Santa Cruz/Monterey County Line SR 129 37,000 41,100 11.1%
Santa Cruz SR 129 SR 152 40,000 45,600 14.0%
Santa Cruz SR 152 Larkin Valley Road 60,000 72,800 21.3%
Santa Cruz Larkin Valley Road Freedom Boulevard 68,000 79,200 16.5%
Santa Cruz Freedom Boulevard Bay Avenue 88,000 112,200 27.5%
Santa Cruz Bay Avenue 41st Avenue 97,000 114,000 17.5%
Santa Cruz 41st Avenue Soquel Avenue 88,000 102,100 16.0%
Santa Cruz Soquel Avenue Morrissey Boulevard 94,000 105,000 11.7%
Santa Cruz Morrissey Boulevard SR 17 86,000 93,000 8.1%
Santa Cruz SR 17 SR-9/River Street 61,000 67,900 11.3%
Santa Cruz SR 9/River Street Mission Street 47,000 52,700 12.1%
Notes: ASource: Caltrans, 2015 Traffic Volumes on California State Highways. (http://www.dot.ca.gov/trafficops/census/) BSource: Caltrans, Transportation Concept Report, State Route 1, Draft May 2, 2017.

Chapter 3 • Existing Conditions
3-32
Traffic on most segments of the study corridor is projected to grow at much less than one percent
per year over the next 25 years. The highest growth of 42.1 percent (1.7 percent per year) is
forecasted between Imjin Parkway and Del Monte Boulevard in Monterey County. This growth is
likely to be associated with planned development at the former Fort Ord and the California State
University, Monterey Bay campus. Annual growth rates of about one percent are projected for the
southern part of Santa Cruz County, near Freedom Boulevard and Bay Avenue. Lower annual
growth rates of 0.5 percent are projected in Monterey County, south of Seaside and in northern
parts of Santa Cruz County closer to SR 17.
Existing Transit Conditions Transit service within the study area is provided and operated by two transit providers – MST
and METRO.
MST operates bus service in Monterey County and southern portion of Santa Cruz County. It
serves about 294 square-miles of Monterey and Santa Cruz Counties, primarily serving the
greater Monterey and Salinas areas; however, it extends limited regional service to faraway
places like San Jose, Santa Cruz, Watsonville, Paso Robles, and Big Sur. Currently, MST provides
55 fixed-route services, five demand-responsive dial-a-ride services, paratransit services, and a
free trolley. MST operates four transit centers in Monterey County – the Monterey Transit Plaza,
the Salinas Transit Center, the Sand City Station, and the Marina Transit Exchange.
MST has partnerships with various military establishments. In partnership with Fort Hunter
Liggett, the Naval Postgraduate School, and the Presidio of Monterey, MST has developed military
bus lines and schedules. These lines primarily operate during peak traffic periods along
Highway 1 between Marina and Seaside. MST transports about 50,000 military and civilian
personnel each month to/from work.
METRO serves Santa Cruz County providing 33 fixed-route bus lines, two seasonal bus routes to
the University of California at Santa Cruz (UCSC), and demand-responsive paratransit services. It
provides one regional service between Santa Cruz and San Jose. METRO operates four transit
centers in Santa Cruz County – the Santa Cruz METRO Center, the Capitola Mall Transit Center,
the Watsonville Transit Center, and the Cavallaro Transit Center in Scotts Valley.
Transit Services along Study Corridor Currently, 16 fixed-route transit lines operate along SR 1 within the study area. Of these, 12 lines
are operated by MST (Lines 12, 18, 19, 20, 21, 55, 67, 72, 74, 75, 76, and 78) and four lines by
METRO (Lines 55, 69A, 69W, and 91X). Most of the bus lines operating within the study corridor
are intra-county, local routes serving locally in Monterey and Santa Cruz Counties. However, two
lines, MST Lines 55 and 78 are intercounty, regional services connecting Monterey County with
Santa Clara and Santa Cruz Counties, respectively. The details of the bus lines and routes are
provided below. The details of MST lines provided in this chapter were based on data collected in
September 2016. As such, data analysis includes that of Line 10, even though it was recently
discontinued in September 2017.
A summary of the bus lines including their operating areas along SR 1 is provided in Table 3-21.

Chapter 3 • Existing Conditions
3-33
The majority of the 15 transit lines traveling along the study corridor operate in one of these two
areas:
▪ Greater Monterey Peninsula between Fremont Street and SR 156 interchanges, or
▪ Santa Cruz County between Main Street and Ocean Street interchanges.
One route, MST Line 78 operates intermittently along SR 1 between Monterey and Santa Cruz.
However, this line operates only six buses on each of the weekdays, three each to Santa Cruz and
Monterey. The average travel distance of transit lines along the study corridor is about 5 miles,
with METRO Line 76 traversing the shortest distance of about 1.6 miles along SR 1 and
MST Line 78 traversing the longest distance of about 32 miles.
Figure 3-7 and Figure 3-8 exhibit areas along the study corridor that are used by MST and
METRO buses, while the distribution of bus lines along the study corridor is summarized in Table
3-22.

Chapter 3 • Existing Conditions
3-34
Table 3-21: Transit Services along Study Corridor
Transit Operator
Bus Line Description Service Region
Operating Area along State Route 1
Limits Approximate
Distance (miles)
Monterey-Salinas Transit
101 Marina – Monterey Greater Monterey Peninsula Fremont Boulevard – Del Monte Boulevard
Fremont Street – Del Monte Boulevard (Line 10 Select)
4.0
7.3 (Line 10 Select)
12 The Dunes – NPS Greater Monterey Peninsula Fremont Street – Imjin Parkway (Line 12 Express) 6.6
18 Monterey – The Dunes Greater Monterey Peninsula Fremont Boulevard – Lightfighter Drive (Line 18
Express) 1.9
19 Del Monte Center – CSUMB2
East Campus Greater Monterey Peninsula
Fremont Street – Lightfighter Drive
Soledad Drive – Imjin Parkway (Line 19 Express)
5.1
8.0 (Line 19 Express)
20 Monterey – Salinas Greater Monterey Peninsula
and Greater Salinas Fremont Boulevard – Del Monte Boulevard 4.0
21 Pebble Beach – Salinas
Express Greater Monterey Peninsula
and Greater Salinas Fremont Street – Del Monte Boulevard 7.3
55 Monterey – San Jose Express Greater Monterey Peninsula
and North County Del Monte Avenue – SR 156 11.8
673 Presidio – Marina Greater Monterey Peninsula Del Monte Avenue – Lightfighter Drive
Imjin Parkway – Del Monte Boulevard 4.2
72 Presidio – North Salinas
Express Greater Monterey Peninsula
and Greater Salinas Del Monte Avenue – Del Monte Boulevard 6.0
74 Presidio – Toro Park Express Greater Monterey Peninsula
and Greater Salinas Del Monte Avenue – Lightfighter Drive (Line 74
Express) 3.9
75 Presidio – Marshal Park
Express Greater Monterey Peninsula
Del Monte Avenue – Lightfighter Drive (Line 75 Select)
3.9
76 Presidio – Stillwell Park
Express Greater Monterey Peninsula Del Monte Avenue – Fremont Boulevard 1.6
78 Presidio – Santa Cruz Express Greater Monterey Peninsula
and North County
Del Monte Avenue – Del Monte Boulevard
Reservation Road – SR 156
Merritt Street – State Park Drive
Soquel Drive – Ocean Street
32.2

Chapter 3 • Existing Conditions
3-35
Transit Operator
Bus Line Description Service Region
Operating Area along State Route 1
Limits Approximate
Distance (miles)
Santa Cruz METRO
55 Rio Del Mar Mid Santa Cruz County Larkin Valley Road – State Park Drive (along
northbound SR 1 only) 2.6
69A Capitola Road/Watsonville via
Airport B Cabrillo/South Santa Cruz
County Airport Boulevard – 41st Avenue 10.3
69W Capitola Road/Watsonville Cabrillo/South Santa Cruz
County Main Street – State Park Drive 7.7
91X Commuter Express Santa
Cruz/Watsonville Cabrillo/South Santa Cruz
County Main Street – State Park Drive
Park Avenue – Morrissey Boulevard 9.5 – 11.1
Notes: 1This bus line was discontinued in September 2017.
2California State University at Monterey Bay 3This bus line was introduced in September 2017.


Chapter 3 • Existing Conditions
3-36
Figure 3-7: Transit Operating Areas along SR 1 – Santa Cruz County


Chapter 3 • Existing Conditions
3-37
Figure 3-8: Transit Operating Areas along SR 1 – Monterey County

Chapter 3 • Existing Conditions
3-38
Table 3-22: Distribution of Bus Lines in Focus Areas
SR 1 Segment Number of MST and METRO Bus Lines
Operating Southern Limit Northern Limit
Monterey County
Soledad Drive Fremont Street 1
Fremont Street SR-68/Salinas Highway 4
SR-68/Salinas Highway Del Monte Avenue 4
Del Monte Avenue SR 218/Canyon Del Rey Boulevard 10
SR 218/Canyon Del Rey Boulevard Fremont Boulevard 10
Fremont Boulevard Lightfighter Drive 11
Lightfighter Drive Imjin Parkway 8
Imjin Parkway Del Monte Boulevard (South) 6
Del Monte Boulevard (South) Reservation Road 1
Reservation Road Del Monte Boulevard (North) 2
Del Monte Boulevard (North) Nashua Road 2
Nashua Road SR 156 2
Santa Cruz County
Main Street Airport Boulevard 3
Airport Boulevard Buena Vista Drive 4
Buena Vista Drive Mar Monte Avenue 4
Mar Monte Avenue Larkin Valley Road/San Andreas Road 4
Larkin Valley Road/San Andreas Road Freedom Boulevard 5
Freedom Boulevard Rio Del Mar Boulevard 5
Rio Del Mar Boulevard State Park Drive 5
State Park Drive Park Avenue 1
Park Avenue Bay Avenue/Porter Street 3
Bay Avenue/Porter Street 41st Avenue 3
41st Avenue Soquel Drive 2
Soquel Drive Morrissey Boulevard 2
Morrissey Boulevard SR 17 -
SR 17 Ocean Street -

Chapter 3 • Existing Conditions
3-39
In Monterey County, the central portion of the bus-on-shoulder concept focus area, between
Del Monte Avenue (Monterey) and Del Monte Boulevard (Marina) is used by the majority of the
bus lines, serving 6 to 10 MST lines. The northern (between Del Monte Boulevard and SR 156)
and southern (between Del Monte Avenue and Soledad Drive) segments of the Monterey County
focus area are used by four or fewer bus lines.
In the Santa Cruz County focus area, the study corridor located between Airport Boulevard and
State Park Drive serves the most number of METRO and MST bus lines (four or five routes). The
remaining portions of the Santa Cruz focus area (between Main Street and Airport Boulevard and
between State Park Drive and Ocean Street) serve three or fewer bus routes.
Weekday Transit Operations A summary of operations of the 16 transit lines that are currently operating along the study SR 1
corridor during a typical weekday is provided in Table 3-23. As mentioned earlier, since there is
minimal or no traffic congestion on SR 1 on a typical weekend day, the bus-on-shoulder concept is
being studied for weekday conditions only. As such, transit operations along the study corridor
were summarized for a typical weekday only.
Of the 12 MST bus lines operating along the study corridor, consistent and regular service
throughout a weekday is provided by four lines only – MST Lines 10, 12, 18, and 20. MST Lines 10
and 20 operate at about 30-minute headways during the AM (from 6 AM to 10 PM) and PM (from
3 PM to 7 PM) peak periods, MST Line 18 Express operates at about 60-minute headways during
the PM peak period, and MST Line 12 operates with slightly longer headways of about 60-90
minutes during the AM and PM peak periods. The remaining nine bus lines provide limited or
irregular service on weekdays.

Chapter 3 • Existing Conditions
3-40
Table 3-23: Transit Operations during a Weekday
Bus Line Direction Times of Operation at Origin
Service Headway (minutes)
Daily AM Peak Period1 PM Peak Period1
MST Line 102
Northbound 7:30 AM – 8:30 AM, 3:05 PM – 5:05 PM 30 30 30
Southbound 6:55 AM – 8:50 AM, 3:45 PM – 4:15 PM 30 30 30
MST Line 12
Northbound 7:15 AM – 8:45 AM, 12:05 PM – 1:40 PM, 3:10 PM – 5:15 PM 60-90 90 60
Southbound 6:45 AM – 9 AM, 12:45 PM, 2:20 PM – 4:55 PM 15-85 15-70 60-85
MST Line 18
Northbound 6:05 AM – 10:05 PM 60 60 60
Southbound 6:15 AM – 9:15 PM 50-100 60 60
MST Line 19
Northbound3 3:25 PM – 2 AM 80-100 - 90
Southbound3 2:30 PM – 1:35 AM 80-90 - 90
MST Line 20
Northbound 5 AM – 9:20 PM 20-60 20-40 30
Southbound 4:45 AM – 10:25 PM 25-60 30-35 30
MST Line 21
Northbound4 3:10 PM – 5:40 PM 55-95 - 55-95
Southbound4 5 AM – 7:05 AM 65 65 -
MST Line 55
Northbound5 9:50 AM and 3:10 PM 320 - -
Southbound5 8:29 AM and 12:50 PM 221 - -
MST Line 67
Northbound3 2:15 PM – 8:15 PM 120 - 120
Southbound3 3:15 PM – 9:15 PM 120 - 120
MST Line 72
Northbound5 7:37 AM and 4:35 PM 538 - -
Southbound5 6 AM and 4:13 PM 613 - -
MST Line 74
Northbound6 7:05 AM and 4:35 PM 570 - -
Southbound6 6:29 AM - - -
MST Line 75
Northbound7 12:10 PM – 9:20 PM 45-120 - 45-95
Southbound 5:55 AM – 10 PM 30-116 35 45-106

Chapter 3 • Existing Conditions
3-41
Bus Line Direction Times of Operation at Origin
Service Headway (minutes)
Daily AM Peak Period1 PM Peak Period1
MST Line 76
Northbound8 4:06 AM – 6:10 AM, 4 PM, and 4:30 PM 30-580 - 30
MST Line 78
Southbound8 4:10 AM – 6:10 AM, 4:37 PM, and 5:07 PM 30-629 - 30
Northbound9 4:30 AM, 7:31 AM, and 4:40 PM 121-549 - -
METRO Line 55
Southbound9 6 AM, 4:22 PM, and 7 PM 158-622 - -
Circular Service
8:30 AM – 5:30 PM 60 60 60
METRO Line 69A
Northbound 7:05 AM – 5:50 PM 60-65 60-65 60
Southbound 6:45 AM – 6 PM 53-60 60 60
METRO Line 69W
Northbound 6:20 AM – 9:20 PM 60 60 60
Southbound 6:40 AM – 8:40 PM 53-127 60 60
METRO Line 91X
Northbound 5:57 AM – 4:20 PM 15-60 15-52 60
Southbound 6:55 AM – 5:25 PM 23-37 23-37 25-35
Notes: 1AM Peak Period – 6 AM to 10 AM, PM Peak Period – 3 PM to 7 PM 2 This bus route was discontinued in September 2017. 3Operates on Friday evenings and nights only during weekdays. 4Operates only five buses daily – two southbound buses in the morning and three northbound buses in the evening. 5Operates only four buses daily – two buses in each direction, one each in the morning and afternoon/evening periods. 6Operates only three buses daily – one southbound bus in the morning and two northbound buses, one each in the morning and evening periods. 7Operates during the afternoon and evening periods only. 8Operates only 11 buses daily, five in the southbound direction and six in the northbound direction. 9Operates only six buses daily, three in each direction.

Chapter 3 • Existing Conditions
3-42
Unlike the MST bus routes, all of the METRO bus routes operating along the study corridor
provide consistent and regular service throughout a weekday. METRO Lines 55, 69A, and 69W
operate with about 60-minute headways during the AM and PM peak periods, while METRO
Line 91X operates with headways varying between 15 and 60 minutes during the AM and PM
peak periods.
Transit Performance As discussed above, traffic operations along the study corridor are poor during a typical weekday
in the peak directions of travel, which are northbound AM peak and southbound PM peak for the
Santa Cruz County focus area and southbound AM peak and northbound PM peak for the
Monterey County focus area. Therefore, to maximize travel time benefits to bus services, the bus-
on-shoulder concept is being considered during a weekday in the peak directions of travel only.
The performance of METRO-operated routes was not evaluated due to the unavailability of bus
performance data.
Performance of MST bus routes was evaluated using the HASTUS software, which is a software
package providing transit planning, scheduling, and operations modeling/monitoring solutions.
Run time graphs from HASTUS software for each of the nine MST lines operating in the peak
directions of travel, as mentioned above, were provided by MST.
Typically, the 10 MST lines have variable run times that are distributed within a 10-15-minute
time period around the scheduled time, suggesting that all of the 10 MST lines have on-time
performance issues as show in Table 3-24.
All of the MST lines operate with at least half their trips delayed during the peak periods in the
peak directions of travel. MST regularly adjusts its schedule to account for increased traffic and
congestion on SR 1. However, as discussed above, with the increase in traffic congestion, on-time
performance and travel time reliability of a transit trip reduces, despite schedule adjustments.

Chapter 3 • Existing Conditions
3-43
Table 3-24: Transit Performance in Peak Directions of Travel
Bus Line
Approximate Scheduled Travel Time (minutes)
Range of Typically Observed Travel Times (minutes) Consistent
On-Time Performance?
Southbound AMA
Northbound PMB
Southbound AMA
Northbound PMB
MST Line 10C 19 18 9-29 11-20 No
MST Line 12D N.A. N.A. N.A. N.A. N.A.
MST Line 18E N.A. 16 N.A. 12-18 No
MST Line 19F N.A. 13 N.A. 12-23 No
MST Line 20 19 w18 9-29 11-20 No
MST Line 21 23 16 11-30 12-27 No
MST Line 55G N.A. N.A. N.A. N.A. N.A.
MST Line 67H Unavailable Unavailable Unavailable Unavailable Unavailable
MST Line 72F N.A. 21 N.A. 16-26 No
MST Line 74F N.A. 17 N.A. 12-23 No
MST Line 75F N.A. 12 N.A. 8-22 No
MST Line 76F N.A. 13 N.A. 10-22 No
MST Line 78 18 20 16-22 13-27 No
Source: HASTUS run time graphs for services between May 2016 and March 2017, Monterey-Salinas Transit.
Notes: ARepresents travel along southbound SR 1 during the AM peak period of traffic (6 AM – 10 AM). BRepresents travel along northbound SR 1 during the PM peak period of traffic (3 PM – 7 PM). C This bus route was discontinued in September 2017. DOperates on arterials only. Line 12 Express operates on SR 1, but does not have service in the peak directions of travel. E MST Line 18 Express does not operate during the AM peak period of traffic. FDoes not have service along southbound SR 1 during the AM peak period of traffic. GDoes not have service in the peak directions of travel. H This bus route was introduced in September 2017; as such, data is unavailable.
N.A. – Not applicable (since no service is provided in the peak directions of travel)
Transit Ridership on SR 1 For the MST bus routes operating along the study corridor in the peak directions of travel
(southbound AM peak and northbound PM peak), estimates of average ridership on SR 1 during
the weekday peak periods are provided in Table 3-25. Even though MST Line 10 has been
recently discontinued in September 2017, its ridership is evaluated and reported in this section,
since its ridership is expected to be transferred to other bus routes, predominantly MST Line 20.
Transit ridership estimates on SR 1 for the MST lines were developed using the transit rider data
provided by MST for the month of September 2016. MST Line 20 has the highest total ridership of
about 200 passengers on SR 1 during both the southbound AM and northbound PM peak periods.
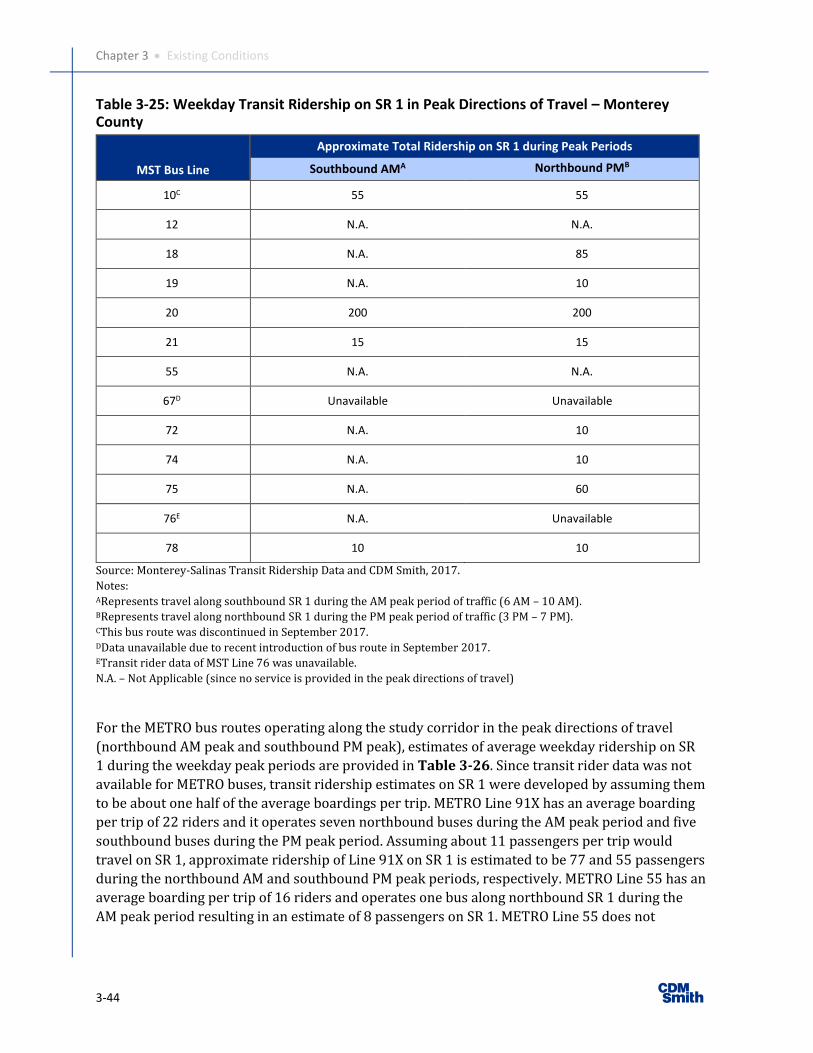
Chapter 3 • Existing Conditions
3-44
Table 3-25: Weekday Transit Ridership on SR 1 in Peak Directions of Travel – Monterey County
MST Bus Line
Approximate Total Ridership on SR 1 during Peak Periods
Southbound AMA Northbound PMB
10C 55 55
12 N.A. N.A.
18 N.A. 85
19 N.A. 10
20 200 200
21 15 15
55 N.A. N.A.
67D Unavailable Unavailable
72 N.A. 10
74 N.A. 10
75 N.A. 60
76E N.A. Unavailable
78 10 10
Source: Monterey-Salinas Transit Ridership Data and CDM Smith, 2017.
Notes: ARepresents travel along southbound SR 1 during the AM peak period of traffic (6 AM – 10 AM). BRepresents travel along northbound SR 1 during the PM peak period of traffic (3 PM – 7 PM). CThis bus route was discontinued in September 2017. DData unavailable due to recent introduction of bus route in September 2017. ETransit rider data of MST Line 76 was unavailable.
N.A. – Not Applicable (since no service is provided in the peak directions of travel)
For the METRO bus routes operating along the study corridor in the peak directions of travel
(northbound AM peak and southbound PM peak), estimates of average weekday ridership on SR
1 during the weekday peak periods are provided in Table 3-26. Since transit rider data was not
available for METRO buses, transit ridership estimates on SR 1 were developed by assuming them
to be about one half of the average boardings per trip. METRO Line 91X has an average boarding
per trip of 22 riders and it operates seven northbound buses during the AM peak period and five
southbound buses during the PM peak period. Assuming about 11 passengers per trip would
travel on SR 1, approximate ridership of Line 91X on SR 1 is estimated to be 77 and 55 passengers
during the northbound AM and southbound PM peak periods, respectively. METRO Line 55 has an
average boarding per trip of 16 riders and operates one bus along northbound SR 1 during the
AM peak period resulting in an estimate of 8 passengers on SR 1. METRO Line 55 does not
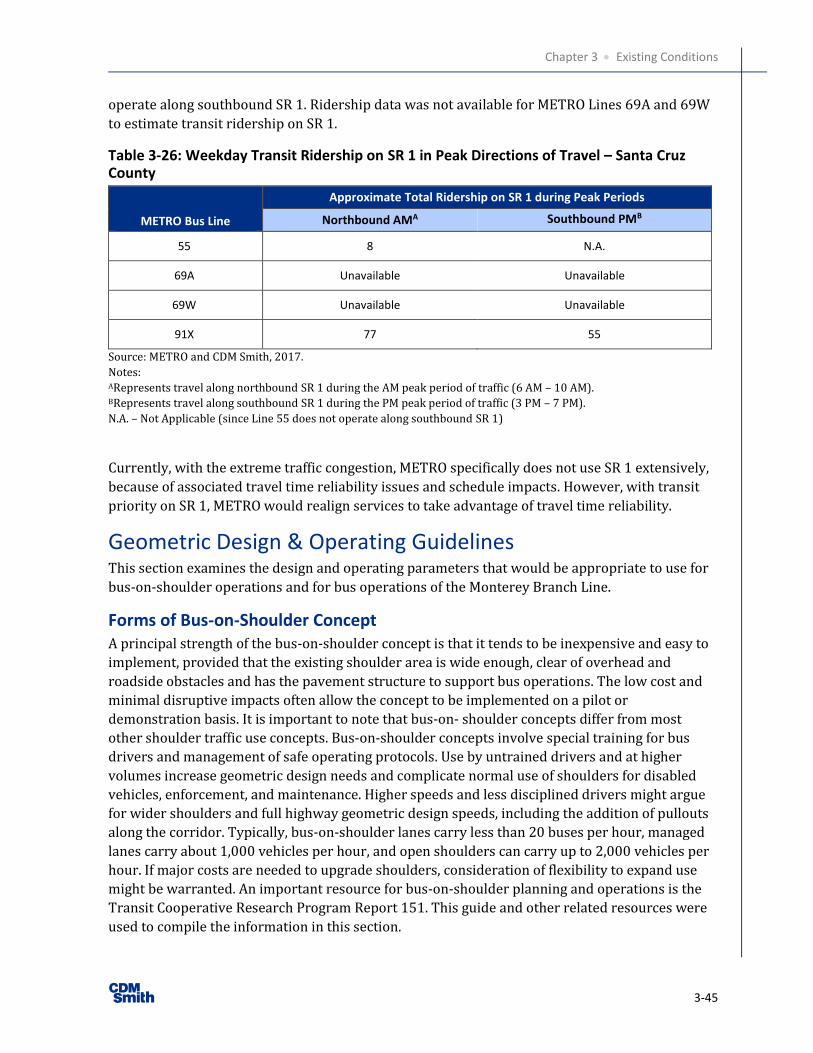
Chapter 3 • Existing Conditions
3-45
operate along southbound SR 1. Ridership data was not available for METRO Lines 69A and 69W
to estimate transit ridership on SR 1.
Table 3-26: Weekday Transit Ridership on SR 1 in Peak Directions of Travel – Santa Cruz County
METRO Bus Line
Approximate Total Ridership on SR 1 during Peak Periods
Northbound AMA Southbound PMB
55 8 N.A.
69A Unavailable Unavailable
69W Unavailable Unavailable
91X 77 55
Source: METRO and CDM Smith, 2017.
Notes: ARepresents travel along northbound SR 1 during the AM peak period of traffic (6 AM – 10 AM). BRepresents travel along southbound SR 1 during the PM peak period of traffic (3 PM – 7 PM).
N.A. – Not Applicable (since Line 55 does not operate along southbound SR 1)
Currently, with the extreme traffic congestion, METRO specifically does not use SR 1 extensively,
because of associated travel time reliability issues and schedule impacts. However, with transit
priority on SR 1, METRO would realign services to take advantage of travel time reliability.
Geometric Design & Operating Guidelines This section examines the design and operating parameters that would be appropriate to use for
bus-on-shoulder operations and for bus operations of the Monterey Branch Line.
Forms of Bus-on-Shoulder Concept A principal strength of the bus-on-shoulder concept is that it tends to be inexpensive and easy to
implement, provided that the existing shoulder area is wide enough, clear of overhead and
roadside obstacles and has the pavement structure to support bus operations. The low cost and
minimal disruptive impacts often allow the concept to be implemented on a pilot or
demonstration basis. It is important to note that bus-on- shoulder concepts differ from most
other shoulder traffic use concepts. Bus-on-shoulder concepts involve special training for bus
drivers and management of safe operating protocols. Use by untrained drivers and at higher
volumes increase geometric design needs and complicate normal use of shoulders for disabled
vehicles, enforcement, and maintenance. Higher speeds and less disciplined drivers might argue
for wider shoulders and full highway geometric design speeds, including the addition of pullouts
along the corridor. Typically, bus-on-shoulder lanes carry less than 20 buses per hour, managed
lanes carry about 1,000 vehicles per hour, and open shoulders can carry up to 2,000 vehicles per
hour. If major costs are needed to upgrade shoulders, consideration of flexibility to expand use
might be warranted. An important resource for bus-on-shoulder planning and operations is the
Transit Cooperative Research Program Report 151. This guide and other related resources were
used to compile the information in this section.

Chapter 3 • Existing Conditions
3-46
Buses are typically 10 feet - 7 inches wide with side mirrors. Fitting side mirror buses into
narrow 10-foot-wide shoulders can be eased by use of on-lane assist technology or virtual side
mirror technology.
There are three basic forms of the bus-on-shoulder concept:
1. Right side shoulder lane,
2. Left side shoulder lane, and
3. Off ramp bypass.
Right Side Shoulder Lane
This is the most common form of bus-on-shoulder concept and has proven safe in more than 25
years of operation. The Twin Cities metro area currently has about 300 miles of bus-on-shoulder
facilities and all except one use the right-side shoulder. The I-35 Managed Lanes segment uses the
left side shoulder and allows buses to operate on this facility. The Minneapolis experience has
been widely used as a template for right side bus-on-shoulder operations and provides a sound
basis for shoulders design and operations protocols in Monterey and Santa Cruz Counties.
MnDOT guidelines for bus on right shoulder are as follows:
▪ Design Speed: Maximum of 35 miles per hour, with 15 miles per hour maximum speed
differential with general-purpose traffic
▪ Shoulder Width: Minimum of 10 feet, with 12 feet desirable, except over bridges where
11.5-foot minimum shoulder is required
▪ Stopping Sight Distance: Minimum of 250 feet
▪ Cross Slope: Maximum 6 percent
▪ Vertical Clearance: 14 feet
Invariably, the horizontal and vertical features of the highway are adequate for slower moving
buses. While most modern and rebuilt pavement sections are adequate for bus-on-shoulder
operations, some older shoulders are substandard. For short pilot period assessments of bus-on-
shoulder use, even these substandard shoulders have proven adequate. Rebuilt shoulders should
meet full pavement standards for general-purpose traffic lanes.
There is no minimum length specified for right shoulders, and the Minnesota Department of
Transportation uses pinch-point signs to advise bus drivers of inadequate shoulder widths. Bus
drivers merely remerge with general traffic at these pinch-points, often a bridge abutment.
Remerges are also the operating protocol across double lane on and off ramps. Entering and
leaving right side shoulders tends to be quite easy with the low volumes and low speeds.
Motorists generally understand that the bus is not disadvantaging them and is simply crossing
their lane. Ramp volumes under 1,000 vehicles per hour have not proven a problem in Minnesota,
but volumes of 1,000 to 1,500 vehicles per hour can be problematic and warrant special design
attention.

Chapter 3 • Existing Conditions
3-47
The California right side shoulder pilot also restricted use of the shoulder when it rained, due to
ponding concerns. This protocol conflicts with the practice in Minneapolis where the greatest
travel time and reliability benefits occurred during bad weather (snow).
Left Side Shoulder Lane
In addition to the Minneapolis left side manage lane on I-35, the two left side shoulder
applications are in Cincinnati and Chicago. The Cincinnati pilot I-71 left side shoulder project
began in 2007 and used minimal signage. The bus segment is about 10 miles in length and allows
buses to use the left shoulder whenever general-purpose traffic speeds drop below 30 miles per
hour. Buses can run up to 15 miles per hour faster than general traffic, with a maximum speed of
45 miles per hour. Shoulders are 12 feet or wider. The Chicago I-55 left side shoulder project
began in 2011 and uses more extensive signage including overhead lane use signage. Buses can
use the shoulder at any time on the driver’s discretion when general traffic speeds drop below 35
miles per hour. Buses cannot exceed 35 miles per hour when using the shoulder and cannot
exceed 15 miles per hour faster than general traffic speeds. The I-55 left side shoulder project is
about 16 miles in length.
Suggested guidelines for left side bus use of shoulders are as follows:
▪ Design speed: 35 miles per hour maximum with 15 miles per hour maximum differential
speed
▪ Shoulder Width: Minimum 12-foot wide
▪ Cross Slope: Six percent maximum
▪ Vertical Clearance: 14 feet
▪ Minimum Length: 5,000 feet
Where shoulders are too narrow or other obstacles existing to use of the shoulder by buses, such
as approaching a two-lane off-ramp, bus can bypass the obstacle or “pinch-point” by exiting the
shoulder and merging into the adjacent lane. Once past the obstacle the buses can re-enter the
shoulder. However, if there are too many of these pinch-point or obstacles much of the purpose of
the bus-on-shoulder use would be defeated. There is no strict guideline for this, but one obstacle
per mile would be about the maximum that would be acceptable.
The key difference for left side shoulder buses is that greater difficulty is encountered while
weaving to enter and exit the left side shoulder. The merge sight lines on the right side of buses
are also not as good as on the left side where the driver sits. Thus, bus remerges to finesse pinch-
points is less practical and generally should be avoided. Providing a left-shoulder operation with
only a single ingress point at the beginning of the corridor and a single egress point at the end of
the corridor would minimize or avoid the issue of multiple and frequent bus remerging. Access
to/from left side shoulders generally requires weaving across two or more traffic lanes. Motorists
in these lanes tend to be more accepting of buses crossing their lane than for remerging into their
traffic lane.

Chapter 3 • Existing Conditions
3-48
One advantage of buses operating on the left side is that they encounter fewer ramp weave
conflicts; therefore, they might be allowed to operate at higher speeds than buses operating on
the right-side shoulder. Based on the Chicago left side shoulder model, however, a 35-miles-per-
hour maximum speed (the same as for right shoulders) is suggested for planning purposes for left
side shoulder bus operations. For a hypothetical five-mile segment, the travel time difference
would be about 2 minutes for 35 miles per hour running and 45 miles per hour running.
One important note is that the existence of a right-side shoulder is critical for emergency stops
and for use by the California Highway Patrol and emergency vehicles. If a narrow left-side
shoulder exists, but the right-side shoulder is adequate, it is not advisable to consider shifting the
freeway lanes, so that the right-side shoulder is narrowed in order to allow the left-side shoulder
to be widened. This is also a very expensive idea, as the paved area used by the freeway lanes
would need to be widened, which is much more costly than just widening the shoulder area.
Off-Ramp Bypass
Sometimes congestion on off-ramps significantly delays buses. In these instances, a short bypass
shoulder use might prove attractive. Typically, they would follow the right-side shoulder
guidelines but could be relatively short (less than a mile).
Existing Highway Geometrics As discussed above, except for one bus route (MST Line 78), all of the bus routes operating along
the study corridor operate on focus areas located near the northern and southern termini of the
study area –between Main Street and Ocean Street interchanges in Santa Cruz County and
between Fremont Street and SR 156 interchanges in Monterey County. Only one bus route, MST
Line 78 operates in the central portion of the study corridor, between SR 156 and Main Street
interchanges. However, MST Line 78 operates intermittently, providing only six buses per
weekday, three in each direction. As such, to provide benefits to multiple bus routes, potential
sites for the bus-on-shoulder concept are identified near the northern and southern termini of the
study area, but not in the central portion of the corridor.
Santa Cruz County
METRO currently operates buses on segments of State Route 1 with most routes connecting to the
downtown Santa Cruz Transit Center via Soquel Avenue and to Watsonville via either Main Street
or Freedom Boulevard. Current service totals under 10 buses an hour north of Freedom
Boulevard and about 4 buses per hour on the segment south to Main Street.
METRO is more interested in left side bus-on-shoulder operations than for right side shoulder
operations because they plan to operate buses non-stop on the freeway between Watsonville and
Downtown Santa Cruz.
For discussion purposes, SR 1 was segregated into 15 segments in both the northbound and
southbound travel directions. The segments were defined by overpass and interchange facilities.
Overall, it is about 15 miles from Santa Cruz to Watsonville. A summary of total available rights-
of-way and shoulder widths along SR 1 in Santa Cruz County is provided in Table 3-27.

Chapter 3 • Existing Conditions
3-49
Northbound Travel
▪ Main Street to Airport Boulevard – Beginning in Watsonville at the Main Street On-Ramp
and continuing to Airport Boulevard, the median is about 42 feet in width with the
northbound paved section about 8 feet and the unpaved median area about 21 feet wide.
Thus, the left shoulder median could accommodate bus-on-shoulder operations, if
improved. The right-side shoulder is also about 8 feet in width. Airport Boulevard
overpasses SR 1 and its bridge has a center pier that constrains median width available for
improving the left side shoulder.
▪ Airport Boulevard to Buena Vista Drive – North of Airport Boulevard, the median widens
to about 56 feet with the paved northbound shoulder being 13 feet wide approximately.
Approaching the SR 1 overpass of Buena Vista Drive, the northbound left shoulder is
dropped. The northbound and southbound overpasses are separated by about 50 feet, but
the northbound overpass would need to be widened to provide a continuous left shoulder.
The right shoulder is about 10 feet wide except at the overpass where it narrows to about
6 feet.
▪ Buena Vista Drive to Mar Monte Avenue – North of Buena Vista Drive, the median
widens to 56 feet with an 8-foot-wide northbound hard left shoulder and a 10-foot right
shoulder. About a mile north of the Buena Vista Drive interchange, the northbound and
southbound lanes separate, and the northbound paved shoulder is 10 feet wide. The
northbound and southbound lanes re-converge about a half mile south of the Mar Monte
Avenue interchange. The approach to Mar Monte Avenue interchange has an 84-foot
median with a ten-foot wide northbound left shoulder. The Mar Monte Avenue overpass of
SR 1 has a center pier support, but adequate space exists in the median for a full left
shoulder and there is space for a full right shoulder.
▪ Mar Monte Avenue to San Andreas Road – The median for this segment is 80 feet wide
and provides for a 16-foot-wide northbound hard left shoulder and an 8-foot wide right
shoulder. The SR 1 overpass of San Andreas Road has minimal shoulders and the
overpasses would need to be widened to provide a 12-foot left shoulder for buses. The right
shoulder is about 8 feet wide beneath the overpass.
▪ San Andreas Road to Freedom Boulevard – This segment has a 70-foot-wide median, a
10-foot-wide hard left shoulder, and a 10-foot-wide right shoulder. The Freedom Boulevard
overpass of SR 1 allows a 50-foot-wide median on SR 1 with a hard, left shoulder of 10 feet
in width. Freedom Boulevard is an access point for Santa Cruz Metro buses. The on- and off-
ramps are on the right side, requiring buses to weave across mainline traffic to access the
left side shoulders. The shoulders on both right and left sides probably could be improved
under the overpass to provide shoulder operations.
▪ Freedom Boulevard to Rio Del Mar Boulevard – This segment has a 34-foot median with
a narrow 4-foot northbound hard left shoulder and an 8-foot-wide right shoulder. Passing
under the Rio Del Mar Boulevard overpass, SR 1 has a 30-footwide median center pier
support and would allow for shoulder use.

Chapter 3 • Existing Conditions
3-50
▪ Rio Del Mar Boulevard to Spreckels Drive – This section has a narrow 12-foot-wide
median with minimal right and left shoulders. Major costs, disruptions, and impacts would
likely be required to upgrade this section for shoulder operations. The northbound right
shoulder is about 6 feet wide and its right-of-way possibly could be used to provide left side
shoulders. The railroad overpass of SR 1 is a constraining point with no left side shoulders
and about a 6-foot right side shoulder. Because the railroad overpass does not provide
adequate shoulder width, any bus-on-shoulder operations would require a costly
lengthening of the railroad bridge or buses would have to exit the shoulder prior to the
overpass and then re-enter the shoulder after the overpass. This works for right side
shoulder operations, but would not work for left-side operations where such a maneuver
would be very difficult for the transit operators.
▪ Spreckels Drive to State Park Drive – The short section has a narrow median south of the
railroad overcrossing and widens to 20 feet north of it. No right-side shoulder is provided
and the railroad overcrossing has a center pier support with no shoulders provided under
the overcrossing. SR 1 under State Park Drive has a 4-foot left and 6-foot right shoulder.
The rail bridge is a major obstacle to bus-on-shoulder as noted above.

Chapter 3 • Existing Conditions
3-51
Table 3-27: Typical Rights-of-Way – Santa Cruz County Focus Area
State Route 1 Location
Northbound Direction Southbound Direction
Left Shoulder (feet)
Right Shoulder (feet)
Total Right-of-Way (feet)
Left Shoulder (feet)
Right Shoulder (feet)
Total Right-of-Way (feet)
1. Main Street – Airport Boulevard 8 8 35-55 10 8 45-60
2. Airport Boulevard – Buena Vista Drive 13 6-10 50-70 6 8 50-75
3. Buena Vista Drive – Mar Monte Avenue 8-10 10 60-75 8 11 50-80
4. Mar Monte Avenue – San Andreas Road 16 8 55-70 8 11 40-80
5. San Andreas Road – Freedom Boulevard 10 10 45-70 6 7 70-75
6. Freedom Boulevard – Rio Del Mar Boulevard 4 8 45-65 3 12 45-65
7. Rio Del Mar Boulevard – Spreckels Drive 0-6 6 25-50 0-4 0-10 25-45
8. Spreckels Drive – State Park Drive 0-4 0-6 40-45 10 10 35-45
9. State Park Drive – Park Avenue 3-5 5-8 50-55 14 10 50
10. Park Avenue – Bay Avenue 0-6 4-10 35-50 12 11 40-50
11. Bay Avenue – Wharf Road 0 10 35-55 0 0-6 35-55
12. Wharf Road – 41st Avenue 0-13 8 45 0 6 45
13. 41st Avenue – Soquel Drive 6-10 6-10 55 12 8 50-55
14. Soquel Drive – La Fonda Avenue 6 10 40-55 6-8 7-10 50-55
15. La Fonda Avenue – Morrissey Boulevard 8 12 40-55 10-11 6-10 55-65

Chapter 3 • Existing Conditions
3-52
▪ State Park Drive to Park Avenue – Minimum shoulders are provided along this segment
with about 5 feet wide shoulders provided on both the right and left sides for shoulders.
A 34-foot-wide total center median however exists. Crossing over Park Avenue, SR 1 has a
3-foot left shoulder and an 8-foot right shoulder.
▪ Park Avenue to Bay Avenue – Six-foot shoulders are provided on both the right and left
sides for northbound travel with a total 20-foot-wide center median for this highway
section. On the approach to the Capitola Avenue overpass of SR 1, the median narrows to
16 feet and the shoulders narrow to 4 feet wide. Approaching Bay Avenue interchange the
median drops to 12 feet and the left shoulder is dropped. The right-side shoulder is about
10 feet in width.
▪ Bay Avenue to Wharf Road – A 10-foot right shoulder is provided, but no left-side
shoulder is provided. A 6-foot median separates the northbound and southbound traffic
lanes. No left shoulder, but a ten-foot right shoulder is provided crossing over Wharf Road.
▪ Wharf Road to 41st Avenue – The right shoulder narrows to 8 feet and the median widens
approaching the 41st Avenue interchange overcrossing. Under the 41st Avenue overpass,
northbound SR 1 has a wide 12-foot-plus left shoulder and a narrow right shoulder.
▪ 41st Avenue to Soquel Drive – The right-side shoulder narrows to about 6 feet and the left
side shoulder widens to about 10 feet. A 36-foot-wide median separates the northbound
and southbound traffic lanes. Underneath the Soquel overpass, SR 1 has a 10-foot-right and
6-foot-left shoulder.
▪ Soquel Drive to La Fonda Avenue – The right shoulder is 10 feet wide and the left
shoulder is 6 feet wide. An 18-foot median separates the northbound and southbound
traffic lanes.
▪ La Fonda Avenue to Morrissey Boulevard – The right shoulder is 12 feet wide and the
left shoulder is about 8 feet wide on this segment. The center median is about 24 feet wide.
The most severe congestion occurs north of Aptos. Left side shoulder operations would be
hindered at the Airport Boulevard interchange, Buena Vista Drive interchange, San Andreas Road
interchange, and from Freedom boulevard to Wharf Road by narrow shoulder widths. However,
left-side bus-on-shoulder operations seem possible for a short segment between Mar Monte
Avenue and San Andreas Road along northbound SR 1. Though it should be noted that typically
buses need longer distances to weave in and out of a left-side shoulder than a right-side shoulder.
Right-side shoulder operations appear more feasible north of Bay Avenue and even the segment
between Bay Avenue and Park Avenue might potentially be upgraded. The viable left side
shoulder segments (Wharf Road to Soquel Drive) could not be fully used as buses would need
distance to weave to and from the left side shoulders.
METRO is primarily looking for a bus-on-shoulder concept north of State Park Drive, since
replacement of the rail bridge located just south of State Park Drive would be extremely
expensive and complicated. A low-cost concept involving no rebuilding of interchanges would
encounter the issues mentioned above. However, a more expensive concept involving

Chapter 3 • Existing Conditions
3-53
replacement of a few interchanges may encounter fewer issues. More details about different
concepts are discussed in Chapter 4.
Southbound Travel
▪ Soquel Drive to 41st Avenue – North of Soquel Drive, southbound SR 1 has a 10-foot right
shoulder and a 4-foot left shoulder. Between Soquel Drive and 41st Avenue, the right
shoulder narrows to 8 feet and the left shoulder widens to 12 feet.
▪ 41st Avenue to Wharf Road – The right shoulder is about 6 feet wide, but no left shoulder
is provided.
▪ Wharf Road to Bay Avenue – The right shoulder transitions to an off-ramp and no left
shoulder is provided.
▪ Bay Avenue to Park Avenue – An 11-foot right shoulder and a 12-foot left shoulder are
provided in the southbound direction.
▪ Park Avenue to State Park Drive – The right shoulder is about 10 feet wide and the left
one is about 14 feet wide.
▪ State Park Drive to Spreckels Road – Both left and right shoulders are about 10 feet wide.
▪ Spreckels Road to Rio Del Mar Boulevard – The right shoulder is about 10 feet wide
north of the railroad overcrossing where the shoulder is dropped before widening back to
10 feet south of the railroad overcrossing. The left shoulder is about 4 feet wide north of
the railroad and it is also dropped passing beneath the railroad. It returns at 4 feet wide
south of the railroad.
▪ Rio Del Mar Boulevard to Freedom Boulevard – The right shoulder is about 12 feet wide
and the left shoulder is about 3 feet wide. It seems very possible to widen the left shoulder
into the unpaved median.
▪ Freedom Boulevard to San Andreas Road – The right shoulder is about 7 feet wide and
the left shoulder is about 6 feet wide.
▪ San Andreas Road to Mar Monte Avenue – The right shoulder is about 11 feet wide and
the left shoulders is about 8 feet wide. The left shoulder could be widened into the unpaved
median.
▪ Mar Monte Avenue to Buena Vista Drive – The southbound section is similar to the above
section with 11-foot right shoulders and 8-foot left shoulders.
▪ Bueno Vista Drive to Airport Boulevard – The right shoulder is 8 feet wide and the left
shoulder is 6 feet wide.
▪ Airport Boulevard to Main Street – The right shoulder is 8 feet wide and the left shoulder
is 10 feet wide.
Potential sites for the bus-on-shoulder concept in Santa Cruz County are illustrated in Figure 3-9.

Chapter 3 • Existing Conditions
3-54
Monterey County
MST operates its buses on several sections of SR 1 and includes service to Santa Cruz. Major hubs
include the Marina Transit Exchange and Sand City Station. Many of the buses exit SR 1 onto
Del Monte Boulevard or Fremont Avenue on the way into Monterey. Bus-on-shoulder operations
were assessed for the segment between Castroville (Junction SR 156) to Soledad Drive/
Munras Avenue. The focus was on right shoulder use. A summary of typical rights-of-way and
shoulder widths available along SR 1 in Monterey County is provided in Table 3-28.
Northbound Travel
▪ Soledad Drive/Munras Avenue to Aguajito Road – The northbound on-ramp from
Soledad Drive is a right side on-ramp. The right shoulder is about 8 to 11 feet wide north to
Aguajito Road, except for the bridge crossing of Iris Canyon where the right shoulder
narrows to about 7 feet. The overpass of Aguajito Road also narrows the shoulder to about
6 feet.
▪ Aguajito Road to Fremont Boulevard – This section includes a long overpass. The right
shoulder is about 6 feet wide and the left shoulder is about 4 feet wide except on the
overpass where it is only 2 feet wide. Fremont Boulevard on-ramp is a double lane high
volume ramp.
▪ Fremont Boulevard to SR-68 – Minimal shoulders of 2 to 3 feet in width are provided on
both sides of this highway segment. It is also a high-volume weave segment interchanging
traffic between two state highways and providing access to Fremont Street. The off-ramp is
a double lane facility.
▪ SR-68 to Casa Verde Way – The right shoulder is about 6 feet wide and the left shoulder
about 7 feet wide.
▪ Casa Verde Way to Del Monte Avenue – An auxiliary lane is provided between these two
interchanges along the right side. Buses could potentially use this auxiliary lane.
▪ Del Monte Avenue to Canyon Del Rey Boulevard – Similarly, an auxiliary lane is
provided on this segment which buses could use. No shoulders are provided. No shoulder
exists after the Canyon Del Rey Boulevard off-ramp, so widening would be required or
buses would need to remerge into general-purpose lanes. The SR 1 overcrossing of Canyon
Del Rey Boulevard has only 6-foot-wide right-side shoulder, so this overcrossing would
need to be widened or buses would need to remerge and use general-purpose lanes.

Chapter 3 • Existing Conditions
3-55
Figure 3-9: Potential Bus-on-Shoulder Sites in Santa Cruz County

Chapter 3 • Existing Conditions
3-56
Table 3-28: Typical Rights-of-Way – Monterey County Focus Area
State Route 1 Location
Northbound Direction Southbound Direction
Left Shoulder (feet)
Right Shoulder (feet)
Total Right-of-Way (feet)
Left Shoulder (feet)
Right Shoulder (feet)
Total Right-of-Way (feet)
1. Soledad Drive/Munras Avenue – Aguajito Road 4-6 7-11 35-45 4-6 6-8 35-45
2. Aguajito Road – Fremont Boulevard 2-4 6 35-50 0-6 0-8 40-50
3. Fremont Boulevard – SR-68 2-3 2-3 50-70 0-6 0-8 50-60
4. SR-68 – Casa Verde Way 7 6 35-55 46 4-6 35-55
5. Casa Verde Way – Del Monte Avenue 4-5 6-7 40-55 5-6 4-6 35-55
6. Del Monte Avenue – Canyon Del Rey Boulevard 0 0-6 35-50 0 0 35-50
7. Canyon Del Rey Boulevard – Tioga Avenue 4-6 8 40-50 3-6 9 40
8. Tioga Avenue – Fremont Boulevard 4-6 0-7 35-50 4-6 7-10 35-60
9. Fremont Boulevard – Lightfighter Drive 4-6 8-12 50-65 5-7 9 45-65
10. Lightfighter Drive – Imjin Parkway 4-6 8-15 50-70 4-6 8-9 50-80
11. Imjin Parkway – Del Monte Boulevard 6-8 7-10 70-85 4-6 10-11 60-75
12. Del Monte Boulevard – Reservation Road 4-6 10-12 35-60 4-6 10-11 35-50
13. Reservation Road – Del Monte Boulevard 4-6 8-10 40-60 3-6 8-11 40-50
14. Del Monte Boulevard – Salinas River 4-7 6-8 40 4-6 9 40
15. Salinas River – Nashua Road 4-6 10 40 3-5 8-10 50
16. Nashua Road – SR 156 4-6 9 50 3-5 9-10 50
Chapter 3 • Existing Conditions
3-57
▪ Canyon Del Rey Boulevard to Tioga Avenue – The right shoulder is about 8 feet wide
including passing beneath the Tioga overpass. The overpass has a center support pier and it
appears the right shoulder could be widened, but not easily.
▪ Tioga Avenue to Fremont Boulevard – The right shoulder is about 7 feet wide but is
dropped at the overcrossing of Fremont Boulevard.
▪ Fremont Boulevard to Lightfighter Drive – The right shoulder is 10 to 12 feet wide along
this segment, but does narrow a little at the Lightfighter Drive overpass (to 8 feet).
▪ Lightfighter Drive to Imjin Parkway – The right shoulder width varies along this segment
ranging from 8 to 15 feet. Drifting sand is also evident along this shoulder segment.
▪ Imjin Parkway to Del Monte Boulevard – The Del Monte Boulevard off-ramp is an
adequate lane facility. The right shoulder is about 10 feet in width, but has sand cover on
most of its length. At the overcrossing of Lake Drive the shoulder narrows to 7 feet.
▪ Del Monte Boulevard to Reservation Road – The right shoulder is 10 to 12 feet wide on
this segment, but narrows to 8 feet on the overcrossing of Reservation Road.
▪ Reservation Road to Del Monte Boulevard – The right shoulder is 8 to 10 feet wide.
▪ Del Monte to Salinas River – The right shoulder is about 8 feet wide except for the bridge
over the Salinas River where it narrows to 6 feet.
▪ Salinas River to Nashua Road – The right shoulder widens to 10 feet north of the river to
Nashua Road.
▪ Nashua Road to SR 156 – The right shoulder is about 9 feet in width.
Southbound Travel
▪ SR 156 to Nashua Road – The southbound right shoulder is 9 to 10 feet wide on this
segment.
▪ Nashua Road to Salinas River – A ten-foot right shoulder is provided on this segment
except on the bridge crossing the Salinas River where it narrows to 8 feet.
▪ Salinas River to Del Monte Boulevard – The shoulder is about 9 feet wide on the right
side of southbound SR 1.
▪ Del Monte Boulevard to Reservation Road – A 10 to 11-foot shoulder is provided, except
for the overcrossing of a private road connecting to a sand quarry where it narrows to 8
feet. Buses would likely need to remerge with traffic over this bridge.
▪ Reservation Road to Imjin Parkway – A 10 to 11-foot right shoulder is provided on this
segment. Drifting sand might be a problem for these shoulders.
▪ Imjin Parkway to Lightfighter Drive – The right shoulder is 8 to 9 feet wide on this
section and could be widened assuming environmental constraints would permit. SR 1

Chapter 3 • Existing Conditions
3-58
passes beneath an overcrossing that provides access to Stilwell Hall located in the Fort Ord
Dunes State Park.
▪ Lightfighter Drive to Fremont Boulevard – The right shoulder is generally about 9 feet
wide and appears possible to widen to 10 to 11 feet if environmental constraints are
addressed.
▪ Del Monte Boulevard to Tioga Avenue – The right shoulder is more than 10-feet-wide
except at the overcrossing of Playa Avenue, where it narrows to 7 feet.
▪ Tioga Avenue to Canyon Del Rey Boulevard – The right shoulder is about 9 feet wide and
appears to have drifting sand issues.
▪ Canyon Del Rey Boulevard to Casa Verde Way – Right shoulder becomes an auxiliary
traffic lane on this segment. Buses could use the auxiliary lane, but it is dropped without
shoulder at Casa Verde Way.
▪ Casa Verde Way to SR-68 – Narrow shoulders of less than 6 feet are provided along this
segment.
▪ SR-68 to Aguajito Road – Either no shoulder is provided or shoulder less than an 8-foot-
wide is provided.
▪ Aguajito Road to Soledad Drive – The shoulders are less than 8 feet wide and appear
difficult to be widened on this section.
Potential sites for bus-on-shoulder concepts in Monterey County are illustrated in Figure 3-10.
Monterey Branch Line The Monterey Branch was built in 1879 and opened to traffic on January 1, 1880; it linked
San Francisco to the Hotel Del Monte and Pebble Beach. It branched from the Southern Pacific
Coast Line main line in Castroville. Gradually, traffic on the line diminished and it fell into
disrepair. TAMC purchased the line from the Union Pacific Railroad in 2003. The Alternatives
Analysis Monterey Peninsula Fixed Guideway Corridor Study conducted by TAMC examined both
light rail and bus alternatives on the branch line right-of-way. Lack of funding has precluded
moving forward with the project.
The branch line right-of-way is generally 100 feet wide. TAMC owns the portion from Watsonville
to Canyon Del Rey Boulevard in Seaside. The remainder of the right-of-way is owned by the City
of Monterey and has been converted to a pedestrian/bicycle trail that extends to Pacific Grove.
The right-of-way parallels SR 1 extending south from Castroville under SR 156 and following the
route of Monte Road and Lapis Road to and through the City of Marina. From there it crosses
under SR 1 and continues south, just west of SR 1 until it turns to the southeast and crosses under
SR 1 again, entering Sand City at the northern junction of Fremont and Del Monte Boulevards.
From here it continues south just east of Del Monte Boulevard and west of California Avenue
continuing into Seaside south to Canyon Del Rey Boulevard. Private businesses have encroached
on major portions of the right-of-way in this area. However, these businesses are leasing the
right-of-way from TAMC with the provision that the leases could be terminated when another use

Chapter 3 • Existing Conditions
3-59
for the right-of-way is identified. The SR 1 structures also pose some constraints on the right-of-
way.
The use of the Branch Line right-of-way would be an option for buses all the way from Castroville
south to Monterey. However, since the highest density of MST bus services in the corridor now
occurs between Marina and Monterey, this segment of the right-of-way is of most interest. Buses
could use the right-of-way on an exclusive bus-only roadway from the Marina Transit Exchange
and continue south via the right-of-way along the west side of SR 1, stopping at Sand City Station
and then continuing south to a possible new transit center in Seaside near Canyon Del Rey
Boulevard. This section of the right-of-way through Sand City and Seaside would also be a
candidate for a pedestrian bicycle path. This path would connect with the Monterey Peninsula
Recreational Trail at SR 1 in Sand City and then with the Monterey Bay Coastal Trail at
Canyon Del Rey Boulevard.
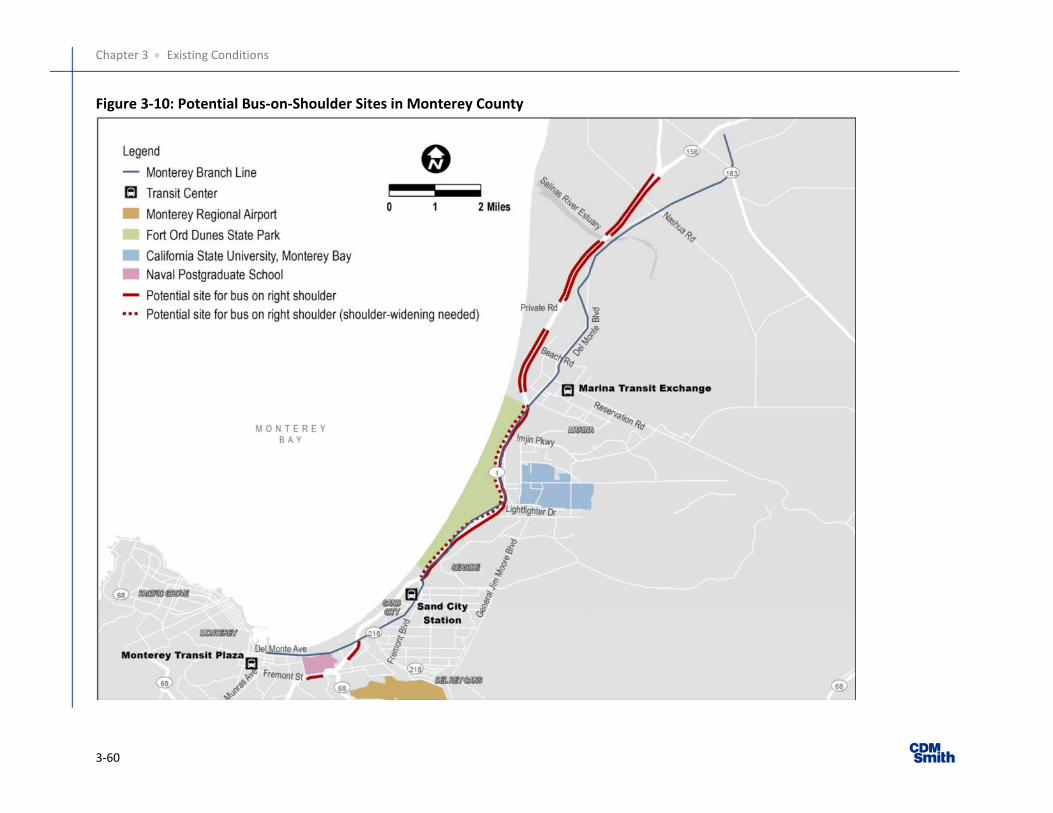
Chapter 3 • Existing Conditions
3-60
Figure 3-10: Potential Bus-on-Shoulder Sites in Monterey County

Chapter 3 • Existing Conditions
3-61
The desired and minimum design criteria for busway use of the railroad right-of-way depend on the
desired facility usage, including speed. The railroad right-of-way potentially could be used for a
two-way busway, for a one-way reversible busway, and possibly a combined busway and bikeway
facility. It is also possible that some segments could be operated with “block signals” and operate as
one-way reversible for short segments if the bus volumes are modest. Because the current pattern
of commuter travel is dominant in the southbound direction in the morning and northbound in the
evening, a one-lane busway could function to serve peak direction buses and then the buses could
use SR 1 and local streets in the off-peak direction.
Given these considerations the options are as follows:
1. Two-lane exclusive busway,
2. Single-lane bi-directional busway with passing pullouts and signals, and
3. Single-lane reversible peak direction only busway.
AASHTO in their Guide for Geometric Design of Transit Facilities on Highways and Streets suggests
a 48-foot cross section for a two-way busway on separate right-of-way and a 38-foot wide cross-
section for reduced standards. These criteria are generally consistent with transit median facility
criteria for freeways. The National Cooperative Highway Research Program (NCHRP) Report 155
suggests a 30-foot wide cross-section as the minimum width for two-way busway and 36 feet
desirable for two-way busway. Station stops would add to the minimum widths. A 20-foot
minimum width would be desirable for reversible or bi-directional busway, but short pinch-point
segments of 12 feet might prove feasible. Provision of a two-way bikeway adjacent to the busway
would increase the required widths by a minimum of 12 feet. A two-way cycle-track with a separate
pedestrian path would be 18 to 22 feet in width.
Given these standards it should be feasible to accommodate both a two-way busway and a
pedestrian/bicycle path in the 100-foot right-of-way. It may even be possible to retain the existing
railroad tracks which are typically in the center of the right-of-way.


4-1
Chapter 4
Project Alternatives
A description of the project alternatives is provided in this chapter. Separate alternatives were
developed for Monterey and Santa Cruz Counties. These alternatives were developed to allow
buses to bypass traffic congestion on SR 1 during morning and evening peak traffic periods.
Monterey County In Monterey County, severe traffic congestion is observed along southbound SR 1 between
Reservation Road and Del Monte Avenue interchanges during the morning peak period and along
northbound SR 1 between Carpenter Street and Fremont Boulevard during the evening peak
period. Therefore, project options to improve bus operations along SR 1 were developed for an
approximately eight-mile stretch between Reservation Road in Marina and Casa Verde Way in
Monterey. In Monterey County, because of the number of options and variations of options that
were identified, the corridor has been divided into four segments (see Figure 4-1) and within each
segment different options have been defined as shown in the list below. Then, alternatives,
spanning the length of the corridor were created by making logical combinations of the options
from each segment of the corridor. For example, the Bus-on-Shoulder – Alternative 1, discussed in
Chapter 5, was created by combining Option I-A from Segment I, Option II-A from Segment II, and
Option III-B from Segment III.
▪ Segment I: Reservation Road/SR 1 (Marina) to Fremont Boulevard/SR 1 (Sand City)
• Option I-A – Southbound Bus-on-Shoulder
• Option I-B – Monterey Branch Line Busway
• Option I-C – Caltrans Bike/Pedestrian Trail
▪ Segment II: Fremont Boulevard/SR 1 (Sand City) to SR 218 (Seaside)
• Option II-A – Southbound Bus-on-shoulder
• Option II-B – Monterey Branch Line Busway
▪ Segment III: SR 218 (Seaside) to Del Monte Avenue (Monterey)
• Option III-A – BRT to English Avenue
• Option III-B – Southbound Bus-on-Shoulder
▪ Segment IV: Casa Verde Way/SR 1 (Monterey) and Fremont Boulevard/SR 1 (Sand City)
• Option IV-A – Northbound Bus-on-Shoulder
Details of these options are provided below.

Chapter 4 • Project Alternatives
4-2
Figure 4-1: Study Corridor Segments – Monterey County
Segment I: Reservation Road/SR 1 to Fremont Boulevard/SR 1 For the 5.5-mile segment between the junction of Reservation Road and Del Monte Boulevard in
Marina, and the Fremont Boulevard/SR 1 interchange in Sand City, three options were developed.
Each of the three options would involve the following common features:
▪ Queue jump lanes at the Reservation Road/Del Monte Boulevard and the Reservation
Road/Palm Avenue intersections in Marina, and Fremont Boulevard/Monterey Road/SR 1
ramps intersection in Sand City
▪ Connections to the new intermodal corridor station that would be located at the junction of
8th and 9th Streets in Marina and the planned Marina-Salinas Multimodal Corridor along 8th
and 2nd Avenues via:
• 9th Street and Monterey Peninsula Recreation Trail, or
• 9th Street, 5th Street, 1st Avenue, and Divarty Street
▪ New bus stations at Monterey Peninsula Recreational Trail/Divarty Street junction in Marina
and Fremont Boulevard/Monterey Road/SR 1 ramps intersection in Sand City

Chapter 4 • Project Alternatives
4-3
Project options for Segment I along with their common features are illustrated in Figure 4-2, while
descriptions of the options are provided in the sections below.
Option I-A: Southbound Bus-on-Shoulder
Option I-A would support bus-on-shoulder operations on the right shoulder of southbound SR 1
between Del Monte Boulevard in Marina on-ramp and the Fremont Boulevard/SR 1 interchange.
Buses will be able to use the right shoulder of the southbound on-ramp from Del Monte Boulevard
in Marina as well. Vehicle-to-infrastructure technology will be used to enhance bus-on-shoulder
operations. For example, this technology can be used at on-ramp junctions to momentarily stop on-
ramp traffic whenever a bus approaches and crosses the on-ramp. Option I-A would provide bus
on right-shoulder operations primarily during the morning peak period (7-10 AM), since
southbound SR 1 experiences major congestion during morning periods only. Generally,
southbound right shoulders in Segment I are 9 to 11 feet wide currently, but additional right-of-
way is available to widen the right shoulders to at least 10 feet to accommodate bus-on-shoulder
operations.
Advantages:
▪ Independent of Off-Ramp Queue Spillovers: Traffic spilling back from a congested off-ramp
onto freeway would not affect bus speeds, except at the off-ramp junction where buses would
go across the off-ramp.
▪ Cost Effective: Option I-A involves minor construction. Most of the construction would be
related to minor shoulder widening, signage, and striping. Maintenance could be performed
as part of normal freeway maintenance.


Chapter 4 • Project Alternatives
4-4
Figure 4-2: Monterey Segment I Options


Chapter 4 • Project Alternatives
4-5
Disadvantages and Potential Issues:
▪ Shared Shoulders: Shoulders will not be available for the exclusive use of emergency vehicles.
▪ Speed Limits: Bus speeds are no more than 10 miles per hour faster than adjacent traffic and
are determined by the speed of congested traffic in the right-most travel lane.
▪ Structures: The old rail spur overcrossing south of 5th Street has a narrow shoulder and buses
will need to bypass by merging out of the shoulder and back into the right traffic lane and
then moving back to the shoulder after the bridge is crossed.
Option I-B: Monterey Branch Line Busway
Option 1-B will construct a 12-foot dedicated, reversible busway with shoulders within the
Monterey Branch Line’s right-of-way and allow buses to operate in both directions. In Segment I,
the Monterey Branch Line runs parallel to SR 1 on the west side. Buses will operate in the
southbound direction during the morning peak period and the northbound direction during the
evening peak period. At the north end, buses will access the busway at the intersection of Del Monte
Boulevard and Reservation Road or Del Monte Boulevard and Palm Avenue. The southern terminus
of this option would be at the Monterey Road/California Avenue/Fremont Boulevard intersection.
Advantages:
▪ Dedicated Right-of-Way: Due to a dedicated right-of-way, busways will have a constant speed
limit that is independent of freeway traffic speeds and congestion. Also, buses will travel at
the speed limits, improving their travel time and reliability.
▪ Autonomous Buses: Due to a dedicated right-of-way separated from traffic, it is reasonable to
consider operating autonomous buses as part of this option.
▪ Open Shoulders: Freeway shoulders will be available for the exclusive use of emergency
vehicles.
Disadvantages and Potential Issues:
▪ Limited Access: The busway will have limited access points; as such, this option is suitable for
express and limited bus lines, but not for local bus lines.
▪ Structures: Narrow overcrossing of unknown condition at Divarty Street will most likely need
to be replaced
▪ Costlier than Bus-on-Shoulder Operations: Option B involves busway construction costs and
is expected to be more expensive that Option I-A. As a new, separate facility from the freeway
it will require its own maintenance program.
Option I-C: Caltrans Bike/Pedestrian Trail
Option 1-C is similar to Option 1-B, except that the dedicated, reversible busway will be provided
within the right-of-way of the Caltrans Bike/Pedestrian Trail (Monterey Peninsula Recreational
Trail) that runs between SR 1 and the Monterey Branch Line parallel and adjacent to SR 1. Buses

Chapter 4 • Project Alternatives
4-6
will primarily operate in southbound direction during the morning peak period and northbound
direction during the evening peak period. Also, buses will access the north end of the busway at the
intersection of Reservation Road and Palm Avenue. The southern terminus of this option would be
at the Monterey Road/California Avenue/Fremont Boulevard intersection. There is a short section
of the recreational trail north and west of this intersection where the two parallel trails are
combined. This section would be displaced by the busway and this alterative includes replacement
of this section of trail using the Branch Line right-of-way.
Advantages:
▪ Dedicated Right-of-Way: Due to a dedicated right-of-way, busways will have a constant speed
limit that is independent of freeway traffic speeds and congestion. Also, buses will travel at
the speed limits, improving their travel time and reliability.
▪ Autonomous Buses: Due to a dedicated right-of-way separated from traffic, it is reasonable to
consider operating autonomous buses as part of this option.
▪ Open Shoulders: Freeway shoulders will be available for the exclusive use of emergency
vehicles.
Disadvantages and Potential Issues:
▪ Limited Access: The busway will have limited access points; as such, this option is suitable for
express and limited bus lines, but not for local bus lines.
▪ Costlier than Bus-on-Shoulder Operations: Option I-C involves busway construction costs and
is expected to be more expensive that Option I-A.
▪ Trail Displacement: Option I-C displaces the Monterey Peninsula Recreational Trail. There is
an alternative trail to west that serves the same function. However, there is an active
bicycling contingency which may object to discontinuing the use of the recreation trail. A
section where the two trails merge into one will be replaced as part of this option.
Segment II: Fremont Boulevard/SR 1 to SR 218 To improve bus operations for the 1.5-2-mile stretch between the Fremont Boulevard/SR 1
interchange in Sand City and SR 218 (Canyon Del Rey Boulevard) in Seaside, two options were
developed – one along SR 1 and the other along the Monterey Branch Line. These options are
extensions of Options I-A, I-B and I-C in Segment I. Project options for Segment II are illustrated in
Figure 4-3.
Option II-A: Southbound Bus-on-Shoulder
Option II-A is an extension of Option I-A, a continuation of bus-on-shoulder. It could be paired with
Options I-B or I-C also, but a costly connector to the freeway from either the Monterey Branch Line
or the Monterey Peninsula Recreational Trail would need to be constructed. This option will
provide for bus operations on the southbound right shoulder of SR 1 between the Fremont
Boulevard and SR 218 interchanges with SR 1. Vehicle-to-infrastructure technology will be used to
enhance bus-on-shoulder operations at on-ramps. Similar to Option I-A, Option II-A will provide
bus on right-shoulder operations primarily during the morning peak period (7-10 AM).

Chapter 4 • Project Alternatives
4-7
Southbound right shoulders in Segment II are 7 to 10 feet wide. However, additional right-of-way
is available to widen the right shoulders to at least 10 feet to accommodate bus-on-shoulder
operations.
Advantages:
▪ Independent of Off-Ramp Queue Spillovers: Traffic spilling back from a congested off-ramp
onto freeway would not affect bus speeds, except at the off-ramp junction where buses would
go across the off-ramp.
▪ Cost Effective: Option II-A involves minimal construction (as long as structure widening is
avoided). Most of the construction would be related to minor shoulder widening, signage,
and striping. Maintenance could be performed as part of normal freeway maintenance.
Disadvantages and Potential Issues:
▪ Shared Shoulders: Shoulders will not be available for the exclusive use of emergency vehicles.
▪ Speed Limits: Bus speeds are no more than 10 miles per hour faster than adjacent traffic and
are determined by the speed of congested traffic in the right-most travel lane.
▪ Structures: There are three major structures, the crossing of the railroad and the southbound
off-road to Fremont Boulevard, the crossing of the Monterey Peninsula Recreational Trail
and the crossing of SR 218 in this segment. All of these have narrow shoulders requiring
buses to bypass each bridge by merging out of the shoulder and back into the right traffic
lane and then moving back to the shoulder after the bridge is crossed. The option to these is
to widen these structures. This however, represents a cost of $25-35 million for each
structure, which would make the project infeasible in terms of cost-effectiveness.
Option II-B: Monterey Branch Line Busway
Option II-B is an extension of Option I-B. This option will involve buses operating along a dedicated,
reversible busway constructed within the Monterey Branch Line’s right-of-way. Similar to
Option I-B, to avoid freeway congestion, buses will primarily operate in southbound direction
during the morning peak period and northbound direction during the evening peak period.
South of the Fremont Boulevard/SR 1 interchange, the Monterey Branch Line crosses under SR 1
and runs parallel to Del Monte Boulevard until Contra Costa Street. As such, as part of Option II-B,
buses will operate as follows:
▪ Between SR 1 and Contra Costa Street – Along the Monterey Branch Line in a dedicated
busway. The busway will cross under Monterey Road and will cross Playa and Tioga Avenues
at grade with new traffic signals (or traffic roundabouts) at both locations.
▪ At Contra Costa Street – The busway will end, and buses will enter Del Monte Boulevard via
Orange Avenue and Contra Costa Street.


Chapter 4 • Project Alternatives
4-8
Figure 4-3: Monterey Segment II Options


Chapter 4 • Project Alternatives
4-9
▪ Between Contra Costa Street and SR 218 – The buses would use Del Monte Boulevard in
mixed traffic.
Bus stops and queue jump lanes will be provided as follows:
▪ A bus stop along the Monterey Branch Line between Playa and Tioga Avenues to serve Sand
City Station,
▪ A bus stop along Orange Avenue at its junction with the Monterey Branch Line, and
▪ Queue jump lanes at the intersection of Del Monte and Canyon Del Rey Boulevards.
Advantages:
▪ Dedicated Right-of-Way: Due to a dedicated right-of-way, busways will have a constant speed
limit that is independent of freeway traffic speeds and congestion. Also, buses will travel at
the speed limits, improving their travel time and reliability.
▪ Autonomous Buses: Due to a dedicated right-of-way separated from traffic, it is reasonable
to consider operating autonomous buses as part of this option.
▪ Open Shoulders: Freeway shoulders will be available for the exclusive use of emergency
vehicles.
Disadvantages and Potential Issues:
▪ Limited Access: The busway will have limited access points; as such, this option is suitable for
express and limited bus lines, but not for local bus lines.
▪ Encroachment – Private businesses have been allowed to use the right-of-way in Sand City
for parking for storage purposes on a month-to-month lease basis. The construction of the
busway would require that these leases be terminated, and the businesses would have to
adapt to operating without use of the rail right-of-way.
▪ Costlier than Bus-on-Shoulder Operations: Option II-B involves busway construction costs and
is expected to be more expensive that Option II-A. As a new, separate facility from the
freeway it will require its own maintenance program.
▪ Street Crossings: The busway will cross Playa and Tioga Avenues at-grade, creating a new
intersection very close to existing intersections on either side. New traffic signals or
roundabouts are possible solutions, but care will need to be taken not to worsen an already
difficult traffic operations issue.
▪ Sand City Station Transfers: Option II-B will have a bus stop about 800 feet away from Sand
City Station; as such, bus patrons at Sand City Station would have to walk to/from Sand City
Station to make transfer connections.

Chapter 4 • Project Alternatives
4-10
Segment III: SR 218 to Del Monte Avenue For the half-mile stretch between SR 218 (Seaside) and Del Monte Avenue (Monterey), two project
options were developed – one along SR 1 and the other along the parallel arterial, Del Monte
Avenue. Options for Segment III are illustrated in Figure 4-4.
Option III-A: BRT to English Avenue
Option III-A is consistent with the alignment of the Monterey Bay BRT along Del Monte
Boulevard/Avenue in Seaside, Sand City, and Monterey that was evaluated and studied by MST as
presented in the report Monterey Bay BRT prepared by MST in 2014 in coordination with the cities
of Monterey, Seaside, Sand City, and Marina, as well as the California State Parks, California State
University Monterey Bay, and the Fort Ord Reuse Authority. Option III-A would allow northbound
and southbound buses to travel in mixed-flow lanes along Del Monte Boulevard/Avenue for
about 0.3 miles between Canyon Del Rey Boulevard and English Avenue. Beyond English Avenue
the alignment could transition into mixed flow operation of buses with traffic on Del Monte Avenue
or could merge into a busway using the Monterey Branch Line right-of-way which is owned by the
City of Monterey as was envisioned in the Monterey Bay BRT report. Note, however, that the
alignment being evaluated in this report does not include any improvement southwest of
English Avenue.
Advantages:
▪ Connectivity: This option serves the intersection of Del Monte Avenue and SR 218, which is a
major transfer location for connections to other MST lines.
Disadvantages:
▪ Operation in Mixed-Flow: Travel with general traffic may cause transit delays

Chapter 4 • Project Alternatives
4-11
Figure 4-4: Monterey Segment III Options


Chapter 4 • Project Alternatives
4-12
Option III-B: Southbound Bus-on-Shoulder
Option III-B is an extension of combined Options I-A and II-A. Option III-B will provide bus-on-
shoulder operations along the right shoulder of southbound SR 1 between SR 218 and the Del
Monte Avenue off-ramp, including along the off-ramp. Option III-B will end at the ramp terminus
of the southbound off-ramp to Del Monte Avenue. Similar to Options I-A and II-A, vehicle-to-
infrastructure technology will be used to enhance bus-on-shoulder operations. Option III-B will
primarily operate during the morning peak period (7-10 AM).
Advantages:
▪ Independent of Off-Ramp Queue Spillovers: Traffic spilling back from a congested off-ramp
onto freeway would not affect bus speeds, except at the off-ramp junction where buses would
go across the off-ramp.
▪ Cost Effective: Option III-B involves minimal construction and should be cost-effective. Most
of the construction would be related to minor shoulder widening, signage, and striping.
Maintenance could be performed as part of normal freeway maintenance.
▪ Provision of Shoulders: Currently, there are narrow shoulders along southbound SR 1 in
Segment III. Provision of wider shoulders to accommodate bus-on-shoulder operations
would also benefit emergency vehicles and regular traffic during emergency situations,
especially during off-peak periods.
Disadvantages and Potential Issues:
▪ Shared Shoulders: Shoulders will not be available for the exclusive use of emergency vehicles.
▪ Speed Limits: Bus speeds are no more than 10 miles per hour faster than adjacent traffic and
are determined by the speed of congested traffic in the right-most travel lane.
▪ Shoulders: As mentioned above, there are narrow shoulders along southbound SR 1 in
Segment III. Widening right shoulders in Segment III would be challenging.
▪ Connectivity: This option would not provide a connection to the numerous MST lines that
pass through the nearby intersection of Del Monte Boulevard and SR 218.
Segment IV: Casa Verde Way/SR 1 to Fremont Boulevard/SR 1 Option IV-A: Northbound Bus-on-Shoulder
Option IV-A will provide bus-on-shoulder operations along the right shoulder of northbound SR 1
between the Casa Verde Way/SR 1 in Monterey and the Fremont Boulevard/SR 1 interchanges in
Sand City (about two miles long). If needed, buses will be able to use the right shoulder of the
northbound on-ramp from Casa Verde Way. Since traffic congestion along northbound SR 1 is
observed primarily during evening periods, Option IV-A will operate during the evening peak
period (3-7 PM).
Currently, northbound SR 1 has narrow right shoulders in Segment IV (8 feet wide or less).
Therefore, the right shoulders have to be widened all along northbound SR 1 to accommodate bus-
on-shoulder operations.

Chapter 4 • Project Alternatives
4-13
The alignment of Option IV-A is exhibited in Figure 4-5.
Advantages:
▪ Independent of Off-Ramp Queue Spillovers: Traffic spilling back from a congested off-ramp
onto freeway would not affect bus speeds, except at the off-ramp junction where buses would
go across the off-ramp.
▪ Cost Effective: Option IV-A involves a moderate level of construction and should be cost-
effective. Most of the construction would be related to shoulder widening, signage, and
striping. Maintenance could be performed as part of normal freeway maintenance.
Disadvantages and Potential Issues:
▪ Shared Shoulders: Shoulders will not be available for the exclusive use of emergency vehicles.
▪ Speed Limits: Bus speeds are no more than 10 miles per hour faster than adjacent traffic and
are determined by the speed of congested traffic in the right-most travel lane.
▪ Structures: There are three major structures, the crossing of the Monterey Peninsula
Recreational Trail the crossing of SR 218, and the crossing of Del Monte Avenue in this
segment. All of these have narrow shoulders requiring buses to bypass each bridge by
merging out of the shoulder and back into the right traffic lane and then moving back to the
shoulder after the bridge is crossed. The option to these is to widen these structures. This
however, represents a cost of $25-35 million for each structure, which would make the
project infeasible in terms of cost-effectiveness.
▪ Narrow Shoulders: Currently, northbound SR 1 has right shoulders narrower than six feet
along certain stretches between Del Monte Avenue and SR 218, and between Tioga Avenue
and Fremont Boulevard. Widening right shoulders at these locations would be challenging.

Chapter 4 • Project Alternatives
4-14
Figure 4-5: Monterey Option IV-A


Chapter 4 • Project Alternatives
4-15
Santa Cruz County In Santa Cruz County, severe traffic congestion is observed between the SR 17 and Buena Vista
Drive interchanges on SR 1. Traffic congestion is primarily directional, with northbound SR 1
congested during the morning peak period and southbound SR 1 congested during the evening
peak period. The following project alternatives were developed to improve freeway bus operations
in Santa Cruz County for an approximately 7.5-mile stretch between Morrissey Boulevard in Santa
Cruz and Freedom Boulevard in Aptos:
▪ Right-Shoulder Alternatives
• Alternative 1 – Interim Southbound Bus-on-Shoulder
• Alternative 2 – Bus-on-Shoulder with Auxiliary Lanes
o Option A: Hybrid-Auxiliary Lanes
o Option B: Bus-on-Shoulder
▪ Left-Side Alternative
• Alternative 3 – HOV Lane Project
These project alternatives were developed accounting for the short-term and long-term highway
improvements planned as part of the Highway 1 Corridor Investment Program1, led by SCCRTC.
Right-Shoulder Alternatives As part of the Highway 1 Corridor Investment Program, southbound and northbound auxiliary
lanes will be constructed at the following locations:
▪ Auxiliary Lane 1: Between Soquel Avenue and 41st Avenue interchanges
▪ Auxiliary Lane 2: Between Porter Street and Park Avenue interchanges
▪ Auxiliary Lane 3: Between Park Avenue and State Park Drive interchanges
▪ Auxiliary Lane 4: Between State Park Drive and Rio Del Mar Boulevard interchanges
▪ Auxiliary Lane 5: Between Rio Del Mar Boulevard and Freedom Boulevard interchanges
It is important to note that the Auxiliary Lane 4 and 5 phases are considered more as long-range
improvements. They are not currently funded by Measure D and they require significant mainline
reconstruction and railroad bridge replacements.
Additionally, right shoulders in either direction will be improved and widened and should be
10 feet wide in most areas. However, construction of these auxiliary lanes will be completed in
stages. Auxiliary Lane 1 will be starting construction by year 2021, Auxiliary Lanes 2 and 3 will
begin construction by year 2023-24, but this is contingent upon the availability of funds. The
1 Webpage: https://sccrtc.org/projects/streets-highways/hwy1corridor/

Chapter 4 • Project Alternatives
4-16
construction timeframe for Auxiliary Lanes 4 and 5 is currently unavailable. An interim bus-on-
shoulder alternative was developed to provide improved transit operations prior to the
implementation of the auxiliary lanes.
Alternative 1: Interim Southbound Bus-on-Shoulder
Alternative 1 provides an interim solution for bus-on-shoulder operations until the auxiliary lane
projects will be constructed along SR 1. As each phase of the Auxiliary lane project proceeds, the
interim bus-on-shoulder operation in that area would be discontinued. Alternative 1 will operate
buses on shoulders where existing right shoulders are at least 10 feet wide or require minimal
widening to be 10 feet. This alternative will avoid any major construction, including widening of
interchanges, Capitola Avenue overpass, and railroad bridges located south of State Park Drive
interchange. As part of Alternative 1, interim bus-on-shoulder operations will be provided along
the southbound right-shoulder, primarily during the evening peak period, since southbound SR 1
experiences major congestion during evening periods only. As northbound right shoulders are
typically narrower than 10 feet, bus-on-shoulder operations will not be provided along northbound
SR 1. Alternative 1 will provide southbound bus-on-shoulder operations at the following three
segments:
▪ Segment A: Soquel Avenue to 41st Avenue
▪ Segment B: Capitola Avenue to State Park Drive
▪ Segment C: South Railroad Bridge to Freedom Boulevard
At other locations, buses will operate along general-purpose lanes. The schematic layout of
Alternative 1 is provided in Figure 4-6.
Advantages:
▪ Interim Solution: Alternative 1 provides an option to improve bus operations along SR 1 until
Auxiliary Lanes 1 through 3 are constructed.
▪ Cost Effective: This alternative involves minimal construction. The majority of the
construction would be related to shoulder widening, signage and striping. However, timing
is important as the interim bus-on-shoulder should be in operation for at least 5 years prior
to the auxiliary lane construction in order to represent a worthwhile investment. This may
rule out the use of interim bus-on-shoulder operations prior to the Auxiliary Lane 1, 2 and 3
stages, as construction of these is planned to start within the next 5 years. To the extent
possible interim bus-on-shoulder improvements should be designed so that they would be
compatible with the future auxiliary lane project and not have to be removed when the
auxiliary lane construction starts.
▪ Flexibility during Construction: During construction of an auxiliary lane, bus-on-shoulder
operations could be eliminated for that segment but could be continued for other segments
located outside of the construction zone.

Chapter 4 • Project Alternatives
4-17
Disadvantages and Potential Issues:
▪ Operations during Construction: Interim bus-on-shoulder operations would have to be
discontinued in the construction zone when each stage of construction of auxiliary lanes
begins.
▪ Capital Costs: Alternative 1 and its associated capital costs are temporary in nature, although
it may be possible to design the improvements, so they would not have to removed when the
auxiliary lane project moves forward, although this is not likely.
▪ Speed Limits: Bus speeds are not fixed and are determined by the speed of congested traffic
in the right-most travel lane.
▪ Structures/Obstacles: Buses will need to bypass areas where shoulders are inadequate and
were two-lane off ramps exists. This requires weaving out of the shoulder lane and entering
the right most traffic lane until the obstacle is bypassed. This is a normal aspect of bus-on-
shoulder operations, however, too many of these obstacles will degrade the benefits of bus-
on-shoulder operations.

Chapter 4 • Project Alternatives
4-18
Figure 4-6: Santa Cruz Alternative 1

Chapter 4 • Project Alternatives
4-19
Alternative 2: Bus-on-Shoulder with Auxiliary Lanes
Alternative 2 provides a longer-term solution after year 2026 when Auxiliary Lanes 1 through 3
will be constructed along Highway 1. Alternative 2 will provide northbound and southbound bus-
on-shoulder operations along SR 1 between the Morrissey Boulevard and State Park Drive
interchanges. The following two options were developed for Alternative 2. Both options are
assumed to eventually extend all the way from Morrissey Boulevard to Freedom Boulevard with
the assumption that the bus-on-shoulder operations would be implemented at the same time or
shortly after each of the five stages of auxiliary lane construction is complete. However, as no
funding is currently identified for the two final stages of the auxiliary lane construction between
State Park Drive and Freedom Boulevard, this portion of the project is considered very long-term
and is not included as part of the project cost estimate.
Option A: Hybrid-Auxiliary Lanes
Option A will provide bus-only lanes between auxiliary lanes across interchanges. The bus-only
lane will serve as an extension of the auxiliary lane across an interchange between the off-ramp
and the on-ramp. These lanes could be provided on the right shoulder. As part of Option A, buses
will operate on:
▪ Auxiliary lanes between interchanges, and
▪ Bus-only lanes across interchanges.
At locations with a two-lane off-ramp, buses will operate on the outermost non-exit-only lane
otherwise buses would have to merge across two off-ramp lanes in order to enter the bus only lane
under the overpass. Once past the off-ramps the bus can move into the bus only lane. After
construction of Auxiliary Lanes 1 through 3, Option A will be provided between Morrissey
Boulevard and State Park Drive interchanges, but will be extended to Freedom Boulevard
interchange after construction of Auxiliary Lanes 4 and 5 occurs. The schematic layout of
Alternative 2: Option A is provided in Figure 4-7.
Advantages:
▪ Higher Bus Speeds: For most part, buses will travel on auxiliary lanes, where traffic speeds
are typically higher compared to those on the remaining travel lanes. Also, auxiliary lanes do
not have speed restrictions like those for bus-on-shoulder operations.
▪ Moderately Cost-Effective: Option A is moderately cost-effective – it involves no construction
between interchanges and minimal construction across interchanges.
▪ Open Shoulders: Shoulders will be available for the exclusive use of emergency vehicles,
especially between interchanges.
Disadvantages and Potential Issues
▪ Queue Spillovers: Traffic spilling back from a congested off-ramp onto an auxiliary lane would
reduce bus speeds.

Chapter 4 • Project Alternatives
4-20
▪ Two-Lane Off-Ramps: At locations with two-lane off-ramps, a bus-only lane cannot be
provided immediately after the auxiliary lane terminates to avoid conflict with exiting traffic.
At such locations, buses would have to shift over from the auxiliary lane to the outermost
non-exit-only lane to travel across the off-ramp junction. It is expected that with the
construction of all of the planned auxiliary lanes, there will be six two-lane off-ramps in the
study corridor. It is not practical to consider reducing these ramps to a single lane, as forecast
traffic volumes dictate the lane requirement and removing one lane would likely cause
queuing onto the freeway, which is also bad for bus-on-shoulder.
▪ Structures/Obstacles: Buses will need to bypass areas where shoulders are inadequate. This
requires weaving out of the shoulder lane and entering the right most traffic lane until the
obstacle is bypassed. This is a normal aspect of bus-on-shoulder operations, however, too
many of these obstacles will degrade the benefits of bus-on-shoulder operations

Chapter 4 • Project Alternatives
4-21
Figure 4-7: Santa Cruz Alternative 2 – Option A

Chapter 4 • Project Alternatives
4-22
▪ On-Ramp Merge Issues: Merge-related issues could occur at bus-only lane/on-ramp junctions.
These issues would be critical with loop on-ramps and could require Caltrans design
exceptions. However, it is expected that these issues could be fully or partially resolved with
the implementation of ramp metering that SCCRTC is planning as part of its Highway 1
Corridor Investment Program.
▪ Restricted Access to Bus-Only Lanes: Prohibiting access of general traffic to bus-only lanes will
be challenging.
▪ Dependent on Construction of Auxiliary Lanes: The successful implementation of Option A is
dependent on the construction of all or some of the 10 auxiliary lanes (five in each direction)
planned by SCCRTC. Stages 1-3 of the auxiliary lane program will start construction by 2025,
the final 2 stages will be much more long term, however it is practical to state the
implementation of bus-on-shoulder to coincide with the implementation of each stage of the
auxiliary lanes.
Option B: Bus-on-Shoulder
Option B will provide continuous bus on right shoulder operations between Morrissey Boulevard
and Freedom Boulevard interchanges, except at the following locations:
▪ Along southbound SR 1 between 41st Avenue and Bay Avenue/Porter Street interchanges –
This location has narrow right shoulders; as such, buses will operate on auxiliary lanes.
▪ At two-lane off-ramps – To avoid conflicting with traffic exiting the highway, buses cannot
continue on right shoulders at two-lane off-ramps; buses would have to shift over from the
auxiliary lane to the outermost non-exit-only lane to travel across the off-ramp junction and
enter right shoulder immediately after the off-ramp. It is not practical to consider reducing
these ramps to a single lane, as forecast traffic volumes dictate the lane requirement and
removing one lane would likely cause queuing onto the freeway, which is also bad for bus-
on-shoulder.
The schematic layout of Alternative 2: Option B is provided in Figure 4-8.
Advantages:
▪ Simple Design: The design of Option B is not complicated like that of Option A. It is simple –
the right shoulders will be open for bus use under certain conditions and can be easily
communicated to general traffic using signage and striping.
▪ Cost-Effective: Option B involves no or minimal construction and is cost-effective. The
majority of the construction would be related to shoulder widening, signage and striping.
▪ Independent of Off-Ramp Queue Spillovers: Traffic spilling back from a congested off-ramp
onto freeway would not affect bus speeds, except at the off-ramp junction where buses would
go across the off-ramp.
▪ Improved Right Shoulder: Freeway widening conducted as part of the auxiliary lanes’
construction would provide improved right shoulders.

Chapter 4 • Project Alternatives
4-23
Figure 4-8: Santa Cruz Alternative 2 – Option B

Chapter 4 • Project Alternatives
4-24
Disadvantages and Potential Issues:
▪ Dependent on the Construction of Auxiliary Lanes: Currently, the right-of-way is tight at the
Capitola Avenue overpass and the two railroad bridges located south of State Park Drive.
Without the construction of auxiliary lanes, buses cannot be operated on the right shoulder
at these locations.
▪ Structures/Obstacles: Buses will need to bypass areas where shoulders are inadequate. This
requires weaving out of the shoulder lane and entering the right most traffic lane until the
obstacle is bypassed. This is a normal aspect of bus-on-shoulder operations, however, too
many of these obstacles will degrade the benefits of bus-on-shoulder operations
▪ Shared Shoulders: Shoulders will not be available for the exclusive use of emergency vehicles.
▪ Speed Limits: Bus speeds are not fixed and are determined by the speed of congested traffic
in the right-most travel lane.
Left-Side Alternative
Alternative 3: HOV Lane Project
Operating buses on left shoulders in Santa Cruz County is challenging due to the following reasons:
▪ The study area has narrow left shoulders and requires substantial construction and
widening, including widening of interchanges and other structures,
▪ Greater difficulty is encountered for buses while weaving to enter and exit the left shoulder,
▪ The merge sight lines on the right side of buses are not as good as on the left side where the
driver sits resulting in bus remerges to finesse pinch-points to be less practical, and
▪ Access to/from left side shoulders would require weaving across two or more traffic lanes
resulting in longer merge and diverge areas for buses.
As such, instead of operating buses on left shoulders, Alternative 3 will provide continuous
northbound and southbound HOV lanes in the median of SR 1 between Soquel Avenue and State
Park Drive interchanges. This alternative is a cost-effective, value-engineered version of the HOV
Lane Alternative evaluated by SCCRTC as part of the Highway 1 Corridor Investment Program,
wherein HOV lanes will be provided in either direction in the highway median between Morrissey
Boulevard and San Andreas Road/Larkin Valley Road interchanges. Provision of HOV lanes would
result in higher travel speeds for buses on the highway.
Alternative 3 would involve substantial construction, including widening of interchange structures
between Soquel Avenue and State Park Drive, and Capitola Avenue overpass to accommodate HOV
lanes in the median and auxiliary lanes on the outside. The schematic layout of Alternative 3 is
provided in Figure 4-9.

Chapter 4 • Project Alternatives
4-25
Figure 4-9: Santa Cruz Alternative 3

Chapter 4 • Project Alternatives
4-26
Advantages:
▪ High Bus Speeds: Due to travel on exclusive bus lanes, buses will travel at or near speed limits,
improving their travel time and reliability.
▪ Promotes Express Service: This alternative will aid in the operation of express bus service(s)
between Santa Cruz and Watsonville.
▪ Open Shoulders: Freeway shoulders will be available for the exclusive use of emergency
vehicles.
Disadvantages and Potential Issues:
▪ Expensive: This alternative involves freeway widening and construction of an exclusive lane,
which will be very expensive.
▪ Coordination with the Construction of Auxiliary Lanes: Design and construction of this
alternative has to be coordinated with the construction of the planned auxiliary lanes.
Cost Estimates Methodology Conceptual cost estimates were prepared for all alternatives and segments. The cost estimate
assumes that no existing structures would be widened as part of any of the alternatives (except
Santa Cruz Alternative 3 and the Monterey HOV lane alternative discussed in Chapter 5) and that
no right-of-way would be acquired (except Santa Cruz Alternative 3). Unit costs were obtained
from the 2016 Caltrans Cost Data Book and escalated to 2018 dollars at a rate of 3.5 percent per
year.
Allowances based on the quantified bid items were included in all alternatives for storm water
pollution prevention plan (3 percent), traffic handling (10 percent), miscellaneous construction
costs (15 percent), and maintenance of traffic (3 percent). An allowance for mobilization (10
percent) and a contingency (35 percent) were also added to arrive at the total construction costs.
Soft costs were calculated for engineering studies (3 percent), environmental (3 percent), design
engineering and construction support (17 percent for alternatives within Caltrans right-of-way and
15 percent for alternatives outside of Caltrans right-of-way), and construction management
(13 percent).
Bus-on-Shoulder Alternatives
Cost estimates for bus-on-shoulder alternatives were generated on a per linear foot basis. It was
assumed that the existing shoulder would be excavated and replaced with a new 10-foot shoulder.
The structural section for the shoulder pavement was based on the structural section proposed for
travel lanes for the HOV Lane Alternative evaluated by SCCRTC as part of the Highway 1 Corridor
Investment Program between Larkin Valley Road and Morrissey Boulevard interchanges. Units per
linear foot for hot mix asphalt, aggregate subbase, lean concrete base, roadway excavation,
imported borrow, hydroseed, clearing and grubbing, traffic stripes, roadside signs, and relocated
roadway signs were calculated using typical cross sections that were exhibited in Figures 4-1
through 4-8. Relocation of overhead, roadside call boxes, catch basins, light poles, and guardrail

Chapter 4 • Project Alternatives
4-27
were assumed via a Google Earth assessment. Average length and height of new retailing walls
were assumed via a Google Earth assessment.
For Santa Cruz Alternative 2 (Option B), it was assumed that the bus-on-shoulder lanes would be
constructed in conjunction with the auxiliary lane project on SR 1, and the cost estimates represent
the additional costs to add the bus-on-shoulder elements. The auxiliary lane project includes new
shoulders of at least 10 feet in width. Construction is mainly limited to signage and striping.
Accordingly, all required sound walls and retaining walls were assumed to be included in the
auxiliary lane project.
HOV Alternative
The HOV Lane Project assumed the same design and construction of the HOV Lane Alternative that
was evaluated by SCCRTC as part of the Highway 1 Corridor Investment Program. The 2010
construction cost estimates for the HOV project was escalated from 2010 dollars to 2017 dollars
using the Caltrans Construction Cost Index. The costs were then escalated to 2018 dollars using the
escalation rate of 3.5 percent.
Monterey Branch Line Alternatives
Cost estimates for the Monterey Branch Line alternatives were generated on a per linear foot basis.
It was assumed that a new 12-foot busway with 4-foot shoulders on each side would be constructed
adjacent to the existing rails. It was assumed that no rail would be removed as part of the project.
For Monterey Segment 2, a new 2,200-square-foot cut-and-cover tunnel was assumed to cross
under Monterey Road near the junction of SR 1 and Fremont Boulevard. The roadway grade for the
approaches to the tunnel was assumed to be 8 percent. New traffic signals were assumed at the
intersections of the busway with Playa and Tioga Avenues. It was assumed that all land in the right-
of-way that is currently leased will be returned to TAMC with all improvements removed.
Caltrans Bike/Pedestrian Trail Alternative
Cost estimates for the Caltrans Bike/Pedestrian Trail alternative were generated on a per linear
foot basis. It was assumed that a new 12-foot busway with 4-foot shoulders on each side would be
constructed in place of the existing 10-foot bike/pedestrian trail. The structural section for the
busway and busway shoulder pavement was based on the structural section proposed for the HOV
Lane Alternative that was evaluated by SCCRTC as part of the Highway 1 Corridor Investment
Program between Larkin Valley Road and Morrissey Boulevard interchanges. Units per linear foot
for hot mix asphalt, aggregate base, aggregate subbase, lean concrete base, imported borrow,
hydroseed, clearing and grubbing, and traffic stripes were calculated using typical cross sections
that can be found in Figures 4-1 through 4-8. Drainage costs were assumed to be 3 percent of the
costs of the quantified bid items.
BRT Alternative
Cost estimates for the BRT alternative assumed bus operations in mixed-flow lanes with a queue-
jump lane at SR 218.

Chapter 4 • Project Alternatives
4-28
Monterey County Cost Estimates A summary of cost estimates for the project options in Monterey County is provided in Table 4-1,
while detailed costs estimates are included in Appendix A.
Table 4-1: Project Options’ Cost Estimates – Monterey County
Note:
1. Soft costs include engineering studies, environmental documentation preparation, design engineering and construction support, and construction management costs.
The total costs for the project alternatives in Segment 1 are expected to be the highest, between
$19 and $20 million. The remaining alternatives are expected to cost between $5 and $9 million,
except for Alternative 3A, which is expected to cost $580,000.
Santa Cruz County Cost Estimates A summary of cost estimates for the project alternatives in Santa Cruz County is provided in
Table 4-2, while detailed costs estimates are included in Appendix A.
The total cost estimates are about $12.2 million for Alternative 1, $1.96 million for Alternative 2
(Option A), $2.23 million for Alternative 2 (Option B), and $350.7 million for Alternative 3. The cost
estimate for Alternative 3 was derived from the most recent version provided in the draft Regional
Transportation Plan,
Segment Option Description
Cost Estimates (2018 $ in millions)
Construction Costs
Right-of-Way Costs
Soft Costs1
Total Costs
Reservation Road/SR 1 to
Fremont Boulevard/SR 1
I-A Southbound Bus-on-Shoulder $13.76 $0 $4.96 $18.72
I-B Monterey Branch Line Busway $14.89 $0 $5.06 $19.96
I-C Caltrans Bike/Pedestrian Trail $14.35 $0 $4.88 $19.23
Fremont Boulevard/SR 1
Highway 218
II-A Southbound Bus-on-Shoulder $3.89 $0 $1.40 $5.30
II-B Monterey Branch Line Busway $6.62 $0 $2.25 $8.86
Highway 218-Del Monte Avenue
III-A BRT to English Avenue $0.38 $0 $0.20 $0.58
III-B Southbound Bus-on-Shoulder $5.22 $0 $1.78 $6.99
Casa Verde Way/SR 1 to Fremont
Boulevard/SR 1 IV-A Northbound Bus-on-Shoulder $4.80 $0 $1.73 $6.52

Chapter 4 • Project Alternatives
4-29
Table 4-2: Project Alternatives’ Cost Estimates – Santa Cruz County
Note:
1. Soft costs include engineering studies, environmental documentation preparation, design engineering and construction support, and construction management costs.
2. Right-of-way costs for this alternative are included in the construction costs estimate.
Alternative
Cost Estimates (2018 $ in millions)
Construction Costs
Right-of-Way Costs
Soft Costs1
Total Costs
1 Interim Southbound Bus-on-Shoulder $8.97 $0 $3.23 $12.20
Segment A: Soquel Avenue – 41st Avenue $1.97 $0 $0.71 $2.68
Segment B: Capitola Avenue – State Park Drive $4.06 $0 $1.46 $5.52
Segment C: South Railroad Bridge – Freedom Boulevard $2.94 $0 $1.06 $4.00
2 Option A: Hybrid-Auxiliary Lanes – Morrissey Boulevard to State Park Drive
$1.44 $0 $0.52 $1.96
2 Option B: Bus-on-Shoulder– Morrissey Boulevard to State Park Drive
$1.64 $0 $0.59 $2.23
3 HOV Lane Project – Soquel Avenue to State Park Drive $257.93 NA2 $92.80 $350.7


5-1
Chapter 5
Evaluation of Alternatives
This chapter provides an evaluation of the bus-on-shoulder and the bus on the Monterey Branch
Line alternatives that were identified and defined in the previous chapter.
Evaluation Criteria and Methodology The project team collaborated to develop the specific criteria to be used to provide for a
comparative evaluation of the alternatives.
Criteria The following evaluation criteria were identified:
▪ Constructability – consideration of the degree of complexity in constructing the project
including construction requirements (such as roadway widening, new or modified
structures), displacement of existing infrastructure environmental impacts or operational
issues
▪ Transit operations – including consideration of additional service to be provided with the
future project as well as:
• Travel time savings
• Operating cost savings
• Transit reliability
• Fleet requirements – including consideration of autonomous buses and vehicle to
infrastructure technology such as ramp metering with bus detection
▪ Potential ridership – including consideration of additional service to be provided with the
future project
▪ Traffic operations and safety – including consideration of potential conflicts between buses
and general traffic as well as pedestrians and bicyclists
▪ Vehicle miles of travel reductions – related to diversion of auto drivers and passengers to
transit due to improved transit service quality
▪ Potential environmental impacts/mitigations required – review of possible areas of impact
caused by construction of the transit improvements or operation of the transit services
▪ Consistency with current plans and policies – review of current plans and policies to
determine the degree to which the potential transit improvements are supportive of
adopted local and regional goals

Chapter 5 • Evaluation of Alternatives
5-2
▪ Funding potential – identification of funding sources which could support implementation
of the potential transit improvements
▪ Institutional considerations – identification of the agencies responsible for funding,
implementing, monitoring and operating the potential transit improvements
▪ Cost (capital and operations and maintenance) – including all softs costs of project
development such as design and environmental studies, permitting, and construction
management
▪ Cost-effectiveness and cost-benefit assessment – quantification of the costs and benefits
associated with each improvement option and alternative
Methodology Overview The methodology used to conduct the evaluation utilizes sketch planning techniques which are
typically used at this early stage of project planning and feasibility assessment. Sketch planning
techniques, sometimes also called “quick-response” methods, use relatively simple and
transparent approaches to estimating travel behavior changes. The benefit is that they are well
suited to evaluating large numbers of alternatives and variations of alternatives, which is the case
in this study. Typically, spreadsheet-based models are used instead of relying on more complex
regional travel models which may not be fully sensitive to smaller scale changes to the
transportation network such as bus-on-shoulder operations.
Because the alternatives have been defined at a very conceptual level the estimates of costs and
ridership should be considered as order of magnitude assessments, which are primarily suitable
for comparing the alternatives. More details on the methodologies used to assess the implications
of the alternatives are provided below.
Alternatives and Timeframes Another aspect of the methodology is the process for comparing the alternatives. To have a
benchmark to compare alternatives, a No-Build Alternative was postulated. The No-Build
Alternative consists of the existing transportation network plus any transportation
improvements that are currently programed in the corridor and likely to occur within the
timeframe of the project evaluation.
Monterey County
In Monterey County, the most significant improvements that will impact the project are:
1. Marina-Salinas Multimodal Corridor Project – As noted in the planning document
for the corridor: “The Marina-Salinas Multimodal Corridor Plan was developed in
response to the need for a regional route through the former Fort Ord area that will
increase roadway capacity by prioritizing high quality transit, bicycling and walking as
viable alternatives to driving.” The corridor extends between Salinas and Marina. The
western terminus of the corridor is in Fort Ord adjacent to SR 1 near the 8th Street
crossing of SR 1. Once the corridor is in place there will be high quality transit services
operating on the Marina-Salinas Multimodal Corridor which could connect to the transit
alternatives being considered in this study.

Chapter 5 • Evaluation of Alternatives
5-3
2. Intermodal Center – The Fort Ord Reuse Plan calls for an Intermodal Center at the
west end of the Marina-Salinas Multimodal Corridor at or near the roundabout that
links 8th and 9th Streets. The center would serve as an important transit node where
services in the Marina-Salinas Multimodal Corridor could interface with local transit
lines and the MST lines that would be using the SR 1 Corridor.
3. SR 1 Widening – There are no specific plans to widen SR 1 in Monterey County at this
time. The Transportation Concept Report - State Route 1 prepared by Caltrans District 5
in 2017 does not call for adding additional lanes, although it does cite shoulder
widening and auxiliary lanes as potential future projects. The mitigations for the Fort
Ord Reuse plan do include an element for widening/improvements to SR 1, but it is not
clear how or when this would occur.
The analysis also included consideration of an HOV Lane alternative which would involve adding
median HOV lanes on SR 1 from Del Monte Boulevard in Marina to Del Monte Avenue in
Monterey. This hypothetical alternative was included for purposes of comparison and is not
currently part of any local, regional or state plans.
Santa Cruz County
For Santa Cruz County the No-Build Project will include the planned SR 1 Auxiliary Lanes being
implemented by the Santa Cruz County Regional Transportation Commission as part of the
Measure D funding program. Auxiliary lanes are short lane segments which extend along the right
side of the freeway between the on and off-ramps. They are very effective at increasing the
efficiency of the traffic weaving that occurs between ramps. The auxiliary lanes include new
shoulder areas which could be suitable for bus-on-shoulder operations.
The first phase of this project will be auxiliary lanes between 41st Avenue and Soquel Drive with
ultimate plans to extend the auxiliary lanes to Freedom Boulevard in Aptos. For this project the
No-Build Project includes new auxiliary lanes from Morrissey Boulevard to State Park Drive with
the understanding that the segment from State Park Drive to Freedom Boulevard is a long-range,
unfunded project. The Santa Cruz County Regional Transportation Commission estimates that the
auxiliary lanes between State Park Drive and Freedom Boulevard will cost $124.6 million. These
funds would have to found before any bus-on-shoulder operations could be implemented in this
segment of the corridor.
Timeframes
Year 2025 was selected as the evaluation timeframe for the alternatives. It is assumed that the
completion and opening of the alternatives could feasibly occur by year 2025. It might be possible
to implement some of the bus-on-shoulder proposals before this timeframe, however, it is still an
appropriate year for comparing the alternatives. In Santa Cruz County the auxiliary lanes from
Morrissey Boulevard to Freedom Boulevard will not be completed until well after 2025, however
they are still included as part of the No-Build Project because the bus-on-shoulder options 2A and
2B would not be implemented in this segment until the auxiliary lanes are in place.

Chapter 5 • Evaluation of Alternatives
5-4
Evaluation Results The criteria identified above were used to evaluate all the alternatives identified for the SR 1
corridors in both Monterey and Santa Cruz counties.
Monterey County The alternatives for Monterey County include bus-on-shoulder operations on SR 1, a
bi-directional busway on the Monterey Branch Line or the Caltrans Pedestrian/Bicycle Trail, and
various hybrid combinations of these options. To facilitate the review of the alternatives the
corridor has been divided into segments and the functional options are defined for each of these
segments as discussed in Chapter 4.
Constructability
The constructability assessment looks at potential challenges or obstacles which may create
difficulties in constructing each of the options. Examples could be conflicts with existing
structures, or a need to avoid sensitive habitats such as bird nesting areas or the presence of
hazardous materials. At this early conceptualization phase, it is difficult to identify all the
potential constructability issues, but areas of potential concern have been identified. The matrix
below,

Chapter 5 • Evaluation of Alternatives
5-5
Table 5-1, summarizes these issues for each corridor segment and options. In general, no fatal
flaws were found that would prevent any of the options from being constructed. The bus-on-
shoulder options do require widening of the shoulder. Widening the shoulder across a bridge is
particularly costly and difficult and is not assumed as part of the bus-on-shoulder options.
In these cases, this cost can be avoided if the buses bypass the critical section of the shoulder by re-entering the regular traffic lane until the bridge area is cleared. The section of SR 1 between the Fremont and Del Monte Avenue interchanges has three critical crossings in each direction, and this may be too many instances where the buses must merge in and out of traffic in a two-mile distance. The use of the Monterey Branch Line in Sand City and Seaside requires the busway to cross three busy streets with nearby signalized intersections. Adding a traffic signal for the busway will create a complex traffic operation problem and reduce the capacity of these intersections which are critical for traffic circulation and transit operations (Playa Avenue). A busway underpass of the Monterey Road crossing is included as a mitigation at that location, but it would be a costly solution, approximately $2.1 million for a simple cut-and-cover underpass. The City of Seaside is exploring improvements to this intersection which could offer a lower cost solution. Roundabouts may be an alternative solution at the Playa and Tioga Avenue locations where the Monterey Branch Line and the local streets intersect.

Chapter 5 • Evaluation of Alternatives
5-6
Table 5-1: Constructability Issues – Monterey County
Options by Segment Constructability Issues
Segment I Reservation Road/SR 1 to Fremont Boulevard/SR 1 (Sand City)
Option I-A Southbound Bus-on-Shoulder
▪ Shoulder widening would be necessary in some areas ▪ Shoulder strength is unknown ▪ Retaining walls may be necessary to accommodate widening ▪ Old rail spur overcrossing may need widening or buses will
need to bypass ▪ Sensitive environmental habitat
Option I-B Monterey Branch Line Busway
▪ Narrow overcrossing of unknown condition at Divarty Street ▪ May have underground utilities in right-of-way ▪ Sensitive environmental habitat ▪ Potential for hazardous materials
Option I-C Caltrans Bike/Pedestrian Trail Busway
▪ Pavement is likely not suitable strength for buses ▪ Retaining walls may be necessary to accommodate busway ▪ Displacement of existing recreational trail (nearby parallel
alternative exists) ▪ Sensitive environmental habitat
Segment II Fremont Boulevard/SR 1 to SR 218
Option II-A Southbound Bus-on-Shoulder – (continues south to the Del Monte Avenue off-ramp)
▪ Shoulder widening would be necessary in some areas ▪ Shoulder strength is unknown ▪ Retaining walls may be necessary to accommodate widening ▪ Overcrossing of Fremont Boulevard off-ramp and rail branch
line may need widening or buses will need to bypass ▪ Overcrossing of Coastal Trail may need widening or buses
will need to bypass ▪ Overcrossing of SR 218 may need widening or buses will
need to bypass ▪ Sensitive environmental habitat
Option II-B Monterey Branch Line Busway
▪ Street crossings at Playa Avenue and Tioga Avenue would require new signals and will create complex traffic operations issues due to nearby adjacent intersections. An undercrossing is assumed at Monterey Road.
▪ Potential for hazardous materials ▪ May have underground utilities in right-of-way ▪ Between Tioga Avenue and Contra Costa Street tenant
leases for using right of way for parking and storage would need to be terminated
Segment III SR 218 to City of Monterey
Option III-A BRT to English Avenue ▪ Potential minor operational impacts due to operating in
mixed flow traffic
Option III-B Southbound Bus-on-Shoulder – SR 218 to Del Monte Avenue
▪ Shoulder widening would be necessary in some areas ▪ Shoulder strength is unknown ▪ Retaining walls may be necessary to accommodate widening ▪ Sensitive environmental habitat
Segment IV Casa Verde Way/SR 1 to Fremont Boulevard/SR 1
Option IV-A Northbound Bus-on-Shoulder
▪ Narrow overcrossing of De Monte Avenue would need to be widened or buses will need to bypass
▪ Overcrossing of SR 218 may need widening or buses will need to bypass
▪ Overcrossing of Coastal Trail may need widening or buses will need to bypass
▪ Sensitive environmental habitat

Chapter 5 • Evaluation of Alternatives
5-7
Transit Operations
As discussed in Chapter 3, MST operates many bus lines which use the SR 1 Corridor. MST Line 20
which operates from Salinas to Monterey via Marina is the most frequent service, operating on-
average about every 30 minutes during the weekday morning and afternoon peak periods.
Combined, all of the MST lines operating on SR 1 provide 7 to 8 trips during the peak hour in the
peak direction on SR 1 under the current schedule, or about one bus every 8 minutes.
In terms of future service, the No-Build Alternative in year 2025 was assumed to include:
▪ Reducing the peak hour headway on MST Line 20 to 20 minutes
▪ Implementing quality transit service in the Marina-Salinas Multimodal Corridor was considered, however, this project is longer term beyond the year 2025 time frame
For all of the other options it is assumed Line 20 headways would be further reduced to
15 minutes and four additional trips per hour would be to the most productive of the other MST
lines using the corridor. This would be service added to take advantage of the travel time and
reliability benefits offered by the project.
Travel time savings
One of the key benefits of bus-on-shoulder or the busway alternatives would be travel time
savings. Reduced travel times benefit the transit rider and they also benefit the transit operator in
the form of reduced costs of operations due to fewer labor hours required to operate the service.
▪ Year 2016 Travel Times – The travel time analysis for each of the study segments and
alternatives in Monterey County based on the conditions observed in year 2016 is shown in
Table 5-2. INRIX cellular data was used to determine peak hour average speeds. The
current transit speed assumes the buses are operating in general freeway traffic. For bus-
on-shoulder operations to occur the traffic speeds must be 35 miles per hour or less.
Currently in the southbound direction in the morning peak hour from Reservation Road to
Fremont Boulevard, this occurs 38 percent of the time on weekdays. Thus, buses would
experience a travel time saving only during these times. It was assumed when the speeds
drop below 35 miles per hour the buses would use the shoulder at speeds 10 miles per
hour faster than the traffic speed in the adjacent lanes.
For Segment 1 between Reservation Road and Fremont Boulevard, the average time
savings per trip for bus-on-shoulder operations would be 1.7 minutes after adjusting for
the fact that a time savings would occur only 38 percent of the weekdays. Bus speeds when
using the shoulder would average 28.4 miles per hour. In contrast, bus speed on a busway
parallel to the freeway would be 65 miles per hour and the average time savings per trip
over the same segment would be 4.7 minutes.

Chapter 5 • Evaluation of Alternatives
5-8
Table 5-2: 2016 Travel Time Analysis – Monterey County
Option
Peak Hour Travel Speeds and Times per Trip (2016)
Length (mi)
Current Average Traffic Speed (mph)1
Current Average Transit Speed (mph)
Percent of Time
Speed is less than 35 mph
Average Transit
Minutes of Travel
New Average Transit Speed (mph)
New Average Transit
Minutes of Travel
Adjusted Average
Time Savings2
(min)
Segment I Reservation Road/SR 1 to Fremont Boulevard/SR 1 (Sand City)
I-A Southbound Bus-on- Shoulder
3.9 18.4 18.4 38% 12.7 28.4 8.2 1.7
I-B Monterey Branch Line Busway3
4.9 42.5 42.5 NA 7.5 65.0 4.5 4.7
I-C Caltrans Bike/ Ped Trail Busway3
4.9 42.5 42.5 NA 7.5 65.0 4.5 4.7
Segment II Fremont Boulevard/SR 1 to SR 218
II-A Southbound Bus-on- Shoulder (continues to Del Monte Blvd.)
1.1 26.3 26.3 31% 2.2 36.3 1.7 0.2
II-B Monterey Branch Line Busway4
1.1 25.0 11.0 NA 6.0 25.0 2.6 3.4
Segment III SR 218 to City of Monterey
III-A BRT to English Ave.5 0.6 20.0 9.0 NA 4.0 28.6 3.5 0.5
III-B Bus-on-Shoulder Southbound – SR 218 to English Avenue
0.6 26.3 26.3 62% 1.2 37.3 0.9 0.1
Segment IV Casa Verde Way/SR 1 to Fremont Boulevard/SR 1
IV-A Northbound Bus-on- Shoulder
2.5 24.2 24.2 100% 6.5 34.2 4.3 2.2
Notes:
1. Freeway speeds based on Peak Hour 50th percentile INRIX Data on SR 1. For bus-on-shoulder this is the average speed for the time when traffic speeds drop below 35 mph. Surface street speeds are estimates.
2. The average freeway travel time is weighted to account for the distribution of speeds for each 10-percentile grouping. This is necessary because the average speed is lower than the 50th percentile or median speed.
3. For the one-mile segment paralleling Del Monte Boulevard in Marina, existing traffic speeds and transit speeds are assumed to be 30 mph.
4. Existing traffic speeds are estimated to be 25 mph, and existing transit speeds are from the MST peak hour schedule for Line 20.
5. Bus operates in mixed traffic with queue jump at SR 218 intersection and transitions to recreational trail ROW at English Avenue intersection.

Chapter 5 • Evaluation of Alternatives
5-9
In terms of speeds and time savings a busway would have a considerable savings over bus-on-
shoulder operations.
▪ Year 2025 Travel Times – Travel time analysis for year 2025 is shown in Table 5-3. The
traffic forecasts presented in Chapter 3 indicate that traffic volumes in the corridor will
increase by 42.1 percent by year 2040, which interpolates to a growth of 16.8 percent by
year 2025. Increases in traffic volumes result in lower traffic speeds. This relationship is
often defined by what is called a speed-flow diagram as shown in Figure 5-1. Generally, as
traffic volumes increase and approach the capacity of the freeway, a small percentage
increase in traffic can result in a relatively large decline in traffic speed. For example, as
shown in the diagram, a 10 percent increase in traffic would result in a decline of 18 miles
per hour in the average speed. This speed-flow relationship was used to calculate the future
average speeds for year 2025.
The increase in traffic results in southbound AM peak hour average speeds on the freeway
decreasing from 18.4 miles per hour currently to 17.9 miles per hour, however, unlike
conditions in year 2016, this speed would represent the average of 100 percent of the
weekdays in year 2025. So, for Segment I, the average time savings per trip for bus-on-
shoulder operations would be 4.7 minutes as compared to 1.7 minutes in year 2016.
However, busway time savings would also benefit from the lower freeway traffic speeds
with a 10.6-minute time savings per trip in year 2025 for Segment I, as compared with the
estimated 4.7 minutes in year 2016. Busway time savings per trip would be significantly
higher than those experienced with bus-on-shoulder.
Figure 5-1: Freeway Speed versus Flow Relationship

Chapter 5 • Evaluation of Alternatives
5-10
Table 5-3: 2025 Travel Time Analysis – Monterey County
Notes:
1. Freeway speeds based on Peak Hour 50th percentile INRIX Data on SR 1, plus consideration of the projected growth in traffic
2. For the one-mile segment paralleling Del Monte Boulevard, traffic speeds and transit speeds are assumed to be 30 mph.
3. Traffic speeds are estimated to be 23 mph, and transit speeds are from the MST schedule for Line 20 plus a minute added for traffic growth
4. Bus operates in mixed traffic with queue jump at SR 218 intersection and transitions to recreational trail ROW at English Avenue intersection.
Option
Peak Hour Travel Speeds and Times per Trip (2025)
Length (mi)
Average Traffic Speed (mph)1
Average Transit Speed (mph)
Percent of Time
Speed is less than 35 mph
Average Transit
Minutes of Travel
New Average Transit Speed
New Average Transit
Minutes of Travel
Average Time
Savings
Segment I Reservation Road/SR 1 to Fremont Boulevard/SR 1 (Sand City)
I-A Southbound Bus-on-Shoulder 3.9 17.9 17.9 100% 13.1 27.9 8.4 4.7
I-B Monterey Branch Line Busway2 4.9 17.9 17.9 N/A 15.1 65.0 4.5 10.6
I-C Caltrans Bike/Ped Trail Busway2 4.9 17.9 17.9 N/A 15.1 65.0 4.5 10.6
Segment II Fremont Boulevard/SR 1 to SR 218
II-A Southbound Bus-on-Shoulder (continues to Del Monte Blvd.)
1.1 26.3 26.3 100% 3.9 36.3 2.4 1.4
II-B Monterey Branch Line Busway3 1.1 23.0 9.4 N/A 7.0 25.0 2.6 4.4
Segment III SR 218 to City of Monterey
III-A BRT to English Avenue4 0.6 18.0 8.0 N/A 4.5 28.6 3.5 1.0
III-B Southbound Bus-on-Shoulder – SR 218 to English Avenue
0.6 17.0 17.0 100% 1.4 27.0 0.9 0.5
Segment IV Casa Verde Way/SR 1 to Fremont Boulevard/SR 1
IV-A Northbound Bus-on-Shoulder – Casa Verde Way to Fremont Blvd.
2.5 13.5 13.5 100% 11.1 23.5 6.3 4.8

Chapter 5 • Evaluation of Alternatives
5-11
Estimated Travel Time Savings
The options for the various corridor segments can be mixed and matched in many ways to make up
complete alternatives for the full length of the corridor. The range of the alternative available that
would appear to offer the greatest time saving benefits is as follows:
1. Southbound Bus-on-Shoulder – This alternative would involve AM peak period bus-on-
shoulder operations on southbound SR 1 all the way from the Del Monte Boulevard on-
ramp in Marina to the Del Monte Avenue off-ramp in Monterey, a distance of 5.4 miles.
2. Southbound Bus-on-Shoulder plus Branch Line – This alternative would involve AM
peak period operations on southbound SR 1 all the way from the Del Monte Boulevard
on-ramp in Marina to the Fremont Boulevard off-ramp in Sand City. The buses would
then transition to the Monterey Branch Line right-of-way at the Monterey
Road/California Avenue/Fremont Boulevard intersection. The buses would then use a bi-
directional busway on the branch line to Contra Costa Street and transition to Del Monte
Boulevard, continuing all the way to English Avenue in Monterey, for a total distance of
5.4 miles.
3. Branch Line – This alternative, a bi-directional busway, would use the Monterey Branch
Line right-of-way from Reservation Road in Marina to Contra Costa Street in Sand City.
Buses would then transition to Del Monte Boulevard, continuing all the way to English
Avenue in Monterey, for a total distance of 5.6 miles.
4. Pedestrian/Bike Trail plus Branch Line – This alternative, a bi-directional busway,
would use the Monterey Branch Line right-of-way from Reservation Road in Marina to
Beach Range Road and then transition to the Monterey Peninsula Recreational Trail
continuing south to the Monterey Road/California Avenue/Fremont Boulevard
intersection in Sand City. The alignment would then then transition to the Monterey
Branch Line right-of-way at the Monterey Road/California Avenue/Fremont Boulevard
intersection, passing under the intersection. The buses would then use a bi-directional
busway on the branch line to Contra Costa Street and transition to Del Monte Boulevard,
continuing all the way to English Avenue in Monterey, for a total distance of 5.6 miles
5. Northbound Bus-on-Shoulder – This is not truly an alternative to the above options but
represents an additional potential project. Buses would operate in the PM peak period on
the northbound SR 1 shoulder from Casa Verde Way in Monterey to Fremont Boulevard
in Sand City, a total distance of 2.5 miles.
Table 5-4 shows the travel times savings per trip that were calculated for each of these alternatives
using the results from Table 5-2 and Table 5-3 as compared to the No- Build and HOV Lanes
alternatives.

Chapter 5 • Evaluation of Alternatives
5-12
Table 5-4: Estimated Travel Time Savings by Alternative – Monterey County
Alternatives Estimated Travel Time Savings per Trip (Peak Hour/Peak Direction)
# Options included Name Description
Existing Transit Travel Time
(minutes)
Average 2016
Transit Time
Savings (minutes)
Percent Travel Time
Improvement
2025 Transit Travel Time
(minutes)
Average 2025
Transit Time
Savings (minutes)
Percent Travel Time
Improvement
1 I-A, II-A,
III-B Southbound Bus-on-Shoulder
Del Monte Blvd to English Avenue via SR 1
18.9 2.4 13% 21.5 7.1 33%
2 I-A, II-B,
III-A
Southbound Bus-on-Shoulder Plus Branch Line
Del Monte Blvd to English Avenue via SR 1 and Branch Line
22.7 5.6 25% 24.6 10.1 41%
3 I-B, II-B,
III-A Branch Line
Reservation Road to English Avenue via Branch Line
17.5 8.5 49% 26.6 15.9 60%
4 I-C, II-B,
III-A Pedestrian/Bike Trail Plus Branch Line
Reservation Road to English Avenue via Caltrans Ped/Bike Path and Branch Line
17.5 8.5 49% 26.6 15.9 60%
5 IV-A Northbound Bus-on-Shoulder
Casa Verde Way to Fremont Boulevard via SR 1
6.5 2.2 34% 11.1 4.8 43%
6 N/A No-Build SR 1 from Del Monte Boulevard in Marina to Del Monte Avenue in Monterey
18.9 0.0 0% 21.5 0.0 0%
7 N/A HOV Lanes SR 1 from Del Monte Boulevard in Marina to Del Monte Avenue in Monterey
18.9 6.7 35% 21.5 14.2 66%

Chapter 5 • Evaluation of Alternatives
5-13
The greatest travel time savings for transit would result from the provision of HOV lanes in the
corridor, with a 66 percent savings in peak hour, peak direction travel times as compared with
the No-Build Alternative. The busway Alternatives 3 and 4 would be competitive with a 60
percent travel time savings. The Bus-on-Shoulder Alternative 1 would provide a 33 percent time
savings compared to the No-Build Alternative. As operations are limited to 10 miles per hour
greater than the freeway traffic speed, the travel time benefits are also limited as compared to a
busway where speeds of 65 miles per hour are practical.
Operating Costs
MST Line 20 is the primary service in the corridor today. Table 5-5 provides current operating
statistics for this line. The operating costs per hour were estimated from the MST 2017 Financial
Report.
Table 5-5: Line 20 Operating Statistics – Monterey County
Trips Days per
Year
Daily Trips Annual Trips
Northbound to Salinas
Southbound to Monterey
Northbound to Salinas
Southbound to Monterey Total
Weekday 258 38 35 9,804 9,030 18,834
Saturday 52 27 24 1,404 1,248 2,652
Sunday 52 18 18 936 936 1,872
Holiday 3 12 12 36 36 72
Total 365 95 89 12,180 11,250 23,430
Average Run Time (min.) 58 60 58 60
Operating Costs (@ $173 per hour plus 20 percent to account for layover/deadhead time)
$ 19,100 $ 18,500 $ 2,442,500 $ 2,333,800 $ 4,776,300
The alternatives would increase transit speeds during periods of congestion and result in reduced
running time for the services. This in turn will result in reduced costs of operation as the required
hours of service will decrease. For year 2025 it was estimated that approximately 30 percent of
the MST Line 20 transit trips in the corridor will be during periods of congestion on SR 1. For the
busway Alternatives 3 and 4, this would result in an annual operating cost savings of $327,000 or
a reduction of 6.8 percent over current cost levels (see Table 5-6). For the bus-on-shoulder
Alternative 1, an annual savings of 3.1 percent was estimated. The other MST lines serving the
corridor would experience similar cost savings on a percentage basis.
Table 5-7 shows the estimated annual operating costs for the transit services related to each
alternative in year 2025 (in 2018 dollars) as compared to the No-Build Alternative. These savings
are for the entire corridor as served by each of the alternatives. The costs include all of the MST
lines using the corridor as noted in column 4 of the table. The next column to the right shows the
added cost related to the assumed service increases by the year 2025.

Chapter 5 • Evaluation of Alternatives
5-14
Table 5-6: Line 20 Operating Cost Savings - Monterey County
Table 5-7: Incremental Annual Operating and Maintenance Costs – Monterey County
Alternative Location
Annual Line 20 Operating Costs Savings
Peak Hour Time Savings
Per Trip (min.)
Total Minutes
Saved
Annual Cost
Savings Percent Savings
1 Southbound Bus-on-Shoulder
Del Monte Boulevard to English Avenue via SR 1
7 33,925 $146,619 3.1%
2 Southbound Bus-on-Shoulder Plus Branch Line
Del Monte Boulevard to English Avenue via SR 1 and Branch Line
10 47,811 $206,631 4.3%
3 Branch Line Reservation Road to English Avenue via Branch Line
16 75,700 $327,165 6.8%
4 Pedestrian/Bike Trail Plus Branch Line
Reservation Road to English Avenue via Caltrans Ped/Bike Path and Branch Line
16 75,700 $327,165 6.8%
5 Northbound Bus-on-Shoulder
Casa Verde Way to Fremont Boulevard via SR 1
5 22,720 $98,194 2.1%
6 No-Build SR 1 from Del Monte Boulevard in Marina to Del Monte Avenue in Monterey
0 0 $0.0 0.0%
7 HOV Lanes SR 1 from Del Monte Boulevard in Marina to Del Monte Avenue in Monterey
14 67,478 $291,631 6.1%
Alternative
Year 2025 Operating and Maintenance Costs (millions of 2018 dollars)
Line 20
Costs
Cost of other
Corridor Services1
Cost of Added Service
Total Annual Transit
Operating Costs
Annual Facilities
Maintenance Costs
Total Annual Maintenance
and Operating
Costs
Incremental Costs
Compared to No-Build
1 Southbound Bus-on-Shoulder
$4.63 $5.97 $10.4 $21.0 $1.14 $22.2 $5.8
2 Southbound Bus-on-Shoulder Plus Branch Line
$4.57 $5.89 $10.3 $20.7 $1.04 $21.8 $5.5
3 Branch Line $4.45 $5.74 $10.0 $20.2 $1.09 $21.3 $5.0
4 Pedestrian/Bike Trail Plus Branch Line
$4.45 $5.74 $10.0 $20.2 $1.07 $21.3 $5.0
5 Northbound Bus-on-Shoulder
$4.68 $6.03 $10.5 $21.2 $0.24 $21.5 $5.2
6 No-Build $4.78 $6.16 $5.4 $16.3 $0.0 $16.3 $0.0
7 HOV Lanes $4.48 $5.78 $10.1 $20.3 $21.66 $42.0 $25.7
1 Includes MST Lines 12, 18, 19, 21, 55, 67, 72, 74, 75, 76, and 78

Chapter 5 • Evaluation of Alternatives
5-15
Transit Reliability
Currently, as documented in Chapter 3, congestion in the SR 1 corridor creates variations in
transit speeds and travel times, affecting service reliability. For example, service of the MST
Line 20 was observed to vary from the printed schedule by as much as 10 minutes faster or
slower over a section of highway where the schedule transit time was 19 minutes. Thus, daily
transit trip times on SR 1 varied by as much as 50 percent of the scheduled time. Reliability of
transit services, as compared to the schedule, impacts the riders and the transit operator in
several ways. When riders learn that a line has poor reliability, they are less likely to ride, and if
they do ride, they must add extra time into their schedule to protect against any potential delays.
The transit operator will typically do the same thing, add time into the transit schedule to account
for the travel time variations. The result is reduced ridership and increased operating costs.
Drivers must also hold at timepoints if they are running early, frustrating passengers who want to
get to their destination.
Bus-on-shoulder operations do improve reliability, as buses bypass traffic congestion. However,
there is still a degree of unreliability, as bus speeds can only be about 10 miles per hour faster
than traffic speeds in the general-purpose lanes. As traffic conditions vary daily, so will transit
speeds, even when the shoulders are utilized. In contrast, an exclusive busway would offer better
reliability as it would not be dependent on traffic conditions in terms of its performance.
Fleet Requirements
The estimated bus fleet requirements were calculated for each alternative as shown in Table 5-8.
A total of eight additional buses would be required for each of the alternatives as compared with
the No-Build Alternative.
Table 5-8: Year 2025 Fleet Requirements – Monterey County
Potential Ridership
A quick response, sketch planning technique has been used to assess ridership potential for the
alternatives. This approach uses the existing corridor ridership as a basis and then calculates
potential ridership increases based on the quality of the proposed future service. The model is
Alternative
Year 2025 Transit Buses Required for New Corridor Services
Buses Required
Spare Buses @ 20%
Total Buses Required
Incremental Increase over
No-Build
1 Southbound Bus-on-Shoulder 14 3 17 8
2 Southbound Bus-on-Shoulder Plus Branch Line
14 3 17 8
3 Branch Line 14 3 17 8
4 Pedestrian/Bike Trail Plus Branch Line 14 3 17 8
5 Northbound Bus-on-Shoulder 14 3 17 8
6 No-Build 7 1 8 0
7 HOV Lanes 14 3 17 8

Chapter 5 • Evaluation of Alternatives
5-16
sensitive to regional growth in the corridor, travel time savings, improvements in reliability and
increases in service frequency. Elasticity factors were identified to be applied to end of the service
quality indicators. Elasticity refers to the observed response in ridership to a change in a service
quality factor such as travel time. For example, an elasticity factor of -0.6 is often used to relate
travel time savings to potential ridership growth. This means that a 50 percent reduction in travel
time would translate to a 30 percent increase in ridership (50 percent times -0.6 = 30 percent).
Table 5-9 shows the results of the ridership analysis. Population and employment growth
typically translates directly into increased transit ridership, so an elasticity of 1.0 was used. In
this case, transit reliability is a major factor so an elasticity of one was also used. The two busway
Alternatives 3 and 4 and the HOV Lane Alternative would have the greatest ridership increases.

Chapter 5 • Evaluation of Alternatives
5-17
Table 5-9: Forecast Future Daily Ridership – Monterey County
Notes:
1. Highlighted cells indicate that the alternative does provide travel time savings in that travel direction or that the alternative provides more travel time savings in
that travel direction than in the other direction.
2. See text for explanation of ridership growth factors and elasticity values.
Alternative
Daily Ridership Growth Factors
Existing Corridor Ridership Population/ Employment
Growth Factor
(Elasticity = 1.0)
Travel Time Savings Factor
(Elasticity = -0.6)
Service Frequency
Increase Factor
(Elasticity = -0.5)
Service Reliability
Factor
(Elasticity = 1.0)
Estimated Year 2025 Corridor Daily Ridership
Southbound AM Peak
(6-10 AM)
NorthboundPM Peak
(3-7 PM)
SouthboundAM Peak
(6-10 AM)
NorthboundPM Peak
(3-7 PM)
1 Southbound Bus-on-Shoulder
270 455 17% 33% 180% 10% 640 850
2 Southbound Bus-on-Shoulder Plus Branch Line
270 455 17% 41% 180% 16% 670 1,060
3 Branch Line 270 455 17% 60% 180% 20% 710 1,200
4 Pedestrian/Bike Trail Plus Branch Line
270 455 17% 60% 180% 20% 710 1,200
5 Northbound Bus-on-Shoulder
270 455 17% 43% 180% 20% 500 1,150
6 No-Build 270 455 17% 0% 140% 0% 500 850
7 HOV Lanes 270 455 17% 66% 180% 20% 720 1,210

Chapter 5 • Evaluation of Alternatives
5-18
Traffic Operations and Safety
As noted in Chapter 2, the safety record of bus-on-shoulder operations around the county is
excellent. With busway operations, there have been some safety issues involving collisions with
traffic where the busway would cross local streets. This would occur with Alternatives 2, 3 and 4.
Traffic operations at these locations in Sand City are also an issue because the crossings would be
so close to the adjacent intersections, particularly at Playa Avenue. A special traffic control
strategy would be needed at these locations to prevent traffic from queuing across the busway
crossing area, while at the same time preserving traffic flow during times when the buses are not
present. The concept of roundabouts should be explored at these locations as a possible
mitigation.
HOV lanes also have their operational issues. It is particularly difficult for buses to maneuver in
and out of the left side lanes to and from the freeway ramps where stops are desirable. For this
reason, in many urban areas transit operators opt not to use HOV lanes. In the case of this
corridor it would be unlikely that HOV lanes would serve a useful transit function due to the
issues of weaving and transit safety.
Vehicle Miles of Travel Reductions
One benefit of bus-on-shoulder operations, busways, or HOV lanes is that the transit services that
use them are fast enough to attract new riders to transit. Table 5-10 shows the vehicle miles of
travel reductions associated with each of the alternatives based on the new transit riders
attracted as compared with the No-Build Alternative. A vehicle occupancy of 1.1 persons
(equivalent transit riders) per vehicle (automobiles) was assumed and the average trip length
was estimated to be 6 miles, so every new transit trip would represent 5.45 vehicle miles of travel
saved.
Table 5-10: Vehicle Miles of Travel Reduction – Monterey County
Alternative
Annual Vehicle Miles of Travel (2025)
Estimated Annual Transit
Ridership
Estimated Vehicle Miles
of Travel Eliminated
Incremental Vehicle Miles of Travel Reduction
over No-Build
1 Southbound Bus-on-shoulder 1,195,600 6,521,500 613,100
2 Southbound Bus-on-shoulder Plus Branch Line
1,388,100 7,571,500 1,663,100
3 Branch Line 1,532,600 8,359,600 2,451,200
4 Pedestrian/Bike Trail Plus Branch Line 1,532,600 8,359,600 2,451,200
5 Northbound Bus-on-shoulder 1,324,000 7,221,800 1,313,400
6 No-Build 1,083,200 5,908,400 -
7 HOV Lanes 1,548,600 8,446,900 2,538,500

Chapter 5 • Evaluation of Alternatives
5-19
Potential Environmental Impacts and Mitigations Required
This portion of the study relies heavily on the environmental research conducted as part of the
Alternatives Analysis for the Monterey Peninsula Fixed Guideway Corridor Study, March 2012 and
the Monterey Peninsula Light Rail Project First Administrative Draft Environmental Assessment,
September 2011. Both of these documents were prepared by the Transportation Agency for
Monterey County to examine the possibility of a light-rail or busway on the Monterey Branch
Line. Extensive environmental research was conducted as part of this effort. Table 5-11 provides
a summary of the environmental review that was conducted for each of the alternatives. The key
issues related to each of the alternatives are as follows:
1. Southbound Bus-on-Shoulder – The SR 1 shoulder widening required for this
alternative could impact the adjacent sensitive biological habitat although the impacted
area would be small and is within the existing right-of-way.
2. Southbound Bus-on-Shoulder plus Branch Line – The SR 1 shoulder widening could
impact the adjacent sensitive habitat although the impacted area would be small and is
within the existing right-of-way. The Monterey Branch Line right-of-way may contain
hazardous materials. There would be impacts to the Monterey Peninsula Recreational
Trail. Traffic impacts will occur at the locations where the busway crosses city streets.
Existing tenants will be displaced from the Monterey Branch Line right-of-way. There
may be some noise and vibration impacts.
3. Branch Line – The development of a busway on the Monterey Branch Line right-of-way
would impact sensitive biological habitat. The Monterey Branch Line right-of-way may
contain hazardous materials. There would be impacts to the Monterey Peninsula
Recreational Trail. Traffic impacts will occur at the locations where the busway crosses
city streets. Existing tenants would be displaced from the Monterey Branch Line right-
of-way. There may be some noise and vibration impacts.
4. Bike and Pedestrian Trail Plus Branch Line – The development of a busway on the
Monterey Peninsula Recreational Trail would impact sensitive biological habitat. The
Monterey Branch Line right-of-way may contain hazardous materials. A major portion
of the Monterey Peninsula Recreational Trail would be displaced. Traffic impacts will
occur at the locations where the busway crosses city streets. Existing tenants would be
displaced from the Monterey Branch Line right-of-way. There may be some noise and
vibration impacts.
5. Northbound Bus-on-Shoulder – The SR 1 shoulder widenings required for this
alternative could impact the adjacent sensitive biological habitat, although the impacted
area would be small and is within the existing right-of-way.
6. No-Build – The no build alternative involves an increase in bus traffic on SR 1 which is
not expected to have any significant impacts and should actually have some
environmental benefits. However, traffic congestion would continue to increase, and
desired emissions reductions would not occur with this alternative.

Chapter 5 • Evaluation of Alternatives
5-20
7. HOV Lanes – This alternative involves a significant widening and reconstruction of
SR 1. The development of HOV lanes would impact sensitive biological habitat as
additional right-of-way may be required. There would be impacts to the Monterey
Peninsula Recreational Trail at some locations where the trail is close to the freeway.
There may be some noise and vibration impacts. It is not consistent with the adopted
plans and policies of MST, as it would not be usable by transit vehicles due to weaving
problems and safety concerns.
It is important to note that all of the build alternatives would provide environmental benefits in
terms of diversion of existing auto trips to transit and the resulting reduction in vehicle miles
traveled, greenhouse gas emissions, and traffic related noise.
Table 5-11: Environmental Impact Review Summary – Monterey County
Impact
Alternative
1 2 3 4 5 6 7
South-bound
Bus-on- Shoulder
South-bound
Bus-on- Shoulder
plus Branch
Line Branch
Line
Pedestrian/ Bike Trail
Plus Branch Line
Northbound Bus-on-
Shoulder No-Build HOV
Lanes
Water Quality
Coastal Zone
Floodplain
Biology
Wetlands
Hazardous Materials
Parklands (4f)
Visual Impacts
Relocations
Traffic
Cultural Resources
Noise and Vibration
Air Quality
Consistency with Community Plans
Not Significant Possibly Significant Significant

Chapter 5 • Evaluation of Alternatives
5-21
Consistency with Current Plans and Policies
Development of either bus-on-shoulder operations or bus use of the Monterey Branch Line is
fully consistent with statewide, regional and local land use and transportation plans and policies.
California Assembly Bill No. 946 which was passed in 2013 authorizes the Monterey-Salinas
Transit District and the Santa Cruz Metropolitan Transit District to conduct a transit bus-only
program using the shoulders of certain state highways as transit bus-only traffic corridors,
subject to approval by the department (Caltrans) and the Department of the California Highway
Patrol. California Assembly Bill No. 1746, which is currently under consideration, states that
Monterey-Salinas Transit, the Santa Cruz Metropolitan Transit District and a number of other
transit operators:
… may conduct a transit bus-only program using the shoulders of certain highways in the
state highway system within the areas served by the transit services of each entity, with
the approval of the department and the Department of the California Highway Patrol. The
department, the Department of the California Highway Patrol, and each participating
transit entity shall jointly determine the segments of each highway where it is
appropriate to designate the shoulders as transit bus-only traffic corridors, based upon
factors that shall include, but are not limited to, right-of-way availability and capacity,
peak congestion hours, and the most heavily congested areas. Under the program, the
participating transit entities shall actively work with the department and the Department
of the California Highway Patrol to develop guidelines that ensure driver and vehicle
safety and the integrity of the infrastructure.
Caltrans is preparing updated guidelines for bus operations on highways and use of shoulder
areas. Bus-on-shoulder operations were successfully tested as part of a pilot program on SR-52
and I-805 in San Diego County, so there is precedent for bus-on-shoulder operations on state
highways.
The Metropolitan Transportation Plan (MTP) and its Sustainable Communities Strategy (SCS) will
be released by the Association of Monterey Bay Area Governments in 2018. It identifies Bus Rapid
Transit in the SR 1 corridor as part of the year 2040 transit network plan, it also references this
bus-on-shoulder and branch line study as an ongoing effort. This plan will replace the current
Metropolitan Transportation Plan (MTP) and its Sustainable Communities Strategy (SCS) which
was adopted in 2014.
The Transportation Agency for Monterey County’s Measure X expenditure program includes the
Highway 1 Traffic Relief – Busway project which is described as follows: “Create a new rapid bus
corridor along Highway 1 between Monterey and Marina, with possible extensions to Castroville,
utilizing the shoulder of the highway and/or portions of the parallel rail right-of-way, to provide a
way for buses to travel more rapidly than cars so that commuters spend less time in traffic.”
During the course of this project, meetings were held with the Fort Ord Reuse Authority and with
the cities of Monterey, Sand City, Seaside, and Marina. In each case, the bus-on-shoulder concept
or use of the Monterey Branch Line for a busway was not in conflict with existing plans and
policies and in general would support sustainability goals in terms of transportation and the
environment. The City of Monterey has studied the feasibility of a bus rapid transit alignment

Chapter 5 • Evaluation of Alternatives
5-22
paralleling Del Monte Avenue, which would provide for an extension of this project into the heart
of Monterey.
Funding Potential
As mentioned above the Transportation Agency of Monterey County’s Measure X expenditure
program includes the Highway 1 Traffic Relief – Busway project. A budget of $15.0 million is
designated for this project.
The Fort Ord Reuse Authority’s Capital Improvement Plan 2017 includes $123 million for
transportation and transit improvements. $22 million is earmarked for SR 1 widening between
Fremont and Del Monte Boulevard/Avenue (Sand City to Monterey).
The Measure X funds and any funding available from the Fort Ord Reuse Authority Capital
Improvement Plan could be used to leverage other state and federal funds. The Federal Transit
Administration under its Small Starts program can fund busway improvements. So far, however,
they have not allowed these funds to be used for bus on freeway projects.
There are several funding opportunities at the state level. Examples include the Transit and
Intercity Rail Capital Program (TIRCP) which was created by Senate Bill (SB) 862 (Chapter 36,
Statutes of 2014) and modified by Senate Bill 9 (Chapter 710, Statutes of 2015) to provide grants
from the Greenhouse Gas Reduction Fund to fund transformative capital improvements that will
modernize California’s intercity, commuter, and urban rail systems, and bus and ferry transit
systems to reduce emissions of greenhouse gases by reducing congestion and vehicle miles
traveled throughout California. Senate Bill 1, the Road Repair and Accountability Act of 2017, was
signed into law on April 28, 2017. This legislative package invests $54 billion over the next
decade to fix roads, freeways and bridges in communities across California and puts more dollars
toward transit and safety. These funds will be split equally between state and local investments.
While there is no specific earmark for projects on SR 1, there are discretionary funds available.
In general, the projects that qualify for funding are those that have broad local support, are in an
advanced state of readiness, and provide tangible benefits.
Institutional Considerations
Any bus-on-shoulder project will have to be approved by both Caltrans and the California
Highway Patrol. Caltrans is in the process of developing guidelines for bus-on-shoulder
applications. These guidelines are likely to be very similar to those laid out in the Transit
Cooperative Research Program Report 151, which was the basis of the conceptual planning used
in this study.
The Transportation Agency for Monterey County is owner of the Monterey Branch Line right-of-
way (except in the City of Monterey) and City of Seaside south of Contra Costa Street. MST would
need approval from the Transportation Agency for Monterey County as well as an easement to
construct a busway on the branch line. Desirably, each of the cities along the corridor would also
allow the use of the right-of-way.

Chapter 5 • Evaluation of Alternatives
5-23
Capital Costs
The costs of construction and project development have been prepared for each of the
alternatives. These costs are incremental or in excess of the costs of the No-Build Alternative. The
assumptions which were used to develop these costs are presented in Chapter 4. Table 5-12
presents the results of the cost analysis. It is assumed that there will be no right-of-way costs for
use of either the Caltrans’ right-of-way or the Monterey Branch Line right-of-way. Soft costs
include the costs of environmental clearance, project planning and design, and construction
management and oversight. The HOV Lane alternative is by far the most expensive, as it would
require the widening or lengthening of eight bridges and two full lanes of pavement plus new
shoulders for the length of the corridor (approximately 5.8 miles). The other alternatives, except
Alternative 5 (northbound PM peak period only), are similar in cost, though it is important to
note that Alternative 1 - Southbound Bus-on-Shoulder provides benefit in one direction only
during the AM peak period. The other alternatives provide service in both travel directions,
southbound in the AM peak period and northbound in the PM peak period, although for
Alternative 2, this is only for the southern portion of the corridor.
Alternatives 3 and 4 provide a connection to the Intermodal Center and the Marina-Salinas
Multimodal Corridor in Fort Ord. This is not included in the other alternatives because of the
difficulty of creating new on and off ramps to SR 1.
Table 5-12: Incremental Capital Costs – Monterey County
Cost-Effectiveness and Benefit-Cost Assessment
A benefit-cost analysis for the project alternatives in Monterey County was conducted. The
purpose of a benefit-cost assessment is to provide a quantitative comparison of the benefits of an
alternative which would include time savings to transit riders, transit operating cost savings,
savings due to reduced vehicle miles of travel and related reductions in vehicular emissions;
compared to the costs of the alternative which include project development and construction
costs, as well as annual operating/maintenance costs. The analysis was based on the following
assumptions:
▪ Life cycle of an alternative is 30 years;
Alternative
Year 2025 Capital Costs (millions of 2018 dollars)
Segments Construction
Costs Right-of-
Way Costs Soft
Costs Vehicle Costs Total
1 Southbound Bus-on-Shoulder I-A, II-A, III-B $22.9 $0 $8.1 $4.0 $35.0
2 Southbound Bus-on-Shoulder Plus Branch Line
I-A, II-B, III-A $20.8 $0 $7.4 $4.0 $32.1
3 Branch Line I-B, II-B, III-A $21.9 $0 $7.5 $4.0 $33.4
4 Pedestrian/Bike Trail Plus Branch Line
I-C, II-B, III-A $21.3 $0 $7.3 $4.0 $32.6
5 Northbound Bus-on-Shoulder IV-A $4.8 $0 $1.7 $4.0 $10.5
6 No-Build N/A $0 $0 $0 $0 $0
7 HOV Lanes N/A $327.7 $0 $118.0 $4.0 $449.7

Chapter 5 • Evaluation of Alternatives
5-24
▪ The project alternative will be constructed by year 2025;
▪ Value of time in Monterey County is $13.65 per hour per person (Source: Cal-B/C Model);
▪ Discount rate is 4 percent (Source: Cal-B/C Model);
▪ Annualization factor is 321 days per year; and
▪ Ratio of travel distance of a bus line on SR 1 to the overall route length is 50 percent. This
factor was used to estimate the operations and maintenance costs that would be applicable
to a project alternative.
A summary of cost-benefit analyses conducted for the project alternatives in Monterey County is
provided in Table 5-13. The benefit-to-cost ratio of the project alternatives would vary between
0.07 and 0.67. Alternatives 1, 2, and 7 are expected to have a benefit-to-cost ratio of 0.25 or lower,
while Alternatives 3 and 4 that would provide benefits in both the directions would have a
benefit-to-cost ratio of 0.66 and 0.67, respectively.
Detailed calculations showing cost-benefit estimates are included in Appendix B.

Chapter 5 • Evaluation of Alternatives
5-25
Table 5-13: Cost-Benefit Summary – Monterey County
Alternative
Present Value of Costs
(2018 $ in millions)
Present Value of Benefits
(2018 $ in millions)
Benefit-to-Cost Ratio Segments
Capital Costs
Operating Costs
Total Costs
Travel Time Benefits
Operating Cost
Benefits C02 Emissions
Benefits Total
Benefits
1 Southbound Bus-on-Shoulder
I-A, II-A, III-B $35.00 $60.35 $95.35 $5.22 $11.41 $0.19 $16.82 0.18
2 Southbound Bus-on-Shoulder Plus Branch Line
I-A, II-B, III-A $32.20 $56.03 $88.23 $5.24 $16.08 $0.52 $21.84 0.25
3 Branch Line I-B, II-B, III-A $33.40 $52.57 $85.97 $30.55 $25.45 $0.77 $56.77 0.66
4 Pedestrian/Bike Trail Plus Branch Line
I-C, II-B, III-A $32.60 $46.52 $84.82 $30.55 $25.46 $0.77 $56.78 0.67
5 Northbound Bus-on-Shoulder
IV-A $10.50 $33.30 $57.02 $6.97 $7.64 $0.41 $15.02 0.26
7 HOV Lanes N/A $449.70 $426.42 $876.12 $34.60 $22.69 $0.80 $58.10 0.07

Chapter 5 • Evaluation of Alternatives
5-26
Santa Cruz County The alternatives for Santa Cruz County are strictly bus-on-shoulder applications using SR 1. The
same criteria as were used in the Monterey County assessment were applied to the assessment
for Santa Cruz County.
Constructability
With the exception of the Interim Southbound Bus-on-Shoulder Alternative, the remainder of the
alternatives are dependent on the planned implementation of the SR 1 Auxiliary Lanes project
(see Table 5-14). The first phase of this project will be auxiliary lanes between 41st Avenue and
Soquel Drive with ultimate plans to extend the auxiliary lanes to Freedom Boulevard in Aptos. For
this project the No-Build Alternative includes new auxiliary lanes from Morrissey Boulevard to
State Park Drive, with the understanding that there is no identified funding source for the
segment between State Park Drive and Freedom Boulevard which should be considered a long-
range project. The auxiliary lanes include new shoulder areas which could be suitable for bus-on-
shoulder operations. No fatal flaws were found that would render any of the alternatives
infeasible. The HOV Lane Alternative 3, however, does require the widening or lengthening of five
structures beyond that which is already required for the Auxiliary Lane project, which is very
costly and would have other significant impacts such as the need for retaining walls and added
right-of-way. Unlike the bus-on-shoulder alternatives, the HOV alternative requires new, fully
functional lanes that can be used by buses and carpools.
For the Interim Southbound Bus-on-Shoulder Alternative, widening the shoulder across a bridge
is particularly costly and difficult. In these cases, this cost can be avoided if the buses bypass the
critical section of the shoulder by re-entering the regular traffic lane until the bridge area is
cleared and then returning to the shoulder. The same is true of the Bus-on-Shoulder Options 2A
and 2B. Widening at interchanges and structures is not essential as the buses can rejoin the
general purpose lanes to bypass these locations, which is a lot more cost effective than spending
the funds to remove the obstacle. It is very common in the bus-on-shoulder practice throughout
the country for the buses to make such bypass maneuvers.

Chapter 5 • Evaluation of Alternatives
5-27
Table 5-14: Constructability Issues – Santa Cruz County
Alternatives Constructability Issues
1 Interim Southbound Bus-on-Shoulder
Segment A Soquel Avenue to 41st Avenue
▪ Shoulder widening will be necessary in some areas
▪ Shoulder strength is unknown
▪ Retaining walls may be necessary to accommodate widening
▪ Sensitive environmental habitat
Segment B Capitola Avenue to State Park Drive
▪ Shoulder widening will be necessary in some areas
▪ Shoulder strength is unknown
▪ Retaining walls may be necessary to accommodate widening
▪ Overcrossing at Park Avenue may need widening or buses will need merge out of the shoulder and bypass the bridge using the regular traffic lane.
▪ Sensitive environmental habitat
Segment C South Railroad Bridge to Freedom Boulevard
▪ Shoulder widening will be necessary in some areas
▪ Shoulder strength is unknown
▪ Retaining walls may be necessary to accommodate widening
▪ Sensitive environmental habitat
2 Bus on Right Shoulder with Auxiliary Lanes
Option A Hybrid-Auxiliary Lanes – Morrissey Boulevard to State Park Drive
▪ Auxiliary lane project involves roadway widening and new 10-foot shoulders. Bus-on-shoulder requires minor shoulder widening in some areas.
▪ Six structures will need to be widened or lengthened, as part of the auxiliary lane project, this is not part of the bus-on-shoulder project
▪ Sensitive environmental habitat
Option B Bus-on-Shoulder – Morrissey Boulevard to State Park Drive
▪ Auxiliary lane project involves roadway widening and new 10-foot shoulders. Bus-on-shoulder requires minor shoulder widening in some areas.
▪ Six structures will need to be widened or lengthened, as part of the auxiliary lane project, this is not part of the bus-on-shoulder project
▪ Sensitive environmental habitat
3 HOV Lane Project
Soquel Avenue to State Park Drive
▪ Major freeway reconstruction to create median HOV lanes, add auxiliary lanes and shoulders
▪ Five structures will need to be widened or lengthened, as part of the HOV lane and auxiliary lane project (fewer structures than Alternative 2 because of the shorter distance with a southern terminus at State Park Drive)
▪ Sensitive environmental habitat
Transit Operations
METRO currently does not operate any through bus service on SR 1 in this corridor. One reason
for that is that SR 1 is so congested that any transit service would be very slow and unreliable.
METRO Route 91X is the route that comes closest to serving the freeway corridor. It does use the
freeway for portions of its trip between Santa Cruz and Watsonville. Its average peak hour speed

Chapter 5 • Evaluation of Alternatives
5-28
is 11.8 miles per hour. If bus-on-shoulder or HOV lanes were developed on SR 1, METRO plans to
enhance its service including direct non-stop express service between Santa Cruz and
Watsonville.
Travel time savings
Travel time savings were calculated using the INRIX speed data from year 2016 as a base and
then forecasting traffic growth to year 2025 using the traffic projections from the traffic
operations report for the Auxiliary Lane project. Time savings per trip were calculated using the
METRO Route 91X travel times as the baseline as shown in Table 5-15. The Interim Bus-on-
Shoulder options under Alternative 1 would provide the least travel time savings, however, the
time savings for all but Segment A are significant. The bus-on-shoulder Options A & B under
Alternative 2 would provide the greatest time savings as these options span a 5.3-mile distance as
compared to 4.0 miles for Alternative 3 – HOV Lanes. Buses would operate faster in the HOV lanes
but over a shorter distance than in Alternative 2.

Chapter 5 • Evaluation of Alternatives
5-29
Table 5-15: Estimated Travel Time Savings – Santa Cruz County
Alternatives
Peak Hour Travel Speeds and Time Savings per Trip
Travel Direction
& Shoulder
Length (mi)
Current Average Speed
on Freeway
(mph)
Current Average Transit Speed (Route
91X)
Opening Year 2025
Speed, without
Aux-iliary Lanes
Opening Year 2025
Speed, with
Auxiliary Lanes
Percent of Time Speed is less
than 35 mph
Average Transit
Minutes of
Travel on
Freeway
New Average Transit Speed
on Freeway
New Average Transit
Minutes of
Travel
Average Time
Savings on
Freeway
Average Time
Savings over
Existing Transit (91X)
1 Interim Southbound Bus-on-Shoulder
Segment A Soquel Avenue to 41st Avenue
SB/Right 0.9 10.6 11.8 N/A N/A 100% 5.1 20.6 2.6 2.5 2.0
Segment B
Capitola Avenue to State Park Drive
SB/Right 2.1 22.5 11.8 N/A N/A 100% 5.6 32.5 3.9 1.7 6.8
Segment C South Railroad Bridge to Freedom Blvd.
SB/Right 1.4 35.9 11.8 N/A N/A 97% 2.3 45.9 1.8 0.5 5.3
2 Bus on Right-Shoulder with Auxiliary Lanes
Option A Morrissey Blvd. to State Park Drive
NB/Right 5.3 29.0 11.8 20.5 37.0 NA 8.6 42.0 7.6 1.0 17.1
SB/Right 5.3 15.0 11.8 13.0 25.5 NA 12.5 30.5 10.4 2.0 7.9
Option B Morrissey Blvd. to State Park Drive
NB/Right 5.3 29.0 11.8 20.5 37.0 NA 8.6 47.0 6.8 1.8 17.9
SB/Right 5.3 15.0 11.8 13.0 25.5 NA 12.5 35.5 9.0 3.5 9.4
3 HOV Lane Project
Soquel Avenue to State Park Drive
NB/Left 4.0 20.0 11.8 20.5 37.0 N/A 6.5 65.0 3.7 2.8 11.2
SB/Left 4.0 20.0 11.8 13.0 25.5 N/A 9.4 65.0 3.7 5.7 14.1

Chapter 5 • Evaluation of Alternatives
5-30
Operating Costs
METRO provided the following cost information (see Table 5-16) for the amount and type of
transit services that would be operated on SR 1 in the study corridor if either bus-on-shoulder
operations or HOV lanes were available. In both cases the headways on the 91X would be reduced
to 15 minutes during peak periods and 30 minutes in the off peak and the other routes shown
represent new services using the freeway corridor, essentially extensions of METRO’s successful
Highway 17 Express Service to San Jose that would serve the mid-county and south-county areas
along SR 1.
Table 5-16: Operating Costs for Planned METRO Bus Services– Santa Cruz County
Route
Span
(in hours) Frequency
Trips per Day
Hours per Trip
Operating Cost per
Hour
Annual Operating
Cost
Frequency w/ Existing and
Proposed Service
Bus-on-Shoulder
91x 11.5 30min 42 0.75 $200 $1,606,500 N/A
91x Santa Cruz-Watsonville
6 30min 24 0.75 $200 $918,000 15 min
91x Santa Cruz-Watsonville
15 30min 60 0.75 $200 $990,000 30 min
Hwy 17 Mid County
6 30min 12 1.25 $200 $765,000 30 min
Total Existing Service Operating Costs $1,606,500
Total New Service Operating Costs $2,673,000
HOV Lanes
91x 11.5 30min 42 0.75 $200 $1,606,500 N/A
91x Santa Cruz-Watsonville
6 30min 24 0.75 $200 $918,000 15 min
91x Santa Cruz-Watsonville
15 30min 60 0.75 $200 $990,000 30 min
Hwy 17 South County
6 30min 12 1.5 $200 $918,000 30 min
Hwy 17 South County
13 1.5hrs 18 1.5 $200 $594,000 1.5hrs
Hwy 17 Mid County
6 30min 12 1.25 $200 $765,000 30min
Total Existing Service Operating Costs $1,606,500
Total New Service Operating Costs $4,185,000
The operating cost savings that could expected with each of the alternatives for existing METRO
Route 91x are shown in Table 5-17. Savings as high as 20-22 percent of the current operating
costs could be experienced with the bus-on-shoulder alternatives 2A and 2B.

Chapter 5 • Evaluation of Alternatives
5-31
Table 5-17: Transit Operating Cost Savings – Santa Cruz County
Alternatives
Annual Route 91X Operating Costs Savings
Peak Hour Time Savings
Per Trip (min.)
Total Minutes
Saved Annual Cost
Savings Percent Savings
1 Interim Southbound Bus-on-Shoulder
Segment A Soquel Avenue to 41st Avenue 2.0 7,688 $38,439 2%
Segment B Capitola Avenue to State Park Drive
6.8 26,645 $133,223 8%
Segment C South Railroad Bridge to Freedom Boulevard
5.3 20,713 $103,563 6%
2 Bus on Right-Shoulder with Auxiliary Lanes
Option A Hybrid-Auxiliary Lanes – Morrissey Blvd. to State Park Drive
12.5 48,718 $243,590 15%
Option B Bus-on-Shoulder – Morrissey Blvd. to State Park Drive
13.6 53,152 $265,762 17%
3 HOV Lane Project
Soquel Avenue to State Park Drive 7.1 27,549 $137,744 9%
Table 5-18 shows the incremental transit operating costs for each alternative as compared with
the No-Build (existing METRO Route 91X). The costs are similar for all the alternatives except for
Alternative 3 – HOV Lanes which had much more added service because of the higher investment
in infrastructure. The annual cost of facilities maintenance included the cost to maintain the
physical elements of new construction that are required to implement each alternative.
Table 5-18: Incremental Annual Operating Costs – Santa Cruz County
Alternative
Incremental Year 2025 Operating and Maintenance Costs
(millions $2018)
Route 91x Operating
Costs
Cost of Added Service
Total Transit
Operating Costs
Annual Facilities
Main-tenance
Costs
Total Annual Main-
tenance and Operating
Costs
Incre-mental Costs
Compared to No-Build
1 Interim Southbound Bus-on-Shoulder
Segment A
Soquel Avenue to 41st Avenue
$1.6 $2.7 $4.2 $0.1 $4.3 $2.7
Segment B
Capitola Avenue to State Park Drive
$1.5 $2.7 $4.1 $0.2 $4.3 $2.7
Segment C
South Railroad Bridge to Freedom Boulevard
$1.5 $2.7 $4.2 $0.1 $4.3 $2.7
2 Bus on Right-Shoulder with Auxiliary Lanes
Option A Hybrid-Auxiliary Lanes – Morrissey Blvd. to State Park Drive
$1.3 $2.7 $4.0 $0.1 $4.1 $2.5

Chapter 5 • Evaluation of Alternatives
5-32
Alternative
Incremental Year 2025 Operating and Maintenance Costs
(millions $2018)
Route 91x Operating
Costs
Cost of Added Service
Total Transit
Operating Costs
Annual Facilities
Main-tenance
Costs
Total Annual Main-
tenance and Operating
Costs
Incre-mental Costs
Compared to No-Build
Option B Bus-on-Shoulder – Morrissey Blvd. to State Park Drive
$1.3 $2.7 $3.9 $0.1 $4.0 $2.4
3 HOV Lane Project
Soquel Avenue to State Park Drive
$1.5 $4.2 $5.7 $15.0 $20.7 $19.1
Transit Reliability
METRO was not able to provide any information on the reliability of the existing Route 91X
service, however, given the known day-to-day variability in traffic speeds and travel times on
SR 1 it is likely that there are significant changes in transit running times which either require
slack to be built into the schedule or an acceptance of poor on-time performance.
Fleet Requirements
Table 5-19 shows the fleet requirements for each alternative as compared to the No-Build
Alternative (existing Route 91X service). Twelve new buses would be required for the bus-on-
shoulder Alternatives 1 and 2, and 27 new buses would be required to operate the service
planned for Alternative 3 – HOV Lanes.
Table 5-19: Incremental Fleet Requirements – Santa Cruz County
Alternative
Incremental Year 2025 Fleet Requirements
Buses Required
Spares @ 15% Total
Incremental Increase over No-
Build
1 Interim Southbound Bus-on-Shoulder
Segment A Soquel Avenue to 41st Avenue 13 2 15 12
Segment B Capitola Avenue to State Park Drive 13 2 15 12
Segment C South Railroad Bridge to Freedom Boulevard 13 2 15 12
2 Bus on Right-Shoulder with Auxiliary Lanes
Option A Morrissey Blvd. to State Park Drive 13 2 15 12
Option B Morrissey Blvd. to State Park Drive 13 2 15 12
3 HOV Lane Project
Soquel Avenue to State Park Drive 26 4 30 27

Chapter 5 • Evaluation of Alternatives
5-33
Potential Ridership
A quick response, sketch planning technique has been used to assess ridership potential for the
alternatives. This approach uses the existing corridor ridership as a basis and calculates potential
ridership increases based on the quality of the proposed future service. The model is sensitive to
regional growth in the corridor, travel time savings, improvements in reliability and increases in
service frequency. Elasticity factors were identified and applied. Elasticity refers to the observed
response in ridership to a change in a service quality factor such as travel time. For example, an
elasticity factor of -0.6 is often used to relate travel time savings to potential ridership growth.
This means that a 50 percent reduction in travel time would translate to a 30 percent increase in
ridership (50 percent times -0.6 = 30 percent). Table 5-20 shows the results of the ridership
analysis. Population and employment growth typically translate directly into increased transit
ridership, so an elasticity of 1.0 was used. In this case transit reliability and transit frequency
increase are major factors so an elasticity of one was also used. For Alternative 1 – Interim Bus-
on-Shoulder, Segments A & B were combined. These two segments are where the primary
congestion occurs and would likely generate the greatest ridership gains. The adjustment factors
are then multiplied times the existing ridership.

Chapter 5 • Evaluation of Alternatives
5-34
Table 5-20: Forecast Year 2025 Daily Ridership – Santa Cruz County
Notes:
Highlighted cells indicate that the alternative does provide travel time savings in that travel direction or that the alternative provides more travel time savings in that travel direction than in the other direction.
1See text for explanation of ridership growth factors and elasticity values.
2Represents existing highway with auxiliary lanes.
Alternatives Ridership Growth Factors*
Alternative Limits Segments
Existing Corridor Daily Ridership
Population/ Employment
Growth Factor
(Elasticity
= 1.0)1
Travel Time
Savings Factor
(Elasticity
= -0.6)1
Service Frequency Increase Factor
(Elasticity
= -0.5)1
Service Reliability
Factor
(Elasticity
= 1.0)1
Estimated Year 2025 Corridor Daily Ridership
Northbound AM Peak
(6-10 AM)
Southbound PM Peak
(3-7 PM)
Northbound AM Peak
(6-10 AM)
Southbound PM Peak
(3-7 PM)
Alternative 1 Soquel Avenue to State Park Drive
1A+1B 77 55 8% 35% 400% 50% 390 690
Alternative 2 (Option A)
Morrissey Blvd. to State Park Drive
N/A 77 55 8% 50% 400% 50% 1,100 1,050
Alternative 2 (Option B)
Morrissey Blvd. to State Park Drive
N/A 77 55 8% 55% 400% 50% 1,110 1,050
Alternative 3 Soquel Avenue to State Park Drive
N/A 77 55 8% 51% 650% 50% 1,490 1,470
No-Build Alternative2
Morrissey Blvd. to State Park Drive
N/A 77 55 8% 34% 0% 0% 220 120

Chapter 5 • Evaluation of Alternatives
5-35
Alternative 3, the HOV Lane project, would yield the greatest ridership; however, Alternatives 2A
and 2B would also yield high levels of ridership. Alternative 1 – Interim Bus-on-Shoulder yields
less ridership than the other alternatives, but still substantially more than the No-Build
Alternative.
Traffic Operations/Safety
As noted in Chapter 2, the safety record of bus-on-shoulder operations around the county is
excellent. Alternative 2A which involves buses transitioning from the auxiliary lane to a bus-on-
shoulder lane through the interchanges is a variation of bus-on-shoulder operations that has not
been tested. A pilot project at a single interchange might be a reasonable way to test the
operation of this concept when Phase I of the auxiliary lane program is implemented.
Vehicle Miles of Travel Reduction
One benefit of bus-on-shoulder operations or HOV lanes is that the transit services that use them
are fast enough to attract new riders to transit. Table 5-21 shows the vehicle miles of travel
reductions associated with each of the alternatives based on the new transit riders attracted as
compared with the No-Build Alternative. A vehicle occupancy of 1.1 persons per vehicle was
assumed and the average trip length was estimated to be 7 miles, the length of the corridor, as
most transit vehicle trips will be non-stop. All of the alternatives show a significant reduction in
vehicle miles of travel with the greatest reduction associated with the HOV Lanes - Alternative 3.
Table 5-21: Incremental Vehicle Miles of Travel Reduction – Santa Cruz County
Potential Environmental Impacts/Mitigations Required
This portion of the study relies heavily on the environmental research conducted as part of the
Santa Cruz Route 1 Tier I and Tier II Environmental Impact Report/ Environmental Assessment
Draft - November 2015. This document was prepared by the Santa Cruz County Regional
Transportation to examine the possibility of auxiliary lanes or HOV lanes on SR 1. Extensive
environmental research was conducted as part of this effort. Table 5-22 provides a summary of
the environmental review that was conducted for each of the alternatives. The key issues related
to each of the alternatives are as follows:
Alternative Annual Vehicle Miles of Travel (2025)
Alternative Limits
Estimated Annual Transit
Ridership
Estimated Vehicle Miles
of Travel Eliminated
Incremental Vehicle Miles of Travel Reduction
over No-Build
Alternative 1 Soquel Avenue to State Park Drive 810,000 5,154,500 3,531,800
Alternative 2 (Option A)
Morrissey Boulevard to State Park Drive 1,612,500 10,261,400 8,638,700
Alternative 2 (Option B)
Morrissey Boulevard to State Park Drive 1,620,000 10,309,100 8,686,400
Alternative 3 Soquel Avenue to State Park Drive 2,220,000 14,127,300 12,504,600
No-Build Alternative
Morrissey Boulevard to State Park Drive 255,000 1,622,700 - -

Chapter 5 • Evaluation of Alternatives
5-36
1. Interim Bus-on-Shoulder Southbound – This alternative involves minor widening of
the existing shoulder areas which could impact some sensitive biological habitat,
waterways and wetlands along the corridor. It would also alter the visual landscape.
2. Bus on Right-Shoulder with Auxiliary Lanes – The auxiliary lanes and new shoulders
that are essential for both Options A and B, are actually part of the No-Build Project. As
such, the impacts of these two variations of bus-on-shoulder are expected to be not-
significant.
3. HOV Lane Project – This alternative involves major widening of the freeway in order
to create the median HOV Lanes and provide the auxiliary lanes with adequate right-
side shoulders and could impact some sensitive biological habitat, waterways and
wetlands along the corridor. The need for new sound walls and/or retaining walls could
have visual impacts. Significant displacement of businesses and residential units is
involved. As the HOV lane would be open to carpools and other qualifying vehicles,
noise and vibration increases are likely.
4. No-Build – The No-Build Alternative does not directly address the lack of convenient
transit alternative to drive-alone auto travel in this corridor and is inconsistent with
plans and policies at the state and local level which call for increased transit use to
improve mobility and reduce greenhouse gas emissions.
It is important to note that all of the build alternatives will provide environmental benefits in
terms of diversion of existing auto trips to transit and the resulting reduction in vehicle miles
traveled, greenhouse gas emissions, and traffic related noise.

Chapter 5 • Evaluation of Alternatives
5-37
Table 5-22: Environmental Impact Review Summary – Santa Cruz County
Alternatives
1. Interim Bus-on-Shoulder Southbound
2. Bus on Right-Shoulder with Auxiliary Lanes
3. HOV Lane Project
4. No-Build Project
Impact
Soquel Avenue to State Park
Drive
A. Hybrid-Auxiliary Lanes
- Morrissey Blvd. to State
Park Drive
B. Bus-on-Shoulder -
Morrissey Blvd. to State Park
Drive
Soquel Avenue to State Park
Drive
Existing Highway with
Auxiliary Lanes - Morrissey
Blvd. to State Park Drive
Water Quality
Coastal Zone
Floodplain
Biology
Wetlands
Hazardous Materials
Parklands (4f)
Visual Impacts
Relocations
Traffic
Cultural Resources
Noise and Vibration
Air Quality
Consistency with Community Plans
Not Significant Possibly Significant Significant
Consistency with Current Plans and Policies
It was found that development of either bus-on-shoulder operations or HOV lanes on SR 1 in
Santa Cruz County is fully consistent with statewide, regional and local land use and
transportation plans and policies.
California Assembly Bill No. 946 which was passed in year 2013 authorizes the Monterey-Salinas
Transit District and the Santa Cruz Metropolitan Transit District to conduct a transit bus-only
program using the shoulders of certain state highways as transit bus-only traffic corridors,
subject to approval by the department (Caltrans) and the Department of the California Highway
Patrol. California Assembly Bill No. 1746, which is currently under consideration, states that
Monterey-Salinas Transit, the Santa Cruz Metropolitan Transit District and a number of other
transit operators:
…may conduct a transit bus-only program using the shoulders of certain highways in the
state highway system within the areas served by the transit services of each entity, with the
approval of the department and the Department of the California Highway Patrol. The

Chapter 5 • Evaluation of Alternatives
5-38
department, the Department of the California Highway Patrol, and each participating
transit entity shall jointly determine the segments of each highway where it is appropriate
to designate the shoulders as transit bus-only traffic corridors, based upon factors that shall
include, but are not limited to, right-of-way availability and capacity, peak congestion hours,
and the most heavily congested areas. Under the program, the participating transit entities
shall actively work with the department and the Department of the California Highway
Patrol to develop guidelines that ensure driver and vehicle safety and the integrity of the
infrastructure.
Caltrans is preparing updated guidelines for bus operations on highways and use of shoulder
areas. Bus-on-shoulder operations were successfully tested as part of a pilot program on SR 152
and I-805, so there is precedent for bus-on-shoulder operations on state highways.
The Metropolitan Transportation Plan (MTP) and its Sustainable Communities Strategy (SCS) will
be released by the Association of Monterey Bay Area Governments in 2018. It identifies Bus Rapid
Transit in the SR 1 corridor as part of the year 2040 transit network plan, it also references this
bus-on-shoulder and branch line study as an ongoing effort. This plan will replace the current
Metropolitan Transportation Plan (MTP) and its Sustainable Communities Strategy (SCS) which
was adopted in 2014.
The Santa Cruz County Regional Transportation Commission is conducting the Unified Corridor
Investment Study. The Unified Corridor Investment Study will examine which transportation
improvements work together to make the most effective use of the community’s north/south
transportation corridor including three parallel routes: Highway 1, Soquel/Freedom, and the
Santa Cruz Branch Rail Line right-of-way. The study is including both HOV Lanes and bus-on-
shoulder alternatives for the SR 1 corridor.
Funding Potential
Phase I of the Auxiliary Lanes project on SR 1 is funded under the Santa Cruz County Regional
Transportation Commission’s Measure D. It will complete the segment between 41st Avenue and
Soquel Drive. This does not include funding for a bus-on-shoulder or HOV lanes project. The
Unified Corridor Investment Study will identify possible sources of funding for projects but not a
detailed strategy for funding these projects.
Institutional Considerations
Any bus-on-shoulder project will need to be approved by both Caltrans and the California
Highway Patrol. Caltrans is in the process of developing guidelines for bus-on-shoulder
applications. These guidelines are likely to be very similar to those laid out in the Transit
Cooperative Research Program Report 151, which was the basis of the conceptual planning used
in this study.
Phasing of bus-on-shoulder improvements on SR 1 is an important consideration. While the
Interim Bus-on-Shoulder Alternative could yield near term benefits, it is critical that it not
interfere with the implementation of the auxiliary lane project. For example, a logical phasing
strategy would be to complete Phase 1 of the auxiliary lane project including either the
Alternative 2 Option A or B approach to bus-on-shoulder and the Segment B of the Interim Bus-
on-Shoulder Alternative. This would provide bus-on-shoulder southbound all the way to

Chapter 5 • Evaluation of Alternatives
5-39
State Park Drive. Then as subsequent phases of the auxiliary lane project proceed the
Alternative 2 Option A or B approach to bus-on-shoulder could be implemented at the same time
for each new segment.
Cost (Capital and Operations/Maintenance)
The costs of construction and project development have been prepared for each of the
alternatives. These costs are incremental or in excess of the costs of the No-Build Alternative. The
assumptions which were used to develop these costs are presented in Chapter 4. Table 5-23
presents the results of the cost analysis. It is assumed there would be no cost for use of the
Caltrans’ right-of-way. Soft costs include all the costs of environmental clearance, project
planning and design and construction management and oversight. Note that the costs for
Alternatives 1, 2A, and 2B do not include any costs for structure widening or replacement. It is
assumed that buses will bypass these locations using the general purpose freeway lanes.
Table 5-23: Incremental Capital Costs – Santa Cruz County
Cost-Effectiveness and Benefit-Cost Assessment
Benefit-cost analysis for project alternatives in Santa Cruz County was conducted based on the
same assumptions used for project alternatives in Monterey County. Results of the benefit-cost
analysis for the Santa Cruz County alternatives are provided in Table 5-24. The benefit-to-cost
ratio of the project alternatives would vary between 0.06 and 1.69. Due to the high construction
costs involved, Alternative 3 (HOV Project from Soquel Avenue to State Park Drive) is expected to
have the least benefit-to-cost ratio of 0.06, while Alternative 2 - Option A (Bus-on-Shoulder -
Auxiliary Lanes between Morrissey and Freedom Boulevards) would have the highest benefit-to-
cost ratio of about 1.69. This is because the costs of the auxiliary lane project which is actually
part of the No-Build Alternative, do not have to be included in the costs of Alternative 2 (either
Options A or B), but the full benefits of being able to use the widened shoulder which is part of the
auxiliary lane project will accrue to Alternative 2 – Options A & B.
Detailed calculations showing benefit-cost estimates are included in Appendix B.
Alternatives Year 2025 Capital Costs (millions of 2018 dollars)
Alternative Limits Segments Construction
Costs Right-
of-Way Vehicle Costs
Soft Costs Total
Alternative 1 Soquel Avenue to State Park Drive
1A+1B $6.0 $0.0 $5.9 $2.2 $14.1
Alternative 2 (Option A)
Morrissey Boulevard to State Park Drive
N/A $1.5 $0.0 $5.9 $0.5 $7.9
Alternative 2 (Option B)
Morrissey Boulevard to State Park Drive
N/A $1.7 $0.0 $5.9 $0.6 $8.2
Alternative 3 Soquel Avenue to State Park Drive
N/A $257.9 $0.0 $13.4 $92.8 $453.9
No-Build Alternative2
Morrissey Boulevard to State Park Drive
N/A $0.0 $0.0 $0.0 $0.0 $0.0

Chapter 5 • Evaluation of Alternatives
5-40
Table 5-24: Benefit-Cost Summary – Santa Cruz County
Alternative
Present Value of Costs
(2018 $ in millions) Present Value of Benefits (2018 $ in millions)
Benefit-to-Cost Ratio Segments Capital Costs
Operating Costs Total Costs
Travel Time Benefits
Operating Cost
Benefits
GHG Emissions’
Benefits Total
Benefits
1 Alternative 1 (Soquel Avenue to State Park Drive)
1A+1B $14.10 $8.10 $22.20 $1.38 $2.70 $0.39 $4.47 0.20
2 Alternative 2 - Option A (Morrissey Boulevard to Freedom Boulevard)
2A $7.86 $23.34 $31.94 $25.84 $14.60 $2.74 $43.18 1.38
3 Alternative 2 - Option B (Morrissey Boulevard to Freedom Boulevard)
2B $8.13 $20.75 $28.88 $30.03 $15.93 $2.75 $48.71 1.69
4 Alternative 3 (Morrissey Boulevard to State Park Drive)
3 $364.10 $293.96 $658.06 $29.63 $6.01 $3.94 $39.58 0.06

APPENDIX


APPENDIX A
COST ESTIMATES


MONTEREY BAY FEASIBILITY STUDY OF BUS OPERATIONS ON STATE ROUTE 1 SHOULDER AND MONTEREY
BRANCH LINE
Santa Cruz
Alternative 1 - Interim Bus on Shoulder Southbound
Segment A: Soquel Avenue to 41st Avenue
Segment B: Capitola Avenue to State Park Drive
Segment C: South Railroad Bridge to Freedom Boulevard
Alternative 2 - Bus on Right Shoulder with Auxilary Lanes
Option A: Hybrid-Auxiliary Lanes (Morrissey to State Park Drive)
Option B: Bus on Shoulder (Morrissey to State Park Dirve)
Alternative 3 - HOV Lane Project
HOV Lane Project from STA 98+70 to STA 168+25
Monterey
Segment I: Reservation Road to Del Monte Aenue (Sand City)
Option I-A - Southbound Bus on Shoulder
Option I-B - Monterey Branch Line Busway
Option I-C - Caltrans Bike/Pedestrian Trail
Segment II: Del Monte Avenue (Sand City) to SR 218
Option II-A - Southbound Bus on Shoulder
Option II-B - Monterey Branch Line Busway
Segment III: SR 218 to Monterey
Option III-A - BRT to English
Option III-B - Southbound Bus on Shoulder
Segment IV: Casa Verde to Fremont/Del Monte
Option IV-A - Bus on Shoulder Northbound (PM Peak)
$350,800,000
$2,300,000
June 26, 2018
Submittal:
DRAFT
$8,900,000
$600,000
$7,000,000
$6,600,000
$2,000,000
$4,100,000
$5,600,000
$2,700,000
Opinion of Probable Construction Costs
Project Name:
Monterey Bay Area Feasibility Study of Bus Operations on State Route 1 Shoulder and Monterey Branch Line
Comparison of Alternatives
Date of Preparation:
$18,800,000
$20,000,000
$19,300,000
$5,300,000
Estimate prepared by CDM Smith
Date: 6/26/2018

MONTEREY BAY AREA FEASIBILITY STUDY OF BUS OPERATIONS ON STATE ROUTE 1 SHOULDER AND
MONTEREY BRANCH LINE
Segment Details
4,500'
8'
2
1
1
0'
0'
0'
0
Item # Unit Quantity Unit Price Cost
1.0 LF 75 $6.50 $488
2.0 EA 2 $510 $1,020
3.0 EA 1 $1,750 $1,750
4.0 EA 9 $535 $4,815
5.0 ACRE 1 $85,400 $85,400
6.0 CY 4,806 $11.50 $55,269
7.0 CY 234 $3.70 $866
8.0 SQFT 51,840 $0.07 $3,629
9.0 CY 1,832 $175 $320,600
10.0 CY 1,071 $165 $176,715
11.0 TON 3,533 $87 $307,371
12.0 LF 0 $400 $0
13.0 LF 36 $1,250 $45,000
14.0 CY 0 $560 $0
15.0 CY 4 $1,950 $7,800
16.0 EA 18 $445 $8,010
17.0 EA 2 $6,750 $13,500
18.0 SF 0 $26 $0
19.0 EA 2 $220 $440
20.0 LF 75 $30 $2,250
21.0 LF 0 $100 $0
22.0 LF 4,500 $0.14 $630
23.0 EA 1 $500 $500
24.0 EA 0 $5,000 $0
25.0 EA 0 $600,000 $0
26.0 EA 0 $350,000 $0
27.0 EA 0 $200,000 $0
SUBTOTAL I (ALL OF ABOVE) $1,036,052
SW3P (3% OF SUBTOTAL I) $31,080 $31,080
TRAFFIC HANDLING (10% OF SUBTOTAL I) $103,610 $103,610
MISC. CONSTRUCTION COSTS (15% OF SUBTOTAL I) $155,410 $155,410
MAINTENANCE OF UTILITIES (3% OF SUBTOTAL I) $31,080 $31,080
SUBTOTAL II (MISCELLANOUS) $321,180
ROADSIDE SIGN - TWO POST
210430 HYDROSEED
Date of Preparation:
568056 RELOCATE SIGN STRUCTURE
498052 60" CAST-IN-DRILLED-HOLE CONCRETE PILE
Retaining Wall Length
Average Retaining Wall Height:
Sound Wall Length:
Catch Basins:
STRUCTURAL CONCRETE, RETAINING WALL
STRUCTURAL CONCRETE, DRAINAGE INLET
Light Pole:
152387
160103 CLEARING AND GRUBBING (ACRE)
490604
Overhead Signs:
Call Boxes:
Code Description
150827 REMOVE CATCH BASIN
150662 REMOVE METAL BEAM GUARD RAILING
190101 ROADWAY EXCAVATION
198010 IMPORTED BORROW (CY)
150668
June 26, 2018
Submittal:
DRAFT
Segment Length:
Average Existing Shoulder Width:
Opinion of Probable Construction Costs
Project Name:
Monterey Bay Area Feasibility Study of Bus Operations on State Route 1 Shoulder and Monterey Branch Line
Santa Cruz Alternative 1 - Interim Southbound Bus-on-Shoulder
Segment A: Soquel Avenue to 41st Avenue
REMOVE FLARED END SECTION
RELOCATE ROADSIDE SIGN-TWO POST
832006 MIDWEST GUARDRAIL SYSTEM (STEEL POST)
250201 CLASS 2 AGGREGATE SUBBASE
280000 LEAN CONCRETE BASE
390132 HOT MIX ASPHALT (TYPE A)
705001 STEEL FLARED END SECTION
510060
510094
582001 SOUND WALL (MASONRY BLOCK)
30" CAST-IN-DRILLED-HOLE CONCRETE PILE
566012
900005 MODIFY SIGNAL AND LIGHTING
840656 PAINT TRAFFIC STRIPE (2-COAT)
900001 RELOCATE CALL BOX
900004 SIGNAL AND LIGHTING
839701 CONCRETE BARRIER (TYPE 60)
900002 RELOCATE LIGHT POLE
900003 CUT AND COVER STRUCTURE
Estimate prepared by CDM Smith
Date: 6/26/2018

MONTEREY BAY AREA FEASIBILITY STUDY OF BUS OPERATIONS ON STATE ROUTE 1 SHOULDER AND
MONTEREY BRANCH LINE
MOBILIZATION (10% OF SUBTOTAL I & II) $135,720 $135,720
CONTINGENCIES (35% OF SUBTOTAL I & II) $476,000 $476,000
SUBTOTAL III (CONSTRUCTION) $1,969,000
LAND ACQUISITION $0 $0
SUBTOTAL IV (RIGHT-OF-WAY) $0
ENGINEERING STUDIES (3% OF SUBTOTAL III) $59,000 $59,000
ENVIRONMENTAL (3% OF SUBTOTAL III) $59,000 $59,000
DESIGN ENGINEERING AND CONSTRUCTION SUPPORT (17% OF SUBTOTAL III) $335,000 $335,000
CONSTRUCTION MANAGEMENT (13% OF SUBTOTAL III) $256,000 $256,000
SUBTOTAL V (SOFT COSTS) $709,000
PROJECT TOTAL $2,678,000
Estimate prepared by CDM Smith
Date: 6/26/2018

MONTEREY BAY AREA FEASIBILITY STUDY OF BUS OPERATIONS ON STATE ROUTE 1 SHOULDER AND
MONTEREY BRANCH LINE
Segment Details
11,000'
10'
0
0
0
0'
0'
0'
0
Item # Unit Quantity Unit Price Cost
1.0 LF 0 $6.50 $0
2.0 EA 0 $510 $0
3.0 EA 0 $1,750 $0
4.0 EA 22 $535 $11,770
5.0 ACRE 0 $85,400 $0
6.0 CY 11,946 $11.50 $137,379
7.0 CY 0 $3.70 $0
8.0 SQFT 0 $0.07 $0
9.0 CY 4,477 $175 $783,475
10.0 CY 2,618 $165 $431,970
11.0 TON 8,635 $87 $751,245
12.0 LF 0 $400 $0
13.0 LF 0 $1,250 $0
14.0 CY 0 $560 $0
15.0 CY 0 $620 $0
16.0 CY 0 $1,950 $0
17.0 EA 44 $445 $19,580
18.0 EA 0 $6,750 $0
19.0 EA 0 $220 $0
20.0 LF 0 $30 $0
21.0 LF 0 $100 $0
22.0 LF 11,000 $0.14 $1,540
23.0 EA 0 $500 $0
24.0 EA 0 $5,000 $0
25.0 EA 0 $600,000 $0
26.0 EA 0 $350,000 $0
27.0 EA 0 $200,000 $0
SUBTOTAL I (ALL OF ABOVE) $2,136,959
SW3P (3% OF SUBTOTAL I) $64,110 $64,110
TRAFFIC HANDLING (10% OF SUBTOTAL I) $213,700 $213,700
MISC. CONSTRUCTION COSTS (15% OF SUBTOTAL I) $320,540 $320,540
MAINTENANCE OF UTILITIES (3% OF SUBTOTAL I) $64,110 $64,110
SUBTOTAL II (MISCELLANOUS) $662,460
832006 MIDWEST GUARDRAIL SYSTEM (STEEL POST)
900001 RELOCATE CALL BOX
900005 MODIFY SIGNAL AND LIGHTING
840656 PAINT TRAFFIC STRIPE (2-COAT)
839701 CONCRETE BARRIER (TYPE 60)
900002 RELOCATE LIGHT POLE
900003 CUT AND COVER STRUCTURE
900004 SIGNAL AND LIGHTING
568056 RELOCATE SIGN STRUCTURE
705001 STEEL FLARED END SECTION
510094 STRUCTURAL CONCRETE, DRAINAGE INLET
566012 ROADSIDE SIGN - TWO POST
498052 60" CAST-IN-DRILLED-HOLE CONCRETE PILE
510060 STRUCTURAL CONCRETE, RETAINING WALL
510061 STRUCTURAL CONCRETE, SOUND WALL
280000 LEAN CONCRETE BASE
390132 HOT MIX ASPHALT (TYPE A)
490604 30" CAST-IN-DRILLED-HOLE CONCRETE PILE
198010 IMPORTED BORROW (CY)
210430 HYDROSEED
250201 CLASS 2 AGGREGATE SUBBASE
160103 CLEARING AND GRUBBING (ACRE)
190101 ROADWAY EXCAVATION
150827 REMOVE CATCH BASIN
152387 RELOCATE ROADSIDE SIGN-TWO POST
Code Description
150662 REMOVE METAL BEAM GUARD RAILING
150668 REMOVE FLARED END SECTION
Light Pole:
June 26, 2018
Submittal:
DRAFT
Segment Length:
Average Existing Shoulder Width:
Overhead Signs:
Call Boxes:
Catch Basins:
Retaining Wall Length
Average Retaining Wall Height:
Sound Wall Length:
Date of Preparation:
Opinion of Probable Construction Costs
Project Name:
Monterey Bay Area Feasibility Study of Bus Operations on State Route 1 Shoulder and Monterey Branch Line
Santa Cruz Alternative 1 - Interim Southbound Bus-on-Shoulder
Segment B: Capitola Avenue to State Park Drive
Estimate prepared by CDM Smith
Date: 6/26/2018

MONTEREY BAY AREA FEASIBILITY STUDY OF BUS OPERATIONS ON STATE ROUTE 1 SHOULDER AND
MONTEREY BRANCH LINE
MOBILIZATION (10% OF SUBTOTAL I & II) $279,940 $279,940
CONTINGENCIES (35% OF SUBTOTAL I & II) $980,000 $980,000
SUBTOTAL III (CONSTRUCTION) $4,059,400
LAND ACQUISITION $0 $0
SUBTOTAL IV (RIGHT-OF-WAY) $0
ENGINEERING STUDIES (3% OF SUBTOTAL III) $122,000 $122,000
ENVIRONMENTAL (3% OF SUBTOTAL III) $122,000 $122,000
DESIGN ENGINEERING AND CONSTRUCTION SUPPORT (17% OF SUBTOTAL III) $690,000 $690,000
CONSTRUCTION MANAGEMENT (13% OF SUBTOTAL III) $528,000 $528,000
SUBTOTAL V (SOFT COSTS) $1,462,000
PROJECT TOTAL $5,522,000
Estimate prepared by CDM Smith
Date: 6/26/2018

MONTEREY BAY AREA FEASIBILITY STUDY OF BUS OPERATIONS ON STATE ROUTE 1 SHOULDER AND
MONTEREY BRANCH LINE
Segment Details
6,000'
8'
0
0
0
1250'
8'
0'
0
Item # Unit Quantity Unit Price Cost
1.0 LF 0 $6.50 $0
2.0 EA 0 $510 $0
3.0 EA 0 $1,750 $0
4.0 EA 12 $535 $6,420
5.0 ACRE 2 $85,400 $170,800
6.0 CY 6,408 $11.50 $73,692
7.0 CY 312 $3.70 $1,154
8.0 SQFT 69,120 $0.07 $4,838
9.0 CY 2,442 $175 $427,350
10.0 CY 1,428 $165 $235,620
11.0 TON 4,710 $87 $409,770
12.0 LF 0 $400 $0
13.0 LF 0 $1,250 $0
14.0 CY 371 $560 $207,760
15.0 CY 0 $620 $0
16.0 CY 0 $1,950 $0
17.0 EA 24 $445 $10,680
18.0 EA 0 $6,750 $0
19.0 EA 0 $220 $0
20.0 LF 0 $30 $0
21.0 LF 0 $100 $0
22.0 LF 6,000 $0.14 $840
23.0 EA 0 $500 $0
24.0 EA 0 $5,000 $0
25.0 EA 0 $600,000 $0
26.0 EA 0 $350,000 $0
27.0 EA 0 $200,000 $0
SUBTOTAL I (ALL OF ABOVE) $1,548,925
SW3P (3% OF SUBTOTAL I) $46,470 $46,470
TRAFFIC HANDLING (10% OF SUBTOTAL I) $154,890 $154,890
MISC. CONSTRUCTION COSTS (15% OF SUBTOTAL I) $232,340 $232,340
MAINTENANCE OF UTILITIES (3% OF SUBTOTAL I) $46,470 $46,470
SUBTOTAL II (MISCELLANOUS) $480,170
832006 MIDWEST GUARDRAIL SYSTEM (STEEL POST)
900001 RELOCATE CALL BOX
900005 MODIFY SIGNAL AND LIGHTING
840656 PAINT TRAFFIC STRIPE (2-COAT)
839701 CONCRETE BARRIER (TYPE 60)
900002 RELOCATE LIGHT POLE
900003 CUT AND COVER STRUCTURE
900004 SIGNAL AND LIGHTING
568056 RELOCATE SIGN STRUCTURE
705001 STEEL FLARED END SECTION
510094 STRUCTURAL CONCRETE, DRAINAGE INLET
566012 ROADSIDE SIGN - TWO POST
498052 60" CAST-IN-DRILLED-HOLE CONCRETE PILE
510060 STRUCTURAL CONCRETE, RETAINING WALL
510061 STRUCTURAL CONCRETE, SOUND WALL
280000 LEAN CONCRETE BASE
390132 HOT MIX ASPHALT (TYPE A)
490604 30" CAST-IN-DRILLED-HOLE CONCRETE PILE
198010 IMPORTED BORROW (CY)
210430 HYDROSEED
250201 CLASS 2 AGGREGATE SUBBASE
160103 CLEARING AND GRUBBING (ACRE)
190101 ROADWAY EXCAVATION
150827 REMOVE CATCH BASIN
152387 RELOCATE ROADSIDE SIGN-TWO POST
Code Description
150662 REMOVE METAL BEAM GUARD RAILING
150668 REMOVE FLARED END SECTION
Light Pole:
June 26, 2018
Submittal:
DRAFT
Segment Length:
Average Existing Shoulder Width:
Overhead Signs:
Call Boxes:
Catch Basins:
Retaining Wall Length
Average Retaining Wall Height:
Sound Wall Length:
Date of Preparation:
Opinion of Probable Construction Costs
Project Name:
Monterey Bay Area Feasibility Study of Bus Operations on State Route 1 Shoulder and Monterey Branch Line
Santa Cruz Alternative 1 - Interim Southbound Bus-on-Shoulder
Segment C: South Railroad Bridge to Freedom Boulevard
Estimate prepared by CDM Smith
Date: 6/26/2018

MONTEREY BAY AREA FEASIBILITY STUDY OF BUS OPERATIONS ON STATE ROUTE 1 SHOULDER AND
MONTEREY BRANCH LINE
MOBILIZATION (10% OF SUBTOTAL I & II) $202,910 $202,910
CONTINGENCIES (35% OF SUBTOTAL I & II) $711,000 $711,000
SUBTOTAL III (CONSTRUCTION) $2,943,100
LAND ACQUISITION $0 $0
SUBTOTAL IV (RIGHT-OF-WAY) $0
ENGINEERING STUDIES (3% OF SUBTOTAL III) $88,000 $88,000
ENVIRONMENTAL (3% OF SUBTOTAL III) $88,000 $88,000
DESIGN ENGINEERING AND CONSTRUCTION SUPPORT (17% OF SUBTOTAL III) $500,000 $500,000
CONSTRUCTION MANAGEMENT (13% OF SUBTOTAL III) $383,000 $383,000
SUBTOTAL V (SOFT COSTS) $1,059,000
PROJECT TOTAL $4,003,000
Estimate prepared by CDM Smith
Date: 6/26/2018

MONTEREY BAY AREA FEASIBILITY STUDY OF BUS OPERATIONS ON STATE ROUTE 1 SHOULDER AND
MONTEREY BRANCH LINE
Segment Details
10,150'
8'
0
0
0
0'
0'
0'
0
Item # Unit Quantity Unit Price Cost
1.0 LF 0 $6.50 $0
2.0 EA 0 $510 $0
3.0 EA 0 $1,750 $0
4.0 EA 21 $535 $11,235
5.0 ACRE 1 $85,400 $85,400
6.0 CY 3,578 $11.50 $41,142
7.0 CY 174 $3.70 $645
8.0 SQFT 38,586 $0.07 $2,701
9.0 CY 1,364 $175 $238,623
10.0 CY 797 $165 $131,551
11.0 TON 2,629 $87 $228,761
12.0 LF 0 $400 $0
13.0 LF 0 $1,250 $0
14.0 CY 0 $560 $0
15.0 CY 0 $620 $0
16.0 CY 0 $1,950 $0
17.0 EA 41 $445 $18,245
18.0 EA 0 $6,750 $0
19.0 EA 0 $220 $0
20.0 LF 0 $30 $0
21.0 LF 0 $100 $0
22.0 LF 10,150 $0.14 $1,421
23.0 EA 0 $500 $0
24.0 EA 0 $5,000 $0
25.0 EA 0 $600,000 $0
26.0 EA 0 $350,000 $0
27.0 EA 0 $200,000 $0
SUBTOTAL I (ALL OF ABOVE) $759,724
SW3P (3% OF SUBTOTAL I) $22,790 $22,790
TRAFFIC HANDLING (10% OF SUBTOTAL I) $75,970 $75,970
MISC. CONSTRUCTION COSTS (15% OF SUBTOTAL I) $113,960 $113,960
MAINTENANCE OF UTILITIES (3% OF SUBTOTAL I) $22,790 $22,790
SUBTOTAL II (MISCELLANOUS) $235,510
832006 MIDWEST GUARDRAIL SYSTEM (STEEL POST)
900001 RELOCATE CALL BOX
900005 MODIFY SIGNAL AND LIGHTING
840656 PAINT TRAFFIC STRIPE (2-COAT)
839701 CONCRETE BARRIER (TYPE 60)
900002 RELOCATE LIGHT POLE
900003 CUT AND COVER STRUCTURE
900004 SIGNAL AND LIGHTING
568056 RELOCATE SIGN STRUCTURE
705001 STEEL FLARED END SECTION
510094 STRUCTURAL CONCRETE, DRAINAGE INLET
566012 ROADSIDE SIGN - TWO POST
498052 60" CAST-IN-DRILLED-HOLE CONCRETE PILE
510060 STRUCTURAL CONCRETE, RETAINING WALL
510061 STRUCTURAL CONCRETE, SOUND WALL
280000 LEAN CONCRETE BASE
390132 HOT MIX ASPHALT (TYPE A)
490604 30" CAST-IN-DRILLED-HOLE CONCRETE PILE
198010 IMPORTED BORROW (CY)
210430 HYDROSEED
250201 CLASS 2 AGGREGATE SUBBASE
160103 CLEARING AND GRUBBING (ACRE)
190101 ROADWAY EXCAVATION
150827 REMOVE CATCH BASIN
152387 RELOCATE ROADSIDE SIGN-TWO POST
Code Description
150662 REMOVE METAL BEAM GUARD RAILING
150668 REMOVE FLARED END SECTION
Light Pole:
June 26, 2018
Submittal:
DRAFT
Segment Length:
Average Existing Shoulder Width:
Overhead Signs:
Call Boxes:
Catch Basins:
Retaining Wall Length
Average Retaining Wall Height:
Sound Wall Length:
Date of Preparation:
Opinion of Probable Construction Costs
Project Name:
Monterey Bay Area Feasibility Study of Bus Operations on State Route 1 Shoulder and Monterey Branch Line
Santa Cruz Alternative 2 - Bus-on-Shoulder with Auxiliary Lanes
Option A: Hybrid-Auxiliary Lanes (Morrissey to State Park Drive)
Estimate prepared by CDM Smith
Date: 6/26/2018

MONTEREY BAY AREA FEASIBILITY STUDY OF BUS OPERATIONS ON STATE ROUTE 1 SHOULDER AND
MONTEREY BRANCH LINE
MOBILIZATION (10% OF SUBTOTAL I & II) $99,520 $99,520
CONTINGENCIES (35% OF SUBTOTAL I & II) $349,000 $349,000
SUBTOTAL III (CONSTRUCTION) $1,443,800
LAND ACQUISITION $0 $0
SUBTOTAL IV (RIGHT-OF-WAY) $0
ENGINEERING STUDIES (3% OF SUBTOTAL III) $43,000 $43,000
ENVIRONMENTAL (3% OF SUBTOTAL III) $43,000 $43,000
DESIGN ENGINEERING AND CONSTRUCTION SUPPORT (17% OF SUBTOTAL III) $245,000 $245,000
CONSTRUCTION MANAGEMENT (13% OF SUBTOTAL III) $188,000 $188,000
SUBTOTAL V (SOFT COSTS) $519,000
PROJECT TOTAL $1,963,000
Estimate prepared by CDM Smith
Date: 6/26/2018

MONTEREY BAY AREA FEASIBILITY STUDY OF BUS OPERATIONS ON STATE ROUTE 1 SHOULDER AND
MONTEREY BRANCH LINE
Segment Details
42,700'
7'
0
0
0
200'
2'
0'
0
Item # Unit Quantity Unit Price Cost
1.0 LF 0 $6.50 $0
2.0 EA 0 $510 $0
3.0 EA 0 $1,750 $0
4.0 EA 86 $535 $46,010
5.0 ACRE 1 $85,400 $85,400
6.0 CY 3,578 $11.50 $41,142
7.0 CY 174 $3.70 $645
8.0 SQFT 38,586 $0.07 $2,701
9.0 CY 1,364 $175 $238,623
10.0 CY 797 $165 $131,551
11.0 TON 2,629 $87 $228,761
12.0 LF 0 $400 $0
13.0 LF 0 $1,250 $0
14.0 CY 15 $560 $8,400
15.0 CY 0 $620 $0
16.0 CY 0 $1,950 $0
17.0 EA 171 $445 $76,095
18.0 EA 0 $6,750 $0
19.0 EA 0 $220 $0
20.0 LF 0 $30 $0
21.0 LF 0 $100 $0
22.0 LF 42,700 $0.14 $5,978
23.0 EA 0 $500 $0
24.0 EA 0 $5,000 $0
25.0 EA 0 $600,000 $0
26.0 EA 0 $350,000 $0
27.0 EA 0 $200,000 $0
SUBTOTAL I (ALL OF ABOVE) $865,306
SW3P (3% OF SUBTOTAL I) $25,960 $25,960
TRAFFIC HANDLING (10% OF SUBTOTAL I) $86,530 $86,530
MISC. CONSTRUCTION COSTS (15% OF SUBTOTAL I) $129,800 $129,800
MAINTENANCE OF UTILITIES (3% OF SUBTOTAL I) $25,960 $25,960
SUBTOTAL II (MISCELLANOUS) $268,250
900005 MODIFY SIGNAL AND LIGHTING
900002 RELOCATE LIGHT POLE
900003 CUT AND COVER STRUCTURE
900004 SIGNAL AND LIGHTING
839701 CONCRETE BARRIER (TYPE 60)
840656 PAINT TRAFFIC STRIPE (2-COAT)
900001 RELOCATE CALL BOX
568056 RELOCATE SIGN STRUCTURE
705001 STEEL FLARED END SECTION
832006 MIDWEST GUARDRAIL SYSTEM (STEEL POST)
510061 STRUCTURAL CONCRETE, SOUND WALL
510094 STRUCTURAL CONCRETE, DRAINAGE INLET
566012 ROADSIDE SIGN - TWO POST
490604 30" CAST-IN-DRILLED-HOLE CONCRETE PILE
498052 60" CAST-IN-DRILLED-HOLE CONCRETE PILE
510060 STRUCTURAL CONCRETE, RETAINING WALL
250201 CLASS 2 AGGREGATE SUBBASE
280000 LEAN CONCRETE BASE
390132 HOT MIX ASPHALT (TYPE A)
190101 ROADWAY EXCAVATION
198010 IMPORTED BORROW (CY)
210430 HYDROSEED
150827 REMOVE CATCH BASIN
152387 RELOCATE ROADSIDE SIGN-TWO POST
160103 CLEARING AND GRUBBING (ACRE)
Code Description
150662 REMOVE METAL BEAM GUARD RAILING
150668 REMOVE FLARED END SECTION
Call Boxes:
Catch Basins:
Retaining Wall Length
Average Retaining Wall Height:
Sound Wall Length:
Light Pole:
June 26, 2018
Submittal:
DRAFT
Segment Length:
Average Existing Shoulder Width:
Overhead Signs:
Opinion of Probable Construction Costs
Project Name:
Monterey Bay Area Feasibility Study of Bus Operations on State Route 1 Shoulder and Monterey Branch Line
Santa Cruz Alternative 2 - Bus-on-Shoulder with Auxiliary Lanes
Option B: Bus on Shoulder (Morrissey to State Park Drive)
Date of Preparation:
Estimate prepared by CDM Smith
Date: 6/26/2018

MONTEREY BAY AREA FEASIBILITY STUDY OF BUS OPERATIONS ON STATE ROUTE 1 SHOULDER AND
MONTEREY BRANCH LINE
MOBILIZATION (10% OF SUBTOTAL I & II) $113,360 $113,360
CONTINGENCIES (35% OF SUBTOTAL I & II) $397,000 $397,000
SUBTOTAL III (CONSTRUCTION) $1,644,000
LAND ACQUISITION $0 $0
SUBTOTAL IV (RIGHT-OF-WAY) $0
ENGINEERING STUDIES (3% OF SUBTOTAL III) $49,000 $49,000
ENVIRONMENTAL (3% OF SUBTOTAL III) $49,000 $49,000
DESIGN ENGINEERING AND CONSTRUCTION SUPPORT (17% OF SUBTOTAL III) $279,000 $279,000
CONSTRUCTION MANAGEMENT (13% OF SUBTOTAL III) $214,000 $214,000
SUBTOTAL V (SOFT COSTS) $591,000
PROJECT TOTAL $2,235,000
Estimate prepared by CDM Smith
Date: 6/26/2018

MONTEREY BAY AREA FEASIBILITY STUDY OF BUS OPERATIONS ON STATE ROUTE 1 SHOULDER AND
MONTEREY BRANCH LINE
Segment Details
29,500'
8'
0
2
0
6000'
2'
0'
0
Item # Unit Quantity Unit Price Cost
1.0 LF 8,600 $6.50 $55,900
2.0 EA 2 $510 $1,020
3.0 EA 0 $1,750 $0
4.0 EA 59 $535 $31,565
5.0 ACRE 6 $85,400 $512,400
6.0 CY 31,506 $11.50 $362,319
7.0 CY 1,534 $3.70 $5,676
8.0 SQFT 339,840 $0.07 $23,789
9.0 CY 12,007 $175 $2,101,225
10.0 CY 7,021 $165 $1,158,465
11.0 TON 23,158 $87 $2,014,746
12.0 LF 0 $400 $0
13.0 LF 0 $1,250 $0
14.0 CY 445 $560 $249,200
15.0 CY 0 $620 $0
16.0 CY 0 $1,950 $0
17.0 EA 118 $445 $52,510
18.0 EA 0 $6,750 $0
19.0 EA 1 $220 $220
20.0 LF 2,400 $30 $72,000
21.0 LF 6,000 $100 $600,000
22.0 LF 29,500 $0.14 $4,130
23.0 EA 2 $500 $1,000
24.0 EA 0 $5,000 $0
25.0 EA 0 $600,000 $0
26.0 EA 0 $350,000 $0
27.0 EA 0 $200,000 $0
SUBTOTAL I (ALL OF ABOVE) $7,246,165
SW3P (3% OF SUBTOTAL I) $217,380 $217,380
TRAFFIC HANDLING (10% OF SUBTOTAL I) $724,620 $724,620
MISC. CONSTRUCTION COSTS (15% OF SUBTOTAL I) $1,086,920 $1,086,920
MAINTENANCE OF UTILITIES (3% OF SUBTOTAL I) $217,380 $217,380
SUBTOTAL II (MISCELLANOUS) $2,246,300
Date of Preparation:
839701 CONCRETE BARRIER (TYPE 60)
Opinion of Probable Construction Costs
Project Name:
Monterey Bay Area Feasibility Study of Bus Operations on State Route 1 Shoulder and Monterey Branch Line
Monterey Segment I: Reservation Road to Fremont Boulevard (Sand City)
Monterey Option I-A - Southbound Bus-on-Shoulder
Light Pole:
June 26, 2018
Submittal:
DRAFT
Segment Length:
Average Existing Shoulder Width:
Overhead Signs:
Call Boxes:
Catch Basins:
Retaining Wall Length
Average Retaining Wall Height:
Sound Wall Length:
Code Description
150662 REMOVE METAL BEAM GUARD RAILING
150668 REMOVE FLARED END SECTION
150827 REMOVE CATCH BASIN
152387 RELOCATE ROADSIDE SIGN-TWO POST
160103 CLEARING AND GRUBBING (ACRE)
190101 ROADWAY EXCAVATION
198010 IMPORTED BORROW (CY)
210430 HYDROSEED
250201 CLASS 2 AGGREGATE SUBBASE
280000 LEAN CONCRETE BASE
390132 HOT MIX ASPHALT (TYPE A)
490604 30" CAST-IN-DRILLED-HOLE CONCRETE PILE
498052 60" CAST-IN-DRILLED-HOLE CONCRETE PILE
510060 STRUCTURAL CONCRETE, RETAINING WALL
510061 STRUCTURAL CONCRETE, SOUND WALL
510094 STRUCTURAL CONCRETE, DRAINAGE INLET
566012 ROADSIDE SIGN - TWO POST
568056 RELOCATE SIGN STRUCTURE
705001 STEEL FLARED END SECTION
900005 MODIFY SIGNAL AND LIGHTING
832006 MIDWEST GUARDRAIL SYSTEM (STEEL POST)
840656 PAINT TRAFFIC STRIPE (2-COAT)
900001 RELOCATE CALL BOX
900002 RELOCATE LIGHT POLE
900003 CUT AND COVER STRUCTURE
900004 SIGNAL AND LIGHTING
Estimate prepared by CDM Smith
Date: 6/26/2018

MONTEREY BAY AREA FEASIBILITY STUDY OF BUS OPERATIONS ON STATE ROUTE 1 SHOULDER AND
MONTEREY BRANCH LINE
MOBILIZATION (10% OF SUBTOTAL I & II) $949,250 $949,250
CONTINGENCIES (35% OF SUBTOTAL I & II) $3,323,000 $3,323,000
SUBTOTAL III (CONSTRUCTION) $13,764,800
LAND ACQUISITION $0 $0
SUBTOTAL IV (RIGHT-OF-WAY) $0
ENGINEERING STUDIES (3% OF SUBTOTAL III) $413,000 $413,000
ENVIRONMENTAL (3% OF SUBTOTAL III) $413,000 $413,000
DESIGN ENGINEERING AND CONSTRUCTION SUPPORT (17% OF SUBTOTAL III) $2,340,000 $2,340,000
CONSTRUCTION MANAGEMENT (13% OF SUBTOTAL III) $1,789,000 $1,789,000
SUBTOTAL V (SOFT COSTS) $4,955,000
PROJECT TOTAL $18,720,000
Estimate prepared by CDM Smith
Date: 6/26/2018

MONTEREY BAY AREA FEASIBILITY STUDY OF BUS OPERATIONS ON STATE ROUTE 1 SHOULDER AND
MONTEREY BRANCH LINE
Segment Details
27,000'
MBL
0
0
0
0'
0'
0'
0
Item # Unit Quantity Unit Price Cost
1.0 LF 0 $6.50 $0
2.0 EA 0 $510 $0
3.0 EA 0 $1,750 $0
4.0 EA 0 $535 $0
5.0 ACRE 21 $85,400 $1,793,400
6.0 CY 11,610 $11.50 $133,515
7.0 CY 15,795 $3.70 $58,442
8.0 SQFT 368,658 $0.07 $25,806
9.0 CY 13,176 $175 $2,305,800
10.0 CY 7,695 $165 $1,269,675
11.0 TON 29,376 $87 $2,555,712
12.0 LF 0 $400 $0
13.0 LF 0 $1,250 $0
14.0 CY 0 $560 $0
15.0 CY 0 $620 $0
16.0 CY 0 $1,950 $0
17.0 EA 0 $445 $0
18.0 EA 0 $6,750 $0
19.0 EA 0 $220 $0
20.0 LF 0 $30 $0
21.0 LF 0 $100 $0
22.0 LF 54,000 $0.14 $7,560
23.0 EA 0 $500 $0
24.0 EA 0 $5,000 $0
25.0 EA 0 $600,000 $0
26.0 EA 0 $350,000 $0
27.0 EA 0 $200,000 $0
SUBTOTAL I (ALL OF ABOVE) $8,149,910
SW3P (3% OF SUBTOTAL I) $244,500 $244,500
DRAINAGE (5% OF SUBTOTAL I) $407,500 $407,500
MISC. CONSTRUCTION COSTS (15% OF SUBTOTAL I) $1,222,490 $1,222,490
MAINTENANCE OF UTILITIES (3% OF SUBTOTAL I) $244,500 $244,500
SUBTOTAL II (MISCELLANOUS) $2,118,990
Date of Preparation:
Opinion of Probable Construction Costs
Project Name:
Monterey Bay Area Feasibility Study of Bus Operations on State Route 1 Shoulder and Monterey Branch Line
Monterey Segment I: Reservation Road to Fremont Boulevard (Sand City)
Monterey Option I-B - Monterey Branch Line Busway
Light Pole:
June 26, 2018
Submittal:
DRAFT
Segment Length:
Configuration:
Overhead Signs:
Call Boxes:
Catch Basins:
Retaining Wall Length
Average Retaining Wall Height:
Sound Wall Length:
Code Description
150662 REMOVE METAL BEAM GUARD RAILING
150668 REMOVE FLARED END SECTION
150827 REMOVE CATCH BASIN
152387 RELOCATE ROADSIDE SIGN-TWO POST
160103 CLEARING AND GRUBBING (ACRE)
190101 ROADWAY EXCAVATION
198010 IMPORTED BORROW (CY)
210430 HYDROSEED
250201 CLASS 2 AGGREGATE SUBBASE
280000 LEAN CONCRETE BASE
390132 HOT MIX ASPHALT (TYPE A)
568056 RELOCATE SIGN STRUCTURE
705001 STEEL FLARED END SECTION
490604 30" CAST-IN-DRILLED-HOLE CONCRETE PILE
498052 60" CAST-IN-DRILLED-HOLE CONCRETE PILE
510060 STRUCTURAL CONCRETE, RETAINING WALL
510061 STRUCTURAL CONCRETE, SOUND WALL
510094 STRUCTURAL CONCRETE, DRAINAGE INLET
566012 ROADSIDE SIGN - TWO POST
900005 MODIFY SIGNAL AND LIGHTING
832006 MIDWEST GUARDRAIL SYSTEM (STEEL POST)
840656 PAINT TRAFFIC STRIPE (2-COAT)
900001 RELOCATE CALL BOX
839701 CONCRETE BARRIER (TYPE 60)
900002 RELOCATE LIGHT POLE
900003 CUT AND COVER STRUCTURE
900004 SIGNAL AND LIGHTING
Estimate prepared by CDM Smith
Date: 6/26/2018

MONTEREY BAY AREA FEASIBILITY STUDY OF BUS OPERATIONS ON STATE ROUTE 1 SHOULDER AND
MONTEREY BRANCH LINE
MOBILIZATION (10% OF SUBTOTAL I & II) $1,026,890 $1,026,890
CONTINGENCIES (35% OF SUBTOTAL I & II) $3,595,000 $3,595,000
SUBTOTAL III (CONSTRUCTION) $14,890,800
LAND ACQUISITION $0 $0
SUBTOTAL IV (RIGHT-OF-WAY) $0
ENGINEERING STUDIES(3% OF SUBTOTAL III) $447,000 $447,000
ENVIRONMENTAL (3% OF SUBTOTAL III) $447,000 $447,000
DESIGN ENGINEERING AND CONSTRUCTION SUPPORT (15% OF SUBTOTAL III) $2,234,000 $2,234,000
CONSTRUCTION MANAGEMENT (13% OF SUBTOTAL III) $1,936,000 $1,936,000
SUBTOTAL V (SOFT COSTS) $5,064,000
PROJECT TOTAL $19,955,000
Estimate prepared by CDM Smith
Date: 6/26/2018

MONTEREY BAY AREA FEASIBILITY STUDY OF BUS OPERATIONS ON STATE ROUTE 1 SHOULDER AND
MONTEREY BRANCH LINE
Segment Details
27,000'
CBP
0
0
0
0'
0'
0'
0
Item # Unit Quantity Unit Price Cost
1.0 LF 0 $6.50 $0
2.0 EA 0 $510 $0
3.0 EA 0 $1,750 $0
4.0 EA 0 $535 $0
5.0 ACRE 15 $85,400 $1,281,000
6.0 CY 32,616 $11.50 $375,084
7.0 CY 7,722 $3.70 $28,571
8.0 SQFT 367,200 $0.07 $25,704
9.0 CY 13,203 $175 $2,310,525
10.0 CY 7,695 $165 $1,269,675
11.0 TON 29,376 $87 $2,555,712
12.0 LF 0 $400 $0
13.0 LF 0 $1,250 $0
14.0 CY 0 $560 $0
15.0 CY 0 $620 $0
16.0 CY 0 $1,950 $0
17.0 EA 0 $445 $0
18.0 EA 0 $6,750 $0
19.0 EA 0 $220 $0
20.0 LF 0 $30 $0
21.0 LF 0 $100 $0
22.0 LF 54,000 $0.14 $7,560
23.0 EA 0 $500 $0
24.0 EA 0 $5,000 $0
25.0 EA 0 $600,000 $0
26.0 EA 0 $350,000 $0
27.0 EA 0 $200,000 $0
SUBTOTAL I (ALL OF ABOVE) $7,853,831
SW3P (3% OF SUBTOTAL I) $235,610 $235,610
DRAINAGE (5% OF SUBTOTAL I) $392,690 $392,690
MISC. CONSTRUCTION COSTS (15% OF SUBTOTAL I) $1,178,070 $1,178,070
MAINTENANCE OF UTILITIES (3% OF SUBTOTAL I) $235,610 $235,610
SUBTOTAL II (MISCELLANOUS) $2,041,980
Date of Preparation:
Opinion of Probable Construction Costs
Project Name:
Monterey Bay Area Feasibility Study of Bus Operations on State Route 1 Shoulder and Monterey Branch Line
Monterey Segment I: Reservation Road to Fremont Boulevard (Sand City)
Monterey Option I-C - Caltrans Bike/Pedestrian Trail
Light Pole:
June 26, 2018
Submittal:
DRAFT
Segment Length:
Configuration:
Overhead Signs:
Call Boxes:
Catch Basins:
Retaining Wall Length
Average Retaining Wall Height:
Sound Wall Length:
Code Description
150662 REMOVE METAL BEAM GUARD RAILING
150668 REMOVE FLARED END SECTION
150827 REMOVE CATCH BASIN
152387 RELOCATE ROADSIDE SIGN-TWO POST
160103 CLEARING AND GRUBBING (ACRE)
190101 ROADWAY EXCAVATION
198010 IMPORTED BORROW (CY)
210430 HYDROSEED
250201 CLASS 2 AGGREGATE SUBBASE
280000 LEAN CONCRETE BASE
390132 HOT MIX ASPHALT (TYPE A)
568056 RELOCATE SIGN STRUCTURE
705001 STEEL FLARED END SECTION
490604 30" CAST-IN-DRILLED-HOLE CONCRETE PILE
498052 60" CAST-IN-DRILLED-HOLE CONCRETE PILE
510060 STRUCTURAL CONCRETE, RETAINING WALL
510061 STRUCTURAL CONCRETE, SOUND WALL
510094 STRUCTURAL CONCRETE, DRAINAGE INLET
566012 ROADSIDE SIGN - TWO POST
900005 MODIFY SIGNAL AND LIGHTING
832006 MIDWEST GUARDRAIL SYSTEM (STEEL POST)
840656 PAINT TRAFFIC STRIPE (2-COAT)
900001 RELOCATE CALL BOX
839701 CONCRETE BARRIER (TYPE 60)
900002 RELOCATE LIGHT POLE
900003 CUT AND COVER STRUCTURE
900004 SIGNAL AND LIGHTING
Estimate prepared by CDM Smith
Date: 6/26/2018

MONTEREY BAY AREA FEASIBILITY STUDY OF BUS OPERATIONS ON STATE ROUTE 1 SHOULDER AND
MONTEREY BRANCH LINE
MOBILIZATION (10% OF SUBTOTAL I & II) $989,580 $989,580
CONTINGENCIES (35% OF SUBTOTAL I & II) $3,464,000 $3,464,000
SUBTOTAL III (CONSTRUCTION) $14,349,400
LAND ACQUISITION $0 $0
SUBTOTAL IV (RIGHT-OF-WAY) $0
ENGINEERING STUDIES(3% OF SUBTOTAL III) $430,000 $430,000
ENVIRONMENTAL (3% OF SUBTOTAL III) $430,000 $430,000
DESIGN ENGINEERING AND CONSTRUCTION SUPPORT (15% OF SUBTOTAL III) $2,152,000 $2,152,000
CONSTRUCTION MANAGEMENT (13% OF SUBTOTAL III) $1,865,000 $1,865,000
SUBTOTAL V (SOFT COSTS) $4,877,000
PROJECT TOTAL $19,227,000
Estimate prepared by CDM Smith
Date: 6/26/2018

MONTEREY BAY AREA FEASIBILITY STUDY OF BUS OPERATIONS ON STATE ROUTE 1 SHOULDER AND
MONTEREY BRANCH LINE
Segment Details
7,000'
8'
0
1
2
2600'
8'
0'
0
Item # Unit Quantity Unit Price Cost
1.0 LF 275 $6.50 $1,788
2.0 EA 1 $510 $510
3.0 EA 2 $1,750 $3,500
4.0 EA 14 $535 $7,490
5.0 ACRE 2 $85,400 $170,800
6.0 CY 7,476 $11.50 $85,974
7.0 CY 364 $3.70 $1,347
8.0 SQFT 80,640 $0.07 $5,645
9.0 CY 2,849 $175 $498,575
10.0 CY 1,666 $165 $274,890
11.0 TON 5,495 $87 $478,065
12.0 LF 0 $400 $0
13.0 LF 0 $1,250 $0
14.0 CY 771 $560 $431,760
15.0 CY 0 $620 $0
16.0 CY 7 $1,950 $13,650
17.0 EA 28 $445 $12,460
18.0 EA 0 $6,750 $0
19.0 EA 0 $220 $0
20.0 LF 0 $30 $0
21.0 LF 300 $100 $30,000
22.0 LF 7,000 $0.14 $980
23.0 EA 1 $500 $500
24.0 EA 0 $5,000 $0
25.0 EA 0 $600,000 $0
26.0 EA 0 $350,000 $0
27.0 EA 0 $200,000 $0
SUBTOTAL I (ALL OF ABOVE) $2,017,933
SW3P (3% OF SUBTOTAL I) $60,540 $60,540
TRAFFIC HANDLING (10% OF SUBTOTAL I) $201,790 $201,790
MISC. CONSTRUCTION COSTS (17% OF SUBTOTAL I) $343,050 $343,050
MAINTENANCE OF UTILITIES (3% OF SUBTOTAL I) $60,540 $60,540
SUBTOTAL II (MISCELLANOUS) $665,920
Date of Preparation:
839701 CONCRETE BARRIER (TYPE 60)
Opinion of Probable Construction Costs
Project Name:
Monterey Bay Area Feasibility Study of Bus Operations on State Route 1 Shoulder and Monterey Branch Line
Monterey Segment II: Fremont Boulevard (Sand City) to SR-218
Monterey Option II-A - Southbound Bus-on-Shoulder
Light Pole:
June 26, 2018
Submittal:
DRAFT
Segment Length:
Average Existing Shoulder Width:
Overhead Signs:
Call Boxes:
Catch Basins:
Retaining Wall Length
Average Retaining Wall Height:
Sound Wall Length:
Code Description
150662 REMOVE METAL BEAM GUARD RAILING
150668 REMOVE FLARED END SECTION
150827 REMOVE CATCH BASIN
152387 RELOCATE ROADSIDE SIGN-TWO POST
160103 CLEARING AND GRUBBING (ACRE)
190101 ROADWAY EXCAVATION
198010 IMPORTED BORROW (CY)
210430 HYDROSEED
250201 CLASS 2 AGGREGATE SUBBASE
280000 LEAN CONCRETE BASE
390132 HOT MIX ASPHALT (TYPE A)
490604 30" CAST-IN-DRILLED-HOLE CONCRETE PILE
498052 60" CAST-IN-DRILLED-HOLE CONCRETE PILE
510060 STRUCTURAL CONCRETE, RETAINING WALL
510061 STRUCTURAL CONCRETE, SOUND WALL
510094 STRUCTURAL CONCRETE, DRAINAGE INLET
566012 ROADSIDE SIGN - TWO POST
568056 RELOCATE SIGN STRUCTURE
705001 STEEL FLARED END SECTION
900005 MODIFY SIGNAL AND LIGHTING
832006 MIDWEST GUARDRAIL SYSTEM (STEEL POST)
840656 PAINT TRAFFIC STRIPE (2-COAT)
900001 RELOCATE CALL BOX
900002 RELOCATE LIGHT POLE
900003 CUT AND COVER STRUCTURE
900004 SIGNAL AND LIGHTING
Estimate prepared by CDM Smith
Date: 6/26/2018

MONTEREY BAY AREA FEASIBILITY STUDY OF BUS OPERATIONS ON STATE ROUTE 1 SHOULDER AND
MONTEREY BRANCH LINE
MOBILIZATION (10% OF SUBTOTAL I & II) $268,390 $268,390
CONTINGENCIES (35% OF SUBTOTAL I & II) $940,000 $940,000
SUBTOTAL III (CONSTRUCTION) $3,892,300
LAND ACQUISITION $0 $0
SUBTOTAL IV (RIGHT-OF-WAY) $0
ENGINEERING STUDIES (3% OF SUBTOTAL III) $117,000 $117,000
ENVIRONMENTAL (3% OF SUBTOTAL III) $117,000 $117,000
DESIGN ENGINEERING AND CONSTRUCTION SUPPORT (17% OF SUBTOTAL III) $662,000 $662,000
CONSTRUCTION MANAGEMENT (13% OF SUBTOTAL III) $506,000 $506,000
SUBTOTAL V (SOFT COSTS) $1,402,000
PROJECT TOTAL $5,295,000
Estimate prepared by CDM Smith
Date: 6/26/2018

MONTEREY BAY AREA FEASIBILITY STUDY OF BUS OPERATIONS ON STATE ROUTE 1 SHOULDER AND
MONTEREY BRANCH LINE
Segment Details
6,500'
MBL
0
0
0
1340'
10'
0'
0
Item # Unit Quantity Unit Price Cost
1.0 LF 0 $6.50 $0
2.0 EA 0 $510 $0
3.0 EA 0 $1,750 $0
4.0 EA 0 $535 $0
5.0 ACRE 6 $85,400 $512,400
6.0 CY 2,795 $11.50 $32,143
7.0 CY 3,803 $3.70 $14,071
8.0 SQFT 88,751 $0.07 $6,213
9.0 CY 3,172 $175 $555,100
10.0 CY 1,853 $165 $305,745
11.0 TON 7,072 $87 $615,264
12.0 LF 0 $400 $0
13.0 LF 0 $1,250 $0
14.0 CY 497 $560 $278,320
15.0 CY 0 $620 $0
16.0 CY 0 $1,950 $0
17.0 EA 0 $445 $0
18.0 EA 0 $6,750 $0
19.0 EA 0 $220 $0
20.0 LF 0 $30 $0
21.0 LF 0 $100 $0
22.0 LF 13,000 $0.14 $1,820
23.0 EA 0 $500 $0
24.0 EA 0 $5,000 $0
25.0 EA 1 $600,000 $600,000
26.0 EA 2 $350,000 $700,000
27.0 EA 0 $200,000 $0
SUBTOTAL I (ALL OF ABOVE) $3,621,075
SW3P (3% OF SUBTOTAL I) $108,630 $108,630
DRAINAGE (5% OF SUBTOTAL I) $181,050 $181,050
MISC. CONSTRUCTION COSTS (15% OF SUBTOTAL I) $543,160 $543,160
MAINTENANCE OF UTILITIES (3% OF SUBTOTAL I) $108,630 $108,630
SUBTOTAL II (MISCELLANOUS) $941,470
Date of Preparation:
900002 RELOCATE LIGHT POLE
900003 CUT AND COVER STRUCTURE
Light Pole:
June 26, 2018
Submittal:
DRAFT
Segment Length:
Configuration:
Overhead Signs:
Call Boxes:
Catch Basins:
Retaining Wall Length
Average Retaining Wall Height:
Opinion of Probable Construction Costs
Project Name:
Monterey Bay Area Feasibility Study of Bus Operations on State Route 1 Shoulder and Monterey Branch Line
Monterey Segment II: Fremont Boulevard (Sand City) to SR-218
Monterey Option II-B - Monterey Branch Line Busway
Sound Wall Length:
Code Description
150662 REMOVE METAL BEAM GUARD RAILING
150668 REMOVE FLARED END SECTION
150827 REMOVE CATCH BASIN
152387 RELOCATE ROADSIDE SIGN-TWO POST
160103 CLEARING AND GRUBBING (ACRE)
190101 ROADWAY EXCAVATION
198010 IMPORTED BORROW (CY)
210430 HYDROSEED
250201 CLASS 2 AGGREGATE SUBBASE
280000 LEAN CONCRETE BASE
390132 HOT MIX ASPHALT (TYPE A)
490604 30" CAST-IN-DRILLED-HOLE CONCRETE PILE
498052 60" CAST-IN-DRILLED-HOLE CONCRETE PILE
510060 STRUCTURAL CONCRETE, RETAINING WALL
510061 STRUCTURAL CONCRETE, SOUND WALL
510094 STRUCTURAL CONCRETE, DRAINAGE INLET
566012 ROADSIDE SIGN - TWO POST
568056 RELOCATE SIGN STRUCTURE
705001 STEEL FLARED END SECTION
900005 MODIFY SIGNAL AND LIGHTING
832006 MIDWEST GUARDRAIL SYSTEM (STEEL POST)
840656 PAINT TRAFFIC STRIPE (2-COAT)
900001 RELOCATE CALL BOX
839701 CONCRETE BARRIER (TYPE 60)
900004 SIGNAL AND LIGHTING
Estimate prepared by CDM Smith
Date: 6/26/2018

MONTEREY BAY AREA FEASIBILITY STUDY OF BUS OPERATIONS ON STATE ROUTE 1 SHOULDER AND
MONTEREY BRANCH LINE
MOBILIZATION (10% OF SUBTOTAL I & II) $456,250 $456,250
CONTINGENCIES (35% OF SUBTOTAL I & II) $1,597,000 $1,597,000
SUBTOTAL III (CONSTRUCTION) $6,615,800
LAND ACQUISITION $0 $0
SUBTOTAL IV (RIGHT-OF-WAY) $0
ENGINEERING STUDIES (3% OF SUBTOTAL III) $198,000 $198,000
ENVIRONMENTAL (3% OF SUBTOTAL III) $198,000 $198,000
DESIGN ENGINEERING AND CONSTRUCTION SUPPORT (15% OF SUBTOTAL III) $992,000 $992,000
CONSTRUCTION MANAGEMENT (13% OF SUBTOTAL III) $860,000 $860,000
SUBTOTAL V (SOFT COSTS) $2,248,000
PROJECT TOTAL $8,864,000
Estimate prepared by CDM Smith
Date: 6/26/2018

MONTEREY BAY AREA FEASIBILITY STUDY OF BUS OPERATIONS ON STATE ROUTE 1 SHOULDER AND
MONTEREY BRANCH LINE
Segment Details
'
0'
0
0
0
0'
0'
0'
0
Item # Unit Quantity Unit Price Cost
1.0 EA 5 $340 $1,700
2.0 EA 1 $200,000 $200,000
SUBTOTAL I (ALL OF ABOVE) $201,700
SW3P (3% OF SUBTOTAL I) $6,050.00 $6,050
TRAFFIC HANDLING (10% OF SUBTOTAL I) $20,170.00 $20,170
MISC. CONSTRUCTION COSTS (15% OF SUBTOTAL I) $30,260.00 $30,260
MAINTENANCE OF UTILITIES (3% OF SUBTOTAL I) $6,050 $6,050
SUBTOTAL II (MISCELLANOUS) $62,530
MOBILIZATION (10% OF SUBTOTAL I & II) $26,420 $26,420
CONTINGENCIES (35% OF SUBTOTAL I & II) $93,000 $93,000
SUBTOTAL III (CONSTRUCTION) $383,700
LAND ACQUISITION $0 $0
SUBTOTAL IV (RIGHT-OF-WAY) $0
ENVIRONMENTAL (3% OF SUBTOTAL III OR $40k MIN.) $40,000 $40,000
ENVIRONMENTAL (3% OF SUBTOTAL III OR $40k MIN.) $40,000 $40,000
DESIGN ENGINEERING AND CONSTRUCTION SUPPORT (17% OF SUBTOTAL III) $65,000 $65,000
CONSTRUCTION MANAGEMENT (13% OF SUBTOTAL III) $50,000 $50,000
SUBTOTAL V (SOFT COSTS) $195,000
PROJECT TOTAL $579,000
900005 MODIFY SIGNAL AND LIGHTING
Code Description
566011 ROADSIDE SIGN - ONE POST
Light Pole:
June 26, 2018
Submittal:
DRAFT
Segment Length:
Average Existing Shoulder Width:
Overhead Signs:
Call Boxes:
Catch Basins:
Retaining Wall Length
Average Retaining Wall Height:
Sound Wall Length:
Date of Preparation:
Opinion of Probable Construction Costs
Project Name:
Monterey Bay Area Feasibility Study of Bus Operations on State Route 1 Shoulder and Monterey Branch Line
Monterey Segment III: SR-218 to Monterey
Monterey Option III-A - BRT to English Avenue
Estimate prepared by CDM Smith
Date: 6/26/2018

MONTEREY BAY AREA FEASIBILITY STUDY OF BUS OPERATIONS ON STATE ROUTE 1 SHOULDER AND
MONTEREY BRANCH LINE
Segment Details
11,000'
3'
0
0
0
0'
0'
0'
0
Item # Unit Quantity Unit Price Cost
1.0 LF 0 $6.50 $0
2.0 EA 0 $510 $0
3.0 EA 0 $1,750 $0
4.0 EA 22 $535 $11,770
5.0 ACRE 7 $85,400 $597,800
6.0 CY 9,427 $11.50 $108,411
7.0 CY 6,974 $3.70 $25,804
8.0 SQFT 212,509 $0.07 $14,876
9.0 CY 4,477 $175 $783,475
10.0 CY 2,618 $165 $431,970
11.0 TON 8,635 $87 $751,245
12.0 LF 0 $400 $0
13.0 LF 0 $1,250 $0
14.0 CY 0 $560 $0
15.0 CY 0 $620 $0
16.0 CY 0 $1,950 $0
17.0 EA 44 $445 $19,580
18.0 EA 0 $6,750 $0
19.0 EA 0 $220 $0
20.0 LF 0 $30 $0
21.0 LF 0 $100 $0
22.0 LF 11,000 $0.14 $1,540
23.0 EA 0 $500 $0
24.0 EA 0 $5,000 $0
25.0 EA 0 $600,000 $0
26.0 EA 0 $350,000 $0
27.0 EA 0 $200,000 $0
SUBTOTAL I (ALL OF ABOVE) $2,746,470
SW3P (3% OF SUBTOTAL I) $82,390 $82,390
TRAFFIC HANDLING (10% OF SUBTOTAL I) $274,650 $274,650
MISC. CONSTRUCTION COSTS (15% OF SUBTOTAL I) $411,970 $411,970
MAINTENANCE OF UTILITIES (3% OF SUBTOTAL I) $82,390 $82,390
SUBTOTAL II (MISCELLANOUS) $851,400
Date of Preparation:
Opinion of Probable Construction Costs
Project Name:
Monterey Bay Area Feasibility Study of Bus Operations on State Route 1 Shoulder and Monterey Branch Line
Monterey Segment III: SR-218 to Monterey
Monterey Alternative 3B - Southbound Bus-on-Shoulder
Light Pole:
June 26, 2018
Submittal:
DRAFT
Segment Length:
Average Existing Shoulder Width:
Overhead Signs:
Call Boxes:
Catch Basins:
Retaining Wall Length
Average Retaining Wall Height:
Sound Wall Length:
Code Description
150662 REMOVE METAL BEAM GUARD RAILING
150668 REMOVE FLARED END SECTION
150827 REMOVE CATCH BASIN
152387 RELOCATE ROADSIDE SIGN-TWO POST
160103 CLEARING AND GRUBBING (ACRE)
190101 ROADWAY EXCAVATION
198010 IMPORTED BORROW (CY)
210430 HYDROSEED
250201 CLASS 2 AGGREGATE SUBBASE
280000 LEAN CONCRETE BASE
390132 HOT MIX ASPHALT (TYPE A)
568056 RELOCATE SIGN STRUCTURE
705001 STEEL FLARED END SECTION
490604 30" CAST-IN-DRILLED-HOLE CONCRETE PILE
498052 60" CAST-IN-DRILLED-HOLE CONCRETE PILE
510060 STRUCTURAL CONCRETE, RETAINING WALL
510061 STRUCTURAL CONCRETE, SOUND WALL
510094 STRUCTURAL CONCRETE, DRAINAGE INLET
566012 ROADSIDE SIGN - TWO POST
900005 MODIFY SIGNAL AND LIGHTING
832006 MIDWEST GUARDRAIL SYSTEM (STEEL POST)
840656 PAINT TRAFFIC STRIPE (2-COAT)
900001 RELOCATE CALL BOX
839701 CONCRETE BARRIER (TYPE 60)
900004 SIGNAL AND LIGHTING
900003 CUT AND COVER STRUCTURE
900002 RELOCATE LIGHT POLE
Estimate prepared by CDM Smith
Date: 6/26/2018

MONTEREY BAY AREA FEASIBILITY STUDY OF BUS OPERATIONS ON STATE ROUTE 1 SHOULDER AND
MONTEREY BRANCH LINE
MOBILIZATION (10% OF SUBTOTAL I & II) $359,790 $359,790
CONTINGENCIES (35% OF SUBTOTAL I & II) $1,260,000 $1,260,000
SUBTOTAL III (CONSTRUCTION) $5,217,700
LAND ACQUISITION $0 $0
SUBTOTAL IV (RIGHT-OF-WAY) $0
ENGINEERING STUDIES (3% OF SUBTOTAL III) $157,000 $157,000
ENVIRONMENTAL (3% OF SUBTOTAL III) $157,000 $157,000
DESIGN ENGINEERING AND CONSTRUCTION SUPPORT (15% OF SUBTOTAL III) $783,000 $783,000
CONSTRUCTION MANAGEMENT (13% OF SUBTOTAL III) $678,000 $678,000
SUBTOTAL V (SOFT COSTS) $1,775,000
PROJECT TOTAL $6,993,000
Estimate prepared by CDM Smith
Date: 6/26/2018

MONTEREY BAY AREA FEASIBILITY STUDY OF BUS OPERATIONS ON STATE ROUTE 1 SHOULDER AND
MONTEREY BRANCH LINE
Segment Details
10,000'
5'
0
1
1
1100'
6'
0'
0
Item # Unit Quantity Unit Price Cost
1.0 LF 0 $6.50 $0
2.0 EA 0 $510 $0
3.0 EA 1 $1,750 $1,750
4.0 EA 20 $535 $10,700
5.0 ACRE 5 $85,400 $427,000
6.0 CY 9,690 $11.50 $111,435
7.0 CY 3,230 $3.70 $11,951
8.0 SQFT 138,000 $0.07 $9,660
9.0 CY 4,070 $175 $712,250
10.0 CY 2,380 $165 $392,700
11.0 TON 7,850 $87 $682,950
12.0 LF 0 $400 $0
13.0 LF 0 $1,250 $0
14.0 CY 245 $560 $137,200
15.0 CY 0 $620 $0
16.0 CY 4 $1,950 $7,800
17.0 EA 40 $445 $17,800
18.0 EA 0 $6,750 $0
19.0 EA 0 $220 $0
20.0 LF 0 $30 $0
21.0 LF 0 $100 $0
22.0 LF 10,000 $0.14 $1,400
23.0 EA 1 $500 $500
24.0 EA 0 $5,000 $0
25.0 EA 0 $600,000 $0
26.0 EA 0 $350,000 $0
27.0 EA 0 $200,000 $0
SUBTOTAL I (ALL OF ABOVE) $2,525,096
SW3P (3% OF SUBTOTAL I) $75,750 $75,750
TRAFFIC HANDLING (10% OF SUBTOTAL I) $252,510 $252,510
MISC. CONSTRUCTION COSTS (15% OF SUBTOTAL I) $378,760 $378,760
MAINTENANCE OF UTILITIES (3% OF SUBTOTAL I) $75,750 $75,750
SUBTOTAL II (MISCELLANOUS) $782,770
Date of Preparation:
Opinion of Probable Construction Costs
Project Name:
Monterey Bay Area Feasibility Study of Bus Operations on State Route 1 Shoulder and Monterey Branch Line
Monterey Segment IV: Casa Verde Way to Fremont Boulevard
Monterey Option IV-A - Northbound Bus-on-Shoulder
Light Pole:
June 26, 2018
Submittal:
DRAFT
Segment Length:
Average Existing Shoulder Width:
Overhead Signs:
Call Boxes:
Catch Basins:
Retaining Wall Length
Average Retaining Wall Height:
Sound Wall Length:
Code Description
150662 REMOVE METAL BEAM GUARD RAILING
150668 REMOVE FLARED END SECTION
150827 REMOVE CATCH BASIN
152387 RELOCATE ROADSIDE SIGN-TWO POST
160103 CLEARING AND GRUBBING (ACRE)
190101 ROADWAY EXCAVATION
198010 IMPORTED BORROW (CY)
210430 HYDROSEED
250201 CLASS 2 AGGREGATE SUBBASE
280000 LEAN CONCRETE BASE
390132 HOT MIX ASPHALT (TYPE A)
568056 RELOCATE SIGN STRUCTURE
705001 STEEL FLARED END SECTION
490604 30" CAST-IN-DRILLED-HOLE CONCRETE PILE
498052 60" CAST-IN-DRILLED-HOLE CONCRETE PILE
510060 STRUCTURAL CONCRETE, RETAINING WALL
510061 STRUCTURAL CONCRETE, SOUND WALL
510094 STRUCTURAL CONCRETE, DRAINAGE INLET
566012 ROADSIDE SIGN - TWO POST
900005 MODIFY SIGNAL AND LIGHTING
832006 MIDWEST GUARDRAIL SYSTEM (STEEL POST)
840656 PAINT TRAFFIC STRIPE (2-COAT)
900001 RELOCATE CALL BOX
839701 CONCRETE BARRIER (TYPE 60)
900004 SIGNAL AND LIGHTING
900003 CUT AND COVER STRUCTURE
900002 RELOCATE LIGHT POLE
Estimate prepared by CDM Smith
Date: 6/26/2018

MONTEREY BAY AREA FEASIBILITY STUDY OF BUS OPERATIONS ON STATE ROUTE 1 SHOULDER AND
MONTEREY BRANCH LINE
MOBILIZATION (10% OF SUBTOTAL I & II) $330,790 $330,790
CONTINGENCIES (35% OF SUBTOTAL I & II) $1,158,000 $1,158,000
SUBTOTAL III (CONSTRUCTION) $4,796,700
LAND ACQUISITION $0 $0
SUBTOTAL IV (RIGHT-OF-WAY) $0
ENGINEERING STUDIES (3% OF SUBTOTAL III) $144,000 $144,000
ENVIRONMENTAL (3% OF SUBTOTAL III) $144,000 $144,000
DESIGN ENGINEERING AND CONSTRUCTION SUPPORT (17% OF SUBTOTAL III) $815,000 $815,000
CONSTRUCTION MANAGEMENT (13% OF SUBTOTAL III) $624,000 $624,000
SUBTOTAL V (SOFT COSTS) $1,727,000
PROJECT TOTAL $6,524,000
Estimate prepared by CDM Smith
Date: 6/26/2018

MONTEREY BAY AREA FEASIBILITY STUDY OF BUS OPERATIONS ON STATE ROUTE 1
SHOULDER AND MONTEREY BRANCH LINE
Bid Item
CodeBid Item Description Unit Price
150662 REMOVE METAL BEAM GUARD RAILING LF $6.50
150668 REMOVE FLARED END SECTION EA $510.00
150827 REMOVE CATCH BASIN EA $1,750.00
150833 REMOVE RETAINING WALL LF $16.00
152386 RELOCATE ROADSIDE SIGN-ONE POST EA $270.00
152387 RELOCATE ROADSIDE SIGN-TWO POST EA $535.00
153252 REMOVE SOUND WALL LF $30.00
160103 CLEARING AND GRUBBING (ACRE) ACRE $85,400.00
190101 ROADWAY EXCAVATION CY $11.50
198010 IMPORTED BORROW (CY) CY $3.70
205035 WOOD MULCH CY $66.00
210220 EROSION CONTROL (DRILL SEED) (SQYD) SQYD $0.50
210430 HYDROSEED SQFT $0.07
250201 CLASS 2 AGGREGATE SUBBASE CY $175.00
260203 CLASS 2 AGGREGATE BASE (CY) CY $53.00
280000 LEAN CONCRETE BASE CY $165.00
390132 HOT MIX ASPHALT (TYPE A) TON $87.00
401050 JOINTED PLAIN CONCRETE PAVEMENT CY $320.00
490604 30" CAST-IN-DRILLED-HOLE CONCRETE PILE LF $400.00
498052 60" CAST-IN-DRILLED-HOLE CONCRETE PILE LF $1,250.00
510060 STRUCTURAL CONCRETE, RETAINING WALL CY $560.00
510061 STRUCTURAL CONCRETE, SOUND WALL CY $620.00
510094 STRUCTURAL CONCRETE, DRAINAGE INLET CY $1,950.00
520101 BAR REINFORCING STEEL LB $1.10
566011 ROADSIDE SIGN - ONE POST EA $340.00
566012 ROADSIDE SIGN - TWO POST EA $445.00
568056 RELOCATE SIGN STRUCTURE EA $6,750.00
582001 SOUND WALL (MASONRY BLOCK) SF $26.00
705001 STEEL FLARED END SECTION EA $220.00
731504 MINOR CONCRETE (CURB AND GUTTER) CY $500.00
731521 MINOR CONCRETE (SIDEWALK) CY $460.00
731623 MINOR CONCRETE (CURB RAMP) CY $580.00
750049 INLET GRATE (TYPE 36R) EA $540.00
832006 MIDWEST GUARDRAIL SYSTEM (STEEL POST) LF $30.00
839701 CONCRETE BARRIER (TYPE 60) LF $100.00
840655 PAINT TRAFFIC STRIPE (1-COAT) LF $1.00
840656 PAINT TRAFFIC STRIPE (2-COAT) LF $0.14
840666 PAINT PAVEMENT MARKING (2-COAT) SQFT $4.00
900001 RELOCATE CALL BOX EA $500.00
900002 RELOCATE LIGHT POLE EA $5,000.00
900003 CUT AND COVER STRUCTURE EA $600,000.00
900004 SIGNAL AND LIGHTING EA $350,000.00
900005 MODIFY SIGNAL AND LIGHTING EA $200,000.00
Estimate prepared by CDM Smith
Date: 6/26/2018

MONTEREY BAY AREA FEASIBILITY STUDY OF BUS OPERATIONS ON STATE ROUTE 1
SHOULDER AND MONTEREY BRANCH LINE
Existing
Shoulder
Width
Bid Item
CodeBid Item Description Unit Quantity
0 152387 RELOCATE ROADSIDE SIGN-TWO POST EA 0.002
0 160103 CLEARING AND GRUBBING (ACRE) ACRE 0.000863
0 190101 ROADWAY EXCAVATION CY 0.618
0 198010 IMPORTED BORROW (CY) CY 1.293
0 210430 HYDROSEED SQFT 27.6
0 250201 CLASS 2 AGGREGATE SUBBASE CY 0.407
0 280000 LEAN CONCRETE BASE CY 0.238
0 390132 HOT MIX ASPHALT (TYPE A) TON 0.785
0 566012 ROADSIDE SIGN - TWO POST EA 0.004
0 840656 PAINT TRAFFIC STRIPE (2-COAT) LF 1
3 152387 RELOCATE ROADSIDE SIGN-TWO POST EA 0.002
3 160103 CLEARING AND GRUBBING (ACRE) ACRE 0.000604
3 190101 ROADWAY EXCAVATION CY 0.857
3 198010 IMPORTED BORROW (CY) CY 0.634
3 210430 HYDROSEED SQFT 19.319
3 250201 CLASS 2 AGGREGATE SUBBASE CY 0.407
3 280000 LEAN CONCRETE BASE CY 0.238
3 390132 HOT MIX ASPHALT (TYPE A) TON 0.785
3 566012 ROADSIDE SIGN - TWO POST EA 0.004
3 840656 PAINT TRAFFIC STRIPE (2-COAT) LF 1
5 152387 RELOCATE ROADSIDE SIGN-TWO POST EA 0.002
5 160103 CLEARING AND GRUBBING (ACRE) ACRE 0.000432
5 190101 ROADWAY EXCAVATION CY 0.969
5 198010 IMPORTED BORROW (CY) CY 0.323
5 210430 HYDROSEED SQFT 13.8
5 250201 CLASS 2 AGGREGATE SUBBASE CY 0.407
5 280000 LEAN CONCRETE BASE CY 0.238
5 390132 HOT MIX ASPHALT (TYPE A) TON 0.785
5 566011 ROADSIDE SIGN - ONE POST EA 0.004
5 566012 ROADSIDE SIGN - TWO POST EA 0.004
5 840656 PAINT TRAFFIC STRIPE (2-COAT) LF 1
6 152387 RELOCATE ROADSIDE SIGN-TWO POST EA 0.002
6 160103 CLEARING AND GRUBBING (ACRE) ACRE 0.000345
6 190101 ROADWAY EXCAVATION CY 1.011
6 198010 IMPORTED BORROW (CY) CY 0.207
6 210430 HYDROSEED SQFT 11.039
6 250201 CLASS 2 AGGREGATE SUBBASE CY 0.407
6 280000 LEAN CONCRETE BASE CY 0.238
6 390132 HOT MIX ASPHALT (TYPE A) TON 0.785
6 566012 ROADSIDE SIGN - TWO POST EA 0.004
6 840656 PAINT TRAFFIC STRIPE (2-COAT) LF 1
6.5 152387 RELOCATE ROADSIDE SIGN-TWO POST EA 0.002
Estimate prepared by CDM Smith
Date: 6/26/2018

MONTEREY BAY AREA FEASIBILITY STUDY OF BUS OPERATIONS ON STATE ROUTE 1
SHOULDER AND MONTEREY BRANCH LINE
6.5 160103 CLEARING AND GRUBBING (ACRE) ACRE 0.000302
6.5 190101 ROADWAY EXCAVATION CY 1.029
6.5 198010 IMPORTED BORROW (CY) CY 0.158
6.5 210430 HYDROSEED SQFT 9.659
6.5 250201 CLASS 2 AGGREGATE SUBBASE CY 0.407
6.5 280000 LEAN CONCRETE BASE CY 0.238
6.5 390132 HOT MIX ASPHALT (TYPE A) TON 0.785
6.5 566012 ROADSIDE SIGN - TWO POST EA 0.004
6.5 840656 PAINT TRAFFIC STRIPE (2-COAT) LF 1
7 152387 RELOCATE ROADSIDE SIGN-TWO POST EA 0.002
7 160103 CLEARING AND GRUBBING (ACRE) ACRE 0.000259
7 190101 ROADWAY EXCAVATION CY 1.044
7 198010 IMPORTED BORROW (CY) CY 0.116
7 210430 HYDROSEED SQFT 8.279
7 250201 CLASS 2 AGGREGATE SUBBASE CY 0.407
7 280000 LEAN CONCRETE BASE CY 0.238
7 390132 HOT MIX ASPHALT (TYPE A) TON 0.785
7 566012 ROADSIDE SIGN - TWO POST EA 0.004
7 840656 PAINT TRAFFIC STRIPE (2-COAT) LF 1
8 152387 RELOCATE ROADSIDE SIGN-TWO POST EA 0.002
8 160103 CLEARING AND GRUBBING (ACRE) ACRE 0.000173
8 190101 ROADWAY EXCAVATION CY 1.068
8 198010 IMPORTED BORROW (CY) CY 0.052
8 210430 HYDROSEED SQFT 11.52
8 250201 CLASS 2 AGGREGATE SUBBASE CY 0.407
8 280000 LEAN CONCRETE BASE CY 0.238
8 390132 HOT MIX ASPHALT (TYPE A) TON 0.785
8 566012 ROADSIDE SIGN - TWO POST EA 0.004
8 840656 PAINT TRAFFIC STRIPE (2-COAT) LF 1
8.5 152387 RELOCATE ROADSIDE SIGN-TWO POST EA 0.002
8.5 160103 CLEARING AND GRUBBING (ACRE) ACRE 0.000129
8.5 190101 ROADWAY EXCAVATION CY 1.076
8.5 198010 IMPORTED BORROW (CY) CY 0.029
8.5 210430 HYDROSEED SQFT 4.139
8.5 250201 CLASS 2 AGGREGATE SUBBASE CY 0.407
8.5 280000 LEAN CONCRETE BASE CY 0.238
8.5 390132 HOT MIX ASPHALT (TYPE A) TON 0.785
8.5 566012 ROADSIDE SIGN - TWO POST EA 0.004
8.5 840656 PAINT TRAFFIC STRIPE (2-COAT) LF 1
10 152387 RELOCATE ROADSIDE SIGN-TWO POST EA 0.002
10 160103 CLEARING AND GRUBBING (ACRE) ACRE 0
10 190101 ROADWAY EXCAVATION CY 1.086
10 198010 IMPORTED BORROW (CY) CY 0
10 210430 HYDROSEED SQFT 0
10 250201 CLASS 2 AGGREGATE SUBBASE CY 0.407
Estimate prepared by CDM Smith
Date: 6/26/2018

MONTEREY BAY AREA FEASIBILITY STUDY OF BUS OPERATIONS ON STATE ROUTE 1
SHOULDER AND MONTEREY BRANCH LINE
10 280000 LEAN CONCRETE BASE CY 0.238
10 390132 HOT MIX ASPHALT (TYPE A) TON 0.785
10 566012 ROADSIDE SIGN - TWO POST EA 0.004
10 840656 PAINT TRAFFIC STRIPE (2-COAT) LF 1
11 152387 RELOCATE ROADSIDE SIGN-TWO POST EA 0.002
11 160103 CLEARING AND GRUBBING (ACRE) ACRE 0
11 190101 ROADWAY EXCAVATION CY 1.107
11 198010 IMPORTED BORROW (CY) CY 0.064
11 210430 HYDROSEED SQFT 6.2
11 250201 CLASS 2 AGGREGATE SUBBASE CY 0.407
11 280000 LEAN CONCRETE BASE CY 0.238
11 390132 HOT MIX ASPHALT (TYPE A) TON 0.785
11 566012 ROADSIDE SIGN - TWO POST EA 0.004
11 840656 PAINT TRAFFIC STRIPE (2-COAT) LF 1
12 152387 RELOCATE ROADSIDE SIGN-TWO POST EA 0.002
12 160103 CLEARING AND GRUBBING (ACRE) ACRE 0
12 190101 ROADWAY EXCAVATION CY 1.127
12 198010 IMPORTED BORROW (CY) CY 0.064
12 210430 HYDROSEED SQFT 6.2
12 250201 CLASS 2 AGGREGATE SUBBASE CY 0.407
12 280000 LEAN CONCRETE BASE CY 0.238
12 390132 HOT MIX ASPHALT (TYPE A) TON 0.785
12 566012 ROADSIDE SIGN - TWO POST EA 0.004
12 840656 PAINT TRAFFIC STRIPE (2-COAT) LF 1
CBP 160103 CLEARING AND GRUBBING (ACRE) ACRE 0.000542
CBP 190101 ROADWAY EXCAVATION CY 1.208
CBP 198010 IMPORTED BORROW (CY) CY 0.286
CBP 210430 HYDROSEED SQFT 13.6
CBP 250201 CLASS 2 AGGREGATE SUBBASE CY 0.489
CBP 260203 CLASS 2 AGGREGATE BASE (CY) CY 0.299
CBP 280000 LEAN CONCRETE BASE CY 0.285
CBP 390132 HOT MIX ASPHALT (TYPE A) TON 1.088
CBP 840656 PAINT TRAFFIC STRIPE (2-COAT) LF 2
MBL 160103 CLEARING AND GRUBBING (ACRE) ACRE 0.000773
MBL 190101 ROADWAY EXCAVATION CY 0.43
MBL 198010 IMPORTED BORROW (CY) CY 0.585
MBL 210430 HYDROSEED SQFT 13.654
MBL 250201 CLASS 2 AGGREGATE SUBBASE CY 0.488
MBL 260203 CLASS 2 AGGREGATE BASE (CY) CY 0.299
MBL 280000 LEAN CONCRETE BASE CY 0.285
MBL 390132 HOT MIX ASPHALT (TYPE A) TON 1.088
MBL 840656 PAINT TRAFFIC STRIPE (2-COAT) LF 2
Estimate prepared by CDM Smith
Date: 6/26/2018

MONTEREY BAY AREA FEASIBILITY STUDY OF BUS OPERATIONS ON STATE ROUTE 1 SHOULDER AND MONTEREY
BRANCH LINE
ASSUMPTIONS
General Assumpions
1. Rate of escalation is 3.5% per year.
2. No removal of railway tracks are include. Assumptions are the project can be constructed
outside the existing rails.
3. No exiting structures are widened as part of any alternatives (excluding Santa Cruz Alternative
3 HOV lanes).
4. No right-of-way will need to be acquired for any alternative.
5. Unit costs obtained from the 2016 Caltrans cost data book. http://www.dot.ca.gov/hq/esc/oe/awards/
Overhead Sign
1. Existing overhead signs assumed to be type G83-5 (CA), sized at 16' x 7'.
2. Sign structure assumed to be a 24'x7.5' truss, requiring a Type VI post. http://www.dot.ca.gov/des/techpubs/manuals/refe
rence-sheets/page/english/7.pdf
3. Truss weight is 4,400 lbs. http://www.dot.ca.gov/des/techpubs/manuals/refe
rence-sheets/page/english/9.pdf
4. Type VI Post quantity is 3,353 lbs. http://www.dot.ca.gov/des/techpubs/manuals/refe
rence-sheets/page/english/10.pdf
5. Pole pile foundation assumed to be 18' in depth with 60" diameter. http://www.dot.ca.gov/des/techpubs/manuals/refe
rence-sheets/page/english/13.pdf
6. 37.5 LF of guardrail to be removed and constructed for each sign relocation.
7. Guardrail end treatment to be removed and constructed for each sign location.
Drainage Inlet
1. New inlets to be Type OL-10.
2. Assumed depth of new drainage inlets to be 5'.
3. 3.406 CY of structural conctrete per inlet. http://www.dot.ca.gov/hq/esc/oe/project_plans/hi
ghway_plans/stdplans_US-customary-
units_15/viewable_pdf/rspd072g.pdf
4. Reinforcing steel not calculated; included in misc. construction costs.
Estimate prepared by CDM Smith
Date: 6/26/2018

MONTEREY BAY AREA FEASIBILITY STUDY OF BUS OPERATIONS ON STATE ROUTE 1 SHOULDER AND MONTEREY
BRANCH LINE
Sound Wall
1. Sound walls are Case 2 and 10' in height.
2. Sound wall footings are 5 SF per LF. http://www.dot.ca.gov/hq/esc/oe/project_plans/hi
ghway_plans/stdplans_US-customary-
units_15/viewable_pdf/b15-01.pdf
3. Reinforcing steel not calculated; included in misc. construction costs.
Retaining Wall
1. Reinforcing steel not calculated; included in misc. construction costs.
Light Pole
1. Pole pile foundation assumed to be 7' in depth with 30" diameter. http://www.dot.ca.gov/hq/esc/oe/project_plans/hi
ghway_plans/stdplans_US-customary-
units_15/viewable_pdf/rspes-06a.pdf
Santa Cruz Alternative 1: Option A
1. Total length of segments is 4,500'.
2. Quantity take-offs for HMA, AS, LCB, Roadway Excavation, Imported Borrow, bus on shoulder
signs, and striping calculated per LF of shoulder widening.
3. Quantity take-offs for overhead signs, call boxes, catch basins, retaining walls, sound walls,
and light poles assumed based on Google Earth assessment.
Santa Cruz Alternative 1: Option B
1. Total length of segments is 11,500'.
2. Quantity take-offs for HMA, AS, LCB, Roadway Excavation, Imported Borrow, bus on shoulder
signs, and striping calculated per LF of shoulder widening.
3. Quantity take-offs for overhead signs, call boxes, catch basins, retaining walls, sound walls,
and light poles assumed based on Google Earth assessment.
Santa Cruz Alternative 1: Option C
1. Total length of segments is 6,000'.
2. Quantity take-offs for HMA, AS, LCB, Roadway Excavation, Imported Borrow, bus on shoulder
signs, and striping calculated per LF of shoulder widening.
3. Quantity take-offs for overhead signs, call boxes, catch basins, retaining walls, sound walls,
and light poles assumed based on Google Earth assessment.
Estimate prepared by CDM Smith
Date: 6/26/2018

MONTEREY BAY AREA FEASIBILITY STUDY OF BUS OPERATIONS ON STATE ROUTE 1 SHOULDER AND MONTEREY
BRANCH LINE
Santa Cruz Alternative 2: Option A
1. Total length of all segments is 10,150'.
2. Alternative consists of adding bus on shoulder lanes through interchanges in conjunction with
the auxiliary lane project per the line diagram.
Santa Cruz Alternative 2: Option B
1. Total length of all segments is 42,700'.
2. Alternative consists of adding bus on shoulder lanes outside of the auxiliary lanes in
conjuction with the auxiliary lane project per the line diagram.
3. Per the TSM project plans, shoulders are typically 10', however some locations are narrower.
Assuming 10% of the shoulders are on average 8' wide, the corridor average shoulder width is
9.8'.
4. All sound walls required are costed as part of the TSM project.
5. Sign structures, light poles, catch basins, and call box relocations are costed as part of the
TSM project.
6. 10% of Retaining walls proposed as part of the TSM project will need to be 2' higher as a
result of widened shoulders.
Estimate prepared by CDM Smith
Date: 6/26/2018

MONTEREY BAY AREA FEASIBILITY STUDY OF BUS OPERATIONS ON STATE ROUTE 1 SHOULDER AND MONTEREY
BRANCH LINE
Santa Cruz Alternative 3
1. Current RTP estimate was factored down to represent the shortened length of the project.
Monterey Segment 1: Alternative 1A
1. Total length of segments is 29,500'.
2. Quantity take-offs for HMA, AS, LCB, Roadway Excavation, Imported Borrow, bus on shoulder
signs, and striping calculated per LF of shoulder widening.
3. Quantity take-offs for overhead signs, call boxes, catch basins, retaining walls, sound walls,
and light poles assumed based on Google Earth assessment.
Monterey Segment 1: Alternative 1B
1. Total length of segments is 27,000'.
2. Alternative consists on constructing a busway in the existing Monterey Branch Line rail right-
of-way next the the rail tracks.
3. Quantity take-offs for HMA, AS, LCB, Roadway Excavation, Imported Borrow, and striping
calculated per LF of shoulder busway.
Estimate prepared by CDM Smith
Date: 6/26/2018

MONTEREY BAY AREA FEASIBILITY STUDY OF BUS OPERATIONS ON STATE ROUTE 1 SHOULDER AND MONTEREY
BRANCH LINE
Monterey Segment 1: Alternative 1B
1. Total length of segments is 27,000'.
2. Alternative consists on constructing a busway in the existing Caltrains bike/pedestrian path
right-of-way.
3. Quantity take-offs for HMA, AS, LCB, Roadway Excavation, Imported Borrow, and striping
calculated per LF of shoulder busway.
Monterey Segment 2: Alternative 2A
1. Total length of segments is 29,500'.
2. Quantity take-offs for HMA, AS, LCB, Roadway Excavation, Imported Borrow, bus on shoulder
signs, and striping calculated per LF of shoulder widening.
3. Quantity take-offs for overhead signs, call boxes, catch basins, retaining walls, sound walls,
and light poles assumed based on Google Earth assessment.
Monterey Segment 2: Alternative 2B
1. Total length of segments is 6,500'.
2. Alternative consists on constructing a busway in the existing Monterey Branch Line rail right-
of-way next the the rail tracks.
3. 2,200 SF cut and cover tunnel required to cross Monterey Boulevard.
4. Retaining walls for cut and cover tunnel based on an 8% roadway grade.
5. All leased land within the right-of-way will be returned to TAMC will all improvements
removed.
6. New traffic signals for crossing Playa Avenue and Tioga Avenue.
Monterey Segment 3: Alternative A
1. Alternative consists of converting the right turn pockets on Del Monte at SR 218 to queue
jump lanes.
Monterey Segment 3: Alternative B
1. Total length of segments is 11,000'.
2. Quantity take-offs for HMA, AS, LCB, Roadway Excavation, Imported Borrow, bus on shoulder
signs, and striping calculated per LF of shoulder widening.
3. Quantity take-offs for overhead signs, call boxes, catch basins, retaining walls, sound walls,
and light poles assumed based on Google Earth assessment.
Estimate prepared by CDM Smith
Date: 6/26/2018

MONTEREY BAY AREA FEASIBILITY STUDY OF BUS OPERATIONS ON STATE ROUTE 1 SHOULDER AND MONTEREY
BRANCH LINE
Monterey Segment 4: Alternative A
1. Total length of segments is 10,500'.
2. Quantity take-offs for HMA, AS, LCB, Roadway Excavation, Imported Borrow, bus on shoulder
signs, and striping calculated per LF of shoulder widening.
3. Quantity take-offs for overhead signs, call boxes, catch basins, retaining walls, sound walls,
and light poles assumed based on Google Earth assessment.
Estimate prepared by CDM Smith
Date: 6/26/2018

APPENDIX B
BENEFIT-COST CALCULATIONS

All costs and benefits are shown in 2018 $.
Costs
Capital Costs
Construction Costs 6,000,000$
Right-of-Way -
Soft Costs 2,200,000$
Vehicles 5,900,000$
Total Capital Costs 14,100,000$
O&M Costs
Annual Costs 1,350,000$
Total Life-Cycle Costs 8,102,774$
Benefits
Travel Time Benefits
Northbound Travel
Savings for Transit Users (mins/passenger) 0.00
Existing transit ridership during the peak period 77
Annual Savings for Transit Users -$
Savings for Auto Users that Shift to Transit (mins/passenger) 0.00
2025 auto users that shift to transit during peak period 390
Annual Savings for Auto Users that Shift to Transit -$
Total Annual Travel Time Savings - Northbound -$
Total Life-Cycle Travel Time Savings - Northbound -$
Southbound Travel
Savings for Transit Users (mins/passenger) 8.80
Existing transit ridership during the peak period 55
Annual Savings for Transit Users 35,345$
Savings for Auto Users that Shift to Transit (mins/passenger) 4.20
2025 auto users that shift to transit during peak period 690
Annual Savings for Auto Users that Shift to Transit 194,764$
Total Annual Travel Time Savings - SB 230,110$
Total Life-Cycle Travel Time Savings - Southbound 1,381,131$
Total Life-Cycle Travel Time Savings 1,381,131$
Operating Costs Savings
Annual Cost Savings 450,613$
Total Life-Cycle Savings 2,704,602$
CO2 Emissions' Benefits
Annual VMT Reductions (miles/year) 3,531,800
Annual CO2 Emission Savings 64,371$
Total Life-Cycle CO2 Emission Savings 386,357$
Benefit-Cost Analysis
Present Value of Costs (in 2018 $) 22,202,774$
Present Value of Benefits (in 2018 $) 4,472,090$
Net Present Value (in 2018 $) (17,730,684)$
B-C Ratio 0.20
Assumptions:
Project life-cycle 7 years
Discount rate (Source: Cal-B/C Model) 4.00%
Value of time (Source: Cal B-C Model) 13.65 $/hour/person
Ratio of travel distance on SR-1 relative to overall bus routes' length 50%
Annualization factor 321 days/year
Vehicular CO2 Emissions (Source: EPA, 2017) 411 grams/mile
Monetary Cost of CO2 Emissions (Source: Institute for Policy Integrity, 2017) $44 per ton
Note:
Only half of the annual O&M costs associated with bus routes have been applied to the alternative based on the assumption that bus
routes would travel about half their trips along SR-1.
Monterey Bay Area Feasibility Study of Bus Operations on State Route 1 Shoulder and Monterey Branch Line
Santa Cruz Alternative 1

All costs and benefits are shown in 2018 $.
Costs
Capital Costs
Construction Costs 1,440,000$
Right-of-Way -
Soft Costs 520,000$
Vehicles 5,900,000$
Total Capital Costs 7,860,000$
O&M Costs
Annual Costs 1,350,000$
Total Life-Cycle Costs 23,344,245$
Benefits
Travel Time Benefits
Northbound Travel
Savings for Transit Users (mins/passenger) 17.10
Existing transit ridership during the peak period 77
Annual Savings for Transit Users 96,155$
Savings for Auto Users that Shift to Transit (mins/passenger) 4.48
2025 auto users that shift to transit during peak period 1100
Annual Savings for Auto Users that Shift to Transit 334,688$
Total Annual Travel Time Savings - Northbound 430,843$
Total Life-Cycle Travel Time Savings - Northbound 7,450,156$
Southbound Travel
Savings for Transit Users (mins/passenger) 7.90
Existing transit ridership during the peak period 55
Annual Savings for Transit Users 31,730$
Savings for Auto Users that Shift to Transit (mins/passenger) 14.20
2025 auto users that shift to transit during peak period 1050
Annual Savings for Auto Users that Shift to Transit 1,031,806$
Total Annual Travel Time Savings - SB 1,063,536$
Total Life-Cycle Travel Time Savings - Southbound 18,390,700$
Total Life-Cycle Travel Time Savings 25,840,856$
Operating Costs Savings
Annual Cost Savings 844,523$
Total Life-Cycle Savings 14,603,518$
CO2 Emissions' Benefits
Annual VMT Reductions (miles/year) 8,686,400
Annual CO2 Emission Savings 158,319$
Total Life-Cycle CO2 Emission Savings 2,737,652$
Benefit-Cost Analysis
Present Value of Costs (in 2018 $) 31,204,245$
Present Value of Benefits (in 2018 $) 43,182,026$
Net Present Value (in 2018 $) 11,977,781$
B-C Ratio 1.38
Assumptions:
Project life-cycle 30 years
Discount rate (Source: Cal-B/C Model) 4.00%
Value of time (Source: Cal B-C Model) 13.65 $/hour/person
Ratio of travel distance on SR-1 relative to overall bus routes' length 50%
Annualization factor 321 days/year
Vehicular CO2 Emissions (Source: EPA, 2017) 411 grams/mile
Monetary Cost of CO2 Emissions (Source: Institute for Policy Integrity, 2017) $44 per ton
Note:
Only half of the annual O&M costs associated with bus routes have been applied to the alternative based on the assumption that bus
routes would travel about half their trips along SR-1.
Monterey Bay Area Feasibility Study of Bus Operations on State Route 1 Shoulder and Monterey Branch Line
Santa Cruz Alternative 2A

All costs and benefits are shown in 2018 $.
Costs
Capital Costs
Construction Costs 1,640,000$
Right-of-Way -
Soft Costs 590,000$
Vehicles 5,900,000$
Total Capital Costs 8,130,000$
O&M Costs
Annual Costs 1,200,000$
Total Life-Cycle Costs 20,750,440$
Benefits
Travel Time Benefits
Northbound Travel
Savings for Transit Users (mins/passenger) 17.90
Existing transit ridership during the peak period 77
Annual Savings for Transit Users 100,654$
Savings for Auto Users that Shift to Transit (mins/passenger) 5.58
2025 auto users that shift to transit during peak period 1110
Annual Savings for Auto Users that Shift to Transit 420,941$
Total Annual Travel Time Savings - Northbound 521,595$
Total Life-Cycle Travel Time Savings - Northbound 9,019,430$
Southbound Travel
Savings for Transit Users (mins/passenger) 9.40
Existing transit ridership during the peak period 55
Annual Savings for Transit Users 37,755$
Savings for Auto Users that Shift to Transit (mins/passenger) 16.20
2025 auto users that shift to transit during peak period 1050
Annual Savings for Auto Users that Shift to Transit 1,177,130$
Total Annual Travel Time Savings - SB 1,214,885$
Total Life-Cycle Travel Time Savings - Southbound 21,007,840$
Total Life-Cycle Travel Time Savings 30,027,270$
Operating Costs Savings
Annual Cost Savings 921,391$
Total Life-Cycle Savings 15,932,720$
CO2 Emissions' Benefits
Annual VMT Reductions (miles/year) 8,734,100
Annual CO2 Emission Savings 159,188$
Total Life-Cycle CO2 Emission Savings 2,752,685$
Benefit-Cost Analysis
Present Value of Costs (in 2018 $) 28,880,440$
Present Value of Benefits (in 2018 $) 48,712,675$
Net Present Value (in 2018 $) 19,832,235$
B-C Ratio 1.69
Assumptions:
Project life-cycle 30 years
Discount rate (Source: Cal-B/C Model) 4.00%
Value of time (Source: Cal B-C Model) 13.65 $/hour/person
Ratio of travel distance on SR-1 relative to overall bus routes' length 50%
Annualization factor 321 days/year
Vehicular CO2 Emissions (Source: EPA, 2017) 411 grams/mile
Monetary Cost of CO2 Emissions (Source: Institute for Policy Integrity, 2017) $44 per ton
Note:
Only half of the annual O&M costs associated with bus routes have been applied to the alternative based on the assumption that bus
routes would travel about half their trips along SR-1.
Monterey Bay Area Feasibility Study of Bus Operations on State Route 1 Shoulder and Monterey Branch Line
Santa Cruz Alternative 2B

All costs and benefits are shown in 2018 $.
Costs
Capital Costs
Construction Costs 257,900,000$
Right-of-Way -$
Soft Costs 92,800,000$
Vehicles 13,400,000$
Total Capital Costs 364,100,000$
O&M Costs
Annual Costs 17,000,000$
Total Life-Cycle Costs 293,964,566$
Benefits
Travel Time Benefits
Northbound Travel
Savings for Transit Users (mins/passenger) 11.20
Existing transit ridership during the peak period 77
Annual Savings for Transit Users 58,859$
Savings for Auto Users that Shift to Transit (mins/passenger) 8.30
2025 auto users that shift to transit during peak period 1490
Annual Savings for Auto Users that Shift to Transit 800,429$
Total Annual Travel Time Savings - Northbound 859,288$
Total Life-Cycle Travel Time Savings - Northbound 14,858,836$
Southbound Travel
Savings for Transit Users (mins/passenger) 14.10
Existing transit ridership during the peak period 55
Annual Savings for Transit Users 52,928$
Savings for Auto Users that Shift to Transit (mins/passenger) 8.30
2025 auto users that shift to transit during peak period 1470
Annual Savings for Auto Users that Shift to Transit 801,562$
Total Annual Travel Time Savings - SB 854,490$
Total Life-Cycle Travel Time Savings - Southbound 14,775,870$
Total Life-Cycle Travel Time Savings 29,634,706$
Operating Costs Savings
Annual Cost Savings 361,578$
Total Life-Cycle Savings 6,011,941$
CO2 Emissions' Benefits
Annual VMT Reductions (miles/year) 12,504,600
Annual CO2 Emission Savings 227,909$
Total Life-Cycle CO2 Emission Savings 3,941,016$
Benefit-Cost Analysis
Present Value of Costs (in 2018 $) 658,064,566$
Present Value of Benefits (in 2018 $) 39,587,663$
Net Present Value (in 2018 $) (618,476,903)$
B-C Ratio 0.06
Assumptions:
Project life-cycle 30 years
Discount rate (Source: Cal-B/C Model) 4.00%
Value of time (Source: Cal B-C Model) 13.65 $/hour/person
Ratio of travel distance on SR-1 relative to overall bus routes' length 50%
Annualization factor 300 days/year
Vehicular CO2 Emissions (Source: EPA, 2017) 411 grams/mile
Monetary Cost of CO2 Emissions (Source: Institute for Policy Integrity, 2017) $44 per ton
Note:
Only half of the annual O&M costs associated with bus routes have been applied to the alternative based on the assumption that bus
routes would travel about half their trips along SR-1.
Monterey Bay Area Feasibility Study of Bus Operations on State Route 1 Shoulder and Monterey Branch Line
Santa Cruz Alternative 3

All costs and benefits are shown in 2018 $.
Costs
Capital Costs
Construction Costs 22,900,000$
Right-of-Way -
Soft Costs 8,100,000$
Vehicles 4,000,000$
Total Capital Costs 35,000,000$
O&M Costs
Annual Costs 3,490,000$
Total Life-Cycle Costs 60,349,196$
Benefits
Travel Time Benefits
Northbound Travel
Savings for Transit Users (mins/passenger) 0.00
Existing transit ridership during the peak period 455
Annual Savings for Transit Users -$
Savings for Auto Users that Shift to Transit (mins/passenger) 0.00
2025 auto users that shift to transit during peak period 850
Annual Savings for Auto Users that Shift to Transit -$
Total Annual Travel Time Savings - Northbound -$
Total Life-Cycle Travel Time Savings - Northbound -$
Southbound Travel
Savings for Transit Users (mins/passenger) 7.10
Existing transit ridership during the peak period 270
Annual Savings for Transit Users 139,994$
Savings for Auto Users that Shift to Transit (mins/passenger) 6.00
2025 auto users that shift to transit during peak period 640
Annual Savings for Auto Users that Shift to Transit 162,121$
Total Annual Travel Time Savings - SB 302,115$
Total Life-Cycle Travel Time Savings - Southbound 5,224,179$
Total Life-Cycle Travel Time Savings 5,224,179$
Operating Costs Savings
Annual Cost Savings 659,786$
Total Life-Cycle Savings 11,409,033$
CO2 Emissions' Benefits
Annual VMT Reductions (miles/year) 613,100
Annual CO2 Emission Savings 11,174$
Total Life-Cycle CO2 Emission Savings 193,228$
Benefit-Cost Analysis
Present Value of Costs (in 2018 $) 95,349,196$
Present Value of Benefits (in 2018 $) 16,826,439$
Net Present Value (in 2018 $) (78,522,757)$
B-C Ratio 0.176
Assumptions:
Project life-cycle 30 years
Discount rate (Source: Cal-B/C Model) 4.00%
Value of time (Source: Cal B-C Model) 13.65 $/hour/person
Ratio of travel distance on SR-1 relative to overall bus routes' length 50%
Annualization factor 321 days/year
Vehicular CO2 Emissions (Source: EPA, 2017) 411 grams/mile
Monetary Cost of CO2 Emissions (Source: Institute for Policy Integrity, 2017) $44 per ton
Note:
Only half of the annual O&M costs associated with bus routes have been applied to the alternative based on the assumption that bus
routes would travel about half their trips along SR-1.
Monterey Bay Area Feasibility Study of Bus Operations on State Route 1 Shoulder and Monterey Branch Line
Monterey Alt 1

All costs and benefits are shown in 2018 $.
Costs
Capital Costs
Construction Costs 20,800,000$
Right-of-Way -
Soft Costs 7,400,000$
Vehicles 4,000,000$
Total Capital Costs 32,200,000$
O&M Costs
Annual Costs 3,240,000$
Total Life-Cycle Costs 56,026,188$
Benefits
Travel Time Benefits
Northbound Travel
Savings for Transit Users (mins/passenger) 0.00
Existing transit ridership during the peak period 455
Annual Savings for Transit Users -$
Savings for Auto Users that Shift to Transit (mins/passenger) 0.00
2025 auto users that shift to transit during peak period 1060
Annual Savings for Auto Users that Shift to Transit -$
Total Annual Travel Time Savings - Northbound -$
Total Life-Cycle Travel Time Savings - Northbound -$
Southbound Travel
Savings for Transit Users (mins/passenger) 10.10
Existing transit ridership during the peak period 270
Annual Savings for Transit Users 199,146$
Savings for Auto Users that Shift to Transit (mins/passenger) 3.56
2025 auto users that shift to transit during peak period 670
Annual Savings for Auto Users that Shift to Transit 103,991$
Total Annual Travel Time Savings - SB 303,137$
Total Life-Cycle Travel Time Savings - Southbound 5,241,858$
Total Life-Cycle Travel Time Savings 5,241,858$
Operating Costs Savings
Annual Cost Savings 929,840$
Total Life-Cycle Savings 16,078,816$
CO2 Emissions' Benefits
Annual VMT Reductions (miles/year) 1,663,100
Annual CO2 Emission Savings 30,312$
Total Life-Cycle CO2 Emission Savings 524,151$
Benefit-Cost Analysis
Present Value of Costs (in 2018 $) 88,226,188$
Present Value of Benefits (in 2018 $) 21,844,825$
Net Present Value (in 2018 $) (66,381,363)$
B-C Ratio 0.25
Assumptions:
Project life-cycle 30 years
Discount rate (Source: Cal-B/C Model) 4.00%
Value of time (Source: Cal B-C Model) 13.65 $/hour/person
Ratio of travel distance on SR-1 relative to overall bus routes' length 50%
Annualization factor 321 days/year
Vehicular CO2 Emissions (Source: EPA, 2017) 411 grams/mile
Monetary Cost of CO2 Emissions (Source: Institute for Policy Integrity, 2017) $44 per ton
Note:
Only half of the annual O&M costs associated with bus routes have been applied to the alternative based on the assumption that bus
routes would travel about half their trips along SR-1.
Monterey Bay Area Feasibility Study of Bus Operations on State Route 1 Shoulder and Monterey Branch Line
Monterey Alt 2

Costs
Capital Costs
Construction Costs 21,900,000$
Right-of-Way -
Soft Costs 7,500,000$
Vehicles 4,000,000$
Total Capital Costs 33,400,000$
O&M Costs
Annual Costs 3,040,000$
Total Life-Cycle Costs 52,567,781$
Benefits
Travel Time Benefits
Northbound Travel
Savings for Transit Users (mins/passenger) 15.90
Existing transit ridership during the peak period 455
Annual Savings for Transit Users 528,317$
Savings for Auto Users that Shift to Transit (mins/passenger) 10.69
2025 auto users that shift to transit during peak period 1200
Annual Savings for Auto Users that Shift to Transit 581,595$
Total Annual Travel Time Savings - Northbound 1,109,912$
Total Life-Cycle Travel Time Savings - Northbound 19,192,637$
Southbound Travel
Savings for Transit Users (mins/passenger) 15.90
Existing transit ridership during the peak period 270
Annual Savings for Transit Users 313,507$
Savings for Auto Users that Shift to Transit (mins/passenger) 10.69
2025 auto users that shift to transit during peak period 710
Annual Savings for Auto Users that Shift to Transit 343,492$
Total Annual Travel Time Savings - SB 656,999$
Total Life-Cycle Travel Time Savings - Southbound 11,360,852$
Total Life-Cycle Travel Time Savings 30,553,489$
Operating Costs Savings
Annual Cost Savings 1,472,243$
Total Life-Cycle Savings 25,458,066$
CO2 Emissions' Benefits
Annual VMT Reductions (miles/year) 2,451,200
Annual CO2 Emission Savings 44,676$
Total Life-Cycle CO2 Emission Savings 772,533$
Benefit-Cost Analysis
Present Value of Costs (in 2018 $) 85,967,781$
Present Value of Benefits (in 2018 $) 56,784,089$
Net Present Value (in 2018 $) (29,183,692)$
B-C Ratio 0.66
Assumptions:
Project life-cycle 30 years
Discount rate (Source: Cal-B/C Model) 4.00%
Value of time (Source: Cal B-C Model) 13.65 $/hour/person
Ratio of travel distance on SR-1 relative to overall bus routes' length 50%
Annualization factor 321 days/year
Vehicular CO2 Emissions (Source: EPA, 2017) 411 grams/mile
Monetary Cost of CO2 Emissions (Source: Institute for Policy Integrity, 2017) $44 per ton
Note:
Only half of the annual O&M costs associated with bus routes have been applied to the alternative based on the assumption that bus
routes would travel about half their trips along SR-1.
Monterey Bay Area Feasibility Study of Bus Operations on State Route 1 Shoulder and Monterey Branch Line
Monterey Alt 3

Costs
Capital Costs
Construction Costs 14,890,000$
Right-of-Way -
Soft Costs 5,100,000$
Vehicles 4,000,000$
Total Capital Costs 23,990,000$
O&M Costs
Annual Costs 2,604,000$
Total Life-Cycle Costs 45,028,455$
Benefits
Travel Time Benefits
Northbound Travel
Savings for Transit Users (mins/passenger) 15.90
Existing transit ridership during the peak period 455
Annual Savings for Transit Users 528,317$
Savings for Auto Users that Shift to Transit (mins/passenger) 10.69
2025 auto users that shift to transit during peak period 1200
Annual Savings for Auto Users that Shift to Transit 581,595$
Total Annual Travel Time Savings - Northbound 1,109,912$
Total Life-Cycle Travel Time Savings - Northbound 19,192,637$
Southbound Travel
Savings for Transit Users (mins/passenger) 15.90
Existing transit ridership during the peak period 270
Annual Savings for Transit Users 313,507$
Savings for Auto Users that Shift to Transit (mins/passenger) 10.69
2025 auto users that shift to transit during peak period 710
Annual Savings for Auto Users that Shift to Transit 343,492$
Total Annual Travel Time Savings - SB 656,999$
Total Life-Cycle Travel Time Savings - Southbound 11,360,852$
Total Life-Cycle Travel Time Savings 30,553,489$
Operating Costs Savings
Annual Cost Savings 1,472,243$
Total Life-Cycle Savings 25,458,066$
CO2 Emissions' Benefits
Annual VMT Reductions (miles/year) 2,451,200
Annual CO2 Emission Savings 44,676$
Total Life-Cycle CO2 Emission Savings 772,533$
Benefit-Cost Analysis
Present Value of Costs (in 2018 $) 69,018,455$
Present Value of Benefits (in 2018 $) 56,784,089$
Net Present Value (in 2018 $) (12,234,366)$
B-C Ratio 0.82
Assumptions:
Project life-cycle 30 years
Discount rate (Source: Cal-B/C Model) 4.00%
Value of time (Source: Cal B-C Model) 13.65 $/hour/person
Ratio of travel distance on SR-1 relative to overall bus routes' length 50%
Annualization factor 321 days/year
Vehicular CO2 Emissions (Source: EPA, 2017) 411 grams/mile
Monetary Cost of CO2 Emissions (Source: Institute for Policy Integrity, 2017) $44 per ton
Note:
Monterey Bay Area Feasibility Study of Bus Operations on State Route 1 Shoulder and Monterey Branch Line
Monterey Alt 3 -Option I-B Only
Only half of the annual O&M costs associated with bus routes have been applied to the alternative based on the assumption that bus
routes would travel about half their trips along SR-1.

All costs and benefits are shown in 2018 $.
Costs
Capital Costs
Construction Costs 21,300,000$
Right-of-Way -
Soft Costs 7,300,000$
Vehicles 4,000,000$
Total Capital Costs 32,600,000$
O&M Costs
Annual Costs 3,020,000$
Total Life-Cycle Costs 52,221,941$
Benefits
Travel Time Benefits
Northbound Travel
Savings for Transit Users (mins/passenger) 15.90
Existing transit ridership during the peak period 455
Annual Savings for Transit Users 528,317$
Savings for Auto Users that Shift to Transit (mins/passenger) 10.69
2025 auto users that shift to transit during peak period 1200
Annual Savings for Auto Users that Shift to Transit 581,595$
Total Annual Travel Time Savings - Northbound 1,109,912$
Total Life-Cycle Travel Time Savings - Northbound 19,192,637$
Southbound Travel
Savings for Transit Users (mins/passenger) 15.90
Existing transit ridership during the peak period 270
Annual Savings for Transit Users 313,507$
Savings for Auto Users that Shift to Transit (mins/passenger) 10.69
2025 auto users that shift to transit during peak period 710
Annual Savings for Auto Users that Shift to Transit 343,492$
Total Annual Travel Time Savings - SB 656,999$
Total Life-Cycle Travel Time Savings - Southbound 11,360,852$
Total Life-Cycle Travel Time Savings 30,553,489$
Operating Costs Savings
Annual Cost Savings 1,472,243$
Total Life-Cycle Savings 25,458,066$
CO2 Emissions' Benefits
Annual VMT Reductions (miles/year) 2,451,200
Annual CO2 Emission Savings 44,676$
Total Life-Cycle CO2 Emission Savings 772,533$
Benefit-Cost Analysis
Present Value of Costs (in 2018 $) 84,821,941$
Present Value of Benefits (in 2018 $) 56,784,089$
Net Present Value (in 2018 $) (28,037,852)$
B-C Ratio 0.67
Assumptions:
Project life-cycle 30 years
Discount rate (Source: Cal-B/C Model) 4.00%
Value of time (Source: Cal B-C Model) 13.65 $/hour/person
Ratio of travel distance on SR-1 relative to overall bus routes' length 50%
Annualization factor 321 days/year
Vehicular CO2 Emissions (Source: EPA, 2017) 411 grams/mile
Monetary Cost of CO2 Emissions (Source: Institute for Policy Integrity, 2017) $44 per ton
Note:
Monterey Bay Area Feasibility Study of Bus Operations on State Route 1 Shoulder and Monterey Branch Line
Monterey Alt 4
Only half of the annual O&M costs associated with bus routes have been applied to the alternative based on the assumption that bus
routes would travel about half their trips along SR-1.

All costs and benefits are shown in 2018 $.
Costs
Capital Costs
Construction Costs 4,800,000$
Right-of-Way -
Soft Costs 1,700,000$
Vehicles 4,000,000$
Total Capital Costs 10,500,000$
O&M Costs
Annual Costs 2,690,000$
Total Life-Cycle Costs 46,515,570$
Benefits
Travel Time Benefits
Northbound Travel
Savings for Transit Users (mins/passenger) 4.80
Existing transit ridership during the peak period 455
Annual Savings for Transit Users 159,492$
Savings for Auto Users that Shift to Transit (mins/passenger) 4.80
2025 auto users that shift to transit during peak period 1150
Annual Savings for Auto Users that Shift to Transit 243,620$
Total Annual Travel Time Savings - Northbound 403,112$
Total Life-Cycle Travel Time Savings - Northbound 6,970,623$
Southbound Travel
Savings for Transit Users (mins/passenger) 0.00
Existing transit ridership during the peak period 270
Annual Savings for Transit Users -$
Savings for Auto Users that Shift to Transit (mins/passenger) 0.00
2025 auto users that shift to transit during peak period 500
Annual Savings for Auto Users that Shift to Transit -$
Total Annual Travel Time Savings - SB -$
Total Life-Cycle Travel Time Savings - Southbound -$
Total Life-Cycle Travel Time Savings 6,970,623$
Operating Costs Savings
Annual Cost Savings 441,873$
Total Life-Cycle Savings 7,640,883$
CO2 Emissions' Benefits
Annual VMT Reductions (miles/year) 1,313,400
Annual CO2 Emission Savings 23,938$
Total Life-Cycle CO2 Emission Savings 413,938$
Benefit-Cost Analysis
Present Value of Costs (in 2018 $) 57,015,570$
Present Value of Benefits (in 2018 $) 15,025,443$
Net Present Value (in 2018 $) (41,990,126)$
B-C Ratio 0.26
Assumptions:
Project life-cycle 30 years
Discount rate (Source: Cal-B/C Model) 4.00%
Value of time (Source: Cal B-C Model) 13.65 $/hour/person
Ratio of travel distance on SR-1 relative to overall bus routes' length 50%
Annualization factor 321 days/year
Vehicular CO2 Emissions (Source: EPA, 2017) 411 grams/mile
Monetary Cost of CO2 Emissions (Source: Institute for Policy Integrity, 2017) $44 per ton
Note:
Monterey Bay Area Feasibility Study of Bus Operations on State Route 1 Shoulder and Monterey Branch Line
Monterey Alt 5
Only half of the annual O&M costs associated with bus routes have been applied to the alternative based on the assumption that bus
routes would travel about half their trips along SR-1.

All costs and benefits are shown in 2018 $.
Costs
Capital Costs
Construction Costs 327,700,000$
Right-of-Way -
Soft Costs 118,000,000$
Vehicles 4,000,000$
Total Capital Costs 449,700,000$
O&M Costs
Annual Costs 24,660,000$
Total Life-Cycle Costs 426,421,541$
Benefits
Travel Time Benefits
Northbound Travel
Savings for Transit Users (mins/passenger) 14.20
Existing transit ridership during the peak period 455
Annual Savings for Transit Users 471,831$
Savings for Auto Users that Shift to Transit (mins/passenger) 14.20
2025 auto users that shift to transit during peak period 1210
Annual Savings for Auto Users that Shift to Transit 782,928$
Total Annual Travel Time Savings - Northbound 1,254,759$
Total Life-Cycle Travel Time Savings - Northbound 21,697,326$
Southbound Travel
Savings for Transit Users (mins/passenger) 14.20
Existing transit ridership during the peak period 270
Annual Savings for Transit Users 279,987$
Savings for Auto Users that Shift to Transit (mins/passenger) 14.20
2025 auto users that shift to transit during peak period 720
Annual Savings for Auto Users that Shift to Transit 466,646$
Total Annual Travel Time Savings - SB 746,633$
Total Life-Cycle Travel Time Savings - Southbound 12,910,805$
Total Life-Cycle Travel Time Savings 34,608,131$
Operating Costs Savings
Annual Cost Savings 1,312,340$
Total Life-Cycle Savings 22,693,018$
CO2 Emissions' Benefits
Annual VMT Reductions (miles/year) 2,538,500
Annual CO2 Emission Savings 46,267$
Total Life-Cycle CO2 Emission Savings 800,047$
Benefit-Cost Analysis
Present Value of Costs (in 2018 $) 876,121,541$
Present Value of Benefits (in 2018 $) 58,101,197$
Net Present Value (in 2018 $) (818,020,344)$
B-C Ratio 0.07
Assumptions:
Project life-cycle 30 years
Discount rate (Source: Cal-B/C Model) 4.00%
Value of time (Source: Cal B-C Model) 13.65 $/hour/person
Ratio of travel distance on SR-1 relative to overall bus routes' length 50%
Annualization factor 321 days/year
Vehicular CO2 Emissions (Source: EPA, 2017) 411 grams/mile
Monetary Cost of CO2 Emissions (Source: Institute for Policy Integrity, 2017) $44 per ton
Note:
Monterey Bay Area Feasibility Study of Bus Operations on State Route 1 Shoulder and Monterey Branch Line
Monterey Alt 7
Only half of the annual O&M costs associated with bus routes have been applied to the alternative based on the assumption that bus
routes would travel about half their trips along SR-1.
