final end of year results presentation 2016 - amazon...
TRANSCRIPT

FY 2016
End of Year Results Presentation
1

FY16 HIGHLIGHTS
2
Acquisition of INVE Aquaculture in December 2015 for US$342m (c.£230m) created new Advanced Animal Nutrition division
Funded by £219m (gross) equity raise and US$70m revolving credit facility
INVE revenue of £55m in line with expectations
Like for like2 revenue up 20% to £30m (2015: £25m)
Operating loss reflects
£12.9m expensed acquisition and integration costs related to INVE
£11.7m investment in expensed R&D (2015: £6.6m)
£30.7m (gross) equity placing in August 2016 to fund capital projects and bolt-on acquisitions
Cash and cash equivalents at period end of £38.1m (2015: £13.6m)
Financial Highlights
£m 2016 2015
Revenue 109.4 44.2
EBITDA from Trading Activities1 22.3 2.4
Adjusted EBITDA3 9.2 (5.7)
Operating loss (20.5) (11.6)
Basic loss per share (pence) (4.39) (5.96)
Net cash 0.4 13.4
1 EBITDA from Trading Activities – excludes costs relating to Investing Activities from reported IFRS numbers. Investing Activities comprise exceptional restructuring costs, acquisition costs, pre-operational expenses for new ventures and research and development expenditure2Like for like – statutory IFRS results excluding businesses acquired in either 2016 or 2015 (primarily the Breeding and Genetics division and INVE) 3 Adjusted EBITDA – EBITDA before exceptional and acquisition cost

Integration of INVE acquisition on track, synergies delivered with Benchmark Group include
First sales of new aquaculture vaccine for sea bass achieved
First major tilapia breeding programme in Asia for Spring Genetics secured post period end
Bolt-on acquisition of world leading shrimp breeding programme in Colombia
Adverse environmental factors mitigated by diversified Group portfolio
£16m investment in state-of-the-art vaccine manufacturing facility in Braintree in commissioning phase, first commercial batches expected in H2 FY 2017
Constructing new year-round, land based salmon egg production unit in Norway which will increase salmon ova production capacity by 37.5%
Ten-year contract with top three global salmon producer supplying genetic material, breeding selection services and health support
Pipeline of products continues to progress well
Eight products developed entirely in-house in final regulatory approval or have achieved first sales
Current product pipeline of 94 products with an addressable market of £783m
FY16 HIGHLIGHTS
3
Operational Highlights

Completing our Technology Platform by adding a world-leading nutrition business
Presence in >70 countries
25% market share in global hatchery segment (fish & shrimp)
Increased global distribution network
Integration progressing well
Key Account Management programme across combined customer portfolio
Work on first co-developed products commenced
STRATEGIC PROGRESS
4

Extracting synergies and entering new genetics markets
Acquisition of one of the world’s leading shrimp breeding programmes
Growing global demand for faster growing, more robust shrimp
Increases market penetration in the shrimp sector together with INVE
Adds to Benchmark’s unique combined offering of genetics, nutrition and health
INTEGRATING INVE
5
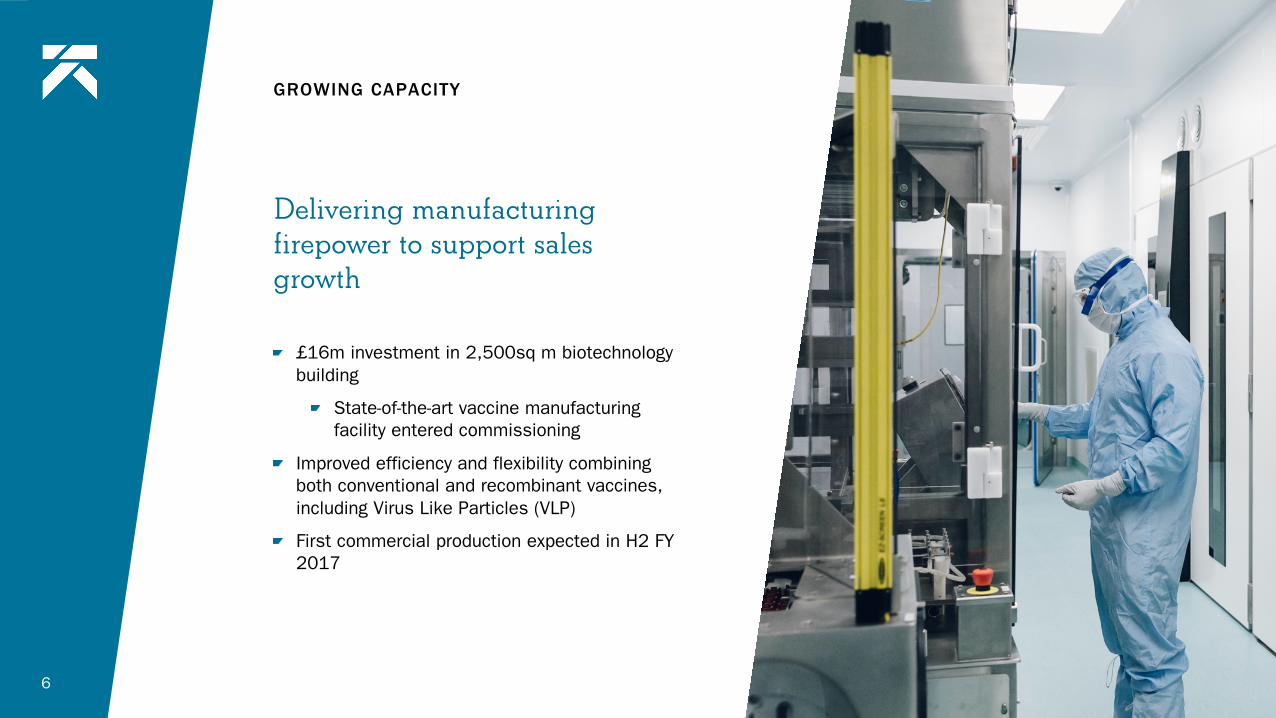
Delivering manufacturing firepower to support sales growth
£16m investment in 2,500sq m biotechnology building
State-of-the-art vaccine manufacturing facility entered commissioning
Improved efficiency and flexibility combining both conventional and recombinant vaccines, including Virus Like Particles (VLP)
First commercial production expected in H2 FY 2017
GROWING CAPACITY
6

Increasing salmon egg production capacity to meet demand
Building commenced of Benchmark’s new land-based salmon broodstock and egg facility –SalmoBreed Salten - in Norway
Capacity to deliver 150m eggs per year and deliver 52 weeks a year
Funded by £31m capital raise in August 2016
GROWING CAPACITY
7

Pipeline of new healthcare technologies to solve major disease problems
Sealice treatment — effective against ALL resistant sealice in Salmon
Streptococcus vaccine — the disease accounts for more deaths in fish than any other
VLP technology — transferring technology that has seen success in human vaccines into the animal healthcare industry
Noda-vibrio vaccine – marine fin fish
Sweetitch - horses
Canine Atopic Dermatitis
PRODUCT EXPANSION & PROGRESSION
8
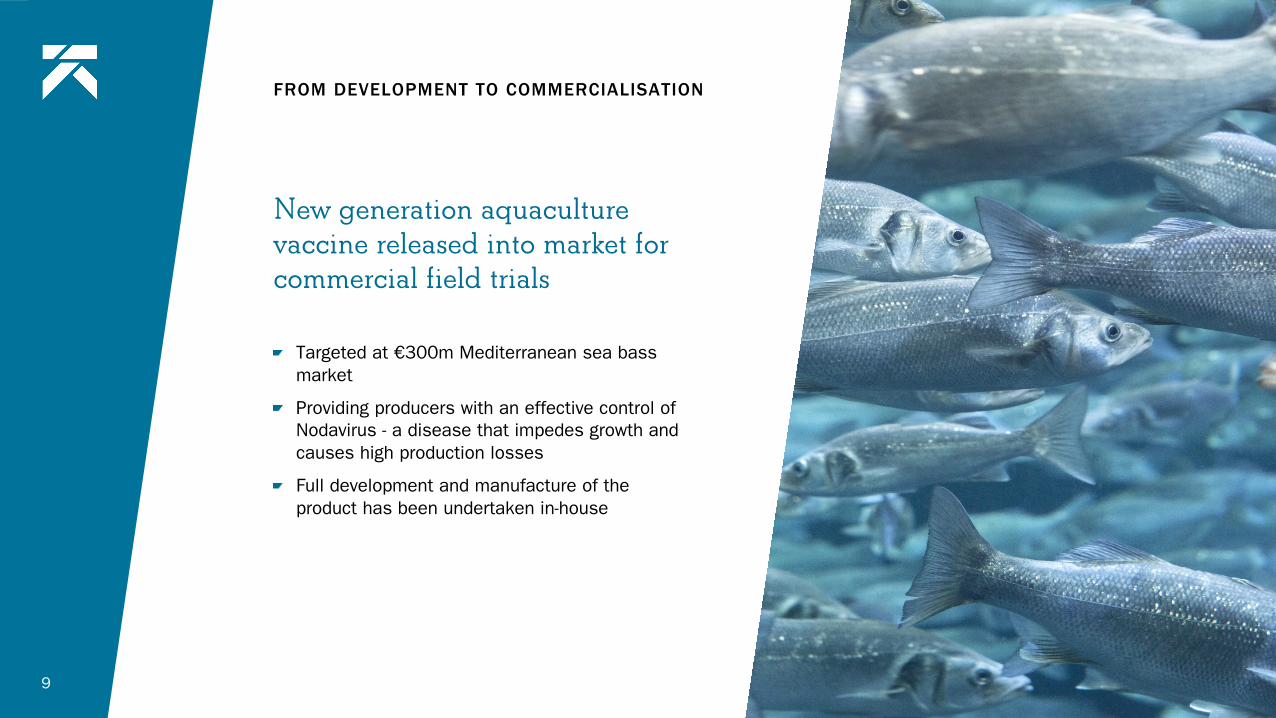
New generation aquaculture vaccine released into market for commercial field trials
Targeted at €300m Mediterranean sea bass market
Providing producers with an effective control of Nodavirus - a disease that impedes growth and causes high production losses
Full development and manufacture of the product has been undertaken in-house
FROM DEVELOPMENT TO COMMERCIALISATION
9

PRODUCT PIPELINE
10
Discovery /Pre-Poc Passed Poc Development Trials In Regulatory First Sales Achieved
Number of products 20 12 11 6 2
Addressable market £618m £256m £73m £215m £67m £7m
AN
IMA
L H
EA
LTH
BR
EE
DIN
G
& G
EN
ETIC
S
Pre-Project Project Phase Test Development Launch
Number of products 3 2 6 7
Addressable market £95m £20m £16m £23m £36m
AD
VA
NC
ED
AN
IMA
L
NU
TR
ITIO
N
*Fullproductpipelinesareoutlinedintheappendix.
Development & Lab Testing Field Verification Market Preparation Start of salesup to 1Y
Number of products 10 10 4 1
Addressable market£70m £48m £18m £4m £0.2m
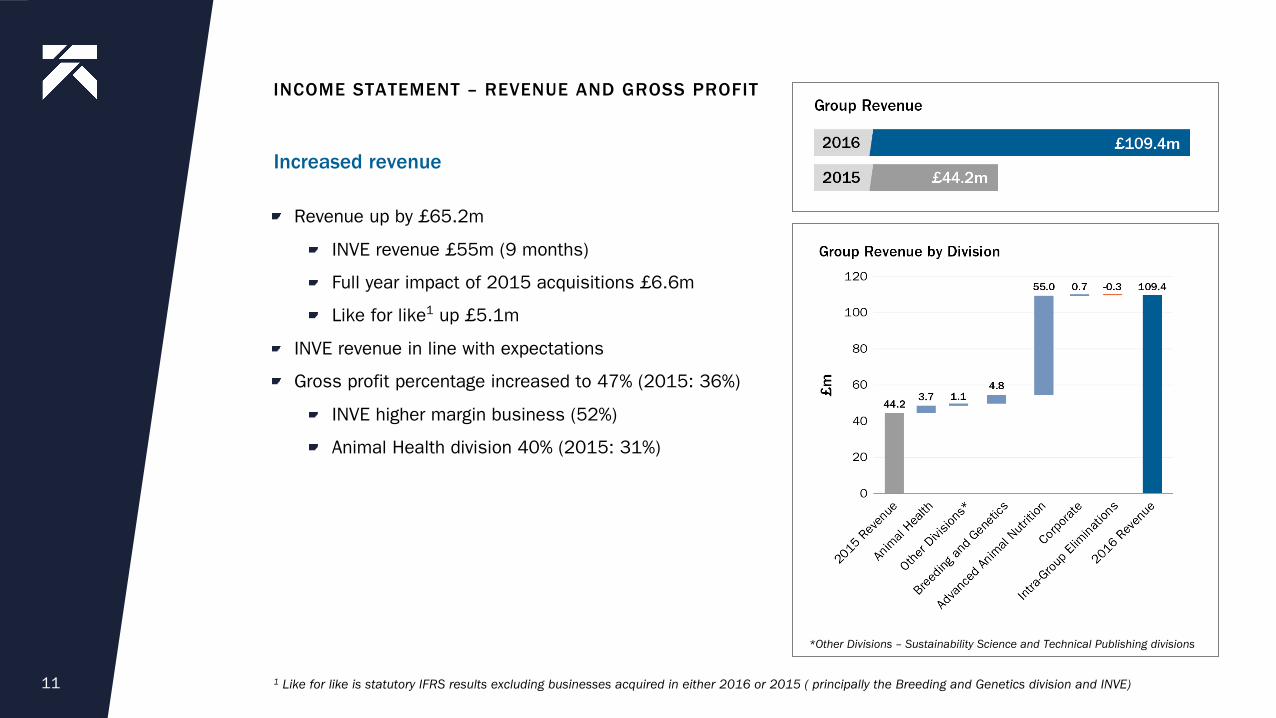
INCOME STATEMENT – REVENUE AND GROSS PROFIT
Revenue up by £65.2m
INVE revenue £55m (9 months)
Full year impact of 2015 acquisitions £6.6m
Like for like1 up £5.1m
INVE revenue in line with expectations
Gross profit percentage increased to 47% (2015: 36%)
INVE higher margin business (52%)
Animal Health division 40% (2015: 31%)
11 1 Like for like is statutory IFRS results excluding businesses acquired in either 2016 or 2015 ( principally the Breeding and Genetics division and INVE)
Increased revenue
*Other Divisions – Sustainability Science and Technical Publishing divisions
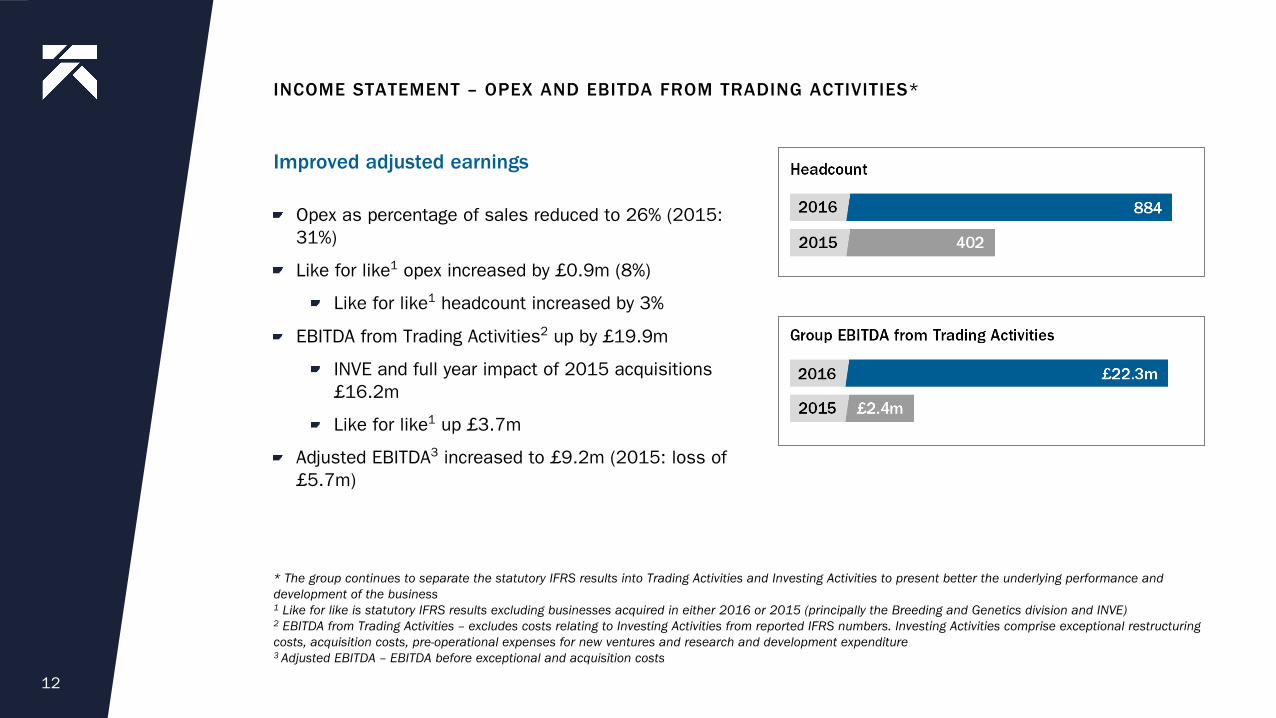
INCOME STATEMENT – OPEX AND EBITDA FROM TRADING ACTIVITIES*
Opex as percentage of sales reduced to 26% (2015: 31%)
Like for like1 opex increased by £0.9m (8%)
Like for like1 headcount increased by 3%
EBITDA from Trading Activities2 up by £19.9m
INVE and full year impact of 2015 acquisitions £16.2m
Like for like1 up £3.7m
Adjusted EBITDA3 increased to £9.2m (2015: loss of £5.7m)
12
* The group continues to separate the statutory IFRS results into Trading Activities and Investing Activities to present better the underlying performance and development of the business1 Like for like is statutory IFRS results excluding businesses acquired in either 2016 or 2015 (principally the Breeding and Genetics division and INVE)2 EBITDA from Trading Activities – excludes costs relating to Investing Activities from reported IFRS numbers. Investing Activities comprise exceptional restructuring costs, acquisition costs, pre-operational expenses for new ventures and research and development expenditure3 Adjusted EBITDA – EBITDA before exceptional and acquisition costs
Improved adjusted earnings

INCOME STATEMENT – INVESTING ACTIVITIES*
Commitment to invest in R&D
Like for like1 investment in R&D increased by £2.5m (35%)
Investment in R&D includes £1.4m capitalised
Expensed R&D 11% of revenue (2015: 15%)
Amortisation substantially related to acquired intangibles
Acquisition costs substantially re INVE
Finance costs mainly relate to acquisition finance
13
Investing in the pipeline
*The group continues to separate the statutory IFRS results into Trading Activities and Investing Activities to present better the underlying performance and development of the business1 Like for like is statutory IFRS results excluding businesses acquired in either 2016 or 2015 (principally the Breeding and Genetics division and INVE)

CASHFLOW AND BALANCE SHEET
Cash outflow from operations
Investment in expensed R&D
Increased working capital requirements of enlarged group
Free cash outflow of £30.6m reflects
investment capex of £15.4m
acquisition costs of £11.5m
deferred consideration payments of £9.6m
Cash and cash equivalents £38.1m (2015 £13.4m)
Net cash at year end £0.4m (2015: £13.6m)
14
Cash generation and deployment of capital

Growing our sustainable business and delivering sustainable shareholder returns
Global demand to grow at 5% per annum
Delivery of commercial sales from robust pipeline of new products
Increasing number of products expected to come to market from 2017 to 2019
Current year started in line with expectations
Expected recovery from softness in Asian shrimp farming market following disease challenges may run into 2018
Salmon farming market experiencing record high prices which look likely to be sustained
New markets and customers opening up as Benchmark’s role in the “Blue Revolution” is increasingly recognised
OUTLOOK
15
Source: Historical data 1950-2010: FAO 2014. “FishStatJ.” Rome: FAO. Projections 2011-20150: Calculated at WRI, assumes 10 per cent reduction in wild fish catch between 2010 and 2050, and linear growth of aquaculture production at an additional 2 million tons per year between 2010 and 2050
Seafood supply — all growth will come from aquaculture

Appendix
16

17
BENCHMARK’S TECHNOLOGY PLATFORM
Biological control is the key driver for sustainable growth
Harnessing best expertise
Deploying cutting edge technologies
Embedded alongside our customers

PRODUCT PIPELINE —ANIMAL HEALTH
18
51 products
Addressable market of £618m
34 vaccine projects that can be manufactured at Benchmark’s newly upgraded facility in Braintree, UK

PRODUCT PIPELINE —ADVANCED ANIMAL NUTRITION
19
25 products
Addressable market of £70m

PRODUCT PIPELINE —BREEDING AND GENETICS
20
18 products
Addressable market of £95m
Recently expanded through Shrimp Breeding programme acquisition

FINANCIAL REVIEW: KNOWLEDGE SERVICES -SUSTAINABILITY SCIENCE & TECHNICAL PUBLISHING DIVISIONS
21
Revenue up £1.1m to £11.2m
Like for like1 down £0.6m due to strategy to focus on higher margin business
EBITDA from Trading Activities2 up £0.4m to £0.2m
£2.7m invested in FAI Aquaculture’s R&D and production sites in Scotland
1 Like for like is statutory IFRS results excluding businesses acquired in either 2016 or 2015 ( principally the Breeding and Genetics division and INVE)2 EBITDA from Trading Activities – excludes costs relating to Investing Activities from reported IFRS numbers. Investing Activities comprise exceptional restructuring costs, acquisition costs, pre-operational expenses for new ventures and research and development expenditure

FINANCIAL REVIEW: ANIMAL HEALTH DIVISION
22
Revenue up 18% to £24.8m
Recovery of Salmosan sales
EBITDA from Trading Activities2 up 109% to £4.5m
Expensed R&D up £3.1m (59%) to £8.3m
R&D capitalised for the first time – total £0.7m
£8.6m invested in the year in Benchmark Vaccine’s manufacturing facility in Braintree
2 EBITDA from Trading Activities – excludes costs relating to Investing Activities from reported IFRS numbers. Investing Activities comprise exceptional restructuring costs, acquisition costs, pre-operational expenses for new ventures and research and development expenditure

FINANCIAL REVIEW: BREEDING AND GENETICS DIVISION
23
Revenue up by £4.8m to £20.7m
Full year impact of 2015 acquisitions £5.1m
Reduction of £3.1m due to Chile border closure
AFGC growth of £1.4m
EBITDA from Trading Activities2 down by £1.1m to £3.6m
Positive full year impact of 2015 acquisitions £0.4m
Reduction of £2m due to Chile border closure
AFGC growth of £1.3m
Expensed R&D up by £0.8m – full year impact of 2015 acquisitions
£1.8m invested in the year in new salmon pedigree stock facility and lumpfish production capacity
2 EBITDA from Trading Activities – excludes costs relating to Investing Activities from reported IFRS numbers. Investing Activities comprise exceptional restructuring costs, acquisition costs, pre-operational expenses for new ventures and research and development expenditure

FINANCIAL REVIEW: ADVANCED ANIMAL NUTRITION DIVISION
24
Revenue in line with expectations
INVE’s sales12 months to 30 September 2016 8% above same period in prior year
Revenue growth for all products except for diet sales in Asia due to El Nino and disease factors
Gross profit percentage 51.8%
Improved for all product categories
Overall gross profit percentage reduced due to product mix – lower proportion of diet sales
Controlled increase in headcount / opex - investment for future growth
EBITDA from Trading Activities2 in line with expectations despite market challenges
EBITDA margin 28.8%
Expensed R&D £1.3m and capitalised £0.7m
2 EBITDA from Trading Activities – excludes costs relating to Investing Activities from reported IFRS numbers. Investing Activities comprise exceptional restructuring costs, acquisition costs, pre-operational expenses for new ventures and research and development expenditure

IMPORTANT NOTICE
25
This presentation has been prepared by Benchmark Holdings plc (the "Company") in connection with the release of its Annual Report and Accounts for the year ended 30 September 2016.
This presentation does not constitute a prospectus or an admission document relating to the Company, nor does it constitute or form part of any offer or invitation to purchase, sell or subscribe for, or any solicitation of any such offer to purchase, sell or subscribe for, any securities in the Company nor shall this presentation or any part of it, or the fact of its distribution, form the basis of, or be relied on in connection with, any contract for the same.
No reliance may be placed, for any purposes whatsoever, on the information contained in this presentation or on its completeness. No representation or warranty, express or implied, is given by or on behalf of the Company, Numis Securities Limited ("Numis") or any of their respective directors, partners, officers, employees, advisers or any other persons as to the accuracy, fairness or sufficiency of the information or opinions contained in this presentation and none of the information contained in this presentation has been independently verified by any person, including Numis. Save in the case of fraud, no liability is accepted for any errors, omissions or inaccuracies in such information or opinions.
This presentation is being made only in the United Kingdom and is directed only at (i) persons having professional experience in matters relating to investments, i.e. investment professionals within the meaning of Article 19(5) of the Financial Services and Markets Act 2000 (Financial Promotion) Order 2005, as amended (the "FPO"), (ii) persons in the business of disseminating information within the meaning of Article 47 of the FPO and (iii) high net-worth companies, unincorporated associations and other bodies within the meaning of Article 49 of the FPO and (iv) persons to whom it is otherwise lawful to make the presentation. The investment or investment activity to which this presentation relates is available only to such persons and will be engaged in only with such persons. Persons who fall outside categories (i) - (iii) above must check that they fall within category (iv).
Neither this presentation nor any copy of it may be (i) taken or transmitted into the United States of America, (ii) distributed, directly or indirectly, in the United States of America or to any US person (within the meaning of regulations made under the Securities Act 1933, as amended), (iii) taken or transmitted into or distributed in Canada, Australia, the Republic of Ireland or the Republic of South Africa or to any resident thereof, or (iv) taken or transmitted into or distributed in Japan or to any resident thereof. Any failure to comply with these restrictions may constitute a violation of the securities laws or the laws of any such jurisdiction. The distribution of this document in other jurisdictions may be restricted by law and the persons into whose possession this document comes should inform themselves about, and observe, any such restrictions.
This presentation is confidential and must not be copied, reproduced, published, distributed, disclosed or passed to any other person at any time without the prior written consent of the Company.