2016 full year results presentation -...
TRANSCRIPT
2016 FULL YEAR RESULTSPRESENTATION
7 March 2017
Strong Revenue, Earnings and
Cash Performance
CAUTIONARY STATEMENT REGARDING FORWARD-LOOKING STATEMENTS
This presentation contains certain forward-looking statements with respect to the financial condition, results, operations and business of Intertek Group plc.
These statements and forecasts involve risk and uncertainty because they relate to events and depend upon circumstances that will occur in the future.
There are a number of factors that could cause actual results or developments to differ materially from those expressed or implied by these forward-looking statements and forecasts.
Nothing in this presentation should be construed as a profit forecast.
7 March 2017
2

AGENDA
3
Performance Highlights
2016 Financial Results
2016 Strategic Update
2017 Outlook by Division
Summary
01
05
04
03
02

01PERFORMANCEHIGHLIGHTS
André Lacroix Chief Executive Officer
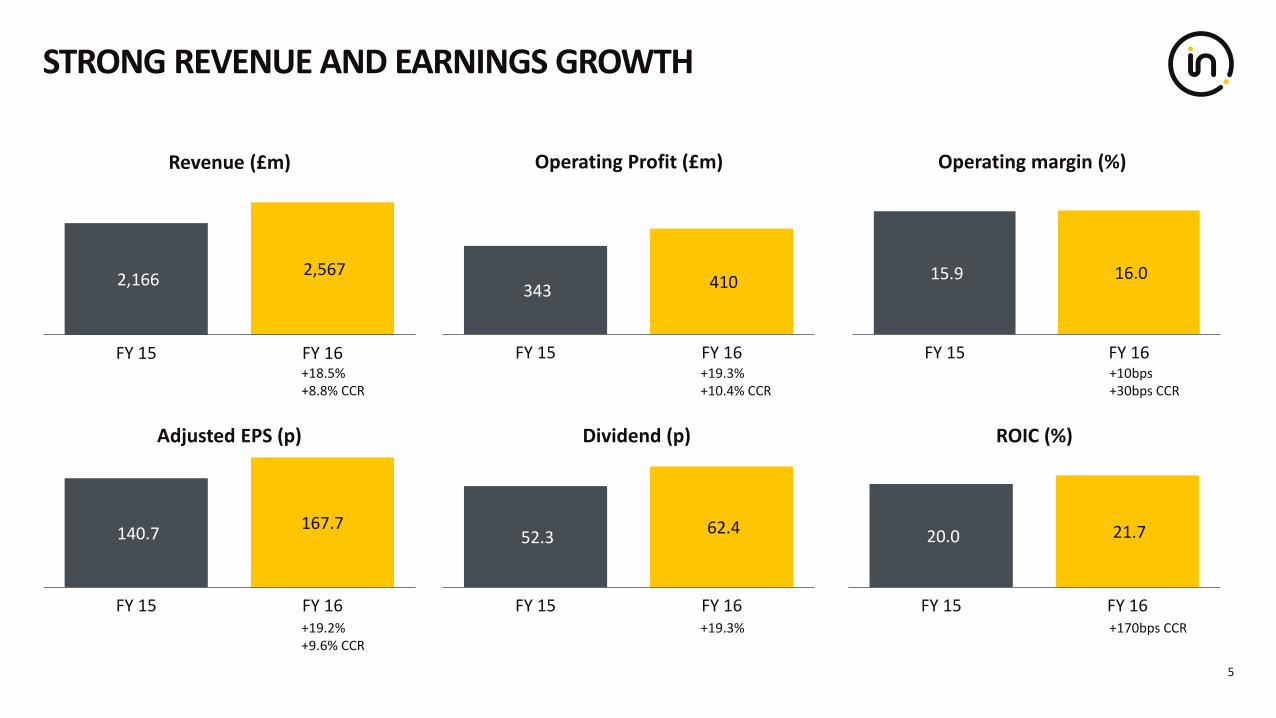
STRONG REVENUE AND EARNINGS GROWTH
5
2,166 2,567
FY 15 FY 16
Revenue (£m)
343 410
FY 15 FY 16
Operating Profit (£m)
15.9 16.0
FY 15 FY 16
Operating margin (%)
140.7 167.7
FY 15 FY 16
Adjusted EPS (p)
52.3 62.4
FY 15 FY 16
Dividend (p)
20.0 21.7
FY 15 FY 16
ROIC (%)
+18.5%+8.8% CCR
+19.3%+10.4% CCR
+10bps+30bps CCR
+19.2%+9.6% CCR
+19.3% +170bps CCR
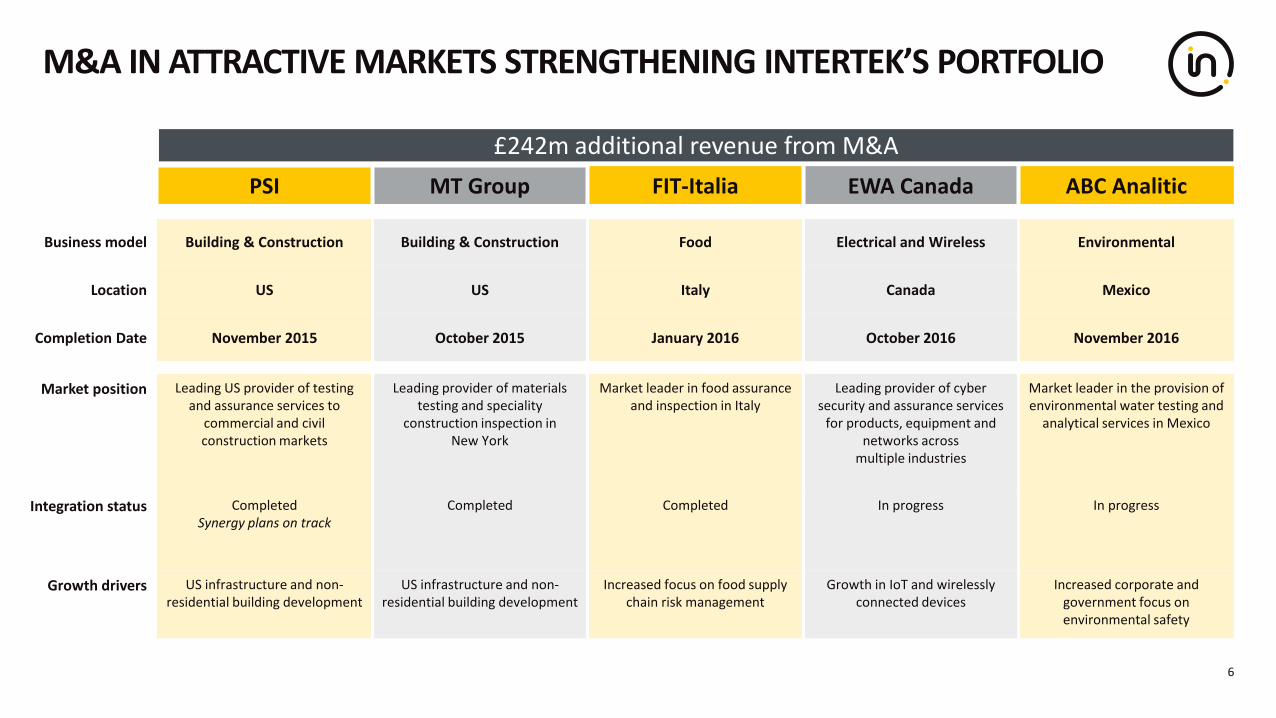
M&A IN ATTRACTIVE MARKETS STRENGTHENING INTERTEK’S PORTFOLIO
6
PSI MT Group FIT-Italia EWA Canada ABC Analitic
Business model Building & Construction Building & Construction Food Electrical and Wireless Environmental
Location US US Italy Canada Mexico
Completion Date November 2015 October 2015 January 2016 October 2016 November 2016
Market position Leading US provider of testing and assurance services to
commercial and civil construction markets
Leading provider of materials testing and speciality
construction inspection in New York
Market leader in food assuranceand inspection in Italy
Leading provider of cyber security and assurance services
for products, equipment and networks across
multiple industries
Market leader in the provision of environmental water testing and
analytical services in Mexico
Integration status CompletedSynergy plans on track
Completed Completed In progress In progress
Growth drivers US infrastructure and non-residential building development
US infrastructure and non-residential building development
Increased focus on food supply chain risk management
Growth in IoT and wirelessly connected devices
Increased corporate and government focus on environmental safety
£242m additional revenue from M&A
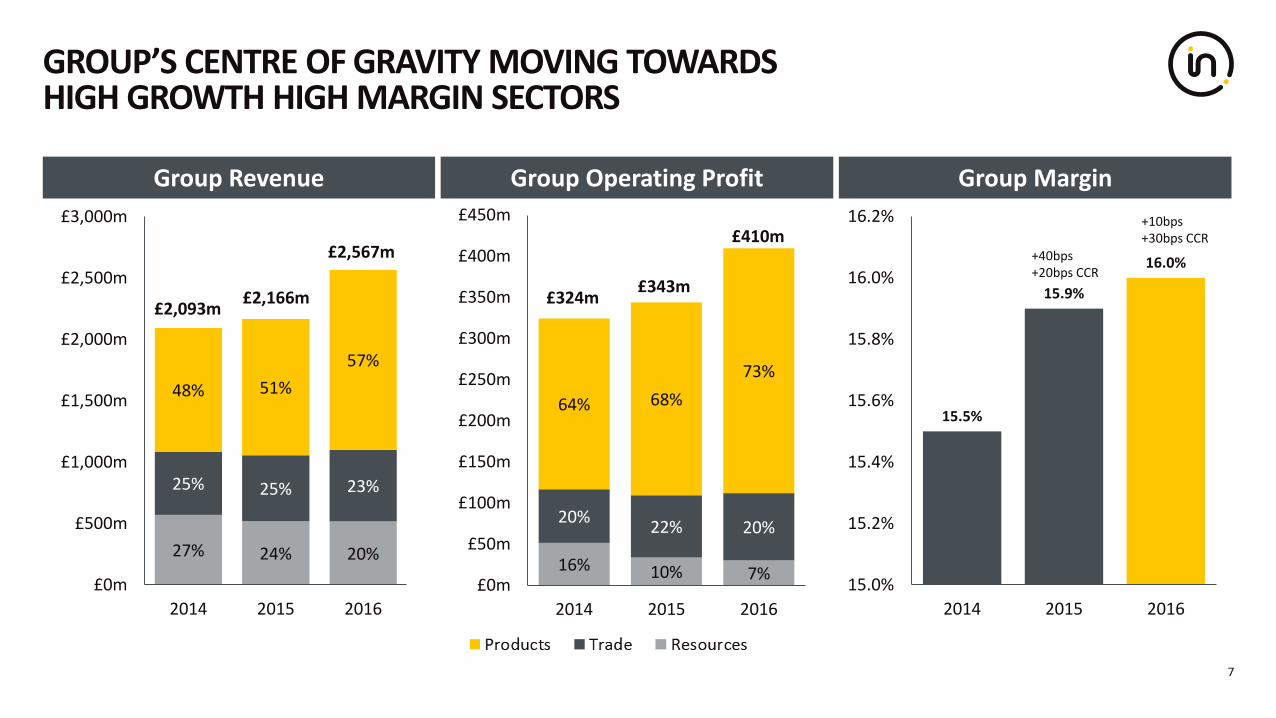
GROUP’S CENTRE OF GRAVITY MOVING TOWARDS HIGH GROWTH HIGH MARGIN SECTORS
7
15.5%
15.9%
16.0%
15.0%
15.2%
15.4%
15.6%
15.8%
16.0%
16.2%
2014 2015 2016
Group Revenue Group Operating Profit
27% 24% 20%
25% 25% 23%
48% 51%
57%
£0m
£500m
£1,000m
£1,500m
£2,000m
£2,500m
£3,000m
2014 2015 2016
16% 10% 7%
20%22% 20%
64% 68%
73%
£0m
£50m
£100m
£150m
£200m
£250m
£300m
£350m
£400m
£450m
2014 2015 2016
Group Margin
+40bps+20bps CCR
+10bps+30bps CCR
£2,093m £2,166m
£2,567m
£324m £343m
£410m
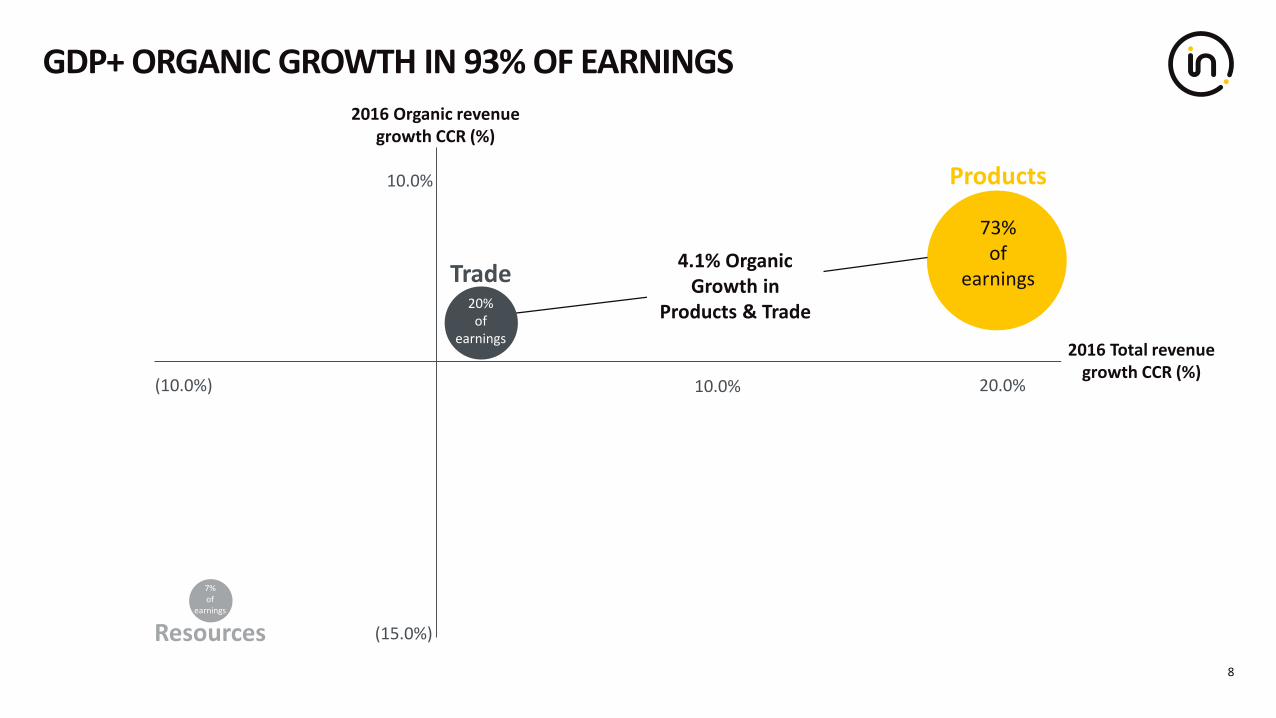
GDP+ ORGANIC GROWTH IN 93% OF EARNINGS
8
Trade
Products
Resources
73% of
earnings20%
of earnings
7% of
earnings
10.0%
(15.0%)
10.0%
(10.0%) 20.0%
4.1% Organic Growth in
Products & Trade
2016 Total revenue growth CCR (%)
2016 Organic revenue growth CCR (%)
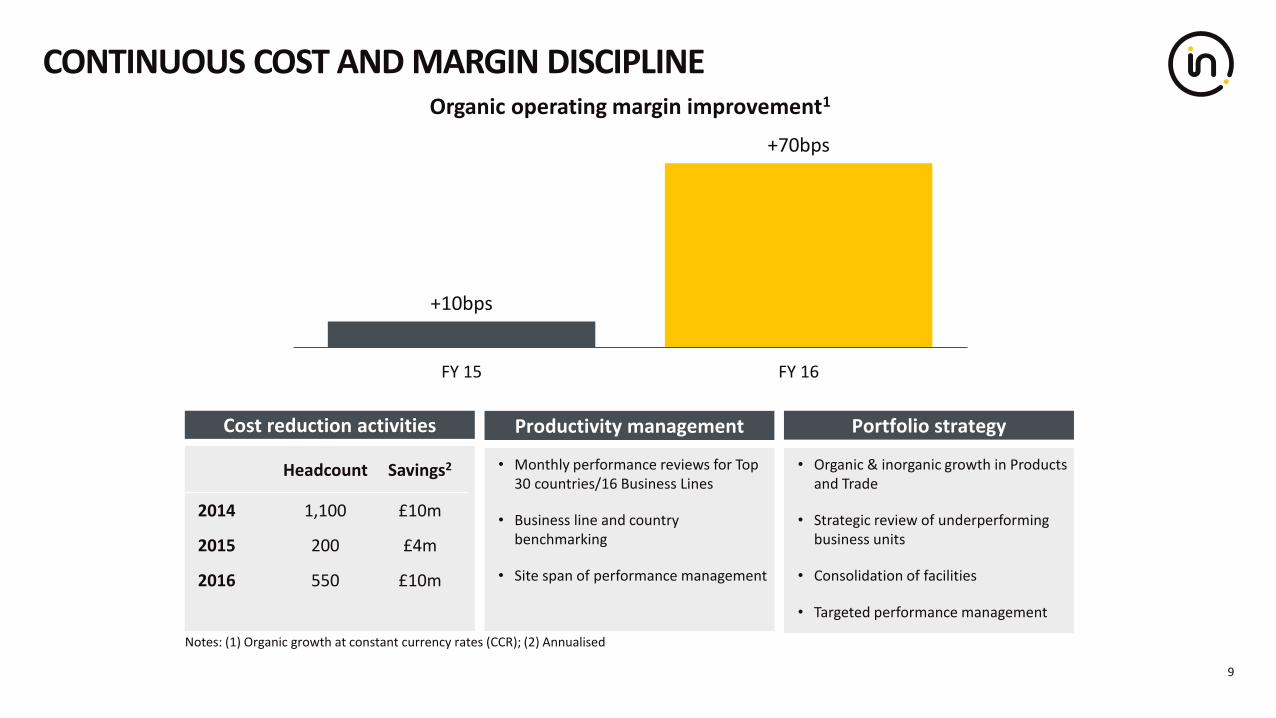
CONTINUOUS COST AND MARGIN DISCIPLINE
9
+10bps
+70bps
FY 15 FY 16
Organic operating margin improvement1
Notes: (1) Organic growth at constant currency rates (CCR); (2) Annualised
Cost reduction activities
• Organic & inorganic growth in Products and Trade
• Strategic review of underperforming business units
• Consolidation of facilities
• Targeted performance management
Headcount Savings2
2014 1,100 £10m
2015 200 £4m
2016 550 £10m
Portfolio strategy
• Monthly performance reviews for Top 30 countries/16 Business Lines
• Business line and country benchmarking
• Site span of performance management
Productivity management
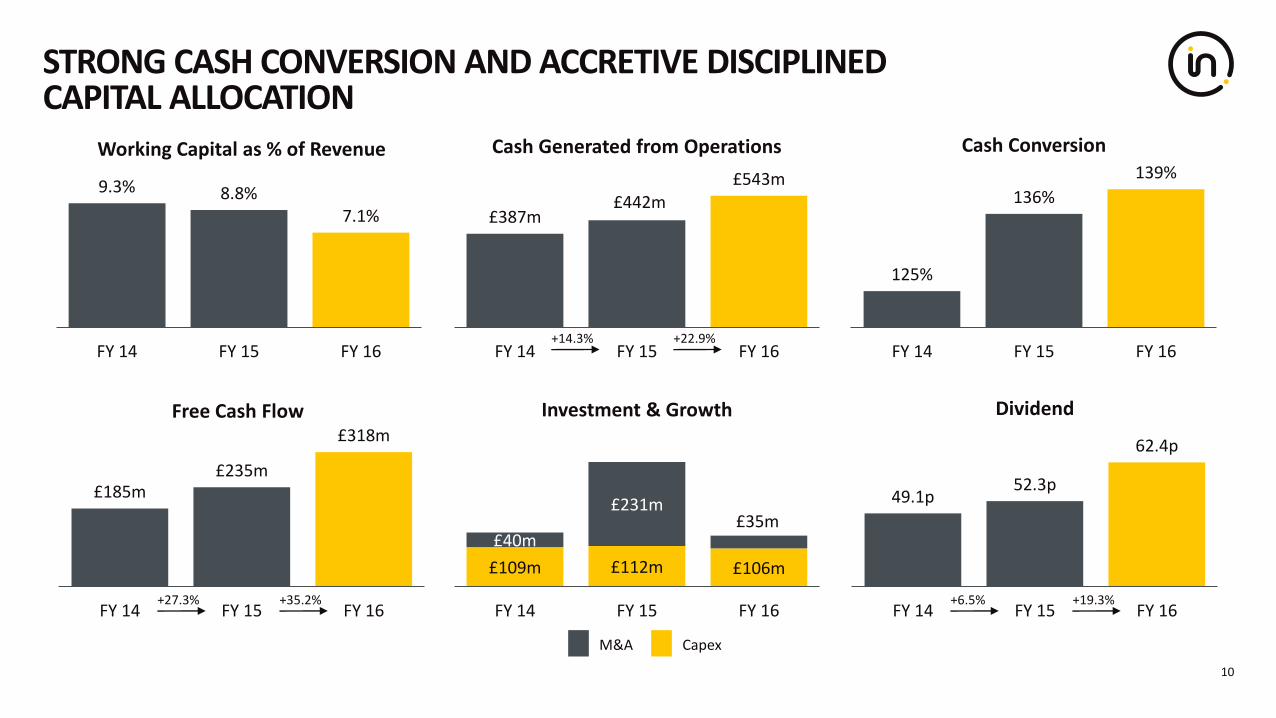
STRONG CASH CONVERSION AND ACCRETIVE DISCIPLINED CAPITAL ALLOCATION
10
125%
136%
139%
FY 14 FY 15 FY 16
Cash Conversion
£387m£442m
£543m
FY 14 FY 15 FY 16
Cash Generated from Operations
£109m £112m £106m
£40m
£231m£35m
FY 14 FY 15 FY 16
Investment & Growth
9.3% 8.8%7.1%
FY 14 FY 15 FY 16
Working Capital as % of Revenue
49.1p52.3p
62.4p
FY 14 FY 15 FY 16
Dividend
£185m£235m
£318m
FY 14 FY 15 FY 16
Free Cash Flow
+19.3%
M&A Capex
+6.5%+35.2%+27.3%
+22.9%+14.3%

2016 FINANCIAL RESULTS
02
Edward Leigh Chief Financial Officer
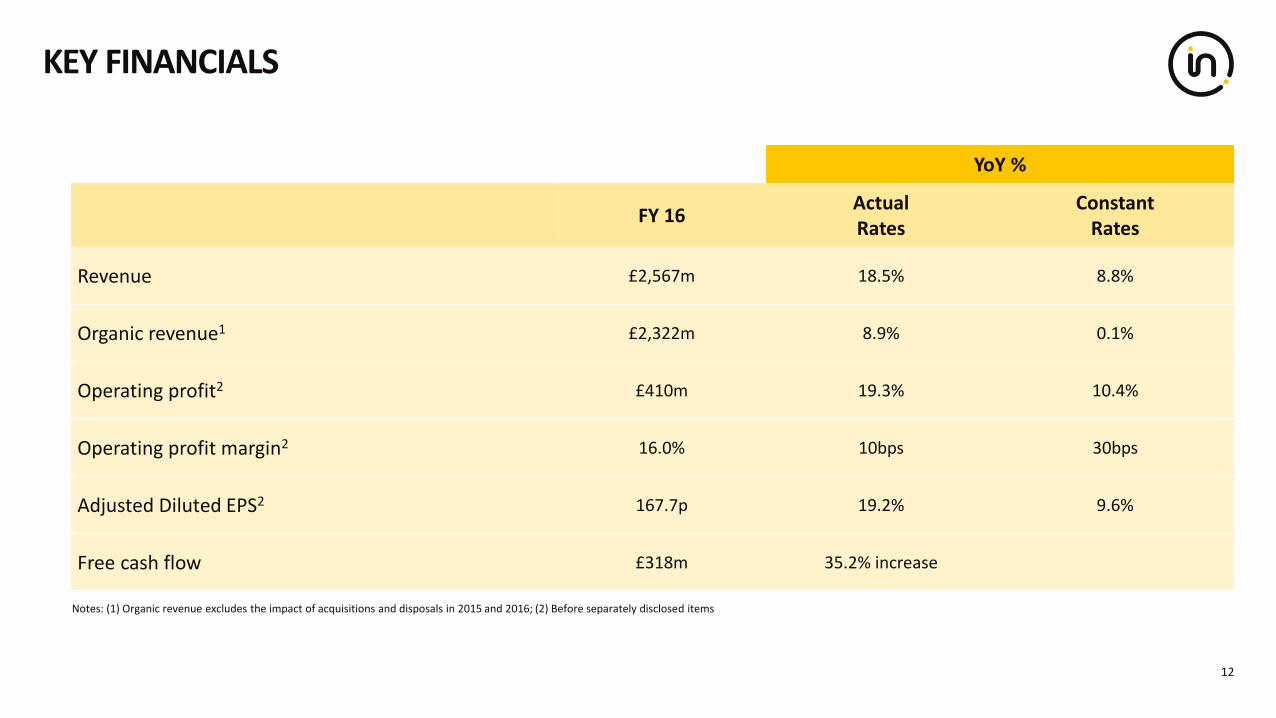
KEY FINANCIALS
12
YoY %
FY 16ActualRates
Constant Rates
Revenue £2,567m 18.5% 8.8%
Organic revenue1 £2,322m 8.9% 0.1%
Operating profit2 £410m 19.3% 10.4%
Operating profit margin2 16.0% 10bps 30bps
Adjusted Diluted EPS2 167.7p 19.2% 9.6%
Free cash flow £318m 35.2% increase
Notes: (1) Organic revenue excludes the impact of acquisitions and disposals in 2015 and 2016; (2) Before separately disclosed items
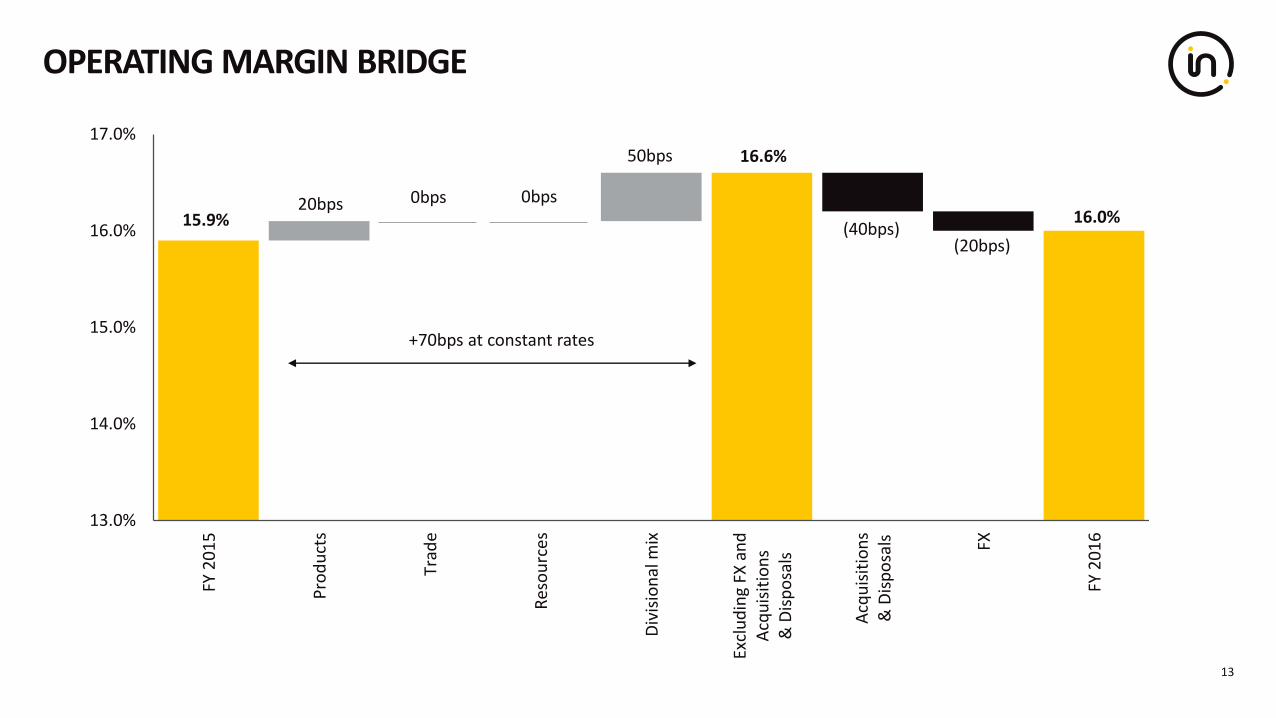
OPERATING MARGIN BRIDGE
13
15.9% 16.0%
16.6%
20bps 0bps 0bps
50bps
(40bps)(20bps)
13.0%
14.0%
15.0%
16.0%
17.0%
FY 2
01
5
Pro
du
cts
Trad
e
Res
ou
rces
Div
isio
nal
mix
Excl
ud
ing
FX a
nd
Acq
uis
itio
ns
& D
isp
osa
ls
Acq
uis
itio
ns
& D
isp
osa
ls FX
FY 2
01
6
+70bps at constant rates

£m @ actual exchange rates FY 15 FY 16
Adjusted operating profit1 343.4 409.7
Depreciation/amortisation 85.2 89.5
Change in working capital 26.8 52.4
Other2 10.3 13.7
Adjusted cash flow from operations 465.7 565.3
Net capex (110.9) (102.5)
Other3 (119.6) (144.7)
Free cash flow 235.2 318.1
Acquisitions4 (231.3) (34.8)
Net debt 775.4 743.7
CASH FLOW & NET DEBT
14Notes:(1) Before Separately Disclosed Items; (2) Comprises Special Pension payments, add back Equity Settled transactions and other Non-Cash Items; (3) Comprises: Exceptionals, Interest Paid/Received and Tax; (4) Total cash consideration in FY16 for 2016 acquisitions £34.8m, net of cash acquired £0.7m; (5) Excludes Special Pension payments of £2.8m
• +19.3% at actual rates
• Cash conversion at 139%5
• Increase in Free Cash Flow of 35.2%
• Net debt / EBITDA ratio 1.5x
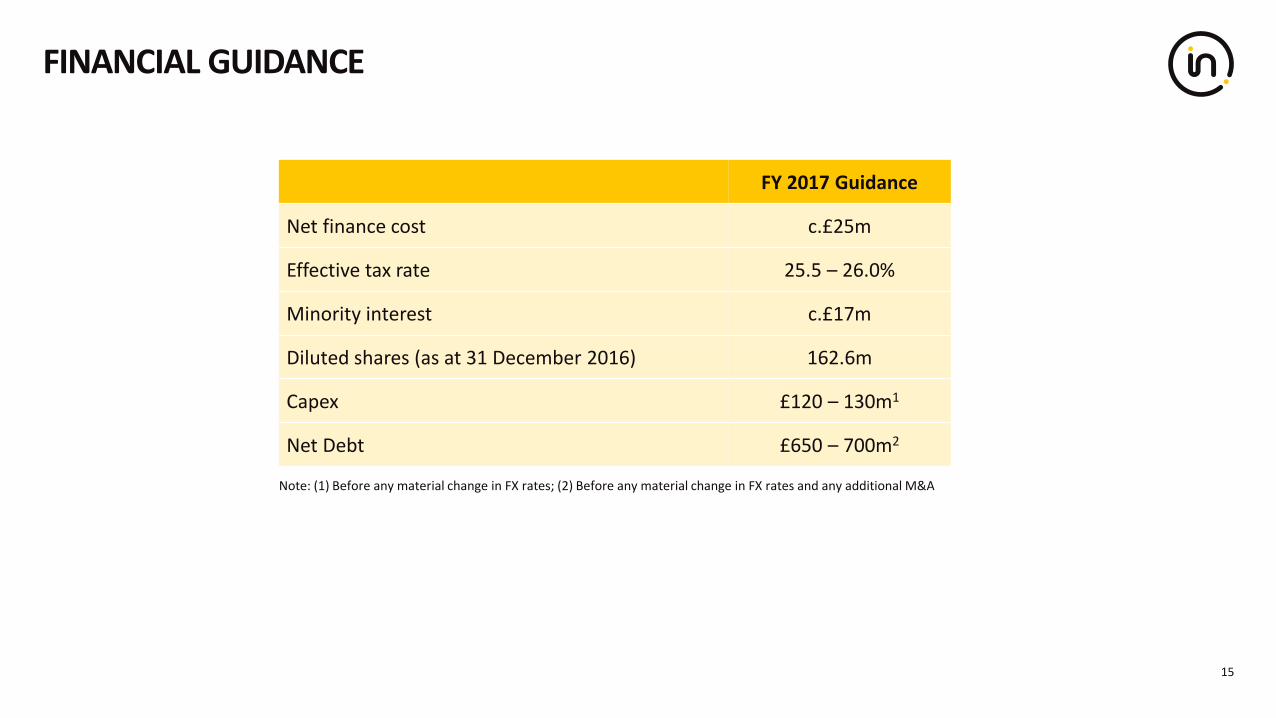
FINANCIAL GUIDANCE
15
Note: (1) Before any material change in FX rates; (2) Before any material change in FX rates and any additional M&A
FY 2017 Guidance
Net finance cost c.£25m
Effective tax rate 25.5 – 26.0%
Minority interest c.£17m
Diluted shares (as at 31 December 2016) 162.6m
Capex £120 – 130m1
Net Debt £650 – 700m2

2016 STRATEGIC UPDATE
André Lacroix Chief Executive Officer
03
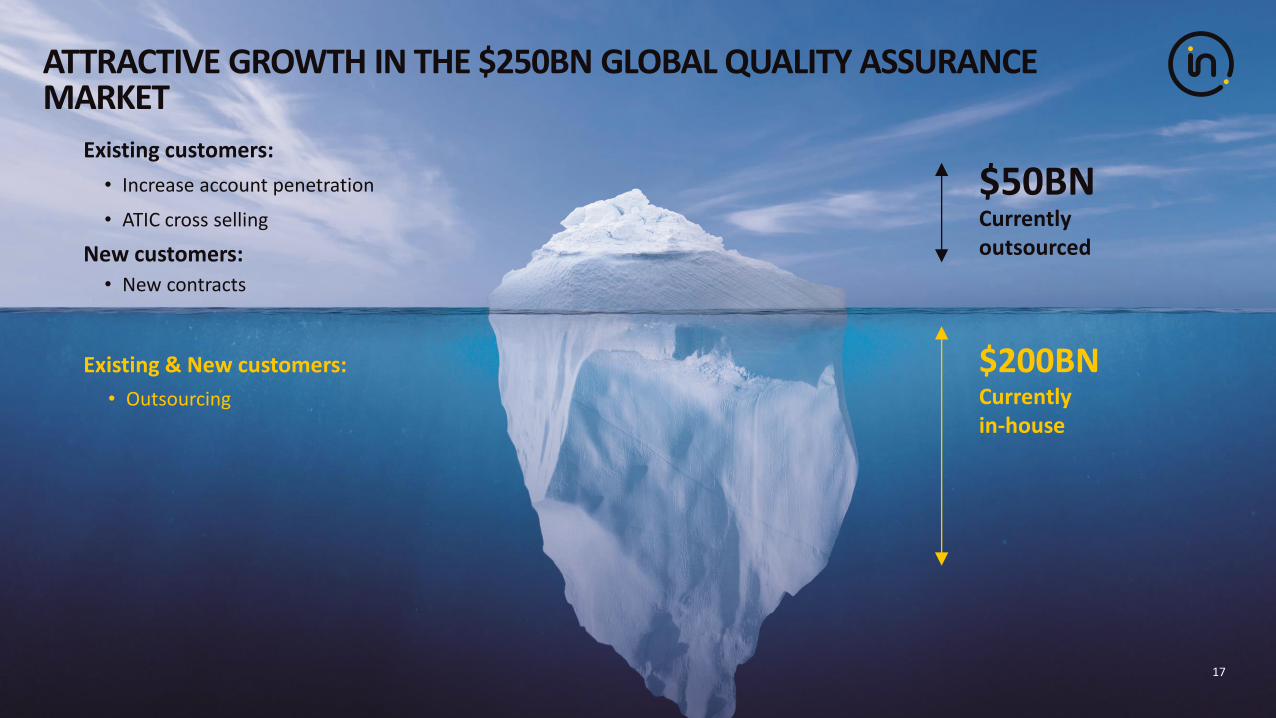
ATTRACTIVE GROWTH IN THE $250BN GLOBAL QUALITY ASSURANCE MARKET
$200BN
$50BNCurrently outsourced
Currently in-house
Existing & New customers:
Existing customers:
• Outsourcing
• Increase account penetration
• ATIC cross selling
New customers:• New contracts
17
Long-term growth
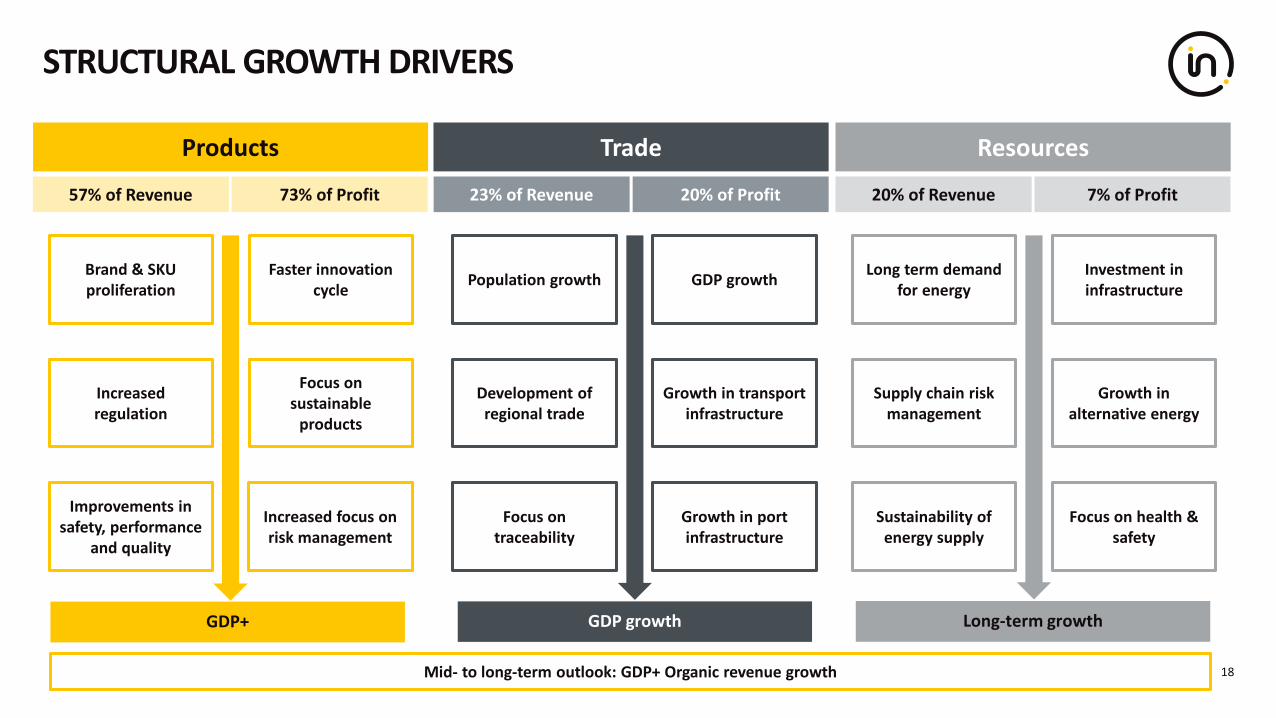
STRUCTURAL GROWTH DRIVERS
18
Resources
23% of Revenue 20% of Profit 20% of Revenue 7% of Profit
Products
57% of Revenue 73% of Profit
Trade
Brand & SKU proliferation
Faster innovation cycle
Increased regulation
Increased focus on risk management
Focus on sustainable
products
Improvements in safety, performance
and quality
Population growth GDP growth
Development of regional trade
Focus on traceability
Growth in transport infrastructure
Growth in port infrastructure
Long term demand for energy
Investment in infrastructure
Supply chain risk management
Sustainability of energy supply
Growth in alternative energy
Focus on health & safety
GDP+ GDP growth
Mid- to long-term outlook: GDP+ Organic revenue growth
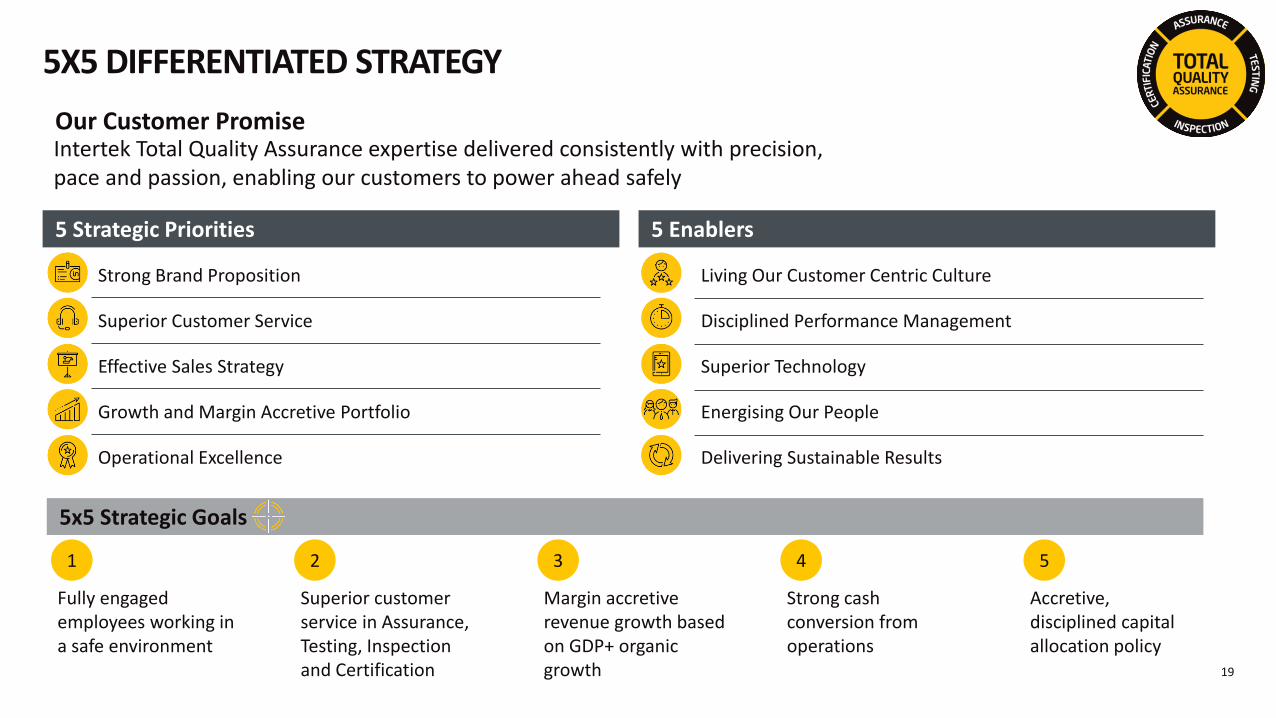
5X5 DIFFERENTIATED STRATEGY
19
Strong Brand Proposition
Superior Customer Service
Effective Sales Strategy
Growth and Margin Accretive Portfolio
Operational Excellence
5 Strategic Priorities 5 Enablers
Living Our Customer Centric Culture
Disciplined Performance Management
Superior Technology
Energising Our People
Delivering Sustainable Results
Our Customer PromiseIntertek Total Quality Assurance expertise delivered consistently with precision, pace and passion, enabling our customers to power ahead safely
5x5 Strategic Goals
Fully engaged employees working in a safe environment
1 2 3 4 5
Superior customer service in Assurance, Testing, Inspection and Certification
Margin accretive revenue growth based on GDP+ organic growth
Strong cash conversion from operations
Accretive, disciplined capital allocation policy
20
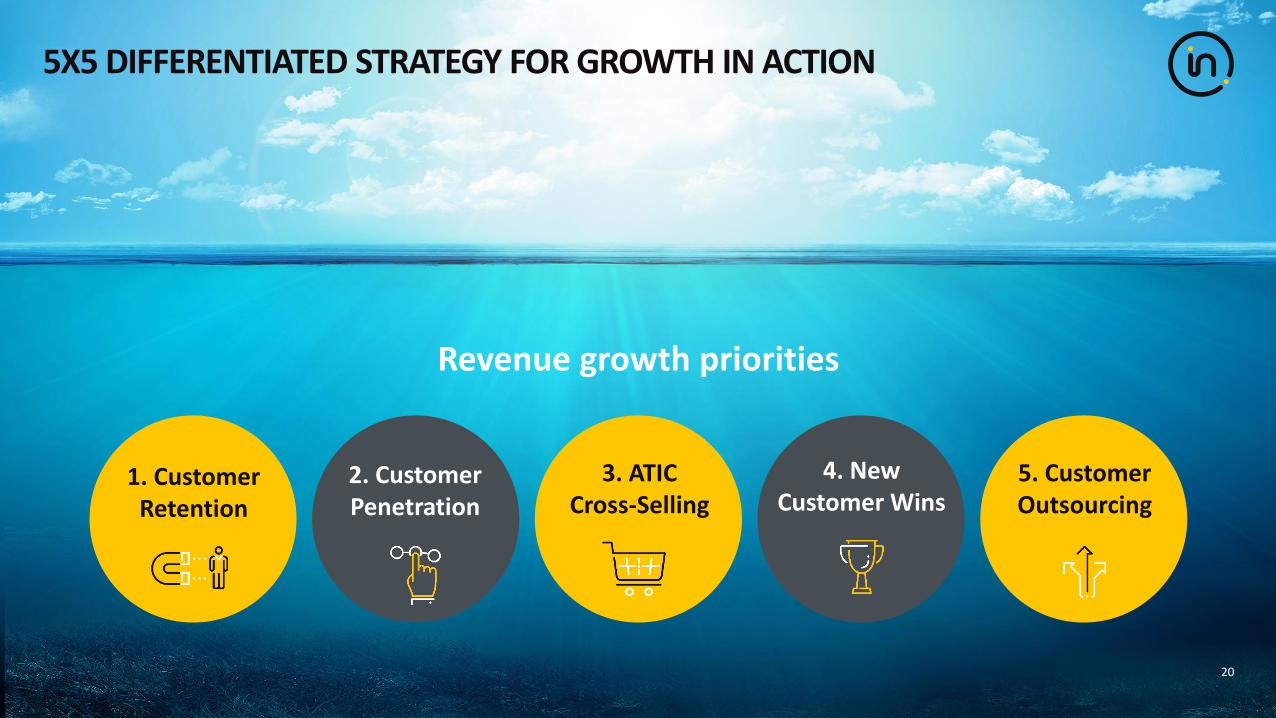
5X5 DIFFERENTIATED STRATEGY FOR GROWTH IN ACTION
Revenue growth priorities
1. Customer Retention
3. ATIC Cross-Selling
5. Customer Outsourcing
2. Customer Penetration
4. New Customer Wins
20

1. CUSTOMER RETENTION: SUPERIOR CUSTOMER SERVICE
21
• Following NPS results and feedback we launched a new customer communication platform
• ‘Fast track hotline’ put in place to speed up response time to customer enquiries
• Led to a material improvement in NPS score
• Evaluate results in local operations and global business lines
• Leverage insights to drive continuous improvement and innovation
• Net Promoter Score (NPS)
• Helps drive improved customer retention and pricing power
• On average c.6-7,000 customer interviews per month
• Covering all Intertek markets
• In Africa, following customer feedback, we introduced a Soil Manager app
• This enables farmers to access a range of agricultural services from remote locations
• Digital customer transaction
Example of Process Improvement Example of Innovation
Methodology Coverage NPS Process
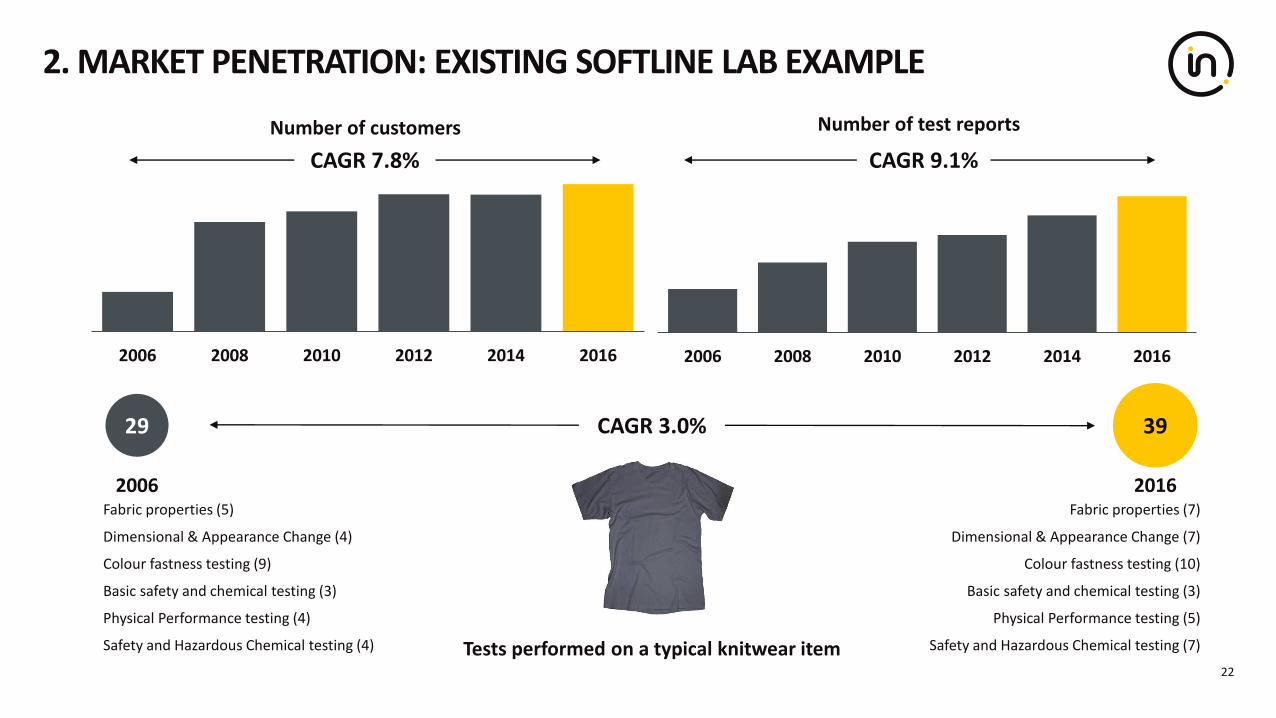
2. MARKET PENETRATION: EXISTING SOFTLINE LAB EXAMPLE
22
Tests performed on a typical knitwear item
2006 2008 2010 2012 2014 2016
Number of customers
2006 2008 2010 2012 2014 2016
Number of test reports
CAGR 7.8% CAGR 9.1%
29 39
2006 2016
CAGR 3.0%
Fabric properties (5)
Dimensional & Appearance Change (4)
Colour fastness testing (9)
Basic safety and chemical testing (3)
Physical Performance testing (4)
Safety and Hazardous Chemical testing (4)
Fabric properties (7)
Dimensional & Appearance Change (7)
Colour fastness testing (10)
Basic safety and chemical testing (3)
Physical Performance testing (5)
Safety and Hazardous Chemical testing (7)
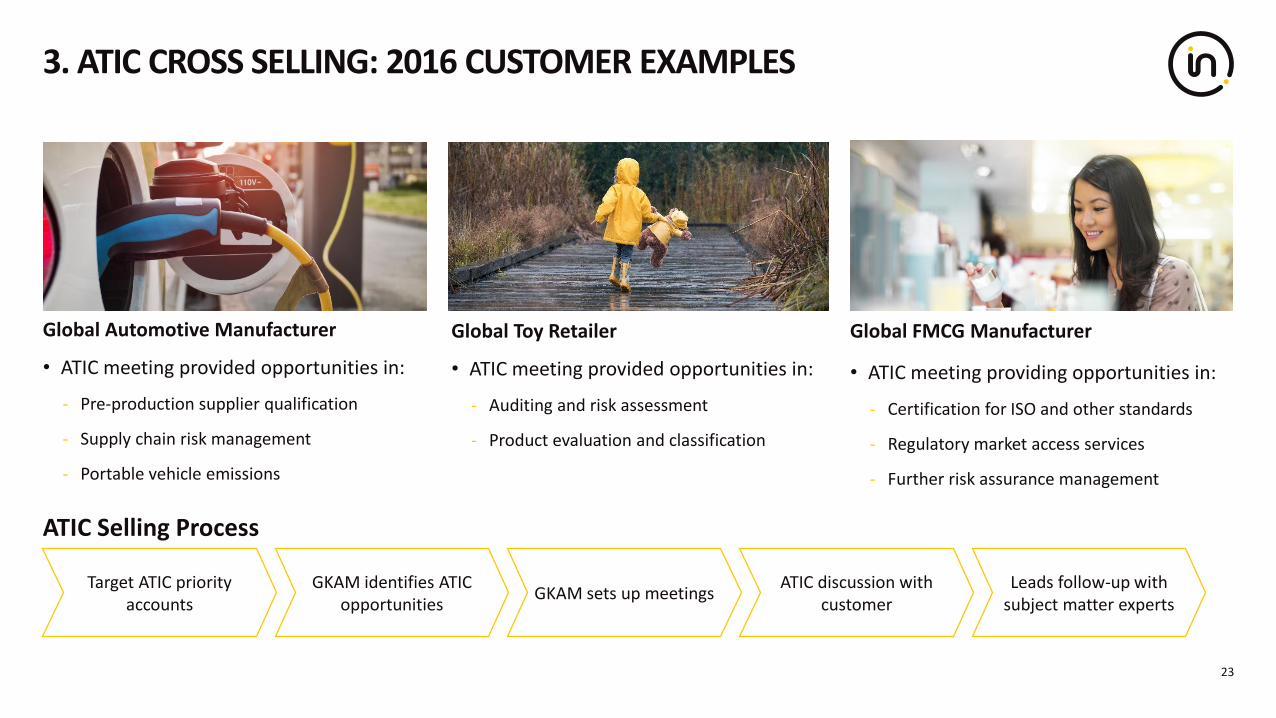
3. ATIC CROSS SELLING: 2016 CUSTOMER EXAMPLES
23
Global Automotive Manufacturer
• ATIC meeting provided opportunities in:
- Pre-production supplier qualification
- Supply chain risk management
- Portable vehicle emissions
Global Toy Retailer
• ATIC meeting provided opportunities in:
- Auditing and risk assessment
- Product evaluation and classification
Global FMCG Manufacturer
• ATIC meeting providing opportunities in:
- Certification for ISO and other standards
- Regulatory market access services
- Further risk assurance management
Target ATIC priority accounts
GKAM identifies ATIC opportunities
ATIC discussion with customer
GKAM sets up meetingsLeads follow-up with
subject matter experts
ATIC Selling Process
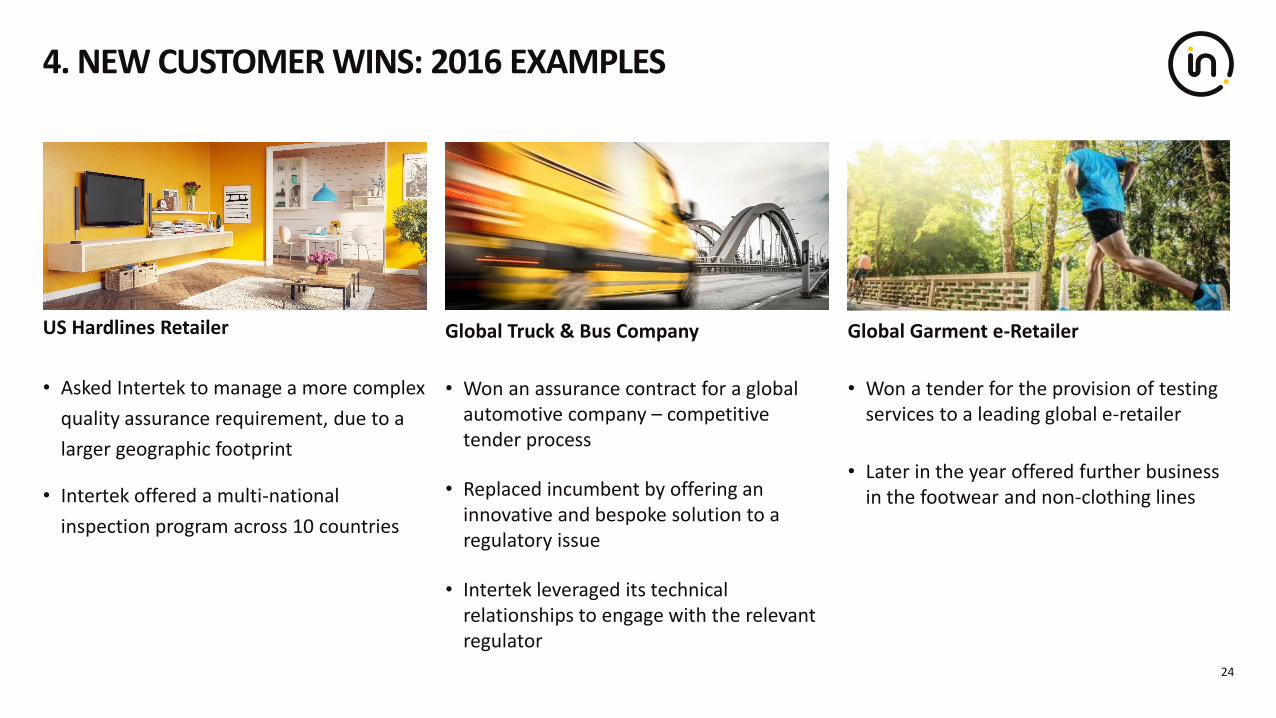
4. NEW CUSTOMER WINS: 2016 EXAMPLES
24
US Hardlines Retailer
• Asked Intertek to manage a more complex
quality assurance requirement, due to a
larger geographic footprint
• Intertek offered a multi-national
inspection program across 10 countries
Global Truck & Bus Company
• Won an assurance contract for a global automotive company – competitive tender process
• Replaced incumbent by offering an innovative and bespoke solution to a regulatory issue
• Intertek leveraged its technical relationships to engage with the relevant regulator
Global Garment e-Retailer
• Won a tender for the provision of testing services to a leading global e-retailer
• Later in the year offered further business in the footwear and non-clothing lines
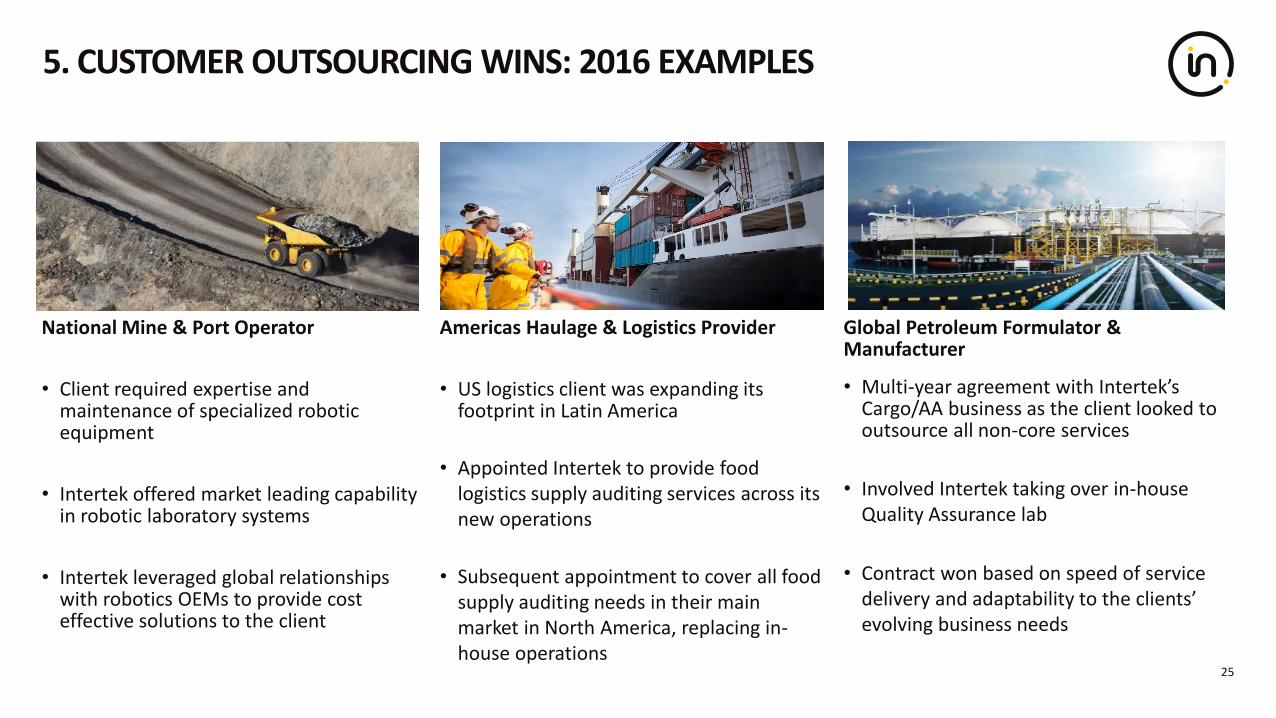
5. CUSTOMER OUTSOURCING WINS: 2016 EXAMPLES
25
National Mine & Port Operator
• Client required expertise and maintenance of specialized robotic equipment
• Intertek offered market leading capability in robotic laboratory systems
• Intertek leveraged global relationships with robotics OEMs to provide cost effective solutions to the client
Americas Haulage & Logistics Provider
• US logistics client was expanding its footprint in Latin America
• Appointed Intertek to provide food logistics supply auditing services across its new operations
• Subsequent appointment to cover all food supply auditing needs in their main market in North America, replacing in-house operations
Global Petroleum Formulator & Manufacturer
• Multi-year agreement with Intertek’s Cargo/AA business as the client looked to outsource all non-core services
• Involved Intertek taking over in-house Quality Assurance lab
• Contract won based on speed of service delivery and adaptability to the clients’ evolving business needs

2017 OUTLOOKBY DIVISION
04
André Lacroix Chief Executive Officer
27
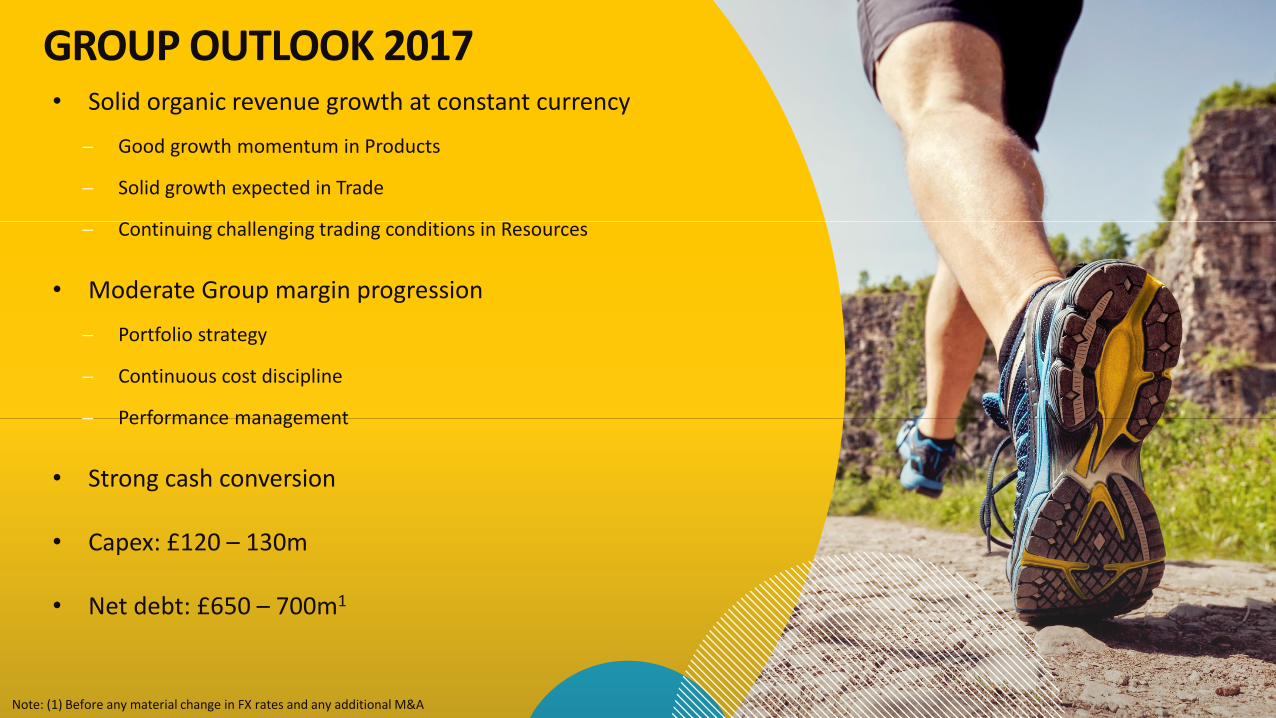
GROUP OUTLOOK 2017• Solid organic revenue growth at constant currency
Good growth momentum in Products
Solid growth expected in Trade
Continuing challenging trading conditions in Resources
• Moderate Group margin progression
Portfolio strategy
Continuous cost discipline
Performance management
• Strong cash conversion
• Capex: £120 – 130m
• Net debt: £650 – 700m1
Note: (1) Before any material change in FX rates and any additional M&A
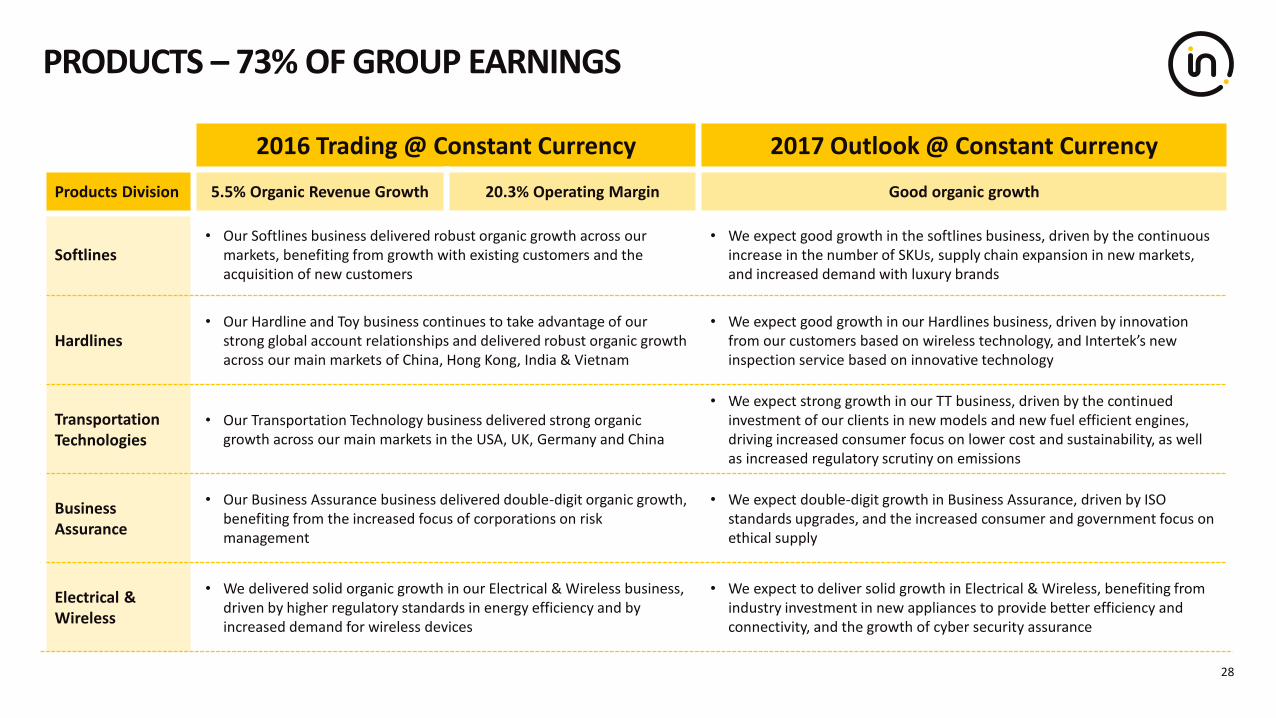
PRODUCTS – 73% OF GROUP EARNINGS
28
2016 Trading @ Constant Currency 2017 Outlook @ Constant Currency
Products Division 5.5% Organic Revenue Growth 20.3% Operating Margin Good organic growth
Softlines• Our Softlines business delivered robust organic growth across our
markets, benefiting from growth with existing customers and the acquisition of new customers
• We expect good growth in the softlines business, driven by the continuous increase in the number of SKUs, supply chain expansion in new markets, and increased demand with luxury brands
Hardlines• Our Hardline and Toy business continues to take advantage of our
strong global account relationships and delivered robust organic growth across our main markets of China, Hong Kong, India & Vietnam
• We expect good growth in our Hardlines business, driven by innovation from our customers based on wireless technology, and Intertek’s new inspection service based on innovative technology
Transportation Technologies
• Our Transportation Technology business delivered strong organic growth across our main markets in the USA, UK, Germany and China
• We expect strong growth in our TT business, driven by the continued investment of our clients in new models and new fuel efficient engines, driving increased consumer focus on lower cost and sustainability, as well as increased regulatory scrutiny on emissions
Business Assurance
• Our Business Assurance business delivered double-digit organic growth, benefiting from the increased focus of corporations on risk management
• We expect double-digit growth in Business Assurance, driven by ISO standards upgrades, and the increased consumer and government focus on ethical supply
Electrical & Wireless
• We delivered solid organic growth in our Electrical & Wireless business, driven by higher regulatory standards in energy efficiency and by increased demand for wireless devices
• We expect to deliver solid growth in Electrical & Wireless, benefiting from industry investment in new appliances to provide better efficiency and connectivity, and the growth of cyber security assurance
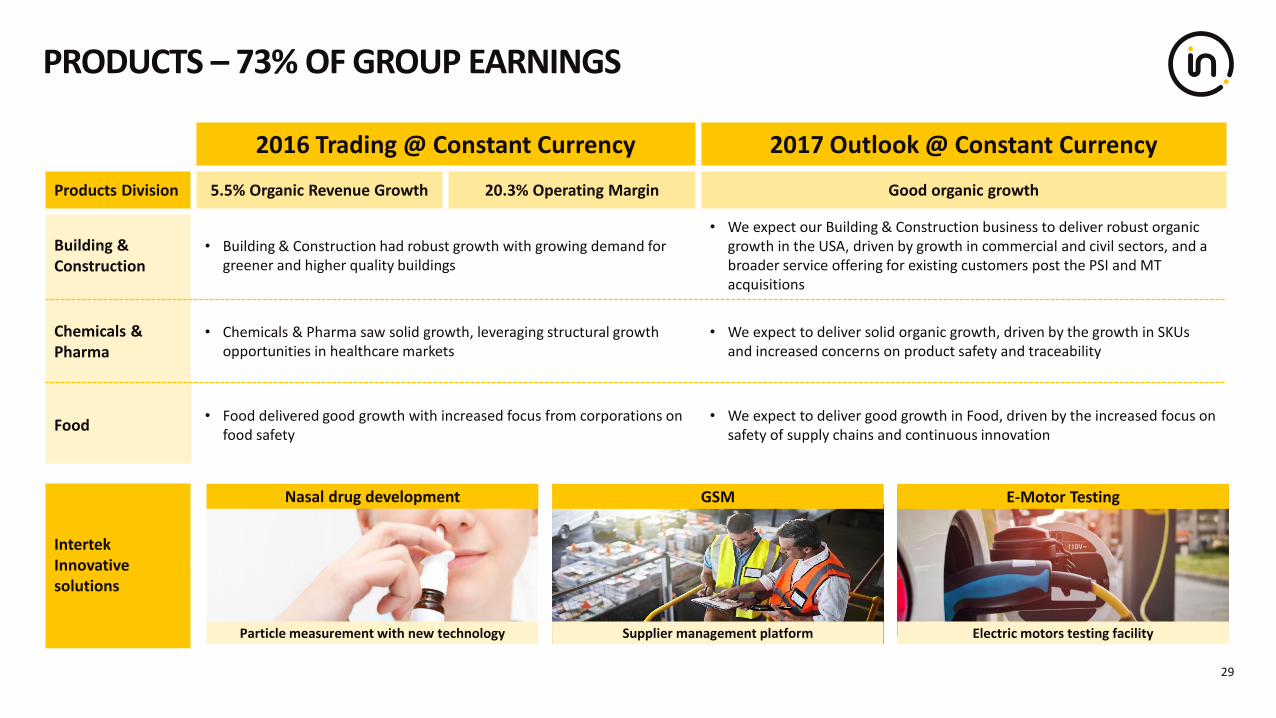
2016 Trading @ Constant Currency 2017 Outlook @ Constant Currency
Products Division 5.5% Organic Revenue Growth 20.3% Operating Margin Good organic growth
Building & Construction
• Building & Construction had robust growth with growing demand for greener and higher quality buildings
• We expect our Building & Construction business to deliver robust organic growth in the USA, driven by growth in commercial and civil sectors, and a broader service offering for existing customers post the PSI and MT acquisitions
Chemicals & Pharma
• Chemicals & Pharma saw solid growth, leveraging structural growth opportunities in healthcare markets
• We expect to deliver solid organic growth, driven by the growth in SKUs and increased concerns on product safety and traceability
Food• Food delivered good growth with increased focus from corporations on
food safety• We expect to deliver good growth in Food, driven by the increased focus on
safety of supply chains and continuous innovation
IntertekInnovative solutions
PRODUCTS – 73% OF GROUP EARNINGS
29
Particle measurement with new technology Supplier management platform Electric motors testing facility
GSM E-Motor TestingNasal drug development
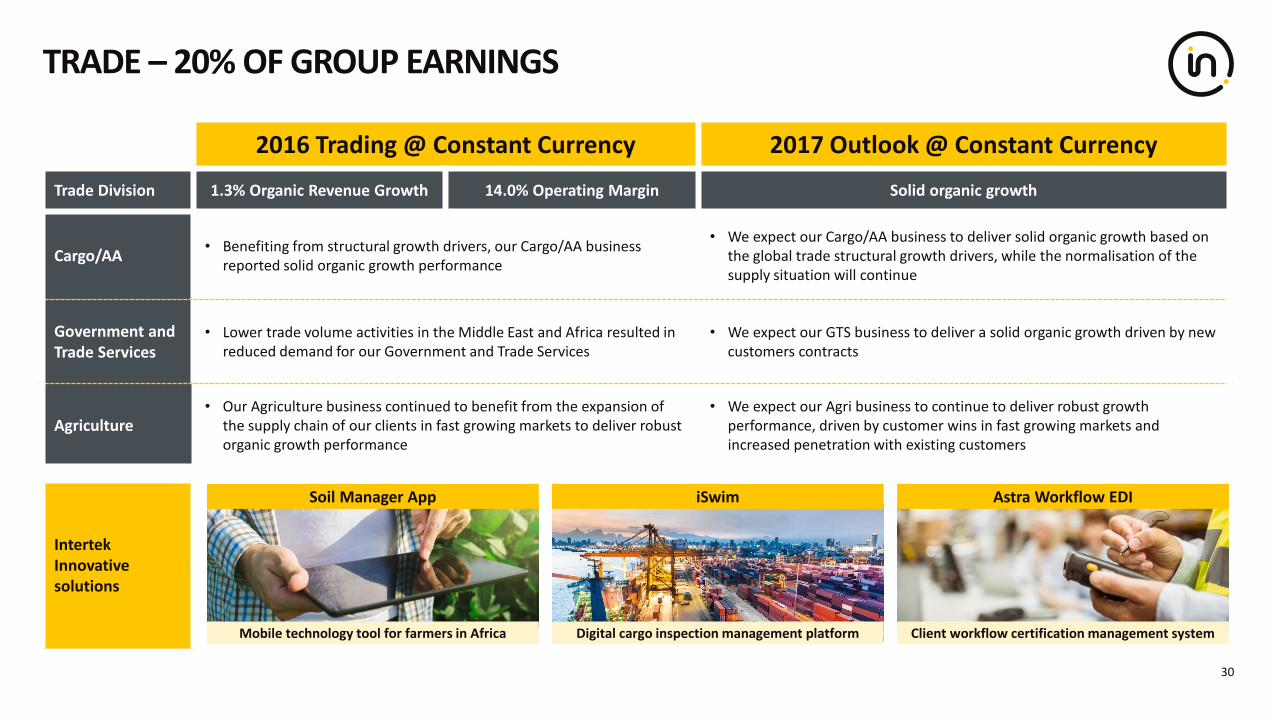
2016 Trading @ Constant Currency 2017 Outlook @ Constant Currency
Trade Division 1.3% Organic Revenue Growth 14.0% Operating Margin Solid organic growth
Cargo/AA• Benefiting from structural growth drivers, our Cargo/AA business
reported solid organic growth performance
• We expect our Cargo/AA business to deliver solid organic growth based on the global trade structural growth drivers, while the normalisation of the supply situation will continue
Government and Trade Services
• Lower trade volume activities in the Middle East and Africa resulted in reduced demand for our Government and Trade Services
• We expect our GTS business to deliver a solid organic growth driven by new customers contracts
Agriculture• Our Agriculture business continued to benefit from the expansion of
the supply chain of our clients in fast growing markets to deliver robust organic growth performance
• We expect our Agri business to continue to deliver robust growth performance, driven by customer wins in fast growing markets and increased penetration with existing customers
Intertek Innovative solutions
TRADE – 20% OF GROUP EARNINGS
30
Mobile technology tool for farmers in Africa
Soil Manager App iSwim Astra Workflow EDI
Digital cargo inspection management platform Client workflow certification management system
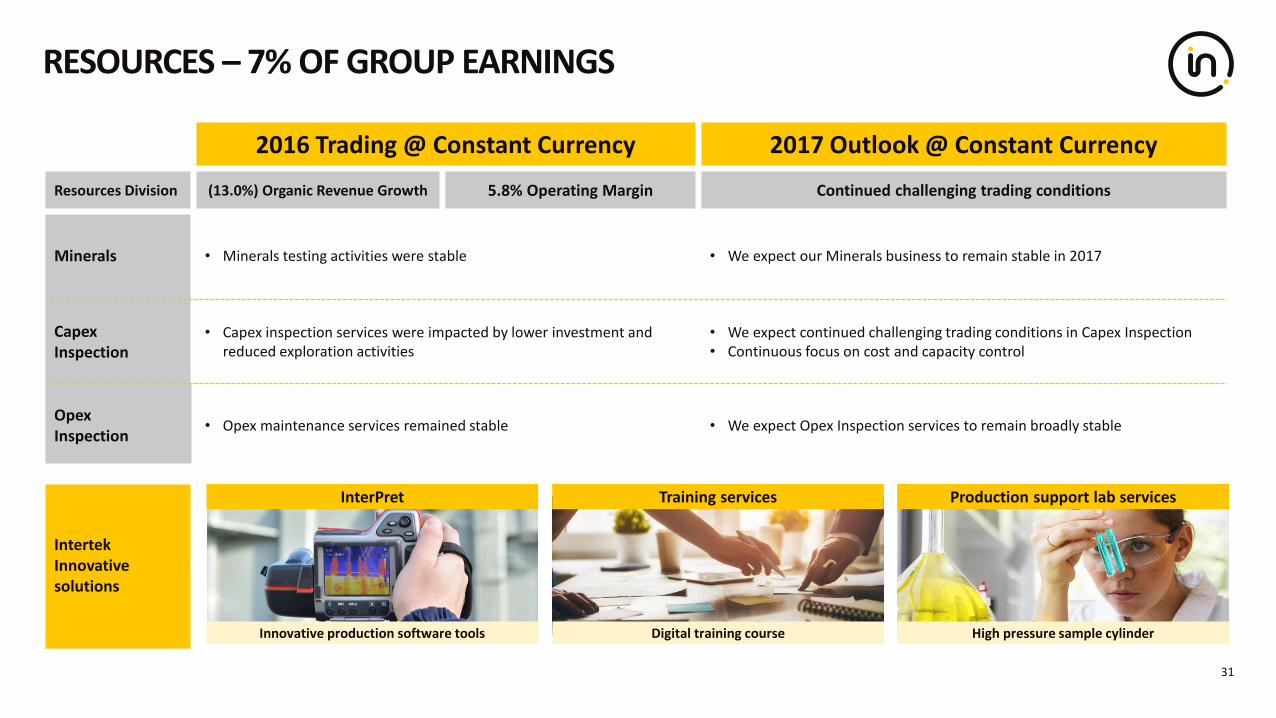
RESOURCES – 7% OF GROUP EARNINGS
31
2016 Trading @ Constant Currency 2017 Outlook @ Constant Currency
Resources Division (13.0%) Organic Revenue Growth 5.8% Operating Margin Continued challenging trading conditions
Minerals • Minerals testing activities were stable • We expect our Minerals business to remain stable in 2017
Capex Inspection
• Capex inspection services were impacted by lower investment and reduced exploration activities
• We expect continued challenging trading conditions in Capex Inspection • Continuous focus on cost and capacity control
Opex Inspection
• Opex maintenance services remained stable • We expect Opex Inspection services to remain broadly stable
Intertek Innovative solutions
Innovative production software tools
InterPret Training services Production support lab services
Digital training course High pressure sample cylinder

32
SUMMARY
05
André Lacroix Chief Executive Officer
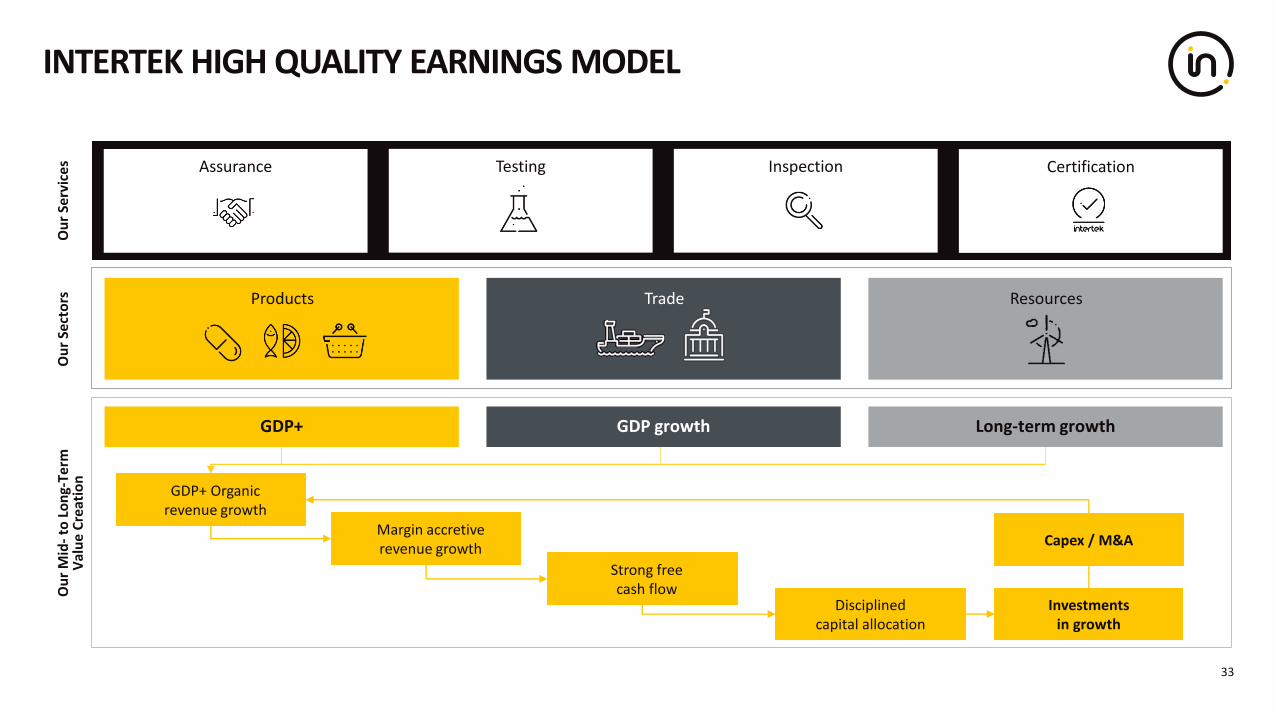
INTERTEK HIGH QUALITY EARNINGS MODEL
33
Ou
r Se
rvic
es Testing Inspection CertificationAssurance
ResourcesTradeProducts
Ou
r Se
cto
rsO
ur
Mid
-to
Lo
ng-
Term
V
alu
e C
reat
ion
GDP+ GDP growth Long-term growth
GDP+ Organic revenue growth
Margin accretive revenue growth
Strong free cash flow
Disciplinedcapital allocation
Investments in growth
Capex / M&A

ACCRETIVE DISCIPLINED ALLOCATION OF CAPITAL
34
Capex and working capital investment to support organic growth (target c.5% of revenue in capex)
Efficient balance sheet with flexibility to invest in growth with Net Debt / EBITDA target of 1.5x - 2.0x
M&A focused on strong growth and margin prospects in businesses with leading market positions or in new attractive growth areas, geographies or services
Sustainable shareholder returns through payment of progressive dividends
01
03
02
04
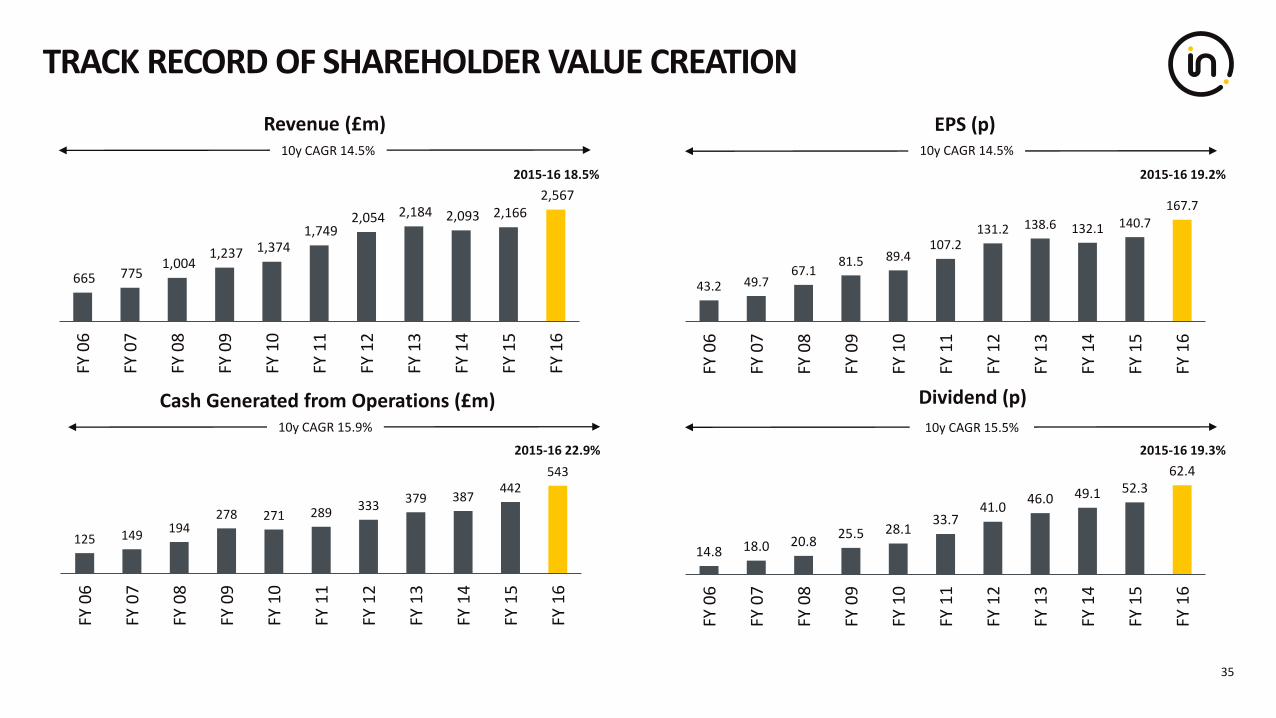
TRACK RECORD OF SHAREHOLDER VALUE CREATION
35
665 775 1,004
1,237 1,374 1,749
2,054 2,184 2,093 2,166 2,567
FY 0
6
FY 0
7
FY 0
8
FY 0
9
FY 1
0
FY 1
1
FY 1
2
FY 1
3
FY 1
4
FY 1
5
FY 1
6
Revenue (£m)
2015-16 18.5%
10y CAGR 14.5%
125 149194
278 271 289333
379 387442
543
FY 0
6
FY 0
7
FY 0
8
FY 0
9
FY 1
0
FY 1
1
FY 1
2
FY 1
3
FY 1
4
FY 1
5
FY 1
6
Cash Generated from Operations (£m)
14.8 18.0 20.825.5 28.1
33.741.0
46.0 49.1 52.362.4
FY 0
6
FY 0
7
FY 0
8
FY 0
9
FY 1
0
FY 1
1
FY 1
2
FY 1
3
FY 1
4
FY 1
5
FY 1
6
Dividend (p)
10y CAGR 15.9% 10y CAGR 15.5%
2015-16 22.9% 2015-16 19.3%
43.2 49.767.1
81.5 89.4107.2
131.2 138.6 132.1 140.7167.7
FY 0
6
FY 0
7
FY 0
8
FY 0
9
FY 1
0
FY 1
1
FY 1
2
FY 1
3
FY 1
4
FY 1
5
FY 1
6
EPS (p)10y CAGR 14.5%
2015-16 19.2%

36
SUMMARY
• Strong revenue, earnings and cash performance
• Attractive growth prospects
• Differentiated growth strategy
• Disciplined performance management and capital
allocation
• High quality earnings model


GROUP PERFORMANCE (2014 – 2016)
38
572 519 517
514 537 585
1,008 1,111 1,466
2,093 2,166
2,567
FY 14 FY 15 FY 16
Revenue (£m)
51 34 30
65 76 82
208 234 298
324 343
410
FY 14 FY 15 FY 16
Adjusted Operating Profit (£m)
Margin Key Metrics 2016
FY 14 FY 15 FY 16% Group Revenue
% Group Profit
Organic Revenue Growth
Products 20.6% 21.1% 20.3% 57% 73% 5.5%
Trade 12.7% 14.1% 14.0% 23% 20% 1.3%
Resources 9.0% 6.5% 5.8% 20% 7% (13.0%)
Group 15.5% 15.9% 16.0% 100% 100% 0.1%
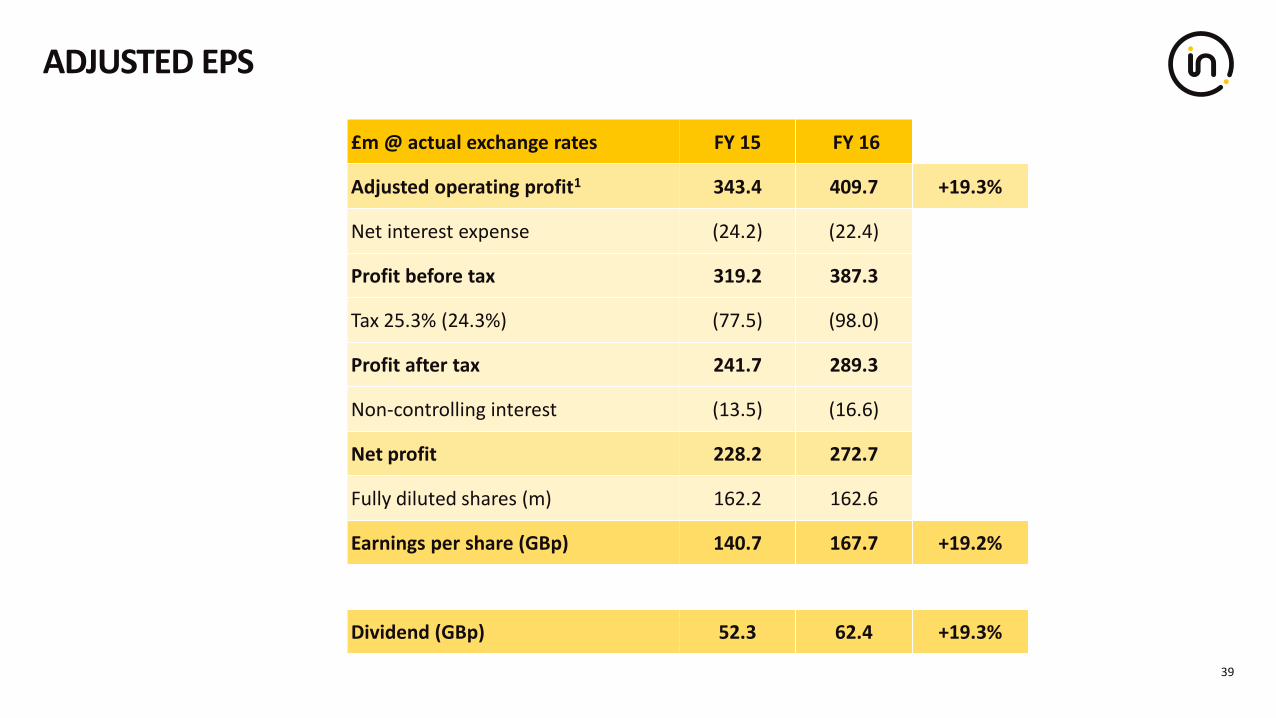
ADJUSTED EPS
39
£m @ actual exchange rates FY 15 FY 16
Adjusted operating profit1 343.4 409.7 +19.3%
Net interest expense (24.2) (22.4)
Profit before tax 319.2 387.3
Tax 25.3% (24.3%) (77.5) (98.0)
Profit after tax 241.7 289.3
Non-controlling interest (13.5) (16.6)
Net profit 228.2 272.7
Fully diluted shares (m) 162.2 162.6
Earnings per share (GBp) 140.7 167.7 +19.2%
Dividend (GBp) 52.3 62.4 +19.3%

GLOBAL TRADE REPRESENTS 58% OF GLOBAL GDP
40
Demand has become truly global reflected in global supply
28%
39%
27%
45%
73%
29%
69%
63%
31%
75%
63%
51%
41%
41%
49%
132%
53%
43%
19%
35%
73%
65%57%
37%
65%
61%
86%
Trade as % of GDP
Source: World Bank. Trade is the sum of exports and imports of goods and services measured as a share of gross domestic product.
1965 1975 1985 1995 2005 2015
Global trade as a % of global GDP
58%56%
44%39%
33%
24%
Customers expect Total Quality Assurance: ATIC
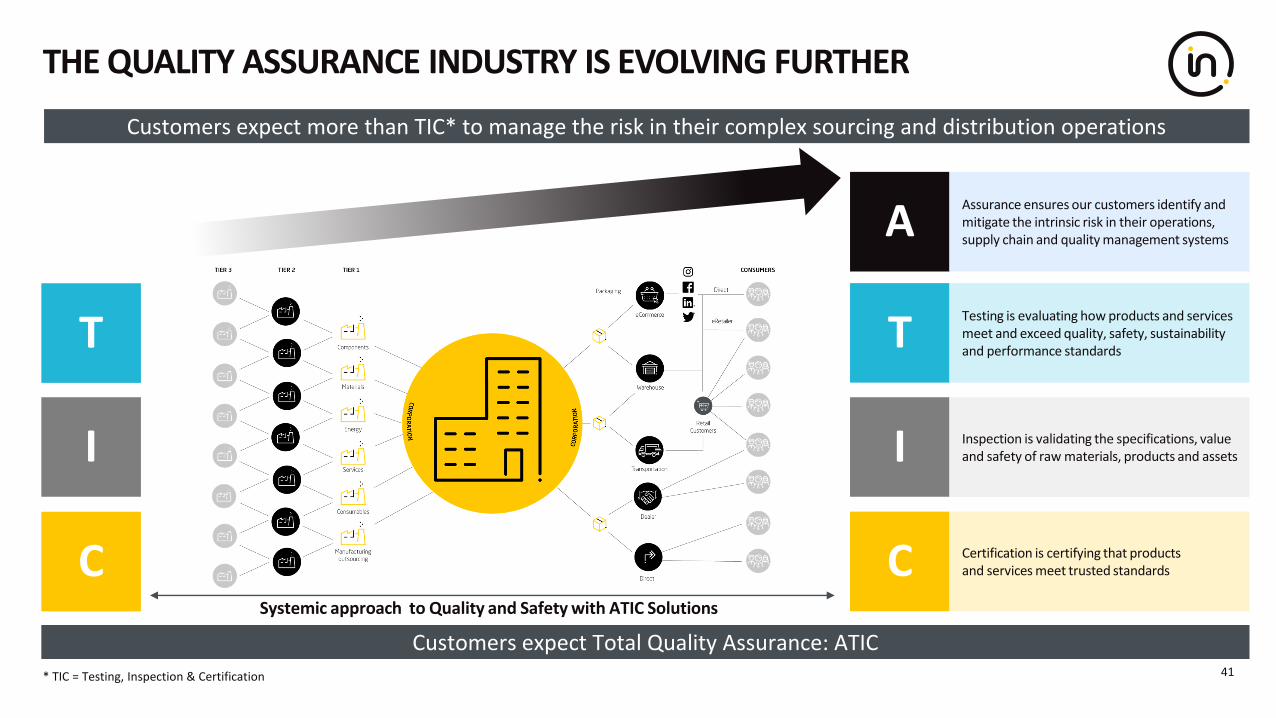
THE QUALITY ASSURANCE INDUSTRY IS EVOLVING FURTHER
41
T
I
C
A
T
I
C Certification is certifying that products and services meet trusted standards
Testing is evaluating how products and services meet and exceed quality, safety, sustainability and performance standards
Inspection is validating the specifications, value and safety of raw materials, products and assets
Assurance ensures our customers identify and mitigate the intrinsic risk in their operations, supply chain and quality management systems
Systemic approach to Quality and Safety with ATIC Solutions
Customers expect more than TIC* to manage the risk in their complex sourcing and distribution operations
* TIC = Testing, Inspection & Certification
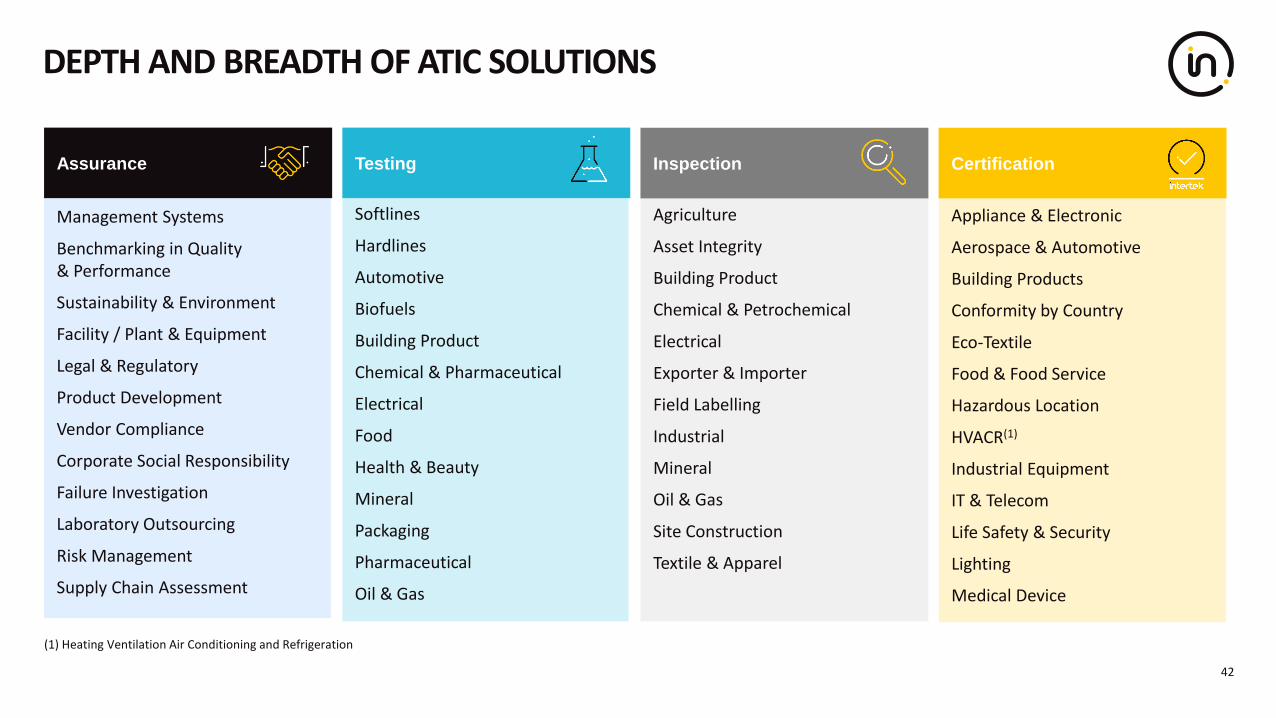
Management Systems
Benchmarking in Quality & Performance
Sustainability & Environment
Facility / Plant & Equipment
Legal & Regulatory
Product Development
Vendor Compliance
Corporate Social Responsibility
Failure Investigation
Laboratory Outsourcing
Risk Management
Supply Chain Assessment
Softlines
Hardlines
Automotive
Biofuels
Building Product
Chemical & Pharmaceutical
Electrical
Food
Health & Beauty
Mineral
Packaging
Pharmaceutical
Oil & Gas
Appliance & Electronic
Aerospace & Automotive
Building Products
Conformity by Country
Eco-Textile
Food & Food Service
Hazardous Location
HVACR(1)
Industrial Equipment
IT & Telecom
Life Safety & Security
Lighting
Medical Device
Agriculture
Asset Integrity
Building Product
Chemical & Petrochemical
Electrical
Exporter & Importer
Field Labelling
Industrial
Mineral
Oil & Gas
Site Construction
Textile & Apparel
DEPTH AND BREADTH OF ATIC SOLUTIONS
42
Assurance Testing CertificationInspection
(1) Heating Ventilation Air Conditioning and Refrigeration
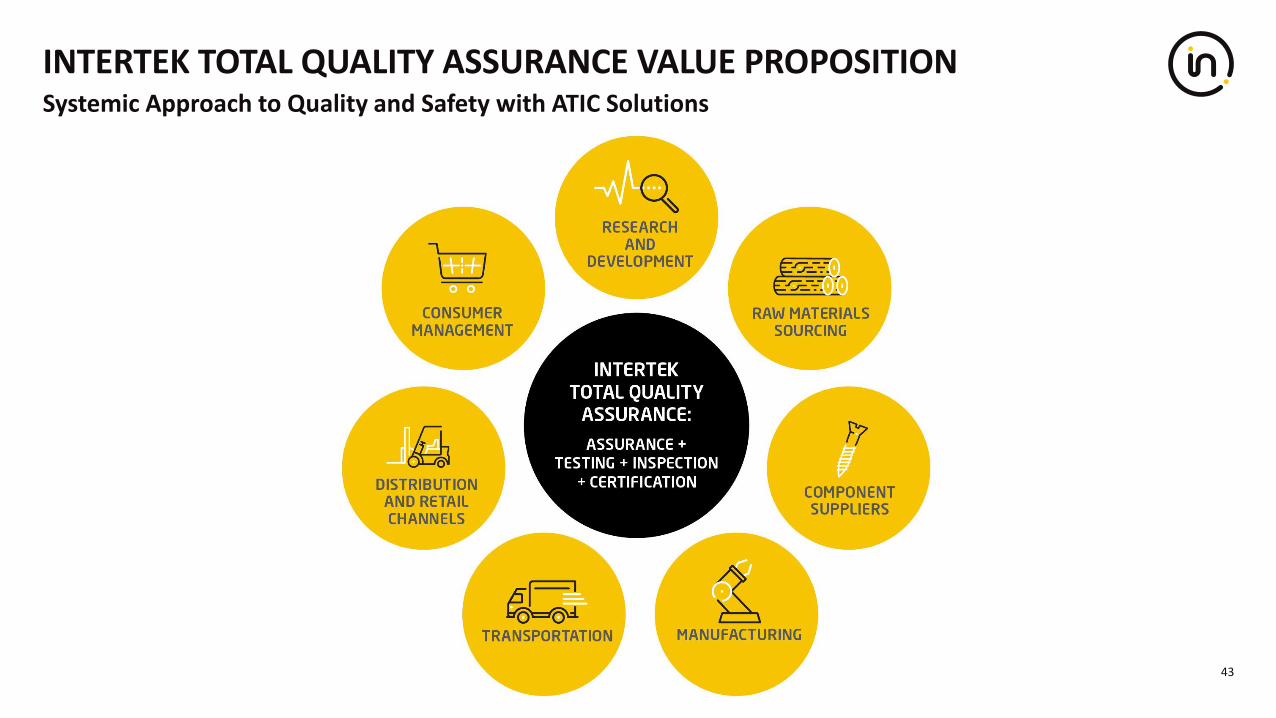
INTERTEK TOTAL QUALITY ASSURANCE VALUE PROPOSITION
43
Systemic Approach to Quality and Safety with ATIC Solutions