full year results - rich investor... · full year results full year business review rebecca miano,...
TRANSCRIPT
Villa Rosa Kempinski, Nairobi | Wednesday,18 October 2017
2016/2017
Full Year
Results
Full Year Business Review
Rebecca Miano, OGW
Ag. Managing Director & CEO

Full year results to 30 June 2017 2
KENYA RANKED AMONG TOP IN GLOBAL
GDP GROWTH
Source: Bloomberg Survey, 2016

Full year results to 30 June 2017 3
6.39%
6.35%
11.70%
7.47%
8.04%
7.06%
4%
6%
8%
10%
12%
14%
Jul-16 Sep-16 Nov-16 Jan-17 Mar-17 May-17 Jul-17 Sep-17
112.10
123.01
121.67
92.24 88.10
93.54
91.69
75
95
115
Jul-16 Sep-16 Nov-16 Jan-17 Mar-17 May-17 Jul-17 Sep-17
USD EUR JPY
KENYA MACRO-ECONOMIC OVERVIEW Kenya economy stable despite market uncertainties
Sources : Central Bank of Kenya; KNBS
Inflation
End of month Exchange Rate of KSh

Full year results to 30 June 2017 4
KENYA’S POWER SECTOR TODAY
Ministry of Energy &
Petroleum (policy)
Energy
Tribunal
(disputes)
ERC
(regulator) Electricity Value Chain
Primary Energy (mainly geothermal)
Generation Transmission Distribution Customers
Current Situation
~2,370MW ~75,350km ~139,650km ~68% Access
KenGen, GDC, KNEB+IPPs
KP+KeTraCo KP+REA+IPPs

Full year results to 30 June 2017 5
KENYA’S INSTALLED AND OUTPUT
CAPACITY
Source: Kenya Power
Installed capacity (MW)
1,691 1,765 1,885
2,299 2,341 2,370
2012 2013 2014 2015 2016 2017
CAGR
6.98%
7,670 8,087
8,840 9,280
9,816 10,205
2012 2013 2014 2015 2016 2017
CAGR
5.88%
Unit sales (GWh)
Full year results to 30 June 2017 6
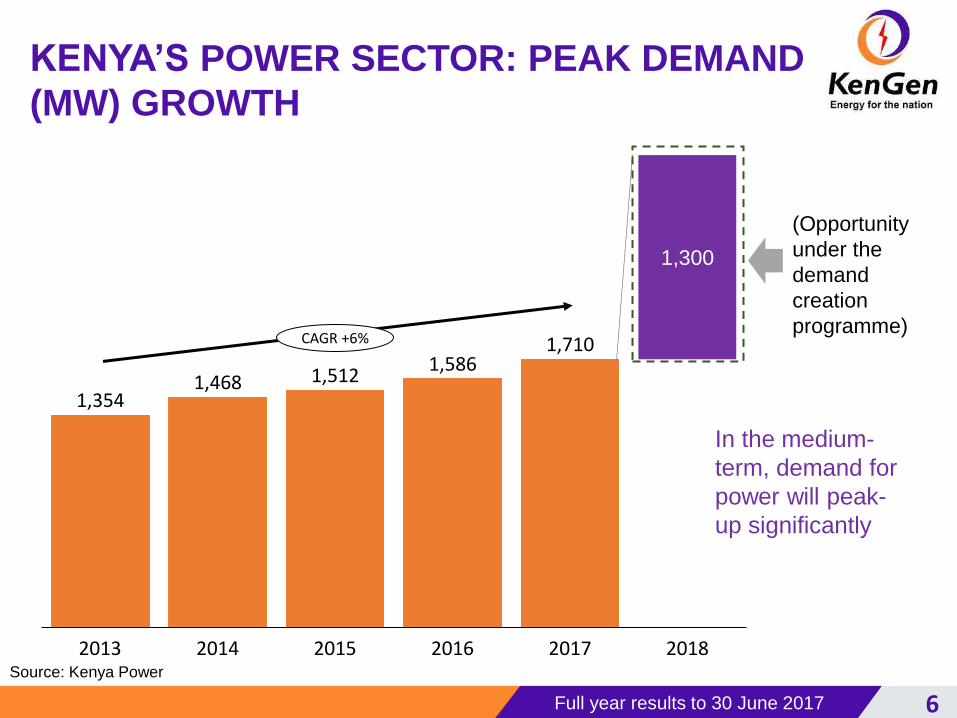
KENYA’S POWER SECTOR: PEAK DEMAND
(MW) GROWTH
Source: Kenya Power
1,354 1,468 1,512
1,586 1,710
1,300
2014 2013 2017 2015 2016 2018
CAGR +6%
(Opportunity
under the
demand
creation
programme)
In the medium-
term, demand for
power will peak-
up significantly

Full year results to 30 June 2017 7
KENYA’S POWER SECTOR: CUSTOMER
GROWTH (Million)
Last Mile Project
targeting
additional 3
million customers
by 2020
2.04 2.33
2.77
3.61
4.80
6.18
2012 2016 2013 2014 2015 2017
CAGR +25%
Source: KenGen; Kenya Power, MoEP

Full year results to 30 June 2017 8
• Energy Bill 2015 – creating market for power
generators (currently in Senate)
• Power Infrastructure Upgrades (improved power
supply quality and reliability)
• Draft National Geothermal Strategy (to guide
investments in the geothermal power generation)
• Feed-in-Tariff Policy, 2008(2012) (currently under
review)
• Draft Renewable Energy Auction Policy (improve
power generation competitiveness)
Key Developments
II
III
IV
V
I
NEW DEVELOPMENTS IN THE POWER SECTOR

Full year results to 30 June 2017 9
Source: KenGen; Kenya Power, MoEP
OUR MARKET POSITION AND MIX AS AT 30TH JUNE 2017
Sales Share (% of Units)
Installed Share (% of MW)
KenGen 74%
IPPs 26%
[CATEGORY NAME
] [PE…
[CATEGOR
Y NAME
] …
50%
33%
16%
KenGen Mix (MW)
85% of
KenGen
Capacity
is Green!
2017
Geothermal
Wind
Diesel & Gas
Hydro
1,631

Full year results to 30 June 2017 10
OUR INSTALLED CAPACITY(MW) - 30TH JUNE 2017
818 818
524 534
263 254
25 25
1,631
Thermal
Wind
Geothermal
1,630
Hydro
Decommissioned 9MW
thermal (Garissa & Lamu)
Commissioned
10MW geothermal
2016 2017

Full year results to 30 June 2017 12
OUR STRATEGIC ASPIRATIONS
Capacity
increase
• Increase our capacity by 2,500MW to remain
relevant market player (50+% share) by 2025
focusing on geothermal
Value
creation
• Provide adequate return to shareholders –
targeting a Return On Invested Capital of 10%
Lower tariffs • Profitably supply cheaper renewable (green)
electricity to the economy
1
2
3

Full year results to 30 June 2017 13
OUR G2G STRATEGY PATH
Good
company
Great
company
Time
10 years+
Horizon III
Horizon II has been
revamped and
extended to 2025
to address changes
in the operating
environment
and achieve success
Explore expansion
opportunities
• Drive expansion
beyond Kenya
• Establish a strong
African footprint
Horizon I
2008-12
Horizon II
2016-25
Stabilise power
situation in Kenya
• Delivered
325+MW
Revamped plan
Create sustainable
power growth in
Kenya
• Deliver 2,500MW
• Create value for
shareholders
• Lower tariffs
• Diversify business
(KenGen C)
Original
2013-15
Delivered
375+MW
Medium-Term Target is 721MW by 2020

Full year results to 30 June 2017 14
2016/17 PROJECT MILESTONES
• Tender for a JV
under Partner in
preparation
• Financial close
achieved
• Drilling completed,
sufficient steam
proven
• Broke ground in
Mar’2017
• Construction
ongoing
• Financing
committed
• Drilling
completed,
sufficient steam
proven
• Procurement of
contractor
ongoing
1 2
Olkaria VI (140MW) Olkaria V (158MW) Olkaria I Rehab.
(51MW)
Olkaria 1
Unit 6 (70MW)
• PPA extended by
3 yrs
• Govt of Japan
pledge for funding
granted
• Plant to undergo
rehabilitation in
phased approach
3 4

Full year results to 30 June 2017 15
STRATEGIC RISKS THAT WE ARE CONTINUOSLY MANAGING
KenGen
continuously
positioning
itself as the
market
leader and
the preferred
supplier of
power in
Kenya
Competition
• New IPPs are aggressively entering the market
• Mitigating this through competitive tariffs and fast
project delivery
Community
Expectation
• Community engagement through a structured
process (SCC)
Legal
Climate
• Pursuing the geothermal strategy aggressively to
mitigate low hydrology
Mitigation Strategies
• Litigious Society
• Following processes and enhancing our policies

17
FY 2016/17 FINANCIAL PERFORMANCE REVIEW
FCPA John Mudany
Finance & ICT Director

Full year results to 30 June 2017 18
2016 2017 %
Change
Revenue 38,610 35,440 -8%
Operating Profit 16,271 13,709 -16%
EBITDA 26,495 22,953 -13%
EBITDA Margin 69% 65% -5%
Profit Before tax 11,264(1)
11,534 2%
Profit After tax 6,743 9,057 34%
FINANCIAL HIGHLIGHTS
Improved profitability despite challenging environment
Profit After Tax
up
34% (1)PBT arrived at after adjusting the EBIT by a provision of KShs 2,431 million in compensating tax after payment of five year
dividend arrears to the government

Full year results to 30 June 2017 19
REVENUE SOURCES
Total Revenue
[VALUE] 29,369
[VALUE]* 5,189
2,210 882
2016 2017
Electricity Revenue Steam RevenueOther income
Note: Total Revenue excludes interest income
Note: Electricity Revenue includes FX adjustments (2016:KShs 610 Million, 2017:KShs 362 Million)
Other Income
*Steam revenue included KShs 1,613M arrears for 2015
38,610 35,440
KShs Millions
1,502
332
286
376
538
57
2016 2017
Contracts/consultancy Insurance compensation
Miscellaneous income Carbon credits
2,210 882
83% of revenue came from electricity sales
Contract/consultancy
(Drilling) absent

Full year results to 30 June 2017 20
7,674 7,583
10,303 10,931
3,285 3,200
2016 2017
1,514 1,038
5,183 5,171
515 564
460 520
2016 2017
Hydro Geothermal Wind Diesel Thermal
STABLE ELECTRICITY REVENUE
Capacity Revenue Energy Revenue
21,262 21,714 7,671
7,293
Improved availability for Olkaria 280MW Poor hydrology (-475), Dispatch
constraints (-173)
KShs Million
2%
75% - 25% Capacity and Energy revenue split
5%
Full year results to 30 June 2017 21
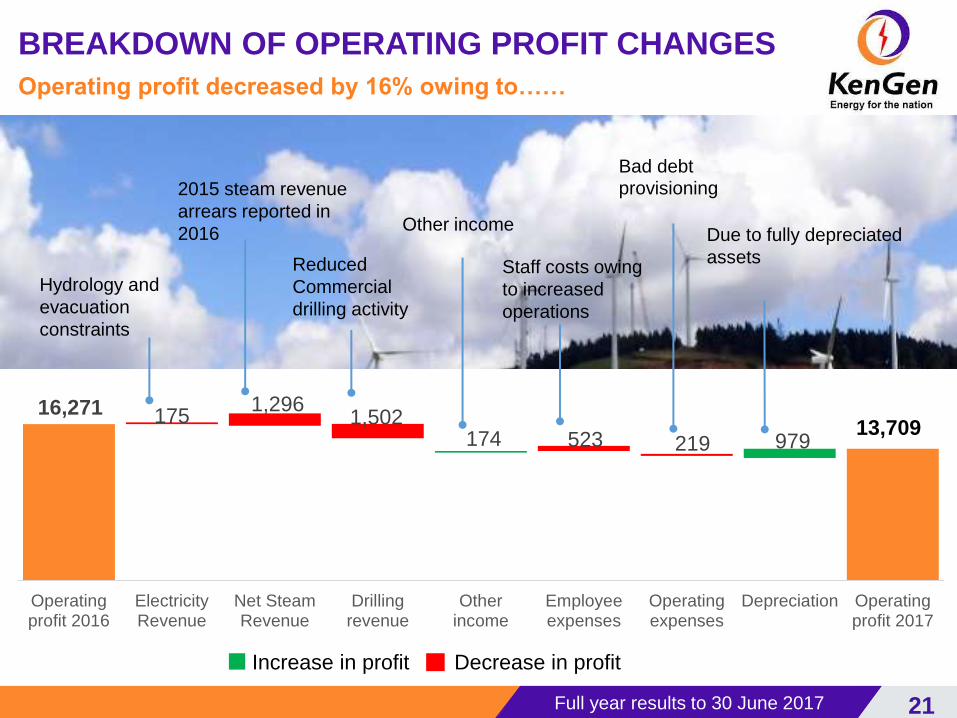
13,709 175
1,296 1,502
523 219
16,271
174 979
Operatingprofit 2016
ElectricityRevenue
Net SteamRevenue
Drillingrevenue
Otherincome
Employeeexpenses
Operatingexpenses
Depreciation Operatingprofit 2017
Increase in profit Decrease in profit
Due to fully depreciated
assets
Hydrology and
evacuation
constraints
2015 steam revenue
arrears reported in
2016
Reduced
Commercial
drilling activity
Other income
Staff costs owing
to increased
operations
Bad debt provisioning
BREAKDOWN OF OPERATING PROFIT CHANGES
Operating profit decreased by 16% owing to……

Full year results to 30 June 2017 22
Interest income
KShs 1,242 million interest income on
investments and interest
charge on late payments
123%
Effective tax rate
Finance costs
9% KShs 3,417 million
Effective interest rate
2.48%
21%
At KShs 2,477
million
Effective tax rate
reduction from 46%
to 21% mainly due
to Tax Incentives
after commissioning
of Wellheads
EPS
Basic
KShs 1.43
Closing No. of shares
6,594,522,339
FINANCE COSTS, TAX AND NET PROFIT
Diluted
KShs 1.37

Full year results to 30 June 2017 23
CASH MOVEMENT
Closing Cash Balances (KShs
Millions) Cash Flow (KShs Millions)
3,996
9,429
3,292
6,756
7,831
2013 2014 2015 2016 2017
Capex:
KShs
12,820
Growth in positive closing cash balances
7,831
8,972
13,074
6,756
9,299 11,849
1,973
1 J
uly
20
16
Ne
t C
ash
fro
mO
pe
rating
Activitie
s
Re
pa
ym
en
t o
fb
orr
ow
ing
s
Pro
ce
ed
s fro
mb
orr
ow
ing
s
Pro
ce
ed
s fro
me
qu
ity issu
e
Ne
t C
ash
use
d in
Inve
stin
g A
ctivitie
s
30
Jun
e 2
01
7
4,850 Net cash from
Financing

Full year results to 30 June 2017 24
BALANCE SHEET
2016 2017
% Movement
ASSETS
Property, Plant and Equipment 320,933 323,843 1%
Other Non-current Assets 24,400 23,715 -3%
Current Assets 21,916 29,639 35%
TOTAL ASSETS 367,249 377,197 3%
EQUITY AND LIABILITIES
Share Capital 15,610 16,488 6%
Share Premium 21,056 22,151 5%
Reserves and Retained Earnings 136,077 144,524 6%
Non-current Liabilities -1%
Borrowings 126,149 127,884 1%
Deferred Income Tax 40,227 42,197 5%
Trade & other payables 9,940 3,860 -61%
Current Liabilities 18,190 20,093 10%
TOTAL EQUITY AND LIABILITIES 367,249 377,197 3%
Strong Balance Sheet for project pipeline execution

Full year results to 30 June 2017 25
DEBT PROFILE AS AT 30TH JUNE 2017
33%
45%
3% 5%
14% Guaranteed
On-lent
Direct (DFIs)
InfrastructureBond
Commercial Loans
27.9%
16.9%
45.4%
9.8%
JPY EUR USD KShs
Exploring use of World Bank (IDA) Partial
Risk Guarantee
Funding currency
Gross debt by source of funding Debt Maturity Profile(KShs Million)
Closed the year with Net debt at KShs 128,124 Million (1% increment)
6,360 8,972 9,230
10,833 11,797
10,231 10,231
2015 2016 2017 2018 2019 2020 2021 2022
32,871
KShs 20.1 Billion
Debt-Equity swap
Weighted Average
Maturity 13.8 years
Weighted Average
Cost of Debt 3.36%

Full year results to 30 June 2017 26
CAPEX FUNDING
56,547
28,737 31,700
JPY Euros Kshs
Local Commercial Banks
Belgium
Government
Funding for our project pipeline firmly on course
-
10,000
20,000
30,000
40,000
50,000
60,000
70,000
80,000
90,000
2017 2018 2019 2020 2021 2022
Wind Power Plants
Wellhead ModularPlants
Geothermal Plants
Steam Drilling
Maintenance
Capex Plan Available multi-currency funding lines
KShs Million

Full year results to 30 June 2017 27
DECENT CAPITAL GAINS FOR
SHAREHOLDERS
34%
52%
31%
Invested atRights
Issue Price
Invested atstart ofYear
Investedwithin lastSix Months
KShs 2.20 KShs 3.00 KShs 2.05
• Cash reinvestment
in capacity
expansion to unlock
steam revenue
• This represents
better value for the
shareholders

1. MACRO ECONOMIC
INDICATORS
28
ONGOING STRATEGY (WAY FORWARD)
Rebecca Miano (Mrs.), OGW
Ag. Managing Director & CEO

Full year results to 30 June 2017 29
CAPACITY GROWTH FOCUSED ON
RENEWABLES
Olkaria 1 to undergo phased rehabilitation
818
534
26
254
818
1,164
116
254
Generation 2017 Generation 2022 Capacity Additions
Wind
Thermal
Geothermal
Hydro
1,631 MW
2,352MW
Wind
Thermal
Geothermal
Hydro
630MW of Geothermal and 90MW of Wind
To grow supply ahead of demand and retain our Market leadership
Olk.V, 140
Olk. I Unit 6, 70
Olk. I AU & IV Topping,
47
Wellhead, 47 Olk. I
Rehab, 46
Olk. VI, 140
Olk. VII, 140
Ngong III, 10
Meru Wind,
80

Full year results to 30 June 2017 30
OUR BUSINESS MODELS
MODEL A (TRADITIONAL) MODEL B
(PRIVATE) MODEL C (DIVERSIFICATION)
KENGEN
Existing KenGen
legal entity (traditional)
Operating existing legacy
plants as well as future
Model A projects (financed
on the balance sheet)
Multiple separate legal entities
with ring fenced risks and
cash flows
Special purpose vehicles
(SPVs – off balance sheet)
Fully owned by KenGen or
with a partner (e.g., SPV 49%)
A legal entity 100% owned by
KenGen
Provides services
to Model A/B
and other companies
Olkaria wellheads
Ngong I phase 3
Olkaria V
Meru phase 1
Olkaria VI
New sites’ geothermal projects
Asset backed security
Drilling services
Consultancy
Industrial park
Steam
Olkaria I unit 6 + rehab
Innovative financing and business diversification plans ongoing

Full year results to 30 June 2017
THANK YOU