2014 full-year results
TRANSCRIPT

2014
Full-Year Results
Nancy McKinstry
Chief Executive Officer and Chairman
Kevin Entricken
Chief Financial Officer
February 18, 2015 | Amsterdam

This presentation contains forward-looking statements. These statements may be identified
by words such as "expect", "should", "could", "shall", and similar expressions. Wolters Kluwer
cautions that such forward-looking statements are qualified by certain risks and
uncertainties, that could cause actual results and events to differ materially from what is
contemplated by the forward-looking statements. Factors which could cause actual results to
differ from these forward-looking statements may include, without limitation, general
economic conditions, conditions in the markets in which Wolters Kluwer is engaged, behavior
of customers, suppliers and competitors, technological developments, the implementation
and execution of new ICT systems or outsourcing, legal, tax, and regulatory rules affecting
Wolters Kluwer's businesses, as well as risks related to mergers, acquisitions and divestments.
In addition, financial risks, such as currency movements, interest rate fluctuations, liquidity
and credit risks could influence future results. The foregoing list of factors should not be
construed as exhaustive. Wolters Kluwer disclaims any intention or obligation to publicly
update or revise any forward-looking statements, whether as a result of new information,
future events or otherwise.
Unless otherwise stated, this presentation is based on continuing operations. Comparative
information is presented accordingly. Growth rates are cited in constant currencies unless
otherwise noted.
Forward-looking Statements
2 2014 Full-Year Results

Introduction
Financial Review
Strategic and Operating Review
Outlook 2015
Appendix
Agenda
3 2014 Full-Year Results

Introduction Guidance met, organic growth improved, returning cash
4 2014 Full-Year Results
2014 results in line with guidance set at the start of the year
– Adjusted operating margin 21.0%, within guidance range
– Adjusted EPS up +3% at constant currencies, in line with guidance
– Adjusted free cash flow €516 million, better than expected
Organic revenue growth improves to +2%
– Leading high growth positions sustain +7% organic growth
– Digital and services revenues grow +5% organically
In 2015, we expect further progress
– Continued restructuring, mainly in Europe
– Stepped up organic investment in sales and marketing and new products
– Reviewing strategic options for Transport Services
– Up to €140 million cash return to shareholders

Strategic progress Key achievements 2014
5 2014 Full-Year Results
▪ Delivered 7% organic growth in our leading,
high growth positions; Double-digit growth in
faster-growing economies
▪ Expanded CLS with acquisition of Datacert
▪ Implemented several small disposals
▪ Digital and services revenues grew +5%
▪ Sustained investment in new and enhanced
products at 8-10% of revenues
▪ Advancing cloud-based and mobile offering
▪ Completed major restructuring
▪ Optimizing print products to drive value
▪ Leveraged technology investments across
borders
Expand
our leading,
high growth
positions
Deliver
solutions and
insights
Drive
efficiencies

Introduction
Financial Review
Strategic and Operating Review
Outlook 2015
Appendix
Agenda
6 2014 Full-Year Results

Full-year 2014 results Results in line with guidance; organic growth improves to 2%
(€ million, unless otherwise stated) FY 2014 FY 2013 ∆ ∆ CC ∆ OG
Revenues 3,660 3,565 +3% +3% +2%
Adjusted operating profit 768 765 0% 0% -1%
Adjusted operating profit margin 21.0% 21.5%
Diluted adjusted EPS €1.57 €1.56 +1% +3%
Adjusted free cash flow 516 503 +3% +1%
Net-debt-to-EBITDA ratio 2.1x 2.2x
Return on Invested Capital 8.5% 8.7%
∆: % Change; ∆ CC: % Change constant currencies (EUR/USD 1.33); ∆ OG: % Organic growth
7 2014 Full-Year Results

(€ million) FY 2014 FY 2013 ∆ ∆ CC ∆ OG
Legal & Regulatory 1,497 1,447 +3% +4% -1%
Tax & Accounting 946 965 -2% -1% +3%
Health 816 775 +5% +5% +5%
Financial & Compliance Services 401 378 +6% +6% +4%
Total revenues 3,660 3,565 +3% +3% +2%
FY 2014 Revenues
Revenues by division Tax & Accounting, Health and Financial & Compliance Services support
organic growth
8 2014 Full-Year Results
Legal & Regulatory
41%
Tax & Accounting
26%
Health 22%
F&CS 11%
∆: % Change; ∆ CC: % Change constant currencies (EUR/USD 1.33); ∆ OG: % Organic growth. Legal & Regulatory and Tax & Accounting include the net effect of the
transfer of certain assets in Europe from Tax & Accounting to the Legal & Regulatory division in 2014

Revenues by region Organic growth driven by North America and Asia Pacific & ROW
North America
55%
Europe 37%
AsiaPac & ROW
8%
FY 2014 Revenues
9 2014 Full-Year Results
∆ OG:
+3% (+2%)
(€ million) FY 2014 FY 2013 ∆ ∆ CC ∆ OG
North America 1,999 1,924 +4% +5% +3%
Europe 1,373 1,387 -1% -1% 0%
AsiaPac & ROW 288 254 +13% +12% +7%
Total revenues 3,660 3,565 +3% +3% +2%
∆: % Change; ∆ CC: % Change constant currencies (EUR/USD 1.33); ∆ OG: % Organic growth
Legend:
∆ OG - % Organic Growth FY 2014 (FY 2013)
∆ OG:
0% (-2%)
∆ OG:
+7% (+5%)

Digital 68%
Services 12%
Print 20%
Revenues by media format Digital revenues up 6% organically, growing in all divisions
(€ million) FY 2014 FY 2013 ∆ ∆ CC ∆ OG
Digital 2,472 2,286 +8% +8% +6%
Services 453 454 0% 0% 0%
Print 735 825 -11% -10% -9%
Total revenues 3,660 3,565 +3% +3% +2%
FY 2014 Revenues
10 2014 Full-Year Results
∆: % Change; ∆ CC: % Change constant currencies (EUR/USD 1.33); ∆ OG: % Organic growth. Breakdown by media format reflects updated product classifications
introduced in 2014

(€ million) FY 2014 FY 2013 ∆ ∆ CC ∆ OG Margin
FY 2014
Margin
FY 2013
Legal & Regulatory 305 313 -3% -3% -6% 20.3% 21.6%
Tax & Accounting 250 259 -3% -3% -3% 26.4% 26.8%
Health 197 175 +13% +11% +11% 24.1% 22.6%
Financial & Compliance Services 65 64 +1% 0% -2% 16.3% 17.1%
Corporate (49) (46) +6% +6% +6%
Adjusted operating profit 768 765 0% 0% -1% 21.0% 21.5%
FY 2014 Adjusted Operating Profit
Adjusted operating profit Margin decline due to increased restructuring
11 2014 Full-Year Results
Legal & Regulatory
37%
Tax & Accounting
31%
Health 24%
F&CS 8%
∆: % Change; ∆ CC: % Change constant currencies (EUR/USD 1.33); ∆ OG: % Organic growth. Legal & Regulatory and Tax & Accounting include the net effect of the
transfer of certain assets in Europe from Tax & Accounting to the Legal & Regulatory division in 2014
* Excluding corporate

Restructuring costs Excluding restructuring, margin up 10 basis points
12 2014 Full-Year Results
(€ million, unless otherwise stated) FY 2014 FY 2013 ∆ ∆ CC ∆ OG
Adjusted operating profit before restructuring 804 780 +3% +3% +1%
Adjusted operating profit margin before restructuring 22.0% 21.9%
Restructuring costs (36) (15)
Total adjusted operating profit 768 765 0% 0% -1%
Adjusted operating profit margin 21.0% 21.5%
∆ - % Change; ∆ CC - % Change constant currencies (EUR/USD 1.33); ∆ OG – % Organic growth
Restructuring is included in adjusted operating profit
Restructuring costs increased to €36 million in 2014
Majority of restructuring costs were in Legal & Regulatory and Tax &
Accounting

Adjusted net profit and EPS Diluted adjusted EPS up +3% in constant currencies
(€ million, unless otherwise stated) FY 2014 FY 2013 ∆ ∆ CC
Revenues 3,660 3,565 +3% +3%
Adjusted operating profit 768 765 0% 0%
Adjusted operating profit margin 21.0% 21.5%
Adjusted net financing costs (113) (117)
Equity-accounted investees, net of tax (1) (1)
Adjusted profit before tax 654 647 +1% +3%
Tax on adjusted profit (182) (178)
Effective benchmark tax rate 27.6% 27.6%
Non-controlling interests (2) (2)
Adjusted net profit 470 467 +1% +3%
Diluted weighted average shares (million) 299.9 299.5
Diluted adjusted EPS €1.57 €1.56 +1% +3%
∆: % Change; ∆ CC: % Change constant currencies (EUR/USD 1.33); ∆ OG: % Organic growth
13 2014 Full-Year Results

IFRS profit and diluted EPS Non-recurring gains and tax benefits drive IFRS net profit up +37%
(€ million, unless otherwise stated) FY 2014 FY 2013 ∆
Adjusted operating profit 768 765 0%
Amortization of acquired intangibles (192) (185)
Results on divestments of operations 10 47
Acquisition integration costs and other non-benchmark items (17) (8)
Operating profit 569 619 -8%
Financing results1) (56) (128)
Share of profit of equity-accounted investees, net of tax (1) (1)
Profit before tax 512 490 +5%
Income tax expense (38) (137)
Effective tax rate 7.4% 28.0%
Profit after tax 474 353 +35%
Loss on discontinued operations, net of tax - (7)
Profit for the year 474 346 +37%
Non-controlling interests (1) (1)
Profit for the year to the owners of the Company 473 345 +37%
Diluted EPS €1.58 €1.15 +37%
∆: % Change; ∆ CC: % Change constant currencies (EUR/USD 1.33)
1) Financing results include employee benefits financing costs of €5 million (2013: €5 million), a €14 million loss on divestment of investments available-for-sale (2013:
write-down of €18 million) and a €76 million revaluation gain on our minority interest in Datacert (2013: disposal gain of €12 million)
14 2014 Full-Year Results

Adjusted free cash flow Cash conversion better than expected
(€ million, unless otherwise stated) FY 2014 FY 2013 ∆ ∆ CC
Adjusted operating profit 768 765 0% 0%
Depreciation and amortization of other intangibles 140 132
Adjusted EBITDA 908 897 +1% +1%
Capital expenditure (148) (148)
Autonomous movements in working capital 4 (22)
Adjusted operating cash flow 764 727 +5% +3%
Cash conversion ratio 100% 95%
Paid financing costs (135) (115)
Paid corporate income tax, adjusted for Springboard (119) (103)
Net change in restructuring provision1) (9) (11)
Other2) 15 5
Adjusted free cash flow 516 503 +3% +1%
∆ - % Change; ∆ CC - % Change constant currencies (EUR/USD 1.33)
1) Excludes Springboard appropriation, additions to acquisition integration and additions after divestments (2013)
2) Other includes share-based payments, dividends received, and other
15 2014 Full-Year Results

Movement in net debt Net debt reduced
(€ million, unless otherwise stated) FY 2014 FY 2013
Net debt at January 1 (1,988) (2,086)
Adjusted free cash flow 516 503
Dividends paid (209) (204)
Springboard restructuring, net of tax (4) (10)
Free cash flow after dividends and Springboard 303 289
Other sources and uses of cash flow:
Acquisition spending, net of cash acquired, including costs (189) (198)
Divestiture cash proceeds, including costs, net of tax 27 60
Share repurchases (25) (27)
Discontinued operations, net of cash disposed of - (13)
Change in the fair value of derivatives (18) (16)
Foreign exchange and other (7) 3
Movement in net debt 91 98
Net debt at December 31 (1,897) (1,988)
Net-debt-to-EBITDA ratio 2.1x 2.2x
16 2014 Full-Year Results

Leverage Net-debt-to-EBITDA below target level
2.9x 2.7x
3.1x
2.4x 2.2x 2.1x
2009 2010 2011 2012 2013 2014
Net-Debt-to-EBITDA (Ratio)
17 2014 Full-Year Results
Target:
2.5x

Debt maturity profile Next major debt maturity not until in 2018
18 2014 Full-Year Results
535
148
14
748
247
696
395
204
2014 2015 2016 2017 2018 2019 2020 2021 2022 2023 2024 2025 >2025
Debt Maturity Profile (€ million)
Cash & cash
equivalents +
€20 million collateral
posted
May 2014: Issued new 10-year €400 million Eurobond with 2.5% coupon
July 2014: Renewed €600 million multi-currency credit facility
year-end
20

Returns to shareholders Increasing cash returns
19 2014 Full-Year Results
Dividend per share (€)1)
Progressive dividend policy: ninth consecutive year of increase
Share buy-back of up to €140 million in 2015
proposed
0.55
0.58
0.64 0.65
0.66 0.67
0.68 0.69
0.70 0.71
2005 2006 2007 2008 2009 2010 2011 2012 2013 2014
19
645
100
135
20 25
140
2006 2007 2008 2009 2010 2011 2012 2013 2014 2015
Share buy-backs (€ million)
intended
1) Dividend declared for the year indicated

Revenues up +2% organically
― Leading, high growth positions +7%
― Digital & services revenues +5%
Adjusted operating profit of €768 million; margin reflects increased
restructuring
Diluted adjusted EPS €1.57, up +3% in constant currencies
Adjusted free cash flow of €516 million, up +1% in constant currencies
Net-debt-to-EBITDA ratio of 2.1x, better than target
Summary
20 2014 Full-Year Results

Introduction
Financial Review
Strategic and Operating Review
Outlook 2015
Appendix
Agenda
21 2014 Full-Year Results

22 2014 Full-Year Results
Corporate Legal Services Revenue +5% organically, buoyed by Q4
transactional revenues
Transactional revenue +7%, benefitting
from one time customer projects in Q4
Strong renewal rates for legal
representation services
Integration of Datacert and TyMetrix
(ELM Solutions) on track; both achieve
strong revenue growth
Legal & Regulatory Solutions Organic revenue decline -3%, in line with
prior year
Digital revenues grow +3% organically
Printed loose leafs and books see
continued decline
Restructuring initiatives expanded
Legal & Regulatory Continued print decline; margin impacted by restructuring
Corporate Legal
Services 33% Legal &
Regulatory Solutions
67%
North America
43% Europe
56%
AsiaPac & ROW 1%
FY 2014 revenues by geographic market
L&R Segments Revenues by Geography
€ million FY 2014 FY 2013 Δ Δ CC Δ OG
Revenues 1,497 1,447 +3% +4% -1%
Adjusted
operating profit 305 313 -3% -3% -6%
Margin 20.3% 21.6%
∆ - % Change; ∆ CC - % Change constant currencies (EUR/USD 1.33); ∆ OG – % Organic growth

Tax & Accounting software
69%
Digital: other 16%
Services 7%
Print 8%
Tax & Accounting Software grows 5% globally; margins reflect increased restructuring
23 2014 Full-Year Results
North America Software revenues up +5%, with both
on-premise and cloud solutions
performing well
Print formats and bank product fees
remain under pressure
Restructured editorial and production
Europe Improved organic growth led by
Germany, Spain and Scandinavia
Investing in cloud-based and
collaborative solutions
Asia Pacific & ROW Positive organic growth, enhanced by
one-time sales in Q4
Restructuring to create software
development centers of excellence
Brazil sees double-digit growth. China
expanded with Dingxin Chuangzhi
North America
56%
Europe 33%
AsiaPac & ROW
11%
Revenues by Media Revenues by Geography
FY 2014 revenues by geographic market
€ million FY 2014 FY 2013 Δ Δ CC Δ OG
Revenues 946 965 -2% -1% +3%
Adjusted
operating profit 250 259 -3% -3% -3%
Margin 26.4% 26.8%
∆ - % Change; ∆ CC - % Change constant currencies (EUR/USD 1.33); ∆ OG – % Organic growth

Health Organic growth +5%; margin up 150 basis points
24 2014 Full-Year Results
Clinical Solutions
Double-digit organic growth, with strong
performances across most product areas
and in all regions globally
UpToDate completed global launch of its
mobile access platform and introduced
22nd specialty
Sustained investment in new product
development
Medical Research, Professional &
Education
Combined revenues broadly flat on
organic basis, with digital growth offset
by print decline
Ovid and online journals saw good
growth; P&E e-learning and other digital
solutions grew 50%+ organically
Printed journals and books decline
Clinical Solutions
45% Medical
Research 37%
Profess'l & Education
18%
North America
71%
Europe 11%
AsiaPac & ROW
18%
Health Segments Revenues by Geography
FY 2014 revenues by geographic market
€ million FY 2014 FY 2013 Δ Δ CC Δ OG
Revenues 816 775 +5% +5% +5%
Adjusted
operating profit 197 175 +13% +11% +11%
Margin 24.1% 22.6%
∆ - % Change; ∆ CC - % Change constant currencies (EUR/USD 1.33); ∆ OG – % Organic growth

Financial & Compliance Services Organic growth +4%; margin reflects lower transaction volumes,
investment and restructuring
25 2014 Full-Year Results
Finance, Risk & Compliance Organic growth in double-digits, driven
by strong software license and
professional services sales in Q4
Audit Robust organic growth
New customer wins for TeamMate
globally more than absorb effect of
product rationalization
Originations Revenue and margins impacted by
downturn in U.S. mortgage refinancing
market
FS Transactional revenue down -6%,
including one-off regulatory driven
transaction sales in Q4
Transport Services (Europe) Revenue decline; transition to
subscription model nearly complete
Originations 32%
Finance, Risk &
Compliance 47%
Audit 11%
Transport Svcs 10%
North America
61%
Europe 31%
AsiaPac & ROW
8%
F&CS Segments Revenues by Geography
FY 2014 revenues by geographic market
€ million FY 2014 FY 2013 Δ Δ CC Δ OG
Revenues 401 378 +6% +6% +4%
Adjusted
operating profit 65 64 +1% 0% -2%
Margin 16.3% 17.1%
∆ - % Change; ∆ CC - % Change constant currencies (EUR/USD 1.33); ∆ OG – % Organic growth

Progress on strategic goals Our strategy aims to accelerate profitable growth
26 2014 Full-Year Results
Expand
our leading,
high growth
positions
Deliver
solutions and
insights
Drive
efficiencies
Find more ways to drive efficiencies in
areas such as sourcing, technology, real
estate, organizational processes, and
distribution channels
Invest in products and services to deliver
the tailored solutions and insights our
professional customers need to make
critical decisions and increase their
productivity
Focus the majority of our investments on
high growth segments where we have
achieved market leadership

1. Expand our leading, high growth positions Our leading, high growth positions in total grew 7% organically
Health
Tax & Accounting
Legal & Regulatory
Financial & Compliance
Services
33%
69%
45%
58% Finance, Risk &
Compliance and Audit1)
+5%
>10%
>10%
+5%
Clinical Solutions
Tax & Accounting Software
Corporate Legal Services
1) Includes the Finance, Risk & Compliance and Audit units within the F&CS division
27 2014 Full-Year Results
Total
organic
growth:
+7%
Wolters Kluwer Revenue FY 2014
Leading, high growth units within divisions (48% of total revenues)
Divisions: Organic Growth: % of division:
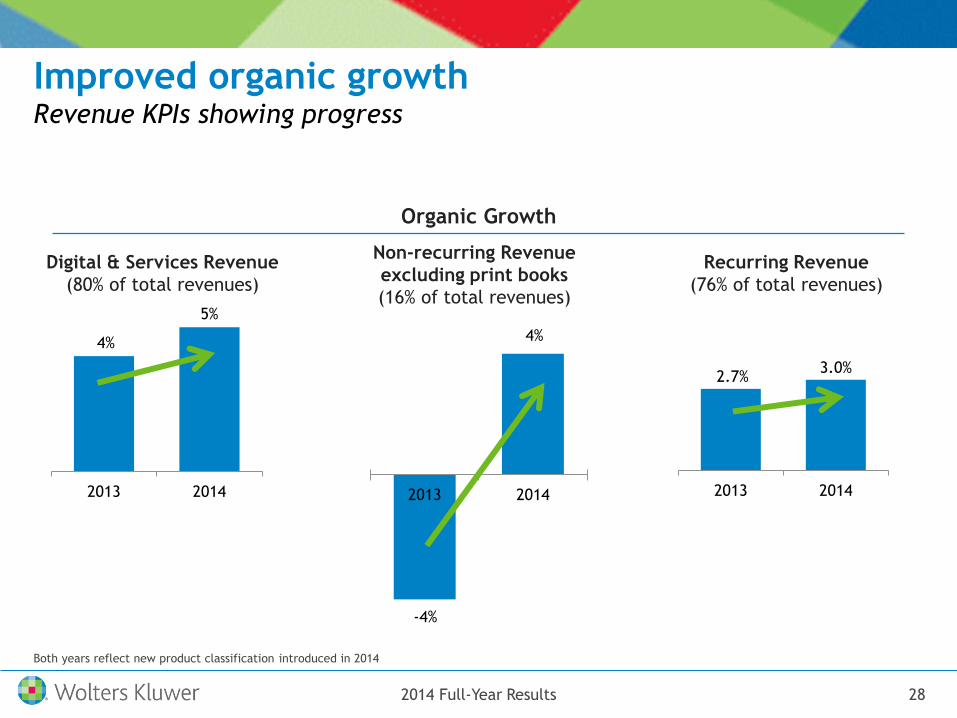
Improved organic growth Revenue KPIs showing progress
28 2014 Full-Year Results
Both years reflect new product classification introduced in 2014
Organic Growth
4%
5%
2013 2014
2.7% 3.0%
2013 2014
Digital & Services Revenue
(80% of total revenues)
Recurring Revenue
(76% of total revenues)
Non-recurring Revenue
excluding print books
(16% of total revenues)
-4%
4%
2013 2014

2. Deliver solutions and insights Improve our customers’ productivity and outcomes
Tailored to
customer needs
Increases mobility and
productivity
Driving improved
outcomes
29 2014 Full-Year Results
Lippincott’s Nursing Advisor
Clinical decision support
system for nurses and the rest
of the interdisciplinary care
Kleos
Next Generation cloud product
supporting both practice and
business of law
UpToDate Anywhere
Expanded global reach of
UpToDate to provide clinicians
with access anywhere, anytime
and through any device

3. Drive efficiencies Creating global scale and savings in our operations
30 2014 Full-Year Results
Sourcing Technology Real Estate Sales Channel
& Go to Market
Process &
Organization
Legal & Regulatory and Tax and Accounting
Outsourcing print, automating editorial & production and consolidating real estate
Streamlined editorial & production and creating centers of excellence in software
development
Financial & Compliance:
Transport Services adjusted cost base to align with declined revenue

Introduction
Financial Review
Strategic and Operating Review
Outlook 2015
Appendix
Agenda
31 2014 Full-Year Results

Divisional Outlook 2015
32 2014 Full-Year Results
Legal & Regulatory
Corporate Legal Services to see organic growth, albeit at a more
moderate pace in the second half
Division, including Legal & Regulatory Solutions, to see organic
revenue decline and modest margin contraction
Tax & Accounting
Revenue momentum similar to 2014, with growth in software
solutions more than offsetting decline in print and bank products
First half growth to be more muted due to normal seasonal patterns
Margin expected to improve modestly
Health
Steady revenue growth, driven by robust growth in Clinical Solutions
Medical Research, Professional & Education likely to see growth in
digital offset by continued decline in print
Margin improvement despite product investment and restructuring
Financial & Compliance
Services
Finance, Risk & Compliance and Audit to see moderate organic
growth, following double-digit growth in 2014
Market conditions for Originations are mixed, with refinancing
volumes still weak but new regulations offering opportunities

Guidance 2015
Performance indicators FY 2015 Guidance
Adjusted operating profit margin 21.0%–21.5%
Adjusted free cash flow €500-€525 million
Return on invested capital ≥ 8%
Diluted adjusted EPS Mid-single-digit growth
Guidance for adjusted free cash flow and diluted adjusted EPS is in constant currencies (EUR/USD 1.33). Guidance for EPS growth reflects the
announced share repurchases. Adjusted operating profit margin and ROIC are in reported currency
33 2014 Full-Year Results
Additional information:
Expect adjusted net financing costs of approximately €100 million, excluding the impact
of exchange rate movements
Expect benchmark effective tax rate to be between 27% and 28%
Expect cash conversion ratio to be in line with our historic average of 95% and capital
expenditure between 4% and 5% of revenue

Q&A
Nancy McKinstry
Chief Executive Officer and Chairman
Kevin Entricken
Chief Financial Officer

Appendix
Nancy McKinstry
Chief Executive Officer and Chairman
Kevin Entricken
Chief Financial Officer

Legal & Regulatory
41%
Tax & Accounting
26%
Health 22%
F&CS 11%
Revenue and operating profit breakdown
FY 2014 Revenues by division
1) Excluding corporate
FY 2014 Adjusted operating profit1)
FY 2014 Revenues by type
Digital 68%
Services 12%
Print 20%
FY 2014 Revenues by media format
Legal & Regulatory
37%
Tax & Accounting
31%
Health 24%
F&CS 8%
36 2014 Full-Year Results
Recurring 76%
Print books
8%
Other non-recurring
16%

Recurring 76%
Print books
8%
Other non-recurring
16%
Revenues by type
(€ million) FY 2014 FY 2013 ∆ ∆ CC ∆ OG
Digital and services subscriptions 2,155 2,016 +7% +7% +5%
Print subscriptions 341 387 -12% -10% -8%
Other recurring 281 274 +2% +2% +1%
Recurring revenues 2,777 2,677 +4% +4% +3%
Print books 289 322 -11% -11% -10%
CLS transactional 215 191 +13% +13% +7%
FS transactional 37 39 -5% -5% -6%
Other non-recurring 342 336 +2% +2% +3%
Total revenues 3,660 3,565 +3% +3% +2%
FY 2014 Revenues
37 2014 Full-Year Results
∆ - % Change; ∆ CC - % Change constant currencies (EUR/USD 1.33); ∆ OG – % Organic growth. Breakdown by revenue type reflects updated product classifications
introduced in 2014

Reconciliation: Adjusted net financing costs to
financing results
38 2014 Full-Year Results
(€ million) FY 2014 FY 2013
Adjusted net financing costs (113) (117)
Divestment related results on AccessData - 12
Loss on investment available-for-sale (14) -
Employee benefits financing component (5) (5)
Revaluation gain on minority interest in Datacert 76 -
Write-down of investments available-for-sale - (18)
Financing results (56) (128)

(€ million, unless otherwise stated) Dec. 31, 2014 Dec. 31, 2013
Goodwill and intangible assets 5,172 4,592
Equity-accounted investees and financial assets 32 58
Other non-current assets 216 212
Non-current assets 5,420 4,862
Cash and cash equivalents 535 755
Other current assets 1,412 1,247
Deferred income (1,375) (1,214)
Short-term borrowings and bank overdrafts (125) (817)
Other current liabilities (924) (883)
Working capital (477) (912)
Capital employed 4,943 3,950
Total equity 2,121 1,584
Long-term debt 2,304 1,909
Other non-current liabilities 518 457
Total financing 4,943 3,950
Closing rate EUR/USD 1.21 1.38
Balance Sheet
39 2014 Full-Year Results

Currency
40 2014 Full-Year Results
Average rates
Impact
revenue
Impact
adjusted
operating
profit
1 Euro FY 2014 FY 2013 FY 2014 FY 2014
U.S. Dollar 1.33 1.33 6 6
British Pound 0.81 0.85 (6) 0
Canadian Dollar 1.47 1.37 (4) 0
Australian Dollar 1.47 1.38 (4) 0
Brazilian Real, Russian Ruble and other (2) (3)
Total impact (€ million) (10) 3
By division:
Legal & Regulatory (6) 0
Tax & Accounting (7) 0
Health 1 2
Financial &
Compliance Services 2 1
Total (10) 3

Sensitivity to U.S. Dollar
41 2014 Full-Year Results
Impact of a 1% weakening of the U.S. Dollar against the Euro
(€ million) 2014
Revenues (21)
Adjusted operating profit (6)
Adjusted net profit (3)
Adjusted FCF (4)
Diluted adjusted EPS (Euro) (0.01)
Does not include the impact of other currency exposures.
Does not include the impact of exchange rate movements on year-end valuation of intercompany balances.