2009 half year results presentation -...
TRANSCRIPT
2009 Half YearResults PresentationPresentation
3 August 2009Wolfhart HauserWolfhart HauserChief Executive Officer
Bill SpencerBill SpencerChief Financial Officer

Cautionary statement regarding forward-looking statements
This presentation contains certain for ard looking statementsThis presentation contains certain forward-looking statements with respect to the financial condition, results, operations and business of Intertek Group plc. These statements and forecasts involve risk and uncertainty because they relate to events andinvolve risk and uncertainty because they relate to events and depend upon circumstances that will occur in the future. There are a number of factors that could cause actual results or developments to differ materially from those expressed or implieddevelopments to differ materially from those expressed or implied by these forward-looking statements and forecasts. Nothing in this presentation should be construed as a profit forecast.
3 August 2009
www.intertek.com 203/08/2009 2
Bill SpencerChief Financial Officer
Financial PerformanceFinancial Performance2009 Half Year Results Presentation
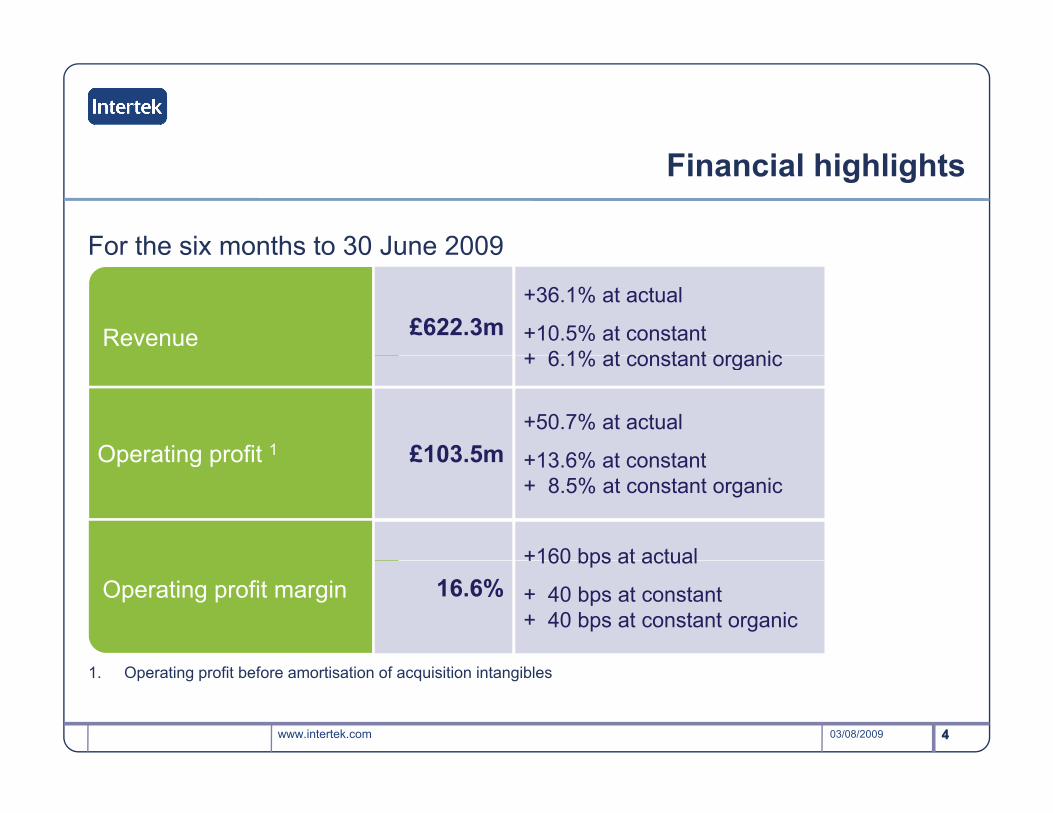
Financial highlights
For the six months to 30 June 2009For the six months to 30 June 2009
Revenue £622.3m+36.1% at actual
+10.5% at constant+ 6 1% at constant organic
Operating profit 1 £103 5m+50.7% at actual
+13 6% at constant
+ 6.1% at constant organic
Operating profit £103.5m +13.6% at constant + 8.5% at constant organic
+160 bps at actualOperating profit margin 16.6%
+160 bps at actual
+ 40 bps at constant + 40 bps at constant organic
www.intertek.com 403/08/2009
1. Operating profit before amortisation of acquisition intangibles
4
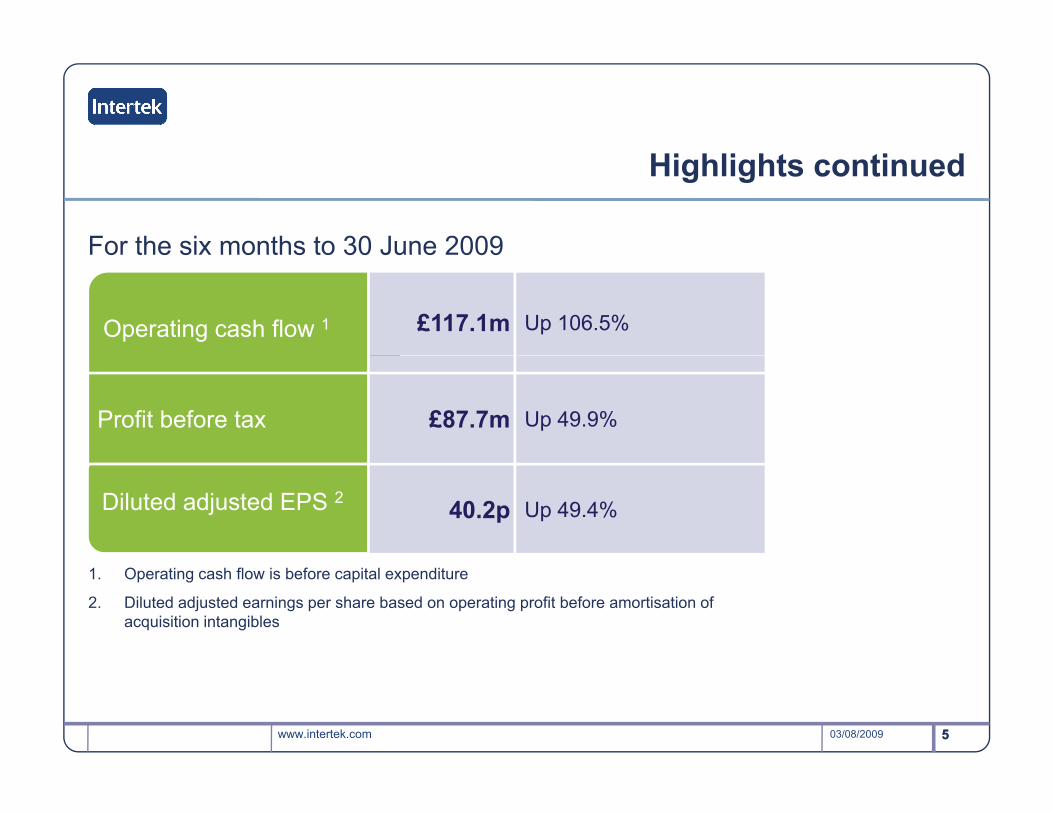
Highlights continued
For the six months to 30 June 2009
Operating cash flow 1 £117.1m Up 106.5%
For the six months to 30 June 2009
Profit before tax £87.7m Up 49.9%
Diluted adjusted EPS 2 40.2p Up 49.4%
1. Operating cash flow is before capital expenditure
2. Diluted adjusted earnings per share based on operating profit before amortisation of acquisition intangibles
www.intertek.com 503/08/2009 5
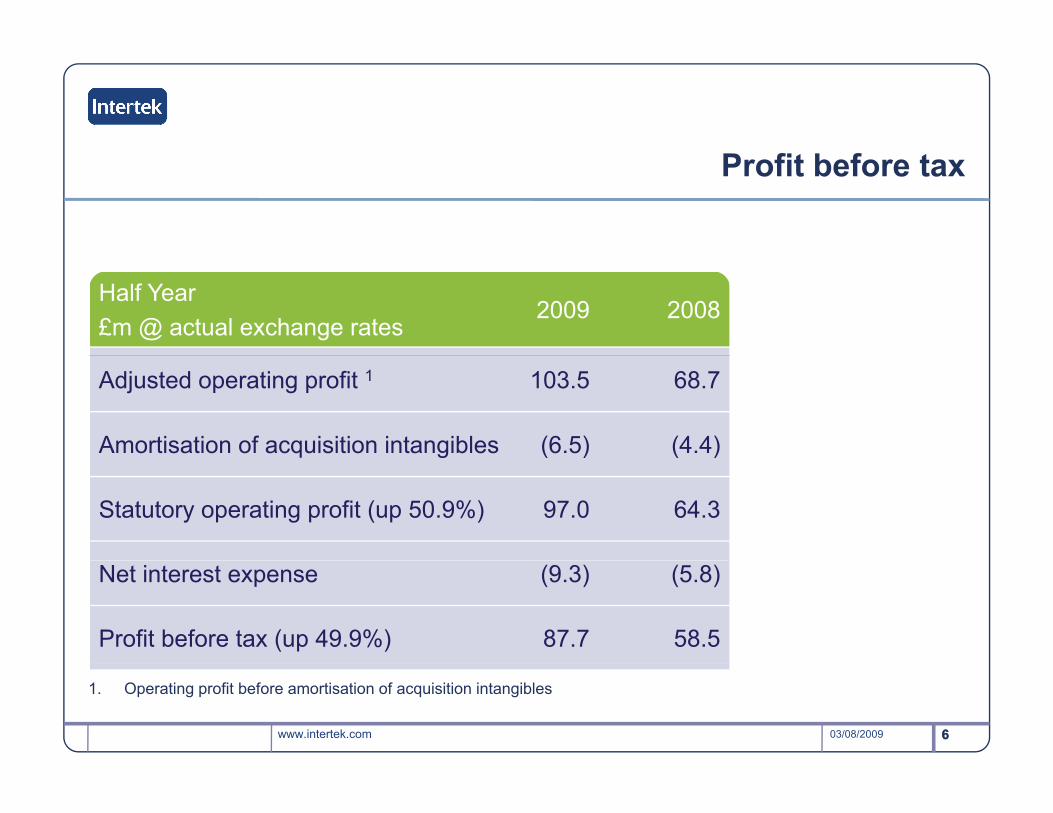
Profit before tax
Half Year £m @ actual exchange rates
2009 2008
Adjusted operating profit 1 103.5 68.7
Amortisation of acquisition intangibles (6.5) (4.4)g ( ) ( )
Statutory operating profit (up 50.9%) 97.0 64.3
Net interest expense (9.3) (5.8)
Profit before tax (up 49.9%) 87.7 58.5
www.intertek.com 603/08/2009 6
1. Operating profit before amortisation of acquisition intangibles
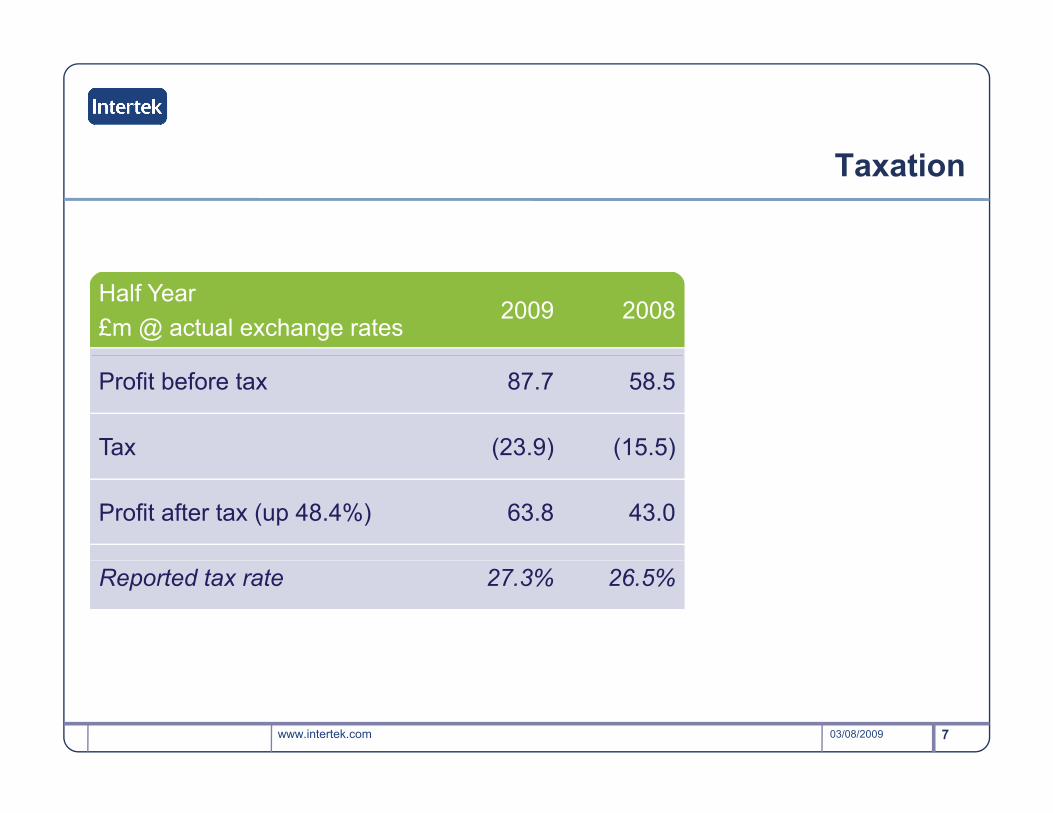
Taxation
Half Year£m @ actual exchange rates
2009 2008
Profit before tax 87.7 58.5
Tax (23.9) (15.5)( ) ( )
Profit after tax (up 48.4%) 63.8 43.0
Reported tax rate 27.3% 26.5%
www.intertek.com 703/08/2009
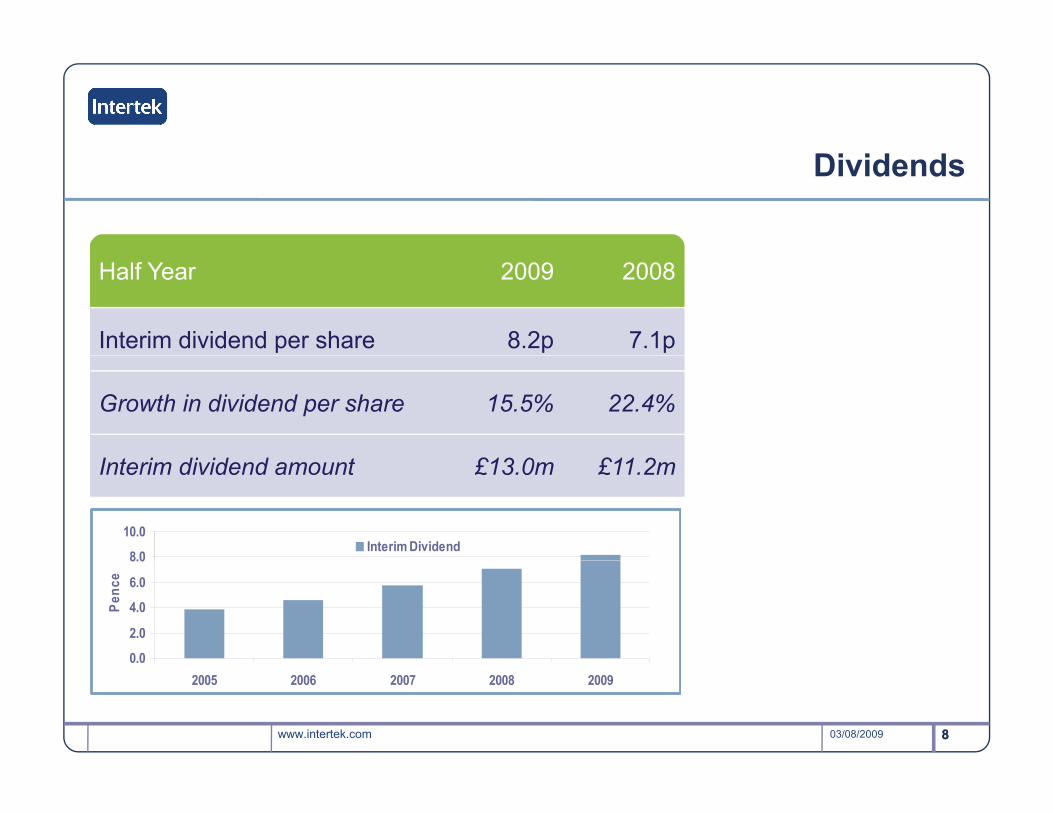
Dividends
Half Year 2009 2008
Interim dividend per share 8.2p 7.1p
Growth in dividend per share 15.5% 22.4%
I t i di id d t £13 0 £11 2Interim dividend amount £13.0m £11.2m
8.0
10.0Interim Dividend
0.0
2.0
4.0
6.0
8.0
Penc
e
www.intertek.com 803/08/2009 8
2005 2006 2007 2008 2009
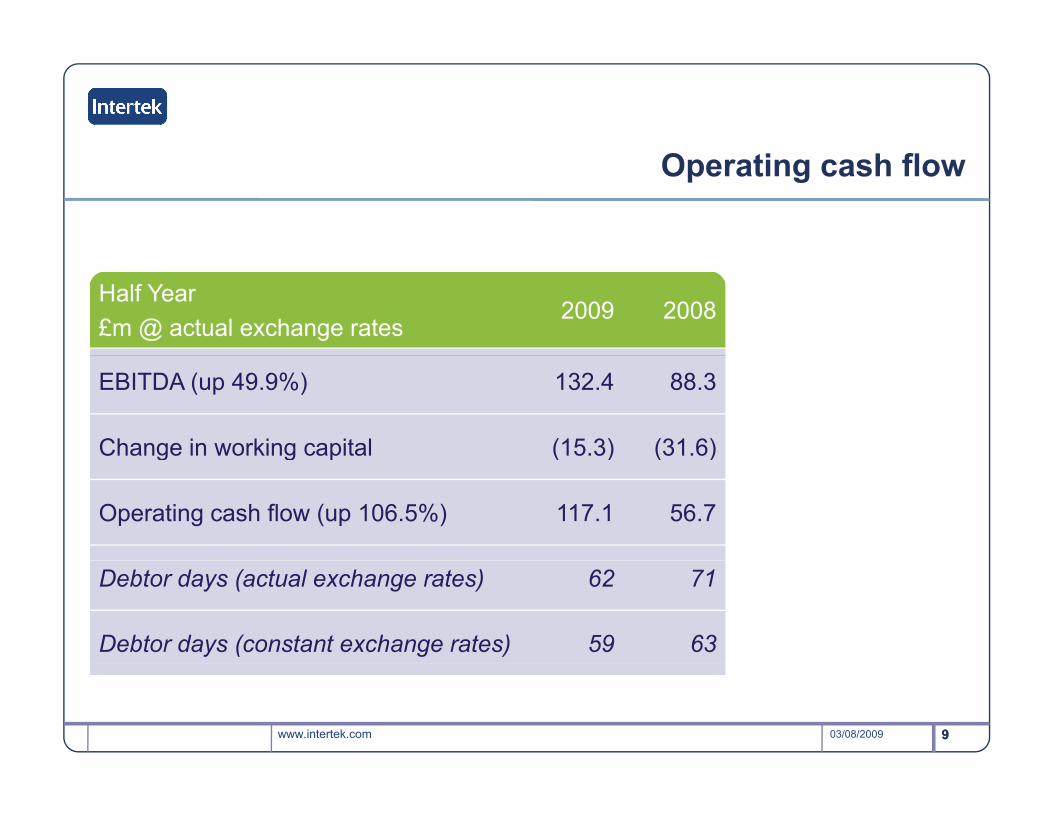
Operating cash flow
Half Year£m @ actual exchange rates
2009 2008
EBITDA (up 49.9%) 132.4 88.3
Change in working capital (15.3) (31.6)g g p ( ) ( )
Operating cash flow (up 106.5%) 117.1 56.7
Debtor days (actual exchange rates) 62 71
Debtor days (constant exchange rates) 59 63
www.intertek.com 903/08/2009 9
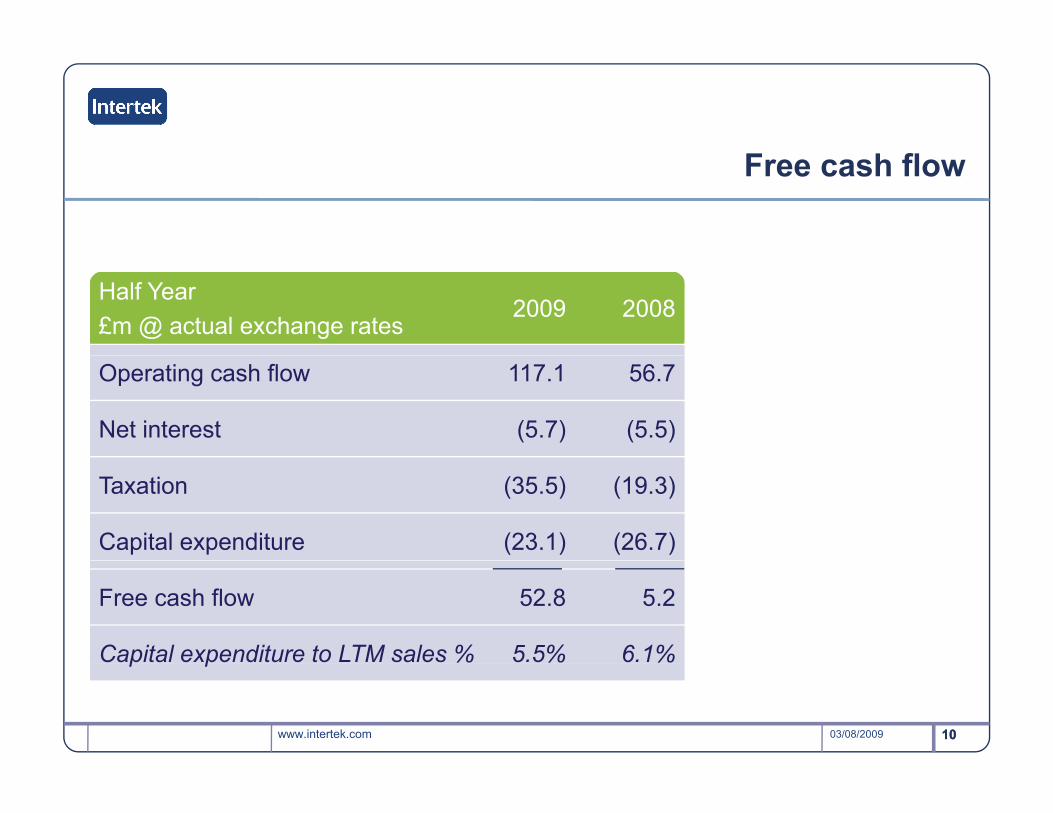
Free cash flow
Half Year£m @ actual exchange rates
2009 2008
Operating cash flow 117.1 56.7
Net interest (5.7) (5.5)
Taxation (35.5) (19.3)
Capital expenditure (23.1) (26.7)
Free cash flow 52.8 5.2
Capital expenditure to LTM sales % 5.5% 6.1%
www.intertek.com 1003/08/2009 10
p p
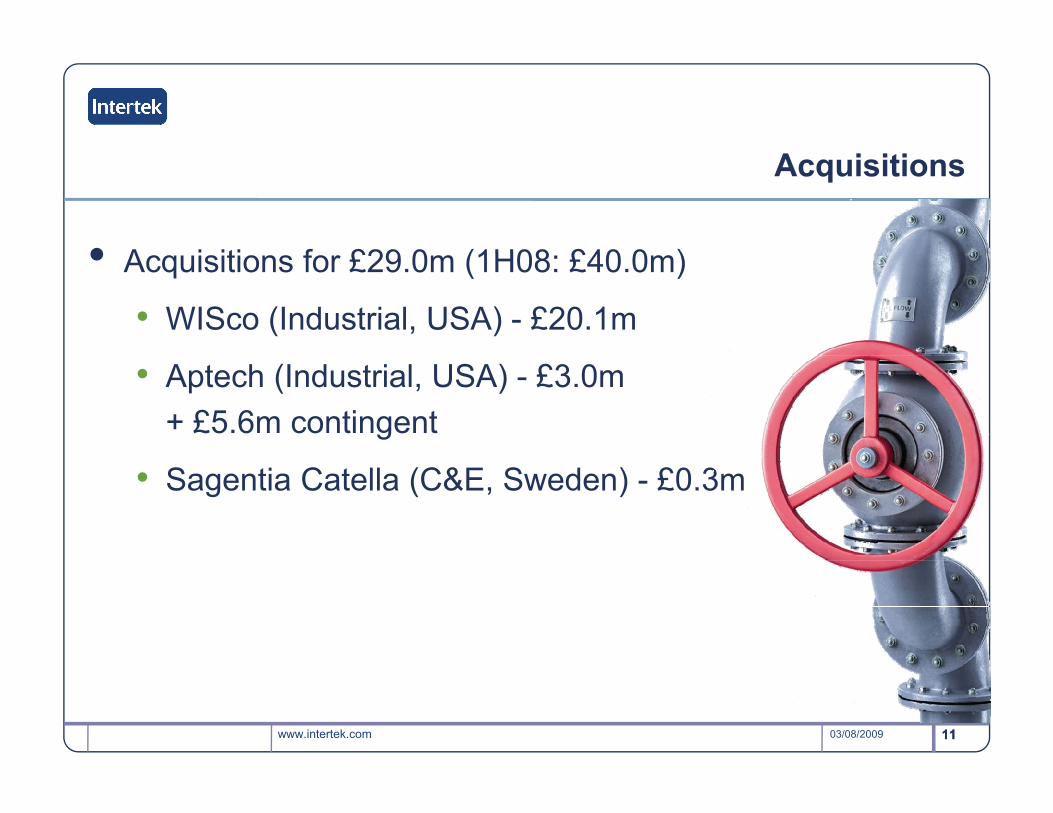
Acquisitions
• A i iti f £29 0 (1H08 £40 0 )• Acquisitions for £29.0m (1H08: £40.0m)
• WISco (Industrial, USA) - £20.1m
• Aptech (Industrial, USA) - £3.0m + £5.6m contingent
• Sagentia Catella (C&E, Sweden) - £0.3m
www.intertek.com 1103/08/2009 11
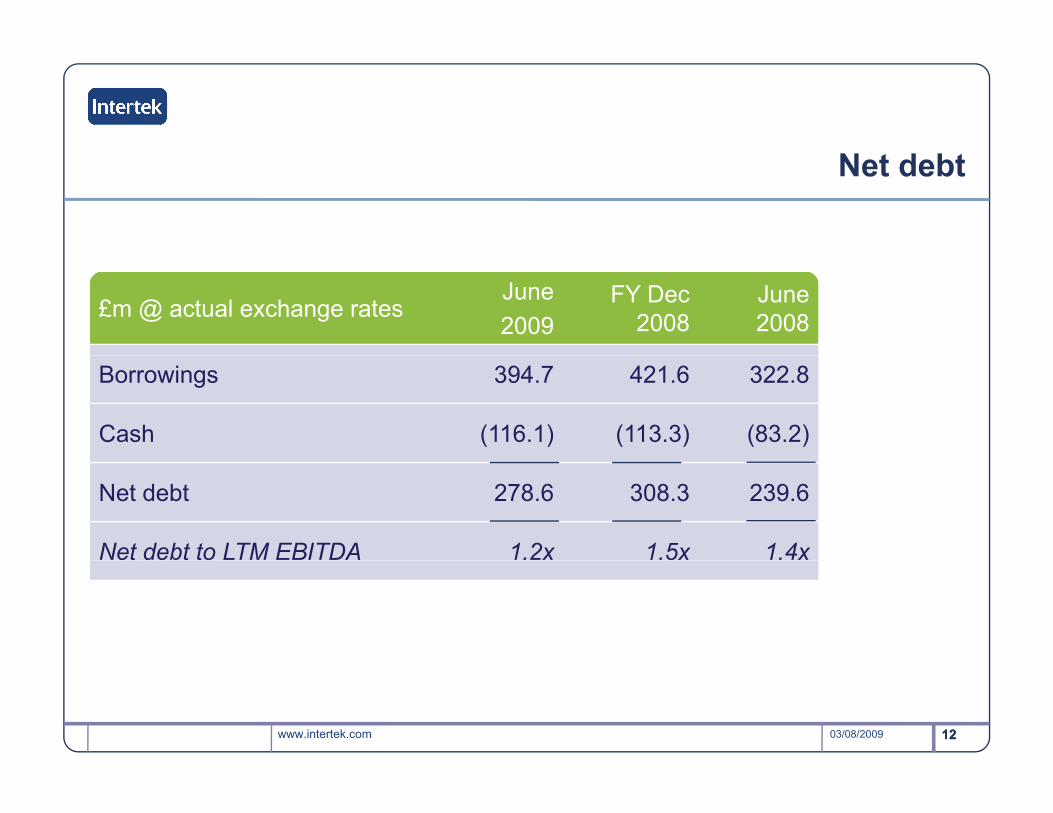
Net debt
£m @ actual exchange ratesJune2009
FY Dec 2008
June 2008
Borrowings 394.7 421.6 322.8
Cash (116.1) (113.3) (83.2)
Net debt 278.6 308.3 239.6
Net debt to LTM EBITDA 1.2x 1.5x 1.4x
www.intertek.com 1203/08/2009 12
Financial summary
• Hi h d fit th t i• High revenue and profit growth rates in a difficult environment
• Helped by exchange translation, due toHelped by exchange translation, due to weak pound
• Excellent cash generation• Strong balance sheet
www.intertek.com 1303/08/2009 13
Wolfhart HauserChief Executive Officer
Operating PerformanceOperating Performance2009 Half Year Results Presentation
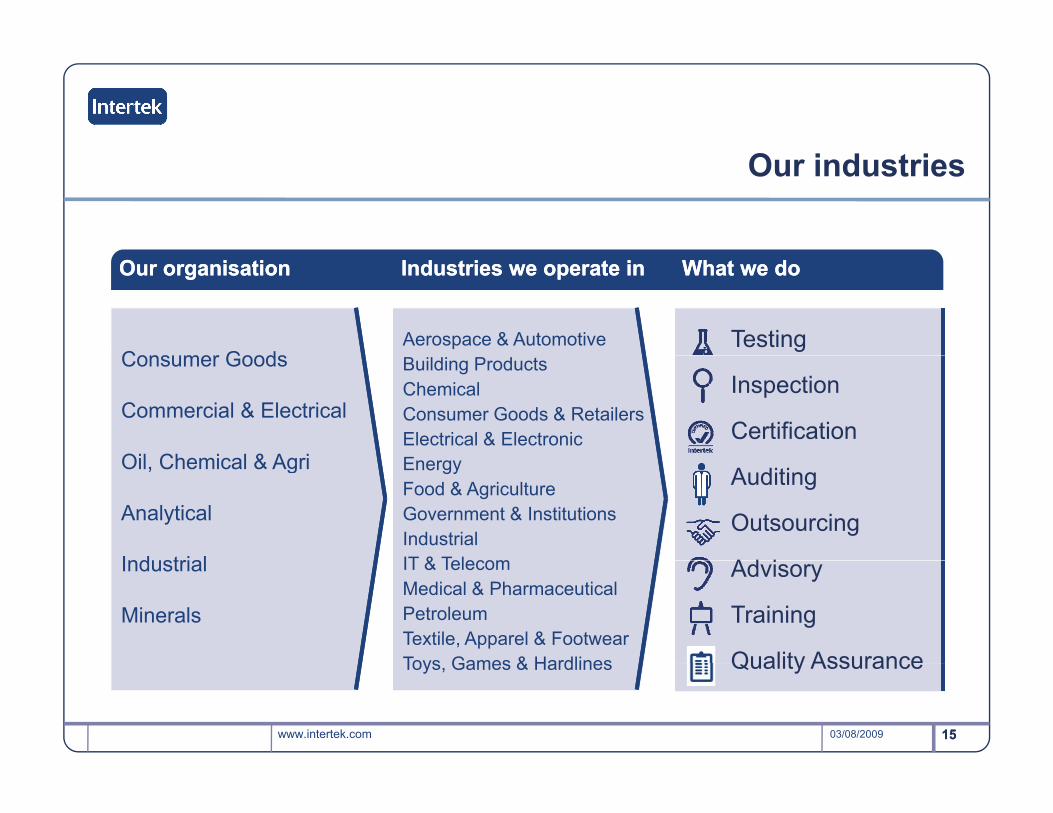
Our industries
Supporting our customers in their global tradeOur organisation The industries we operate in What we doOur organisation What we doThe industries we operate in
Our organisation Industries we operate in What we doOur organisation Industries we operate in What we do
TestingConsumer Goods
Aerospace & Automotive
Inspection
Certification
Consumer Goods
Commercial & Electrical
Oil Chemical & Agri
Building ProductsChemicalConsumer Goods & RetailersElectrical & ElectronicE Auditing
Outsourcing
Ad i
Oil, Chemical & Agri
Analytical
Industrial
EnergyFood & AgricultureGovernment & InstitutionsIndustrialIT & Telecom Advisory
Training
Quality Assurance
Industrial
Minerals
IT & TelecomMedical & PharmaceuticalPetroleumTextile, Apparel & FootwearToys Games & Hardlines
www.intertek.com 1503/08/2009 15
Quality AssuranceToys, Games & Hardlines
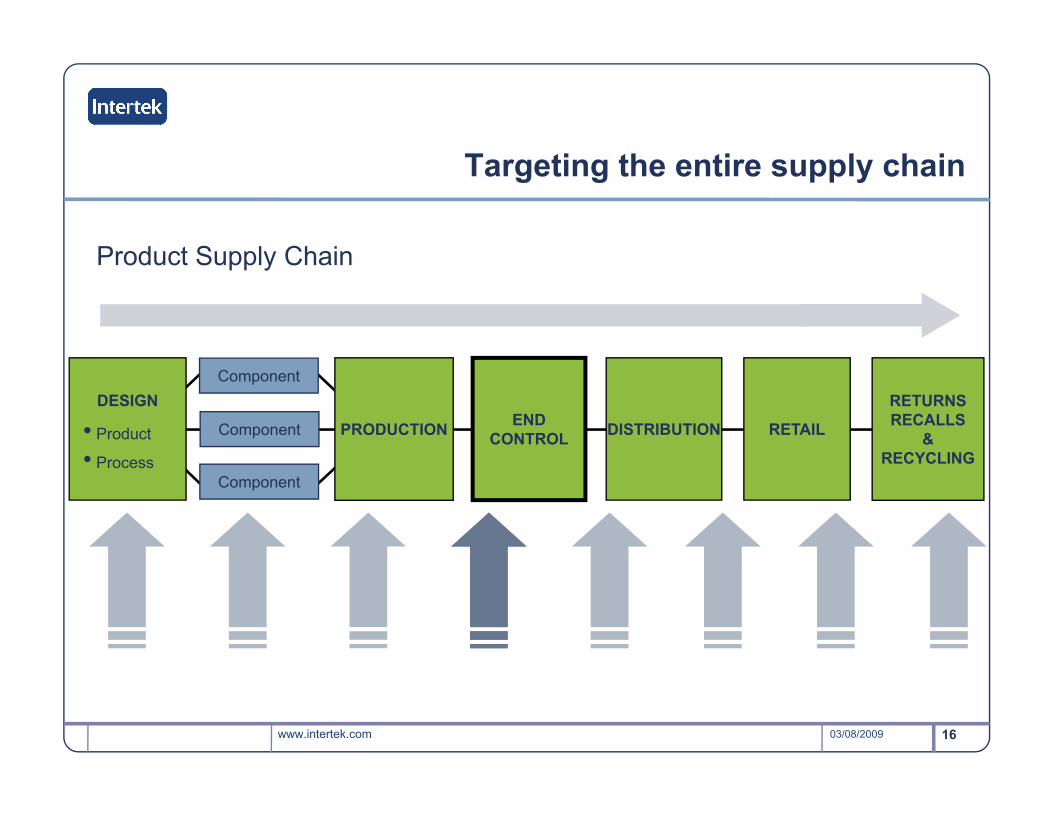
Targeting the entire supply chain
Product Supply ChainProduct Supply Chain
DESIGN
• Product
• P
PRODUCTION END CONTROL DISTRIBUTION RETAIL
RETURNS RECALLS
& RECYCLING
Component
Component
• Process RECYCLINGComponent
www.intertek.com 1603/08/2009
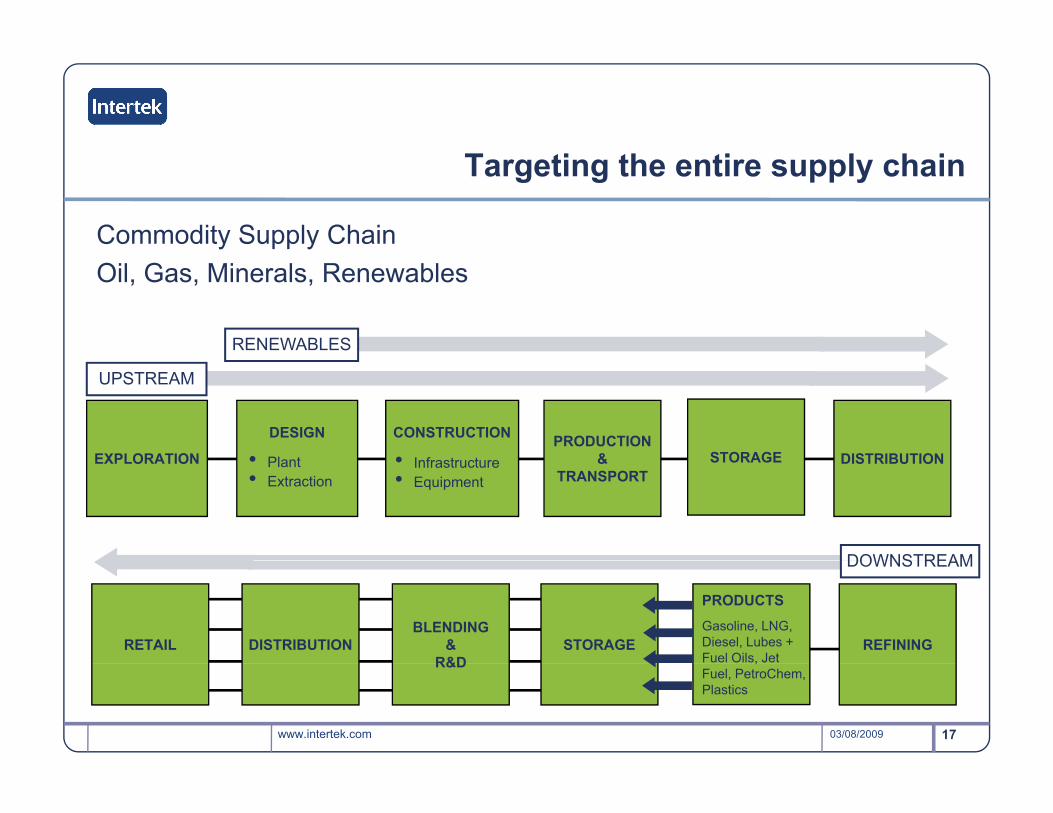
Targeting the entire supply chain
Commodity Supply Chain Oil, Gas, Minerals, Renewables
RENEWABLES
EXPLORATION
UPSTREAM
DESIGN
• Pl tPRODUCTION
& STORAGE DISTRIBUTION
CONSTRUCTION
• I f t tEXPLORATION • Plant• Extraction
& TRANSPORT
STORAGE DISTRIBUTION• Infrastructure• Equipment
DOWNSTREAM
RETAIL DISTRIBUTIONBLENDING
&R&D
STORAGE
PRODUCTSGasoline, LNG, Diesel, Lubes + Fuel Oils, Jet
REFINING
DOWNSTREAM
www.intertek.com 1703/08/2009
R&D ,Fuel, PetroChem, Plastics
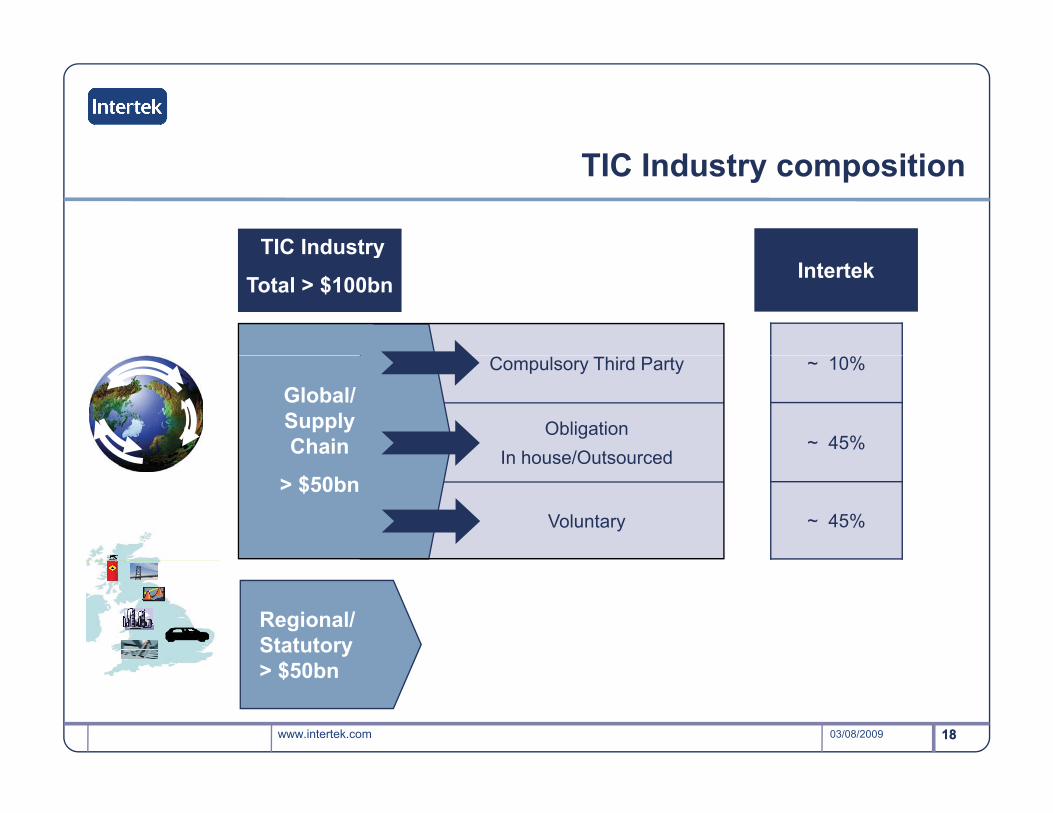
TIC Industry composition
TIC IndustryTIC Industry
Total > $100bn Intertek
Compulsory Third Party
Obligation In house/Outsourced
Global/ Supply Chain
~ 10%
~ 45%In house/Outsourced
Voluntary
> $50bn~ 45%
Regional/ Statutory
$50b
www.intertek.com 1803/08/2009 18
> $50bn
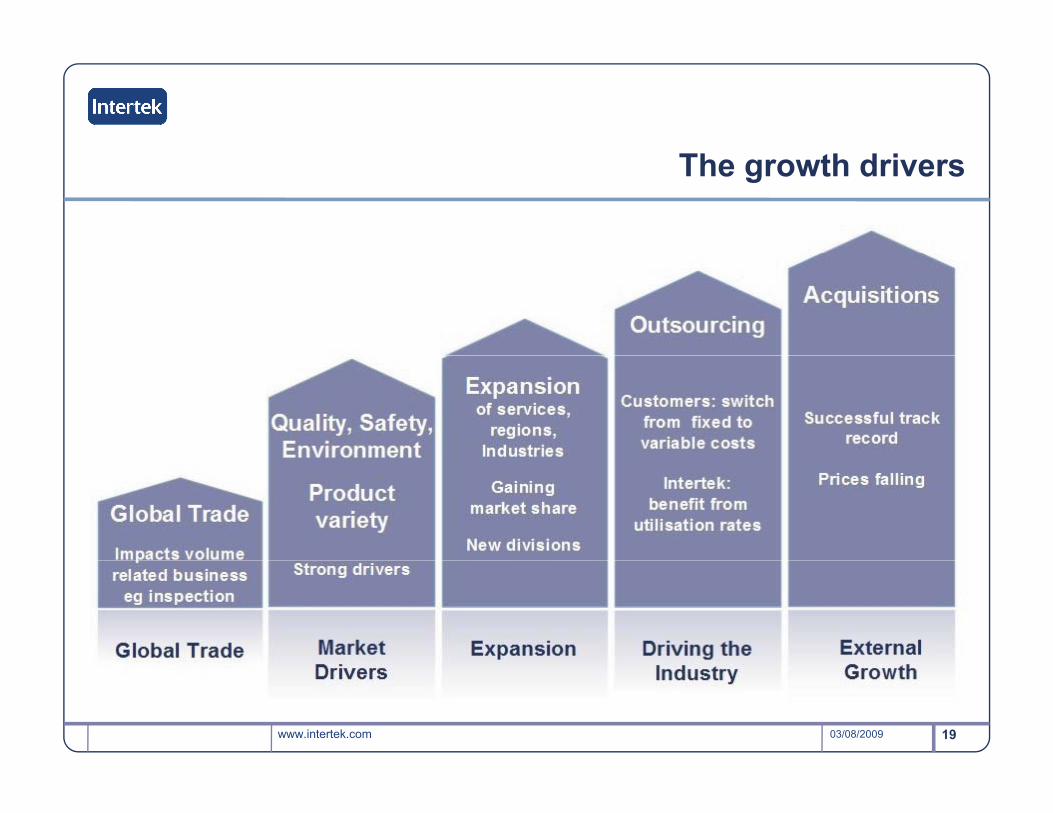
The growth drivers
www.intertek.com 1903/08/2009
A highly resilient business model
• M i th d i i d d t f• Main growth drivers independent of economic environment
• Customer penetration is lowCustomer penetration is low• Barriers to entry are high• Balanced portfolio of industries,
geographies and customers• High single digit organic growth
through cyclethrough cycle
www.intertek.com 2003/08/2009 20
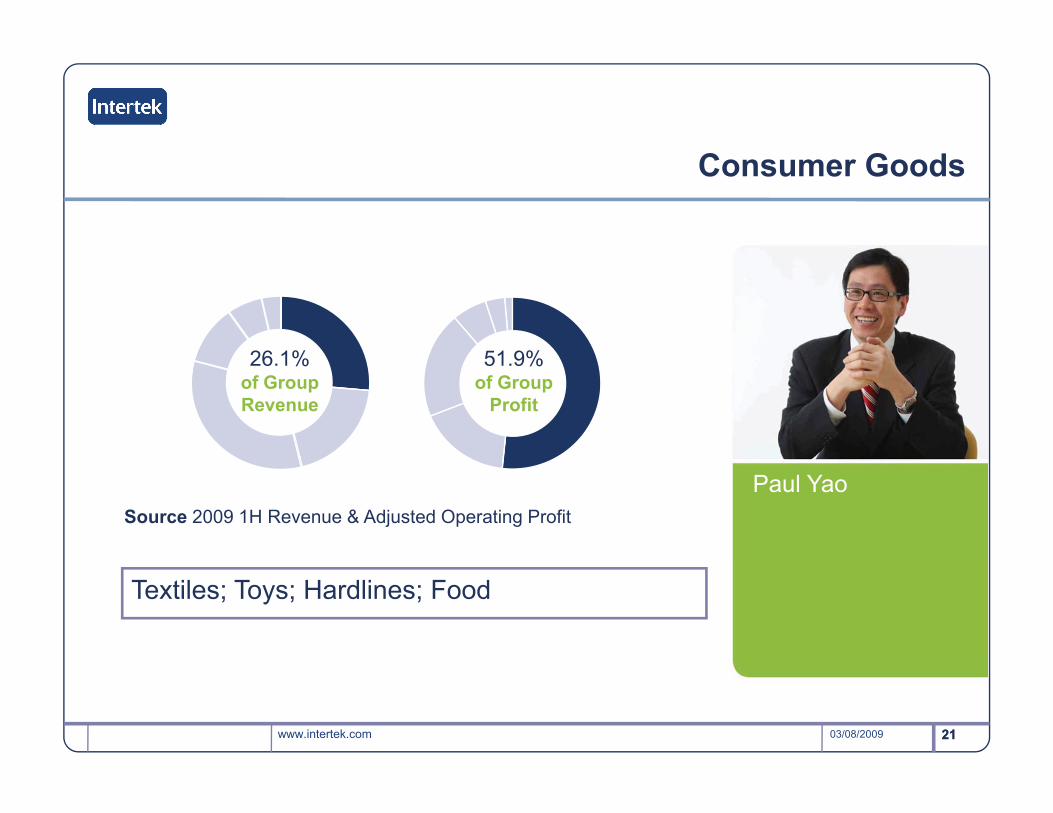
Consumer Goods
51 9%26 1% 51.9%of Group
Profit
26.1%of Group Revenue
Paul YaoSource 2009 1H Revenue & Adjusted Operating Profit
Textiles; Toys; Hardlines; Food
www.intertek.com 2103/08/2009 21
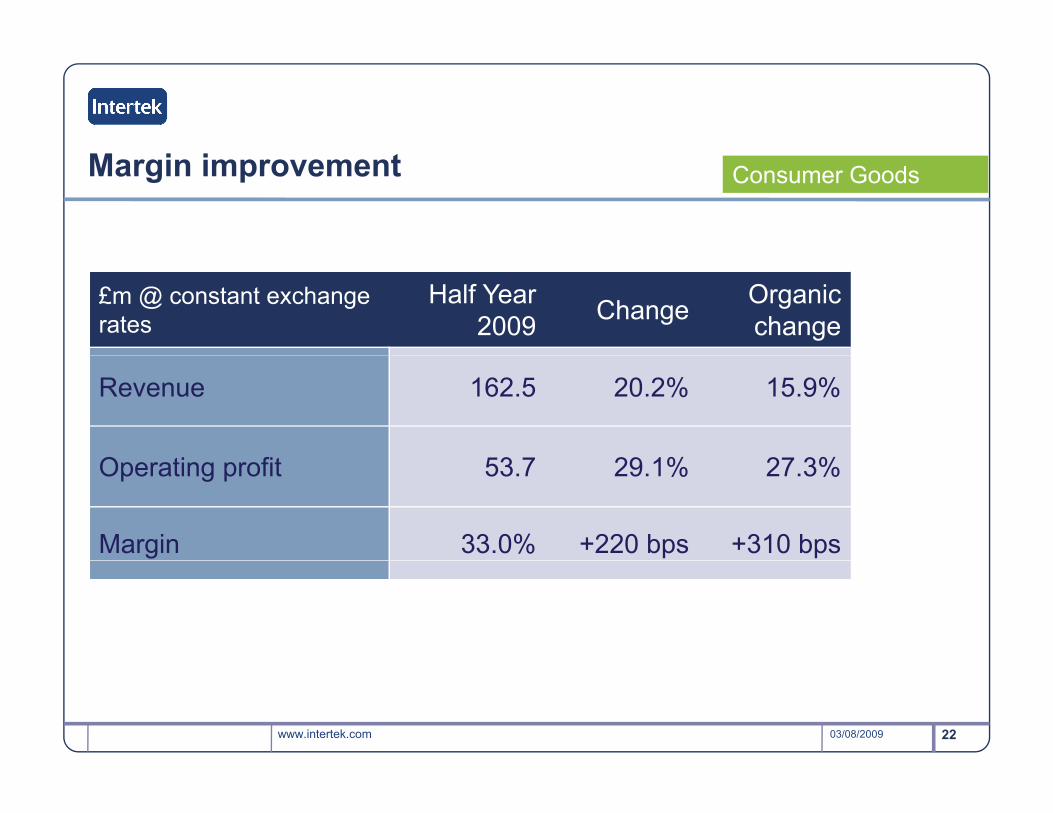
Margin improvement Consumer Goods
£m @ constant exchange rates
Half Year 2009 Change Organic
change
Revenue 162.5 20.2% 15.9%
O ti fit 53 7 29 1% 27 3%Operating profit 53.7 29.1% 27.3%
Margin 33.0% +220 bps +310 bps
www.intertek.com 2203/08/2009
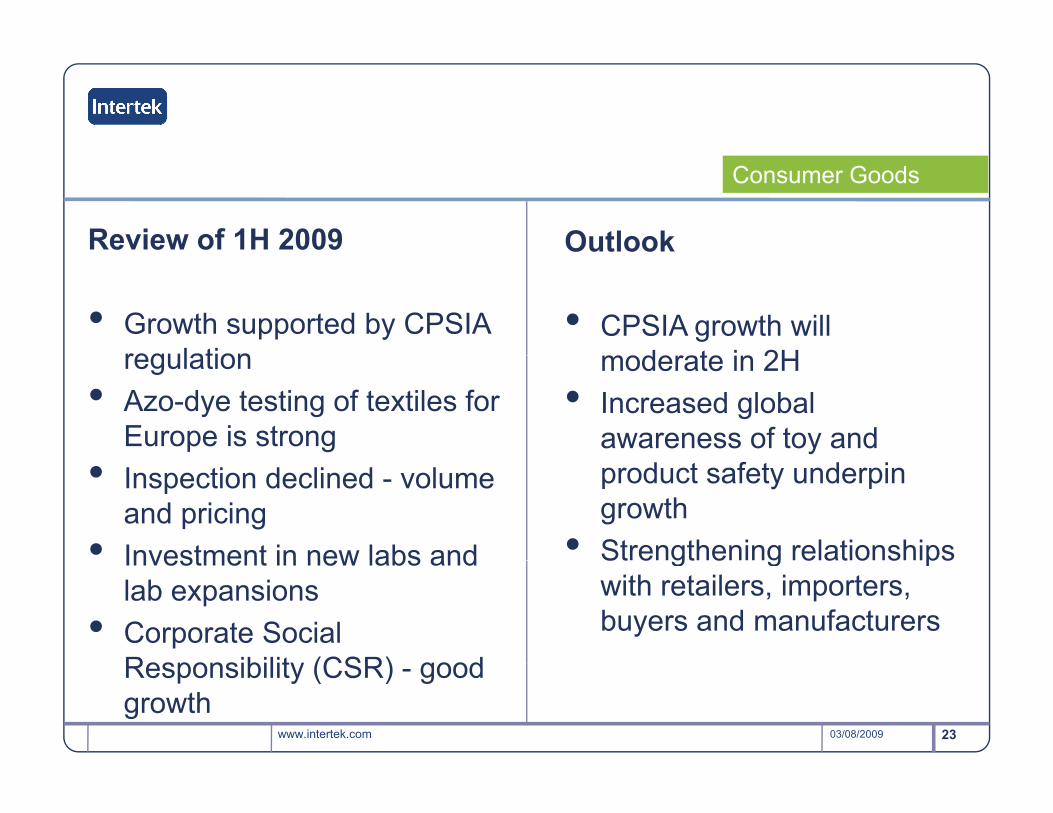
Review of 1H 2009 Outlook
Consumer Goods
• Growth supported by CPSIA regulation
• CPSIA growth will moderate in 2Hregulation
• Azo-dye testing of textiles for Europe is strong
moderate in 2H• Increased global
awareness of toy and • Inspection declined - volume
and pricing• Investment in new labs and
product safety underpin growth
• Strengthening relationships Investment in new labs and lab expansions
• Corporate Social Responsibility (CSR) good
St e gt e g e at o s pswith retailers, importers, buyers and manufacturers
www.intertek.com 2303/08/2009
Responsibility (CSR) - good growth
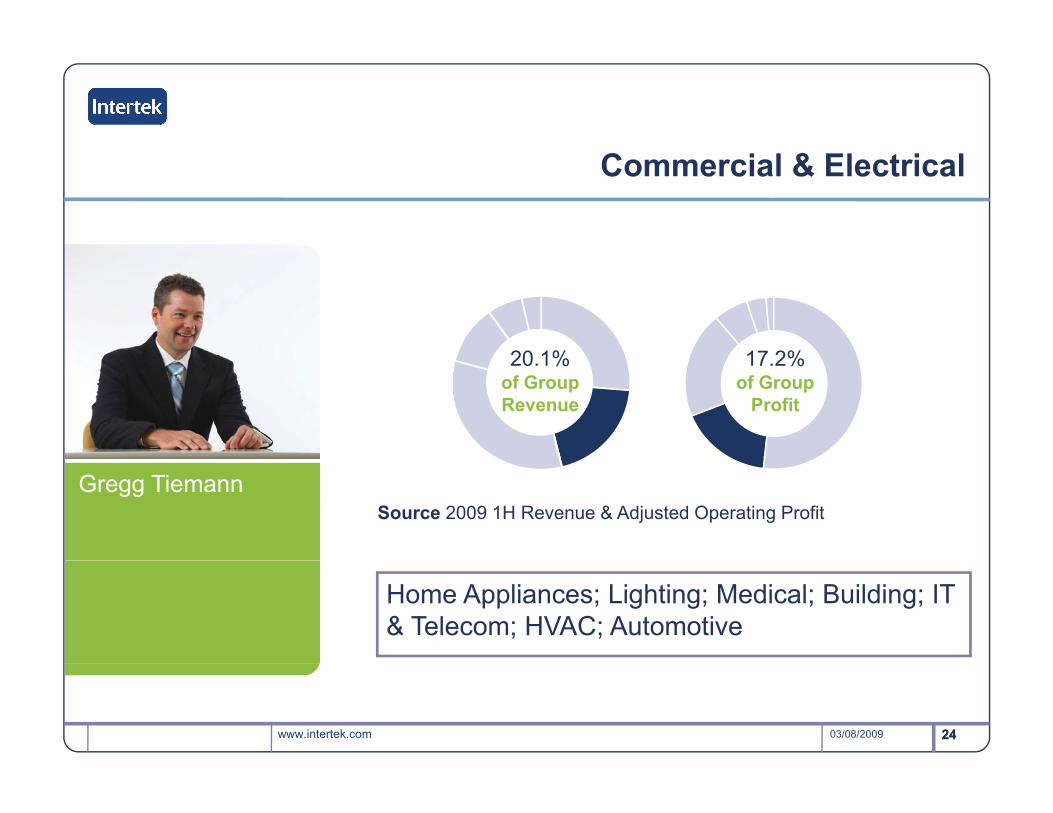
Commercial & Electrical
17 2%20 1% 17.2%of Group
Profit
20.1%of Group Revenue
Source 2009 1H Revenue & Adjusted Operating ProfitGregg Tiemann
Home Appliances; Lighting; Medical; Building; IT & Telecom; HVAC; Automotive
www.intertek.com 2403/08/2009 24
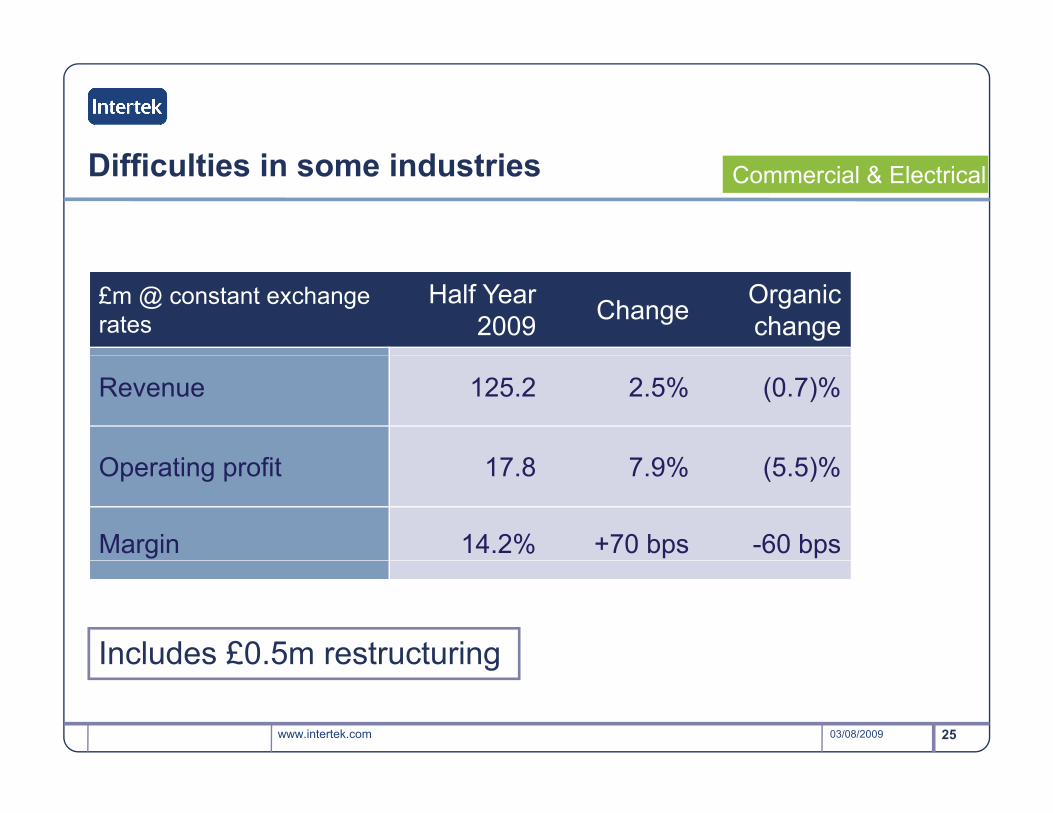
Difficulties in some industries Commercial & Electrical
£m @ constant exchange rates
Half Year 2009 Change Organic
change
Revenue 125.2 2.5% (0.7)%
O ti fit 17 8 7 9% (5 5)%Operating profit 17.8 7.9% (5.5)%
Margin 14.2% +70 bps -60 bps
Includes £0.5m restructuring
www.intertek.com 2503/08/2009
Includes £0.5m restructuring
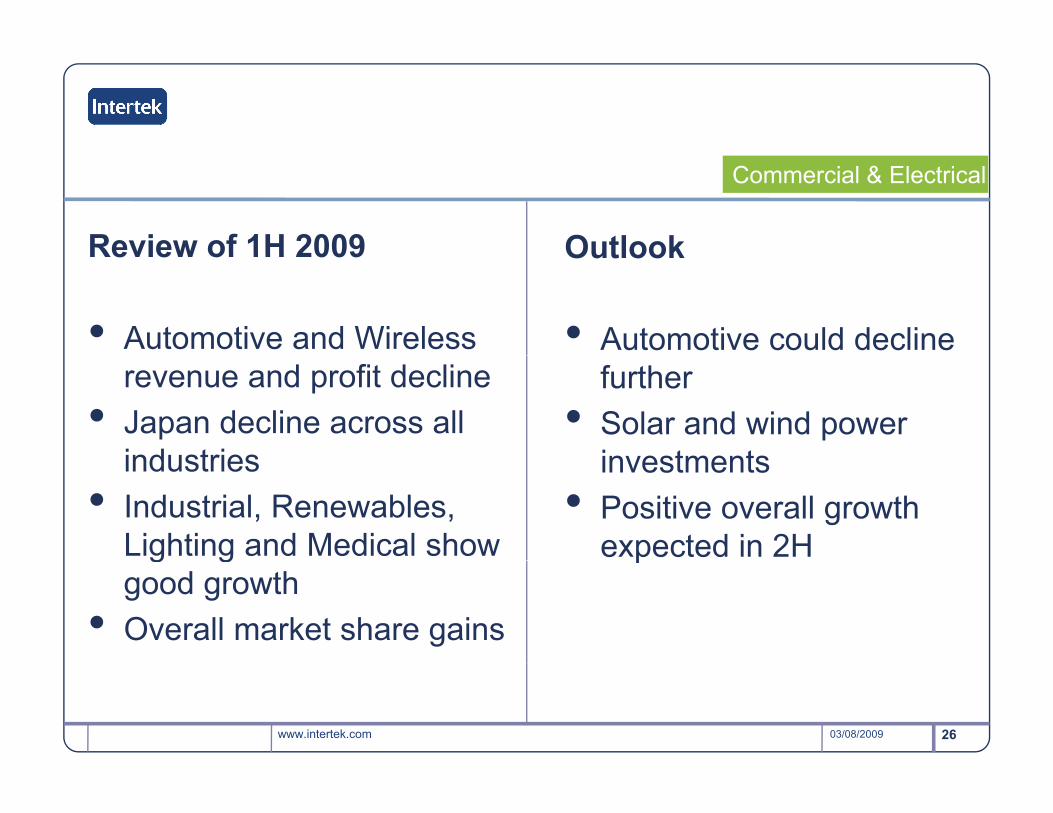
Review of 1H 2009 Outlook
Commercial & Electrical
Review of 1H 2009
• Automotive and Wireless
Outlook
• Automotive could decline revenue and profit decline
• Japan decline across all industries
further• Solar and wind power
investmentsindustries• Industrial, Renewables,
Lighting and Medical show
investments• Positive overall growth
expected in 2Hg ggood growth
• Overall market share gains
p
www.intertek.com 2603/08/2009
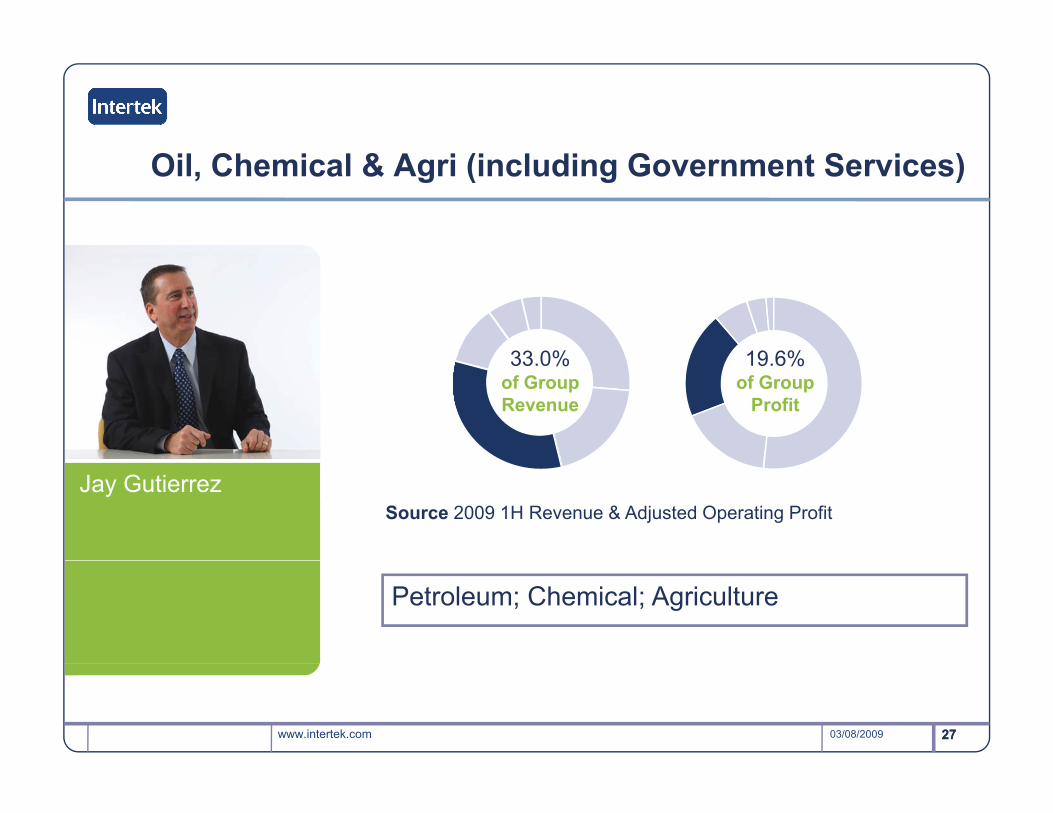
Oil, Chemical & Agri (including Government Services)
19 6%33 0% 19.6%of Group
Profit
33.0%of Group Revenue
Jay GutierrezSource 2009 1H Revenue & Adjusted Operating Profit
Petroleum; Chemical; Agriculture
www.intertek.com 2703/08/2009 27

Good top line Oil, Chemical & Agri
£m @ constant exchange rates
Half Year 2009 Change Organic
change
Revenue 205.6 4.5% 4.5%
O ti fit 20 3 (10 6)% (10 6)%Operating profit 20.3 (10.6)% (10.6)%
Margin 9.9% -160 bps -160 bps
www.intertek.com 2803/08/2009
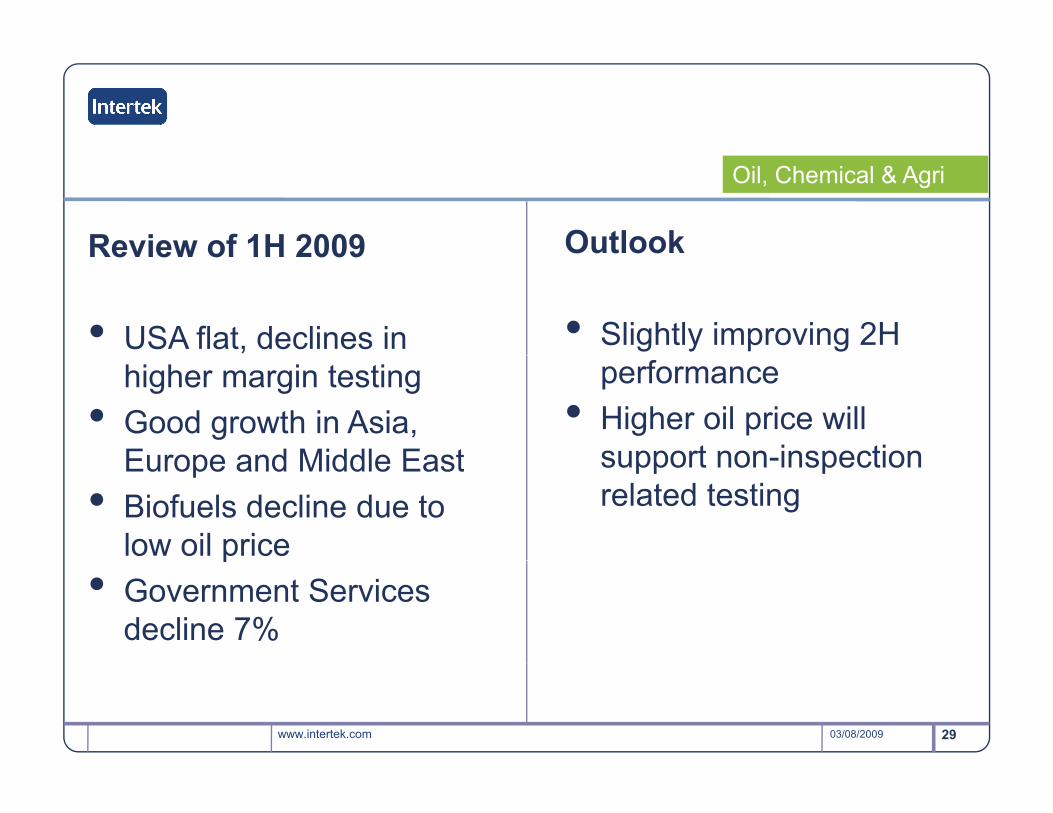
Review of 1H 2009 Outlook
Oil, Chemical & Agri
Review of 1H 2009
• USA flat, declines in
Outlook
• Slightly improving 2H higher margin testing
• Good growth in Asia, Europe and Middle East
performance• Higher oil price will
support non-inspectionEurope and Middle East• Biofuels decline due to
low oil price
support non-inspection related testing
p• Government Services
decline 7%
www.intertek.com 2903/08/2009
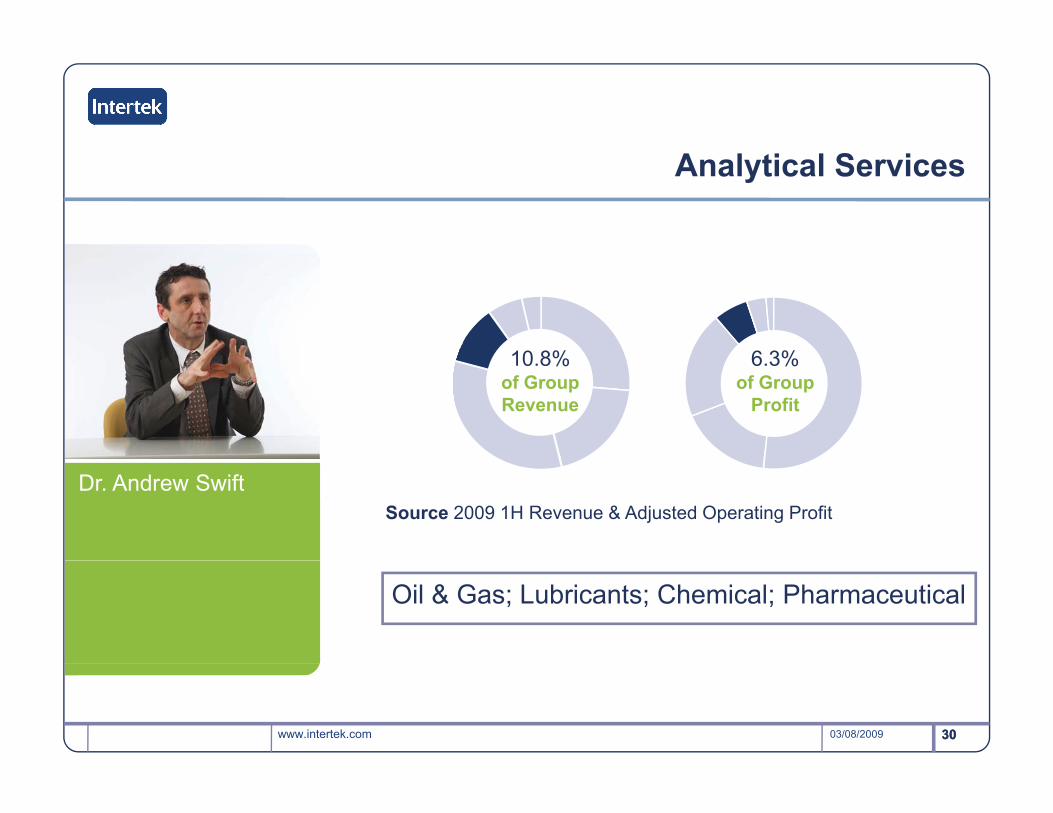
Analytical Services
6 3%10 8% 6.3%of Group
Profit
10.8%of Group Revenue
Source 2009 1H Revenue & Adjusted Operating ProfitDr. Andrew Swift
Oil & Gas; Lubricants; Chemical; Pharmaceutical
www.intertek.com 3003/08/2009 30
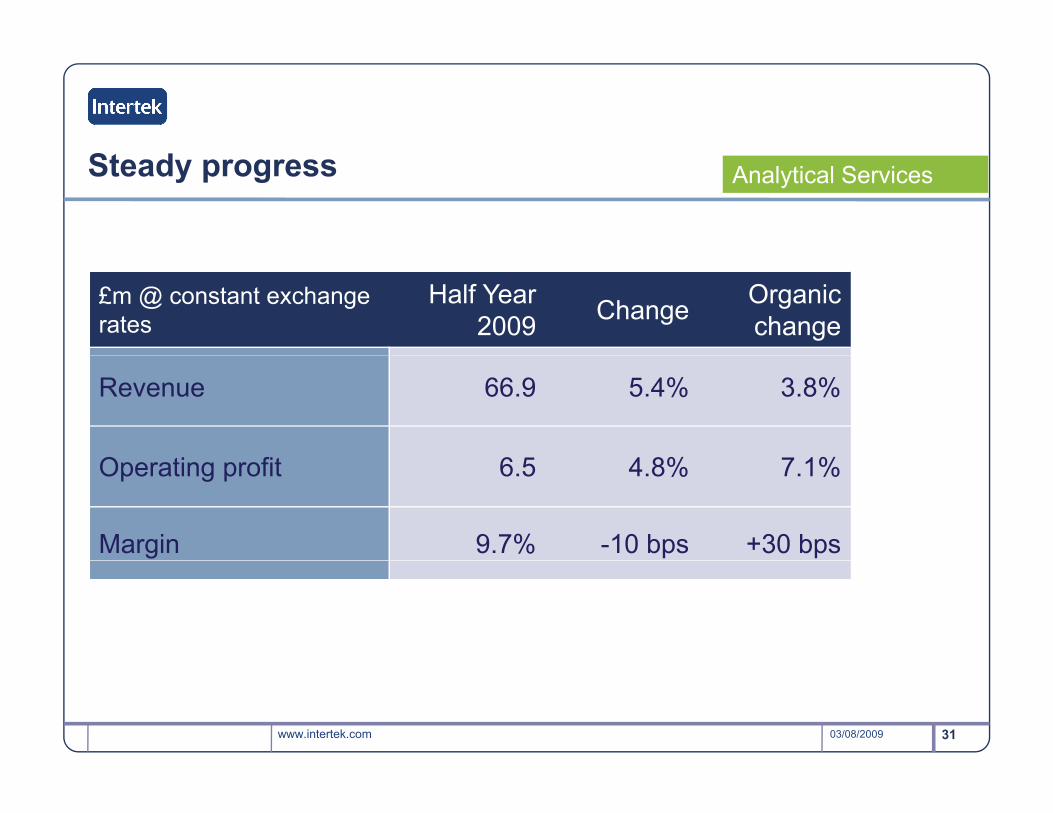
Steady progress Analytical Services
£m @ constant exchange rates
Half Year 2009 Change Organic
change
Revenue 66.9 5.4% 3.8%
O ti fit 6 5 4 8% 7 1%Operating profit 6.5 4.8% 7.1%
Margin 9.7% -10 bps +30 bps
www.intertek.com 3103/08/2009
Analytical Services
Review of 1H 2009 OutlookReview of 1H 2009
• Downstream good growth
Outlook
• New standard (GF-5) will g g• Upstream steady with
some project deferrals • Ph d
drive lubricants testing • Expect larger outsourcing
projects• Pharma down: restructuring in UK
projects• Stronger oil price
supporting upstream• Pharma outlook improving
www.intertek.com 3203/08/2009 32
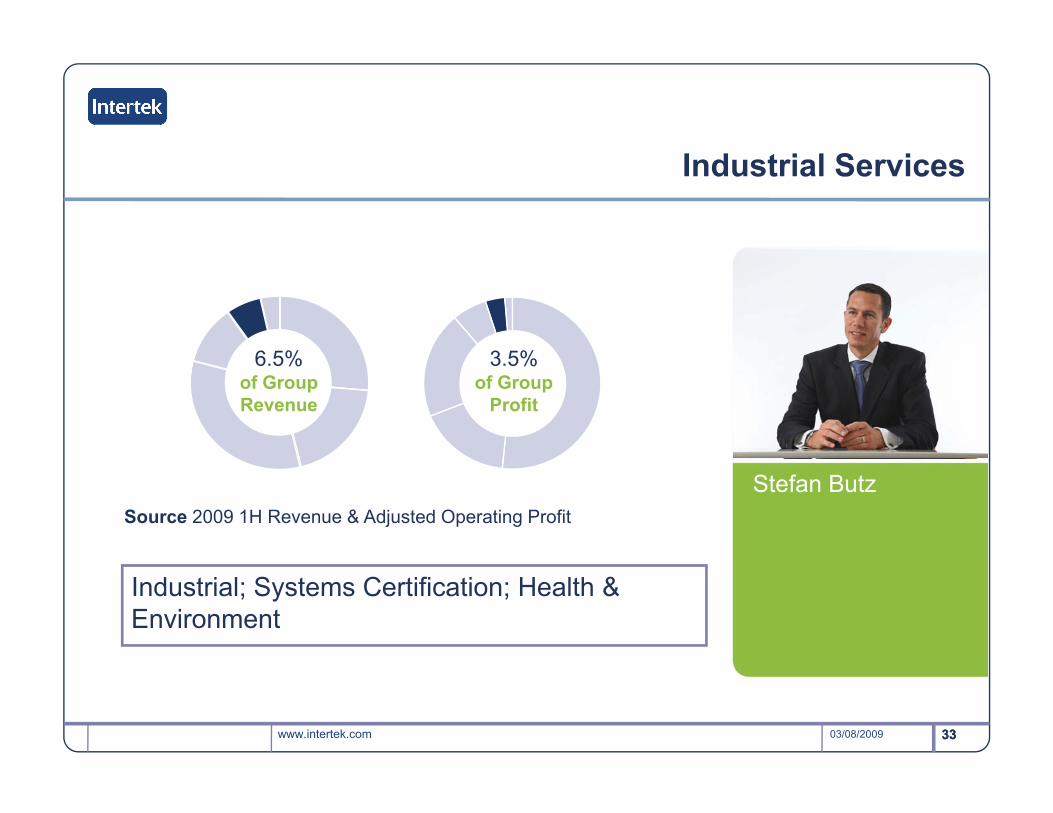
Industrial Services
3 5%6 5% 3.5%of Group
Profit
6.5%of Group Revenue
Stefan ButzSource 2009 1H Revenue & Adjusted Operating Profit
Industrial; Systems Certification; Health & Environment
www.intertek.com 3303/08/2009 33

Building scale Industrial Services
£m @ constant exchange rates
Half Year 2009 Change Organic
change
Revenue 40.2 67.5% 13.8%
O ti fit 3 6 200 0% 75 0%Operating profit 3.6 200.0% 75.0%
Margin 9.0% +400 bps +100 bps
www.intertek.com 3403/08/2009
Industrial Services
Review of 1H 2009 OutlookReview of 1H 2009
• Global supply chain driving t h i l i ti b i
Outlook
• Good prospects and strong i ith OCA dtechnical inspection business
• Asset Integrity Management increasing in size and scale
synergies with OCA and Analytical
• Focus on value adding • System certification weak in
Auto • Two acquisitions:
services like engineering, consulting and 3D scanning
• Geared to new build and• Two acquisitions:• WISco and Aptech
Geared to new build and ageing plants providing balance
www.intertek.com 3503/08/2009 35
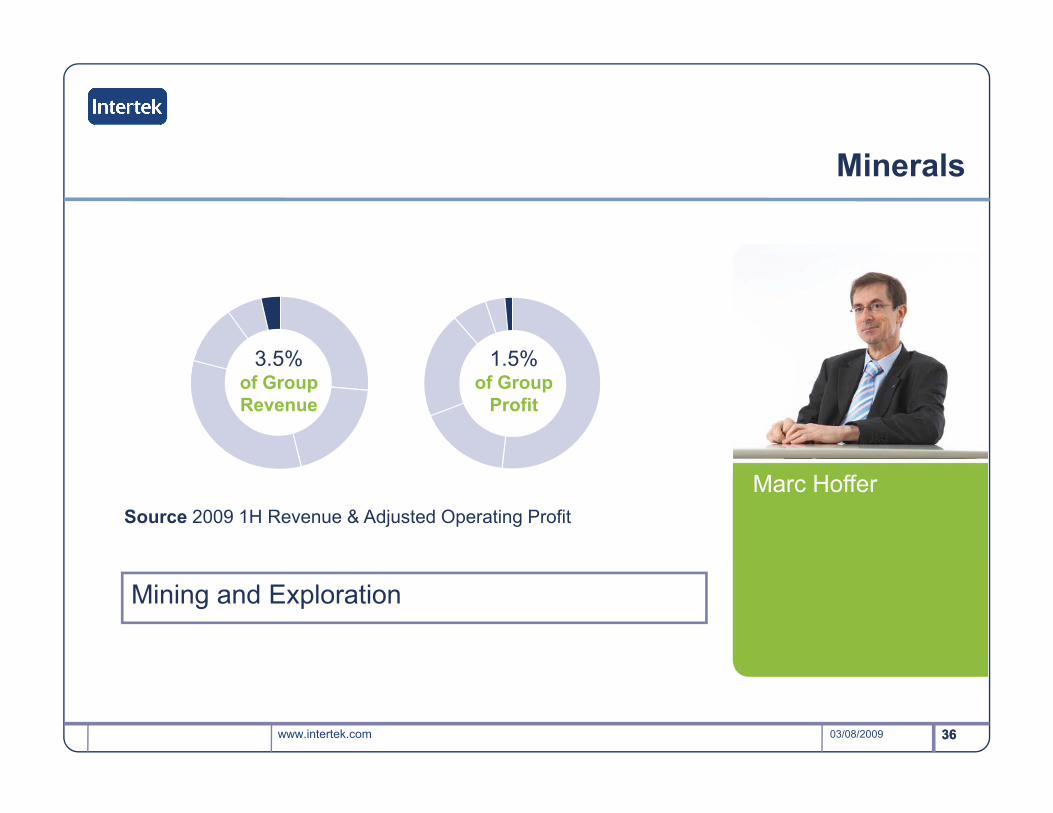
Minerals
1 5%3 5% 1.5%of Group
Profit
3.5%of Group Revenue
Marc HofferSource 2009 1H Revenue & Adjusted Operating Profit
Mining and Exploration
www.intertek.com 3603/08/2009 36
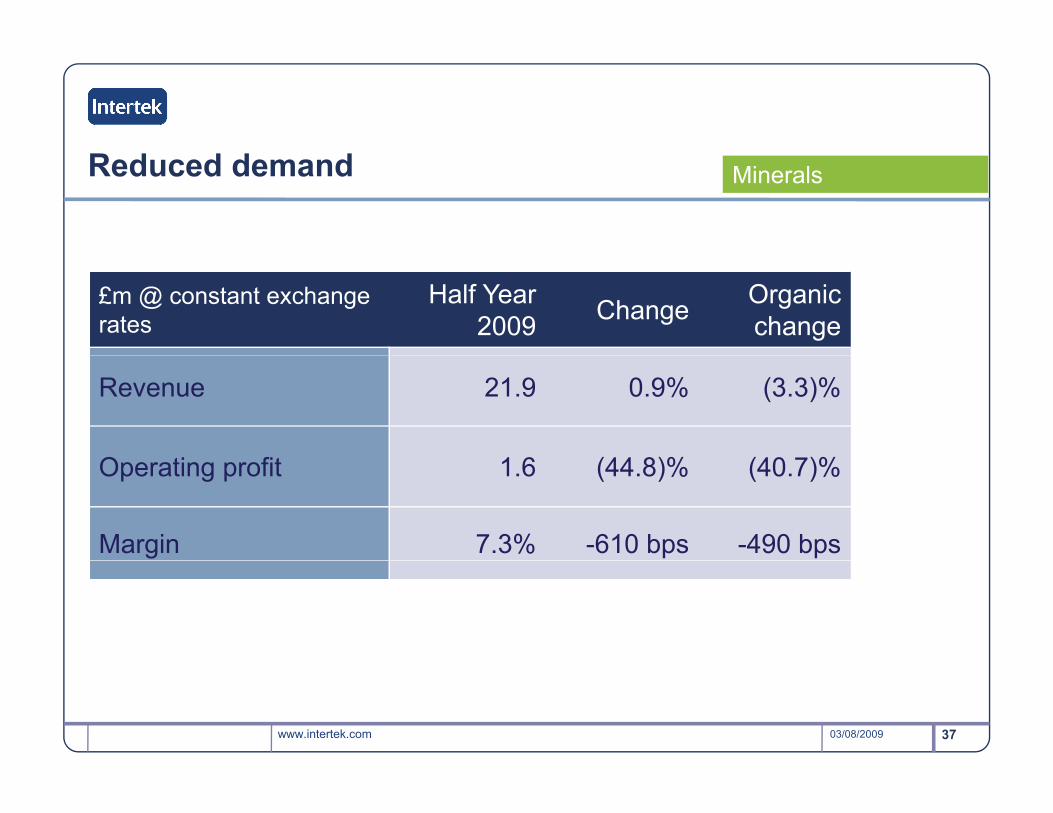
Reduced demand Minerals
£m @ constant exchange rates
Half Year 2009 Change Organic
change
Revenue 21.9 0.9% (3.3)%
O ti fit 1 6 (44 8)% (40 7)%Operating profit 1.6 (44.8)% (40.7)%
Margin 7.3% -610 bps -490 bps
www.intertek.com 3703/08/2009
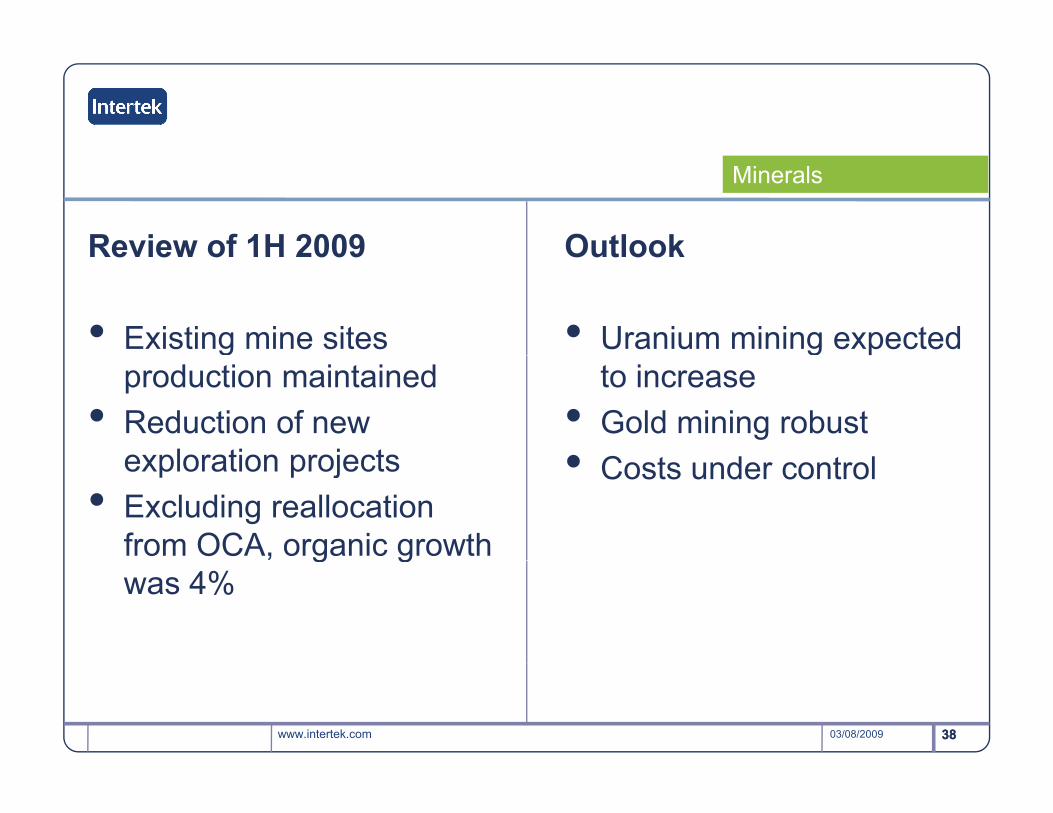
Minerals
Review of 1H 2009 OutlookReview of 1H 2009
• Existing mine sites
Outlook
• Uranium mining expected gproduction maintained
• Reduction of new exploration projects
gto increase
• Gold mining robust • C t d t lexploration projects
• Excluding reallocation from OCA, organic growth
• Costs under control
g gwas 4%
www.intertek.com 3803/08/2009 38
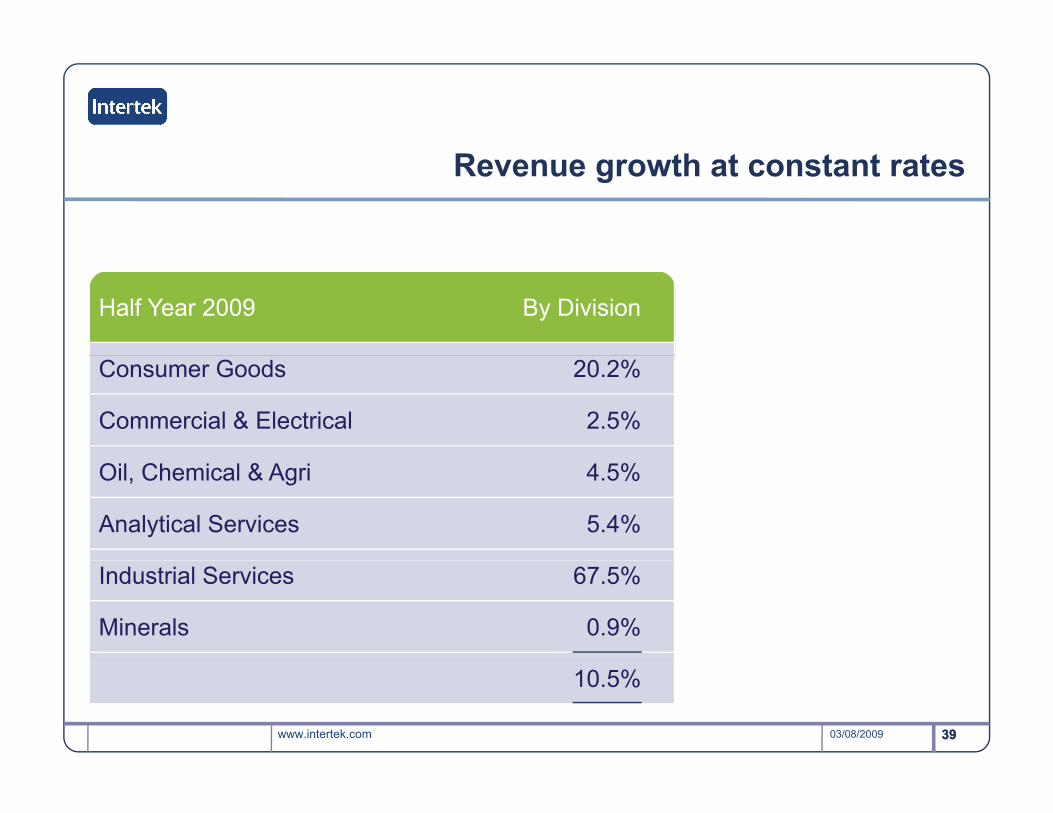
Revenue growth at constant rates
Half Year 2009 By Division
Consumer Goods 20.2%
Commercial & Electrical 2.5%
Oil, Chemical & Agri 4.5%
Analytical Services 5.4%
Industrial Services 67.5%
Minerals 0.9%
www.intertek.com 3903/08/2009 39
10.5%
Outlook
• An excellent half year result• Expect good organic revenue growth
for full yearfor full year• Demonstrates resilience of business
model• Medium and longer term outlook
positive• A i iti t iti i• Acquisition opportunities opening up
www.intertek.com 4003/08/2009 40