final draft - hzg · 1 helmholtz-zentrum geesthacht, institute of materials research, materials...
TRANSCRIPT
Final Draft of the original manuscript: Steglich, D.; Tian, X.; Bohlen, J.; Kuwabara, T.: Mechanical Testing of Thin Sheet Magnesium Alloys in Biaxial Tension and Uniaxial Compression In: Experimental Mechanics (2014) Springer DOI: 10.1007/s11340-014-9892-0

Mechanical Testing of thin Sheet Magnesium Alloys in
biaxial Tension and uniaxial Compression
D. Steglich1,*, X. Tian1, J. Bohlen2, T. Kuwabara3
1Helmholtz-Zentrum Geesthacht, Institute of Materials Research, Materials Me-chanics / ACE-Centre, Max-Planck-Str. 1, D-21502 Geesthacht, Germany 2Helmholtz-Zentrum Geesthacht, Institute of Materials Research, Magnesium In-novations Centre MagIC, Max-Planck-Str. 1, D-21502 Geesthacht, Germany 3Division of Advanced Mechanical Systems Engineering, Institute of Engineering, Tokyo University of Agriculture and Technology, 2-24-16, Nakacho, Koganei-shi, Tokyo 184-8588, Japan
Abstract: Tension and compression experiments on magnesium rolled sheets and extruded products of AZ31 (Mg + 3%Al + 1%Zn) and ZE10 (Mg + 1%Zn + 0.3%Ce based mischmetal) were performed at room temperature. The tests were conducted along the longitudinal and the transverse direction to quantify the in-plane anisotropy. Samples built from adhesively-bonded layers of sheets were used for in-plane as well as through-thickness compression testing. It was verified that this simple testing method leads to identical results as using comb-like dies and equi-biaxial bulge testing, respectively. In the case of uniaxial loading, the longitudinal and transverse strain components were measured using independent extensometers. R-values were calculated from these signals. The mechanical re-sponses were correlated to the microstructure and the texture. The recorded differ-ences between tensile and compressive response reveal the strength differential effect of the materials. The distortional character of the plastic behaviour is evi-denced through their responses to equi-biaxial tensile loading. Significant differ-ences in the compressive responses of the two alloys were identified by compar-ing the respective hardening rates.
Keywords: strength differential effect; differential hardening; anisotropy; sheet
metal; magnesium alloy
1
Introduction
Motivated by the growing demand for lightweight materials, research on magne-
sium and its alloys has been getting more attention as magnesium is the lightest
metal in use for the production of structural components in the automotive and
aircraft industry. Despite the high strength-to-weight ratio, the application of
wrought magnesium (i.e. sheets and extruded profiles) to lightweight structures is
restricted due to its pronounced anisotropy, the tension-compression asymmetry
(the so-called strength differential effect, SD effect) (Hosford 1993; Hosford and
Allen 1973) as well as its comparably poor formability, especially at room tem-
perature (Hosford 1993; Bohlen et al. 2007b). Existing applications are mainly
based on cast products. The use of sheets for the fabrication of components and
structures can still be expanded in an attempt to use the full light-weight potential
of metallic magnesium.
The reason for the specific mechanical behaviour lies in the hexagonal close-
packed (hcp) lattice structure which restricts the number of deformation mecha-
nisms in comparison to cubic metals. Therefore the ductility as well as the forma-
bility of magnesium sheets is limited, which partly confines the whole process
chain, i.e. the rolling procedures for magnesium sheets, the forming procedures of
structural components and subsequently the mechanical properties of the resulting
parts. The application of wrought magnesium alloys requires reliable simulation
tools for predicting the forming capabilities, the structural response to mechanical
loads and the lifetime of the component. The respective constitutive models have
to account for the mentioned peculiarities of the mechanical behaviour, demand-
ing for sophisticated simulation techniques.
The distinct role that easily activated basal slip plays in strain accommodation
during deformation has been pointed out to correlate the anisotropic flow behav-
iour to the texture of the material. It has been shown that even slight differences in
the angular distribution of basal planes can explain visible differences in the yield
stresses, e.g. as a function of the orientation of sheets (Agnew 2002). Further-
more, the micromechanical source of the SD effect as well as of (planar) anisotro-
py was investigated by many researchers in the past (Agnew and Duygulu 2005;
Agnew et al. 2001; Jiang et al. 2008; Jiang et al. 2007b; Kelley and Hosford 1968;
Yi et al. 2009). It is confirmed that mechanical {10-12} twinning is easily activat-2

ed and can give a major contribution to deformation in case of c-axis extension,
but it does not so in case of c-axis compression (Partridge 1967; Christian and
Mahajan 1995). Thus, the statistical distribution of the c-axis orientation of a
magnesium alloy, the initial texture, primarily determines its plastic deformation
behavior. While in case of a random or weak texture, e.g. in case of die-cast alloy,
no significant difference in the mechanical behavior between tension and com-
pression is observed (Hakamada et al. 2009), textured alloys experience different
yielding in tension and compression. The latter was frequently confirmed for ex-
truded magnesium products of different alloys, e.g. (Wang and Huang 2007;
Zhang et al. 2011; Ball and Prangnell 1994; Barnett 2007). The plastic behaviour
during compression was mostly investigated with respect to load reversals and
less often for rolled sheets compared to extrudates. Contributions to the quantifi-
cation of sheet material under compression field can be found, see e.g. (Lee et al.
2009; Lou et al. 2007; Khan et al. 2011). The reason for this underrepresentation
of respective test results might be the challenges arising from bucking of the sheet
sample once compressive stresses are applied. Limitations either for the sheet’s
width-to-thickness-ratio or the achieved maximum strain apply (Boger et al.
2005). To overcome this, methods were developed to stabilize the compressed
sheet by applying a transverse force via a die, see (Kuwabara et al. 2009) or by a
fixture in an universal tester (Boger et al. 2005). Alternatively, buckling can be
prevented by stacking stacked test pieces (Tozawa 1978), or by a combination
of adhesively bonded sheet laminate specimens and a clamping device
(Yoshida et al. 2002). Maeda et al. (Maeda et al. 1998) showed that the effect
of friction and the misalignment of the compression platens can be controlled
and therefore compression of stacked and glued cubes of sheet material can be
used to derive valid stress-strain data. Very recently, this method was success-
fully applied to the magnesium alloy AZ31B-O, see (Ghaffari Tari et al. 2014).
Strain hardening differs significantly between tension and compression in case of
textured magnesium samples. While the stress-strain relationship in uniaxial ten-
sion typically is a convex curve, a sigmoidal function results from compression
(Barnett et al. 2004). Four subsequent stages of the hardening behaviour are iden-
tified, namely (I) that of the elastic–plastic transition; (II) the range of low or con-
ventional rate of strain hardening; (III) the range where the rate of hardening in-
3

creases and (IV) the range of decreasing work hardening (Jiang et al. 2007a).
These differences in hardening evolution between tension and compression load-
ing should be considered in constitutive models addressing forming operations
(Steglich and Tian 2013), for springback prediction (Lee et al. 2009) and for the
assessment of crashworthiness.
In this paper the plastic deformation of two different wrought magnesium alloys
(AZ31 and ZE10) under quasi-static tensile and compressive loading conditions at
room temperature is studied. It aims at providing the necessary input for modeling
the plastic response of planar anisotropic or orthotropic polycrystals. A relatively
simple method for determining the compressive stress-strain curve using layered
sheets is applied. The generated results are compared to the data recorded from an
established method of compression testing (Kuwabara et al. 2009). Beside the
tensile and compression tests along the axes of orthotropy, results of through-
thickness compression tests using layered sheets are presented here. The equi-
biaxial stress-strain curve obtained by this method is discussed in the light of pre-
viously generated results (Steglich et al. 2012).
Materials and Microstructures
Two different commercial magnesium rolled sheets were selected for investiga-
tion: A well-known and widely used wrought magnesium alloy AZ31 (Mg +
3%Al + 1%Zn) and an alloy, ZE10 (Mg + 1%Zn + 0.3%Ce based mischmetal)
with improved formability. The differences in the mechanical behavior and the
formability of the two magnesium sheet alloys have been described in earlier
works, see (Bohlen et al. 2007b; Yi et al. 2009; Mekonen et al. 2012). ZE10
shows improved ductility at room temperature compared to AZ31 which is asso-
ciated with an effect of the included rare earth elements in ZE10 and the result of
deformation and recrystallization during sheet rolling.
The two alloys are used in form of magnesium sheets in an annealed condition (O-
temper) with a thickness of 2 mm. Both sheets were received from the former
Salzgitter Magnesium Technology SZMT of Germany. In Figure 1 micrographs
and pole figures of the two rolled sheets are presented. The sheets reveal a fully
recrystallized microstructure resulting in a comparable average grain size of 15
µm. More in detail, the grains of the AZ31-sheet appear equi-axed with a broad
4

size distribution whereas in ZE10 a preferential alignment with a longer axis in
RD is found. This underlines a delay of recrystallization during rolling and/or an-
nealing of this alloy. These differences in the grain structure are unlikely to cause
significant variations of the mechanical behavior. The texture is shown in the
form of re-calculated (0002) basal pole and {10-10} prismatic pole figures. These
pole figures are based on x-ray measurements of six incomplete pole figures in a
Panalytical X’Pert Pro x-ray diffractometer with a goniometer setup. An open
source code MTEX (Bachmann et al. 2010) has been applied to calculate the ori-
entation distribution function and re-calculate full pole figures. The AZ31 sheet
has a strong basal texture with a preferential alignment of basal planes in the sheet
plane. It is noted that the intensity distribution of the basal pole is broader be-
tween ND and RD rather than between ND and TD, typical of rolled AZ31 alloys.
The ZE10 sheet exhibits a significantly weaker texture which does not show the
basal character like the AZ31 sheet. There is no preferential alignment of basal
planes in the sheet plane (i.e. with the c-axis close to ND) but a weak component
with a tilt to the TD.
In an approach to compare the resulting microstructures and properties of different
conditions of the two alloys an extruded component was used for comparison.
Gravity cast slabs of AZ31 and ZE10 were homogenization annealed for 15 hours
at 350°C and extruded at 300°C to hollow rectangular profiles that consist of four
plane rectangular cross sections with a thickness of 1.7 mm. It is noted that the
processing route was different compared to the rolled sheets but sheet-like sec-
tions were obtained and used for analysis in the same way. Figure 2 shows micro-
graphs and pole figures of the extruded alloys. Typical extruded microstructures
are revealed with an almost fully recrystallized grain structure which still allows
the extrusion direction to be seen because of a preferential elongation of grains.
Different average grain sizes correspond to a broader size distribution of grains.
AZ31 reveals an average grain size of 11 µm whereas ZE10 shows a slightly
coarser microstructure with an average grain size of 15 µm. In both cases the tex-
ture can be characterized by a strong basal component which is principally com-
parable to that of the AZ31 sheet in Figure 1. However, the orientation of broader
angular distribution is different and is broader between the ND and the TD in the
extrudates.
5

Experimental Setup
Tension tests
To characterize the mechanical behavior of the magnesium sheets, quasi-static
uniaxial tensile tests were conducted with a constant nominal strain rate of 0.001/s
at room temperature. A universal testing setup Zwick Z050 was used. The tension
tests were performed using flat dogbone-shaped specimens with a parallel length
of 75 mm. A mechanical extensometer was used to measure strain along a length
of 60 mm. Furthermore, another extensometer was used to measure changes in the
specimen’s width for a subsequent analysis of the strain anisotropy (r-value). The
specimens of the rolled sheets were fabricated along rolling direction (RD) and
transverse direction (TD), while the specimens of the extrudates were fabricated
in extrusion direction (ED) only. A minimum of three samples were tested in or-
der to reveal standard deviations of mechanical properties.
The (cumulative) r-value was calculated using the relation
plw
pl pll w
r εε ε
= −+
, (1)
where 𝜀𝑤𝑝𝑙 and 𝜀𝑙
𝑝𝑙 are the plastic strains in the width and longitudinal direction.
These two plastic strain components were calculated by subtracting the elastic
strain from the respective total strain
pl plw w l l= ; =
E Eσ σε ε ν ε ε+ − , (2)
where 𝜀𝑤 and 𝜀𝑙 are the true (logarithmic) strains in the width direction and longi-
tudinal direction, 𝜎 is true stress, E is Young’s modulus and 𝑣 is Poisson’s ratio.
For E and 𝑣 the values of 43 GPa and 0.3 were used. The true stress was calculat-
ed from the load record assuming isochoric deformation.
Compression tests
Methods for large-strain in-plane compression testing of sheet materials remain
challenging as buckling occurs easily preventing uniaxial deformation. Therefore,
procedures have to be developed in order to prevent buckling. This can be 6

achieved either by guiding the sheet between rigid blocks parallel to the sample or
by minimizing the effective length (or the length-to-thickness ratio) of the sample.
In this work, the two methods are used and the respective results are compared.
Cubic specimens glued with five layers of magnesium sheets were prepared for
the tests, see Figure 3a. The specimens were machined along both, RD and TD.
The single sheets were cleaned before applying the J-B-Weld® adhesive (see
http://www.jbweld.com/ for details). To improve the performance of the adhesive,
the surface of the sheet was roughened using an abrasive tool mounted on a mill-
ing machine. The thickness of the stack was determined by the sheets and the ad-
hesive layers and therefore slightly above 10 mm, the other two sides of the cube
were exactly 10 mm. The two surfaces on which the force was applied had been
machined to be exactly parallel to each other and perpendicular to other faces. The
upper and lower platens were mirror polished and Teflon spray was used as lubri-
cant between the specimen and the platens to decrease the friction. The testing
machine used was a SCHENCK servo-hydraulic 1000 kN machine. A compres-
sive force was applied in the plane of the sheets and the force applied with an ini-
tial strain rate of 0.00016/s was measured by the load cell. The experimental setup
is shown in Figure 4. Like during tensile testing, two sets of extensometers were
used to measure the displacement in loading direction and width direction. The
displacement between the top and bottom surfaces of the specimen was recorded
by two extensometers attached to opposite sides on the platens. The average of
their readings was used to calculate the displacement along the compression direc-
tion. A third extensometer was used to assess the width displacement, see Figure
4. By recording the respective displacements at the specimen’s surface, the ma-
chine stiffness need not to be considered. The experiments were stopped when
cracks appeared, seen as in Figure 3b. To check the repeatability of the results,
three experiments were conducted for each orientation and material respectively.
Mechanical testing in compression generally is not as straight forward as ten-
sile testing. In order to verify the method described above, additional tests were
conducted using an in-plane compression testing apparatus originally designed
and developed in earlier work (Kuwabara et al. 2009). Figure 5a shows the comb-
type dies used. The tooth width is 2.7 mm, the tooth length is 55.5 mm, and the
gap between the teeth is 3.0 mm. Dies are installed in the testing apparatus as
7
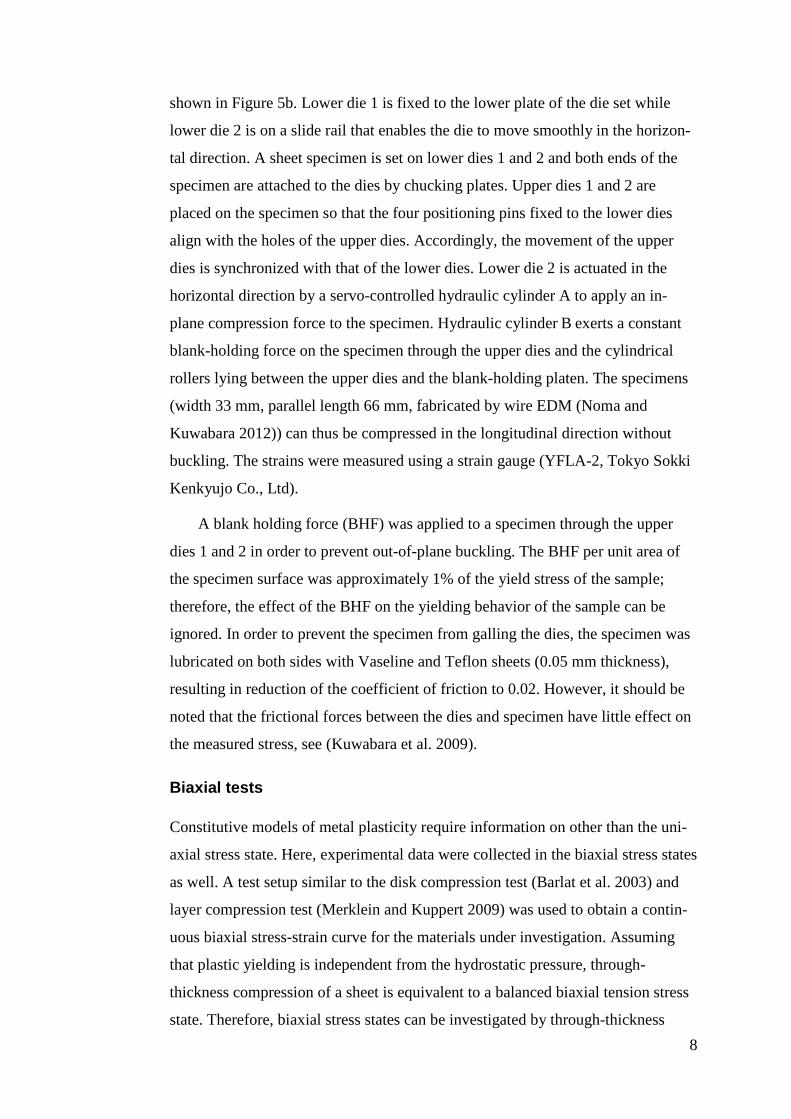
shown in Figure 5b. Lower die 1 is fixed to the lower plate of the die set while
lower die 2 is on a slide rail that enables the die to move smoothly in the horizon-
tal direction. A sheet specimen is set on lower dies 1 and 2 and both ends of the
specimen are attached to the dies by chucking plates. Upper dies 1 and 2 are
placed on the specimen so that the four positioning pins fixed to the lower dies
align with the holes of the upper dies. Accordingly, the movement of the upper
dies is synchronized with that of the lower dies. Lower die 2 is actuated in the
horizontal direction by a servo-controlled hydraulic cylinder A to apply an in-
plane compression force to the specimen. Hydraulic cylinder B exerts a constant
blank-holding force on the specimen through the upper dies and the cylindrical
rollers lying between the upper dies and the blank-holding platen. The specimens
(width 33 mm, parallel length 66 mm, fabricated by wire EDM (Noma and
Kuwabara 2012)) can thus be compressed in the longitudinal direction without
buckling. The strains were measured using a strain gauge (YFLA-2, Tokyo Sokki
Kenkyujo Co., Ltd).
A blank holding force (BHF) was applied to a specimen through the upper
dies 1 and 2 in order to prevent out-of-plane buckling. The BHF per unit area of
the specimen surface was approximately 1% of the yield stress of the sample;
therefore, the effect of the BHF on the yielding behavior of the sample can be
ignored. In order to prevent the specimen from galling the dies, the specimen was
lubricated on both sides with Vaseline and Teflon sheets (0.05 mm thickness),
resulting in reduction of the coefficient of friction to 0.02. However, it should be
noted that the frictional forces between the dies and specimen have little effect on
the measured stress, see (Kuwabara et al. 2009).
Biaxial tests
Constitutive models of metal plasticity require information on other than the uni-
axial stress state. Here, experimental data were collected in the biaxial stress states
as well. A test setup similar to the disk compression test (Barlat et al. 2003) and
layer compression test (Merklein and Kuppert 2009) was used to obtain a contin-
uous biaxial stress-strain curve for the materials under investigation. Assuming
that plastic yielding is independent from the hydrostatic pressure, through-
thickness compression of a sheet is equivalent to a balanced biaxial tension stress
state. Therefore, biaxial stress states can be investigated by through-thickness 8
compression using a universal testing machine and thus circumventing the use of
a hydraulic bulge (Young et al. 1981) or a biaxial tester (Kuwabara et al. 1998).
Five (six in case of the extruded products) circular samples of 20 mm diameter
and 2 mm thickness were stacked and glued as described in the previous section.
The stack of sheets was loaded in compression through upper and lower (mirror-
polished) platens of a SCHENCK servo-hydraulic 1000 kN universal testing ma-
chine with an initial strain rate of 10-3 /s. Teflon spray was used as a lubricant be-
tween specimen and platens in order to minimize friction. The relative displace-
ment between the platens was recorded using two MTS extensometers. The biaxi-
al stress, σb, and the thickness strain, εt, were calculated from the averaged exten-
someter signal u and the compressive force F of the load cell following
20 0 0
4 1 , ln 1 ; 0b tF u u ud t t
σ επ
= − = − ≥
(3)
with t0 being the initial thickness of the stack and d0 its initial diameter. In this
case, isochoric deformation was considered.
In contrast to the interrupted test on single disks proposed earlier, this setup yields
a continuous force-displacement signal from which a stress–strain curve can be
calculated assuming isochoric deformation. It is worth to mention that the biaxial
stress, σb, is realised via a compressive force in thickness direction – not via in-
plane tension loading. This implies that the common understanding of true stress-
es being larger than engineering stresses appears reversed. Furthermore, the ex-
traction of only one stress and one strain component drops the information on the
evolution of anisotropic deformation. Hence it cannot be expected that this test-
setup reveals information on the heterogeneity of the strain response directly. Any
attempt towards parameter identification for plasticity models should consider the
scalar character of the stress signal obtained hereby.
Results
Tension tests
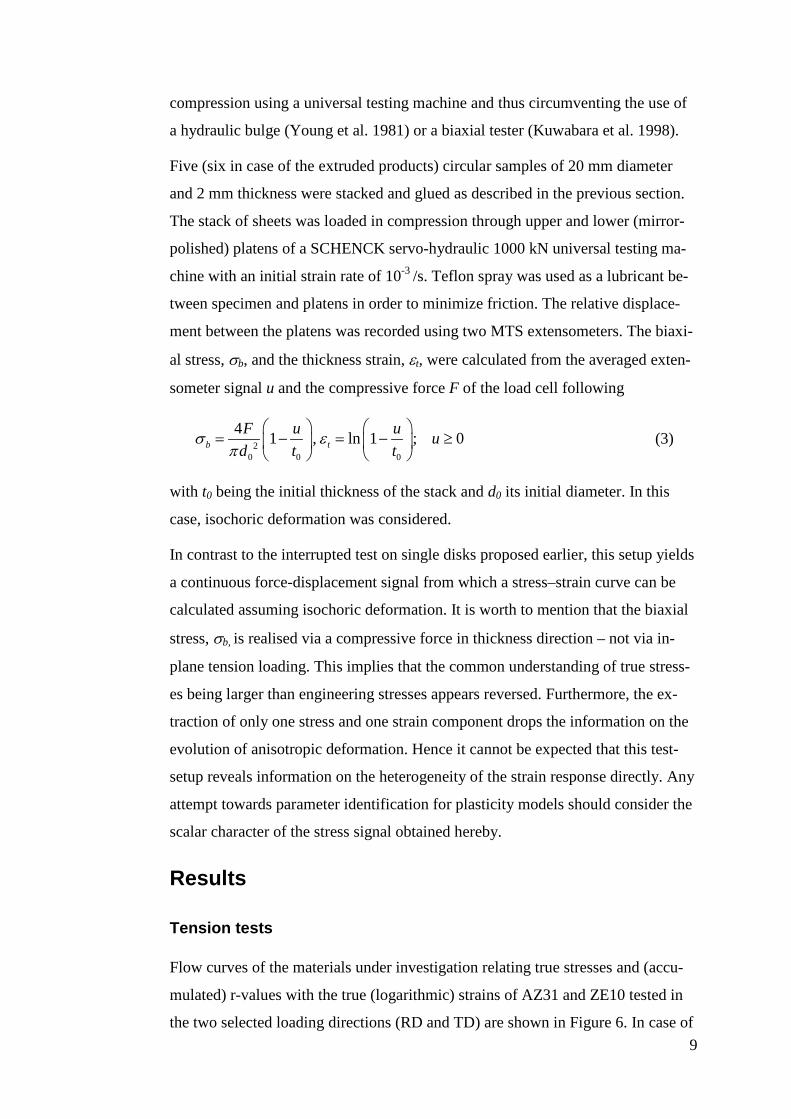
Flow curves of the materials under investigation relating true stresses and (accu-
mulated) r-values with the true (logarithmic) strains of AZ31 and ZE10 tested in
the two selected loading directions (RD and TD) are shown in Figure 6. In case of 9
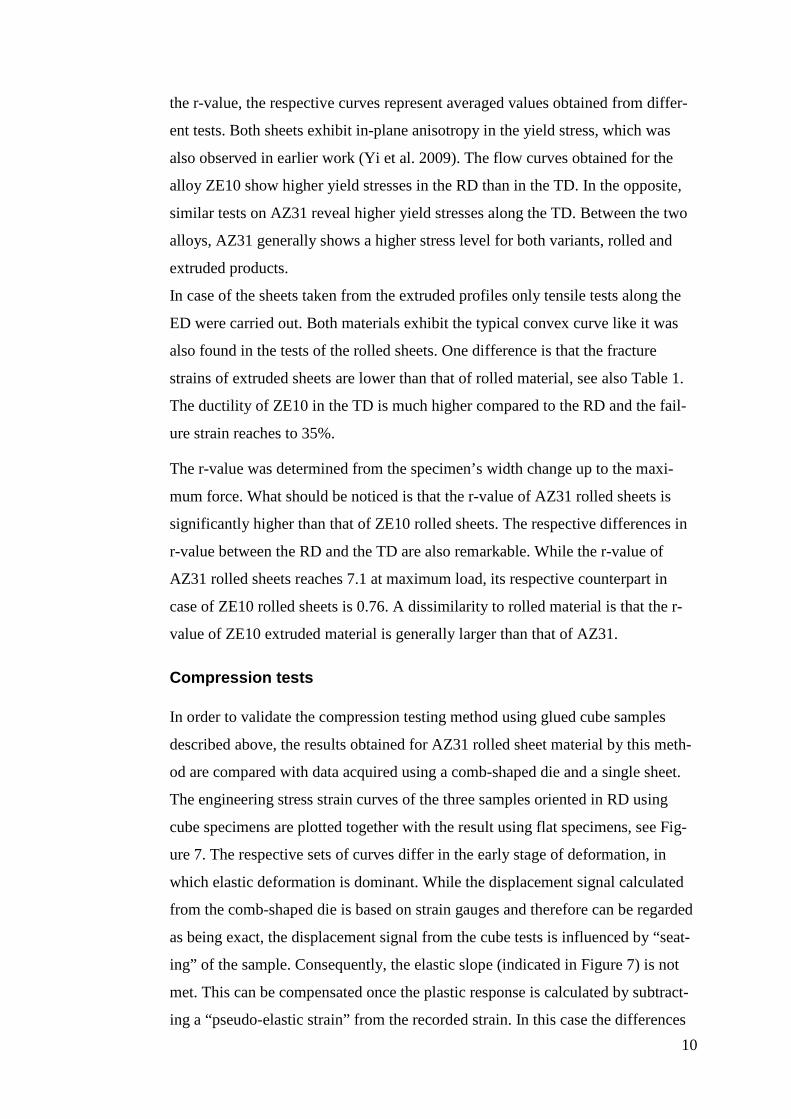
the r-value, the respective curves represent averaged values obtained from differ-
ent tests. Both sheets exhibit in-plane anisotropy in the yield stress, which was
also observed in earlier work (Yi et al. 2009). The flow curves obtained for the
alloy ZE10 show higher yield stresses in the RD than in the TD. In the opposite,
similar tests on AZ31 reveal higher yield stresses along the TD. Between the two
alloys, AZ31 generally shows a higher stress level for both variants, rolled and
extruded products.
In case of the sheets taken from the extruded profiles only tensile tests along the
ED were carried out. Both materials exhibit the typical convex curve like it was
also found in the tests of the rolled sheets. One difference is that the fracture
strains of extruded sheets are lower than that of rolled material, see also Table 1.
The ductility of ZE10 in the TD is much higher compared to the RD and the fail-
ure strain reaches to 35%.
The r-value was determined from the specimen’s width change up to the maxi-
mum force. What should be noticed is that the r-value of AZ31 rolled sheets is
significantly higher than that of ZE10 rolled sheets. The respective differences in
r-value between the RD and the TD are also remarkable. While the r-value of
AZ31 rolled sheets reaches 7.1 at maximum load, its respective counterpart in
case of ZE10 rolled sheets is 0.76. A dissimilarity to rolled material is that the r-
value of ZE10 extruded material is generally larger than that of AZ31.
Compression tests
In order to validate the compression testing method using glued cube samples
described above, the results obtained for AZ31 rolled sheet material by this meth-
od are compared with data acquired using a comb-shaped die and a single sheet.
The engineering stress strain curves of the three samples oriented in RD using
cube specimens are plotted together with the result using flat specimens, see Fig-
ure 7. The respective sets of curves differ in the early stage of deformation, in
which elastic deformation is dominant. While the displacement signal calculated
from the comb-shaped die is based on strain gauges and therefore can be regarded
as being exact, the displacement signal from the cube tests is influenced by “seat-
ing” of the sample. Consequently, the elastic slope (indicated in Figure 7) is not
met. This can be compensated once the plastic response is calculated by subtract-
ing a “pseudo-elastic strain” from the recorded strain. In this case the differences 10
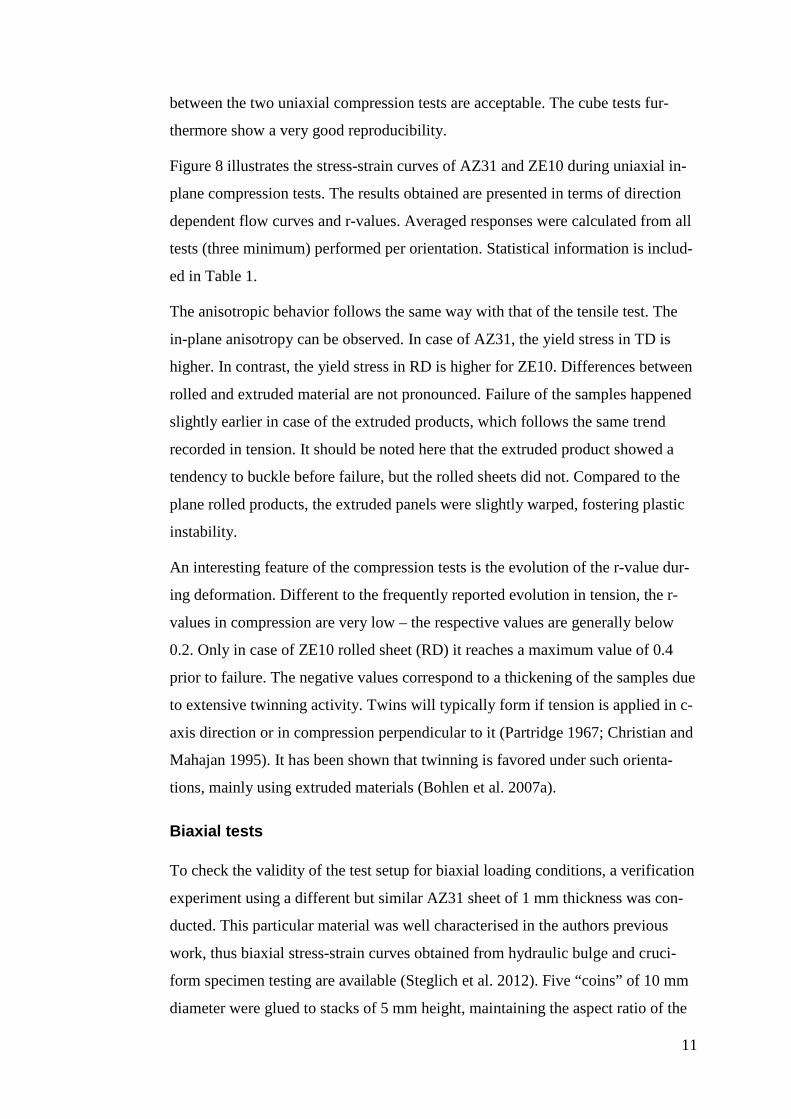
between the two uniaxial compression tests are acceptable. The cube tests fur-
thermore show a very good reproducibility.
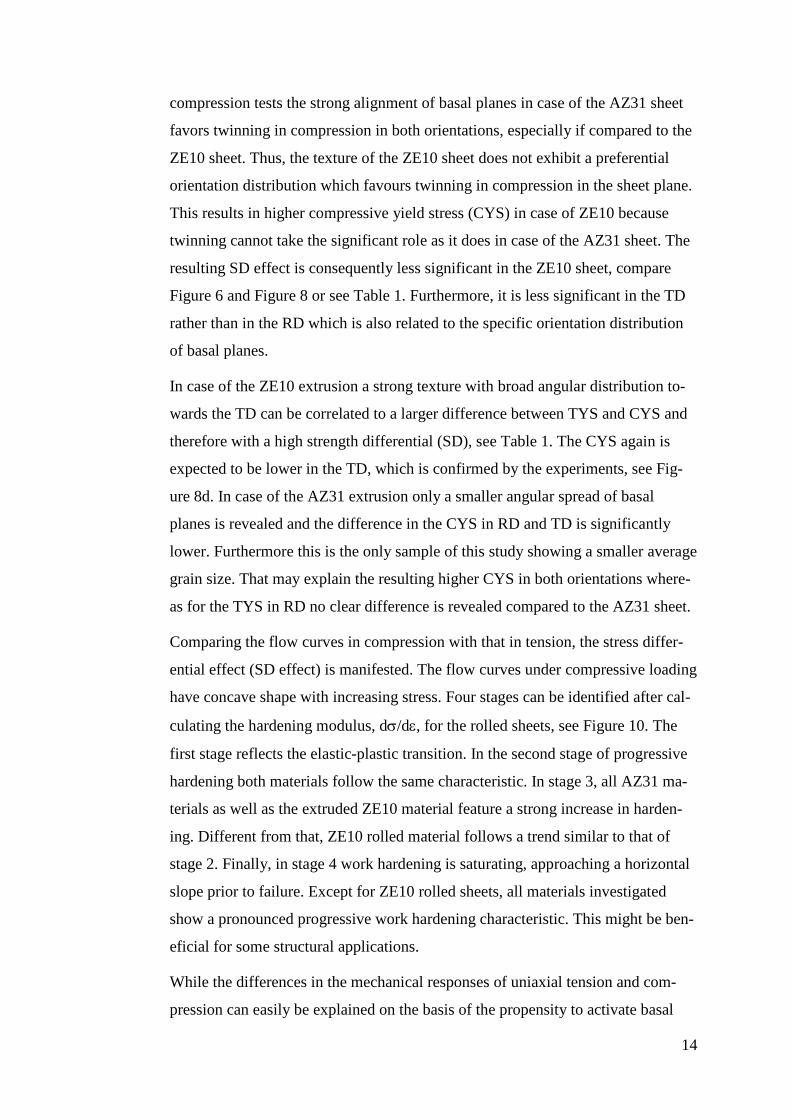
Figure 8 illustrates the stress-strain curves of AZ31 and ZE10 during uniaxial in-
plane compression tests. The results obtained are presented in terms of direction
dependent flow curves and r-values. Averaged responses were calculated from all
tests (three minimum) performed per orientation. Statistical information is includ-
ed in Table 1.
The anisotropic behavior follows the same way with that of the tensile test. The
in-plane anisotropy can be observed. In case of AZ31, the yield stress in TD is
higher. In contrast, the yield stress in RD is higher for ZE10. Differences between
rolled and extruded material are not pronounced. Failure of the samples happened
slightly earlier in case of the extruded products, which follows the same trend
recorded in tension. It should be noted here that the extruded product showed a
tendency to buckle before failure, but the rolled sheets did not. Compared to the
plane rolled products, the extruded panels were slightly warped, fostering plastic
instability.
An interesting feature of the compression tests is the evolution of the r-value dur-
ing deformation. Different to the frequently reported evolution in tension, the r-
values in compression are very low – the respective values are generally below
0.2. Only in case of ZE10 rolled sheet (RD) it reaches a maximum value of 0.4
prior to failure. The negative values correspond to a thickening of the samples due
to extensive twinning activity. Twins will typically form if tension is applied in c-
axis direction or in compression perpendicular to it (Partridge 1967; Christian and
Mahajan 1995). It has been shown that twinning is favored under such orienta-
tions, mainly using extruded materials (Bohlen et al. 2007a).
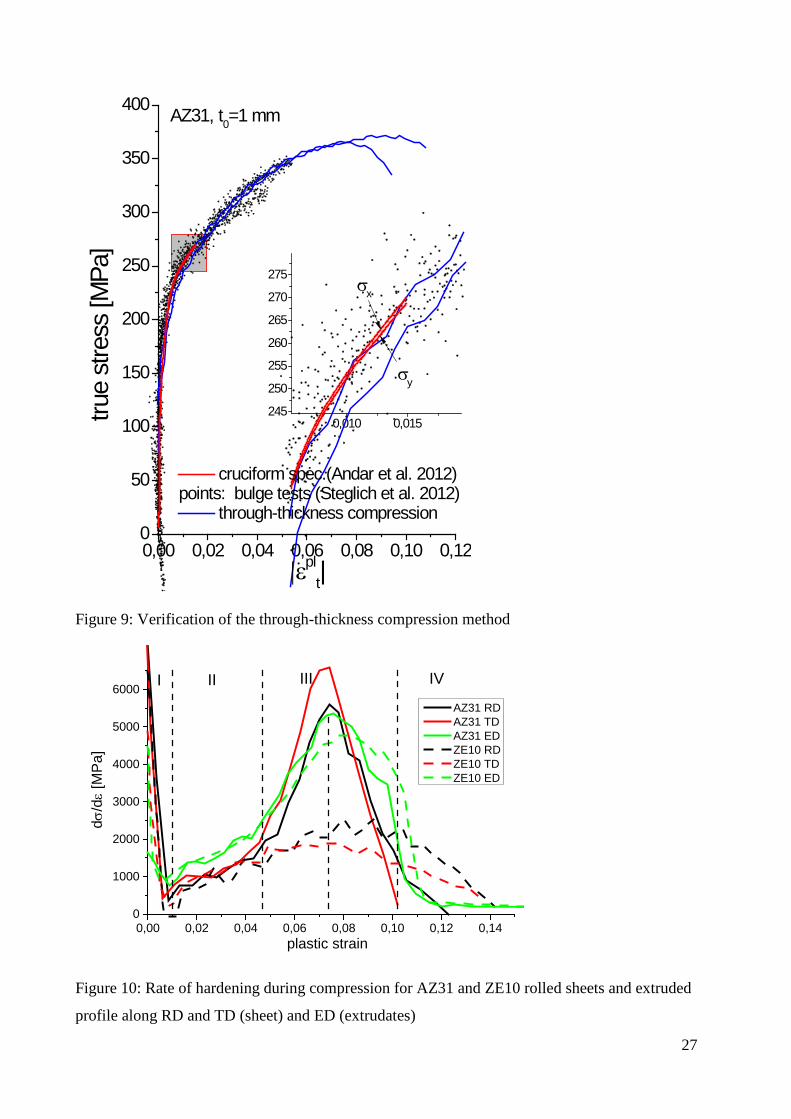
Biaxial tests
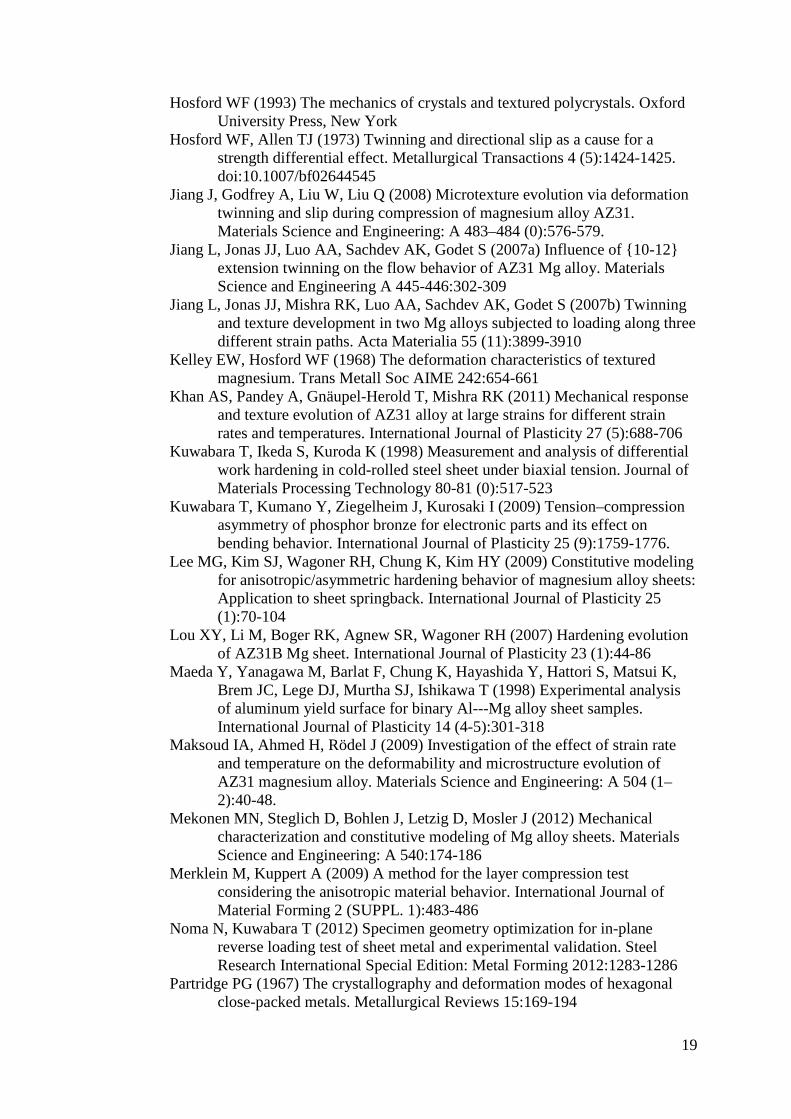
To check the validity of the test setup for biaxial loading conditions, a verification
experiment using a different but similar AZ31 sheet of 1 mm thickness was con-
ducted. This particular material was well characterised in the authors previous
work, thus biaxial stress-strain curves obtained from hydraulic bulge and cruci-
form specimen testing are available (Steglich et al. 2012). Five “coins” of 10 mm
diameter were glued to stacks of 5 mm height, maintaining the aspect ratio of the
11

specimens described in the previous section. The results of two compression ex-
periments are shown in Figure 9 together with results obtained from alternative
testing methods in terms of biaxial stress (or membrane stress in case of the bulge
test) σb as a function of the plastic thickness strain, εplt. The latter was computed
for the test of the cruciform specimen from the measured strain components along
the axes of orthotropy assuming isochoric plastic deformation. All tests revealed
similar characteristics. While the signal obtained from the bulge test is subjected
to scatter, the equi-biaxial tensile experiments and the stacked disk compression
tests show a smooth signal. Due to the anisotropy of the material, the cruciform
specimen reveals independent (and not equal) signals for the two stress compo-
nents – see insert in Figure 9. The signal derived from the stacked disks yield al-
most identical result up to a total strain of 0.011. This is surprising, as the latter
may suffer from friction effects while the first does not. While the biaxial tension
test was stopped once the arms of the cruciform specimen torn off (Andar et al.
2012), the stacked-coin compression test yields still valid results up to a plastic
strain of 0.05. Then the specimens failed by a shear fracture through their thick-
ness, see Figure 3d. Due to the good agreement of the tests with respect to the
biaxial stress-strain curve, it seems that the compression test described here can be
used to generate valid biaxial stress strain characteristics without further correc-
tion for friction.
Figure 6 summarises the biaxial stress-strain curves obtained for the materials,
ZE10 and AZ31, rolled sheets and extruded products. Note that in this case the
thickness strain is used as the independent variable. For all materials, the curves
are not parallel to those obtained by uniaxial tension. This evidences the distor-
tional character of hardening (Mekonen et al. 2012). For AZ31 a high hardening
rate is recorded. Failure of the samples appeared at relatively low strains – with
ZE10 rolled sheet as an exception. In this particular case material separation ap-
pears at a plastic thickness strain of 0.3, which is approximately the same than the
fracture strain observed in uniaxial tension along RD. The respective sample
showed strong anisotropic deformation, leading to an oval shape of the initially
circular coin stack. This is expected, because equal stresses imposed along the RD
and the TD direction only result in identical principal strains once the biaxial r-
value of the material equals unity (Aretz and Keller 2011). Hence, any ellipticity
12

of the stack observed after compression evidences a biaxial r-value different from
unity.
Discussion
The tensile behavior of the two sheets and extrusions can be explained if grain
size and texture effects on the activity of strain accommodating deformation
mechanisms are considered. It has been noted that basal slip and tension twinning,
i.e. twins that allow strain accommodation due to c-axis extension, play a major
role for the resulting strength properties.
A decrease in grain size, measured e.g. as the average grain size of a sample, leads
to an increase in yield stress correlated with the boundary strengthening mecha-
nism as described by Hall and Petch. For magnesium extrusions it was shown that
both, glide mechanisms and twinning, follow a typical linear behavior of increas-
ing yield strength with the inverse square root of the average grain size (Barnett et
al. 2004; Bohlen et al. 2007a).
Texture effects with a specific impact on basal slip are related to the activation
ability described by Schmid’s law. Thus, a strong alignment of basal planes into
testing direction will limit the ability of this deformation mechanism to contribute
to strain accommodation and will result in higher stresses before activation.
Therefore a line can be drawn between the ability to activate this mechanism and
the macroscopic yield stress if dislocation glide rather than twinning is the domi-
nating deformation mechanism.
If the texture is first considered, the angular distribution of basal planes of the
AZ31 sheet between the normal direction (ND) and the rolling direction (RD) is
broader compared to the one between the ND and the transverse direction (TD).
This favors the activation of basal slip if stress is uniaxially applied along the RD
rather than along the TD. This imposes a mechanical anisotropy with higher ten-
sile yield stress (TYS) in the TD than in the RD. In case of the ZE10 sheet it is
vice versa because of the broader angular distribution of basal planes towards TD.
Furthermore, the texture results in a less significant alignment of basal planes in
any orientation, specifically in the sheet plane. Thus, an unfavorable orientation to
activate basal slip parallel to the sheet plane is not distinct any more which there-
fore leads to reduced TYS in both orientations compared to AZ31. In case of
13
compression tests the strong alignment of basal planes in case of the AZ31 sheet
favors twinning in compression in both orientations, especially if compared to the
ZE10 sheet. Thus, the texture of the ZE10 sheet does not exhibit a preferential
orientation distribution which favours twinning in compression in the sheet plane.
This results in higher compressive yield stress (CYS) in case of ZE10 because
twinning cannot take the significant role as it does in case of the AZ31 sheet. The
resulting SD effect is consequently less significant in the ZE10 sheet, compare
Figure 6 and Figure 8 or see Table 1. Furthermore, it is less significant in the TD
rather than in the RD which is also related to the specific orientation distribution
of basal planes.
In case of the ZE10 extrusion a strong texture with broad angular distribution to-
wards the TD can be correlated to a larger difference between TYS and CYS and
therefore with a high strength differential (SD), see Table 1. The CYS again is
expected to be lower in the TD, which is confirmed by the experiments, see Fig-
ure 8d. In case of the AZ31 extrusion only a smaller angular spread of basal
planes is revealed and the difference in the CYS in RD and TD is significantly
lower. Furthermore this is the only sample of this study showing a smaller average
grain size. That may explain the resulting higher CYS in both orientations where-
as for the TYS in RD no clear difference is revealed compared to the AZ31 sheet.
Comparing the flow curves in compression with that in tension, the stress differ-
ential effect (SD effect) is manifested. The flow curves under compressive loading
have concave shape with increasing stress. Four stages can be identified after cal-
culating the hardening modulus, dσ/dε, for the rolled sheets, see Figure 10. The
first stage reflects the elastic-plastic transition. In the second stage of progressive
hardening both materials follow the same characteristic. In stage 3, all AZ31 ma-
terials as well as the extruded ZE10 material feature a strong increase in harden-
ing. Different from that, ZE10 rolled material follows a trend similar to that of
stage 2. Finally, in stage 4 work hardening is saturating, approaching a horizontal
slope prior to failure. Except for ZE10 rolled sheets, all materials investigated
show a pronounced progressive work hardening characteristic. This might be ben-
eficial for some structural applications.
While the differences in the mechanical responses of uniaxial tension and com-
pression can easily be explained on the basis of the propensity to activate basal
14

slip and twinning, the prismatic slip is to be considered as an important defor-
mation mechanism to fulfil the requirements for polycrystalline plastic defor-
mation (Agnew 2002). Specifically, it has been shown in case of biaxial testing
that the abnormal hardening is caused by the delayed activation of prismatic slip
under equi-biaxial stresses acting perpendicular to the basal plane (Hama and
Takuda 2012). As all tested products show a (more the less pronounced) basal
texture, this effect is present in rolled and extruded products of both alloys. The
absence of prismatic slip causes an early failure of the material by shear separa-
tion on inclined planes (Steglich and Morgeneyer 2013). It is worth to mention
that this type of biaxial hardening cannot be described by a plasticity law based on
the von Mises yield criterion. A model accounting for differential hardening is
required instead.
The presented experiments yield a non-constant r-value in compression in the
range of 0.2 – 0.4. They are significantly lower that the respective r-values in ten-
sion. If ND is the “thickness-direction” of the sheet and extruded product, respec-
tively, the material flow is favored in ND rather than in the other non-compressed
direction. Thus the thickness strain, εt, is significantly larger than the width strain
of the compressed sample, εw. The reason for this behaviour lies in the twinning
activity, which is pronounced in the RD and TD compression regime, but not in
tension. Extension twinning causes a re-orientation of the basal plane by 86.3°
(Wonsiewicz and Backofen 1967) in a part of the grain and therefore strongly
influences the global deformation mode. This effect has also been shown experi-
mentally for AR31B, see (Lou et al. 2007) as well as numerically by using the
visco-plastic self-consistent scheme for the same material, see (Wang et al. 2010).
Magnesium alloys generally show a rate dependent mechanical behaviour, in par-
ticular at elevated temperatures. Variations in the yield strength with strain rate
where different deformation mechanisms are active were observed (Maksoud et
al. 2009). All tests reported here were conducted with an initial strain rate being
less or equal 10-3 s-1. For the temperature and these loading rates the rate effects
appear negligible, see also tests reported elsewhere, e.g. (Mekonen et al. 2012).
For the calibration of yield surfaces the instantaneous r-value is commonly pre-
ferred, see (Lou et al. 2007) for a good example. Once the normality rule is used
for computing the strain increments from the plastic potential, the ratio
15

plwplt
r εε
′ =
(4)
gives the normal to the yield surface. Hence, the dependency of plastic width and
thickness strain was fitted by cubic functions; their first derivatives are shown as
instantaneous r-values r´ in Figure 11. The cumulative and instantaneous r-values
do not coincide, because the planar anisotropy of the materials is evolving. Typi-
cally, the instantaneous r-values are higher compared to their cumulative counter-
parts. This has been reported already for the case of tensile loads (Lou et al. 2007)
and could be confirmed in the present study. The same trend is observed in case of
compressive loads, however, the difference between instantaneous and cumulative
r-value appears more pronounced, compare Figure 6 and the respective figure in
(Lou et al. 2007). This effect is related to the progressive increase of the r-value
with strain in case of compression and hence has to be considered in parameter
identification procedures.
Both, in Figure 6 and Figure 8, only the inelastic portion of the total strains is con-
sidered, see Eq. (2). It is assumed that – independently of the magnitude of strain
– unloading would be purely elastic and follow the initial Young’s modulus. This
might not be the case, as previous investigation reveal a decrease of the elastic
slope after pre-straining the material in tension (Andar et al. 2010). A quantifica-
tion of the recoverable inelastic strain, as conducted in (Cleveland and Ghosh
2002) for steel and aluminium, was not performed here. In an attempt to quantify
the effect of changing E-modulus, two additional curves are included in Figure
11a: One representing the accumulated r-value assuming a decrease of the initial
Young’s modulus by 15%, another by neglecting the elastic strain in Eq. (1).
From this figure it becomes obvious that in both cases the calculated r-value is
inside the confidence band established by repeated tests, see Figure 8. Hence, dis-
regarding the elastic strains does not significantly change the results.
Conclusions
A relatively simple method to determine the compressive behaviour of sheet metal
was used to quantify the mechanical behaviour of two magnesium alloys, AZ31
and ZE10, produced by two different production routes. The method uses two
independent extensometers to simultaneously record longitudinal and transversal
16

strains and therefore determines r-values during compression parallel to the sheet
planes. The method was successfully validated via a more sophisticated setup
based on comb dies. Restrictions apply only in the early stage of deformation, as
the elastic slope could not be recovered due to seating of the specimen.
A very similar setup was used to assess the equi-biaxial (tensile) behaviour of the
materials. This method was validated against hydraulic bulge and cruciform spec-
imen tests and found to give good results. The method can be used to achieve
higher strains before failure, because plastic instabilities are suppressed compared
to the aforementioned test methods.
Mechanical tests were conducted along the orthotropic axes of the materials. The
measured behaviour was explained by differences in the microstructure and tex-
ture. Certain trends could be explained through the fundamental deformation
mechanisms present in magnesium alloys. An evolving strength differential effect
in both flow stress and r-value response of all materials was observed. The com-
pressive r-values are generally lower than the tensile r-values. The generated re-
sults are comprehensive enough to be used as an input for constitutive modeling.
Acknowledgements
The authors appreciate the help of Dr.-Ing. Sören Müller and his team at the Ex-
trusion Research Centre of TU Berlin (Germany) during extrusion experiments.
The help of Mr. Günther Meister of HZG during casting of the extrusion billets is
acknowledged as well as the help of Mr. Lennart Stutz during characterization of
the AZ31 sheet. Special thanks to Kay Erdmann and Anne Groth for their assis-
tance during mechanical testing. Support by Assessment, Computing and Engi-
neering Centre (ACE) is gratefully acknowledged.
Literature
Agnew SR (2002) Plastic anisotropy of magnesium alloy AZ31B sheet. Paper presented at the Magnesium Technology 2002, Seattle,
Agnew SR, Duygulu Ö (2005) Plastic anisotropy and the role of non-basal slip in magnesium alloy AZ31B. Int J Plast 21 (6):1161-1193
17

Agnew SR, Yoo MH, Tome CN (2001) Application of texture simulation to understanding mechanical behavior of Mg and solid solution alloys containing Li or Y. Acta Mater 49 (20):4277-4289
Andar MO, Kuwabara T, Steglich D (2012) Material modeling of AZ31 Mg sheet considering variation of r-values and asymmetry of the yield locus. Mater Sci Eng A 549:82-92.
Andar O, Steglich D, Kuwabara T (2010) Measurement and Analysis of the Biaxial Loading and Unloading Behavior of AZ31 Mg Alloy Sheet. Paper presented at the International Conference on Advances in Materials and Processing Technologies (AMPT2010), Paris, France,
Aretz H, Keller S (2011) On the non-balanced biaxial stress state in bulge-testing. Steel Research int, special edition Material Characterization and Modelling:738-743
Bachmann F, Hielscher R, Schaeben H (2010) Texture Analysis with MTEX – Free and Open Source Software Toolbox. Solid State Phenomena 160 63-68
Ball EA, Prangnell PB (1994) Tensile-compressive yield asymmetries in high strength wrought magnesium alloys. Scripta Metallurgica et Materiala 31 (2):111-116
Barlat F, Brem JC, Yoon JW, Chung K, Dick RE, Lege DJ, Pourboghrat F, Choi S-H, Chu E (2003) Plane stress yield function for aluminum alloy sheets-part 1: theory. Int J Plast 19 (9):1297-1319
Barnett MR (2007) Twinning and the ductility of magnesium alloys: Part I: 'Tension' twins. Mater Sci Eng A 464 (1-2):1-7
Barnett MR, Keshavarz Z, Beer AG, Atwell D (2004) Influence of grain size on the compressive deformation of wrought Mg–3Al–1Zn. Acta Mater 52:5093-5103
Boger RK, Wagoner RH, Barlat F, Lee MG, Chung K (2005) Continuous, large strain, tension/compression testing of sheet material. International Journal of Plasticity 21 (12):2319-2343
Bohlen J, Dobroň P, Swiostek J, Letzig D, Chmelík F, Lukáč P, Kainer KU (2007a) On the influence of the grain size and solute content on the AE response of magnesium alloys tested in tension and compression. Materials Science and Engineering: A 462 (1–2):302-306.
Bohlen J, Nuernberg MR, Senn JW, Letzig D, Agnew SR (2007b) The texture and anisotropy of magnesium–zinc–rare earth alloy sheets. Acta Mater 55:2101-2112
Christian JW, Mahajan S (1995) Deformation twinning. Prog Mater Sci 39:1-157 Cleveland RM, Ghosh AK (2002) Inelastic effects on springback in metals.
International Journal of Plasticity 18 (5–6):769-785. Ghaffari Tari D, Worswick MJ, Ali U, Gharghouri MA (2014) Mechanical
response of AZ31B magnesium alloy: Experimental characterization and material modeling considering proportional loading at room temperature. International Journal of Plasticity 55:247–267.
Hakamada M, Watazu A, Saito N, Iwasaki H (2009) Tension/compression anisotropy in hot forged Mg-Al-Ca-RE alloy. Materials Transactions 50 (7):1898-1901
Hama T, Takuda H (2012) Crystal plasticity finite-element simulation of work-hardening behavior in a magnesium alloy sheet under biaxial tension. Computational Materials Science 51 (1):156-164
18
Hosford WF (1993) The mechanics of crystals and textured polycrystals. Oxford University Press, New York
Hosford WF, Allen TJ (1973) Twinning and directional slip as a cause for a strength differential effect. Metallurgical Transactions 4 (5):1424-1425. doi:10.1007/bf02644545
Jiang J, Godfrey A, Liu W, Liu Q (2008) Microtexture evolution via deformation twinning and slip during compression of magnesium alloy AZ31. Materials Science and Engineering: A 483–484 (0):576-579.
Jiang L, Jonas JJ, Luo AA, Sachdev AK, Godet S (2007a) Influence of {10-12} extension twinning on the flow behavior of AZ31 Mg alloy. Materials Science and Engineering A 445-446:302-309
Jiang L, Jonas JJ, Mishra RK, Luo AA, Sachdev AK, Godet S (2007b) Twinning and texture development in two Mg alloys subjected to loading along three different strain paths. Acta Materialia 55 (11):3899-3910
Kelley EW, Hosford WF (1968) The deformation characteristics of textured magnesium. Trans Metall Soc AIME 242:654-661
Khan AS, Pandey A, Gnäupel-Herold T, Mishra RK (2011) Mechanical response and texture evolution of AZ31 alloy at large strains for different strain rates and temperatures. International Journal of Plasticity 27 (5):688-706
Kuwabara T, Ikeda S, Kuroda K (1998) Measurement and analysis of differential work hardening in cold-rolled steel sheet under biaxial tension. Journal of Materials Processing Technology 80-81 (0):517-523
Kuwabara T, Kumano Y, Ziegelheim J, Kurosaki I (2009) Tension–compression asymmetry of phosphor bronze for electronic parts and its effect on bending behavior. International Journal of Plasticity 25 (9):1759-1776.
Lee MG, Kim SJ, Wagoner RH, Chung K, Kim HY (2009) Constitutive modeling for anisotropic/asymmetric hardening behavior of magnesium alloy sheets: Application to sheet springback. International Journal of Plasticity 25 (1):70-104
Lou XY, Li M, Boger RK, Agnew SR, Wagoner RH (2007) Hardening evolution of AZ31B Mg sheet. International Journal of Plasticity 23 (1):44-86
Maeda Y, Yanagawa M, Barlat F, Chung K, Hayashida Y, Hattori S, Matsui K, Brem JC, Lege DJ, Murtha SJ, Ishikawa T (1998) Experimental analysis of aluminum yield surface for binary Al---Mg alloy sheet samples. International Journal of Plasticity 14 (4-5):301-318
Maksoud IA, Ahmed H, Rödel J (2009) Investigation of the effect of strain rate and temperature on the deformability and microstructure evolution of AZ31 magnesium alloy. Materials Science and Engineering: A 504 (1–2):40-48.
Mekonen MN, Steglich D, Bohlen J, Letzig D, Mosler J (2012) Mechanical characterization and constitutive modeling of Mg alloy sheets. Materials Science and Engineering: A 540:174-186
Merklein M, Kuppert A (2009) A method for the layer compression test considering the anisotropic material behavior. International Journal of Material Forming 2 (SUPPL. 1):483-486
Noma N, Kuwabara T (2012) Specimen geometry optimization for in-plane reverse loading test of sheet metal and experimental validation. Steel Research International Special Edition: Metal Forming 2012:1283-1286
Partridge PG (1967) The crystallography and deformation modes of hexagonal close-packed metals. Metallurgical Reviews 15:169-194
19

Steglich D, Jeong Y, Andar MO, Kuwabara T (2012) Biaxial deformation behaviour of AZ31 magnesium alloy: Crystal-plasticity-based prediction and experimental validation. International Journal of Solids and Structures 49 (25):3551-3561
Steglich D, Morgeneyer TF (2013) Failure of magnesium sheets under monotonic loading: 3d examination of fracture mode and mechanisms. International Journal of Fracture 183 (1):105-112
Steglich D, Tian X Modelling of magnesium sheet forming operations. In: Numiform 2013, Shenyang, CN, 2013. AIP, pp 714-717
Tozawa N (1978) Plastic deformation behavior under the conditions of combined stress. In: Koistinen DP, Wang, N.M. (ed) Mechanics of Sheet Metal Forming. Plenum Press, New York, pp 81–110
Wang H, Raeisinia B, Wu PD, Agnew SR, Tomé CN (2010) Evaluation of self-consistent polycrystal plasticity models for magnesium alloy AZ31B sheet. International Journal of Solids and Structures 47 (21):2905-2917
Wang YN, Huang JC (2007) The role of twinning and untwinning in yielding behavior in hot-extruded Mg-Al-Zn alloy. Acta Mater 55 (3):897-905
Wonsiewicz BC, Backofen WA (1967) Plasticity of magnesium crystals. Trans Metall Soc AIME 239:1422-1433
Yi S, Bohlen J, Heinemann F, Letzig D (2009) Mechanical anisotropy and deep drawing behaviour of AZ31 and ZE10 magnesium alloy sheets. Acta Materialia 58 (2):592-605
Yoshida F, Uemori T, Fujiwara K (2002) Elastic–plastic behavior of steel sheets under in-plane cyclic tension–compression at large strain. International Journal of Plasticity 18 (5–6):633-659.
Young RF, Bird JE, Duncan JL (1981) An automated hydraulic bulge tester. Journal of Applied Metalworking 2 (1):11-18
Zhang J, Yu Q, Jiang Y, Li Q (2011) An experimental study of cyclic deformation of extruded AZ61A magnesium alloy. International Journal of Plasticity 27 (5):768-787
20

Tables
Table 1: Mechanical properties of the rolled sheets and extrudates. Tensile and
compression tests along rolling direction (RD) and transverse direction (TD) of
sheets and along extrusion direction (ED) and perpendicular transverse direction
(TD) of extrudates; TYS: tensile yield stress, CYS: compressive yield stress, SD:
strength differential TYS/CYS, UTS: ultimate tensile strength; standard deviation
in brackets
alloy variant av. grain size [µm]
TYS [MPa]
CYS [MPa] SD UTS
[MPa] fracture strain
[%]
AZ31 sheet - RD
15 (1) 170 (1) 72 (2) 2.36 254 (1) 22.2 (1.5)
sheet - TD 194 (1) 77 (2) 2.52 257 (1) 22.6 (0.5)
ZE10 sheet - RD
15 (1) 157 (1) 104 (2) 1.51 229 (1) 21.7 (0.1)
sheet - TD 107 (1) 92 (1) 1.16 216 (1) 32.2 (1.6)
AZ31 extrusion - ED
11 (1) 166 (7) 93 (2) 1.78 261 (5) 16.8 (1.5)
extrusion - TD - 90 (1) - - -
ZE10 extrusion -ED
15 (1) 160 (9) 65 (1) 2.46 229 (6) 18.8 (0.8)
extrusion - TD - 57 (2) - - -
21

Figures
Figure 1: Microstructure and texture of rolled sheets of alloys a) AZ31 and b) ZE10
Figure 2: Microstructure and texture of extruded profiles of alloys a) AZ31 and b) ZE10
a) AZ31 : rolled sheet
RD
TD
b) ZE10: rolled sheet
RD
a) AZ31 : extruded hollow rectangle
ED
TD
b) ZE10: extruded hollow rectangle
ED
22

Figure 3: Compression test specimens used in this investigation: initial (a) and fractured
specimen (b) for in-plane loading; initial (c) and fractured specimen (d) for through-thickness
compression
23

Figure 4: Setup for uniaxial compression testing using cube specimens (mounted in the middle)
Figure 5: Alternative experimental apparatus for application of in-plane compression to a sheet specimen: (a) configuration of the dies, and (b) an overview of the testing apparatus.
Lower die 1
Lower die 2
Upper die 1
Upper die 2
SpecimenTeflon sheets
Load cell
Hydraulic cylinder A
Blank holding platen
Hydraulic cylinder B
Lower plate Slide rail
Lower die 1 Lower die 2
Upper die 1 Upper die 2
Specimen
24

0.00 0.05 0.10 0.15 0.20 0.25 0.30 0.350
50
100
150
200
250
300
350a) AZ31 rolled
True
stre
ss [M
Pa]
True strain
RD true stress TD true stress ND true stress
0.0
1.5
3.0
4.5
6.0
7.5
RD cumulative r-value TD cumulative r-value
Cum
ulat
ive
r-val
ue
0.00 0.05 0.10 0.15 0.20 0.25 0.30 0.350
50
100
150
200
250
300
350b) ZE10 rolled
RD true stress TD true stress ND true stress
True
stre
ss [M
Pa]
True strain
0.0
1.5
3.0
4.5
6.0
7.5
RD cumulative r-value TD cumulative r-value
Cum
ulat
ive
r-val
ue
0.00 0.05 0.10 0.15 0.20 0.25 0.30 0.350
50
100
150
200
250
300
350
True
stre
ss [M
Pa]
True strain
ED true stress ND true stress
0.0
1.5
3.0
4.5
6.0
7.5c) AZ31 extruded
ED cumulative r-value
Cum
ulat
ive
r-val
ue
0.00 0.05 0.10 0.15 0.20 0.25 0.30 0.350
50
100
150
200
250
300
350
True
stre
ss [M
Pa]
True strain
ED true stress ND true stress
0.0
1.5
3.0
4.5
6.0
7.5d) ZE10 extruded
ED cumulative r-value
Cum
ulat
ive
r-val
ue
Figure 6: Mechanical response in tension (uniaxial and biaxial) for a) AZ31 rolled sheet, b)
ZE10 rolled sheet, c) AZ31 extruded material and d) ZE10 extruded material
0,00 0,02 0,04 0,06 0,08 0,10 0,12 0,140
50
100
150
200
250
300
350
400
Cube tests AZ31_RD Flat sheet tests AZ31_RD
F/A 0
-∆l/l0
E
Figure 7: Engineering stress strain curves of cube and flat sheet tests for AZ31 along RD
25

0.00 0.02 0.04 0.06 0.08 0.10 0.12 0.14 0.160
50
100
150
200
250
300
350a) AZ31 rolled
RD true stress TD true stress
True
stre
ss [M
Pa]
True strain
0.0
0.2
0.4
0.6
0.8
1.0
RD cumulative r-value TD cumulative r-value
Cum
ulat
ive
r-val
ue
0.00 0.02 0.04 0.06 0.08 0.10 0.12 0.14 0.160
50
100
150
200
250
300
350
RD true stress TD true strain
True
stre
ss [M
Pa]
True strain
0.0
0.2
0.4
0.6
0.8
1.0b) ZE10 rolled
RD cumulative r-value TD cumulative r-value
Cum
ulat
ive
r-val
ue
0.00 0.02 0.04 0.06 0.08 0.10 0.12 0.14 0.160
50
100
150
200
250
300
350c) AZ31 extruded
ED true stress TD true stress
True
stre
ss [M
Pa]
True strain
0.0
0.2
0.4
0.6
0.8
1.0
ED cumulative r-value TD cumulative r-value
Cum
ulat
ive
r-val
ue
0.00 0.02 0.04 0.06 0.08 0.10 0.12 0.14 0.160
50
100
150
200
250
300
350d) ZE10 extruded
ED true stress TD true stress
True
stre
ss [M
Pa]
True strain
0.0
0.2
0.4
0.6
0.8
1.0
ED cumulative r-value TD cumulative r-value
Cum
ulat
ive
r-val
ue
Figure 8: Mechanical response in compression using glued cube samples for a) AZ31 rolled sheet, b) ZE10 rolled sheet, c) AZ31 extruded material and d) ZE10 extruded material
26
0,00 0,02 0,04 0,06 0,08 0,10 0,120
50
100
150
200
250
300
350
400
0,010 0,015245
250
255
260
265
270
275
σy
σx
AZ31, t0=1 mm
cruciform spec.(Andar et al. 2012)points: bulge tests (Steglich et al. 2012)
through-thickness compression
true
stre
ss [M
Pa]
|εplt|
Figure 9: Verification of the through-thickness compression method
0,00 0,02 0,04 0,06 0,08 0,10 0,12 0,140
1000
2000
3000
4000
5000
6000IVIIIII
dσ/dε
[MP
a]
plastic strain
AZ31 RD AZ31 TD AZ31 ED ZE10 RD ZE10 TD ZE10 ED
I
Figure 10: Rate of hardening during compression for AZ31 and ZE10 rolled sheets and extruded
profile along RD and TD (sheet) and ED (extrudates)
27

0.00 0.02 0.04 0.06 0.08 0.10 0.12 0.14-0.1
0.0
0.1
0.2
0.3
0.4
0.5
0.6
0.7
0.8
RD cumulative r-value TD cumulative r-value RD instantaneous r-value TD instantaneous r-value RD cumulative r-value (total strain) RD cumulative r-value
(15% lower Young's modulus)
r-val
ue
True strain
a) AZ31 rolled
0.00 0.02 0.04 0.06 0.08 0.10 0.12 0.14-0.1
0.0
0.1
0.2
0.3
0.4
0.5
0.6
0.7
0.8b) ZE10 rolled
RD cumulative r-value TD cumulative r-value RD instantaneous r-value TD instantaneous r-value
r-val
ue
True strain
0.00 0.02 0.04 0.06 0.08 0.10 0.12 0.14-0.1
0.0
0.1
0.2
0.3
0.4
0.5
0.6
0.7
0.8c) AZ31 extruded
ED cumulative r-value TD cumulative r-value ED instantaneous r-value TD instantaneous r-value
r-val
ue
True strain0.00 0.02 0.04 0.06 0.08 0.10 0.12 0.14
-0.1
0.0
0.1
0.2
0.3
0.4
0.5
0.6
0.7
0.8d) ZE10 extruded
ED cumulative r-value TD cumulative r-value ED instantaneous r-value TD instantaneous r-value
r-val
ue
True strain
Figure 11: Assessment of the in-plane anisotropy during compression of AZ31 (a and c) and
ZE10 (b and d) products in terms of cumulative and instantaneous r-values
28