Download - READING ECG
READING ECGFor paramedic
Presented by : SN NORLIZA ALI
UNIT KECEMASAN & TRAUMA
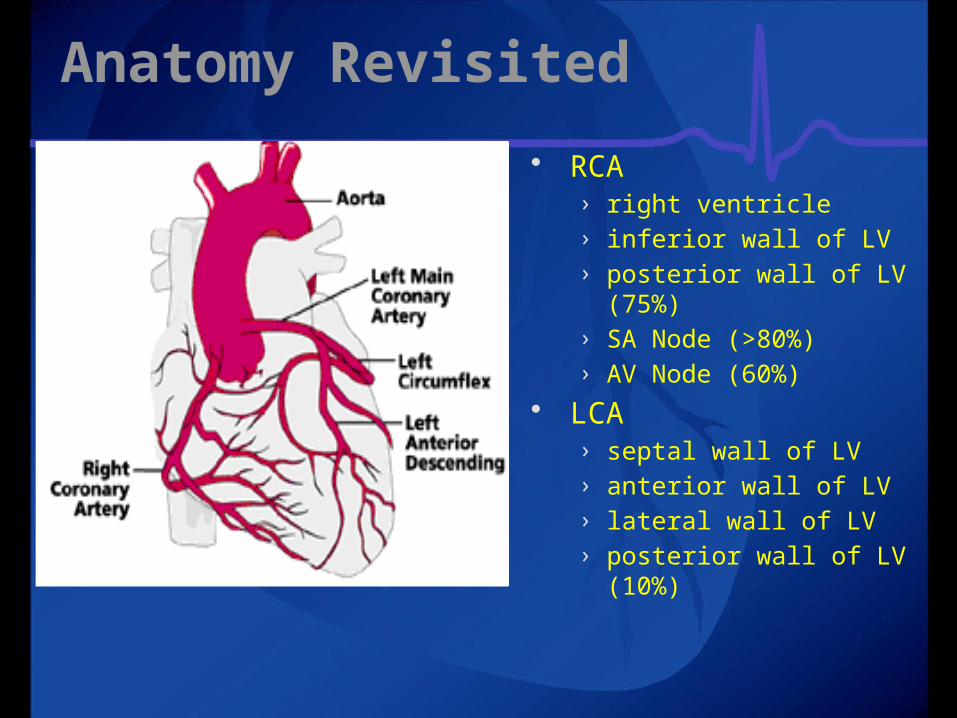
Anatomy Revisited RCA
› right ventricle› inferior wall of LV› posterior wall of LV (75%)
› SA Node (>80%)› AV Node (60%)
LCA› septal wall of LV› anterior wall of LV› lateral wall of LV› posterior wall of LV (10%)
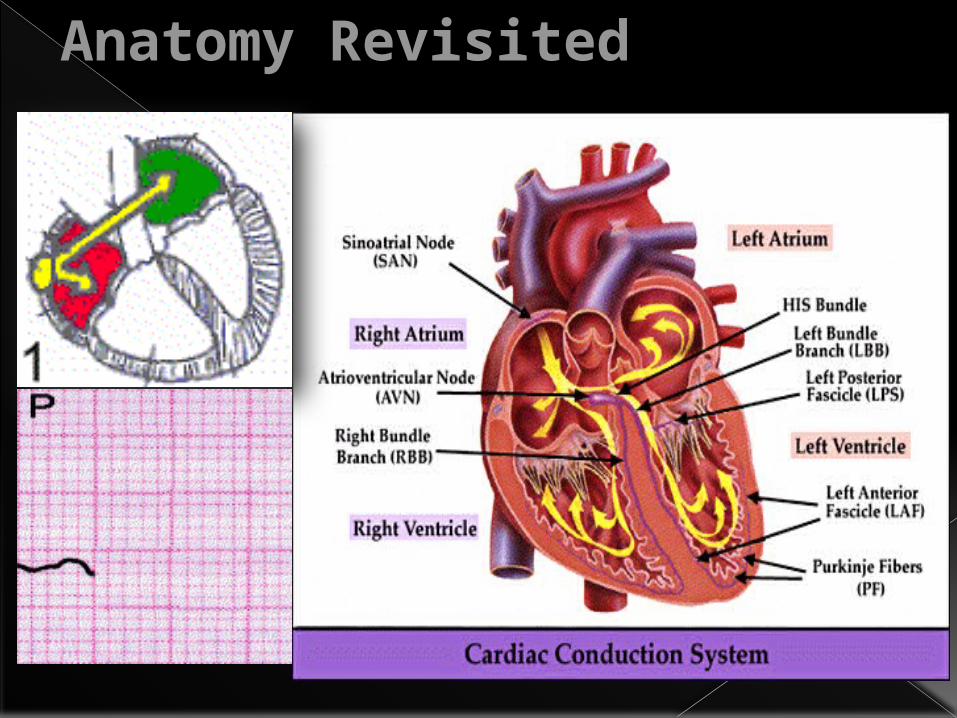
Anatomy Revisited
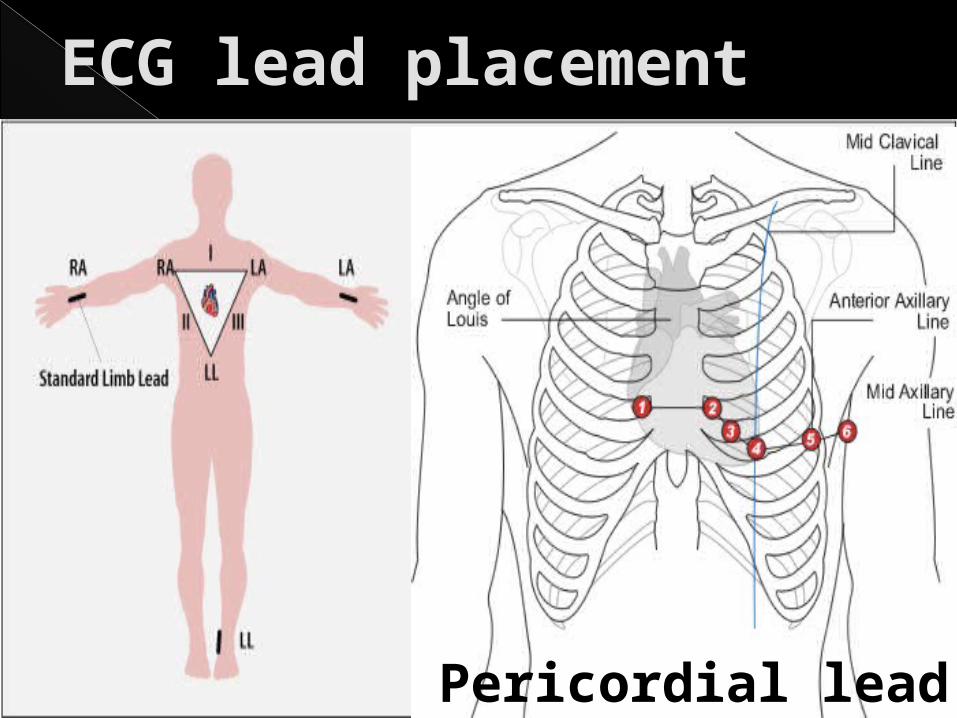
ECG lead placement
Pericordial lead
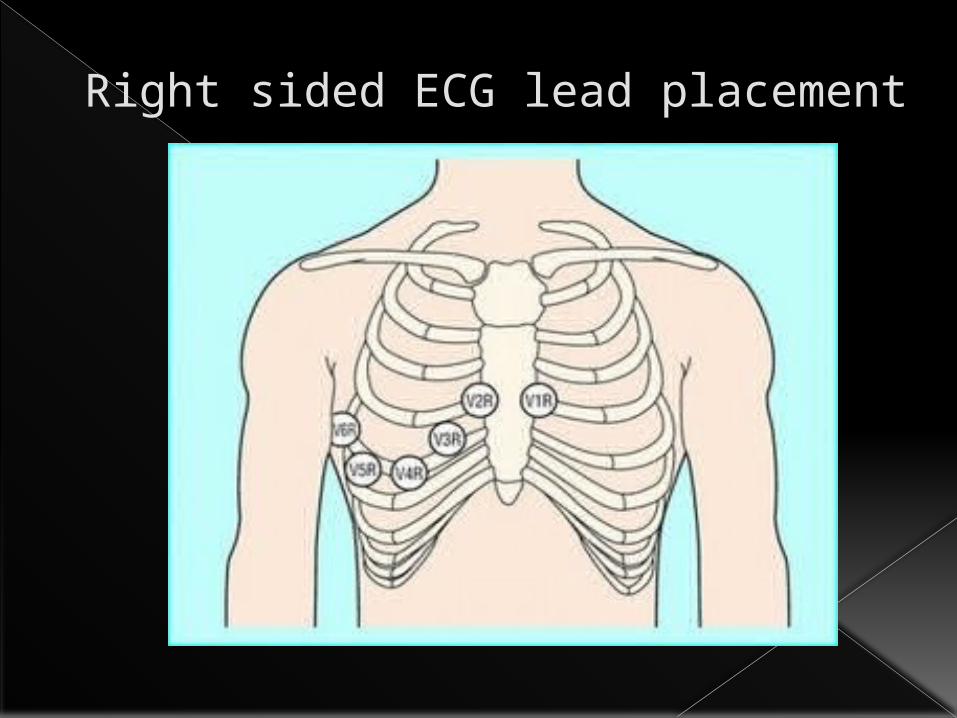
Right sided ECG lead placement
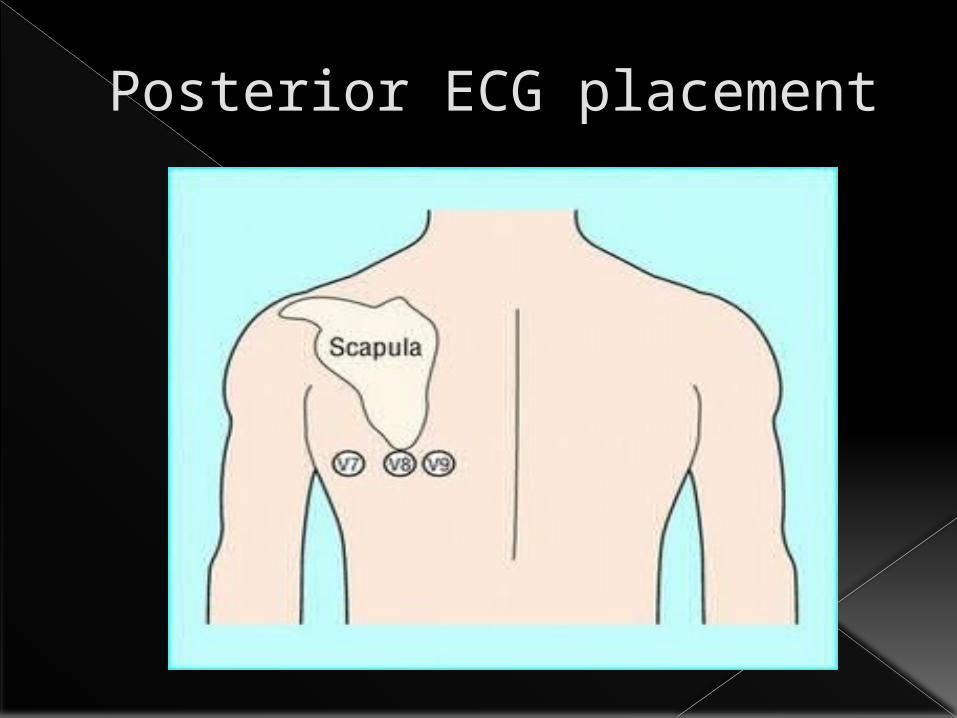
Posterior ECG placement
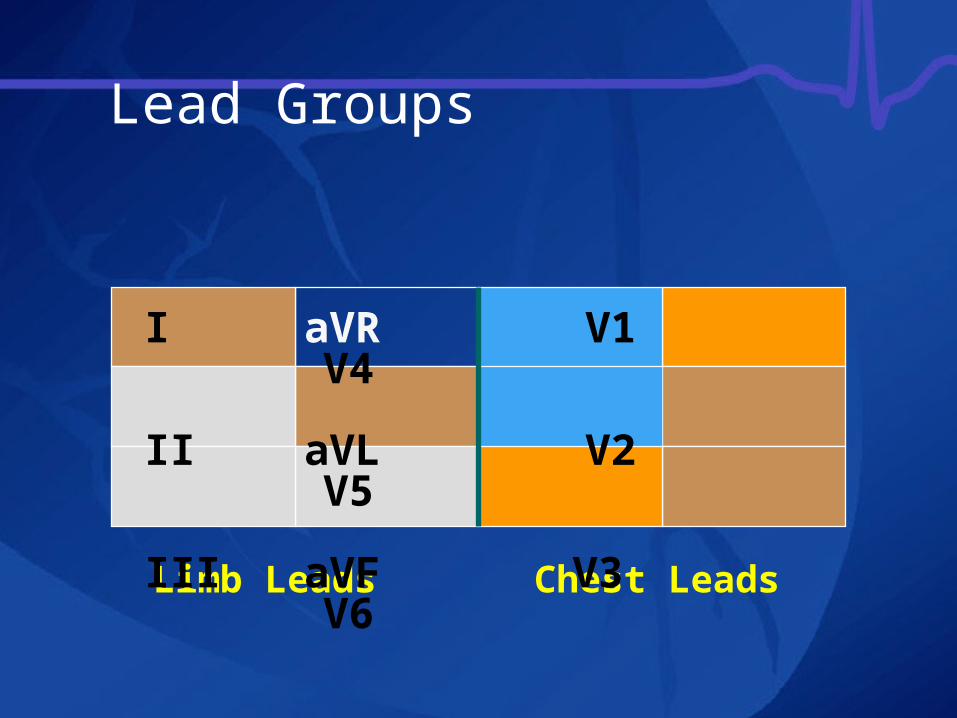
Limb Leads Chest Leads
I aVR V1 V4II aVL V2 V5III aVF V3 V6
Lead Groups
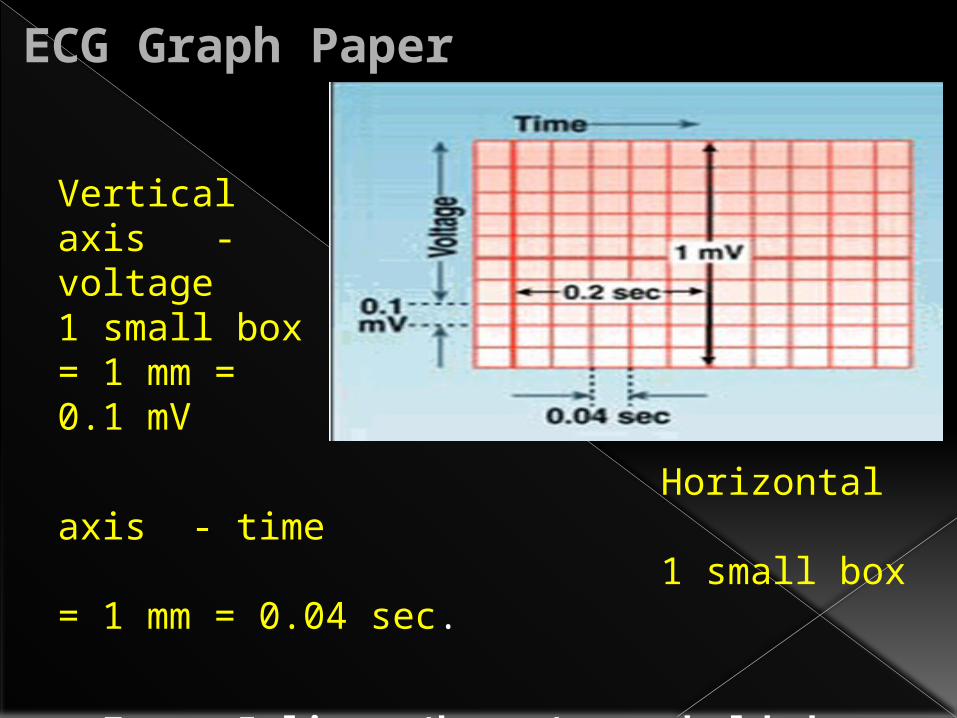
ECG Graph Paper
Horizontal axis - time 1 small box = 1 mm = 0.04 sec.
o Every 5 lines (boxes) are bolded
Vertical axis - voltage1 small box = 1 mm = 0.1 mV
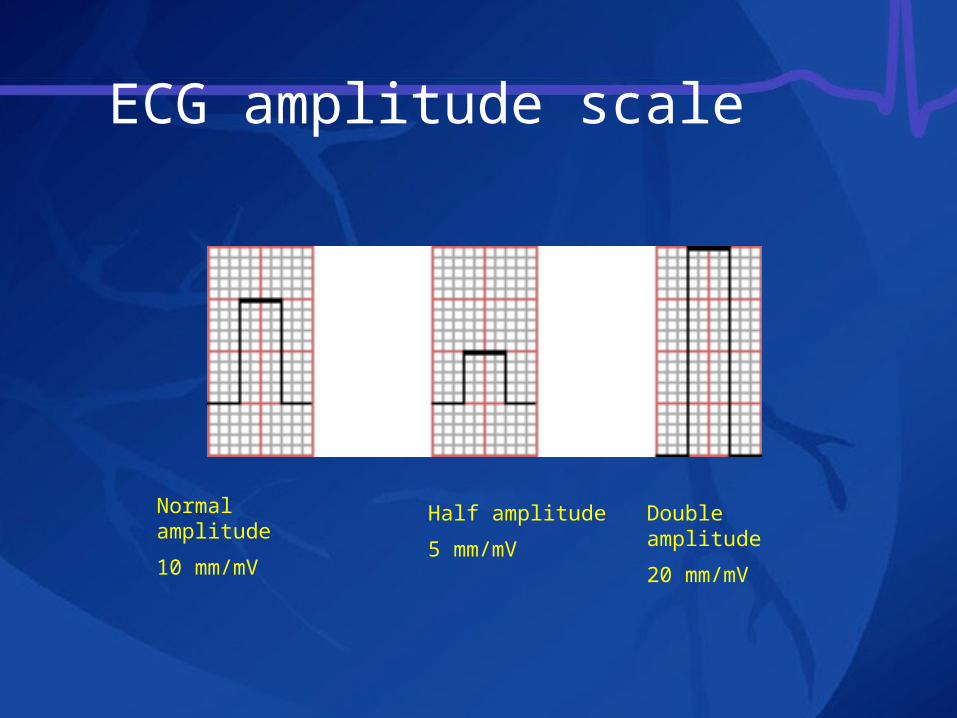
ECG amplitude scale
Normal amplitude10 mm/mV
Half amplitude5 mm/mV
Double amplitude20 mm/mV
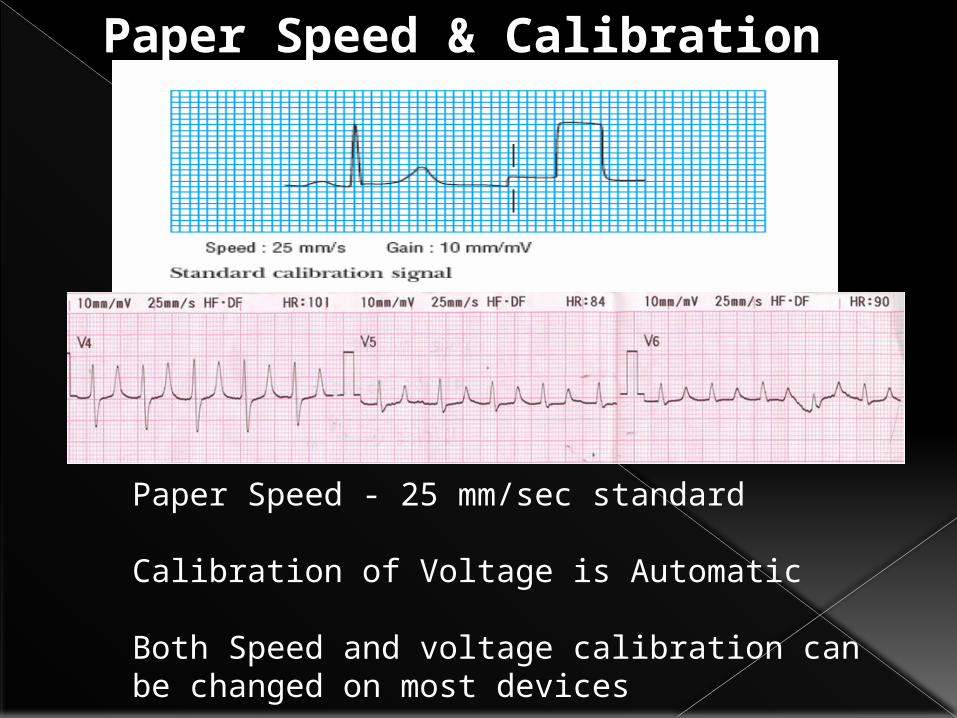
Paper Speed - 25 mm/sec standard
Calibration of Voltage is Automatic
Both Speed and voltage calibration can be changed on most devices
Paper Speed & Calibration
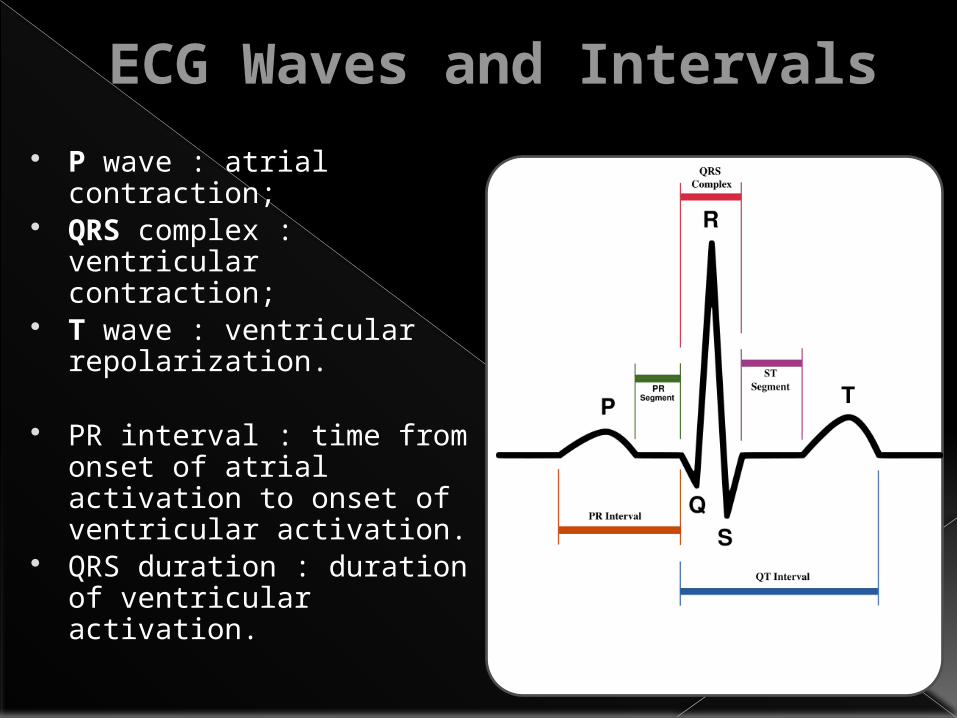
ECG Waves and Intervals P wave : atrial
contraction; QRS complex :
ventricular contraction;
T wave : ventricular repolarization.
PR interval : time from onset of atrial activation to onset of ventricular activation.
QRS duration : duration of ventricular activation.
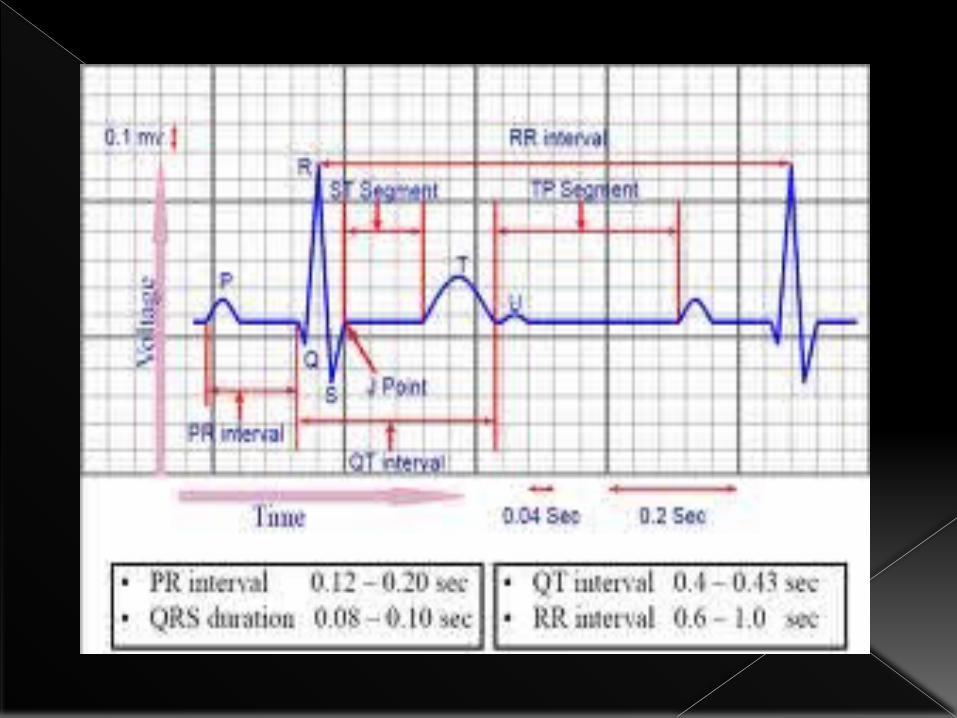
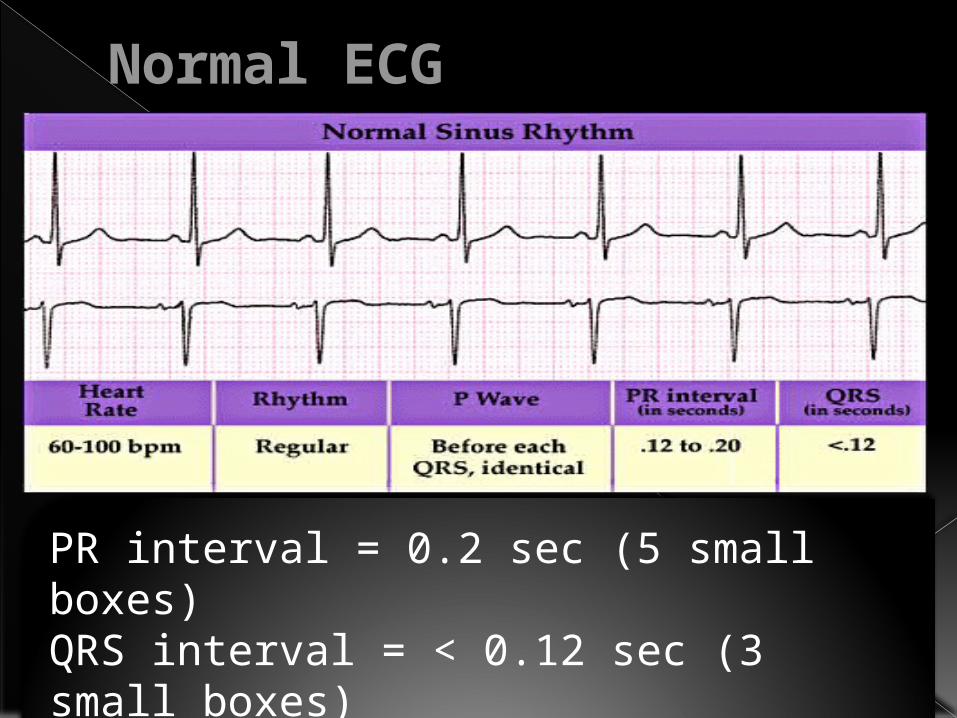
PR interval = 0.2 sec (5 small boxes)QRS interval = < 0.12 sec (3 small boxes)QT interval = 0.42 sec (10 small boxes)
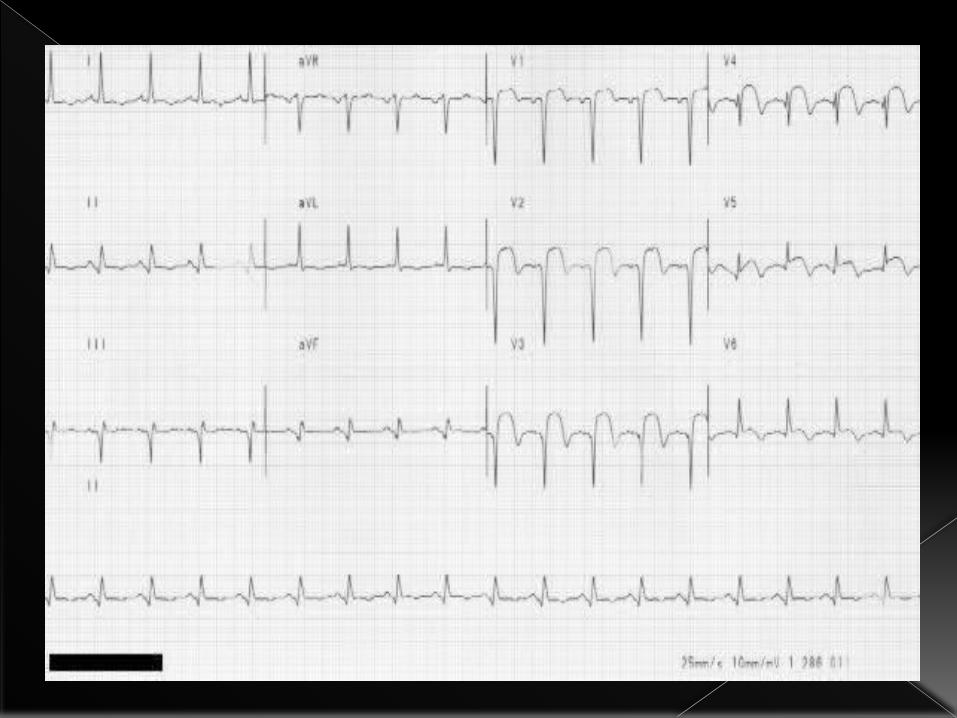
Normal ECG
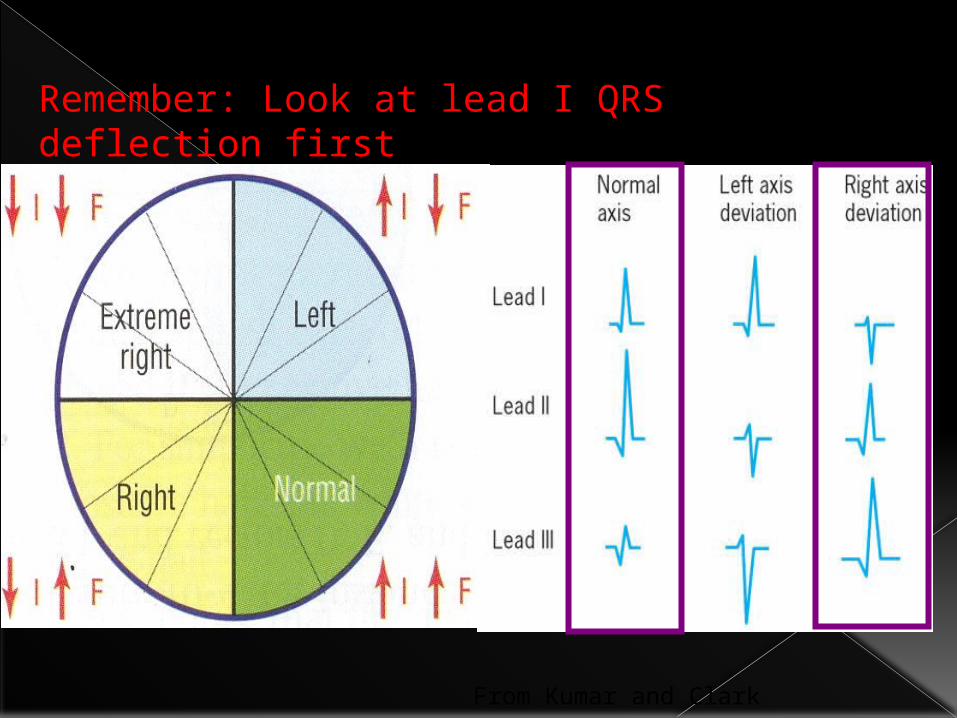
From Kumar and Clark
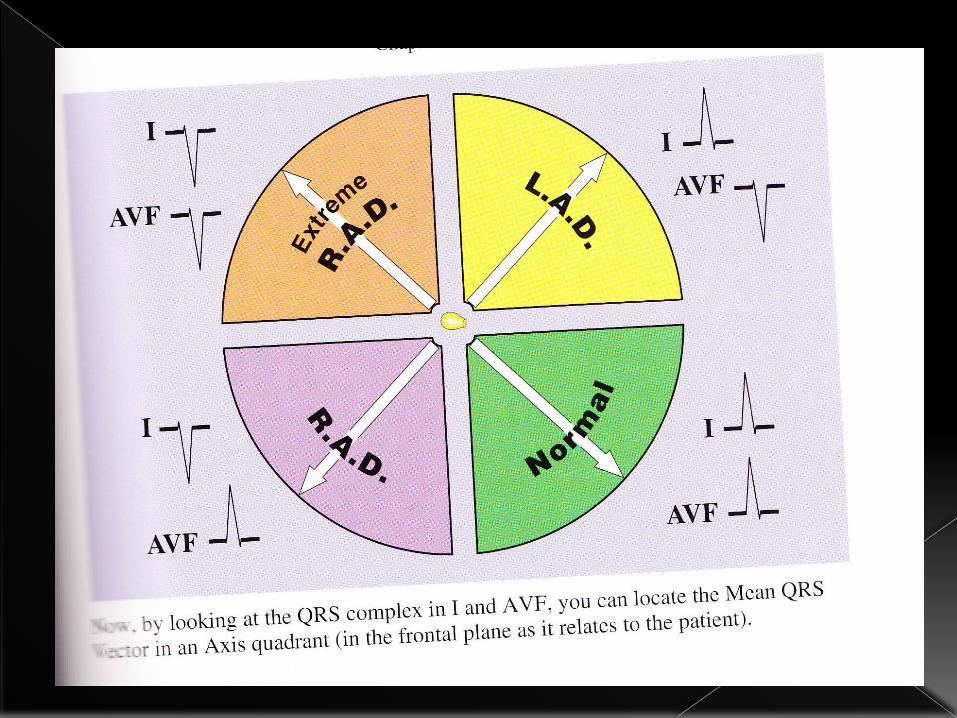
Remember: Look at lead I QRS deflection first
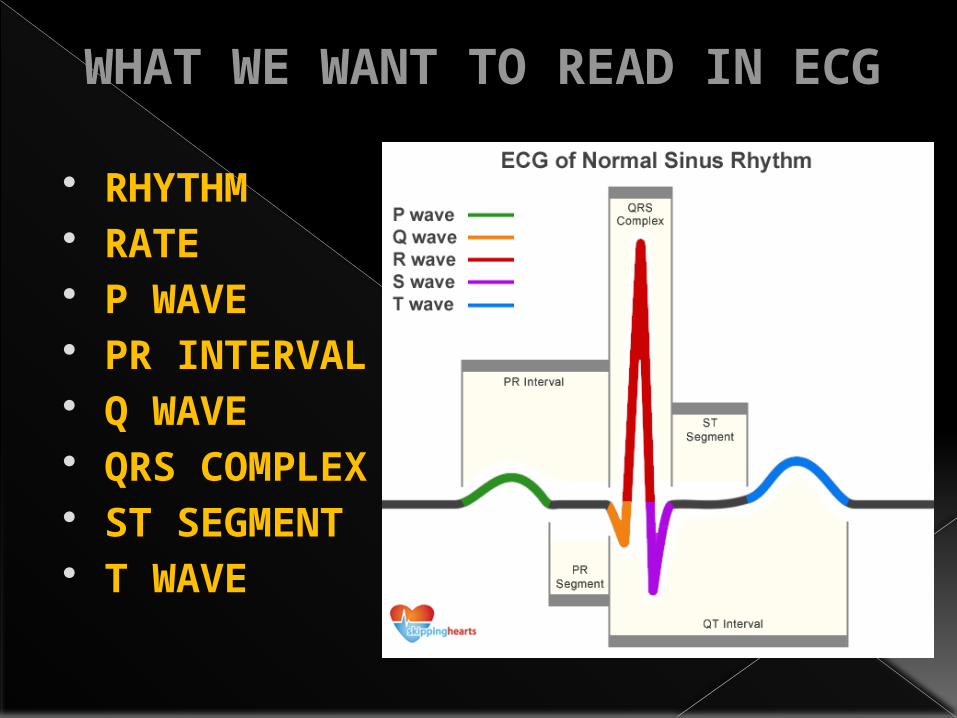
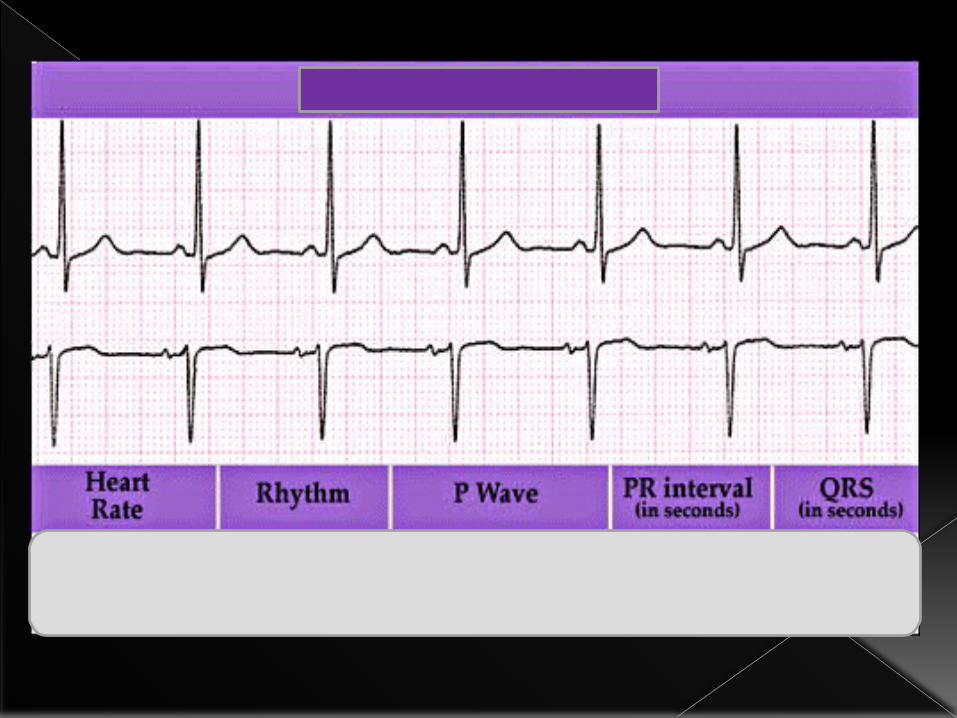
WHAT WE WANT TO READ IN ECG
RHYTHM RATE P WAVE PR INTERVAL Q WAVE QRS COMPLEX ST SEGMENT T WAVE
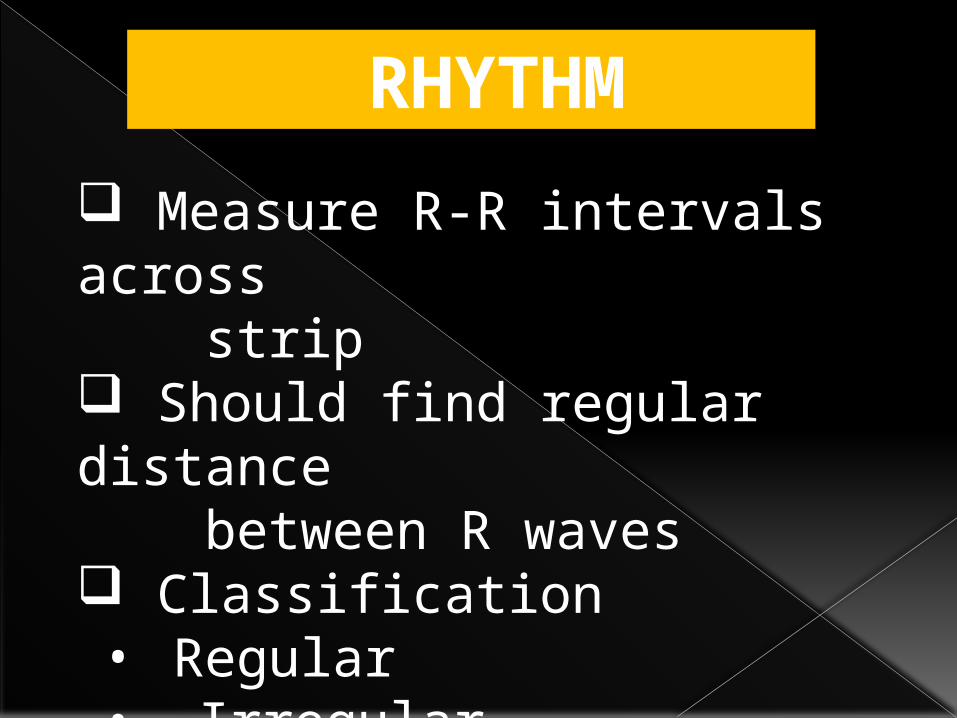
RHYTHM Measure R-R intervals across strip Should find regular distance between R waves Classification• Regular• Irregular
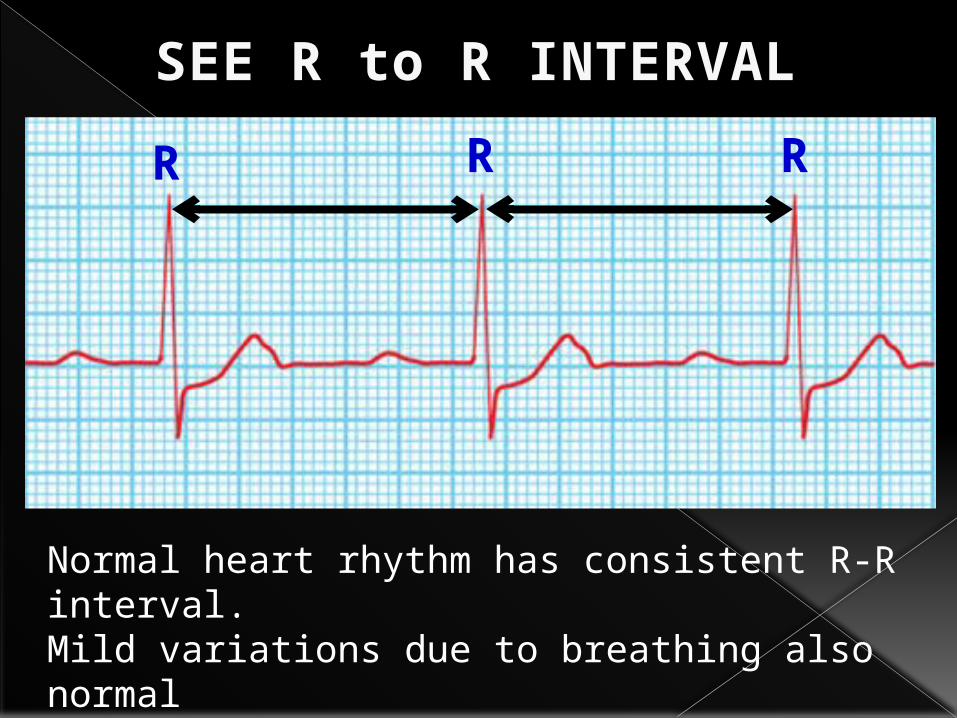
SEE R to R INTERVALR R R
Normal heart rhythm has consistent R-R interval.Mild variations due to breathing also normal
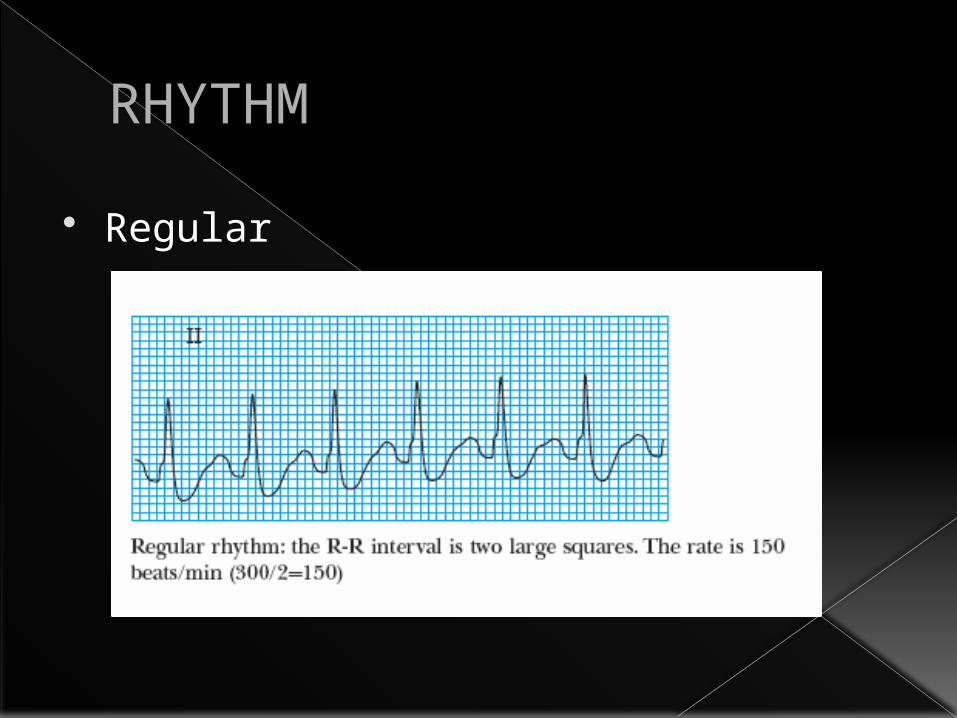
RHYTHM Regular
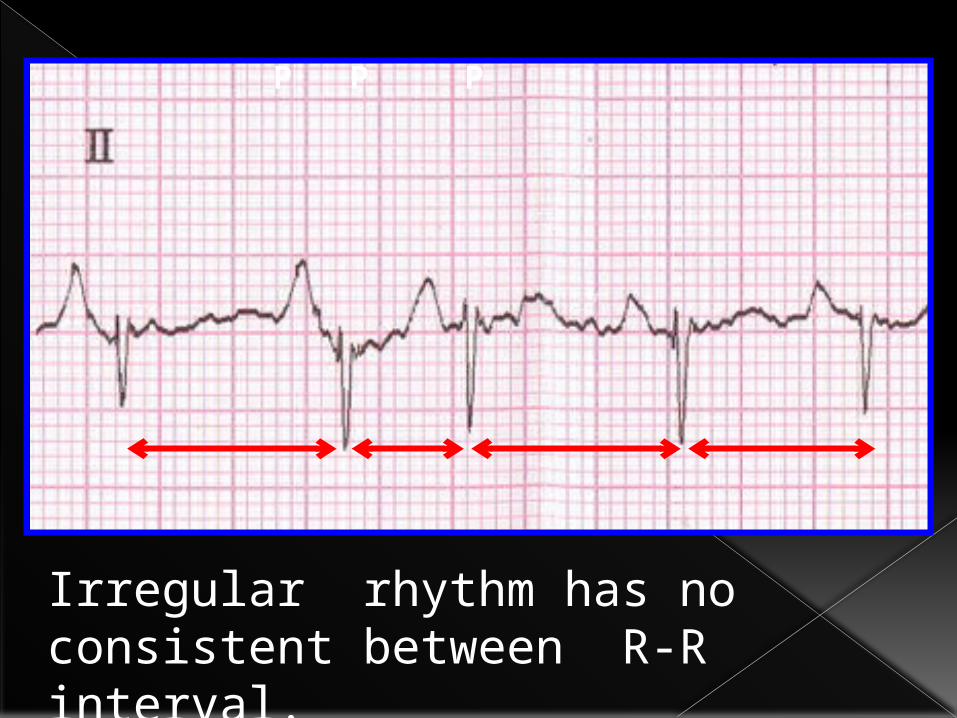
P P P
Irregular rhythm has no consistent between R-R interval.
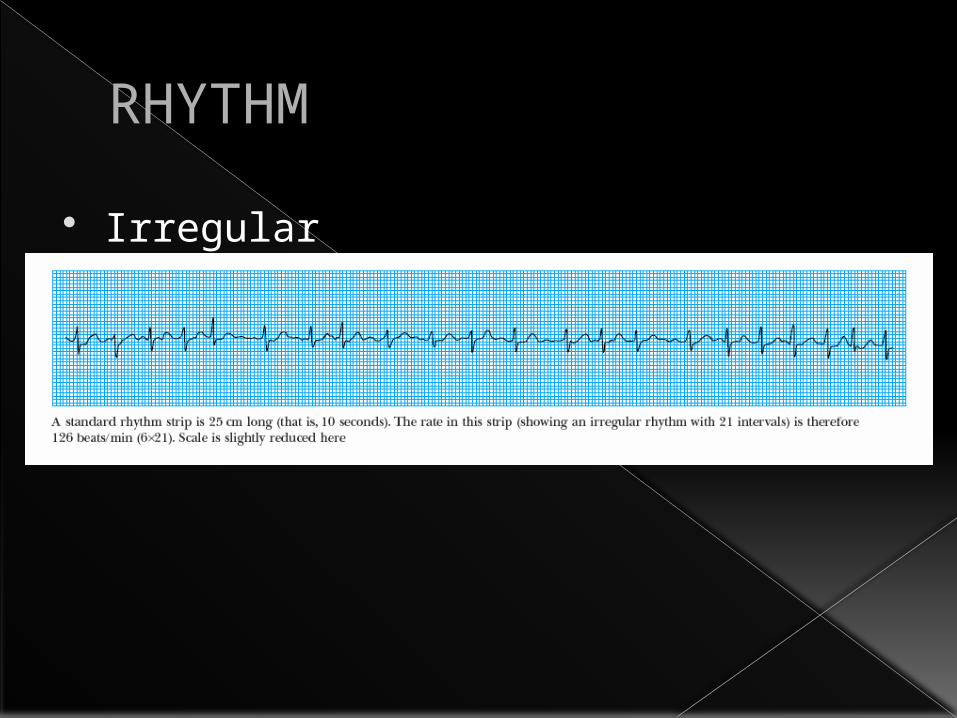
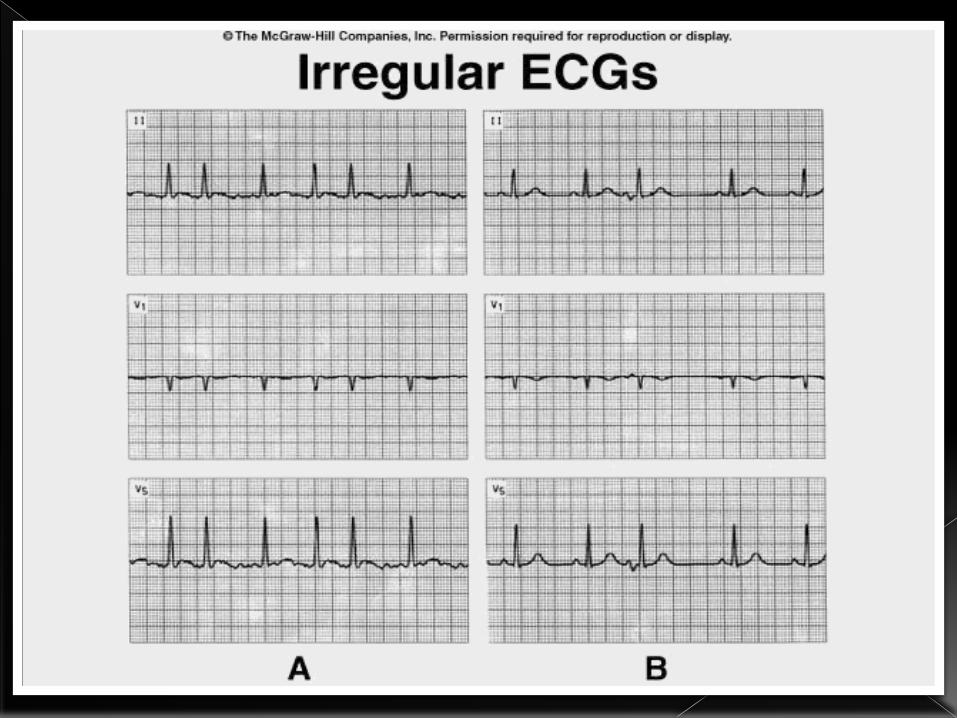
RHYTHM Irregular

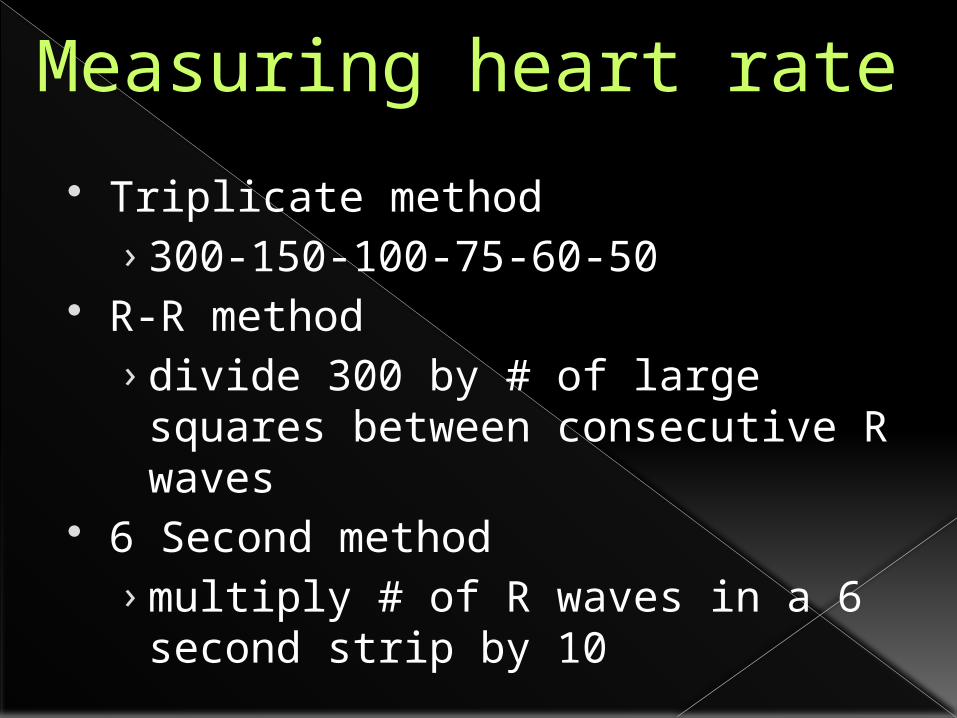
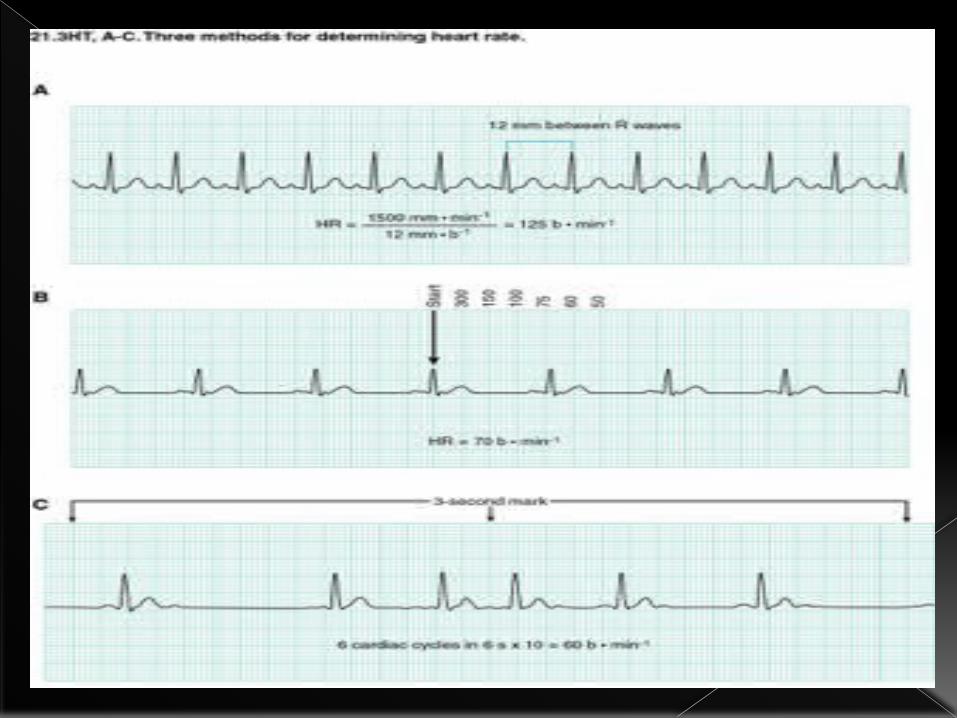
Triplicate method›300-150-100-75-60-50
R-R method›divide 300 by # of large squares between consecutive R waves
6 Second method›multiply # of R waves in a 6 second strip by 10
Measuring heart rate
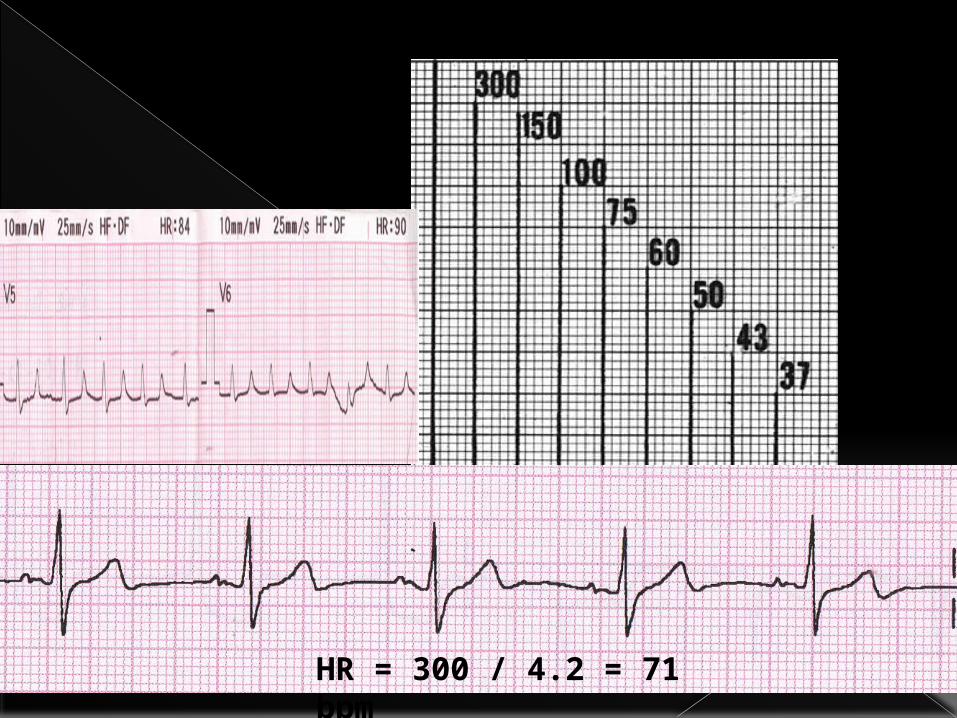
HR = 300 / 4.2 = 71 bpm
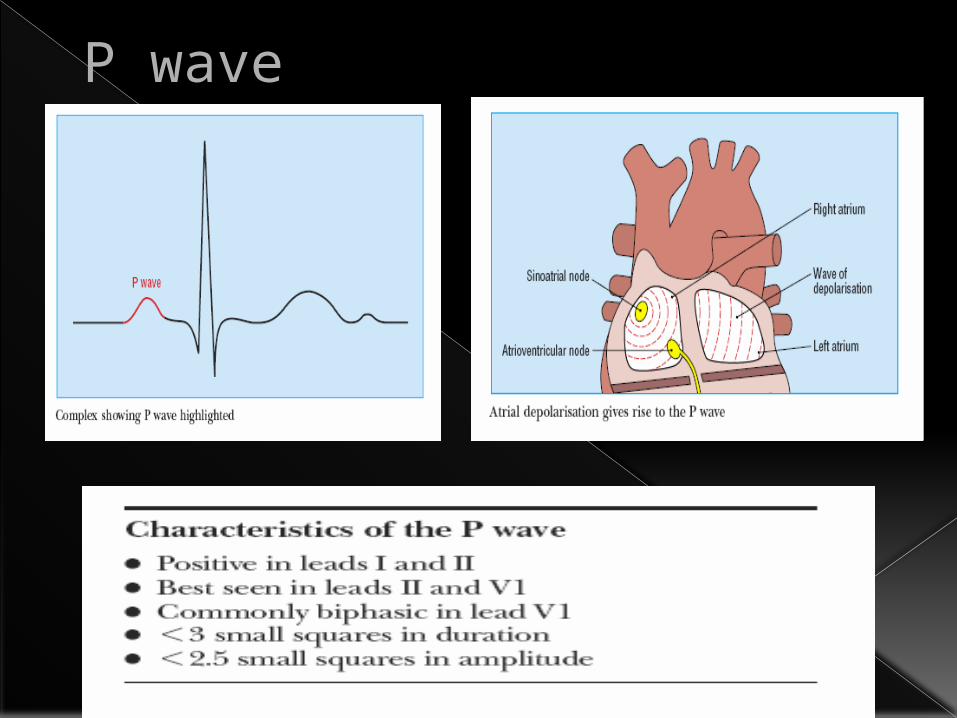
P wave
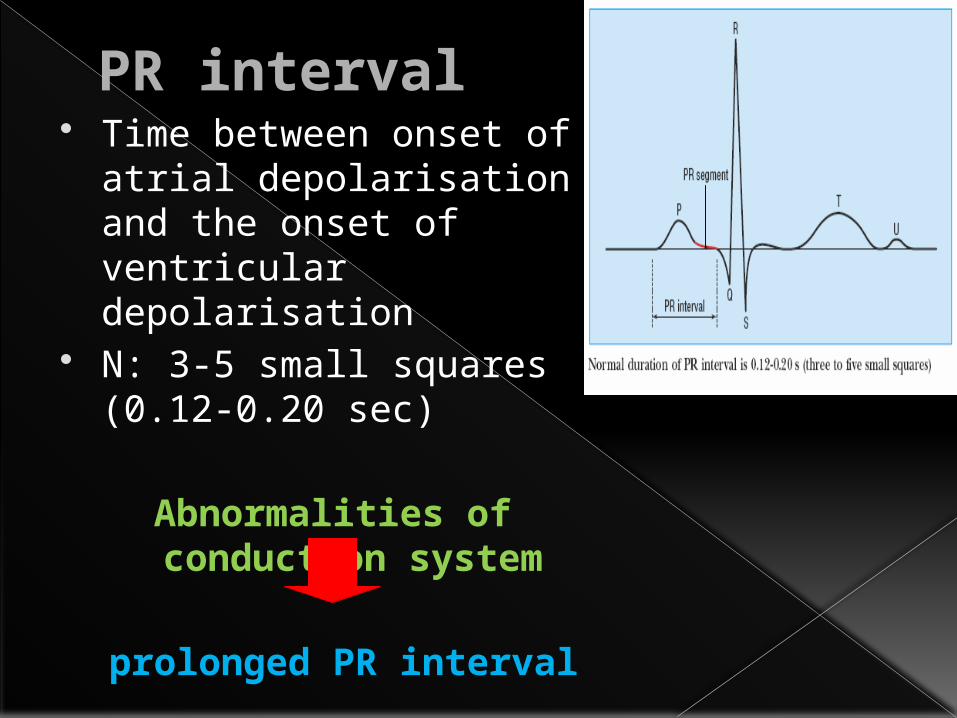
PR interval Time between onset of atrial depolarisation and the onset of ventricular depolarisation
N: 3-5 small squares (0.12-0.20 sec)
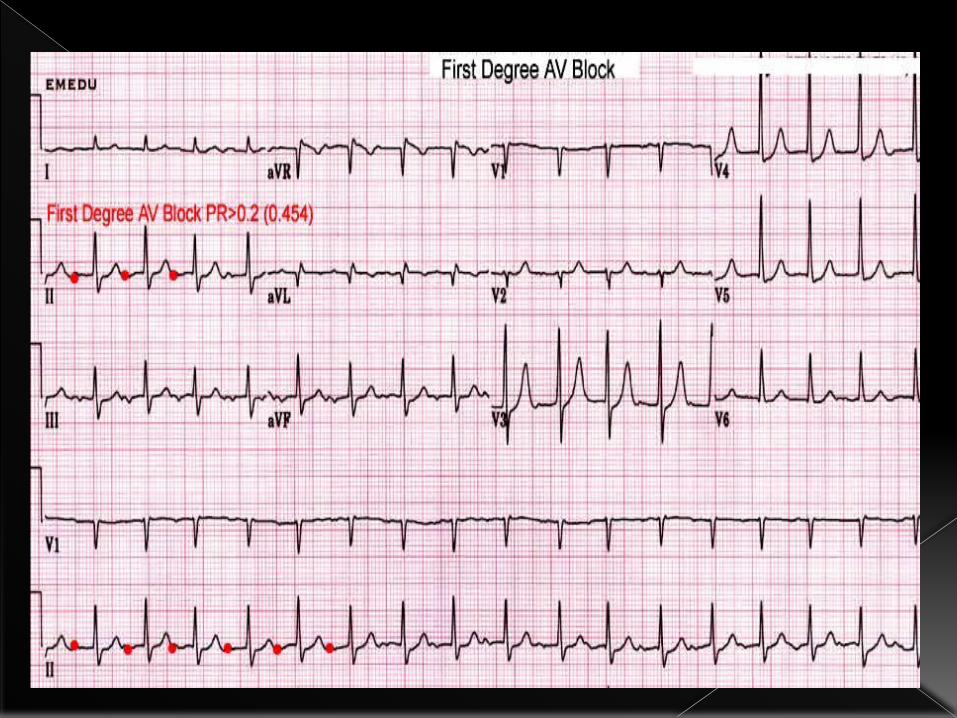
Abnormalities of conduction system
prolonged PR interval
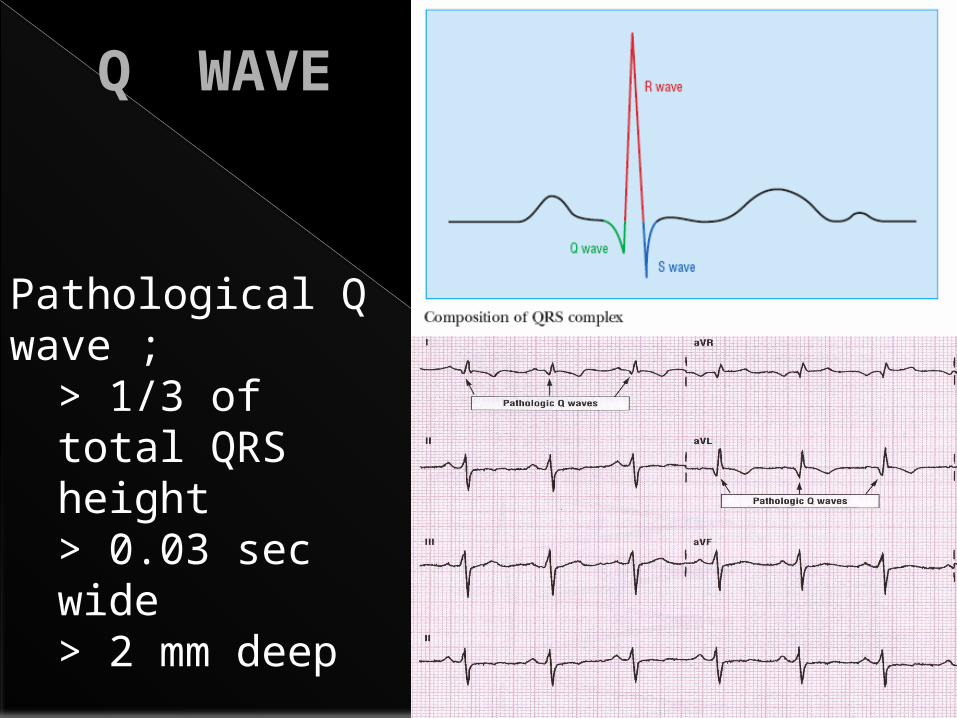
Q WAVE
Pathological Q wave ; > 1/3 of total QRS height> 0.03 sec wide> 2 mm deep
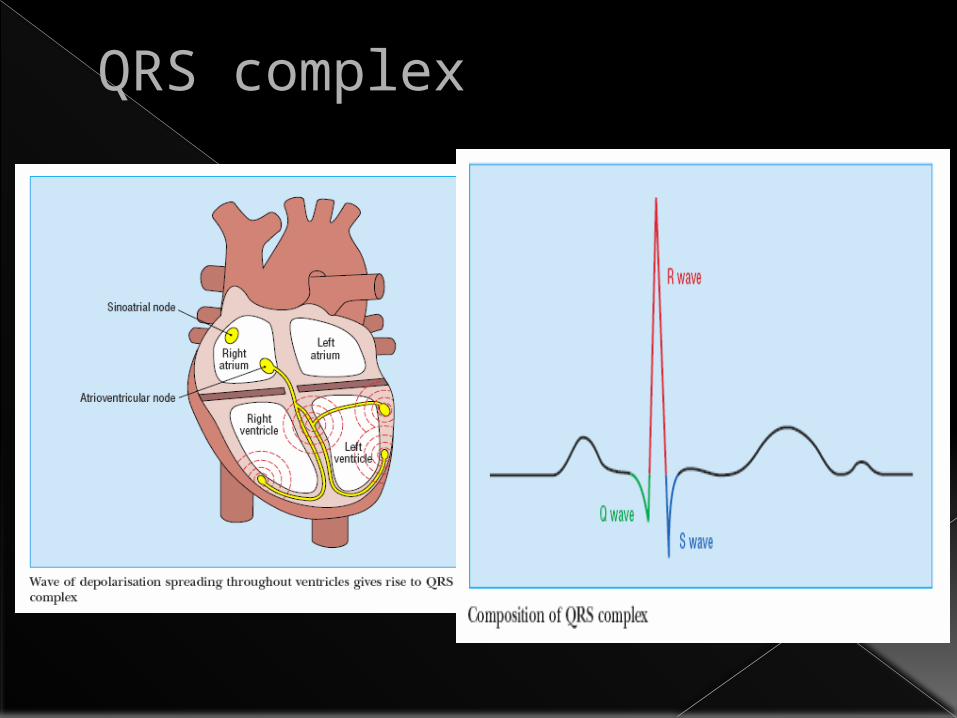
QRS complex
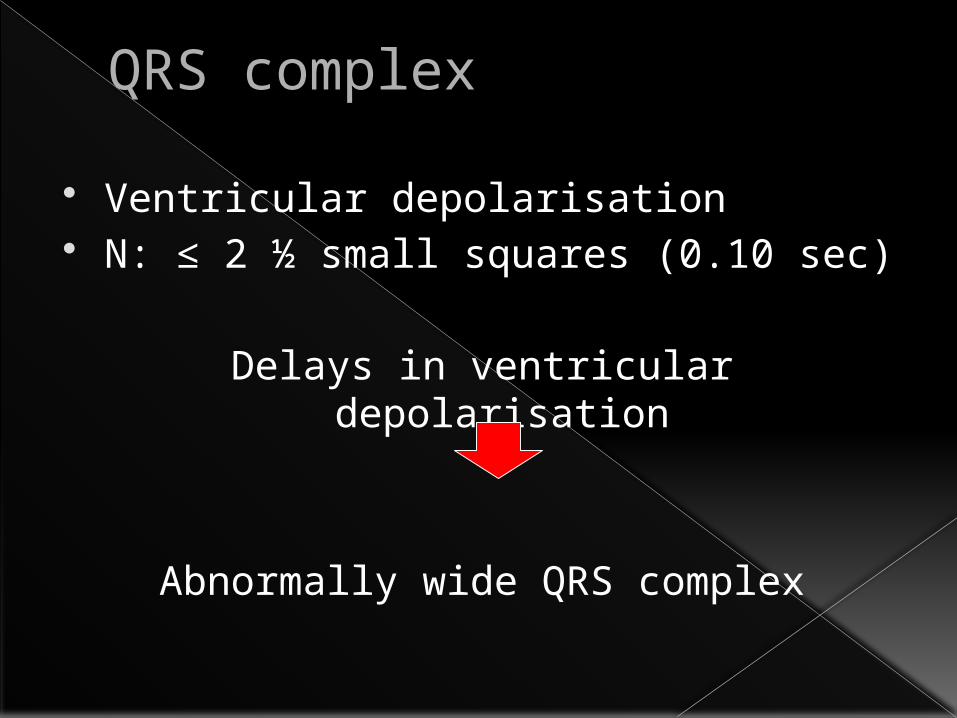
QRS complex
Ventricular depolarisation N: ≤ 2 ½ small squares (0.10 sec)
Delays in ventricular depolarisation
Abnormally wide QRS complex
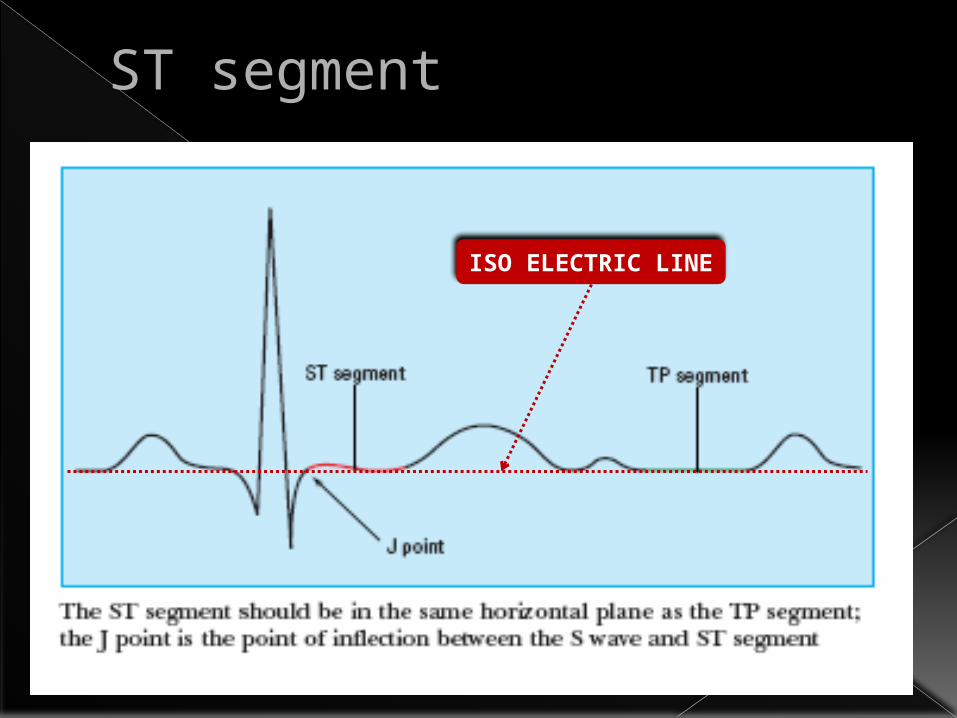
ST segment
ISO ELECTRIC LINE
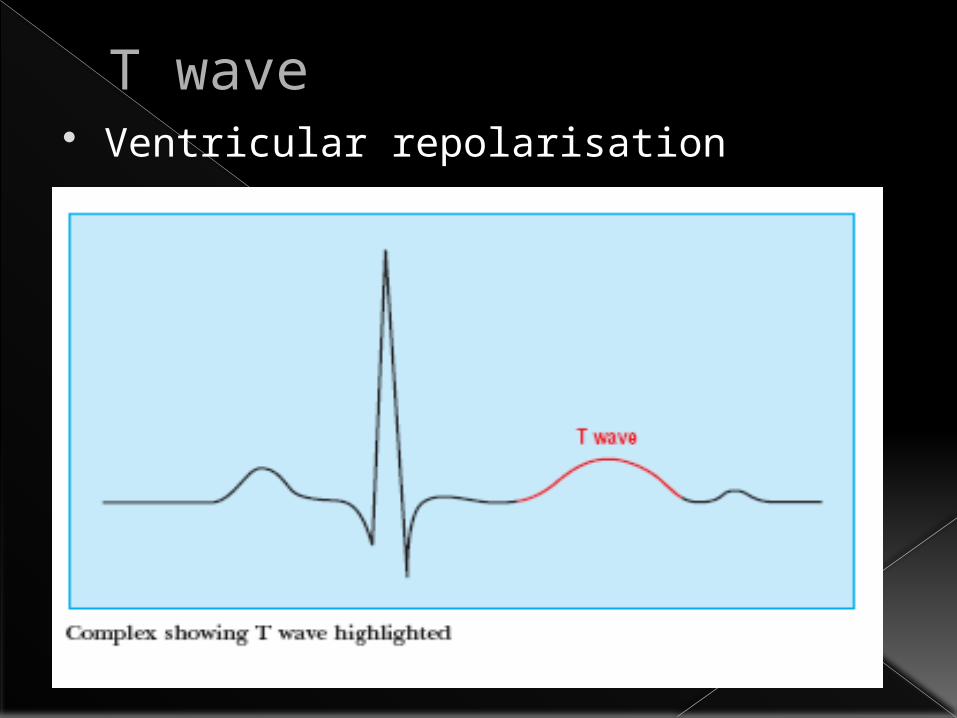
T wave Ventricular repolarisation
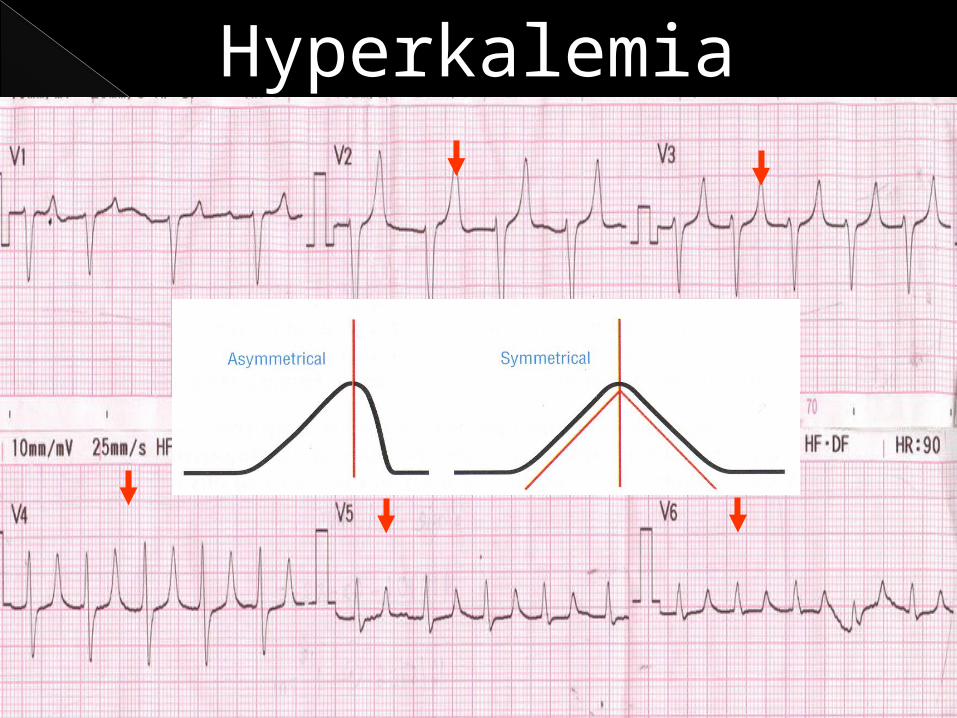
Hyperkalemia
ECGIn Acute Coronary Syndrome
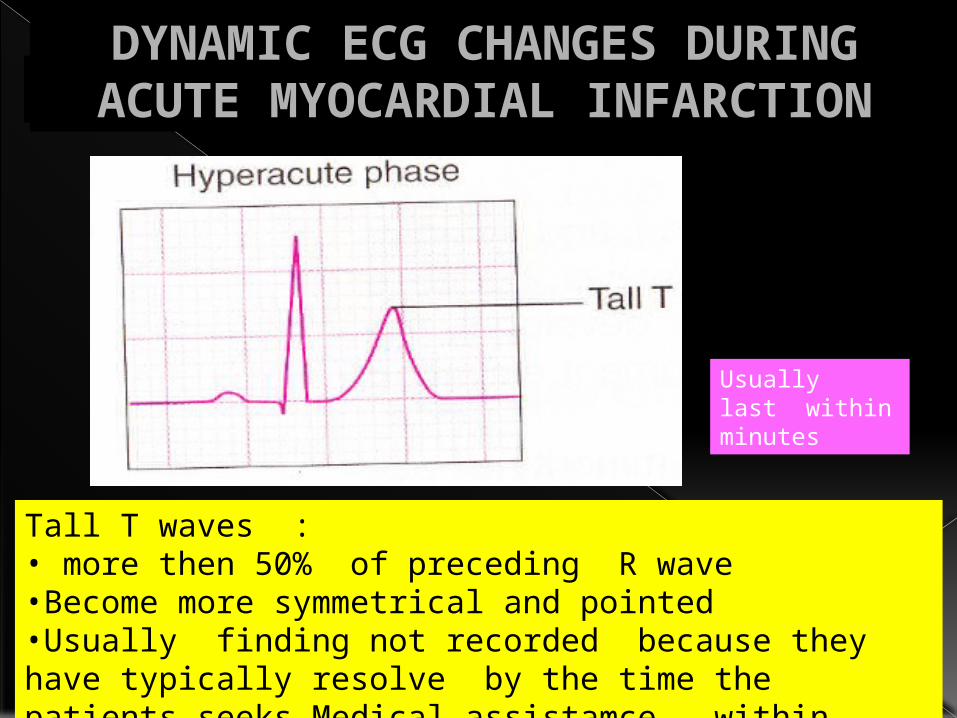
HYPERACUTE PHASE
Tall T waves :• more then 50% of preceding R wave•Become more symmetrical and pointed •Usually finding not recorded because they have typically resolve by the time the patients seeks Medical assistamce – within minutes
Usually last within minutes
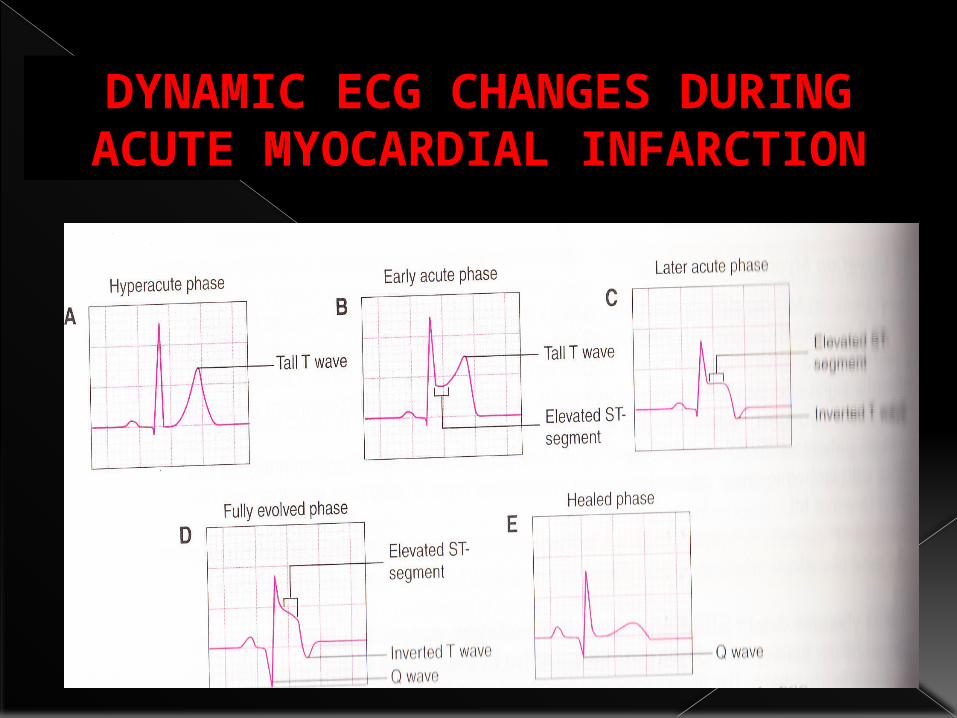
DYNAMIC ECG CHANGES DURING ACUTE MYOCARDIAL INFARCTION
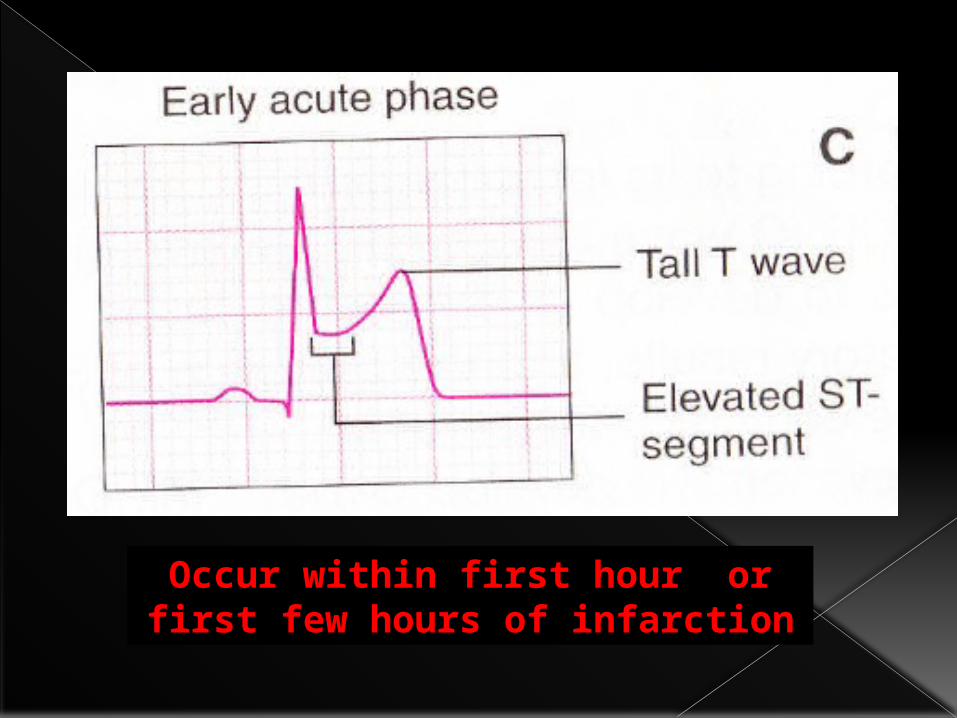
Occur within first hour or first few hours of infarction
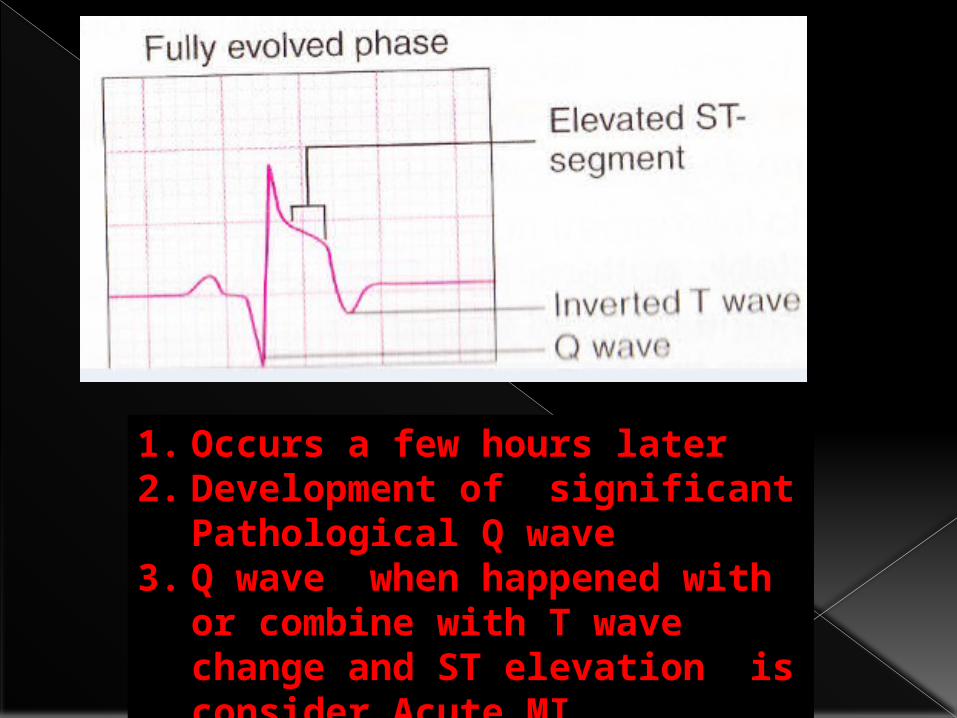
1. Occurs a few hours later2. Development of significant
Pathological Q wave3. Q wave when happened with
or combine with T wave change and ST elevation is consider Acute MI
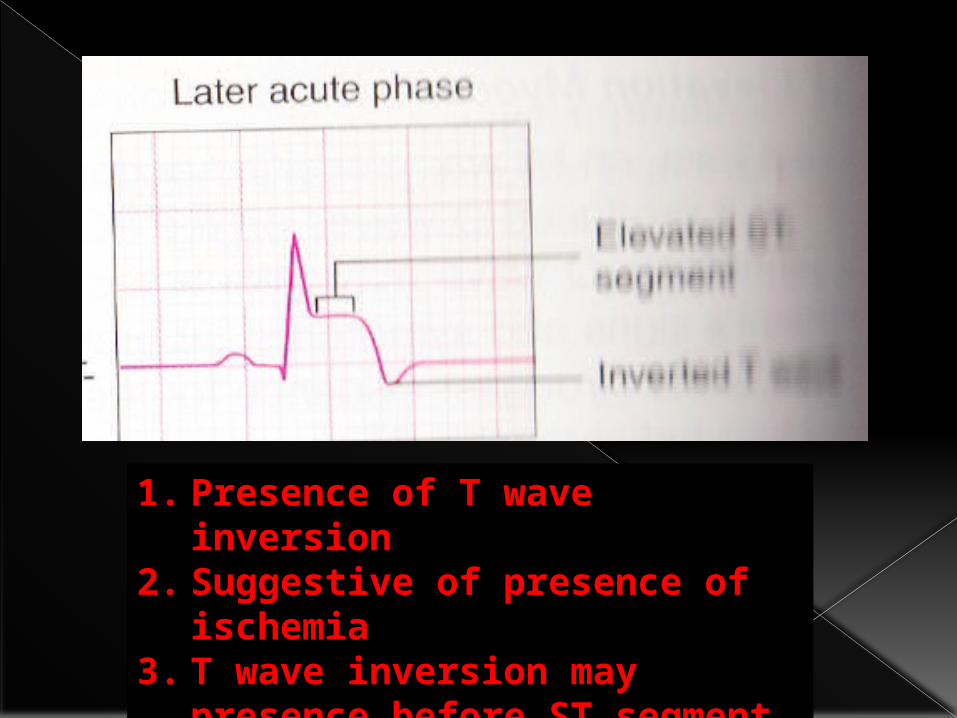
1. Presence of T wave inversion
2. Suggestive of presence of ischemia
3. T wave inversion may presence before ST segment elevation or may occur at the same time
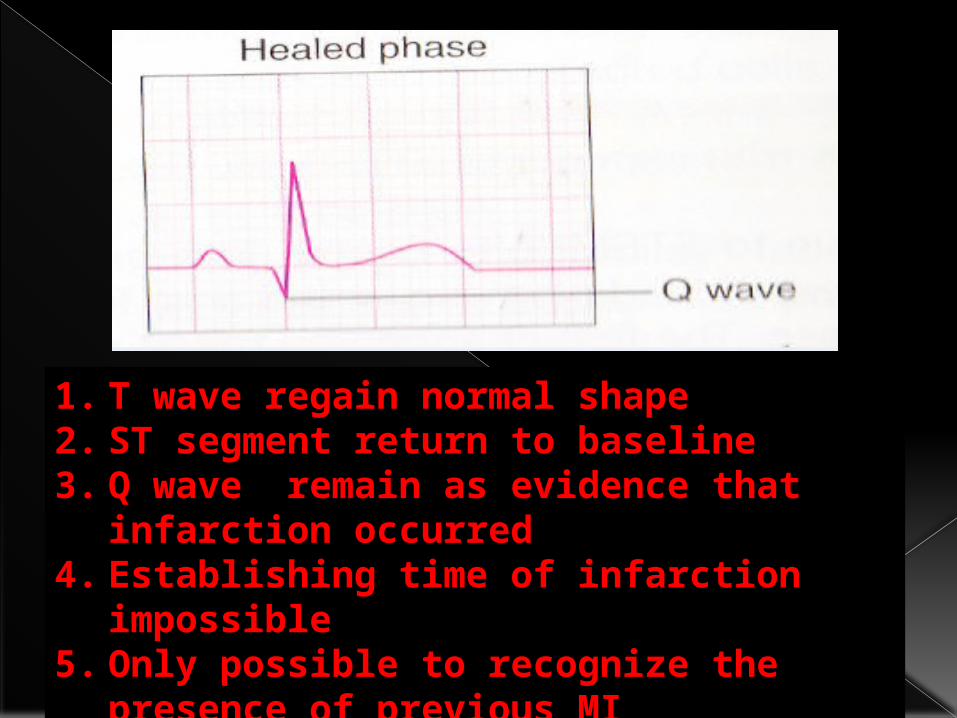
1. T wave regain normal shape2. ST segment return to baseline3. Q wave remain as evidence that
infarction occurred4. Establishing time of infarction
impossible5. Only possible to recognize the
presence of previous MI
DYNAMIC ECG CHANGES DURING ACUTE MYOCARDIAL INFARCTION
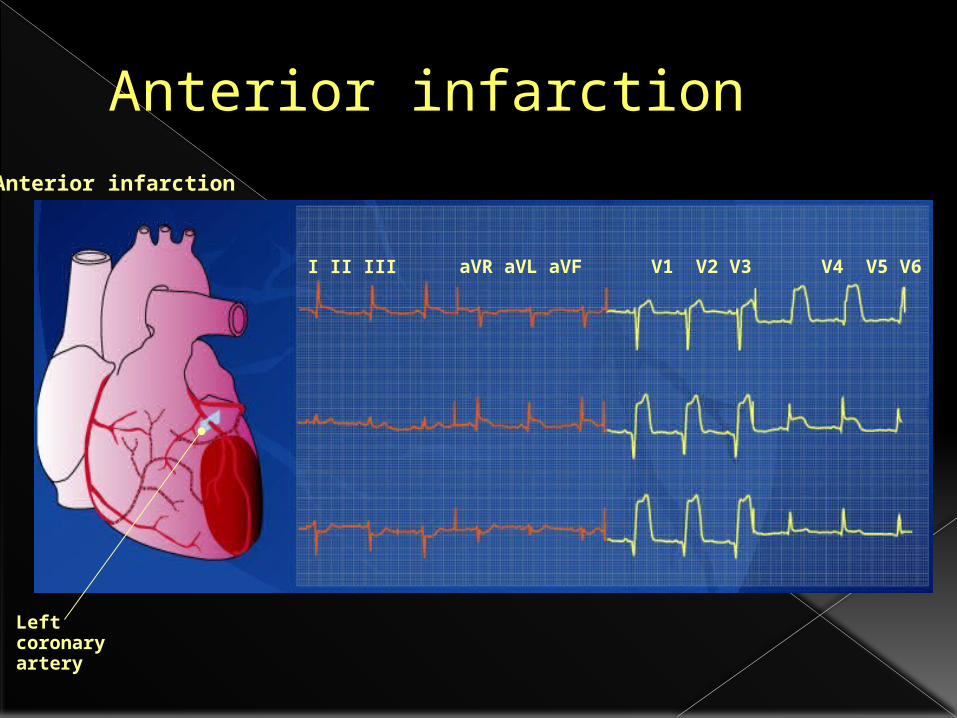
Anterior infarctionAnterior infarction
I II III aVR aVL aVF V1 V2 V3 V4 V5 V6
Left coronary artery
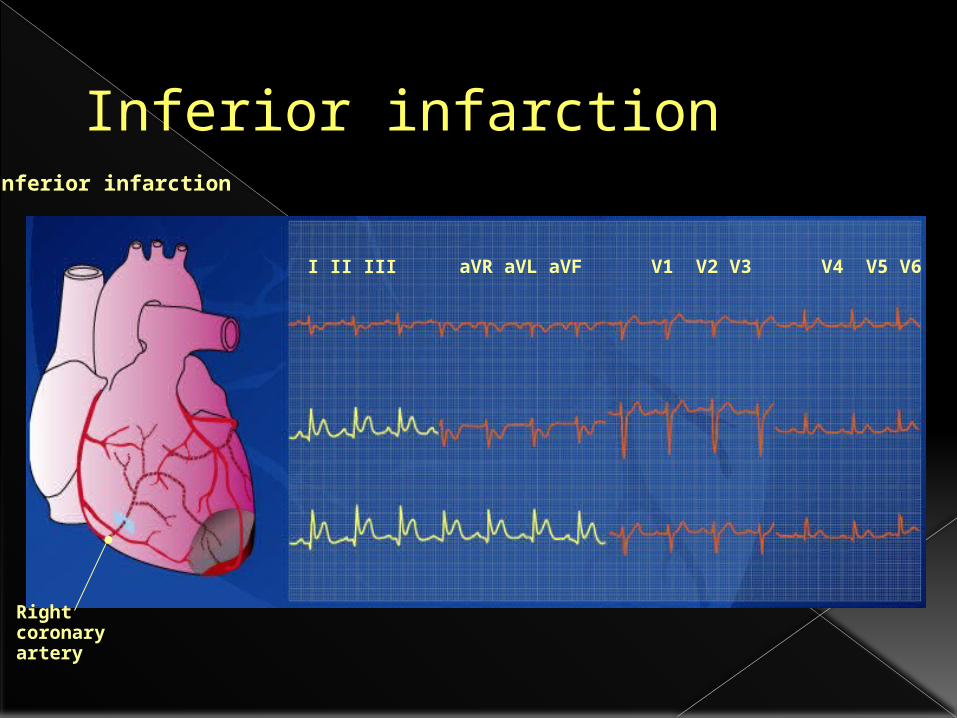
Inferior infarctionInferior infarction
I II III aVR aVL aVF V1 V2 V3 V4 V5 V6
Right coronary artery
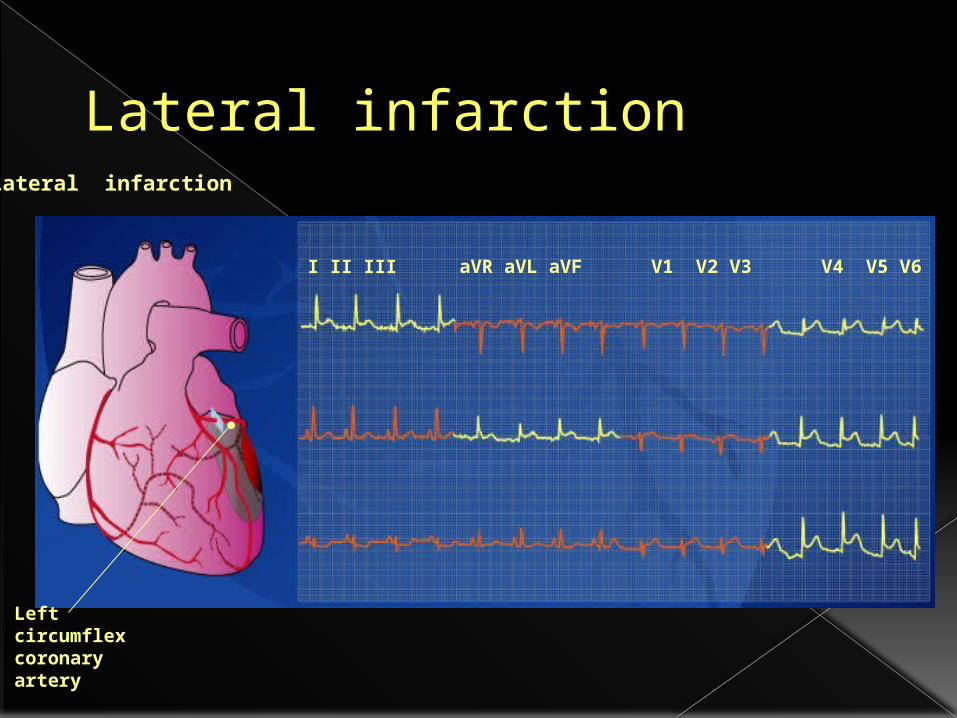
Lateral infarctionLateral infarction
I II III aVR aVL aVF V1 V2 V3 V4 V5 V6
Left circumflexcoronary artery
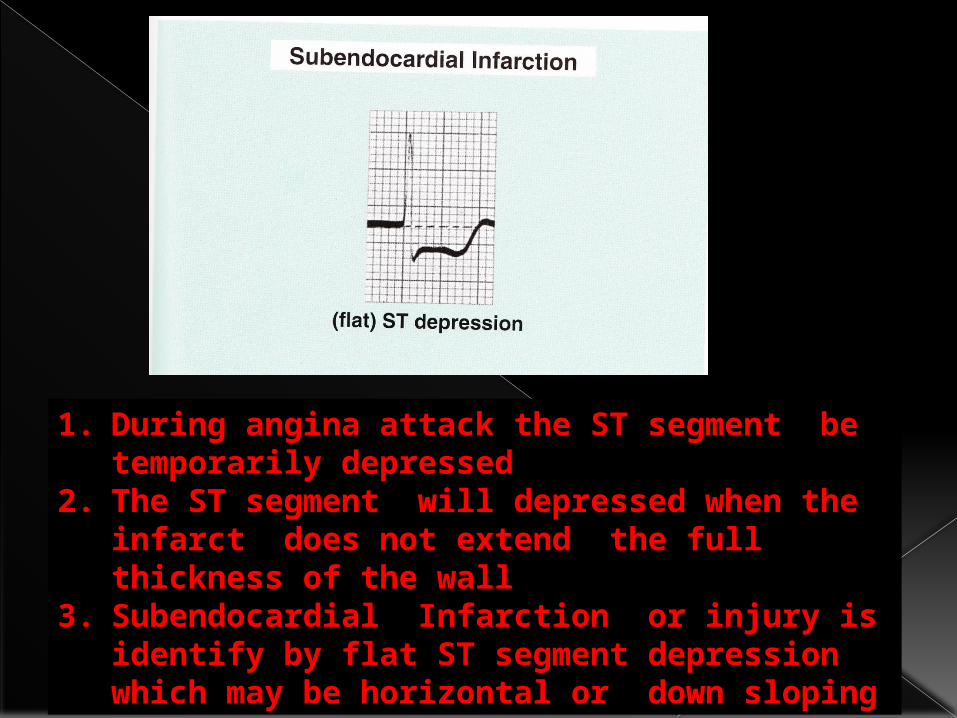
1. During angina attack the ST segment be temporarily depressed
2. The ST segment will depressed when the infarct does not extend the full thickness of the wall
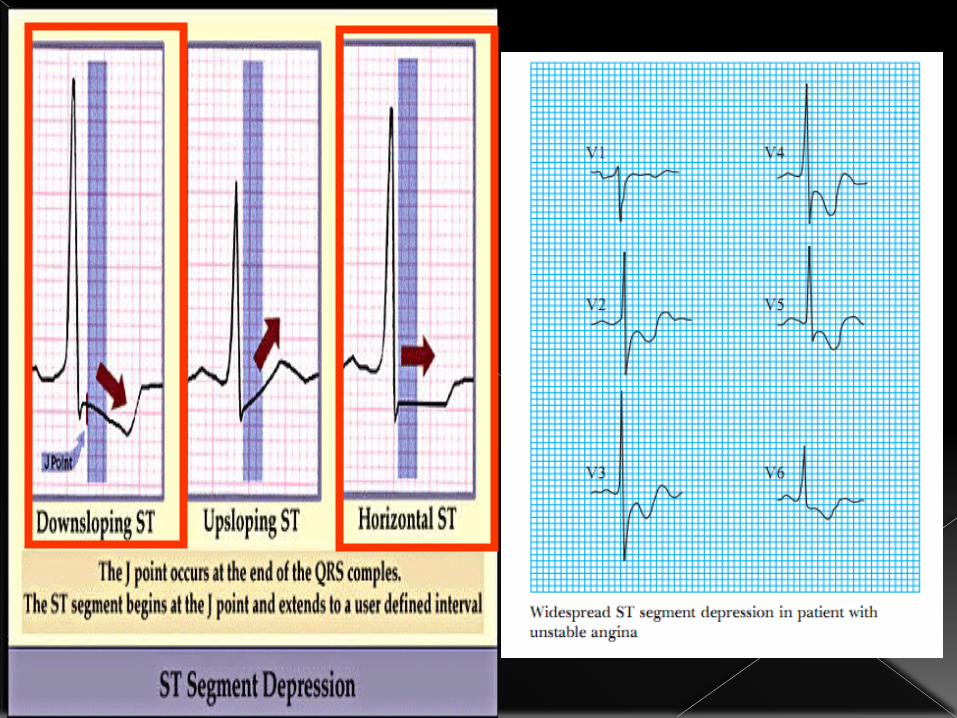
3. Subendocardial Infarction or injury is identify by flat ST segment depression which may be horizontal or down sloping
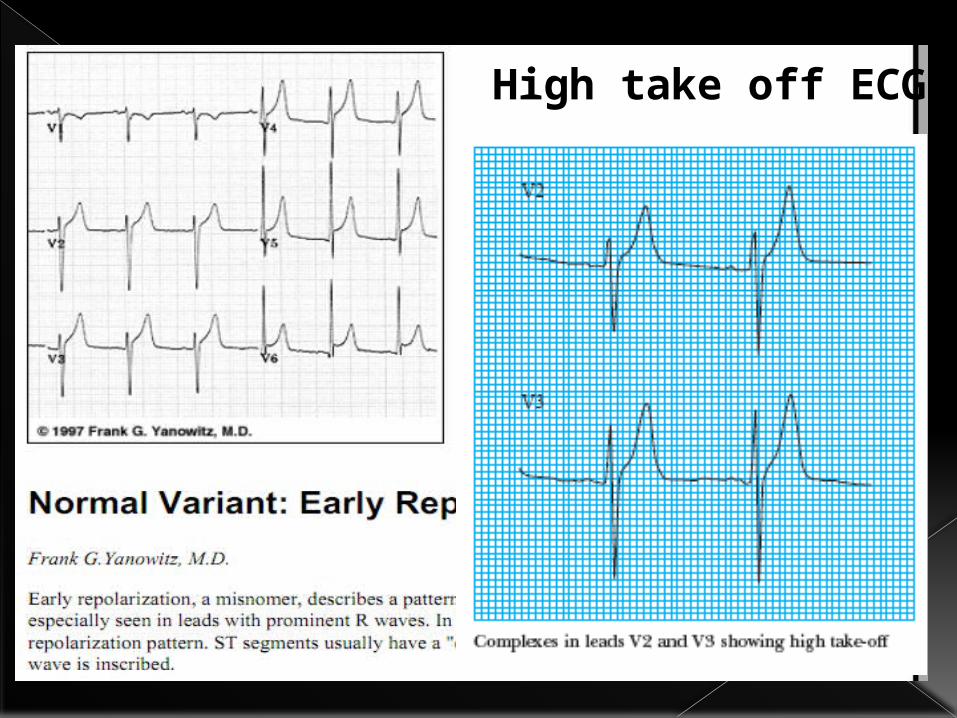
High take off ECG
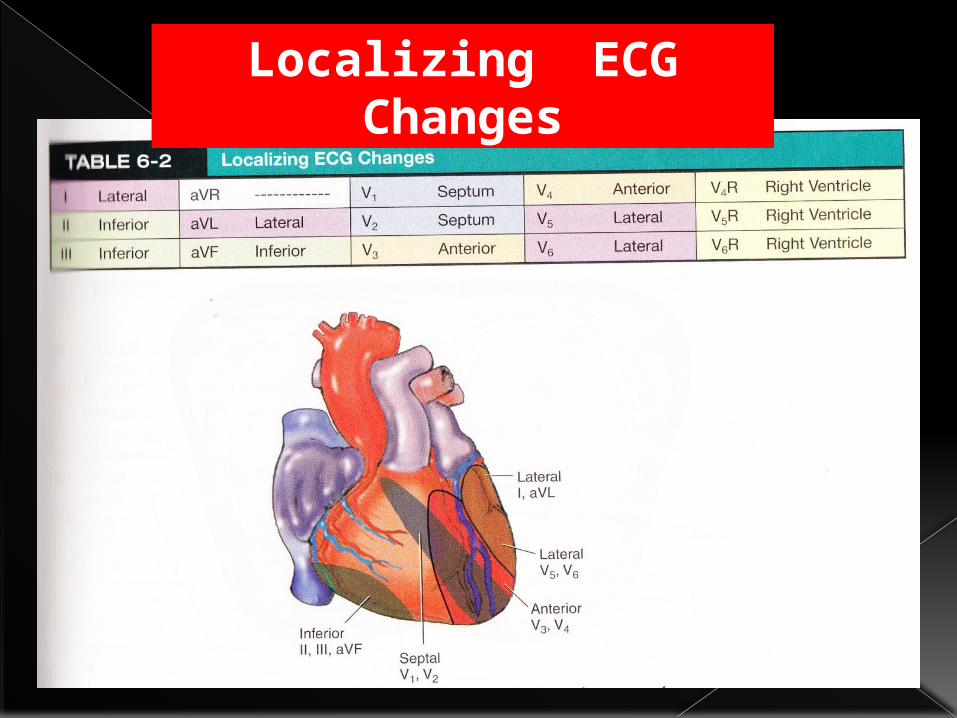
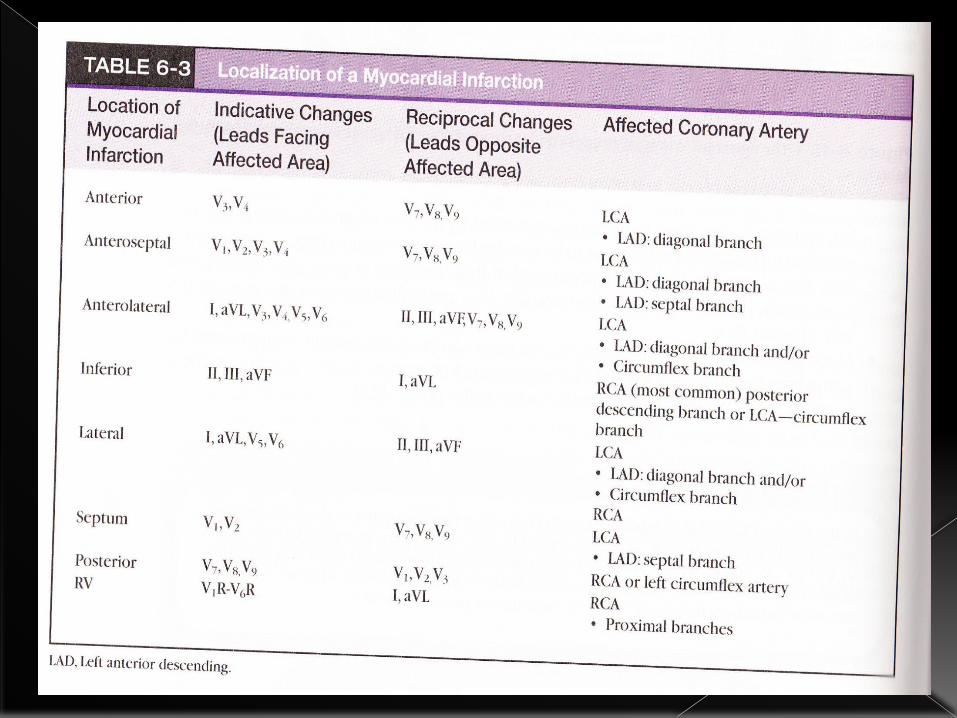
Localizing ECG Changes

Criteria In ECG
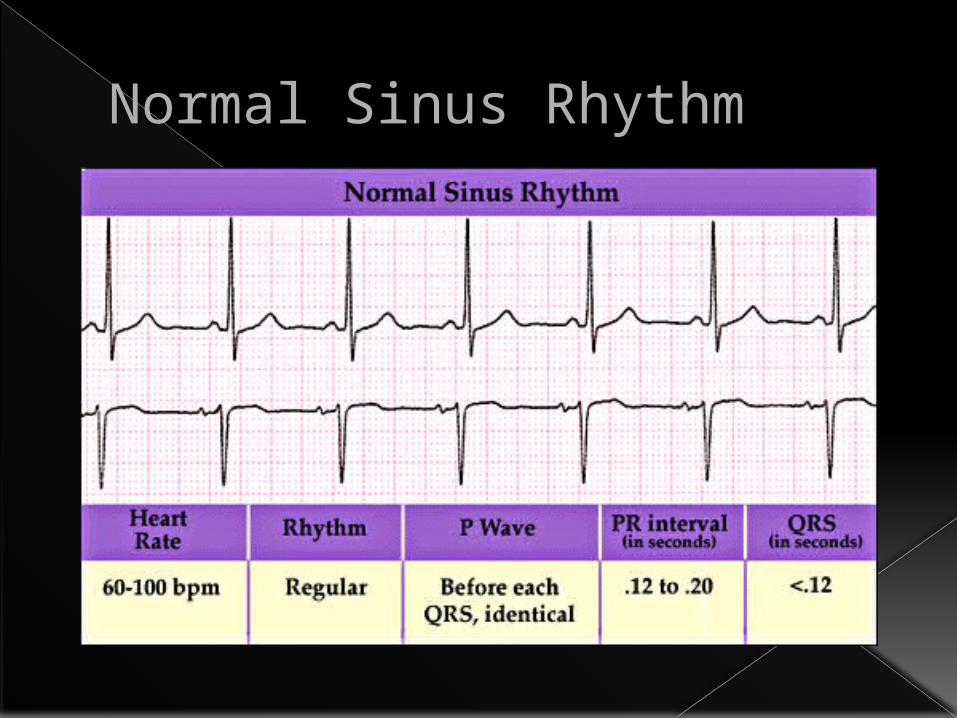
Normal Sinus Rhythm
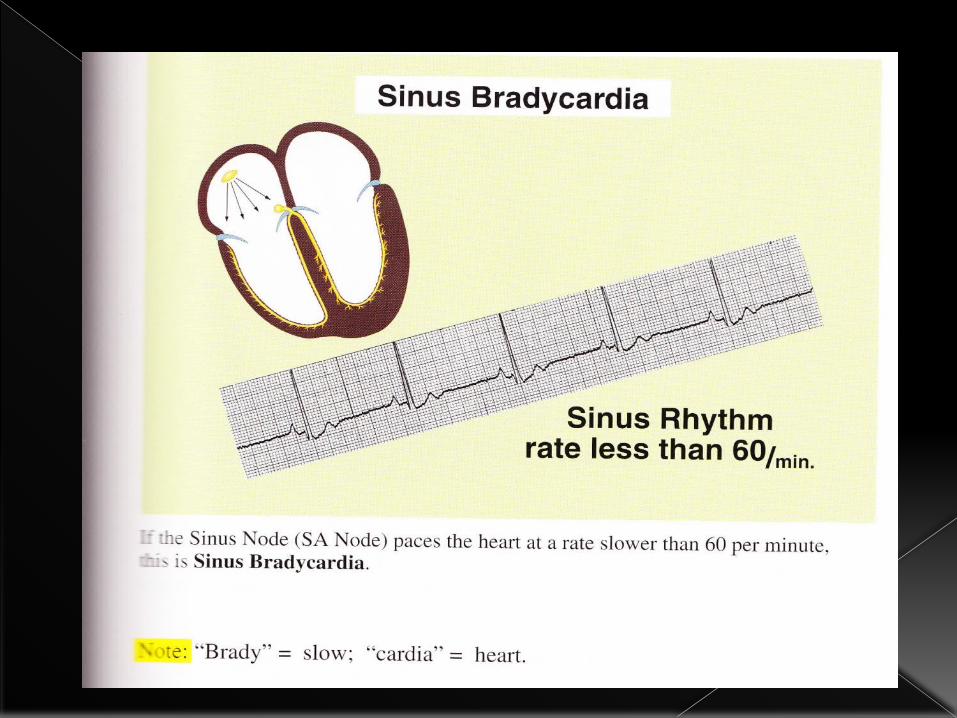
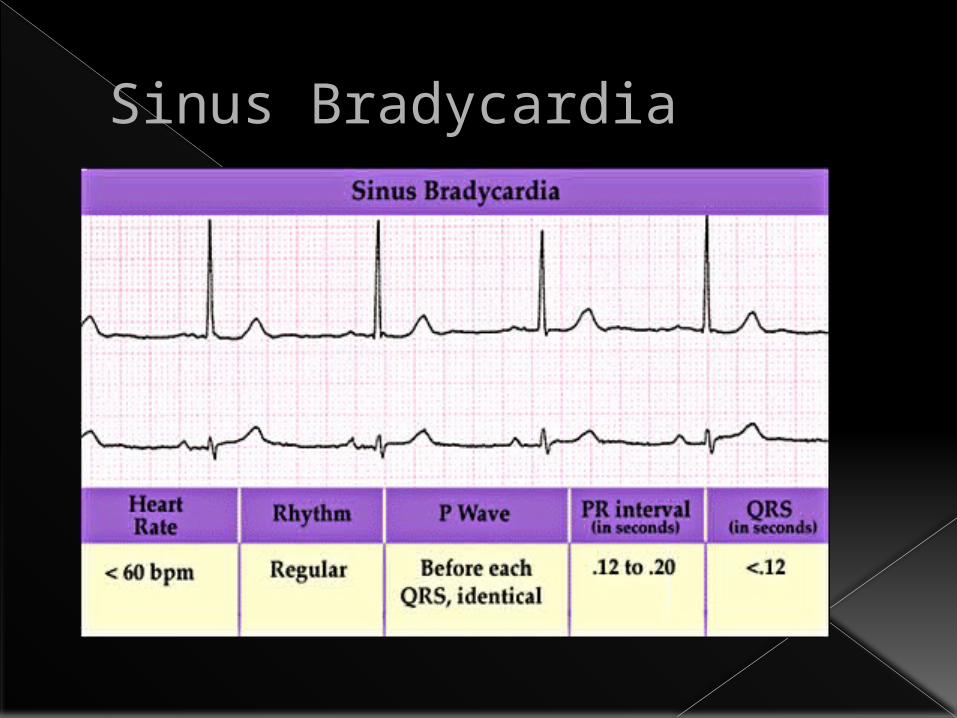
Sinus Bradycardia
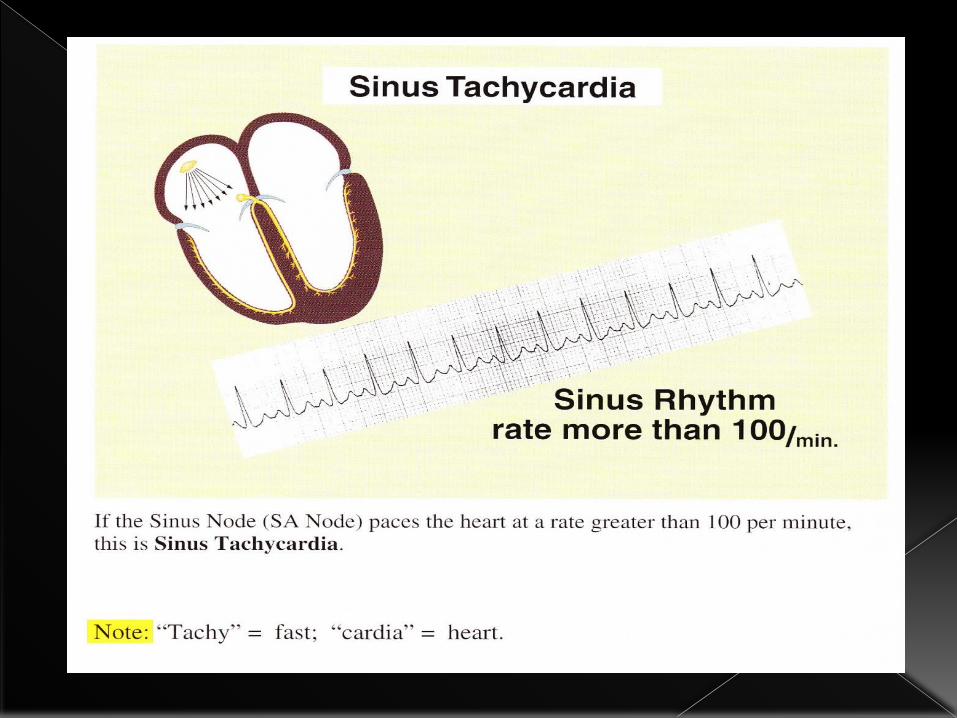
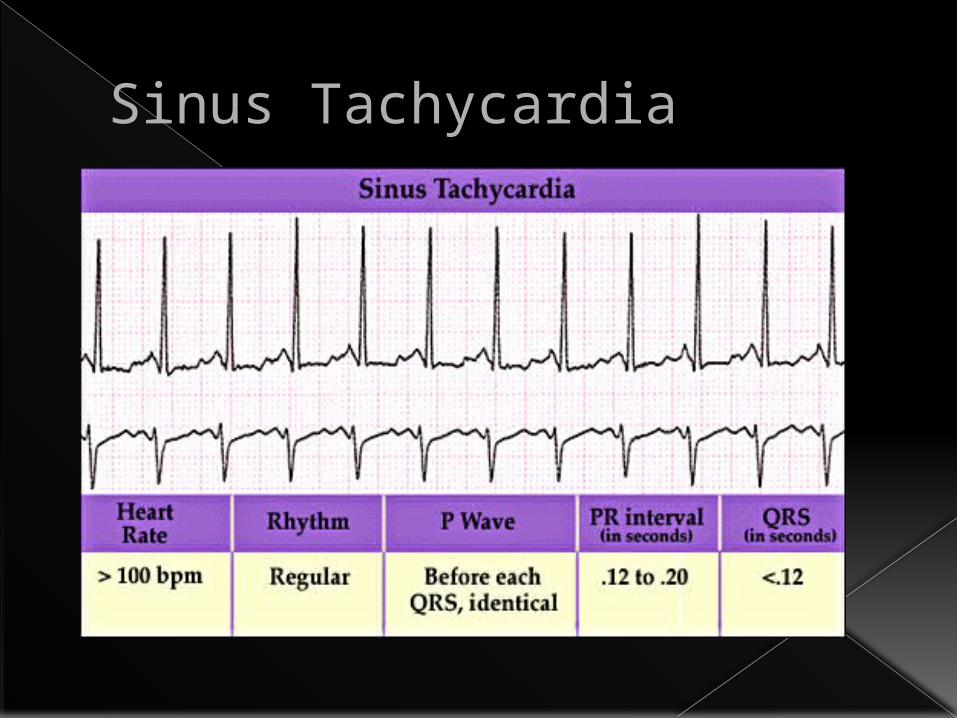
Sinus Tachycardia
Atrial Tachycardia& fibrillation
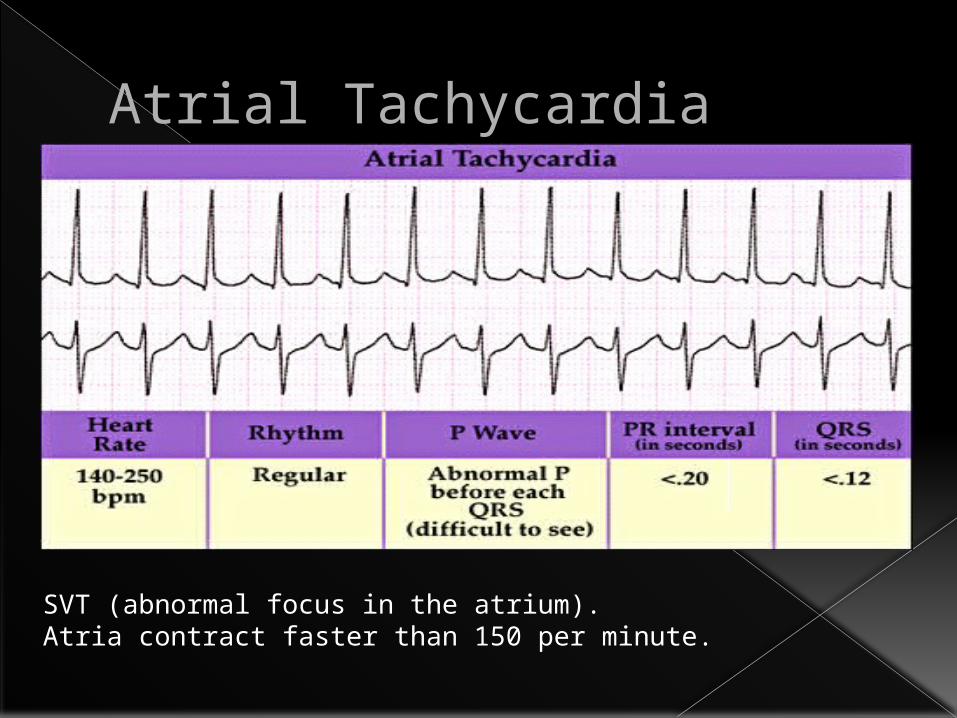
Atrial Tachycardia
SVT (abnormal focus in the atrium).Atria contract faster than 150 per minute.

Atrial Flutter With Variable AV Block
P waves seen at 300 per min – ‘saw-tooth’ appearance.
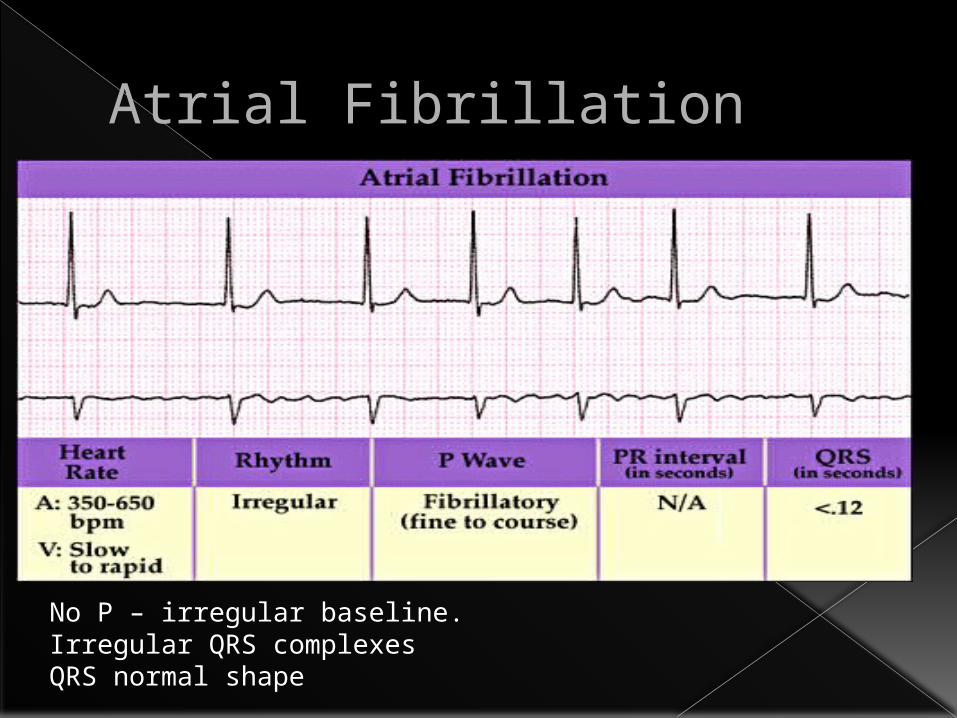
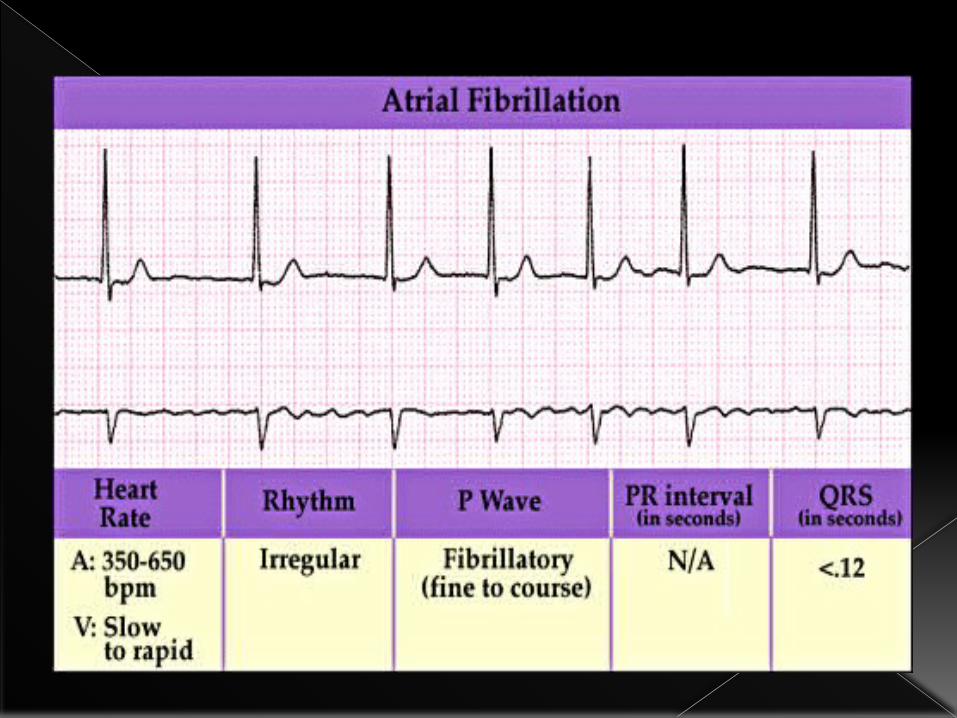
Atrial Fibrillation
No P – irregular baseline.Irregular QRS complexesQRS normal shape
Ventricular Tachycardia
& fibrillation
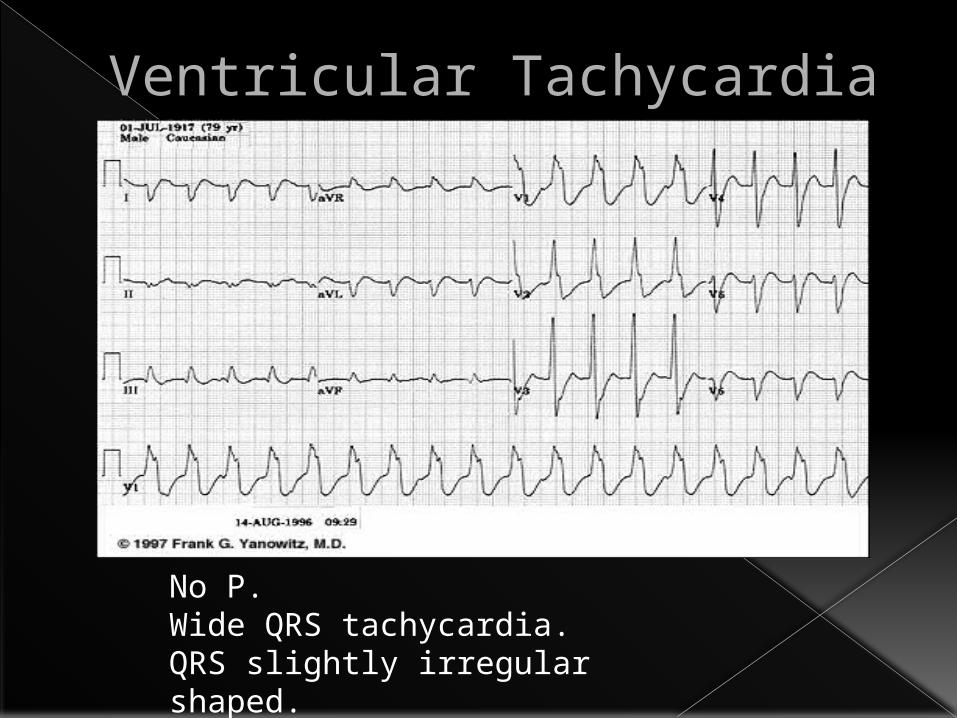
Ventricular Tachycardia
No P.Wide QRS tachycardia.QRS slightly irregular shaped.
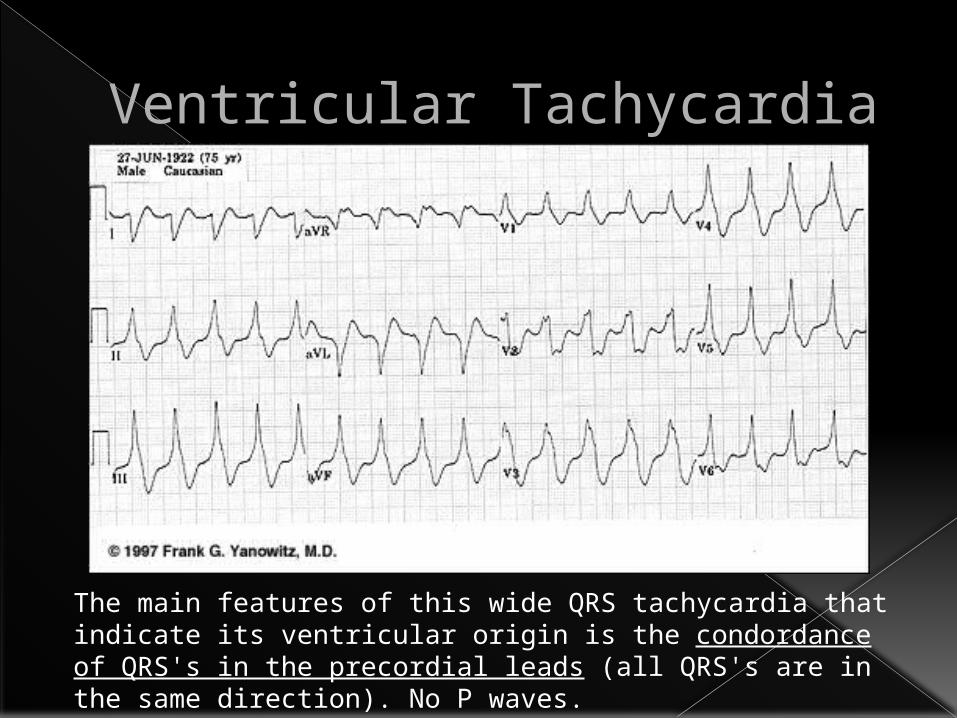
Ventricular Tachycardia
The main features of this wide QRS tachycardia that indicate its ventricular origin is the condordance of QRS's in the precordial leads (all QRS's are in the same direction). No P waves.
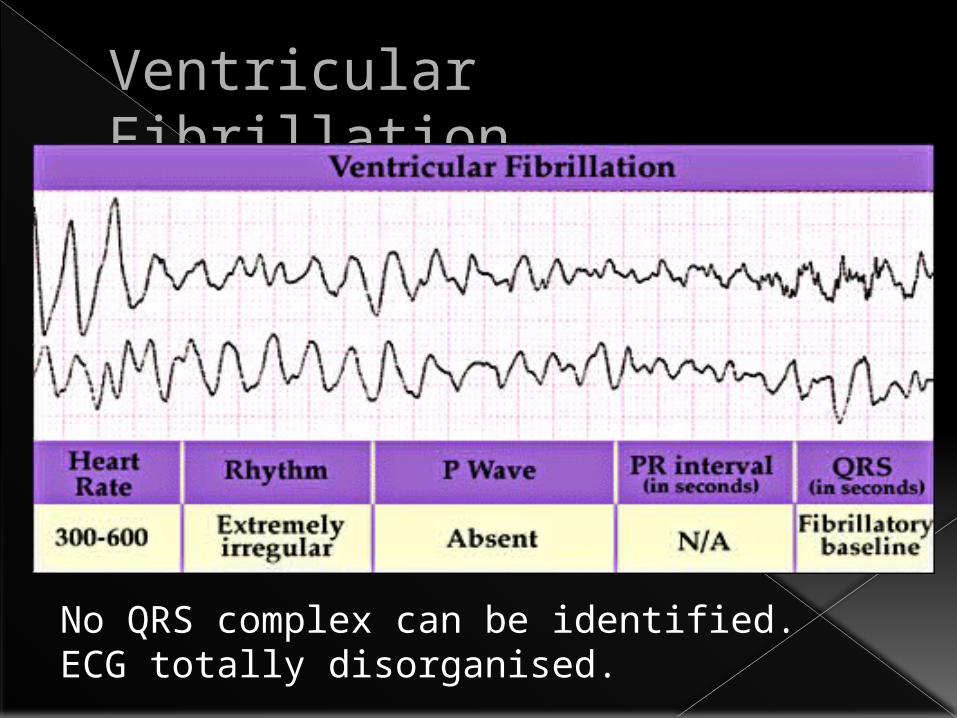
Ventricular Fibrillation
No QRS complex can be identified.ECG totally disorganised.

Extrasystole(ectopic beats)
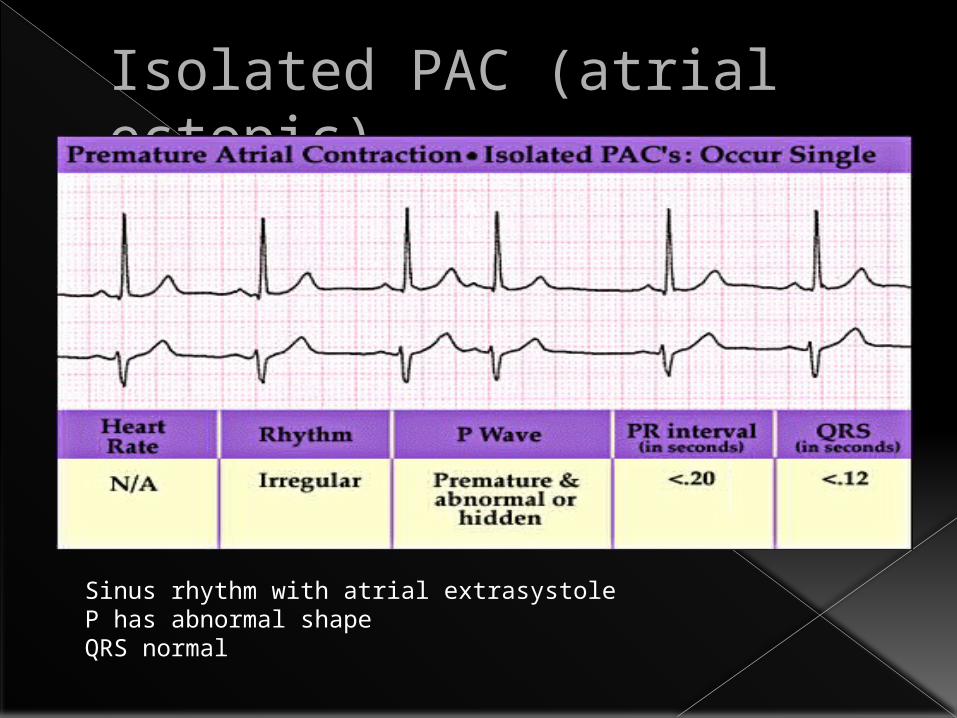
Isolated PAC (atrial ectopic)
Sinus rhythm with atrial extrasystoleP has abnormal shapeQRS normal
A
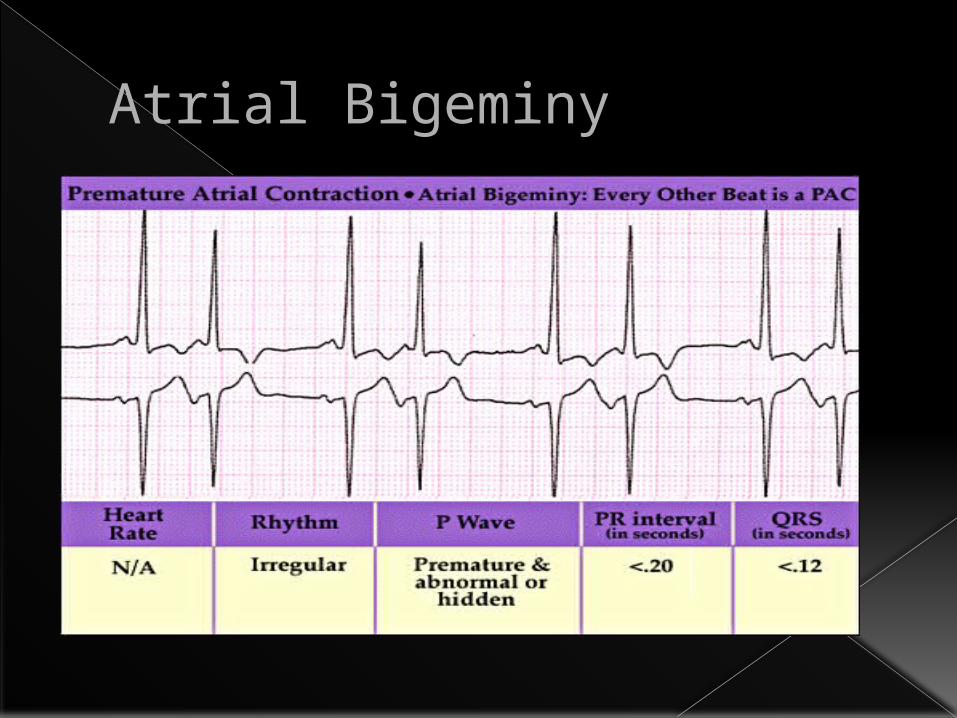
Atrial Bigeminy
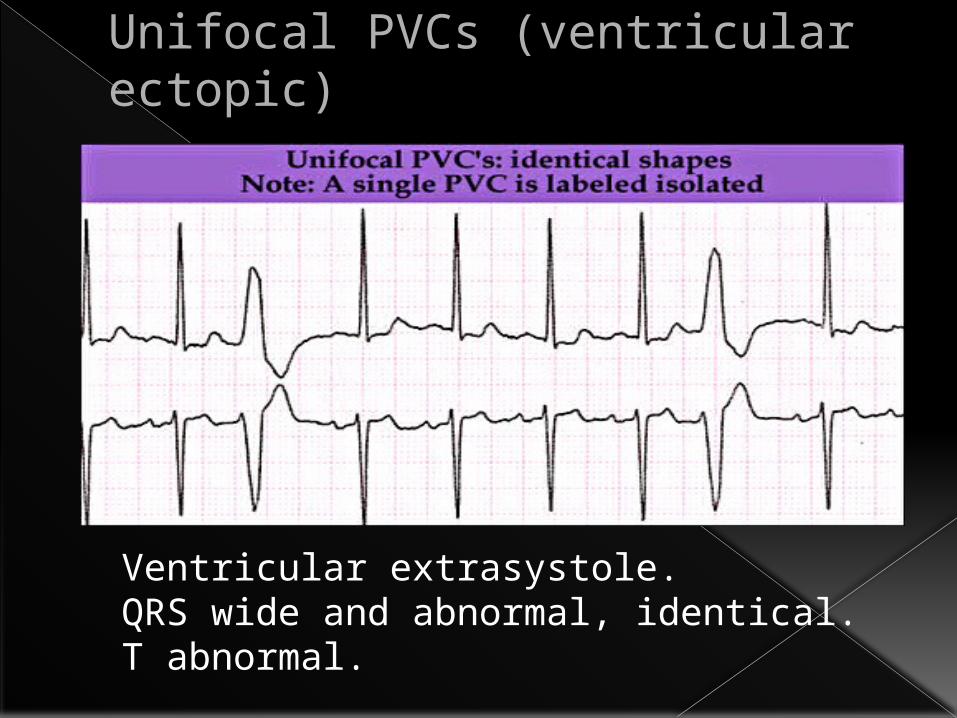
Unifocal PVCs (ventricular ectopic)
Ventricular extrasystole.QRS wide and abnormal, identical. T abnormal.
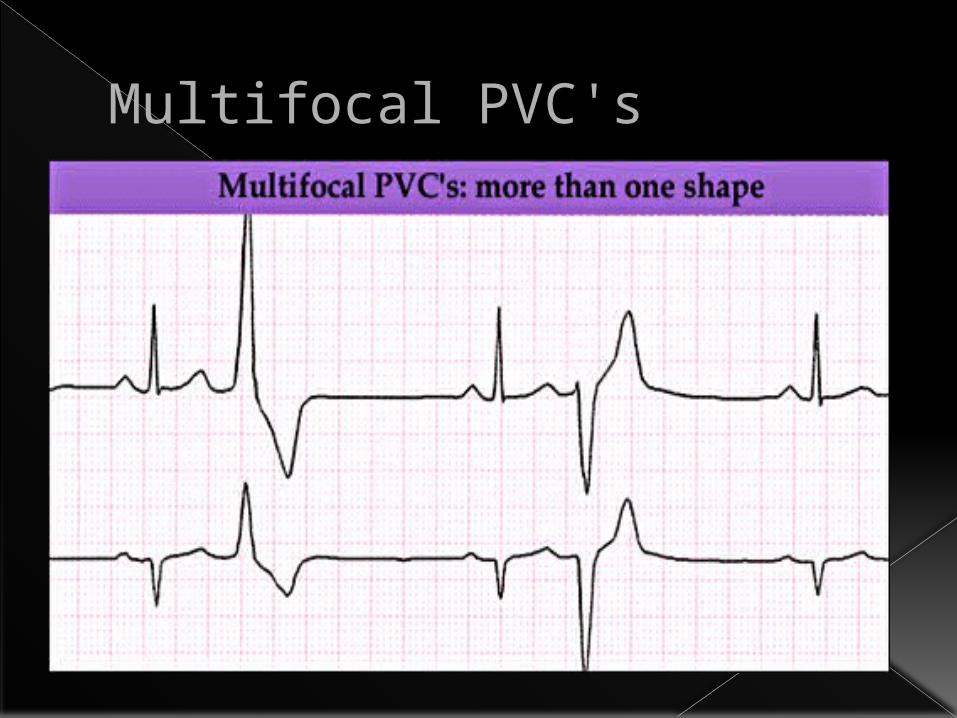
Multifocal PVC's
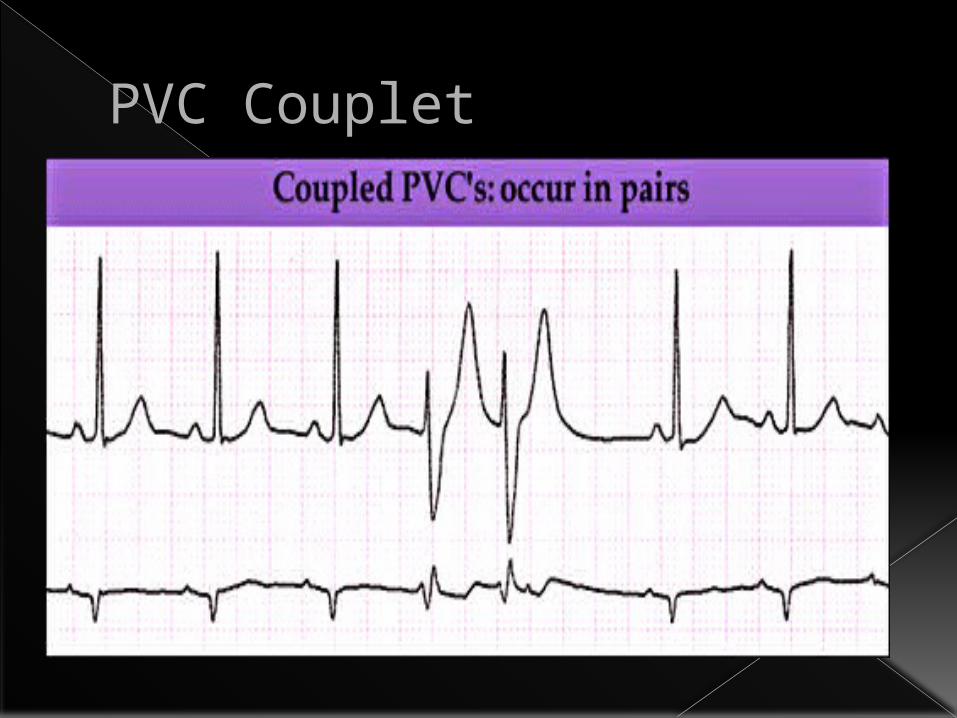
PVC Couplet
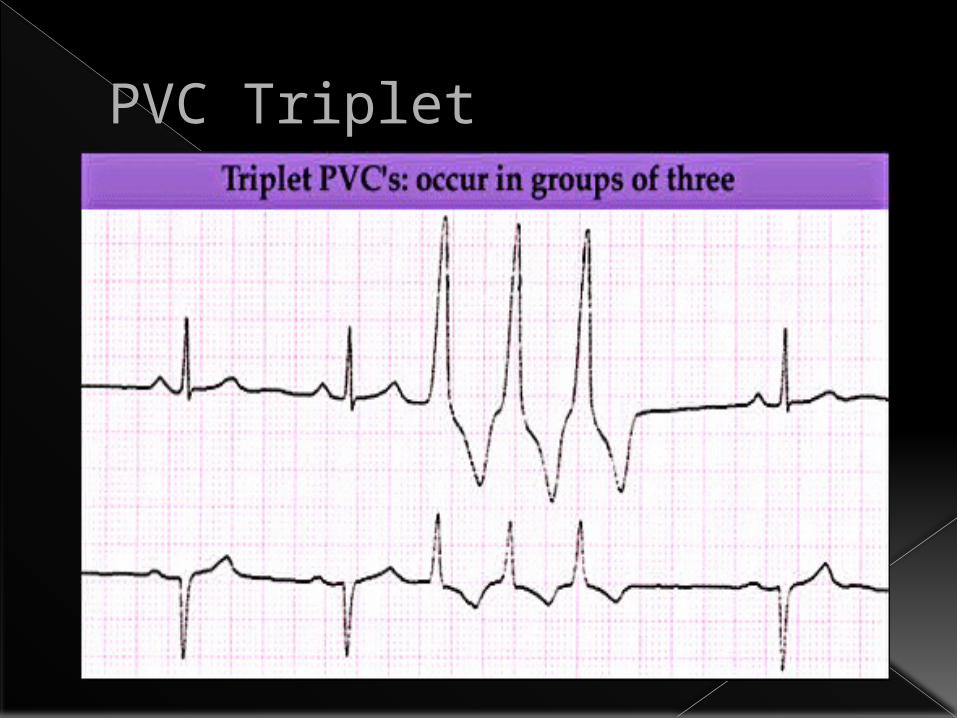
PVC Triplet
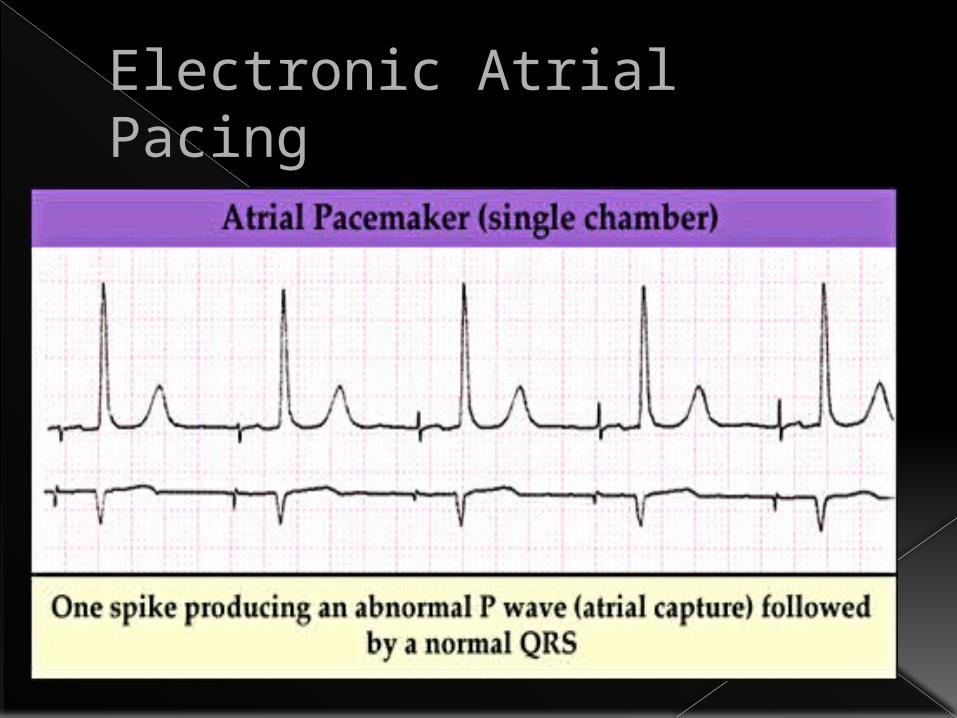
Electronic Atrial Pacing
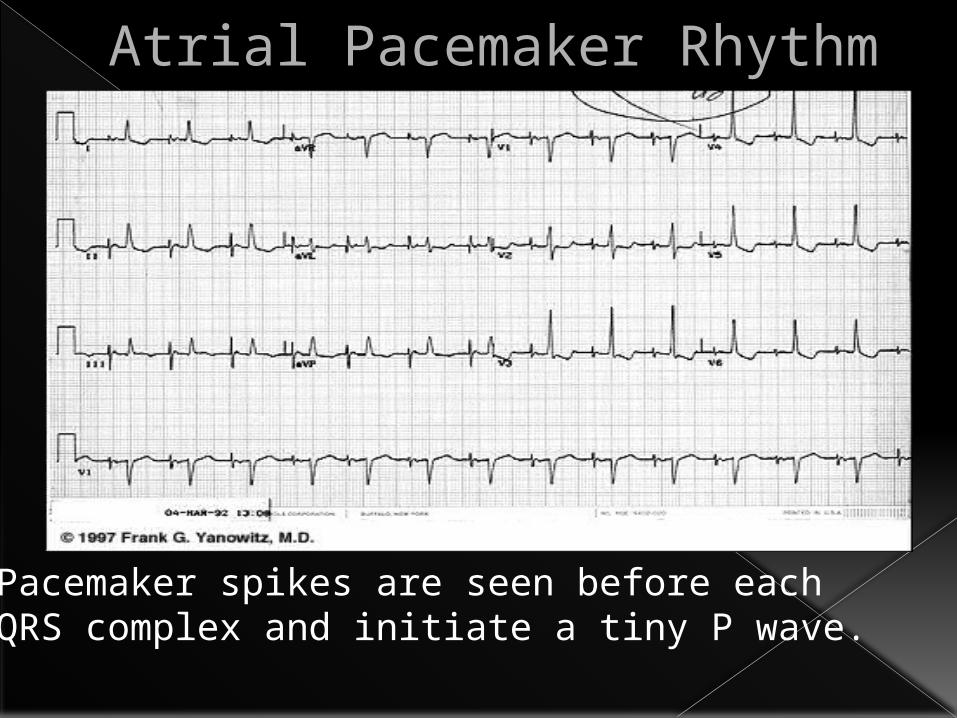
Atrial Pacemaker Rhythm
Pacemaker spikes are seen before each QRS complex and initiate a tiny P wave.
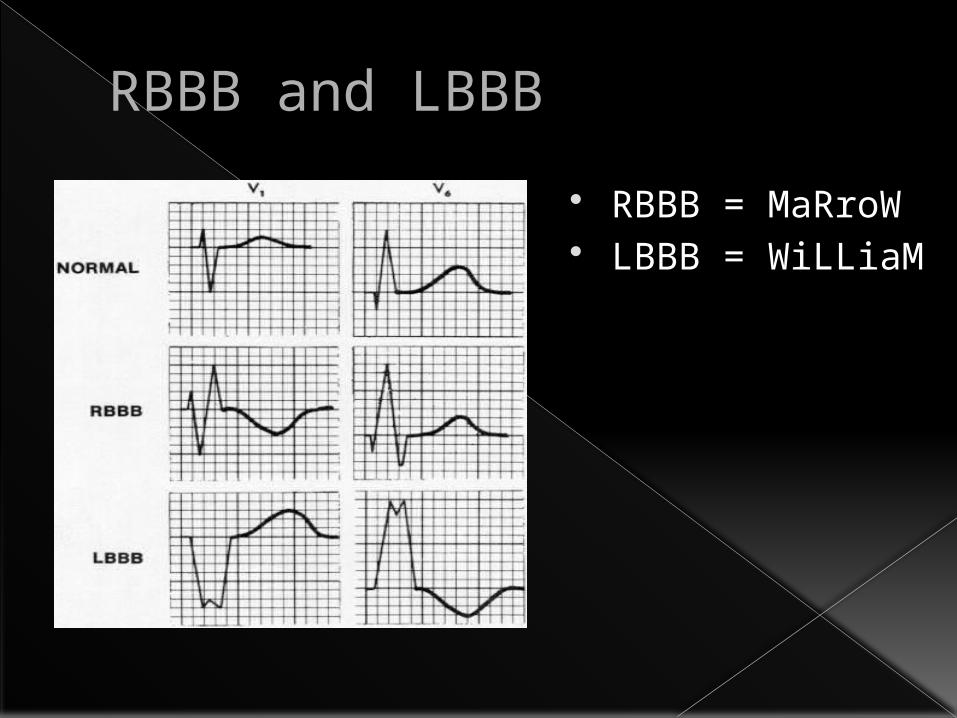
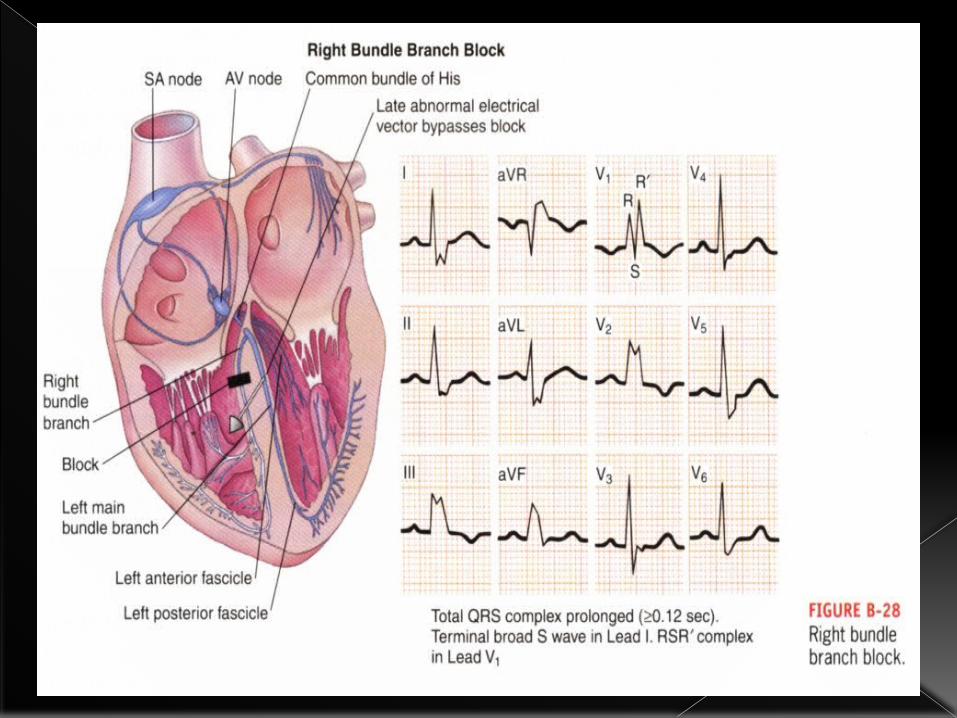
RBBB and LBBB RBBB = MaRroW LBBB = WiLLiaM

Miscelllaneous
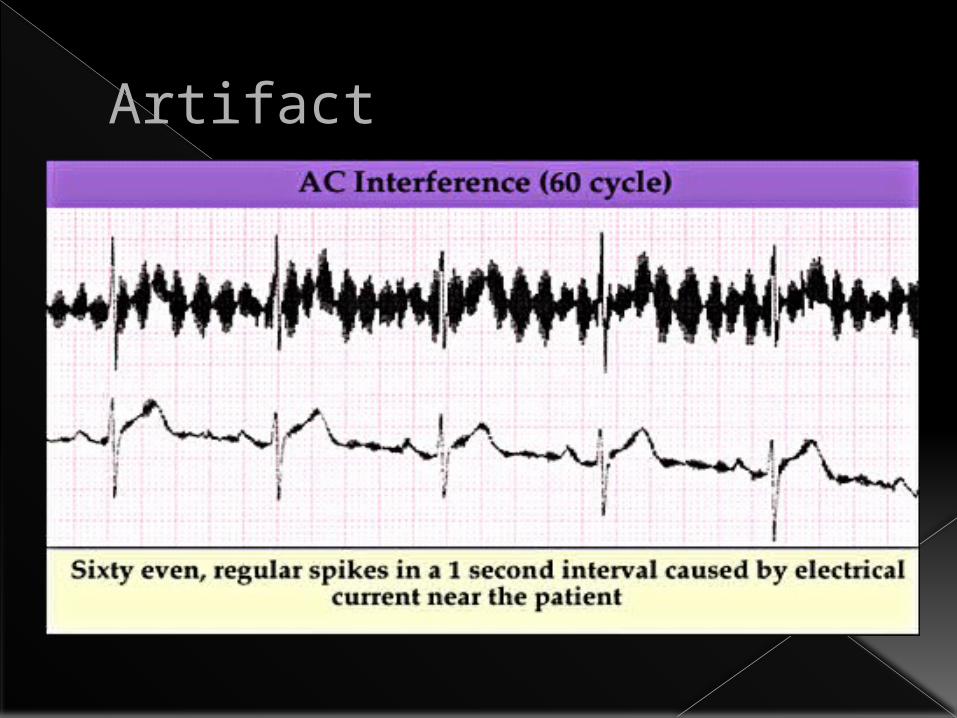
Artifact
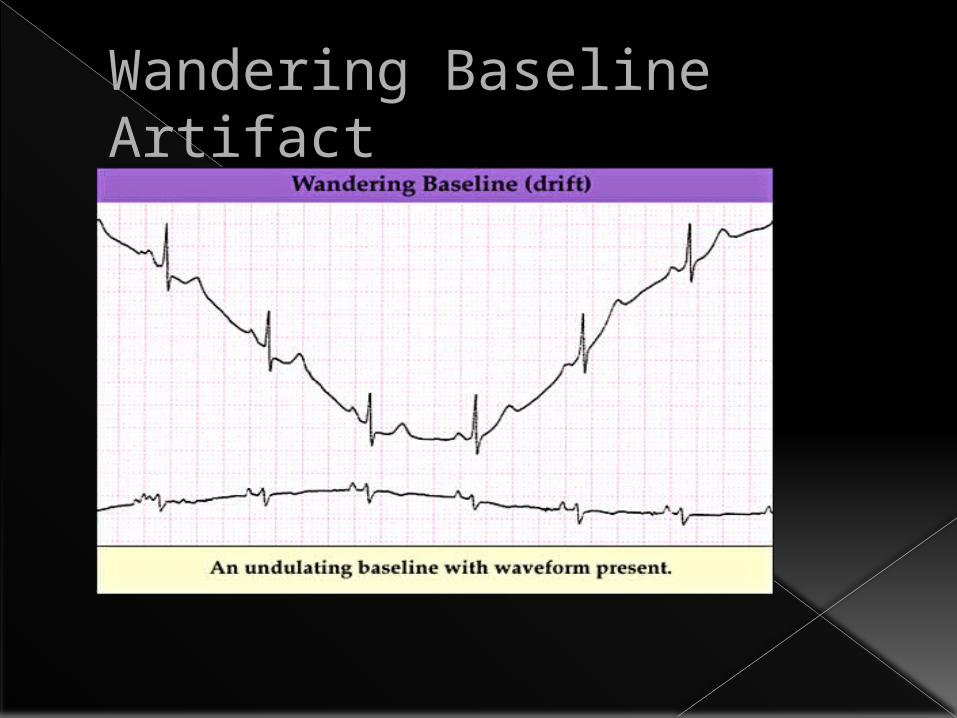
Wandering Baseline Artifact
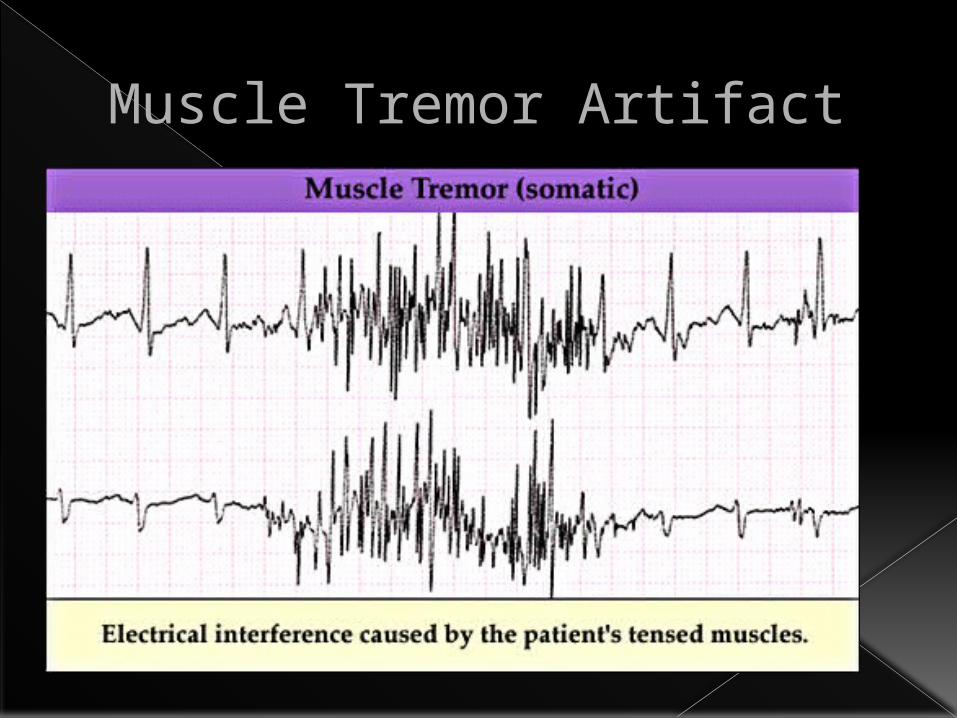
Muscle Tremor Artifact
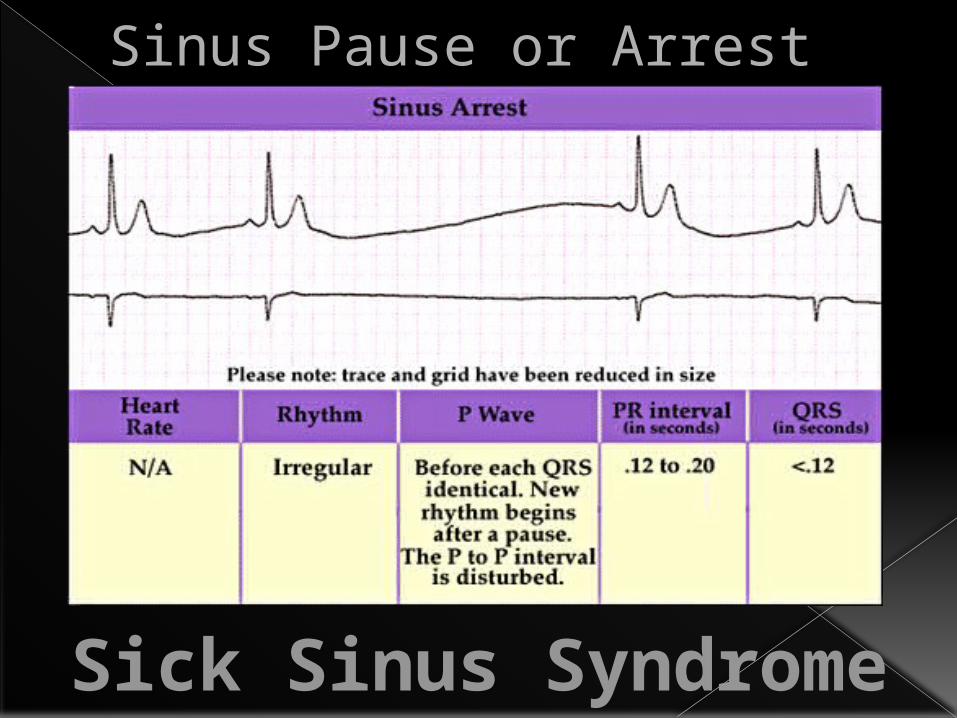
Sinus Pause or Arrest
Sick Sinus Syndrome
Emergency Rhythm
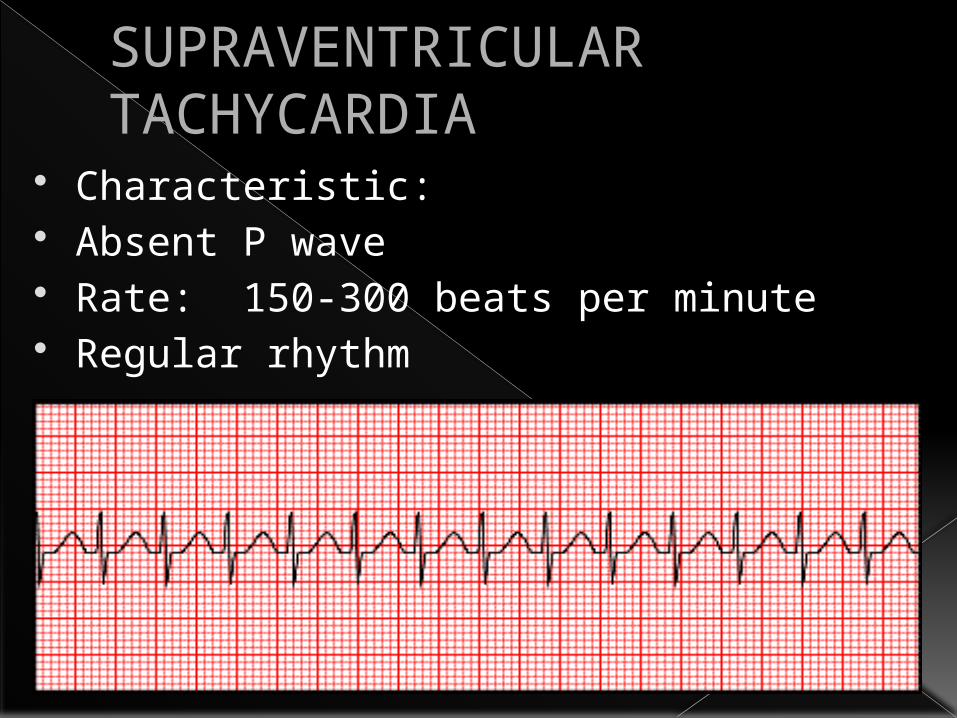
SUPRAVENTRICULAR TACHYCARDIA
Characteristic: Absent P wave Rate: 150-300 beats per minute Regular rhythm
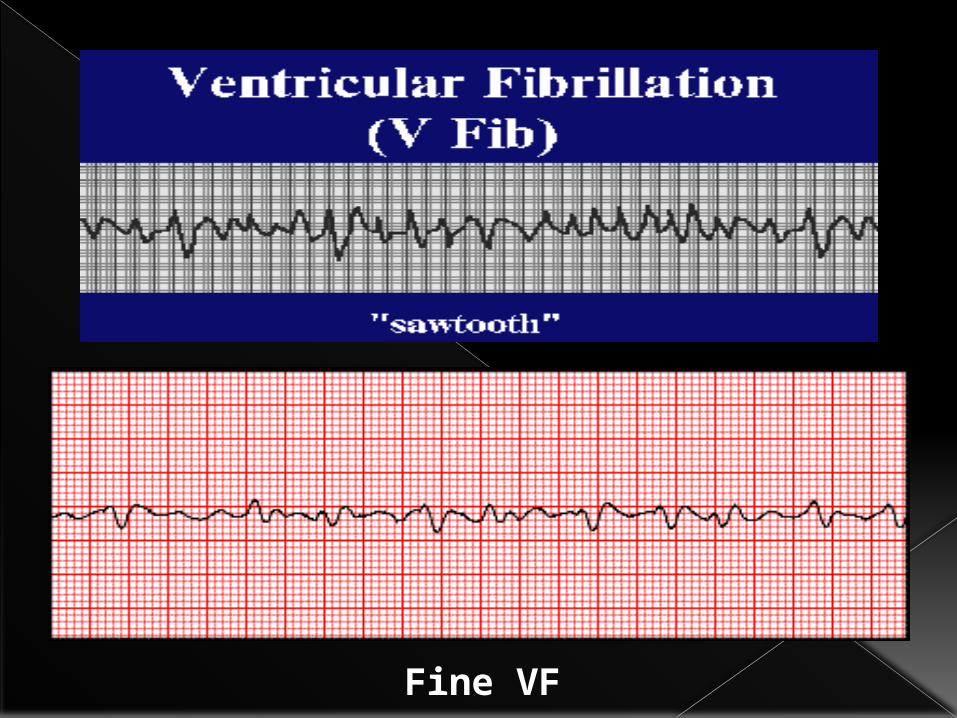
Fine VF
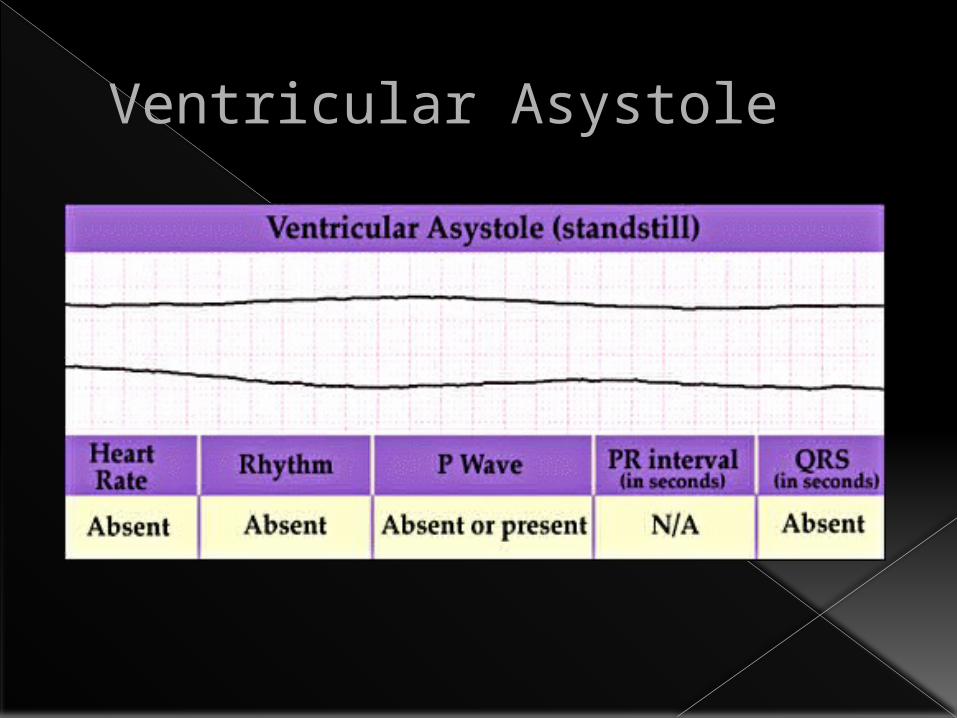
Ventricular Asystole
ThankYou


