local fractal dimension based ecg arrhythmia classification
TRANSCRIPT
Biomedical Signal Processing and Control 5 (2010) 114–123
Local fractal dimension based ECG arrhythmia classification
Amit K. Mishra *, Shantanu Raghav
Department of Electronics and Communication Engineering, Indian Institute of Technology Guwahati, India
A R T I C L E I N F O
Article history:
Received 13 August 2008
Received in revised form 30 December 2009
Accepted 5 January 2010
Available online 2 February 2010
Keywords:
ECG arrhythmia
Beat classification
Fractal dimension
Patient-independent classifier
A B S T R A C T
We propose a local fractal dimension based nearest neighbor classifier for ECG based classification of
arrhythmia. Local fractal dimension (LFD) at each sample point of the ECG waveform is taken as the
feature. A nearest neighbor algorithm in the feature space is used to find the class of the test ECG beat.
The nearest neighbor is found based on the RR-interval-information-biased Euclidean distance,
proposed in the current work. Based on the two algorithms used for estimating the LFD, two
classification algorithms are validated in the current work, viz. variance based fractal dimension
estimation based nearest neighbor classifier and power spectral density based fractal dimension
estimation based nearest neighbor classifier. Their performances are evaluated based on various figures
of merit. MIT-BIH (Massachusetts Institute of Technology - Boston’s Beth Israel Hospital) Arrhythmia
dataset has been used to validate the algorithms. Along with showing good performance against all the
figures of merit, the proposed algorithms also proved to be patient independent in the sense that the
performance is good even when the test ECG signal is from a patient whose ECG is not present in the
training ECG dataset.
� 2010 Elsevier Ltd. All rights reserved.
Contents lists available at ScienceDirect
Biomedical Signal Processing and Control
journa l homepage: www.e lsev ier .com/ locate /bspc
1. Introduction
Cardiac arrhythmia is a term for any abnormal electrical activityin heart beats. Electrocardiogram (ECG) is one of the mostimportant noninvasive tools for the diagnosis of cardiac arrhyth-mia. The classification of ECG signals into different diseasecategories is a complex pattern recognition problem. For thecomputer-aided diagnosis (CAD) of ECG signals, a wide range ofsignal processing techniques have been used, like spectral analysis,time frequency distribution and nonlinear signal processingtechniques [1–5]. Researchers have also used wavelets [6],artificial neural networks (ANN) [7], fuzzy and neuro-fuzzysystems [8], hidden Markov modeling [9], principal componentanalysis (PCA) [10] and independent component analysis (ICA)[11]. There have also been works on the use of simple templatematching based classifier for the detection and classification ofarrhythmia using ECG signal [12,13]. However, most of thepublished algorithms are not validated regarding their perfor-mance in stringent conditions like the lack of enough trainingdataset. Secondly, most of these algorithms do not perform well ifthe training and test ECG signals are from different patients.
The current work proposes algorithms based on local fractaldimension of ECG signal. The idea of self similar structures has
* Corresponding author.
E-mail addresses: [email protected], [email protected] (A.K. Mishra),
[email protected] (S. Raghav).
1746-8094/$ – see front matter � 2010 Elsevier Ltd. All rights reserved.
doi:10.1016/j.bspc.2010.01.002
occurred in mathematical research for a long time. It wasMandelbrot who gave this idea a firm theoretical backgroundand coined such structures as fractals [14]. Broadly speaking, afractal structure has the same statistics under any scale ofmagnification [14–16]. Due to their ability to model nature moreaccurately, fractal modeling has proved to be an important tool in awide spectrum of fields, starting from image analysis, texturemodeling, market analysis to the study of genome sequences [17–19].
Previous studies suggest that physiological signals generated bycomplex self-regulating systems under healthy conditions mayhave a fractal temporal structure [20]. Fractal geometry basedmethods have been a major success in cardiac signal analysis [21].It has been reported that ECG signals are well modeled as self-affined fractal sets and their classification is possible by usingfractal dimension [22–24]. There has also been some reports on theuse of multifractal model for cardiac signal analysis [25,26].However, none of the works in the open literature has extensivelytested and validated a fractal dimension based ECG signalclassification algorithm. In one of the earlier works [27], theauthors have tried using local fractal dimension based nearestneighbor classifier for ECG signal based arrhythmia classification,and results were encouraging. The current work is an expandedversion of the earlier work and here we have done some addition tothe base algorithm and have validated it extensively.
In the current work, local fractal dimension (LFD) of neighbor-ing sample points of ECG signal segments are used as the featureson which the classifier is based. For estimating the LFD we have
A.K. Mishra, S. Raghav / Biomedical Signal Processing and Control 5 (2010) 114–123 115
used two methods, viz. power spectral density based fractaldimension estimator (PSDFE) and variance based fractal dimensionestimator (VFE). A modified Euclidean distance based nearestneighbor classifier is used as the final classification machine. Thismodified Euclidean distance takes into account the RR-intervalinformation, and is a contribution of the authors.
The proposed algorithms have many unique advantages. First ofall the performance of the classifier in terms of sensitivity andspecificity is comparable to the best in the open literature. Secondly,the classification results also have a good confidence level, asobserved from the error-bar analysis and performance withreduction of training dataset. From these experiments, the VFEbased classifier was found to be more suitable for ECG basedarrhythmia classification. Another novelty of this algorithm is theperformance of the classifier when it is presented with ECG ofpatients whose ECG signals were not present in the training dataset.The classifier is found to give good performance with differentpatients without any a priori information about the patient. It maybe noted here that there are very few works in the open literaturewhich have validated ECG classifiers using different sets of patientsin the training and test phases [28,29], and many of these works usesome amount of a priori information about the patient. On the otherhand the proposed algorithm uses no such information.
The rest of the paper is organized as follows. The next sectiongives a description about fractals and discusses two majoralgorithms for estimating the local fractal dimension, as used inthis paper. Section 3 describes the database used in theclassification exercise. After this the classification algorithm isdescribed. Section 5 discusses the figures of merit based on whichthe validation of the classifiers has been done. After that we givethe results and analyze them. Section 7 discusses some of thelimitations of the current study and the implications of the same.The last section ends the paper with conclusive remarks.
2. Fractals and fractal dimension
Fractal is a mathematical model to represent self similarstructures and is used to describe scale invariant randomprocesses. Fractals are often characterized by their fractionaldimensions [30]. Many algorithms have been devised to estimatethe fractal dimension of a time series, viz. power spectral analysis[31], range scaled analysis by the calculation of Hurst expo-nent[32], box-counting method [33], Higuchi method [34],analysis by wavelet packets [35], etc. The algorithms to estimatethe fractal dimension can be grouped into two groups, viz. time-domain analysis based estimators, and transfer-domain analysisbased estimators. To estimate the fractal dimension of ECG signalswe have used two methods, one from each group. From transfer-domain analysis based group of estimators, power spectral densitybased fractal dimension estimator (PSDFE) [31] is chosen. Fromtime-domain analysis based group of estimators, variance basedfractal dimension estimator (VFE) [36] is chosen. These estimatorsare chosen based on their reported performance and the ease ofimplementing them.
2.1. Power spectrum density based fractal dimension estimator
PSDFE is a well-accepted method to estimate the fractaldimension of biological signals[31]. Let xðnÞ be a discrete sequence.Then the power spectrum of the discrete signal can be calculatedby the square of its Fourier transform. The power spectrum (Sð f nÞ)of a fractal process in frequency domain follows a power lawrelationship with the frequency (f), according to the followingrelation.
Sð f nÞ� p f�bn (1)
Taking logarithm of both sides of the expression yields
log Sð f nÞ� log p� blog f n: (2)
The spectral exponent b is estimated by the slope of the line fittingthe log–log plot of the power spectrum by a least square method inthe linear frequency range. Fractal dimension D can be expressed interms of spectral index b by the following equation.
D ¼ 5� b2
(3)
To find the fractal dimension of a curve, first an estimate of b isobtained from the PSD curve and then the fractal dimension D isfound using the above expression.
2.2. Variance based fractal dimension estimator
VFE [36] is a popular method for estimating the fractaldimension of a non chaotic time series. It is estimated by thespread of the increments in the signal amplitude.
The variance s2, of the amplitude increments for a time seriesxðnÞ over a given time increment is proportional to the timeincrement according to the following power law
varðxðn2Þ � xðn1ÞÞ� jn2 � n1j2H: (4)
Here H is the Hurst exponent and var() function which determinesthe variance. By setting Dn ¼ jn2 � n1j and ðDxÞDn ¼ xðn2Þ � xðn1Þ,H can be estimated from a log–log plot of Dnm versus varðDxÞm.Dnm is the discrete time increment at the m th order scale.Similarly, varðDxÞm is the amplitude increment over that discretetime increment at the m th order scale. The slope s of the line fittingthe log–log plot can be calculated by least square method andHurst exponent is obtained from
H ¼ s
2: (5)
Hurst exponent H is related to fractional dimension D as:
D ¼ Eþ 1� H: (6)
where E is the Euclidean dimension [14]. For ECG signals E ¼ 1 andhence
D ¼ 2� H: (7)
3. ECG signal database and preprocessing
The data used in the present work is the ECG signal databasefrom the MIT-BIH (Massachusetts Institute of Technology -Boston’s Beth Israel Hospital) Arrhythmia Database [37] availableon Physionet website. The MIT-BIH Arrhythmia Database contains48 half-hour excerpts of two-channel ambulatory ECG recordings,obtained from 47 subjects studied by the BIH ArrhythmiaLaboratory between 1975 and 1979. The recordings were digitizedat 360 samples per second per channel with 11-bit resolution overa 10 mV range. The proposed algorithm uses small segments of theECG records of modified limb lead II (MLII), each segmentconsisting of 200 samples. A fixed length window around themaximum peak of R wave, was applied to extract the heartbeatwaveform. Not only QRS complex but also some parts of P and Twaves were extracted by using a window starting 50 samplesbefore the R-peak and ending 150 samples after the same point.Hence, the ECG waveform samples are aligned in time. It can benoted here that unlike most of the ECG arrhythmia classifieralgorithms, for LFD based algorithms it is not required to normalizethe ECG beats in the preprocessing stage. This is because of the factthat linear operations on a signal do not change its fractal

Table 1The number and type of QRS complexes used in this study.
Type MIT-BIH file number No. of QRS complexes No. of QRS complexes for validation
N 100, 101, 102, 104, 74,952 49,983
105, 106, 108, 112, 113, 114, 115,
116, 117, 119, 121, 122, 123, 200,
201, 202, 203, 205, 208, 209, 210,
212, 213, 215, 217, 219, 220, 221,
222, 223, 228, 230, 231, 233, 234
L 109, 111, 207, 214 8066 5380
R 118, 124, 207, 212, 231, 232 7248 4833
PB 102, 104, 107, 217 7016 4678
V 100, 102, 104, 105, 106, 107, 108 7126 4764
109, 111, 114, 116, 118, 119, 121,
123, 124, 200, 201, 202, 203, 205,
207, 208, 209, 210, 213, 214, 215,
217, 219, 221, 223, 228, 230, 231,
233, 234,
A 100, 101, 103, 108, 112, 114, 116 2541 1701
117, 118, 121, 124, 200, 201, 202,
205, 207, 209, 213, 215, 220, 222,
223, 228, 231, 232, 233
Total 106,949 71,334
A.K. Mishra, S. Raghav / Biomedical Signal Processing and Control 5 (2010) 114–123116
dimension [15]. Hence, the estimated LFD is roughly independentof any scaling operation done on the signal.
The database consists of ECG beats belonging to five types ofarrhythmia and normal ECG (N). The arrhythmia types are leftbundle branch block beat (L), right bundle branch block beat (R),atrial premature beat (A), premature ventricular contraction (V)and paced beat (PB). The ECG beats in the database aresummarized in Table 1. Out of these, one third of the ECG beatsare selected for training and the remaining for testing orvalidating the classifiers.
4. Fractal dimension based nearest neighbor classifier
This section describes the proposed fractal dimension basednearest neighbor classifier (FDNN). The ECG signal is preprocessedas described in the above section. The next step is to extract thefractal dimensions of the ECG signal. For that, the local fractionaldimension is calculated for each sample point in the signal by usingthe two algorithms described in Section 2, separately. In case ofPSDFE algorithm, a Hamming window of size W is taken aroundeach sample point of the ECG record, after which its fractionaldimension is calculated by Eqs. (1)–(3). The reason to chooseHamming window is to reduce the side-lobes in the frequencydomain. Fractional dimension at each point consists of fractalinformation about its neighboring sample points. Thus, thismoving window of size W over each ECG signal waveform of200 samples converts the signal into a time series of fractionaldimensions of size ð200�WÞ. Similarly, in case of the VFE, arectangular window of the same size W is taken around eachsample point and fractional dimension is calculated by usingEqs. (4), (5) and (7).
In the training phase, the above process is applied on eachpreprocessed ECG beat in the training set and the resultingfractal dimension series are used as features. In the test phase,each ECG beat in testing set is first converted into its fractaldimension series. Then its nearest neighbor is found from theECG beats from the training set, in the fractal dimension featuredimension. For finding the nearest neighbor, a modifiedEuclidean distance incorporating the RR-interval informationhas been used. This measure is termed as the RR-biased
Euclidean distance (RRED) and, for two fractal dimensionsequences xi and yi, is defined as:
RRED ¼
ffiffiffiffiffiffiffiffiffiffiffiffiffiffiffiffiffiffiffiffiffiffiffiffiffiffiffiffiffiffiffiffiffiffiffiffiffiffiffiffiffiffiffiffiffiffiffiffiffiffiffiffiffiffiffiffiffiffiffiffiffiX200�W
i¼1
ðxi � yiÞ2 þ
RRdi f f
k
� �2vuut : (8)
Here RRdi f f is the difference of RR-interval values (RRdi f f ) betweenthe training and testing QRS complexes. To keep the contributionof RRdi f f at a desired level, it is scaled by factor k. The value of kwas experimentally determined to be 10. The reason for biasingEuclidean distance with RRdi f f is the observation that ECG beatsfor certain arrhythmia such as atrial fibrillation, are difficult todetect on the basis of the information from the QRS complex only.For example, the heart rate varying features in arrhythmia of typeA are the prominent factors in their detection and the RR-intervalinformation may help in recognizing these beats. A switchablescheme has been implemented for ECG classification by Yu et al.[11] which decides the length of the sample for classifier on thebasis of the RR-interval value. The proposed RRED has beeninspired by such works.
After finding the nearest neighbor in the fractal dimensionfeature space, the class of the ECG beat giving the minimum RREDis declared as the class of the test signal.
In our work we have used two different algorithms to estimatethe local fractal dimension. Based on the algorithm used, wedeveloped two classification algorithms, viz. PSDFE based nearestneighbor classifier (PSDFENNC) and VFE based nearest neighborclassifier (VFENNC).
5. Figures of merit for comparison
Comparison and validation of classification algorithms havealways been tough. Due to the high mortality rate among thepatients with heart diseases and high risk involved in arrhythmiadiseases, the ECG classification task becomes more crucial andsensitive. Rigorous validation of the algorithm is to be done beforethe implementation of an ECG beat classifier in real-time heartdiagnosis. Thus, the correct classification rate or sensitivity shouldnot be the only figure of merit, in evaluating the performance of theclassifier. Considering all the features affecting the performance of
A.K. Mishra, S. Raghav / Biomedical Signal Processing and Control 5 (2010) 114–123 117
an ECG classifier algorithm, the comparison between the two abovementioned algorithm PSDFENNC and VFENNC and the validation ofthe same is done on the basis of the following figures of merit.
5.1. Confusion matrix
Confusion matrix is by far the most comprehensive form ofrepresenting the results from a classification exercise. The entriesin the confusion matrix give the number of QRS complexes of agiven class, classified as different classes. For example, the (i, j)thentry in the confusion matrix represents the number of QRScomplexes from the test dataset belonging to class i recognized asthe class j. Following are some of the information that can beextracted from the confusion matrix.
– S
TaQR
ensitivity Se for a given class i is calculated using the (i, i)thelement of the confusion matrix, i.e.
Sei¼ CMði; iÞ
Ni; (9)
where CM(i, i)th is the (i, i)th element of the confusion matrix
and Ni is the total no. of QRS complexes for class i. The sensitivity
of a classifier measures the proportion of actual positives which
are correctly identified.
– A verage sensitivity for a given classification algorithm is given bythe expression
Average sensiti ðSeÞ ¼1
M
XMi¼1
Sei(10)
where M is the number of classes of ECG beats in the dataset.
– S pecificity S p of a classifier measures the proportion of negativeswhich are correctly identified, i.e. the fraction of correctlyidentified QRS complexes that does not belong to a certain class.Hence, the specificity for a given class i is calculated as
S pi ¼ 1�
XMj¼1
CMð j; iÞ � CMði; iÞ
XMj¼1
N j
0@
1A� Ni
: (11)
5.2. Performance with reduced training dataset
ECG measurements involve human subjects in clinical environ-ment. This makes the collection of extensive amount of real-lifedata, both time consuming and costly. Hence, a practical ECG signalbased arrhythmia classifier is expected to perform with limitedamount of training dataset. The trend of how a classifier behaveswith reduced training data is the next ground on which the currentalgorithms have been evaluated. The less the deviation observed inthe percentage of correct classification with reduced trainingdataset, the more efficient is the classifier.
ble 2S complexes used for patient-independent study of different classifiers.
Experiment number MIT-BIH file number used in test phase (each file
I 209, 109, 111, 103, 113, 102, 104, 118, 124, 119, 2
II 222, 111, 207, 113, 115, 104, 107, 124, 212, 200, 2
III 232, 207, 214, 115, 123, 107, 217, 212, 231, 221, 2
IV 209, 109, 214, 123, 220, 102, 217, 118, 231, 119, 2
V 222, 109, 207, 220, 234, 102, 107, 118, 212, 119, 2
VI 232, 111, 214, 103, 234, 104, 217, 124, 231, 200, 2
5.3. Receiver operating characteristics (ROC) curves
In a detection problem, the ROC curve is plotted between the1� s peci ficity and average sensitivity.
The present way of looking at ROC curves has been adopted toexamine the performance of the algorithms to see how efficient itis in classifying a particular class. This was analyzed by assigning athreshold of classification to each arrhythmia class. For a templatematching type algorithm
atst 2 arg miniðkatst ; atrði; jÞk � g iÞ: (12)
Here g i is the risk factor assigned to the ith class, atst is the test QRScomplex and atrði; jÞ is the jth ECG template of the ith class. Thehigher the threshold g i for a class, the more difficult it is to missthat class. At the same time, the easier it is to mis-classify anotherarrhythmia as belonging to this class. For a given value of g i and agiven ECG class, the confusion matrix was calculated. From that,the values of average sensitivity and specificity were found. Thisprocedure was repeated for all the classes. By varying the value ofg i, the ROC curve of a particular type of target is determined for agiven FDNN algorithm.
5.4. Patient independence of the classifier
The ECG waveforms of different patients and patient groupsvary wildly in their morphologies, which make their automaticreal-time classification a tough task. The performance of an ECGbeat classifier often deteriorates when presented with ECGwaveform of a different patient than those whose ECG waveformshave been used in the training phase.
To overcome this problem, we may use a training datasetcontaining ECG signal from all the possible patient types. Howeverit is not practically feasible to cover every ECG waveform of allpotential patients. Also, it will be a costly and time consumingapproach as it is difficult to develop and maintain such a largetraining database in practice. Hence, a good classifier must performwell with a training database collected from a limited number ofpatients. This is an important figure of merit and unfortunately notmuch stressed in many of the works on ECG arrhythmiaclassification.
Some previous studies have developed algorithms to solve thisproblem by monitoring the patient for some time before usingtheir ECG signals for classification [28,29].
To validate an ECG classifier for its patient-independent nature,we have devised the following scheme. The performance of aclassifier is tested under six different cases. In each case, the ECGsignals in the test dataset are from patients different from thepatients whose ECG beats are used in the training phase. For thisset of experiments, we have used the recordings from 25 patientsas described in Table 2. Recordings from rest of the subjects havenot been used. This is because in the rest of the subjects, there aresome with more than one type of arrhythmia. Hence they cannotbe used to represent a single type of arrhythmia. Secondly, the 25
number corresponds to a different patient) No. of QRS complexes
00 17,241
21 15,570
33 16,234
33 16,606
21 17,752
33 17,646
Table 3Confusion matrix for VFENNC (the rows represent database classification and the
columns represent algorithm classification).
N L R PB V A
N 49,441 129 64 1 136 212
L 124 5238 6 2 6 4
R 80 8 4732 0 5 8
PB 32 6 2 4630 7 1
V 229 25 6 7 4481 16
A 208 3 9 0 11 1470
A.K. Mishra, S. Raghav / Biomedical Signal Processing and Control 5 (2010) 114–123118
patients under consideration contribute towards the maximumamount of recordings in the dataset. Rest of the patients contributemostly towards normal type of ECG or have very little amount ofdata. Hence if included, these will increase the amount of normalECG disproportionately which in turn will give rise to biasedclassification.
ECG waveforms from 11 patients out of the total 25 patients areused for testing and ECG waveform from the rest 14 patients areused for training. The patients are selected such that training setand test set both contain at least one patient from each class ofarrhythmia. Table 2 describes the MIT files used for testing andtraining.
5.5. ECG fractal clustering analysis
The fractal features of ECG signals are obtained by convertingthe original QRS signals into a fractal dimension time series. Theeffectiveness of these features for separating the differentmorphological classes is demonstrated by using statisticalmeasures such as cluster dispersion and cluster-to-clusterdistance. Such measures can be effectively used as quantitativeways of predicting the classifiability of classes [38]. In the currentstudy, we have used two measures for testing the classifiability ofarrhythmia in the domain of fractal dimension time series of ECGsignal.
Geometrical separability index (GSI): Thornton’s separabilityindex or geometrical separability index [39] is a measure of theseparability of the classes assuming a nearest neighbor type ofclassifier. GSI has been used to design optimal support vectormachines and in other machine learning exercises [40,41]. GSIgives an idea about if two classes are separable in a nearestneighbor sense or not. For two data-clusters, GSI is given as:
GSI ¼
XN
i¼1
ð f ðxiÞ þ f ðxiNNÞ þ 1Þmod2
N(13)
Here, xi is a data point and xiNN is its nearest neighbor. f representsthe binary decision classification function giving the class numberof the data point. N is the total number of data points. GSI finds thenumber of data points for which its nearest neighbor is from thesame class as itself.
Bhattacharya distance: Bhattacharya distance (BD) is a measureof difference or separability between two Gaussian distributeddata-clusters. This is given by [42,43].
BD ¼ 1
8ðM1 �M2ÞT
S1 þS2
2
� ��1
ðM1 �M2Þ þ1
2ln
S1þS22
��� ���ffiffiffiffiffiffiffiffiffiffiffiffiffiffiffiffiffiffijS1jjS2j
q (14)
Here, S1 and S2 are the covariance matrices of clusters 1 and 2,respectively. M1 and M2 are mean vectors of clusters 1 and 2,respectively.
BD as expressed in the above expression has two terms. The firstterm gives the difference between the means of the two clusters,normalized by the sum of their spreads as given by the covarianceof the clusters. The second term shows the difference between thespread of the two clusters.
Based on these measures the cluster-to-cluster distance andcluster dispersion of the arrhythmia classes were analyzed in thecurrent work.
6. Results and discussion
This section presents the results from the present work anddiscusses the implications of the same. All ECG signal beats of 200sample points each, as mentioned in Table 1 are processed using
the two algorithms, PSDFE and VFE, for estimating their localfractal dimension series. To achieve good classification perfor-mance the sliding window (W) should be chosen judiciously for thealgorithms. The window size affects the quality of the LFD featuresobtained. A very small window introduces noise into the estimatedfractal dimension and a very large window may cause loss ofinformation. An optimal sliding window of size 30 is chosenexperimentally by inspecting the local fractal series of the ECGsamples. After the calculation of LFD, the samples reduce to alength of 170 sample points, resulting in higher processing speedand less use of hardware memory. One third of the total QRScomplexes (i.e. 35,615 QRS complexes) are kept for training andrest of them (i.e. 71,334 QRS complexes) are used in the test phase.The performance of the two classifiers is compared on the basis ofthe figures of merit as discussed in the last section.
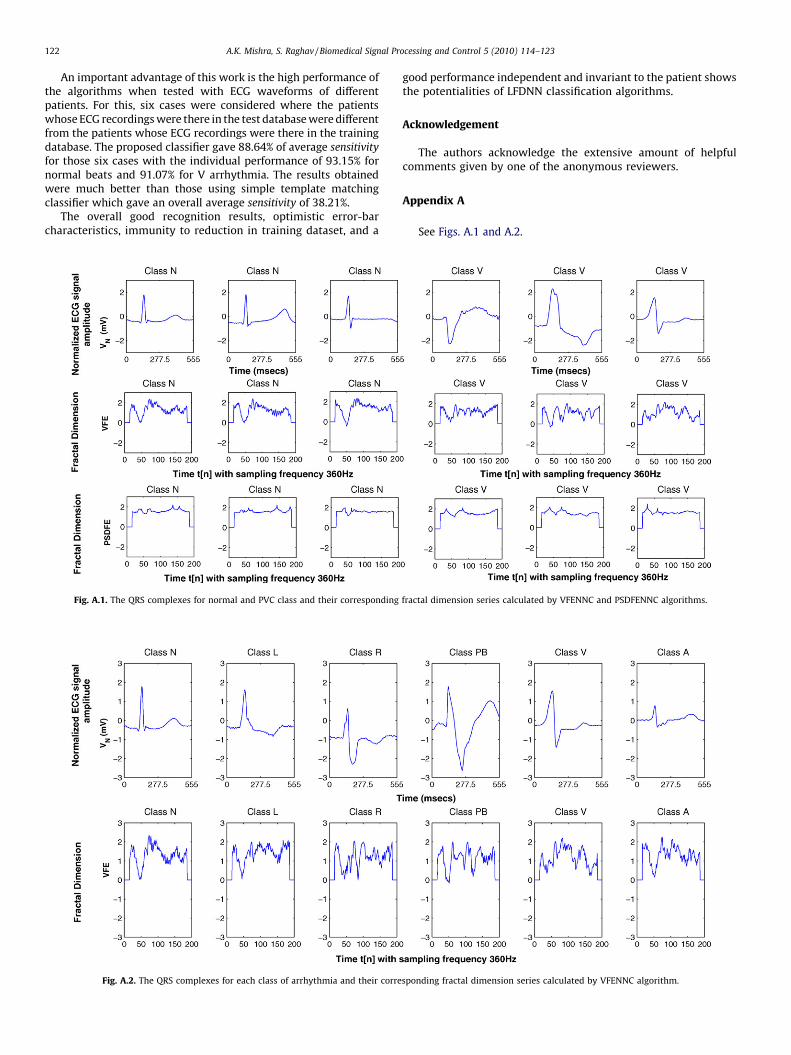
Before we proceed with the results a note on the fractaldimension of ECG signals is in order. Fig. A1 in Appendix A displaysthe QRS complexes for class V and class A arrhythmia and thefractal dimension of corresponding QRS complexes by VFENNC andPSDFENNC algorithm. It can be interpreted from the figure that thethree different QRS complexes of a normal ECG beat give almostsimilar fractal dimension series by VFENNC algorithm however aconsiderate difference can be seen in QRS complexes of these threenormal beats. Also from the same figure it can be seen that thefractal dimension by PSDFENNC algorithm are almost similar forthree completely different QRS complexes of class V arrhythmia.Fig. A2 in Appendix A displays the fractal dimension series for allsix classes of arrhythmia and their QRS complexes. It can be notedhere that VFE is a time-domain fractal dimension estimator,whereas PSDFE is a transform domain estimator. Hence the localfractal dimensions as estimated using these two algorithms are notexactly equal. Local small perturbations affect the VFE estimateddimension severely and hence the fractal dimension estimated byVFE is more varying than that estimated using PSDFE.
6.1. Absolute performance and confusion matrix
There are six different classes of arrhythmia taken intoconsideration in this work. Correspondingly there will be sixsensitivity indices. Tables 3 and 4 give the confusion matrices of theVFENNC and PSDFENNC, respectively. The rows represent the ECGdatabase classes and columns represent the ECG classes classifiedby the algorithm. Thus as previously explained the (i, j)th elementof a confusion matrix represent the number of QRS complexeswhich belong to class i and classified as class j. The diagonalelements of the confusion matrices show the number of correctlyclassified QRS complexes. Table 5 gives the average specificity andaverage sensitivity information for different classes. The averagesensitivity for PSDFENNC is 92.8%, while the same for VFENNC is95.6%. The average specificity performance in percentage for all ECGarrhythmia using VFENNC is found to be 99.4% and the same usingPSDFENNC is found to be 98.8%. These figures are comparable tothose of some of the best ECG arrhythmia classifiers reported in theopen literature [11,44,45]. It may also be observed that VFENNCperforms better than PSDFENNC.
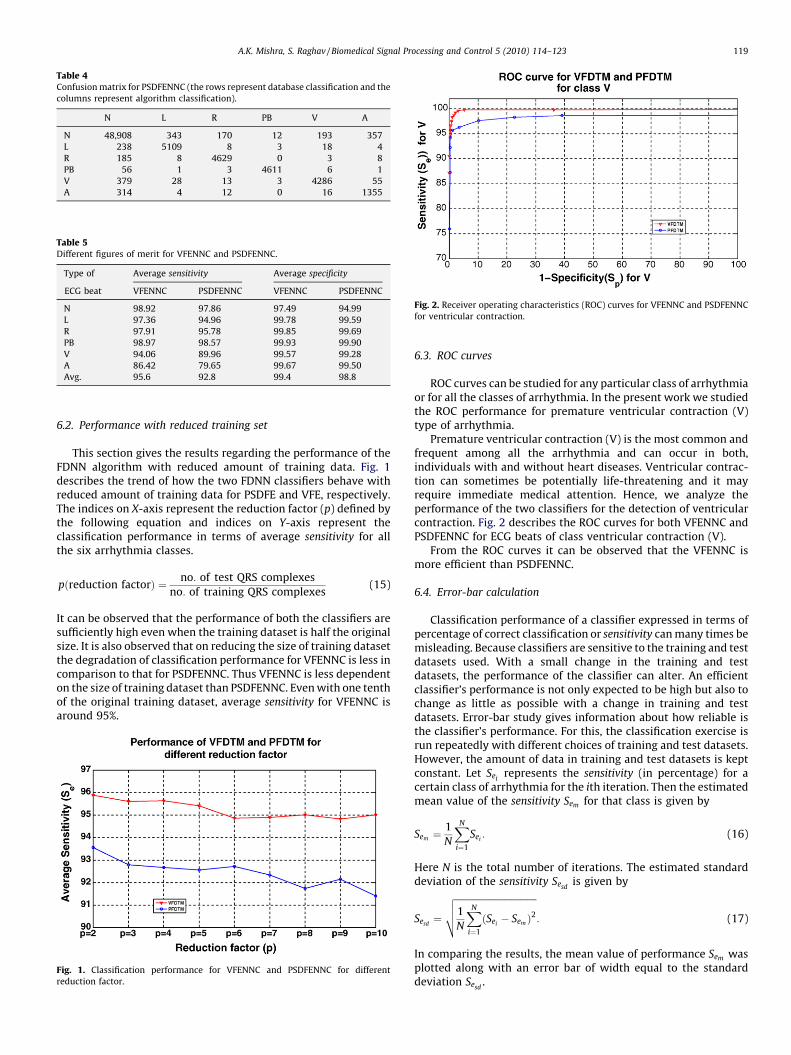
Table 4Confusion matrix for PSDFENNC (the rows represent database classification and the
columns represent algorithm classification).
N L R PB V A
N 48,908 343 170 12 193 357
L 238 5109 8 3 18 4
R 185 8 4629 0 3 8
PB 56 1 3 4611 6 1
V 379 28 13 3 4286 55
A 314 4 12 0 16 1355
Table 5Different figures of merit for VFENNC and PSDFENNC.
Type of Average sensitivity Average specificity
ECG beat VFENNC PSDFENNC VFENNC PSDFENNC
N 98.92 97.86 97.49 94.99
L 97.36 94.96 99.78 99.59
R 97.91 95.78 99.85 99.69
PB 98.97 98.57 99.93 99.90
V 94.06 89.96 99.57 99.28
A 86.42 79.65 99.67 99.50
Avg. 95.6 92.8 99.4 98.8
Fig. 2. Receiver operating characteristics (ROC) curves for VFENNC and PSDFENNC
for ventricular contraction.
A.K. Mishra, S. Raghav / Biomedical Signal Processing and Control 5 (2010) 114–123 119
6.2. Performance with reduced training set
This section gives the results regarding the performance of theFDNN algorithm with reduced amount of training data. Fig. 1describes the trend of how the two FDNN classifiers behave withreduced amount of training data for PSDFE and VFE, respectively.The indices on X-axis represent the reduction factor (p) defined bythe following equation and indices on Y-axis represent theclassification performance in terms of average sensitivity for allthe six arrhythmia classes.
pðreduction factorÞ ¼ no: of test QRS complexes
no: of training QRS complexes(15)
It can be observed that the performance of both the classifiers aresufficiently high even when the training dataset is half the originalsize. It is also observed that on reducing the size of training datasetthe degradation of classification performance for VFENNC is less incomparison to that for PSDFENNC. Thus VFENNC is less dependenton the size of training dataset than PSDFENNC. Even with one tenthof the original training dataset, average sensitivity for VFENNC isaround 95%.
Fig. 1. Classification performance for VFENNC and PSDFENNC for different
reduction factor.
6.3. ROC curves
ROC curves can be studied for any particular class of arrhythmiaor for all the classes of arrhythmia. In the present work we studiedthe ROC performance for premature ventricular contraction (V)type of arrhythmia.
Premature ventricular contraction (V) is the most common andfrequent among all the arrhythmia and can occur in both,individuals with and without heart diseases. Ventricular contrac-tion can sometimes be potentially life-threatening and it mayrequire immediate medical attention. Hence, we analyze theperformance of the two classifiers for the detection of ventricularcontraction. Fig. 2 describes the ROC curves for both VFENNC andPSDFENNC for ECG beats of class ventricular contraction (V).
From the ROC curves it can be observed that the VFENNC ismore efficient than PSDFENNC.
6.4. Error-bar calculation
Classification performance of a classifier expressed in terms ofpercentage of correct classification or sensitivity can many times bemisleading. Because classifiers are sensitive to the training and testdatasets used. With a small change in the training and testdatasets, the performance of the classifier can alter. An efficientclassifier’s performance is not only expected to be high but also tochange as little as possible with a change in training and testdatasets. Error-bar study gives information about how reliable isthe classifier’s performance. For this, the classification exercise isrun repeatedly with different choices of training and test datasets.However, the amount of data in training and test datasets is keptconstant. Let Sei
represents the sensitivity (in percentage) for acertain class of arrhythmia for the ith iteration. Then the estimatedmean value of the sensitivity Sem for that class is given by
Sem ¼1
N
XN
i¼1
Sei: (16)
Here N is the total number of iterations. The estimated standarddeviation of the sensitivity Sesd
is given by
Sesd¼
ffiffiffiffiffiffiffiffiffiffiffiffiffiffiffiffiffiffiffiffiffiffiffiffiffiffiffiffiffiffiffiffiffiffiffi1
N
XN
i¼1
ðSei� Sem Þ
2
vuut : (17)
In comparing the results, the mean value of performance Sem wasplotted along with an error bar of width equal to the standarddeviation Sesd
.
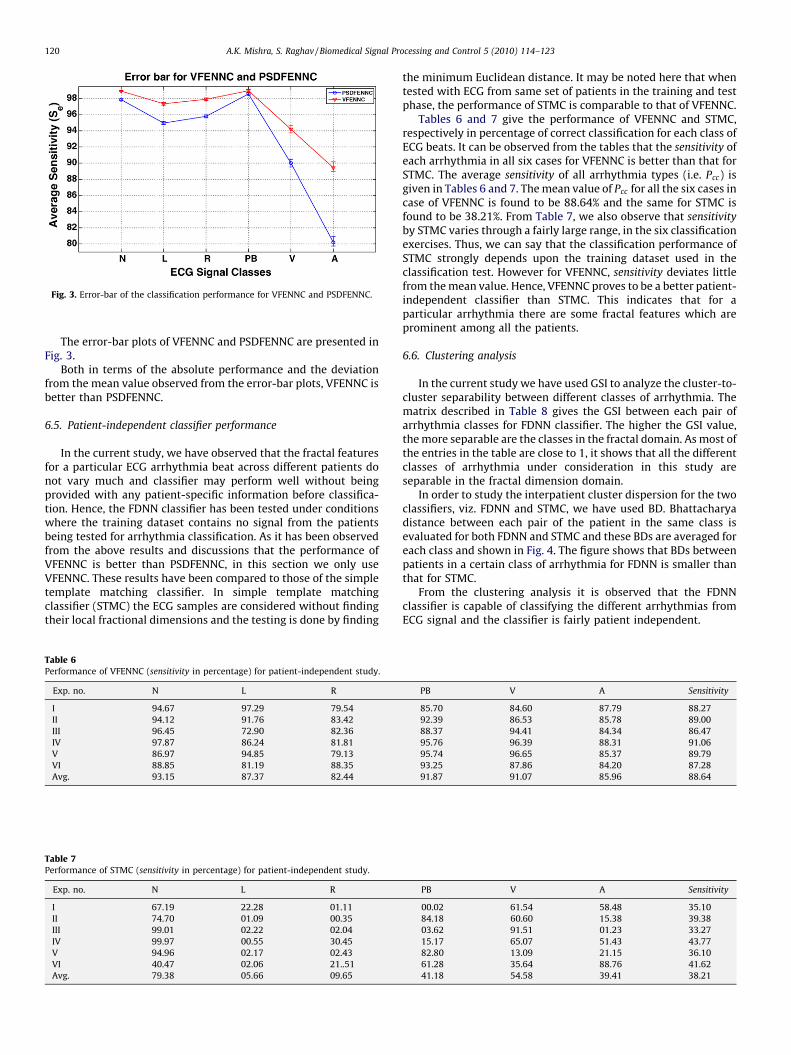
Fig. 3. Error-bar of the classification performance for VFENNC and PSDFENNC.
A.K. Mishra, S. Raghav / Biomedical Signal Processing and Control 5 (2010) 114–123120
The error-bar plots of VFENNC and PSDFENNC are presented inFig. 3.
Both in terms of the absolute performance and the deviationfrom the mean value observed from the error-bar plots, VFENNC isbetter than PSDFENNC.
6.5. Patient-independent classifier performance
In the current study, we have observed that the fractal featuresfor a particular ECG arrhythmia beat across different patients donot vary much and classifier may perform well without beingprovided with any patient-specific information before classifica-tion. Hence, the FDNN classifier has been tested under conditionswhere the training dataset contains no signal from the patientsbeing tested for arrhythmia classification. As it has been observedfrom the above results and discussions that the performance ofVFENNC is better than PSDFENNC, in this section we only useVFENNC. These results have been compared to those of the simpletemplate matching classifier. In simple template matchingclassifier (STMC) the ECG samples are considered without findingtheir local fractional dimensions and the testing is done by finding
Table 6Performance of VFENNC (sensitivity in percentage) for patient-independent study.
Exp. no. N L R
I 94.67 97.29 79.54
II 94.12 91.76 83.42
III 96.45 72.90 82.36
IV 97.87 86.24 81.81
V 86.97 94.85 79.13
VI 88.85 81.19 88.35
Avg. 93.15 87.37 82.44
Table 7Performance of STMC (sensitivity in percentage) for patient-independent study.
Exp. no. N L R
I 67.19 22.28 01.11
II 74.70 01.09 00.35
III 99.01 02.22 02.04
IV 99.97 00.55 30.45
V 94.96 02.17 02.43
VI 40.47 02.06 21..51
Avg. 79.38 05.66 09.65
the minimum Euclidean distance. It may be noted here that whentested with ECG from same set of patients in the training and testphase, the performance of STMC is comparable to that of VFENNC.
Tables 6 and 7 give the performance of VFENNC and STMC,respectively in percentage of correct classification for each class ofECG beats. It can be observed from the tables that the sensitivity ofeach arrhythmia in all six cases for VFENNC is better than that forSTMC. The average sensitivity of all arrhythmia types (i.e. Pcc) isgiven in Tables 6 and 7. The mean value of Pcc for all the six cases incase of VFENNC is found to be 88.64% and the same for STMC isfound to be 38.21%. From Table 7, we also observe that sensitivity
by STMC varies through a fairly large range, in the six classificationexercises. Thus, we can say that the classification performance ofSTMC strongly depends upon the training dataset used in theclassification test. However for VFENNC, sensitivity deviates littlefrom the mean value. Hence, VFENNC proves to be a better patient-independent classifier than STMC. This indicates that for aparticular arrhythmia there are some fractal features which areprominent among all the patients.
6.6. Clustering analysis
In the current study we have used GSI to analyze the cluster-to-cluster separability between different classes of arrhythmia. Thematrix described in Table 8 gives the GSI between each pair ofarrhythmia classes for FDNN classifier. The higher the GSI value,the more separable are the classes in the fractal domain. As most ofthe entries in the table are close to 1, it shows that all the differentclasses of arrhythmia under consideration in this study areseparable in the fractal dimension domain.
In order to study the interpatient cluster dispersion for the twoclassifiers, viz. FDNN and STMC, we have used BD. Bhattacharyadistance between each pair of the patient in the same class isevaluated for both FDNN and STMC and these BDs are averaged foreach class and shown in Fig. 4. The figure shows that BDs betweenpatients in a certain class of arrhythmia for FDNN is smaller thanthat for STMC.
From the clustering analysis it is observed that the FDNNclassifier is capable of classifying the different arrhythmias fromECG signal and the classifier is fairly patient independent.
PB V A Sensitivity
85.70 84.60 87.79 88.27
92.39 86.53 85.78 89.00
88.37 94.41 84.34 86.47
95.76 96.39 88.31 91.06
95.74 96.65 85.37 89.79
93.25 87.86 84.20 87.28
91.87 91.07 85.96 88.64
PB V A Sensitivity
00.02 61.54 58.48 35.10
84.18 60.60 15.38 39.38
03.62 91.51 01.23 33.27
15.17 65.07 51.43 43.77
82.80 13.09 21.15 36.10
61.28 35.64 88.76 41.62
41.18 54.58 39.41 38.21
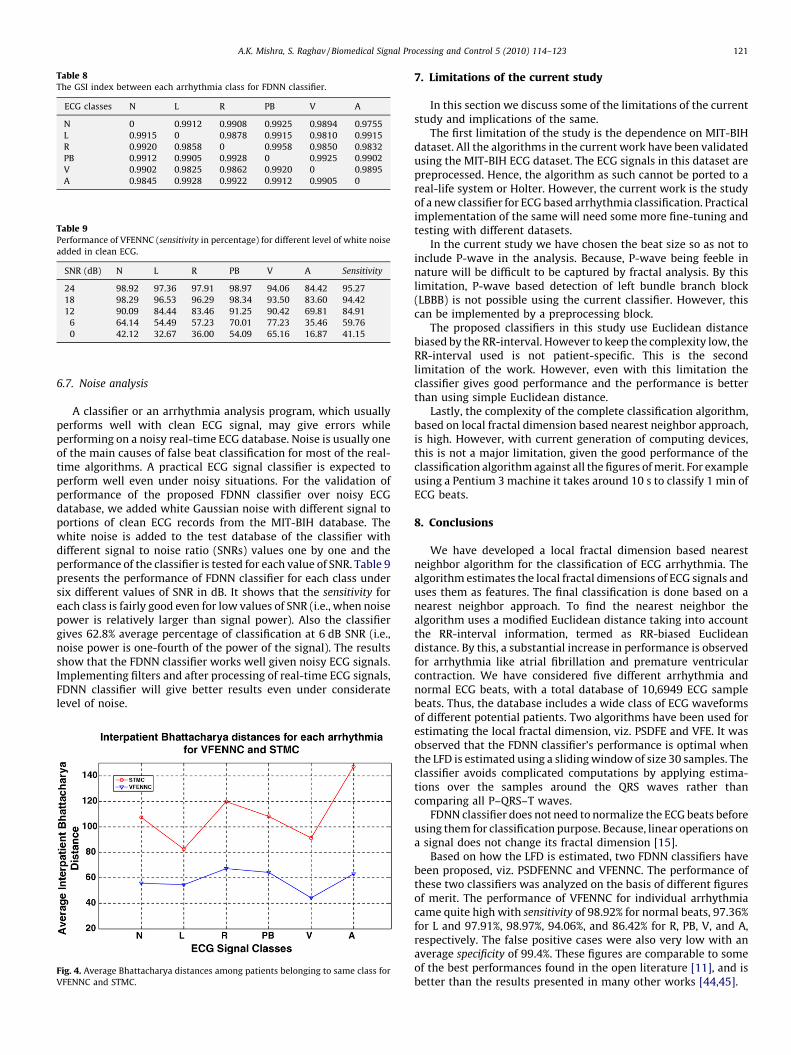
Table 8The GSI index between each arrhythmia class for FDNN classifier.
ECG classes N L R PB V A
N 0 0.9912 0.9908 0.9925 0.9894 0.9755
L 0.9915 0 0.9878 0.9915 0.9810 0.9915
R 0.9920 0.9858 0 0.9958 0.9850 0.9832
PB 0.9912 0.9905 0.9928 0 0.9925 0.9902
V 0.9902 0.9825 0.9862 0.9920 0 0.9895
A 0.9845 0.9928 0.9922 0.9912 0.9905 0
Table 9Performance of VFENNC (sensitivity in percentage) for different level of white noise
added in clean ECG.
SNR (dB) N L R PB V A Sensitivity
24 98.92 97.36 97.91 98.97 94.06 84.42 95.27
18 98.29 96.53 96.29 98.34 93.50 83.60 94.42
12 90.09 84.44 83.46 91.25 90.42 69.81 84.91
6 64.14 54.49 57.23 70.01 77.23 35.46 59.76
0 42.12 32.67 36.00 54.09 65.16 16.87 41.15
A.K. Mishra, S. Raghav / Biomedical Signal Processing and Control 5 (2010) 114–123 121
6.7. Noise analysis
A classifier or an arrhythmia analysis program, which usuallyperforms well with clean ECG signal, may give errors whileperforming on a noisy real-time ECG database. Noise is usually oneof the main causes of false beat classification for most of the real-time algorithms. A practical ECG signal classifier is expected toperform well even under noisy situations. For the validation ofperformance of the proposed FDNN classifier over noisy ECGdatabase, we added white Gaussian noise with different signal toportions of clean ECG records from the MIT-BIH database. Thewhite noise is added to the test database of the classifier withdifferent signal to noise ratio (SNRs) values one by one and theperformance of the classifier is tested for each value of SNR. Table 9presents the performance of FDNN classifier for each class undersix different values of SNR in dB. It shows that the sensitivity foreach class is fairly good even for low values of SNR (i.e., when noisepower is relatively larger than signal power). Also the classifiergives 62.8% average percentage of classification at 6 dB SNR (i.e.,noise power is one-fourth of the power of the signal). The resultsshow that the FDNN classifier works well given noisy ECG signals.Implementing filters and after processing of real-time ECG signals,FDNN classifier will give better results even under consideratelevel of noise.
Fig. 4. Average Bhattacharya distances among patients belonging to same class for
VFENNC and STMC.
7. Limitations of the current study
In this section we discuss some of the limitations of the currentstudy and implications of the same.
The first limitation of the study is the dependence on MIT-BIHdataset. All the algorithms in the current work have been validatedusing the MIT-BIH ECG dataset. The ECG signals in this dataset arepreprocessed. Hence, the algorithm as such cannot be ported to areal-life system or Holter. However, the current work is the studyof a new classifier for ECG based arrhythmia classification. Practicalimplementation of the same will need some more fine-tuning andtesting with different datasets.
In the current study we have chosen the beat size so as not toinclude P-wave in the analysis. Because, P-wave being feeble innature will be difficult to be captured by fractal analysis. By thislimitation, P-wave based detection of left bundle branch block(LBBB) is not possible using the current classifier. However, thiscan be implemented by a preprocessing block.
The proposed classifiers in this study use Euclidean distancebiased by the RR-interval. However to keep the complexity low, theRR-interval used is not patient-specific. This is the secondlimitation of the work. However, even with this limitation theclassifier gives good performance and the performance is betterthan using simple Euclidean distance.
Lastly, the complexity of the complete classification algorithm,based on local fractal dimension based nearest neighbor approach,is high. However, with current generation of computing devices,this is not a major limitation, given the good performance of theclassification algorithm against all the figures of merit. For exampleusing a Pentium 3 machine it takes around 10 s to classify 1 min ofECG beats.
8. Conclusions
We have developed a local fractal dimension based nearestneighbor algorithm for the classification of ECG arrhythmia. Thealgorithm estimates the local fractal dimensions of ECG signals anduses them as features. The final classification is done based on anearest neighbor approach. To find the nearest neighbor thealgorithm uses a modified Euclidean distance taking into accountthe RR-interval information, termed as RR-biased Euclideandistance. By this, a substantial increase in performance is observedfor arrhythmia like atrial fibrillation and premature ventricularcontraction. We have considered five different arrhythmia andnormal ECG beats, with a total database of 10,6949 ECG samplebeats. Thus, the database includes a wide class of ECG waveformsof different potential patients. Two algorithms have been used forestimating the local fractal dimension, viz. PSDFE and VFE. It wasobserved that the FDNN classifier’s performance is optimal whenthe LFD is estimated using a sliding window of size 30 samples. Theclassifier avoids complicated computations by applying estima-tions over the samples around the QRS waves rather thancomparing all P–QRS–T waves.
FDNN classifier does not need to normalize the ECG beats beforeusing them for classification purpose. Because, linear operations ona signal does not change its fractal dimension [15].
Based on how the LFD is estimated, two FDNN classifiers havebeen proposed, viz. PSDFENNC and VFENNC. The performance ofthese two classifiers was analyzed on the basis of different figuresof merit. The performance of VFENNC for individual arrhythmiacame quite high with sensitivity of 98.92% for normal beats, 97.36%for L and 97.91%, 98.97%, 94.06%, and 86.42% for R, PB, V, and A,respectively. The false positive cases were also very low with anaverage specificity of 99.4%. These figures are comparable to someof the best performances found in the open literature [11], and isbetter than the results presented in many other works [44,45].
A.K. Mishra, S. Raghav / Biomedical Signal Processing and Control 5 (2010) 114–123122
An important advantage of this work is the high performance ofthe algorithms when tested with ECG waveforms of differentpatients. For this, six cases were considered where the patientswhose ECG recordings were there in the test database were differentfrom the patients whose ECG recordings were there in the trainingdatabase. The proposed classifier gave 88.64% of average sensitivity
for those six cases with the individual performance of 93.15% fornormal beats and 91.07% for V arrhythmia. The results obtainedwere much better than those using simple template matchingclassifier which gave an overall average sensitivity of 38.21%.
The overall good recognition results, optimistic error-barcharacteristics, immunity to reduction in training dataset, and a
Fig. A.2. The QRS complexes for each class of arrhythmia and their corre
Fig. A.1. The QRS complexes for normal and PVC class and their corresponding
good performance independent and invariant to the patient showsthe potentialities of LFDNN classification algorithms.
Acknowledgement
The authors acknowledge the extensive amount of helpfulcomments given by one of the anonymous reviewers.
Appendix A
See Figs. A.1 and A.2.
sponding fractal dimension series calculated by VFENNC algorithm.
fractal dimension series calculated by VFENNC and PSDFENNC algorithms.
A.K. Mishra, S. Raghav / Biomedical Signal Processing and Control 5 (2010) 114–123 123
References
[1] R. Archarya, N. Kannathal, S. Krishnan, Comprehensive analysis of cardiachealth using heart rate signals, Physiological Measurement (25) (2004) 1139–1151.
[2] R. Povinelli, F. Roberts, R.K. Pella, Identification of ECG arrhythmias using phasespace reconstruction, PKDD01, Freiburg, Germany, 2001, pp. 411–423.
[3] L. Khadra, A. Al-Fahoum, S. Binajjaj, A quantitative analysis approach for cardiacarrhythmia classification using higher order spectral techniques, IEEE Transac-tions on Biomedical Engineering (45) (2005) 1878–1885.
[4] P.S. Addison, J.N. Watson, G.R. Clegg, M. Holzer, F. Sterz, C.E. Roberstson, Evaluat-ing arrhythmias in ECG signals using wavelet transforms, IEEE Engineering inMedicine and Biology (2000) 104–109.
[5] V. Afonso, W. Tompkins, Detecting ventricular fibrillation, IEEE Engineering inMedicine and Biology (14) (1995) 152–159.
[6] L. Khadra, A.S. Al-Fahoum, H. Al-Nashash, Detection of life-threatening cardiacarrhythmias using the wavelet transformation, Medical & Biological Engineering& Computing 35 (1997) 626–632.
[7] I. Guler, E.D. Ubeyli, ECG beat classifier designed by combined neural network,Pattern Recognition 38 (2) (2005) 199–208.
[8] M. Engin, ECG beat classification using neuro-fuzzy network, Pattern RecognitionLetters 25 (15) (2004) 1715–1722.
[9] D.A. Coast, R.M. Stern, G.G. Cano, S.A. Briller, An approach to cardiac arrhythmiaanalysis using hidden Markov models, IEEE Transactions on Biomedical Engineer-ing 37 (1990) 826–836.
[10] J. Nadal, R.B. Panerai, Classification of cardiac arrhythmias using principal com-ponent analysis of the ECG, in: Annual International Conference of IEEE Eng. inMed. and Biology Society, vol. 13 (2), 1991, 580–581.
[11] S.N. Yu, K.T. Chou, A switchable scheme for ECG beat classification based onindependent component analysis, Expert Systems with Application 33 (2007)824–829.
[12] R.D. Throne, J.M. Jenkins, S.A. Winston, L.A. DiCarlo, A comparison of four newtime-domain techniques for discriminating nonmorphic ventricular tachycardiafrom sinus rhythm using ventricular waveform morphology, IEEE Transactions onBiomedical Engineering 38 (1991) 561–570.
[13] V. Krasteva, I. Jekova, QRS template matching for recognition of ventricularectopic beats, Annals of Biomedical Engineering 35 (12) (2007) 2065–2076.
[14] B.B. Mandelbrot, The Fractal Geometry of Nature, Freeman, CA, 1983.[15] A.P. Pentland, Fractal based description of natural scenes, IEEE Transactions on
Pattern Analysis and Machine Intelligence PAMI-6 6 (1984) 661–674.[16] E. Bayraktar, V. Poor, R. Sircar, Estimating the fractal dimension of the sp 500
index using wavelet analysis, International Journal of Theoretical and AppliedFinance 7 (5) (2004) 615–643.
[17] L.M. Kaplan, Extended fractal analysis of texture classification and segmentation,IEEE Transactions on Image Processing 8 (11) (1999) 1572–1585.
[18] E.E. Peters, Fractal Market Analysis, John Wiley and Sons, 1994.[19] Y.X. Tian, C. Chen, X.Y. Zou, P.X. Cai, J.Y. Mo, Study on fractal characteristics of the
coding sequence in DNA, Chinese Journal of Chemistry 24 (3) (2006) 423–429.[20] J.B. Bassingthwaighte, L.S. Liebovitch, B.J. West, Fractal Physiology, Oxford
University Press, New York, 1994.[21] B.J. West, R. Zhang, A.W. Sanders, S. Miniyar, J.H. Zuckerman, B.D. Levine, Fractal
fluctuations in cardiac time series, Physica A 270 (1999) 309–324.[22] P.Y. Muller, N. Contento, H. Rix, Fractal dimension on ECG, Engineering in
Medicine and Biology Society 14 (3) (1992) 977–978.
[23] K.T. Lai, K.L. Chan, Real-time classification of electrocardiogram based on fractaland correlation analyses, Engineering in Medicine and Biology Society 20 (1)(1998) 119–122.
[24] A.N. Esgiar, P.K. Chakravorty, Electrocardiogram signal classification based onfractal features, Computers in Cardiology 31 (2004) 661–664.
[25] P.C. Ivanov, L.A.N. Amaral, A.L. Goldberger, S. Havlin, M.G. Rosenblum, Z.R. Struzik,Multifractality in human heart beat dynamics, Nature 5 (1999) 399–461.
[26] G. Wang, H. Huang, H. Xie, Z. Wang, X. Hu, Multifractal analysis of ventricularfibrillation and ventricular tachycardia, Medical Engineering and Physics 29(2007) 375–379.
[27] S. Raghav, A.K. Mishra, Fractal feature based ECG arrhythmia classification, in:Proceedings of IEEE TENCON 2008.
[28] Y.H. Hu, S. Palreddy, W.J. Tompkins, A patient-adaptable ECG beat classifier usinga mixture of experts approach, IEEE Transactions on Biomedical Engineering (9)(1997) 891–900.
[29] R. Watrous, G. Towell, A patient adaptive neural network ECG patient monitoringalgorithm, Computers in Cardiology (1995) 229–232.
[30] J. Theiler, Estimating fractal dimension, Journal of the Optical Society of America A7 (6) (1990) 1055–1073.
[31] S. Spasic, Spectral and fractal analysis of biosignals and coloured noise, in:International Symposium on Intelligent systems and Informatics, 2007, 147–149.
[32] B. James, G.M. Raymond, Evaluating rescaled range analysis for time series, Annalsof Biomedical Engineering 22 (4) (1994) 432–444.
[33] A. Block, W. Von Bloh, H.J. Schellnhuber, Efficient box-counting determination ofgeneralized fractal dimensions, Physical Review A 42 (4) (1990) 1869–1874.
[34] T. Higuchi, Approach to an irregular time series on the basis of the fractal theory,Physics D31 (1988) 277–283.
[35] Z. Wang, D. Guo, X. Li, Y. Fei, Estimating Hurst exponent with wavelet packet,Computer-Aided Industrial Design and Conceptual Design, 2006. CAIDCD’06. 7thInternational Conference on (2006) 1–4
[36] W. Kinsner, Batch and real-time computation of a fractal dimension based onvariance of a time series, Technical Report, DEL 94-6.
[37] MIT-BIH Arrhythmia Database, http://www.physionet.ph.biu.ac.il/physiobank/database/mitdb/.
[38] A.K. Mishra, Separability indices and their use in radar signal based targetrecognition, IEICE Electronics Express 6 (14) (2009) 1000–1005.
[39] C. Thornton, Separability is a learner’s best friend, in: Proceedings of the FourthNeural Computation and Psychology Workshop: Connectionist Representations,2008, pp. 40–47.
[40] C. Scheler, R. Pfelfer, Y. Kunyloshi, Embedded neural networks: exploiting con-straints, Neural Networks 11 (7–8) (1998) 1551–1569.
[41] G. Anthony, H. Ruther, Comparison of feature selection techniques for SVMclassification, in: International Symposium on Physical Measurement and Signa-ture in Remote sensing, ISPMSRS, 2007.
[42] K. Fukunaga, Introduction to Statistical Pattern Recognition, Academic Press,1990.
[43] M. Rahman, P. Bhattacharya, B. Desai, Similarity searching in image retrieval withstatistical distance measures and supervised learning, Lecture Notes in ComputerScience 3686/2005 (2005) 315–324.
[44] G.K. Prasad, J.S. Sahambi, Classification of ECG arrhythmias using multi-resolutionanalysis and neural networks, TENCON 2003. Conference on Convergent Tech-nologies for Asia-Pacific Region 1.
[45] K. Minami, H. Nakajima, T. Toyoshima, Real-time discrimination of ventriculartachyarrhythmia with Fourier-transform neural network, IEEE Transactions onBiomedical Engineering 46 (2) (1999) 179–185.