Edited by
Electrical Properties of Model Lipid Membranes
Monika Naumowicz
Printed Edition of the Special Issue Published in Membranes
www.mdpi.com/journal/membranes

Electrical Properties of Model LipidMembranes

Electrical Properties of Model LipidMembranes
Editor
Monika Naumowicz
MDPI ‚ Basel ‚ Beijing ‚ Wuhan ‚ Barcelona ‚ Belgrade ‚ Manchester ‚ Tokyo ‚ Cluj ‚ Tianjin
Editor
Monika Naumowicz
Faculty of Chemistry
University of Bialystok
Bialystok
Poland
Editorial Office
MDPI
St. Alban-Anlage 66
4052 Basel, Switzerland
This is a reprint of articles from the Special Issue published online in the open access journal
Membranes (ISSN 2077-0375) (available at: www.mdpi.com/journal/membranes/special issues/EP
MLM).
For citation purposes, cite each article independently as indicated on the article page online and as
indicated below:
LastName, A.A.; LastName, B.B.; LastName, C.C. Article Title. Journal Name Year, Volume Number,
Page Range.
ISBN 978-3-0365-4058-0 (Hbk)
ISBN 978-3-0365-4057-3 (PDF)
© 2022 by the authors. Articles in this book are Open Access and distributed under the Creative
Commons Attribution (CC BY) license, which allows users to download, copy and build upon
published articles, as long as the author and publisher are properly credited, which ensures maximum
dissemination and a wider impact of our publications.
The book as a whole is distributed by MDPI under the terms and conditions of the Creative Commons
license CC BY-NC-ND.
Contents
Preface to ”Electrical Properties of Model Lipid Membranes” . . . . . . . . . . . . . . . . . . . . vii
Monika Naumowicz, Marcin Zajac, Magdalena Kusaczuk, Miroslav Gal and JoannaKotynskaElectrophoretic Light Scattering and Electrochemical Impedance Spectroscopy Studies of LipidBilayers Modified by Cinnamic Acid and Its Hydroxyl DerivativesReprinted from: Membranes 2020, 10, 343, doi:10.3390/membranes10110343 . . . . . . . . . . . . 1
Damian Dziubak, Kamil Strzelak and Slawomir SekElectrochemical Properties of Lipid Membranes Self-Assembled from BicellesReprinted from: Membranes 2020, 11, 11, doi:10.3390/membranes11010011 . . . . . . . . . . . . . 23
Anna Chachaj-Brekiesz, Jan Kobierski, Anita Wnetrzak and Patrycja Dynarowicz-LatkaElectrical Properties of Membrane Phospholipids in Langmuir MonolayersReprinted from: Membranes 2021, 11, 53, doi:10.3390/membranes11010053 . . . . . . . . . . . . . 37
Daniela MeleleoStudy of Resveratrol’s Interaction with Planar Lipid Models: Insights into Its Location in LipidBilayersReprinted from: Membranes 2021, 11, 132, doi:10.3390/membranes11020132 . . . . . . . . . . . . 49
Aneta D. Petelska, Michał Szeremeta, Joanna Kotynska and Anna Niemcunowicz-JanicaExperimental and Theoretical Approaches to Describing Interactions in Natural CellMembranes Occurring as a Result of Fatal Alcohol PoisoningReprinted from: Membranes 2021, 11, 189, doi:10.3390/membranes11030189 . . . . . . . . . . . . 65
Alenka Macek Lebar, Damijan Miklavcic, Malgorzata Kotulska and Peter KramarWater Pores in Planar Lipid Bilayers at Fast and Slow Rise of Transmembrane VoltageReprinted from: Membranes 2021, 11, 263, doi:10.3390/membranes11040263 . . . . . . . . . . . . 77
Victoria Vitkova, Vesela Yordanova, Galya Staneva, Ognyan Petkov, AngelinaStoyanova-Ivanova and Krassimira Antonova et al.Dielectric Properties of Phosphatidylcholine Membranes and the Effect of SugarsReprinted from: Membranes 2021, 11, 847, doi:10.3390/membranes11110847 . . . . . . . . . . . . 93
Jeel Raval, Ekaterina Gongadze, Metka Bencina, Ita Junkar, Niharika Rawat and LukaMesarec et al.Mechanical and Electrical Interaction of Biological Membranes with Nanoparticles andNanostructured SurfacesReprinted from: Membranes 2021, 11, 533, doi:10.3390/membranes11070533 . . . . . . . . . . . . 115
Marcin Zajac, Joanna Kotynska, Mateusz Worobiczuk, Joanna Breczko and MonikaNaumowiczThe Effect of Submicron Polystyrene on the Electrokinetic Potential of Cell Membranes of RedBlood Cells and PlateletsReprinted from: Membranes 2022, 12, 366, doi:10.3390/membranes12040366 . . . . . . . . . . . . 135
v

Preface to ”Electrical Properties of Model LipidMembranes”
This book presents the significant recent progress that has been made recently in the study of the
electrical properties of various model membrane systems used for mimicking biological membranes.
The book contains nine articles: eight research articles and one review. The complete description of
each study and the main results are presented in more detail in the full manuscript, which the reader
is invited to read.
Studies of the electrical properties of model lipid membranes have been carried out for many
years. However, there are still many issues that have not been verified experimentally and for which
the existing results are incomplete or inconsistent. Therefore, the main objective of this book was to
collect recent scientific and review articles on the electrical properties of model lipid membranes. This
objective has been successfully achieved, for which I express heartfelt appreciation to all authors and
reviewers for their excellent contributions.
Monika Naumowicz
Editor
vii

membranes
Article
Electrophoretic Light Scattering and ElectrochemicalImpedance Spectroscopy Studies of Lipid BilayersModified by Cinnamic Acid and ItsHydroxyl Derivatives
Monika Naumowicz 1,* , Marcin Zajac 2, Magdalena Kusaczuk 3, Miroslav Gál 4
and Joanna Kotynska 1
1 Department of Physical Chemistry, Faculty of Chemistry, University of Bialystok, K. Ciolkowskiego 1K,15-245 Bialystok, Poland; [email protected]
2 Doctoral School of Exact and Natural Sciences, University of Bialystok, K. Ciolkowskiego 1K,15-245 Bialystok, Poland; [email protected]
3 Department of Pharmaceutical Biochemistry, Medical University of Bialystok, Mickiewicza 2A,15-222 Bialystok, Poland; [email protected]
4 Department of Inorganic Technology, Faculty of Chemical and Food Technology,Slovak University of Technology, Radlinského 9, 812 37 Bratislava, Slovakia; [email protected]
* Correspondence: [email protected]; Tel.: +48-8573-880-71
Received: 23 October 2020; Accepted: 13 November 2020; Published: 15 November 2020
Abstract: Pharmacological efficiency of active compounds is largely determined by their membranepermeability. Thus, identification of drug-membrane interactions seems to be a crucial elementdetermining drug-like properties of chemical agents. Yet, knowledge of this issue is still lacking.Since chemoprevention based on natural compounds such as cinnamic acid (CinA), p-coumaric acid(p-CoA) and ferulic (FA) is becoming a strong trend in modern oncopharmacology, determination ofphysicochemical properties of these anticancer compounds is highly important. Here, electrophoreticlight scattering and impedance spectroscopy were applied to study the effects of these phenolicacids on electrical properties of bilayers formed from 1,2-dioleoyl-sn-glycero-3-phosphocholine(DOPC), 1,2-diacyl-sn-glycero-3-phospho-l-serine (PS) or DOPC-PS mixture. After phenolic acidtreatment, the negative charge of membranes increased in alkaline pH solutions, but not in acidicones. The impedance data showed elevated values of both the electrical capacitance and the electricalresistance. We concluded that at acidic pH all tested compounds were able to solubilize into themembrane and permeate it. At neutral and alkaline pH, the CinA could be partially inserted into thebilayers, whereas p-CoA and FA could be anchored at the bilayer surface. Our results indicate that theelectrochemical methods might be crucial for predicting pharmacological activity and bioavailabilityof phenolic acids.
Keywords: cinnamic acid; p-coumaric acid; ferulic acid; phenolic compound; electrophoreticlight scattering; electrochemical impedance spectroscopy; phospholipid bilayers; liposomes;drug-membrane interaction; membrane biophysical study
1. Introduction
A growing body of evidence indicates dietary polyphenols to be efficient antioxidants counteractingnegative effects of oxidative stress accompanying many diseases such as cardiovascular diseases,inflammation, and also cancer [1–6]. In line with previous reports, many of these compounds may actas chemopreventive or even chemotherapeutic agents [5,7–9]. Specifically to malignant cells, cinnamic
1
Membranes 2020, 10, 343
acid (CinA) and its hydroxy derivatives have been shown to exhibit both antioxidant a antineoplasticactivity, with their cytostatic effect being largely related to their structural characteristics [10–13].However, the mode of action of CinA and its derivatives is still incompletely determined, but mayinvolve scavenging of reactive oxygen species, modulation of gene expression, activation of xenobioticsmetabolism-related enzymes, and regulation of signal transduction pathways essential for tumor cellgrowth and progression [14].
Despite their natural origin and many promising biological effects, bioavailability ofhydroxycinnamic acids presents certain limitations. Although working well in aqueous media,their hydrophilic nature is usually a restriction for lipophilic system protection [15]. Lipophilicityis a major physicochemical property of chemical substances, which affects their biological activities.It is known to be important for describing both pharmacodynamic and pharmacokinetic aspectsof drug action. In biological systems, lipophilicity largely determines key properties of potentialpharmacological agents, such as solubility of substances in biological fluids, penetration through thebiological membranes, rate of absorption, affinity to plasma and tissue proteins, and distributioninto the specific body compartments [16]. Lipophilicity is commonly expressed by the logarithm ofn-octanol/water partition coefficient (logP) for ionizable compounds of a neutral form of compounds.Initially, logP was considered important in drug and pesticide discovery and design, but now itis an essential characteristic of all chemicals. This is because logP largely determines chemicalsfate both inside a living organism and in the environment. LogP values are typically between −3(very hydrophilic) and +10 (extremely hydrophobic) [17]. For ionizable forms of compounds, thedistribution coefficient (logD) at a specific pH is also often used. As opposed to logP, which is onlyvalid for a single electrical species, logD represents the pH-dependent mixture of all electrical speciesoccurring at given pH [18].
Based on the observation that most medication drugs are relatively small and lipophilic molecules,Lipinski et al. formulated “the rule of five” (Ro5) [19]. This is a rule of thumb in determiningif a pharmacologically/biologically active chemical compound, a candidate for a drug, would bepotentially bioavailable via oral administration in humans [20]. According to Ro5, chemicals are lessprone to adsorb on the cell membrane and more likely to permeate the bilayer when their calculatedn-octanol/water partition coefficient (clogP) ≥ 5, they have ≥10 H-bond acceptors, ≥5 H-bond donors,and their molecular weight (MWT) exceeds 500 g/mol [19]. Because each threshold is a multiple of5, the rule was called Ro5. Molecules not complying with more than one of these rules may haveproblems with bioavailability [21].
To obtain lipophilicity parameters of significant pharmacokinetic and pharmacodynamic relevance,partition coefficients between (mostly but not exclusively) artificial membranes and water have beentested recently [22]. Monolayers and bilayers have been used for several decades as models ofbiomembranes to study solute/biological membranes interactions. A variety of lipids and theirmixtures may serve as components to prepare both types of these membrane models. Nevertheless,phospholipids tend to be the most widely exploited as they are easily reproducible and have wellstandardized systems [23]. These lipids are either negatively charged or zwitterionic (electricallyneutral due to an equal number of positive and negative charges). Phospholipids are amphipathic andoccur naturally in all living organisms as the major components of cell membranes. Most biologicalmembranes are characterized by the asymmetrical distribution of phospholipids within the inner andouter leaflets. The inner leaflet of the bilayer mainly consists of negatively charged lipids, such asphosphatidylserine (PS), while electrically neutral lipids, such as phosphatidylcholine (PC) andphosphatidylethanolamine (PE), are mostly located in the outer layer [24]. At physiological pH,negative charge of the outer leaflet lipids is due to low values of acid dissociation constant (pKa) of thephosphate moieties of the lipid head group [25].
Our understanding of the properties, function and structure of biological membranes hasbenefitted a lot from the experimental and theoretical studies of the electrical properties of lipid bilayers.Therefore, evaluation of the parameters such as surface charge density (σ) of the membrane is critical
2
Membranes 2020, 10, 343
for determination of the electrostatic interactions between membranes and their surrounding solutes.The surface charge of a lipid membrane, which may change with pH, depends also on the lipids presentin the outer layer and can be quantified by zeta-potential measurements using electrochemical lightscattering (ELS) technique. Zeta potential depends on a lots of parameters, including temperature, pH,conductivity (ionic strength), and solvent (viscosity). Small changes in any of these parameters canpotentially dramatically affect the zeta potential values [26].
In order to best mimic electrochemical conditions observed in natural membranes, model systemsof artificial bilayers ought to possess similar values of capacitance (Cm) and resistance (Rm) to thoseobserved in biological membranes. In this respect, the parallel plate capacitor model may serveas an estimator of the lipid bilayer capacitance. Assuming that typical hydrophobic thickness ofa membrane equals 4 nm and a relative permittivity of ranges from 2 to 4, the capacitance of thebilayer is supposed to be 0.5–1.0 µF/cm2. In fact, Cm values placing within this range have beenalready confirmed in experimental research [27–29]. Typical values of bilayer resistance are in therange 104
−107 Ω cm2 [30,31]. The measurement of lipid membrane resistance may sometimes bedifficult and unreproducible. These variations are most likely a result of a leakage at the bilayersupport and/or trapped emulsified droplets [32]. Luckily, membrane capacitance and resistance can beeasily measured by electrochemical impedance spectroscopy (EIS). EIS is a technique that enables toextract the information not only about the bulk phase of tested material (e.g., dielectric constant andconductivity) but also about their inner and outer interfaces (e.g., interfacial region capacitance andderived quantities) [33].
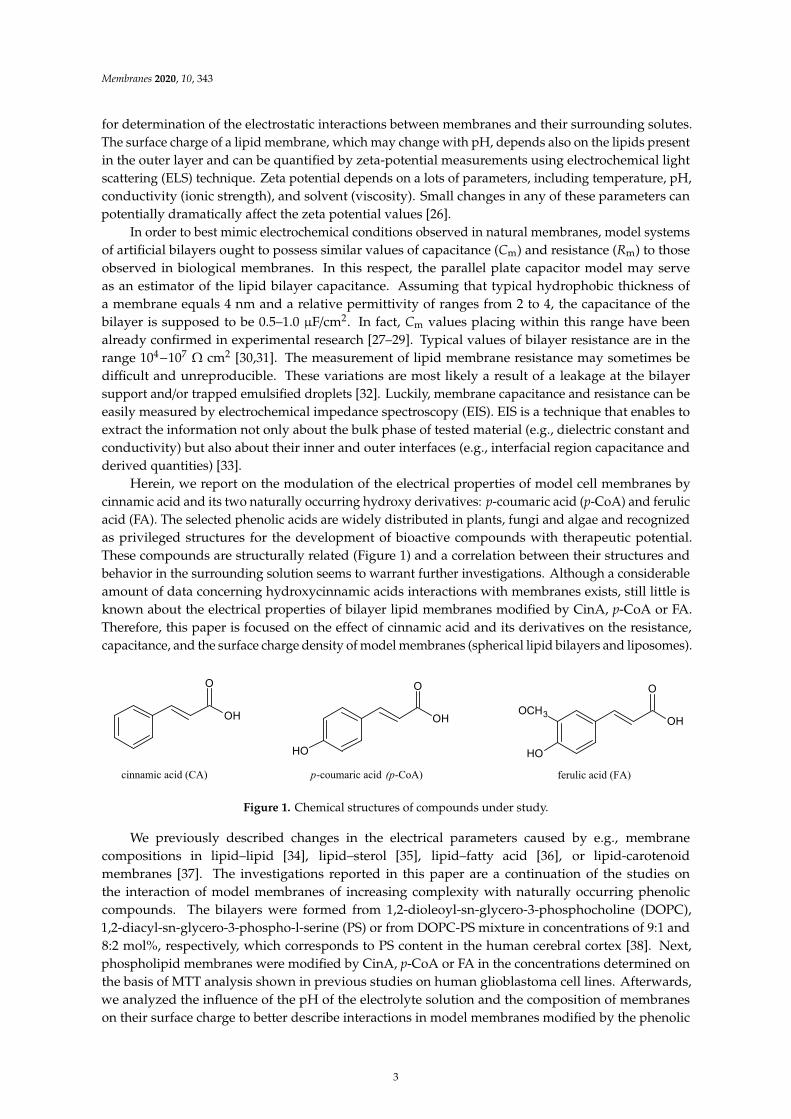
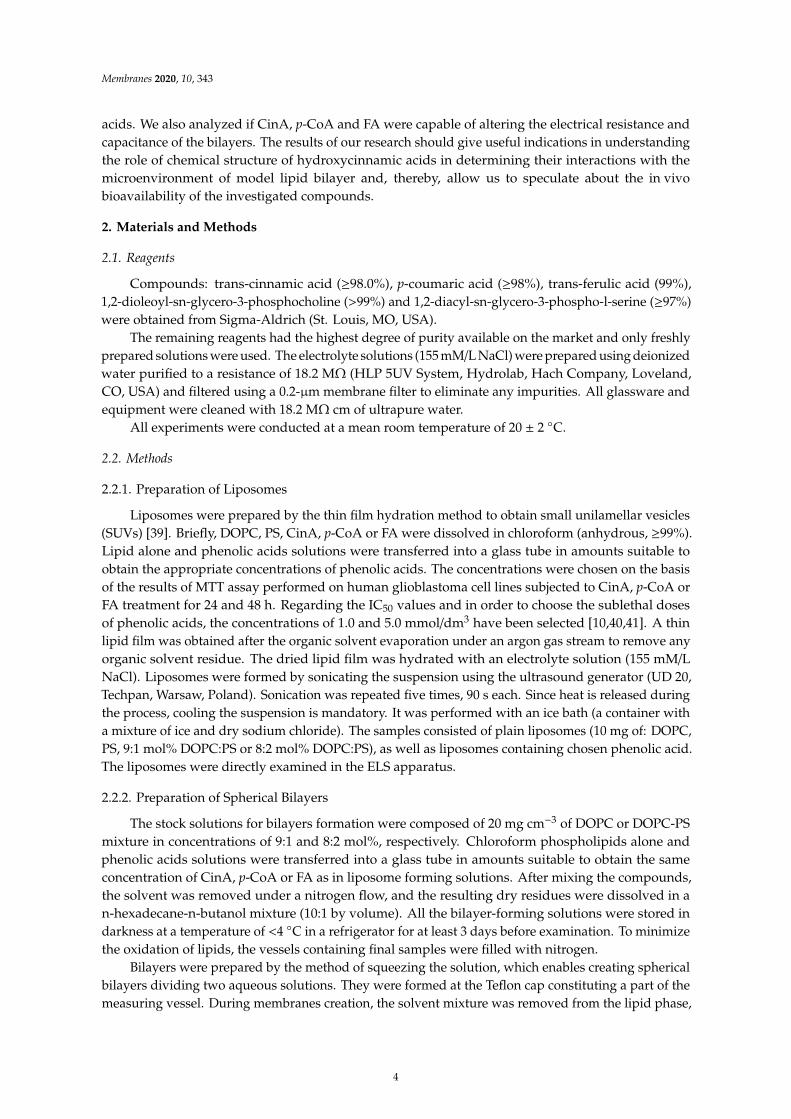
Herein, we report on the modulation of the electrical properties of model cell membranes bycinnamic acid and its two naturally occurring hydroxy derivatives: p-coumaric acid (p-CoA) and ferulicacid (FA). The selected phenolic acids are widely distributed in plants, fungi and algae and recognizedas privileged structures for the development of bioactive compounds with therapeutic potential.These compounds are structurally related (Figure 1) and a correlation between their structures andbehavior in the surrounding solution seems to warrant further investigations. Although a considerableamount of data concerning hydroxycinnamic acids interactions with membranes exists, still little isknown about the electrical properties of bilayer lipid membranes modified by CinA, p-CoA or FA.Therefore, this paper is focused on the effect of cinnamic acid and its derivatives on the resistance,capacitance, and the surface charge density of model membranes (spherical lipid bilayers and liposomes).
μ
− Ω
OH
O
OH
OH
O
OH
OCH3OH
O
cinnamic acid (CA) p-coumaric acid (p-CoA) ferulic acid (FA)
Figure 1. Chemical structures of compounds under study. Figure 1. Chemical structures of compounds under study.
We previously described changes in the electrical parameters caused by e.g., membranecompositions in lipid–lipid [34], lipid–sterol [35], lipid–fatty acid [36], or lipid-carotenoidmembranes [37]. The investigations reported in this paper are a continuation of the studies onthe interaction of model membranes of increasing complexity with naturally occurring phenoliccompounds. The bilayers were formed from 1,2-dioleoyl-sn-glycero-3-phosphocholine (DOPC),1,2-diacyl-sn-glycero-3-phospho-l-serine (PS) or from DOPC-PS mixture in concentrations of 9:1 and8:2 mol%, respectively, which corresponds to PS content in the human cerebral cortex [38]. Next,phospholipid membranes were modified by CinA, p-CoA or FA in the concentrations determined onthe basis of MTT analysis shown in previous studies on human glioblastoma cell lines. Afterwards,we analyzed the influence of the pH of the electrolyte solution and the composition of membraneson their surface charge to better describe interactions in model membranes modified by the phenolic
3
Membranes 2020, 10, 343
acids. We also analyzed if CinA, p-CoA and FA were capable of altering the electrical resistance andcapacitance of the bilayers. The results of our research should give useful indications in understandingthe role of chemical structure of hydroxycinnamic acids in determining their interactions with themicroenvironment of model lipid bilayer and, thereby, allow us to speculate about the in vivobioavailability of the investigated compounds.
2. Materials and Methods
2.1. Reagents
Compounds: trans-cinnamic acid (≥98.0%), p-coumaric acid (≥98%), trans-ferulic acid (99%),1,2-dioleoyl-sn-glycero-3-phosphocholine (>99%) and 1,2-diacyl-sn-glycero-3-phospho-l-serine (≥97%)were obtained from Sigma-Aldrich (St. Louis, MO, USA).
The remaining reagents had the highest degree of purity available on the market and only freshlyprepared solutions were used. The electrolyte solutions (155 mM/L NaCl) were prepared using deionizedwater purified to a resistance of 18.2 MΩ (HLP 5UV System, Hydrolab, Hach Company, Loveland,CO, USA) and filtered using a 0.2-µm membrane filter to eliminate any impurities. All glassware andequipment were cleaned with 18.2 MΩ cm of ultrapure water.
All experiments were conducted at a mean room temperature of 20 ± 2 C.
2.2. Methods
2.2.1. Preparation of Liposomes
Liposomes were prepared by the thin film hydration method to obtain small unilamellar vesicles(SUVs) [39]. Briefly, DOPC, PS, CinA, p-CoA or FA were dissolved in chloroform (anhydrous, ≥99%).Lipid alone and phenolic acids solutions were transferred into a glass tube in amounts suitable toobtain the appropriate concentrations of phenolic acids. The concentrations were chosen on the basisof the results of MTT assay performed on human glioblastoma cell lines subjected to CinA, p-CoA orFA treatment for 24 and 48 h. Regarding the IC50 values and in order to choose the sublethal dosesof phenolic acids, the concentrations of 1.0 and 5.0 mmol/dm3 have been selected [10,40,41]. A thinlipid film was obtained after the organic solvent evaporation under an argon gas stream to remove anyorganic solvent residue. The dried lipid film was hydrated with an electrolyte solution (155 mM/LNaCl). Liposomes were formed by sonicating the suspension using the ultrasound generator (UD 20,Techpan, Warsaw, Poland). Sonication was repeated five times, 90 s each. Since heat is released duringthe process, cooling the suspension is mandatory. It was performed with an ice bath (a container witha mixture of ice and dry sodium chloride). The samples consisted of plain liposomes (10 mg of: DOPC,PS, 9:1 mol% DOPC:PS or 8:2 mol% DOPC:PS), as well as liposomes containing chosen phenolic acid.The liposomes were directly examined in the ELS apparatus.
2.2.2. Preparation of Spherical Bilayers
The stock solutions for bilayers formation were composed of 20 mg cm−3 of DOPC or DOPC-PSmixture in concentrations of 9:1 and 8:2 mol%, respectively. Chloroform phospholipids alone andphenolic acids solutions were transferred into a glass tube in amounts suitable to obtain the sameconcentration of CinA, p-CoA or FA as in liposome forming solutions. After mixing the compounds,the solvent was removed under a nitrogen flow, and the resulting dry residues were dissolved in an-hexadecane-n-butanol mixture (10:1 by volume). All the bilayer-forming solutions were stored indarkness at a temperature of <4 C in a refrigerator for at least 3 days before examination. To minimizethe oxidation of lipids, the vessels containing final samples were filled with nitrogen.
Bilayers were prepared by the method of squeezing the solution, which enables creating sphericalbilayers dividing two aqueous solutions. They were formed at the Teflon cap constituting a part of themeasuring vessel. During membranes creation, the solvent mixture was removed from the lipid phase,
4
Membranes 2020, 10, 343
resulting in membranes with the same composition as in stock solutions. Bilayers were monitoredboth electrically and optically during the entire process of formation. Measurements were initiated10–15 min after the membranes turned completely black. Membrane images were taken by color CCDcamera using the WinFast PVR program. The bilayer areas were calculated from the photographs,taking into consideration the spherical nature of the surface and employing the Makroaufmassprogramprogram [42]. The area of the spherical membranes was about 6 × 10⁻² cm2. More details regardingthe procedure for the membrane formation are given in our previous works [31,36,37].
2.2.3. Electrophoretic Light Scattering Measurements
Microelectrophoretic mobility of the liposomes was obtained by performing micro-electrophoreticassessments on samples using ELS technique. The measurements were performed by Zetasizer NanoZS apparatus (Malvern Instruments, Malvern, United Kingdom). The xperiment was carried outas a function of pH using a WTW InoLab pH 720 laboratory meter (WTW, Weinheim, Germany).The samples were suspended in 155 mM/L NaCl solution and titrated to the desired pH (range 2–10,every ± 0.3 units) with HCl or NaOH. Six measurements were made (each covering 100–200 seriesfor a duration of 5 s) for each pH value per sample. Experiments were performed three times withsimilar results.
The surface charge density δ depends on electrophoretic mobility as described by the followingequation [43]:
δ =η · u
d(1)
where η is the viscosity of the solution, u is the electrophoretic mobility, and d is called the diffuselayer thickness.
The diffuse layer thickness is defined as [44]:
d =
√
ε·εo·R·T
2·F2·I(2)
where: R represents the gas constant, T—the temperature, F—the Faraday constant, I—the ionicstrength of 0.9% NaCl, and ε and ε0 refer to the permeability of the electric medium.
2.2.4. Liposome Size Determination
Dynamic light scattering (DLS) method was used to determine the size of the liposomes.The diameter of the particles was evaluated from the intensity of the dispersed light, which isthe standard parameter measured, by the Zetasizer Nano ZS software. A helium–neon (He–Ne) ionlaser at 633 nm wave length was used as the incident beam.
2.2.5. Electrochemical Impedance Measurements
Electrochemical impedance spectroscopy was conducted with an Autolab potentiostat (ModelPGSTAT302N, Metrohm, Poland) coupled with an FRA2 module. A four-probe cell with two Ag/AgClreference electrodes was employed for sensing and two platinum electrodes were used to carry thecurrent for the measurements. The cell was presented in [37]. EIS data were registered in the frequencyrange of 0.1–100,000 Hz. A sinusoidal voltage excitation of 4 mV versus open circuit potential wasapplied. No direct current was used.
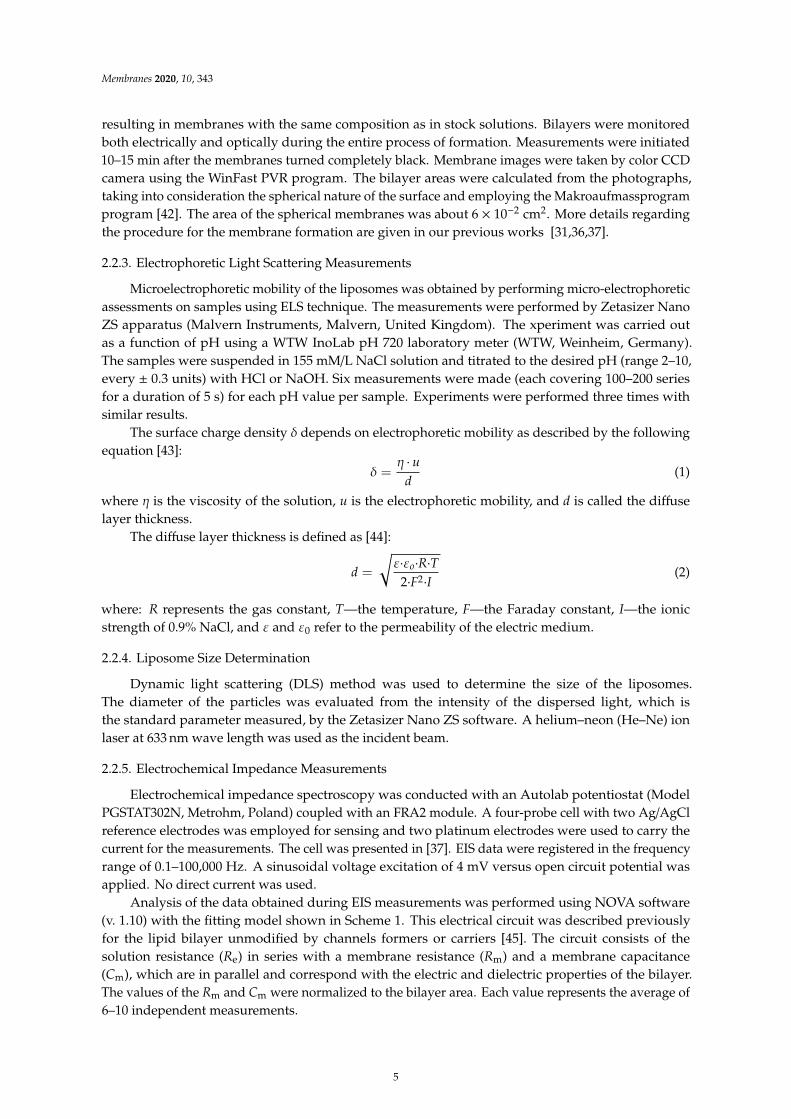
Analysis of the data obtained during EIS measurements was performed using NOVA software(v. 1.10) with the fitting model shown in Scheme 1. This electrical circuit was described previouslyfor the lipid bilayer unmodified by channels formers or carriers [45]. The circuit consists of thesolution resistance (Re) in series with a membrane resistance (Rm) and a membrane capacitance(Cm), which are in parallel and correspond with the electric and dielectric properties of the bilayer.The values of the Rm and Cm were normalized to the bilayer area. Each value represents the average of6–10 independent measurements.
5
Membranes 2020, 10, 343
σ
Scheme 1. The equivalent circuit model used to fit EIS data.
3. Results
In order to get a deeper insight into the interactions between CinA, p-CoA or FA and bilayer lipidmembranes, a systematic series of experiments was carried out using two representative concentrationsof each phenolic acid. From the results of previous tests carried out on human glioblastoma celllines [10,40,41], 1 and 5 mM/L concentrations have been selected. Firstly, the surface charge density ofphospholipid liposomal membranes (DOPC, PS, DOPC/PS 9:1 and DOPC/PS 8:2), plain and modifiedby phenolic acids, was calculated based on the electrophoretic light scattering (ELS) technique.Subsequently, the capacitance and resistance values of DOPC, DOPC/PS 9:1 or DOPC/PS 8:2 sphericalbilayers (plain and phenolic acid-modified) were obtained on the basis of the impedance data.
3.1. The Effect of Cinnamic Acid and Its Derivatives on Surface Charge Densities of Liposomal Membranes
To get insight into the surface charge density-modulatory properties of CinA, p-CoA and FA,the ELS technique has been engaged. The measurements were performed as a function of H+
concentration. In order to receive the values of pH-dependent electrophoretic mobility, liposomes weresuspended in 155 mM/L NaCl solution, which was further titrated to the adequate pH with concentratedNaOH or HCl. Surface charge density values were calculated on the basis of electrophoretic mobilityin accordance to Equation (1) provided in section “Materials and Methods”. Representative plots fromat least three independent experiments are shown.
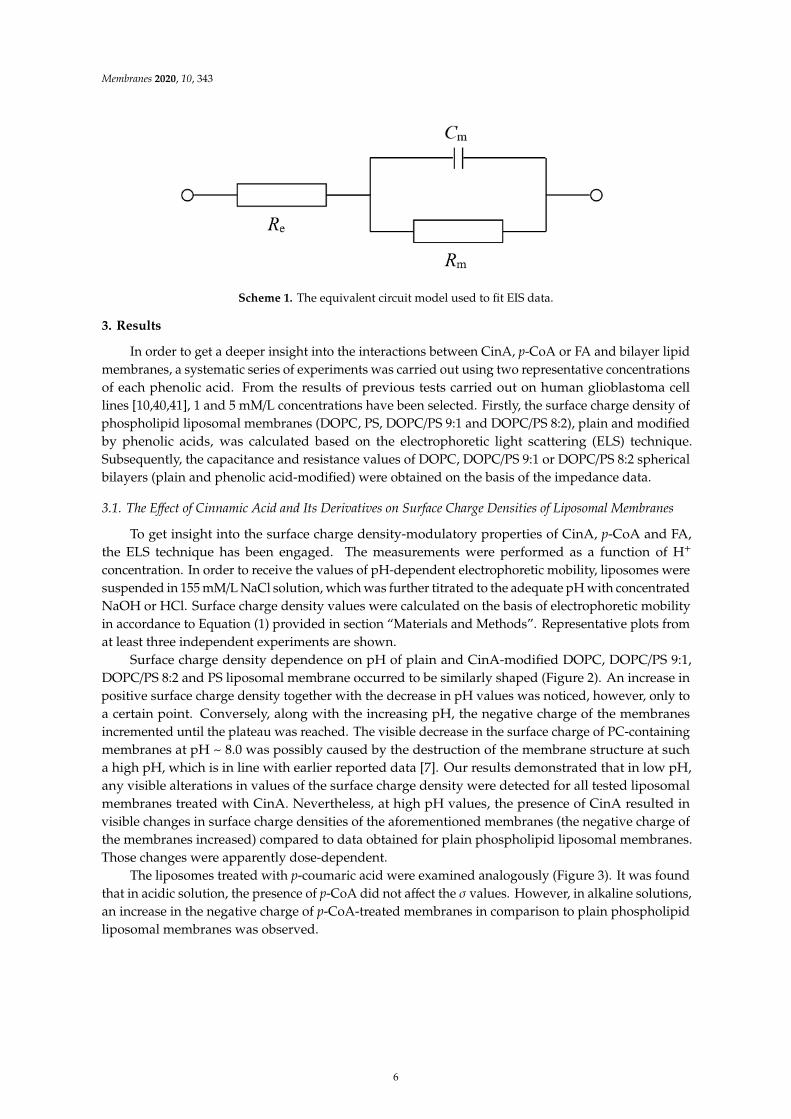
Surface charge density dependence on pH of plain and CinA-modified DOPC, DOPC/PS 9:1,DOPC/PS 8:2 and PS liposomal membrane occurred to be similarly shaped (Figure 2). An increase inpositive surface charge density together with the decrease in pH values was noticed, however, only toa certain point. Conversely, along with the increasing pH, the negative charge of the membranesincremented until the plateau was reached. The visible decrease in the surface charge of PC-containingmembranes at pH ~ 8.0 was possibly caused by the destruction of the membrane structure at sucha high pH, which is in line with earlier reported data [7]. Our results demonstrated that in low pH,any visible alterations in values of the surface charge density were detected for all tested liposomalmembranes treated with CinA. Nevertheless, at high pH values, the presence of CinA resulted invisible changes in surface charge densities of the aforementioned membranes (the negative charge ofthe membranes increased) compared to data obtained for plain phospholipid liposomal membranes.Those changes were apparently dose-dependent.
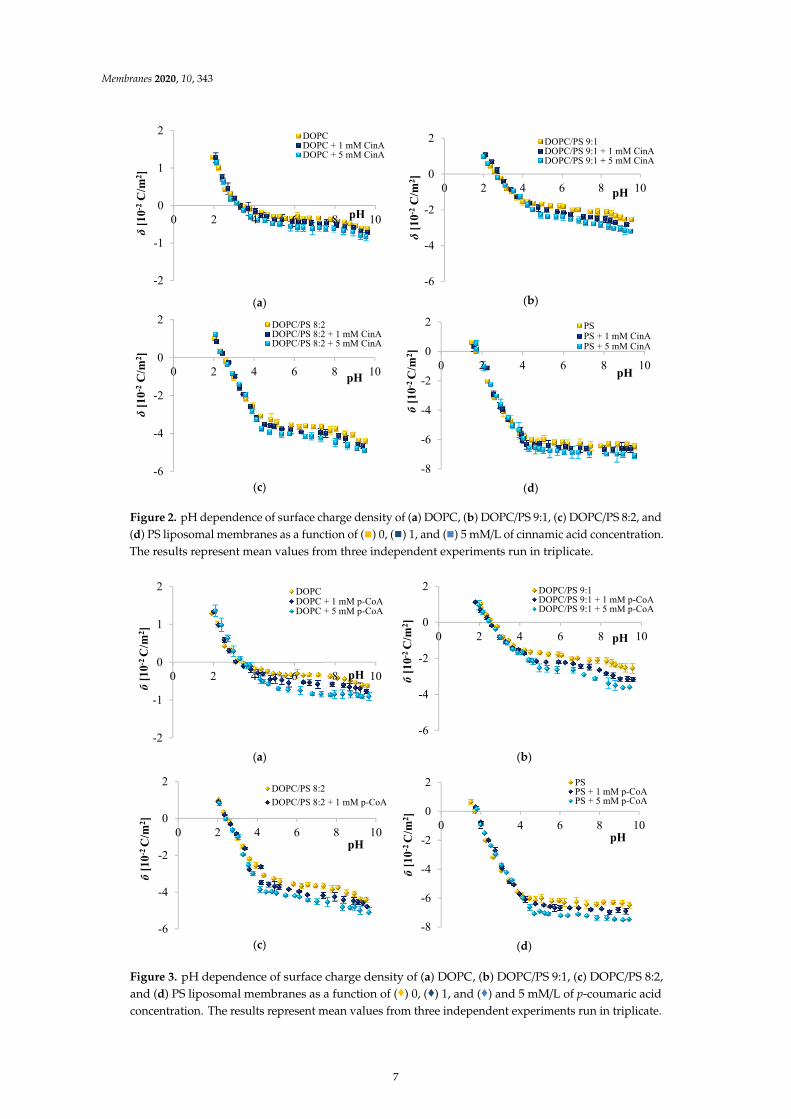
The liposomes treated with p-coumaric acid were examined analogously (Figure 3). It was foundthat in acidic solution, the presence of p-CoA did not affect the σ values. However, in alkaline solutions,an increase in the negative charge of p-CoA-treated membranes in comparison to plain phospholipidliposomal membranes was observed.
6
Membranes 2020, 10, 343
(a)
(b)
(c)
(d)
-2
-1
0
1
2
0 2 4 6 8 10
δ[1
0-2C
/m2 ]
pH
DOPCDOPC + 1 mM CinADOPC + 5 mM CinA
-6
-4
-2
0
2
0 2 4 6 8 10
δ[1
0-2C
/m2 ]
pH
DOPC/PS 9:1DOPC/PS 9:1 + 1 mM CinADOPC/PS 9:1 + 5 mM CinA
-6
-4
-2
0
2
0 2 4 6 8 10
δ[1
0-2C
/m2 ]
pH
DOPC/PS 8:2DOPC/PS 8:2 + 1 mM CinADOPC/PS 8:2 + 5 mM CinA
-8
-6
-4
-2
0
2
0 2 4 6 8 10
б[1
0-2 C
/m2 ]
pH
PSPS + 1 mM CinAPS + 5 mM CinA
-2
-1
0
1
2
0 2 4 6 8 10
б[1
0-2 C
/m2 ]
pH
DOPCDOPC + 1 mM p-CoADOPC + 5 mM p-CoA
-6
-4
-2
0
2
0 2 4 6 8 10
б[1
0-2 C
/m2 ]
pH
DOPC/PS 9:1DOPC/PS 9:1 + 1 mM p-CoADOPC/PS 9:1 + 5 mM p-CoA
-6
-4
-2
0
2
0 2 4 6 8 10
б[1
0-2 C
/m2 ]
pH
DOPC/PS 8:2DOPC/PS 8:2 + 1 mM p-CoA
-8
-6
-4
-2
0
2
0 2 4 6 8 10
б[1
0-2 C
/m2 ]
pH
PSPS + 1 mM p-CoAPS + 5 mM p-CoA
Figure 2. pH dependence of surface charge density of (a) DOPC, (b) DOPC/PS 9:1, (c) DOPC/PS 8:2, and(d) PS liposomal membranes as a function of (
osomal membranes as a function of () 0
-2
-1
0
1
2
0 2 4 6 8 10
δ[1
0-2C
/m2 ]
pH
DOPCDOPC + 1 mM CinADOPC + 5 mM CinA
-6
-4
-2
0
2
0 2 4 6 8 10
δ[1
0-2C
/m2 ]
pH
DOPC/PS 9:1DOPC/PS 9:1 + 1 mM CinADOPC/PS 9:1 + 5 mM CinA
-6
-4
-2
0
2
0 2 4 6 8 10
δ[1
0-2C
/m2 ]
pH
DOPC/PS 8:2DOPC/PS 8:2 + 1 mM CinADOPC/PS 8:2 + 5 mM CinA
-8
-6
-4
-2
0
2
0 2 4 6 8 10б
[10-2
C/m
2 ]pH
PSPS + 1 mM CinAPS + 5 mM CinA
-2
-1
0
1
2
0 2 4 6 8 10
б[1
0-2 C
/m2 ]
pH
DOPCDOPC + 1 mM p-CoADOPC + 5 mM p-CoA
-6
-4
-2
0
2
0 2 4 6 8 10
б[1
0-2 C
/m2 ]
pH
DOPC/PS 9:1DOPC/PS 9:1 + 1 mM p-CoADOPC/PS 9:1 + 5 mM p-CoA
-6
-4
-2
0
2
0 2 4 6 8 10
б[1
0-2 C
/m2 ]
pH
DOPC/PS 8:2DOPC/PS 8:2 + 1 mM p-CoA
-8
-6
-4
-2
0
2
0 2 4 6 8 10
б[1
0-2 C
/m2 ]
pH
PSPS + 1 mM p-CoAPS + 5 mM p-CoA
) 0, (
, () 1, and (
-2
-1
0
1
2
0 2 4 6 8 10
δ[1
0-2C
/m2 ]
pH
DOPCDOPC + 1 mM CinADOPC + 5 mM CinA
-6
-4
-2
0
2
0 2 4 6 8 10
δ[1
0-2C
/m2 ]
pH
DOPC/PS 9:1DOPC/PS 9:1 + 1 mM CinADOPC/PS 9:1 + 5 mM CinA
-6
-4
-2
0
2
0 2 4 6 8 10
δ[1
0-2C
/m2 ]
pH
DOPC/PS 8:2DOPC/PS 8:2 + 1 mM CinADOPC/PS 8:2 + 5 mM CinA
-8
-6
-4
-2
0
2
0 2 4 6 8 10б
[10-2
C/m
2 ]pH
PSPS + 1 mM CinAPS + 5 mM CinA
-2
-1
0
1
2
0 2 4 6 8 10
б[1
0-2 C
/m2 ]
pH
DOPCDOPC + 1 mM p-CoADOPC + 5 mM p-CoA
-6
-4
-2
0
2
0 2 4 6 8 10
б[1
0-2 C
/m2 ]
pH
DOPC/PS 9:1DOPC/PS 9:1 + 1 mM p-CoADOPC/PS 9:1 + 5 mM p-CoA
-6
-4
-2
0
2
0 2 4 6 8 10
б[1
0-2 C
/m2 ]
pH
DOPC/PS 8:2DOPC/PS 8:2 + 1 mM p-CoA
-8
-6
-4
-2
0
2
0 2 4 6 8 10
б[1
0-2 C
/m2 ]
pH
PSPS + 1 mM p-CoAPS + 5 mM p-CoA
) 1, and (
) 1, and ()
-2
-1
0
1
2
0 2 4 6 8 10
δ[1
0-2C
/m2 ]
pH
DOPCDOPC + 1 mM CinADOPC + 5 mM CinA
-6
-4
-2
0
2
0 2 4 6 8 10
δ[1
0-2C
/m2 ]
pH
DOPC/PS 9:1DOPC/PS 9:1 + 1 mM CinADOPC/PS 9:1 + 5 mM CinA
-6
-4
-2
0
2
0 2 4 6 8 10
δ[1
0-2C
/m2 ]
pH
DOPC/PS 8:2DOPC/PS 8:2 + 1 mM CinADOPC/PS 8:2 + 5 mM CinA
-8
-6
-4
-2
0
2
0 2 4 6 8 10б
[10-2
C/m
2 ]pH
PSPS + 1 mM CinAPS + 5 mM CinA
-2
-1
0
1
2
0 2 4 6 8 10
б[1
0-2 C
/m2 ]
pH
DOPCDOPC + 1 mM p-CoADOPC + 5 mM p-CoA
-6
-4
-2
0
2
0 2 4 6 8 10
б[1
0-2 C
/m2 ]
pH
DOPC/PS 9:1DOPC/PS 9:1 + 1 mM p-CoADOPC/PS 9:1 + 5 mM p-CoA
-6
-4
-2
0
2
0 2 4 6 8 10
б[1
0-2 C
/m2 ]
pH
DOPC/PS 8:2DOPC/PS 8:2 + 1 mM p-CoA
-8
-6
-4
-2
0
2
0 2 4 6 8 10
б[1
0-2 C
/m2 ]
pH
PSPS + 1 mM p-CoAPS + 5 mM p-CoA
) 5 mM/L of cinnamic acid concentration.The results represent mean values from three independent experiments run in triplicate.
(a)
(b)
(c)
(d)
-2
-1
0
1
2
0 2 4 6 8 10
δ[1
0-2C
/m2 ]
pH
DOPCDOPC + 1 mM CinADOPC + 5 mM CinA
-6
-4
-2
0
2
0 2 4 6 8 10
δ[1
0-2C
/m2 ]
pH
DOPC/PS 9:1DOPC/PS 9:1 + 1 mM CinADOPC/PS 9:1 + 5 mM CinA
-6
-4
-2
0
2
0 2 4 6 8 10
δ[1
0-2C
/m2 ]
pH
DOPC/PS 8:2DOPC/PS 8:2 + 1 mM CinADOPC/PS 8:2 + 5 mM CinA
-8
-6
-4
-2
0
2
0 2 4 6 8 10
б[1
0-2 C
/m2 ]
pH
PSPS + 1 mM CinAPS + 5 mM CinA
-2
-1
0
1
2
0 2 4 6 8 10
б[1
0-2 C
/m2 ]
pH
DOPCDOPC + 1 mM p-CoADOPC + 5 mM p-CoA
-6
-4
-2
0
2
0 2 4 6 8 10
б[1
0-2 C
/m2 ]
pH
DOPC/PS 9:1DOPC/PS 9:1 + 1 mM p-CoADOPC/PS 9:1 + 5 mM p-CoA
-6
-4
-2
0
2
0 2 4 6 8 10
б[1
0-2 C
/m2 ]
pH
DOPC/PS 8:2DOPC/PS 8:2 + 1 mM p-CoA
-8
-6
-4
-2
0
2
0 2 4 6 8 10
б[1
0-2 C
/m2 ]
pH
PSPS + 1 mM p-CoAPS + 5 mM p-CoA
Figure 3. pH dependence of surface charge density of (a) DOPC, (b) DOPC/PS 9:1, (c) DOPC/PS 8:2,and (d) PS liposomal membranes as a function of (
of (♦) 0 ♦ ♦
σσ
∼ ∼
-2
-1
0
1
2
0 2 4 6 8 10
б[1
0-2 C
/m2 ]
pH
DOPCDOPC + 1 mM FADOPC + 5 mM FA
-6
-4
-2
0
2
0 2 4 6 8 10
б[1
0-2C
/m2 ] pH
DOPC/PS 9:1DOPC/PS 9:1 + 1 mM FADOPC/PS 9:1 + 5 mM FA
-6
-4
-2
0
2
0 2 4 6 8 10
б[1
0-2 C
/m2 ] pH
DOPC/PS 8:2DOPC/PS 8:2 + 1 mM FADOPC/PS 8:2 + 5 mM FA
-8
-6
-4
-2
0
2
0 2 4 6 8 10
б[1
0-2 C
/m2 ] pH
PSPS + 1 mM FAPS + 5 mM FA
) 0, (
♦) 0, (♦) ♦
σσ
∼ ∼
-2
-1
0
1
2
0 2 4 6 8 10
б[1
0-2 C
/m2 ]
pH
DOPCDOPC + 1 mM FADOPC + 5 mM FA
-6
-4
-2
0
2
0 2 4 6 8 10
б[1
0-2C
/m2 ] pH
DOPC/PS 9:1DOPC/PS 9:1 + 1 mM FADOPC/PS 9:1 + 5 mM FA
-6
-4
-2
0
2
0 2 4 6 8 10
б[1
0-2 C
/m2 ] pH
DOPC/PS 8:2DOPC/PS 8:2 + 1 mM FADOPC/PS 8:2 + 5 mM FA
-8
-6
-4
-2
0
2
0 2 4 6 8 10
б[1
0-2 C
/m2 ] pH
PSPS + 1 mM FAPS + 5 mM FA
) 1, and (
♦ ♦ 1, and (♦) a
σσ
∼ ∼
-2
-1
0
1
2
0 2 4 6 8 10
б[1
0-2 C
/m2 ]
pH
DOPCDOPC + 1 mM FADOPC + 5 mM FA
-6
-4
-2
0
2
0 2 4 6 8 10
б[1
0-2C
/m2 ] pH
DOPC/PS 9:1DOPC/PS 9:1 + 1 mM FADOPC/PS 9:1 + 5 mM FA
-6
-4
-2
0
2
0 2 4 6 8 10
б[1
0-2 C
/m2 ] pH
DOPC/PS 8:2DOPC/PS 8:2 + 1 mM FADOPC/PS 8:2 + 5 mM FA
-8
-6
-4
-2
0
2
0 2 4 6 8 10
б[1
0-2 C
/m2 ] pH
PSPS + 1 mM FAPS + 5 mM FA
) and 5 mM/L of p-coumaric acidconcentration. The results represent mean values from three independent experiments run in triplicate.
7
Membranes 2020, 10, 343
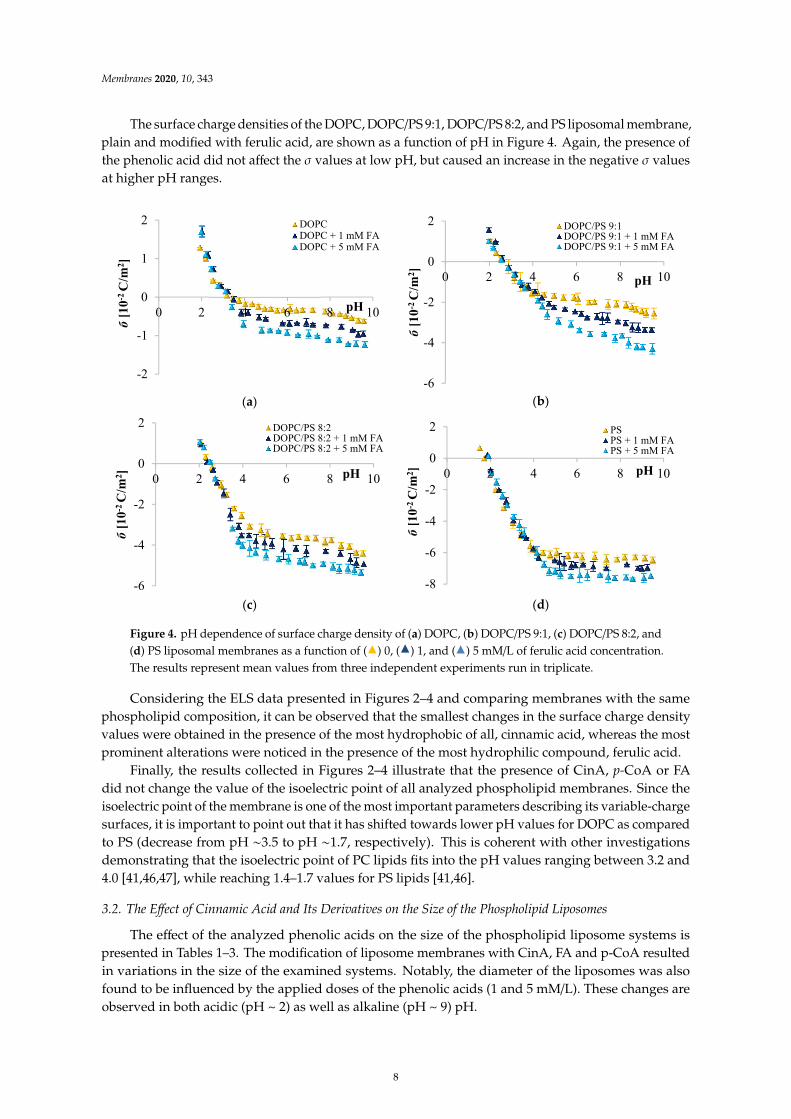
The surface charge densities of the DOPC, DOPC/PS 9:1, DOPC/PS 8:2, and PS liposomal membrane,plain and modified with ferulic acid, are shown as a function of pH in Figure 4. Again, the presence ofthe phenolic acid did not affect the σ values at low pH, but caused an increase in the negative σ valuesat higher pH ranges.
♦ ♦ ♦
σσ
(a)
(b)
(c)
(d)
∼ ∼
-2
-1
0
1
2
0 2 4 6 8 10
б[1
0-2 C
/m2 ]
pH
DOPCDOPC + 1 mM FADOPC + 5 mM FA
-6
-4
-2
0
2
0 2 4 6 8 10
б[1
0-2C
/m2 ] pH
DOPC/PS 9:1DOPC/PS 9:1 + 1 mM FADOPC/PS 9:1 + 5 mM FA
-6
-4
-2
0
2
0 2 4 6 8 10
б[1
0-2 C
/m2 ] pH
DOPC/PS 8:2DOPC/PS 8:2 + 1 mM FADOPC/PS 8:2 + 5 mM FA
-8
-6
-4
-2
0
2
0 2 4 6 8 10
б[1
0-2 C
/m2 ] pH
PSPS + 1 mM FAPS + 5 mM FA
Figure 4. pH dependence of surface charge density of (a) DOPC, (b) DOPC/PS 9:1, (c) DOPC/PS 8:2, and(d) PS liposomal membranes as a function of (
♦ ♦ ♦
σσ
function of () 0,
∼ ∼
-2
-1
0
1
2
0 2 4 6 8 10
б[1
0-2 C
/m2 ]
pH
DOPCDOPC + 1 mM FADOPC + 5 mM FA
-6
-4
-2
0
2
0 2 4 6 8 10
б[1
0-2C
/m2 ] pH
DOPC/PS 9:1DOPC/PS 9:1 + 1 mM FADOPC/PS 9:1 + 5 mM FA
-6
-4
-2
0
2
0 2 4 6 8 10
б[1
0-2 C
/m2 ] pH
DOPC/PS 8:2DOPC/PS 8:2 + 1 mM FADOPC/PS 8:2 + 5 mM FA
-8
-6
-4
-2
0
2
0 2 4 6 8 10
б[1
0-2 C
/m2 ] pH
PSPS + 1 mM FAPS + 5 mM FA
) 0, (
♦ ♦ ♦
σσ
) 0, () 1, an
∼ ∼
-2
-1
0
1
2
0 2 4 6 8 10
б[1
0-2 C
/m2 ]
pH
DOPCDOPC + 1 mM FADOPC + 5 mM FA
-6
-4
-2
0
2
0 2 4 6 8 10
б[1
0-2C
/m2 ] pH
DOPC/PS 9:1DOPC/PS 9:1 + 1 mM FADOPC/PS 9:1 + 5 mM FA
-6
-4
-2
0
2
0 2 4 6 8 10
б[1
0-2 C
/m2 ] pH
DOPC/PS 8:2DOPC/PS 8:2 + 1 mM FADOPC/PS 8:2 + 5 mM FA
-8
-6
-4
-2
0
2
0 2 4 6 8 10
б[1
0-2 C
/m2 ] pH
PSPS + 1 mM FAPS + 5 mM FA
) 1, and (
♦ ♦ ♦
σσ
d () 5 mM/L
∼ ∼
-2
-1
0
1
2
0 2 4 6 8 10
б[1
0-2 C
/m2 ]
pH
DOPCDOPC + 1 mM FADOPC + 5 mM FA
-6
-4
-2
0
2
0 2 4 6 8 10
б[1
0-2C
/m2 ] pH
DOPC/PS 9:1DOPC/PS 9:1 + 1 mM FADOPC/PS 9:1 + 5 mM FA
-6
-4
-2
0
2
0 2 4 6 8 10
б[1
0-2 C
/m2 ] pH
DOPC/PS 8:2DOPC/PS 8:2 + 1 mM FADOPC/PS 8:2 + 5 mM FA
-8
-6
-4
-2
0
2
0 2 4 6 8 10
б[1
0-2 C
/m2 ] pH
PSPS + 1 mM FAPS + 5 mM FA
) 5 mM/L of ferulic acid concentration.The results represent mean values from three independent experiments run in triplicate.
Considering the ELS data presented in Figures 2–4 and comparing membranes with the samephospholipid composition, it can be observed that the smallest changes in the surface charge densityvalues were obtained in the presence of the most hydrophobic of all, cinnamic acid, whereas the mostprominent alterations were noticed in the presence of the most hydrophilic compound, ferulic acid.
Finally, the results collected in Figures 2–4 illustrate that the presence of CinA, p-CoA or FAdid not change the value of the isoelectric point of all analyzed phospholipid membranes. Since theisoelectric point of the membrane is one of the most important parameters describing its variable-chargesurfaces, it is important to point out that it has shifted towards lower pH values for DOPC as comparedto PS (decrease from pH ∼3.5 to pH ∼1.7, respectively). This is coherent with other investigationsdemonstrating that the isoelectric point of PC lipids fits into the pH values ranging between 3.2 and4.0 [41,46,47], while reaching 1.4–1.7 values for PS lipids [41,46].
3.2. The Effect of Cinnamic Acid and Its Derivatives on the Size of the Phospholipid Liposomes
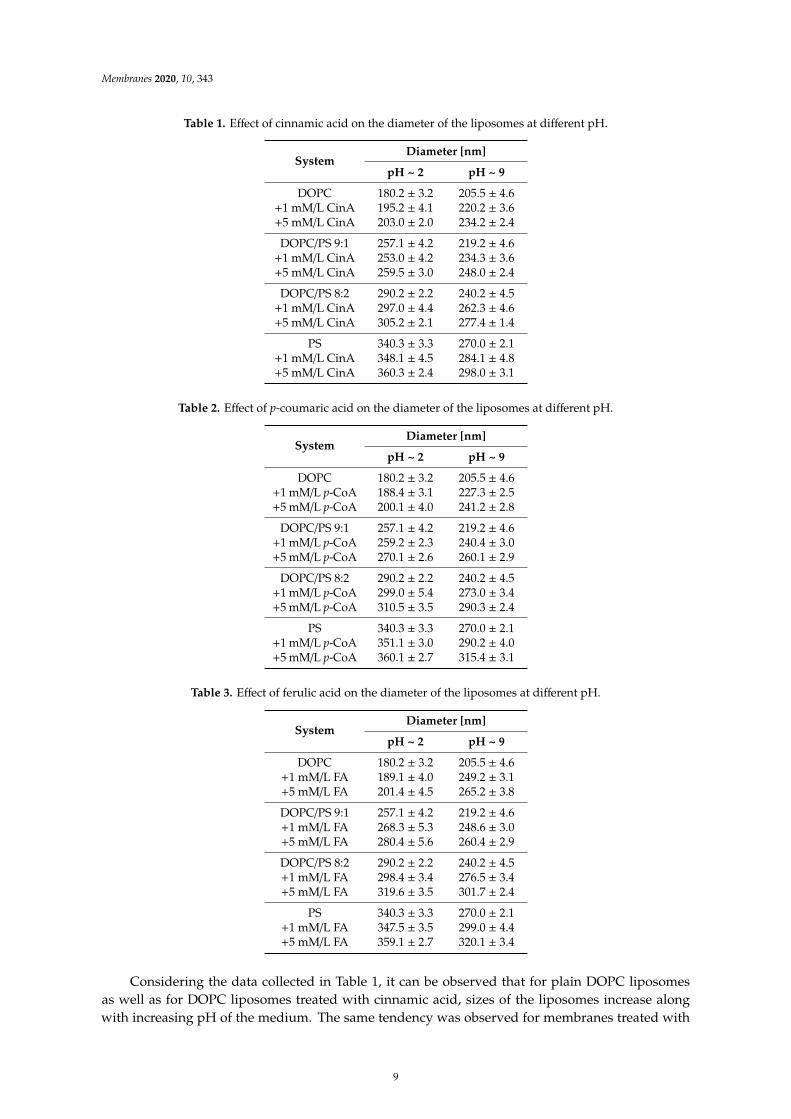
The effect of the analyzed phenolic acids on the size of the phospholipid liposome systems ispresented in Tables 1–3. The modification of liposome membranes with CinA, FA and p-CoA resultedin variations in the size of the examined systems. Notably, the diameter of the liposomes was alsofound to be influenced by the applied doses of the phenolic acids (1 and 5 mM/L). These changes areobserved in both acidic (pH ~ 2) as well as alkaline (pH ~ 9) pH.
8
Membranes 2020, 10, 343
Table 1. Effect of cinnamic acid on the diameter of the liposomes at different pH.
SystemDiameter [nm]
pH ~ 2 pH ~ 9
DOPC 180.2 ± 3.2 205.5 ± 4.6+1 mM/L CinA 195.2 ± 4.1 220.2 ± 3.6+5 mM/L CinA 203.0 ± 2.0 234.2 ± 2.4
DOPC/PS 9:1 257.1 ± 4.2 219.2 ± 4.6+1 mM/L CinA 253.0 ± 4.2 234.3 ± 3.6+5 mM/L CinA 259.5 ± 3.0 248.0 ± 2.4
DOPC/PS 8:2 290.2 ± 2.2 240.2 ± 4.5+1 mM/L CinA 297.0 ± 4.4 262.3 ± 4.6+5 mM/L CinA 305.2 ± 2.1 277.4 ± 1.4
PS 340.3 ± 3.3 270.0 ± 2.1+1 mM/L CinA 348.1 ± 4.5 284.1 ± 4.8+5 mM/L CinA 360.3 ± 2.4 298.0 ± 3.1
Table 2. Effect of p-coumaric acid on the diameter of the liposomes at different pH.
SystemDiameter [nm]
pH ~ 2 pH ~ 9
DOPC 180.2 ± 3.2 205.5 ± 4.6+1 mM/L p-CoA 188.4 ± 3.1 227.3 ± 2.5+5 mM/L p-CoA 200.1 ± 4.0 241.2 ± 2.8
DOPC/PS 9:1 257.1 ± 4.2 219.2 ± 4.6+1 mM/L p-CoA 259.2 ± 2.3 240.4 ± 3.0+5 mM/L p-CoA 270.1 ± 2.6 260.1 ± 2.9
DOPC/PS 8:2 290.2 ± 2.2 240.2 ± 4.5+1 mM/L p-CoA 299.0 ± 5.4 273.0 ± 3.4+5 mM/L p-CoA 310.5 ± 3.5 290.3 ± 2.4
PS 340.3 ± 3.3 270.0 ± 2.1+1 mM/L p-CoA 351.1 ± 3.0 290.2 ± 4.0+5 mM/L p-CoA 360.1 ± 2.7 315.4 ± 3.1
Table 3. Effect of ferulic acid on the diameter of the liposomes at different pH.
SystemDiameter [nm]
pH ~ 2 pH ~ 9
DOPC 180.2 ± 3.2 205.5 ± 4.6+1 mM/L FA 189.1 ± 4.0 249.2 ± 3.1+5 mM/L FA 201.4 ± 4.5 265.2 ± 3.8
DOPC/PS 9:1 257.1 ± 4.2 219.2 ± 4.6+1 mM/L FA 268.3 ± 5.3 248.6 ± 3.0+5 mM/L FA 280.4 ± 5.6 260.4 ± 2.9
DOPC/PS 8:2 290.2 ± 2.2 240.2 ± 4.5+1 mM/L FA 298.4 ± 3.4 276.5 ± 3.4+5 mM/L FA 319.6 ± 3.5 301.7 ± 2.4
PS 340.3 ± 3.3 270.0 ± 2.1+1 mM/L FA 347.5 ± 3.5 299.0 ± 4.4+5 mM/L FA 359.1 ± 2.7 320.1 ± 3.4
Considering the data collected in Table 1, it can be observed that for plain DOPC liposomesas well as for DOPC liposomes treated with cinnamic acid, sizes of the liposomes increase alongwith increasing pH of the medium. The same tendency was observed for membranes treated with
9
Membranes 2020, 10, 343
p-coumaric and ferulic acids (Tables 2 and 3). However, the opposite trend was noted for negativelycharged liposomes (DOPC/PS 9:1, DOPC/PS 8:2, PS). Here, sizes of both plain and modified liposomesdecreased together with increasing pH. In acidic pH, the diameter of phospholipid liposomes modifiedwith cinnamic acid did not vary significantly from the diameter of liposomes modified with p-coumaricand ferulic acids. In alkaline pH, phospholipid liposomes treated with ferulic acid exhibited the largestsizes, whereas those treated with cinnamic acid were the smallest.
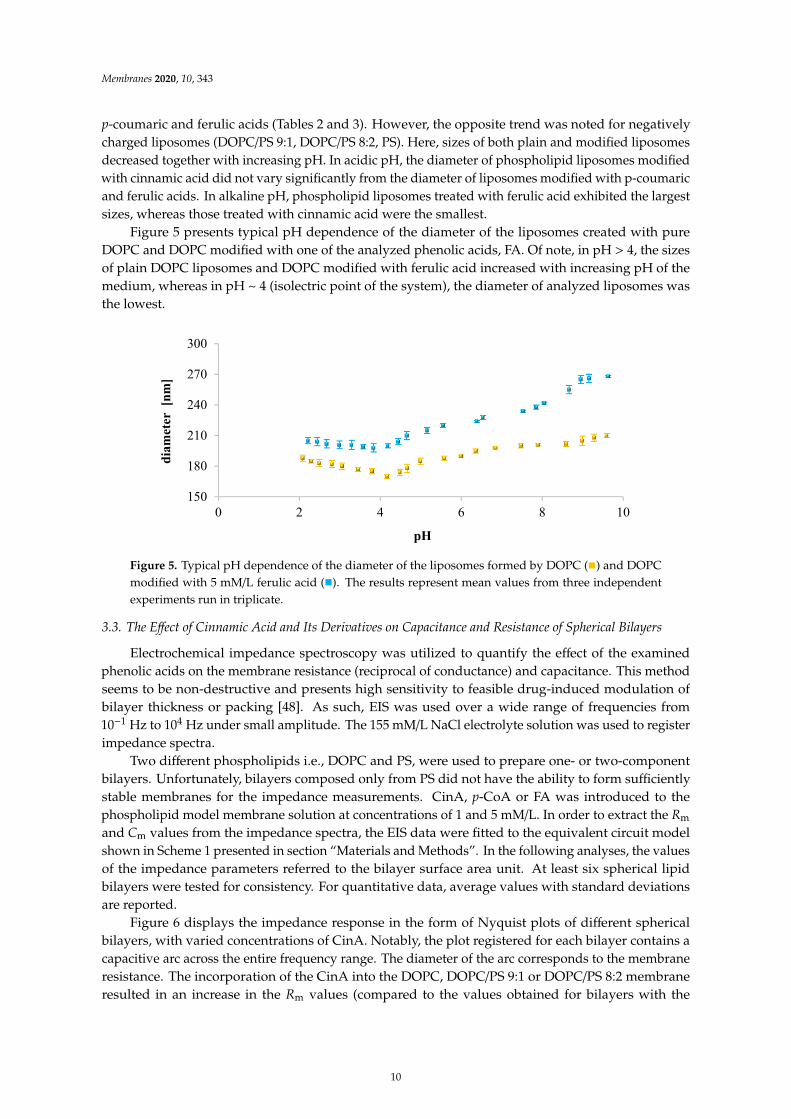
Figure 5 presents typical pH dependence of the diameter of the liposomes created with pureDOPC and DOPC modified with one of the analyzed phenolic acids, FA. Of note, in pH > 4, the sizesof plain DOPC liposomes and DOPC modified with ferulic acid increased with increasing pH of themedium, whereas in pH ~ 4 (isolectric point of the system), the diameter of analyzed liposomes wasthe lowest.
−
150
180
210
240
270
300
0 2 4 6 8 10
diam
eter
[nm
]
pH
Figure 5. Typical pH dependence of the diameter of the liposomes formed by DOPC (
PC () a
−
150
180
210
240
270
300
0 2 4 6 8 10
diam
eter
[nm
]
pH
) and DOPCmodified with 5 mM/L ferulic acid (
id (). The
−
150
180
210
240
270
300
0 2 4 6 8 10
diam
eter
[nm
]
pH
). The results represent mean values from three independentexperiments run in triplicate.
3.3. The Effect of Cinnamic Acid and Its Derivatives on Capacitance and Resistance of Spherical Bilayers
Electrochemical impedance spectroscopy was utilized to quantify the effect of the examinedphenolic acids on the membrane resistance (reciprocal of conductance) and capacitance. This methodseems to be non-destructive and presents high sensitivity to feasible drug-induced modulation ofbilayer thickness or packing [48]. As such, EIS was used over a wide range of frequencies from10−1 Hz to 104 Hz under small amplitude. The 155 mM/L NaCl electrolyte solution was used to registerimpedance spectra.
Two different phospholipids i.e., DOPC and PS, were used to prepare one- or two-componentbilayers. Unfortunately, bilayers composed only from PS did not have the ability to form sufficientlystable membranes for the impedance measurements. CinA, p-CoA or FA was introduced to thephospholipid model membrane solution at concentrations of 1 and 5 mM/L. In order to extract the Rm
and Cm values from the impedance spectra, the EIS data were fitted to the equivalent circuit modelshown in Scheme 1 presented in section “Materials and Methods”. In the following analyses, the valuesof the impedance parameters referred to the bilayer surface area unit. At least six spherical lipidbilayers were tested for consistency. For quantitative data, average values with standard deviationsare reported.
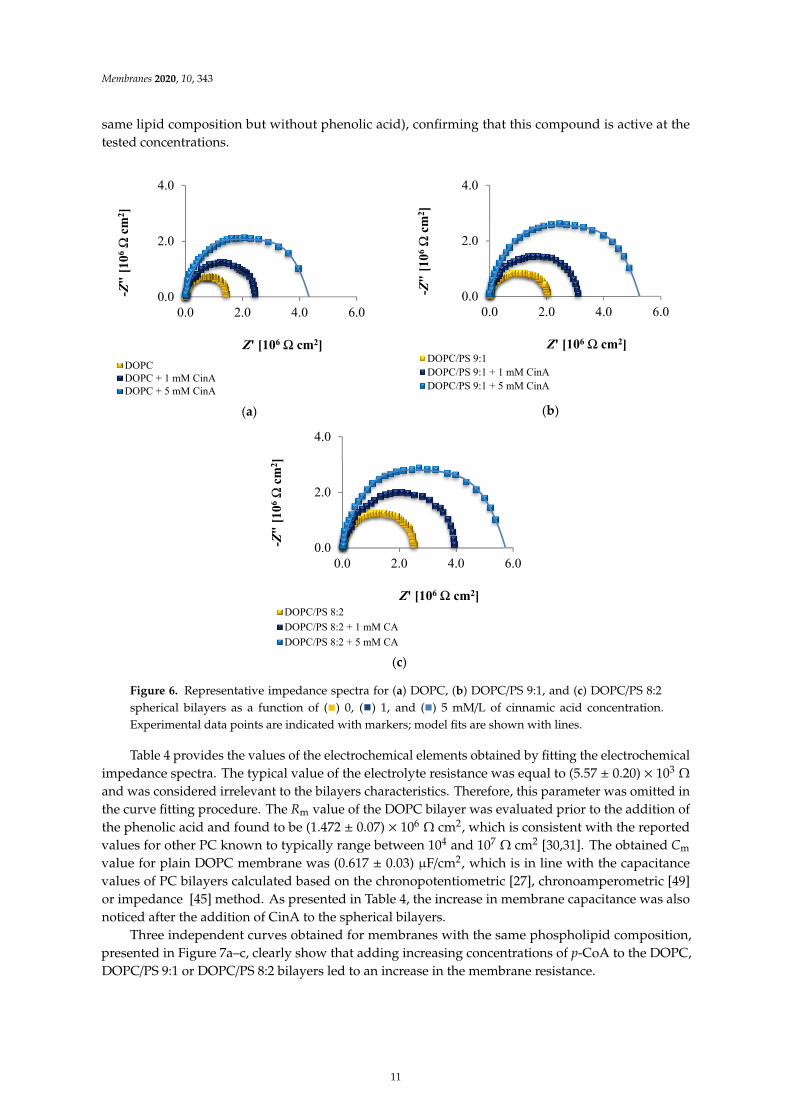
Figure 6 displays the impedance response in the form of Nyquist plots of different sphericalbilayers, with varied concentrations of CinA. Notably, the plot registered for each bilayer contains acapacitive arc across the entire frequency range. The diameter of the arc corresponds to the membraneresistance. The incorporation of the CinA into the DOPC, DOPC/PS 9:1 or DOPC/PS 8:2 membraneresulted in an increase in the Rm values (compared to the values obtained for bilayers with the
10
Membranes 2020, 10, 343
same lipid composition but without phenolic acid), confirming that this compound is active at thetested concentrations.
Ω
ΩΩ
μ
(a)
(b)
(c)
0.0
2.0
4.0
0.0 2.0 4.0 6.0
-Z"
[106
Ωcm
2 ]
Z' [106 Ω cm2]DOPCDOPC + 1 mM CinADOPC + 5 mM CinA
0.0
2.0
4.0
0.0 2.0 4.0 6.0
-Z"
[106
Ωcm
2 ]
Z' [106 Ω cm2]DOPC/PS 9:1DOPC/PS 9:1 + 1 mM CinADOPC/PS 9:1 + 5 mM CinA
0.0
2.0
4.0
0.0 2.0 4.0 6.0
-Z"
[106
Ωcm
2 ]
Z' [106 Ω cm2]DOPC/PS 8:2DOPC/PS 8:2 + 1 mM CADOPC/PS 8:2 + 5 mM CA
Figure 6. Representative impedance spectra for (a) DOPC, (b) DOPC/PS 9:1, and (c) DOPC/PS 8:2spherical bilayers as a function of (
osomal membranes as a function of () 0
-2
-1
0
1
2
0 2 4 6 8 10
δ[1
0-2C
/m2 ]
pH
DOPCDOPC + 1 mM CinADOPC + 5 mM CinA
-6
-4
-2
0
2
0 2 4 6 8 10δ
[10-2
C/m
2 ]pH
DOPC/PS 9:1DOPC/PS 9:1 + 1 mM CinADOPC/PS 9:1 + 5 mM CinA
-6
-4
-2
0
2
0 2 4 6 8 10
δ[1
0-2C
/m2 ]
pH
DOPC/PS 8:2DOPC/PS 8:2 + 1 mM CinADOPC/PS 8:2 + 5 mM CinA
-8
-6
-4
-2
0
2
0 2 4 6 8 10
б[1
0-2 C
/m2 ]
pH
PSPS + 1 mM CinAPS + 5 mM CinA
-2
-1
0
1
2
0 2 4 6 8 10
б[1
0-2 C
/m2 ]
pH
DOPCDOPC + 1 mM p-CoADOPC + 5 mM p-CoA
-6
-4
-2
0
2
0 2 4 6 8 10
б[1
0-2 C
/m2 ]
pH
DOPC/PS 9:1DOPC/PS 9:1 + 1 mM p-CoADOPC/PS 9:1 + 5 mM p-CoA
-6
-4
-2
0
2
0 2 4 6 8 10
б[1
0-2 C
/m2 ]
pH
DOPC/PS 8:2DOPC/PS 8:2 + 1 mM p-CoA
-8
-6
-4
-2
0
2
0 2 4 6 8 10
б[1
0-2 C
/m2 ]
pH
PSPS + 1 mM p-CoAPS + 5 mM p-CoA
) 0, (
, () 1, and (
-2
-1
0
1
2
0 2 4 6 8 10
δ[1
0-2C
/m2 ]
pH
DOPCDOPC + 1 mM CinADOPC + 5 mM CinA
-6
-4
-2
0
2
0 2 4 6 8 10δ
[10-2
C/m
2 ]pH
DOPC/PS 9:1DOPC/PS 9:1 + 1 mM CinADOPC/PS 9:1 + 5 mM CinA
-6
-4
-2
0
2
0 2 4 6 8 10
δ[1
0-2C
/m2 ]
pH
DOPC/PS 8:2DOPC/PS 8:2 + 1 mM CinADOPC/PS 8:2 + 5 mM CinA
-8
-6
-4
-2
0
2
0 2 4 6 8 10
б[1
0-2 C
/m2 ]
pH
PSPS + 1 mM CinAPS + 5 mM CinA
-2
-1
0
1
2
0 2 4 6 8 10
б[1
0-2 C
/m2 ]
pH
DOPCDOPC + 1 mM p-CoADOPC + 5 mM p-CoA
-6
-4
-2
0
2
0 2 4 6 8 10
б[1
0-2 C
/m2 ]
pH
DOPC/PS 9:1DOPC/PS 9:1 + 1 mM p-CoADOPC/PS 9:1 + 5 mM p-CoA
-6
-4
-2
0
2
0 2 4 6 8 10
б[1
0-2 C
/m2 ]
pH
DOPC/PS 8:2DOPC/PS 8:2 + 1 mM p-CoA
-8
-6
-4
-2
0
2
0 2 4 6 8 10
б[1
0-2 C
/m2 ]
pH
PSPS + 1 mM p-CoAPS + 5 mM p-CoA
) 1, and (
) 1, and ()
-2
-1
0
1
2
0 2 4 6 8 10
δ[1
0-2C
/m2 ]
pH
DOPCDOPC + 1 mM CinADOPC + 5 mM CinA
-6
-4
-2
0
2
0 2 4 6 8 10δ
[10-2
C/m
2 ]pH
DOPC/PS 9:1DOPC/PS 9:1 + 1 mM CinADOPC/PS 9:1 + 5 mM CinA
-6
-4
-2
0
2
0 2 4 6 8 10
δ[1
0-2C
/m2 ]
pH
DOPC/PS 8:2DOPC/PS 8:2 + 1 mM CinADOPC/PS 8:2 + 5 mM CinA
-8
-6
-4
-2
0
2
0 2 4 6 8 10
б[1
0-2 C
/m2 ]
pH
PSPS + 1 mM CinAPS + 5 mM CinA
-2
-1
0
1
2
0 2 4 6 8 10
б[1
0-2 C
/m2 ]
pH
DOPCDOPC + 1 mM p-CoADOPC + 5 mM p-CoA
-6
-4
-2
0
2
0 2 4 6 8 10
б[1
0-2 C
/m2 ]
pH
DOPC/PS 9:1DOPC/PS 9:1 + 1 mM p-CoADOPC/PS 9:1 + 5 mM p-CoA
-6
-4
-2
0
2
0 2 4 6 8 10
б[1
0-2 C
/m2 ]
pH
DOPC/PS 8:2DOPC/PS 8:2 + 1 mM p-CoA
-8
-6
-4
-2
0
2
0 2 4 6 8 10
б[1
0-2 C
/m2 ]
pH
PSPS + 1 mM p-CoAPS + 5 mM p-CoA
) 5 mM/L of cinnamic acid concentration.Experimental data points are indicated with markers; model fits are shown with lines.
Table 4 provides the values of the electrochemical elements obtained by fitting the electrochemicalimpedance spectra. The typical value of the electrolyte resistance was equal to (5.57 ± 0.20) × 103 Ω
and was considered irrelevant to the bilayers characteristics. Therefore, this parameter was omitted inthe curve fitting procedure. The Rm value of the DOPC bilayer was evaluated prior to the addition ofthe phenolic acid and found to be (1.472 ± 0.07) × 106 Ω cm2, which is consistent with the reportedvalues for other PC known to typically range between 104 and 107 Ω cm2 [30,31]. The obtained Cm
value for plain DOPC membrane was (0.617 ± 0.03) µF/cm2, which is in line with the capacitancevalues of PC bilayers calculated based on the chronopotentiometric [27], chronoamperometric [49]or impedance [45] method. As presented in Table 4, the increase in membrane capacitance was alsonoticed after the addition of CinA to the spherical bilayers.
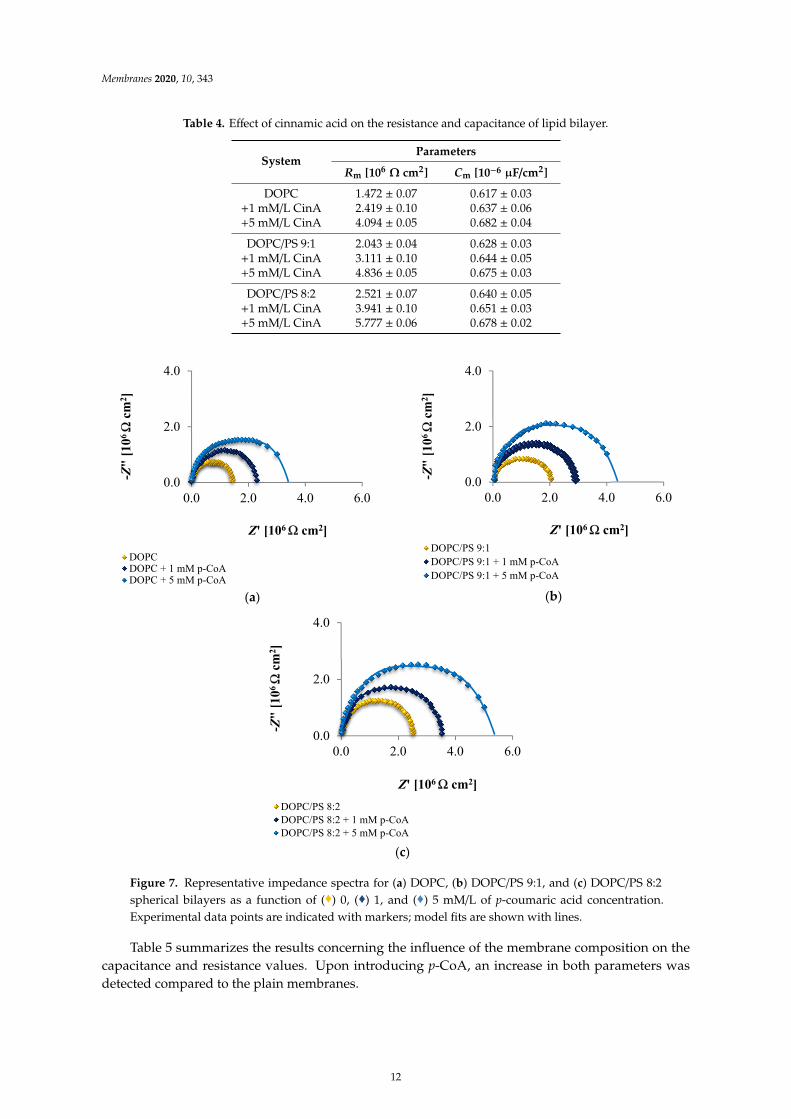
Three independent curves obtained for membranes with the same phospholipid composition,presented in Figure 7a–c, clearly show that adding increasing concentrations of p-CoA to the DOPC,DOPC/PS 9:1 or DOPC/PS 8:2 bilayers led to an increase in the membrane resistance.
11
Membranes 2020, 10, 343
Table 4. Effect of cinnamic acid on the resistance and capacitance of lipid bilayer.
SystemParameters
Rm [106Ω cm2] Cm [10−6 µF/cm2]
DOPC 1.472 ± 0.07 0.617 ± 0.03+1 mM/L CinA 2.419 ± 0.10 0.637 ± 0.06+5 mM/L CinA 4.094 ± 0.05 0.682 ± 0.04
DOPC/PS 9:1 2.043 ± 0.04 0.628 ± 0.03+1 mM/L CinA 3.111 ± 0.10 0.644 ± 0.05+5 mM/L CinA 4.836 ± 0.05 0.675 ± 0.03
DOPC/PS 8:2 2.521 ± 0.07 0.640 ± 0.05+1 mM/L CinA 3.941 ± 0.10 0.651 ± 0.03+5 mM/L CinA 5.777 ± 0.06 0.678 ± 0.02
Ω − μ
(a)
(b)
(c)
♦ ♦ ♦
0.0
2.0
4.0
0.0 2.0 4.0 6.0
-Z"
[106
Ωcm
2 ]
Z' [106 Ω cm2]
DOPCDOPC + 1 mM p-CoADOPC + 5 mM p-CoA
0.0
2.0
4.0
0.0 2.0 4.0 6.0
-Z"
[106
Ωcm
2 ]
Z' [106 Ω cm2]DOPC/PS 9:1DOPC/PS 9:1 + 1 mM p-CoADOPC/PS 9:1 + 5 mM p-CoA
0.0
2.0
4.0
0.0 2.0 4.0 6.0
-Z"
[106
Ωcm
2 ]
Z' [106 Ω cm2]DOPC/PS 8:2DOPC/PS 8:2 + 1 mM p-CoADOPC/PS 8:2 + 5 mM p-CoA
Figure 7. Representative impedance spectra for (a) DOPC, (b) DOPC/PS 9:1, and (c) DOPC/PS 8:2spherical bilayers as a function of (
of (♦) 0 ♦ ♦
σσ
∼ ∼
-2
-1
0
1
2
0 2 4 6 8 10
б[1
0-2 C
/m2 ]
pH
DOPCDOPC + 1 mM FADOPC + 5 mM FA
-6
-4
-2
0
2
0 2 4 6 8 10
б[1
0-2C
/m2 ] pH
DOPC/PS 9:1DOPC/PS 9:1 + 1 mM FADOPC/PS 9:1 + 5 mM FA
-6
-4
-2
0
2
0 2 4 6 8 10
б[1
0-2 C
/m2 ] pH
DOPC/PS 8:2DOPC/PS 8:2 + 1 mM FADOPC/PS 8:2 + 5 mM FA
-8
-6
-4
-2
0
2
0 2 4 6 8 10
б[1
0-2 C
/m2 ] pH
PSPS + 1 mM FAPS + 5 mM FA
) 0, (
♦) 0, (♦) ♦
σσ
∼ ∼
-2
-1
0
1
2
0 2 4 6 8 10
б[1
0-2 C
/m2 ]
pH
DOPCDOPC + 1 mM FADOPC + 5 mM FA
-6
-4
-2
0
2
0 2 4 6 8 10
б[1
0-2C
/m2 ] pH
DOPC/PS 9:1DOPC/PS 9:1 + 1 mM FADOPC/PS 9:1 + 5 mM FA
-6
-4
-2
0
2
0 2 4 6 8 10
б[1
0-2 C
/m2 ] pH
DOPC/PS 8:2DOPC/PS 8:2 + 1 mM FADOPC/PS 8:2 + 5 mM FA
-8
-6
-4
-2
0
2
0 2 4 6 8 10
б[1
0-2 C
/m2 ] pH
PSPS + 1 mM FAPS + 5 mM FA
) 1, and (
♦ ♦ 1, and (♦) a
σσ
∼ ∼
-2
-1
0
1
2
0 2 4 6 8 10
б[1
0-2 C
/m2 ]
pH
DOPCDOPC + 1 mM FADOPC + 5 mM FA
-6
-4
-2
0
2
0 2 4 6 8 10
б[1
0-2C
/m2 ] pH
DOPC/PS 9:1DOPC/PS 9:1 + 1 mM FADOPC/PS 9:1 + 5 mM FA
-6
-4
-2
0
2
0 2 4 6 8 10
б[1
0-2 C
/m2 ] pH
DOPC/PS 8:2DOPC/PS 8:2 + 1 mM FADOPC/PS 8:2 + 5 mM FA
-8
-6
-4
-2
0
2
0 2 4 6 8 10
б[1
0-2 C
/m2 ] pH
PSPS + 1 mM FAPS + 5 mM FA
) 5 mM/L of p-coumaric acid concentration.Experimental data points are indicated with markers; model fits are shown with lines.
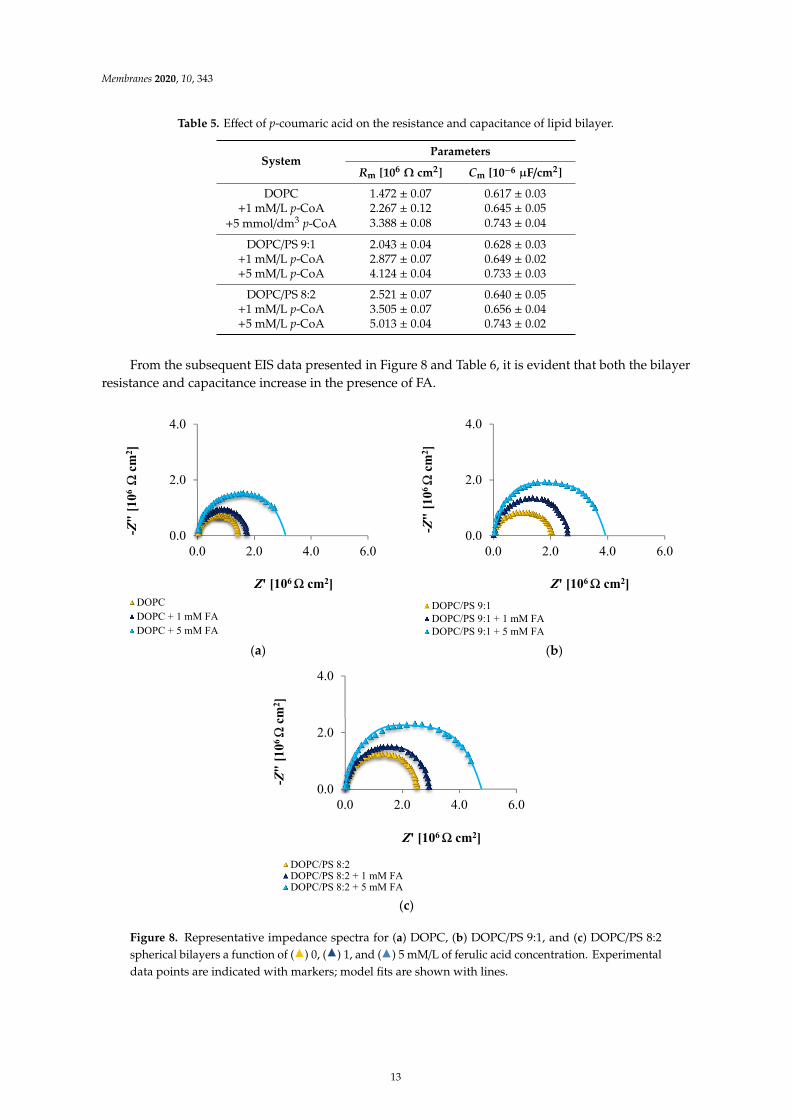
Table 5 summarizes the results concerning the influence of the membrane composition on thecapacitance and resistance values. Upon introducing p-CoA, an increase in both parameters wasdetected compared to the plain membranes.
12
Membranes 2020, 10, 343
Table 5. Effect of p-coumaric acid on the resistance and capacitance of lipid bilayer.
SystemParameters
Rm [106Ω cm2] Cm [10−6 µF/cm2]
DOPC 1.472 ± 0.07 0.617 ± 0.03+1 mM/L p-CoA 2.267 ± 0.12 0.645 ± 0.05
+5 mmol/dm3 p-CoA 3.388 ± 0.08 0.743 ± 0.04
DOPC/PS 9:1 2.043 ± 0.04 0.628 ± 0.03+1 mM/L p-CoA 2.877 ± 0.07 0.649 ± 0.02+5 mM/L p-CoA 4.124 ± 0.04 0.733 ± 0.03
DOPC/PS 8:2 2.521 ± 0.07 0.640 ± 0.05+1 mM/L p-CoA 3.505 ± 0.07 0.656 ± 0.04+5 mM/L p-CoA 5.013 ± 0.04 0.743 ± 0.02
From the subsequent EIS data presented in Figure 8 and Table 6, it is evident that both the bilayerresistance and capacitance increase in the presence of FA.
Ω − μ
(a) (b)
(c)
0.0
2.0
4.0
0.0 2.0 4.0 6.0
-Z"
[106
Ωcm
2 ]
Z' [106 Ω cm2]DOPCDOPC + 1 mM FADOPC + 5 mM FA
0.0
2.0
4.0
0.0 2.0 4.0 6.0
-Z"
[106
Ωcm
2 ]
Z' [106 Ω cm2]DOPC/PS 9:1DOPC/PS 9:1 + 1 mM FADOPC/PS 9:1 + 5 mM FA
0.0
2.0
4.0
0.0 2.0 4.0 6.0
-Z"
[106
Ωcm
2 ]
Z' [106 Ω cm2]
DOPC/PS 8:2DOPC/PS 8:2 + 1 mM FADOPC/PS 8:2 + 5 mM FA
Figure 8. Representative impedance spectra for (a) DOPC, (b) DOPC/PS 9:1, and (c) DOPC/PS 8:2spherical bilayers a function of (
♦ ♦ ♦
σσ
function of () 0,
∼ ∼
-2
-1
0
1
2
0 2 4 6 8 10
б[1
0-2 C
/m2 ]
pH
DOPCDOPC + 1 mM FADOPC + 5 mM FA
-6
-4
-2
0
2
0 2 4 6 8 10
б[1
0-2C
/m2 ] pH
DOPC/PS 9:1DOPC/PS 9:1 + 1 mM FADOPC/PS 9:1 + 5 mM FA
-6
-4
-2
0
2
0 2 4 6 8 10
б[1
0-2 C
/m2 ] pH
DOPC/PS 8:2DOPC/PS 8:2 + 1 mM FADOPC/PS 8:2 + 5 mM FA
-8
-6
-4
-2
0
2
0 2 4 6 8 10
б[1
0-2 C
/m2 ] pH
PSPS + 1 mM FAPS + 5 mM FA
) 0, (
♦ ♦ ♦
σσ
) 0, () 1, an
∼ ∼
-2
-1
0
1
2
0 2 4 6 8 10
б[1
0-2 C
/m2 ]
pH
DOPCDOPC + 1 mM FADOPC + 5 mM FA
-6
-4
-2
0
2
0 2 4 6 8 10
б[1
0-2C
/m2 ] pH
DOPC/PS 9:1DOPC/PS 9:1 + 1 mM FADOPC/PS 9:1 + 5 mM FA
-6
-4
-2
0
2
0 2 4 6 8 10
б[1
0-2 C
/m2 ] pH
DOPC/PS 8:2DOPC/PS 8:2 + 1 mM FADOPC/PS 8:2 + 5 mM FA
-8
-6
-4
-2
0
2
0 2 4 6 8 10
б[1
0-2 C
/m2 ] pH
PSPS + 1 mM FAPS + 5 mM FA
) 1, and (
♦ ♦ ♦
σσ
d () 5 mM/L
∼ ∼
-2
-1
0
1
2
0 2 4 6 8 10
б[1
0-2 C
/m2 ]
pH
DOPCDOPC + 1 mM FADOPC + 5 mM FA
-6
-4
-2
0
2
0 2 4 6 8 10
б[1
0-2C
/m2 ] pH
DOPC/PS 9:1DOPC/PS 9:1 + 1 mM FADOPC/PS 9:1 + 5 mM FA
-6
-4
-2
0
2
0 2 4 6 8 10
б[1
0-2 C
/m2 ] pH
DOPC/PS 8:2DOPC/PS 8:2 + 1 mM FADOPC/PS 8:2 + 5 mM FA
-8
-6
-4
-2
0
2
0 2 4 6 8 10
б[1
0-2 C
/m2 ] pH
PSPS + 1 mM FAPS + 5 mM FA
) 5 mM/L of ferulic acid concentration. Experimentaldata points are indicated with markers; model fits are shown with lines.
13
Membranes 2020, 10, 343
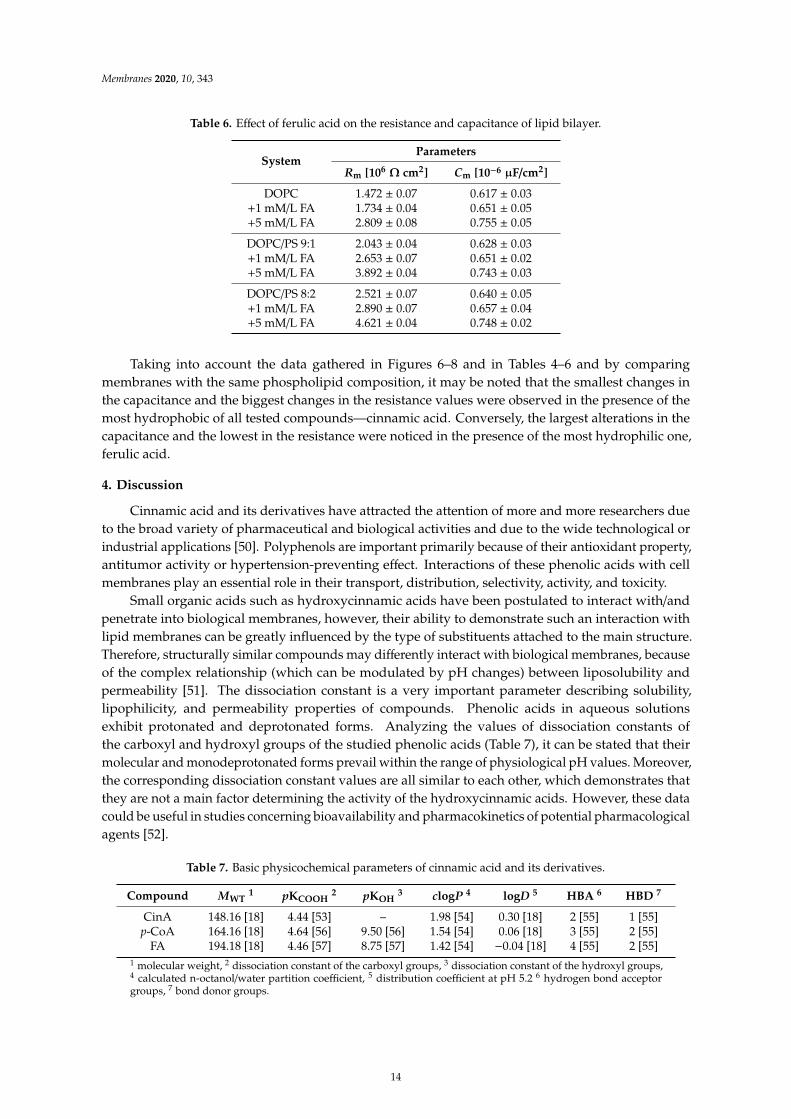
Table 6. Effect of ferulic acid on the resistance and capacitance of lipid bilayer.
SystemParameters
Rm [106Ω cm2] Cm [10−6 µF/cm2]
DOPC 1.472 ± 0.07 0.617 ± 0.03+1 mM/L FA 1.734 ± 0.04 0.651 ± 0.05+5 mM/L FA 2.809 ± 0.08 0.755 ± 0.05
DOPC/PS 9:1 2.043 ± 0.04 0.628 ± 0.03+1 mM/L FA 2.653 ± 0.07 0.651 ± 0.02+5 mM/L FA 3.892 ± 0.04 0.743 ± 0.03
DOPC/PS 8:2 2.521 ± 0.07 0.640 ± 0.05+1 mM/L FA 2.890 ± 0.07 0.657 ± 0.04+5 mM/L FA 4.621 ± 0.04 0.748 ± 0.02
Taking into account the data gathered in Figures 6–8 and in Tables 4–6 and by comparingmembranes with the same phospholipid composition, it may be noted that the smallest changes inthe capacitance and the biggest changes in the resistance values were observed in the presence of themost hydrophobic of all tested compounds—cinnamic acid. Conversely, the largest alterations in thecapacitance and the lowest in the resistance were noticed in the presence of the most hydrophilic one,ferulic acid.
4. Discussion
Cinnamic acid and its derivatives have attracted the attention of more and more researchers dueto the broad variety of pharmaceutical and biological activities and due to the wide technological orindustrial applications [50]. Polyphenols are important primarily because of their antioxidant property,antitumor activity or hypertension-preventing effect. Interactions of these phenolic acids with cellmembranes play an essential role in their transport, distribution, selectivity, activity, and toxicity.
Small organic acids such as hydroxycinnamic acids have been postulated to interact with/andpenetrate into biological membranes, however, their ability to demonstrate such an interaction withlipid membranes can be greatly influenced by the type of substituents attached to the main structure.Therefore, structurally similar compounds may differently interact with biological membranes, becauseof the complex relationship (which can be modulated by pH changes) between liposolubility andpermeability [51]. The dissociation constant is a very important parameter describing solubility,lipophilicity, and permeability properties of compounds. Phenolic acids in aqueous solutionsexhibit protonated and deprotonated forms. Analyzing the values of dissociation constants ofthe carboxyl and hydroxyl groups of the studied phenolic acids (Table 7), it can be stated that theirmolecular and monodeprotonated forms prevail within the range of physiological pH values. Moreover,the corresponding dissociation constant values are all similar to each other, which demonstrates thatthey are not a main factor determining the activity of the hydroxycinnamic acids. However, these datacould be useful in studies concerning bioavailability and pharmacokinetics of potential pharmacologicalagents [52].
Table 7. Basic physicochemical parameters of cinnamic acid and its derivatives.
Compound MWT1 pKCOOH
2 pKOH3 clogP 4 logD 5 HBA 6 HBD 7
CinA 148.16 [18] 4.44 [53] – 1.98 [54] 0.30 [18] 2 [55] 1 [55]p-CoA 164.16 [18] 4.64 [56] 9.50 [56] 1.54 [54] 0.06 [18] 3 [55] 2 [55]
FA 194.18 [18] 4.46 [57] 8.75 [57] 1.42 [54] −0.04 [18] 4 [55] 2 [55]1 molecular weight, 2 dissociation constant of the carboxyl groups, 3 dissociation constant of the hydroxyl groups,4 calculated n-octanol/water partition coefficient, 5 distribution coefficient at pH 5.2 6 hydrogen bond acceptorgroups, 7 bond donor groups.
14
Membranes 2020, 10, 343
The positive values of the calculated logP of CinA, p-CoA and FA may indicate that these acidsare partitioning in the octanol phase. Nevertheless, only lipophilicity of uncharged molecules can bedetermined by this method, thus it is difficult to apply to these phenolic acids, which at physiologicalconditions are rather negatively charged. Analysis of Table 7 revealed that there are relevant differencesbetween clogP and logD coefficient partitions for each acid. These findings suggest that the drugdistribution between the aqueous solution and the lipid membrane is regulated by the ionizationstate of the molecule. All three compounds tested here are ionizable molecules, and it is alreadywidely recognized that ionizable drugs partition into the lipid membrane to a high extent thanks toelectrostatic interactions and formation of hydrogen bonds with polar groups of the phospholipids [18].As a matter of fact, several reports inform about different experimental logD values from the predictedlogP values calculated exclusively for the neutral species of drugs [58,59].
Rocher et al. reported the percentage of the undissociated forms of i.e., CinA, p-CoA and FA inpulvinar cells of Mimosa pudica L. at pH 5.2, which amounted to 70.4%, 58.6%, and 52.7% of the totalpool of these acids respectively [18]. Considering the fact that only lipophilic neutral forms are able tocross the plasma membrane by diffusion, this parameter bears important information on this family ofcarboxylic acids [60].
Regarding the importance of physicochemical properties of drugs, Lipinski developed Ro5 [18].According to this rule, candidates for efficient drugs should be characterized by logP ≤ 5, molecularweight ≤ 500, number of hydrogen bond acceptors (O) ≤ 10, and number of hydrogen bond donors(OH, NH) ≤ 5. All phenolic acids examined herein meet the Lipinski’s rule as demonstrated in Table 7.Thus, CinA, p-CoA and FA display favorable drug-like properties, which certainly encourage theirfurther examination in the in vitro and in vivo studies.
Since phenolic compounds has been demonstrated as efficient cytostatic agents against variousmalignancies, it seems essential to evaluate how these compounds interact with lipid membranes,to get fuller insight into the transportation and anticancer mechanisms of these natural compounds.The affinity of polyphenols to the lipid bilayer is reflected in several electrochemical parameters. The firstdeterminant is the adsorption on the membrane surface mediated by interactions of hydrophilic partswith the polar head groups of the lipids at the water–lipid interface. Second is the absorptiondependent on the partitioning of the hydrophobic parts into the nonpolar core of the membrane [61,62].The mechanism of action of polyphenols is determined by the presence of different substituents in theirbackbone structure and the pH value of their microenvironment. If the pH of the external medium islow (acidic), phenolic acids are then able to diffuse through the membrane due to their unchangedform [63,64]. The ELS data presented in Figures 2–4 clearly show that cinnamic acid and its derivativesdo not affect the surface charge density of liposomal membranes at acidic pH. Therefore, it can beassumed that at acidic pH, investigated polyphenols were able to solubilize into the membrane andto permeate it. At neutral and basic pH, the CinA was unable to considerably modify the surfacecharge of the model membrane due to the lack of a hydroxyl group. Whereas more hydrophilic p-CoAand FA remained anchored at the bilayer surface without perturbing the lipidic structure but clearlyaffecting σ values. These findings are in agreement with literature, where the influence of structuralcharacteristics of cinnamic acid and its hydroxyl derivatives on their interaction with model membraneswas reported [51,65,66]. Similarly, the penetration of many other compounds e.g., flavonoids [7] ornon-steroidal anti-inflammatory drugs [67] in bilayers, depends on the pH of the media.
Given the pKCOOH values (Table 7), at neutral and basic pH, the carboxyl group of CinA, p-CoAand FA is most likely negatively charged, and the negative charge of their molecules is probablyoriented towards the positive pole of zwitterionic DOPC headgroup. ELS measurements performedin the presence of two concentrations of phenolic acids corroborate this hypothesis given that thesurface charge of the membrane was altered, becoming increasingly negative with the addition of theexamined polyphenols. The same tendency was observed for other negatively charged compounds [67].The incorporation of cinnamic acid resulted in the slightest changes of σ, which again suggestsinteractions of CinA with the interior of the membrane. It is obvious that the effects of different phenolic
15
Membranes 2020, 10, 343
acids are correlated to their structural characteristics, thereby even the difference in one –OH group canbe important, as well as the number of H-bonds they form. CinA can form three H-bonds, with one asa H-bond donor, and two as H-bond acceptors; its partition coefficient was the highest, and it was themost soluble of these phenolic acids in octanol (Table 7). In other words, CinA as a non-polar substancecould enter the lipid bilayer easily. Our findings are in line with the literature, where the interactionof model membranes with phenolic acids presenting different structural changes in their molecularbackbone is deciphered on the basis of the shift of lipid phase transition temperature [51,61,66,68].These authors reported that for pH below pKCOOH values, the protonation of the carboxylic groupallows the substance to penetrate the lipid bilayer. Likewise, Castelli et al. employed multilamellar orunilamellar liposomes created from synthetic L-R-dimyristoylphosphatidylcholine to check whethercinnamic acid can dissolve into lipid membranes and penetrate them by migration from the aqueousphase [51]. This process continues until there is a constant molar fraction on the membrane surface,and then progressively inside the other internal bilayers. At the end of this process, the thermotropicbehavior is close to that obtained by direct mixing of the biophenol with the lipid component duringthe liposomal preparation. The same researchers investigating PC liposomes containing p-CoA at twodifferent pHs (4 and 7) reported no shift of the calorimetric peaks toward lower values, suggestingthat the –OH group influences the ability of this compound to penetrate the membrane [51]. They didnot exclude a surface interaction with the lipid layers and stated that the presence of differentsubstituents in the backbone structure of biophenols might influence their incorporation. On theother hand, Ota et al. compared the thermograms obtained for the unilamelar large vesicles of1,2-dipalmitoyl-sn-glycero-3-phosphocholine in the presence of the p-CoA or FA, and noticed that theenthalpy value of the main transition of the phospholipids decreased by 1.46 ± 0.10 kcal/mol in thepresence of p-CoA, and by 0.45 ± 0.17 kcal/mol with FA. This small but significant decrease in theenthalpy of transition implies that both acids intercalate into the acyl chain region of the bilayer [66].
Analyzing the influence of the polar headgroup of lipids on the penetration capacity of cinnamicacid and its derivatives, we expected that phenolic acids will be less able to penetrate the negativelycharged headgroup of PS lipids as compared with DOPC. Surprisingly, we have not noticed suchan effect. We speculate that perhaps the acids concentrations used here were not sufficient to causesignificant alterations of the membrane surface charge, or it may also be the result of certain limitationsof the ELS technique per se. Likewise, Fadel et al. [64] reported that rosmarinic acid, another compoundbelonging to phenolic acids, evoked a weaker effect in PS than PC membranes.
Furthermore, we analyzed the influence of pH on the size of the liposomes. Our findings showedthat for neutral liposomes (DOPC), their diameter increased with increasing pH of the solution. It maysuggest that in acidic pH, existing electrostatic repulsive forces dominate over hydrogen bondingaffinities between neighboring lipid molecules [69]. This might be a tentative explanation of why weobserved smaller sizes of DOPC liposomes. Contrarily, for the negatively charged liposomes (DOPC/PS9:1, DOPC/PS 8:2, PS), the diameter decreased with increasing pH. As such, at acidic pH, the extentof protonation was higher than this observed in the case of DOPC liposomes. Also, an oppositedependence, the dominance of hydrogen bonding over electrostatic repulsions, was observed.This might be the reason why the negatively charged liposomes showed larger sizes than neutralones (DOPC). Simultaneously, in alkaline and neutral pH, reduction of the diameter of negativelycharged liposomes was observed most probably due to the repulsive forces between phospholipidmolecules [70].
The EIS data presented in Figures 6–8 and collected in Tables 4–6 indicate that the addition ofcinnamic acid and its hydroxy derivatives to the DOPC, DOPC/PS 9:1 or DOPC/PS 8:2 membranes causedan increase in their resistance, and thus reduced conductivity. An increase in the Rm value implies thatthese phenolic acids exacerbated the ordering and decreased the dynamics of the phospholipid alkylchains of spherical bilayers. This behavior can be explained in relation to the polarities of the examinedmolecules, indicating to what levels they can penetrate into the lipid bilayer. CinA, the least polar acidamong the tested ones, had the greatest effect on the structure of the membrane lipids (i.e., stabilizing
16
Membranes 2020, 10, 343
of the structure). p-CoA and FA are both more polar than CinA (see Figure 1), therefore, presenting aweaker effect on the membrane resistance. Based on our experimental approach, the following order ofthe stabilization effect was established: cinnamic acid > p-coumaric acid > ferulic acid. Our resultsare in line with previously reported data where the influence of the phenolic acids on structuralproperties of a model lipid membrane was investigated by differential scanning calorimetry [51,66,68],fluorescence spectroscopy [66,68], and electron paramagnetic resonance spectroscopy [68].
As opposed to the resistance, alterations in the capacitance seem to be less obvious in Nyquistplots, therefore, no remarkable differences between subsequent EIS measurements can be observedin Figures 6–8. It may be stated that the deposition of phenolic acids on the membrane was notaccompanied by the appearance of any additional time constant, which was also reported not to happenin the case of protein adsorption [71]. Consequently, the Cm values fitted from the equivalent circuitmodel were in alignment with the indications from the Nyquist (Tables 4–6), revealing increasingcapacitance with increasing phenolic acids concentrations.
Together, the EIS data indicate that in comparison to untreated plain phospholipid bilayer,CinA-stimulated membranes showed a significant and systematic increase in bilayer resistance,which is dependent on increasing the concentration of phenolic acid. These changes were accompaniedby moderate elevation of the bilayer capacitance, which can be attributed to a decrease in membranethickness. This in turn, may indicate the ordering and stabilizing effect of CinA on the phospholipidalkyl chains of bilayers.
According to the EIS response shown in Figures 6–8 and data collected in Tables 4–6, it is evidentthat p-CoA and FA interact with the bilayer in a different way than CinA. Both of these compounds elicitsignificant changes in the lipid membrane capacitance, which indicate their adsorption at the bilayerinterface. In contrast to CinA, changes in membrane resistance caused by increasing concentrations ofp-CoA or FA were much smaller. These observations were consistent with the ELS data, suggestingthat the CinA associates strongly and penetrates deeply into the lipid membrane. Conversely, p-CoAand FA may locate near the phospholipid headgroup, most probably via electrostatic interaction,without perturbing the lipidic structure.
Finally, if we compare the influence of the polar headgroup of lipids on the Rm and Cm values ofmembranes modified with CinA, p-CoA or FA, it seems that phenolic acids are less able to interact withthe negatively charged headgroup of PS lipids as compared with DOPC. This result is not surprising,because the data were registered at pH equals 6.59 (pH of 155 mM/L NaCl electrolyte solution), in whichall tested compounds bear a negative charge (carboxylate group) that may cause charge repulsionbetween the two carboxylate functions of the serine in PS. Notably, we failed to identify the differencesin the interaction between phenolic acids and DOPC or PS bilayers using zeta potential analysis.This indicates that impedance measurement is a useful and effective technique worth utilizing inphysicochemical studies.
5. Conclusions
Currently, in the era of lipidomics, the attention of scientists from many fields has beenshifted towards looking at biological membranes from a different perspective. Membranes havebeen demonstrated to determine certain physiological functions of cells and play important rolesin several pathologies such as cancer. In this respect, a great deal of attention is now directedinto the understanding of the interactions between anticancer drugs and cellular membranes.Thus, evaluation of drug-membrane dependencies can serve as a useful tool in predictingmembrane permeability, bioactivity and cytotoxicity of potential antineoplastic agents in modernoncopharmacology. Regarding the importance of such interactions, the role of biomimetic modelmembranes and biophysical/electrochemical techniques becomes increasingly significant in chemicaland pharmacological studies. As such, based on previous in vitro research conducted on glioblastomacancer cells, we used electrophoretic light scattering and impedance spectroscopy to study the effectsof CinA, p-CoA and FA on electrical properties of bilayers formed from DOPC, PS or DOPC-PS
17
Membranes 2020, 10, 343
mixture. We demonstrated that after treatment with phenolic acids, the negative charge of membranesincreased in alkaline pH solutions, but not in acidic ones. On the other hand, the data from impedancemeasurements showed elevated values of either the electrical capacitance and the electrical resistance intreated cells. We therefore concluded that at acidic pH, all tested compounds were able to solubilize intothe membrane and permeate it. However, at neutral and alkaline pH, the CinA could be partially insertedinto the bilayers, whereas p-CoA and FA could be anchored at the bilayer surface. Since intracellularpenetration seems to be a key determinant of drug functioning, our results imply that electrochemicalmethods might be employed for predicting pharmacological activity and bioavailability of phenolicacids in the future.
Author Contributions: Conceptualization, M.N.; Methodology, J.K. and M.N.; Validation, J.K., M.G. and M.K.;Formal Analysis, J.K., M.Z., M.G. and M.N.; Investigation, M.Z.; Resources, M.N.; Data Curation, J.K. andM.G.; Writing—Original Draft Preparation, M.N.; Writing—Review and Editing, M.Z., J.K., M.K. and M.N.;Visualization, M.N., M.Z. and J.K.; Supervision, M.N.; Project Administration, M.N.; Funding Acquisition, M.N.,M.G. All authors have read and agreed to the published version of the manuscript.
Funding: This study was funded by the National Science Centre (Poland) on the basis on the decision number2018/02/X/ST4/02153 (Miniatura 2 call). This research was supported by the Slovak Research and DevelopmentAgency under the contract No. APVV-17-0149 and PP-COVID-20-0019. The potentiostat/galvanostat wasfunded by the European Funds for Regional Development and the National Funds of Ministry of Scienceand Higher Education as part of the Operational Program Development of Eastern Poland 2007–2013, project:POPW.01.03.00-20-044/11.
Conflicts of Interest: The authors declare no conflict of interest.
Abbreviations
ELS Electrochemical light scatteringEIS Electrochemical impedance spectroscopyCinA Cinnamic acidp-CoA p-Coumaric acidFA Ferulic acidDOPC 1,2-Dioleoyl-sn-glycero-3-phosphocholinePC PhosphatidylcholinePS PhosphatidylserineCm Membrane capacitanceRm Membrane resistanceσ Surface charge densitylogP n-octanol/water partition coefficientclogP Calculated n-octanol/water partition coefficientRo5 Rule of fiveMWT Molecular weightpKa Dissociation constantpKCOOH Dissociation constant of the carboxyl groupspKOH Dissociation constant of the hydroxyl groupsHBA Hydrogen bond acceptor groupsHBD Hydrogen bond donor groups
References
1. Sokolová, R.; Degano, I.; Ramešová, Š.; Bulícková, J.; Hromadová, M.; Gál, M.; Fiedler, J.; Valášek, M.The oxidation mechanism of the antioxidant quercetin in nonaqueous media. Electrochim. Acta 2011,56, 7421–7427. [CrossRef]
2. Rice-Evans, C.A.; Miller, N.J.; Paganga, G. Structure-antioxidant activity relationships of flavonoids andphenolic acids. Free. Radic. Biol. Med. 1996, 20, 933–956. [CrossRef]
18
Membranes 2020, 10, 343
3. Apostolou, A.; Stagos, D.; Galitsiou, E.; Spyrou, A.; Haroutounian, S.; Portesis, N.; Trizoglou, I.; Hayes, A.W.;Tsatsakis, A.M.; Kouretas, D. Assessment of polyphenolic content, antioxidant activity, protection againstROS-induced DNA damage and anticancer activity of Vitis vinifera stem extracts. Food Chem. Toxicol. 2013,61, 60–68. [CrossRef] [PubMed]
4. Lall, R.K.; Syed, D.N.; Adhami, V.M.; Khan, M.I.; Mukhtar, H. Dietary Polyphenols in Prevention andTreatment of Prostate Cancer. Int. J. Mol. Sci. 2015, 16, 3350–3376. [CrossRef] [PubMed]
5. Weng, C.-J.; Yen, G.-C. Chemopreventive effects of dietary phytochemicals against cancer invasion andmetastasis: Phenolic acids, monophenol, polyphenol, and their derivatives. Cancer Treat. Rev. 2012, 38, 76–87.[CrossRef] [PubMed]
6. Zheng, X.; Cheng, Y.; Chen, Y.; Yue, Y.; Li, Y.; Xia, S.; Li, Y.; Deng, H.; Zhang, J.; Cao, Y.J. Ferulic Acid ImprovesDepressive-Like Behavior in Prenatally-Stressed Offspring Rats via Anti-Inflammatory Activity and HPAAxis. Int. J. Mol. Sci. 2019, 20, 493. [CrossRef] [PubMed]
7. Kruszewski, M.; Kusaczuk, M.; Kotynska, J.; Gál, M.; Kretowski, R.; Cechowska-Pasko, M.; Naumowicz, M.The effect of quercetin on the electrical properties of model lipid membranes and human glioblastoma cells.Bioelectrochemistry 2018, 124, 133–141. [CrossRef]
8. Cárdenas, M.; Marder, M.; Blank, V.C.; Roguin, L.P. Antitumor activity of some natural flavonoids andsynthetic derivatives on various human and murine cancer cell lines. Bioorg. Med. Chem. 2006, 14, 2966–2971.[CrossRef]
9. Li, H.; Liu, J.; Pei, T.; Bai, Z.; Han, R.; Liang, Z. Overexpression of SmANS Enhances AnthocyaninAccumulation and Alters Phenolic Acids Content in Salvia miltiorrhiza and Salvia miltiorrhiza Bge f. albaPlantlets. Int. J. Mol. Sci. 2019, 20, 2225. [CrossRef]
10. Kruszewski, M.A.; Kotynska, J.; Kusaczuk, M.; Gál, M.; Naumowicz, M. The Modulating Effect of p-CoumaricAcid on The Surface Charge Density of Human Glioblastoma Cell Membranes. Int. J. Mol. Sci. 2019, 20, 5286.[CrossRef]
11. Zhang, X.; Lin, D.; Jiang, R.; Li, H.; Wan, J.; Li, H. Ferulic acid exerts antitumor activity and inhibits metastasisin breast cancer cells by regulating epithelial to mesenchymal transition. Oncol. Rep. 2016, 36, 271–278.[CrossRef] [PubMed]
12. Li, W.; Li, N.; Tang, Y.-P.; Li, B.; Liu, L.; Zhang, X.; Fu, H.; Duan, J.-A. Biological activity evaluation andstructure–activity relationships analysis of ferulic acid and caffeic acid derivatives for anticancer. Bioorg. Med.
Chem. Lett. 2012, 22, 6085–6088. [CrossRef] [PubMed]13. Mori, H.; Kawabata, K.; Matsunaga, K.; Ushida, J.; Fujii, K.; Hara, A.; Tanaka, T.; Murai, H. Chemopreventive
effects of coffee bean and rice constituents on colorectal carcinogenesis. BioFactors 2000, 12, 101–105.[CrossRef] [PubMed]
14. Ls, R.; Nja, S.; Ncp, S.; Mc, M.; Aj, T. Anticancer Properties of Phenolic Acids in Colon Cancer—A Review.J. Nutr. Food Sci. 2016, 6, 1000468. [CrossRef]
15. Serafim, T.L.; Carvalho, F.S.; Marques, M.P.M.; Calheiros, R.; Silva, T.; Garrido, J.M.; Milhazes, N.; Borges, F.;Roleira, F.M.; Silva, E.T.; et al. Lipophilic Caffeic and Ferulic Acid Derivatives Presenting Cytotoxicity againstHuman Breast Cancer Cells. Chem. Res. Toxicol. 2011, 24, 763–774. [CrossRef] [PubMed]
16. Dabrowska, M.; Starek, M.; Skucinski, J. Lipophilicity study of some non-steroidal anti-inflammatory agentsand cephalosporin antibiotics: A review. Talanta 2011, 86, 35–51. [CrossRef] [PubMed]
17. Cumming, H.; Rücker, C. Octanol–Water Partition Coefficient Measurement by a Simple1H NMR Method.ACS Omega 2017, 2, 6244–6249. [CrossRef]
18. Rocher, F.; Roblin, G.; Chollet, J.-F. Modifications of the chemical structure of phenolics differentially affectphysiological activities in pulvinar cells of Mimosa pudica L. II. Influence of various molecular properties inrelation to membrane transport. Environ. Sci. Pollut. Res. 2016, 24, 6910–6922. [CrossRef]
19. Lipinski, C.A.; Lombardo, F.; Dominy, B.W.; Feeney, P.J. Experimental and computational approaches toestimate solubility and permeability in drug discovery and development settings. Adv. Drug Deliv. Rev.
2012, 64, 4–17. [CrossRef]20. Narayanaswamy, R.; Gnanamani, A.; Shanmugasamy, S.; Kumar, G.R.; Mandal, A.B. Bioinformatics in
crosslinking chemistry of collagen with selective cross linkers. BMC Res. Notes 2011, 4, 399. [CrossRef]21. Alam, A.; Tamkeen, N.; Imam, N.; Farooqui, A.; Ahmed, M.M.; Tazyeen, S.; Ali, S.; Malik, Z.; Ishrat, R.
Pharmacokinetic and Molecular Docking Studies of Plant-Derived Natural Compounds to Exploring PotentialAnti-Alzheimer Activity. In Silico Approach for Sustainable Agriculture; Springer: Singapore, 2018; pp. 217–238.
19
Membranes 2020, 10, 343
22. Van Balen, G.P.; Martinet, C.A.M.; Caron, G.; Reist, M.; Carrupt, P.-A.; Fruttero, R.; Gasco, A.; Testa, B.Liposome/water lipophilicity: Methods, information content, and pharmaceutical applications. Med. Res. Rev.
2004, 24, 299–324. [CrossRef] [PubMed]23. New, R.R.C. Liposomes. A Practical Approach; IRL Press: Oxford, UK, 1990.24. Liu, X.; Testa, B.; Fahr, A. Lipophilicity and Its Relationship with Passive Drug Permeation. Pharm. Res. 2010,
28, 962–977. [CrossRef] [PubMed]25. McLaughlin, S. The Electrostatic Properties of Membranes. Annu. Rev. Biophys. Biophys. Chem. 1989,
18, 113–136. [CrossRef] [PubMed]26. Smith, M.C.; Crist, R.M.; Clogston, J.D.; McNeil, S.E. Zeta potential: A case study of cationic, anionic,
and neutral liposomes. Anal. Bioanal. Chem. 2017, 409, 5779–5787. [CrossRef]27. Naumowicz, M.; Figaszewski, Z.A. Chronopotentiometric Technique as a Method for Electrical
Characterization of Bilayer Lipid Membranes. J. Membr. Biol. 2011, 240, 47–53. [CrossRef]28. Taylor, R.; Shults, J. (Eds.) Handbook of Chemical and Biological Sensors, 1st ed.; CRC Press: Boca Raton, FL,
USA, 1996.29. Khan, M.S.; Dosoky, N.S.; Berdiev, B.K.; Williams, J.D. Electrochemical impedance spectroscopy for black
lipid membranes fused with channel protein supported on solid-state nanopore. Eur. Biophys. J. 2016, 45,843–852. [CrossRef]
30. Velikonja, A.; Kramar, P.; Miklavcic, D.; Lebar, A.M. Specific electrical capacitance and voltage breakdown asa function of temperature for different planar lipid bilayers. Bioelectrochemistry 2016, 112, 132–137. [CrossRef]
31. Naumowicz, M.; Figaszewski, Z.A. Impedance Spectroscopic Investigation of the Bilayer Lipid MembranesFormed from the Phosphatidylserine–Ceramide Mixture. J. Membr. Biol. 2009, 227, 67–75. [CrossRef]
32. Brown, H. (Ed.) Chemistry of the Cell Interface. Part A, 1st ed.; Academic Press: New York, NY, USA, 1971;ISBN 9780323154581.
33. Coster, H.G. Dielectric and Electrical Properties of Lipid Bilayers in Relation to their Structure.Membr. Sci. Technol. 2003, 7, 75–108. [CrossRef]
34. Kotynska, J.; Figaszewski, Z.A. Microelectrophoretic investigation of the interactions between liposomalmembranes formed from a phosphatidylcholine-phosphatidylglycerol mixture and monovalent ions.Eur. Phys. J. E 2014, 37, 1–6. [CrossRef]
35. Naumowicz, M.; Figaszewski, Z. Pore Formation in Lipid Bilayer Membranes made of Phosphatidylcholineand Cholesterol Followed by Means of Constant Current. Cell Biophys. 2012, 66, 109–119. [CrossRef][PubMed]
36. Naumowicz, M.; Petelska, A.D.; Figaszewski, Z. Impedance Analysis of Complex Formation Equilibria inPhosphatidylcholine Bilayers Containing Decanoic Acid or Decylamine. Cell Biophys. 2011, 61, 145–155.[CrossRef] [PubMed]
37. Naumowicz, M.; Kruszewski, M.A.; Gál, M. Electrical properties of phosphatidylcholine bilayers containingcanthaxanthin or β-carotene, investigated by electrochemical impedance spectroscopy. J. Electroanal. Chem.
2017, 799, 563–569. [CrossRef]38. Svennerholm, L. Distribution and fatty acid composition of phosphoglycerides in normal human brain.
J. Lipid Res. 1968, 9, 570–579. [PubMed]39. Bangham, A.; Standish, M.; Watkins, J. Diffusion of univalent ions across the lamellae of swollen phospholipids.
J. Mol. Biol. 1965, 13, 238–252. [CrossRef]40. Naumowicz, M.; Kusaczuk, M.; Zajac, M.; Gál, M.; Kotynska, J. Monitoring of the Surface Charge Density
Changes of Human Glioblastoma Cell Membranes upon Cinnamic and Ferulic Acids Treatment. Int. J.
Mol. Sci. 2020, 21, 6972. [CrossRef]41. Naumowicz, M.; Kusaczuk, M.; Kruszewski, M.A.; Gál, M.; Kretowski, R.; Cechowska-Pasko, M.; Kotynska, J.
The modulating effect of lipid bilayer/p-coumaric acid interactions on electrical properties of model lipidmembranes and human glioblastoma cells. Bioorg. Chem. 2019, 92, 103242. [CrossRef]
42. Makroaufmassprogram Program. Available online: http://ruedig.de/tmp/messprogramm.htm (accessed on22 March 2020).
43. Alexander, A.E.; Johnson, P. Colloid Science; Clarendon Press: Oxford, UK, 1949.44. Barrow, G.M. Physical Chemistry; McGraw-Hill: New York, NY, USA, 1996.45. Naumowicz, M.; Figaszewski, Z. Impedance Analysis of Phosphatidylcholine/α-Tocopherol System in Bilayer
Lipid Membranes. J. Membr. Biol. 2005, 205, 29–36. [CrossRef]
20
Membranes 2020, 10, 343
46. Laszuk, P.; Urbaniak, W.; Petelska, A.D. The Equilibria in Lipid–Lipoic Acid Systems: Monolayers,Microelectrophoretic and Interfacial Tension Studies. Molecules 2020, 25, 3678. [CrossRef]
47. Zhou, Y.; Raphael, R.M. Solution pH Alters Mechanical and Electrical Properties of PhosphatidylcholineMembranes: Relation between Interfacial Electrostatics, Intramembrane Potential, and Bending Elasticity.Biophys. J. 2007, 92, 2451–2462. [CrossRef]
48. Ramadurai, S.; Sarangi, N.K.; Maher, S.; MacConnell, N.; Bond, A.M.; McDaid, D.; Flynn, D.; Keyes, T.E.Microcavity-Supported Lipid Bilayers; Evaluation of Drug–Lipid Membrane Interactions by ElectrochemicalImpedance and Fluorescence Correlation Spectroscopy. Langmuir 2019, 35, 8095–8109. [CrossRef] [PubMed]
49. Naumowicz, M.; Figaszewski, Z.A. Chronoamperometric Technique as a Useful Method for ElectricalCharacterization of Bilayer Lipid Membranes. J. Electrochem. Soc. 2013, 161, H11–H16. [CrossRef]
50. Dávalos, J.Z.; Herrero, R.; Chana, A.; Guerrero, A.; Jiménez, P.; Santiuste, J.M. Energetics and StructuralProperties, in the Gas Phase, of trans-Hydroxycinnamic Acids. J. Phys. Chem. A 2012, 116, 2261–2267.[CrossRef] [PubMed]
51. Castelli, F.; Uccella, N.A.; Trombetta, D.; Saija, A. Differences between coumaric and cinnamic acids inmembrane permeation as evidenced by time-dependent calorimetry. J. Agric. Food Chem. 1999, 47, 991–995.[CrossRef]
52. Silva, F.A.M.; Borges, F.; Guimarães, C.; Lima, J.L.F.C.; Matos, C.; Reis, S. Phenolic Acids and Derivatives:Studies on the Relationship among Structure, Radical Scavenging Activity, and Physicochemical Parameters.J. Agric. Food Chem. 2000, 48, 2122–2126. [CrossRef]
53. Kealey, D. Experiments in Modern Analytical Chemistry; Springer Science and Business Media: New York, NY,USA, 1986.
54. Galanakis, C.; Goulas, V.; Tsakona, S.; Manganaris, G.; Gekas, V. A Knowledge Base for The Recovery ofNatural Phenols with Different Solvents. Int. J. Food Prop. 2013, 16, 382–396. [CrossRef]
55. Jablonsky, M.; Haz, A.; Burcova, Z.; Kreps, F.; Jablonsky, J. Pharmacokinetic properties of biomass-extractedsubstances isolated by green solvents. BioResources 2019, 14, 6294–6303. [CrossRef]
56. Naseem, S.; Laurent, A.D.; Carroll, E.C.; Vengris, M.; Kumauchi, M.; Hoff, W.D.; Krylov, A.I.; Larsen, D.S.Photo-isomerization upshifts the pKa of the Photoactive Yellow Protein chromophore to contribute tophotocycle propagation. J. Photochem. Photobiol. A Chem. 2013, 270, 43–52. [CrossRef]
57. Friedman, M.; Jürgens, H.S. Effect of pH on the Stability of Plant Phenolic Compounds. J. Agric. Food Chem.
2000, 48, 2101–2110. [CrossRef]58. Alves, A.C.; Ribeiro, D.; Horta, M.; Lima, J.L.F.C.; Nunes, C.; Reis, S. A biophysical approach to daunorubicin
interaction with model membranes: Relevance for the drug’s biological activity. J. R. Soc. Interface 2017,14, 20170408. [CrossRef]
59. Ramalho, M.J.; Andrade, S.; Coelho, M.; Álvaro, N.; Loureiro, J.A.; Pereira, M.C. Biophysical interactionof temozolomide and its active metabolite with biomembrane models: The relevance of drug-membraneinteraction for Glioblastoma Multiforme therapy. Eur. J. Pharm. Biopharm. 2019, 136, 156–163. [CrossRef][PubMed]
60. Cheynier, V.; Comte, G.; Davies, K.M.; Lattanzio, V.; Martens, S. Plant phenolics: Recent advances on theirbiosynthesis, genetics, and ecophysiology. Plant Physiol. Biochem. 2013, 72, 1–20. [CrossRef] [PubMed]
61. Ulrih, N.P. Effects of Caffeic, Ferulic, and p-Coumaric Acids on Lipid Membranes. In Coffee in Health and Disease
Prevention; Preedy, V.R., Ed.; Academic Press: San Diego, CA, USA, 2015; pp. 813–821, ISBN 9780124167162.62. Sirk, T.W.; Brown, E.F.; Sum, A.K.; Friedman, M. Molecular Dynamics Study on the Biophysical Interactions
of Seven Green Tea Catechins with Lipid Bilayers of Cell Membranes. J. Agric. Food Chem. 2008, 56, 7750–7758.[CrossRef] [PubMed]
63. Damasceno, S.S.; Dantas, B.B.; Ribeiro-Filho, J.; Araújo, D.A.M.; Da Costa, J.G.M. Chemical Properties ofCaffeic and Ferulic Acids in Biological System: Implications in Cancer Therapy. A Review. Curr. Pharm. Des.
2017, 23, 3015–3023. [CrossRef]64. Fadel, O.; El Kirat, K.; Morandat, S. The natural antioxidant rosmarinic acid spontaneously penetrates
membranes to inhibit lipid peroxidation in situ. Biochim. Biophys. Acta (BBA) Biomembr. 2011, 1808, 2973–2980.[CrossRef]
65. Phan, H.T.; Yoda, T.; Chahal, B.; Morita, M.; Takagi, M.; Vestergaard, M. Structure-dependent interactionsof polyphenols with a biomimetic membrane system. Biochim. Biophys. Acta (BBA) Biomembr. 2014,1838, 2670–2677. [CrossRef]
21
Membranes 2020, 10, 343
66. Ota, A.; Abramovic, H.; Abram, V.; Ulrih, N.P. Interactions of p-coumaric, caffeic and ferulic acids and theirstyrenes with model lipid membranes. Food Chem. 2011, 125, 1256–1261. [CrossRef]
67. Lúcio, M.; Ferreira, H.; Lima, J.L.F.C.; Reis, S. Use of liposomes as membrane models to evaluate thecontribution of drug–membrane interactions to antioxidant properties of etodolac. Redox Rep. 2008,13, 225–236. [CrossRef]
68. Ulrih, N.P.; Ota, A.; Abram, V. Impact of selected polyphenolics on the structural properties of model lipidmembranes—A review. Int. J. Food Stud. 2017, 6, 158–177. [CrossRef]
69. Sułkowski, W.; Pentak, D.; Nowak, K.; Sułkowska, A. The influence of temperature, cholesterol content andpH on liposome stability. J. Mol. Struct. 2005, 744, 737–747. [CrossRef]
70. Roy, B.; Guha, P.; Bhattarai, R.; Nahak, P.; Karmakar, G.; Chettri, P.; Panda, A.K. Influence of LipidComposition, pH, and Temperature on Physicochemical Properties of Liposomes with Curcumin as ModelDrug. J. Oleo Sci. 2016, 65, 399–411. [CrossRef] [PubMed]
71. Dutoit, M.; Ngaboyamahina, E.; Wiesner, M. Pairing electrochemical impedance spectroscopy with conductingmembranes for the in situ characterization of membrane fouling. J. Membr. Sci. 2021, 618, 118680. [CrossRef]
Publisher’s Note: MDPI stays neutral with regard to jurisdictional claims in published maps and institutionalaffiliations.
© 2020 by the authors. Licensee MDPI, Basel, Switzerland. This article is an open accessarticle distributed under the terms and conditions of the Creative Commons Attribution(CC BY) license (http://creativecommons.org/licenses/by/4.0/).
22
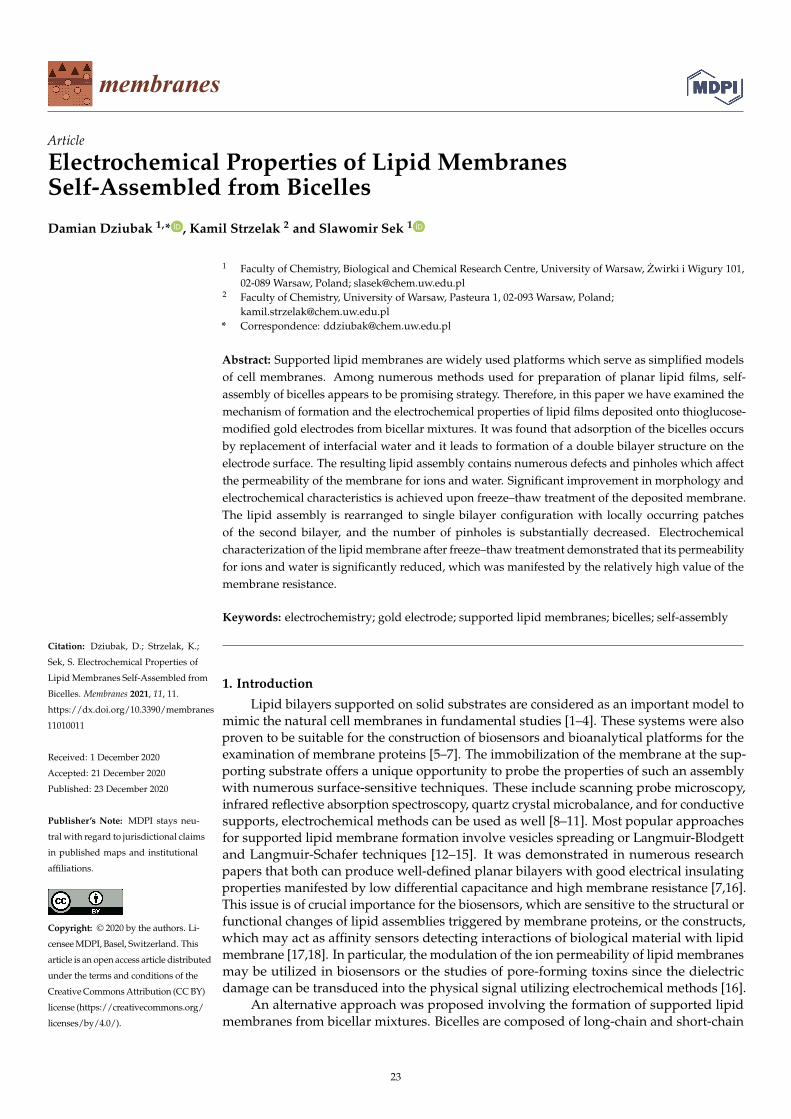
membranes
Article
Electrochemical Properties of Lipid MembranesSelf-Assembled from Bicelles
Damian Dziubak 1,* , Kamil Strzelak 2 and Slawomir Sek 1
Citation: Dziubak, D.; Strzelak, K.;
Sek, S. Electrochemical Properties of
Lipid Membranes Self-Assembled from
Bicelles. Membranes 2021, 11, 11.
https://dx.doi.org/10.3390/membranes
11010011
Received: 1 December 2020
Accepted: 21 December 2020
Published: 23 December 2020
Publisher’s Note: MDPI stays neu-
tral with regard to jurisdictional claims
in published maps and institutional
affiliations.
Copyright: © 2020 by the authors. Li-
censee MDPI, Basel, Switzerland. This
article is an open access article distributed
under the terms and conditions of the
Creative Commons Attribution (CC BY)
license (https://creativecommons.org/
licenses/by/4.0/).
1 Faculty of Chemistry, Biological and Chemical Research Centre, University of Warsaw, Zwirki i Wigury 101,02-089 Warsaw, Poland; [email protected]
2 Faculty of Chemistry, University of Warsaw, Pasteura 1, 02-093 Warsaw, Poland;[email protected]
* Correspondence: [email protected]
Abstract: Supported lipid membranes are widely used platforms which serve as simplified modelsof cell membranes. Among numerous methods used for preparation of planar lipid films, self-assembly of bicelles appears to be promising strategy. Therefore, in this paper we have examined themechanism of formation and the electrochemical properties of lipid films deposited onto thioglucose-modified gold electrodes from bicellar mixtures. It was found that adsorption of the bicelles occursby replacement of interfacial water and it leads to formation of a double bilayer structure on theelectrode surface. The resulting lipid assembly contains numerous defects and pinholes which affectthe permeability of the membrane for ions and water. Significant improvement in morphology andelectrochemical characteristics is achieved upon freeze–thaw treatment of the deposited membrane.The lipid assembly is rearranged to single bilayer configuration with locally occurring patchesof the second bilayer, and the number of pinholes is substantially decreased. Electrochemicalcharacterization of the lipid membrane after freeze–thaw treatment demonstrated that its permeabilityfor ions and water is significantly reduced, which was manifested by the relatively high value of themembrane resistance.
Keywords: electrochemistry; gold electrode; supported lipid membranes; bicelles; self-assembly
1. Introduction
Lipid bilayers supported on solid substrates are considered as an important model tomimic the natural cell membranes in fundamental studies [1–4]. These systems were alsoproven to be suitable for the construction of biosensors and bioanalytical platforms for theexamination of membrane proteins [5–7]. The immobilization of the membrane at the sup-porting substrate offers a unique opportunity to probe the properties of such an assemblywith numerous surface-sensitive techniques. These include scanning probe microscopy,infrared reflective absorption spectroscopy, quartz crystal microbalance, and for conductivesupports, electrochemical methods can be used as well [8–11]. Most popular approachesfor supported lipid membrane formation involve vesicles spreading or Langmuir-Blodgettand Langmuir-Schafer techniques [12–15]. It was demonstrated in numerous researchpapers that both can produce well-defined planar bilayers with good electrical insulatingproperties manifested by low differential capacitance and high membrane resistance [7,16].This issue is of crucial importance for the biosensors, which are sensitive to the structural orfunctional changes of lipid assemblies triggered by membrane proteins, or the constructs,which may act as affinity sensors detecting interactions of biological material with lipidmembrane [17,18]. In particular, the modulation of the ion permeability of lipid membranesmay be utilized in biosensors or the studies of pore-forming toxins since the dielectricdamage can be transduced into the physical signal utilizing electrochemical methods [16].
An alternative approach was proposed involving the formation of supported lipidmembranes from bicellar mixtures. Bicelles are composed of long-chain and short-chain
23
Membranes 2021, 11, 11
phospholipids and tend to form disk-like aggregates [19,20]. Such lipidic assembliesare broadly utilized in structural biology studies due to their ability to host membraneproteins while retaining protein structure and function [21]. The planar bilayer formationon silicon chips from a bicellar mixture of 1,2-dipalmitoyl-sn-glycero-3-phosphocholineand 1,2-diheptanoyl-sn-glycero-3-phosphocholine lipids was first reported by Zeineldinand coworkers [22]. The optimal routes to fabricate supported lipid bilayers from bicelleswere later demonstrated by Cho’s group, who also revealed mechanistic details of the lipidmembrane formation on hydrophilic substrates such as silicon dioxide, titanium oxide, andaluminum oxide [23,24]. These authors have shown that the adsorption behavior of bicellescan vary depending on the nature of the supporting surface, and the electrostatic attractionbetween the surface and adsorbing bicelles is necessary for the successful formation ofthe supported lipid bilayer (SLB). A similar conclusion can be drawn based on the resultsreported by Yamada and coworkers, who utilized atomic force microscopy and forcespectroscopy to probe the properties of lipid films assembled from bicelles [25]. It wasfound that lamellae of phospholipid bilayers were aligned parallel to a surface in case ofthe negatively charged bare silicon substrate, while unoriented phospholipid bilayers wereformed on Si substrate modified with terminal amine groups, where the excess of positivesurface charge is expected.
In this work, we have described the mechanism of bicelles adsorption onto thioglucose-modified gold electrodes. The architecture of the resulting membrane can be consideredas a floating lipid membrane, which is separated from the substrate by a monolayer ofhydrophilic molecules of thioglucose [26,27]. In such a configuration, the polar heads oflipids located close to the electrode surface remain hydrated and the direct interactionwith metal is eliminated. Immobilization of the lipid assembly on conductive supportenabled electrochemical characterization of the resulting membrane and assessment ofits permeability for ions. Additionally, the effect of freeze–thaw treatment on membraneelectrical insulating properties and morphology was investigated.
2. Materials and Methods
Chemicals. 1,2-dimyristoyl-sn-glycero-3-phosphocholine (DMPC) and 3-([3-cholamidopropyl]dimethylammonio)-2-hydroxy-1-propanesulfonate (CHAPSO) were purchasedfrom Avanti Polar Lipids Inc., Alabaster, AL, USA. Sodium fluoride, 1-thio-β-D-glucose,hydrofluoric acid, and sodium tetrachloroaurate were purchased from Sigma-Aldrich Sp.z. o. o., Poznan, Poland. All other reagents and solvents were obtained from AvantorPerformance Materials Poland S.A., Gliwice, Poland. All chemicals were used as received.The water was purified through the Milli-Q system (resistivity 18.2 MΩ × cm). In allexperiments, we have used an aqueous solution of 0.1 M NaF.
Bicelles preparation. Bicelles were prepared according to the protocol described byUjwal and coworkers [28]. 260 mg of DMPC and 90 mg of CHAPSO were transferred to thevial and mixed with 1 mL of ultrapure Milli-Q water with a resistivity of 18.2 MΩ × cm. Todisperse lipids and obtain bicelles, the suspension was warmed to 40 C and then cooled to−20 C. The steps with warming and cooling were repeated more than 25 times until themixture at room temperature was homogeneous and in gel consistency. However, 10 cyclesshould be enough to observe the formation of the gel at room temperature and cloudinessupon cooling. For the experiments, bicelles were dissolved in 0.1 M NaF solution with avolume ratio of 1:1000.
Electrochemistry. Electrochemical experiments were performed using CHI 650Bpotentiostat (CH Instruments Inc., Austin, TX, USA) in a three-electrode cell with anAg|AgCl|sat.KCl reference electrode, a Pt foil counter electrode, and an Au(111) workingelectrode. The measurements were carried out in a hanging meniscus configuration. Beforeeach experiment, the Au(111) working electrode was cleaned in piranha solution (H2SO4:H2O2 3:1 v/v. CAUTION: piranha reacts violently with organic compounds) for at least 12h. Then it was thoroughly rinsed with ultrapure water and flame annealed. The monolay-ers of 1-thio-β-D-glucose (further referenced as thioglucose) were obtained by immersing
24
Membranes 2021, 11, 11
the Au(111) electrode in an aqueous solution containing 0.1 mg/mL of the thioglucosefor ~2 h. Next, the electrodes were rinsed with ultrapure water and immersed in bicellarsuspension for at least 3 h to obtain lipid assembly. For the freeze–thaw treatment, theelectrode was taken out from the suspension and covered with a thin film of the supportingelectrolyte. Freeze–thaw treatment was carried out by cooling the electrode with depositedlipid film down to −18 C for 2 h and then warming it up to room temperature. A singlefreeze–thaw cycle was performed for each experiment. AC voltammetry measurementswere performed with a scan rate of 5 mV/s. The RMS amplitude of AC perturbation was10 mV, and a frequency set at 20 Hz. The differential capacitance was derived based onAC voltammograms from the in-phase and out-of-phase components of the AC signalunder the assumption that the electrode-electrolyte interface can be treated as a simpleRC circuit. Electrochemical impedance spectroscopy (EIS) measurements were carried outwithin the frequency range of 10−1 to 104 Hz and the amplitude AC perturbation was10 mV. All measurements were carried at 22 ± 1 C. The potentials reported in this workare referenced to the Ag|AgCl|sat.KCl electrode.
Topography Imaging. Atomic force microscopy (AFM) experiments were performedwith Dimension Icon (Bruker Corporation, Billerica, MA, USA). The imaging of the sampleswas performed using ScanAsyst Fluid probes (Bruker, nominal spring constant 0.7 N/m,tip radius ~20 nm) in PeakForce Tapping mode. The cantilever was periodically modulatedwith default amplitude at the frequency of 2 kHz. The exact value of the spring constantand the deflection sensitivity for a given probe was carefully calibrated by thermal tuningbefore each experiment. All images were recorded in an aqueous solution of 0.1 M NaF atthe temperature of 22 ± 1 C. In situ imaging was performed on an Au(111) single crystal(MaTecK, GmbH, Julich, Germany) pre-modified with thioglucose monolayer. The qualityof the bare Au(111) surface was verified by AFM imaging before each experiment (seeFigure S1 in Supplementary Materials). The images were processed using Nanoscope Anal-ysis software version 1.40 (Bruker Corporation, Billerica, MA, USA) and involved flatteningwith a first-order polynomial function. The protocol of the thioglucose immobilizationon gold was the same as for electrochemical measurements. The images were collectedimmediately after injection of bicellar suspension into the liquid cell of the atomic forcemicroscope. Freeze–thaw treatment was performed by cooling the sample with depositedlipid film down to −18 C and then warming it up to room temperature.
Surface Enhanced Infrared Absorption Spectroscopy. The spectra were recorded withNicolet iS50 FTIR spectrometer (Thermo Fisher Scientific, Waltham, MA, USA) with MCT-Adetector and custom-made single-reflection accessory. The incident angle was 60 andthe spectral resolution was 4 cm−1. The all-glass custom-made spectroelectrochemicalcell was used in all experiments with platinum foil serving as a counter electrode andAg|AgCl|sat.KCl as a reference electrode. The working electrode was a thin gold filmdeposited on a reflectance plane of a Si hemispherical prism. Deposition of gold wascarried out by dropping an aqueous plating solution onto the hydrogen-terminated Sisurface. The plating solution was obtained by mixing 100 µL of 0.03 M NaAuCl4·2H2O,2 mL of 0.15 M Na2SO3 + 0.05 M Na2S2O3·5H2O + 0.05 M NH4Cl, and 1 mL of 2% HF.After approximately 90 s of plating, the prism was rinsed with ultrapure water to finish thedeposition. The deposited film was further modified by dropping an aqueous solution ofthioglucose (0.1 mg/mL) onto the gold surface and after 2 h the prism was gently rinsedwith ultrapure water. The spectra are displayed in absorbance units defined as A = log(I0/I),where I0 corresponds to the intensities of IR radiation observed for the reference spectra,while I corresponds to the intensity observed for the sample. The reference spectrum wascollected for gold film modified with thioglucose. Data processing was performed usingOmnic 9 software (Thermo Fisher Scientific, Waltham, MA, USA).
3. Results and Discussion
Self-assembly of bicelles on thioglucose-modified gold was monitored using surface-enhanced infrared absorption spectroscopy (SEIRAS). In this technique, the infrared absorp-
25
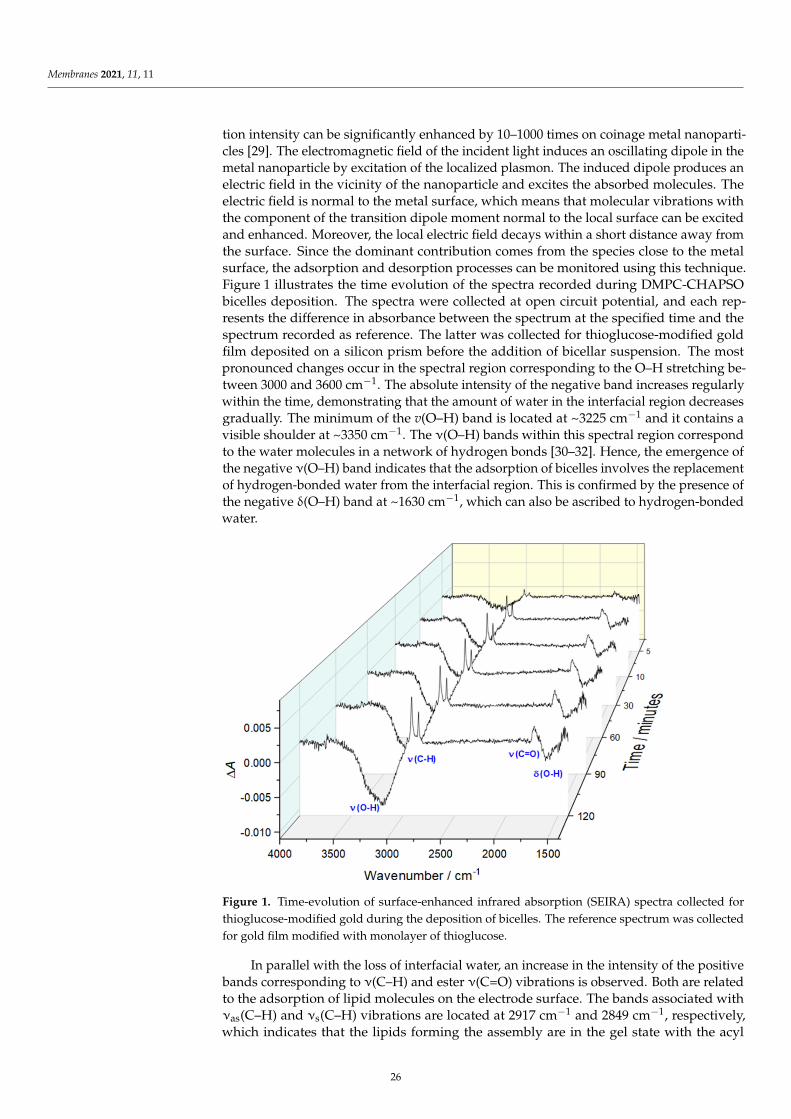
Membranes 2021, 11, 11
tion intensity can be significantly enhanced by 10–1000 times on coinage metal nanoparti-cles [29]. The electromagnetic field of the incident light induces an oscillating dipole in themetal nanoparticle by excitation of the localized plasmon. The induced dipole produces anelectric field in the vicinity of the nanoparticle and excites the absorbed molecules. Theelectric field is normal to the metal surface, which means that molecular vibrations withthe component of the transition dipole moment normal to the local surface can be excitedand enhanced. Moreover, the local electric field decays within a short distance away fromthe surface. Since the dominant contribution comes from the species close to the metalsurface, the adsorption and desorption processes can be monitored using this technique.Figure 1 illustrates the time evolution of the spectra recorded during DMPC-CHAPSObicelles deposition. The spectra were collected at open circuit potential, and each rep-resents the difference in absorbance between the spectrum at the specified time and thespectrum recorded as reference. The latter was collected for thioglucose-modified goldfilm deposited on a silicon prism before the addition of bicellar suspension. The mostpronounced changes occur in the spectral region corresponding to the O–H stretching be-tween 3000 and 3600 cm−1. The absolute intensity of the negative band increases regularlywithin the time, demonstrating that the amount of water in the interfacial region decreasesgradually. The minimum of the v(O–H) band is located at ~3225 cm−1 and it contains avisible shoulder at ~3350 cm−1. The ν(O–H) bands within this spectral region correspondto the water molecules in a network of hydrogen bonds [30–32]. Hence, the emergence ofthe negative ν(O–H) band indicates that the adsorption of bicelles involves the replacementof hydrogen-bonded water from the interfacial region. This is confirmed by the presence ofthe negative δ(O–H) band at ~1630 cm−1, which can also be ascribed to hydrogen-bondedwater.
−
−
−
− ν
ν
δ −
Figure 1. Time-evolution of surface-enhanced infrared absorption (SEIRA) spectra collected forthioglucose-modified gold during the deposition of bicelles. The reference spectrum was collectedfor gold film modified with monolayer of thioglucose.
In parallel with the loss of interfacial water, an increase in the intensity of the positivebands corresponding to ν(C–H) and ester ν(C=O) vibrations is observed. Both are relatedto the adsorption of lipid molecules on the electrode surface. The bands associated withνas(C–H) and νs(C–H) vibrations are located at 2917 cm−1 and 2849 cm−1, respectively,which indicates that the lipids forming the assembly are in the gel state with the acyl
26
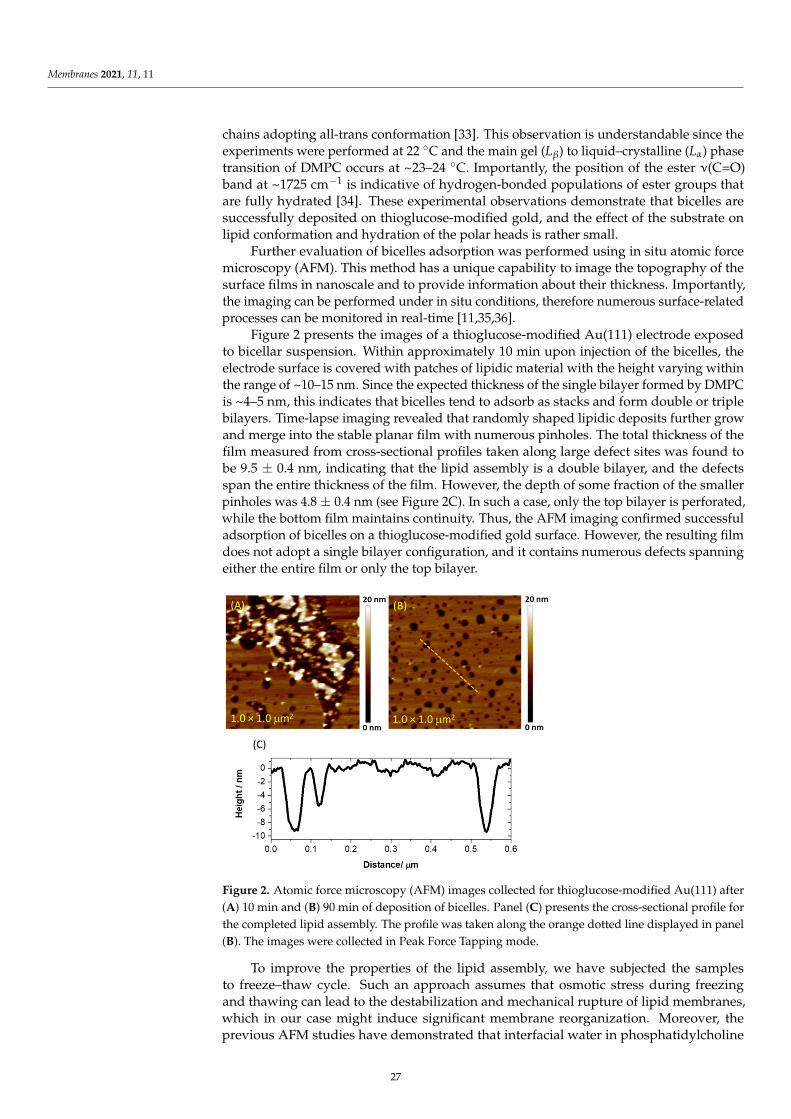
Membranes 2021, 11, 11
chains adopting all-trans conformation [33]. This observation is understandable since theexperiments were performed at 22 C and the main gel (Lβ) to liquid–crystalline (Lα) phasetransition of DMPC occurs at ~23–24 C. Importantly, the position of the ester ν(C=O)band at ~1725 cm−1 is indicative of hydrogen-bonded populations of ester groups thatare fully hydrated [34]. These experimental observations demonstrate that bicelles aresuccessfully deposited on thioglucose-modified gold, and the effect of the substrate onlipid conformation and hydration of the polar heads is rather small.
Further evaluation of bicelles adsorption was performed using in situ atomic forcemicroscopy (AFM). This method has a unique capability to image the topography of thesurface films in nanoscale and to provide information about their thickness. Importantly,the imaging can be performed under in situ conditions, therefore numerous surface-relatedprocesses can be monitored in real-time [11,35,36].
Figure 2 presents the images of a thioglucose-modified Au(111) electrode exposedto bicellar suspension. Within approximately 10 min upon injection of the bicelles, theelectrode surface is covered with patches of lipidic material with the height varying withinthe range of ~10–15 nm. Since the expected thickness of the single bilayer formed by DMPCis ~4–5 nm, this indicates that bicelles tend to adsorb as stacks and form double or triplebilayers. Time-lapse imaging revealed that randomly shaped lipidic deposits further growand merge into the stable planar film with numerous pinholes. The total thickness of thefilm measured from cross-sectional profiles taken along large defect sites was found tobe 9.5 ± 0.4 nm, indicating that the lipid assembly is a double bilayer, and the defectsspan the entire thickness of the film. However, the depth of some fraction of the smallerpinholes was 4.8 ± 0.4 nm (see Figure 2C). In such a case, only the top bilayer is perforated,while the bottom film maintains continuity. Thus, the AFM imaging confirmed successfuladsorption of bicelles on a thioglucose-modified gold surface. However, the resulting filmdoes not adopt a single bilayer configuration, and it contains numerous defects spanningeither the entire film or only the top bilayer.
ν ν
ν ν − −
β α
ν−
Figure 2. Atomic force microscopy (AFM) images collected for thioglucose-modified Au(111) after(A) 10 min and (B) 90 min of deposition of bicelles. Panel (C) presents the cross-sectional profile forthe completed lipid assembly. The profile was taken along the orange dotted line displayed in panel(B). The images were collected in Peak Force Tapping mode.
To improve the properties of the lipid assembly, we have subjected the samplesto freeze–thaw cycle. Such an approach assumes that osmotic stress during freezingand thawing can lead to the destabilization and mechanical rupture of lipid membranes,which in our case might induce significant membrane reorganization. Moreover, theprevious AFM studies have demonstrated that interfacial water in phosphatidylcholine
27
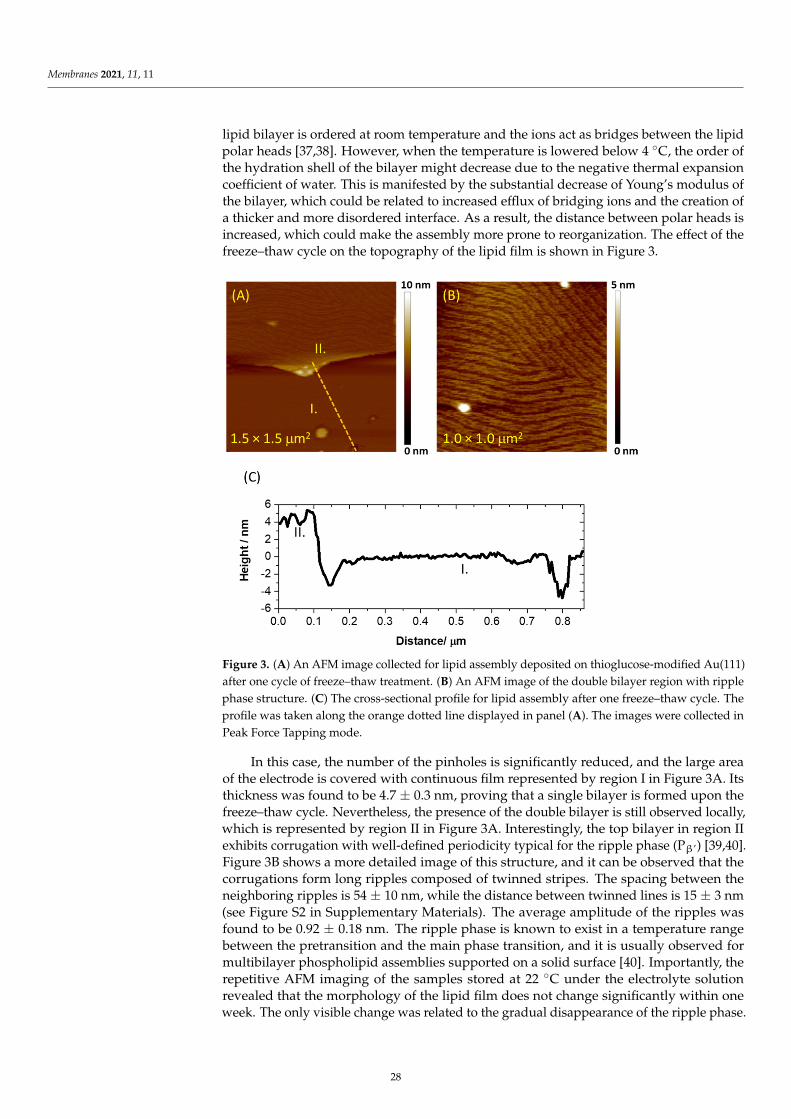
Membranes 2021, 11, 11
lipid bilayer is ordered at room temperature and the ions act as bridges between the lipidpolar heads [37,38]. However, when the temperature is lowered below 4 C, the order ofthe hydration shell of the bilayer might decrease due to the negative thermal expansioncoefficient of water. This is manifested by the substantial decrease of Young’s modulus ofthe bilayer, which could be related to increased efflux of bridging ions and the creation ofa thicker and more disordered interface. As a result, the distance between polar heads isincreased, which could make the assembly more prone to reorganization. The effect of thefreeze–thaw cycle on the topography of the lipid film is shown in Figure 3.
β
Figure 3. (A) An AFM image collected for lipid assembly deposited on thioglucose-modified Au(111)after one cycle of freeze–thaw treatment. (B) An AFM image of the double bilayer region with ripplephase structure. (C) The cross-sectional profile for lipid assembly after one freeze–thaw cycle. Theprofile was taken along the orange dotted line displayed in panel (A). The images were collected inPeak Force Tapping mode.
In this case, the number of the pinholes is significantly reduced, and the large areaof the electrode is covered with continuous film represented by region I in Figure 3A. Itsthickness was found to be 4.7 ± 0.3 nm, proving that a single bilayer is formed upon thefreeze–thaw cycle. Nevertheless, the presence of the double bilayer is still observed locally,which is represented by region II in Figure 3A. Interestingly, the top bilayer in region IIexhibits corrugation with well-defined periodicity typical for the ripple phase (Pβ’) [39,40].Figure 3B shows a more detailed image of this structure, and it can be observed that thecorrugations form long ripples composed of twinned stripes. The spacing between theneighboring ripples is 54 ± 10 nm, while the distance between twinned lines is 15 ± 3 nm(see Figure S2 in Supplementary Materials). The average amplitude of the ripples wasfound to be 0.92 ± 0.18 nm. The ripple phase is known to exist in a temperature rangebetween the pretransition and the main phase transition, and it is usually observed formultibilayer phospholipid assemblies supported on a solid surface [40]. Importantly, therepetitive AFM imaging of the samples stored at 22 C under the electrolyte solutionrevealed that the morphology of the lipid film does not change significantly within oneweek. The only visible change was related to the gradual disappearance of the ripple phase.
28
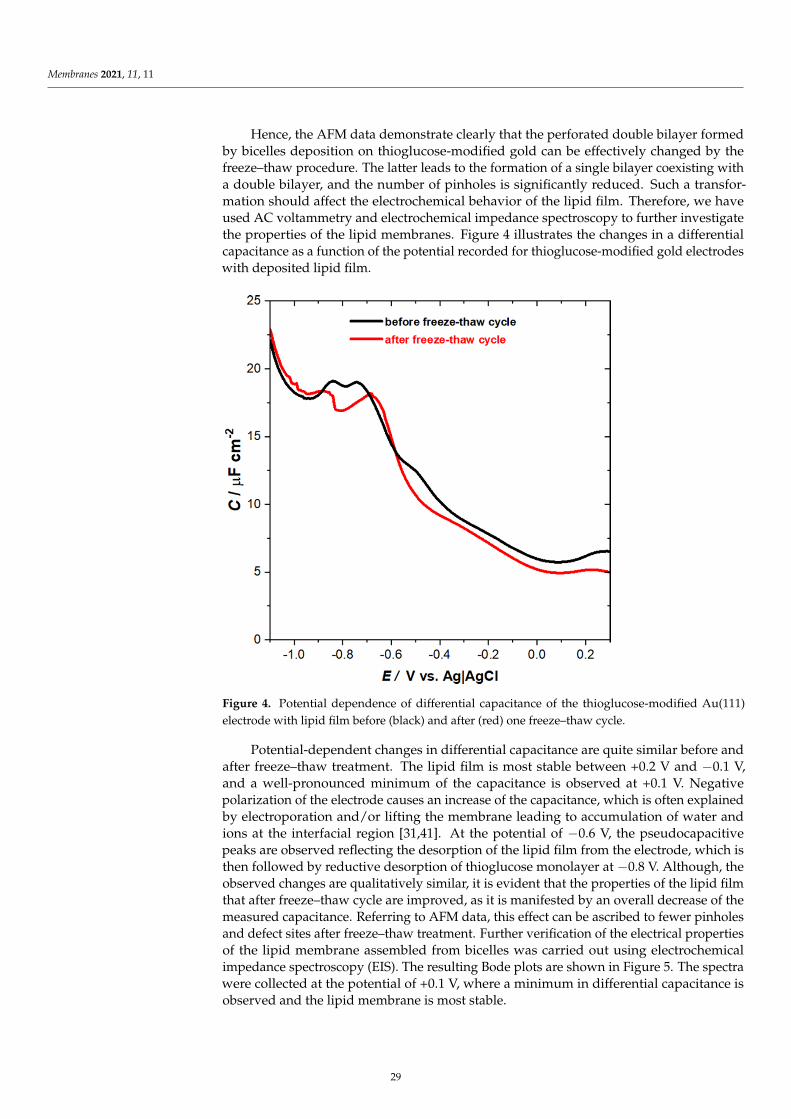
Membranes 2021, 11, 11
Hence, the AFM data demonstrate clearly that the perforated double bilayer formedby bicelles deposition on thioglucose-modified gold can be effectively changed by thefreeze–thaw procedure. The latter leads to the formation of a single bilayer coexisting witha double bilayer, and the number of pinholes is significantly reduced. Such a transfor-mation should affect the electrochemical behavior of the lipid film. Therefore, we haveused AC voltammetry and electrochemical impedance spectroscopy to further investigatethe properties of the lipid membranes. Figure 4 illustrates the changes in a differentialcapacitance as a function of the potential recorded for thioglucose-modified gold electrodeswith deposited lipid film.
−− −
Figure 4. Potential dependence of differential capacitance of the thioglucose-modified Au(111)electrode with lipid film before (black) and after (red) one freeze–thaw cycle.
Potential-dependent changes in differential capacitance are quite similar before andafter freeze–thaw treatment. The lipid film is most stable between +0.2 V and −0.1 V,and a well-pronounced minimum of the capacitance is observed at +0.1 V. Negativepolarization of the electrode causes an increase of the capacitance, which is often explainedby electroporation and/or lifting the membrane leading to accumulation of water andions at the interfacial region [31,41]. At the potential of −0.6 V, the pseudocapacitivepeaks are observed reflecting the desorption of the lipid film from the electrode, which isthen followed by reductive desorption of thioglucose monolayer at −0.8 V. Although, theobserved changes are qualitatively similar, it is evident that the properties of the lipid filmthat after freeze–thaw cycle are improved, as it is manifested by an overall decrease of themeasured capacitance. Referring to AFM data, this effect can be ascribed to fewer pinholesand defect sites after freeze–thaw treatment. Further verification of the electrical propertiesof the lipid membrane assembled from bicelles was carried out using electrochemicalimpedance spectroscopy (EIS). The resulting Bode plots are shown in Figure 5. The spectrawere collected at the potential of +0.1 V, where a minimum in differential capacitance isobserved and the lipid membrane is most stable.
29
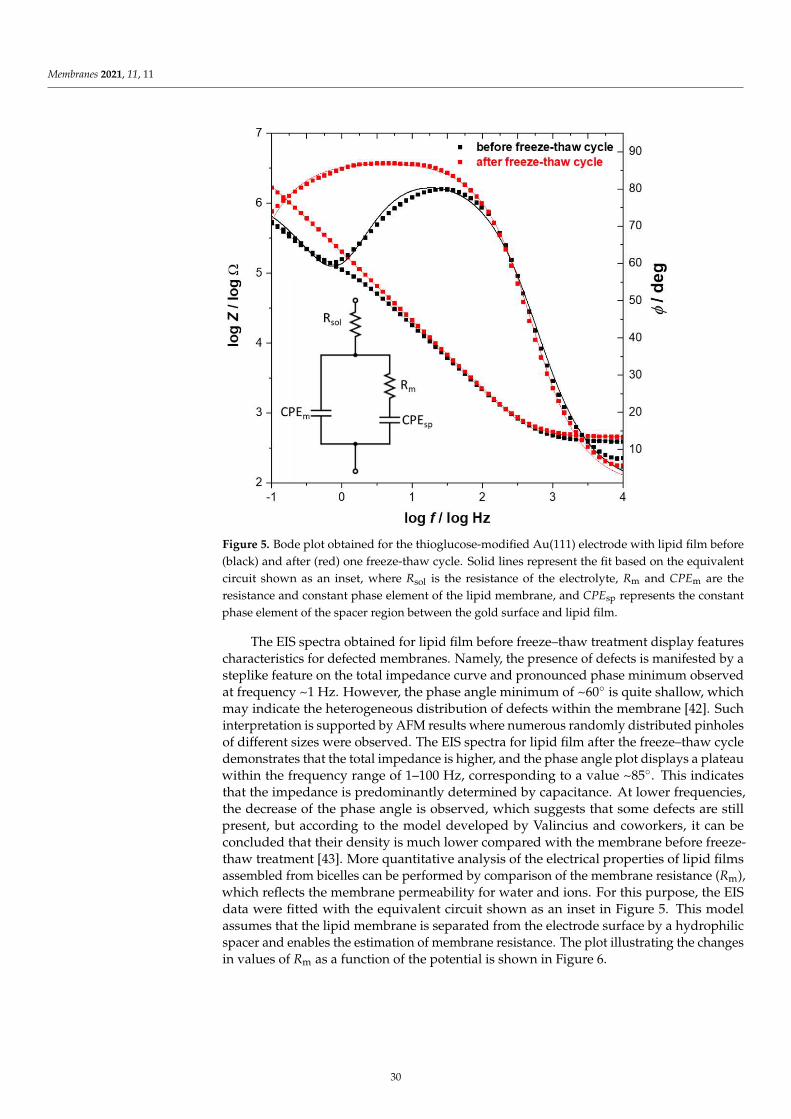
Membranes 2021, 11, 11
Figure 5. Bode plot obtained for the thioglucose-modified Au(111) electrode with lipid film before(black) and after (red) one freeze-thaw cycle. Solid lines represent the fit based on the equivalentcircuit shown as an inset, where Rsol is the resistance of the electrolyte, Rm and CPEm are theresistance and constant phase element of the lipid membrane, and CPEsp represents the constantphase element of the spacer region between the gold surface and lipid film.
The EIS spectra obtained for lipid film before freeze–thaw treatment display featurescharacteristics for defected membranes. Namely, the presence of defects is manifested by asteplike feature on the total impedance curve and pronounced phase minimum observedat frequency ~1 Hz. However, the phase angle minimum of ~60 is quite shallow, whichmay indicate the heterogeneous distribution of defects within the membrane [42]. Suchinterpretation is supported by AFM results where numerous randomly distributed pinholesof different sizes were observed. The EIS spectra for lipid film after the freeze–thaw cycledemonstrates that the total impedance is higher, and the phase angle plot displays a plateauwithin the frequency range of 1–100 Hz, corresponding to a value ~85. This indicatesthat the impedance is predominantly determined by capacitance. At lower frequencies,the decrease of the phase angle is observed, which suggests that some defects are stillpresent, but according to the model developed by Valincius and coworkers, it can beconcluded that their density is much lower compared with the membrane before freeze-thaw treatment [43]. More quantitative analysis of the electrical properties of lipid filmsassembled from bicelles can be performed by comparison of the membrane resistance (Rm),which reflects the membrane permeability for water and ions. For this purpose, the EISdata were fitted with the equivalent circuit shown as an inset in Figure 5. This modelassumes that the lipid membrane is separated from the electrode surface by a hydrophilicspacer and enables the estimation of membrane resistance. The plot illustrating the changesin values of Rm as a function of the potential is shown in Figure 6.
30
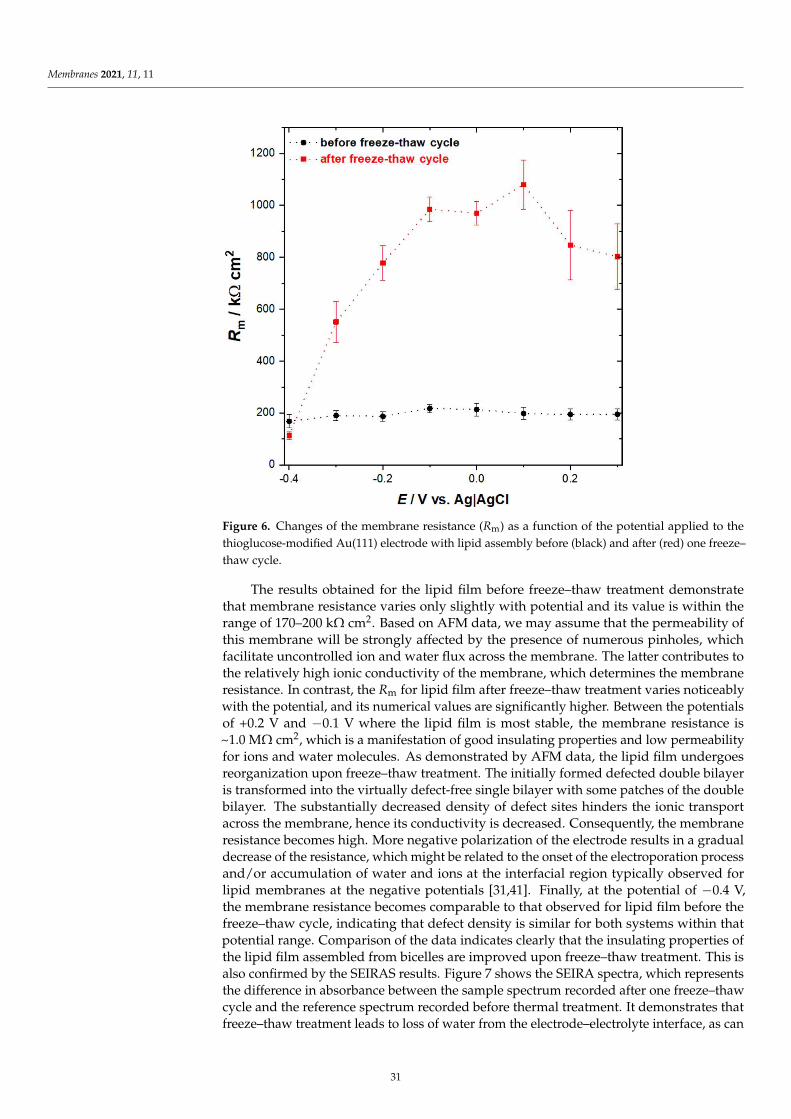
Membranes 2021, 11, 11
Ω
−Ω
−
Figure 6. Changes of the membrane resistance (Rm) as a function of the potential applied to thethioglucose-modified Au(111) electrode with lipid assembly before (black) and after (red) one freeze–thaw cycle.
The results obtained for the lipid film before freeze–thaw treatment demonstratethat membrane resistance varies only slightly with potential and its value is within therange of 170–200 kΩ cm2. Based on AFM data, we may assume that the permeability ofthis membrane will be strongly affected by the presence of numerous pinholes, whichfacilitate uncontrolled ion and water flux across the membrane. The latter contributes tothe relatively high ionic conductivity of the membrane, which determines the membraneresistance. In contrast, the Rm for lipid film after freeze–thaw treatment varies noticeablywith the potential, and its numerical values are significantly higher. Between the potentialsof +0.2 V and −0.1 V where the lipid film is most stable, the membrane resistance is~1.0 MΩ cm2, which is a manifestation of good insulating properties and low permeabilityfor ions and water molecules. As demonstrated by AFM data, the lipid film undergoesreorganization upon freeze–thaw treatment. The initially formed defected double bilayeris transformed into the virtually defect-free single bilayer with some patches of the doublebilayer. The substantially decreased density of defect sites hinders the ionic transportacross the membrane, hence its conductivity is decreased. Consequently, the membraneresistance becomes high. More negative polarization of the electrode results in a gradualdecrease of the resistance, which might be related to the onset of the electroporation processand/or accumulation of water and ions at the interfacial region typically observed forlipid membranes at the negative potentials [31,41]. Finally, at the potential of −0.4 V,the membrane resistance becomes comparable to that observed for lipid film before thefreeze–thaw cycle, indicating that defect density is similar for both systems within thatpotential range. Comparison of the data indicates clearly that the insulating properties ofthe lipid film assembled from bicelles are improved upon freeze–thaw treatment. This isalso confirmed by the SEIRAS results. Figure 7 shows the SEIRA spectra, which representsthe difference in absorbance between the sample spectrum recorded after one freeze–thawcycle and the reference spectrum recorded before thermal treatment. It demonstrates thatfreeze–thaw treatment leads to loss of water from the electrode–electrolyte interface, as can
31
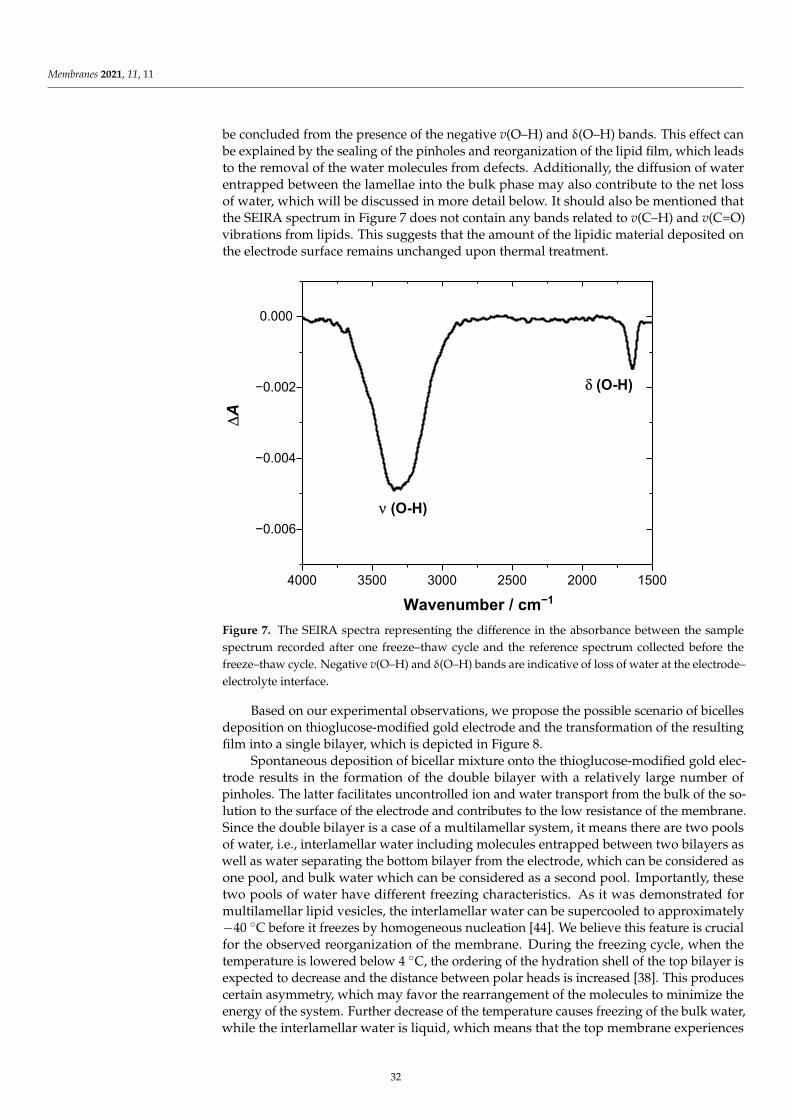
Membranes 2021, 11, 11
be concluded from the presence of the negative v(O–H) and δ(O–H) bands. This effect canbe explained by the sealing of the pinholes and reorganization of the lipid film, which leadsto the removal of the water molecules from defects. Additionally, the diffusion of waterentrapped between the lamellae into the bulk phase may also contribute to the net lossof water, which will be discussed in more detail below. It should also be mentioned thatthe SEIRA spectrum in Figure 7 does not contain any bands related to v(C–H) and v(C=O)vibrations from lipids. This suggests that the amount of the lipidic material deposited onthe electrode surface remains unchanged upon thermal treatment.
δ
δ
4000 3500 3000 2500 2000 1500
−0.006
−0.004
−0.002
0.000
∆A
Wavenumber / cm−1
ν (O-H)
δ (O-H)
Figure 7. The SEIRA spectra representing the difference in the absorbance between the samplespectrum recorded after one freeze–thaw cycle and the reference spectrum collected before thefreeze–thaw cycle. Negative v(O–H) and δ(O–H) bands are indicative of loss of water at the electrode–electrolyte interface.
Based on our experimental observations, we propose the possible scenario of bicellesdeposition on thioglucose-modified gold electrode and the transformation of the resultingfilm into a single bilayer, which is depicted in Figure 8.
Spontaneous deposition of bicellar mixture onto the thioglucose-modified gold elec-trode results in the formation of the double bilayer with a relatively large number ofpinholes. The latter facilitates uncontrolled ion and water transport from the bulk of the so-lution to the surface of the electrode and contributes to the low resistance of the membrane.Since the double bilayer is a case of a multilamellar system, it means there are two poolsof water, i.e., interlamellar water including molecules entrapped between two bilayers aswell as water separating the bottom bilayer from the electrode, which can be considered asone pool, and bulk water which can be considered as a second pool. Importantly, thesetwo pools of water have different freezing characteristics. As it was demonstrated formultilamellar lipid vesicles, the interlamellar water can be supercooled to approximately−40 C before it freezes by homogeneous nucleation [44]. We believe this feature is crucialfor the observed reorganization of the membrane. During the freezing cycle, when thetemperature is lowered below 4 C, the ordering of the hydration shell of the top bilayer isexpected to decrease and the distance between polar heads is increased [38]. This producescertain asymmetry, which may favor the rearrangement of the molecules to minimize theenergy of the system. Further decrease of the temperature causes freezing of the bulk water,while the interlamellar water is liquid, which means that the top membrane experiences
32
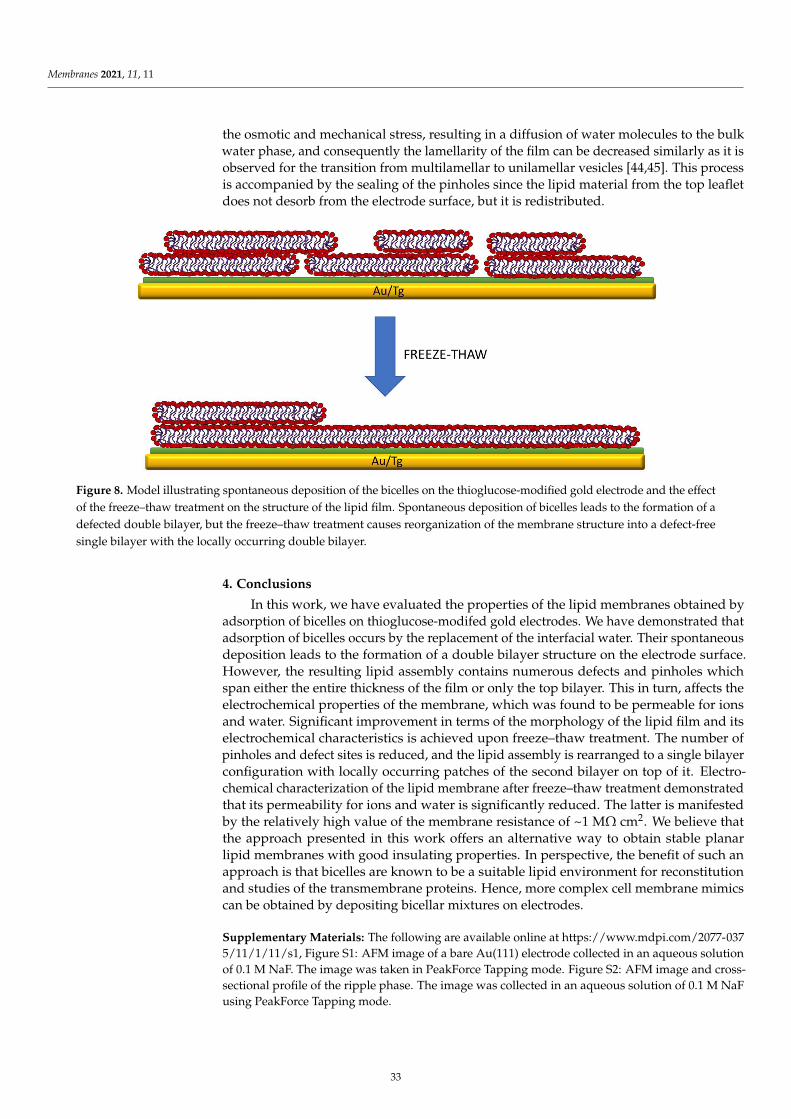
Membranes 2021, 11, 11
the osmotic and mechanical stress, resulting in a diffusion of water molecules to the bulkwater phase, and consequently the lamellarity of the film can be decreased similarly as it isobserved for the transition from multilamellar to unilamellar vesicles [44,45]. This processis accompanied by the sealing of the pinholes since the lipid material from the top leafletdoes not desorb from the electrode surface, but it is redistributed.
−
Figure 8. Model illustrating spontaneous deposition of the bicelles on the thioglucose-modified gold electrode and the effectof the freeze–thaw treatment on the structure of the lipid film. Spontaneous deposition of bicelles leads to the formation of adefected double bilayer, but the freeze–thaw treatment causes reorganization of the membrane structure into a defect-freesingle bilayer with the locally occurring double bilayer.
4. Conclusions
In this work, we have evaluated the properties of the lipid membranes obtained byadsorption of bicelles on thioglucose-modifed gold electrodes. We have demonstrated thatadsorption of bicelles occurs by the replacement of the interfacial water. Their spontaneousdeposition leads to the formation of a double bilayer structure on the electrode surface.However, the resulting lipid assembly contains numerous defects and pinholes whichspan either the entire thickness of the film or only the top bilayer. This in turn, affects theelectrochemical properties of the membrane, which was found to be permeable for ionsand water. Significant improvement in terms of the morphology of the lipid film and itselectrochemical characteristics is achieved upon freeze–thaw treatment. The number ofpinholes and defect sites is reduced, and the lipid assembly is rearranged to a single bilayerconfiguration with locally occurring patches of the second bilayer on top of it. Electro-chemical characterization of the lipid membrane after freeze–thaw treatment demonstratedthat its permeability for ions and water is significantly reduced. The latter is manifestedby the relatively high value of the membrane resistance of ~1 MΩ cm2. We believe thatthe approach presented in this work offers an alternative way to obtain stable planarlipid membranes with good insulating properties. In perspective, the benefit of such anapproach is that bicelles are known to be a suitable lipid environment for reconstitutionand studies of the transmembrane proteins. Hence, more complex cell membrane mimicscan be obtained by depositing bicellar mixtures on electrodes.
Supplementary Materials: The following are available online at https://www.mdpi.com/2077-0375/11/1/11/s1, Figure S1: AFM image of a bare Au(111) electrode collected in an aqueous solutionof 0.1 M NaF. The image was taken in PeakForce Tapping mode. Figure S2: AFM image and cross-sectional profile of the ripple phase. The image was collected in an aqueous solution of 0.1 M NaFusing PeakForce Tapping mode.
33
Membranes 2021, 11, 11
Author Contributions: Conceptualization, D.D. and S.S.; Formal analysis, S.S.; Investigation, D.D.;Methodology, K.S. and S.S.; Resources, K.S.; Writing—original draft, D.D.; Writing—review & editing,S.S. All authors have read and agreed to the published version of the manuscript.
Funding: This research was funded by Polish National Science Centre, Project No. 2016/21/B/ST4/02122.
Acknowledgments: The study was carried out at the Biological and Chemical Research Cen-tre, University of Warsaw, established within the project co-financed by European Union fromthe European Regional Development Fund under the Operational Program Innovative Economy,2007–2013.
Conflicts of Interest: The authors declare no conflict of interest.
References1. Sackmann, E. Supported Membranes: Scientific and Practical Applications. Science 1996, 271, 43–48. [CrossRef] [PubMed]2. Brian, A.A.; McConnell, H.M. Allogeneic Stimulation of Cytotoxic T Cells by Supported Planar Membranes. Proc. Natl. Acad. Sci.
USA 1984, 81, 6159–6163. [CrossRef] [PubMed]3. Poursoroush, A.; Sperotto, M.M.; Laradji, M. Phase Behavior of Supported Lipid Bilayers: A Systematic Study by Coarse-Grained
Molecular Dynamics Simulations. J. Chem. Phys. 2017, 146, 154902. [CrossRef] [PubMed]4. Schneemilch, M.; Quirke, N. Free Energy of Adsorption of Supported Lipid Bilayers from Molecular Dynamics Simulation. Chem.
Phys. Lett. 2016, 664, 199–204. [CrossRef]5. Castellana, E.T.; Cremer, P.S. Solid Supported Lipid Bilayers: From Biophysical Studies to Sensor Design. Surf. Sci. Rep. 2006, 61,
429–444. [CrossRef]6. Becucci, L.; Guidelli, R.; Peggion, C.; Toniolo, C.; Moncelli, M.R. Incorporation of Channel-Forming Peptides in a Hg-Supported
Lipid Bilayer. J. Electroanal. Chem. 2005, 576, 121–128. [CrossRef]7. Knoll, W.; Köper, I.; Naumann, R.; Sinner, E.-K. Tethered Bimolecular Lipid Membranes—A Novel Model Membrane Platform.
Electrochim. Acta 2008, 53, 6680–6689. [CrossRef]8. Konarzewska, D.; Juhaniewicz, J.; Güzeloglu, A.; Sek, S. Characterization of Planar Biomimetic Lipid Films Composed of
Phosphatidylethanolamines and Phosphatidylglycerols from Escherichia Coli. Biochim. Biophys. Acta Biomembr. 2017, 1859,475–483. [CrossRef]
9. Matyszewska, D.; Bilewicz, R.; Su, Z.; Abbasi, F.; Leitch, J.J.; Lipkowski, J. PM-IRRAS Studies of DMPC Bilayers Supported onAu(111) Electrodes Modified with Hydrophilic Monolayers of Thioglucose. Langmuir 2016, 32, 1791–1798. [CrossRef]
10. Su, Z.; Jay Leitch, J.; Abbasi, F.; Faragher, R.J.; Schwan, A.L.; Lipkowski, J. EIS and PM-IRRAS Studies of Alamethicin IonChannels in a Tethered Lipid Bilayer. J. Electroanal. Chem. 2018, 812, 213–220. [CrossRef]
11. Richter, R.P.; Brisson, A.R. Following the Formation of Supported Lipid Bilayers on Mica: A Study Combining AFM, QCM-D,and Ellipsometry. Biophys. J. 2005, 88, 3422–3433. [CrossRef] [PubMed]
12. Richter, R.; Mukhopadhyay, A.; Brisson, A. Pathways of Lipid Vesicle Deposition on Solid Surfaces: A Combined QCM-D andAFM Study. Biophys. J. 2003, 85, 3035–3047. [CrossRef]
13. Pawłowski, J.; Juhaniewicz, J.; Güzeloglu, A.; Sek, S. Mechanism of Lipid Vesicles Spreading and Bilayer Formation on a Au(111)Surface. Langmuir 2015, 31, 11012–11019. [CrossRef] [PubMed]
14. Lipkowski, J. Building Biomimetic Membrane at a Gold Electrode Surface. Phys. Chem. Chem. Phys. 2010, 12, 13874–13887.[CrossRef] [PubMed]
15. Su, Z.; Leitch, J.J.; Lipkowski, J. Electrode-Supported Biomimetic Membranes: An Electrochemical and Surface Science Approachfor Characterizing Biological Cell Membranes. Curr. Opin. Electrochem. 2018, 12, 60–72. [CrossRef]
16. Valincius, G.; Meškauskas, T.; Ivanauskas, F. Electrochemical Impedance Spectroscopy of Tethered Bilayer Membranes. Langmuir
2012, 28, 977–990. [CrossRef] [PubMed]17. Misawa, N.; Osaki, T.; Takeuchi, S. Membrane Protein-Based Biosensors. J. R. Soc. Interface 2018, 15, 20170952. [CrossRef]18. Nikoleli, G.-P.; Nikolelis, D.P.; Siontorou, C.G.; Nikolelis, M.-T.; Karapetis, S. The Application of Lipid Membranes in Biosensing.
Membranes 2018, 8, 108. [CrossRef]19. Vestergaard, M.; Kraft, J.F.; Vosegaard, T.; Thøgersen, L.; Schiøtt, B. Bicelles and Other Membrane Mimics: Comparison of
Structure, Properties, and Dynamics from MD Simulations. J. Phys. Chem. B 2015, 119, 15831–15843. [CrossRef]20. Li, M.; Morales, H.H.; Katsaras, J.; Kucerka, N.; Yang, Y.; Macdonald, P.M.; Nieh, M.-P. Morphological Characterization of
DMPC/CHAPSO Bicellar Mixtures: A Combined SANS and NMR Study. Langmuir 2013, 29, 15943–15957. [CrossRef]21. Smrt, S.T.; Draney, A.W.; Singaram, I.; Lorieau, J.L. Structure and Dynamics of Membrane Proteins and Membrane Associated
Proteins with Native Bicelles from Eukaryotic Tissues. Biochemistry 2017, 56, 5318–5327. [CrossRef] [PubMed]22. Zeineldin, R.; Last, J.A.; Slade, A.L.; Ista, L.K.; Bisong, P.; O’Brien, M.J.; Brueck, S.R.J.; Sasaki, D.Y.; Lopez, G.P. Using Bicellar
Mixtures To Form Supported and Suspended Lipid Bilayers on Silicon Chips. Langmuir 2006, 22, 8163–8168. [CrossRef] [PubMed]23. Kolahdouzan, K.; Jackman, J.A.; Yoon, B.K.; Kim, M.C.; Johal, M.S.; Cho, N.-J. Optimizing the Formation of Supported Lipid
Bilayers from Bicellar Mixtures. Langmuir 2017, 33, 5052–5064. [CrossRef] [PubMed]
34
Membranes 2021, 11, 11
24. Sut, T.N.; Jackman, J.A.; Cho, N.-J. Understanding How Membrane Surface Charge Influences Lipid Bicelle Adsorption ontoOxide Surfaces. Langmuir 2019, 35, 8436–8444. [CrossRef]
25. Yamada, N.L.; Sferrazza, M.; Fujinami, S. In-Situ Measurement of Phospholipid Nanodisk Adhesion on a Solid Substrate UsingNeutron Reflectometry and Atomic Force Microscopy. Phys. B Condens. Matter 2018, 551, 222–226. [CrossRef]
26. Kycia, A.H.; Wang, J.; Merrill, A.R.; Lipkowski, J. Atomic Force Microscopy Studies of a Floating-Bilayer Lipid Membrane on aAu(111) Surface Modified with a Hydrophilic Monolayer. Langmuir 2011, 27, 10867–10877. [CrossRef]
27. Kycia, A.H.; Sek, S.; Su, Z.; Merrill, A.R.; Lipkowski, J. Electrochemical and STM Studies of 1-Thio-β-d-Glucose Self-Assembledon a Au(111) Electrode Surface. Langmuir 2011, 27, 13383–13389. [CrossRef]
28. Ujwal, R.; Bowie, J.U. Crystallizing Membrane Proteins Using Lipidic Bicelles. Methods 2011, 55, 337–341. [CrossRef]29. Osawa, M. Topics in Applied Physics. In Near-Field Optics and Surface Plasmon Polaritons; Springer: New York, NY, USA, 2002;
pp. 163–187.30. Uchida, T.; Osawa, M.; Lipkowski, J. SEIRAS Studies of Water Structure at the Gold Electrode Surface in the Presence of Supported
Lipid Bilayer. J. Electroanal. Chem. 2014, 716, 112–119. [CrossRef]31. Juhaniewicz-Debinska, J.; Konarzewska, D.; Sek, S. Effect of Interfacial Water on the Nanomechanical Properties of Negatively
Charged Floating Bilayers Supported on Gold Electrodes. Langmuir 2019, 35, 9422–9429. [CrossRef]32. Su, Z.; Juhaniewicz-Debinska, J.; Sek, S.; Lipkowski, J. Water Structure in the Submembrane Region of a Floating Lipid Bilayer:
The Effect of an Ion Channel Formation and the Channel Blocker. Langmuir 2019, 36, 409–418. [CrossRef] [PubMed]33. Casal, H.L.; Mantsch, H.H. Polymorphic Phase Behaviour of Phospholipid Membranes Studied by Infrared Spectroscopy. Biochim.
Biophys. Acta 1984, 779, 381–401. [CrossRef]34. Zawisza, I.; Bin, X.; Lipkowski, J. Potential-Driven Structural Changes in Langmuir−Blodgett DMPC Bilayers Determined by in
Situ Spectroelectrochemical PM IRRAS. Langmuir 2007, 23, 5180–5194. [CrossRef] [PubMed]35. Juhaniewicz, J.; Sek, S. Atomic Force Microscopy and Electrochemical Studies of Melittin Action on Lipid Bilayers Supported on
Gold Electrodes. Electrochim. Acta 2015, 162, 53–61. [CrossRef]36. Gál, M.; Sokolová, R.; Naumowicz, M.; Híveš, J.; Krahulec, J. Electrochemical and AFM Study of the Interaction of Recombinant
Human Cathelicidin LL-37 with Various Supported Bilayer Lipid Membranes. J. Electroanal. Chem. 2018, 821, 40–46. [CrossRef]37. Fukuma, T.; Higgins, M.J.; Jarvis, S.P. Direct Imaging of Individual Intrinsic Hydration Layers on Lipid Bilayers at Ångstrom
Resolution. Biophys. J. 2007, 92, 3603–3609. [CrossRef] [PubMed]38. Gabbutt, C.; Shen, W.; Seifert, J.; Contera, S. AFM Nanoindentation Reveals Decrease of Elastic Modulus of Lipid Bilayers near
Freezing Point of Water. Sci. Rep. 2019, 9, 19473. [CrossRef]39. Leidy, C.; Kaasgaard, T.; Crowe, J.H.; Mouritsen, O.G.; Jørgensen, K. Ripples and the Formation of Anisotropic Lipid Domains:
Imaging Two-Component Supported Double Bilayers by Atomic Force Microscopy. Biophys. J. 2002, 83, 2625–2633. [CrossRef]40. Kaasgaard, T.; Leidy, C.; Crowe, J.H.; Mouritsen, O.G.; Jørgensen, K. Temperature-Controlled Structure and Kinetics of Ripple
Phases in One- and Two-Component Supported Lipid Bilayers. Biophys. J. 2003, 85, 350–360. [CrossRef]41. Chen, M.; Li, M.; Brosseau, C.L.; Lipkowski, J. AFM Studies of the Effect of Temperature and Electric Field on the Structure of a
DMPC−Cholesterol Bilayer Supported on a Au(111) Electrode Surface. Langmuir 2009, 25, 1028–1037. [CrossRef]42. Valincius, G.; Mickevicius, M.; Penkauskas, T.; Jankunec, M. Electrochemical Impedance Spectroscopy of Tethered Bilayer
Membranes: An Effect of Heterogeneous Distribution of Defects in Membranes. Electrochim. Acta 2016, 222, 904–913. [CrossRef]43. Valincius, G.; Mickevicius, M. Chapter Two—Tethered Phospholipid Bilayer Membranes: An Interpretation of the Electrochemical
Impedance Response. In Advances in Planar Lipid Bilayers and Liposomes; Iglic, A., Kulkarni, C.V., Rappolt, M.B.T.-A., Eds.;Academic Press: New York, NY, USA, 2015; Volume 21, pp. 27–61. [CrossRef]
44. Kaasgaard, T.; Mouritsen, O.G.; Jørgensen, K. Freeze/Thaw Effects on Lipid-Bilayer Vesicles Investigated by Differential ScanningCalorimetry. Biochim. Biophys. Acta Biomembr. 2003, 1615, 77–83. [CrossRef]
45. Traïkia, M.; Warschawski, D.E.; Recouvreur, M.; Cartaud, J.; Devaux, P.F. Formation of Unilamellar Vesicles by RepetitiveFreeze-Thaw Cycles: Characterization by Electron Microscopy and 31P-Nuclear Magnetic Resonance. Eur. Biophys. J. 2000, 29,184–195. [CrossRef] [PubMed]
35

membranes
Article
Electrical Properties of Membrane Phospholipids in LangmuirMonolayers
Anna Chachaj-Brekiesz 1 , Jan Kobierski 2 , Anita Wnetrzak 1 and Patrycja Dynarowicz-Latka 1,*
Citation: Chachaj-Brekiesz, A.;
Kobierski, J.; Wnetrzak, A.;
Dynarowicz-Latka, P. Electrical
Properties of Membrane
Phospholipids in Langmuir
Monolayers. Membranes 2021, 11, 53.
https://doi.org/10.3390/membranes
11010053
Received: 13 December 2020
Accepted: 11 January 2021
Published: 13 January 2021
Publisher’s Note: MDPI stays neu-
tral with regard to jurisdictional clai-
ms in published maps and institutio-
nal affiliations.
Copyright: © 2021 by the authors. Li-
censee MDPI, Basel, Switzerland.
This article is an open access article
distributed under the terms and con-
ditions of the Creative Commons At-
tribution (CC BY) license (https://
creativecommons.org/licenses/by/
4.0/).
1 Faculty of Chemistry, Jagiellonian University, Gronostajowa 2, 30-387 Kraków, Poland;[email protected] (A.C.-B.); [email protected] (A.W.)
2 Department of Pharmaceutical Biophysics, Faculty of Pharmacy, Jagiellonian University Medical College,Medyczna 9, 30-688 Kraków, Poland; [email protected]
* Correspondence: [email protected]
Abstract: Experimental surface pressure (π) and electric surface potential (∆V) isotherms were mea-sured for membrane lipids, including the following phosphatidylcholines (PCs)—1,2-dipalmitoyl-sn-glycero-3-phosphocholine (DPPC); 1,2-distearoyl-sn-glycero-3-phosphocholine (DSPC); 1,2-diarachidoyl-sn-glycero-3-phosphocholine (DAPC); and 1,2-dioleoyl-sn-glycero-3-phosphocholine (DOPC). Inaddition, other phospholipids, such as phosphatidylethanolamines (represented by 1,2-dipalmitoyl-sn-glycero-3-phosphoethanolamine (DPPE)) and sphingolipids (represented by N-(hexadecanoyl)-sphing-4-enine-1-phosphocholine (SM)) were also studied. The experimental apparent dipole mo-ments (µexp
A ) of the abovementioned lipids were determined using the Helmholtz equation. Theparticular contributions to the apparent dipole moments of the investigated molecules connectedwith their polar (µp
⊥) and apolar parts (µa⊥) were theoretically calculated for geometrically optimized
systems. Using a three-layer capacitor model, introducing the group’s apparent dipole moments(calculated herein) and adopting values from other papers to account for the reorientation of watermolecules (µw
⊥/εw), as well as the for the local dielectric permittivity in the vicinity of the polar (εp)and apolar (εa) groups, the apparent dipole moments of the investigated molecules were calculated(µcalc
A ). Since the comparison of the two values (experimental and calculated) resulted in large dis-crepancies, we developed a new methodology that correlates the results from density functionaltheory (DFT) molecular modeling with experimentally determined values using multiple linearregression. From the fitted model, the following contributions to the apparent dipole momentswere determined: µw
⊥/εw = −1.8 ± 1.4 D; εp = 10.2 ± 7.0 and εa = 0.95 ± 0.52). Local dielectricpermittivity in the vicinity of apolar groups (εa) is much lower compared to that in the vicinity ofpolar moieties (εp), which is in line with the tendency observed by other authors studying simplemolecules with small polar groups. A much higher value for the contributions from the reorientationof water molecules (µw
⊥/εw) has been interpreted as resulting from bulky and strongly hydratedpolar groups of phospholipids.
Keywords: Langmuir monolayers; electric surface potential; dipole moments; phospholipids
1. Introduction
The Langmuir monolayers formed by insoluble amphiphiles at the free water surfacehave mainly been analyzed using the classical method based on recording surface pressure(π)–area (A) isotherms, which enables researchers to monitor changes of the physical stateof film molecules upon compression [1]. Their visualization is possible with microscopicmethods like Brewster angle microscopy [2] and fluorescence microscopy [3]. Changesin the electric potential (∆V), which provide important information on the orientation ofmolecules at the surface, are performed less frequently. Such measurements complementthe characterization of the film’s electrical properties (including dipole moments anddielectric permittivity), which play an important role in many intermolecular interactions.
37
Membranes 2021, 11, 53
Their analysis provides the basis for an insight into the understanding of biomolecularprocesses in membranes.
A Langmuir monolayer can be considered as an array of electric dipoles of film-forming molecules situated at the air/water interface. Of particular interest are phospho-lipid monolayers, which provide a simplified, two-dimensional membrane model that issuitable for studying interactions [4]. Particularly important are those between the polargroups of film molecules and substances dissolved in the subphase (ions and solublebiomolecules). During interactions, the electrical surface potential of the monolayer can bedecreased or increased. The measurements of such modifications are of great value as theycan be used to screen drugs and check their effectiveness [5–8].
The experimental surface potential changes of a monolayer have usually been interpretedin the terms of so-called effective dipole moments (µ⊥). In the simplest approach, derivedfrom the parallel plate condenser model [9], ∆V is expressed by the Helmholtz equation:
∆V =µ⊥
Aεε0(1)
where ε is the dielectric permittivity of the film, ε0 is the dielectric permittivity of thevacuum, µ⊥. is the normal (to the interface) component of the dipole moment of the filmmolecule at the interface (note that this is different from the molecular dipole momentof the free molecule) and A is the average area occupied by the molecule at the surface(A = 1/N, where N is the total number of molecules at 1 cm2 of the surface). The aboveequation applies to un-ionized molecules. For ionized ones, the double layer potential (ψ0)must be taken into account [9,10]. The main problem in Equation (1) is the unknown valueof the permittivity of the film, ε. One of the approaches assumes that ε = 1, either becausemolecules are considered as isolated entities or because of the lack of a known value [10],however, this can be assumed only for gaseous films. Some authors have claimed that avalue 5 < ε < 10 should be used [11]. Others suggest that for condensed monolayers, ε canbe taken as 2, which is the dielectric permittivity of hydrocarbons [12]. In another approach,the unknown value of ε has been included in the so-called “apparent dipole moment” of afilm molecule, µA = µ⊥
ε[13]. µA can be easily determined from the experimental values
of ∆V as a function of A. Apart from the Helmholtz model, other approaches have beensuggested in order to interpret surface potential changes (reviewed in [14,15]). A frequentlyused model was provided by Demchak and Fort [16], which treats the monolayer as athree-layer capacitor. In this model, the effective dipole moment of a film molecule can bedivided into the contributions from the reorientation of water molecules in the monolayer,the polar and apolar part of the film molecule (µw
⊥, µp⊥ and µa
⊥, respectively), divided bytheir local dielectric permittivities:
∆V =1
Aε0
(
µw⊥εw
+µ
p⊥εp
+µa⊥εa
)
(2)
Equation (2) has been used to interpret electric surface potentials for both adsorbed [17]as well as insoluble monolayers [18]. Group dipole moments, µp
⊥ and µa⊥ were calculated
from bond dipole moments and angles between them, whereas local dielectric permittivitiesεa and εp were obtained by solving in pairs equations of type (2) for molecules having thesame apolar parts and different polar parts, and vice versa, assuming that the contributionfrom the reorientation of water molecules (µw
⊥/εw) in each pair of equations is the same.Using this procedure for adsorbed films [17] and Langmuir monolayers [18,19] formedby carboxylic acids, alcohols and their derivatives, the following values were obtained:εp = 4.2; εa = 2.4; (µw
⊥/εw) = −100 ÷ −200 mD; εp = 6.4; εa = 2.8; (µw⊥/εw) = −65 mD,
and εp = 7.6; εa = 4.2; (µw⊥/εw) = 25 mD, respectively. Upon analyzing surface potential
changes for terphenyl derivatives [16], the following values were obtained: εp = 7.6;εa = 5.3; (µw
⊥/εw) = 40 mD. Although there are some differences as regards the valuesof local dielectric permittivities, εp is always higher than εa. The greatest discrepancies
38
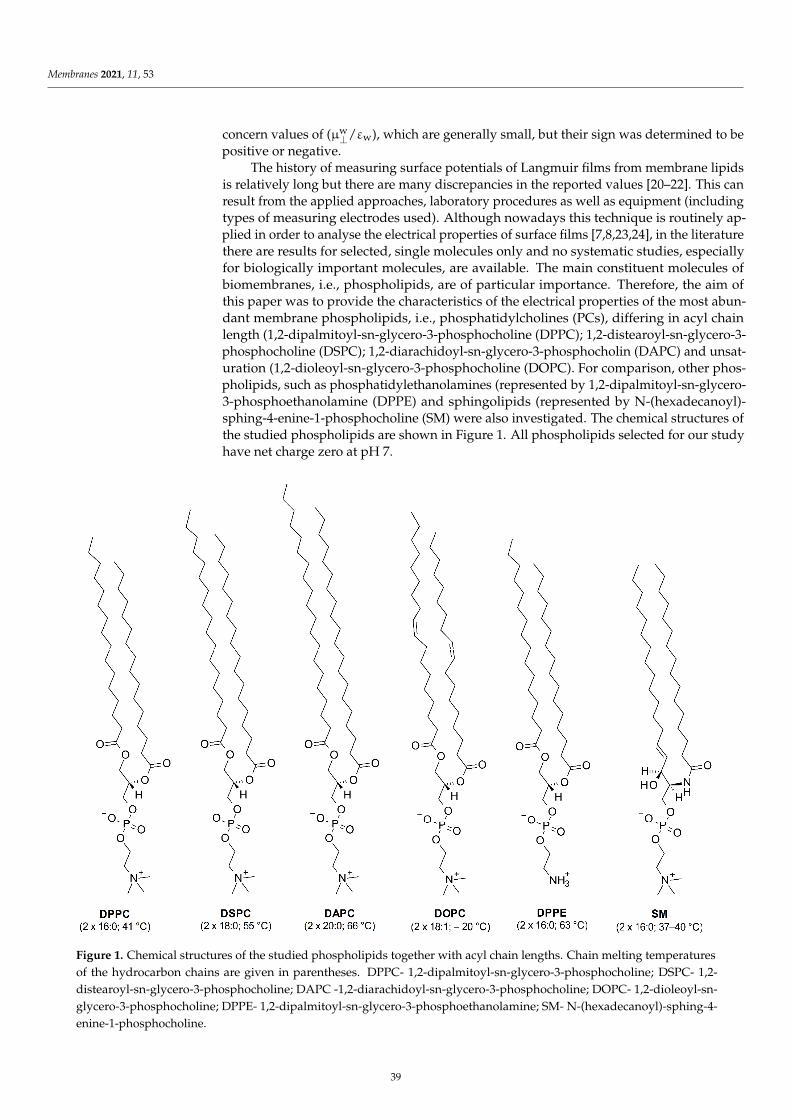
Membranes 2021, 11, 53
concern values of (µw⊥/εw), which are generally small, but their sign was determined to be
positive or negative.The history of measuring surface potentials of Langmuir films from membrane lipids
is relatively long but there are many discrepancies in the reported values [20–22]. This canresult from the applied approaches, laboratory procedures as well as equipment (includingtypes of measuring electrodes used). Although nowadays this technique is routinely ap-plied in order to analyse the electrical properties of surface films [7,8,23,24], in the literaturethere are results for selected, single molecules only and no systematic studies, especiallyfor biologically important molecules, are available. The main constituent molecules ofbiomembranes, i.e., phospholipids, are of particular importance. Therefore, the aim ofthis paper was to provide the characteristics of the electrical properties of the most abun-dant membrane phospholipids, i.e., phosphatidylcholines (PCs), differing in acyl chainlength (1,2-dipalmitoyl-sn-glycero-3-phosphocholine (DPPC); 1,2-distearoyl-sn-glycero-3-phosphocholine (DSPC); 1,2-diarachidoyl-sn-glycero-3-phosphocholin (DAPC) and unsat-uration (1,2-dioleoyl-sn-glycero-3-phosphocholine (DOPC). For comparison, other phos-pholipids, such as phosphatidylethanolamines (represented by 1,2-dipalmitoyl-sn-glycero-3-phosphoethanolamine (DPPE) and sphingolipids (represented by N-(hexadecanoyl)-sphing-4-enine-1-phosphocholine (SM) were also investigated. The chemical structures ofthe studied phospholipids are shown in Figure 1. All phospholipids selected for our studyhave net charge zero at pH 7.
Figure 1. Chemical structures of the studied phospholipids together with acyl chain lengths. Chain melting temperaturesof the hydrocarbon chains are given in parentheses. DPPC- 1,2-dipalmitoyl-sn-glycero-3-phosphocholine; DSPC- 1,2-distearoyl-sn-glycero-3-phosphocholine; DAPC -1,2-diarachidoyl-sn-glycero-3-phosphocholine; DOPC- 1,2-dioleoyl-sn-glycero-3-phosphocholine; DPPE- 1,2-dipalmitoyl-sn-glycero-3-phosphoethanolamine; SM- N-(hexadecanoyl)-sphing-4-enine-1-phosphocholine.
39
Membranes 2021, 11, 53
The theoretical models used so far for determining the apparent dipole moments andlocal dielectric permittivities were developed for very simple molecules such as carboxylicacids, alcohols and amines. The use of these models to determine the electrical propertiesof more complex molecules has not worked well. Therefore, an additional goal of ourresearch was to develop a universal model to be used for molecules of any structure, basedon density functional theory (DFT) modeling and multiple linear regression.
2. Materials and Methods2.1. Surface Potential Measurements
DPPC (1,2-dipalmitoyl-sn-glycero-3-phosphocholine; 16:0 PC), DSPC (1,2-distearoyl-sn-glycero-3-phosphocholine; 18:0 PC), DAPC (1,2-diarachidoyl-sn-glycero-3-phosphocholine; 20:0 PC); DOPC (1,2-dioleoyl-sn-glycero-3-phosphocholine; 18:1 PC), egg SM (con-taining 86% of N-(hexadecanoyl)-sphing-4-enine-1-phosphocholine; 16:0 SM) and DPPE(1,2-dipalmitoyl-sn-glycero-3-phosphoethanolamine; 16:0 PE) in purities > 99% were sup-plied by Avanti Polar Lipids. All the investigated phospholipids (except for DOPC) wereinvestigated below their chain melting temperatures (specified in Figure 1). Ethanol(98%) and spectral grade chloroform (stabilized with ethanol) were delivered by Sigma-Aldrich. Spreading solutions for Langmuir experiments were prepared by dissolvingeach compound in chloroform or chloroform:ethanol (9:1) with a typical concentration of0.2–0.3 mg·mL−1. In a standard experiment, 50–100 µL of the investigated solution wasspread with a microsyringe (precise to ±2.5 µL). After spreading, the monolayers wereleft for 10 min for solvent evaporation before starting the compression at a barrier speedof 20 cm2/min. Deionized ultrapure water from a Millipore system with a resistivity of18.2 MΩ·cm, pH 7, and a surface tension of 72.8 mN/m was used as a subphase. Thesubphase temperature (20 C) was controlled to within 0.1 C using a thermostat fromJulabo. Experiments were carried out with a two-barrier Langmuir 612D NIMA trough(total area 600 cm2) placed on an antivibration table. Surface pressure was measuredwith an accuracy of 0.1 mN/m using a Wilhelmy plate made of chromatography paper(Whatman Chr1) as the pressure sensor. Electric surface potential measurements wereperformed using a Kelvin probe (model KP2, NFT) mounted on a 612D NIMA trough. Thevibrating plate was located ca. 2 mm above the water surface while the reference electrode,made from platinum foil, was placed in the water subphase. The surface potential mea-surements were reproducible to ±15 mV and ±2 Å2 per molecule. Experimental resultsof surface pressure–area and electric surface potential–area isotherms presented here arerepresentative curves selected from at least three overlapping experiments.
2.2. Theoretical Calculations
The dipole moments and of polar µp⊥ and apolar µa
⊥ parts of molecules were cal-culated for previously geometrically optimized systems using the Gaussian 16 softwarepackage [25]. Geometry optimization was performed by density functional theory (DFT)modeling. All calculations were performed using the B3LYP functional [26–29] with a6-311+G(d,p) basis set [30,31] and the D3 version of Grimme’s empirical dispersion with theoriginal D3 damping function [32]. Systems were optimized with the default convergenceprocedures, with no Fermi broadening.
3. Results and Discussion
The results of surface pressure (π) and electric surface potential changes (∆V) versusarea per molecule (A) measurements for the investigated lipids are presented in Figures 1and 2. Experimental π–A isotherms for all the studied phospholipids are in good agree-ment with those already published ([33] for DPPC, [34] for DSPC, [35] for DAPC, [36] forDOPC, [37] for DPPE and [38] for SM). Experimental ∆V − A curves can be characterizedby two important parameters: critical area (Ac, which corresponds to the area at which∆V is triggered off) and maximum value of surface potential (∆Vmax). The change insurface potential, observed at Ac occurs at much earlier stages of monolayer compression
40

Membranes 2021, 11, 53
compared to the surface pressure lift-off area (Alift–off) [10]. The onset areas of both surfacepressure (Alift–off) and surface potential (Ac) occur at the largest areas for the unsaturatedphospholipid DOPC. This is due to the steric requirements for molecules with cis unsatu-rated bonds in their chains, having a coiled conformation, in contrast to saturated all-transchains. For uncharged compounds, ∆V is approximately constant and close to zero at largeareas per molecule. Upon compression, a sharp change (increase or decrease) is observedat the critical area. Changes in the slope of ∆V–A dependence reflect molecular orientationand/or conformational changes in the layer, as ∆V is proportional to the magnitude of theelectrostatic field gradient normal to the subphase surface [1]. The maximum of the surfacepotential, ∆Vmax, is defined as the value corresponding to the most vertical orientation ofmolecules, which usually coincides with the maximum condensation of the monolayer,characterized by the maximum compressibility modulus: C−1
s = −A(
dπdA
)
[39]. Finally, ata collapse point, ∆V becomes approximately constant. The maximum value of the surfacepotential, ∆Vmax, is used to calculate the apparent dipole moment µexp
A of film molecules,using the following equation:
µexpA =
µ⊥ε
= ε0 · A · ∆Vmax (3)
wherein ε0 is the vacuum permittivity, ε is the monolayer permittivity (unknown) and Aand ∆Vmax are values extracted from experimental curves corresponding to the maximumcompressibility modulus. The values of µexp
A for all the investigated phospholipids, togetherwith other characteristic parameters for their monolayers, such as Alift–off, Ac, ∆Vmax andA, are summarized in Table 1.
ΔV–A−
𝜋–𝐴
ΔV–A
Figure 2. Electric surface potential change and surface pressure isotherms, together with calculated compressional mod-uli curves for selected phosphatidylcholines: (A) DPPC (1,2-dipalmitoyl-sn-glycero-3-phosphocholine), (B) DSPC (1,2-distearoyl-sn-glycero-3-phosphocholine), (C) DAPC (1,2-diarachidoyl-sn-glycero-3-phosphocholine) and (D) DOPC (1,2-dioleoyl-sn-glycero-3-phosphocholine).
41
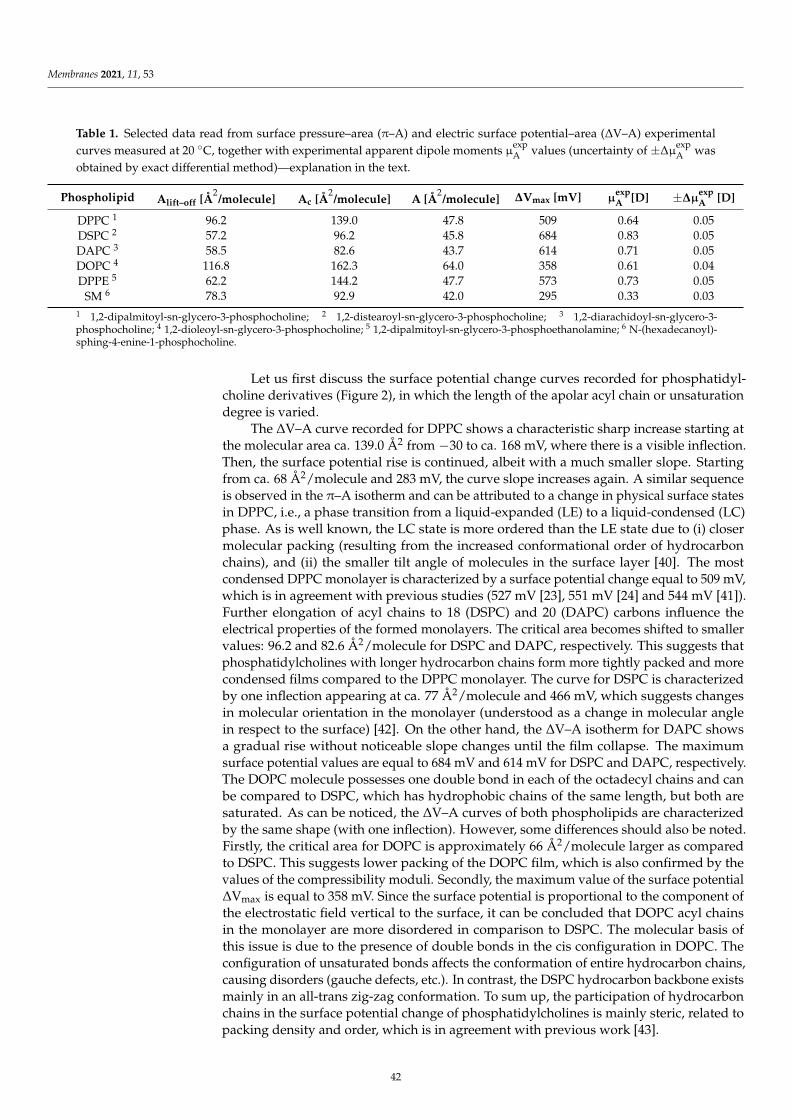
Membranes 2021, 11, 53
Table 1. Selected data read from surface pressure–area (π–A) and electric surface potential–area (∆V–A) experimentalcurves measured at 20 C, together with experimental apparent dipole moments µexp
A values (uncertainty of ±∆µexpA was
obtained by exact differential method)—explanation in the text.
Phospholipid Alift–off [Å2/molecule] Ac [Å
2/molecule] A [Å
2/molecule] ∆Vmax [mV] µ
expA [D] ±∆µ
expA [D]
DPPC 1 96.2 139.0 47.8 509 0.64 0.05DSPC 2 57.2 96.2 45.8 684 0.83 0.05DAPC 3 58.5 82.6 43.7 614 0.71 0.05DOPC 4 116.8 162.3 64.0 358 0.61 0.04DPPE 5 62.2 144.2 47.7 573 0.73 0.05
SM 6 78.3 92.9 42.0 295 0.33 0.031 1,2-dipalmitoyl-sn-glycero-3-phosphocholine; 2 1,2-distearoyl-sn-glycero-3-phosphocholine; 3 1,2-diarachidoyl-sn-glycero-3-phosphocholine; 4 1,2-dioleoyl-sn-glycero-3-phosphocholine; 5 1,2-dipalmitoyl-sn-glycero-3-phosphoethanolamine; 6 N-(hexadecanoyl)-sphing-4-enine-1-phosphocholine.
Let us first discuss the surface potential change curves recorded for phosphatidyl-choline derivatives (Figure 2), in which the length of the apolar acyl chain or unsaturationdegree is varied.
The ∆V–A curve recorded for DPPC shows a characteristic sharp increase starting atthe molecular area ca. 139.0 Å2 from −30 to ca. 168 mV, where there is a visible inflection.Then, the surface potential rise is continued, albeit with a much smaller slope. Startingfrom ca. 68 Å2/molecule and 283 mV, the curve slope increases again. A similar sequenceis observed in the π–A isotherm and can be attributed to a change in physical surface statesin DPPC, i.e., a phase transition from a liquid-expanded (LE) to a liquid-condensed (LC)phase. As is well known, the LC state is more ordered than the LE state due to (i) closermolecular packing (resulting from the increased conformational order of hydrocarbonchains), and (ii) the smaller tilt angle of molecules in the surface layer [40]. The mostcondensed DPPC monolayer is characterized by a surface potential change equal to 509 mV,which is in agreement with previous studies (527 mV [23], 551 mV [24] and 544 mV [41]).Further elongation of acyl chains to 18 (DSPC) and 20 (DAPC) carbons influence theelectrical properties of the formed monolayers. The critical area becomes shifted to smallervalues: 96.2 and 82.6 Å2/molecule for DSPC and DAPC, respectively. This suggests thatphosphatidylcholines with longer hydrocarbon chains form more tightly packed and morecondensed films compared to the DPPC monolayer. The curve for DSPC is characterizedby one inflection appearing at ca. 77 Å2/molecule and 466 mV, which suggests changesin molecular orientation in the monolayer (understood as a change in molecular anglein respect to the surface) [42]. On the other hand, the ∆V–A isotherm for DAPC showsa gradual rise without noticeable slope changes until the film collapse. The maximumsurface potential values are equal to 684 mV and 614 mV for DSPC and DAPC, respectively.The DOPC molecule possesses one double bond in each of the octadecyl chains and canbe compared to DSPC, which has hydrophobic chains of the same length, but both aresaturated. As can be noticed, the ∆V–A curves of both phospholipids are characterizedby the same shape (with one inflection). However, some differences should also be noted.Firstly, the critical area for DOPC is approximately 66 Å2/molecule larger as comparedto DSPC. This suggests lower packing of the DOPC film, which is also confirmed by thevalues of the compressibility moduli. Secondly, the maximum value of the surface potential∆Vmax is equal to 358 mV. Since the surface potential is proportional to the component ofthe electrostatic field vertical to the surface, it can be concluded that DOPC acyl chainsin the monolayer are more disordered in comparison to DSPC. The molecular basis ofthis issue is due to the presence of double bonds in the cis configuration in DOPC. Theconfiguration of unsaturated bonds affects the conformation of entire hydrocarbon chains,causing disorders (gauche defects, etc.). In contrast, the DSPC hydrocarbon backbone existsmainly in an all-trans zig-zag conformation. To sum up, the participation of hydrocarbonchains in the surface potential change of phosphatidylcholines is mainly steric, related topacking density and order, which is in agreement with previous work [43].
42
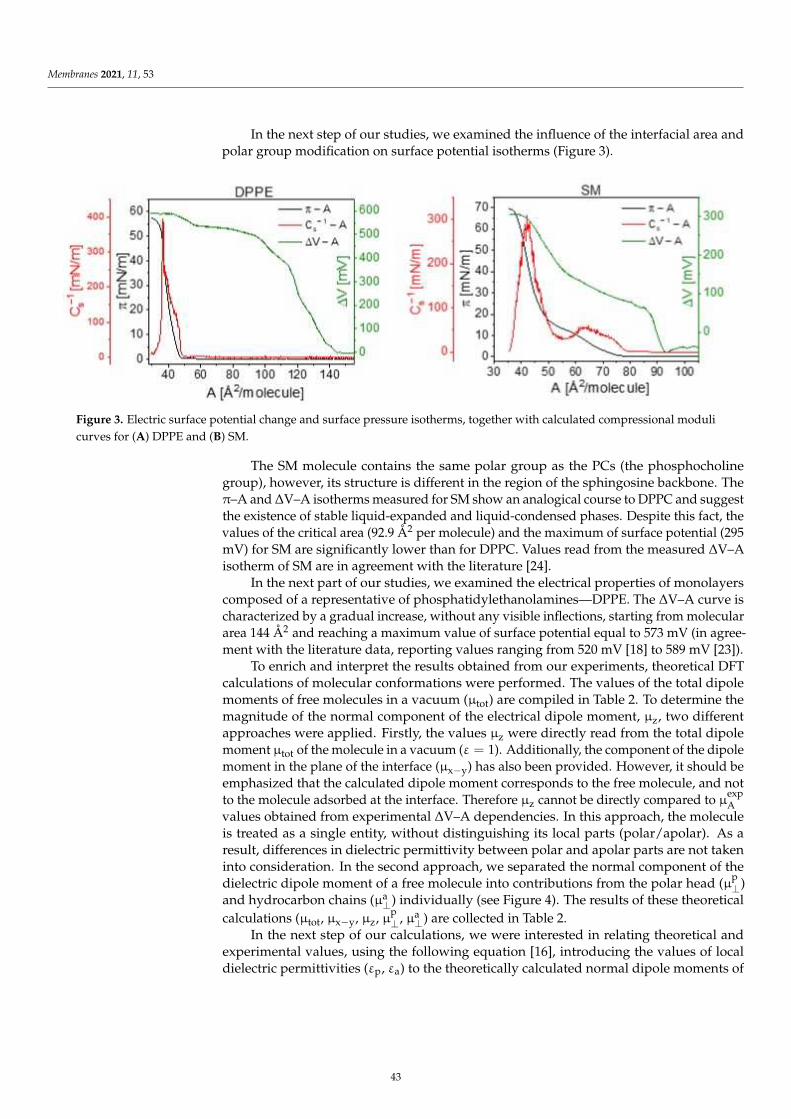
Membranes 2021, 11, 53
In the next step of our studies, we examined the influence of the interfacial area andpolar group modification on surface potential isotherms (Figure 3).
ΔV–AΔV
π–A ΔV–AΔV–A ΔV–A
μ
Figure 3. Electric surface potential change and surface pressure isotherms, together with calculated compressional modulicurves for (A) DPPE and (B) SM.
The SM molecule contains the same polar group as the PCs (the phosphocholinegroup), however, its structure is different in the region of the sphingosine backbone. Theπ–A and ∆V–A isotherms measured for SM show an analogical course to DPPC and suggestthe existence of stable liquid-expanded and liquid-condensed phases. Despite this fact, thevalues of the critical area (92.9 Å2 per molecule) and the maximum of surface potential (295mV) for SM are significantly lower than for DPPC. Values read from the measured ∆V–Aisotherm of SM are in agreement with the literature [24].
In the next part of our studies, we examined the electrical properties of monolayerscomposed of a representative of phosphatidylethanolamines—DPPE. The ∆V–A curve ischaracterized by a gradual increase, without any visible inflections, starting from moleculararea 144 Å2 and reaching a maximum value of surface potential equal to 573 mV (in agree-ment with the literature data, reporting values ranging from 520 mV [18] to 589 mV [23]).
To enrich and interpret the results obtained from our experiments, theoretical DFTcalculations of molecular conformations were performed. The values of the total dipolemoments of free molecules in a vacuum (µtot) are compiled in Table 2. To determine themagnitude of the normal component of the electrical dipole moment, µz, two differentapproaches were applied. Firstly, the values µz were directly read from the total dipolemoment µtot of the molecule in a vacuum (ε = 1). Additionally, the component of the dipolemoment in the plane of the interface (µx−y) has also been provided. However, it should beemphasized that the calculated dipole moment corresponds to the free molecule, and notto the molecule adsorbed at the interface. Therefore µz cannot be directly compared to µexp
Avalues obtained from experimental ∆V–A dependencies. In this approach, the moleculeis treated as a single entity, without distinguishing its local parts (polar/apolar). As aresult, differences in dielectric permittivity between polar and apolar parts are not takeninto consideration. In the second approach, we separated the normal component of thedielectric dipole moment of a free molecule into contributions from the polar head (µp
⊥)and hydrocarbon chains (µa
⊥) individually (see Figure 4). The results of these theoreticalcalculations (µtot, µx−y, µz, µp
⊥, µa⊥) are collected in Table 2.
In the next step of our calculations, we were interested in relating theoretical andexperimental values, using the following equation [16], introducing the values of localdielectric permittivities (εp, εa) to the theoretically calculated normal dipole moments of
43
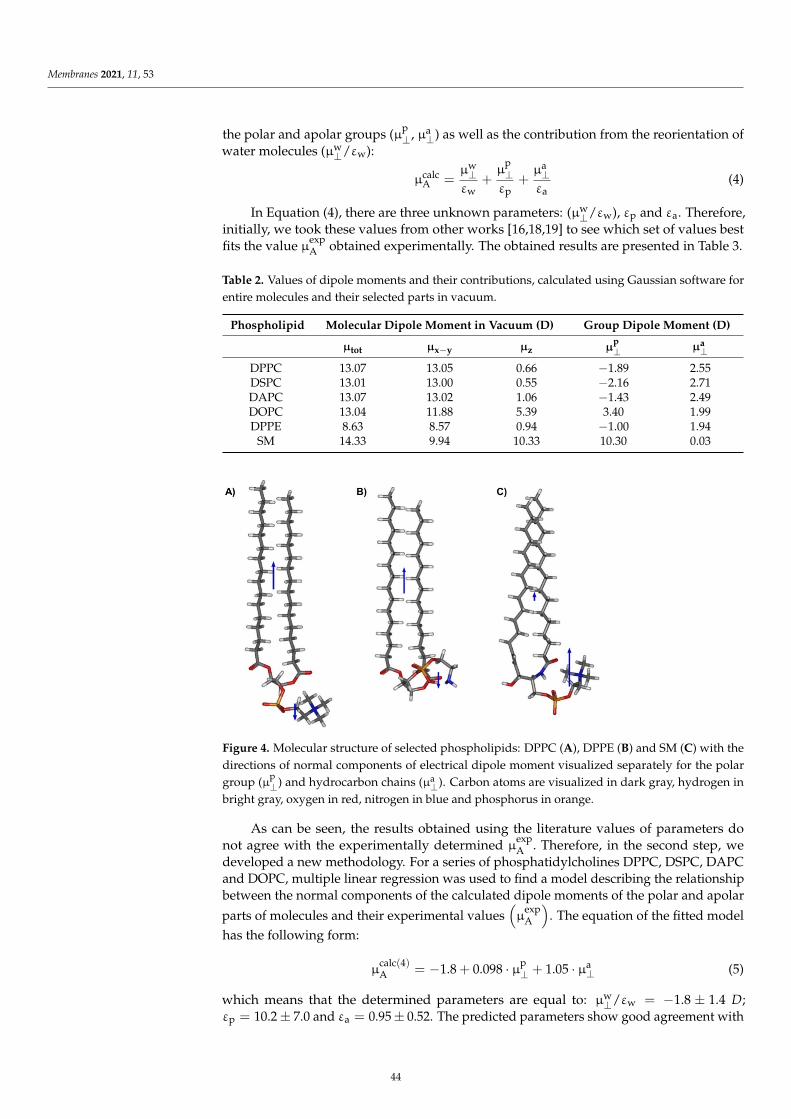
Membranes 2021, 11, 53
the polar and apolar groups (µp⊥, µa
⊥) as well as the contribution from the reorientation ofwater molecules (µw
⊥/εw):
µcalcA =
µw⊥εw
+µ
p⊥εp
+µa⊥εa
(4)
In Equation (4), there are three unknown parameters: (µw⊥/εw), εp and εa. Therefore,
initially, we took these values from other works [16,18,19] to see which set of values bestfits the value µexp
A obtained experimentally. The obtained results are presented in Table 3.
Table 2. Values of dipole moments and their contributions, calculated using Gaussian software forentire molecules and their selected parts in vacuum.
Phospholipid Molecular Dipole Moment in Vacuum (D) Group Dipole Moment (D)
µtot µx−y µz µp⊥ µa
⊥DPPC 13.07 13.05 0.66 −1.89 2.55DSPC 13.01 13.00 0.55 −2.16 2.71DAPC 13.07 13.02 1.06 −1.43 2.49DOPC 13.04 11.88 5.39 3.40 1.99DPPE 8.63 8.57 0.94 −1.00 1.94
SM 14.33 9.94 10.33 10.30 0.03−
μ με εμ μμ /ε μ = με + με + με μ /ε ε εμ
μ /ε ε ε−
−
( ) ( ) ( ) ( )
−
Figure 4. Molecular structure of selected phospholipids: DPPC (A), DPPE (B) and SM (C) with thedirections of normal components of electrical dipole moment visualized separately for the polargroup (µp
⊥) and hydrocarbon chains (µa⊥). Carbon atoms are visualized in dark gray, hydrogen in
bright gray, oxygen in red, nitrogen in blue and phosphorus in orange.
As can be seen, the results obtained using the literature values of parameters donot agree with the experimentally determined µexp
A . Therefore, in the second step, wedeveloped a new methodology. For a series of phosphatidylcholines DPPC, DSPC, DAPCand DOPC, multiple linear regression was used to find a model describing the relationshipbetween the normal components of the calculated dipole moments of the polar and apolarparts of molecules and their experimental values
(
µexpA
)
. The equation of the fitted modelhas the following form:
µcalc(4)A = −1.8 + 0.098 · µp
⊥ + 1.05 · µa⊥ (5)
which means that the determined parameters are equal to: µw⊥/εw = −1.8 ± 1.4 D;
εp = 10.2 ± 7.0 and εa = 0.95± 0.52. The predicted parameters show good agreement with
44
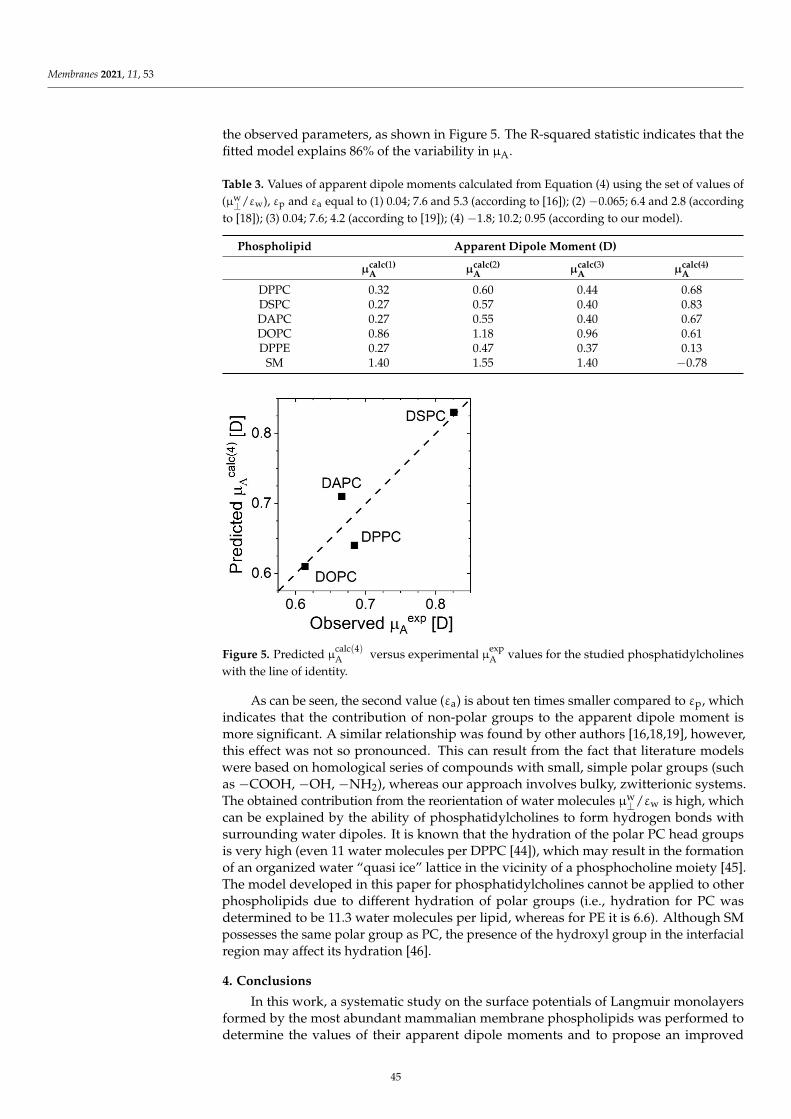
Membranes 2021, 11, 53
the observed parameters, as shown in Figure 5. The R-squared statistic indicates that thefitted model explains 86% of the variability in µA.
Table 3. Values of apparent dipole moments calculated from Equation (4) using the set of values of(µw
⊥/εw), εp and εa equal to (1) 0.04; 7.6 and 5.3 (according to [16]); (2) −0.065; 6.4 and 2.8 (accordingto [18]); (3) 0.04; 7.6; 4.2 (according to [19]); (4) −1.8; 10.2; 0.95 (according to our model).
Phospholipid Apparent Dipole Moment (D)
µcalc(1)A µcalc(2)
A µcalc(3)A µcalc(4)
A
DPPC 0.32 0.60 0.44 0.68DSPC 0.27 0.57 0.40 0.83DAPC 0.27 0.55 0.40 0.67DOPC 0.86 1.18 0.96 0.61DPPE 0.27 0.47 0.37 0.13
SM 1.40 1.55 1.40 −0.78
μ .(μ )
μ ( ) = −1.8 + 0.098 ⋅ μ + 1.05 ⋅ μ/ = −1.8 ± 1.4 =10.2 ± 7.0 = 0.95 ± 0.52
μ ( ) με ε
− − − μ /ε
Figure 5. Predicted µcalc(4)A versus experimental µexp
A values for the studied phosphatidylcholineswith the line of identity.
As can be seen, the second value (εa) is about ten times smaller compared to εp, whichindicates that the contribution of non-polar groups to the apparent dipole moment ismore significant. A similar relationship was found by other authors [16,18,19], however,this effect was not so pronounced. This can result from the fact that literature modelswere based on homological series of compounds with small, simple polar groups (suchas −COOH, −OH, −NH2), whereas our approach involves bulky, zwitterionic systems.The obtained contribution from the reorientation of water molecules µw
⊥/εw is high, whichcan be explained by the ability of phosphatidylcholines to form hydrogen bonds withsurrounding water dipoles. It is known that the hydration of the polar PC head groupsis very high (even 11 water molecules per DPPC [44]), which may result in the formationof an organized water “quasi ice” lattice in the vicinity of a phosphocholine moiety [45].The model developed in this paper for phosphatidylcholines cannot be applied to otherphospholipids due to different hydration of polar groups (i.e., hydration for PC wasdetermined to be 11.3 water molecules per lipid, whereas for PE it is 6.6). Although SMpossesses the same polar group as PC, the presence of the hydroxyl group in the interfacialregion may affect its hydration [46].
4. Conclusions
In this work, a systematic study on the surface potentials of Langmuir monolayersformed by the most abundant mammalian membrane phospholipids was performed todetermine the values of their apparent dipole moments and to propose an improved
45
Membranes 2021, 11, 53
protocol for estimating individual contributions to a three-layer capacitor model. Ourmethodology correlates the results from DFT molecular modeling with experimentallydetermined values using multiple linear regression. It can be applied to the study ofother phosphatidylcholine derivatives (with similar hydration) with different hydrocarbonchain lengths and saturations. To be able to determine the parameters (µw
⊥/εw), εp andεa for other kinds of phospholipids, a similar approach should be carried out for theirhomologous series.
Author Contributions: Conceptualization P.D.-L. and J.K.; investigation, A.C.-B. and J.K.; datacuration and visualization, J.K., A.C.-B. and A.W.; manuscript writing P.D.-L., A.C.-B. and A.W. Allauthors have read and agreed to the published version of the manuscript.
Funding: This research received no external funding.
Institutional Review Board Statement: Not applicable.
Informed Consent Statement: Not applicable.
Acknowledgments: This research was supported in part by PL–Grid Infrastructure.
Conflicts of Interest: The authors declare no conflict of interest regarding the publication of this article.
References1. Barnes, G.; Gentle, I. Interfacial Science: An Introduction, 2nd ed.; Oxford University Press: Oxford, UK, 2011; ISBN 9780199571185.2. Daear, W.; Mahadeo, M.; Prenner, E.J. Applications of Brewster angle microscopy from biological materials to biological systems.
Biochim. Biophys. Acta Biomembr. 2017, 1859, 1749–1766. [CrossRef] [PubMed]3. Stottrup, B.L.; Nguyen, A.H.; Tüzel, E. Taking another look with fluorescence microscopy: Image processing techniques in
Langmuir monolayers for the twenty-first century. Biochim. Biophys. Acta Biomembr. 2010, 1798, 1289–1300. [CrossRef] [PubMed]4. Nobre, T.M.; Pavinatto, F.J.; Caseli, L.; Barros-Timmons, A.; Dynarowicz-Łatka, P.; Oliveira, O.N. Interactions of bioactive
molecules & nanomaterials with Langmuir monolayers as cell membrane models. Thin Solid Films 2015, 593, 158–188.5. Jaroque, G.N.; Sartorelli, P.; Caseli, L. The effect of the monocyclic monoterpene tertiary alcohol γ-terpineol on biointerfaces
containing cholesterol. Chem. Phys. Lipids 2020, 230, 104915. [CrossRef]6. Ceridório, L.F.; Caseli, L.; Oliveira, O.N. Chondroitin sulfate interacts mainly with headgroups in phospholipid monolayers.
Colloids Surf. B. Biointerfaces 2016, 141, 595–601. [CrossRef]7. Nakahara, H.; Hagimori, M.; Mukai, T.; Shibata, O. Monolayers of a tetrazine-containing gemini amphiphile: Interplays with
biomembrane lipids. Colloids Surf. B. Biointerfaces 2018, 164, 1–10. [CrossRef]8. Nakahara, H.; Hagimori, M.; Mukai, T.; Shibata, O. Interactions of a Tetrazine Derivative with Biomembrane Constituents: A
Langmuir Monolayer Study. Langmuir 2016, 32, 6591–6599. [CrossRef]9. Dynarowicz, P. Recent developments in the modeling of the monolayers structure at the water/air interface. Adv. Colloid Interface
Sci. 1993, 45, 215–241. [CrossRef]10. Oliveira, O.N.; Bonardi, C. The Surface Potential of Langmuir Monolayers Revisited. Langmuir 1997, 13, 5920–5924. [CrossRef]11. Adam, N.K.; Danielli, J.F.; Harding J., B. The structure of surface films XXI—Surface potentials of dibasic esters, alcohols,
aldoximes, and ketones. Proc. Math. Phys. Eng. Sci. 1934, 147, 491–499.12. Schuhmann, D. Electrical properties of adsorbed or spread films: The effective value of permittivities in the Helmholtz equation
(plane distribution of point dipoles). J. Colloid Interface Sci. 1990, 134, 152–160. [CrossRef]13. Broniatowski, M.; Macho, I.S.; Miñones, J.; Dynarowicz-Łatka, P. Langmuir monolayers characteristic of (Perfluorodecyl)-alkanes.
J. Phys. Chem. B. 2004, 108, 13403–13411. [CrossRef]14. Shibata, O.; Krafft, M.P. Mixed Langmuir monolayers made from single-chain perfluoroalkylated amphiphiles. Langmuir 2000, 16,
10281–10286. [CrossRef]15. Oliveira, O.N.; Taylor, D.M.; Morgan, H. Modelling the surface potential-area dependence of a stearic acid monolayer. Thin Solid
Films 1992, 210–211, 76–78. [CrossRef]16. Demchak, R.J.; Fort, T. Surface dipole moments of close-packed un-ionized monolayers at the air-water interface. J. Colloid
Interface Sci. 1974, 46, 191–202. [CrossRef]17. Dynarowicz, P.; Paluch, M. Electrical properties of some adsorbed films at the water-air interface. J. Colloid Interface Sci. 1985, 107,
75–80. [CrossRef]18. Oliveira, O.N.; Taylor, D.M.; Lewis, T.J.; Salvagno, S.; Stirling, C.J.M. Estimation of group dipole moments from surface potential
measurements on Langmuir monolayers. J. Chem. Soc. Faraday Trans. 1 Phys. Chem. Condens. Phases 1989, 85, 1009–1018.[CrossRef]
19. Petrov, J.G.; Polymeropoulos, E.E.; Möhwald, H. Three-capacitor model for surface potential of insoluble monolayers. J. Phys.
Chem. 1996, 100, 9860–9869. [CrossRef]
46
Membranes 2021, 11, 53
20. Mozaffary, H. On the sign and origin of the surface potential of phospholipid monolayers. Chem. Phys. Lipids 1991, 59, 39–47.[CrossRef]
21. Beitinger, H.; Vogel, V.; Möbius, D.; Rahmann, H. Surface potentials and electric dipole moments of ganglioside and phospholipidmonolayers: Contribution of the polar headgroup at the water/lipid interface. Biochim. Biophys. Acta Biomembr. 1989, 984, 293–300.[CrossRef]
22. Smaby, J.M.; Brockman, H.L. Surface dipole moments of lipids at the argon-water interface. Similarities among glycerol-ester-based lipids. Biophys. J. 1990, 58, 195–204. [CrossRef]
23. Nakahara, H.; Nakamura, S.; Nakamura, K.; Inagaki, M.; Aso, M.; Higuchi, R.; Shibata, O. Cerebroside Langmuir monolayersoriginated from the echinoderms: I. Binary systems of cerebrosides and phospholipids. Colloids Surf. B. Biointerfaces 2005, 42,157–174. [CrossRef] [PubMed]
24. Sakamoto, S.; Nakahara, H.; Shibata, O. Miscibility behavior of sphingomyelin with phytosterol derivatives by a Langmuirmonolayer approach. J. Oleo Sci. 2013, 62, 809–824. [CrossRef] [PubMed]
25. Frisch, M.J.; Trucks, G.W.; Schlegel, H.B.; Scuseria, G.E.; Robb, M.A.; Cheeseman, J.R.; Scalmani, G.; Barone, V.; Petersson, G.A.;Nakatsuji, H.; et al. Gaussian 16, Revision B.01; Gaussian Inc.: Wallingford, CT, USA, 2016.
26. Becke, A.D. Density-functional thermochemistry. III. The role of exact exchange. J. Chem. Phys. 1993, 98, 5648–5652. [CrossRef]27. Lee, C.; Yang, W.; Parr, R.G. Development of the Colle-Salvetti correlation-energy formula into a functional of the electron density.
Phys. Rev. B. 1988, 37, 785–789. [CrossRef]28. Vosko, S.H.; Wilk, L.; Nusair, M. Accurate spin-dependent electron liquid correlation energies for local spin density calculations:
A critical analysis. Can. J. Phys. 1980, 58, 1200–1211. [CrossRef]29. Stephens, P.J.; Devlin, F.J.; Chabalowski, C.F.; Frisch, M.J. Ab Initio Calculation of Vibrational Absorption and Circular Dichroism
Spectra Using Density Functional Force Fields. J. Phys. Chem. 1994, 98, 11623–11627. [CrossRef]30. McLean, A.D.; Chandler, G.S. Contracted Gaussian basis sets for molecular calculations. I. Second row atoms, Z = 11–18. J. Chem.
Phys. 1980, 72, 5639–5648. [CrossRef]31. Krishnan, R.; Binkley, J.S.; Seeger, R.; Pople, J.A. Self-consistent molecular orbital methods. XX. A basis set for correlated wave
functions. J. Chem. Phys. 1980, 72, 650–654. [CrossRef]32. Grimme, S.; Antony, J.; Ehrlich, S.; Krieg, H. A consistent and accurate ab initio parametrization of density functional dispersion
correction (DFT-D) for the 94 elements H-Pu. J. Chem. Phys. 2010, 132, 154104. [CrossRef]33. Stefaniu, C.; Brezesinski, G.; Möhwald, H. Polymer-capped magnetite nanoparticles change the 2D structure of DPPC model
membranes. Soft Matter 2012, 8, 7952–7959. [CrossRef]34. Kilic, S.; Bolukcu, E.S. Phase behavior of DSPC/PEG40St mixtures at higher emulsifier contents. Colloids Surf. B. Biointerfaces
2018, 171, 368–376. [CrossRef]35. Borden, M.A.; Pu, G.; Runner, G.J.; Longo, M.L. Surface phase behavior and microstructure of lipid/PEG-emulsifier monolayer-
coated microbubbles. Colloids Surf. B Biointerfaces 2004, 35, 209–223. [CrossRef] [PubMed]36. Raju, R.; Torrent-Burgués, J.; Bryant, G. Interactions of cryoprotective agents with phospholipid membranes—A Langmuir
monolayer study. Chem. Phys. Lipids 2020, 231, 104949. [CrossRef] [PubMed]37. Korchowiec, B.; Paluch, M.; Corvis, Y.; Rogalska, E. A Langmuir film approach to elucidating interactions in lipid membranes:
1,2-dipalmitoyl-sn-glycero-3-phosphoethanolamine/cholesterol/metal cation systems. Chem. Phys. Lipids 2006, 144, 127–136.[CrossRef] [PubMed]
38. Wnetrzak, A.; Makyła-Juzak, K.; Filiczkowska, A.; Kulig, W.; Dynarowicz-Latka, P. Oxysterols Versus Cholesterol in ModelNeuronal Membrane. I. The Case of 7-Ketocholesterol. The Langmuir Monolayer Study. J. Membr. Biol. 2017, 250, 553–564.[CrossRef] [PubMed]
39. Davies, J.T.; Rideal, E.K. Interfacial phenomena; Academic Press: Cambridge, MA, USA, 1963; ISBN 9780123956095.40. Gragson, D.E.; Beaman, D.; Porter, R. Using compression isotherms of phospholipid monolayers to explore critical phenomena. A
biophysical chemistry experiment. J. Chem. Educ. 2008, 85, 272–275. [CrossRef]41. Taylor, D.M.; De Oliveira, O.N.; Morgan, H. Models for interpreting surface potential measurements and their application to
phospholipid monolayers. J. Colloid Interface Sci. 1990, 139, 508–518. [CrossRef]42. Sanchez, J.; Badia, A. Spatial variation in the molecular tilt orientational order within the solid domains of phase-separated,
mixed dialkylphosphatidylcholine monolayers. Chem. Phys. Lipids 2008, 152, 24–37. [CrossRef]43. Peterson, U.; Mannock, D.A.; Lewis, R.N.A.H.; Pohl, P.; McElhaney, R.N.; Pohl, E.E. Origin of membrane dipole potential:
Contribution of the phospholipid fatty acid chains. Chem. Phys. Lipids 2002, 117, 19–27. [CrossRef]44. Pasenkiewicz-Gierula, M.; Baczynski, K.; Markiewicz, M.; Murzyn, K. Computer modelling studies of the bilayer/water interface.
Biochim. Biophys. Acta Biomembr. 2016, 1858, 2305–2321. [CrossRef] [PubMed]45. Disalvo, E.A.; Lairion, F.; Martini, F.; Almaleck, H.; Diaz, S.; Gordillo, G. Water in biological membranes at interfaces: Does it play
a functional role? An. des la Asoc. Quim. Argentina 2004, 92, 1–22.46. Kodama, M.; Abe, M.; Kawasaki, Y.; Hayashi, K.; Ohira, S.; Nozaki, H.; Katagiri, C.; Inoue, K.; Takahashi, H. Estimation of
interlamellar water molecules in sphingomyelin bilayer systems studied by DSC and X-ray diffraction. Thermochim. Acta 2004,416, 105–111.
47

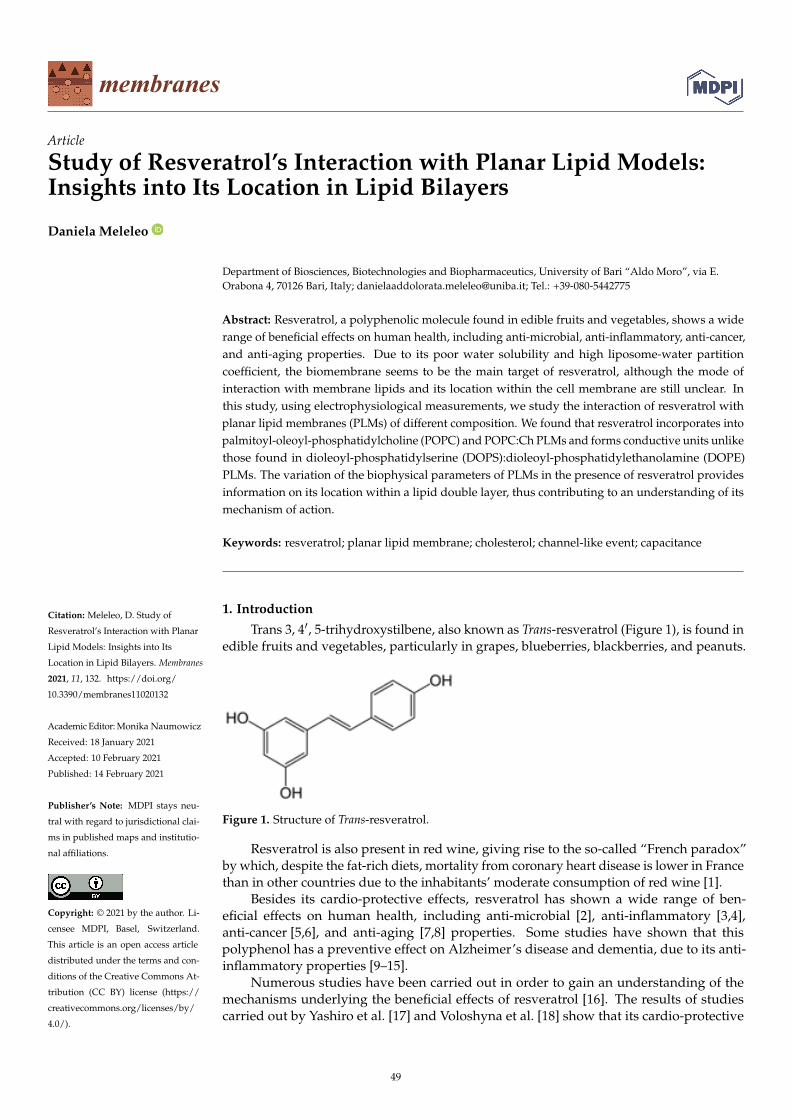
membranes
Article
Study of Resveratrol’s Interaction with Planar Lipid Models:Insights into Its Location in Lipid Bilayers
Daniela Meleleo
Citation: Meleleo, D. Study of
Resveratrol’s Interaction with Planar
Lipid Models: Insights into Its
Location in Lipid Bilayers. Membranes
2021, 11, 132. https://doi.org/
10.3390/membranes11020132
Academic Editor: Monika Naumowicz
Received: 18 January 2021
Accepted: 10 February 2021
Published: 14 February 2021
Publisher’s Note: MDPI stays neu-
tral with regard to jurisdictional clai-
ms in published maps and institutio-
nal affiliations.
Copyright: © 2021 by the author. Li-
censee MDPI, Basel, Switzerland.
This article is an open access article
distributed under the terms and con-
ditions of the Creative Commons At-
tribution (CC BY) license (https://
creativecommons.org/licenses/by/
4.0/).
Department of Biosciences, Biotechnologies and Biopharmaceutics, University of Bari “Aldo Moro”, via E.Orabona 4, 70126 Bari, Italy; [email protected]; Tel.: +39-080-5442775
Abstract: Resveratrol, a polyphenolic molecule found in edible fruits and vegetables, shows a widerange of beneficial effects on human health, including anti-microbial, anti-inflammatory, anti-cancer,and anti-aging properties. Due to its poor water solubility and high liposome-water partitioncoefficient, the biomembrane seems to be the main target of resveratrol, although the mode ofinteraction with membrane lipids and its location within the cell membrane are still unclear. Inthis study, using electrophysiological measurements, we study the interaction of resveratrol withplanar lipid membranes (PLMs) of different composition. We found that resveratrol incorporates intopalmitoyl-oleoyl-phosphatidylcholine (POPC) and POPC:Ch PLMs and forms conductive units unlikethose found in dioleoyl-phosphatidylserine (DOPS):dioleoyl-phosphatidylethanolamine (DOPE)PLMs. The variation of the biophysical parameters of PLMs in the presence of resveratrol providesinformation on its location within a lipid double layer, thus contributing to an understanding of itsmechanism of action.
Keywords: resveratrol; planar lipid membrane; cholesterol; channel-like event; capacitance
1. Introduction
Trans 3, 4′, 5-trihydroxystilbene, also known as Trans-resveratrol (Figure 1), is found inedible fruits and vegetables, particularly in grapes, blueberries, blackberries, and peanuts.
′
Figure 1. Structure of Trans-resveratrol.
Resveratrol is also present in red wine, giving rise to the so-called “French paradox”by which, despite the fat-rich diets, mortality from coronary heart disease is lower in Francethan in other countries due to the inhabitants’ moderate consumption of red wine [1].
Besides its cardio-protective effects, resveratrol has shown a wide range of ben-eficial effects on human health, including anti-microbial [2], anti-inflammatory [3,4],anti-cancer [5,6], and anti-aging [7,8] properties. Some studies have shown that thispolyphenol has a preventive effect on Alzheimer’s disease and dementia, due to its anti-inflammatory properties [9–15].
Numerous studies have been carried out in order to gain an understanding of themechanisms underlying the beneficial effects of resveratrol [16]. The results of studiescarried out by Yashiro et al. [17] and Voloshyna et al. [18] show that its cardio-protective
49
Membranes 2021, 11, 132
effect may be due to resveratrol’s capacity to act as a modulator of lipoprotein metabolism.Indeed, resveratrol inhibits the oxidation of low-density lipoproteins and platelet aggre-gation, while increasing high-density lipoproteins [19]. It is known to be a scavenger offree radicals [20]. Several studies have shown that, when phospholipase A2 promotes therelease of cytokines and NADPH oxidases that cause cell inflammation, resveratrol hasproven to act as a good cell protective agent [21–24].
Although resveratrol’s beneficial effects on human health have been accepted, itsmolecular mechanism remains unclear. The biomembrane seems to be the main targetof resveratrol, although its mode of interaction with membrane lipids and its locationwithin the cell membrane are subject to debate. Resveratrol’s affinity for the lipid matrix isindicated by its poor water solubility (0.03 g/mL) and high partition coefficient (3.07 and3.11 in 1,2-dipalmitoyl-sn-glycero-3-phosphocholine (DPPC) and 1,2-distearoyl-sn-glycero-3-phosphocholine (DSPC) liposomal membranes, respectively) [25].
Numerous studies have examined the interaction and location of resveratrol withinthe membrane utilizing different techniques and lipid models given that the cell membraneis a complex system. The results of these studies are not unique. Indeed, it has beeneither concluded that resveratrol is located in the hydrophilic headgroup region or, on thecontrary, in the hydrophobic core.
The results of a study carried out by de Ghellinck and colleagues indicate that resver-atrol accumulates between the lipid headgroups, causing conformational changes in thetilt angle of the lipid headgroups to a more upright orientation [26]. Incorporation andlocation of resveratrol in the hydrophilic headgroup region seem to depend on the lipidcomposition of the membrane model. The study carried out by Han and colleagues showsthat, in 1,2-dioleoyl-sn-glycero-3-phosphatidylcholine (DOPC) liposomes, resveratrol couldpenetrate into the lipid membrane, locating mostly in the headgroup region rather thanin the deeper region of the lipid double layer. In DOPC/sphingomyelin/cholesterol orsphingomyelin/cholesterol liposomes, resveratrol associates with the liposome surfacewithout penetrating into the headgroup region. This different behavior shown by resvera-trol may be due to a different packing of the lipid acyl carbon chains. In DOPC liposomes,the acyl carbon chains are less packed than in liposomes containing sphingomyelin andcholesterol [27]. Similar results have also been obtained by Cardia and colleagues, whostudied the interaction of resveratrol with soybean phosphatidylcholine (P90G) liposomesby 1H NMR spectroscopy. Resveratrol is located in the region of the phosphocholineheadgroup. Quantitative data on the incorporation of resveratrol at both the liposomepreparation stage and by preformed liposomes suggest that the amount of resveratrolincorporated into P90G liposomes was about 20 mM, which corresponds to a 150-foldincrease with respect to the solubility of resveratrol in water. These experimental data showthat resveratrol diffuses through lipid bilayers [28]. Using liposomes made from saturatedphosphatidylcholine (DPPC) and cholesterol (CHOL) or positively charged derivates ofcholesterol (DC-CHOL), Bonechi et al. found that resveratrol associates with the surface ofliposome containing CHOL, as found by Han et al. [27], while the polyphenolic compoundinserts more deeply into cationic liposomes [29].
On the other hand, some authors state that resveratrol is located in the hydrophobiccore. The results of a study carried out by Balanc and colleagues indicate that resveratrol isincorporated in the inner part of the liposome membrane [30]. In agreement with the resultsobtained by Balanc are those presented by Fabris and colleagues who, using phosphatidyl-choline liposomes of various chain lengths, show that the hydroxyl groups of resveratrolare located in the lipid region of the bilayers close to the double bonds of polyunsaturatedfatty acids and that the longer the acyl chains, the more stable and less perturbable thebilayers [25]. Similar results have also been obtained by Brittes and colleagues [1]. In addi-tion, Neves and colleagues show that resveratrol induces phase separation and formationof liquid-ordered domains in liposomes made of egg L-α phosphatidylcholine, cholesteroland sphingomyelin. Besides, this polyphenol stabilizes the membrane bilayers of the
50
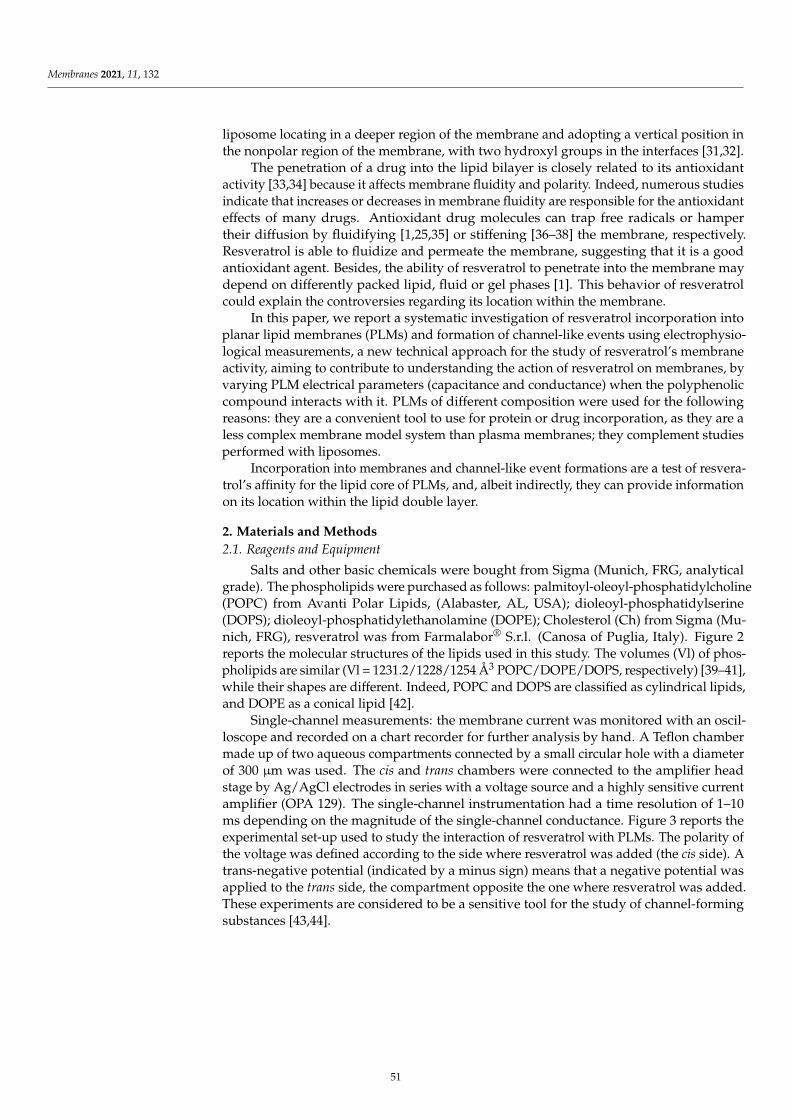
Membranes 2021, 11, 132
liposome locating in a deeper region of the membrane and adopting a vertical position inthe nonpolar region of the membrane, with two hydroxyl groups in the interfaces [31,32].
The penetration of a drug into the lipid bilayer is closely related to its antioxidantactivity [33,34] because it affects membrane fluidity and polarity. Indeed, numerous studiesindicate that increases or decreases in membrane fluidity are responsible for the antioxidanteffects of many drugs. Antioxidant drug molecules can trap free radicals or hampertheir diffusion by fluidifying [1,25,35] or stiffening [36–38] the membrane, respectively.Resveratrol is able to fluidize and permeate the membrane, suggesting that it is a goodantioxidant agent. Besides, the ability of resveratrol to penetrate into the membrane maydepend on differently packed lipid, fluid or gel phases [1]. This behavior of resveratrolcould explain the controversies regarding its location within the membrane.
In this paper, we report a systematic investigation of resveratrol incorporation intoplanar lipid membranes (PLMs) and formation of channel-like events using electrophysio-logical measurements, a new technical approach for the study of resveratrol’s membraneactivity, aiming to contribute to understanding the action of resveratrol on membranes, byvarying PLM electrical parameters (capacitance and conductance) when the polyphenoliccompound interacts with it. PLMs of different composition were used for the followingreasons: they are a convenient tool to use for protein or drug incorporation, as they are aless complex membrane model system than plasma membranes; they complement studiesperformed with liposomes.
Incorporation into membranes and channel-like event formations are a test of resvera-trol’s affinity for the lipid core of PLMs, and, albeit indirectly, they can provide informationon its location within the lipid double layer.
2. Materials and Methods2.1. Reagents and Equipment
Salts and other basic chemicals were bought from Sigma (Munich, FRG, analyticalgrade). The phospholipids were purchased as follows: palmitoyl-oleoyl-phosphatidylcholine(POPC) from Avanti Polar Lipids, (Alabaster, AL, USA); dioleoyl-phosphatidylserine(DOPS); dioleoyl-phosphatidylethanolamine (DOPE); Cholesterol (Ch) from Sigma (Mu-nich, FRG), resveratrol was from Farmalabor® S.r.l. (Canosa of Puglia, Italy). Figure 2reports the molecular structures of the lipids used in this study. The volumes (Vl) of phos-pholipids are similar (Vl = 1231.2/1228/1254 Å3 POPC/DOPE/DOPS, respectively) [39–41],while their shapes are different. Indeed, POPC and DOPS are classified as cylindrical lipids,and DOPE as a conical lipid [42].
Single-channel measurements: the membrane current was monitored with an oscil-loscope and recorded on a chart recorder for further analysis by hand. A Teflon chambermade up of two aqueous compartments connected by a small circular hole with a diameterof 300 µm was used. The cis and trans chambers were connected to the amplifier headstage by Ag/AgCl electrodes in series with a voltage source and a highly sensitive currentamplifier (OPA 129). The single-channel instrumentation had a time resolution of 1–10ms depending on the magnitude of the single-channel conductance. Figure 3 reports theexperimental set-up used to study the interaction of resveratrol with PLMs. The polarity ofthe voltage was defined according to the side where resveratrol was added (the cis side). Atrans-negative potential (indicated by a minus sign) means that a negative potential wasapplied to the trans side, the compartment opposite the one where resveratrol was added.These experiments are considered to be a sensitive tool for the study of channel-formingsubstances [43,44].
51
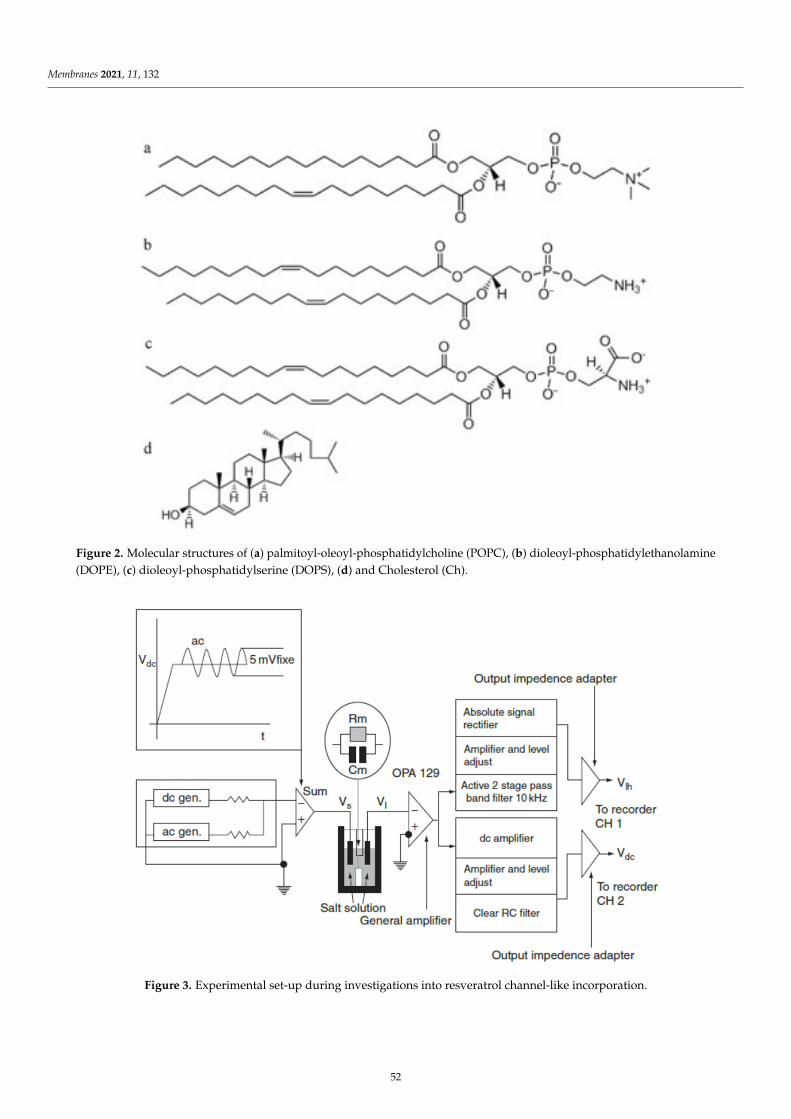
Membranes 2021, 11, 132
Figure 2. Molecular structures of (a) palmitoyl-oleoyl-phosphatidylcholine (POPC), (b) dioleoyl-phosphatidylethanolamine(DOPE), (c) dioleoyl-phosphatidylserine (DOPS), (d) and Cholesterol (Ch).
−
Figure 3. Experimental set-up during investigations into resveratrol channel-like incorporation.
52
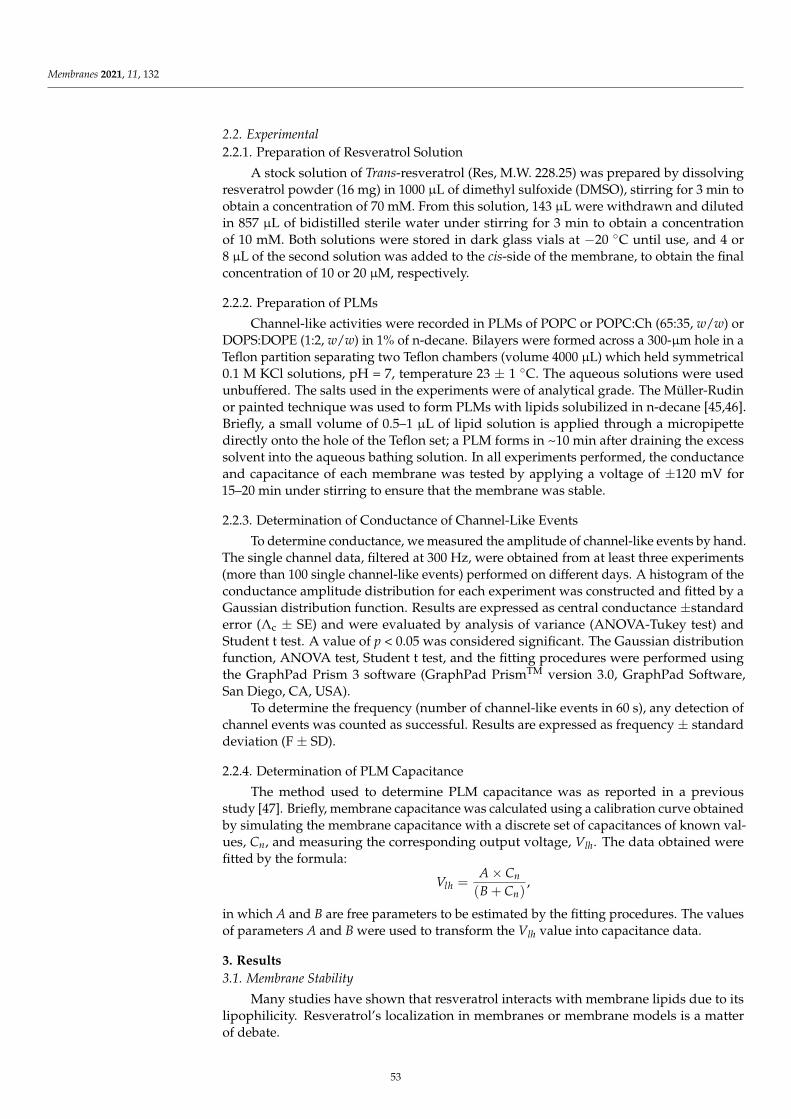
Membranes 2021, 11, 132
2.2. Experimental
2.2.1. Preparation of Resveratrol Solution
A stock solution of Trans-resveratrol (Res, M.W. 228.25) was prepared by dissolvingresveratrol powder (16 mg) in 1000 µL of dimethyl sulfoxide (DMSO), stirring for 3 min toobtain a concentration of 70 mM. From this solution, 143 µL were withdrawn and dilutedin 857 µL of bidistilled sterile water under stirring for 3 min to obtain a concentrationof 10 mM. Both solutions were stored in dark glass vials at −20 C until use, and 4 or8 µL of the second solution was added to the cis-side of the membrane, to obtain the finalconcentration of 10 or 20 µM, respectively.
2.2.2. Preparation of PLMs
Channel-like activities were recorded in PLMs of POPC or POPC:Ch (65:35, w/w) orDOPS:DOPE (1:2, w/w) in 1% of n-decane. Bilayers were formed across a 300-µm hole in aTeflon partition separating two Teflon chambers (volume 4000 µL) which held symmetrical0.1 M KCl solutions, pH = 7, temperature 23 ± 1 C. The aqueous solutions were usedunbuffered. The salts used in the experiments were of analytical grade. The Müller-Rudinor painted technique was used to form PLMs with lipids solubilized in n-decane [45,46].Briefly, a small volume of 0.5–1 µL of lipid solution is applied through a micropipettedirectly onto the hole of the Teflon set; a PLM forms in ~10 min after draining the excesssolvent into the aqueous bathing solution. In all experiments performed, the conductanceand capacitance of each membrane was tested by applying a voltage of ±120 mV for15–20 min under stirring to ensure that the membrane was stable.
2.2.3. Determination of Conductance of Channel-Like Events
To determine conductance, we measured the amplitude of channel-like events by hand.The single channel data, filtered at 300 Hz, were obtained from at least three experiments(more than 100 single channel-like events) performed on different days. A histogram of theconductance amplitude distribution for each experiment was constructed and fitted by aGaussian distribution function. Results are expressed as central conductance ±standarderror (Λc ± SE) and were evaluated by analysis of variance (ANOVA-Tukey test) andStudent t test. A value of p < 0.05 was considered significant. The Gaussian distributionfunction, ANOVA test, Student t test, and the fitting procedures were performed usingthe GraphPad Prism 3 software (GraphPad PrismTM version 3.0, GraphPad Software,San Diego, CA, USA).
To determine the frequency (number of channel-like events in 60 s), any detection ofchannel events was counted as successful. Results are expressed as frequency ± standarddeviation (F ± SD).
2.2.4. Determination of PLM Capacitance
The method used to determine PLM capacitance was as reported in a previousstudy [47]. Briefly, membrane capacitance was calculated using a calibration curve obtainedby simulating the membrane capacitance with a discrete set of capacitances of known val-ues, Cn, and measuring the corresponding output voltage, Vlh. The data obtained werefitted by the formula:
Vlh =A × Cn
(B + Cn),
in which A and B are free parameters to be estimated by the fitting procedures. The valuesof parameters A and B were used to transform the Vlh value into capacitance data.
3. Results3.1. Membrane Stability
Many studies have shown that resveratrol interacts with membrane lipids due to itslipophilicity. Resveratrol’s localization in membranes or membrane models is a matterof debate.
53
Membranes 2021, 11, 132
In this study, we used a classic electrophysiological method to investigate resvera-trol’s microscopic incorporation at concentrations of 10 and 20 µM, in PLMs of differentcomposition. Channel-like event formation indicates that molecules of a substance areincorporating into the membrane. PLMs of different composition were used to see whetherresveratrol is able to incorporate into PLMs and to form conductive units, and under whatexperimental conditions. With this aim, POPC was used as a zwitterionic membrane,POPC:Ch as a neutral mixed membrane and DOPS:DOPE as a mixed membrane withdiluted charges.
First of all, we tested PLM stability by applying a voltage of ±120 mV for 10–15 minunder stirring and by monitoring the constant values for PLM conductance and capacitance.Preliminarily, to exclude any non-specific and destabilizing effects of DMSO per se onthe PLMs used, we performed experiments by adding 4 or 8 µL of a H2O:DMSO (6:1)mixture to the medium, on the cis side of the membrane. In many different experimentsand independently of lipid composition, the PLMs were stable even when applying avoltage of ±100 mV for 12 h under stirring and monitoring the constant values for PLMconductance and capacitance.
3.2. Resveratrol Interaction with POPC PLMs
In many different experiments on POPC PLMs, the addition of 10 or 20 µM of resver-atrol to the cis side of the medium facing the membrane was performed at the appliedvoltage of 100 mV (addition voltage). After different lag times depending on the resveratrolconcentration, channel-like activity appears as non-random discrete events that fluctuatebetween conductive or non-conductive states compatible with channel-type openings andclosures with different conductance levels and frequencies. After the first channel-likeevent, alternating periods of channel-like activity can be observed, during which the num-ber of events can be rigorously analyzed, followed by quiescent periods and periods ofparoxystic channel-like activity that often lead to membrane destabilization until rup-ture. Figure 4 shows a typical example of channel-like event recordings with associatedhistograms of the conductance fluctuations.
In experiments at the 10 µM resveratrol concentration, channel-like activity appearsafter about 60 minutes’ lag time at an applied voltage of 100 mV. After the first channel-likeevent, the applied voltage can be lowered as far as 60 mV and channel amplitude can bemonitored. The channel-like activity was registered at applied voltages of ±60, ±80, ±100,and ±120 mV, each applied for 1 h, starting from 60 mV.
By doubling the resveratrol concentration to 20 µM, the lag time reduced to 20 min,after which channel-like activity appeared at an applied voltage of 100 mV, manifestingin a paroxystic manner. Paroxystic activity occurred even when the applied voltage waslowered to 80 mV; therefore, the applied voltage was lowered to 60 mV and channel-like activity appeared as discrete current fluctuations with different conductance levels.Channel-like activity was monitored at applied voltages of ±40 and ±60 mV, each appliedfor 1 h, starting from 60 mV.
Table 1 summarizes the central conductance values (Λc ± SE), obtained by fitting theexperimental data with a Gaussian function (Figure 4), and frequency values (F ± SD)at the two different concentrations of resveratrol. Interestingly, at the 10 µM resveratrolconcentration, the frequency values were higher at negative applied voltages than atpositive ones, indicating a higher turnover of channel-like events.
54
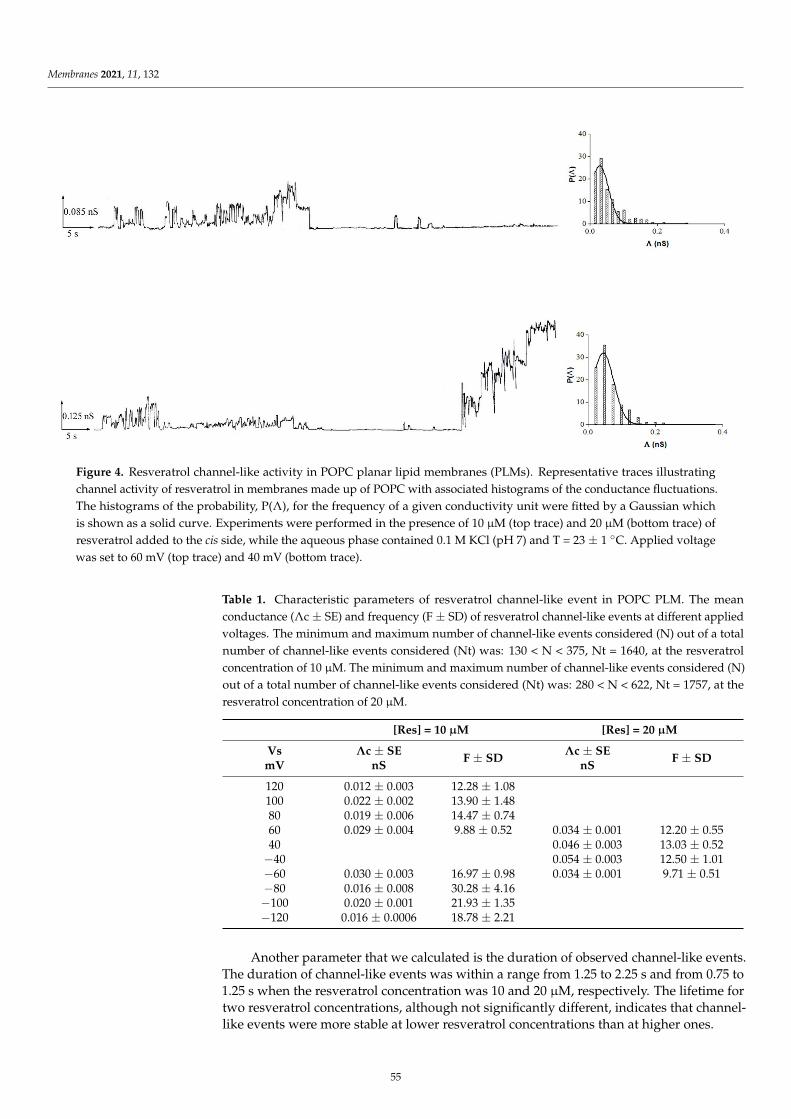
Membranes 2021, 11, 132
Λ
Figure 4. Resveratrol channel-like activity in POPC planar lipid membranes (PLMs). Representative traces illustratingchannel activity of resveratrol in membranes made up of POPC with associated histograms of the conductance fluctuations.The histograms of the probability, P(Λ), for the frequency of a given conductivity unit were fitted by a Gaussian whichis shown as a solid curve. Experiments were performed in the presence of 10 µM (top trace) and 20 µM (bottom trace) ofresveratrol added to the cis side, while the aqueous phase contained 0.1 M KCl (pH 7) and T = 23 ± 1 C. Applied voltagewas set to 60 mV (top trace) and 40 mV (bottom trace).
Table 1. Characteristic parameters of resveratrol channel-like event in POPC PLM. The meanconductance (Λc ± SE) and frequency (F ± SD) of resveratrol channel-like events at different appliedvoltages. The minimum and maximum number of channel-like events considered (N) out of a totalnumber of channel-like events considered (Nt) was: 130 < N < 375, Nt = 1640, at the resveratrolconcentration of 10 µM. The minimum and maximum number of channel-like events considered (N)out of a total number of channel-like events considered (Nt) was: 280 < N < 622, Nt = 1757, at theresveratrol concentration of 20 µM.
[Res] = 10 µM [Res] = 20 µM
VsmV
Λc ± SEnS
F ± SDΛc ± SE
nSF ± SD
120 0.012 ± 0.003 12.28 ± 1.08100 0.022 ± 0.002 13.90 ± 1.4880 0.019 ± 0.006 14.47 ± 0.7460 0.029 ± 0.004 9.88 ± 0.52 0.034 ± 0.001 12.20 ± 0.5540 0.046 ± 0.003 13.03 ± 0.52−40 0.054 ± 0.003 12.50 ± 1.01−60 0.030 ± 0.003 16.97 ± 0.98 0.034 ± 0.001 9.71 ± 0.51−80 0.016 ± 0.008 30.28 ± 4.16−100 0.020 ± 0.001 21.93 ± 1.35−120 0.016 ± 0.0006 18.78 ± 2.21
Another parameter that we calculated is the duration of observed channel-like events.The duration of channel-like events was within a range from 1.25 to 2.25 s and from 0.75 to1.25 s when the resveratrol concentration was 10 and 20 µM, respectively. The lifetime fortwo resveratrol concentrations, although not significantly different, indicates that channel-like events were more stable at lower resveratrol concentrations than at higher ones.
55
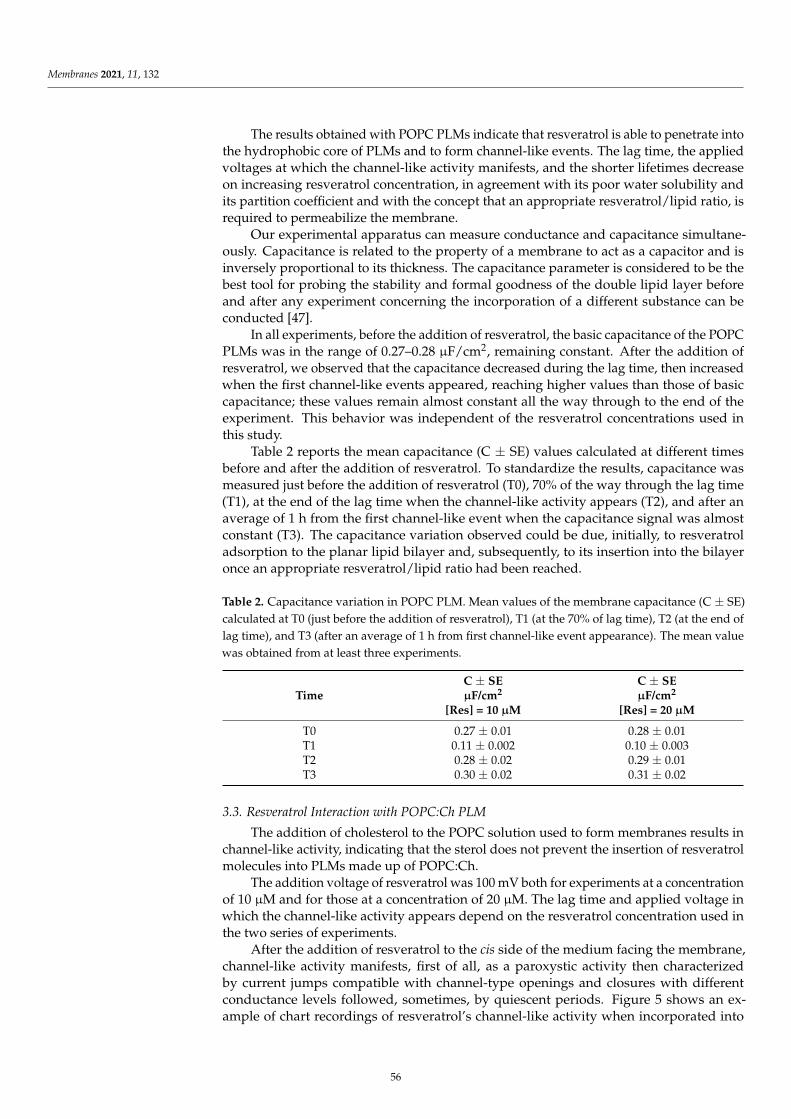
Membranes 2021, 11, 132
The results obtained with POPC PLMs indicate that resveratrol is able to penetrate intothe hydrophobic core of PLMs and to form channel-like events. The lag time, the appliedvoltages at which the channel-like activity manifests, and the shorter lifetimes decreaseon increasing resveratrol concentration, in agreement with its poor water solubility andits partition coefficient and with the concept that an appropriate resveratrol/lipid ratio, isrequired to permeabilize the membrane.
Our experimental apparatus can measure conductance and capacitance simultane-ously. Capacitance is related to the property of a membrane to act as a capacitor and isinversely proportional to its thickness. The capacitance parameter is considered to be thebest tool for probing the stability and formal goodness of the double lipid layer beforeand after any experiment concerning the incorporation of a different substance can beconducted [47].
In all experiments, before the addition of resveratrol, the basic capacitance of the POPCPLMs was in the range of 0.27–0.28 µF/cm2, remaining constant. After the addition ofresveratrol, we observed that the capacitance decreased during the lag time, then increasedwhen the first channel-like events appeared, reaching higher values than those of basiccapacitance; these values remain almost constant all the way through to the end of theexperiment. This behavior was independent of the resveratrol concentrations used inthis study.
Table 2 reports the mean capacitance (C ± SE) values calculated at different timesbefore and after the addition of resveratrol. To standardize the results, capacitance wasmeasured just before the addition of resveratrol (T0), 70% of the way through the lag time(T1), at the end of the lag time when the channel-like activity appears (T2), and after anaverage of 1 h from the first channel-like event when the capacitance signal was almostconstant (T3). The capacitance variation observed could be due, initially, to resveratroladsorption to the planar lipid bilayer and, subsequently, to its insertion into the bilayeronce an appropriate resveratrol/lipid ratio had been reached.
Table 2. Capacitance variation in POPC PLM. Mean values of the membrane capacitance (C ± SE)calculated at T0 (just before the addition of resveratrol), T1 (at the 70% of lag time), T2 (at the end oflag time), and T3 (after an average of 1 h from first channel-like event appearance). The mean valuewas obtained from at least three experiments.
TimeC ± SEµF/cm2
[Res] = 10 µM
C ± SEµF/cm2
[Res] = 20 µM
T0 0.27 ± 0.01 0.28 ± 0.01T1 0.11 ± 0.002 0.10 ± 0.003T2 0.28 ± 0.02 0.29 ± 0.01T3 0.30 ± 0.02 0.31 ± 0.02
3.3. Resveratrol Interaction with POPC:Ch PLM
The addition of cholesterol to the POPC solution used to form membranes results inchannel-like activity, indicating that the sterol does not prevent the insertion of resveratrolmolecules into PLMs made up of POPC:Ch.
The addition voltage of resveratrol was 100 mV both for experiments at a concentrationof 10 µM and for those at a concentration of 20 µM. The lag time and applied voltage inwhich the channel-like activity appears depend on the resveratrol concentration used inthe two series of experiments.
After the addition of resveratrol to the cis side of the medium facing the membrane,channel-like activity manifests, first of all, as a paroxystic activity then characterizedby current jumps compatible with channel-type openings and closures with differentconductance levels followed, sometimes, by quiescent periods. Figure 5 shows an ex-ample of chart recordings of resveratrol’s channel-like activity when incorporated into
56
Membranes 2021, 11, 132
POPC:Ch PLMs at the applied voltage of 80 and 40 mV with associated histograms of theconductance fluctuations.
Λ
Figure 5. Resveratrol channel-like activity in POPC:Ch PLMs. Representative traces illustrating channel activity ofresveratrol in membranes made up of POPC:Ch (65:35, w:w) with associated histograms of the conductance fluctuations.The histograms of the probability, P(Λ), for the frequency of a given conductivity unit were fitted by a Gaussian whichis shown as a solid curve. Experiments were performed in the presence of 10 µM (top trace) and 20 µM (bottom trace) ofresveratrol added to the cis side, while the aqueous phase contained 0.1 M KCl (pH 7) and T = 23 ± 1 C. Applied voltagewas set to 80 mV (top trace) and 40 mV (bottom trace).
In the set of experiments at 10 µM of resveratrol, channel-like activity appears aftera lag time of 6–7 h at an applied voltage of 120 mV (activation voltage) as a paroxysticactivity, after which the applied voltage was lowered down as far as 80 mV where thechannel-like event amplitude could be monitored. The channel-like activity was recordedat applied voltages of ±80, ±100, and ±120 mV, each applied for 1 h, starting from 80 mV.
In the set of experiments at 20 µM of resveratrol, channel-like activity manifests asa paroxystic activity after a lag time of 2 h at an applied voltage of 100 mV followedby membrane rupture. After PLM breakage and withdrawal, the channel-like activityoccurred spontaneously after a lag time of about 15 min at an applied voltage of 40 mV.The channel-like activity was monitored at applied voltages of ±40 mV, each applied for90 min, starting from 40 mV. The application of voltages higher than ±40 mV (±60 and±80 mV) determined paroxystic activity followed by destabilization of the membrane.
Table 3 reports the biophysical and statistic parameters (Λc ± SE and F ± SD, respec-tively) of the channel-like events obtained under the two different experimental conditions.It is important to note that, at a resveratrol concentration of 10 µM, the central conductanceand frequency values seem to be independent of applied voltages both at positive and atnegative voltages.
The comparatively higher lag times and applied voltages observed in these exper-imental sets than those for POPC PLMs may be due to the effect of cholesterol on acylcarbon chains that are more closely packed. Resveratrol penetrates the hydrophobic core ofthe membrane less easily.
As was done for POPC PLMs, we calculated the lifetime of channel-like events formedby resveratrol. The duration of channel-like events was within a range from 1.25 to 1.75 swhen the resveratrol concentration was 10 µM, while, at 20 µM, the duration of channel-likeevents was 1.75 s at applied voltages of ±40 mV.
57
Membranes 2021, 11, 132
Table 3. Characteristic parameters of resveratrol channel-like event in POPC:Ch PLM. The meanconductance (Λc ± SE) and frequency (F ± SD) of resveratrol channel-like events at different appliedvoltages. The minimum and maximum number of channel-like events considered (N) out of a totalnumber of channel-like events considered (Nt) was: 186 < N < 516, at the resveratrol concentration of10 µM. The minimum and maximum number of channel-like events considered (N) out of a totalnumber of channel-like events considered (Nt) was: 265 < N < 337, Nt = 602, at the resveratrolconcentration of 20 µM.
[Res] = 10 µM [Res] = 20 µM
VsmV
Λc ± SEnS
F ± SDΛc ± SE
nSF ± SD
120 0.020 ± 0.001 11.10 ± 0.49100 0.020 ± 0.001 9.63 ± 0.6280 0.019 ± 0.002 6.80 ± 0.4740 0.065 ± 0.003 9.87 ± 0.86−40 0.050 ± 0.003 6.95 ± 0.70−80 0.020 ± 0.002 10.78 ± 0.79−100 0.021 ± 0.0006 12.74 ± 0.60−120 0.016 ± 0.0004 7.20 ± 1.07
The capacitance behavior recorded in the experiments with POPC:Ch PLMs wassimilar to that observed for POPC PLMs at the two different resveratrol concentrations.Table 4 reports the mean capacitance values at four different times, T0, T1, T2, and T3. Itis interesting to note that the low values of capacitance measured at 70% of lag time (T1)could be due to resveratrol adsorption to the POPC:Ch PLM before its insertion into thebilayer, similarly to that observed for POPC PLMs.
Table 4. Capacitance variation in POPC:Ch PLM. Mean values of the membrane capacitance (C ± SE)calculated at T0, T1, T2, and T3, for which meanings are reported in the legend to Table 3. The meanvalue was obtained from at least four experiments.
TimeC ± SEµF/cm2
[Res] = 10 µM
C ± SEµF/cm2
[Res] = 20 µM
T0 0.30 ± 0.02 0.30 ± 0.02T1 0.11 ± 0.002 0.12 ± 0.002T2 0.29 ± 0.01 0.28 ± 0.01T3 0.30 ± 0.02 0.31 ± 0.01
3.4. Resveratrol Interaction with DOPS:DOPE PLMs
In order to test the role of the polar head and the effect of negative membrane chargeon resveratrol incorporation and channel-like events, we carried out experiments usingPLMs made up of DOPS:DOPE (1:2, w/w) in which the negative charge is diluted. Thismembrane is characterized by the presence of the net negative charge of DOPS and theneutral DOPE, a non-lamellar-forming lipid.
The resveratrol concentrations tested were 10 and 20 µM. The addition of resveratrolto the cis side of the medium facing the membrane was made at an applied voltage of100 mV, using the same protocol as that described for POPC and POPC:Ch PLMs.
In all experiments with DOPS:DOPE membranes and independently of the resveratrolconcentration, no current fluctuations were observed for many hours using a wide range ofapplied voltages. No channel-like activity occurred after PLM breakage and the formationof the second membrane by painting the lipid solution present around the hole.
In addition, in these experimental sets, we monitored capacitance. In all experiments,before the addition of resveratrol, the basic capacitance of the PLMs remained constantin the range of 0.26–0.28 µF/cm2. After the addition of resveratrol, we observed that the
58
Membranes 2021, 11, 132
capacitance decreased during the lag time until reaching a minimum value that remainedconstant until the end of the experiment. This behavior was observed both at 10 and 20 µMof resveratrol. As in the experiments with POPC and POPC:Ch PLMs, we calculated themean capacitance values at the different times, T0, T1, T2, and T3, which are reported inTable 5. The capacitance values remain low (0.11 ± 0.03 µF/cm2) even after PLM breakageand formation of the second membrane.
Table 5. Capacitance variation in DOPS:DOPE PLM. Mean values of the membrane capacitance(C ± SE) calculated at T0, T1, T2, and T3, for which meanings are reported in the legend to Table 3.The mean value was obtained from at least six experiments.
TimeC ± SEµF/cm2
[Res] = 10 µM
C ± SEµF/cm2
[Res] = 20 µM
T0 0.26 ± 0.01 0.28 ± 0.01T1 0.10 ± 0.003 0.11 ± 0.002T2 0.10 ± 0.002 0.11 ± 0.002T3 0.10 ± 0.003 0.12 ± 0.001
These results indicate that resveratrol is unable to incorporate into PLMs made up ofDOPS:DOPE and to form channel-like events, probably due to the presence of DOPE, a non-lamellar-forming lipid, as resveratrol may induce a negative curvature of the membrane.The combination of these factors prevent resveratrol incorporation into PLMs; however,we cannot exclude an effect of negatively charged lipid DOPS.
4. Discussion
In recent decades, natural derivatives have been the subject of intensive studiesregarding their biological and pharmacological properties. Resveratrol is known for itsnumerous beneficial effects on human health, even though its mechanisms of action arestill unclear. Due to its lipophilicity and poor water solubility, the lipid membrane is theprincipal target of resveratrol.
An important aspect of resveratrol’s interaction with the membrane is that it induceschanges in the membrane’s biophysical properties. The resveratrol molecule may inducechanges either to the interfacial structure or to the chain region, thus modifying membranepacking. Therefore, it is very important to be able to clarify the exact location in or on themembrane.
In this work, by simultaneously measuring membrane conductance and capacitance,we show that resveratrol interacts with a planar lipid membrane and the mode of interactionis due to the bilayer’s lipid composition. To our knowledge, this is the first study in whichresveratrol’s membrane activity has been monitored by electrophysiological measurements,which are not so frequently used for the characterization of drug-membrane interactionsand by PLMs that complement studies performed with liposomes.
As is well known, conductance is related to the ionic current through the bilayerwhen a substance (a protein, peptide, or drug) incorporates into the membrane formingconductive units that span the bilayer, while capacitance is related to the property of amembrane to act as a capacitor; indeed, the lipid bilayer is an insulator separating twoelectrolytic media. Capacitance is directly proportional to the area of the membrane andinversely proportional to its thickness. Capacitance also depends on the characteristics ofthe lipids used as the insulating material.
Several studies show that the structure of lipids determines the biophysical propertiesof membrane (e.g., organization in bilayers, fluidity, hexagonal phases, etc.) [48]. In ourwork, we used POPC that is prone to form a bilayer [49,50], cholesterol that has effects onmembrane fluidity, and DOPE that is prone to form inverse hexagonal phases [49,50]. Dur-ing the interaction of resveratrol with the planar lipid bilayer, the variation in capacitancecan help to shed light on its mechanism of action.
59
Membranes 2021, 11, 132
Our results show that resveratrol incorporates into PLMs made up of POPC and formstransient channel-like events in which lag time depends on its concentration. The lag timeis the time at which a conductance variation first occurs after resveratrol addition. Thedifferent duration of lag time may be due to reaching an appropriate resveratrol/lipidratio. Once a threshold resveratrol/lipid value has been reached, resveratrol forms tran-sient conductive units permeabilizing the membrane. The capacitance variation, inducedby adding resveratrol, may be due to: adsorption of resveratrol (capacitance decrease)occurring before formation of conductive units and/or formation of channel-like events(capacitance increase) across the membrane. The paroxystic activity reported above may bedue to the collapse of the conductive units inducing rapid flip-flopping of the membranelipids. It is important to note that both the lag time and the applied voltages at which theparoxystic activity appears depend on the resveratrol concentration, thus strengtheningthe concept that an appropriate resveratrol/lipid ratio has been reached.
The addition of cholesterol, a known component of the cellular membrane, to PLMsmade up of POPC increases the lag time compared to that observed for experiments withPOPC PLMs, regardless of the resveratrol concentration used. The capacitance behaves ina similar fashion to that observed for experiments with PLMs in the absence of cholesterol,decreasing immediately after resveratrol addition and increasing when the channel-likeactivity appears. Therefore, also in POPC:Ch PLMs, the formation of channel-like eventscomes after the resveratrol adsorption phase. However, the higher lag times than thoseobtained for POPC PLMs would seem to indicate that cholesterol makes it more difficultfor resveratrol to incorporate into PLMs and to form conductive units, probably due to thetighter packing of the phospholipid tails.
According to some studies, the β-hydroxyl group attached to C3 of the cholesterolmolecule, is located in the headgroup region of POPC, while the isooctyl chain, attached toC17, is located deep within the hydrophobic core of the bilayer close to the double bonds offatty acids [24]. Some authors [1,25] have shown that resveratrol adopts the same positionin the membrane as cholesterol. Besides, the higher applied voltage (120 mV) needed toobtain channel-like activity, compared with POPC PLMs, seems to confirm this idea.
Our results appear to be in line with those obtained by other authors [25,29,51] whohave shown that resveratrol penetrates into the hydrophobic core of the bilayer close to thedouble bonds of polyunsaturated fatty acids.
This mode of interaction with lipids might explain the anti-peroxidation effects dis-played by resveratrol, because it protects the phospholipids from oxidation reactions, actingas an electron donor to a free radical, neutralizing it and inhibiting its capacity to damagethe cell membrane [52].
In contrast with its effects in neutral PLMs, resveratrol does not interact with DOPEPLMs to which negatively charged lipid DOPS have been added. To our knowledge, theinteraction of resveratrol with the lipid system containing these phospholipids has neverpreviously been studied.
In the experiments with DOPS:DOPE PLMs, the capacitance decreases after resveratroladdition reaching a minimal value that is quite constant until the end of the experiment.
The behavior of the capacitance and the absence of channel-like activity indicate thatresveratrol remains on the membrane surface and is unable to incorporate into the PLM.This behavior may be due to the chemical characteristics of the lipids forming the bilayerand/or to the effect of resveratrol on the membrane surface, which promote the formationof the inverse hexagonal phase and of membrane negative curvature.
Several studies have shown that the nature and molecular shape of lipids determinetheir intrinsic tendency to form distinct phases [49] and to affect membrane curvature. Phos-phatidylethanolamine (PE) has a truncated cone shape because its headgroup has a smallerarea than the cross-section of its hydrocarbon chains, while phosphatidylcholine (PC) hasa cylindrical molecular shape. Because of these features, PE is prone to form an inversehexagonal phase and PC bilayer. Besides, dioleoyl lipids with phosphatidylethanolamineheadgroups adopt a negatively-curved surface because the PE headgroup is smaller than
60
Membranes 2021, 11, 132
the PC headgroup [53], and they are able to interact most with the glycerol and phosphategroups of neighboring lipids, probably due to the differing hydration properties influencingthe curvature [54].
On the other hand, it has been demonstrated that many substances that are active atthe membrane interface induce membrane curvature, namely local or global deformationsof the membrane.
Numerous studies show that there are many substances, interfacially active pep-tides [55–57] and non-peptide compounds that can influence membrane curvature, andvice versa. Yesylevskyy and colleagues have shown that the permeability of the modellipid membrane for cisplatin and gemcitabine depends on the curvature [58]. Barry andcolleagues showed that curcumin, a lipophilic drug, binds to dimyristoyl-phosphocholine(DMPC) with a transbilayer orientation, anchoring to the bilayer by a hydrogen bond tothe phosphate group, while, in dipalmitoleoyl-glycero-phosphoethanolamine (DiPOPE)vesicles, it promotes and stabilizes the formation of the inverted hexagonal (HII) phase.According to the authors, this feature of curcumin is indirect evidence that it inducesnegative membrane curvature [59].
On the other hand, primaquine, a potent antimalarial agent, increases the phasetransition temperature (TH) of Lα and reduces the transition enthalpy of palmitoyl-oleoyl-phosphatidylethanolamine (POPE) vesicles, indicating that primaquine promotes positivemembrane curvature and stabilizes the fluid phase of POPE vesicles [60].
All these studies indicate that many substances, peptides, and drugs induce modi-fications of a membrane’s biophysical properties caused by the chemical characteristicsof the substances in question. In line with this concept, our work shows that resveratrolinteracts with model membranes, modifying their biophysical parameters for differentlipid compositions. Studies on drug-membrane interaction are very important in order tounderstand and clarify their mechanism of action.
5. Conclusions
Our results indicate that resveratrol interacts with zwitterionic and neutral PLMs, byincorporating into PLMs and forming transient conductive units, whereas it is unable tointeract with DOPE:DOPS PLMs. In light of this, we hypothesize a model in which itsfundamental steps are: (1) adsorption of resveratrol onto the membrane surface. This stepis common to the neutral PLMs and to the negatively-charged PLMs used in this study;and (2) in neutral PLMs, formation of transient conductive units made up of moleculesof resveratrol oriented with their long axis along the membrane normal and assembledtogether (Figure 6). The incorporation and channel-like events formation indicate thatresveratrol is located in the hydrophobic core of the bilayer. These results, obtained bysimultaneously monitoring membrane conductance and capacitance, may help to clarify themechanism of action by which resveratrol performs its beneficial effects on human health,such as its antioxidant or anti-microbial properties and its scavenging of lipid radicals.
61

Membranes 2021, 11, 132
Figure 6. Schematic model of the resveratrol interaction with PLM at different lipid composition. Resveratrol adsorbsonto the membrane surface, regardless to the PLM composition. In POPC or POPC:Ch PLMs (top), resveratrol insertsand assembles into membrane forming conductive units, once an appropriate resveratrol/lipid ratio has been reached. InDOPE:DOPS PLMs (bottom), resveratrol inducing negative curvature of membrane is unable to insert into it.
Funding: This research did not receive any specific grant from funding agencies in the public,commercial, or not-for-profit sectors.
Acknowledgments: The authors acknowledge Anthony Green for proofreading and providinglinguistic advice.
Conflicts of Interest: The author declares no conflict of interest.
References1. Brittes, J.; Lúcio, M.; Nunes, C.; Lima, J.L.; Reis, S. Effects of Resveratrol on Membrane Biophysical Properties: Relevance for Its
Pharmacological Effects. Chem. Phys. Lipids 2010, 163, 747–754. [CrossRef]2. Vestergaard, M.; Ingmer, H. Antibacterial and Antifungal Properties of Resveratrol. Int. J. Antimicrob. Agents 2019, 53, 716–723.
[CrossRef] [PubMed]3. Bo, S.; Ciccone, G.; Castiglione, A.; Gambino, R.; De Michieli, F.; Villois, P.; Durazzo, M.; Perin, C.P.; Cassader, M. Anti-
inflammatory and Antioxidant Effects of Resveratrol in Healthy Smokers a Randomized, Double-Blind, Placebo-Controlled,Cross-over Trial. Curr. Med. Chem. 2013, 20, 1323–1331. [CrossRef] [PubMed]
4. Lançon, A.; Frazzi, R.; Latruffe, N. Anti-Oxidant, Anti-Inflammatory and Anti-Angiogenic Properties of Resveratrol in OcularDiseases. Molecules 2016, 21, 304. [CrossRef]
5. Athar, M.; Back, J.H.; Kopelovich, L.; Bickers, D.R.; Kim, A.L. Multiple Molecular Targets of Resveratrol: Anti-CarcinogenicMechanisms. Arch. Biochem. Biophys. 2009, 486, 95–102. [CrossRef] [PubMed]
6. Ko, J.H.; Sethi, G.; Um, J.Y.; Shanmugam, M.K.; Arfuso, F.; Kumar, A.P.; Bishayee, A.; Ahn, K.S. The Role of Resveratrol in CancerTherapy. Int. J. Mol. Sci. 2017, 18, 2589. [CrossRef]
7. Baxter, R.A. Anti-aging Properties of Resveratrol: Review and Report of a Potent New Antioxidant Skin Care Formulation.J. Cosmet. Dermatol. 2008, 7, 2–7. [CrossRef] [PubMed]
8. Wen, S.; Zhang, J.; Yang, B.; Elias, P.M.; Man, M.Q. Role of Resveratrol in Regulating Cutaneous Functions. Evid. Based Complement.
Alternat. Med. 2020, 2020, 2416837. [CrossRef]9. Braidy, N.; Jugder, B.E.; Poljak, A.; Jayasena, T.; Mansour, H.; Nabavi, S.M.; Sachdev, P.; Grant, R. Resveratrol as a Potential
Therapeutic Candidate for the Treatment and Management of Alzheimer’s Disease. Curr. Top. Med. Chem. 2016, 16, 1951–1960.[CrossRef]
10. Granzotto, A.; Zatta, P. Resveratrol and Alzheimer’s Disease: Message in a Bottle on Red Wine and Cognition. Front. Aging
Neurosci. 2014, 6, 95. [CrossRef]
62
Membranes 2021, 11, 132
11. Hartman, R.E.; Shah, A.; Fagan, A.M.; Schwetye, K.E.; Parsadanian, M.; Schulman, R.N.; Finn, M.B.; Holtzman, D.M. PomegranateJuice Decreases Amyloid Load and Improves Behavior in a Mouse Model of Alzheimer’s Disease. Neurobiol. Dis. 2006, 24,506–515. [CrossRef]
12. Koukoulitsa, C.; Villalonga-Barber, C.; Csonka, R.; Alexi, X.; Leonis, G.; Dellis, D.; Hamelink, E.; Belda, O.; Steele, B.R.; Micha-Screttas, M.; et al. Biological and Computational Evaluation of Resveratrol Inhibitors against Alzheimer’s Disease. J. Enzyme
Inhib. Med. Chem. 2016, 31, 67–77. [CrossRef]13. Ono, K.; Yoshiike, Y.; Takashima, A.; Hasegawa, K.; Naiki, H.; Yamada, M. Potent Anti-Amyloidogenic and Fibril-Destabilizing
Effects of Polyphenols in Vitro: Implications for the Prevention and Thera-Peutics of Alzheimer’s Disease. J. Neurochem. 2003, 87,172–181. [CrossRef] [PubMed]
14. Pasinetti, G.M.; Wang, J.; Ho, L.; Zhao, W.; Dubner, L. Roles of Resveratrol and Other Grape-Derived Polyphenols in Alzheimer’sDisease Prevention and Treatment. Biochim. Biophys. Acta 2015, 1852, 1202–1208. [CrossRef] [PubMed]
15. Rege, S.D.; Geetha, T.; Griffin, G.D.; Broderick, T.L.; Babu, J.R. Neuroprotective Effects of Resveratrol in Alzheimer DiseasePathology. Front. Aging Neurosci. 2014, 6, 218. [CrossRef]
16. Bastianetto, S.; Ménard, C.; Quirion, R. Neuroprotective Action of Resveratrol. Biochim. Biophys. Acta 2015, 1852, 1195–1201.[CrossRef] [PubMed]
17. Yashiro, T.; Nanmoku, M.; Shimizu, M.; Inoue, J.; Sato, R. Resveratrol Increases the Expression and Activity of the LowDensity Lipoprotein Receptor in Hepatocytes by the Proteolytic Activation of the Sterol Regulatory Element-Binding Proteins.Atherosclerosis 2012, 220, 369–374. [CrossRef]
18. Voloshyna, I.; Hussaini, S.M.; Reiss, A.B. Resveratrol in Cholesterol Metabolism and Atherosclerosis. J. Med. Food 2012, 15,763–773. [CrossRef]
19. Galfi, P.; Jakus, J.; Molnar, T.; Neogrady, S.; Csordas, A. Divergent Effects of Resveratrol, a Polyphenolic Phytostilbene, on FreeRadical Levels and Type of Cell Death Induced by the Histone Deacetylase Inhibitors Butyrate and Trichostatin A. J. Steroid
Biochem. Mol. Biol. 2005, 94, 39–47. [CrossRef]20. Frankel, E.N.; Waterhouse, A.L.; Kinsella, J.E. Inhibition of Human LDL Oxidation by Resveratrol. Lancet 1993, 341, 1103–1104.
[CrossRef]21. Jensen, M.D.; Sheng, W.; Simonyi, A.; Johnson, G.S.; Sun, A.Y.; Sun, G.Y. Involvement of Oxidative Pathways in Cytokine-Induced
Secretory Phospholipase A2-IIA in Astrocytes. Neurochem. Int. 2009, 55, 362–368. [CrossRef]22. Sun, G.Y.; Shelat, P.B.; Jensen, M.B.; He, Y.; Sun, A.Y.; Simonyi, A. Phospholipases a2 and Inflammatory Responses in the Central
Nervous System. Neuromol. Med. 2010, 12, 133–148. [CrossRef]23. Yarla, N.S.; Bishayee, A.; Sethi, G.; Reddanna, P.; Kalle, A.M.; Dhananjaya, B.L.; Dowluru, K.S.; Chintala, R.; Duddukuri, G.R.
Targeting Arachidonic Acid Pathway by Natural Products for Cancer Prevention and Therapy. Semin. Cancer Biol. 2016, 40, 48–81.[CrossRef]
24. Fei, Q.; Kent, D.; Botello-Smith, W.M.; Nur, F.; Nur, S.; Alsamarah, A.; Chatterjee, P.; Lambros, M.; Luo, Y. Molecular Mechanismof Resveratrol’s Lipid Membrane Protection. Sci. Rep. 2018, 8, 1587. [CrossRef] [PubMed]
25. Fabris, S.; Momo, F.; Ravagnan, G.; Stevanato, R. Antioxidant Properties of Resveratrol and Piceid on Lipid Peroxidation inMicelles and Monolamellar Liposomes. Biophys. Chem. 2008, 135, 76–83. [CrossRef]
26. Ghellinck, d.A.; Shen, C.; Fragneto, G.; Klösgen, B. Probing the Position of Resveratrol in Lipid Bilayers: A Neutron ReflectivityStudy. Colloids Surf. B Biointerfaces 2015, 134, 65–72. [CrossRef] [PubMed]
27. Han, J.; Suga, K.; Hayashi, K.; Okamoto, Y.; Umakoshi, H. Multi-Level Characterization of the Membrane Properties ofResveratrol-Incorporated Liposomes. J. Phys. Chem. B 2017, 121, 4091–4098. [CrossRef]
28. Cardia, M.C.; Caddeo, C.; Lai, F.; Fadda, A.M.; Sinico, C.; Luhmer, M. H NMR Study of the Interaction of Trans-Resveratrol withSoybean Phosphatidylcholine Liposomes. Sci. Rep. 2019, 9, 17736. [CrossRef]
29. Bonechi, C.; Martini, S.; Ciani, L.; Lamponi, S.; Rebmann, H.; Rossi, C.; Ristori, S. Using Liposomes as Carriers for PolyphenolicCompounds: The Case of Trans-Resveratrol. PLoS ONE 2012, 7, e41438. [CrossRef] [PubMed]
30. Balanc, B.; Ota, A.; Djordjevic, V.; Sentjurc, M.; Nedovic, V.; Bugarski, B.; Poklar, U.N. Resveratrol-Loaded Liposomes: Interactionof Resveratrol with Phospholipids. Eur. J. Lipid Sci. Technol. 2015, 117, 1615–1626. [CrossRef]
31. Neves, A.R.; Nunes, C.; Reis, S. Resveratrol Induces Ordered Domains Formation in Biomembranes: Implication for Its PleiotropicAction. Biochim. Biophys. Acta 2016, 1858, 12–18. [CrossRef]
32. Neves, A.R.; Nunes, C.; Reis, S. New Insights on the Biophysical Interaction of Resveratrol with Biomembrane Models: Relevancefor Its Biological Effects. J. Phys. Chem. B 2015, 119, 11664–11672. [CrossRef]
33. Martinovic, N.; Abramovic, H.; Poklar, U.N. Inhibition of Copper-Induced Lipid Peroxidation by Sinapic Acid and Its Derivativesin Correlation to Their Effect on the Membrane Structural Properties. Biochim. Biophys. Acta Biomembr. 2019, 1861, 1–8. [CrossRef][PubMed]
34. Andrade, S.; Ramalho, M.; Loureiro, A.; Pereira, M. The Biophysical Interaction of Ferulic Acid with Liposomes as BiologicalMembrane Model: The Effect of the Lipid Bilayer Composition. J. Mol. Liq. 2020. [CrossRef]
35. Gutiérrez, M.E.; García, A.F.; Madariaga, A.M.; Sagrista, M.L.; Casadó, F.J.; Mora, M. Interaction of Tocopherols and PhenolicCompounds with Membrane Lipid Components: Evaluation of Their Antioxidant Activity in a Liposomal Model System. Life Sci.
2003, 72, 2337–2360. [CrossRef]
63
Membranes 2021, 11, 132
36. Arora, A.; Byrem, T.M.; Nair, M.G.; Strasburg, G.M. Modulation of Liposomal Membrane Fluidity by Flavonoids and Isoflavonoids.Arch. Biochem. Biophys. 2000, 373, 102–109. [CrossRef] [PubMed]
37. Tsuchiya, H.; Nagayama, M.; Tanaka, T.; Furusawa, M.; Kashimata, M.; Takeuchi, H. Membrane-Rigidifying Effects of Anti-cancerDietary Factors. Biofactors 2002, 16, 45–56. [CrossRef]
38. Selvaraj, S.; Mohan, A.; Narayanan, S.; Sethuraman, S.; Krishnan, U.M. Dose-Dependent Interaction of Trans-Resveratrol withBiomembranes: Effects on Antioxidant Property. J. Med. Chem. 2013, 56, 970–981. [CrossRef]
39. Shahane, G.; Ding, W.; Palaiokostas, M.; Orsi, M. Physical Properties of Model Biological Lipid Bilayers: Insights from All-AtomMolecular Dynamics Simulations. J. Mol. Model. 2019, 25, 76. [CrossRef] [PubMed]
40. Murugova, T.N.; Balgavý, P. Molecular Volumes of DOPC and DOPS in Mixed Bilayers of Multilamellar Vesicles. Phys. Chem.
Chem. Phys. 2014, 16, 18211–18216. [CrossRef] [PubMed]41. Rand, R.P.; Fuller, N.L. Structural Dimensions and Their Changes in a Reentrant Hexagonal-Lamellar Transition of Phospholipids.
Biophys. J. 1994, 66, 2127–2138. [CrossRef]42. Suetsugu, S.; Kurisu, S.; Takenawa, T. Dynamic Shaping of Cellular Membranes by Phospholipids and Membrane-Deforming
Proteins. Physiol. Rev. 2014, 94, 1219–1248. [CrossRef] [PubMed]43. Tien, H.; Ottova, A.-L. Membrane Biophysics: As Viewed from Experimental Bilayer Lipid Membranes; Elsevier: Amsterdam,
The Netherlands, 2000.44. Tien, H.; Ottova, A.-L. The Lipid Bilayer Concept and Its Experimental Realization: From Soap Bubbles, Kitchen Sink, to Bilayer
Lipid Membranes. J. Membr. Sci. 2001, 189, 83–117. [CrossRef]45. Müller, P.; Rudin, D.; Tien, T.; Weacott, W. Reconstitution of Cell Membrane Structure in Vitro and Its Trasformation into an
Excitable System. Nature 1962, 194, 979–980. [CrossRef] [PubMed]46. Tien, T.; Mountz, J.; Martinosi, A. Protein-Lipid Interaction in Bilayer Lipid Membranes (BLM). In Enzyme of Biological Membranes;
NY Plenum: New York, NY, USA, 1977; pp. 139–170.47. Micelli, S.; Gallucci, E.; Meleleo, D.; Stipani, V.; Picciarelli, V. Mitochondrial Porin Incorporation into Black Lipid Membranes:
Ionic and Gating Contribution to the Total Current. Bioelectrochemistry 2002, 57, 97–106. [CrossRef]48. Faroux, J.M.; Ureta, M.M.; Tymczyszyn, E.E.; Gómez-Zavaglia, A. An Overview of Peroxidation Reactions Using Liposomes as
Model Systems and Analytical Methods as Monitoring Tools. Colloids Surf. B Biointerfaces 2020, 195, 111254. [CrossRef]49. Koller, D.; Lohner, K. The Role of Spontaneous Lipid Curvature in the Interaction of Interfacially Active Peptides with Membranes.
Biochim. Biophys. Acta 2014, 1838, 2250–2259. [CrossRef] [PubMed]50. Cullis, P.R.; de Kruijff, B. Lipid Polymorphism and the Functional Roles of Lipids in Biological Membranes. Biochim. Biophys. Acta
1979, 559, 399–420. [CrossRef]51. Koukoulitsa, C.; Durdagi, S.; Siapi, E.; Villalonga-Barber, C.; Alexi, X.; Steele, B.R.; Micha, M.-S.; Alexis, M.N.; Tsantili-Kakoulidou,
A.; Mavromoustakos, T. Comparison of Thermal Effects of Stilbenoid Analogs in Lipid Bilayers Using Differential ScanningCalorimetry and Molecular Dynamics: Correlation of Thermal Effects and Topographical Position with Antioxidant Activity. Eur.
Biophys. J. 2011, 40, 865–875. [CrossRef]52. Zhang, J.; Fu, Y.; Yang, P.; Liu, X.; Li, Y.; Gu, Z. ROS Scavenging Biopolymers for Anti-Inflammatory Diseases: Classification and
Formulation. Adv. Mater. Interfaces 2020, 7. [CrossRef]53. Rand, R.P.; Fuller, N.L.; Gruner, S.M.; Parsegian, V.A. Membrane Curvature, Lipid Segregation, and Structural Transitions for
Phospholipids under Dual-Solvent Stress. Biochemistry 1990, 29, 76–87. [CrossRef] [PubMed]54. Sodt, A.J.; Pastor, R.W. Molecular Modeling of Lipid Membrane Curvature Induction by a Peptide: More Than Simply Shape.
Biophys. J. 2014, 106, 1958–1969. [CrossRef] [PubMed]55. Haney, E.F.; Nathoo, S.; Vogel, H.J.; Prenner, E.J. Induction of Non-lamellar Lipid Phases by Antimicrobial Peptides: A Potential
Link to Mode of Action. Chem. Phys. Lipids 2010, 163, 82–93. [CrossRef] [PubMed]56. Gallucci, E.; Meleleo, D.; Micelli, S.; Picciarelli, V. Magainin 2 Channel Formation in Planar Lipid Membranes: The Role of Lipid
Polar Groups and Ergosterol. Eur. Biophys. J. 2003, 32, 22–32. [CrossRef] [PubMed]57. Matsuzaki, K.; Mitani, Y.; Akada, K.Y.; Murase, O.; Yoneyama, S.; Zasloff, M.; Miyajima, K. Mechanism of Synergism between
Antimicrobial Peptides Magainin 2 and PGLa. Biochemistry 1998, 37, 15144–15153. [CrossRef]58. Yesylevskyy, S.; Rivel, T.; Ramseyer, C. Curvature Increases Permeability of the Plasma Membrane for Ions, Water and the
Anti-cancer Drugs Cisplatin and Gemcitabine. Sci. Rep. 2019, 9, 17214. [CrossRef]59. Barry, J.; Fritz, M.; Brender, J.R.; Smith, P.E.; Lee, D.K.; Ramamoorthy, A. Determining the Effects of Lipophilic Drugs on
Membrane Structure by Solid-State NMR Spectroscopy: The Case of the Antioxidant Curcumin. J. Am. Chem. Soc. 2009, 131,4490–4498. [CrossRef]
60. Basso, L.G.; Rodrigues, R.Z.; Naal, R.M.; Costa-Filho, A.J. Effects of the Antimalarial Drug Primaquine on the Dynamic Structureof Lipid Model Membranes. Biochim. Biophys. Acta 2011, 1808, 55–64. [CrossRef]
64
membranes
Article
Experimental and Theoretical Approaches to DescribingInteractions in Natural Cell Membranes Occurring as a Resultof Fatal Alcohol Poisoning
Aneta D. Petelska 1,* , Michał Szeremeta 2 , Joanna Kotynska 1 and Anna Niemcunowicz-Janica 2
Citation: Petelska, A.D.;
Szeremeta, M.; Kotynska, J.;
Niemcunowicz-Janica, A.
Experimental and Theoretical
Approaches to Describing
Interactions in Natural Cell
Membranes Occurring as a Result of
Fatal Alcohol Poisoning. Membranes
2021, 11, 189. https://doi.org/
10.3390/membranes11030189
Academic Editor: Francisco Monroy
Received: 28 January 2021
Accepted: 5 March 2021
Published: 9 March 2021
Publisher’s Note: MDPI stays neutral
with regard to jurisdictional claims in
published maps and institutional affil-
iations.
Copyright: © 2021 by the authors.
Licensee MDPI, Basel, Switzerland.
This article is an open access article
distributed under the terms and
conditions of the Creative Commons
Attribution (CC BY) license (https://
creativecommons.org/licenses/by/
4.0/).
1 Faculty of Chemistry, University of Bialystok, Ciolkowskiego 1K, 15-245 Bialystok, Poland;[email protected]
2 Department of Forensic Medicine, Medical University of Bialystok, Waszyngtona St. 13,15-230 Bialystok, Poland; [email protected] (M.S.); [email protected] (A.N.-J.)
* Correspondence: [email protected]
Abstract: We propose herein a theoretical model describing the effect of fatal ethanol poisoning on theequilibria between cell membranes and the surrounding ions. Using this model, we determined theparameters characterizing the interaction between the electrolyte solution’s ions and the functionalgroups on the blood cells’ surface. Via the application of mathematical equations, we calculated thetotal surface concentrations of the acidic and basic groups, cA and cB, and their association constantswith solution ions, KAH and KBOH. Using the determined parameters and mathematical equations’values, we calculated the theoretical surface charge density values. We verified the proposed modelby comparing these values with experimental data, which were selected based on measurementsof the electrophoretic mobility of erythrocyte and thrombocyte membranes. Compatibility of theexperimental and theoretical surface charge density values was observed in the range of pH 2–8,while deviations were observed at higher pH values.
Keywords: fatal ethyl alcohol poisoning; surface charge density; microelectrophoresis; acid–baseequilibria; erythrocytes; thrombocytes
1. Introduction
Alcoholism is a severe health problem worldwide. Even if it is not itself the directcause of death, ethanol abuse is associated with many health risks, including poisoningand the greater spread of HIV and tuberculosis. Alcohol negatively affects various typesof blood cells and their functions. Ethyl alcohol abusers most often have defective redblood cells; they are destroyed prematurely, leading to anemia. Drinking too much ethylalcohol can increase stroke risk as it affects the blood coagulation system [1]. Ethyl alcoholis toxic to the bone marrow (it contains blood cell precursors) and all cells circulating inthe blood [2]. Microscopic examination of cultured blood cell precursors has shown thatexposure of cells to a wide range of ethyl alcohol concentrations causes damage to themembrane surrounding each cell.
Alcoholism can also modify blood clotting or coagulation. Alcohol consumption caninterfere with these processes at several levels, causing thrombocytopenia (abnormallylow blood platelet count), thrombocytopathy (impaired platelet function), and reducedfibrinolysis. Researchers have suggested that alcohol intoxication itself causes a decreasein blood platelets. Literature data also indicate that alcohol shortens existing thrombocytes’lifespan and may affect the late stage of platelet production. Alcohol abuse also affectsthe properties of thrombocytes. These platelet abnormalities include impaired plateletaggregation and decreased secretion or activity of platelet-derived proteins involved inblood coagulation [3–7].
Even small changes in the composition of cell membranes can strongly affect theirfunctioning and physicochemical properties. These changes may occur due to the modi-
65
Membranes 2021, 11, 189
fication of cell membranes by short-chain alcohols like ethanol, a particularly importantrepresentative of molecules that can modulate membranes’ properties. As a first approx-imation to understanding the interaction of ethanol with cell membranes, lipid bilayersare considered. This interaction is of biophysical interest as ethyl alcohol can induce theformation of interdigitated bilayer structures and modulate lipids’ phase stability. Numer-ous experimental and computational studies have been performed to determine how ethylalcohol affects lipid bilayers [8–10]. Although the alcohol has an amphiphilic nature, itshydrophobicity is limited; it can pass through the bilayer. Besides this, ethanol moleculescondense near the interface region between lipids and water. –OH groups are positioned inthe bilayer interfacial region (forming hydrogen bonds with hydrophilic lipid headgroups),and the hydrocarbon chains face the hydrophobic core of the bilayer. The presence ofethanol in the lipid membrane has a disordering effect on the hydrocarbon chains, givingrise to an increase in the membrane’s area per lipid and fluidity.
The interaction of ethyl alcohol with lipid membranes, both natural and model, hasbeen examined for years. Alcohol-induced modifications in erythrocyte membranes havebeen extensively investigated using different experimental methods such as Electron param-agnetic resonance spectroscopy (EPR) spectroscopy [11,12], fluorescence anisotropy [13,14],gas chromatography [15], and microelectrophoresis [16–18]. Nevertheless, there is limiteddata concerning the influence of ethanol poisoning on thrombocyte membranes. In theliterature, one can find microelectrohoretic studies of cell membranes’ electric propertieswhen intoxicated with ethanol, but it should be emphasized that these reports concern rats.The authors found that alcohol significantly enhanced changes in the surface charge densityof erythrocyte membranes [17] and liver cell membranes [18]. The obtained results indicatethat changes in cell membrane charge connect with changes in membrane composition.
In recent years, studies of the electrical properties of cell membranes have focusedmainly on model membranes—monolayers [19], bilayers [20], and supported lipid mem-branes [21]—while there are few papers concerning natural membranes [22,23]. The resultsincluded in this paper are a continuation of the systematic research on the electrical prop-erties of blood cell membranes conducted by Petelska et al. [24–28]. In this work, weanalyze the influence of fatal ethanol poisoning on human blood cell membranes’ sur-face charge, which is an important parameter describing equilibria in both model andnatural membranes.
Erythrocytes and thrombocytes have relatively simple structures. Thus, they are idealcellular models to study the alterations of membranes’ physicochemical properties underthe influence of small amphiphilic solutes, like ethanol. In cellular systems, the toxicityof ethyl alcohol has been suggested to be due to its interactions with membranes [29].Due to the lack of literature data on the effect of fatal poisoning with ethyl alcohol on theequilibria between the membranes of erythrocytes and thrombocytes and the surroundingenvironment, we proposed a mathematical model to describe these equilibria. The obtaineddata indicate the influence of alcohol intoxication on the blood cell membranes. In ouropinion, our quantitative description of the properties of erythrocyte and thrombocytemembranes may help to better understand the impact of fatal ethyl alcohol poisoning onthe surface properties of blood cell membranes.
2. Materials and Methods2.1. Materials
The Ethics Review Board of the Medical University of Bialystok approved the con-ducted research (No. R-I-002/533/2010). During autopsies made at the Department ofForensic Medicine, Medical University of Bialystok, blood (pH ~ 6.9) was obtained fromindividuals who died due to fatal alcohol poisoning. The conducted experiment wasbased on ten selective fatal alcohol poisonings (5 men and 5 women; mean age 45.8 years,range 19–65). Blood was taken for tests from the femoral vein and placed in sterile contain-ers, then sent to the Faculty of Chemistry, University of Bialystok for further research. The
66
Membranes 2021, 11, 189
obtained results were subjected to a comparative analysis with a control group obtainedfrom live individuals at the Blood Donation Center in Białystok.
RBC isolation: The RBCs were isolated from 2 mL of whole blood by centrifugationfor 8 min at room temperature at 900× g. The thrombocyte-rich plasma supernatantwas removed, and the obtained erythrocytes were washed three times with 0.9% NaCl,then centrifuged for 15 min at 3000× g. After the final centrifugation, erythrocytes wereresuspended in 0.9% NaCl, followed by microelectrophoretic measurement.
Platelet isolation: The thrombocyte-rich plasma was centrifuged for 8 min at 4000× g.The plasma supernatant was removed and discarded. Thrombocytes were washed threetimes with physiological saline solution (0.9% NaCl) and then centrifuged for 15 min at3000× g. Then, thrombocytes were resuspended in 0.9% NaCl, and microelectrophoreticmeasurements were made.
The test solutions were made and all purification procedures were performed usingultrapure water from a Milli-Q11 system (18.2 MΩ cm, Millipore, Burlington, MA, USA).
2.2. Methods
Microelectrophoretic Mobility Measurements
The purpose of the microelectrophoretic experiment was to obtain the dependence ofthe surface charge density on the pH of the electrolyte solution. Using a Zetasizer Nano ZS(Malvern Instruments, Malvern, UK) apparatus allowed us to obtain data on the microelec-trophoretic mobility of the blood cells using the laser Doppler microelectrophoresis (LDE)technique. WTW InoLab 720 laboratory pH meter (WTW, Weinheim, Germany) use for allmeasurements was performed as a function of pH. Six measurements were made (eachcovering 100–200 series for a duration of 5 s) for each pH value for each sample.
Equation (1) allowed us to calculate of the surface charge density from electrophoreticmobility measurements [30]:
δ =η · u
d(1)
where η is the viscosity of the solution, u is the electrophoretic mobility, and d is thediffusion layer thickness.
The thickness of the diffusion layer can be determined from the following formula(Equation (2)) [31]:
d =
√
ε · ε0 · R · T
2 · F2 · I(2)
where R is the the gas constant, T is the temperature, F is the Faraday number, I is the ionicstrength of 0.9% NaCl, and εε0 is the permeability of the electric medium.
3. Results
The experimental values of the surface charge densities of erythrocyte and thrombo-cyte membranes (control and fatal ethyl alcohol poisoning groups) versus pH are presentedin Figures 1 and 2, respectively. We determined the surface charge density values basedon experimental electrophoretic mobility data using Equation (1). All measurements werecarried out at several pH values, using the basic electrolyte (0.155 M NaCl).
Figure 1 shows the surface charge densities of the control and fatal ethyl alcoholpoisoning erythrocyte groups versus pH values. We observed a decrease in the positivecharge and an increase in the erythrocytes membrane’s negative charge after death by ethylalcohol poisoning compared to control erythrocytes. A slight shift of the isoelectric point ofmembranes to lower pH values is visible.
Figure 2 shows the effect of pH on the surface charge density for the control and fatalethyl alcohol poisoning thrombocyte groups.
67
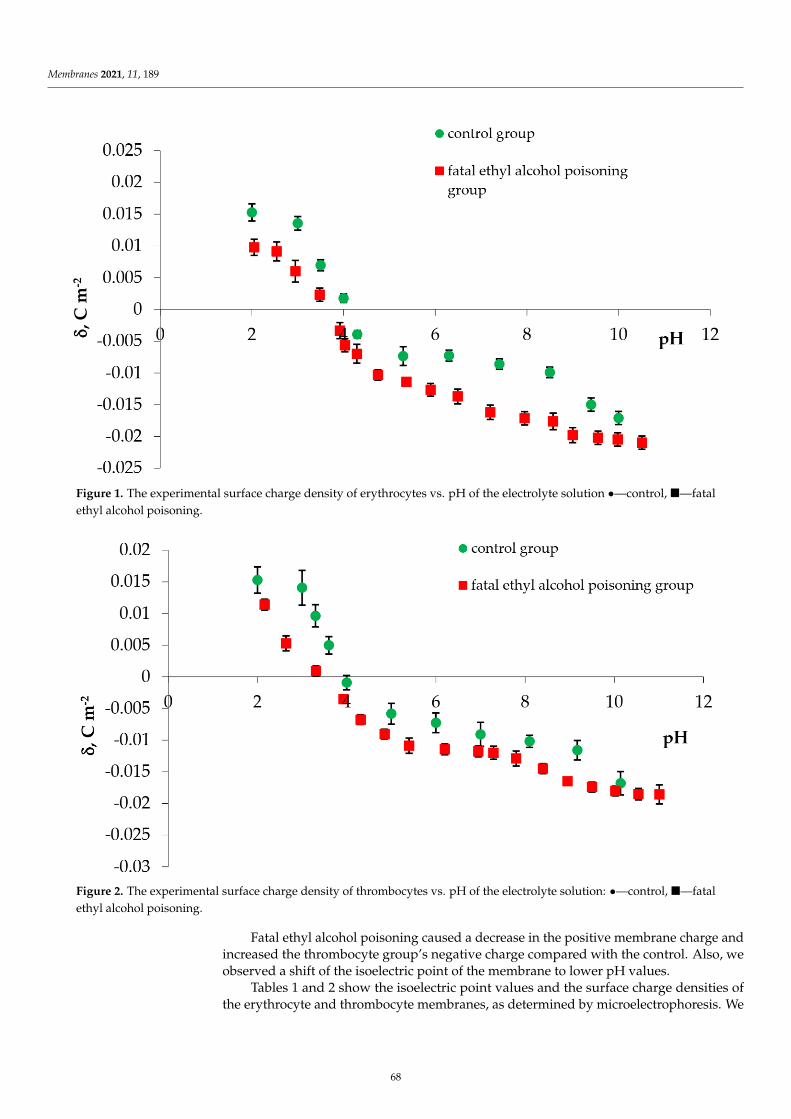
Membranes 2021, 11, 189
Figure 1. The experimental surface charge density of erythrocytes vs. pH of the electrolyte solution •—control, —fatalethyl alcohol poisoning.
Figure 2. The experimental surface charge density of thrombocytes vs. pH of the electrolyte solution: •—control, —fatalethyl alcohol poisoning.
Fatal ethyl alcohol poisoning caused a decrease in the positive membrane charge andincreased the thrombocyte group’s negative charge compared with the control. Also, weobserved a shift of the isoelectric point of the membrane to lower pH values.
Tables 1 and 2 show the isoelectric point values and the surface charge densities ofthe erythrocyte and thrombocyte membranes, as determined by microelectrophoresis. We
68
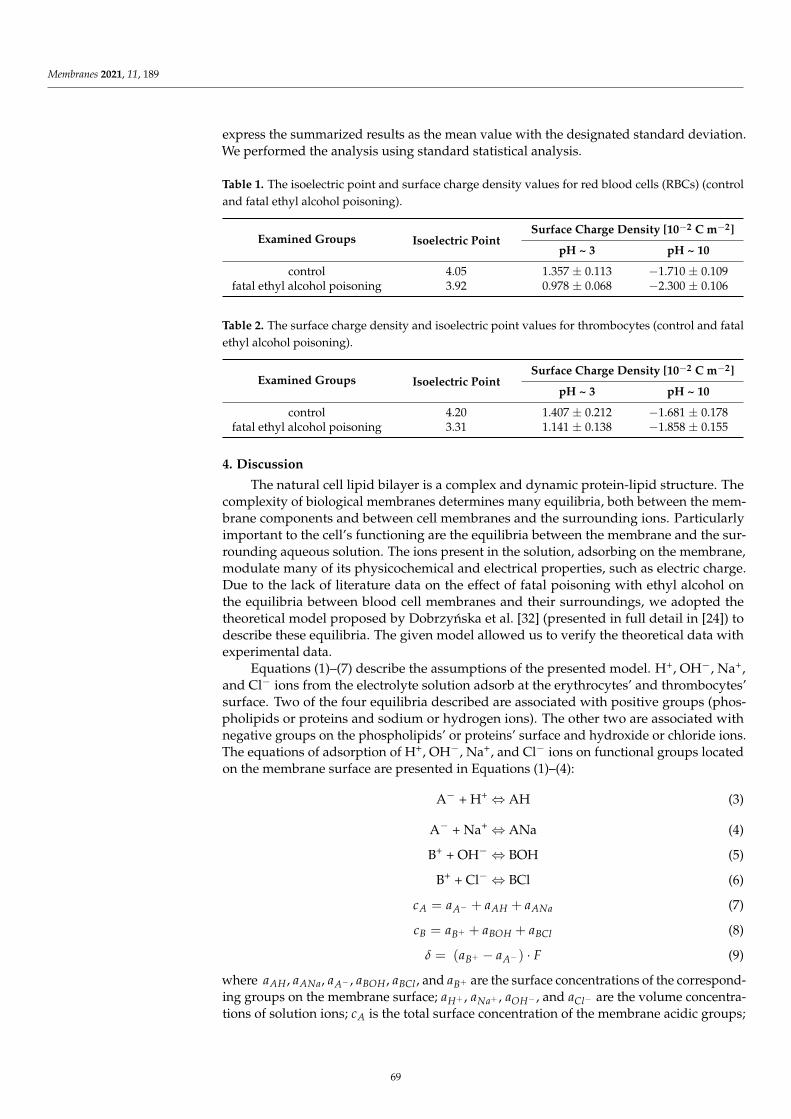
Membranes 2021, 11, 189
express the summarized results as the mean value with the designated standard deviation.We performed the analysis using standard statistical analysis.
Table 1. The isoelectric point and surface charge density values for red blood cells (RBCs) (controland fatal ethyl alcohol poisoning).
Examined Groups Isoelectric PointSurface Charge Density [10−2 C m−2]
pH ~ 3 pH ~ 10
control 4.05 1.357 ± 0.113 −1.710 ± 0.109fatal ethyl alcohol poisoning 3.92 0.978 ± 0.068 −2.300 ± 0.106
Table 2. The surface charge density and isoelectric point values for thrombocytes (control and fatalethyl alcohol poisoning).
Examined Groups Isoelectric PointSurface Charge Density [10−2 C m−2]
pH ~ 3 pH ~ 10
control 4.20 1.407 ± 0.212 −1.681 ± 0.178fatal ethyl alcohol poisoning 3.31 1.141 ± 0.138 −1.858 ± 0.155
4. Discussion
The natural cell lipid bilayer is a complex and dynamic protein-lipid structure. Thecomplexity of biological membranes determines many equilibria, both between the mem-brane components and between cell membranes and the surrounding ions. Particularlyimportant to the cell’s functioning are the equilibria between the membrane and the sur-rounding aqueous solution. The ions present in the solution, adsorbing on the membrane,modulate many of its physicochemical and electrical properties, such as electric charge.Due to the lack of literature data on the effect of fatal poisoning with ethyl alcohol onthe equilibria between blood cell membranes and their surroundings, we adopted thetheoretical model proposed by Dobrzynska et al. [32] (presented in full detail in [24]) todescribe these equilibria. The given model allowed us to verify the theoretical data withexperimental data.
Equations (1)–(7) describe the assumptions of the presented model. H+, OH−, Na+,and Cl− ions from the electrolyte solution adsorb at the erythrocytes’ and thrombocytes’surface. Two of the four equilibria described are associated with positive groups (phos-pholipids or proteins and sodium or hydrogen ions). The other two are associated withnegative groups on the phospholipids’ or proteins’ surface and hydroxide or chloride ions.The equations of adsorption of H+, OH−, Na+, and Cl− ions on functional groups locatedon the membrane surface are presented in Equations (1)–(4):
A− + H+ ⇔ AH (3)
A− + Na+ ⇔ ANa (4)
B+ + OH− ⇔ BOH (5)
B+ + Cl− ⇔ BCl (6)
cA = aA− + aAH + aANa (7)
cB = aB+ + aBOH + aBCl (8)
δ = (aB+ − aA−) · F (9)
where aAH , aANa, aA− , aBOH , aBCl , and aB+ are the surface concentrations of the correspond-ing groups on the membrane surface; aH+ , aNa+ , aOH− , and aCl− are the volume concentra-tions of solution ions; cA is the total surface concentration of the membrane acidic groups;
69
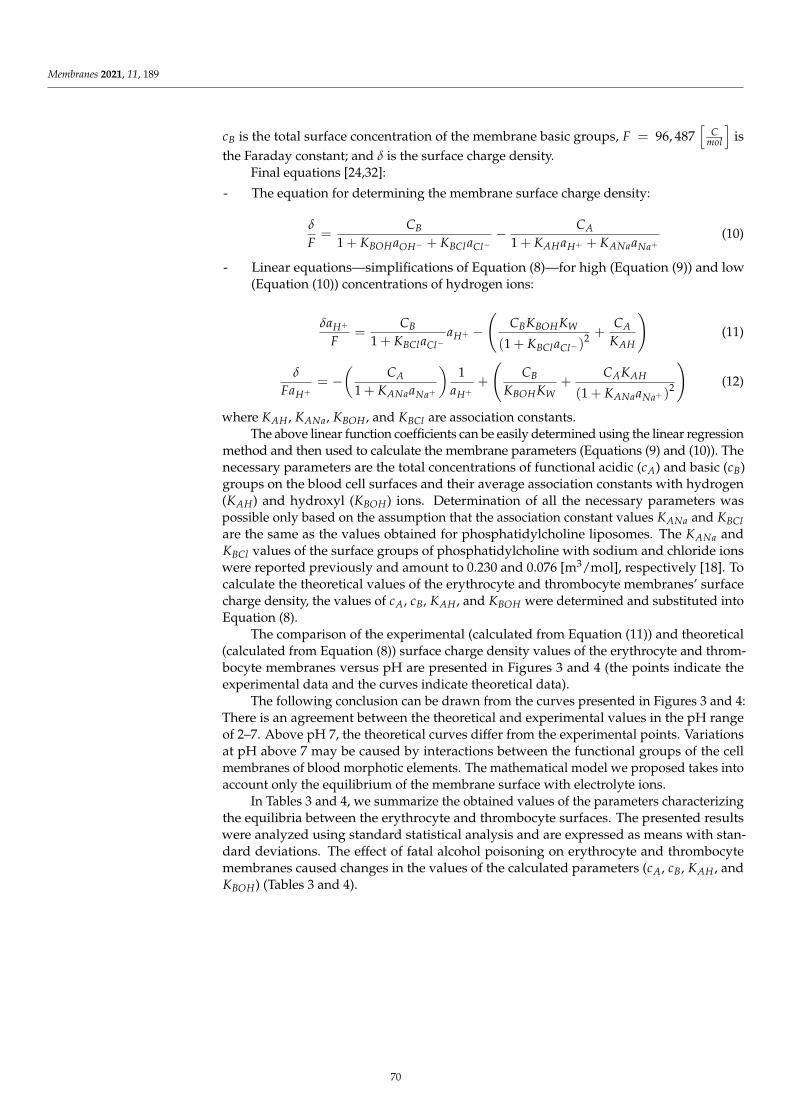
Membranes 2021, 11, 189
cB is the total surface concentration of the membrane basic groups, F = 96, 487[
Cmol
]
isthe Faraday constant; and δ is the surface charge density.
Final equations [24,32]:
- The equation for determining the membrane surface charge density:
δ
F=
CB
1 + KBOHaOH− + KBClaCl−− CA
1 + KAHaH+ + KANaaNa+(10)
- Linear equations—simplifications of Equation (8)—for high (Equation (9)) and low(Equation (10)) concentrations of hydrogen ions:
δaH+
F=
CB
1 + KBClaCl−aH+ −
(
CBKBOHKW
(1 + KBClaCl−)2 +
CA
KAH
)
(11)
δ
FaH+= −
(
CA
1 + KANaaNa+
)
1aH+
+
(
CB
KBOHKW+
CAKAH
(1 + KANaaNa+)2
)
(12)
where KAH , KANa, KBOH , and KBCl are association constants.The above linear function coefficients can be easily determined using the linear regression
method and then used to calculate the membrane parameters (Equations (9) and (10)). Thenecessary parameters are the total concentrations of functional acidic (cA) and basic (cB)groups on the blood cell surfaces and their average association constants with hydrogen(KAH) and hydroxyl (KBOH) ions. Determination of all the necessary parameters waspossible only based on the assumption that the association constant values KANa and KBCl
are the same as the values obtained for phosphatidylcholine liposomes. The KANa andKBCl values of the surface groups of phosphatidylcholine with sodium and chloride ionswere reported previously and amount to 0.230 and 0.076 [m3/mol], respectively [18]. Tocalculate the theoretical values of the erythrocyte and thrombocyte membranes’ surfacecharge density, the values of cA, cB, KAH , and KBOH were determined and substituted intoEquation (8).
The comparison of the experimental (calculated from Equation (11)) and theoretical(calculated from Equation (8)) surface charge density values of the erythrocyte and throm-bocyte membranes versus pH are presented in Figures 3 and 4 (the points indicate theexperimental data and the curves indicate theoretical data).
The following conclusion can be drawn from the curves presented in Figures 3 and 4:There is an agreement between the theoretical and experimental values in the pH rangeof 2–7. Above pH 7, the theoretical curves differ from the experimental points. Variationsat pH above 7 may be caused by interactions between the functional groups of the cellmembranes of blood morphotic elements. The mathematical model we proposed takes intoaccount only the equilibrium of the membrane surface with electrolyte ions.
In Tables 3 and 4, we summarize the obtained values of the parameters characterizingthe equilibria between the erythrocyte and thrombocyte surfaces. The presented resultswere analyzed using standard statistical analysis and are expressed as means with stan-dard deviations. The effect of fatal alcohol poisoning on erythrocyte and thrombocytemembranes caused changes in the values of the calculated parameters (cA, cB, KAH , andKBOH) (Tables 3 and 4).
70
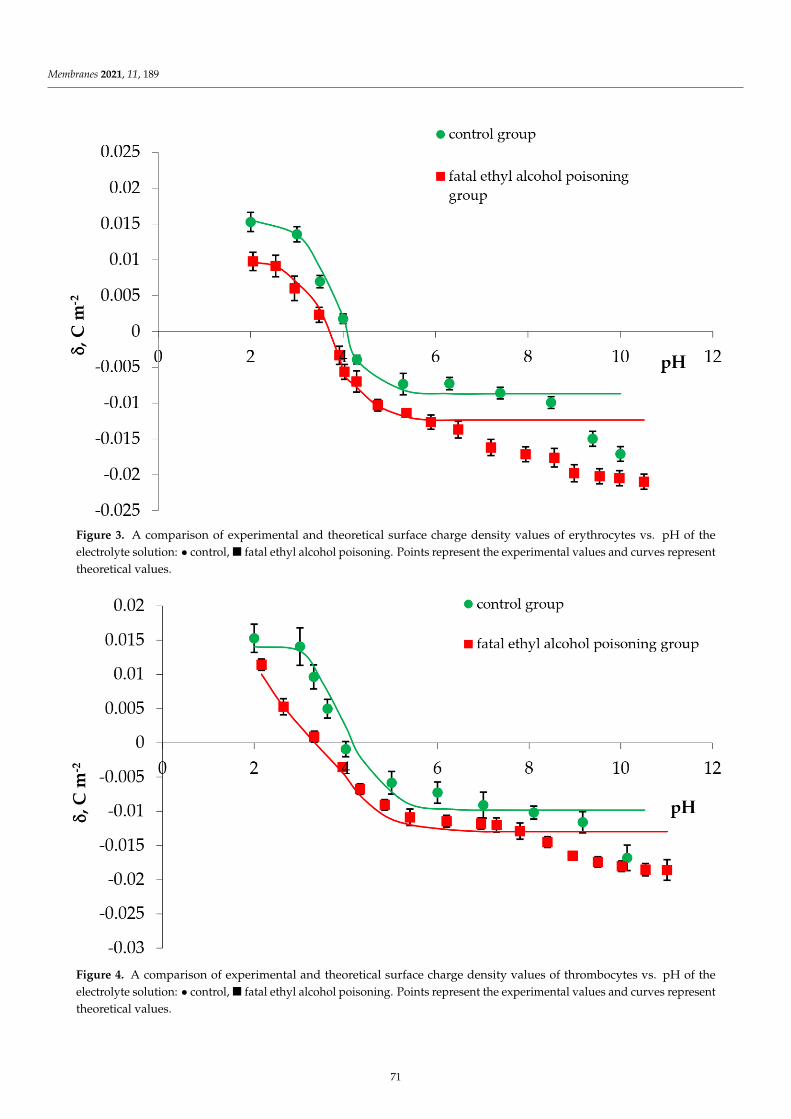
Membranes 2021, 11, 189
Figure 3. A comparison of experimental and theoretical surface charge density values of erythrocytes vs. pH of theelectrolyte solution: • control, fatal ethyl alcohol poisoning. Points represent the experimental values and curves representtheoretical values.
Figure 4. A comparison of experimental and theoretical surface charge density values of thrombocytes vs. pH of theelectrolyte solution: • control, fatal ethyl alcohol poisoning. Points represent the experimental values and curves representtheoretical values.
71
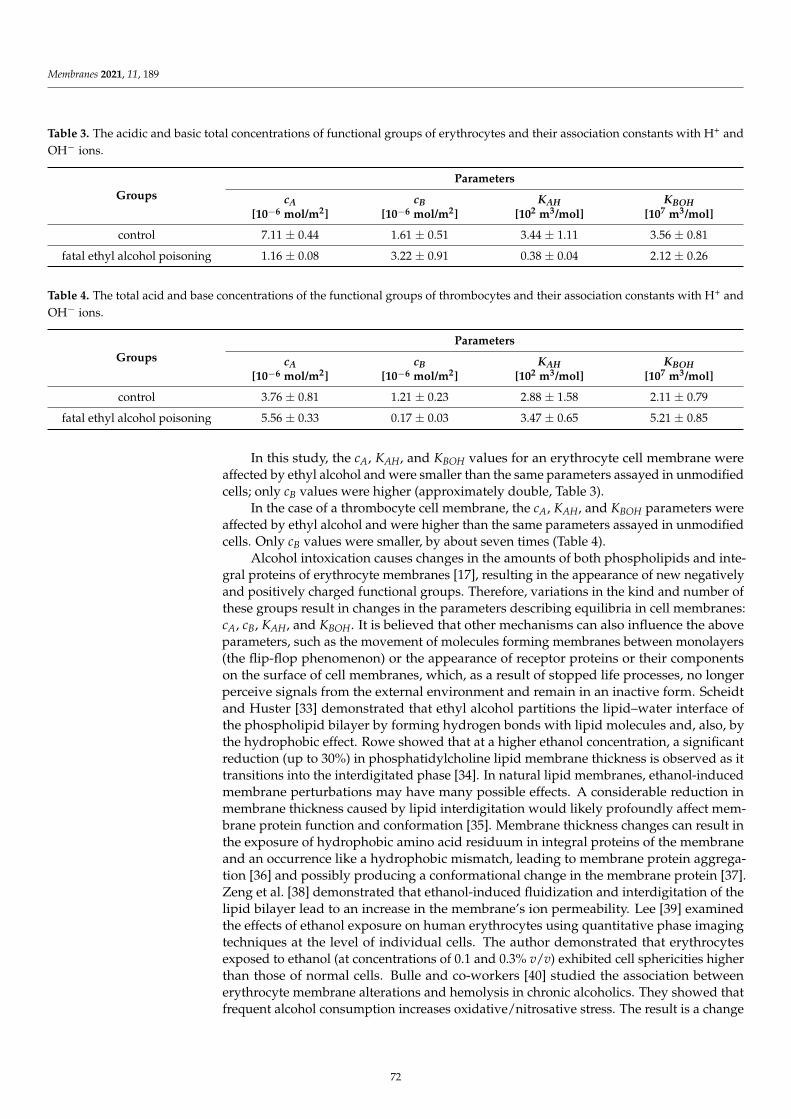
Membranes 2021, 11, 189
Table 3. The acidic and basic total concentrations of functional groups of erythrocytes and their association constants with H+ andOH− ions.
GroupsParameters
cA
[10−6 mol/m2]cB
[10−6 mol/m2]KAH
[102 m3/mol]KBOH
[107 m3/mol]
control 7.11 ± 0.44 1.61 ± 0.51 3.44 ± 1.11 3.56 ± 0.81
fatal ethyl alcohol poisoning 1.16 ± 0.08 3.22 ± 0.91 0.38 ± 0.04 2.12 ± 0.26
Table 4. The total acid and base concentrations of the functional groups of thrombocytes and their association constants with H+ andOH− ions.
GroupsParameters
cA
[10−6 mol/m2]cB
[10−6 mol/m2]KAH
[102 m3/mol]KBOH
[107 m3/mol]
control 3.76 ± 0.81 1.21 ± 0.23 2.88 ± 1.58 2.11 ± 0.79
fatal ethyl alcohol poisoning 5.56 ± 0.33 0.17 ± 0.03 3.47 ± 0.65 5.21 ± 0.85
In this study, the cA, KAH, and KBOH values for an erythrocyte cell membrane wereaffected by ethyl alcohol and were smaller than the same parameters assayed in unmodifiedcells; only cB values were higher (approximately double, Table 3).
In the case of a thrombocyte cell membrane, the cA, KAH, and KBOH parameters wereaffected by ethyl alcohol and were higher than the same parameters assayed in unmodifiedcells. Only cB values were smaller, by about seven times (Table 4).
Alcohol intoxication causes changes in the amounts of both phospholipids and inte-gral proteins of erythrocyte membranes [17], resulting in the appearance of new negativelyand positively charged functional groups. Therefore, variations in the kind and number ofthese groups result in changes in the parameters describing equilibria in cell membranes:cA, cB, KAH, and KBOH. It is believed that other mechanisms can also influence the aboveparameters, such as the movement of molecules forming membranes between monolayers(the flip-flop phenomenon) or the appearance of receptor proteins or their componentson the surface of cell membranes, which, as a result of stopped life processes, no longerperceive signals from the external environment and remain in an inactive form. Scheidtand Huster [33] demonstrated that ethyl alcohol partitions the lipid–water interface ofthe phospholipid bilayer by forming hydrogen bonds with lipid molecules and, also, bythe hydrophobic effect. Rowe showed that at a higher ethanol concentration, a significantreduction (up to 30%) in phosphatidylcholine lipid membrane thickness is observed as ittransitions into the interdigitated phase [34]. In natural lipid membranes, ethanol-inducedmembrane perturbations may have many possible effects. A considerable reduction inmembrane thickness caused by lipid interdigitation would likely profoundly affect mem-brane protein function and conformation [35]. Membrane thickness changes can result inthe exposure of hydrophobic amino acid residuum in integral proteins of the membraneand an occurrence like a hydrophobic mismatch, leading to membrane protein aggrega-tion [36] and possibly producing a conformational change in the membrane protein [37].Zeng et al. [38] demonstrated that ethanol-induced fluidization and interdigitation of thelipid bilayer lead to an increase in the membrane’s ion permeability. Lee [39] examinedthe effects of ethanol exposure on human erythrocytes using quantitative phase imagingtechniques at the level of individual cells. The author demonstrated that erythrocytesexposed to ethanol (at concentrations of 0.1 and 0.3% v/v) exhibited cell sphericities higherthan those of normal cells. Bulle and co-workers [40] studied the association betweenerythrocyte membrane alterations and hemolysis in chronic alcoholics. They showed thatfrequent alcohol consumption increases oxidative/nitrosative stress. The result is a change
72
Membranes 2021, 11, 189
in the lipid composition of the erythrocyte membrane and the protein content, resultingfrom increased hemolysis.
There are no data on ethyl alcohol’s effect on blood platelets’ electrical propertiesin the literature. Slowed blood flow in ethyl alcohol poisoning promotes platelet acti-vation, leading to changes in the exposure of phospholipids (phosphatidylserine andphosphatidylethanolamine) in the clotting process to the surface of the cell membrane.Since phospholipids are endowed with an electric charge, we believe that their presence inthe membrane will result in changes in the surface charge density and, consequently, thedetermined parameters (cA, cB, KAH, and KBOH).
5. Conclusions
Based on numerous literature reports, it can be said that ethyl alcohol shows bio-physical effects on lipid membranes. In this paper, both experimental and theoreticaldata demonstrated that the electrical properties of blood cell membranes (erythrocytesand thrombocytes) are changed upon fatal alcohol poisoning. We observed changes in alldetermined parameters, cA, cB, KAH , and KBOH . Interactions among membrane compo-nents (lipids and proteins) and between these components and their surroundings lead tovariations in the number and kind of functional groups present, which results in changesin cA and cB and in the values of association constants. Also, sialic acid, a component ofglycoproteins and glycolipids, may influence all these parameters in fatal ethyl alcoholpoisoning. Understanding some of the physical and chemical processes occurring in thehuman body after death is essential in describing the pathophysiology of fatal ethyl alcoholpoisoning deaths. A quantitative description of the phenomena occurring on the blood cellmembrane surfaces and the obtained parameters characterizing the existing equilibria (cA,cB, KAH, and KBOH) may provide essential information for forensic medicine. We want toemphasize that our theoretical descriptions are innovative and the research carried out isquite preliminary. Still, because the obtained data may help solve many forensic medicineproblems, there is no doubt that there is a necessity for continuation of this research.
Author Contributions: Conceptualization, M.S. and A.D.P.; methodology, J.K. and A.D.P.; validation,M.S., J.K., and A.D.P.; formal analysis, J.K. and A.D.P.; writing—original draft preparation, M.S.,J.K., A.N.-J., A.D.P.; writing—review and editing, M.S., J.K., A.N.-J., and A.D.P.; visualization, M.S.and A.D.P.; supervision, A.D.P. All authors have read and agreed to the published version of themanuscript.
Funding: This research received no external funding.
Institutional Review Board Statement: The study was conducted according to the guidelines of theDeclaration of Helsinki, and approved by the The Ethics Review Board of the Medical University ofBialystok approved the conducted research (No. R-I-002/533/2010).
Informed Consent Statement: Not applicable.
Data Availability Statement: The data presented in this study are available on request from thecorresponding author.
Acknowledgments: The Zetasizer Nano ZS apparatus was funded by the European Funds for RegionalDevelopment and the National Funds of the Ministry of Science and Higher Education as part of theOperational Program Development of Eastern Poland 2007–2013 [POPW.01.03.00-20-044/11].
Conflicts of Interest: The authors declare no conflict of interest.
References1. Ballard, H.S. The hematological complications of alcoholism. Alcohol. Clin. Exp. Res. 1989, 13, 706–720. [CrossRef] [PubMed]2. Ballard, H.S. Alcohol, bone marrow, and blood. Alcohol. Health Res. World. 1993, 17, 310–315.3. Stouten, K.; Riedl, J.A.; Droogendijk, J.; Castel, R.; van Rosmalen, J.; van Houten, R.J.; Berendes, P.; Sonneveld, P.; Levin, M.D.
Prevalence of potential underlying aetiology of macrocytic anaemia in Dutch general practice. BMC Fam. Pr. 2016, 17, 113.[CrossRef]
73
Membranes 2021, 11, 189
4. Thoma, E.; Bitri, S.; Mucaj, K.; Tahiri, A.; Pano, I. Changes of Some Blood Count Variables in Correlation with the Time of AlcoholAbuse. J. Addict. Res. 2015, 6, 2. [CrossRef]
5. Marumo, M.; Wakabayashi, I. Sensitivity of thrombin-induced platelet aggregation to inhibition by ethanol. Clin. Chim. Acta 2009,402, 156–159. [CrossRef]
6. Ballard, H.S. Alcohol Abuse in Guide to Anemia, 2nd ed.; Garrison, C.D., Ed.; Cumberland House: Naperville, IL, USA, 2009; p. 165.7. De Pietri, L.; Bianchini, M.; Montalti, R.; De Maria, N.; Di Maira, T.; Begliomini, B.; Gerunda, G.E.; di Benedetto, F.; Garcia-Tsao, G.;
Villa, E. Thrombelastography-guided blood product use before invasive procedures in cirrhosis with severe coagulopathy: Arandomized, controlled trial. Hepatology 2016, 63, 566–573. [CrossRef] [PubMed]
8. Gurtovenko, A.A.; Anwar, J. Interaction of Ethanol with Biological Membranes: The Formation of Non-bilayer Structures withinthe Membrane Interior and their Significance. J. Phys. Chem. B 2009, 113, 1983–1992. [CrossRef]
9. Sonmez, M.; Ince, H.Y.; Yalcin, O.; Ajdžanovic, V.; Spasojevic, I.; Meiselman, H.J.; Baskurt, O.K. The effect of alcohols on red bloodcell mechanical properties and membrane fluidity depends on their molecular size. PLoS ONE 2013, 8, e76579. [CrossRef]
10. Dora, M.D.; Goldstein, B. Effect of alcohol on cellular membranes. Ann. Emerg. Med. 1986, 15, 1013–1018.11. Chin, J.H.; Goldstein, B.D. Effects of low concentrations of ethanol on the fluidity of spin-labeled erythrocyte and brain membranes.
Mol. Pharm. 1977, 13, 435–441.12. Wood, W.G.; Lahiri, S.; Gorka, C.; Armbrecht, H.J.; Strong, R. In vitro effects of ethanol on erythrocyte membrane fluidity of
alcoholic patients: An electron spin resonance study. Alcohol. Clin. Exp. Res. 1987, 11, 332–335. [CrossRef]13. Beaug, F.; Gallay, J.; Stibler, H.; Borg, S. Alcohol abuse increases the lipid structural order in human erythrocyte membranes: A
steady-state and time-resolved anisotropy study. Biochem. Pharmacol. 1988, 37, 3823–3828. [CrossRef]14. Stibler, H.; Beauge, F.; Leguicher, A.; Borg, S. Biophysical and biochemical alterations in erythrocyte membranes from chronic
alcoholics. Scand. J. Clin. Lab. Investig. 1991, 51, 309–319. [CrossRef]15. Hrelia, S.; Lercker, G.; Biagi, P.; Bordoni, A.; Stefanini, F.; Zunarelli, P.; Rossi, C.A. Effect of ethanol intake on human erythrocyte
membrane fluidity and lipid composition. Biochem. Int. 1986, 12, 741–750.16. Dobrzynska, I.; Szachowicz-Petelska, B.; Skrzydlewska, E.; Figaszewski, Z.A. Changes in electric charge and phospholipids
composition in erythrocyte membrane of ethanol-poisoned rats after administration of teas. Acta Pol. Pharm. 2004, 61, 483–487.[PubMed]
17. Szachowicz-Petelska, B.; Dobrzynska, I.; Skrzydlewska, E.; Figaszewski, Z. Influence of green tea on surface charge density andphospholipids composition of erythrocytes membrane in ethanol intoxicated rats. Cell Biol. Toxicol. 2005, 21, 61–70. [CrossRef]
18. Szachowicz-Petelska, B.; Dobrzynska, I.; Skrzydlewska, E.; Figaszewski, Z. Protective effect of blackcurrant on liver cell membraneof rats intoxicated with ethanol. J. Membr. Biol. 2012, 245, 191–200. [CrossRef] [PubMed]
19. Chachaj-Brekiesz, A.; Kobierski, J.; Wnetrzak, A.; Dynarowicz-Latka, P. Electrical Properties of Membrane Phospholipids inLangmuir Monolayers. Membranes 2021, 11, 53. [CrossRef]
20. Naumowicz, M.; Zajac, M.; Kusaczuk, M.; Gál, M.; Kotynska, J. Electrophoretic Light Scattering and Electrochemical ImpedanceSpectroscopy Studies of Lipid Bilayers Modified by Cinnamic Acid and Its Hydroxyl Derivatives. Membranes 2020, 10, 343.[CrossRef] [PubMed]
21. Dziubak, D.; Strzelak, K.; Sek, S. Electrochemical Properties of Lipid Membranes Self-Assembled from Bicelles. Membranes 2021,11, 11. [CrossRef]
22. Fernandes, H.P.; Cesar, C.L.; de Lourdes Barjas-Castro, M. Electrical properties of the red blood cell membrane and immunohe-matological investigation. Rev. Bras. Hematol. Hemoter. 2011, 33, 297–301. [CrossRef] [PubMed]
23. Liu, J.; Qiang, Y.; Alvarez, O.; Du, E. Electrical Impedance Characterization of Erythrocyte Response to Cyclic Hypoxia in SickleCell Disease. ACS Sens. 2019, 4, 1783–1790. [CrossRef] [PubMed]
24. Kotynska, J.; Petelska, A.D.; Szeremeta, M.; Niemcunowicz-Janica, A.; Figaszewski, Z.A. Changes in surface charge density ofblood cells after sudden unexpected death. J. Membr. Biol. 2012, 245, 185–190. [CrossRef]
25. Szeremeta, M.; Petelska, A.D.; Kotynska, J.; Niemcunowicz-Janica, A.; Figaszewski, Z.A. The effect of fatal carbon monoxidepoisoning on the surface charge of blood cells. J. Membr. Biol. 2013, 246, 717–722. [CrossRef] [PubMed]
26. Petelska, A.D.; Kotynska, J.; Figaszewski, Z.A. The effect of fatal carbon monoxide poisoning on the equilibria between cellmembranes and the electrolyte solution. J. Membr. Biol. 2015, 248, 157–161. [CrossRef] [PubMed]
27. Szeremeta, M.; Petelska, A.D.; Kotynska, J.; Pepinski, W.; Naumowicz, M.; Figaszewski, Z.A.; Niemcunowicz-Janica, A. Changesin surface charge density of blood cells in fatal accidental hypothermia. J. Membr. Biol. 2015, 248, 1175–1180. [CrossRef]
28. Petelska, A.D.; Kotynska, J.; Naumowicz, M.; Figaszewski, Z.A. Equilibria between cell membranes and electrolyte solution:Effect of fatal accidental hypothermia. J. Membr. Biol. 2016, 249, 375–380. [CrossRef] [PubMed]
29. Patra, M.; Salonen, E.; Terama, E.; Vattulainen, I.; Faller, R.; Lee, B.W.; Holopainen, J.; Karttunen, M. Under the Influence ofAlcohol: The Effect of Ethanol and Methanol on Lipid Bilayers. Biophys. J. 2006, 90, 1121–1135. [CrossRef]
30. Alexander, A.E.; Johnson, P. Colloid Science; Clarendon Press: Oxford, UK, 1949.31. Barrow, G.M. Physical Chemistry; McGraw-Hill Inc: New York, NY, USA, 1996.32. Dobrzynska, I.; Skrzydlewska, E.; Figaszewski, Z. Parameters characterizing acid-base equilibria between cell membrane and
solution and their application to monitoring the effect of various factors on the membrane. Bioelectrochemistry 2006, 69, 142–147.[CrossRef] [PubMed]
74
Membranes 2021, 11, 189
33. Scheidt, H.A.; Huster, D. The interaction of small molecules with phospholipid membranes studied by 1 H NOESY NMR undermagic-angle spinning. Acta Pharmacol. Sin. 2008, 29, 35–49. [CrossRef] [PubMed]
34. Rowe, E.S. Effects of ethanol on membrane lipids. In Alcohol and Neurobiology: Receptors, Membranes, and Channels, 1st ed.;Watson, R.R., Ed.; CRC Press: Boca Raton, FL, USA, 1992; pp. 239–268.
35. Henderson, C.M.; Block, D.E. Examining the Role of Membrane Lipid Composition in Determining the Ethanol Tolerance ofSaccharomyces cerevisiae. Appl. Environ. Microbiol. 2014, 80, 2966–2972. [CrossRef]
36. Lee, S.Y.; Park, H.J.; Best-Popescu, C.; Jang, S.; Park, Y.K. The Effects of Ethanol on the Morphological and Biochemical Propertiesof Individual Human Red Blood Cells. PLoS ONE 2015, 10, e0145327. [CrossRef] [PubMed]
37. Killian, J.A. Hydrophobic mismatch between proteins and lipids in membranes. Biochim. Biophys. Acta. 1998, 1376, 401–416.[CrossRef]
38. Zeng, J.; Smith, K.E.; Chong, P.L. Effects of alcohol-induced lipid interdigitation on proton permeability in L-α-dipalmitoylphosphatidylcholine vesicles. Biophys. J. 1993, 65, 1404–1414. [CrossRef]
39. Lee, A.G. How lipids affect the activities of integral membrane proteins. Biochim. Biophys. Acta 2004, 1666, 62–87. [CrossRef]40. Bulle, S.; Reddy, V.D.; Padmavathi, P.; Maturu, P.; Puvvada, P.K.; Nallanchakravarthula, V. Association between alcohol-induced
erythrocyte membrane alterations and hemolysis in chronic alcoholic. J. Clin. Biochem. Nutr. 2017, 60, 63–69. [CrossRef] [PubMed]
75

membranes
Article
Water Pores in Planar Lipid Bilayers at Fast and Slow Rise ofTransmembrane Voltage
Alenka Macek Lebar 1,*,† , Damijan Miklavcic 1 , Malgorzata Kotulska 2 , Peter Kramar 1,*,†
Citation: Macek Lebar, A.; Miklavcic,
D.; Kotulska, M.; Kramar, P. Water
Pores in Planar Lipid Bilayers at Fast
and Slow Rise of Transmembrane
Voltage. Membranes 2021, 11, 263.
https://doi.org/10.3390/
membranes11040263
Academic Editors: Francisco Monroy
and Monika Naumowicz
Received: 7 March 2021
Accepted: 29 March 2021
Published: 5 April 2021
Publisher’s Note: MDPI stays neutral
with regard to jurisdictional claims in
published maps and institutional affil-
iations.
Copyright: © 2021 by the authors.
Licensee MDPI, Basel, Switzerland.
This article is an open access article
distributed under the terms and
conditions of the Creative Commons
Attribution (CC BY) license (https://
creativecommons.org/licenses/by/
4.0/).
1 Faculty of Electrical Engineering, University of Ljubljana, 1000 Ljubljana, Slovenia;[email protected]
2 Department of Biomedical Engineering, Faculty of Fundamental Problems of Technology,Wroclaw University of Science and Technology, 50-370 Wrocław, Poland; [email protected]
* Correspondence: [email protected] (A.M.L.); [email protected] (P.K.);Tel.: +386-14768770 (A.M.L.); +386-14768290 (P.K.)
† These authors contributed equally to this work.
Abstract: Basic understanding of the barrier properties of biological membranes can be obtained bystudying model systems, such as planar lipid bilayers. Here, we study water pores in planar lipidbilayers in the presence of transmembrane voltage. Planar lipid bilayers were exposed to fast and slowlinearly increasing voltage and current signals. We measured the capacitance, breakdown voltage,and rupture time of planar lipid bilayers composed of 1-pamitoyl 2-oleoyl phosphatidylcholine(POPC), 1-pamitoyl 2-oleoyl phosphatidylserine (POPS), and a mixture of both lipids in a 1:1 ratio.Based on the measurements, we evaluated the change in the capacitance of the planar lipid bilayercorresponding to water pores, the radius of water pores at membrane rupture, and the fraction ofthe area of the planar lipid bilayer occupied by water pores. The estimated pore radii determiningthe rupture of the planar lipid bilayer upon fast build-up of transmembrane voltage are 0.101 nm,0.110 nm, and 0.106 nm for membranes composed of POPC, POPS, and POPC:POPS, respectively.The fraction of the surface occupied by water pores at the moment of rupture of the planar lipidbilayer is in the range of 0.1–1.8%.
Keywords: planar lipid bilayer; capacitance; voltage breakdown; water pores; hydrophobic pores
1. Introduction
Biological membranes, the barriers that envelope the cell and its inner organelles, playan important role in the physiology and functionality of cells. Although biological mem-branes are composed of lipids, proteins, and small amounts of carbohydrates, the barrierfunction is assured by the thin lipid bilayer. Basic understanding of barrier properties ofbiological membranes can be obtained by investigating model systems, such as artificialliposomes or vesicles, which mimic the geometry and size of the cell membrane but aredevoid of ion channels and the multitude of other embedded components, commonlypresent in the cell membrane. The simplest model of a cell membrane patch is a planarlipid bilayer. The chemical composition of the planar lipid bilayer can be chosen in ad-vance and is therefore well defined. However, to mimic a non-curved fragment of thecell membrane, the planar lipid bilayer should separate two electrolytes. Therefore, theplanar lipid bilayer is usually vertically formed across a small aperture in a hydrophobicpartition that separates two compartments filled with electrolytes [1]. Visual observationof the planar lipid bilayer in such an experimental system is limited. However, electrodesimmersed in the electrolyte permit measurements of electric parameters of the planar lipidbilayer. As a planar lipid bilayer can be electrically considered as a non-perfect capacitor,the capacitance C of an ideal capacitor and the resistance R of a resistor in parallel bothdescribe planar lipid bilayer’s characteristic [2,3]. Voltage-controlled and current-controlled
77
Membranes 2021, 11, 263
methods enable observing electrical properties of the planar lipid bilayer and its structuralchanges that are reflected in the electrical characteristics [4–7].
The capacitance C is the parameter considered as the best tool for probing the stabilityand proper formation of planar lipid bilayer and for this reason, it is measured for eachplanar lipid bilayer studied with electrical methods, even when other properties are in thefocus of investigation. For comparison between different studies, the measured value ofthe capacitance is normalized by the area of planar lipid bilayer to determine the specificcapacitance c [8].
An exposure of planar lipid bilayer to external electrical stimulus and formation oftransmembrane voltage alter both electrical parameters of planar lipid bilayer model, R andC. Molecular dynamics (MD) simulations have shown that small so-called water fingersare formed on both sides of the planar lipid bilayer in the presence of transmembranevoltage and create water or hydrophobic pores [9,10]. The lipids adjacent to the watermolecules inside the pores start reorienting their polar headgroups toward water moleculesand stabilizing the pores into hydrophilic state, which allows more water and ions toenter the pores. These conductive paths reduce R of the planar lipid bilayer. At lowtransmembrane voltages, when pores are not created yet, a capacitance increase can beobserved. An electrostrictive thinning of the planar lipid bilayer has been suggested as themechanism responsible for this phenomenon [11,12]. The capacitance of the planar lipidbilayer depends on applied voltage U according to the equation
C(U) = C0[1 + αU2], (1)
where C0 is the planar lipid bilayer capacitance at zero transmembrane voltage, and α isthe proportionality coefficient. Experiments revealed that its value is around 0.02 V−2 [11],while using numerical models it was assessed to be in the range of 0.053–0.082 V−2 [13].However, at higher transmembrane voltages, appearance of water and hydrophilic poresleads to reduction of the planar lipid bilayer capacitance, due to significant difference indielectric constant values of lipid bilayer and water [14,15]. A long-lasting exposure tostrong electric stimulus causes irreversible damage to a planar lipid bilayer. Electricalmeasurements permit determination of the breakdown voltage value Ubr.
Hydrophobic pores formed in planar lipid bilayer were first hypothesized decadesago in Abidor’s theory of electroporation [16] and as water pores successfully modeledby molecular dynamic simulation [17]. Since such water pores are very small transientstructures, they cannot be directly observed. As far as we know, the only study that associ-ated experimental data with the existence of hydrophobic pores in the planar lipid bilayerswere reported by Anosov et al. [18]. The experimentally observed increase in the varianceof membrane current, that was attributed to small current fluctuations due to membranecapacitance changes, was connected to the number of hydrophobic pores in the membraneduring the phase transition. Even experimental information about conducting hydrophilicpores and their characteristics comes only from indirect measurements, like current fluctu-ations measurements [19], voltage fluctuations measurements [20,21], or observing voltagedrops [22]. Recently, Akimov et al. [15,23] introduced an improved theory on the poreformation, which allows modeling continuous trajectories of pore formation, both in theabsence and presence of stress conditions. The theory nicely explains the complex behaviorof pores during their formation under lateral tension, even in various loading rates regimesthat were studied in giant unilamellar vesicles (GUV) aspiration experiments [24]. Namely,at low loading rates, GUV membrane ruptured at small tensions and, according to theory,membrane breakdown is governed by the pore expansion. On the other hand, at highloading rates, GUV membrane rupture occurs at high values of tensions and is theoreticallylimited by water pore formation, which is lipid type (curvature) dependent. Akimov’stheory predicts that the planar lipid bilayer, exposed to the electric field, behaves similarlyas in the presence of lateral tension.
To explore if different membrane rupture mechanisms can be predicted also fromexperiments in which transmembrane voltage is raised at various rates, we exposed pla-
78
Membranes 2021, 11, 263
nar lipid bilayers to linearly rising voltage or current signals of different slopes. Planarlipid bilayers were formed using two types of lipid molecules: 1-pamitoyl 2-oleoyl phos-phatidylcholine (POPC), lipid molecules with a zwitterionic head group and almost zerospontaneous curvature, negatively charged 1-pamitoyl 2-oleoyl phosphatidylserine (POPS)molecules with negative spontaneous curvature, as well as mixture of both lipid types in a1:1 ratio. For each planar lipid bilayer composition, C was measured using two differentmethods—discharge pulse [4,25] and voltage to period converter [26,27]. Changing ratesof transmembrane voltage rise and measuring Ubr and time at which planar lipid bilayerrupture occurs tbr, we evaluated changes in C that correspond to water pores, estimatedwater pore radius at the rupture moment, and calculated the fraction of planar lipid bilayerarea that is occupied by water pores.
2. Materials and Methods2.1. Chemicals
The lipids 1-pamitoyl 2-oleoyl phosphatidylcholine (POPC) and 1-pamitoyl 2-oleoylphosphatidylserine (POPS) were purchased in powder form (Avanti Polar-Lipids Inc.,Birmingham, AL, USA). A solution of 10 mg/mL of each lipid was prepared in a 9:1mixture of hexane and ethanol. A mixture of both lipids in a 1:1 ratio was prepared bypipetting the same amount of both lipid solutions in a small plastic tube and mixing byrepeated pipetting immediately before the experiments. The mixture of hexadecane andpentane in the ratio of 3:7 was used for torus formation. The electrolyte was prepared from0.1 M KCl and 0.01 M Hepes in the ratio of 1:1. A few drops of 1 M NaOH were added toobtain a pH of 7.4.
2.2. Experimental Setups
Planar lipid bilayers were formed by the Montal–Muller method [28] across a circularhole 117 µm in diameter (d). The hole was in a thin Teflon sheet sandwiched between tworeservoirs in the Teflon chamber. The glass window in the Teflon chamber allowed easyviewing of the hole during the formation of the planar lipid bilayer using stereo microscopewith led illumination. Both sides of the hole in the Teflon sheet were first treated with1 µL of the lipid solution. After the lipid solvent had completely evaporated, the hole wastreated on each side with 1.5 µL of the hexadecane and pentane mixture. Both reservoirswere filled with electrolyte just below the hole. A drop of 2 µL of the lipid solution wascarefully applied to the electrolyte surface in each reservoir and allowed to spread for atleast 15 min. To form a planar lipid bilayer, the electrolyte level in both reservoirs wasraised to the same height just above the hole (Figure 1A). After a planar lipid bilayer wasruptured, a new one was formed by lowering the electrolyte levels below the hole, and thenraising them again. All experiments were performed at room temperature (24 °C).
The voltage-controlled measurement system [29] consisted of a signal generator, twoAg-AgCl electrodes (E-205, IVM, Healdsburg, CA, USA) immersed in the electrolyte, oneon each side of the planar lipid bilayer, and amplifiers connected to an oscilloscope formeasuring transmembrane current and voltage. The electrodes were used to apply thetransmembrane voltage and measure the transmembrane current. The transmembranevoltage was measured using the LeCroy differential amplifier 1822 and custom made am-pere meter was used for transmembrane current measurements. Both signals were storedin Matlab format using LeCroy Waverunner-2 354M oscilloscope and analyzed afterwards.
The current-controlled experiments were performed using a potentiostat-galvanostatmeasurement system controlled by a computer as described in [20]. Four Ag-AgCl elec-trodes (E-205, IVM, Healdsburg, CA, USA) immersed in the electrolyte were used, two oneach side of the planar lipid bilayer. One pair of electrodes was used to apply current andthe other was used as a reference electrodes. The transmembrane voltage measurementswere stored on a computer in a raw file and later imported into Matlab for further analysis.
79
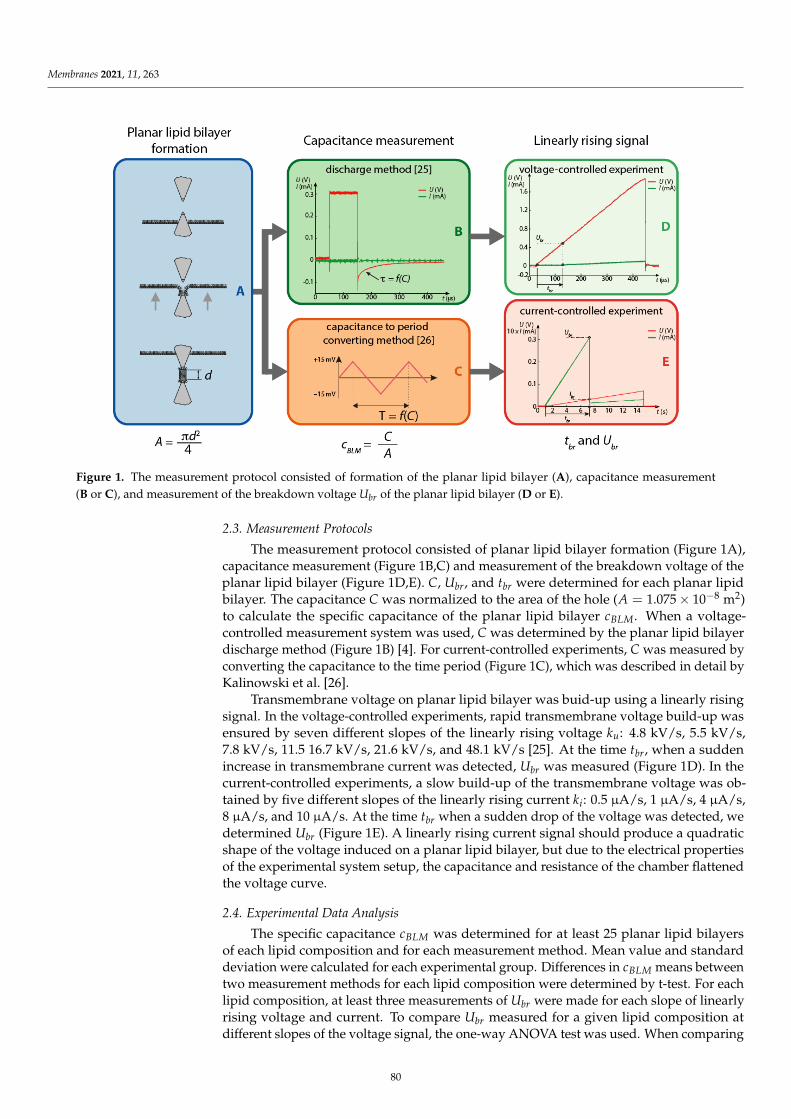
Membranes 2021, 11, 263
Figure 1. The measurement protocol consisted of formation of the planar lipid bilayer (A), capacitance measurement(B or C), and measurement of the breakdown voltage Ubr of the planar lipid bilayer (D or E).
2.3. Measurement Protocols
The measurement protocol consisted of planar lipid bilayer formation (Figure 1A),capacitance measurement (Figure 1B,C) and measurement of the breakdown voltage of theplanar lipid bilayer (Figure 1D,E). C, Ubr, and tbr were determined for each planar lipidbilayer. The capacitance C was normalized to the area of the hole (A = 1.075 × 10⁻⁸ m2)to calculate the specific capacitance of the planar lipid bilayer cBLM. When a voltage-controlled measurement system was used, C was determined by the planar lipid bilayerdischarge method (Figure 1B) [4]. For current-controlled experiments, C was measured byconverting the capacitance to the time period (Figure 1C), which was described in detail byKalinowski et al. [26].
Transmembrane voltage on planar lipid bilayer was buid-up using a linearly risingsignal. In the voltage-controlled experiments, rapid transmembrane voltage build-up wasensured by seven different slopes of the linearly rising voltage ku: 4.8 kV/s, 5.5 kV/s,7.8 kV/s, 11.5 16.7 kV/s, 21.6 kV/s, and 48.1 kV/s [25]. At the time tbr, when a suddenincrease in transmembrane current was detected, Ubr was measured (Figure 1D). In thecurrent-controlled experiments, a slow build-up of the transmembrane voltage was ob-tained by five different slopes of the linearly rising current ki: 0.5 µA/s, 1 µA/s, 4 µA/s,8 µA/s, and 10 µA/s. At the time tbr when a sudden drop of the voltage was detected, wedetermined Ubr (Figure 1E). A linearly rising current signal should produce a quadraticshape of the voltage induced on a planar lipid bilayer, but due to the electrical propertiesof the experimental system setup, the capacitance and resistance of the chamber flattenedthe voltage curve.
2.4. Experimental Data Analysis
The specific capacitance cBLM was determined for at least 25 planar lipid bilayersof each lipid composition and for each measurement method. Mean value and standarddeviation were calculated for each experimental group. Differences in cBLM means betweentwo measurement methods for each lipid composition were determined by t-test. For eachlipid composition, at least three measurements of Ubr were made for each slope of linearlyrising voltage and current. To compare Ubr measured for a given lipid composition atdifferent slopes of the voltage signal, the one-way ANOVA test was used. When comparing
80
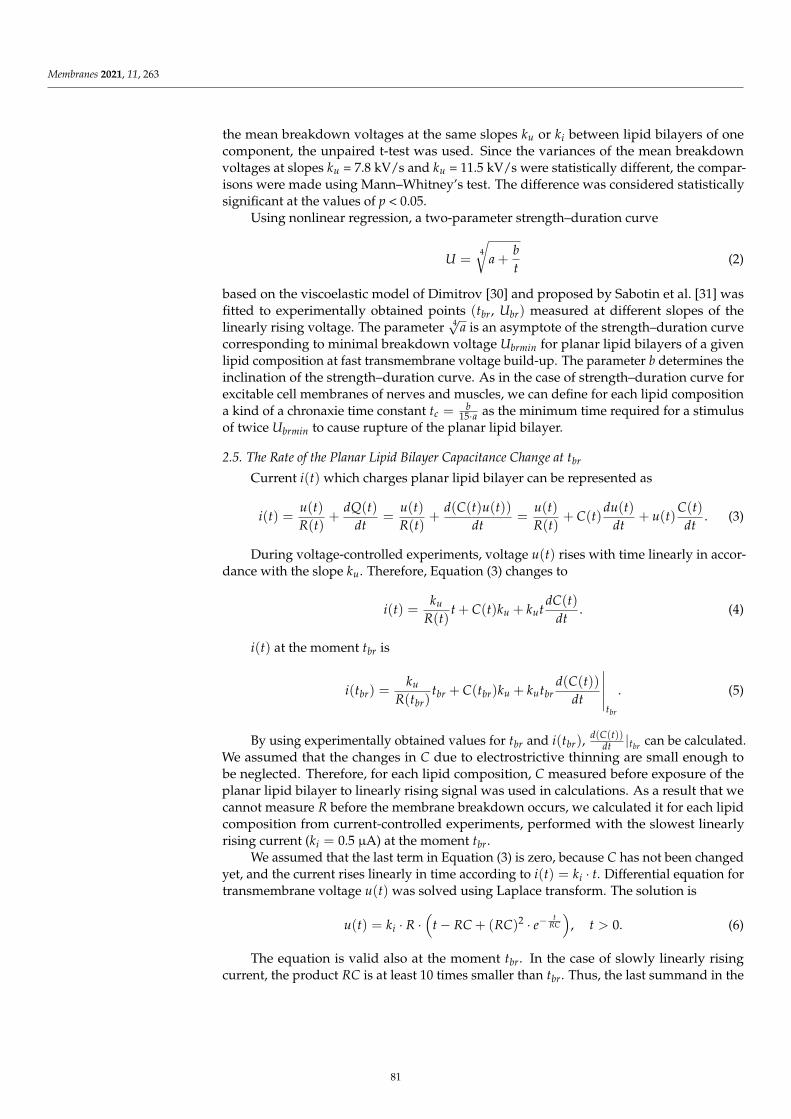
Membranes 2021, 11, 263
the mean breakdown voltages at the same slopes ku or ki between lipid bilayers of onecomponent, the unpaired t-test was used. Since the variances of the mean breakdownvoltages at slopes ku = 7.8 kV/s and ku = 11.5 kV/s were statistically different, the compar-isons were made using Mann–Whitney’s test. The difference was considered statisticallysignificant at the values of p < 0.05.
Using nonlinear regression, a two-parameter strength–duration curve
U =4
√
a +b
t(2)
based on the viscoelastic model of Dimitrov [30] and proposed by Sabotin et al. [31] wasfitted to experimentally obtained points (tbr, Ubr) measured at different slopes of thelinearly rising voltage. The parameter 4√a is an asymptote of the strength–duration curvecorresponding to minimal breakdown voltage Ubrmin for planar lipid bilayers of a givenlipid composition at fast transmembrane voltage build-up. The parameter b determines theinclination of the strength–duration curve. As in the case of strength–duration curve forexcitable cell membranes of nerves and muscles, we can define for each lipid compositiona kind of a chronaxie time constant tc =
b15·a as the minimum time required for a stimulus
of twice Ubrmin to cause rupture of the planar lipid bilayer.
2.5. The Rate of the Planar Lipid Bilayer Capacitance Change at tbr
Current i(t) which charges planar lipid bilayer can be represented as
i(t) =u(t)
R(t)+
dQ(t)
dt=
u(t)
R(t)+
d(C(t)u(t))
dt=
u(t)
R(t)+ C(t)
du(t)
dt+ u(t)
C(t)
dt. (3)
During voltage-controlled experiments, voltage u(t) rises with time linearly in accor-dance with the slope ku. Therefore, Equation (3) changes to
i(t) =ku
R(t)t + C(t)ku + kut
dC(t)
dt. (4)
i(t) at the moment tbr is
i(tbr) =ku
R(tbr)tbr + C(tbr)ku + kutbr
d(C(t))
dt
∣
∣
∣
∣
∣
tbr
. (5)
By using experimentally obtained values for tbr and i(tbr),d(C(t))
dt |tbrcan be calculated.
We assumed that the changes in C due to electrostrictive thinning are small enough tobe neglected. Therefore, for each lipid composition, C measured before exposure of theplanar lipid bilayer to linearly rising signal was used in calculations. As a result that wecannot measure R before the membrane breakdown occurs, we calculated it for each lipidcomposition from current-controlled experiments, performed with the slowest linearlyrising current (ki = 0.5 µA) at the moment tbr.
We assumed that the last term in Equation (3) is zero, because C has not been changedyet, and the current rises linearly in time according to i(t) = ki · t. Differential equation fortransmembrane voltage u(t) was solved using Laplace transform. The solution is
u(t) = ki · R ·(
t − RC + (RC)2 · e−t
RC
)
, t > 0. (6)
The equation is valid also at the moment tbr. In the case of slowly linearly risingcurrent, the product RC is at least 10 times smaller than tbr. Thus, the last summand in the
81
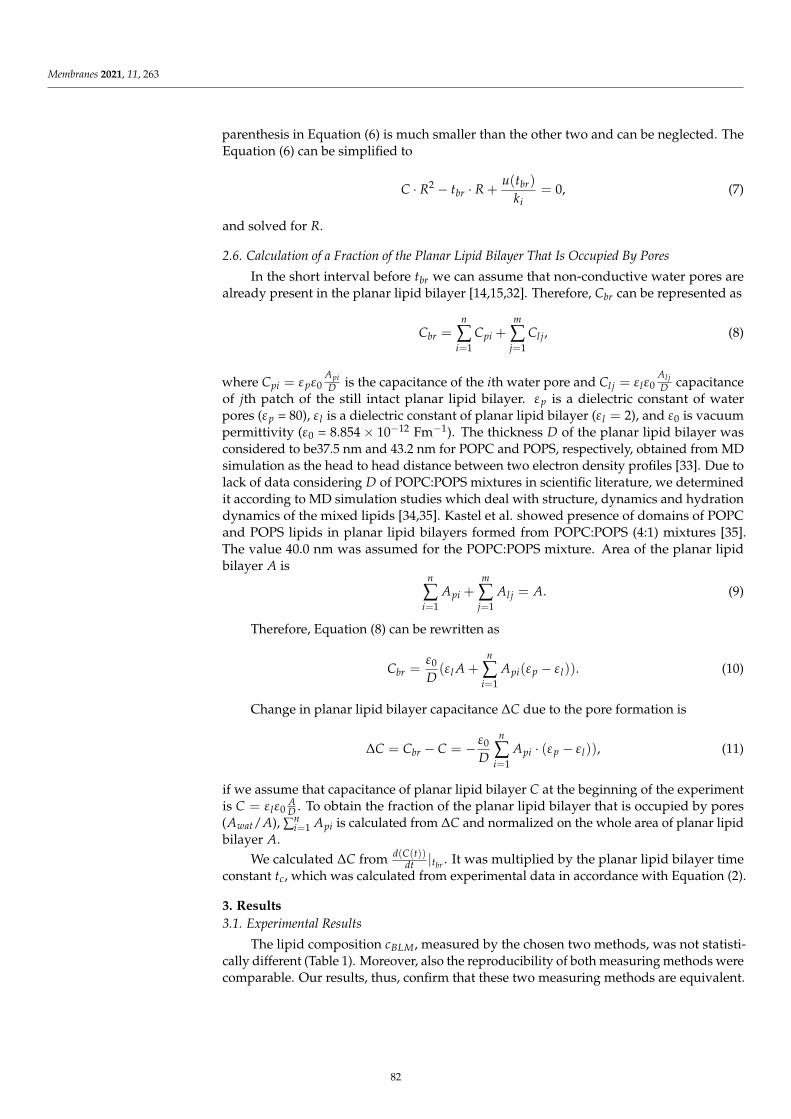
Membranes 2021, 11, 263
parenthesis in Equation (6) is much smaller than the other two and can be neglected. TheEquation (6) can be simplified to
C · R2 − tbr · R +u(tbr)
ki= 0, (7)
and solved for R.
2.6. Calculation of a Fraction of the Planar Lipid Bilayer That Is Occupied By Pores
In the short interval before tbr we can assume that non-conductive water pores arealready present in the planar lipid bilayer [14,15,32]. Therefore, Cbr can be represented as
Cbr =n
∑i=1
Cpi +m
∑j=1
Cl j, (8)
where Cpi = εpε0Api
D is the capacitance of the ith water pore and Cl j = ε lε0Al j
D capacitanceof jth patch of the still intact planar lipid bilayer. εp is a dielectric constant of waterpores (εp = 80), ε l is a dielectric constant of planar lipid bilayer (ε l = 2), and ε0 is vacuumpermittivity (ε0 = 8.854 × 10⁻¹² Fm−1). The thickness D of the planar lipid bilayer wasconsidered to be37.5 nm and 43.2 nm for POPC and POPS, respectively, obtained from MDsimulation as the head to head distance between two electron density profiles [33]. Due tolack of data considering D of POPC:POPS mixtures in scientific literature, we determinedit according to MD simulation studies which deal with structure, dynamics and hydrationdynamics of the mixed lipids [34,35]. Kastel et al. showed presence of domains of POPCand POPS lipids in planar lipid bilayers formed from POPC:POPS (4:1) mixtures [35].The value 40.0 nm was assumed for the POPC:POPS mixture. Area of the planar lipidbilayer A is
n
∑i=1
Api +m
∑j=1
Al j = A. (9)
Therefore, Equation (8) can be rewritten as
Cbr =ε0
D(ε l A +
n
∑i=1
Api(εp − ε l)). (10)
Change in planar lipid bilayer capacitance ∆C due to the pore formation is
∆C = Cbr − C = − ε0
D
n
∑i=1
Api · (εp − ε l)), (11)
if we assume that capacitance of planar lipid bilayer C at the beginning of the experimentis C = ε lε0
AD . To obtain the fraction of the planar lipid bilayer that is occupied by pores
(Awat/A), ∑ni=1 Api is calculated from ∆C and normalized on the whole area of planar lipid
bilayer A.We calculated ∆C from d(C(t))
dt |tbr. It was multiplied by the planar lipid bilayer time
constant tc, which was calculated from experimental data in accordance with Equation (2).
3. Results3.1. Experimental Results
The lipid composition cBLM, measured by the chosen two methods, was not statisti-cally different (Table 1). Moreover, also the reproducibility of both measuring methods werecomparable. Our results, thus, confirm that these two measuring methods are equivalent.
82
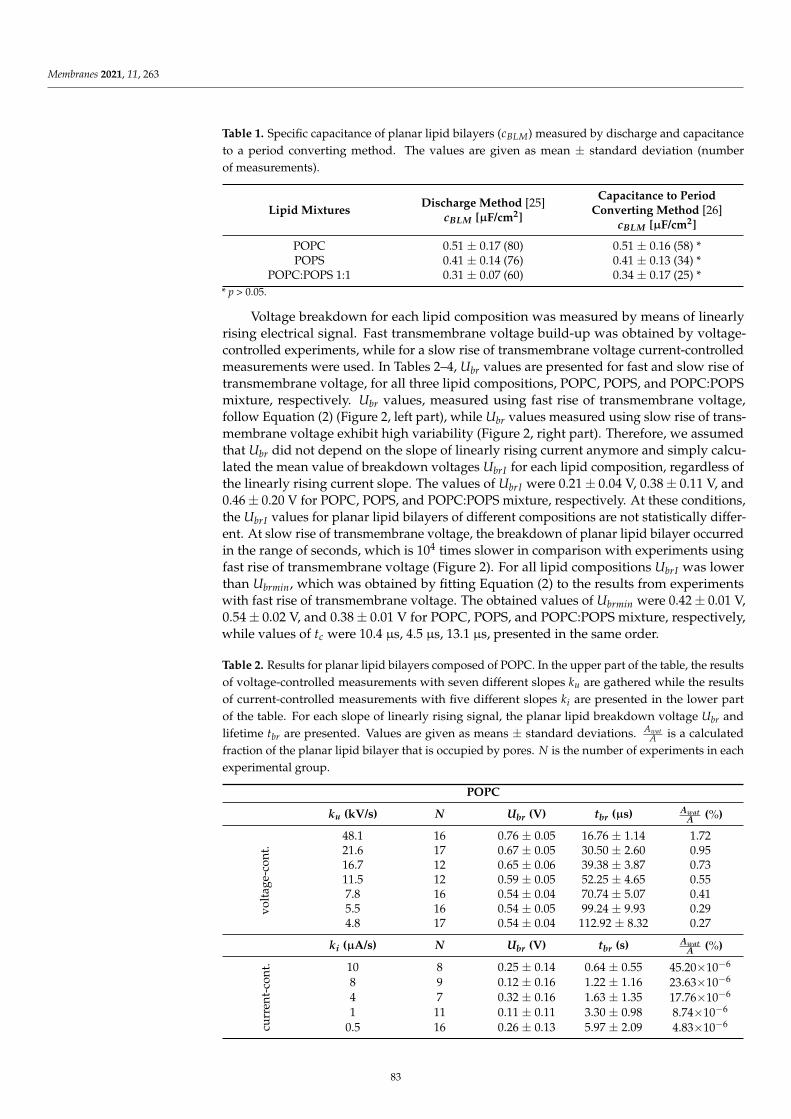
Membranes 2021, 11, 263
Table 1. Specific capacitance of planar lipid bilayers (cBLM) measured by discharge and capacitanceto a period converting method. The values are given as mean ± standard deviation (numberof measurements).
Lipid MixturesDischarge Method [25]
cBLM [µF/cm2]
Capacitance to PeriodConverting Method [26]
cBLM [µF/cm2]
POPC 0.51 ± 0.17 (80) 0.51 ± 0.16 (58) *POPS 0.41 ± 0.14 (76) 0.41 ± 0.13 (34) *
POPC:POPS 1:1 0.31 ± 0.07 (60) 0.34 ± 0.17 (25) ** p > 0.05.
Voltage breakdown for each lipid composition was measured by means of linearlyrising electrical signal. Fast transmembrane voltage build-up was obtained by voltage-controlled experiments, while for a slow rise of transmembrane voltage current-controlledmeasurements were used. In Tables 2–4, Ubr values are presented for fast and slow rise oftransmembrane voltage, for all three lipid compositions, POPC, POPS, and POPC:POPSmixture, respectively. Ubr values, measured using fast rise of transmembrane voltage,follow Equation (2) (Figure 2, left part), while Ubr values measured using slow rise of trans-membrane voltage exhibit high variability (Figure 2, right part). Therefore, we assumedthat Ubr did not depend on the slope of linearly rising current anymore and simply calcu-lated the mean value of breakdown voltages UbrI for each lipid composition, regardless ofthe linearly rising current slope. The values of UbrI were 0.21 ± 0.04 V, 0.38 ± 0.11 V, and0.46 ± 0.20 V for POPC, POPS, and POPC:POPS mixture, respectively. At these conditions,the UbrI values for planar lipid bilayers of different compositions are not statistically differ-ent. At slow rise of transmembrane voltage, the breakdown of planar lipid bilayer occurredin the range of seconds, which is 104 times slower in comparison with experiments usingfast rise of transmembrane voltage (Figure 2). For all lipid compositions UbrI was lowerthan Ubrmin, which was obtained by fitting Equation (2) to the results from experimentswith fast rise of transmembrane voltage. The obtained values of Ubrmin were 0.42 ± 0.01 V,0.54 ± 0.02 V, and 0.38 ± 0.01 V for POPC, POPS, and POPC:POPS mixture, respectively,while values of tc were 10.4 µs, 4.5 µs, 13.1 µs, presented in the same order.
Table 2. Results for planar lipid bilayers composed of POPC. In the upper part of the table, the resultsof voltage-controlled measurements with seven different slopes ku are gathered while the resultsof current-controlled measurements with five different slopes ki are presented in the lower partof the table. For each slope of linearly rising signal, the planar lipid breakdown voltage Ubr andlifetime tbr are presented. Values are given as means ± standard deviations. Awat
A is a calculatedfraction of the planar lipid bilayer that is occupied by pores. N is the number of experiments in eachexperimental group.
POPC
ku (kV/s) N Ubr (V) tbr (µs) AwatA (%)
volt
age-
cont
.
48.1 16 0.76 ± 0.05 16.76 ± 1.14 1.7221.6 17 0.67 ± 0.05 30.50 ± 2.60 0.9516.7 12 0.65 ± 0.06 39.38 ± 3.87 0.7311.5 12 0.59 ± 0.05 52.25 ± 4.65 0.557.8 16 0.54 ± 0.04 70.74 ± 5.07 0.415.5 16 0.54 ± 0.05 99.24 ± 9.93 0.294.8 17 0.54 ± 0.04 112.92 ± 8.32 0.27
ki (µA/s) N Ubr (V) tbr (s) AwatA (%)
curr
ent-
cont
. 10 8 0.25 ± 0.14 0.64 ± 0.55 45.20×10⁻⁶
8 9 0.12 ± 0.16 1.22 ± 1.16 23.63×10⁻⁶
4 7 0.32 ± 0.16 1.63 ± 1.35 17.76×10⁻⁶
1 11 0.11 ± 0.11 3.30 ± 0.98 8.74×10⁻⁶
0.5 16 0.26 ± 0.13 5.97 ± 2.09 4.83×10⁻⁶
83
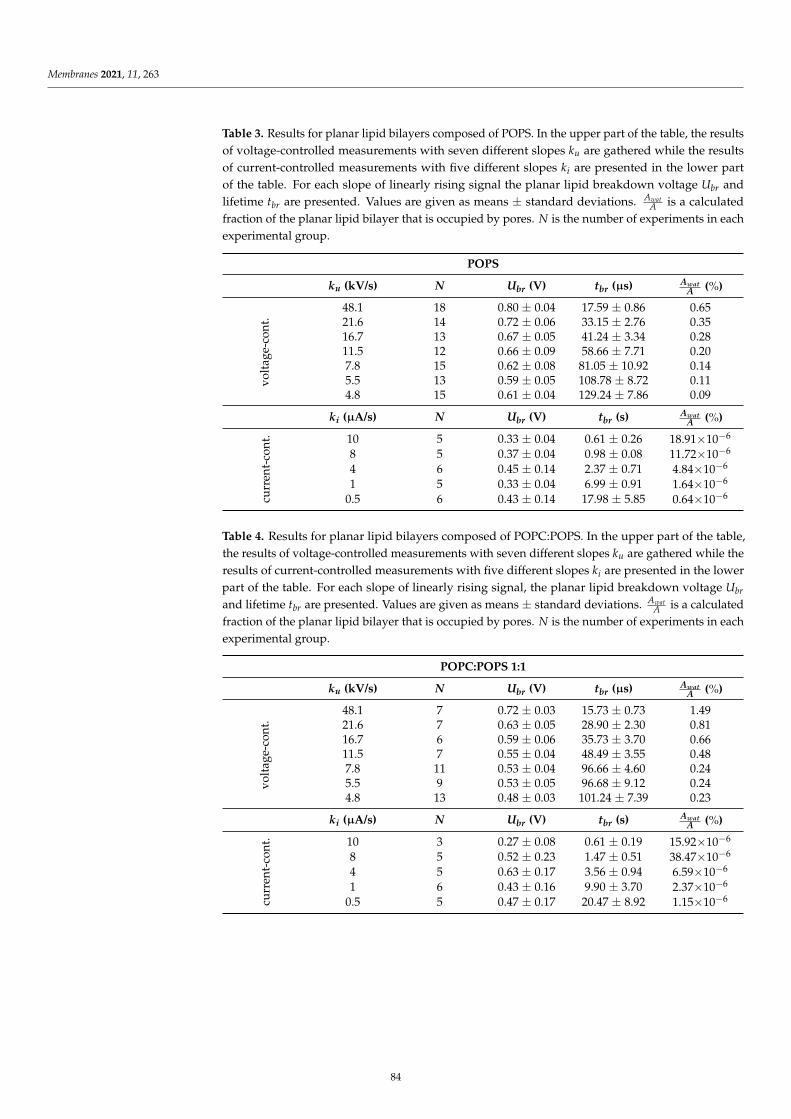
Membranes 2021, 11, 263
Table 3. Results for planar lipid bilayers composed of POPS. In the upper part of the table, the resultsof voltage-controlled measurements with seven different slopes ku are gathered while the resultsof current-controlled measurements with five different slopes ki are presented in the lower partof the table. For each slope of linearly rising signal the planar lipid breakdown voltage Ubr andlifetime tbr are presented. Values are given as means ± standard deviations. Awat
A is a calculatedfraction of the planar lipid bilayer that is occupied by pores. N is the number of experiments in eachexperimental group.
POPS
ku (kV/s) N Ubr (V) tbr (µs) AwatA (%)
volt
age-
cont
.
48.1 18 0.80 ± 0.04 17.59 ± 0.86 0.6521.6 14 0.72 ± 0.06 33.15 ± 2.76 0.3516.7 13 0.67 ± 0.05 41.24 ± 3.34 0.2811.5 12 0.66 ± 0.09 58.66 ± 7.71 0.207.8 15 0.62 ± 0.08 81.05 ± 10.92 0.145.5 13 0.59 ± 0.05 108.78 ± 8.72 0.114.8 15 0.61 ± 0.04 129.24 ± 7.86 0.09
ki (µA/s) N Ubr (V) tbr (s) AwatA (%)
curr
ent-
cont
. 10 5 0.33 ± 0.04 0.61 ± 0.26 18.91×10⁻⁶
8 5 0.37 ± 0.04 0.98 ± 0.08 11.72×10⁻⁶
4 6 0.45 ± 0.14 2.37 ± 0.71 4.84×10⁻⁶
1 5 0.33 ± 0.04 6.99 ± 0.91 1.64×10⁻⁶
0.5 6 0.43 ± 0.14 17.98 ± 5.85 0.64×10⁻⁶
Table 4. Results for planar lipid bilayers composed of POPC:POPS. In the upper part of the table,the results of voltage-controlled measurements with seven different slopes ku are gathered while theresults of current-controlled measurements with five different slopes ki are presented in the lowerpart of the table. For each slope of linearly rising signal, the planar lipid breakdown voltage Ubr
and lifetime tbr are presented. Values are given as means ± standard deviations. AwatA is a calculated
fraction of the planar lipid bilayer that is occupied by pores. N is the number of experiments in eachexperimental group.
POPC:POPS 1:1
ku (kV/s) N Ubr (V) tbr (µs) AwatA (%)
volt
age-
cont
.
48.1 7 0.72 ± 0.03 15.73 ± 0.73 1.4921.6 7 0.63 ± 0.05 28.90 ± 2.30 0.8116.7 6 0.59 ± 0.06 35.73 ± 3.70 0.6611.5 7 0.55 ± 0.04 48.49 ± 3.55 0.487.8 11 0.53 ± 0.04 96.66 ± 4.60 0.245.5 9 0.53 ± 0.05 96.68 ± 9.12 0.244.8 13 0.48 ± 0.03 101.24 ± 7.39 0.23
ki (µA/s) N Ubr (V) tbr (s) AwatA (%)
curr
ent-
cont
. 10 3 0.27 ± 0.08 0.61 ± 0.19 15.92×10⁻⁶
8 5 0.52 ± 0.23 1.47 ± 0.51 38.47×10⁻⁶
4 5 0.63 ± 0.17 3.56 ± 0.94 6.59×10⁻⁶
1 6 0.43 ± 0.16 9.90 ± 3.70 2.37×10⁻⁶
0.5 5 0.47 ± 0.17 20.47 ± 8.92 1.15×10⁻⁶
84
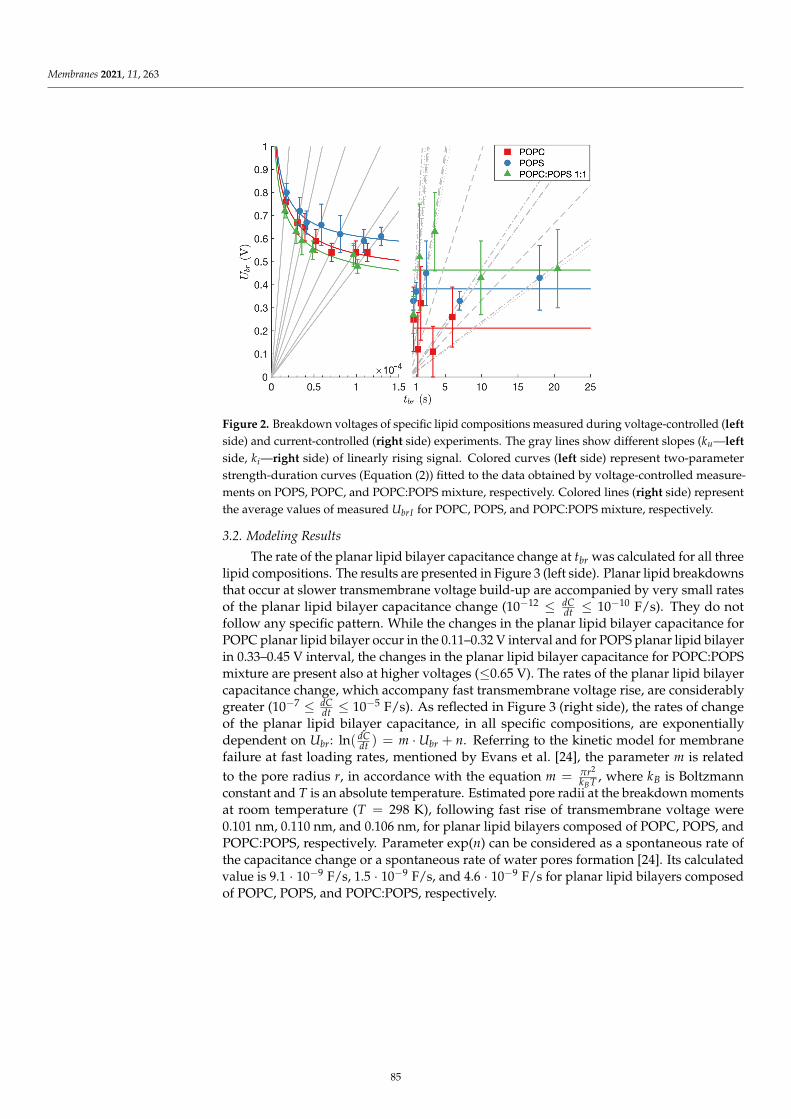
Membranes 2021, 11, 263
Figure 2. Breakdown voltages of specific lipid compositions measured during voltage-controlled (leftside) and current-controlled (right side) experiments. The gray lines show different slopes (ku—leftside, ki—right side) of linearly rising signal. Colored curves (left side) represent two-parameterstrength-duration curves (Equation (2)) fitted to the data obtained by voltage-controlled measure-ments on POPS, POPC, and POPC:POPS mixture, respectively. Colored lines (right side) representthe average values of measured UbrI for POPC, POPS, and POPC:POPS mixture, respectively.
3.2. Modeling Results
The rate of the planar lipid bilayer capacitance change at tbr was calculated for all threelipid compositions. The results are presented in Figure 3 (left side). Planar lipid breakdownsthat occur at slower transmembrane voltage build-up are accompanied by very small ratesof the planar lipid bilayer capacitance change (10−12 ≤ dC
dt ≤ 10−10 F/s). They do notfollow any specific pattern. While the changes in the planar lipid bilayer capacitance forPOPC planar lipid bilayer occur in the 0.11–0.32 V interval and for POPS planar lipid bilayerin 0.33–0.45 V interval, the changes in the planar lipid bilayer capacitance for POPC:POPSmixture are present also at higher voltages (≤0.65 V). The rates of the planar lipid bilayercapacitance change, which accompany fast transmembrane voltage rise, are considerablygreater (10−7 ≤ dC
dt ≤ 10−5 F/s). As reflected in Figure 3 (right side), the rates of changeof the planar lipid bilayer capacitance, in all specific compositions, are exponentiallydependent on Ubr: ln( dC
dt ) = m · Ubr + n. Referring to the kinetic model for membranefailure at fast loading rates, mentioned by Evans et al. [24], the parameter m is relatedto the pore radius r, in accordance with the equation m = πr2
kBT , where kB is Boltzmannconstant and T is an absolute temperature. Estimated pore radii at the breakdown momentsat room temperature (T = 298 K), following fast rise of transmembrane voltage were0.101 nm, 0.110 nm, and 0.106 nm, for planar lipid bilayers composed of POPC, POPS, andPOPC:POPS, respectively. Parameter exp(n) can be considered as a spontaneous rate ofthe capacitance change or a spontaneous rate of water pores formation [24]. Its calculatedvalue is 9.1 · 10−9 F/s, 1.5 · 10−9 F/s, and 4.6 · 10−9 F/s for planar lipid bilayers composedof POPC, POPS, and POPC:POPS, respectively.
85
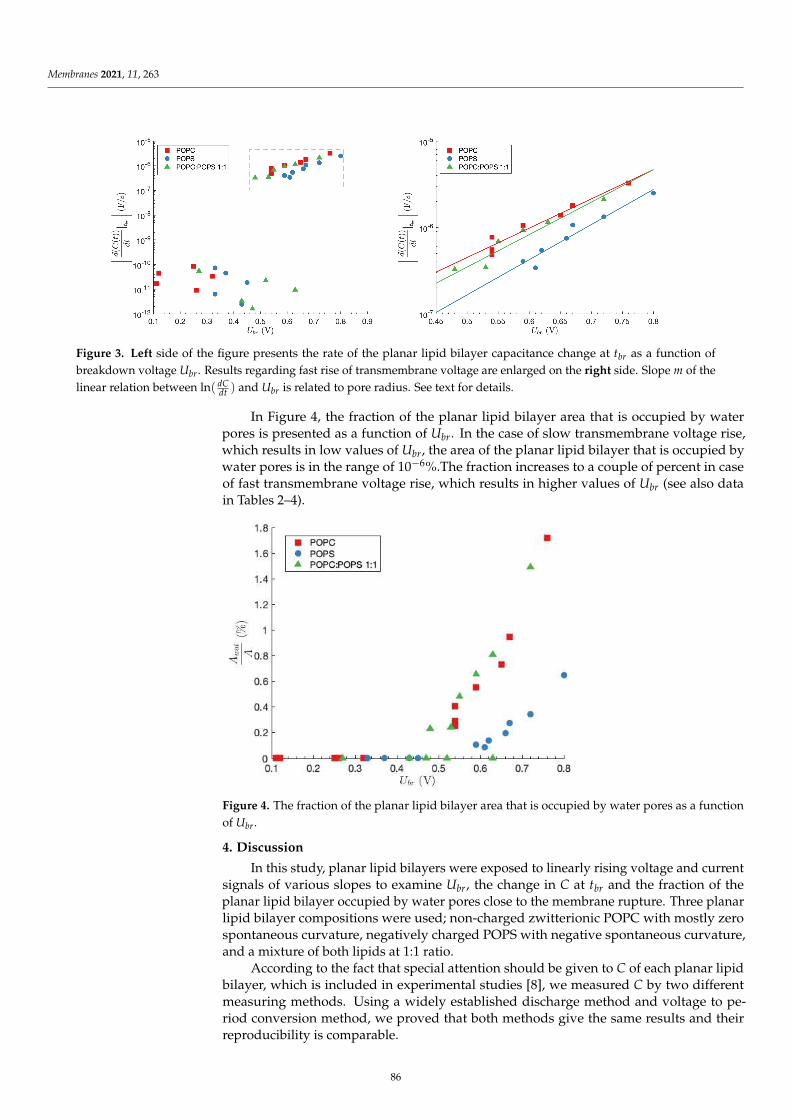
Membranes 2021, 11, 263
Figure 3. Left side of the figure presents the rate of the planar lipid bilayer capacitance change at tbr as a function ofbreakdown voltage Ubr. Results regarding fast rise of transmembrane voltage are enlarged on the right side. Slope m of thelinear relation between ln( dC
dt ) and Ubr is related to pore radius. See text for details.
In Figure 4, the fraction of the planar lipid bilayer area that is occupied by waterpores is presented as a function of Ubr. In the case of slow transmembrane voltage rise,which results in low values of Ubr, the area of the planar lipid bilayer that is occupied bywater pores is in the range of 10−6%.The fraction increases to a couple of percent in caseof fast transmembrane voltage rise, which results in higher values of Ubr (see also datain Tables 2–4).
Figure 4. The fraction of the planar lipid bilayer area that is occupied by water pores as a functionof Ubr.
4. Discussion
In this study, planar lipid bilayers were exposed to linearly rising voltage and currentsignals of various slopes to examine Ubr, the change in C at tbr and the fraction of theplanar lipid bilayer occupied by water pores close to the membrane rupture. Three planarlipid bilayer compositions were used; non-charged zwitterionic POPC with mostly zerospontaneous curvature, negatively charged POPS with negative spontaneous curvature,and a mixture of both lipids at 1:1 ratio.
According to the fact that special attention should be given to C of each planar lipidbilayer, which is included in experimental studies [8], we measured C by two differentmeasuring methods. Using a widely established discharge method and voltage to pe-riod conversion method, we proved that both methods give the same results and theirreproducibility is comparable.
86
Membranes 2021, 11, 263
We found that within the experimental error, the specific capacitance of the POPCplanar lipid bilayer was quite similar (Table 1) to that obtained for POPC bilayers reportedpreviously (cBLM ≈ 0.6 µF/cm2) [36–38], although much lower values (cBLM = 0.28 µF/cm2)have also been reported [39]. In addition, the specific capacitance measured for POPSplanar lipid bilayers was slightly lower than values reported in the literature for lipidsof similar type (cBLM = 0.624 µF/cm2) [40]. The measured specific capacitance for planarlipid bilayers formed from a POPC:POPS mixture was considerably lower than previouslyreported values (cBLM = 0.6 µF/cm2) [41]. For all three lipid compositions, we measuredlower values of the specific capacitance. The most likely due to the use of a small diameterhole (d = 117 µm), where the torus is not negligible and therefore the true planar lipid bilayerarea is smaller than the geometric area associated with the hole diameter. Micelli et al. [42]studied the capacitance dependence on the hole radius and gave a simple relation for thewidth of the torus evaluation. If we consider cBLM = 0.6 µF/cm2 as an appropriate valuefor the specific capacitance of POPC:POPS planar lipid bilayers, the width of the torus is16.3 µm, which is reasonable. We think that the width of the torus can be dependent alsoon the planar lipid bilayer composition due to lipid molecules packing differences.
From Ubr measurements presented in Figure 2, it is clear that Ubr depends on dynamicsof transmembrane voltage build-up. Application of slow slopes of linearly rising stimulus(ki ≤ 10 µA/s) caused high variability of Ubr. The mean values of Ubr for specific lipidcomposition, calculated from all measurements obtained by slow slopes of linearly risingstimulus, were not statistically different. It seems that at slow slopes of linearly risingstimulus, the planar lipid bilayer rupture process, which occurs in the range of seconds,is stochastic to a great extent. At constant voltage applied on the planar lipid bilayer,fluctuations of conductance spikes were noticed [19] and associated with defects in planarlipid bilayer that appear and vanish spontaneously. Similarly, we noticed small voltagedrops during constant or slowly linearly rising stimulus and reported about them in ourprevious studies [22,43,44]. Such conductive defects that appear and due to slowly risingstimulus are able also to vanish, locally discharge the planar lipid bilayer and can be thereason for the high variability of Ubr in slow slopes of linearly rising stimulus conditions.MD simulations support the occurrence of a hydrophilic pore in planar lipid bilayers madefrom POPC [22] while POPS planar lipid bilayers exhibited only hydrophobic pores [44].Although the appearance of a pore in POPS planar lipid bilayers was hydrophobic, ionswere driven through the pore and discharged the planar lipid bilayer. Full recovery of theplanar lipid bilayer in the case of hydrophilic pores is according to MD simulations tens oftimes longer as in the case of hydrophobic pores, whose lifetime is only a few nanoseconds.This is consistent with experimentally noticed voltage drops in POPS planar lipid bilayersbeing observed less frequently [44]. Similar observations were reported also on dropletinterface planar lipid bilayers, where a population of pores of various sizes were visualizedat constant voltage applied [45]. It was also reported that bilayer rupture takes place via asingle electropore which grows while other pores shrink and close [45]. The lowest valuesof Ubr were obtained for POPC planar lipid bilayers. In some cases of slowly increasingtransmembrane voltage, planar lipid bilayers ruptured at transmembrane voltages close to100 mV, which is in the range of the electric potential difference across a range of biologicalmembranes [46]. Biological membranes, however, are not homogeneous single-componentbilayers, but heterogeneous media with a complex organization of lipids and proteins.If we consider planar lipid bilayers of a POPC:POPS (1:1) mixture as a very simple modelof a multicomponent bilayer, the experimental results showed that Ubr is always higherthan 200 mV, which can be an approximation of the upper value of the resting potential ofbiological membranes [47].
Application of fast slopes of linearly rising stimulus (4.8 kV/s ≤ ku ≤ 48.1 kV/s)resulted in typical “strength-duration” behavior of Ubr. The steeper the slope of the linearlyrising stimulus, the higher the transmembrane voltage that is needed for planar lipidbilayer rupture. We fitted the strength–duration curve proposed by Dimitrov [30] to (tbr,Ubr) points measured for all three lipid compositions. The chosen strength–duration curve
87
Membranes 2021, 11, 263
considers the planar lipid bilayer as a thin viscoelastic film with fluctuating surfaces andwas originally used to predict the critical voltage and critical time needed to breakdownthe planar lipid bilayer at applied constant voltage. Planar lipid bilayers composed ofPOPS ruptured at higher voltages than planar lipid bilayers composed of POPC or thePOPC:POPS mixture. According to the study on POPS/POPC (1:20) vesicles [48] andaccording to the study on solid-supported membranes of POPC:POPS (4:1) [35], irregularlyshaped domains are formed in bilayers of POPC-POPS lipid mixtures. The formation ofanionic lipid domains is mediated by the presence of cations in the environment; experi-ments and MD have shown that Ca2+ ions force the formation of larger PS domains [49]and it is also known that monovalent ions are able to induce domain formation [50]. How-ever, charged lipids themselves also form segregated zones in membranes [51]. Moreover,the phase transition temperatures of PS lipids are always higher than those of its PCcounterparts with the same acyl chains (e.g., that of POPC is −2 °C and that of POPS is+14 °C [52]), so incomplete lateral mixing of POPC and POPS is expected.
Measurements based on 2H nuclear magnetic resonance [48,53] have shown that thelipid hydrocarbon chains in pure PC and PS membranes have different order parameters atroom temperatures. Namely, although both were in a lamellar liquid crystalline phase, PSwas more ordered than PC. This difference is also reflected in differences in the lipid–lipidinteraction at the lipid–water interface; namely, in the presence of an electric field, the in-corporation of water into the hydrophobic region of the planar lipid bilayer is significantlyenhanced in the disordered domains and almost unchanged in the ordered domains [54].From molecular dynamics simulation studies, two regions in bilayers consisting of differentdomains are suggested for pore formation in the presence of an electric field: lipid regionswith greater disorder [54,55] and thinned regions at domain boundaries [56]. According toReigada et al. [54], pores are formed in lipid regions with greater disorder, and the smallerthe disordered domains, the faster they are electroporated.. Our results are in line withthese observations. Indeed, Ubrmin were 0.42 ± 0.01 V and 0.54 ± 0.02 V for POPC andPOPS planar lipid bilayers, respectively, implying that pores form more easily in moredisordered POPC planar lipid bilayers. Moreover, for POPC planar lipid bilayers, the esti-mated spontaneous rate of water pore formation is six times higher than in the case of POPSplanar lipid bilayers. Ubrmin obtained for POPC:POPS mixture was even lower, 0.38 ± 0.01V, which is consitent with the fact that smaller disordered domains are more susceptiblefor pore formation. On the other hand, the formation of pores could also be expectedat the domain boundaries, where near the phase transition of single-component DPPCplanar lipid bilayer, pore formation induced by an external electric field was obtained inthinned regions at the liquid and gel-domain interfaces [56]. Although our experimentswere performed far from the transition temperature (at least 10 °C), thinner regions withreduced stability [57] can also be attributed to boundaries between disordered POPC andmore ordered POPS lipid domains.
The rate of capacitance change of the planar lipid bilayer can be related to the rateof water pores formation [14,16,18]. Ruptures of planar lipid bilayer that occur as aconsequence of a slow build-up of transmembrane voltage are accompanied by very smallrates of the capacitance change, which do not exhibit any specific pattern. However,the rates of capacitance change which appear at fast build-up of transmembrane voltageare exponentially dependent on Ubr. Similarly, Evans et al. [24] reported that the size andfrequency of initial defect formation of fluid membrane vesicles depend on the loadingrate of micro-pipette suction. Estimated radii of pores that govern ruptures of a planarlipid bilayer are 0.101 nm, 0.110 nm, and 0.106 nm for planar lipid bilayers composedof POPC, POPS, and POPC:POPS, respectively. The values are in the range of radii forhydrophobic pores predicted by Akimov’s model [15]. The model also predicts a slightlylarger radius of hydrophobic pores for planar lipid bilayers composed of lipids withnegative spontaneous curvature while compared with planar lipid bilayers composedof lipids with zero spontaneous curvature, which is in agreement with our experimentsand modeling.
88
Membranes 2021, 11, 263
Estimation of the area fraction that is occupied with water pores at the moment ofplanar lipid bilayer rupture reveals that the number of water pores is considerably lowerin the case of slow build-up of transmembrane voltage. It is probably due to the fact thatduring slow rise of the transmembrane voltage, conducting pores are already present inplanar lipid bilayer [19,45], which also changes the electrical resistance of planar lipidbilayer. It should be noted that this change was not taken into account in our calculations.Aqueous fractional area in the planar lipid bilayer due to an exponential pulse, bipolarsquare pulse, or a square pulse was theoretically evaluated by Freeman et al. in 1994 [14].According to their calculations, only 0.1% of the membrane is occupied by pores, whichis in good agreement with our results obtained for a fast build-up of transmembranevoltage. Moreover, recently, Anosov et al. [18] presented a computational model whichpredicts the number of hydrophobic pores in planar lipid bilayer using the variance of themembrane current. Their calculations showed that the area of hydrophobic pores at thephase transition (absence of a stimulus) does not exceed 4.5% of the planar lipid bilayerarea, which is also in agreement with our observations.
The area fraction that is occupied with water pores is similar in the case of planarlipid bilayers formed of POPC and POPC:POPS mixture, while POPS planar lipid bilayersexhibited lower values. Lipid molecules in POPS planar lipid bilayers are more orderedthan in POPC planar lipid bilayers [58] and according to MD simulations in POPS planarlipid bilayers mostly hydrophobic pores are formed where lifetime is only a few nanosec-onds [44], allowing quick planar lipid bilayer discharge. As a result that pores are harderto form in ordered planar lipid bilayer, also our results show a six times lower spontaneousrate of water pore formation in comparison with POPC lipids. Therefore, it is possiblethat the area fraction that is occupied with water pores at the moment of planar lipidbilayer rupture in POPS planar lipid bilayers is indeed noticeably smaller in comparisonwith POPC and POPC:POPS planar lipid bilayers. The area fraction occupied with waterpores at the moment of the planar lipid bilayers rupture is similar in the case of POPCand POPC:POPS planar lipid bilayers. Although it seems that in the planar lipid bilayersmade of POPC:POPS mixture, pores are predominantly formed in more disordered POPCdomains, additional experimental and theoretical studies are needed to confirm this guess.
Estimation of the radius of a water pore that governs planar lipid bilayer rupture andthe fraction of planar lipid bilayer area that is occupied by water pores at the momentof rupture is based on prediction that small water pores are present in the planar lipidbilayer. Therefore, the difference in the dielectric permittivity of planar lipid bilayer (ε = 2)and water (ε = 80) is the only reason for the change in capacitance. This assumption isa considerable simplification of all phenomena that are involved in water pore creationand existence. Close to the charged surface, for example, strong orientational water dipoleordering may result in a local decrease of permittivity [59,60]. The relative permittivityof the electrolyte solution decreases with the increasing magnitude of the electric fieldstrength. In narrow tubes, like in water pores, the water dipoles are partially oriented alsoclose to the axis of the tube, which decreases the relative water permittivity [61]. To obtainmore reliable results, at least orientational ordering of water molecules in pores and closeto the membrane should be taken into account.
5. Conclusions
Theories of pore formation and molecular dynamics simulations suggest recurrenthydrophobic pores or water pores whose occurrence is strongly dependent on the electricfield. Experimental information about them is very rare. In our study, planar lipid bilayersof POPC, POPS, and a POPC:POPS (1:1) mixture were exposed to different slopes oflinearly increasing voltage or current signal. Such experiments allowed to determine thebreakdown voltage of planar lipid bilayers, and taking into account that the membrane canbe represented by an RC circuit, the fraction of the planar lipid bilayer occupied by waterpores could be calculated. Our results confirm the results of pore formation theories andmolecular dynamics models. The fraction of area occupied by water pores at the moment
89
Membranes 2021, 11, 263
of planar lipid bilayer rupture is considerably lower when the transmembrane voltageis built up slower than in the case of a fast build-up of transmembrane voltage. In moredisordered planar lipid bilayers, water pores are easily formed, and the radii of the waterpores are smaller in this case than in more ordered planar lipid bilayers. In the case of lipidmixtures, water pores are formed even more easily, probably due to smaller disordereddomains in the planar lipid bilayer or/and weaker regions at the domain boundaries.
Author Contributions: Conceptualization, P.K. and A.M.L.; methodology, P.K. and A.M.L.; valida-tion, P.K. and A.M.L.; formal analysis, P.K. and A.M.L.; investigation, P.K. and A.M.L.; data curation,P.K. and A.M.L.; writing—original draft preparation, P.K., A.M.L., M.K., and D.M.; visualization,P.K.; supervision, P.K. and A.M.L.; funding acquisition, D.M. and M.K. All authors have read andagreed to the published version of the manuscript.
Funding: This research was supported by Slovenian Research Agency (ARRS) research core fundingNo. P2-0249. The part of experimental work was performed in the scope of Polish-Slovenian ScientificCooperation: Electroporation of cells in a current-controlled mode funded by Ministry of Science andHigher Education (MNiSW), Poland and Slovenian Research Agency (ARRS), Slovenia.
Institutional Review Board Statement: Not applicable.
Informed Consent Statement: Not applicable.
Data Availability Statement: All data presented are available in this article.
Conflicts of Interest: The authors declare no conflict of interest.
AbbreviationsThe following abbreviations are used in this manuscript:
POPC 1-pamitoyl 2-oleoyl phosphatidylcholinePOPS 1-pamitoyl 2-oleoyl phosphatidylserineMD Molecular dynamics simulationGUV Giant unilamellar vesicles
References1. Siontorou, C.; Nikoleli, G.P.; Nikolelis, D.; Karapetis, S. Artificial Lipid Membranes: Past, Present, and Future. Membranes 2017,
7, 38. [CrossRef] [PubMed]2. Brosseau, C.; Sabri, E. Resistor–capacitor modeling of the cell membrane: A multiphysics analysis. J. Appl. Phys. 2021, 129, 011101.
[CrossRef]3. Naumowicz, M.; Figaszewski, Z.A. Pore Formation in Lipid Bilayer Membranes made of Phosphatidylcholine and Cholesterol
Followed by Means of Constant Current. Cell Biochem. Biophys. 2013, 66, 109–119. [CrossRef] [PubMed]4. Kramar, P.; Miklavcic, D.; Kotulska, M.; Lebar, A. Voltage- and Current-Clamp Methods for Determination of Planar Lipid Bilayer
Properties; Elsevier Inc.: Amsterdam, The Netherlands, 2010; Volume 11. [CrossRef]5. Naumowicz, M.; Kotynska, J.; Petelska, A.; Figaszewski, Z. Impedance analysis of phosphatidylcholine membranes modified
with valinomycin. Eur. Biophys. J. 2006, 35, 239–246. [CrossRef]6. Shlyonsky, V.; Dupuis, F.; Gall, D. The OpenPicoAmp: An Open-Source Planar Lipid Bilayer Amplifier for Hands-On Learning of
Neuroscience. PLoS ONE 2014, 9, e108097. [CrossRef]7. Mosgaard, L.D.; Zecchi, K.A.; Heimburg, T.; Budvytyte, R. The effect of the nonlinearity of the response of lipid membranes
to voltage perturbations on the interpretation of their electrical properties. A new theoretical description. Membranes 2015,5, 495–512. [CrossRef]
8. Pavlin, M.; Kotnik, T.; Miklavcic, D.; Kramar, P.; Macek Lebar, A. Chapter Seven Electroporation of Planar Lipid Bilayers andMembranes. Adv. Planar Lipid Bilayers Liposomes 2008, 6, 165–226. [CrossRef]
9. Kotnik, T.; Rems, L.; Tarek, M.; Miklavcic, D. Membrane Electroporation and Electropermeabilization: Mechanisms and Models.Annu. Rev. Biophys. 2019, 48, 63–91. [CrossRef]
10. Hu, Y.; Sinha, S.K.; Patel, S. Investigating Hydrophilic Pores in Model Lipid Bilayers Using Molecular Simulations: CorrelatingBilayer Properties with Pore-Formation Thermodynamics. Langmuir 2015, 31, 6615–6631. [CrossRef]
11. Alvarez, O.; Latorre, R. Voltage-dependent capacitance in lipid bilayers made from monolayers. Biophys. J. 1978, 21, 1–17.[CrossRef]
12. Heimburg, T. The capacitance and electromechanical coupling of lipid membranes close to transitions: The effect of electrostriction.Biophys. J. 2012, 103, 918–929. [CrossRef]
90
Membranes 2021, 11, 263
13. Sabri, E.; Lasquellec, S.; Brosseau, C. Electromechanical modeling of the transmembrane potential-dependent cell membranecapacitance. Appl. Phys. Lett. 2020, 117, 043701. [CrossRef]
14. Freeman, S.A.; Wang, M.A.; Weaver, J.C. Theory of electroporation of planar bilayer membranes: Predictions of the aqueous area,change in capacitance, and pore-pore separation. Biophys. J. 1994, 67, 42–56. [CrossRef]
15. Akimov, S.A.; Volynsky, P.E.; Galimzyanov, T.R.; Kuzmin, P.I.; Pavlov, K.V.; Batishchev, O.V. Pore formation in lipid membrane II:Energy landscape under external stress. Sci. Rep. 2017, 7, 12509. [CrossRef]
16. Abidor, I.G.; Arakelyan, V.B.; Chernomordik, L.V.; Chizmadzhev, Y.A.; Pastushenko, V.F.; Tarasevich, M.P. Electric breakdown ofbilayer lipid membranes. I. The main experimental facts and their qualitative discussion. J. Electroanal. Chem. 1979, 104, 37–52.[CrossRef]
17. Tieleman, D.P.; Leontiadou, H.; Mark, A.E.; Marrink, S.J. Simulation of Pore Formation in Lipid Bilayers by Mechanical Stressand Electric Fields. J. Am. Chem. Soc. 2003, 125, 6382–6383. [CrossRef]
18. Anosov, A.A.; Smirnova, E.Y.; Sharakshane, A.A.; Nikolayeva, E.A.; Zhdankina, Y.S. Increase in the current variance in bilayerlipid membranes near phase transition as a result of the occurrence of hydrophobic defects. Biochim. Biophys. Acta Biomembr.
2020, 1862, 183147. [CrossRef]19. Melikov, K.C.; Frolov, V.A.; Shcherbakov, A.; Samsonov, A.V.; Chizmadzhev, Y.A.; Chernomordik, L.V. Voltage-Induced
Nonconductive Pre-Pores and Metastable Single Pores in Unmodified Planar Lipid Bilayer. Biophys. J. 2001, 80, 1829–1836.[CrossRef]
20. Kalinowski, S.; Ibron, G.; Bryl, K.; Figaszewski, Z. Chronopotentiometric studies of electroporation of bilayer lipid membranes.Biochim. Biophys. Acta Biomembr. 1998, 1369, 204–212. [CrossRef]
21. Kotulska, M. Natural fluctuations of an electropore show fractional Lévy stable motion. Biophys. J. 2007, 92, 2412–2421. [CrossRef]22. Kramar, P.; Delemotte, L.; Lebar, A.M.; Kotulska, M.; Tarek, M.; Miklavcic, D. Molecular-level characterization of lipid membrane
electroporation using linearly rising current. J. Membr. Biol. 2012, 245, 651–659. [CrossRef] [PubMed]23. Akimov, S.A.; Volynsky, P.E.; Galimzyanov, T.R.; Kuzmin, P.I.; Pavlov, K.V.; Batishchev, O.V. Pore formation in lipid membrane
I: Continuous reversible trajectory from intact bilayer through hydrophobic defect to transversal pore. Sci. Rep. 2017, 7, 1–20.[CrossRef] [PubMed]
24. Evans, E.; Heinrich, V.; Ludwig, F.; Rawicz, W. Dynamic tension spectroscopy and strength of biomembranes. Biophys. J. 2003,85, 2342–2350. [CrossRef]
25. Kramar, P.; Miklavcic, D.; Lebar, A.M. Determination of the lipid bilayer breakdown voltage by means of linear rising signal.Bioelectrochemistry 2007, 70, 23–27. [CrossRef] [PubMed]
26. Kalinowski, S.; Figaszewski, Z. A four-electrode system for measurement of bilayer lipid membrane capacitance. Meas. Sci.
Technol. 1995, 6, 1043–1049. [CrossRef]27. Kalinowski, S.; Figaszewski, Z. A four-electrode potentiostat-galvanostat for studies of bilayer lipid membranes. Meas. Sci.
Technol. 1995, 6, 1050–1055. [CrossRef]28. Montal, M.; Mueller, P. Formation of Bimolecular Membranes from Lipid Monolayers and a Study of Their Electrical Properties.
Proc. Natl. Acad. Sci. USA 1972, 69, 3561–3566. [CrossRef]29. Kramar, P.; Miklavcic, D.; Lebar, A.M. A system for the determination of planar lipid bilayer breakdown voltage and its
applications. IEEE Trans. Nanobiosci. 2009, 8, 132–138. [CrossRef]30. Dimitrov, D.S. Electric field-induced breakdown of lipid bilayers and cell membranes: A thin viscoelastic film model. J. Membr.
Biol. 1984, 78, 53–60. [CrossRef]31. Sabotin, I.; Lebar, A.; Miklavcic, D.; Kramar, P. Measurement protocol for planar lipid bilayer viscoelastic properties. IEEE Trans.
Dielectr. Electr. Insul. 2009, 16, 1236–1242. [CrossRef]32. Levine, Z.A.; Vernier, P.T. Life cycle of an electropore: Field-dependent and field-independent steps in pore creation and
annihilation. J. Membr. Biol. 2010, 236, 27–36. [CrossRef]33. Shahane, G.; Ding, W.; Palaiokostas, M.; Orsi, M. Physical properties of model biological lipid bilayers: Insights from all-atom
molecular dynamics simulations. J. Mol. Model. 2019, 25, 1–13. [CrossRef]34. Jurkiewicz, P.; Cwiklik, L.; Vojtíšková, A.; Jungwirth, P.; Hof, M. Structure, dynamics, and hydration of POPC/POPS bilayers
suspended in NaCl, KCl, and CsCl solutions. Biochim. Biophys. Acta Biomembr. 2012, 1818, 609–616. [CrossRef]35. Kastl, K.; Menke, M.; Lüthgens, E.; Faiß, S.; Gerke, V.; Janshoff, A.; Steinem, C. Partially reversible adsorption of annexin A1
on POPC/POPS bilayers investigated by QCM measurements, SFM, and DMC simulations. ChemBioChem 2006, 7, 106–115.[CrossRef]
36. Troiano, G.C.; Tung, L.; Sharma, V.; Stebe, K.J. The reduction in electroporation voltages by the addition of a surfactant to planarlipid bilayers. Biophys. J. 1998, 75, 880–888. [CrossRef]
37. Naumowicz, M.; Petelska, A.D.; Figaszewski, Z.A. Physicochemical analysis of phosphatidylcholine-ceramide system in bilayerlipid membranes. Acta Biochim. Pol. 2008, 55, 721–730._3033. [CrossRef]
38. Cannon, B.; Hermansson, M.; Györke, S.; Somerharju, P.; Virtanen, J.A.; Cheng, K.H. Regulation of calcium channel activity bylipid domain formation in planar lipid bilayers. Biophys. J. 2003, 85, 933–942. [CrossRef]
39. Meleleo, D. Study of Resveratrol’s Interaction with Planar Lipid Models: Insights into Its Location in Lipid Bilayers. Membranes
2021, 11, 132. [CrossRef]
91
Membranes 2021, 11, 263
40. Naumowicz, M.; Figaszewski, Z.A. Impedance Spectroscopic Investigation of the Bilayer Lipid Membranes Formed from thePhosphatidylserine–Ceramide Mixture. J. Membr. Biol. 2009, 227, 67–75. [CrossRef]
41. Naumowicz, M.; Figaszewski, Z.A. The effect of pH on the electrical capacitance of phosphatidylcholine-phosphatidylserinesystem in bilayer lipid membrane. J. Membr. Biol. 2014, 247, 361–369. [CrossRef]
42. Micelli, S.; Gallucci, E.; Meleleo, D.; Stipani, V.; Picciarelli, V. Mitochondrial porin incorporation into black lipid membranes:Ionic and gating contribution to the total current. Bioelectrochemistry 2002, 57, 97–106. [CrossRef]
43. Kotulska, M.; Basalyga, J.; Derylo, M.B.; Sadowski, P. Metastable pores at the onset of constant-current electroporation. J. Membr.
Biol. 2010, 236, 37–41. [CrossRef]44. Dehez, F.; Delemotte, L.; Kramar, P.; Miklavcic, D.; Tarek, M. Evidence of conducting hydrophobic nanopores across membranes
in response to an electric field. J. Phys. Chem. C 2014, 118, 6752–6757. [CrossRef]45. Sengel, J.T.; Wallace, M.I. Imaging the dynamics of individual electropores. Proc. Natl. Acad. Sci. USA 2016, 113, 5281–5286.
[CrossRef]46. What Is the Electric Potential Difference Across Membranes? Available online: http://book.bionumbers.org/what-is-the-electric-
potential-difference-across-membranes/ (accessed on 27 March 2021)47. Kinoshita, N.; Unemoto, T.; Kobayashi, H. Proton motive force is not obligatory for growth of Escherichia coli. J. Bacteriol. 1984,
160, 1074–1077. [CrossRef]48. Justice, M.J.; Petrusca, D.N.; Rogozea, A.L.; Williams, J.A.; Schweitzer, K.S.; Petrache, I.; Wassall, S.R.; Petrache, H.I. Effects of
Lipid Interactions on Model Vesicle Engulfment by Alveolar Macrophages. Biophys. J. 2014, 106, 598–609. [CrossRef]49. Sahoo, A.; Matysiak, S. Microscopic Picture of Calcium-Assisted Lipid Demixing and Membrane Remodeling Using Multiscale
Simulations. J. Phys. Chem. B 2020, 124, 7327–7335. [CrossRef] [PubMed]50. Ganesan, S.J.; Xu, H.; Matysiak, S. Influence of Monovalent Cation Size on Nanodomain Formation in Anionic–Zwitterionic
Mixed Bilayers. J. Phys. Chem. B 2017, 121, 787–799. [CrossRef] [PubMed]51. Bobone, S.; Hilsch, M.; Storm, J.; Dunsing, V.; Herrmann, A.; Chiantia, S. Phosphatidylserine Lateral Organization Influences the
Interaction of Influenza Virus Matrix Protein 1 with Lipid Membranes. J. Virol. 2017, 91, 1–15. [CrossRef] [PubMed]52. Phase Transition Temperatures for Glycerophospholipids. Available online: https://avantilipids.com/tech-support/physical-
properties/phase-transition-temps (accessed on 27 March 2021).53. Huster, D.; Arnold, K.; Gawrisch, K. Influence of docosahexaenoic acid and cholesterol on lateral lipid organization in
phospholipid mixtures. Biochemistry 1998, 37, 17299–17308. [CrossRef]54. Reigada, R. Electroporation of heterogeneous lipid membranes. Biochim. Biophys. Acta Biomembr. 2014, 1838, 814–821. [CrossRef]55. López Martí, J.M.; English, N.J.; Del Pópolo, M.G. Elucidating mysteries of phase-segregated membranes: Mobile-lipid
recruitment facilitates pores’ passage to the fluid phase. Phys. Chem. Chem. Phys. 2018, 20, 19234–19239. [CrossRef]56. Kirsch, S.A.; Böckmann, R.A. Coupling of Membrane Nanodomain Formation and Enhanced Electroporation near Phase
Transition. Biophys. J. 2019, 116, 2131–2148. [CrossRef]57. Cordeiro, R.M. Molecular Structure and Permeability at the Interface between Phase-Separated Membrane Domains. J. Phys.
Chem. B 2018, 122, 6954–6965. [CrossRef]58. Engberg, O.; Yasuda, T.; Hautala, V.; Matsumori, N.; Nyholm, T.K.; Murata, M.; Slotte, J.P. Lipid Interactions and Organization in
Complex Bilayer Membranes. Biophys. J. 2016, 110, 1563–1573. [CrossRef]59. Lebar, A.M.; Velikonja, A.; Kramar, P.; Iglic, A. Internal configuration and electric potential in planar negatively charged lipid
head group region in contact with ionic solution. Bioelectrochemistry 2016, 111, 49–56. [CrossRef]60. Iglic, A.; Gongadze, E.; Kralj-Iglic, V. Differential capacitance of electric double layer – Influence of asymmetric size of ions,
thickness of stern layer and orientational ordering of water dipoles. Acta Chim. Slov. 2019, 66, 534–541. [CrossRef]61. Drab, M.; Gongadze, E.; Kralj-Iglic, V.; Iglic, A. Electric double layer and orientational ordering of water dipoles in narrow
channels within a modified Langevin Poisson-Boltzmann model. Entropy 2020, 22, 1054. [CrossRef]
92
membranes
Article
Dielectric Properties of Phosphatidylcholine Membranes andthe Effect of Sugars
Victoria Vitkova 1,*, Vesela Yordanova 2, Galya Staneva 2 , Ognyan Petkov 1, Angelina Stoyanova-Ivanova 1,Krassimira Antonova 1 and Georgi Popkirov 3
Citation: Vitkova, V.; Yordanova, V.;
Staneva, G.; Petkov, O.; Stoyanova-
Ivanova, A.; Antonova, K.; Popkirov,
G. Dielectric Properties of
Phosphatidylcholine Membranes and
the Effect of Sugars. Membranes 2021,
11, 847. https://doi.org/10.3390/
membranes11110847
Academic Editor: Monika
Naumowicz
Received: 30 September 2021
Accepted: 27 October 2021
Published: 30 October 2021
Publisher’s Note: MDPI stays neutral
with regard to jurisdictional claims in
published maps and institutional affil-
iations.
Copyright: © 2021 by the authors.
Licensee MDPI, Basel, Switzerland.
This article is an open access article
distributed under the terms and
conditions of the Creative Commons
Attribution (CC BY) license (https://
creativecommons.org/licenses/by/
4.0/).
1 Georgi Nadjakov Institute of Solid State Physics, Bulgarian Academy of Sciences, 72 Tsarigradsko Chaussee,Blvd., 1784 Sofia, Bulgaria; [email protected] (O.P.); [email protected] (A.S.-I.);[email protected] (K.A.)
2 Institute of Biophysics and Biomedical Engineering, Bulgarian Academy of Sciences, Acad. G. Bonchev Str.,Bl. 21, 1113 Sofia, Bulgaria; [email protected] (V.Y.); [email protected] (G.S.)
3 Central Laboratory of Solar Energy and New Energy Sources, Bulgarian Academy of Sciences,72 Tsarigradsko Chaussee, Blvd., 1784 Sofia, Bulgaria; [email protected]
* Correspondence: [email protected]
Abstract: Simple carbohydrates are associated with the enhanced risk of cardiovascular disease andadverse changes in lipoproteins in the organism. Conversely, sugars are known to exert a stabilizingeffect on biological membranes, and this effect is widely exploited in medicine and industry forcryopreservation of tissues and materials. In view of elucidating molecular mechanisms involved inthe interaction of mono- and disaccharides with biomimetic lipid systems, we study the alterationof dielectric properties, the degree of hydration, and the rotational order parameter and dipolepotential of lipid bilayers in the presence of sugars. Frequency-dependent deformation of cell-sizeunilamellar lipid vesicles in alternating electric fields and fast Fourier transform electrochemicalimpedance spectroscopy are applied to measure the specific capacitance of phosphatidylcholinelipid bilayers in sucrose, glucose and fructose aqueous solutions. Alteration of membrane specificcapacitance is reported in sucrose solutions, while preservation of membrane dielectric propertiesis established in the presence of glucose and fructose. We address the effect of sugars on thehydration and the rotational order parameter for 1-palmitoyl-2-oleoyl-sn-glycero-3- phosphocholine(POPC) and 1-stearoyl-2-oleoyl-sn-glycero-3- phosphocholine (SOPC). An increased degree of lipidpacking is reported in sucrose solutions. The obtained results provide evidence that some smallcarbohydrates are able to change membrane dielectric properties, structure, and order related tomembrane homeostasis. The reported data are also relevant to future developments based on theresponse of lipid bilayers to external physical stimuli such as electric fields and temperature changes.
Keywords: lipid bilayers; sucrose; capacitance; relative permittivity; dipole potential; membrane structure
1. Introduction
The biological significance of carbohydrate molecules and developments of theirbiomedical and industrial applications have stimulated intensive research toward gainingknowledge of the alteration of membrane physicochemical properties by the presenceof sugars. The protection of higher plant cells from the consequences of prolonged de-hydration with the help of oligo- and polysaccharides represents a prominent exampleof the stabilizing effect exerted by sugars on biological membranes [1–3]. Simple carbo-hydrates represent one of the major protecting excipients in preservation of cells duringfreeze-drying [4]. The cryoprotective efficiency of sugars is related to the molecular mecha-nisms of their interaction with lipid membranes. It has been established that even underconditions of tight lipid packing, polysaccharides are able to sustain the liquid-crystallinelamellar phase of phospholipids by penetrating between the lipid headgroups [5], which
93
Membranes 2021, 11, 847
is coherent with their strong drought-protective role in cellular membranes [1]. Sim-ple carbohydrates (mono- and disaccharides) are also found to exert a protective roleagainst abnormal temperatures and dehydration in biomembranes and synthetic lipidbilayers [6]. Some disaccharides such as trehalose and sucrose are identified as efficientcryoprotectants counteracting the water deficiency via replacement of water moleculesat the membrane surface [1,7,8]. Large decrease of the lateral phospholipid mobility bysucrose has been evidenced by fluorescence correlation spectroscopy measurements andmolecular dynamic simulations [7]. The strong influence of simple carbohydrates and oligo-and polysaccharides on the tension of lipid monolayers has also been reported [8]. Dataacquired for mechanical properties of bilayer lipid stacks [9,10] and free-standing lipidmembranes [11–13] in the presence of mono- and disaccharides outline a more complexpicture on sugar–membrane interactions.
The detailed characterization of the electrical properties of biological membranescontributes to the understanding of the governing mechanisms involved in cellular pro-cesses such as transmission of electrical impulses or synaptic activity. Research in thisdirection is relevant to numerous electroporation-based applications in drug delivery, elec-trochemotherapy, cell–cell hybridization, food processing, etc. [14]. The lipid bimolecularmatrix represents the main structural entity of cell membranes. Since it is impermeable toions, the lipid bilayer behaves as a capacitor, strongly influencing the electric field distribu-tion in the cell. The quantification of the lipid bilayer capacitance and the estimation ofits dependence on external factors allows for evaluating the charging time of membranesand membrane–field interactions, including transmembrane potential difference [15]. Thealteration of the bilayer electrical capacitance in sucrose-containing solutions reportedrecently [16] emerged various questions regarding the effect on membrane electrical prop-erties of dissolving simple carbohydrates in the aqueous surroundings.
Considering the close relation of the specific capacitance to membrane composition,its structure and physical state [17], we probe here the susceptibility of this importantelectrical parameter of lipid bilayers to the presence of sugar molecules in the aqueoussurroundings. The effect of glucose, fructose and sucrose on the degree of hydrationand rotational order parameter of lipid molecules is measured with regard to expectedalterations of membrane dielectric permittivity [16,18–20]. The specific capacitance offree-standing membranes is measured by frequency-dependent electrodeformation of giantunilamellar lipid vesicles (GUVs) and Fast-Fourier transform electrochemical impedancespectrometry (FFT-EIS) of planar bilayer lipid membranes (BLMs) for acquisition of theimpedance spectrum (1 Hz–50 kHz) in a couple of seconds. The simplest physical modelof biological membranes is the lipid bilayer [21]. Characterized by diameters in the samerange as the typical cell sizes (5–100 µm), GUVs are considered as a basic physical modelof biomembranes allowing for investigation of membrane-related phenomena at the scaleof single vesicles [22,23]. The elaborated experimental protocols for preparation of GUVsoffer a good control of membrane composition and the physicochemical parameters of theaqueous environment. Membrane dipole potential, the degree of hydration and rotationalorder parameter of lipid molecules are studied in sugar-containing aqueous solutions byfluorescence spectroscopy of large unilamellar vesicles (LUVs), which are characterized byorders of magnitude smaller diameters (~100 nm) compared to GUVs. In addition to theapplication for modeling biomembranes, lipid vesicles are also recognized for their usageas drug and gene carriers [24], which foregrounds the investigation of their membranephysical properties and stability.
Here, we study the alteration of dielectric properties, the degree of hydration, therotational order parameter and dipole potential of lipid bilayers in the presence of sim-ple carbohydrates. For the first time, the effect of glucose and fructose is probed on theimpedance characteristics of biomimetic lipid membranes. The reported results provideknowledge of sugar–membrane interactions in relation to the bilayer molecular organi-zation, electrical capacitance, resistance and dielectric permittivity. The acquired newdata about the alteration of the dielectric properties and molecular organization of lipid
94
Membranes 2021, 11, 847
bilayers in sugar solutions are expected to facilitate the selection of the best carbohydrateto meet requirements of applications related to the response of lipid bilayers to externalelectric fields.
2. Materials and Methods2.1. Materials
Synthetic monounsaturated phospholipids 1-palmitoyl-2-oleoyl-sn-glycero- 3-phosphocholine(16:0-18:1 PC, POPC) and 1-stearoyl-2-oleoyl-sn-glycero- 3-phosphocholine (18:0-18:1 PC,SOPC) purchased from Avanti Polar Lipids Inc. (Alabaster, AL, USA) in powder, are usedto produce model bilayer systems as described further. Molecular probes for fluorescencespectroscopy measurements, namely 6-dodecanoyl-N, N-dimethyl-2-naphthylamine (Lau-rdan), 1,6-diphenyl-1,3,5-hexatriene (DPH) and 4-(2-[6-(Dioctylamino)-2-naphthalenyl]ethenyl)-1-(3-sulfopropyl)pyridinium inner salt (di-8-ANEPPS) are purchased from Sigma-Aldrich (Darmstadt, Germany). The same provider supplied chloroform and methanol forlipid solutions, sodium chloride for aqueous solutions as well as D-(+)-Glucose (C6H12O6,BioXtra, ≥99.5%, GC), D-(−)-Fructose (C6H12O6, BioUltra, ≥99.0%, HPLC) and sucrose(C12H22O11, BioXtra, ≥99.5%, GC). Pentane CH3(CH2)3CH3 and hexane CH3(CH2)4CH3of HPLC grade are purchased from Honeywell, Riedel-de Haën (Seelze, Germany). Poly-dimethylsiloxane (PDMS) is provided by Dow Corning (Midland, MI, USA). All substancesused for the preparation of bilayer membranes and vesicle suspensions are utilized aspurchased. Aqueous solutions are prepared with bidistilled water from a quartz distiller.
2.2. Methods
2.2.1. Preparation of Giant Unilamellar Vesicles
Electroformation method is applied to produce giant unilamellar vesicles (GUVs) formeasurements of membrane electrical capacitance. The electroformation cell consists oftwo indium tin oxide (ITO)-coated glass plates, serving as electrodes, which are separatedby a PDMS spacer [25]. A small amount (~50 µg) of POPC or SOPC with lipid concen-tration of 1 g/L in chloroform-methanol solvent (9:1 volume parts) is uniformly spreadon the ITO-coated side of each glass plate. After the complete evaporation of the organicsolvents achieved under vacuum, the electroformation chamber is filled with 1 mmol/LNaCl aqueous solution, which is sugar-free (control) or contains up to 300 mmol/L ofglucose, fructose or sucrose. AC electric field with 10 Hz frequency and peak-to-peakvoltage amplitude successively increased to 4 V is applied to the chamber. A high yield ofquasispherical unilamellar vesicles with diameters of dozens of micrometers is obtained inseveral (~3) hours. The conductivities of the aqueous solutions are measured with Cyber-scan PC510 (Eutech Instruments, Singapore). Prior to electrodeformation measurementsof GUVs, we add 0.1 mmol/L of sodium chloride to the suspension in order to increasethe conductivity of the external solution in accordance with the requirements of the GUVelectrodeformation method (see Section 2.2.5).
2.2.2. Preparation of Large Unilamellar Vesicles
Fluorescence spectroscopy of 6-Dodecanoyl-N,N-dimethyl-2-naphthylamine (Laur-dan), 1,6-diphenyl-1,3,5-hexatriene (DPH) and Di-8-ANEPPS is performed on large unil-amellar vesicles (LUVs). LUVs are formed by means of the extrusion method as describedin [26]. The lipid and the indicated fluorescent probe are dissolved and mixed in chloro-form/methanol (1:1 v/v). Laurdan or DPH are mixed with the lipids in the initial organicsolution at 1:200 probe:lipid molar ratio. The fluorescent probe di-8-ANEPPS in ethanolat 1 mg/mL stock solution concentration, is mixed with the lipids in the initial organicsolution at 1:250 probe-to-lipid molar ratio. Afterward, the solvent is removed under astream of oxygen-free dry nitrogen. The residues are subsequently maintained undervacuum overnight, and then filtered (0.2 µm) sugar solution is added at room temperature(22 C) to yield a lipid concentration of 1 mM. The samples are heated at 60C for 5 min,vortexed for 1 min, then left in a sonication bath for 1 min, and finally cooled in ice for
95
Membranes 2021, 11, 847
5 min. This heating/cooling procedure is repeated three times to ensure the sample ho-mogenization. The multilamellar vesicles obtained at this stage are then extruded with aLiposoFast small-volume extruder equipped with polycarbonate filters (Avestin, Ottawa,Canada) as follows: 11 extrusions through 800 nm, followed by 21 extrusions through 100nm filters. The final lipid concentration in cuvette is 200 µmol/L. LUV samples are studiedthe same day after equilibration for 20 min at room temperature (22 C). Each sample ismeasured 10 times after gentle pipetting and averaged by three different LUV preparations.
2.2.3. Preparation of Bilayer Lipid Membranes
Bilayer lipid membranes (BLMs) are prepared after Montal and Mueller [27,28] inBC-20A chamber (Eastern Scientific LLC, Rockville, MD, USA), consisting of two similarTeflon blocks, each one with volume 2 mL, designed to hold 0.025 mm thin Teflon filmin between. Solvent-free membrane patch is generated across a hole in the Teflon filmwith diameter 100 µm following the procedure described in [27]. The first step consists inpre-painting each side of the hole with ~1 µL of 1 wt% hexadecane in pentane and allowingthe solvent to evaporate for ~5 min. The next step consists in pipetting in each compartment0.5 mL of the aqueous solution containing 1 mM NaCl for the control sample or 1 mM ofNaCl and 200 mM of glucose, fructose or sucrose. Thereafter, 15 µL of freshly preparedmembrane-forming lipid solution is spread on top of the buffer in both compartments inorder to ensure the presence of several lipid layers on the air-water interphase. The gentleaddition of 1.5 mL of the corresponding aqueous solution consequently in each part ofthe cuvette leads to the generation of POPC bilayer on the aperture of the Teflon partitionbetween the two compartments [28]. The final control of membrane formation and qualityis performed electrically [27]. EIS-FTT measurement is effectuated immediately afterward.
2.2.4. Fluorescence Spectroscopy of Laurdan-, DPH- and Di-8-ANEPPS-Labeled LUVs
The lipid structural order parameter of the bilayer in the fatty acid core and at theglycerol level are probed by fluorescence spectroscopy of DPH [29] and Laurdan [30],respectively. The excitation wavelength for Laurdan is 355 nm. In disordered lipid sur-roundings, its emission maximum with intensity I490 is centered at 490 nm. In more orderedlipid environment, the maximum of Laurdan emission is shifted at 440 nm with intensityI440. The lipid packing is quantified by the parameter GP representing Laurdan generalizedpolarization accordingly [30]:
GP =I440 − I490
I440 + I490(1)
It theoretically assumes values from −1, corresponding to disordered membrane upto 1 for most ordered molecules. We record three times all emission spectra from 390 to600 nm, then average, and subtract background. For every studied LUV suspension, theemission spectrum of Laurdan is obtained and GP values are calculated in the temperaturerange (20 − 60) °C.
We apply 1,6-diphenyl-1,3,5-hexatriene (DPH) fluorescence spectroscopy [31] to assessmembrane fluidity as a function of sugar concentration in LUV samples. DPH representsa hydrocarbonic probe, which is nearly non-fluorescent in water. Contrastingly, in lipidmembranes, it exhibits strong fluorescence. In our experiment, the excitation is adjusted to358 nm. We record the emission at 430 nm. The fluorescence polarization is measured asdescribed in [32]. The DPH fluorescence anisotropy rDPH , quantifying membrane fluidityis expressed by the intensities I of the polarized components of the fluorophore emission:
rDPH =IVV − GIVH
IVV + 2GIVH, (2)
where V and H stand for “vertical” and “horizontal”, corresponding to the orientationof the polarization axis with respect to the light direction. The first index indicates thepolarization of the excitation light and the second one denotes the polarization of theemission signal, corresponding to the orientation of the excitation and emission polarizers,
96
Membranes 2021, 11, 847
respectively. The grating factor G = IHV/IHH reflects the sensitivity of the instrumenttoward vertically and horizontally polarized light. Around the main phase transition ofthe bilayer, the fluorescence anisotropy of DPH sharply increases. It can assume valuesfrom −0.2 to 0.4 [31].
The membrane dipole potential in sugar-containing aqueous solutions is quantifiedby the fluorescence excitation ratio of the potential-sensitive fluorescent styryl dye di-8-ANEPPS. In the case of di-8-ANEPPS incorporated into LUVs, fluorescence is excited at420 nm and 520 nm and detected at 670 nm. It has been shown that the fluorescenceintensity ratio Rex = I670 (exc.420)/I670 (exc.520) is proportional to the dipole potential Ψd,independently of fluidity effects [33–35]:
Ψd = (Rex + 0.3)/0.0043 (3)
The dipole potential occurs transversally between the water–lipid interface and thehydrocarbon interior from the contribution of all polarized and polarizable chemical groupsof lipid molecules and by the hydration shell of the bilayer [36].
FP-8300 spectrofluorimeter (Jasco) equipped with polarizers and a thermostatted(±0.1 °C) cuvette holder with quartz cuvettes is used. Samples are equilibrated for 5 minat the desired temperature. Excitation and emission slits are adjusted to 5 nm.
2.2.5. Electrodeformation of GUVs
The specific electrical capacitance, Cm, of POPC and SOPC membranes in the presenceof small carbohydrates (sucrose, glucose and fructose) is measured from the frequency-dependent deformation of GUVs in alternating electric field [37]. The vesicle shape trans-formation has been established to depend on the ratio Λ between the conductivity λin
of the aqueous solution, enclosed by the vesicle membrane, and the conductivity λout
of the external (suspending) medium [38,39]. In the case of more conductive externalmedium, upon increasing the AC field frequency, a vesicle with radius r placed in a moreconductive aqueous solution changes its shape from prolate to oblate with respect to thefield direction. During this morphological transition, the intermediate frequency, fcr, atwhich the quasispherical shape is assumed, is given by the expression [38]:
fcr =λin
2πrCm[(1 − Λ)(Λ + 3)]−1/2 (4)
Cm denotes the resultant capacitance of a series of three capacitors. These are the barelipid bilayer, Cm, and the capacitances of the diffuse charge regions resembling electricdouble layers in the aqueous solution at the two sides of the bilayer, denoted by CD,in andCD,ex, respectively:
Cm = (1/Cm + 1/CD,in + 1/CD,ex)−1 (5)
On the length scale of GUVs with radii ~10 µm and bilayer thickness d ~ 5 nm(d ≪ r) [37] the membrane is described as a two-dimensional surface with dielectricpermittivity εm = εrmε0, where εrm stands for the relative dielectric constant of the bilayerand ε0 ≈ 8.85 × 10⁻¹² F/m is the vacuum permittivity. Therefore, the specific capacitanceCm of the bilayer is given by:
Cm = εm/d (6)
The capacitance of the electric double layers is represented by the capacitance of aplanar capacitor with thickness equal to the Debye length, λD, and dielectric constant equalto the dielectric constant of the aqueous solution εr ≈ 80 [40]. The Debye length is relatedto the molar concentration c of a 1:1 electrolyte by the expression λD = 0.303/
√c nm [41].
Considering the concentrations of NaCl applied here, we estimate the capacitance for thedouble layers of free charges in the aqueous solution on both sides of the bilayer CD,in andCD,ex. As discussed in [38], their contribution increases at lower salt concentrations as wellas for high enough values of the bilayer capacitance.
97
Membranes 2021, 11, 847
It has been established that the dielectric properties of the ionic double layers near themembrane are related to the orientational ordering of water dipoles in the aqueous sur-roundings as well as in the headgroup region of lipid bilayers. We analyze the former in thelight of the theoretical evaluations published so far [40,42,43], while the latter corroboratesthe necessity to investigate the effect of sugar molecules on the bilayer dielectric properties.In the case of lipid membranes composed of zwitterionic phosphatidylcholines, studiedhere, it has been shown that at much higher monovalent salt concentrations the relativepermittivity in the dipolar headgroup region is decreased as a result from the saturationeffect in orientational ordering of water dipoles [44]. In the present study, we considerPC membranes in sugar-containing electrolyte solutions with ionic strength, which is twoorders of magnitude lower than in [44]. At zero surface charge density correspondingto the model lipid system studied here, the value taken for εr ≈ 80 represents a goodevaluation for the relative permittivity of the aqueous solution surrounding the bilayeras shown in [43]. The electric field strengths applied are far below the electroporationthreshold [37,45].
The electrodeformation measurements are conducted in a chamber consisting of twoparallel glass slides, which are separated by a 0.5 mm-thick inert spacer (Sigma-AldrichInc., St Louis, MO, USA). AC electric field from an arbitrary waveform generator (33120A,HP/Agilent, Santa Clara, CA, USA) is applied to a pair of two rectangular parallel ITO-electrodes deposited on the lower inner surface of the chamber at 1 mm apart. Themeasurement is performed by varying the frequency of the imposed uniform field inthe range of 10–200 kHz. The field strengths ≤ 7 kV/m, applied here, are two orders ofmagnitude lower than the electroporation threshold [37,45]. The vesicle electrodeformationis observed and recorded using a phase-contrast microscope (B-510PH, Optika, Ponteranica,BG, Italy) equipped with a dry objective (×40, 0.65 numerical aperture) and Axiocam ERc5s camera 5 MP (Zeiss, Jena, Germany) connected to a computer for image recording andprocessing with resolution of 0.1 µm/pixel. The ratios 0.87 ≤ Λ ≤ 0.95 correspond to amore conductive suspending solution. We perform data analysis following the originalapproach of Salipante et al. [16,38].
2.2.6. Fast Fourier Transform Impedance Spectroscopy of BLMs
Fast Fourier transform electrochemical impedance spectroscopy (FFT-EIS) is basedon measurements in the time domain, applying a multisine perturbation signal of a small-amplitude ~10 mV peak-to-peak covering the desired frequency range of 1.5 Hz–50 kHz.The perturbation and the respective response signals are simultaneously measured andsubsequently transferred to the frequency domain using the fast Fourier transformation(FFT). The major advantages of the approach chosen here are the fast acquisition of theimpedance spectrum obtained in a couple of seconds and the possibility to easily recognizeviolation of stationarity [46,47]. Thus, the FFT-EIS method appears to be suitable forstudying the impedance properties of dynamic and unstable samples such as lipid bilayers.The perturbation voltage is applied potentiostatically using a two-electrode scheme withtwo platinum electrodes to supply the current and to measure the voltage across membrane.The contact area of Pt electrodes with the bulk phase in both compartments of Montal–Mueller cell is large enough to guarantee that the contribution of the electrode doubleelectric layer is negligible in the frequency range covered.
The analysis of FFT-EIS data is performed by equivalent circuit modeling. Fromelectrical point of view Montal–Mueller BLM set-up is represented by the capacitance CBLMand resistance RBLM of the planar lipid bilayer, connected in parallel together with thecapacitance of the Teflon membrane CTM. The resistance Rs of the surrounding solutionis connected in series as depicted in Figure 1. Considering the 100 µm aperture surfacearea Sm = 8.10−5 cm2 we deduce membrane-specific capacitance Cm = CBLM/Sm andresistance Rm = RBLMSm. The reported values are calculated as the weighted average of4–7 independent measurements averaged over 10 repetitions each. The capacitance CTM ismeasured independently as discussed below.
98
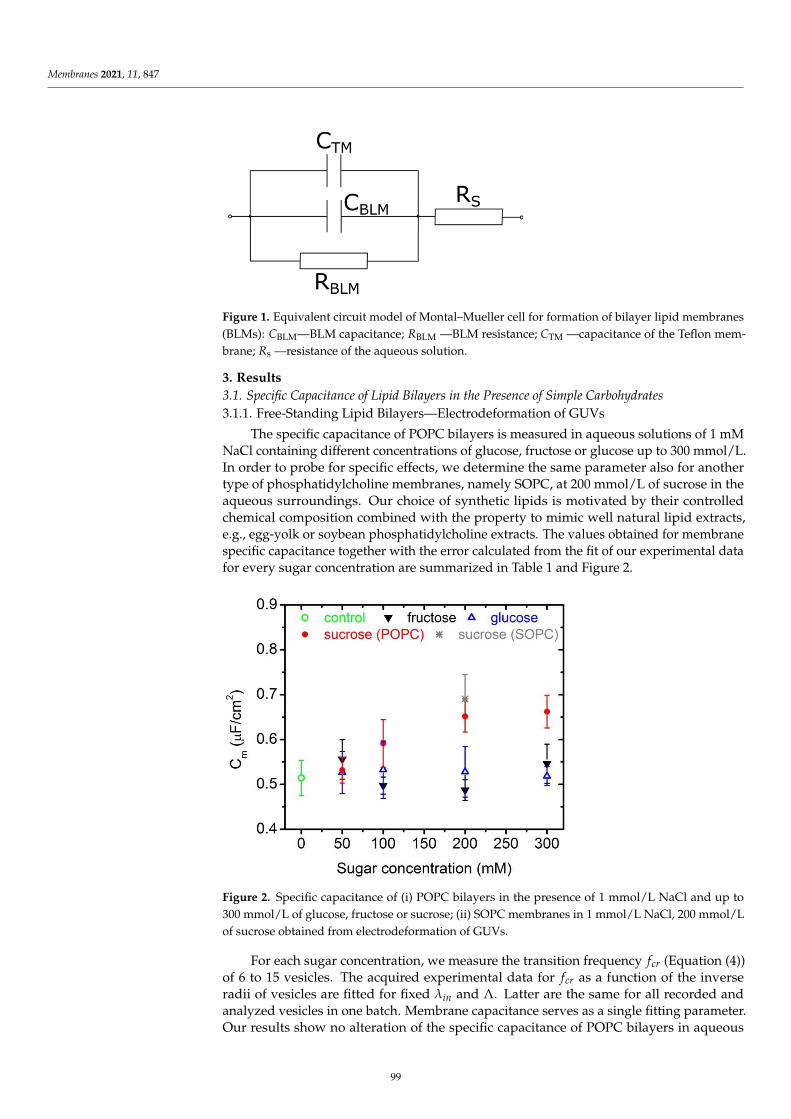
Membranes 2021, 11, 847
CR C R𝑆 = − 𝐶 = 𝐶 /𝑆𝑅 = 𝑅 𝑆 C
𝐶 𝑅 𝐶𝑅
𝑓𝑓𝜆 Λ𝐶 = 0.52 ± 0.02 𝐶 = 0.51 ±0.01
𝐶
Figure 1. Equivalent circuit model of Montal–Mueller cell for formation of bilayer lipid membranes(BLMs): CBLM—BLM capacitance; RBLM —BLM resistance; CTM —capacitance of the Teflon mem-brane; Rs —resistance of the aqueous solution.
3. Results3.1. Specific Capacitance of Lipid Bilayers in the Presence of Simple Carbohydrates
3.1.1. Free-Standing Lipid Bilayers—Electrodeformation of GUVs
The specific capacitance of POPC bilayers is measured in aqueous solutions of 1 mMNaCl containing different concentrations of glucose, fructose or glucose up to 300 mmol/L.In order to probe for specific effects, we determine the same parameter also for anothertype of phosphatidylcholine membranes, namely SOPC, at 200 mmol/L of sucrose in theaqueous surroundings. Our choice of synthetic lipids is motivated by their controlledchemical composition combined with the property to mimic well natural lipid extracts,e.g., egg-yolk or soybean phosphatidylcholine extracts. The values obtained for membranespecific capacitance together with the error calculated from the fit of our experimental datafor every sugar concentration are summarized in Table 1 and Figure 2.
𝐶λ Λ 𝑪𝒎 𝑪𝒎
Figure 2. Specific capacitance of (i) POPC bilayers in the presence of 1 mmol/L NaCl and up to300 mmol/L of glucose, fructose or sucrose; (ii) SOPC membranes in 1 mmol/L NaCl, 200 mmol/Lof sucrose obtained from electrodeformation of GUVs.
For each sugar concentration, we measure the transition frequency fcr (Equation (4))of 6 to 15 vesicles. The acquired experimental data for fcr as a function of the inverseradii of vesicles are fitted for fixed λin and Λ. Latter are the same for all recorded andanalyzed vesicles in one batch. Membrane capacitance serves as a single fitting parameter.Our results show no alteration of the specific capacitance of POPC bilayers in aqueous
99
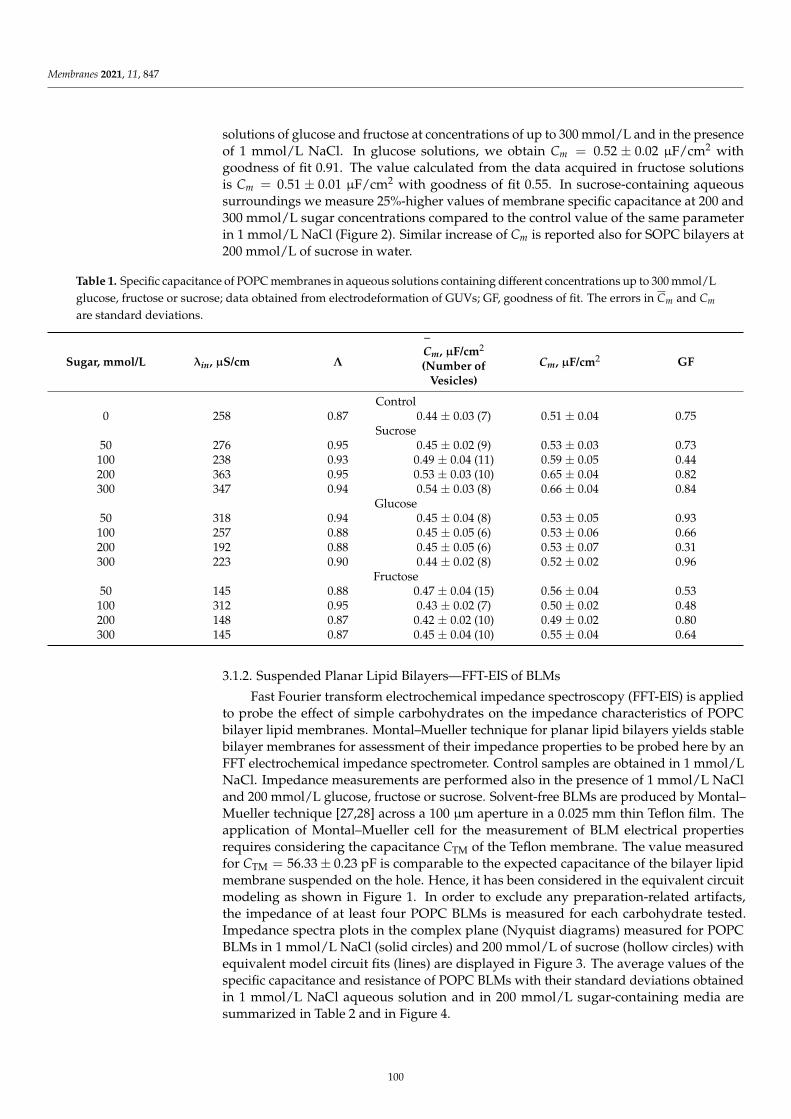
Membranes 2021, 11, 847
solutions of glucose and fructose at concentrations of up to 300 mmol/L and in the presenceof 1 mmol/L NaCl. In glucose solutions, we obtain Cm = 0.52 ± 0.02 µF/cm2 withgoodness of fit 0.91. The value calculated from the data acquired in fructose solutionsis Cm = 0.51 ± 0.01 µF/cm2 with goodness of fit 0.55. In sucrose-containing aqueoussurroundings we measure 25%-higher values of membrane specific capacitance at 200 and300 mmol/L sugar concentrations compared to the control value of the same parameterin 1 mmol/L NaCl (Figure 2). Similar increase of Cm is reported also for SOPC bilayers at200 mmol/L of sucrose in water.
Table 1. Specific capacitance of POPC membranes in aqueous solutions containing different concentrations up to 300 mmol/Lglucose, fructose or sucrose; data obtained from electrodeformation of GUVs; GF, goodness of fit. The errors in Cm and Cm
are standard deviations.
Sugar, mmol/L λin, µS/cm Λ
¯
Cm, µF/cm2
(Number ofVesicles)
Cm, µF/cm2 GF
Control0 258 0.87 0.44 ± 0.03 (7) 0.51 ± 0.04 0.75
Sucrose50 276 0.95 0.45 ± 0.02 (9) 0.53 ± 0.03 0.73100 238 0.93 0.49 ± 0.04 (11) 0.59 ± 0.05 0.44200 363 0.95 0.53 ± 0.03 (10) 0.65 ± 0.04 0.82300 347 0.94 0.54 ± 0.03 (8) 0.66 ± 0.04 0.84
Glucose50 318 0.94 0.45 ± 0.04 (8) 0.53 ± 0.05 0.93100 257 0.88 0.45 ± 0.05 (6) 0.53 ± 0.06 0.66200 192 0.88 0.45 ± 0.05 (6) 0.53 ± 0.07 0.31300 223 0.90 0.44 ± 0.02 (8) 0.52 ± 0.02 0.96
Fructose50 145 0.88 0.47 ± 0.04 (15) 0.56 ± 0.04 0.53100 312 0.95 0.43 ± 0.02 (7) 0.50 ± 0.02 0.48200 148 0.87 0.42 ± 0.02 (10) 0.49 ± 0.02 0.80300 145 0.87 0.45 ± 0.04 (10) 0.55 ± 0.04 0.64
3.1.2. Suspended Planar Lipid Bilayers—FFT-EIS of BLMs
Fast Fourier transform electrochemical impedance spectroscopy (FFT-EIS) is appliedto probe the effect of simple carbohydrates on the impedance characteristics of POPCbilayer lipid membranes. Montal–Mueller technique for planar lipid bilayers yields stablebilayer membranes for assessment of their impedance properties to be probed here by anFFT electrochemical impedance spectrometer. Control samples are obtained in 1 mmol/LNaCl. Impedance measurements are performed also in the presence of 1 mmol/L NaCland 200 mmol/L glucose, fructose or sucrose. Solvent-free BLMs are produced by Montal–Mueller technique [27,28] across a 100 µm aperture in a 0.025 mm thin Teflon film. Theapplication of Montal–Mueller cell for the measurement of BLM electrical propertiesrequires considering the capacitance CTM of the Teflon membrane. The value measuredfor CTM = 56.33 ± 0.23 pF is comparable to the expected capacitance of the bilayer lipidmembrane suspended on the hole. Hence, it has been considered in the equivalent circuitmodeling as shown in Figure 1. In order to exclude any preparation-related artifacts,the impedance of at least four POPC BLMs is measured for each carbohydrate tested.Impedance spectra plots in the complex plane (Nyquist diagrams) measured for POPCBLMs in 1 mmol/L NaCl (solid circles) and 200 mmol/L of sucrose (hollow circles) withequivalent model circuit fits (lines) are displayed in Figure 3. The average values of thespecific capacitance and resistance of POPC BLMs with their standard deviations obtainedin 1 mmol/L NaCl aqueous solution and in 200 mmol/L sugar-containing media aresummarized in Table 2 and in Figure 4.
100
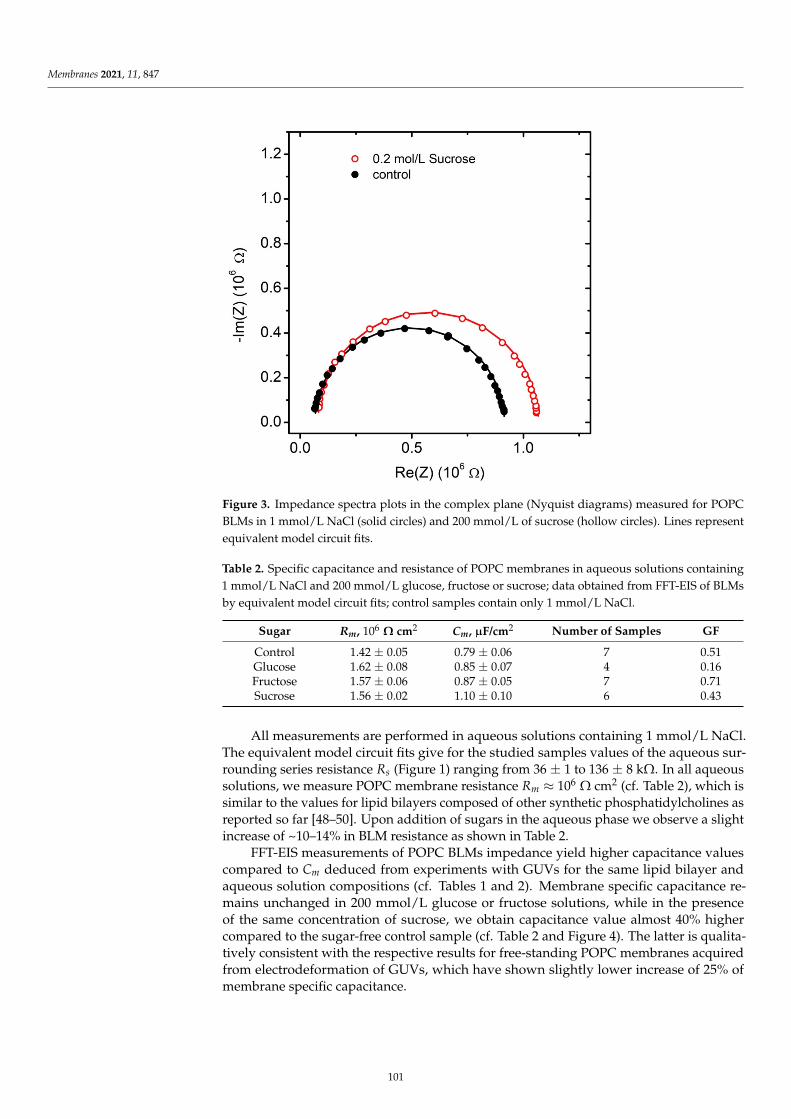
Membranes 2021, 11, 847
а𝐶𝐶 = 56.33 ± 0.23
𝑅 Ω𝑅 ≈ Ω
𝐶
Figure 3. Impedance spectra plots in the complex plane (Nyquist diagrams) measured for POPCBLMs in 1 mmol/L NaCl (solid circles) and 200 mmol/L of sucrose (hollow circles). Lines representequivalent model circuit fits.
Table 2. Specific capacitance and resistance of POPC membranes in aqueous solutions containing1 mmol/L NaCl and 200 mmol/L glucose, fructose or sucrose; data obtained from FFT-EIS of BLMsby equivalent model circuit fits; control samples contain only 1 mmol/L NaCl.
Sugar Rm, 106Ω cm2 Cm, µF/cm2 Number of Samples GF
Control 1.42 ± 0.05 0.79 ± 0.06 7 0.51Glucose 1.62 ± 0.08 0.85 ± 0.07 4 0.16Fructose 1.57 ± 0.06 0.87 ± 0.05 7 0.71Sucrose 1.56 ± 0.02 1.10 ± 0.10 6 0.43
All measurements are performed in aqueous solutions containing 1 mmol/L NaCl.The equivalent model circuit fits give for the studied samples values of the aqueous sur-rounding series resistance Rs (Figure 1) ranging from 36 ± 1 to 136 ± 8 kΩ. In all aqueoussolutions, we measure POPC membrane resistance Rm ≈ 106 Ω cm2 (cf. Table 2), which issimilar to the values for lipid bilayers composed of other synthetic phosphatidylcholines asreported so far [48–50]. Upon addition of sugars in the aqueous phase we observe a slightincrease of ~10–14% in BLM resistance as shown in Table 2.
FFT-EIS measurements of POPC BLMs impedance yield higher capacitance valuescompared to Cm deduced from experiments with GUVs for the same lipid bilayer andaqueous solution compositions (cf. Tables 1 and 2). Membrane specific capacitance re-mains unchanged in 200 mmol/L glucose or fructose solutions, while in the presenceof the same concentration of sucrose, we obtain capacitance value almost 40% highercompared to the sugar-free control sample (cf. Table 2 and Figure 4). The latter is qualita-tively consistent with the respective results for free-standing POPC membranes acquiredfrom electrodeformation of GUVs, which have shown slightly lower increase of 25% ofmembrane specific capacitance.
101
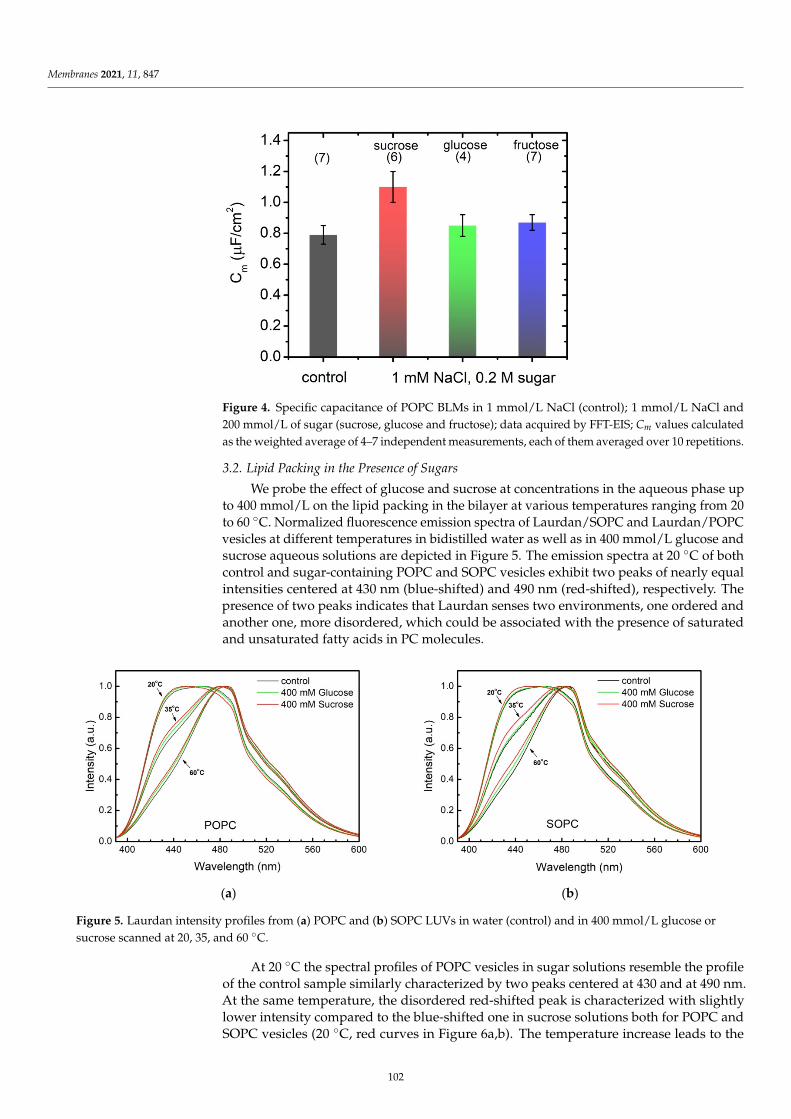
Membranes 2021, 11, 847
𝑹𝒎 Ω 𝑪𝒎
𝐶Figure 4. Specific capacitance of POPC BLMs in 1 mmol/L NaCl (control); 1 mmol/L NaCl and200 mmol/L of sugar (sucrose, glucose and fructose); data acquired by FFT-EIS; Cm values calculatedas the weighted average of 4–7 independent measurements, each of them averaged over 10 repetitions.
3.2. Lipid Packing in the Presence of Sugars
We probe the effect of glucose and sucrose at concentrations in the aqueous phase upto 400 mmol/L on the lipid packing in the bilayer at various temperatures ranging from 20to 60 C. Normalized fluorescence emission spectra of Laurdan/SOPC and Laurdan/POPCvesicles at different temperatures in bidistilled water as well as in 400 mmol/L glucose andsucrose aqueous solutions are depicted in Figure 5. The emission spectra at 20 C of bothcontrol and sugar-containing POPC and SOPC vesicles exhibit two peaks of nearly equalintensities centered at 430 nm (blue-shifted) and 490 nm (red-shifted), respectively. Thepresence of two peaks indicates that Laurdan senses two environments, one ordered andanother one, more disordered, which could be associated with the presence of saturatedand unsaturated fatty acids in PC molecules.
(a) (b)
𝐺𝑃2060 𝐺𝑃𝐺𝑃 −𝐺𝑃 20 − 60 𝐿 𝐺𝑃𝐺𝑃
Figure 5. Laurdan intensity profiles from (a) POPC and (b) SOPC LUVs in water (control) and in 400 mmol/L glucose orsucrose scanned at 20, 35, and 60 C.
At 20 C the spectral profiles of POPC vesicles in sugar solutions resemble the profileof the control sample similarly characterized by two peaks centered at 430 and at 490 nm.At the same temperature, the disordered red-shifted peak is characterized with slightlylower intensity compared to the blue-shifted one in sucrose solutions both for POPC andSOPC vesicles (20 C, red curves in Figure 6a,b). The temperature increase leads to the
102
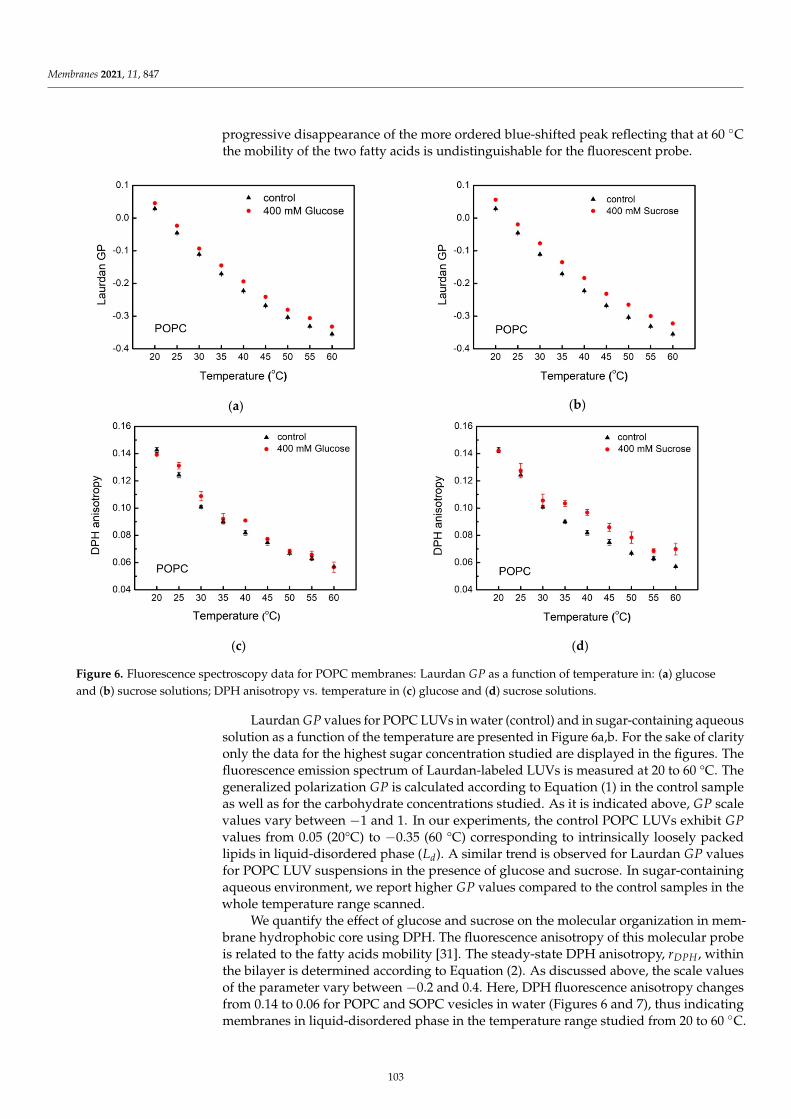
Membranes 2021, 11, 847
progressive disappearance of the more ordered blue-shifted peak reflecting that at 60 Cthe mobility of the two fatty acids is undistinguishable for the fluorescent probe.
𝐺𝑃2060 𝐺𝑃𝐺𝑃 −𝐺𝑃 20 − 60 𝐿 𝐺𝑃𝐺𝑃
(a) (b)
(c) (d) 𝐺𝑃𝑟
−
𝑟
𝑟𝑟
Figure 6. Fluorescence spectroscopy data for POPC membranes: Laurdan GP as a function of temperature in: (a) glucoseand (b) sucrose solutions; DPH anisotropy vs. temperature in (c) glucose and (d) sucrose solutions.
Laurdan GP values for POPC LUVs in water (control) and in sugar-containing aqueoussolution as a function of the temperature are presented in Figure 6a,b. For the sake of clarityonly the data for the highest sugar concentration studied are displayed in the figures. Thefluorescence emission spectrum of Laurdan-labeled LUVs is measured at 20 to 60 °C. Thegeneralized polarization GP is calculated according to Equation (1) in the control sampleas well as for the carbohydrate concentrations studied. As it is indicated above, GP scalevalues vary between −1 and 1. In our experiments, the control POPC LUVs exhibit GPvalues from 0.05 (20°C) to −0.35 (60 °C) corresponding to intrinsically loosely packedlipids in liquid-disordered phase (Ld). A similar trend is observed for Laurdan GP valuesfor POPC LUV suspensions in the presence of glucose and sucrose. In sugar-containingaqueous environment, we report higher GP values compared to the control samples in thewhole temperature range scanned.
We quantify the effect of glucose and sucrose on the molecular organization in mem-brane hydrophobic core using DPH. The fluorescence anisotropy of this molecular probeis related to the fatty acids mobility [31]. The steady-state DPH anisotropy, rDPH , withinthe bilayer is determined according to Equation (2). As discussed above, the scale valuesof the parameter vary between −0.2 and 0.4. Here, DPH fluorescence anisotropy changesfrom 0.14 to 0.06 for POPC and SOPC vesicles in water (Figures 6 and 7), thus indicatingmembranes in liquid-disordered phase in the temperature range studied from 20 to 60 C.
103
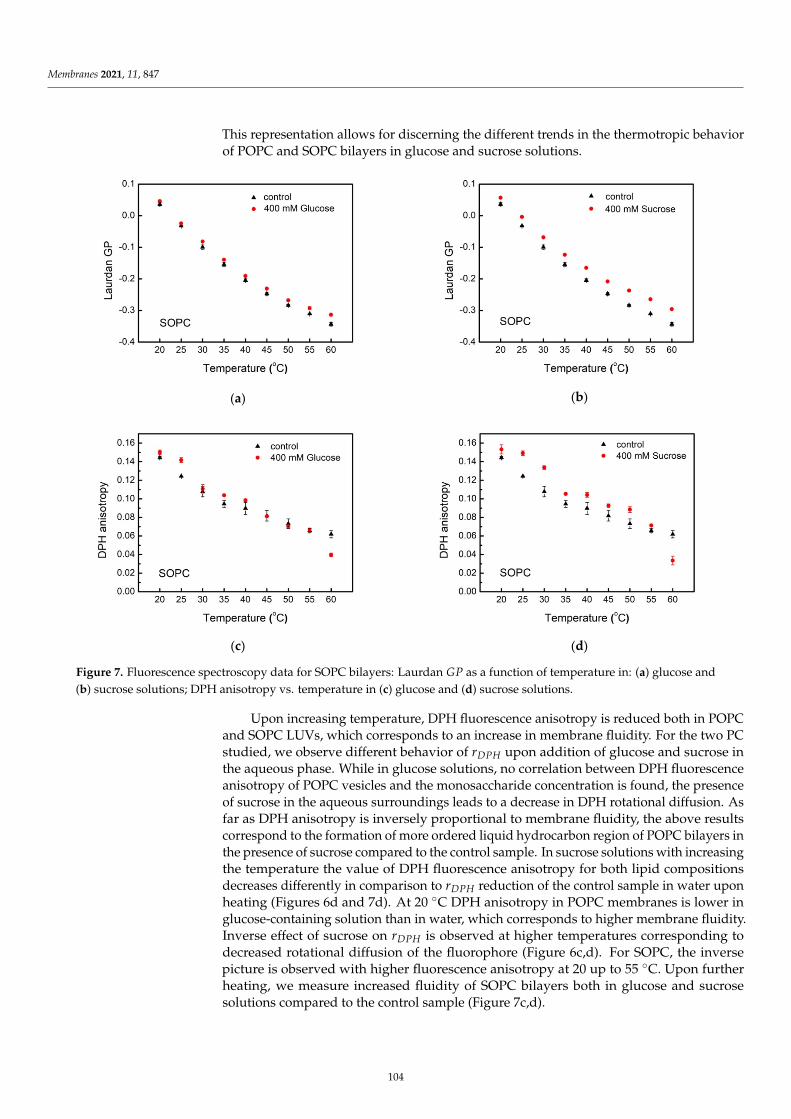
Membranes 2021, 11, 847
This representation allows for discerning the different trends in the thermotropic behaviorof POPC and SOPC bilayers in glucose and sucrose solutions.
(a) (b)
(c) (d) 𝐺𝑃
∆∆
Δ𝐺𝑃 Δ𝑟 20Δ𝑟 Δ𝐺𝑃
Δ𝐺𝑃/Δ𝑟 ~2.3
Figure 7. Fluorescence spectroscopy data for SOPC bilayers: Laurdan GP as a function of temperature in: (a) glucose and(b) sucrose solutions; DPH anisotropy vs. temperature in (c) glucose and (d) sucrose solutions.
Upon increasing temperature, DPH fluorescence anisotropy is reduced both in POPCand SOPC LUVs, which corresponds to an increase in membrane fluidity. For the two PCstudied, we observe different behavior of rDPH upon addition of glucose and sucrose inthe aqueous phase. While in glucose solutions, no correlation between DPH fluorescenceanisotropy of POPC vesicles and the monosaccharide concentration is found, the presenceof sucrose in the aqueous surroundings leads to a decrease in DPH rotational diffusion. Asfar as DPH anisotropy is inversely proportional to membrane fluidity, the above resultscorrespond to the formation of more ordered liquid hydrocarbon region of POPC bilayers inthe presence of sucrose compared to the control sample. In sucrose solutions with increasingthe temperature the value of DPH fluorescence anisotropy for both lipid compositionsdecreases differently in comparison to rDPH reduction of the control sample in water uponheating (Figures 6d and 7d). At 20 C DPH anisotropy in POPC membranes is lower inglucose-containing solution than in water, which corresponds to higher membrane fluidity.Inverse effect of sucrose on rDPH is observed at higher temperatures corresponding todecreased rotational diffusion of the fluorophore (Figure 6c,d). For SOPC, the inversepicture is observed with higher fluorescence anisotropy at 20 up to 55 C. Upon furtherheating, we measure increased fluidity of SOPC bilayers both in glucose and sucrosesolutions compared to the control sample (Figure 7c,d).
104
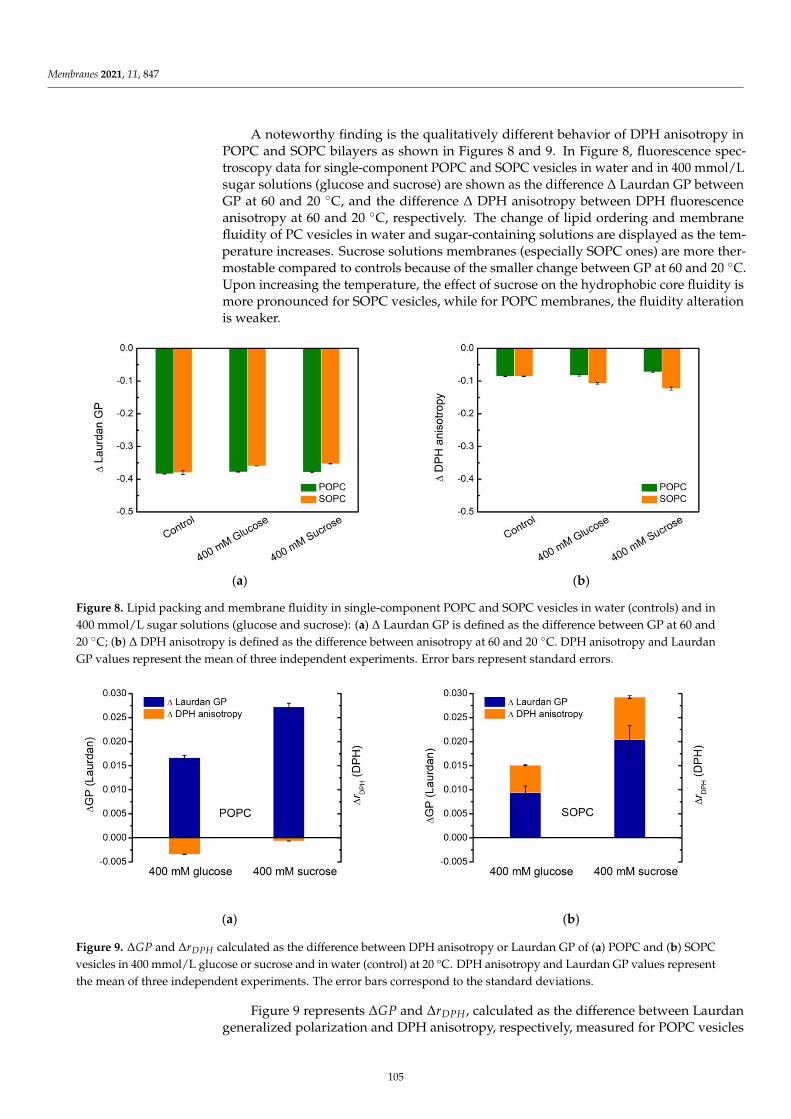
Membranes 2021, 11, 847
A noteworthy finding is the qualitatively different behavior of DPH anisotropy inPOPC and SOPC bilayers as shown in Figures 8 and 9. In Figure 8, fluorescence spec-troscopy data for single-component POPC and SOPC vesicles in water and in 400 mmol/Lsugar solutions (glucose and sucrose) are shown as the difference ∆ Laurdan GP betweenGP at 60 and 20 C, and the difference ∆ DPH anisotropy between DPH fluorescenceanisotropy at 60 and 20 C, respectively. The change of lipid ordering and membranefluidity of PC vesicles in water and sugar-containing solutions are displayed as the tem-perature increases. Sucrose solutions membranes (especially SOPC ones) are more ther-mostable compared to controls because of the smaller change between GP at 60 and 20 C.Upon increasing the temperature, the effect of sucrose on the hydrophobic core fluidity ismore pronounced for SOPC vesicles, while for POPC membranes, the fluidity alterationis weaker.
~1.7 Δ𝐺𝑃/Δ𝑟 ~ − 43 ~ − 5
(a) (b)
∆∆
Δ𝐺𝑃 Δ𝑟 20
Figure 8. Lipid packing and membrane fluidity in single-component POPC and SOPC vesicles in water (controls) and in400 mmol/L sugar solutions (glucose and sucrose): (a) ∆ Laurdan GP is defined as the difference between GP at 60 and20 C; (b) ∆ DPH anisotropy is defined as the difference between anisotropy at 60 and 20 C. DPH anisotropy and LaurdanGP values represent the mean of three independent experiments. Error bars represent standard errors.
~1.7 Δ𝐺𝑃/Δ𝑟 ~ − 43 ~ − 5
∆∆
(a) (b) Δ𝐺𝑃 Δ𝑟 20 Figure 9. ∆GP and ∆rDPH calculated as the difference between DPH anisotropy or Laurdan GP of (a) POPC and (b) SOPCvesicles in 400 mmol/L glucose or sucrose and in water (control) at 20 °C. DPH anisotropy and Laurdan GP values representthe mean of three independent experiments. The error bars correspond to the standard deviations.
Figure 9 represents ∆GP and ∆rDPH , calculated as the difference between Laurdangeneralized polarization and DPH anisotropy, respectively, measured for POPC vesicles
105
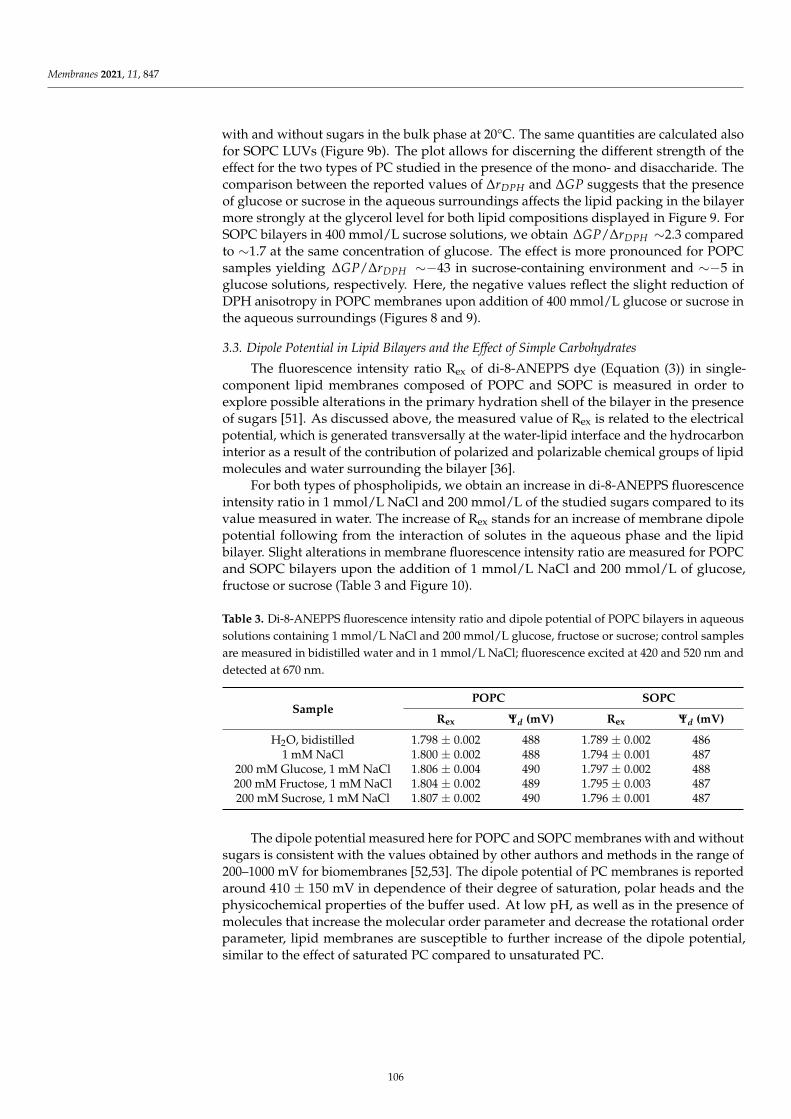
Membranes 2021, 11, 847
with and without sugars in the bulk phase at 20°C. The same quantities are calculated alsofor SOPC LUVs (Figure 9b). The plot allows for discerning the different strength of theeffect for the two types of PC studied in the presence of the mono- and disaccharide. Thecomparison between the reported values of ∆rDPH and ∆GP suggests that the presenceof glucose or sucrose in the aqueous surroundings affects the lipid packing in the bilayermore strongly at the glycerol level for both lipid compositions displayed in Figure 9. ForSOPC bilayers in 400 mmol/L sucrose solutions, we obtain ∆GP/∆rDPH ∼2.3 comparedto ∼1.7 at the same concentration of glucose. The effect is more pronounced for POPCsamples yielding ∆GP/∆rDPH ∼−43 in sucrose-containing environment and ∼−5 inglucose solutions, respectively. Here, the negative values reflect the slight reduction ofDPH anisotropy in POPC membranes upon addition of 400 mmol/L glucose or sucrose inthe aqueous surroundings (Figures 8 and 9).
3.3. Dipole Potential in Lipid Bilayers and the Effect of Simple Carbohydrates
The fluorescence intensity ratio Rex of di-8-ANEPPS dye (Equation (3)) in single-component lipid membranes composed of POPC and SOPC is measured in order toexplore possible alterations in the primary hydration shell of the bilayer in the presenceof sugars [51]. As discussed above, the measured value of Rex is related to the electricalpotential, which is generated transversally at the water-lipid interface and the hydrocarboninterior as a result of the contribution of polarized and polarizable chemical groups of lipidmolecules and water surrounding the bilayer [36].
For both types of phospholipids, we obtain an increase in di-8-ANEPPS fluorescenceintensity ratio in 1 mmol/L NaCl and 200 mmol/L of the studied sugars compared to itsvalue measured in water. The increase of Rex stands for an increase of membrane dipolepotential following from the interaction of solutes in the aqueous phase and the lipidbilayer. Slight alterations in membrane fluorescence intensity ratio are measured for POPCand SOPC bilayers upon the addition of 1 mmol/L NaCl and 200 mmol/L of glucose,fructose or sucrose (Table 3 and Figure 10).
Table 3. Di-8-ANEPPS fluorescence intensity ratio and dipole potential of POPC bilayers in aqueoussolutions containing 1 mmol/L NaCl and 200 mmol/L glucose, fructose or sucrose; control samplesare measured in bidistilled water and in 1 mmol/L NaCl; fluorescence excited at 420 and 520 nm anddetected at 670 nm.
SamplePOPC SOPC
Rex Ψd (mV) Rex Ψd (mV)
H2O, bidistilled 1.798 ± 0.002 488 1.789 ± 0.002 4861 mM NaCl 1.800 ± 0.002 488 1.794 ± 0.001 487
200 mM Glucose, 1 mM NaCl 1.806 ± 0.004 490 1.797 ± 0.002 488200 mM Fructose, 1 mM NaCl 1.804 ± 0.002 489 1.795 ± 0.003 487200 mM Sucrose, 1 mM NaCl 1.807 ± 0.002 490 1.796 ± 0.001 487
The dipole potential measured here for POPC and SOPC membranes with and withoutsugars is consistent with the values obtained by other authors and methods in the range of200–1000 mV for biomembranes [52,53]. The dipole potential of PC membranes is reportedaround 410 ± 150 mV in dependence of their degree of saturation, polar heads and thephysicochemical properties of the buffer used. At low pH, as well as in the presence ofmolecules that increase the molecular order parameter and decrease the rotational orderparameter, lipid membranes are susceptible to further increase of the dipole potential,similar to the effect of saturated PC compared to unsaturated PC.
106
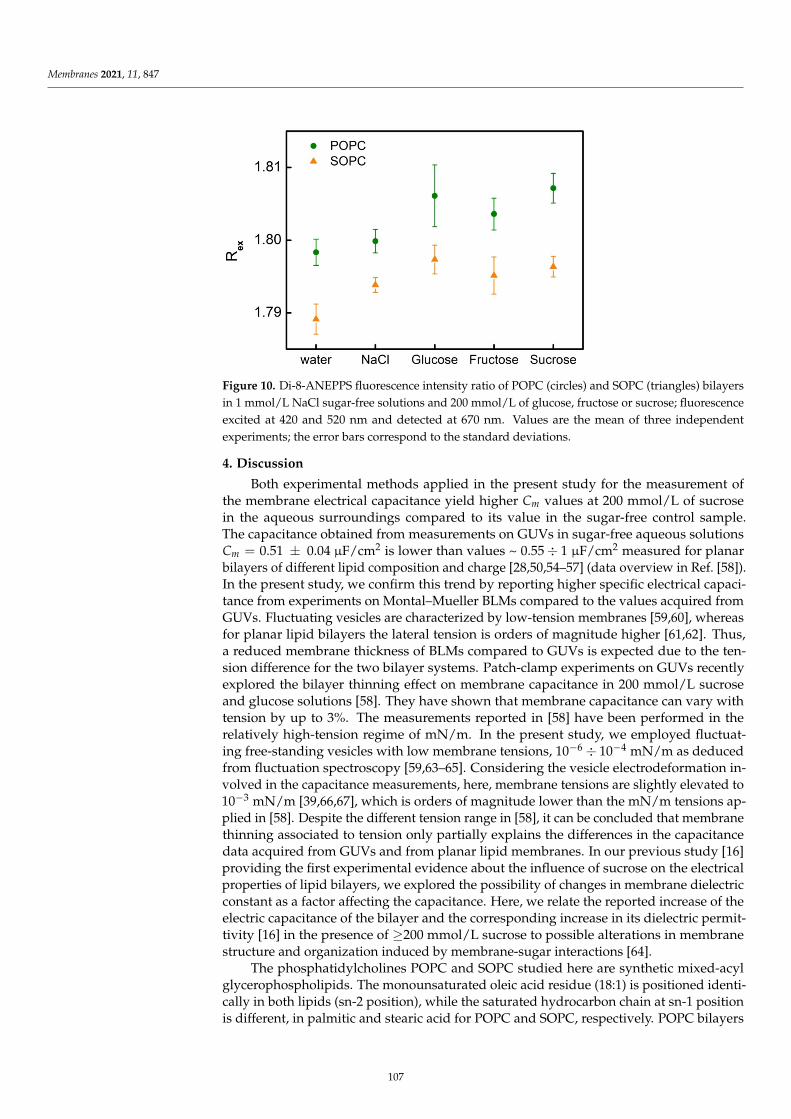
Membranes 2021, 11, 847
𝚿𝒅 𝚿𝒅
Figure 10. Di-8-ANEPPS fluorescence intensity ratio of POPC (circles) and SOPC (triangles) bilayersin 1 mmol/L NaCl sugar-free solutions and 200 mmol/L of glucose, fructose or sucrose; fluorescenceexcited at 420 and 520 nm and detected at 670 nm. Values are the mean of three independentexperiments; the error bars correspond to the standard deviations.
4. Discussion
Both experimental methods applied in the present study for the measurement ofthe membrane electrical capacitance yield higher Cm values at 200 mmol/L of sucrosein the aqueous surroundings compared to its value in the sugar-free control sample.The capacitance obtained from measurements on GUVs in sugar-free aqueous solutionsCm = 0.51 ± 0.04 µF/cm2 is lower than values ~ 0.55 ÷ 1 µF/cm2 measured for planarbilayers of different lipid composition and charge [28,50,54–57] (data overview in Ref. [58]).In the present study, we confirm this trend by reporting higher specific electrical capaci-tance from experiments on Montal–Mueller BLMs compared to the values acquired fromGUVs. Fluctuating vesicles are characterized by low-tension membranes [59,60], whereasfor planar lipid bilayers the lateral tension is orders of magnitude higher [61,62]. Thus,a reduced membrane thickness of BLMs compared to GUVs is expected due to the ten-sion difference for the two bilayer systems. Patch-clamp experiments on GUVs recentlyexplored the bilayer thinning effect on membrane capacitance in 200 mmol/L sucroseand glucose solutions [58]. They have shown that membrane capacitance can vary withtension by up to 3%. The measurements reported in [58] have been performed in therelatively high-tension regime of mN/m. In the present study, we employed fluctuat-ing free-standing vesicles with low membrane tensions, 10−6 ÷ 10−4 mN/m as deducedfrom fluctuation spectroscopy [59,63–65]. Considering the vesicle electrodeformation in-volved in the capacitance measurements, here, membrane tensions are slightly elevated to10−3 mN/m [39,66,67], which is orders of magnitude lower than the mN/m tensions ap-plied in [58]. Despite the different tension range in [58], it can be concluded that membranethinning associated to tension only partially explains the differences in the capacitancedata acquired from GUVs and from planar lipid membranes. In our previous study [16]providing the first experimental evidence about the influence of sucrose on the electricalproperties of lipid bilayers, we explored the possibility of changes in membrane dielectricconstant as a factor affecting the capacitance. Here, we relate the reported increase of theelectric capacitance of the bilayer and the corresponding increase in its dielectric permit-tivity [16] in the presence of ≥200 mmol/L sucrose to possible alterations in membranestructure and organization induced by membrane-sugar interactions [64].
The phosphatidylcholines POPC and SOPC studied here are synthetic mixed-acylglycerophospholipids. The monounsaturated oleic acid residue (18:1) is positioned identi-cally in both lipids (sn-2 position), while the saturated hydrocarbon chain at sn-1 positionis different, in palmitic and stearic acid for POPC and SOPC, respectively. POPC bilayers
107
Membranes 2021, 11, 847
undergo a gel-to-liquid crystalline phase transition around −2 C [65]. The main phasetransition of SOPC membranes occurs around 7 C [66].
The fluorescence spectroscopy of Laurdan and DPH provide information about thelipid packing at different levels in the lipid bilayer, near the glycerol backbone and thehydrophobic core, respectively. Laurdan responds to the degree of hydration at the glycerollevel, while DPH fluorescence anisotropy corresponds to the rotational diffusion of theprobe in the hydrophobic region of the bilayer. Considering that the lipid moleculesstudied here are not characterized by truncated chains, we apply interchangeably the termsordering and packing [67,68].
The amphiphilic fluorophore Laurdan comprises a naphthalene residue linked byan ester bond (hydrophilic) and a chain of lauric fatty acid (hydrophobic). As a result,it inserts the membrane parallel to lipid molecules in a way that its naphthalene moietyis located at the glycerol backbone of the lipid molecule and more precisely, at the levelof sn-1 carbonyl [69]. Upon excitation by UV-light, the dipole moment of the fluorescentmoiety increases leading to reorientation of the surrounding solvent dipoles. The resultspresented above (Figures 6 and 7) suggest that at high temperatures, membrane becomesmore loosely packed, which imparts higher mobility and increased dipolar relaxation atmembrane interface. The reported results indicate that at higher temperatures the LaurdanGP values decrease for all measured LUV suspension compositions. Our findings supportthe expected thermotropic behavior of the lipid bilayer, whose packing order decreasesupon increasing the temperature.
Reorientations of sn-1 and sn-2 chains lead to conformational and hydration changesat the glycerol level related also to reorientation of the lipid headgroups. Laurdan positiondistribution is characterized by a certain width as well as its possible relocation uponexcitation. Thereby, the fluorescence wavelength is related to the fluorophore locationdepth in membrane. Shorter wavelengths are emitted by Laurdan molecules positioneddeeper within the lipid bilayer, while red-shifted emission (longer wavelengths) occur fromfluorophores located closer to membrane-water interface. Hence, Laurdan experiments areable to distinguish POPC from SOPC lipid ordering. Our results support the hypothesisabout sucrose ordering effect in membrane in the proximity of the glycerol backbone(Figure 5; blue-shifted Laurdan emission signal).
The depolarization of fluorescence has been recognized as a reliable parameter forcharacterization of dynamic features and thermotropic behavior of the hydrophobic regionsof lipid membranes and lipoproteins [31]. Measurements of DPH fluorescence anisotropyallow evaluating the hindrance of the fluorophore mobility in the hydrophobic core of thebilayer related to alterations in packing of the aliphatic chains. We obtain that the increaseof the sucrose content in the aqueous surrounding leads to hindering the DPH rotationaldiffusion as a result from to the formation of more ordered liquid phase.
The relative changes, ∆rDPH and ∆GP, state that the reduction in rotational diffusionand degree of hydration for the corresponding molecular probe is larger in the presence ofthe disaccharide. This reduction is more considerable for Laurdan (Figure 9). Therefore,the changes in lipid ordering induced by the presence of sucrose are predominantly at theglycerol level rather than in the hydrophobic core.
In order to further elucidate the effect of sucrose binding [64,70] on the electric prop-erties of lipid bilayers, we study the bilayer dipole potential, which occurs due to thehydrated polar headgroups, the glycerol-ester region of the lipids and the functional groupdipoles of the terminal methyl groups of hydrocarbon chains. This membrane parameteris still limitedly understood but undoubtedly recognized as an important regulator ofmembrane structure and function [71]. Numerous examples can be given in this respectsuch as the modulation of the hydration force interplaying in membrane–membrane andmembrane-ligand interactions or the lipid-mediated cellular signaling in cells. The dipolepotential arises in a medium over which the dielectric constant is changing in a largeinterval—from 2 to 80 [71]. Even if the microscopic nature of the interactions leading to
108
Membranes 2021, 11, 847
the creation of the dipole potential remains not completely described, some elaboratedtheoretical models of its origin account for the important role of interfacial water molecules.
The slight increase in the dipole potential reported here for POPC and SOPC bilay-ers upon the addition of sodium chloride and small carbohydrates is in agreement withthe trend measured for monolayers of dimyristoylphosphatidylcholine on the air/waterinterface at 20 C, which is below the main transition temperature of the lipid [51]. Foursucrose molecules have been reported to displace three water molecules per lipid, thusproducing only a weak effect on the dipole potential or the carbonyl groups in monolay-ers [51]. In contrast to trehalose, sucrose has not been found to interact directly with thephospholipid groups, thus implying that this disaccharide is not expected to replace watermolecules in the tightly bound hydration sphere. Upon increasing the sugar concentration,the water activity in the bulk solution decreases [72]. Furthermore, the refractive indexchanges observed in vesicles under osmotic stress inferred alterations in the extent ofhydration and/or lipid packing of phospholipid molecules [73]. Hence, sucrose wouldexhibit a colligative effect on fully hydrated bilayers by osmotically extruding water fromthe bilayer.
Our findings suggest possible alterations of the bilayer relative permittivity in sucrose-containing aqueous surroundings. They are coherent with our previous results for sucrosesolutions with high ionic strength [16]. From the capacitance data and the reported mem-brane thickness [64], the values of the relative dielectric permittivity have been evaluatedto vary from ~2.3 (sugar-free, 10 mmol/L NaCl) to ~3.5 (for sucrose concentrations above~200 mmol/L and 10 mmol/L NaCl). Following the approach here, we estimate a narrowerrange of εrm changes upon increasing sucrose content in the bulk phase, characterized byan order of magnitude of lower ionic strength. POPC bilayer relative permittivity variesfrom εrm ∼2.4 in 1 mM NaCl up to εrm ∼2.9 in the presence of sucrose with concentrations>200 mmol/L in the electrolyte solution.
The above evaluations for the relative dielectric permittivity are performed consid-ering the integral thickness of the bilayer, including its hydrophobic part and headgroupregions. In order to appropriately account for the contribution of the hydrocarbon core andthe headgroup regions, the bilayer has to be described by an equivalent circuit of capacitorsin series replacing Cm in Equation (5). Attempts to analyze the obtained alteration of εm
are based on the data available in the literature for the thickness of the headgroup regionof PC ~ 9 Å [74] and the thickness of dioleoylphosphatidylcholine (DOPC) bilayers insugar-containing aqueous solutions concentrations [64]. This approximation is realisticas the head groups of DOPC and POPC are identical and both lipids are characterizedby similar hydrophobic lengths. The hydrophobic thickness of DOPC and POPC is re-ported to be between 27.1 and 27.2 Å [75,76] for the former, and 27.1 Å [77] for the latter.Estimations for the relative dielectric permittivity of the dipolar region of phosphatidyl-choline lipid bilayers have given a wide range of values depending on the theoreticalmodel applied [78]. The consideration of the rotating polar headgroups as an ensemble ofinteracting dipoles embedded in a nonhomogeneous dielectric with explicitly consideringthe interactions between the nearest neighborhood has derived ~30 for the headgroupdielectric constant [78], thus providing for the capacitance of the headgroup region a valueof the order of 15 µF/cm2. As shown by Velikonja et al. [44] at high monovalent saltconcentrations the relative permittivity in the dipolar headgroup region is decreased dueto a saturation effect in orientational ordering of water dipoles. Considering that our studyis performed at nearly 500 times lower salt concentrations we hypothesize that the changesin the dielectric properties are much more pronounced in the hydrophobic core than inthe dipolar head region. In this case, one should keep in mind that further theoreticalinvestigations could help quantifying the sucrose effect on the dielectric permittivity ofthe headgroup region. Here, we suppose that the obtained alteration of εm is a resultmainly of modulation in the hydrocarbon core of the bilayer. Hence, we deduce that in thepresence of high sucrose concentrations (≥200 mmol/L) the relative dielectric permittivityof hydrocarbon chains is increased by ~14% and varies between ~1.4 and 1.6 in the studied
109
Membranes 2021, 11, 847
sucrose concentration range. Considering the narrower range of εrm changes upon increas-ing sucrose content in the bulk phase at an order of magnitude lower ionic strength thanin [16] we formulate a hypothesis for a cooperative effect of sodium chloride and sucrose onmembrane properties, including the bilayer specific capacitance and relative permittivity.It is supported by previous results indicating that the presence of sodium chloride modifiesthe effect of sucrose on the bending rigidity of lipid bilayers. We found that membranebending elasticity measured in sucrose solutions containing 10 mM NaCl was independentof the disaccharide concentration in the aqueous surroundings [79]. This result has to beconsidered in the light of the ion-induced modification of sucrose-phosphatidylcholinehydrogen bond network, reported in the literature [80,81]. The capability of disaccharidesto replace water molecules [51] and to create a water-like hydrogen bond network in thelipid surroundings contributes to retaining of the molecular properties of lipids [6]. Molec-ular dynamics simulation results have provided evidence that the hydrogen bond networkof phosphatidylcholines and sucrose is partially disrupted in the presence of sodium andchloride ions [81].
5. Conclusions
The active research in the field of membrane biophysics deepens the understandingof the structural and functional membrane features in regard to vital processes in cells.In the present study a step forward is performed toward revealing the impact of smallcarbohydrates on the bilayer electrical properties, structure and organization. Modulationof membrane dielectric properties (capacitance and relative permittivity) is reported atmoderate concentrations (above 200 mmol/L) of sucrose in the bulk phase. The aboveparameters are insensitive to the presence of fructose or glucose in the aqueous solution. Acooperative effect of sodium chloride and sucrose on membrane properties is suggested.As obtained by FFT EIS, all three of the small carbohydrate molecules studied here con-tribute to increased bilayer electric resistance. A qualitatively different behavior of thehydrocarbon fluidity in the two types of phosphatidylcholine bilayers, POPC and SOPC,upon the addition of sucrose in the aqueous surroundings is found. The hypothesis aboutsucrose ordering effect in membrane in the proximity of the glycerol backbone is supportedhere. The reduction in rotational diffusion and degree of hydration for the correspondingfluorophore is larger in the presence of the disaccharide studied. Sucrose is found to inducelarger changes in lipid ordering at the glycerol level rather than in the hydrophobic core.A slight increase in the dipole potential is reported for POPC and SOPC bilayers uponthe addition of sodium chloride, glucose, fructose and sucrose. The presented results areexpected to be useful for the appropriate choice of carbohydrates, when the efficiency of theapplication targets the preservation of membrane electric properties. Gaining knowledgeof the modulation of membrane molecular organization and its electric characteristics (ca-pacitance, dielectric permittivity and resistance) by small carbohydrates would foster theelaboration of sugar-based lipid biomimetic systems for electric field-assisted applicationsin food industry, biotechnology and medicine.
Author Contributions: Conceptualization, V.V.; methodology, V.V., G.S. and G.P.; software, G.P.;validation, V.V., G.S. and G.P.; investigation, V.Y., O.P., A.S.-I. and K.A.; writing—original draftpreparation, V.V.; writing—review and editing, G.S. and G.P.; visualization, V.V.; supervision, V.V.;project administration, V.V.; funding acquisition, V.V. and G.S. All authors have read and agreed tothe published version of the manuscript.
Funding: This research and the APC were funded by Bulgarian National Science Fund, grantnumbers DN18/15-2017 and DO1-154/28/08/2018, Scientific Infrastructure on Cell Technologies inBiomedicine (SICTB)—Bulgarian Ministry of Education and Science.
Institutional Review Board Statement: Not applicable.
Informed Consent Statement: Not applicable.
Data Availability Statement: Data is contained within the article.
110
Membranes 2021, 11, 847
Conflicts of Interest: The authors declare no conflict of interest. The funders had no role in the designof the study; in the collection, analyses, or interpretation of data; in the writing of the manuscript, orin the decision to publish the results.
Abbreviations
BLM bilayer lipid membraneDi-8-ANEPPS 4-(2-[6-(Dioctylamino)-2-naphthalenyl]ethenyl)-1-(3-sulfopropyl) pyridinium inner saltDPH 1,6-diphenyl-1,3,5-hexatrieneFFT-EIS fast Fourier transform electrochemical impedance spectroscopyGP generalized polarizationGUV giant unilamellar vesicleITO indium tin oxideLaurdan 6-dodecanoyl-N, N-dimethyl-2-naphthylamineLUV large unilamellar vesiclePC phosphatidylcholinePDMS polydimethylsiloxanePOPC 1-palmitoyl-2-oleoyl-sn-glycero-3-phosphocholineSOPC 1-stearoyl-2-oleoyl-sn-glycero-3-phosphocholine
References1. Crowe, L.M. Lessons from nature: The role of sugars in anhydrobiosis. Comp. Biochem. Physiol. Part A Mol. Integr. Physiol. 2002,
131, 505–513. [CrossRef]2. Panis, B.; Piette, B.; Swennen, R. Droplet vitrification of apical meristems: A cryopreservation protocol applicable to all Musaceae.
Plant Sci. 2005, 168, 45–55. [CrossRef]3. O’Brien, C.; Hiti-Bandaralage, J.; Folgado, R.; Hayward, A.; Lahmeyer, S.; Folsom, J.; Mitter, N. Cryopreservation of Woody Crops:
The Avocado Case. Plants 2021, 10, 934. [CrossRef]4. Rockinger, U.; Funk, M.; Winter, G. Current approaches of preservation of cells during (freeze-) drying. J. Pharm. Sci. 2021, 110,
2873–2893. [CrossRef]5. Vereyken, I.J.; Chupin, V.; Demel, R.A.; Smeekens, S.C.M.; Kruijff, B.D. Fructans insert between the headgroups of phospholipids.
Biochim. Biophys. Acta Biomembr. 2001, 1510, 307–320. [CrossRef]6. Leekumjorn, S.; Sum, A.K. Molecular dynamics study on the stabilization of dehydrated lipid bilayers with glucose and trehalose.
J. Phys. Chem. B 2008, 112, 10732–10740. [CrossRef]7. van den Bogaart, G.; Hermans, N.; Krasnikov, V.; de Vries, A.H.; Poolman, B. On the decrease in lateral mobility of phospholipids
by sugars. Biophys. J. 2007, 92, 1598–1605. [CrossRef]8. Demel, R.A.; Dorrepaal, E.; Ebskamp, M.J.M.; Smeekens, J.C.M.; de Kruijff, B. Fructans interact strongly with model membranes.
Biochim. Biophys. Acta Biomembr. 1998, 1375, 36–42. [CrossRef]9. Nagle, J.F.; Jablin, M.S.; Tristram-Nagle, S. Sugar does not affect the bending and tilt moduli of simple lipid bilayers. Chem. Phys.
Lipids 2016, 196, 76–80. [CrossRef]10. Nagle, J.F.; Jablin, M.S.; Tristram-Nagle, S.; Akabori, K. What are the true values of the bending modulus of simple lipid bilayers?
Chem. Phys. Lipids 2015, 185, 3–10. [CrossRef] [PubMed]11. Vitkova, V.; Genova, J.; Mitov, M.D.; Bivas, I. Sugars in the aqueous phase change the mechanical properties of lipid mono- and
bilayers. Mol. Cryst. Liq. Cryst. 2006, 449, 95–106. [CrossRef]12. Shchelokovskyy, P.; Tristram-Nagle, S.; Dimova, R. Effect of the HIV-1 fusion peptide on the mechanical properties and leaflet
coupling of lipid bilayers. New J. Phys. 2011, 13, 025004. [CrossRef] [PubMed]13. Mitkova, D.; Vitkova, V. The aqueous surroundings alters the bending rigidity of lipid membranes. Russ. J. Electrochem. 2016, 52,
1172–1178. [CrossRef]14. Handbook of Electroporation; Miklavcic, D. (Ed.) Springer: Cham, Switzerland, 2017; Volume 3, p. 2998.15. Schwan, H.P. Dielectrophoresis and Rotation of Cells. In Electroporation and Electrofusion in Cell Biology; Neumann, E., Sowers,
A.E., Jordan, C.A., Eds.; Springer: Boston, MA, USA, 1989. [CrossRef]16. Vitkova, V.; Mitkova, D.; Antonova, K.; Popkirov, G.; Dimova, R. Sucrose solutions alter the electric capacitance and dielectric
permittivity of lipid bilayers. Colloids Surf. A Physicochem. Eng. Asp. 2018, 557, 51–57. [CrossRef]17. Heimburg, T. The capacitance and electromechanical coupling of lipid membranes close to transitions: The effect of electrostriction.
Biophys. J. 2012, 103, 918–929. [CrossRef]18. Huang, W.; Levitt, D.G. Theoretical calculation of the dielectric constant of a bilayer membrane. Biophys. J. 1977, 17, 111–128.
[CrossRef]19. Stern, H.A.; Feller, S.E. Calculation of the dielectric permittivity profile for a nonuniform system: Application to a lipid bilayer
simulation. J. Chem. Phys. 2003, 118, 3401–3412. [CrossRef]
111
Membranes 2021, 11, 847
20. Nymeyer, H.; Zhou, H.-X. A Method to Determine Dielectric Constants in Nonhomogeneous Systems: Application to BiologicalMembranes. Biophys. J. 2008, 94, 1185–1193. [CrossRef]
21. Structure and Dynamics of Membranes; Lipowsky, R.; Sackmann, E. (Eds.) Elsevier: Amsterdam, The Netherlands, 1995.22. Giant Vesicles; Luisi, P.L.; Walde, P. (Eds.) John Wiley & Sons, Ltd.: Chichester, UK, 2000.23. The Giant Vesicle Book, 1st ed.; Dimova, R.; Marques, C. (Eds.) CRC Press: Boca Raton, FL, USA, 2020.24. Allen, T.M.; Cullis, P.R. Drug delivery systems: Entering the mainstream. Science 2004, 303, 1818–1822. [CrossRef]25. Vitkova, V.; Antonova, K.; Popkirov, G.; Mitov, M.D.; Ermakov, Y.A.; Bivas, I. Electrical resistivity of the liquid phase of vesicular
suspensions prepared by different methods. J. Phys. Conf. Ser. 2010, 253, 012059. [CrossRef]26. Khalifat, N.; Fournier, J.B.; Angelova, M.I.; Puff, N. Lipid packing variations induced by pH in cardiolipin-containing bilayers:
The driving force for the cristae-like shape instability. Biochim. Biophys. Acta Biomembr. 2011, 1808, 2724–2733. [CrossRef][PubMed]
27. Gutsmann, T.; Heimburg, T.; Keyser, U.; Mahendran, K.R.; Winterhalter, M. Protein reconstitution into freestanding planar lipidmembranes for electrophysiological characterization. Nat. Protoc. 2015, 10, 188–198. [CrossRef]
28. Montal, M.; Mueller, P. Formation of Bimolecular Membranes from Lipid Monolayers and a Study of Their Electrical Properties.Proc. Natl. Acad. Sci. USA 1972, 69, 3561–3566. [CrossRef] [PubMed]
29. Blitterswijk, M.J.V.; Hoeven, R.P.V.; DerMeer, B.W.V. Lipid structural order parameters (reciprocal of fluidity) in biomembranesderived from steady-state fluorescence polarization measurements. Biochim. Biophys. Acta Biomembr. 1981, 644, 323–332.[CrossRef]
30. Parasassi, T.; Gratton, E. Membrane lipid domains and dynamics as detected by Laurdan fluorescence. J. Fluoresc. 1995, 5, 59–69.[CrossRef] [PubMed]
31. Litman, B.J.; Barenholz, Y. Fluorescent probe: Diphenylhexatriene. Methods Enzymol. 1982, 81, 678–685. [CrossRef] [PubMed]32. Vitkova, V.; Mitkova, D.; Yordanova, V.; Pohl, P.; Bakowsky, U.; Staneva, G.; Batishchev, O. Elasticity and phase behaviour of
biomimetic membrane systems containing tetraether archaeal lipids. Colloids Surf. A Physicochem. Eng. Asp. 2020, 601, 124974.[CrossRef]
33. Clarke, R.J.; Kane, D.J. Optical detection of membrane dipole potential: Avoidance of fluidity and dye-induced effects. Biochim.
Biophys. Acta Biomembr. 1997, 1323, 223–239. [CrossRef]34. Clarke, R.J. Effect of lipid structure on the dipole potential of phosphatidylcholine bilayers. Biochim. Biophys. Acta Biomembr. 1997,
1327, 269–278. [CrossRef]35. Starke-Peterkovic, T.; Clarke, R.J. Effect of headgroup on the dipole potential of phospholipid vesicles. Eur. Biophys. J. 2009, 39,
103. [CrossRef]36. Parisio, G.; Marini, A.; Biancardi, A.; Ferrarini, A.; Mennucci, B. Polarity-Sensitive Fluorescent Probes in Lipid Bilayers: Bridging
Spectroscopic Behavior and Microenvironment Properties. J. Phys. Chem B 2011, 115, 9980–9989. [CrossRef]37. Vlahovska, P.M.; Gracia, R.S.; Aranda-Espinoza, S.; Dimova, R. Electrohydrodynamic model of vesicle deformation in alternating
electric fields. Biophys. J. 2009, 96, 4789–4803. [CrossRef]38. Salipante, P.F.; Knorr, R.L.; Dimova, R.; Vlahovska, P.M. Electrodeformation method for measuring the capacitance of bilayer
membranes. Soft Matter 2012, 8, 3810–3816. [CrossRef]39. Dimova, R.; Bezlyepkina, N.; Jordö, M.D.; Knorr, R.L.; Riske, K.A.; Staykova, M.; Vlahovska, P.M.; Yamamoto, T.; Yang, P.;
Lipowsky, R. Vesicles in electric fields: Some novel aspects of membrane behavior. Soft Matter 2009, 5, 3201–3212. [CrossRef]40. Bockris, J.O.M.; Khan, S.U.M. The Interphasial Structure. In Surface Electrochemistry: A Molecular Level Approach; Springer US,
Plenum Press: New York, NY, USA, 1993; pp. 59–210. [CrossRef]41. Israelachvili, J.N. Intermolecular and Surface Forces; Academic Press: New York, NY, USA, 1985.42. Gongadze, E.; Velikonja, A.; Perutkova, Š.; Kramar, P.; Macek-Lebar, A.; Kralj-Iglic, V.; Iglic, A. Ions and water molecules in an
electrolyte solution in contact with charged and dipolar surfaces. Electrochim. Acta 2014, 126, 42–60. [CrossRef]43. Iglic, A.; Gongadze, E.; Kralj-Iglic, V. Differential Capacitance of Electric Double Layer—Influence of Asymmetric Size of Ions,
Thickness of Stern Layer and Orientational Ordering of Water Dipoles. Acta Chim. Slov. 2019, 66, 8. [CrossRef]44. Velikonja, A.; Perutkova, S.; Gongadze, E.; Kramar, P.; Polak, A.; Macek-Lebar, A.; Iglic, A. Monovalent ions and water dipoles in
contact with dipolar zwitterionic lipid headgroups-theory and MD simulations. Int. J. Mol. Sci 2013, 14, 2846–2861. [CrossRef][PubMed]
45. Needham, D.; Hochmuth, R.M. Electro-mechanical permeabilization of lipid vesicles. Role of membrane tension and compress-ibility. Biophys. J. 1989, 55, 1001–1009. [CrossRef]
46. Popkirov, G.S.; Schindler, R.N. Validation of experimental data in electrochemical impedance spectroscopy. Electrochim. Acta 1993,38, 861–867. [CrossRef]
47. Popkirov, G.S.; Schindler, R.N. A new approach to the problem of “good” and “bad” impedance data in electrochemical impedancespectroscopy. Electrochim. Acta 1994, 39, 2025–2030. [CrossRef]
48. Velikonja, A.; Kramar, P.; Miklavcic, D.; Macek Lebar, A. Specific electrical capacitance and voltage breakdown as a function oftemperature for different planar lipid bilayers. Bioelectrochemistry 2016, 112, 132–137. [CrossRef]
49. Naumowicz, M.; Zajac, M.; Kusaczuk, M.; Gál, M.; Kotynska, J. Electrophoretic Light Scattering and Electrochemical ImpedanceSpectroscopy Studies of Lipid Bilayers Modified by Cinnamic Acid and Its Hydroxyl Derivatives. Membranes 2020, 10, 343.[CrossRef]
112
Membranes 2021, 11, 847
50. Batishchev, O.V.; Indenbom, A.V. Alkylated glass partition allows formation of solvent-free lipid bilayer by Montal-Muellertechnique. Bioelectrochemistry 2008, 74, 22–25. [CrossRef]
51. Luzardo, M.d.C.; Amalfa, F.; Nunez, A.M.; Diaz, S.; Biondi de Lopez, A.C.; Disalvo, E.A. Effect of Trehalose and Sucrose on theHydration and Dipole Potential of Lipid Bilayers. Biophys. J. 2000, 78, 2452–2458. [CrossRef]
52. Starke-Peterkovic, T.; Turner, N.; Else, P.L.; Clarke, R.J. Electric field strength of membrane lipids from vertebrate species:Membrane lipid composition and Na+-K+-ATPase molecular activity. Am. J. Physiol. Regul. Integr. Comp. Physiol. 2005, 288,R663–R670. [CrossRef]
53. Wang, L. Measurements and Implications of the Membrane Dipole Potential. Annu. Rev. Biochem. 2012, 81, 615–635. [CrossRef]54. Benz, R.; Janko, K. Voltage-induced capacitance relaxation of lipid bilayer membranes Effects of membrane composition. Biochim.
Biophys. Acta 1976, 455, 721–738. [CrossRef]55. Alvarez, O.; Latorre, R. Voltage-dependent capacitance in lipid bilayers made from monolayers. Biophys. J. 1978, 21, 1–17.
[CrossRef]56. Schuster, B.; Pum, D.; Braha, O.; Bayley, H.; Sleytr, U. Self-assembled α-hemolysin pores in an S-layer-supported lipid bilayer.
Biochim. Biophys. Acta 1998, 1370, 280–288. [CrossRef]57. Gross, L.; Heron, A.; Baca, S.; Wallace, M. Determining membrane capacitance by dynamic control of droplet interface bilayer
area. Langmuir 2011, 27, 14335–14342. [CrossRef] [PubMed]58. Garten, M.; Mosgaard, L.D.; Bornschlögl, T.; Dieudonné, S.; Bassereau, P.; Toombes, G.E.S. Whole-GUV patch-clamping. Proc.
Natl. Acad Sci. USA 2017, 114, 328–333. [CrossRef]59. Mitov, M.D.; Faucon, J.F.; Méléard, P.; Bothorel, P. Thermal fluctuations of membranes. In Advances in Supramolecular Chemistry;
Gokel, G.W., Ed.; JAI Press Inc.: Stamford, CT, USA, 1992; Volume 2, pp. 93–139.60. Genova, J.; Vitkova, V.; Bivas, I. Registration and analysis of the shape fluctuations of nearly spherical lipid vesicles. Phys. Rev. E
2013, 88, 022707. [CrossRef] [PubMed]61. Taylor, G.J.; Venkatesan, G.A.; Collier, C.P.; Sarles, S.A. Direct in situ measurement of specific capacitance, monolayer tension, and
bilayer tension in a droplet interface bilayer. Soft Matter 2015, 11, 7592–7605. [CrossRef]62. Beltramo, P.J.; Hooghten, R.V.; Vermant, J. Millimeter-area, free standing, phospholipid bilayers. Soft Matter 2016, 12, 4324–4331.
[CrossRef]63. Gracia, R.S.; Bezlyepkina, N.; Knorr, R.L.; Lipowsky, R.; Dimova, R. Effect of cholesterol on the rigidity of saturated and
unsaturated membranes: Fluctuation and electrodeformation analysis of giant vesicles. Soft Matter 2010, 6, 1472–1482. [CrossRef]64. Andersen, H.D.; Wang, C.; Arleth, L.; Peters, G.H.; Westh, P. Reconciliation of opposing views on membrane–sugar interactions.
Proc. Natl. Acad. Sci. USA 2011, 108, 1874–1878. [CrossRef]65. Kucerka, N.; Nieh, M.-P.; Katsaras, J. Fluid phase lipid areas and bilayer thicknesses of commonly used phosphatidylcholines as a
function of temperature. Biochim. Biophys. Acta Biomembr. 2011, 1808, 2761–2771. [CrossRef]66. Matsuki, H.; Goto, M.; Tada, K.; Tamai, N. Thermotropic and barotropic phase behavior of phosphatidylcholine bilayers. Int. J.
Mol. Sci 2013, 14, 2282–2302. [CrossRef]67. Jurkiewicz, P.; Cwiklik, L.; Jungwirth, P.; Hof, M. Lipid hydration and mobility: An interplay between fluorescence solvent
relaxation experiments and molecular dynamics simulations. Biochimie 2012, 94, 26–32. [CrossRef] [PubMed]68. Poojari, C.; Wilkosz, N.; Lira, R.B.; Dimova, R.; Jurkiewicz, P.; Petka, R.; Kepczynski, M.; Róg, T. Behavior of the DPH fluorescence
probe in membranes perturbed by drugs. Chem. Phys. Lipids 2019, 223, 104784. [CrossRef]69. Jurkiewicz, P.; Olzynska, A.; Langner, M.; Hof, M. Headgroup Hydration and Mobility of DOTAP/DOPC Bilayers: A Fluorescence
Solvent Relaxation Study. Langmuir 2006, 22, 8741–8749. [CrossRef] [PubMed]70. Collins, K.D.; Washabaugh, M.W. The Hofmeister effect and the behaviour of water at interfaces. Q. Rev. Biophys. 1985, 18,
323–422. [CrossRef]71. Brockman, H. Dipole potential of lipid membranes. Chem. Phys. Lipids 1994, 73, 57–79. [CrossRef]72. Cevc, G. Hydration force and the interfacial structure of the polar surface. J. Chem. Soc. Faraday Trans. 1991, 87, 2733–2739.
[CrossRef]73. White, G.; Pencer, J.; Nickel, B.G.; Wood, J.M.; Hallett, F.R. Optical changes in unilamellar vesicles experiencing osmotic stress.
Biophys. J. 1996, 71, 2701–2715. [CrossRef]74. Nagle, J.F.; Tristram-Nagle, S. Structure of lipid bilayers. Biochim. Biophys. Acta Biomembr. 2000, 1469, 159–195. [CrossRef]75. Tristram-Nagle, S.; Petrache, H.I.; Nagle, J.F. Structure and Interactions of Fully Hydrated Dioleoylphosphatidylcholine Bilayers.
Biophys. J. 1998, 75, 917–925. [CrossRef]76. Liu, Y.; Nagle, J.F. Diffuse scattering provides material parameters and electron density profiles of biomembranes. Phys. Rev. E
2004, 69, 040901. [CrossRef] [PubMed]77. Kucerka, N.; Tristram-Nagle, S.; Nagle, J.F. Structure of Fully Hydrated Fluid Phase Lipid Bilayers with Monounsaturated Chains.
J. Membrane Biol. 2005, 208, 193–202. [CrossRef]78. Raudino, A.; Mauzerall, D. Dielectric properties of the polar head group region of zwitterionic lipid bilayers. Biophys. J. 1986, 50,
441–449. [CrossRef]79. Vitkova, V.; Minetti, C.; Stoyanova-Ivanova, A. Bending rigidity of lipid bilayers in electrolyte solutions of sucrose. Bulg. Chem.
Commun. 2020, 52, 35–40.
113
Membranes 2021, 11, 847
80. Valley, C.C.; Perlmutter, J.D.; Braun, A.R.; Sachs, J.N. NaCl interactions with phosphatidylcholine bilayers do not alter membranestructure but induce long-range ordering of ions and water. J. Memb. Biol. 2011, 244, 35–42. [CrossRef] [PubMed]
81. Bakaric, D.; Petrov, D.; Mouvencherya, Y.K.; Heiβler, S.; Oostenbrink, C.; Schaumann, G.E. Ion-induced modification of thesucrose network and its impact on melting of freeze-dried liposomes. DSC and molecular dynamics study. Chem. Phys. Lipids
2018, 210, 38–46. [CrossRef] [PubMed]
114
membranes
Review
Mechanical and Electrical Interaction of Biological Membraneswith Nanoparticles and Nanostructured Surfaces
Jeel Raval 1, Ekaterina Gongadze 2, Metka Bencina 3 , Ita Junkar 3 , Niharika Rawat 2, Luka Mesarec 2,Veronika Kralj-Iglic 4 , Wojciech Gózdz 1 and Aleš Iglic 2,5,*
Citation: Raval, J.; Gongadze, E.;
Bencina, M.; Junkar, I.; Rawat, N.;
Mesarec, L.; Kralj-Iglic, V.; Gózdz, W.;
Iglic, A. Mechanical and Electrical
Interaction of Biological Membranes
with Nanoparticles and
Nanostructured Surfaces. Membranes
2021, 11, 533. https://doi.org/
10.3390/membranes11070533
Academic Editor:
Monika Naumowicz
Received: 17 June 2021
Accepted: 5 July 2021
Published: 14 July 2021
Publisher’s Note: MDPI stays neutral
with regard to jurisdictional claims in
published maps and institutional affil-
iations.
Copyright: © 2021 by the authors.
Licensee MDPI, Basel, Switzerland.
This article is an open access article
distributed under the terms and
conditions of the Creative Commons
Attribution (CC BY) license (https://
creativecommons.org/licenses/by/
4.0/).
1 Group of Physical Chemistry of Complex Systems, Institute of Physical Chemistry, Polish Academyof Sciences, 01-224 Warsaw, Poland; [email protected] (J.R.); [email protected] (W.G.)
2 Laboratory of Physics, Faculty of Electrical Engineering, University of Ljubljana, 1000 Ljubljana, Slovenia;[email protected] (E.G.); [email protected] (N.R.); [email protected] (L.M.)
3 Department of Surface Engineering and Optoelectronics, Jožef Stefan Institute, 1000 Ljubljana, Slovenia;[email protected] (M.B.); [email protected] (I.J.)
4 Laboratory of Clinical Biophysics, Faculty of Health Sciences, University of Ljubljana, 1000 Ljubljana,Slovenia; [email protected]
5 Laboratory of Clinical Biophysics, Chair of Orthopaedics, Faculty of Medicine, University of Ljubljana,1000 Ljubljana, Slovenia
* Correspondence: [email protected]; Tel.: +386-1-4768-825
Abstract: In this review paper, we theoretically explain the origin of electrostatic interactions betweenlipid bilayers and charged solid surfaces using a statistical mechanics approach, where the orienta-tional degree of freedom of lipid head groups and the orientational ordering of the water dipolesare considered. Within the modified Langevin Poisson–Boltzmann model of an electric double layer,we derived an analytical expression for the osmotic pressure between the planar zwitterionic lipidbilayer and charged solid planar surface. We also show that the electrostatic interaction between thezwitterionic lipid head groups of the proximal leaflet and the negatively charged solid surface isaccompanied with a more perpendicular average orientation of the lipid head-groups. We furtherhighlight the important role of the surfaces’ nanostructured topography in their interactions withbiological material. As an example of nanostructured surfaces, we describe the synthesis of TiO2 nan-otubular and octahedral surfaces by using the electrochemical anodization method and hydrothermalmethod, respectively. The physical and chemical properties of these nanostructured surfaces aredescribed in order to elucidate the influence of the surface topography and other physical propertieson the behavior of human cells adhered to TiO2 nanostructured surfaces. In the last part of thepaper, we theoretically explain the interplay of elastic and adhesive contributions to the adsorptionof lipid vesicles on the solid surfaces. We show the numerically predicted shapes of adhered lipidvesicles corresponding to the minimum of the membrane free energy to describe the influence ofthe vesicle size, bending modulus, and adhesion strength on the adhesion of lipid vesicles on solidcharged surfaces.
Keywords: lipid bilayer electrostatics; zwitterionic lipid bilayers; electric double layer; osmoticpressure; orientational degree of freedom of lipid headgroups; orientational ordering of waterdipoles; adhesion of lipid vesicles; lipid bilayer elasticity; lipid vesicle shapes
1. Introduction
Biological membranes are an essential constituent of living cells. Their main role is toseparate the interior of the cell from its surroundings, allowing for selective transport of spe-cific materials across the membrane [1]. This article focuses on the interaction of biologicalmembranes with nanostructured surfaces and nanoparticles [1–3]. The main building blockof the biological membranes is the lipid bilayer with embedded inclusions such as proteinsand glycolipids. Isotropic and anisotropic membrane proteins may induce local changes in
115
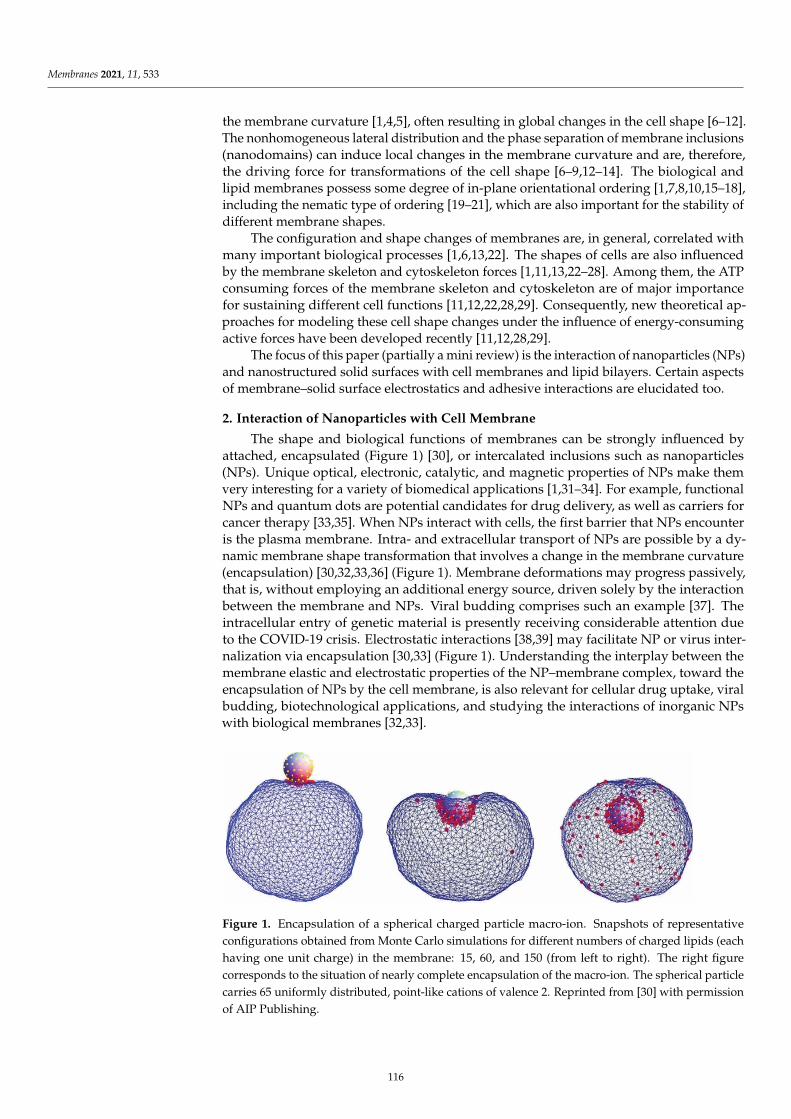
Membranes 2021, 11, 533
the membrane curvature [1,4,5], often resulting in global changes in the cell shape [6–12].The nonhomogeneous lateral distribution and the phase separation of membrane inclusions(nanodomains) can induce local changes in the membrane curvature and are, therefore,the driving force for transformations of the cell shape [6–9,12–14]. The biological andlipid membranes possess some degree of in-plane orientational ordering [1,7,8,10,15–18],including the nematic type of ordering [19–21], which are also important for the stability ofdifferent membrane shapes.
The configuration and shape changes of membranes are, in general, correlated withmany important biological processes [1,6,13,22]. The shapes of cells are also influencedby the membrane skeleton and cytoskeleton forces [1,11,13,22–28]. Among them, the ATPconsuming forces of the membrane skeleton and cytoskeleton are of major importancefor sustaining different cell functions [11,12,22,28,29]. Consequently, new theoretical ap-proaches for modeling these cell shape changes under the influence of energy-consumingactive forces have been developed recently [11,12,28,29].
The focus of this paper (partially a mini review) is the interaction of nanoparticles (NPs)and nanostructured solid surfaces with cell membranes and lipid bilayers. Certain aspectsof membrane–solid surface electrostatics and adhesive interactions are elucidated too.
2. Interaction of Nanoparticles with Cell Membrane
The shape and biological functions of membranes can be strongly influenced byattached, encapsulated (Figure 1) [30], or intercalated inclusions such as nanoparticles(NPs). Unique optical, electronic, catalytic, and magnetic properties of NPs make themvery interesting for a variety of biomedical applications [1,31–34]. For example, functionalNPs and quantum dots are potential candidates for drug delivery, as well as carriers forcancer therapy [33,35]. When NPs interact with cells, the first barrier that NPs encounteris the plasma membrane. Intra- and extracellular transport of NPs are possible by a dy-namic membrane shape transformation that involves a change in the membrane curvature(encapsulation) [30,32,33,36] (Figure 1). Membrane deformations may progress passively,that is, without employing an additional energy source, driven solely by the interactionbetween the membrane and NPs. Viral budding comprises such an example [37]. Theintracellular entry of genetic material is presently receiving considerable attention dueto the COVID-19 crisis. Electrostatic interactions [38,39] may facilitate NP or virus inter-nalization via encapsulation [30,33] (Figure 1). Understanding the interplay between themembrane elastic and electrostatic properties of the NP–membrane complex, toward theencapsulation of NPs by the cell membrane, is also relevant for cellular drug uptake, viralbudding, biotechnological applications, and studying the interactions of inorganic NPswith biological membranes [32,33].
Figure 1. Encapsulation of a spherical charged particle macro-ion. Snapshots of representativeconfigurations obtained from Monte Carlo simulations for different numbers of charged lipids (eachhaving one unit charge) in the membrane: 15, 60, and 150 (from left to right). The right figurecorresponds to the situation of nearly complete encapsulation of the macro-ion. The spherical particlecarries 65 uniformly distributed, point-like cations of valence 2. Reprinted from [30] with permissionof AIP Publishing.
116
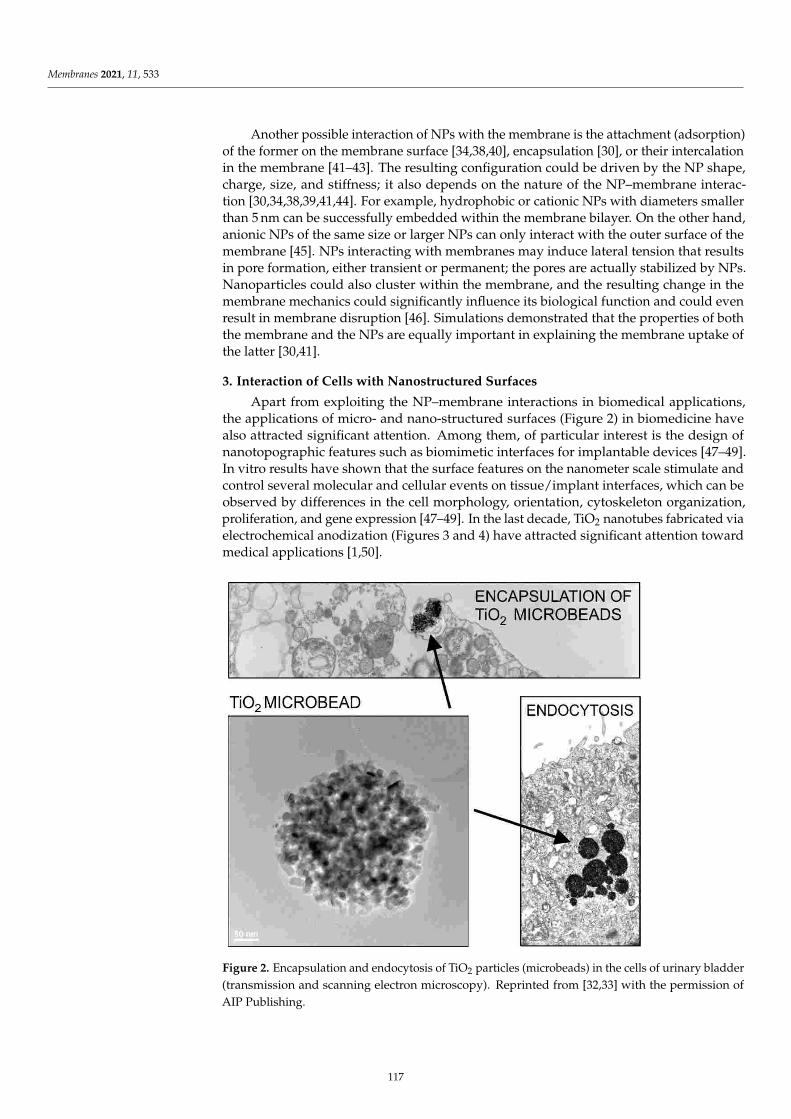
Membranes 2021, 11, 533
Another possible interaction of NPs with the membrane is the attachment (adsorption)of the former on the membrane surface [34,38,40], encapsulation [30], or their intercalationin the membrane [41–43]. The resulting configuration could be driven by the NP shape,charge, size, and stiffness; it also depends on the nature of the NP–membrane interac-tion [30,34,38,39,41,44]. For example, hydrophobic or cationic NPs with diameters smallerthan 5 nm can be successfully embedded within the membrane bilayer. On the other hand,anionic NPs of the same size or larger NPs can only interact with the outer surface of themembrane [45]. NPs interacting with membranes may induce lateral tension that resultsin pore formation, either transient or permanent; the pores are actually stabilized by NPs.Nanoparticles could also cluster within the membrane, and the resulting change in themembrane mechanics could significantly influence its biological function and could evenresult in membrane disruption [46]. Simulations demonstrated that the properties of boththe membrane and the NPs are equally important in explaining the membrane uptake ofthe latter [30,41].
3. Interaction of Cells with Nanostructured Surfaces
Apart from exploiting the NP–membrane interactions in biomedical applications,the applications of micro- and nano-structured surfaces (Figure 2) in biomedicine havealso attracted significant attention. Among them, of particular interest is the design ofnanotopographic features such as biomimetic interfaces for implantable devices [47–49].In vitro results have shown that the surface features on the nanometer scale stimulate andcontrol several molecular and cellular events on tissue/implant interfaces, which can beobserved by differences in the cell morphology, orientation, cytoskeleton organization,proliferation, and gene expression [47–49]. In the last decade, TiO2 nanotubes fabricated viaelectrochemical anodization (Figures 3 and 4) have attracted significant attention towardmedical applications [1,50].
Figure 2. Encapsulation and endocytosis of TiO2 particles (microbeads) in the cells of urinary bladder(transmission and scanning electron microscopy). Reprinted from [32,33] with the permission ofAIP Publishing.
117
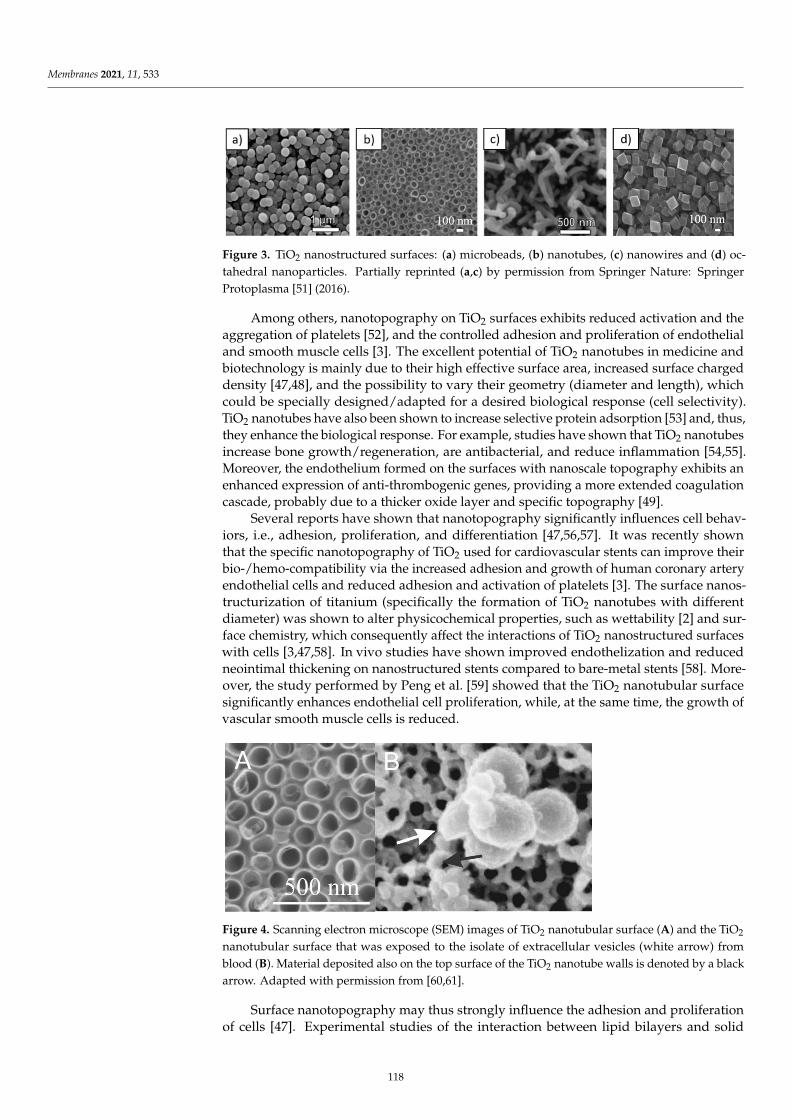
Membranes 2021, 11, 533
Figure 3. TiO2 nanostructured surfaces: (a) microbeads, (b) nanotubes, (c) nanowires and (d) oc-tahedral nanoparticles. Partially reprinted (a,c) by permission from Springer Nature: SpringerProtoplasma [51] (2016).
Among others, nanotopography on TiO2 surfaces exhibits reduced activation and theaggregation of platelets [52], and the controlled adhesion and proliferation of endothelialand smooth muscle cells [3]. The excellent potential of TiO2 nanotubes in medicine andbiotechnology is mainly due to their high effective surface area, increased surface chargeddensity [47,48], and the possibility to vary their geometry (diameter and length), whichcould be specially designed/adapted for a desired biological response (cell selectivity).TiO2 nanotubes have also been shown to increase selective protein adsorption [53] and, thus,they enhance the biological response. For example, studies have shown that TiO2 nanotubesincrease bone growth/regeneration, are antibacterial, and reduce inflammation [54,55].Moreover, the endothelium formed on the surfaces with nanoscale topography exhibits anenhanced expression of anti-thrombogenic genes, providing a more extended coagulationcascade, probably due to a thicker oxide layer and specific topography [49].
Several reports have shown that nanotopography significantly influences cell behav-iors, i.e., adhesion, proliferation, and differentiation [47,56,57]. It was recently shownthat the specific nanotopography of TiO2 used for cardiovascular stents can improve theirbio-/hemo-compatibility via the increased adhesion and growth of human coronary arteryendothelial cells and reduced adhesion and activation of platelets [3]. The surface nanos-tructurization of titanium (specifically the formation of TiO2 nanotubes with differentdiameter) was shown to alter physicochemical properties, such as wettability [2] and sur-face chemistry, which consequently affect the interactions of TiO2 nanostructured surfaceswith cells [3,47,58]. In vivo studies have shown improved endothelization and reducedneointimal thickening on nanostructured stents compared to bare-metal stents [58]. More-over, the study performed by Peng et al. [59] showed that the TiO2 nanotubular surfacesignificantly enhances endothelial cell proliferation, while, at the same time, the growth ofvascular smooth muscle cells is reduced.
Figure 4. Scanning electron microscope (SEM) images of TiO2 nanotubular surface (A) and the TiO2
nanotubular surface that was exposed to the isolate of extracellular vesicles (white arrow) fromblood (B). Material deposited also on the top surface of the TiO2 nanotube walls is denoted by a blackarrow. Adapted with permission from [60,61].
Surface nanotopography may thus strongly influence the adhesion and proliferationof cells [47]. Experimental studies of the interaction between lipid bilayers and solid
118
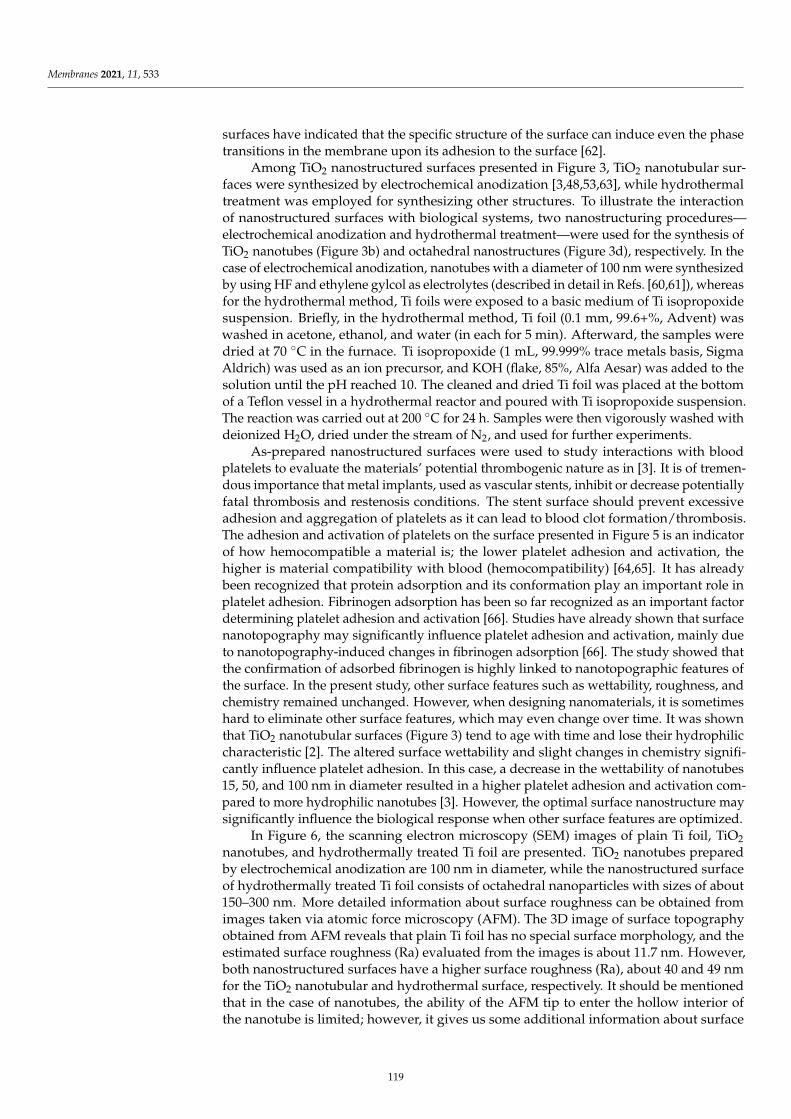
Membranes 2021, 11, 533
surfaces have indicated that the specific structure of the surface can induce even the phasetransitions in the membrane upon its adhesion to the surface [62].
Among TiO2 nanostructured surfaces presented in Figure 3, TiO2 nanotubular sur-faces were synthesized by electrochemical anodization [3,48,53,63], while hydrothermaltreatment was employed for synthesizing other structures. To illustrate the interactionof nanostructured surfaces with biological systems, two nanostructuring procedures—electrochemical anodization and hydrothermal treatment—were used for the synthesis ofTiO2 nanotubes (Figure 3b) and octahedral nanostructures (Figure 3d), respectively. In thecase of electrochemical anodization, nanotubes with a diameter of 100 nm were synthesizedby using HF and ethylene gylcol as electrolytes (described in detail in Refs. [60,61]), whereasfor the hydrothermal method, Ti foils were exposed to a basic medium of Ti isopropoxidesuspension. Briefly, in the hydrothermal method, Ti foil (0.1 mm, 99.6+%, Advent) waswashed in acetone, ethanol, and water (in each for 5 min). Afterward, the samples weredried at 70 C in the furnace. Ti isopropoxide (1 mL, 99.999% trace metals basis, SigmaAldrich) was used as an ion precursor, and KOH (flake, 85%, Alfa Aesar) was added to thesolution until the pH reached 10. The cleaned and dried Ti foil was placed at the bottomof a Teflon vessel in a hydrothermal reactor and poured with Ti isopropoxide suspension.The reaction was carried out at 200 C for 24 h. Samples were then vigorously washed withdeionized H2O, dried under the stream of N2, and used for further experiments.
As-prepared nanostructured surfaces were used to study interactions with bloodplatelets to evaluate the materials’ potential thrombogenic nature as in [3]. It is of tremen-dous importance that metal implants, used as vascular stents, inhibit or decrease potentiallyfatal thrombosis and restenosis conditions. The stent surface should prevent excessiveadhesion and aggregation of platelets as it can lead to blood clot formation/thrombosis.The adhesion and activation of platelets on the surface presented in Figure 5 is an indicatorof how hemocompatible a material is; the lower platelet adhesion and activation, thehigher is material compatibility with blood (hemocompatibility) [64,65]. It has alreadybeen recognized that protein adsorption and its conformation play an important role inplatelet adhesion. Fibrinogen adsorption has been so far recognized as an important factordetermining platelet adhesion and activation [66]. Studies have already shown that surfacenanotopography may significantly influence platelet adhesion and activation, mainly dueto nanotopography-induced changes in fibrinogen adsorption [66]. The study showed thatthe confirmation of adsorbed fibrinogen is highly linked to nanotopographic features ofthe surface. In the present study, other surface features such as wettability, roughness, andchemistry remained unchanged. However, when designing nanomaterials, it is sometimeshard to eliminate other surface features, which may even change over time. It was shownthat TiO2 nanotubular surfaces (Figure 3) tend to age with time and lose their hydrophiliccharacteristic [2]. The altered surface wettability and slight changes in chemistry signifi-cantly influence platelet adhesion. In this case, a decrease in the wettability of nanotubes15, 50, and 100 nm in diameter resulted in a higher platelet adhesion and activation com-pared to more hydrophilic nanotubes [3]. However, the optimal surface nanostructure maysignificantly influence the biological response when other surface features are optimized.
In Figure 6, the scanning electron microscopy (SEM) images of plain Ti foil, TiO2nanotubes, and hydrothermally treated Ti foil are presented. TiO2 nanotubes preparedby electrochemical anodization are 100 nm in diameter, while the nanostructured surfaceof hydrothermally treated Ti foil consists of octahedral nanoparticles with sizes of about150–300 nm. More detailed information about surface roughness can be obtained fromimages taken via atomic force microscopy (AFM). The 3D image of surface topographyobtained from AFM reveals that plain Ti foil has no special surface morphology, and theestimated surface roughness (Ra) evaluated from the images is about 11.7 nm. However,both nanostructured surfaces have a higher surface roughness (Ra), about 40 and 49 nmfor the TiO2 nanotubular and hydrothermal surface, respectively. It should be mentionedthat in the case of nanotubes, the ability of the AFM tip to enter the hollow interior ofthe nanotube is limited; however, it gives us some additional information about surface
119
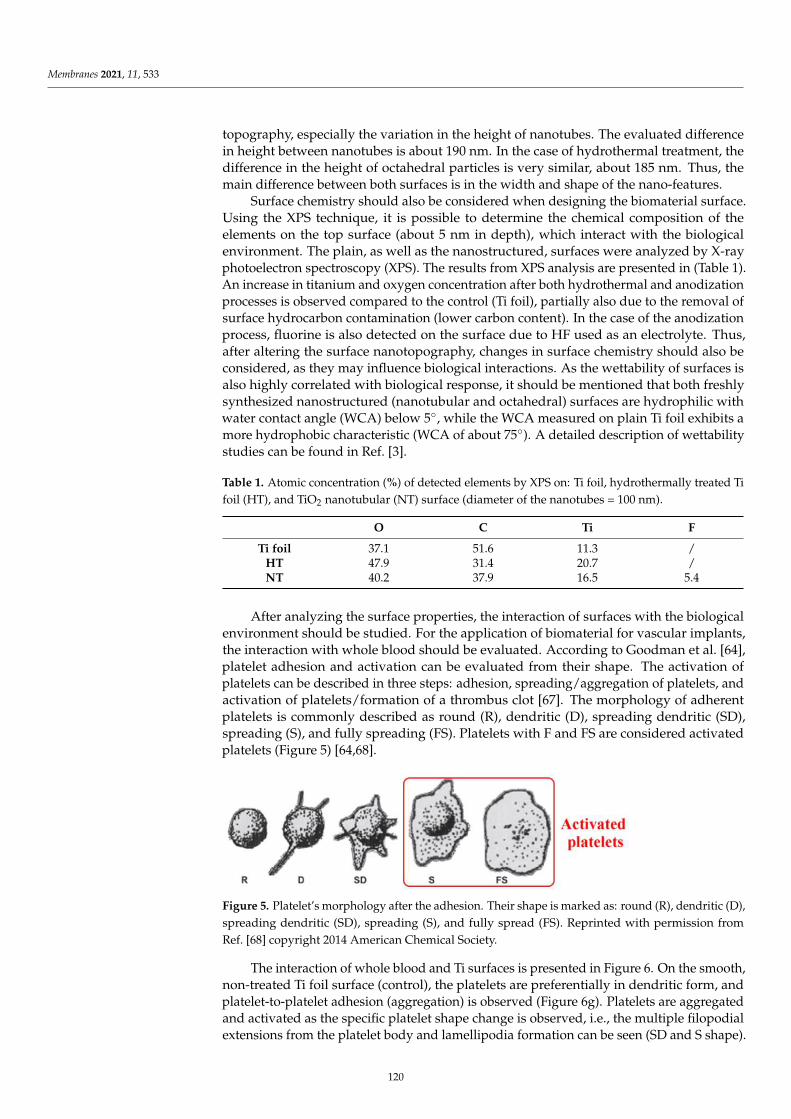
Membranes 2021, 11, 533
topography, especially the variation in the height of nanotubes. The evaluated differencein height between nanotubes is about 190 nm. In the case of hydrothermal treatment, thedifference in the height of octahedral particles is very similar, about 185 nm. Thus, themain difference between both surfaces is in the width and shape of the nano-features.
Surface chemistry should also be considered when designing the biomaterial surface.Using the XPS technique, it is possible to determine the chemical composition of theelements on the top surface (about 5 nm in depth), which interact with the biologicalenvironment. The plain, as well as the nanostructured, surfaces were analyzed by X-rayphotoelectron spectroscopy (XPS). The results from XPS analysis are presented in (Table 1).An increase in titanium and oxygen concentration after both hydrothermal and anodizationprocesses is observed compared to the control (Ti foil), partially also due to the removal ofsurface hydrocarbon contamination (lower carbon content). In the case of the anodizationprocess, fluorine is also detected on the surface due to HF used as an electrolyte. Thus,after altering the surface nanotopography, changes in surface chemistry should also beconsidered, as they may influence biological interactions. As the wettability of surfaces isalso highly correlated with biological response, it should be mentioned that both freshlysynthesized nanostructured (nanotubular and octahedral) surfaces are hydrophilic withwater contact angle (WCA) below 5, while the WCA measured on plain Ti foil exhibits amore hydrophobic characteristic (WCA of about 75). A detailed description of wettabilitystudies can be found in Ref. [3].
Table 1. Atomic concentration (%) of detected elements by XPS on: Ti foil, hydrothermally treated Tifoil (HT), and TiO2 nanotubular (NT) surface (diameter of the nanotubes = 100 nm).
O C Ti F
Ti foil 37.1 51.6 11.3 /HT 47.9 31.4 20.7 /NT 40.2 37.9 16.5 5.4
After analyzing the surface properties, the interaction of surfaces with the biologicalenvironment should be studied. For the application of biomaterial for vascular implants,the interaction with whole blood should be evaluated. According to Goodman et al. [64],platelet adhesion and activation can be evaluated from their shape. The activation ofplatelets can be described in three steps: adhesion, spreading/aggregation of platelets, andactivation of platelets/formation of a thrombus clot [67]. The morphology of adherentplatelets is commonly described as round (R), dendritic (D), spreading dendritic (SD),spreading (S), and fully spreading (FS). Platelets with F and FS are considered activatedplatelets (Figure 5) [64,68].
Figure 5. Platelet’s morphology after the adhesion. Their shape is marked as: round (R), dendritic (D),spreading dendritic (SD), spreading (S), and fully spread (FS). Reprinted with permission fromRef. [68] copyright 2014 American Chemical Society.
The interaction of whole blood and Ti surfaces is presented in Figure 6. On the smooth,non-treated Ti foil surface (control), the platelets are preferentially in dendritic form, andplatelet-to-platelet adhesion (aggregation) is observed (Figure 6g). Platelets are aggregatedand activated as the specific platelet shape change is observed, i.e., the multiple filopodialextensions from the platelet body and lamellipodia formation can be seen (SD and S shape).
120
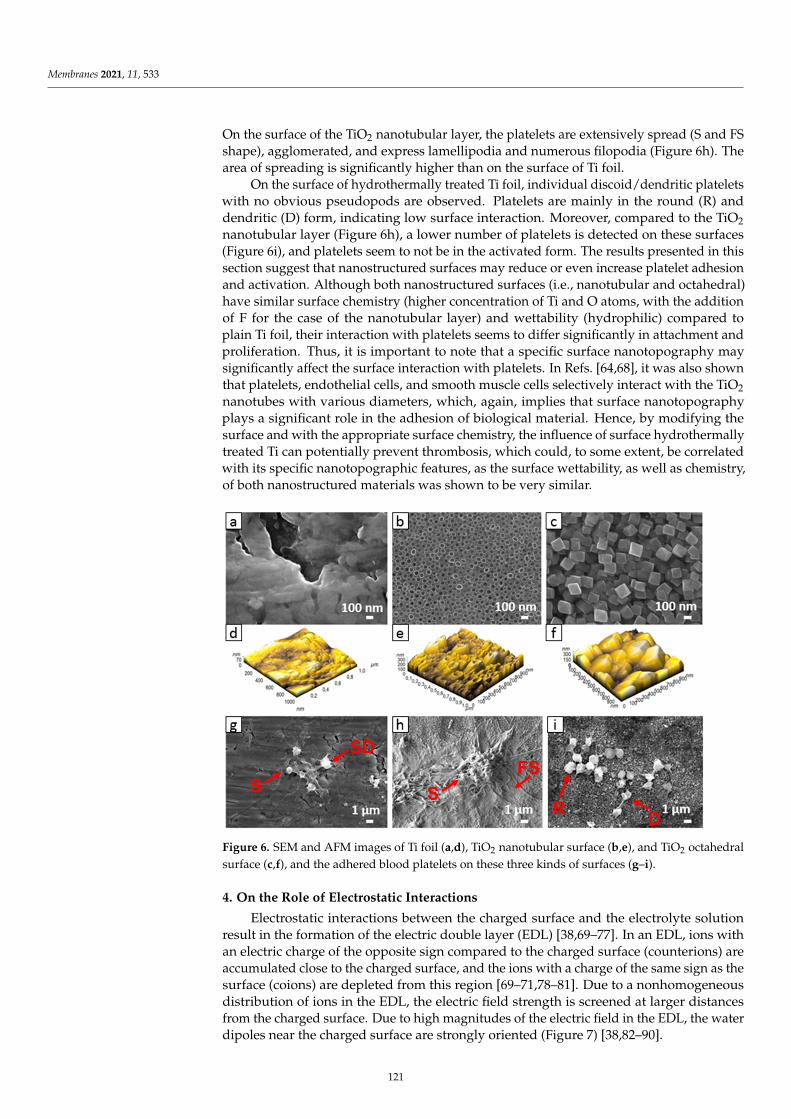
Membranes 2021, 11, 533
On the surface of the TiO2 nanotubular layer, the platelets are extensively spread (S and FSshape), agglomerated, and express lamellipodia and numerous filopodia (Figure 6h). Thearea of spreading is significantly higher than on the surface of Ti foil.
On the surface of hydrothermally treated Ti foil, individual discoid/dendritic plateletswith no obvious pseudopods are observed. Platelets are mainly in the round (R) anddendritic (D) form, indicating low surface interaction. Moreover, compared to the TiO2nanotubular layer (Figure 6h), a lower number of platelets is detected on these surfaces(Figure 6i), and platelets seem to not be in the activated form. The results presented in thissection suggest that nanostructured surfaces may reduce or even increase platelet adhesionand activation. Although both nanostructured surfaces (i.e., nanotubular and octahedral)have similar surface chemistry (higher concentration of Ti and O atoms, with the additionof F for the case of the nanotubular layer) and wettability (hydrophilic) compared toplain Ti foil, their interaction with platelets seems to differ significantly in attachment andproliferation. Thus, it is important to note that a specific surface nanotopography maysignificantly affect the surface interaction with platelets. In Refs. [64,68], it was also shownthat platelets, endothelial cells, and smooth muscle cells selectively interact with the TiO2nanotubes with various diameters, which, again, implies that surface nanotopographyplays a significant role in the adhesion of biological material. Hence, by modifying thesurface and with the appropriate surface chemistry, the influence of surface hydrothermallytreated Ti can potentially prevent thrombosis, which could, to some extent, be correlatedwith its specific nanotopographic features, as the surface wettability, as well as chemistry,of both nanostructured materials was shown to be very similar.
Figure 6. SEM and AFM images of Ti foil (a,d), TiO2 nanotubular surface (b,e), and TiO2 octahedralsurface (c,f), and the adhered blood platelets on these three kinds of surfaces (g–i).
4. On the Role of Electrostatic Interactions
Electrostatic interactions between the charged surface and the electrolyte solutionresult in the formation of the electric double layer (EDL) [38,69–77]. In an EDL, ions withan electric charge of the opposite sign compared to the charged surface (counterions) areaccumulated close to the charged surface, and the ions with a charge of the same sign as thesurface (coions) are depleted from this region [69–71,78–81]. Due to a nonhomogeneousdistribution of ions in the EDL, the electric field strength is screened at larger distancesfrom the charged surface. Due to high magnitudes of the electric field in the EDL, the waterdipoles near the charged surface are strongly oriented (Figure 7) [38,82–90].
121
Membranes 2021, 11, 533
In the past, the first theoretical description of the EDL was introduced by Helmholtz [91,92],who assumed that a single layer of counterions forms at the charged surface. Later, thespatial distribution of point-like ions in the vicinity of the charged surface was describedby the Boltzmann distribution function for the counter-ions and co-ions in the Poissonequation [69,70] within the so-called classical Poisson–Boltzmann (PB) model [69,70]. ThePB model neglects the finite size of molecules and considers the relative permittivityas a constant throughout the whole electrolyte solution, i.e., PB approach neglects thespatial dependence of relative permittivity. A constant relative permittivity is a relativelygood approximation for small magnitudes of surface charge density, but not for highermagnitudes of surface charge density where a substantial decrease in relative permittivitydue to the strong orientational ordering of water dipoles in the vicinity of the chargedsurface was predicted [38,86,88]. In addition, the PB model also does not take into accountthe spatially dependent volume electric charge distribution in the zwitterionic lipidsheadgroup region, which depends on the interaction with neighboring charged bodies andalso on the composition of the electrolyte solution [38,39,43].
The finite size of ions in the theoretical description of the EDL was first incorporatedby Stern [78] with the so-called distance of closest approach and later developed furtherby [71,79–81]. Their work was further improved by numerous theoretical studies andsimulations taking into account the asymmetry of the size of the ions, direct interactionsbetween ions, orientational ordering of water dipoles, discrete charge distribution of thesurface, quantum mechanical approach, etc. [1,72–74,76,84–86,88,90,93–115]. The physicalproperties of the EDL are crucial in understanding the interaction between charged surfacesin electrolyte solutions [34,38,43,116–124].
4.1. Modified Langevin Poisson–Boltzmann model
In the following, we shall describe the theoretical consideration of the electrostaticinteraction (adhesion) between lipid head groups of the proximal leaflet of the lipid bilayerand charged solid surface where the orientational degree of freedom of lipid headgroups istaken into account. Among others, we shall derive, within the modified Langevin Poisson–Boltzmann [38,125,126] model, an analytical expression for the osmotic pressure betweentwo charged surfaces, which can then also be used for the calculation of osmotic pressurebetween the planar lipid bilayer and charged planar surface.
We shall start with a short description of the modified Langevin Poisson–Boltzmann(LPB) model of the electric double layer [38,125,126], which presents the generalizationof classic Poisson–Boltzmann (PB) theory for point-like ions by taking into account theorientational ordering of water molecules in an EDL. In the modified LPB model, theorientational ordering of water dipoles is also considered close to the saturation regime orin the saturation regime, which leads to the prediction that the relative permittivity closeto the charged surface is considerably reduced. The modified LPB model also accountsfor the electronic polarization of the water [38,126]. The space dependency of the relativepermittivity within the modified LPB model is [38,43,126]:
εr(r) = n2 +nw p0
ε0
(
2 + n2
3
)(
L(γp0E(r)β)
E(r)
)
, (1)
where n is the refractive index of water, nw is the bulk number density of water, p0 isthe magnitude of the dipole moment of a water molecule, L(u) = cot h(u)− 1/u is theLangevin function, γ =
(
2 + n2)/2, E(r) is the magnitude (absolute value) of the electricfield strength, β = 1/kT, and kT is the thermal energy. The above expression for the spacedependency of the relative permittivity (Equation (1)) then appears in the modified LPBequation for electric potential φ [38,43,126]:
∇ · [ε0εr(r)∇] = 2e0n0 sin h(e0φ(r)β), (2)
122
Membranes 2021, 11, 533
where we take into account the macroscopic (net) volume charge density of the electrolytesolution written in the form:
ρ(r) = e0 n+(r)− e0 n−(r) = −2e0n0sinh(e0φ(r)β) (3)
and Boltzmann distribution functions for the number densities of monovalent cationsand anions:
n+(r) = n0 exp(−e0φ(r)β), n−(r) = n0(e0φ(r)β) (4)
where n0 is the bulk number density of ions. In the limit of vanishing electric field strength,the above expression for the relative permittivity (Equation (1)) yields the Onsager limitexpression for bulk relative permittivity [38,43,82]:
εr,b = n2 +
(
2 + n2
3
)2nw p2
0β
2ε0(5)
At room temperature T = 298 K, p0 = 3.1 Debye (the Debye is 3.336 × 10⁻³⁰ C/m),and nw/NA = 55 mol/L, Equation (5) gives εr,b = 78.5 for bulk solution. The valuep0 = 3.1 Debye is smaller than the corresponding value in previous similar models of electricdouble layers, also considering orientational ordering of the water dipole (p0 = 4.86 Debye)(see, for example, [86,127]), which did not take into account the cavity field and electronicpolarizability of water molecules. In addition, the model [127] predicts the increase in therelative permittivity in the direction toward the charged surface contrary to the predictionof the modified LPB model, which predicts the decrease in relative permittivity in theelectrolyte solution near the charged surface [38,43,82] in agreement with experimentalresults. The predicted substantial increase in relative permittivity near the charged surfacein [127], therefore, opposes the experimental results and defies the common principles inphysics [87,123,125,126].
4.2. Osmotic Pressure between Two Charged Surfaces within Modified LangevinPoisson–Boltzmann Model
In the following, we shall derive, within the modified LPB theory, the expression for os-motic pressure between two charged planar surfaces (see Figure 7). First, we shall rearrangethe modified LPB equation (Equation (2)) into a planar geometry in the form [38,43,125]:
− d
dx
[
ε0n2 dφ
dx
]
− n0w p0
(
2 + n2
3
)
d
dxL(γp0E(x)β) + 2e0n0 sin h(e0φβ) = 0, (6)
where we take into account Equation (1) for relative permittivity. Equation (6) is firstmultiplied by φ′ = dφ/dx and then integrated to obtain [38,43]
− 12 ε0n2E(x)2 + 2n0kT cos h(−e0φβ)− nw p0
(
2+n2
3
)
E(x)L(γp0E(x)β)+(
2+n2
3
)
nwγβ ln
[
sin h(γp0E(x)β)γp0E(x)β
]
= K,(7)
where the constant K in Equation (7) is the local pressure between the charged surfaces.Equation (7) is equivalent to the contact theorem. In the second step, we subtract thebulk values (outside the space between the charged surfaces) from the local pressurebetween the charged surfaces to obtain the expression for the osmotic pressure differenceΠ = Πinner − Πbulk in the form [38,43]:
Π = − 12 ε0n2E(x)2 + 2n0kT(cos h(−e0φ(x)β)− 1)−
nw p0
(
2+n2
3
)
E(x)L(γp0E(x)β) +(
2+n2
3
)
nwγβ ln
[
sin h(γp0E(x)β)γp0E(x)β
]
.(8)
123
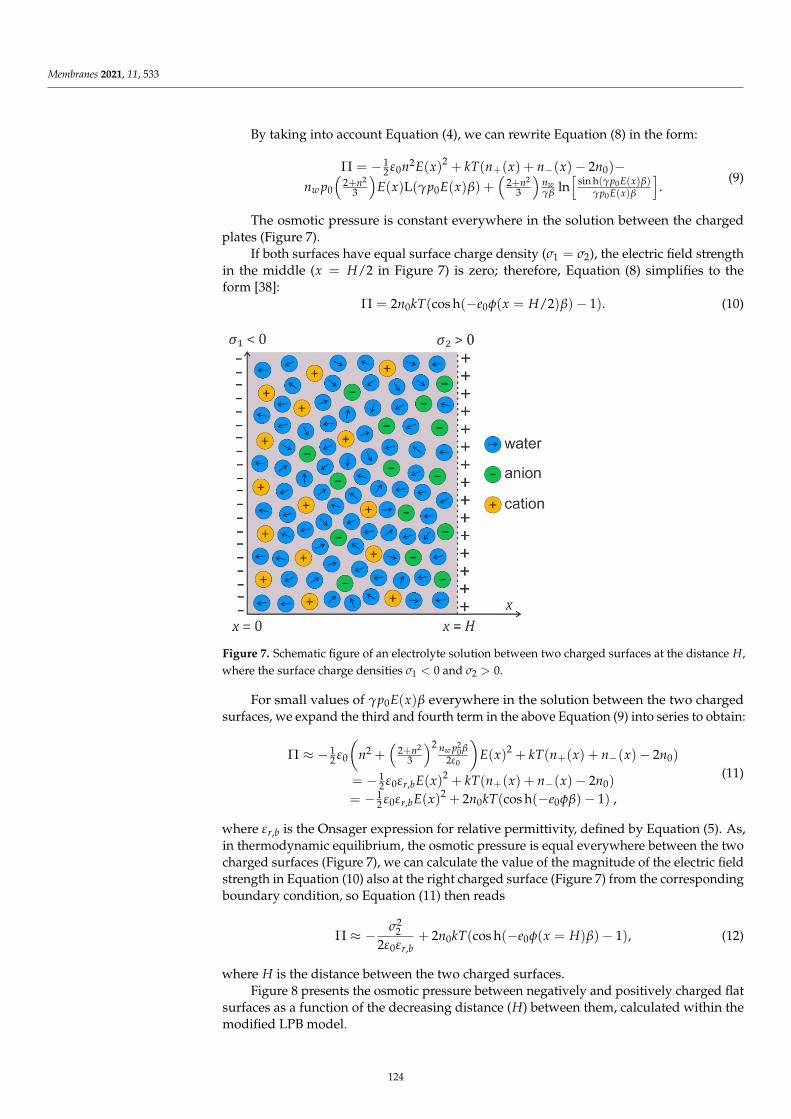
Membranes 2021, 11, 533
By taking into account Equation (4), we can rewrite Equation (8) in the form:
Π = − 12 ε0n2E(x)2 + kT(n+(x) + n−(x)− 2n0)−
nw p0
(
2+n2
3
)
E(x)L(γp0E(x)β) +(
2+n2
3
)
nwγβ ln
[
sin h(γp0E(x)β)γp0E(x)β
]
.(9)
The osmotic pressure is constant everywhere in the solution between the chargedplates (Figure 7).
If both surfaces have equal surface charge density (σ1 = σ2), the electric field strengthin the middle (x = H/2 in Figure 7) is zero; therefore, Equation (8) simplifies to theform [38]:
Π = 2n0kT(cos h(−e0φ(x = H/2)β)− 1). (10)
𝛱 =𝛱 − 𝛱 𝛱 = − 𝜀 𝑛 𝐸(𝑥) + 2𝑛 𝑘𝑇(cosh(−𝑒 𝜙(𝑥)𝛽) − 1) −−𝑛 𝑝 𝐸(𝑥)L(𝛾𝑝 𝐸(𝑥)𝛽) + ln ( ( ) )( )𝛱 = − 𝜀 𝑛 𝐸(𝑥) + 𝑘𝑇(𝑛 (𝑥) + 𝑛 (𝑥) − 2𝑛 ) − 𝑛 𝑝 𝐸(𝑥)L(𝛾𝑝 𝐸(𝑥)𝛽) ++ ln ( ( ) )( )
𝜎 = 𝜎𝑥 = 𝐻/2𝛱 = 2𝑛 𝑘𝑇(cosh(−𝑒 𝜙(𝑥 = 𝐻/2)𝛽) − 1)
𝜎 < 0 𝜎 > 0𝛾𝑝 𝐸(𝑥)𝛽𝛱 ≈ − 12 𝜀 𝑛 + 2 + 𝑛3 𝑛 𝑝 𝛽2𝜀 𝐸(𝑥) + 𝑘𝑇(𝑛 (𝑥) + 𝑛 (𝑥) − 2𝑛 ) =
= − 12 𝜀 𝜀 , 𝐸(𝑥) + 𝑘𝑇(𝑛 (𝑥) + 𝑛 (𝑥) − 2𝑛 ) == − 𝜀 𝜀 , 𝐸(𝑥) + 2𝑛 𝑘𝑇(cosh(−𝑒 𝜙𝛽) − 1)𝜀 ,
Figure 7. Schematic figure of an electrolyte solution between two charged surfaces at the distance H,where the surface charge densities σ1 < 0 and σ2 > 0.
For small values of γp0E(x)β everywhere in the solution between the two chargedsurfaces, we expand the third and fourth term in the above Equation (9) into series to obtain:
Π ≈ − 12 ε0
(
n2 +(
2+n2
3
)2 nw p20β
2ε0
)
E(x)2 + kT(n+(x) + n−(x)− 2n0)
= − 12 ε0εr,bE(x)2 + kT(n+(x) + n−(x)− 2n0)
= − 12 ε0εr,bE(x)2 + 2n0kT(cos h(−e0φβ)− 1) ,
(11)
where εr,b is the Onsager expression for relative permittivity, defined by Equation (5). As,in thermodynamic equilibrium, the osmotic pressure is equal everywhere between the twocharged surfaces (Figure 7), we can calculate the value of the magnitude of the electric fieldstrength in Equation (10) also at the right charged surface (Figure 7) from the correspondingboundary condition, so Equation (11) then reads
Π ≈ − σ22
2ε0εr,b+ 2n0kT(cos h(−e0φ(x = H)β)− 1), (12)
where H is the distance between the two charged surfaces.Figure 8 presents the osmotic pressure between negatively and positively charged flat
surfaces as a function of the decreasing distance (H) between them, calculated within themodified LPB model.
124

Membranes 2021, 11, 533
𝛱 ≈ − , + 2𝑛 𝑘𝑇(cosh(−𝑒 𝜙(𝑥 = 𝐻)𝛽) − 1)𝐻 𝐻
𝜎 = 𝜎 = −𝜎 𝑇 = 𝑛 /𝑁 = 𝑝 = 𝑁
𝐷𝜎 𝑥 = 0𝜎 𝑥 = 𝐻𝜌 (𝑥)
P( 𝑥)
𝜀 𝜀 (𝑥) = 2𝑒 𝑛 sinh(𝑒 𝜙(𝑥)𝛽) − 𝜌 (𝑥)𝜌 (𝑥) = | | ( ) 𝜌 (𝑥 > 𝐷) = 0
P( 𝑥) = Λ ( ( ) )( ( ) ) 0 < 𝑥 ≤ 𝐷
Figure 8. The calculated osmotic pressure between negatively and positively charged flat surfaces asa function of the distance between the two surfaces (H) (see Figure 7), calculated within the modifiedLPB model (Equations (1) and (2)) for two values of the bulk salt concentration. Other modelparameters are: σ1 = 0.2 As/m2, σ2 = −σ1, T = 298 K, concentration of water nw/NA = 55 mol/L,and dipole moment of water p0 = 3.1 Debye, where NA is the Avogadro number.
4.3. Osmotic Pressure between Dipolar Zwitterionic Lipid Bilayer and Charged Rigid Surface
In the model, the zwitterionic dipolar lipid headgroup is composed of the lipids witha positively charged trimethylammonium group and a negatively charged carboxyl group,theoretically described by two charges at fixed distance, D (see Figure 9) [38,43,128]. Thenegative charges of the phosphate groups of dipolar (zwitterionic) lipids are describedby negative surface charge density, σ1 at x = 0, while the opposite charged surface withsurface charge density σ2 is located at x = H. The corresponding Poisson equation in aplanar geometry then reads [38,43,128]:
d
dx
[
ε0εr(x)dφ
dx
]
= 2e0n0 sin h(e0φ(x)β)− ρZW(x), (13)
where ρZW(x) is the volume charge density due to the positively charged trimethylammo-nium group (Figure 9):
ρZW(x) =|σ1|P(x)
Dand ρZW(x > D) = 0, (14)
and P(x) the probability density function [38,43,128]:
P(x) = Λα exp(−e0φ(x)β)
α exp(−e0φ(x)β) + 1, 0 < x ≤ D (15)
The normalization constant is determined from the condition:
1D
∫ D
0P(x)dx = 1. (16)
.P(x) describes the probability that the positive charge of a dipolar lipid headgroup is
located at the distance x from the negatively charged surface at x = 0. The parameter α isequal to the ratio between the average volume of the positively charged parts of dipolar
125
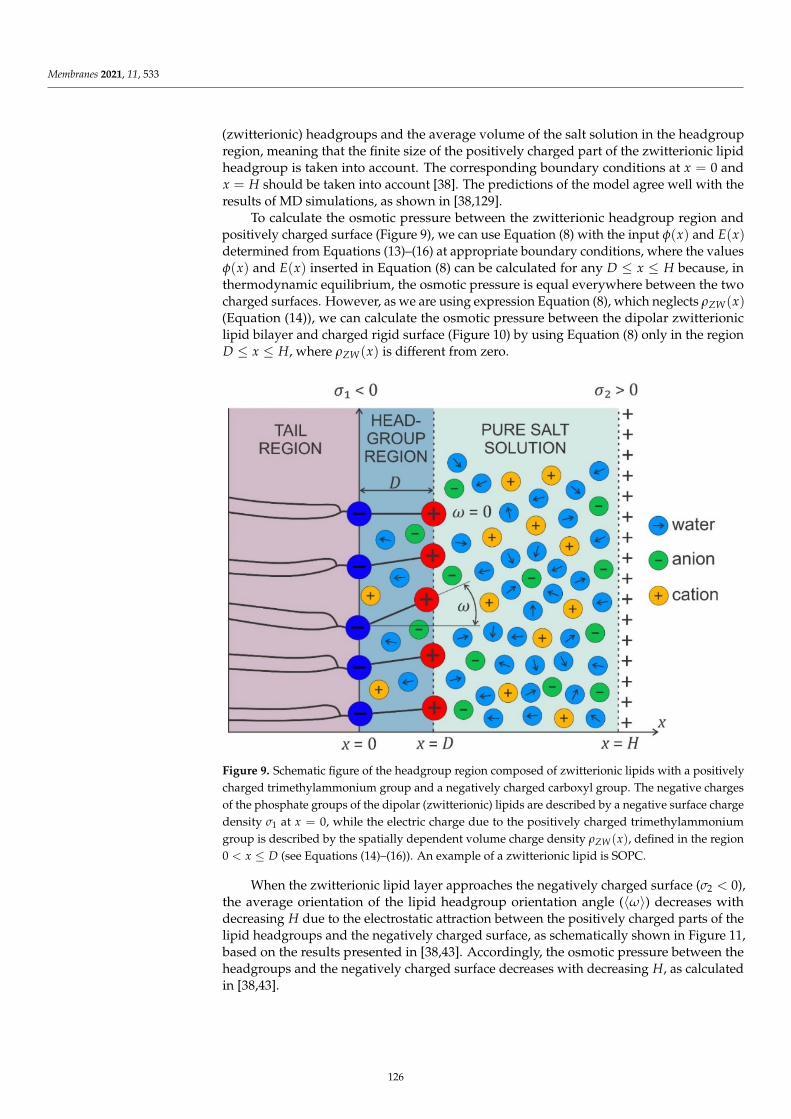
Membranes 2021, 11, 533
(zwitterionic) headgroups and the average volume of the salt solution in the headgroupregion, meaning that the finite size of the positively charged part of the zwitterionic lipidheadgroup is taken into account. The corresponding boundary conditions at x = 0 andx = H should be taken into account [38]. The predictions of the model agree well with theresults of MD simulations, as shown in [38,129].
To calculate the osmotic pressure between the zwitterionic headgroup region andpositively charged surface (Figure 9), we can use Equation (8) with the input φ(x) and E(x)determined from Equations (13)–(16) at appropriate boundary conditions, where the valuesφ(x) and E(x) inserted in Equation (8) can be calculated for any D ≤ x ≤ H because, inthermodynamic equilibrium, the osmotic pressure is equal everywhere between the twocharged surfaces. However, as we are using expression Equation (8), which neglects ρZW(x)(Equation (14)), we can calculate the osmotic pressure between the dipolar zwitterioniclipid bilayer and charged rigid surface (Figure 10) by using Equation (8) only in the regionD ≤ x ≤ H, where ρZW(x) is different from zero.
P(𝑥) 𝑥 𝑥 = 0𝛼𝑥 = 0𝑥 = 𝐻
𝜙(𝑥)𝐸(𝑥) 𝜙(𝑥) 𝐸(𝑥) 𝐷 ≤ 𝑥 ≤ 𝐻𝜌 (𝑥)𝐷 ≤ 𝑥 ≤ 𝐻 𝜌 (𝑥)
𝜎 𝑥 = 0 𝜌 (𝑥)0 < 𝑥 ≤ 𝐷 𝜎 <0 ⟨𝜔⟩𝐻
1𝐷 P( 𝑥)𝑑𝑥 = 1.
Figure 9. Schematic figure of the headgroup region composed of zwitterionic lipids with a positivelycharged trimethylammonium group and a negatively charged carboxyl group. The negative chargesof the phosphate groups of the dipolar (zwitterionic) lipids are described by a negative surface chargedensity σ1 at x = 0, while the electric charge due to the positively charged trimethylammoniumgroup is described by the spatially dependent volume charge density ρZW(x), defined in the region0 < x ≤ D (see Equations (14)–(16)). An example of a zwitterionic lipid is SOPC.
When the zwitterionic lipid layer approaches the negatively charged surface (σ2 < 0),the average orientation of the lipid headgroup orientation angle (〈ω〉) decreases withdecreasing H due to the electrostatic attraction between the positively charged parts of thelipid headgroups and the negatively charged surface, as schematically shown in Figure 11,based on the results presented in [38,43]. Accordingly, the osmotic pressure between theheadgroups and the negatively charged surface decreases with decreasing H, as calculatedin [38,43].
126
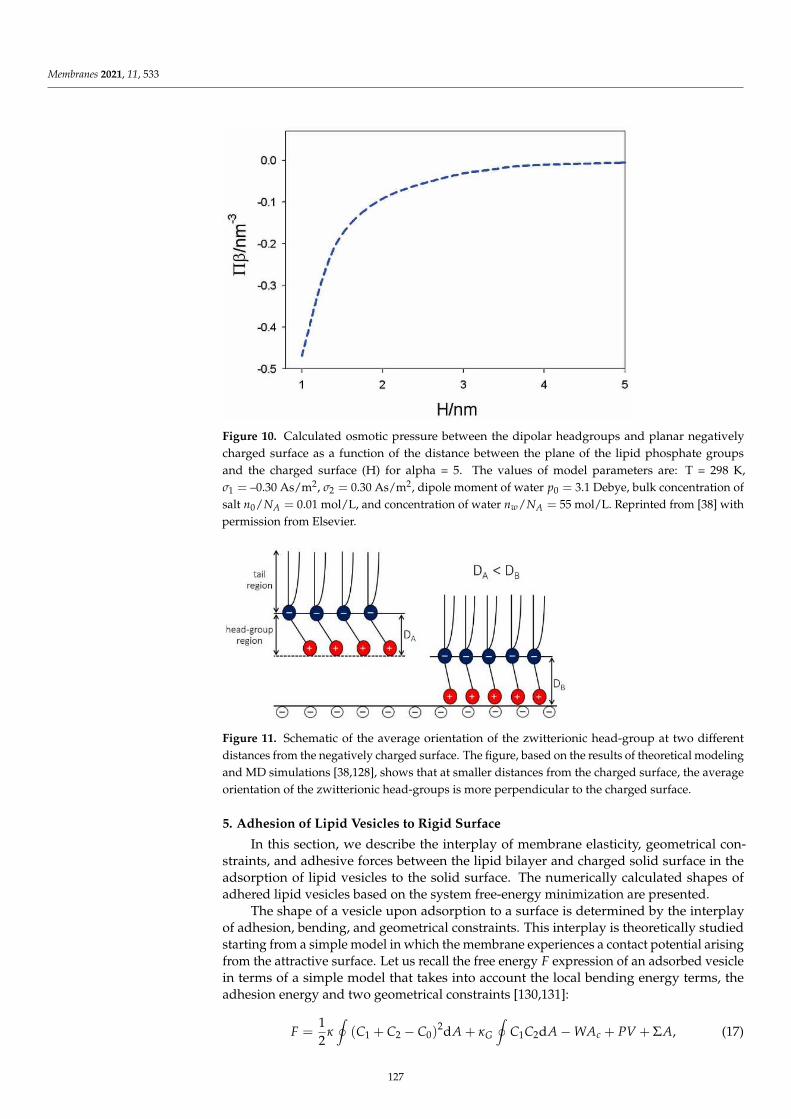
Membranes 2021, 11, 533 𝐻
𝜎 =𝜎 = 𝑝 =𝑛 /𝑁 = 𝑛 /𝑁 =
𝐹
Figure 10. Calculated osmotic pressure between the dipolar headgroups and planar negativelycharged surface as a function of the distance between the plane of the lipid phosphate groupsand the charged surface (H) for alpha = 5. The values of model parameters are: T = 298 K,σ1 = –0.30 As/m2, σ2 = 0.30 As/m2, dipole moment of water p0 = 3.1 Debye, bulk concentration ofsalt n0/NA = 0.01 mol/L, and concentration of water nw/NA = 55 mol/L. Reprinted from [38] withpermission from Elsevier.
𝐻
𝜎 =𝜎 = 𝑝 =𝑛 /𝑁 = 𝑛 /𝑁 =
𝐹
Figure 11. Schematic of the average orientation of the zwitterionic head-group at two differentdistances from the negatively charged surface. The figure, based on the results of theoretical modelingand MD simulations [38,128], shows that at smaller distances from the charged surface, the averageorientation of the zwitterionic head-groups is more perpendicular to the charged surface.
5. Adhesion of Lipid Vesicles to Rigid Surface
In this section, we describe the interplay of membrane elasticity, geometrical con-straints, and adhesive forces between the lipid bilayer and charged solid surface in theadsorption of lipid vesicles to the solid surface. The numerically calculated shapes ofadhered lipid vesicles based on the system free-energy minimization are presented.
The shape of a vesicle upon adsorption to a surface is determined by the interplayof adhesion, bending, and geometrical constraints. This interplay is theoretically studiedstarting from a simple model in which the membrane experiences a contact potential arisingfrom the attractive surface. Let us recall the free energy F expression of an adsorbed vesiclein terms of a simple model that takes into account the local bending energy terms, theadhesion energy and two geometrical constraints [130,131]:
F =12
κ
∮
(C1 + C2 − C0)2dA + κG
∮
C1C2dA − WAc + PV + ΣA, (17)
127
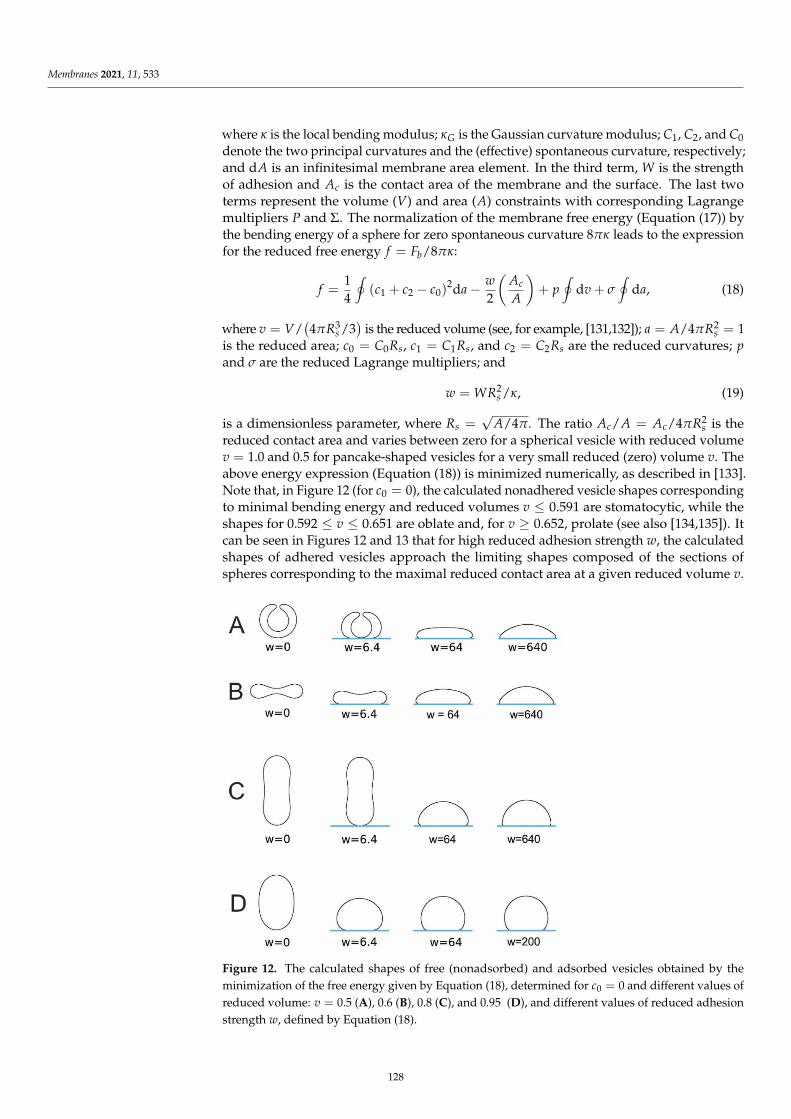
Membranes 2021, 11, 533
where κ is the local bending modulus; κG is the Gaussian curvature modulus; C1, C2, and C0denote the two principal curvatures and the (effective) spontaneous curvature, respectively;and dA is an infinitesimal membrane area element. In the third term, W is the strengthof adhesion and Ac is the contact area of the membrane and the surface. The last twoterms represent the volume (V) and area (A) constraints with corresponding Lagrangemultipliers P and Σ. The normalization of the membrane free energy (Equation (17)) bythe bending energy of a sphere for zero spontaneous curvature 8πκ leads to the expressionfor the reduced free energy f = Fb/8πκ:
f =14
∮
(c1 + c2 − c0)2da − w
2
(
Ac
A
)
+ p∮
dv + σ
∮
da, (18)
where v = V/(
4πR3s /3)
is the reduced volume (see, for example, [131,132]); a = A/4πR2s = 1
is the reduced area; c0 = C0Rs, c1 = C1Rs, and c2 = C2Rs are the reduced curvatures; pand σ are the reduced Lagrange multipliers; and
w = WR2s /κ, (19)
is a dimensionless parameter, where Rs =√
A/4π. The ratio Ac/A = Ac/4πR2s is the
reduced contact area and varies between zero for a spherical vesicle with reduced volumev = 1.0 and 0.5 for pancake-shaped vesicles for a very small reduced (zero) volume v. Theabove energy expression (Equation (18)) is minimized numerically, as described in [133].Note that, in Figure 12 (for c0 = 0), the calculated nonadhered vesicle shapes correspondingto minimal bending energy and reduced volumes v ≤ 0.591 are stomatocytic, while theshapes for 0.592 ≤ v ≤ 0.651 are oblate and, for v ≥ 0.652, prolate (see also [134,135]). Itcan be seen in Figures 12 and 13 that for high reduced adhesion strength w, the calculatedshapes of adhered vesicles approach the limiting shapes composed of the sections ofspheres corresponding to the maximal reduced contact area at a given reduced volume v.
𝐹 = 𝜅 ∮(𝐶 + 𝐶 − 𝐶 ) d𝐴 + 𝜅 ∮ 𝐶 𝐶 d𝐴 − 𝑊𝐴 + 𝑃𝑉 + Σ𝐴𝜅 𝜅 𝐶 𝐶𝐶 d𝐴 𝑊𝐴 𝑉 𝐴𝑃 8𝜋𝜅𝑓 = 𝐹 /8𝜋𝜅𝑣 = 𝑉/(4𝜋𝑅 /3) 𝑎 =𝐴/4𝜋𝑅 = 1 𝑐 = 𝐶 𝑅 𝑐 = 𝐶 𝑅 𝑐 = 𝐶 𝑅𝑝 𝜎
𝑅 = 𝐴/4𝜋 𝐴 /𝐴 = 𝐴 /4𝜋𝑅𝑣 = 1.0 0.5 𝑣𝑐 = 0 𝑣 ≤ 0.5910.592 ≤ 𝑣 ≤ 0.651 𝑣 ≥ 0.652 𝑤𝑣
𝑓 = ∮(𝑐 + 𝑐 − 𝑐 ) d𝑎 − + 𝑝 ∮ d𝑣 + 𝜎 ∮ d𝑎𝑤 = 𝑊𝑅 /𝜅
Figure 12. The calculated shapes of free (nonadsorbed) and adsorbed vesicles obtained by theminimization of the free energy given by Equation (18), determined for c0 = 0 and different values ofreduced volume: v = 0.5 (A), 0.6 (B), 0.8 (C), and 0.95 (D), and different values of reduced adhesionstrength w, defined by Equation (18).
128
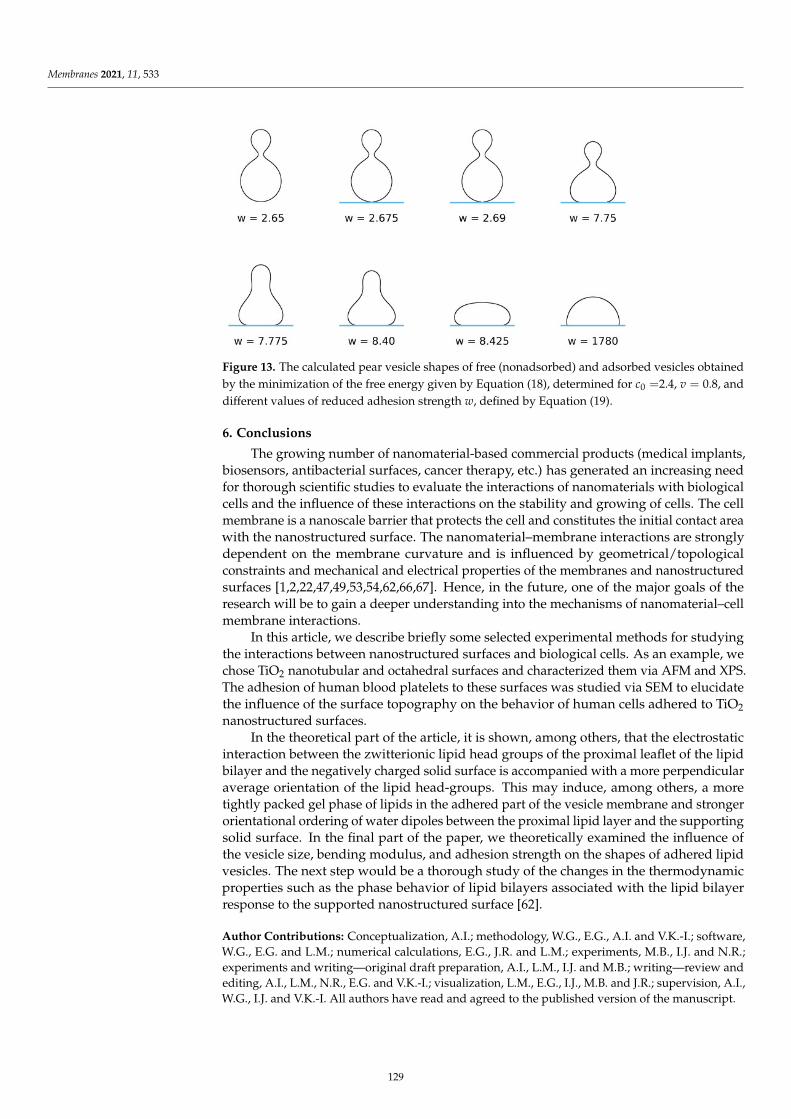
Membranes 2021, 11, 533
𝑐 = 0𝑣 = 0.5 0.6 0.8 0.95 𝑤
𝑐 = 𝑣 = 0.8𝑤Figure 13. The calculated pear vesicle shapes of free (nonadsorbed) and adsorbed vesicles obtainedby the minimization of the free energy given by Equation (18), determined for c0 =2.4, v = 0.8, anddifferent values of reduced adhesion strength w, defined by Equation (19).
6. Conclusions
The growing number of nanomaterial-based commercial products (medical implants,biosensors, antibacterial surfaces, cancer therapy, etc.) has generated an increasing needfor thorough scientific studies to evaluate the interactions of nanomaterials with biologicalcells and the influence of these interactions on the stability and growing of cells. The cellmembrane is a nanoscale barrier that protects the cell and constitutes the initial contact areawith the nanostructured surface. The nanomaterial–membrane interactions are stronglydependent on the membrane curvature and is influenced by geometrical/topologicalconstraints and mechanical and electrical properties of the membranes and nanostructuredsurfaces [1,2,22,47,49,53,54,62,66,67]. Hence, in the future, one of the major goals of theresearch will be to gain a deeper understanding into the mechanisms of nanomaterial–cellmembrane interactions.
In this article, we describe briefly some selected experimental methods for studyingthe interactions between nanostructured surfaces and biological cells. As an example, wechose TiO2 nanotubular and octahedral surfaces and characterized them via AFM and XPS.The adhesion of human blood platelets to these surfaces was studied via SEM to elucidatethe influence of the surface topography on the behavior of human cells adhered to TiO2nanostructured surfaces.
In the theoretical part of the article, it is shown, among others, that the electrostaticinteraction between the zwitterionic lipid head groups of the proximal leaflet of the lipidbilayer and the negatively charged solid surface is accompanied with a more perpendicularaverage orientation of the lipid head-groups. This may induce, among others, a moretightly packed gel phase of lipids in the adhered part of the vesicle membrane and strongerorientational ordering of water dipoles between the proximal lipid layer and the supportingsolid surface. In the final part of the paper, we theoretically examined the influence ofthe vesicle size, bending modulus, and adhesion strength on the shapes of adhered lipidvesicles. The next step would be a thorough study of the changes in the thermodynamicproperties such as the phase behavior of lipid bilayers associated with the lipid bilayerresponse to the supported nanostructured surface [62].
Author Contributions: Conceptualization, A.I.; methodology, W.G., E.G., A.I. and V.K.-I.; software,W.G., E.G. and L.M.; numerical calculations, E.G., J.R. and L.M.; experiments, M.B., I.J. and N.R.;experiments and writing—original draft preparation, A.I., L.M., I.J. and M.B.; writing—review andediting, A.I., L.M., N.R., E.G. and V.K.-I.; visualization, L.M., E.G., I.J., M.B. and J.R.; supervision, A.I.,W.G., I.J. and V.K.-I. All authors have read and agreed to the published version of the manuscript.
129
Membranes 2021, 11, 533
Funding: This project has received funding from the European Union’s Horizon 2020 research andinnovation programme under grant agreement no. 801338 (VES4US project) and from grant nos.P2-0232, P3-0388, J3-9262, J1-9162, and J2-8166 from the Slovenian Research Agency (ARRS). Thispublication is also a part of a project that has received funding from the European Union’s Horizon2020 research and innovation programme under the Marie Skłodowska-Curie grant agreement No.711859. The scientific work was funded from the financial resources for science in the years 2017–2021awarded by the Polish Ministry of Science and Higher Education for the implementation of aninternational co-financed project. WG would like to acknowledge the support from NCN grant No.2018/30/Q/ST3/00434.
Institutional Review Board Statement: The study was conducted according to the guidelines ofthe Declaration of Helsinki and approved by Slovenia’s Ethics Committee (number of approval;56/03/10, date of approval; March 2010).
Informed Consent Statement: Not applicable.
Data Availability Statement: Not applicable.
Acknowledgments: We thank Marko Jeran for technical assistance.
Conflicts of Interest: The authors declare no conflict of interest.
References1. Iglic, A.; Drobne, D.; Kralj-Iglic, V. Nanostructures in Biological Systems: Theory and Applications, 1st ed.; CRC Press: Boca Raton, FL,
USA, 2015.2. Kulkarni, M.; Patil-Sen, Y.; Junkar, I.; Kulkarni, C.V.; Lorenzetti, M.; Iglic, A. Wettability studies of topologically distinct titanium
surfaces. Colloids Surf. B Biointerfaces 2015, 129, 47–53. [CrossRef] [PubMed]3. Junkar, I.; Kulkarni, M.; Bencina, M.; Kovac, J.; Mrak-Poljšak, K.; Lakota, K.; Sodin-Šemrl, S.; Mozetic, M.; Iglic, A. Titanium
dioxide nanotube Arrays for cardiovascular stent applications. ACS Omega 2020, 5, 7280–7289. [CrossRef] [PubMed]4. Fošnaric, M.; Bohinc, K.; Gauger, D.R.; Iglic, A.; Kralj-Iglic, V.; May, S. The influence of anisotropic membrane inclusions on
curvature elastic properties of lipid membranes. J. Chem. Inf. Model. 2005, 45, 1652–1661. [CrossRef] [PubMed]5. Fošnaric, M.; Iglic, A.; May, S. Influence of rigid inclusions on the bending elasticity of a lipid membrane. J. Phys. Rev. E 2006,
74, 051503. [CrossRef]6. Kralj-Iglic, V.; Pocsfalvi, G.; Mesarec, L.; Šuštar, V.; Hägerstrand, H.; Iglic, A. Minimizing isotropic and deviatoric membrane
energy–An unifying formation mechanism of different cellular membrane nanovesicle types. PLoS ONE 2020, 15, e0244796.[CrossRef]
7. Kralj-Iglic, V.; Heinrich, V.; Svetina, S.; Žekš, B. Free energy of closed membrane with anisotropic inclusions. Eur. Phys. J.
B-Condens. Matter Complex Syst. 1999, 10, 5–8. [CrossRef]8. Kralj-Iglic, V.; Svetina, S.; Žekš, B. Shapes of bilayer vesicles with membrane embedded molecules. Eur. Biophys. J. 1996, 24,
311–321. [CrossRef]9. Markin, V.S. Lateral organization of membranes and cell shapes. Biophys. J. 1981, 36, 1–19. [CrossRef]10. Walani, N.; Torres, J.; Agrawal, A. Endocytic proteins drive vesicle growth via instability in high membrane tension environment.
Proc. Natl. Acad. Sci. USA 2015, 112, E1423–E1432. [CrossRef]11. Gov, N.S. Guided by curvature: Shaping cells by coupling curved membrane proteins and cytoskeletal forces. Philos. Trans. R.
Soc. B Biol. Sci. 2018, 373, 20170115. [CrossRef]12. Fošnaric, M.; Penic, S.; Iglic, A.; Kralj-Iglic, V.; Drab, M.; Gov, N.S. Theoretical study of vesicle shapes driven by coupling curved
proteins and active cytoskeletal forces. Soft Matter 2019, 15, 5319–5330. [CrossRef]13. Mesarec, L.; Gózdz, W.; Kralj, S.; Fošnaric, M.; Penic, S.; Kralj-Iglic, V.; Iglic, A. On the role of external force of actin filaments in
the formation of tubular protrusions of closed membrane shapes with anisotropic membrane components. Eur. Biophys. J. 2017,46, 705–718. [CrossRef]
14. Hägerstrand, H.; Mrówczynska, L.; Salzer, U.; Prohaska, R.; Michelsen, K.A.; Kralj-Iglic, V.; Iglic, A. Curvature-dependent lateraldistribution of raft markers in the human erythrocyte membrane. Mol. Membr. Biol. 2006, 23, 277–288. [CrossRef]
15. Fischer, T.M. Bending stiffness of lipid bilayers. III. Gaussian curvature. J. Phys. II 1992, 2, 337–343. [CrossRef]16. Fischer, T.M. Bending stiffness of lipid bilayers. V. Comparison of two formulations. J. Phys. II 1993, 3, 1795–1805. [CrossRef]17. Fournier, J.B. Nontopological saddle-splay and curvature instabilities from anisotropic membrane inclusions. Phys. Rev. Lett.
1996, 76, 4436. [CrossRef] [PubMed]18. Safinya, C.R. Biomolecular materials: Structure, interactions and higher order self-assembly. Colloids Surfaces A Physicochem. Eng.
Asp. 1997, 128, 183–195. [CrossRef]19. Fournier, J.B.; Galatola, P. Bilayer membranes with 2D-nematic order of the surfactant polar heads. Braz. J. Phys. 1998, 28, 329–338.
[CrossRef]
130
Membranes 2021, 11, 533
20. Kralj-Iglic, V.; Babnik, B.; Gauger, D.R.; May, S.; Iglic, A. Quadrupolar ordering of phospholipid molecules in narrow necks ofphospholipid vesicles. J. Stat. Phys. 2006, 125, 727–752. [CrossRef]
21. Penic, S.; Mesarec, L.; Fošnaric, M.; Mrówczynska, L.; Hägerstrand, H.; Kralj-Iglic, V.; Iglic, A. Budding and fission of membranevesicles: A mini review. Front. Phys. 2020, 8, 342. [CrossRef]
22. Graziano, B.R.; Town, J.P.; Sitarska, E.; Nagy, T.L.; Fošnaric, M.; Penic, S.; Iglic, A.; Kralj-Iglic, V.; Gov, N.S.; Diz-Muñoz, A. Cellconfinement reveals a branched-actin independent circuit for neutrophil polarity. PLoS Biol. 2019, 17, e3000457. [CrossRef]
23. Discher, D.E. Biomembrane Mechanical Properties Direct Diverse Cell Functions. In Physics of Biological Membranes; Springer:Berlin/Heidelberg, Germany, 2018; pp. 263–285.
24. Veksler, A.; Gov, N.S. Phase transitions of the coupled membrane-cytoskeleton modify cellular shape. Biophys. J. 2007, 93,3798–3810. [CrossRef] [PubMed]
25. Boulbitch, A.A. Deflection of a cell membrane under application of a local force. Phys. Rev. E 1998, 57, 2123. [CrossRef]26. Iglic, A. A possible mechanism determining the stability of spiculated red blood cells. J. Biomech. 1997, 30, 35–40. [CrossRef]27. Iglic, A.; Kralj-Iglic, V.; Hägerstrand, H. Amphiphile induced echinocyte-spheroechinocyte transformation of red blood cell shape.
Eur. Biophys. J. 1998, 27, 335–339. [CrossRef] [PubMed]28. Alimohamadi, H.; Smith, A.S.; Nowak, R.B.; Fowler, V.M.; Rangamani, P. Non-uniform distribution of myosin-mediated forces
governs red blood cell membrane curvature through tension modulation. PLoS Comput. Biol. 2020, 16, e1007890. [CrossRef]29. Penic, S.; Fošnaric, M.; Mesarec, L.; Iglic, A.; Kralj-Iglic, V. Active forces of myosin motors may control endovesiculation of red
blood cells. Acta Chim. Slov. 2020, 67, 674–681. [CrossRef]30. Fošnaric, M.; Iglic, A.; Kroll, D.M.; May, S. Monte Carlo simulations of complex formation between a mixed fluid vesicle and a
charged colloid. J. Chem. Phys. 2009, 131, 09B610. [CrossRef]31. Rossi, G.; Monticelli, L. Gold nanoparticles in model biological membranes: A computational perspective. Biochim. Biophys. Acta
(BBA) Biomembr. 2016, 1858, 2380–2389. [CrossRef]32. Imani, R.; Veranic, P.; Iglic, A.; Kreft, M.E.; Pazoki, M.; Hudoklin, S. Combined cytotoxic effect of UV-irradiation and TiO2
microbeads in normal urothelial cells, low-grade and high-grade urothelial cancer cells. Photochem. Photobiol. Sci. 2015, 14,583–590. [CrossRef]
33. Imani, R.; Dillert, R.; Bahnemann, D.W.; Pazoki, M.; Apih, T.; Kononenko, V.; Repar, N.; Kralj-Iglic, V.; Boschloo, G.; Drobne, D.Multifunctional gadolinium-Doped mesoporous TiO2 nanobeads: Photoluminescence, enhanced spin relaxation, and reactiveoxygen species photogeneration, beneficial for cancer diagnosis and treatment. Small 2017, 13, 1700349. [CrossRef] [PubMed]
34. Goršak, T.; Drab, M.; Križaj, D.; Jeran, M.; Genova, J.; Kralj, S.; Lisjak, D.; Kralj-Iglic, V.; Iglic, A.; Makovec, D. Magneto-mechanicalactuation of barium-hexaferrite nanoplatelets for the disruption of phospholipid membranes. J. Colloid Interface Sci. 2020, 579,508–519. [CrossRef] [PubMed]
35. Wang, D.; Sun, Y.; Liu, Y.; Meng, F.; Lee, R.J. Clinical translation of immunoliposomes for cancer therapy: Recent perspectives.Expert Opin. Drug Deliv. 2018, 15, 893–903. [CrossRef] [PubMed]
36. Bahrami, A.H.; Lipowsky, R.; Weikl, T.R. The role of membrane curvature for the wrapping of nanoparticles. Soft Matter 2016, 12,581–587. [CrossRef]
37. Cooper, A.; Paran, N.; Shaul, Y. The earliest steps in hepatitis B virus infection. Biochim. Biophys. Acta (BBA) Biomembr. 2003, 1614,89–96. [CrossRef]
38. Gongadze, E.; Velikonja, A.; Perutkova, Š.; Kramar, P.; Macek-Lebar, A.; Kralj-Iglic, V.; Iglic, A. Ions and water molecules in anelectrolyte solution in contact with charged and dipolar surfaces. Electrochim. Acta 2014, 126, 42–60. [CrossRef]
39. Santhosh, P.B.; Velikonja, A.; Perutkova, Š.; Gongadze, E.; Kulkarni, M.; Genova, J.; Eleršic, K.; Iglic, A.; Kralj-Iglic, V.; Ulrih, N.P.Influence of nanoparticle–membrane electrostatic interactions on membrane fluidity and bending elasticity. Chem. Phys. Lipids
2014, 178, 52–62. [CrossRef]40. Šaric, A.; Cacciuto, A. Self-assembly of nanoparticles adsorbed on fluid and elastic membranes. Soft Matter 2013, 9, 6677–6695.
[CrossRef]41. Daniel, M.; Reznícková, J.; Handl, M.; Iglic, A.; Kralj-Iglic, V. Clustering and separation of hydrophobic nanoparticles in lipid
bilayer explained by membrane mechanics. Sci. Rep. 2018, 8, 1–7. [CrossRef]42. Yi, X.; Gao, H. Incorporation of soft particles into lipid vesicles: Effects of particle size and elasticity. Langmuir 2016, 32,
13252–13260. [CrossRef]43. Velikonja, A.; Santhosh, P.B.; Gongadze, E.; Kulkarni, M.; Eleršic, K.; Perutkova, Š.; Kralj-Iglic, V.; Ulrih, N.P.; Iglic, A. Interaction
between dipolar lipid headgroups and charged nanoparticles mediated by water dipoles and ions. Int. J. Mol. Sci. 2013, 14,15312–15329. [CrossRef] [PubMed]
44. Wi, H.S.; Lee, K.; Pak, H.K. Interfacial energy consideration in the organization of a quantum dot–lipid mixed system. J. Phys.
Condens. Matter 2008, 20, 494211.45. Contini, C.; Hindley, J.W.; Macdonald, T.J.; Barritt, J.D.; Ces, O.; Quirke, N. Size dependency of gold nanoparticles interacting
with model membranes. Commun. Chem. 2020, 3, 1–12. [CrossRef] [PubMed]46. Liu, Y.; Zhang, Z.; Zhang, Q.; Baker, G.L.; Worden, R.M. Biomembrane disruption by silica-core nanoparticles: Effect of surface
functional group measured using a tethered bilayer lipid membrane. Biochim. Biophys. Acta (BBA) Biomembr. 2014, 1838, 429–437.[CrossRef]
131
Membranes 2021, 11, 533
47. Gongadze, E.; Kabaso, D.; Bauer, S.; Slivnik, T.; Schmuki, P.; van Rienen, U.; Iglic, A. Adhesion of osteoblasts to a nanoroughtitanium implant surface. Int. J. Nanomed. 2011, 6, 1801.
48. Kulkarni, M.; Mazare, A.; Gongadze, E.; Perutkova, Š.; Kralj-Iglic, V.; Milošev, I.; Schmuki, P.; Iglic, A.; Mozetic, M. Titaniumnanostructures for biomedical applications. Nanotechnology 2015, 26, 062002. [CrossRef]
49. Mohan, C.C.; Chennazhi, K.P.; Menon, D. In vitro hemocompatibility and vascular endothelial cell functionality on titaniananostructures under static and dynamic conditions for improved coronary stenting applications. Acta Biomater. 2013, 9,9568–9577. [CrossRef]
50. Bencina, M.; Iglic, A.; Mozetic, M.; Junkar, I. Crystallized TiO2 nanosurfaces in biomedical applications. Nanomaterials 2020,10, 1121. [CrossRef]
51. Imani, R.; Pazoki, M.; Zupancic, D.; Kreft, M.E.; Kralj-Iglic, V.; Veranic, P.; Iglic, A. Biocompatibility of different nanostructuredTiO2 scaffolds and their potential for urologic applications. Protoplasma 2016, 253, 1439–1447. [CrossRef]
52. Bencina, M.; Junkar, I.; Mavric, T.; Iglic, A.; Kralj-Iglic, V.; Valant, M. Performance of annealed TiO2 nanotubes in interactions withblood platelets. Mater. Tehnol. 2019, 53, 791–795. [CrossRef]
53. Kulkarni, M.; Mazare, A.; Park, J.; Gongadze, E.; Killian, M.S.; Kralj, S.; von der Mark, K.; Iglic, A.; Schmuki, P. Protein interactionswith layers of TiO2 nanotube and nanopore arrays: Morphology and surface charge influence. Acta Biomater. 2016, 45, 357–366.[CrossRef] [PubMed]
54. Ding, X.; Zhou, L.; Wang, J.; Zhao, Q.; Lin, X.; Gao, Y.; Li, S.; Wu, J.; Rong, M.; Guo, Z. The effects of hierarchical mi-cro/nanosurfaces decorated with TiO2 nanotubes on the bioactivity of titanium implants in vitro and in vivo. Int. J. Nanomed.
2015, 10, 6955.55. Neacsu, P.; Mazare, A.; Schmuki, P.; Cimpean, A. Attenuation of the macrophage inflammatory activity by TiO2 nanotubes via
inhibition of MAPK and NF-κB pathways. Int. J. Nanomed. 2015, 10, 6455.56. Yang, L.; Gong, Z.; Lin, Y.; Chinthapenta, V.; Li, Q.; Webster, T.J.; Sheldon, B.W. Disordered topography mediates filopodial
extension and morphology of cells on stiff materials. Adv. Funct. Mater. 2017, 27, 1702689. [CrossRef]57. Guilak, F.; Cohen, D.M.; Estes, B.T.; Gimble, J.M.; Liedtke, W.; Chen, C.S. Control of stem cell fate by physical interactions with
the extracellular matrix. Cell Stem Cell 2009, 5, 17–26. [CrossRef]58. Cherian, A.M.; Joseph, J.; Nair, M.B.; Nair, S.V.; Maniyal, V.; Menon, D. Successful reduction of neointimal hyperplasia on stainless
steel coronary stents by titania nanotexturing. ACS Omega 2020, 5, 17582–17591. [CrossRef]59. Peng, L.; Eltgroth, M.L.; LaTempa, T.J.; Grimes, C.A.; Desai, T.A. The effect of TiO2 nanotubes on endothelial function and smooth
muscle proliferation. Biomaterials 2009, 30, 1268–1272. [CrossRef]60. Kralj-Iglic, V.; Dahmane, R.; Bulc, T.G.; Trebše, P.; Battelino, S.; Kralj, M.B.; Bencina, M.; Bohinc, K.; Božic, D.; Debeljak, M. From
extracellular vesicles to global environment: A cosmopolite SARS-CoV-2 virus. Int. J. Clin. Stud. Med.Case Rep. 2020, 4, 1–23.61. Kulkarni, M.; Šepitka, J.; Junkar, I.; Bencina, M.; Rawat, N.; Mazare, A.; Rode, C.; Gokhale, S.; Schmuki, P.; Daniel, M.; et al.
Mechanical properties of anodic titanium dioxide nanostructures. Mater. Technol. 2021, 55, 19–24. [CrossRef]62. Bibissidis, N.; Betlem, K.; Cordoyiannis, G.; Prista-von Bonhorst, F.; Goole, J.; Raval, J.; Daniel, M.; Gózdz, W.; Iglic, A.;
Losada-Pérez, P. Correlation between adhesion strength and phase behaviour in solid-supported lipid membranes. J. Mol. Liq.
2020, 320, 114492. [CrossRef]63. Bencina, M.; Junkar, I.; Zaplotnik, R.; Valant, M.; Iglic, A.; Mozetic, M. Plasma-induced crystallization of TiO2 nanotubes. Materials
2019, 12, 626. [CrossRef]64. Goodman, S.L.; Grasel, T.G.; Cooper, S.L.; Albrecht, R.M. Platelet shape change and cytoskeletal reorganization on polyuretha-
neureas. J. Biomed. Mater. Res. 1989, 23, 105–123. [CrossRef]65. Schettini, N.; Jaroszeski, M.J.; West, L.; Saddow, S.E. Hemocompatibility assessment of 3C-SiC for cardiovascular applications. In
Silicon Carbide Biotechnology; Elsevier: Waltham, MA, USA, 2012; pp. 153–208.66. Firkowska-Boden, I.; Helbing, C.; Dauben, T.J.; Pieper, M.; Jandt, K.D. How Nanotopography-induced conformational changes of
fibrinogen affect platelet adhesion and activation. Langmuir 2020, 36, 11573–11580. [CrossRef]67. Zarka, R.; Horev, M.B.; Volberg, T.; Neubauer, S.; Kessler, H.; Spatz, J.P.; Geiger, B. Differential modulation of platelet adhesion
and spreading by adhesive ligand density. Nano Lett. 2019, 19, 1418–1427. [CrossRef]68. Ding, Y.; Yang, Z.; Bi, C.W.C.; Yang, M.; Xu, S.L.; Lu, X.; Huang, N.; Huang, P.; Leng, Y. Directing vascular cell selectivity and
hemocompatibility on patterned platforms featuring variable topographic geometry and size. ACS Appl. Mater. Interfaces 2014, 6,12062–12070. [CrossRef]
69. Gouy, M. Sur la constitution de la charge électrique à la surface d’un électrolyte. J. Phys. Le Radium 1910, 9, 457–468. [CrossRef]70. Chapman, D.L.L. A contribution to the theory of electrocapillarity. London Edinburgh Dublin Philos. Mag. J. Sci. 1913, 25, 475–481.
[CrossRef]71. Freise, V. Zur theorie der diffusen doppelschicht. Z. Elektrochem. Ber. Bunsenges. Phys. Chem. 1952, 56, 822–827.72. Torrie, G.M.; Valleau, J.P. Electrical double layers. I. Monte Carlo study of a uniformly charged surface. J. Chem. Phys. 1980, 73,
5807–5816. [CrossRef]73. Kenkel, S.W.; Macdonald, J.R. A lattice model for the electrical double layer using finite-length dipoles. J. Chem. Phys. 1984, 81,
3215–3221. [CrossRef]74. Outhwaite, C.W.; Bhuiyan, L.B. A modified Poisson–Boltzmann equation in electric double layer theory for a primitive model
electrolyte with size-asymmetric ions. J. Chem. Phys. 1986, 84, 3461–3471. [CrossRef]
132
Membranes 2021, 11, 533
75. McLaughlin, S. The electrostatic properties of membranes. Ann. Rev. Biophys. Biophys. Chem. 1989, 18, 113–136. [CrossRef]76. Kralj-Iglic, V.; Iglic, A. A simple statistical mechanical approach to the free energy of the electric double layer including the
excluded volume effect. J. Phys. II 1996, 6, 477–491. [CrossRef]77. Bivas, I. Electrostatic and mechanical properties of a flat lipid bilayer containing ionic lipids: Possibility for formation of domains
with different surface charges. Colloids Surfaces A Physicochem. Eng. Asp. 2006, 282, 423–434. [CrossRef]78. Stern, O. Zur Theorie der elektrolytischen Doppelschicht. Z. Elektrochem. 1924, 30, 508–516.79. Bikerman, J.J. Structure and capacity of electrical double layer. Philos. Mag. 1942, 33, 384–397. [CrossRef]80. Wicke, E.; Eigen, M. Über den Einfluß des Raumbedarfs von Ionen in wäßriger Lösung auf ihre Verteilung in elektrischen Feld
und ihre Aktivitätskoeffizienten. Z. Elektrochem. 1952, 56, 551–561.81. Eigen, M.; Wicke, E. The thermodynamics of electrolytes at higher concentration. J. Phys. Chem. 1954, 58, 702–714. [CrossRef]82. Onsager, L. Electric moments of molecules in liquids. J. Am. Chem. Soc. 1936, 58, 1486–1493. [CrossRef]83. Booth, F. The dielectric constant of water and the saturation effect. J. Chem. Phys. 1951, 19, 391–394. [CrossRef]84. Outhwaite, C.W. A treatment of solvent effects in the potential theory of electrolyte solutions. Mol. Phys. 1976, 31, 1345–1357.
[CrossRef]85. Outhwaite, C.W. Towards a mean electrostatic potential treatment of an ion-dipole mixture or a dipolar system next to a plane
wall. Mol. Phys. 1983, 48, 599–614. [CrossRef]86. Iglic, A.; Gongadze, E.; Bohinc, K. Excluded volume effect and orientational ordering near charged surface in solution of ions and
Langevin dipoles. Bioelectrochemistry 2010, 79, 223–227. [CrossRef]87. Bazant, M.Z.; Kilic, M.S.; Storey, B.D.; Ajdari, A. Towards an understanding of induced-charge electrokinetics at large applied
voltages in concentrated solutions. Adv. Colloid Interface Sci. 2009, 152, 48–88. [CrossRef] [PubMed]88. Gongadze, E.; Iglic, A. Asymmetric size of ions and orientational ordering of water dipoles in electric double layer model-an
analytical mean-field approach. Electrochim. Acta 2015, 178, 541–545. [CrossRef]89. Gongadze, E.; Mesarec, L.; Kralj-Iglic, V.; Iglic, A. Asymmetric finite size of ions and orientational ordering of water in electric
double layer theory within lattice model. Mini Rev. Med. Chem. 2018, 18, 1559–1566. [CrossRef]90. Iglic, A.; Gongadze, E.; Kralj-Iglic, V. Differential Capacitance of Electric Double Layer-Influence of Asymmetric Size of Ions,
Thickness of Stern Layer and Orientational Ordering of Water Dipoles. Acta Chim. Slov. 2019, 66, 534–541. [CrossRef]91. Helmholtz, H. Ueber einige Gesetze der Vertheilung elektrischer Ströme in körperlichen Leitern, mit Anwendung auf die
thierisch-elektrischen Versuche. Ann. Phys. 1853, 165, 353–377. [CrossRef]92. Helmholtz, H.V. Studien über electrische Grenzschichten. Ann. Phys. 1879, 243, 337–382. [CrossRef]93. Liu, C.; Elvati, P.; Majumder, S.; Wang, Y.; Liu, A.P.; Violi, A. Predicting the time of entry of nanoparticles in lipid membranes.
ACS Nano 2019, 13, 10221–10232. [CrossRef] [PubMed]94. Torrie, G.M.; Valleau, J.P. Electrical double layers. 4. Limitations of the Gouy-Chapman theory. J. Phys. Chem. 1982, 86, 3251–3257.
[CrossRef]95. Nielaba, P.; Forstmann, F. Packing of ions near an electrolyte-electrode interface in the hnc/lmsa approximation to the rpm model.
Chem. Phys. Lett. 1985, 117, 46–48. [CrossRef]96. Plischke, M.; Henderson, D. Pair correlation functions and density profiles in the primitive model of the electric double layer. J.
Chem. Phys. 1988, 88, 2712–2718. [CrossRef]97. Kornyshev, A.A. Double-layer in ionic liquids: Paradigm change? J. Phys. Chem. B 2007, 111, 5545–5557. [CrossRef]98. Mier-y-Teran, L.; Suh, S.H.; White, H.S.; Davis, H.T. A nonlocal free-energy density-functional approximation for the electrical
double layer. J. Chem. Phys. 1990, 92, 5087–5098. [CrossRef]99. Strating, P.; Wiegel, F.W. Effects of excluded volume on the electrolyte distribution around a charged sphere. J. Phys. A Math. Gen.
1993, 26, 3383. [CrossRef]100. Lee, J.W.; Nilson, R.H.; Templeton, J.A.; Griffiths, S.K.; Kung, A.; Wong, B.M. Comparison of molecular dynamics with classical
density functional and poisson–boltzmann theories of the electric double layer in nanochannels. J. Chem. Theory Comput. 2012, 8,2012–2022. [CrossRef]
101. Quiroga, M.A.; Xue, K.-H.; Nguyen, T.-K.; Tułodziecki, M.; Huang, H.; Franco, A.A. A multiscale model of electrochemical doublelayers in energy conversion and storage devices. J. Electrochem. Soc. 2014, 161, E3302. [CrossRef]
102. Bandopadhyay, A.; Shaik, V.A.; Chakraborty, S. Effects of finite ionic size and solvent polarization on the dynamics of electrolytesprobed through harmonic disturbances. Phys. Rev. E 2015, 91, 042307. [CrossRef] [PubMed]
103. Lian, C.; Liu, K.; van Aken, K.L.; Gogotsi, Y.; Wesolowski, D.J.; Liu, H.L.; Jiang, D.E.; Wu, J.Z. Enhancing the capacitiveperformance of electric double-layer capacitors with ionic liquid mixtures. ACS Energy Lett. 2016, 1, 21–26. [CrossRef]
104. Drab, M.; Kralj-Iglic, V. Diffuse electric double layer in planar nanostructures due to Fermi-Dirac statistics. Electrochim. Acta 2016,204, 154–159. [CrossRef]
105. Budkov, Y.A.; Kolesnikov, A.L.; Goodwin, Z.A.H.; Kiselev, M.G.; Kornyshev, A.A. Theory of electrosorption of water from ionicliquids. Electrochim. Acta 2018, 284, 346–354. [CrossRef]
106. Budkov, Y.A. Nonlocal statistical field theory of dipolar particles in electrolyte solutions. J. Phys. Condens. Matter 2018, 30, 344001.[CrossRef] [PubMed]
107. Dubtsov, A.V.; Pasechnik, S.V.; Shmeliova, D.V.; Saidgaziev, A.S.; Gongadze, E.; Iglic, A.; Kralj, S. Liquid crystalline droplets inaqueous environments: Electrostatic effects. Soft Matter 2018, 14, 9619–9630. [CrossRef]
133
Membranes 2021, 11, 533
108. Gavish, N.; Elad, D.; Yochelis, A. From solvent-free to dilute electrolytes: Essential components for a continuum theory. J. Phys.
Chem. Lett. 2018, 9, 36–42. [CrossRef] [PubMed]109. Gavish, N. Poisson-Nernst-Planck equations with steric effects—Non-convexity and multiple stationary solutions. Phys. D
Nonlinear Phenom. 2018, 368, 50–65. [CrossRef]110. Kruczek, J.; Chiu, S.-W.; Varma, S.; Jakobsson, E.; Pandit, S.A. Interactions of monovalent and divalent cations at palmitoyl-oleoyl-
phosphatidylcholine interface. Langmuir 2019, 35, 10522–10532. [CrossRef]111. Liu, X.; Tian, R.; Ding, W.; Wu, L.; Li, H. Role of ionic polarization and dielectric decrement in the estimation of surface potential
of clay particles. Eur. J. Soil Sci. 2019, 70, 1073–1081. [CrossRef]112. May, S. Differential capacitance of the electric double layer: Mean-field modeling approaches. Curr. Opin. Electrochem. 2019, 13,
125–131. [CrossRef]113. Cruz, C.; Kondrat, S.; Lomba, E.; Ciach, A. Effect of proximity to ionic liquid-solvent demixing on electrical double layers. J. Mol.
Liq. 2019, 294, 111368. [CrossRef]114. Guardiani, C.; Gibby, W.; Barabash, M.; Luchinsky, D.; Khovanov, I.; McClintock, P. Prehistory probability distribution of ionic
transitions through a graphene nanopore. In Proceedings of the 25th International Conference on Noise and Fluctuations—ICNF2019, Neuchatel, Switzerland, 18–21 June 2019.
115. Khademi, M.; Barz, D.P.J. Structure of the Electrical Double Layer Revisited: Electrode Capacitance in Aqueous Solutions.Langmuir 2020, 36, 4250–4260. [CrossRef]
116. Kjellander, R.; Marcelja, S. Interaction of charged surfaces in electrolyte solutions. Chem. Phys. Lett. 1986, 127, 402–407. [CrossRef]117. Evans, D.F.; Wennerström, H. The Colloidal Domain: Where Physics, Chemistry, Biology, and Technology Meet; Wiley-VCH: Weinheim,
Germany, 1999.118. Butt, H.J.; Graf, K.; Kappl, M. Physics and Chemistry of Interfaces; Wiley-VCH: Weinheim, Germany, 2003.119. Bohinc, K.; Iglic, A.; May, S. Interaction between macroions mediated by divalent rod-like ions. Europhys. Lett. 2004, 68, 494.
[CrossRef]120. Urbanija, J.; Bohinc, K.; Bellen, A.; Maset, S.; Iglic, A.; Kralj-Iglic, V.; Sunil Kumar, P.B. Attraction between negatively charged
surfaces mediated by spherical counterions with quadrupolar charge distribution. J. Chem. Phys. 2008, 129, 105101. [CrossRef]121. Perutková, Š.; Frank, M.; Bohinc, K.; Bobojevic, G.; Zelko, J.; Rozman, B.; Kralj-Iglic, V.; Iglic, A. Interaction between equally
charged membrane surfaces mediated by positively and negatively charged macro-ions. J. Membr. Biol. 2010, 236, 43–53.[CrossRef]
122. Israelachvili, J.N. Intermolecular and Surface Forces, 3rd ed.; Academic Press: London, UK, 2011.123. Prasanna Misra, R.; Das, S.; Mitra, S.K. Electric double layer force between charged surfaces: Effect of solvent polarization. J.
Chem. Phys. 2013, 138, 114703. [CrossRef]124. Gimsa, J.; Wysotzki, P.; Perutkova, S.; Weihe, T.; Elter, P.; Marszałek, P.; Kralj-Iglic, V.; Müller, T.; Iglic, A. Spermidine-induced
attraction of like-charged surfaces is correlated with the pH-dependent spermidine charge: Force spectroscopy characterization.Langmuir 2018, 34, 2725–2733. [CrossRef]
125. Gongadze, E.; van Rienen, U.; Kralj-Iglic, V.; Iglic, A. Langevin Poisson-Boltzmann equation: Point-like ions and water dipolesnear a charged surface. Gen. Physiol. Biophys. 2011, 30, 130–137. [CrossRef]
126. Drab, M.; Gongadze, E.; Kralj-Iglic, V.; Iglic, A. Electric Double Layer and Orientational Ordering of Water Dipoles in NarrowChannels within a Modified Langevin Poisson-Boltzmann Model. Entropy 2020, 22, 1054. [CrossRef] [PubMed]
127. Abrashkin, A.; Andelman, D.; Orland, H. Dipolar Poisson-Boltzmann equation: Ions and dipoles close to charge interfaces. Phys.
Rev. Lett. 2007, 99, 077801. [CrossRef]128. Velikonja, A.; Perutkova, Š.; Gongadze, E.; Kramar, P.; Polak, A.; Macek-Lebar, A.; Iglic, A. Monovalent ions and water dipoles in
contact with dipolar zwitterionic lipid headgroups-theory and MD simulations. Int. J. Mol. Sci. 2013, 14, 2846–2861. [CrossRef]129. Lebar, A.M.; Velikonja, A.; Kramar, P.; Iglic, A. Internal configuration and electric potential in planar negatively charged lipid
head group region in contact with ionic solution. Bioelectrochemistry 2016, 111, 49–56. [CrossRef]130. Lipowsky, R.; Seifert, U. Adhesion of vesicles and membranes. Mol. Cryst. Liq. Cryst. 1991, 202, 17–25. [CrossRef]131. Deuling, H.J.; Helfrich, W. The curvature elasticity of fluid membranes: A catalogue of vesicle shapes. J. Phys. 1976, 37, 1335–1345.
[CrossRef]132. Iglic, A.; Kralj-Iglic, V.; Majhenc, J. Cylindrical shapes of closed lipid bilayer structures correspond to an extreme area difference
between the two monolayers of the bilayer. J. Biomech. 1999, 32, 1343–1347. [CrossRef]133. Gózdz, W.T. Spontaneous curvature induced shape transformations of tubular polymersomes. Langmuir 2004, 20, 7385–7391.
[CrossRef] [PubMed]134. Seifert, U.; Berndl, K.; Lipowsky, R. Shape transformations of vesicles: Phase diagram for spontaneous-curvature and bilayer-
coupling models. Phys. Rev. A 1991, 44, 1182. [CrossRef] [PubMed]135. Mesarec, L.; Gózdz, W.; Iglic, A.; Kralj-Iglic, V.; Virga, E.G.; Kralj, S. Normal red blood cells’ shape stabilized by membrane’s
in-plane ordering. Sci. Rep. 2019, 9, 1–11. [CrossRef]
134
Citation: Zajac, M.; Kotynska, J.;
Worobiczuk, M.; Breczko, J.;
Naumowicz, M. The Effect of
Submicron Polystyrene on the
Electrokinetic Potential of Cell
Membranes of Red Blood Cells and
Platelets. Membranes 2022, 12, 366.
https://doi.org/10.3390/
membranes12040366
Academic Editor: Francisco Monroy
Received: 1 March 2022
Accepted: 22 March 2022
Published: 26 March 2022
Publisher’s Note: MDPI stays neutral
with regard to jurisdictional claims in
published maps and institutional affil-
iations.
Copyright: © 2022 by the authors.
Licensee MDPI, Basel, Switzerland.
This article is an open access article
distributed under the terms and
conditions of the Creative Commons
Attribution (CC BY) license (https://
creativecommons.org/licenses/by/
4.0/).
membranes
Article
The Effect of Submicron Polystyrene on the ElectrokineticPotential of Cell Membranes of Red Blood Cells and PlateletsMarcin Zajac 1, Joanna Kotynska 2 , Mateusz Worobiczuk 2 , Joanna Breczko 2 and Monika Naumowicz 2,*
1 Doctoral School of Exact and Natural Sciences, University of Bialystok, K. Ciolkowskiego 1K,15-245 Bialystok, Poland; [email protected]
2 Department of Physical Chemistry, Faculty of Chemistry, University of Bialystok, K. Ciolkowskiego 1K,15-245 Bialystok, Poland; [email protected] (J.K.); [email protected] (M.W.);[email protected] (J.B.)
* Correspondence: [email protected]; Tel.: +48-8573-880-71
Abstract: In recent years, many scientists have studied the effects of polymer micro- and nanostruc-tures on living organisms. As it turns out, plastic can be a component of the blood of livestock, eatenby humans around the globe. Thus, it seems important to investigate possible changes in the physico-chemical parameters and morphology of the cell membranes of blood morphotic elements (red bloodcells and platelets) under the influence of polymer particles. The article presents research in which cellmembranes were exposed to plain polystyrene (PS) and amino-functionalized polystyrene (PS-NH2)of two different sizes. The polymers were characterized by infrared spectroscopy and dynamiclight-scattering methods. To analyze possible changes caused by polymer exposure in the structureof the membranes, their zeta potentials were measured using the electrophoretic light-scatteringtechnique. The concentration of the polymers, as well as the exposure time, were also taken into theconsideration during the research. Based on the obtained results, we concluded that 100 and 200 nmPS, as well as 100 nm PS-NH2, internalize into the cells. On the contrary, 200 nm PS-NH2 particlesattach to cell membranes. Our study clearly shows that particle size and surface chemistry determinethe interaction with biological membranes.
Keywords: polymers; erythrocytes; platelets; electrophoretic light scattering; dynamic light scattering;FTIR spectroscopy
1. Introduction
Nowadays, it is difficult to imagine functioning without polymers. Polymers are usedin various industries, such as construction [1], electrical engineering [2], and medicine [3].In recent years, more and more researchers from around the world have become interestedin the characteristics of nano- and microplastic. Submicron polymer particles are definedas molecules of plastic smaller than 5 mm in diameter [4]. They are separated into twotypes: (1) Primary plastics, which enter the environment in their micro- and nanoscopicstate, and (2) secondary plastics, which are the result of continuous environmental impactson plastic litter and yield progressively smaller polymer fragments. Polystyrene (PS) is oneof the most commonly used polymers in the production of plastic materials, together withpolyethylene and polypropylene [5]. Its use is found mainly in food packaging, which, dueto COVID-19, became a very busy branch of industry. Synthetic polymers have become aserious concern for the life and health safety of living organisms, as it is becoming clearerjust how omnipresent plastic is in the ecosystem. Human activity is the main cause ofcontamination of the environment with polymers. Additionally, plastic production iscontinually increasing. It is estimated to reach 33 billion tons in 2050 [6]. The consequencesof polymer particle debris for wildlife are becoming better and better documented.
Factors affecting the breakdown of polymers into smaller structures include UV radia-tion [7] or the influence of microorganisms [8–10]. The presence of polymers has already
135
Membranes 2022, 12, 366
been evidenced in soil [11], freshwater [12], oceans [13], plants [14], animal organisms [15],and food products [16]. Mass production of plastic articles in society poses great risks, asthese items should be properly disposed of or recycled. If these processes do not take place,polymers will certainly end up in the environment. Given plastic’s ubiquitous nature andsmall dimensions, its ingestion and subsequent impact on living organisms is a growingcause for concern. At cellular and molecular levels, alterations of immunological responses,neurotoxic effects, and the onset of genotoxicity have been observed in water-dwellingorganisms exposed to polystyrene particles [17,18].
Domestic pigs (Sus domestica) are particularly useful in biomedical research for severalreasons. This species is characterized by high fertility and occurs in many genotypesand phenotypes, which is important for the selection of appropriate genetic material formedicinal studies [19–22]. The usage of biological material from pigs raises less oppositionin laboratory tests than tests on dogs or cats. Sus domestica is very important in medicalsciences such as surgery [23,24] and pharmacy [25,26] because of correlations betweentheir bodies and humans. Pigs are not only comparable in size, but also have analogiesto humans in the structure of their digestive, nervous, circulatory, and urinary systems.These similarities in the anatomy and physiology of Sus domestica and Homo sapiens are onereason biological material from pigs can be used for reliable modeling of cellular processesof human bodies.
Soil is also believed to be a pathway for micropolymers to enter living organisms. Asit was found out, plastic particles can enter plants grown in heavily polluted areas [27].This could lead to the consumption of polymers while eating contaminated vegetables byhumans or animals. Other studies have shown that digesting processes do not break downplastic, and synthetic polymers can be a component of manure [28]. Scientists discoveredpolymers in the muscle tissue of marine animals, such as turtles [29] or fish [30]. It isindicated that plastic particles can also cross the blood–brain barrier. The consequenceof this is the accumulation of polymers in the microglia cells, worsening their ability tomultiply and leading to their death [31]. This information sheds a different light on theeffects of polymers on human cells, including cell membranes.
Thus, food consumption can be a direct path of entry to the human body for microp-olymers. Scientists believe that polymer molecules can move up the food chain thanksto their presence in the bloodstream of animals [32]. Thus, any type of meat could be apotential route for micro- and nanopolymers to enter the human system. This could havevery serious consequences for health and wellness. Many tests have to be carried out toassess the toxicity and transport pathway of micropolymers from livestock, e.g., pigs, tothe human body.
Experimental studies of the electrical properties of natural cell membranes can con-tribute to our knowledge of their properties, function, and structure. The zeta potential(otherwise known as the electrokinetic potential, ζ) of membranes is an extremely impor-tant electrical parameter that depends on the composition of the cytoplasmic membrane.This parameter defines the stability of a system and allows one to determine whether modi-fications of the natural system with polymers affect changes in the structure of the naturalmembrane. The zeta potential varies according to many parameters, such as temperature,pH, conductivity (ionic strength), and solvent (viscosity). Thus, small modifications toany of these parameters may have a significant influence on the zeta potential values [33].One technique used to estimate zeta potential is electrophoretic light scattering (ELS), atechnique based on dynamic light scattering (DLS), in which the shift in the frequencyor oscillation phase of the laser beam depends on the mobility of particles/cells in analternating electric field [34].
The purpose of the research presented in this article is to assess the influence ofPS particles on the zeta potential of Sus domestica blood components—red blood cells(RBCs), also referred to as erythrocytes and platelets (thrombocytes). We chose polystyreneas it does not generate reactive oxygen species in the presence of cells, and membranedamage by oxidative stress is unlikely [35]. Two sizes of two types of polystyrene were
136
Membranes 2022, 12, 366
used: 100 nm plain polystyrene (PS-100) and 200 nm plain polystyrene (PS-200), as well as100 nm polystyrene with amino groups (PS-NH2-100) and 200 nm polystyrene with aminogroups (PS-NH2-200). In addition, different particle concentrations and exposure timesto the polymer were applied. Based on the knowledge of the authors, such a thoroughanalysis has never been performed before.
2. Materials and Methods2.1. Materials
2.1.1. Domestic Pig Blood
The blood was obtained from the Bost Meat Plant in Turosn Koscielna from adult pigsof the species Sus domestica. Animal blood was collected directly into sterile test tubes madeof unbreakable plastic with buffered sodium citrate in a ratio of 1:9 to biological material.Those test tubes were delivered to the laboratory, where individual morphotic elements ofblood were immediately isolated.
2.1.2. Polymers
The following polymers were used to modify the biological membranes of the mor-photic blood elements of Sus domestica: PS-100 and PS-200 (purchased from Sigma Aldrich,Saint Louis, MO, USA), PS-NH2-100 (purchased from Polysciences, Hirschberg an derBergstrasse, Germany), and PS-NH2-200 (purchased from Bang Laboratories, Fishers, IN,USA). Each polymer was used at the concentrations of 0.002, 0.01, 0.1, and 0.5 mg/mL. Thepolymers were diluted to the appropriate concentration using 0.155 M sodium chloride,in which the blood was also suspended for physiological conditions. In preliminary ex-perimental studies, the stability and durability of the tested polymers in the electrolytesolution were investigated using the DLS method. The tests were performed immediatelyafter mixing morphotic blood elements with polymers and after 1 h and 3 h of exposure toplastic particles.
2.2. Methods
2.2.1. Isolation of Erythrocytes from Blood
The blood samples (2 mL volume) were centrifuged at 900 rpm for 8 min at roomtemperature. The red blood cells fell to the bottom of the tube, while the thrombocyte-rich plasma was removed from the system and further isolation was performed. Theerythrocytes were washed three times with a 0.155 M NaCl solution at 3000 rpm for15 min to obtain a clean erythrocyte-rich system. Finally, the washed red blood cells weresuspended in an electrolyte solution (0.155 M NaCl) to prepare them for measurement viaelectrophoretic light scattering.
2.2.2. Isolation of Thrombocytes from Plasma
The plasma was centrifuged at 4000 rpm for 8 min. Thrombocytes remained at thebottom of the tube after centrifugation. The plasma was removed from the vial. Theplatelets were washed three times with 0.155 M sodium chloride, as were the erythrocytes.Finally, the thrombocytes were added to the electrolyte solution (0.155 M NaCl). Thissolution was then used during measurements performed by the ELS technique.
2.2.3. Comparison of Different Polymers by FTIR Spectroscopy
The Fourier transform infrared (FTIR) measurements were performed on the Nicolet6700 spectrometer (Thermo Scientific, Madison, WI, USA) in transmission mode using theKBr method. First, the stock solutions of the different PS microspheres (PS-100, PS-200,PS-NH2-100, and PS-NH2-200) were diluted with distilled water to a concentration of0.1 mg/mL. Next, aqueous PS solutions were frozen with liquid nitrogen and lyophilizedin a freeze dryer (Christ Alpha 1–2 LD plus with double–chamber, Osterode am Harz,Germany) for 24 h under 0.013 mbar pressure. The obtained powder samples were mixedand ground in an agate mortar with dry KBr at a mass ratio of 1:100. The powders
137
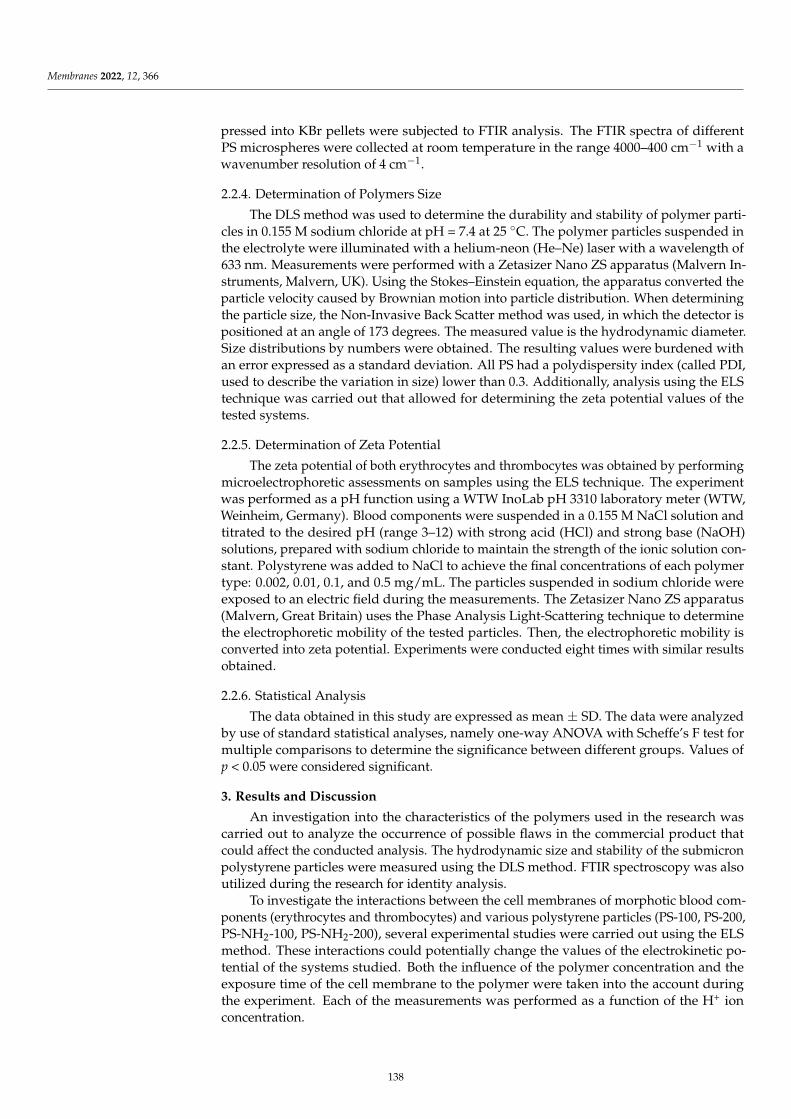
Membranes 2022, 12, 366
pressed into KBr pellets were subjected to FTIR analysis. The FTIR spectra of differentPS microspheres were collected at room temperature in the range 4000–400 cm−1 with awavenumber resolution of 4 cm−1.
2.2.4. Determination of Polymers Size
The DLS method was used to determine the durability and stability of polymer parti-cles in 0.155 M sodium chloride at pH = 7.4 at 25 C. The polymer particles suspended inthe electrolyte were illuminated with a helium-neon (He–Ne) laser with a wavelength of633 nm. Measurements were performed with a Zetasizer Nano ZS apparatus (Malvern In-struments, Malvern, UK). Using the Stokes–Einstein equation, the apparatus converted theparticle velocity caused by Brownian motion into particle distribution. When determiningthe particle size, the Non-Invasive Back Scatter method was used, in which the detector ispositioned at an angle of 173 degrees. The measured value is the hydrodynamic diameter.Size distributions by numbers were obtained. The resulting values were burdened withan error expressed as a standard deviation. All PS had a polydispersity index (called PDI,used to describe the variation in size) lower than 0.3. Additionally, analysis using the ELStechnique was carried out that allowed for determining the zeta potential values of thetested systems.
2.2.5. Determination of Zeta Potential
The zeta potential of both erythrocytes and thrombocytes was obtained by performingmicroelectrophoretic assessments on samples using the ELS technique. The experimentwas performed as a pH function using a WTW InoLab pH 3310 laboratory meter (WTW,Weinheim, Germany). Blood components were suspended in a 0.155 M NaCl solution andtitrated to the desired pH (range 3–12) with strong acid (HCl) and strong base (NaOH)solutions, prepared with sodium chloride to maintain the strength of the ionic solution con-stant. Polystyrene was added to NaCl to achieve the final concentrations of each polymertype: 0.002, 0.01, 0.1, and 0.5 mg/mL. The particles suspended in sodium chloride wereexposed to an electric field during the measurements. The Zetasizer Nano ZS apparatus(Malvern, Great Britain) uses the Phase Analysis Light-Scattering technique to determinethe electrophoretic mobility of the tested particles. Then, the electrophoretic mobility isconverted into zeta potential. Experiments were conducted eight times with similar resultsobtained.
2.2.6. Statistical Analysis
The data obtained in this study are expressed as mean ± SD. The data were analyzedby use of standard statistical analyses, namely one-way ANOVA with Scheffe’s F test formultiple comparisons to determine the significance between different groups. Values ofp < 0.05 were considered significant.
3. Results and Discussion
An investigation into the characteristics of the polymers used in the research wascarried out to analyze the occurrence of possible flaws in the commercial product thatcould affect the conducted analysis. The hydrodynamic size and stability of the submicronpolystyrene particles were measured using the DLS method. FTIR spectroscopy was alsoutilized during the research for identity analysis.
To investigate the interactions between the cell membranes of morphotic blood com-ponents (erythrocytes and thrombocytes) and various polystyrene particles (PS-100, PS-200,PS-NH2-100, PS-NH2-200), several experimental studies were carried out using the ELSmethod. These interactions could potentially change the values of the electrokinetic po-tential of the systems studied. Both the influence of the polymer concentration and theexposure time of the cell membrane to the polymer were taken into the account duringthe experiment. Each of the measurements was performed as a function of the H+ ionconcentration.
138
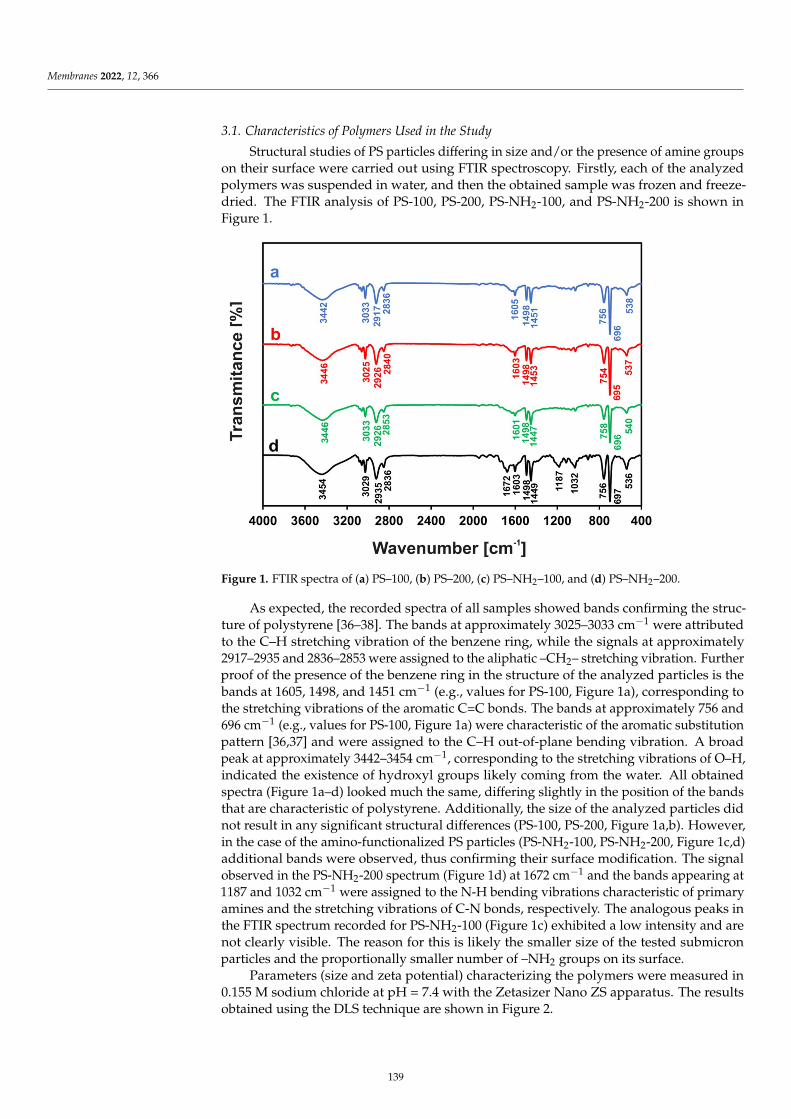
Membranes 2022, 12, 366
3.1. Characteristics of Polymers Used in the Study
Structural studies of PS particles differing in size and/or the presence of amine groupson their surface were carried out using FTIR spectroscopy. Firstly, each of the analyzedpolymers was suspended in water, and then the obtained sample was frozen and freeze-dried. The FTIR analysis of PS-100, PS-200, PS-NH2-100, and PS-NH2-200 is shown inFigure 1.
Membranes 2022, 12, x 5 of 17
cron polystyrene particles were measured using the DLS method. FTIR spectroscopy was also utilized during the research for identity analysis.
To investigate the interactions between the cell membranes of morphotic blood components (erythrocytes and thrombocytes) and various polystyrene particles (PS-100, PS-200, PS-NH2-100, PS-NH2-200), several experimental studies were carried out using the ELS method. These interactions could potentially change the values of the electroki-netic potential of the systems studied. Both the influence of the polymer concentration and the exposure time of the cell membrane to the polymer were taken into the account during the experiment. Each of the measurements was performed as a function of the H+ ion concentration.
3.1. Characteristics of Polymers Used in the Study Structural studies of PS particles differing in size and/or the presence of amine
groups on their surface were carried out using FTIR spectroscopy. Firstly, each of the analyzed polymers was suspended in water, and then the obtained sample was frozen and freeze-dried. The FTIR analysis of PS-100, PS-200, PS-NH2-100, and PS-NH2-200 is shown in Figure 1.
Figure 1. FTIR spectra of (a) PS–100, (b) PS–200, (c) PS–NH2–100, and (d) PS–NH2–200.
As expected, the recorded spectra of all samples showed bands confirming the structure of polystyrene [36–38]. The bands at approximately 3025–3033 cm−1 were at-tributed to the C–H stretching vibration of the benzene ring, while the signals at ap-proximately 2917–2935 and 2836–2853 were assigned to the aliphatic –CH2– stretching vibration. Further proof of the presence of the benzene ring in the structure of the ana-lyzed particles is the bands at 1605, 1498, and 1451 cm−1 (e.g., values for PS-100, Figure 1a), corresponding to the stretching vibrations of the aromatic C=C bonds. The bands at approximately 756 and 696 cm−1 (e.g., values for PS-100, Figure 1a) were characteristic of the aromatic substitution pattern [36,37] and were assigned to the C–H out-of-plane bending vibration. A broad peak at approximately 3442–3454 cm−1, corresponding to the stretching vibrations of O–H, indicated the existence of hydroxyl groups likely coming from the water. All obtained spectra (Figure 1a–d) looked much the same, differing slightly in the position of the bands that are characteristic of polystyrene. Additionally, the size of the analyzed particles did not result in any significant structural differences (PS-100, PS-200, Figure 1a,b). However, in the case of the amino-functionalized PS parti-
Figure 1. FTIR spectra of (a) PS–100, (b) PS–200, (c) PS–NH2–100, and (d) PS–NH2–200.
As expected, the recorded spectra of all samples showed bands confirming the struc-ture of polystyrene [36–38]. The bands at approximately 3025–3033 cm−1 were attributedto the C–H stretching vibration of the benzene ring, while the signals at approximately2917–2935 and 2836–2853 were assigned to the aliphatic –CH2– stretching vibration. Furtherproof of the presence of the benzene ring in the structure of the analyzed particles is thebands at 1605, 1498, and 1451 cm−1 (e.g., values for PS-100, Figure 1a), corresponding tothe stretching vibrations of the aromatic C=C bonds. The bands at approximately 756 and696 cm−1 (e.g., values for PS-100, Figure 1a) were characteristic of the aromatic substitutionpattern [36,37] and were assigned to the C–H out-of-plane bending vibration. A broadpeak at approximately 3442–3454 cm−1, corresponding to the stretching vibrations of O–H,indicated the existence of hydroxyl groups likely coming from the water. All obtainedspectra (Figure 1a–d) looked much the same, differing slightly in the position of the bandsthat are characteristic of polystyrene. Additionally, the size of the analyzed particles didnot result in any significant structural differences (PS-100, PS-200, Figure 1a,b). However,in the case of the amino-functionalized PS particles (PS-NH2-100, PS-NH2-200, Figure 1c,d)additional bands were observed, thus confirming their surface modification. The signalobserved in the PS-NH2-200 spectrum (Figure 1d) at 1672 cm−1 and the bands appearing at1187 and 1032 cm−1 were assigned to the N-H bending vibrations characteristic of primaryamines and the stretching vibrations of C-N bonds, respectively. The analogous peaks inthe FTIR spectrum recorded for PS-NH2-100 (Figure 1c) exhibited a low intensity and arenot clearly visible. The reason for this is likely the smaller size of the tested submicronparticles and the proportionally smaller number of –NH2 groups on its surface.
Parameters (size and zeta potential) characterizing the polymers were measured in0.155 M sodium chloride at pH = 7.4 with the Zetasizer Nano ZS apparatus. The resultsobtained using the DLS technique are shown in Figure 2.
139
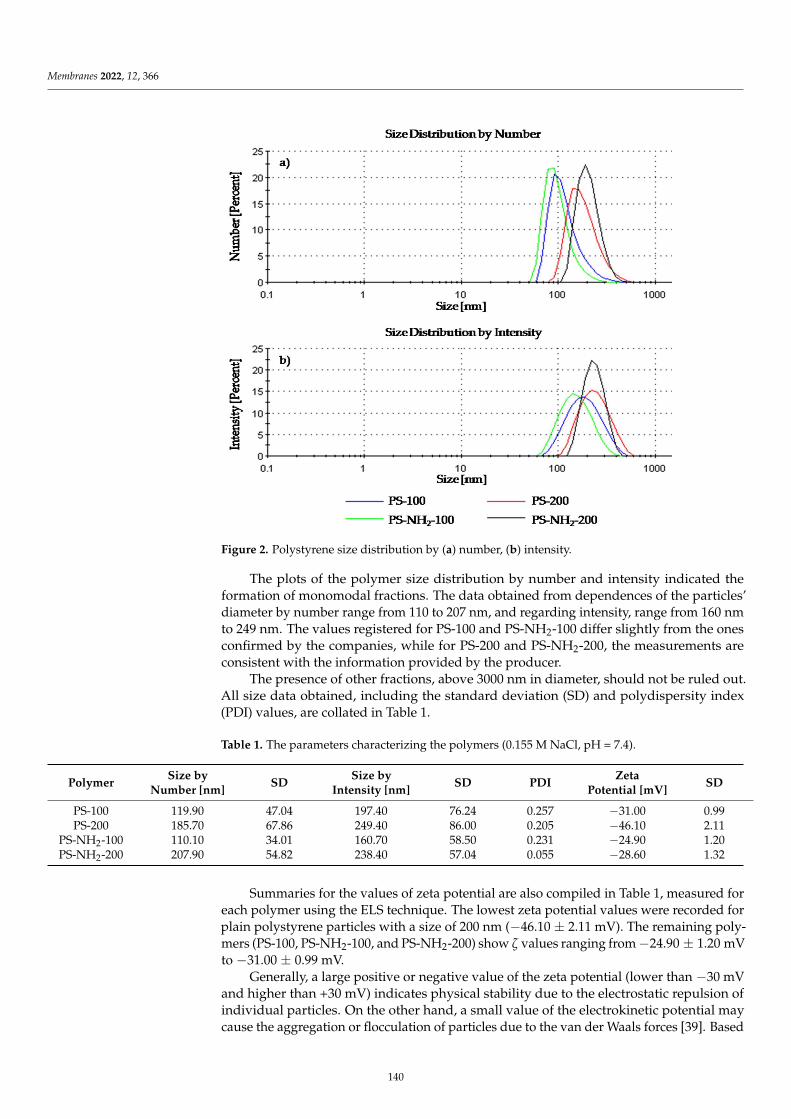
Membranes 2022, 12, 366
Membranes 2022, 12, x 6 of 17
cles (PS-NH2-100, PS-NH2-200, Figure 1c,d) additional bands were observed, thus con-firming their surface modification. The signal observed in the PS-NH2-200 spectrum (Figure 1d) at 1672 cm−1 and the bands appearing at 1187 and 1032 cm−1 were assigned to the N-H bending vibrations characteristic of primary amines and the stretching vibra-tions of C-N bonds, respectively. The analogous peaks in the FTIR spectrum recorded for PS-NH2-100 (Figure 1c) exhibited a low intensity and are not clearly visible. The reason for this is likely the smaller size of the tested submicron particles and the proportionally smaller number of –NH2 groups on its surface.
Parameters (size and zeta potential) characterizing the polymers were measured in 0.155 M sodium chloride at pH = 7.4 with the Zetasizer Nano ZS apparatus. The results obtained using the DLS technique are shown in Figure 2.
Figure 2. Polystyrene size distribution by (a) number, (b) intensity.
The plots of the polymer size distribution by number and intensity indicated the formation of monomodal fractions. The data obtained from dependences of the particles’ diameter by number range from 110 to 207 nm, and regarding intensity, range from 160 nm to 249 nm. The values registered for PS-100 and PS-NH2-100 differ slightly from the ones confirmed by the companies, while for PS-200 and PS-NH2-200, the measurements are consistent with the information provided by the producer.
The presence of other fractions, above 3000 nm in diameter, should not be ruled out. All size data obtained, including the standard deviation (SD) and polydispersity index (PDI) values, are collated in Table 1.
Table 1. The parameters characterizing the polymers (0.155 M NaCl, pH = 7.4).
Polymer Size by
Number [nm] SD
Size by Intensity [nm]
SD PDI Zeta
Potential [mV] SD
PS-100 119.90 47.04 197.40 76.24 0.257 −31.00 0.99 PS-200 185.70 67.86 249.40 86.00 0.205 −46.10 2.11
Figure 2. Polystyrene size distribution by (a) number, (b) intensity.
The plots of the polymer size distribution by number and intensity indicated theformation of monomodal fractions. The data obtained from dependences of the particles’diameter by number range from 110 to 207 nm, and regarding intensity, range from 160 nmto 249 nm. The values registered for PS-100 and PS-NH2-100 differ slightly from the onesconfirmed by the companies, while for PS-200 and PS-NH2-200, the measurements areconsistent with the information provided by the producer.
The presence of other fractions, above 3000 nm in diameter, should not be ruled out.All size data obtained, including the standard deviation (SD) and polydispersity index(PDI) values, are collated in Table 1.
Table 1. The parameters characterizing the polymers (0.155 M NaCl, pH = 7.4).
PolymerSize by
Number [nm]SD
Size byIntensity [nm]
SD PDIZeta
Potential [mV]SD
PS-100 119.90 47.04 197.40 76.24 0.257 −31.00 0.99PS-200 185.70 67.86 249.40 86.00 0.205 −46.10 2.11
PS-NH2-100 110.10 34.01 160.70 58.50 0.231 −24.90 1.20PS-NH2-200 207.90 54.82 238.40 57.04 0.055 −28.60 1.32
Summaries for the values of zeta potential are also compiled in Table 1, measured foreach polymer using the ELS technique. The lowest zeta potential values were recorded forplain polystyrene particles with a size of 200 nm (−46.10 ± 2.11 mV). The remaining poly-mers (PS-100, PS-NH2-100, and PS-NH2-200) show ζ values ranging from −24.90 ± 1.20 mVto −31.00 ± 0.99 mV.
Generally, a large positive or negative value of the zeta potential (lower than −30 mVand higher than +30 mV) indicates physical stability due to the electrostatic repulsion ofindividual particles. On the other hand, a small value of the electrokinetic potential maycause the aggregation or flocculation of particles due to the van der Waals forces [39]. Based
140
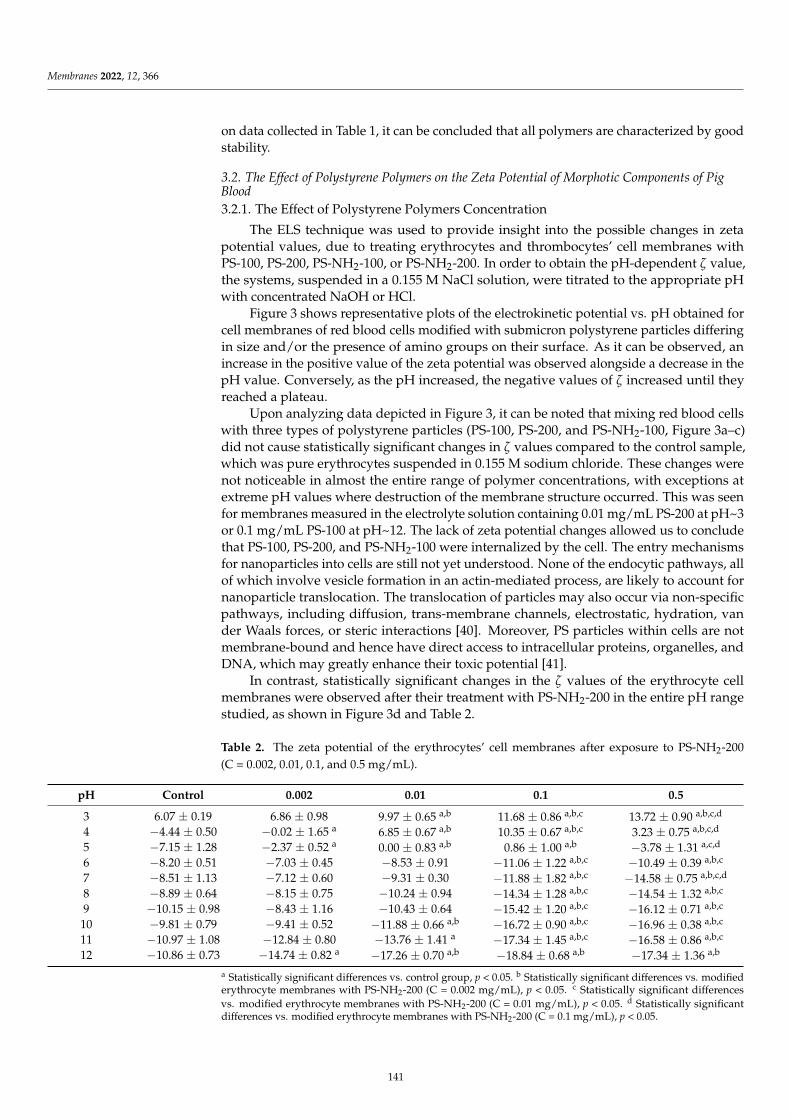
Membranes 2022, 12, 366
on data collected in Table 1, it can be concluded that all polymers are characterized by goodstability.
3.2. The Effect of Polystyrene Polymers on the Zeta Potential of Morphotic Components of PigBlood
3.2.1. The Effect of Polystyrene Polymers Concentration
The ELS technique was used to provide insight into the possible changes in zetapotential values, due to treating erythrocytes and thrombocytes’ cell membranes withPS-100, PS-200, PS-NH2-100, or PS-NH2-200. In order to obtain the pH-dependent ζ value,the systems, suspended in a 0.155 M NaCl solution, were titrated to the appropriate pHwith concentrated NaOH or HCl.
Figure 3 shows representative plots of the electrokinetic potential vs. pH obtained forcell membranes of red blood cells modified with submicron polystyrene particles differingin size and/or the presence of amino groups on their surface. As it can be observed, anincrease in the positive value of the zeta potential was observed alongside a decrease in thepH value. Conversely, as the pH increased, the negative values of ζ increased until theyreached a plateau.
Upon analyzing data depicted in Figure 3, it can be noted that mixing red blood cellswith three types of polystyrene particles (PS-100, PS-200, and PS-NH2-100, Figure 3a–c)did not cause statistically significant changes in ζ values compared to the control sample,which was pure erythrocytes suspended in 0.155 M sodium chloride. These changes werenot noticeable in almost the entire range of polymer concentrations, with exceptions atextreme pH values where destruction of the membrane structure occurred. This was seenfor membranes measured in the electrolyte solution containing 0.01 mg/mL PS-200 at pH~3or 0.1 mg/mL PS-100 at pH~12. The lack of zeta potential changes allowed us to concludethat PS-100, PS-200, and PS-NH2-100 were internalized by the cell. The entry mechanismsfor nanoparticles into cells are still not yet understood. None of the endocytic pathways, allof which involve vesicle formation in an actin-mediated process, are likely to account fornanoparticle translocation. The translocation of particles may also occur via non-specificpathways, including diffusion, trans-membrane channels, electrostatic, hydration, vander Waals forces, or steric interactions [40]. Moreover, PS particles within cells are notmembrane-bound and hence have direct access to intracellular proteins, organelles, andDNA, which may greatly enhance their toxic potential [41].
In contrast, statistically significant changes in the ζ values of the erythrocyte cellmembranes were observed after their treatment with PS-NH2-200 in the entire pH rangestudied, as shown in Figure 3d and Table 2.
Table 2. The zeta potential of the erythrocytes’ cell membranes after exposure to PS-NH2-200(C = 0.002, 0.01, 0.1, and 0.5 mg/mL).
pH Control 0.002 0.01 0.1 0.5
3 6.07 ± 0.19 6.86 ± 0.98 9.97 ± 0.65 a,b 11.68 ± 0.86 a,b,c 13.72 ± 0.90 a,b,c,d
4 −4.44 ± 0.50 −0.02 ± 1.65 a 6.85 ± 0.67 a,b 10.35 ± 0.67 a,b,c 3.23 ± 0.75 a,b,c,d
5 −7.15 ± 1.28 −2.37 ± 0.52 a 0.00 ± 0.83 a,b 0.86 ± 1.00 a,b −3.78 ± 1.31 a,c,d
6 −8.20 ± 0.51 −7.03 ± 0.45 −8.53 ± 0.91 −11.06 ± 1.22 a,b,c −10.49 ± 0.39 a,b,c
7 −8.51 ± 1.13 −7.12 ± 0.60 −9.31 ± 0.30 −11.88 ± 1.82 a,b,c −14.58 ± 0.75 a,b,c,d
8 −8.89 ± 0.64 −8.15 ± 0.75 −10.24 ± 0.94 −14.34 ± 1.28 a,b,c −14.54 ± 1.32 a,b,c
9 −10.15 ± 0.98 −8.43 ± 1.16 −10.43 ± 0.64 −15.42 ± 1.20 a,b,c −16.12 ± 0.71 a,b,c
10 −9.81 ± 0.79 −9.41 ± 0.52 −11.88 ± 0.66 a,b −16.72 ± 0.90 a,b,c −16.96 ± 0.38 a,b,c
11 −10.97 ± 1.08 −12.84 ± 0.80 −13.76 ± 1.41 a −17.34 ± 1.45 a,b,c −16.58 ± 0.86 a,b,c
12 −10.86 ± 0.73 −14.74 ± 0.82 a −17.26 ± 0.70 a,b −18.84 ± 0.68 a,b −17.34 ± 1.36 a,b
a Statistically significant differences vs. control group, p < 0.05. b Statistically significant differences vs. modifiederythrocyte membranes with PS-NH2-200 (C = 0.002 mg/mL), p < 0.05. c Statistically significant differencesvs. modified erythrocyte membranes with PS-NH2-200 (C = 0.01 mg/mL), p < 0.05. d Statistically significantdifferences vs. modified erythrocyte membranes with PS-NH2-200 (C = 0.1 mg/mL), p < 0.05.
141
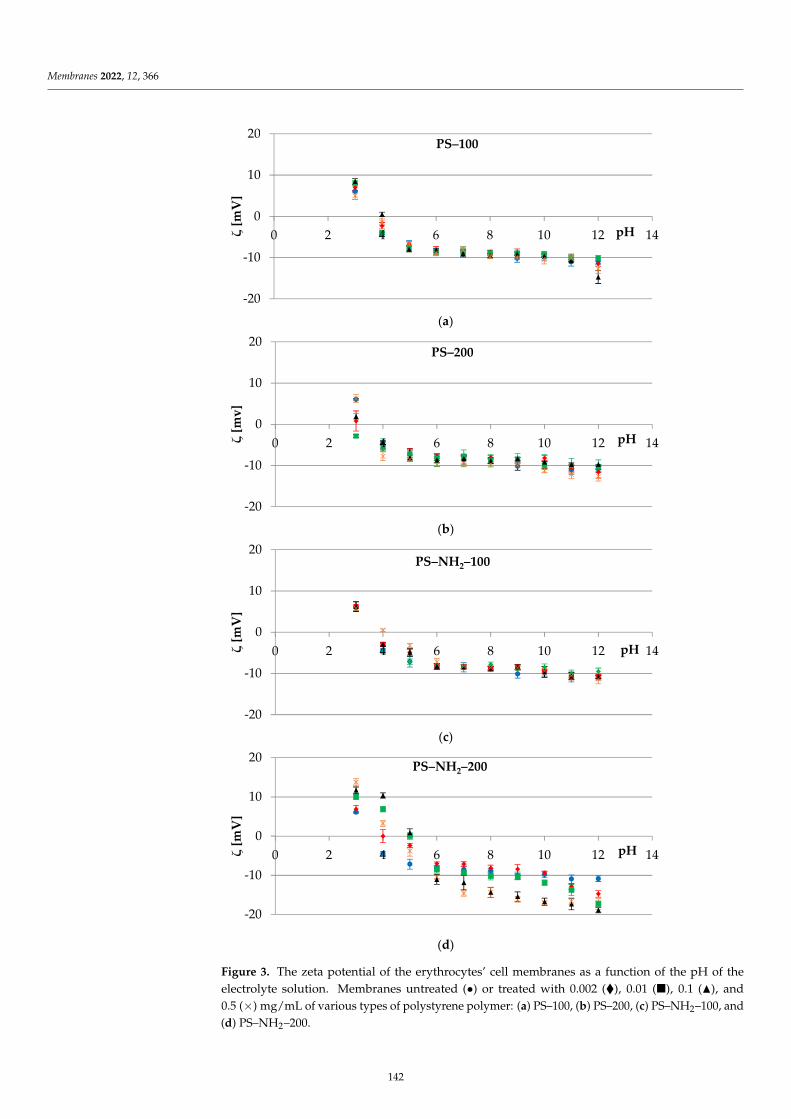
Membranes 2022, 12, 366Membranes 2022, 12, x 8 of 17
(a)
(b)
(c)
(d)
Figure 3. The zeta potential of the erythrocytes’ cell membranes as a function of the pH of the electrolyte solution. Membranes untreated () or treated with 0.002 (♦), 0.01 (), 0.1 (), and 0.5 (×) mg/mL of various types of polystyrene polymer: (a) PS–100, (b) PS–200, (c) PS–NH2–100, and (d) PS–NH2–200.
-20
-10
0
10
20
0 2 4 6 8 10 12 14ζ[m
V]
pH
PS–100
-20
-10
0
10
20
0 2 4 6 8 10 12 14ζ[m
v]
pH
PS–200
-20
-10
0
10
20
0 2 4 6 8 10 12 14ζ[m
V]
pH
PS–NH2–100
-20
-10
0
10
20
0 2 4 6 8 10 12 14ζ[m
V]
pH
PS–NH2–200
Figure 3. The zeta potential of the erythrocytes’ cell membranes as a function of the pH of theelectrolyte solution. Membranes untreated (•) or treated with 0.002 (), 0.01 (), 0.1 (N), and0.5 (×) mg/mL of various types of polystyrene polymer: (a) PS–100, (b) PS–200, (c) PS–NH2–100, and(d) PS–NH2–200.
142
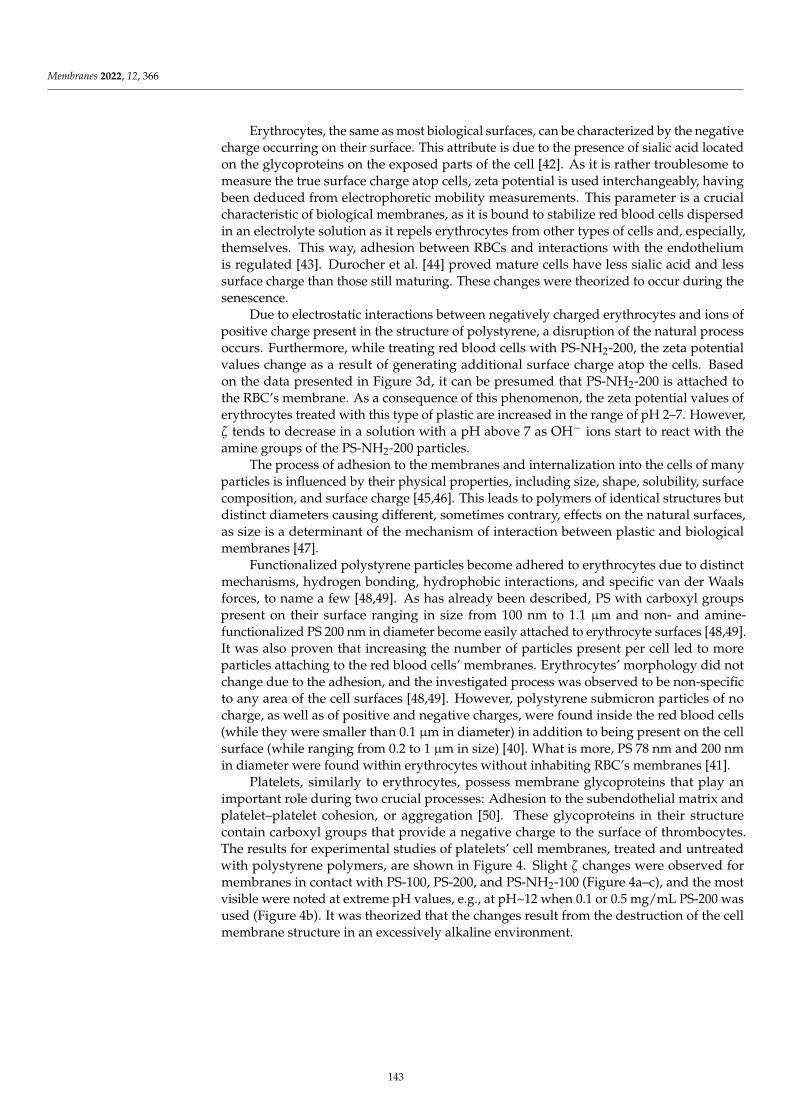
Membranes 2022, 12, 366
Erythrocytes, the same as most biological surfaces, can be characterized by the negativecharge occurring on their surface. This attribute is due to the presence of sialic acid locatedon the glycoproteins on the exposed parts of the cell [42]. As it is rather troublesome tomeasure the true surface charge atop cells, zeta potential is used interchangeably, havingbeen deduced from electrophoretic mobility measurements. This parameter is a crucialcharacteristic of biological membranes, as it is bound to stabilize red blood cells dispersedin an electrolyte solution as it repels erythrocytes from other types of cells and, especially,themselves. This way, adhesion between RBCs and interactions with the endotheliumis regulated [43]. Durocher et al. [44] proved mature cells have less sialic acid and lesssurface charge than those still maturing. These changes were theorized to occur during thesenescence.
Due to electrostatic interactions between negatively charged erythrocytes and ions ofpositive charge present in the structure of polystyrene, a disruption of the natural processoccurs. Furthermore, while treating red blood cells with PS-NH2-200, the zeta potentialvalues change as a result of generating additional surface charge atop the cells. Basedon the data presented in Figure 3d, it can be presumed that PS-NH2-200 is attached tothe RBC’s membrane. As a consequence of this phenomenon, the zeta potential values oferythrocytes treated with this type of plastic are increased in the range of pH 2–7. However,ζ tends to decrease in a solution with a pH above 7 as OH− ions start to react with theamine groups of the PS-NH2-200 particles.
The process of adhesion to the membranes and internalization into the cells of manyparticles is influenced by their physical properties, including size, shape, solubility, surfacecomposition, and surface charge [45,46]. This leads to polymers of identical structures butdistinct diameters causing different, sometimes contrary, effects on the natural surfaces,as size is a determinant of the mechanism of interaction between plastic and biologicalmembranes [47].
Functionalized polystyrene particles become adhered to erythrocytes due to distinctmechanisms, hydrogen bonding, hydrophobic interactions, and specific van der Waalsforces, to name a few [48,49]. As has already been described, PS with carboxyl groupspresent on their surface ranging in size from 100 nm to 1.1 µm and non- and amine-functionalized PS 200 nm in diameter become easily attached to erythrocyte surfaces [48,49].It was also proven that increasing the number of particles present per cell led to moreparticles attaching to the red blood cells’ membranes. Erythrocytes’ morphology did notchange due to the adhesion, and the investigated process was observed to be non-specificto any area of the cell surfaces [48,49]. However, polystyrene submicron particles of nocharge, as well as of positive and negative charges, were found inside the red blood cells(while they were smaller than 0.1 µm in diameter) in addition to being present on the cellsurface (while ranging from 0.2 to 1 µm in size) [40]. What is more, PS 78 nm and 200 nmin diameter were found within erythrocytes without inhabiting RBC’s membranes [41].
Platelets, similarly to erythrocytes, possess membrane glycoproteins that play animportant role during two crucial processes: Adhesion to the subendothelial matrix andplatelet–platelet cohesion, or aggregation [50]. These glycoproteins in their structurecontain carboxyl groups that provide a negative charge to the surface of thrombocytes.The results for experimental studies of platelets’ cell membranes, treated and untreatedwith polystyrene polymers, are shown in Figure 4. Slight ζ changes were observed formembranes in contact with PS-100, PS-200, and PS-NH2-100 (Figure 4a–c), and the mostvisible were noted at extreme pH values, e.g., at pH~12 when 0.1 or 0.5 mg/mL PS-200 wasused (Figure 4b). It was theorized that the changes result from the destruction of the cellmembrane structure in an excessively alkaline environment.
143
Membranes 2022, 12, 366
Membranes 2022, 12, x 10 of 17
to be non-specific to any area of the cell surfaces [48,49]. However, polystyrene submi-cron particles of no charge, as well as of positive and negative charges, were found inside the red blood cells (while they were smaller than 0.1 μm in diameter) in addition to being present on the cell surface (while ranging from 0.2 to 1 μm in size) [40]. What is more, PS 78 nm and 200 nm in diameter were found within erythrocytes without inhabiting RBC’s membranes [41].
Platelets, similarly to erythrocytes, possess membrane glycoproteins that play an important role during two crucial processes: Adhesion to the subendothelial matrix and platelet–platelet cohesion, or aggregation [50]. These glycoproteins in their structure contain carboxyl groups that provide a negative charge to the surface of thrombocytes. The results for experimental studies of platelets’ cell membranes, treated and untreated with polystyrene polymers, are shown in Figure 4. Slight ζ changes were observed for membranes in contact with PS-100, PS-200, and PS-NH2-100 (Figure 4a–c), and the most visible were noted at extreme pH values, e.g., at pH~12 when 0.1 or 0.5 mg/mL PS-200 was used (Figure 4b). It was theorized that the changes result from the destruction of the cell membrane structure in an excessively alkaline environment.
Statistically significant changes, as in the case of erythrocytes, were observed for the thrombocytes’ cell membranes treated with PS-NH2-200 (Figure 4d), and the most visible in the entire pH range were noted for polymer concentrations of 0.1 and 0.5 mg/mL. At an acidic pH (pH~3 and pH~4), the ζ reached higher positive values, while in the re-maining pH range (pH 5 to 12), the zeta potential increased towards negative values. The changes that occurred in the parameter with the participation of lower concentrations of polystyrene (0.002 and 0.01 mg/mL) were insignificant.
(a)
(b)
-30
-20
-10
0
10
20
0 2 4 6 8 10 12 14ζ[mV]
pH
PS–100
-30
-20
-10
0
10
20
0 2 4 6 8 10 12 14ζ[mV]
pH
PS–200
Membranes 2022, 12, x 11 of 17
(c)
(d)
Figure 4. The zeta potential of the platelets’ cell membranes as a function of the pH of the electro-lyte solution. Membranes untreated () or treated with 0.002 (♦), 0.01 (), 0.1 (), and 0.5 (×) mg/mL of various types of polystyrene polymer: (a) PS–100, (b) PS–200, (c) PS–NH2–100, and (d) PS–NH2–200.
The data of the zeta potential of thrombocytes during PS-NH2-200 treatment as a function of pH is compiled in Table 3.
Table 3. The zeta potential of the platelets’ cell membranes after exposure to PS-NH2-200 (C = 0.002, 0.01, 0.1, and 0.5 mg/mL).
pH Control 0.002 0.01 0.1 0.5 3 8.40 ± 0.58 6.86 ± 0.98 9.97 ± 0.65 13.48 ± 1.07 b 15.28 ± 0.89 a,b,c 4 2.49 ± 0.77 −0.02 ± 1.65 6.85 ± 0.67 a,b 9.25 ± 1.62 a,b 7.17 ± 0.93 a,b 5 −4.19 ± 0.85 −2.37 ± 0.52 0.00 ± 0.83 a,b −8.24 ± 1.00 a,b,c −22.18 ± 1.82 a,b,c,d
6 −8.48 ± 1.72 −7.03 ± 0.45 a −8.53 ± 0.91 b −10.78 ± 0.76 a,b,c −21.14 ± 0.95 a,b,c,d
7 −8.35 ± 1.24 −7.12 ± 0.60 −9.31 ± 0.30 b −13.10 ± 1.21 a,b,c −22.48 ± 1.61 a,b,c,d
8 −9.42 ± 0.74 −8.15 ± 0.75 −10.24 ± 0.94 b −15.10 ± 0.72 a,b,c −22.40 ± 0.90 a,b,c,d
9 −11.20 ± 0.97 −8.43 ± 1.16 a −10.43 ± 0.64 −14.68 ± 1.16 a,b,c −21.98 ± 1.54 a,b,c,d
10 −10.48 ± 1.49 −9.41 ± 0.52 −11.88 ± 0.66 b −17.30 ± 1.65 a,b,c −22.98 ± 0.78 a,b,c,d
11 −10.76 ± 0.38 −12.84 ± 0.80 a −13.76 ± 1.41 a −17.94 ± 0.61 a,b,c −23.30 ± 1.03 a,b,c,d
12 −13.44 ± 1.08 −14.74 ± 0.82 −17.26 ± 0.70 a,b −19.34 ± 0.15 a,b,c −24.92 ± 1.16 a,b,c,d
a Statistically significant differences vs. control group, p < 0.05. b Statistically significant differences vs. modified erythrocyte membranes with PS-NH2-200 (C = 0.002 mg/mL), p < 0.05. c Statistically significant differences vs. modified erythrocyte membranes with PS-NH2-200 (C = 0.01 mg/mL), p < 0.05. d Statistically significant differences vs. modified erythrocyte membranes with PS-NH2-200 (C = 0.1 mg/mL), p < 0.05.
-30
-20
-10
0
10
20
0 2 4 6 8 10 12 14ζ[m
V]
pH
PS–200
-30
-20
-10
0
10
20
0 2 4 6 8 10 12 14ζ[m
V]
pH
PS–NH2–200
Figure 4. The zeta potential of the platelets’ cell membranes as a function of the pH of the electrolytesolution. Membranes untreated (•) or treated with 0.002 (), 0.01 (), 0.1 (N), and 0.5 (×) mg/mL ofvarious types of polystyrene polymer: (a) PS–100, (b) PS–200, (c) PS–NH2–100, and (d) PS–NH2–200.
Statistically significant changes, as in the case of erythrocytes, were observed for thethrombocytes’ cell membranes treated with PS-NH2-200 (Figure 4d), and the most visiblein the entire pH range were noted for polymer concentrations of 0.1 and 0.5 mg/mL. At anacidic pH (pH~3 and pH~4), the ζ reached higher positive values, while in the remaining
144
Membranes 2022, 12, 366
pH range (pH 5 to 12), the zeta potential increased towards negative values. The changesthat occurred in the parameter with the participation of lower concentrations of polystyrene(0.002 and 0.01 mg/mL) were insignificant.
The data of the zeta potential of thrombocytes during PS-NH2-200 treatment as afunction of pH is compiled in Table 3.
Table 3. The zeta potential of the platelets’ cell membranes after exposure to PS-NH2-200 (C = 0.002,0.01, 0.1, and 0.5 mg/mL).
pH Control 0.002 0.01 0.1 0.5
3 8.40 ± 0.58 6.86 ± 0.98 9.97 ± 0.65 13.48 ± 1.07 b 15.28 ± 0.89 a,b,c
4 2.49 ± 0.77 −0.02 ± 1.65 6.85 ± 0.67 a,b 9.25 ± 1.62 a,b 7.17 ± 0.93 a,b
5 −4.19 ± 0.85 −2.37 ± 0.52 0.00 ± 0.83 a,b −8.24 ± 1.00 a,b,c −22.18 ± 1.82 a,b,c,d
6 −8.48 ± 1.72 −7.03 ± 0.45 a −8.53 ± 0.91 b −10.78 ± 0.76 a,b,c −21.14 ± 0.95 a,b,c,d
7 −8.35 ± 1.24 −7.12 ± 0.60 −9.31 ± 0.30 b −13.10 ± 1.21 a,b,c −22.48 ± 1.61 a,b,c,d
8 −9.42 ± 0.74 −8.15 ± 0.75 −10.24 ± 0.94 b −15.10 ± 0.72 a,b,c −22.40 ± 0.90 a,b,c,d
9 −11.20 ± 0.97 −8.43 ± 1.16 a −10.43 ± 0.64 −14.68 ± 1.16 a,b,c −21.98 ± 1.54 a,b,c,d
10 −10.48 ± 1.49 −9.41 ± 0.52 −11.88 ± 0.66 b −17.30 ± 1.65 a,b,c −22.98 ± 0.78 a,b,c,d
11 −10.76 ± 0.38 −12.84 ± 0.80 a −13.76 ± 1.41 a −17.94 ± 0.61 a,b,c −23.30 ± 1.03 a,b,c,d
12 −13.44 ± 1.08 −14.74 ± 0.82 −17.26 ± 0.70 a,b −19.34 ± 0.15 a,b,c −24.92 ± 1.16 a,b,c,d
a Statistically significant differences vs. control group, p < 0.05. b Statistically significant differences vs. modifiederythrocyte membranes with PS-NH2-200 (C = 0.002 mg/mL), p < 0.05. c Statistically significant differencesvs. modified erythrocyte membranes with PS-NH2-200 (C = 0.01 mg/mL), p < 0.05. d Statistically significantdifferences vs. modified erythrocyte membranes with PS-NH2-200 (C = 0.1 mg/mL), p < 0.05.
There is much evidence in the literature that suggests the possibility of interac-tions between submicron polymer particles and elements/components of the circulatorysystem—blood and blood vessels. The existence of such interactions would explain theproatherothrombic effect observed in a number of models. Smyth et al. [51] conductedresearch investigating the ability of non-functionalized and functionalized polystyreneparticles of different sizes (50 and 100 nm) to cause thrombocytes’ aggregation in vitroand in vivo. Their results confirmed that the process of aggregation was influenced bythe physical properties of PS. Tested particles caused GPIIb/IIIa-mediated aggregation ofthrombocytes to a certain degree, varying due to the size and presence of surface groups.PS-NH2 of 50 nm in diameter acted in an enhanced agonist-induced aggregation by linkingadjacent platelets, many of which were not even activated. Nemmar et al. [52] incubatedthrombocytes with 60 nm polystyrene particles with different surface chemistries andfound that the potency of causing aggregation was highest when using aminated particles,followed by carboxylated ones. Unmodified polystyrene was observed to induce aggre-gation to the lowest degree. Although these findings were to be generally confirmed byMcGuinnes et al. [53], a difference in causing aggregation between PS particles of aminoand carboxyl groups present on their surfaces was not to be found.
Given the data acquired using the ELS technique presented in Figures 3 and 4 andTables 2 and 3, it can be recognized that significant changes of zeta potential were observedwhen treating erythrocytes and thrombocytes’ membranes using PS-NH2-200. The exposi-tion of cells’ surfaces to 200 nm amine-functionalized polystyrene caused the electrokineticpotential to shift towards more negative values. As it was reported in the scientific litera-ture, the larger the PS-NH2 was, the higher ζ tended to increase [54], which was confirmedin Section 3.2.1. We hypothesized that the interaction between erythrocyte and throm-bocyte membranes and the PS-NH2-200 underlie the increased membrane perturbation.McGuinnes et al. [53] demonstrated that amino-functionalized PS appear to act via an unex-plained mechanism that results in the display of anionic phospholipids on the outer surfaceof platelets and erythrocyte membranes and suggested that unusual protein adsorptionpatterns might lead to membrane perturbation-mediated aggregation.
3.2.2. The Effect of the Exposure Time
Subsequent studies were focused on the measurement of the zeta potential of redblood cell and platelet membranes as a function of pH depending on the exposure time of
145
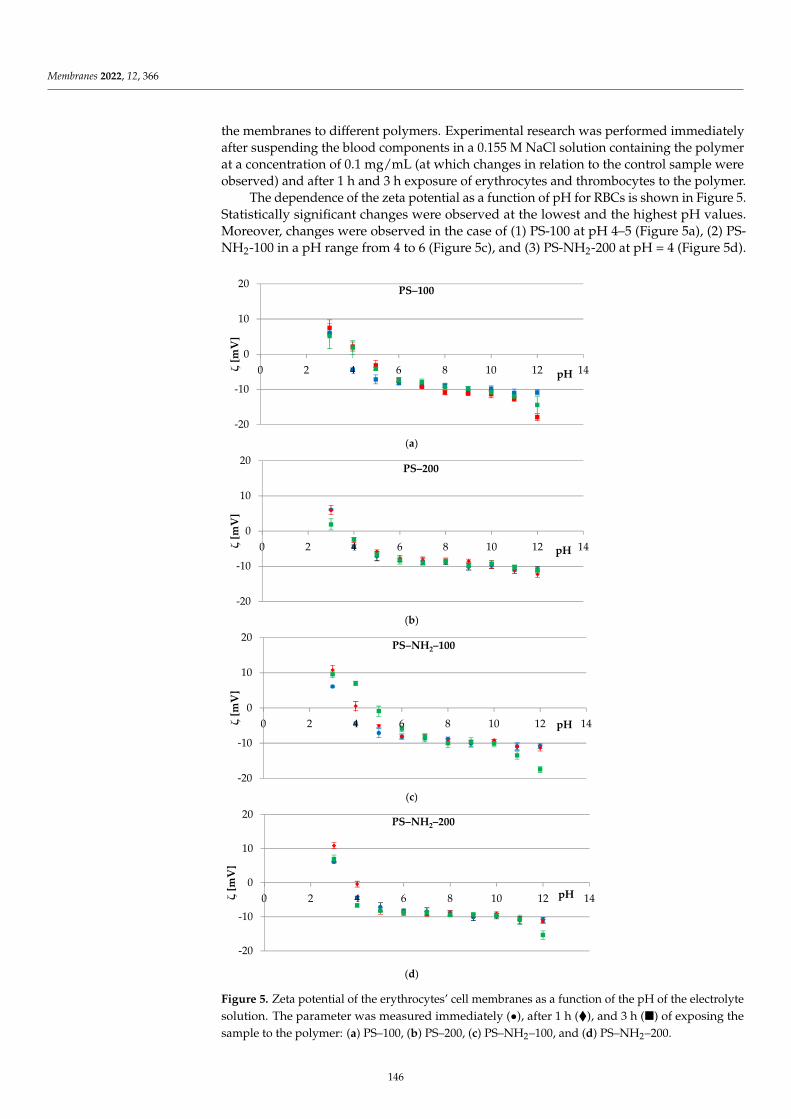
Membranes 2022, 12, 366
the membranes to different polymers. Experimental research was performed immediatelyafter suspending the blood components in a 0.155 M NaCl solution containing the polymerat a concentration of 0.1 mg/mL (at which changes in relation to the control sample wereobserved) and after 1 h and 3 h exposure of erythrocytes and thrombocytes to the polymer.
The dependence of the zeta potential as a function of pH for RBCs is shown in Figure 5.Statistically significant changes were observed at the lowest and the highest pH values.Moreover, changes were observed in the case of (1) PS-100 at pH 4–5 (Figure 5a), (2) PS-NH2-100 in a pH range from 4 to 6 (Figure 5c), and (3) PS-NH2-200 at pH = 4 (Figure 5d).
Membranes 2022, 12, x 13 of 17
(a)
(b)
(c)
(d)
Figure 5. Zeta potential of the erythrocytes’ cell membranes as a function of the pH of the electro-lyte solution. The parameter was measured immediately (), after 1 h (♦), and 3 h () of exposing the sample to the polymer: (a) PS–100, (b) PS–200, (c) PS–NH2–100, and (d) PS–NH2–200.
-20
-10
0
10
20
0 2 4 6 8 10 12 14ζ[m
V]
pH
PS–100
-20
-10
0
10
20
0 2 4 6 8 10 12 14ζ[m
V]
pH
PS–200
-20
-10
0
10
20
0 2 4 6 8 10 12 14ζ[m
V]
pH
PS–NH2–100
-20
-10
0
10
20
0 2 4 6 8 10 12 14ζ[m
V]
pH
PS–NH2–200
Figure 5. Zeta potential of the erythrocytes’ cell membranes as a function of the pH of the electrolytesolution. The parameter was measured immediately (•), after 1 h (), and 3 h () of exposing thesample to the polymer: (a) PS–100, (b) PS–200, (c) PS–NH2–100, and (d) PS–NH2–200.
146
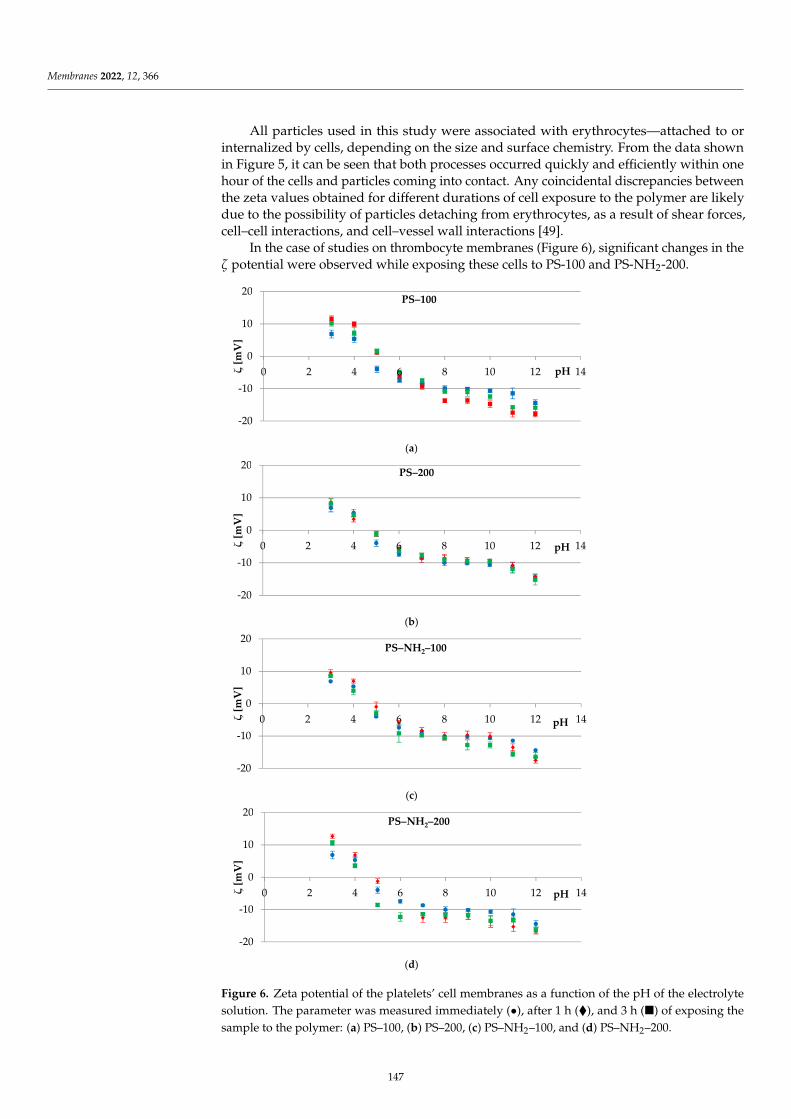
Membranes 2022, 12, 366
All particles used in this study were associated with erythrocytes—attached to orinternalized by cells, depending on the size and surface chemistry. From the data shownin Figure 5, it can be seen that both processes occurred quickly and efficiently within onehour of the cells and particles coming into contact. Any coincidental discrepancies betweenthe zeta values obtained for different durations of cell exposure to the polymer are likelydue to the possibility of particles detaching from erythrocytes, as a result of shear forces,cell–cell interactions, and cell–vessel wall interactions [49].
In the case of studies on thrombocyte membranes (Figure 6), significant changes in theζ potential were observed while exposing these cells to PS-100 and PS-NH2-200.
Membranes 2022, 12, x 14 of 17
In the case of studies on thrombocyte membranes (Figure 6), significant changes in the ζ potential were observed while exposing these cells to PS-100 and PS-NH2-200.
(a)
(b)
(c)
(d)
-20
-10
0
10
20
0 2 4 6 8 10 12 14ζ[m
V]
pH
PS–100
-20
-10
0
10
20
0 2 4 6 8 10 12 14ζ[m
V]
pH
PS–200
-20
-10
0
10
20
0 2 4 6 8 10 12 14ζ[m
V]
pH
PS–NH2–100
-20
-10
0
10
20
0 2 4 6 8 10 12 14ζ[m
V]
pH
PS–NH2–200
Figure 6. Zeta potential of the platelets’ cell membranes as a function of the pH of the electrolytesolution. The parameter was measured immediately (•), after 1 h (), and 3 h () of exposing thesample to the polymer: (a) PS–100, (b) PS–200, (c) PS–NH2–100, and (d) PS–NH2–200.
147
Membranes 2022, 12, 366
From the data depicted in Figure 6, it can be noted that PS-200 and PS-NH2-100quickly and efficiently attached to platelet membranes within an hour. For PS-100 andPS-NH2-200 particles, the association of polystyrene with cells was slower. This can beseen in the obtained dependencies, in which the zeta potential values measured after 3 hof thrombocyte exposure to the polymer are more similar to those measured directly thanto those determined after 1 h of cell exposure. In the subject literature, studies have beenpresented in which internalization was noticeable as early as 1 min after incubation [46],and in which, as the duration of cell exposure to polystyrene increased, a greater probabilityof polystyrene association with cells was reported [37].
4. Conclusions
To summarize, there is a need to understand the influence of submicron polystyreneparticle properties, such as size and chemical composition, on the various endpoints ofparticle toxicity. In the presented research, we investigated whether polystyrene particlesinfluence the electrokinetic potential of erythrocytes and thrombocytes. Two types ofpolymers were used, and each experiment was conducted several times. In addition,different particle sizes and concentrations, as well as exposure durations to the polymer,always provided the same results, i.e., the internalization of PS-100, PS-200, and PS-NH2-100 particles into the cells and the attachment of PS-NH2-200 particles to cell membranes.Our study clearly shows that the size and surface chemistry of PS particles determinethe extent to which they affect the electrical properties of thrombocyte and erythrocytemembranes.
Author Contributions: Conceptualization, M.Z. and M.N.; methodology, M.Z., J.K., J.B. and M.N.;validation, M.Z., J.K., J.B. and M.N.; formal analysis, M.Z., J.K. and M.N.; investigation, M.Z.;resources, M.Z., J.K. and M.N.; data curation, J.K. and M.N.; writing—original draft preparation,M.Z., J.K. and M.N.; writing—review and editing, M.Z., J.K., M.W. and M.N.; visualization, M.Z.,J.K. and M.N.; supervision, M.N. All authors have read and agreed to the published version of themanuscript.
Funding: The FTIR spectrometer was funded by the EU as part of the Operational Program Develop-ment of Eastern Poland 2007-2013 (projects Nr POPW.01.03.00-20-034/09-00 and POPW.01.03.00-20-004/11-00, the Centre of Synthesis and Analysis BioNanoTechno, University of Bialystok, Poland).
Institutional Review Board Statement: Not applicable.
Informed Consent Statement: Not applicable.
Data Availability Statement: Not applicable.
Conflicts of Interest: The authors declare no conflict of interest.
Abbreviations
ELS Electrophoretic light scatteringDLS Dynamic light scatteringFTIR Fourier transform infraredζ Zeta potential (electrokinetic potential)PDI Polydispersity indexPS Polystyrene particlesPS-100 100 nm polystyrene particlesPS-200 200 nm polystyrene particlesPS-NH2-100 100 nm polystyrene particles with amino groupsPS-NH2-200 200 nm polystyrene particles with amino groupsRBC Red blood cells (erythrocytes)Platelets (thrombocytes)
148
Membranes 2022, 12, 366
References1. Kazemi, M.; Fini, E.H. State of the art in the application of functionalized waste polymers in the built environment. Resour.
Conserv. Recycl. 2022, 177, 105967. [CrossRef]2. Lai, J.H. Polymers for Electronic Applications, 1st ed.; CRC Press: Boca Raton, FL, USA, 2018.3. Puoci, F. Advanced Polymers in Medicine, 1st ed.; Springer: Cham, Switzerland, 2015.4. Manivannan, B.; Eltzov, E.; Borisover, M. Submicron polymer particles may mask the presence of toxicants in wastewater effluents
probed by reporter gene containing bacteria. Sci. Rep. 2021, 11, 7424. [CrossRef] [PubMed]5. Kik, K.; Bukowska, B.; Sicinska, P. Polystyrene Nanoparticles: Sources, Occurrence in the Environment, Distribution in Tissues,
Accumulation and Toxicity to Various Organisms. Environ. Pollut. 2020, 262, 114297. [CrossRef] [PubMed]6. Zimmermann, W. Biocatalytic recycling of polyethylene terephthalate plastic. Philos. Trans. A Math. Phys. Eng. Sci. 2020, 378,
20190273. [CrossRef]7. Fotopoulou, K.N.; Karapanagioti, H.K. Degradation of Various Plastics in the Environment. In Hazardous Chemicals Associated
with Plastics in the Marine Environment; Takada, H., Karapanagioti, H., Eds.; The Handbook of Environmental Chemistry Series;Springer: Cham, Switzerland, 2017; Volume 78.
8. Roohi; Bano, K.; Kuddus, M.; Zaheer, M.R.; Zia, Q.; Khan, M.F.; Ashraf, G.M.; Gupta, A.; Aliev, G. Microbial enzymaticdegradation of biodegradable plastics. Curr. Pharm. Biotechnol. 2017, 18, 429–440. [CrossRef]
9. Urbanek, A.K.; Rymowicz, W.; Mironczuk, A.M. Degradation of plastics and plastic-degrading bacteria in cold marine habitats.Appl. Microbiol. Biotechnol. 2018, 102, 7669–7678. [CrossRef]
10. Yang, S.-S.; Brandon, A.M.; Andrew Flanagan, J.C.; Yang, J.; Ning, D.; Cai, S.-Y.; Fan, H.-Q.; Wang, Z.-Y.; Ren, J.; Benbow, E.Biodegradation of polystyrene wastes in yellow mealworms. Chemosphere 2018, 191, 979–989. [CrossRef]
11. Iqbal, S.; Xu, J.; Allen, S.D.; Khan, S.; Nadir, S.; Arif, M.S.; Yasmeen, T. Unraveling consequences of soil micro- and nano-plasticpollution on soil-plant system: Implications for nitrogen (N) cycling and soil microbial activity. Chemosphere 2020, 260, 127578.[CrossRef]
12. Blettler, M.C.M.; Abrial, E.; Khan, F.R.; Sivri, N.; Espinola, L.A. Freshwater plastic pollution: Recognizing research biases andidentifying knowledge gaps. Water Res. 2018, 143, 416–424. [CrossRef]
13. Haward, M. Plastic pollution of the world’s seas and oceans as a contemporary challenge in ocean governance. Nat. Commun.
2018, 9, 667. [CrossRef]14. Cook, C.R.; Halden, R.U. Ecological and health issues of plastic waste. In Plastic Waste and Recycling; Letcher, T.M., Ed.; Academic
Press: Cambridge, MA, USA, 2020; pp. 513–527.15. Frydkjær, C.K.; Iversen, N.; Roslev, P. Ingestion and egestion of microplastics by the cladoceran daphnia magna: Effects of regular
and irregular shaped plastic and sorbed phenanthrene. Bull. Environ. Contam. Toxicol. 2017, 99, 655–661. [CrossRef] [PubMed]16. Muradov, M.; Kot, P.; Ateeq, M.; Abdullah, B.; Shaw, A.; Hashim, K.; Al-Shamma’a, A. Real-time detection of plastic shards in
cheese using microwave-sensing technique. Proceedings 2019, 42, 54.17. Rehse, S.; Kloas, W.; Zarfl, C. Short-term exposure with high concentrations of pristine microplastic particles leads to immobilisa-
tion of daphnia magna. Chemosphere 2016, 153, 91–99. [CrossRef] [PubMed]18. Jemec, A.; Horvat, P.; Kunej, U.; Bele, M.; Kržan, A. Uptake and effects of microplastic textile fibers on freshwater crustacean
daphnia magna. Environ. Pollut. 2016, 219, 201–209. [CrossRef] [PubMed]19. Rothschild, M.F.; Ruvinsky, A. The Genetics of the Pig, 2nd ed.; C.A.B. International: Wallingford, UK, 2011.20. Vodicka, P.; Smetana, K.; Dvoránková, B.; Emerick, T.; Xu, Y.Z.; Ourednik, J.; Ourednik, V.; Motlík, J. The miniature pig as an
animal model in biomedical research. Ann. N. Y. Acad. Sci. 2005, 1049, 161–171. [CrossRef]21. Swindle, M.M.; Makin, A.; Herron, A.J.; Clubb, F.J.; Frazier, K.S. Swine as models in biomedical research and toxicology testing.
Vet. Pathol. 2012, 49, 344–356. [CrossRef]22. Aigner, B.; Renner, S.; Kessler, B.; Klymiuk, N.; Kurome, M.; Wünsch, A.; Wolf, E. Transgenic pigs as models for translational
biomedical research. J. Mol. Med. 2010, 88, 653–664. [CrossRef]23. Bradbury, A.G.; Argyle, S.; Eddleston, M.; Clutton, R.E. Prophylactic use of antimicrobials in surgical pig models; a literature
review. Vet. Res. 2015, 177, 16–21.24. Campisi, C.C.; Jiga, L.P.; Ryan, M.; di Summa, P.G.; Campisi, C.; Ionac, M. Mastering lymphatic microsurgery: Anew training
model in living tissue. Ann. Plast. Surg. 2017, 79, 298–303. [CrossRef]25. Henze, L.J.; Koehl, N.J.; O’Shea, J.P.; Kostewicz, E.S.; Holm, R.; Griffin, B.T. The pig as a preclinical model for predicting oral
bioavailability and in vivo performance of pharmaceutical oral dosage forms: A pearrl review. J. Pharm. Pharmacol. 2019, 71,581–602. [CrossRef]
26. Bures, J.; Kvetina, J.; Radochova, V.; Tacheci, I.; Peterova, E.; Herman, D.; Dolezal, R.; Kopacova, M.; Rejchrt, S.; Douda, T.The pharmacokinetic parameters and the effect of a single and repeated doses of memantine on gastric myoelectric activity inexperimental pigs. PLoS ONE 2020, 15, e0227781. [CrossRef]
27. Peng, L.; Fu, D.; Qi, H.; Lan, C.Q.; Yu, H.; Ge, C. Micro- and nano-plastics in marine environment: Source, distribution andthreats—A review. Sci. Total Environ. 2020, 698, 13425. [CrossRef] [PubMed]
28. Wu, X.; Lu, J.; Du, M.; Xu, X.; Beiyuan, J.; Sarkar, B.; Bolan, N.; Xu, W.; Xu, S.; Chen, X.; et al. Particulate plastics-plant interactionin soil and its implications: A review. Sci. Total Environ. 2021, 792, 148337. [CrossRef] [PubMed]
149
Membranes 2022, 12, 366
29. Beriot, N.; Zomer, P.; Zornoza, R.; Geissen, V. A laboratory comparison of thei interactions between three plastic mulch types and38 active substances found in pesticides. PeerJ 2020, 8, e9876. [CrossRef] [PubMed]
30. Clukey, K.E.; Lepczyk, C.A.; Balazs, G.H.; Work, T.M.; Lynch, J.M. Investigation of plastic debris ingestion by four species of seaturtles collected as bycatch in pelagic pacific longline fisheries. Mar. Pollut. Bull. 2017, 120, 117–125. [CrossRef] [PubMed]
31. Markic, A.; Gaertner, J.-C.; Gaertner-Mazouni, N.; Koelmans, A.A. Plastic ingestion by marine fish in the wild. Crit. Rev. Environ.
Sci. Technol. 2020, 50, 657–697. [CrossRef]32. Choi, D.; Hwang, J.; Bang, J.; Han, S.; Kim, T.; Oh, Y.; Hwang, Y.; Choi, J.; Hong, J. In vitro toxicity from a physical perspective of
polyethylene microplastics based on statistical curvature change analysis. Sci. Total Environ. 2021, 752, 142242. [CrossRef]33. Marsalek, R.; Kotyrba, M.; Volna, E.; Jarusek, R. Neural network modelling for prediction of zeta potential. Mathematics 2021, 9,
3089. [CrossRef]34. Naumowicz, M.; Zajac, M.; Kusaczuk, M.; Gál, M.; Kotynska, J. Electrophoretic light scattering and electrochemical impedance
spectroscopy studies of lipid bilayers modified by cinnamic acid and its hydroxyl derivatives. Membranes 2020, 10, 343. [CrossRef]35. Wang, M.L.; Hauschka, P.V.; Tuan, R.S.; Steinbeck, M.J. Exposure to Particles Stimulates Superoxide Production by Human THP-1
Macrophages and Avian HD-11EM Osteoclasts Activated by Tumor Necrosis Factor-α and PMA. J. Arthroplast. 2002, 17, 335–346.[CrossRef]
36. Liu, S.; Wu, X.; Gu, W.; Yu, J.; Wu, B. Influence of the digestive process on intestinal toxicity of polystyrene microplastics asdetermined by in vitro Caco-2 models. Chemosphere 2020, 256, 127204. [CrossRef] [PubMed]
37. Wu, B.; Wu, X.; Liu, S.; Wang, Z.; Chen, L. Size-dependent effects of polystyrene microplastics on cytotoxicity and efflux pumpinhibition in human Caco-2 cells. Chemosphere 2019, 221, 333–341. [CrossRef] [PubMed]
38. Fang, J.; Xuan, Y.; Li, Q. Preparation of polystyrene spheres in different particle sizes and assembly of the PS colloidal crystals. Sci.
China Technol. Sci. 2010, 53, 3088–3093. [CrossRef]39. Joseph, E.; Singhvi, G. Multifunctional nanocrystals for cancer therapy: A potential nanocarrier. In Nanomaterials for Drug Delivery
and Therapy; Grumezescu, A.M., Ed.; William Andrew Publishing: Amsterdam, The Netherlands, 2019; pp. 91–116.40. Silva, D.C.N.; Jovino, C.N.; Silva, C.A.L.; Fernandes, H.P.; Filho, M.M.; Lucena, S.C.; Costa, A.M.D.N.; Cesar, C.L.;
Barjas-Castro, M.L.; Santos, B.S. Optical tweezers as a new biomedical tool to measure zeta potential of stored red blood cells.PLoS ONE 2012, 7, e31778. [CrossRef]
41. Godin, C.; Caprani, A. Effect of blood storage on erythrocyte/wall interactions: Implications for surface charge and rigidity. Eur.
Biophys. J. 1997, 26, 175–182. [CrossRef]42. Durocher, J.R.; Payne, R.C.; Conrad, M.E. Role of sialic acid in erythrocyte survival. Blood 1975, 45, 11–20. [CrossRef]43. Wang, T.; Bai, J.; Jiang, X.; Nienhaus, G.U. Cellular uptake of nanoparticles by membrane penetration: Astudy combining confocal
microscopy with FTIR spectroelectrochemistry. ACS Nano 2012, 6, 1251–1259. [CrossRef]44. Jiang, X.; Dausend, J.; Hafner, M.; Musyanovych, A.; Röcker, C.; Landfester, K.; Mailänder, V.; Nienhaus, G.U. Specific effects
of surface amines on polystyrene nanoparticles in their interactions with mesenchymal stem cells. Biomacromolecules 2010, 11,748–753. [CrossRef]
45. Dwivedi, M.V.; Harishchandra, R.K.; Koshkina, O.; Maskos, M.; Galla, H.-J. Size influences the effect of hydrophobic nanoparticleson lung surfactant model systems. Biophys. J. 2014, 106, 289–298. [CrossRef]
46. Chambers, E.; Mitragotri, S. Prolonged circulation of large polymeric nanoparticles by non-covalent adsorption on erythrocytes. J.
Control. Release 2004, 100, 111–119. [CrossRef]47. Chambers, E.; Mitragotri, S. Long circulating nanoparticles via adhesion on red blood cells: Mechanism and extended circulation.
Exp. Biol. Med. 2007, 232, 958–966.48. Rothen-Rutishauser, B.M.; Schürch, S.; Haenni, B.; Kapp, N.; Gehr, P. Interaction of fine particles and nanoparticles with red blood
cells visualized with advanced microscopic techniques. Environ. Sci. Technol. 2006, 40, 4353–4359. [CrossRef] [PubMed]49. Geiser, M.; Rothen-Rutishauser, B.; Kapp, N.; Schürch, S.; Kreyling, W.; Schulz, H.; Semmler, M.; Im Hof, V.; Heyder, J.; Gehr, P.
Ultrafine particles cross cellular membranes by nonphagocytic mechanisms in lungs and in cultured cells. Environ. Health Perspect.
2005, 113, 1555–1560. [CrossRef] [PubMed]50. Kunicki, T.J. Platelet membrane glycoproteins and their function: An overview. Blut 1989, 59, 30–34. [CrossRef]51. Smyth, E.; Solomon, A.; Vydyanath, A.; Luther, P.K.; Pitchford, S.; Tetley, T.D.; Emerson, M. Induction and enhancement of
platelet aggregation in vitro and in vivo by model polystyrene nanoparticles. Nanotoxicology 2015, 9, 356–364. [CrossRef]52. Nemmar, A.; Hoylaerts, M.F.; Hoet, P.H.M.; Dinsdale, D.; Smith, T.; Xu, H.; Vermylen, J.; Nemery, B. Ultrafine Particles affect
experimental thrombosis in an in vivo hamster model. Am. J. Respir. Crit. Care Med. 2002, 166, 998–1004. [CrossRef]53. McGuinnes, C.; Duffin, R.; Brown, S.; Mills, L.N.; Megson, I.L.; MacNee, W.; Johnston, S.; Lu, S.L.; Tran, L.; Li, R.; et al. Surface
derivatization state of polystyrene latex nanoparticles determines both their potency and their mechanism of causing humanplatelet aggregation in vitro. Toxicol. Sci. 2011, 119, 359–368. [CrossRef]
54. Oslakovic, C.; Cedervall, T.; Linse, S.; Dahlbäck, B. Polystyrene nanoparticles affecting blood coagulation. Nanomedicine 2012, 8,981–986. [CrossRef]
150
MDPISt. Alban-Anlage 66
4052 BaselSwitzerland
Tel. +41 61 683 77 34Fax +41 61 302 89 18
www.mdpi.com
Membranes Editorial OfficeE-mail: [email protected]
www.mdpi.com/journal/membranes


MDPI
St. Alban-Anlage 66
4052 Basel
Switzerland
Tel: +41 61 683 77 34
Fax: +41 61 302 89 18
www.mdpi.com ISBN 978-3-0365-4057-3


