BIOREMEDIATION OF WASTEWATER USING MICROALGAE
Dissertation
Submitted to
The School of Engineering of the
UNIVERSITY OF DAYTON
In Partial Fulfillment of the Requirements for
The Degree of
Doctor of Philosophy in Materials Engineering
By
Saikumar Chalivendra
UNIVERSITY OF DAYTON
Dayton, Ohio
December, 2014
ii
BIOREMEDIATION OF WASTEWATER USING MICROALGAE
Name: Chalivendra, Saikumar
APPROVED BY:
_______________________________ ________________________________
Sukh S. Sidhu, Ph.D. Moshan Kahandawala, Ph.D.
Advisory Committee Chairperson Committee Member
Division Head, Group Leader,
Distinguished Research Engineer Senior Research Engineer
Energy Technologies & Materials Division Bioenergy & Carbon Mitigation Group
University of Dayton Research Institute University of Dayton Research Institute
Professor,
Dept. of Mechanical & Aerospace Engineering
______________________________ _______________________________
Denise Taylor, Ph.D., P.E. Amy Ciric, Ph.D.
Committee Member Committee Member
Associate Professor Associate Professor
Civil and Environmental Engineering Chemical and Materials Engineering
and Engineering Mechanics University of Dayton
University of Dayton
______________________________ _______________________________
John G. Weber, Ph.D. Eddy M. Rojas, Ph.D., M.A., P.E.
Associate Dean Dean
School of Engineering School of Engineering

iii
© Copyright by
Saikumar Chalivendra
All rights reserved
2014
iv
ABSTRACT
BIOREMEDIATION OF WASTEWATER USING MICROALGAE
Name: Chalivendra, Saikumar
University of Dayton
Advisor: Dr. Sukh S. Sidhu
Population expansion and industrial development has deteriorated the quality of
freshwater reservoirs around the world and has caused freshwater shortages in certain
areas. Discharge of industrial effluents containing toxic heavy metals such as Cd and Cr
into the environment have serious impact on human, animal and aquatic life. In order to
solve these problems, the present study was focused on evaluating and demonstrating
potential of microalgae for bioremediation of wastewater laden with nitrogen (N) in the
form of nitrates, phosphorous (P) in the form of phosphates, chromium (Cr (VI)) and
cadmium (Cd (II)). After screening several microalgae, Chlorella vulgaris and algae
taken from Pleasant Hill Lake were chosen as candidate species for this study. The
viability of the process was demonstrated in laboratory bioreactors and various
experimental parameters such as contact time, initial metal concentration, algae
concentration, pH and temperature that would affect remediation rates were studied.
Based on the experimental results, correlations were developed to enable customizing and
designing a commercial Algae based Wastewater Treatment System (AWTS). A
v
commercial AWTS system that can be easily customized and is suitable for integration
into existing wastewater treatment facilities was developed, and capital cost estimates for
system including installation and annual operating costs were determined.
The work concludes that algal bioremediation is a viable alternate technology for
treating wastewater in an economical and sustainable way when compared to
conventional treatment processes. The annual wastewater treatment cost to remove N,P
is ~26x lower and to remove Cr, Cd is 7x lower than conventional treatment processes.
The cost benefit analysis performed shows that if this technology is implemented at
industrial complexes, Air Force freight and other Department of Defense installations
with wastewater treatment plants, it could lead to millions of dollars in savings that could
be repurposed for meeting other needs.
vi
ACKNOWLEDGEMENTS
First and foremost I would like to thank and express my deepest gratitude to Dr.
Moshan Kahandawala for his mentorship and support throughout the project. The best
teacher I could have wished for, he is actively involved in the work of all of his students,
and clearly always has their best interest in mind. I thank him for making time for me
around the clock, despite his other commitments, whenever I needed his help or
suggestions. I have learnt much about scientific experimentation from his vast experience
and knowledge, and his persistence and attention to detail. In every sense, none of this
work would have been possible without his help. I would like to thank my advisor Dr.
Sukh Sidhu for patiently guiding and encouraging me throughout this work. He has been
instrumental in ensuring my academic, professional and financial well-being ever since I
started working for University of Dayton Research Institute. Last but not the least I am
forever indebted to my family for supporting me during all the ups and downs of this
project. Any number of words I would use here are not sufficient to thank my family. I
can never thank them enough for their unwavering love and support.
vii
TABLE OF CONTENTS
ABSTRACT ....................................................................................................................... iv
ACKNOWLEDGEMENTS ............................................................................................... vi
LIST OF FIGURES………………………………………………………………………xi
LIST OF TABLES…………………………………………………………………….xviii
LIST OF SYMBOLS, NOTATIONS, AND DEFINITIONS ........................................... xx
CHAPTER 1 INTRODUCTION………………………………………………………….1
1.1 Conventional Wastewater Treatment ................................................................... 2
1.2 Nitrogen, Phosphorus and Heavy Metal Contamination ...................................... 4
1.2.1 Nitrogen and Phosphorus Contamination ..................................................... 4
1.2.2 Heavy Metal Contamination ......................................................................... 5
1.3 Regulations ........................................................................................................... 7
1.4 Conventional Removal Technologies .................................................................. 8
1.4.1 Nitrogen Removal Technology ..................................................................... 9
1.4.2 Phosphorus Removal Technology ................................................................ 9
1.4.3 Heavy Metal Removal Technology .............................................................. 9
1.5 Need for Novel Technology ............................................................................... 10
1.6 Microalgae .......................................................................................................... 11
CHAPTER 2 LITERATURE ............................................................................................ 12
2.1 Wastewater Treatment with Microalgae ............................................................ 12
2.2 Mechanisms of Nutrient and Heavy Metal Removal ......................................... 13
2.2.1 Nitrogen ...................................................................................................... 14
2.2.2 Phosphorus .................................................................................................. 15
2.2.3 Heavy Metals .............................................................................................. 15
2.3 Logic of Strain Selection .................................................................................... 16
2.4 Growth Conditions of Chlorella Vulgaris .......................................................... 17
2.5 Growth Controlling Factors of Microalgae ........................................................ 18
viii
2.5.1 Carbon ......................................................................................................... 18
2.5.2 Nitrogen and Phosphorus ............................................................................ 19
2.5.3 Light Intensity ............................................................................................. 19
2.5.4 Temperature ................................................................................................ 20
2.5.5 pH ................................................................................................................ 20
2.6 Metal Chemistry ................................................................................................. 20
2.6.1 Electron Distribution ................................................................................... 21
2.6.2 Effect of pH................................................................................................. 22
2.7 Nutrients and Heavy Metal (Cd, Cr) Removal (current knowledge) ................. 22
2.7.1 Nutrients (nitrogen and phosphorus) ............................................................... 22
2.7.2 Cd and Cr Removal ..................................................................................... 26
CHAPTER 3 RESEARCH OBJECTIVES ....................................................................... 32
3.1 Specific Objectives ............................................................................................. 32
CHAPTER 4 MATERIALS AND METHODS ............................................................... 34
4.1 Microalgae .......................................................................................................... 34
4.2 Growth Medium ................................................................................................. 36
4.2.1 BBM ............................................................................................................ 36
4.2.2 TAP Medium .............................................................................................. 37
4.2.3 f/2 Medium.................................................................................................. 37
4.3 Culture Conditions ............................................................................................. 40
4.4 Glassware Cleaning ............................................................................................ 40
4.5 Experimental Setup ............................................................................................ 40
4.6 Wastewater Experiments (Nitrate and Phosphorus Removal) ........................... 41
4.6.1 Preliminary Experiments (selection of microalgae) ................................... 41
4.6.2 Nitrate and Phosphorus Removal Experiments .......................................... 43
4.6.3 Effect of nitrogen source on growth of Chlorella vulgaris ......................... 45
4.6.4 Phosphorus Removal by Species Acclimated to High P Environments .......... 46
4.7 Heavy Metal (Cr, Cd) Removal Experiments. ................................................... 48
4.7.1 Preliminary Studies ..................................................................................... 48
4.7.1.1 EDTA Washing ........................................................................................ 49
4.7.2 Cr and Cd Removal Experiments ............................................................... 50
4.7.3 Heavy Metal Removal by Mixotrophically and Heterotrophically Grown
Algae ……………………………………………………………………………..54
4.8 Analysis .............................................................................................................. 56
4.8.1 Absorbance ................................................................................................. 56
ix
4.8.2 Algae Cell Growth ...................................................................................... 57
4.8.3 Nitrate Analysis .......................................................................................... 58
4.8.4 Phosphorus Analysis ................................................................................... 58
4.8.5 Total Nitrogen Analysis .............................................................................. 59
4.8.6 Metal Analysis ............................................................................................ 59
4.8.7 Lipid Extraction .......................................................................................... 60
CHAPTER 5 RESULTS AND DISCUSSION ................................................................. 62
5.1 Nitrate and Phosphorus Removal ....................................................................... 63
5.1.1. Preliminary Experiments (selection of microalgae) ................................... 63
5.1.2 Nitrate and Phosphorus Removal Experiments .......................................... 67
5.1.2.1 Effect of Nitrate and Phosphorus on Growth .......................................... 68
5.1.2.2 Effect of Initial Phosphorus Concentration on Nitrate Removal ............ 72
5.1.2.3 Effect of Initial Nitrate Concentration on Phosphorus Removal ............ 75
5.1.2.4 Effect of Nitrate Concentration on Lipid Content ................................... 78
5.1.2.5 Nitrogen Uptake Validation .................................................................... 81
5.1.2.6 Bio Kinetic Coefficients of Nitrate and Phosphorus Removal ................ 86
5.1.3. Effect of Temperature on Nitrate and Phosphorus Removal ...................... 88
5.1.4. Nitrogen Removal from Different Nitrogen Sources .................................. 92
5.1.5. Phosphorus Removal by Species Acclimated to High P Environments ..... 96
5.2. Heavy Metal (Cr, Cd) Removal Experiments. ................................................. 101
5.2.1 Preliminary Studies ................................................................................... 101
5.2.2 Biosorption of Chromium and Cadmium from Synthetic Wastewater by
Chlorella vulgaris. ................................................................................................... 108
5.2.3 Kinetics Studies ........................................................................................ 119
5.2.5 Heavy Metal Removal Under Mixotrophic and Heterotrophic Conditions
……………………………………………………………………………127
5.2.5.1 Mixotrophic and Heterotrophic Growth ............................................... 127
5.2.5.2 Heavy Metal Removal ........................................................................... 133
5.3 Application of Algal Bioremediation for Wastewater Treatment at Industrial
Complexes................................................................................................................... 135
5.4 Metal Recovery from Algae Surface ................................................................ 138
5.5 Design of Algae-based Wastewater Treatment Technology (AWTS) ............. 140
5.5.1 Technology Assumptions.......................................................................... 141
5.5.2 Site Location and Climatic Conditions ..................................................... 142
5.5.3 Design Theory ........................................................................................... 143
x
5.5.4 Design Principle ........................................................................................ 149
5.5.5 Cost Estimation ......................................................................................... 153
5.5.6 Conventional Process vs AWTS for Treating Metal Laden Water. .......... 157
CHAPTER 6 SUMMARY AND FUTURE WORK ...................................................... 161
6.1. Summary .......................................................................................................... 161
6.2 Future Work ..................................................................................................... 162
BIBLIOGRAPHY ........................................................................................................... 163
APPENDIX A Cost Estimation ...................................................................................... 188
xi
LIST OF FIGURES
Figure 1.1 Schematic representation of conventional wastewater treatment plant. ............ 3
Figure 2.1. Process involved in a high rate algal pond. .................................................... 13
Figure 2.2 Conversion of inorganic nitrogen to organic nitrogen. ................................... 14
Figure 2.3. Metal binding sites of a typical algal cell. ...................................................... 16
Figure 4.1. Microscopic photos of algae species .............................................................. 35
Figure 4.2. Bioremediation experimental set up. .............................................................. 42
Figure 5.1. Nitrate removal from wastewater. .................................................................. 63
Figure 5.2. Nitrate uptake per unit biomass. ..................................................................... 64
Figure 5.3. Phosphorus removal from wastewater............................................................ 65
Figure 5.4. Phosphate uptake per unit biomass................................................................. 66
Figure 5.5. Growth of species in wastewater. ................................................................... 67
Figure 5.6. Growth curves of C.vulgaris in synthetic wastewater at different P
loading, (PO4)i experiments [PO4-P (mg/L) (♦)13.1; (■) 26.21; (▴)52.42 ]; [NO3- ~
183 mg/L].......................................................................................................................... 69
Figure 5.7. Growth curves of C.vulgaris in synthetic wastewater at different nitrate
loading, (NO3)i experiments.[NO3- (mg/L) (♦) 90.12; (■) 182.68; (▴) 362.69; (●)741.56];
[PO4-P ~52 mg/L]. ............................................................................................................ 69
Figure 5.8. General pattern of microalgal growth in batch cultures. ................................ 70
xii
Figure 5.9. Variation of nitrate concentration in wastewater with time under various
initial phosphorus concentrations, (PO4)i experiments.[PO4-P (mg/L) (♦)13.1; (■) 26.21;
(▴) 52.42] and constant nitrate concentration (NO3- ~ 183 mg/L). ................................... 74
Figure 5.10. Variation of phosphorus concentration in wastewater with time under
various initial phosphorus concentrations, (PO4)i experiments.[PO4-P (mg/L) (♦)13.1; (■)
26.21; (▴) 52.42] and constant nitrate concentration (NO3- ~ 183 mg/L). ........................ 74
Figure 5.11. Variation of phosphorus concentration in wastewater with time under
various initial nitrate concentrations, (NO3)i experiments. [NO3- (mg/L) (♦) 90.12;(■)
182.68; (▴) 362.69; (●) 741.56] and constant phosphorus concentration
(PO4- P ~ 52mg/L). ........................................................................................................... 77
Figure 5.12. Variation of nitrate concentration in wastewater with time under various
initial nitrate concentrations, (NO3)i experiments.[ NO3- (mg/L) (♦)90.12; (■) 182.68;
(▴) 362.69; (●) 741.56] and constant phosphorus concentration (PO4-P ~52 mg/L). ....... 77
Figure 5.13. Nitrate uptake rate as a function of initial nitrate concentration. ................. 78
Figure 5.14. Nitrate removal efficiency in synthetic wastewater for (NO3)i
experiments. ...................................................................................................................... 78
Figure 5.15. Comparison of lipid content of C.vulgaris grown in synthetic wastewater
with different initial nitrate concentration in exponential and stationary phase. .............. 79
Figure 5.16. Nitrogen validation for (PO4)1 experiments. ................................................ 82
Figure 5.17. Nitrogen validation for (PO4)2 experiment. .................................................. 82
Figure 5.18. Nitrogen validation for (PO4)3 experiment. .................................................. 83
Figure 5.19. Nitrogen validation for (NO3)1 experiment. ................................................. 83
Figure 5.20. Nitrogen validation for (NO3)2 experiment. ................................................. 84
xiii
Figure 5.21. Nitrogen validation for (NO3)3 experiment. ................................................. 84
Figure 5.22. Nitrogen validation for (NO3)4 experiment. ................................................. 85
Figure 5.23. Effect of initial NO3-N concentration on specific NO3-N removal rate for
(NO3)i set of experiments. ................................................................................................. 87
Figure 5.24. Effect of initial PO4-P concentration on specific PO4-P removal rate for
(PO4)i set of experiments. ................................................................................................. 88
Figure 5.25. Effect of temperature on algal biomass productivity. .................................. 89
Figure 5.26. Effect of temperature on nitrate uptake of C.vulgaris. ................................. 91
Figure 5.27. Effect of temperature on phosphorus uptake of C.vulgaris. ......................... 91
Figure 5.28. Growth of C.vulgaris under different nitrogen sources................................ 93
Figure 5.29. Biomass productivity of C.vulgaris under different nitrogen sources. ......... 93
Figure 5.30. Variation of nitrogen concentration with time in synthetic wastewater
containing four different nitrogen sources. ....................................................................... 95
Figure 5.31. Variation of nitrogen removal efficiency with time in synthetic wastewater
containing four different nitrogen sources. ....................................................................... 95
Figure 5.32. Nitrogen uptake by C.vulgaris from different nitrogen sources. .................. 96
Figure 5.33. Growth curve of Pleasant hill Lake species at different phosphorus
concentrations (P1= ~10 ppm, P2= ~20 ppm, P3= ~30 ppm). ......................................... 97
Figure 5.34. Growth curve of Delaware Lake species at different phosphours
concentrations (P4= ~10 ppm, P5= ~20 ppm, P6= ~30 ppm). ......................................... 97
Figure 5.35. Phosphorus removal from Plesant hill lake species (P1= ~10 ppm, P2= ~20
ppm, P3= ~30 ppm). ......................................................................................................... 98
xiv
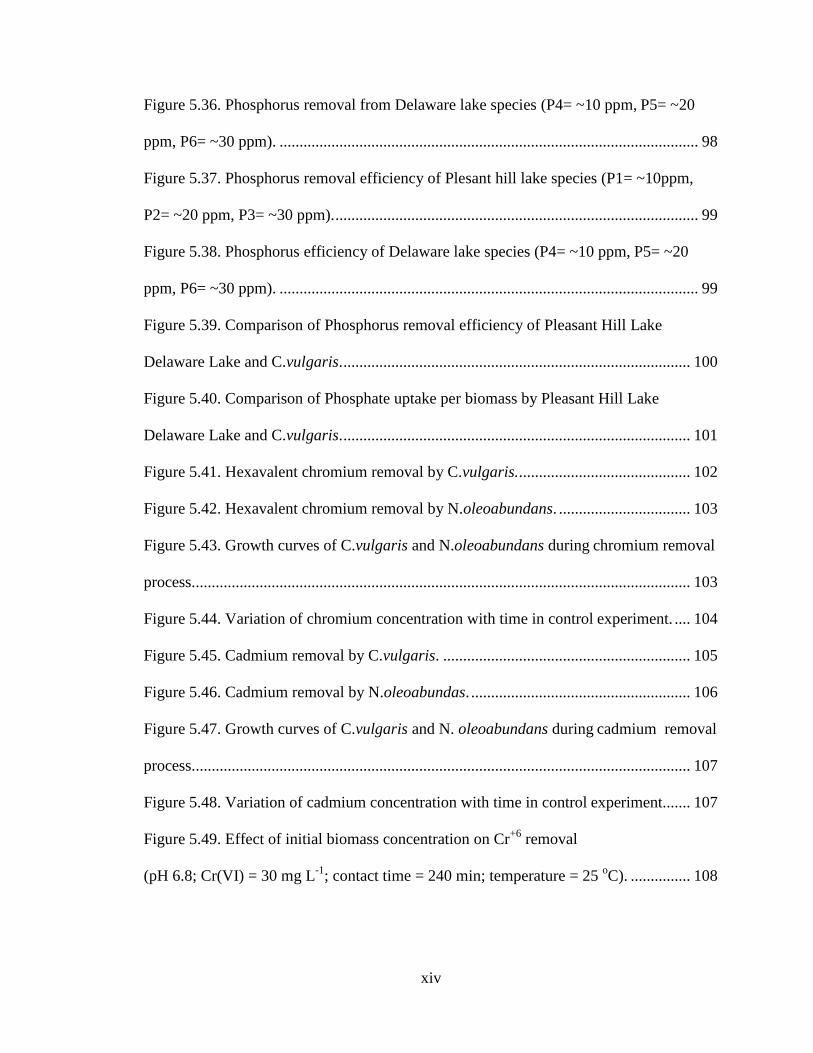
Figure 5.36. Phosphorus removal from Delaware lake species (P4= ~10 ppm, P5= ~20
ppm, P6= ~30 ppm). ......................................................................................................... 98
Figure 5.37. Phosphorus removal efficiency of Plesant hill lake species (P1= ~10ppm,
P2= ~20 ppm, P3= ~30 ppm). ........................................................................................... 99
Figure 5.38. Phosphorus efficiency of Delaware lake species (P4= ~10 ppm, P5= ~20
ppm, P6= ~30 ppm). ......................................................................................................... 99
Figure 5.39. Comparison of Phosphorus removal efficiency of Pleasant Hill Lake
Delaware Lake and C.vulgaris. ....................................................................................... 100
Figure 5.40. Comparison of Phosphate uptake per biomass by Pleasant Hill Lake
Delaware Lake and C.vulgaris. ....................................................................................... 101
Figure 5.41. Hexavalent chromium removal by C.vulgaris. ........................................... 102
Figure 5.42. Hexavalent chromium removal by N.oleoabundans. ................................. 103
Figure 5.43. Growth curves of C.vulgaris and N.oleoabundans during chromium removal
process............................................................................................................................. 103
Figure 5.44. Variation of chromium concentration with time in control experiment. .... 104
Figure 5.45. Cadmium removal by C.vulgaris. .............................................................. 105
Figure 5.46. Cadmium removal by N.oleoabundas. ....................................................... 106
Figure 5.47. Growth curves of C.vulgaris and N. oleoabundans during cadmium removal
process............................................................................................................................. 107
Figure 5.48. Variation of cadmium concentration with time in control experiment....... 107
Figure 5.49. Effect of initial biomass concentration on Cr+6
removal
(pH 6.8; Cr(VI) = 30 mg L-1
; contact time = 240 min; temperature = 25 oC). ............... 108
xv
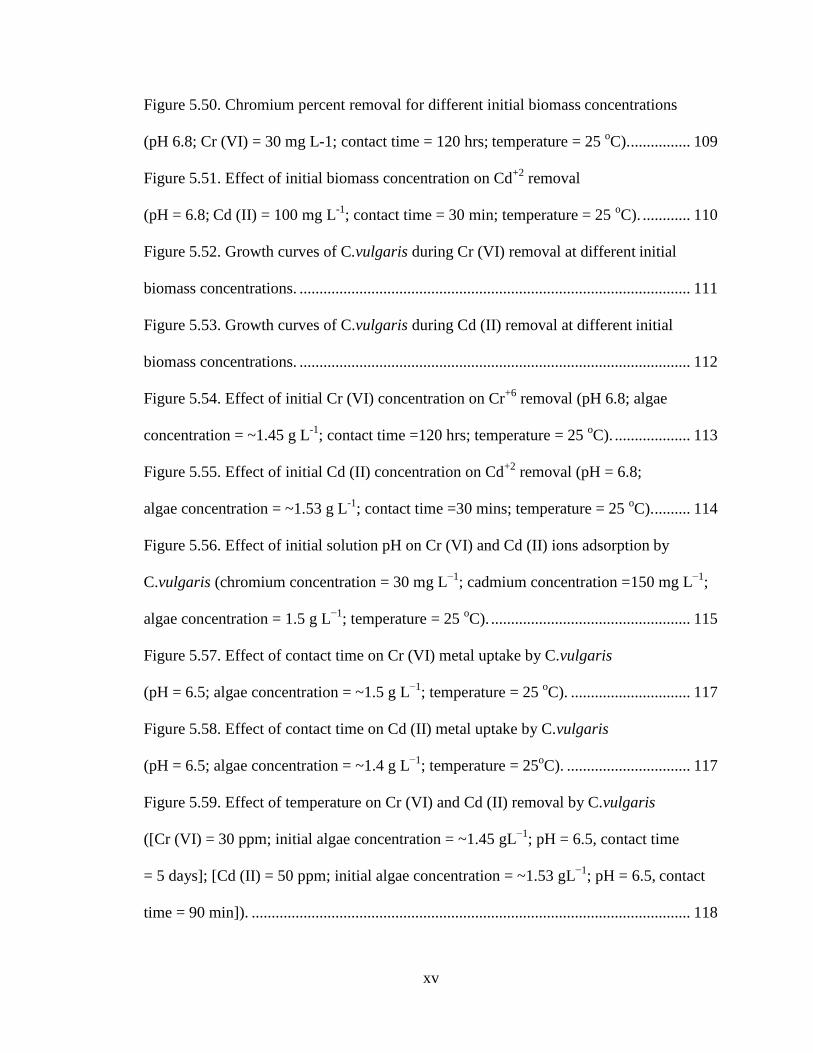
Figure 5.50. Chromium percent removal for different initial biomass concentrations
(pH 6.8; Cr (VI) = 30 mg L-1; contact time = 120 hrs; temperature = 25 oC). ............... 109
Figure 5.51. Effect of initial biomass concentration on Cd+2
removal
(pH = 6.8; Cd (II) = 100 mg L-1
; contact time = 30 min; temperature = 25 oC). ............ 110
Figure 5.52. Growth curves of C.vulgaris during Cr (VI) removal at different initial
biomass concentrations. .................................................................................................. 111
Figure 5.53. Growth curves of C.vulgaris during Cd (II) removal at different initial
biomass concentrations. .................................................................................................. 112
Figure 5.54. Effect of initial Cr (VI) concentration on Cr+6
removal (pH 6.8; algae
concentration = ~1.45 g L-1
; contact time =120 hrs; temperature = 25 oC). ................... 113
Figure 5.55. Effect of initial Cd (II) concentration on Cd+2
removal (pH = 6.8;
algae concentration = ~1.53 g L-1
; contact time =30 mins; temperature = 25 oC). ......... 114
Figure 5.56. Effect of initial solution pH on Cr (VI) and Cd (II) ions adsorption by
C.vulgaris (chromium concentration = 30 mg L−1
; cadmium concentration =150 mg L−1
;
algae concentration = 1.5 g L−1
; temperature = 25 oC). .................................................. 115
Figure 5.57. Effect of contact time on Cr (VI) metal uptake by C.vulgaris
(pH = 6.5; algae concentration = ~1.5 g L−1
; temperature = 25 oC). .............................. 117
Figure 5.58. Effect of contact time on Cd (II) metal uptake by C.vulgaris
(pH = 6.5; algae concentration = ~1.4 g L−1
; temperature = 25oC). ............................... 117
Figure 5.59. Effect of temperature on Cr (VI) and Cd (II) removal by C.vulgaris
([Cr (VI) = 30 ppm; initial algae concentration = ~1.45 gL−1
; pH = 6.5, contact time
= 5 days]; [Cd (II) = 50 ppm; initial algae concentration = ~1.53 gL−1
; pH = 6.5, contact
time = 90 min]). .............................................................................................................. 118
xvi
Figure 5.60. Plots for the pseudo first order kinetics of Cr (VI) biosorption on
C.vulgaris........................................................................................................................ 121
Figure 5.61. Plots for the pseudo second order kinetics of Cr (VI) biosorption on
C.vulgaris. ....................................................................................................................... 122
Figure 5.62. Plots for the pseudo second order kinetics of Cd (II) biosorption on
C.vulgaris. ....................................................................................................................... 122
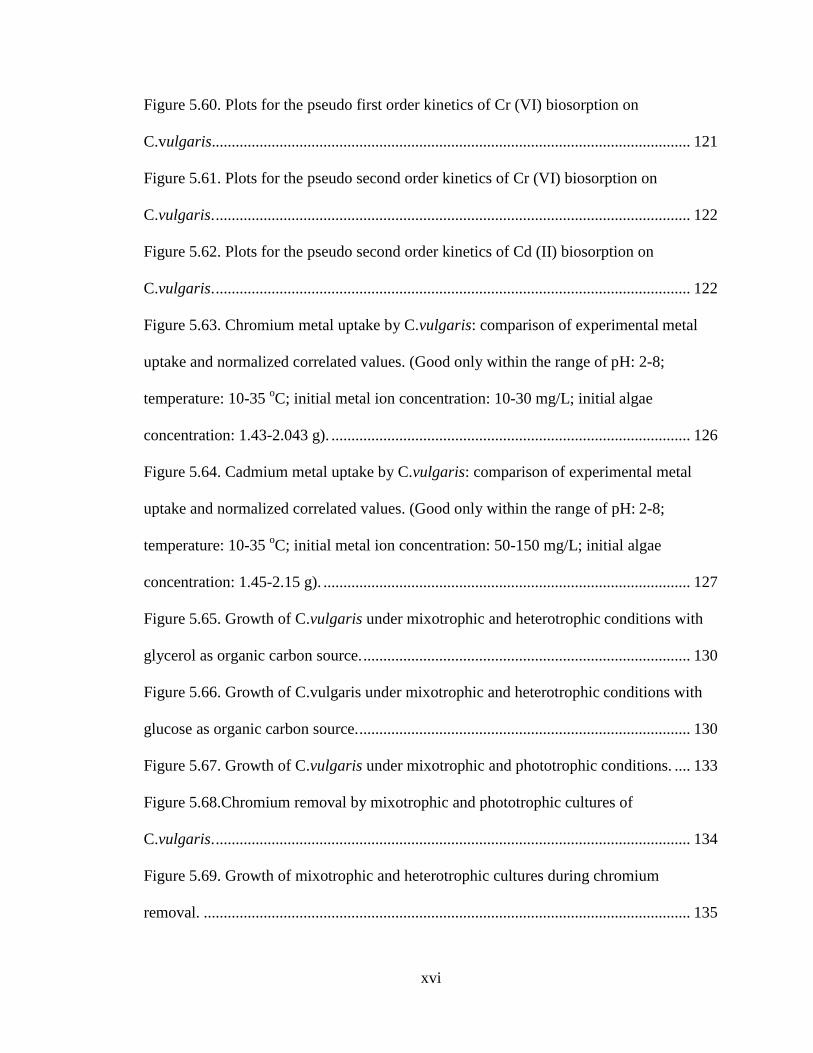
Figure 5.63. Chromium metal uptake by C.vulgaris: comparison of experimental metal
uptake and normalized correlated values. (Good only within the range of pH: 2-8;
temperature: 10-35 oC; initial metal ion concentration: 10-30 mg/L; initial algae
concentration: 1.43-2.043 g). .......................................................................................... 126
Figure 5.64. Cadmium metal uptake by C.vulgaris: comparison of experimental metal
uptake and normalized correlated values. (Good only within the range of pH: 2-8;
temperature: 10-35 oC; initial metal ion concentration: 50-150 mg/L; initial algae
concentration: 1.45-2.15 g). ............................................................................................ 127
Figure 5.65. Growth of C.vulgaris under mixotrophic and heterotrophic conditions with
glycerol as organic carbon source. .................................................................................. 130
Figure 5.66. Growth of C.vulgaris under mixotrophic and heterotrophic conditions with
glucose as organic carbon source. ................................................................................... 130
Figure 5.67. Growth of C.vulgaris under mixotrophic and phototrophic conditions. .... 133
Figure 5.68.Chromium removal by mixotrophic and phototrophic cultures of
C.vulgaris. ....................................................................................................................... 134
Figure 5.69. Growth of mixotrophic and heterotrophic cultures during chromium
removal. .......................................................................................................................... 135
xvii
Figure 5.70. Variation of Chromium percent removal with time by C.vulgaris. ........... 137
Figure 5.71. Comparison of chromium removal for two biomass treatment cycles
for 1 hour......................................................................................................................... 137
Figure 5.72. Cadmium removal by C.vulgaris. .............................................................. 138
Figure 5.73. Schematic representation of metal bounded algae gasification. ................. 139
Figure 5.74. Flow chart of the design optimization strategy. ......................................... 144
Figure 5.75. Impeller ( D1/w = 5); D1 = 0.40 d. .............................................................. 145
Figure 5.76. Schematic representation of AWTS design ................................................ 151
xviii
LIST OF TABLES
Table 1.1. Sources of heavy metals from various industries .............................................. 6
Table 1.2. Health risks of various heavy metals ................................................................. 6
Table 1.3. Element requirements set by WHO ................................................................... 7
Table 1.4. Permissible limits of phosphate in water ........................................................... 8
Table 1.5. Industrial heavy metal discharge limits in US. .................................................. 8
Table 2.1.Nitrogen and phosphorus removal efficiencies. ............................................... 25
Table 2.2 Optimum pH values for sorption of Cr and Cd by algae……………………...30
Table 4.1. Microalgae strains used in this study. .............................................................. 36
Table 4.2. TAP medium. ................................................................................................... 38
Table 4.3. f/2 medium. ...................................................................................................... 39
Table 4.4.Experimental matrix for nitrate and phosphorus removal from synthetic
wastewater by Chlorella vulgaris...................................................................................... 44
Table 4.5. Experimental conditions for nitrate and phosphorus removal. ........................ 44
Table 4.6 Experimental matrix for N removal from different nitrogen sources. .............. 45
Table 4.7. Experimental matrix for P removal by Lake Species (species acclimated to .. 47
high P environments) ........................................................................................................ 47
Table 4.8 Biomass concentrations for preliminary experiments of Cr6+
and Cd2+
............ 49
removal. ............................................................................................................................ 49
xix
Table 4.9 Experimental matrix for Cr6+
removal by Chlorella. ........................................ 52
Table 4.10 Experimental matrix for Cd2+
removal by Chlorella. ..................................... 53
Table 4.11 Initial organic carbon and biomass concentrations for mixotrophic and ........ 56
heterotrophic growth of Chlorella vulgaris....................................................................... 56
Table 5.1. Specific growth rates of C.vulgaris. ................................................................ 71
Table 5.2. Effect of nitrate concentration on lipid content of C.vulgaris. ........................ 80
Table 5.3. Sorption rate expression for different metal concentrations. ......................... 121
Table 5.4. Comparison of adsorption capacities of various adsorbents used for Cr (VI)
and Cd (II) removal. ........................................................................................................ 123
Table:5.5 Growth rates of mixotrophic ........................................................................... 132
Table 5.6. Operation parameters for contaminant removal ............................................ 152
Table 5.7: Pond construction cost ................................................................................... 154
Table 5.8. Other costs involved in AWTS design .......................................................... 155
Table 5.9. Installation cost for equipment as a percentage of the purchased- ................ 156
equipment cost. ............................................................................................................... 156
Table 5.10. Total cost estimation for AWTS design ...................................................... 157
Table 5.11. Conventional process vs AWTS for treating metal laden water. ................. 158
Table 5.12. Conventional process vs. AWTS for treating municipal wastewater. ......... 159
xx
LIST OF SYMBOLS, NOTATIONS, AND DEFINITIONS
Abbreviation Key
CaCl2.2H2O Calcium chloride dihydrate
Co (NO3)2.6H2O Cobalt nitrate hexahydrate
CoCl2.6H2O Cobalt dichloride hexahydrate
KH2PO4 Potassium phosphate
FeSO4.7H2O Iron sulfate heptahydrate
H3BO3 Boric acid
MgSO4. 7H2O Magnesium sulfate heptahydrate
MnCl2.4 H2O Manganese chloride tetrahydrate
NaH2PO4.2H2O Sodium dihydrogen phosphate
Na2MoO4.2H2O Sodium molybdate dehydrate
NaNO3 Sodium nitrate
Na2SiO3.5H2O Sodium metasilicate pentahydrate
NH4Cl Ammonium Chloride
NH2CONH2 Urea
(NH4)6Mo7O24.4H2O Ammonium molybdate tetrahydrate
ZnSO47 H2O Zinc sulfate heptahydrate
GC/MS Gas chromatography/ Mass spectroscopy
ICP-MS Inductively coupled plasma mass spectrometry

xxi
TAG Triacylglyceride
AWTS Algae based Wastewater Treatment System
1
CHAPTER 1
INTRODUCTION
Despite the fact that the world is two-thirds water, most of it is not potable.
Population expansion and industrial development has deteriorated the quality of
freshwater reservoirs around the world and has caused freshwater shortages in certain
areas. According to U.S. geological survey, it is projected that by the year 2025 global
water demand will exceed supply by 56% [1]. To solve this water crisis and to meet the
growing population’s demand for freshwater, wastewater treatment techniques aimed at
remediating wastewater should be employed.
Wastewater is any type of water that has been negatively affected in quality by
anthropogenic influence. There are mainly two kinds of wastewater i.e. municipal
wastewater and industrial wastewater. Municipal wastewater consists of domestic
wastewaters originated from households, sewer overflows and storm drains. On average,
each American uses about 150 gallons of water a day– most of it in the home and
produces 80 gallons of wastewater per day [2]. As reported by Ramanarayanan et.al, the
total domestic wastewater generation rate in the US is about 31 x 109 million gallons per
day [3]. Remediating at least half volume of the wastewater generated daily will provide
a solution for water crisis.
2
Different industries produce various kinds of industrial wastewater based on their
own specific combination of pollutants. Among those, metal working industry serves as
an important pollution distributor discharging heavy metal waste (toxic waste) such as
nickel, lead, chromium, cadmium, zinc and iron contaminated wastewater into the
environment. This indiscriminate disposal of industrial and domestic wastes leads to
heavy pollution of water, threatening all kinds of inhabiting organisms [4]. Therefore, it
is necessary to focus on the treatment techniques and ways to partially remove
contaminants (nitrates, phosphates and heavy metals) from wastewater before discharging
them into waterways.
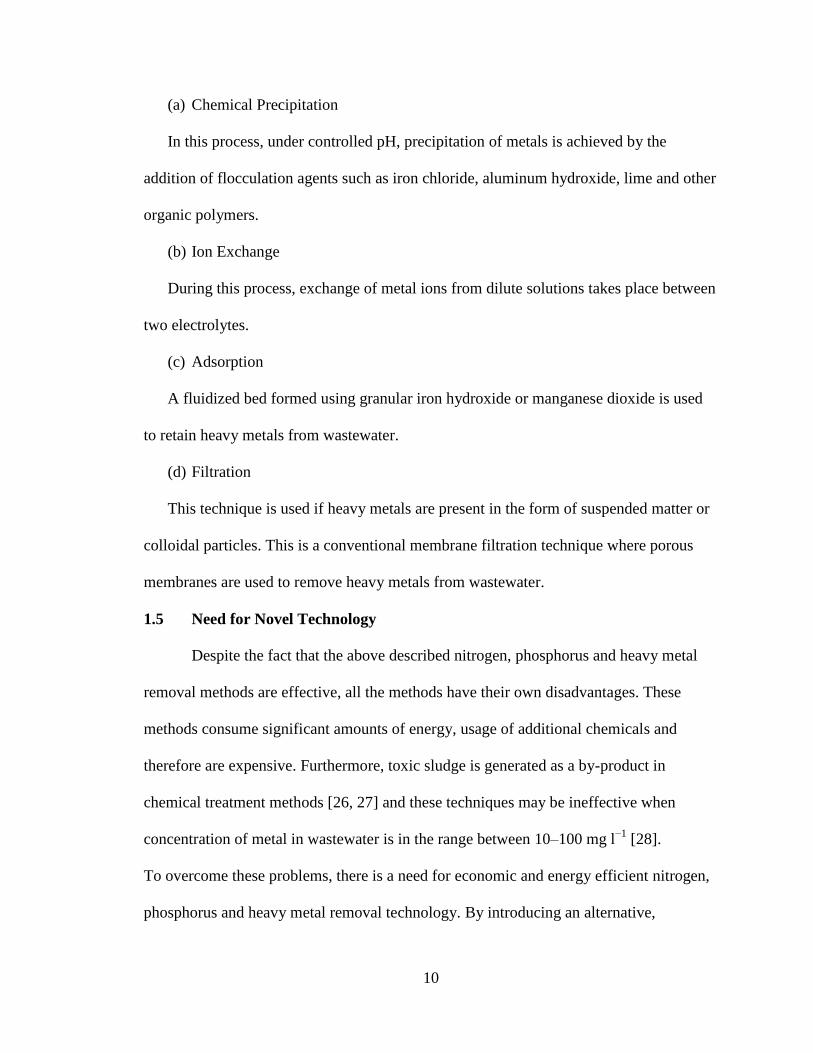
1.1 Conventional Wastewater Treatment
Most of the wastewater treatment plants employ conventional wastewater
treatment methods to reduce the contaminant concentration and to improve the quality of
wastewater effluent before it discharges to groundwater or re-enters water bodies [5].
This method is employed only for treating municipal wastewater and is not designed and
equipped for handling toxic industrial waste. Toxic waste is pretreated at the source of
generation (industries) bringing down the concentration level and is sent to wastewater
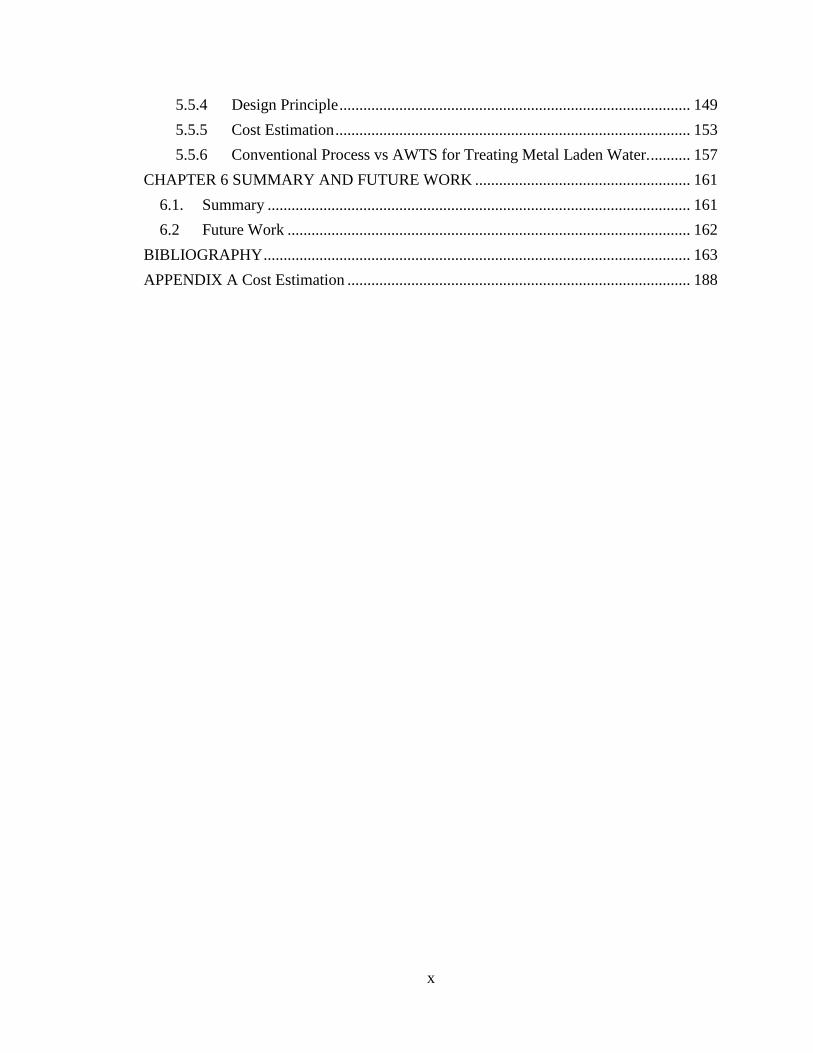
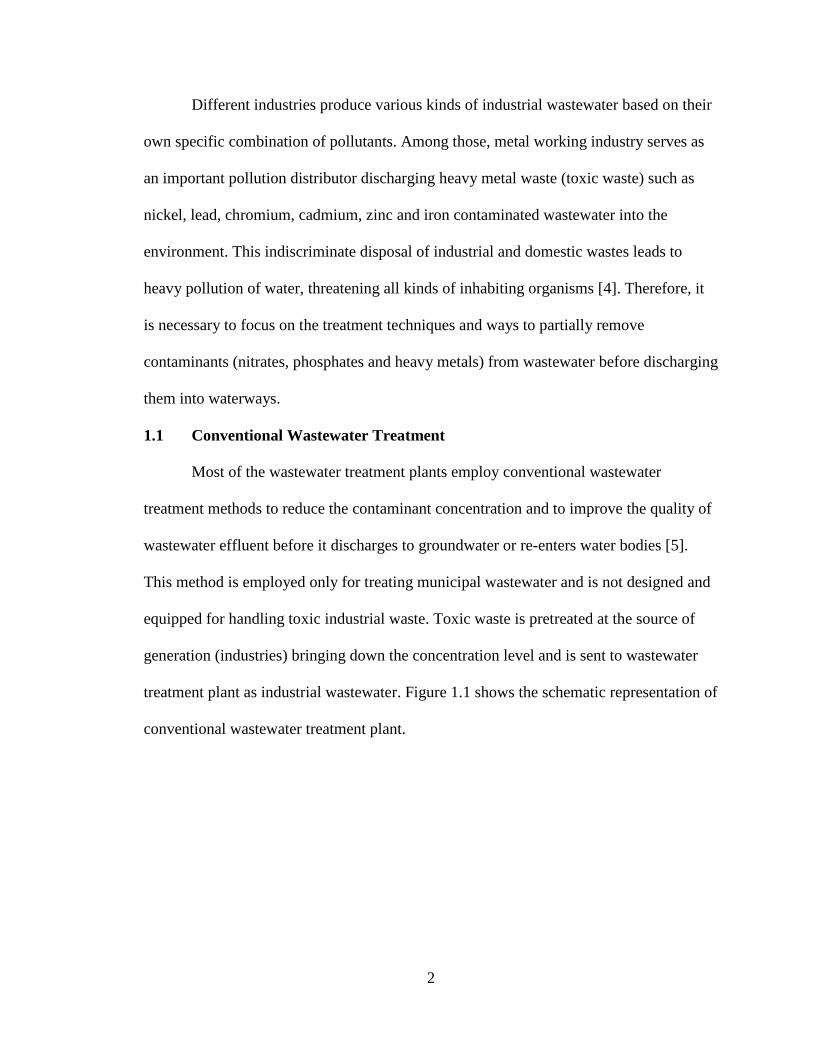
treatment plant as industrial wastewater. Figure 1.1 shows the schematic representation of
conventional wastewater treatment plant.
3
Figure 1.1 Schematic representation of conventional wastewater treatment plant [6].
In brief, municipal and industrial wastewater is initially collected and subjected to
two main treatment processes: primary and secondary treatment. During primary
treatment, pretreatment is performed which involves the usage of bar screens to remove
large solids from the wastewater. The water is then pumped to pre-aeration tanks where
grit (sand, eggshells, etc.) is removed. Next, the wastewater is fed to a primary clarifier
where suspended solids are allowed to settle (primary settlement). After the primary
clarifier, the wastewater still contains high amount of organic content and is sent to
secondary treatment. During the secondary treatment, the organic content of the
wastewater is degraded by microorganisms within the aeration tanks, and waste sludge is
allowed to settle in the secondary clarifier. Sludge that settles on the bottom of the
primary and secondary clarifiers is pumped to a digester via a sludge thickener to produce
methane and carbon dioxide [7]. However, the water leaving the secondary clarifier could
still contains significant amounts of nitrogen and phosphorus. Also in this process, there
is no special method employed during the treatment cycle to remove heavy metals from
wastewater.
Sludge thickener
Collecting
system Screening Grit
chamber Primary clarifier
Aeration
Secondary clarifier
Digestor
Nutrient removal
4
1.2 Nitrogen, Phosphorus and Heavy Metal Contamination
1.2.1 Nitrogen and Phosphorus Contamination
(a) Sources
Conventional wastewater treatment method can only reduce nitrogen and phosphorus
concentrations in wastewater to a limited extent [8]. Discharge of this partially treated
water leads to high release of nitrates and phosphates into the environment. In addition,
agricultural activities also contribute significantly for the release of nitrates and
phosphates to the groundwater in most parts of the United States. They contribute about
50% of the nitrogen and phosphorus entering surface waters. Livestock and dairy farm
operations also contribute their share to nitrate and phosphate loading of soils and
contamination of groundwater due to the mobility of nitrates and phosphates through the
soil. Storm water run-off and chemical pollution (automotive products, paint, cleaners,
and pesticides) are the other sources that release nitrogen and phosphorus into the
environment.
(b) Effect on environment and human health
Discharge of water having high amounts of nitrate and phosphates into the
environment leads to eutrophication in rivers and lakes. Eutrophication has been
recognized as major water pollution in North American lakes and reservoirs [9].
Phosphorus has been identified as a key grow-limiting nutrient for algae in lakes and
reservoirs [10]. Excess discharge of phosphorus causes eutrophication in freshwater
ecosystems [11] and results in serious issues like water discoloration and foaming,
decreased water transparency, increased algal biomass and depletion of dissolved oxygen
[12]. Coastal eutrophication is caused due to excess nitrogen discharge and can cause
5
excessive production of algal biomass, blooms of toxic algal species, increased mortality
rate in aquatic species and increase in sedimentation of organic particles [13]. Hence,
eutrophication related water quality concerns could have very significant negative
economic effects.
Excess nitrate concentration in drinking water is a possible health risk to human
health. Nitrate itself does not pose a health threat; however, nitrate reductase readily
reduces nitrate to nitrite (NO2-) which is carcinogenic and can cause
methaemoglobinaemia (blue-baby syndrome) [14].
1.2.2 Heavy Metal Contamination
(a) Sources
Industries such as leather processing, printed board manufacturing, metal finishing
and plating, welding units, textile dyes, etc. are mainly responsible for release of heavy
metals into the environment. In addition, street runoffs also contribute to the heavy metal
contamination in wastewater. Table 1.1 gives the list of industries that release heavy
metals into water bodies.
(b) Effect on environment and human health
Heavy metal contaminants mainly impact the environment in two aspects. Firstly,
they have an ability to exist in natural ecosystems for a long period, Secondly they have
the tendency to accumulate in biological chains, thereby causing chronic and acute
disorders [15]. Some of the common health risks of heavy metals are listed in Table 1.2.
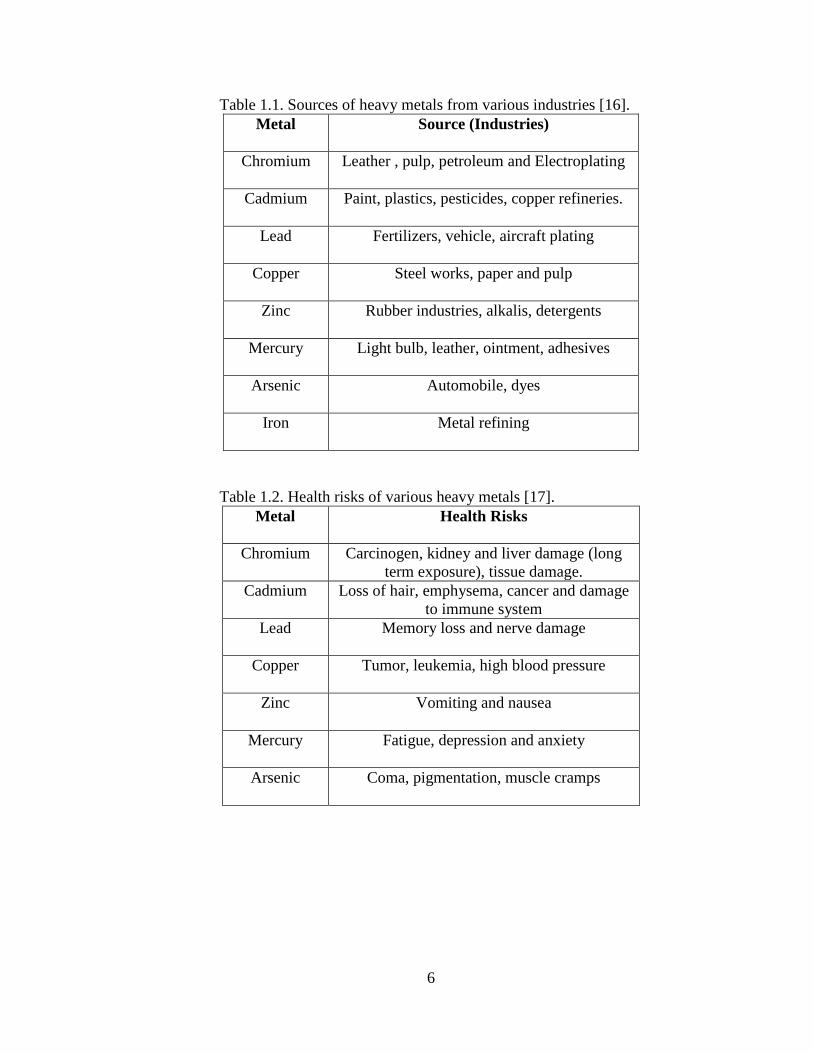
6
Table 1.1. Sources of heavy metals from various industries [16].
Metal Source (Industries)
Chromium Leather , pulp, petroleum and Electroplating
Cadmium Paint, plastics, pesticides, copper refineries.
Lead Fertilizers, vehicle, aircraft plating
Copper Steel works, paper and pulp
Zinc Rubber industries, alkalis, detergents
Mercury Light bulb, leather, ointment, adhesives
Arsenic Automobile, dyes
Iron Metal refining
Table 1.2. Health risks of various heavy metals [17].
Metal Health Risks
Chromium Carcinogen, kidney and liver damage (long
term exposure), tissue damage.
Cadmium Loss of hair, emphysema, cancer and damage
to immune system
Lead Memory loss and nerve damage
Copper Tumor, leukemia, high blood pressure
Zinc Vomiting and nausea
Mercury Fatigue, depression and anxiety
Arsenic Coma, pigmentation, muscle cramps
7
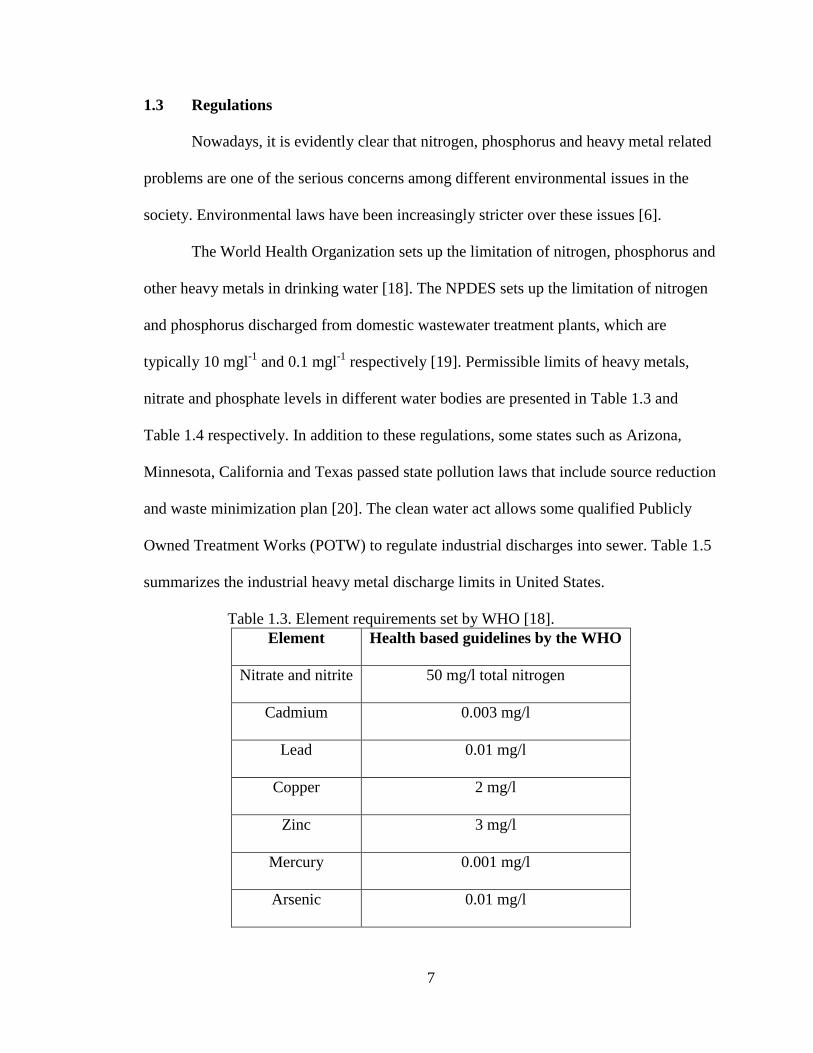
1.3 Regulations
Nowadays, it is evidently clear that nitrogen, phosphorus and heavy metal related
problems are one of the serious concerns among different environmental issues in the
society. Environmental laws have been increasingly stricter over these issues [6].
The World Health Organization sets up the limitation of nitrogen, phosphorus and
other heavy metals in drinking water [18]. The NPDES sets up the limitation of nitrogen
and phosphorus discharged from domestic wastewater treatment plants, which are
typically 10 mgl-1
and 0.1 mgl-1
respectively [19]. Permissible limits of heavy metals,
nitrate and phosphate levels in different water bodies are presented in Table 1.3 and
Table 1.4 respectively. In addition to these regulations, some states such as Arizona,
Minnesota, California and Texas passed state pollution laws that include source reduction
and waste minimization plan [20]. The clean water act allows some qualified Publicly
Owned Treatment Works (POTW) to regulate industrial discharges into sewer. Table 1.5
summarizes the industrial heavy metal discharge limits in United States.
Table 1.3. Element requirements set by WHO [18].
Element Health based guidelines by the WHO
Nitrate and nitrite 50 mg/l total nitrogen
Cadmium 0.003 mg/l
Lead 0.01 mg/l
Copper 2 mg/l
Zinc 3 mg/l
Mercury 0.001 mg/l
Arsenic 0.01 mg/l
8
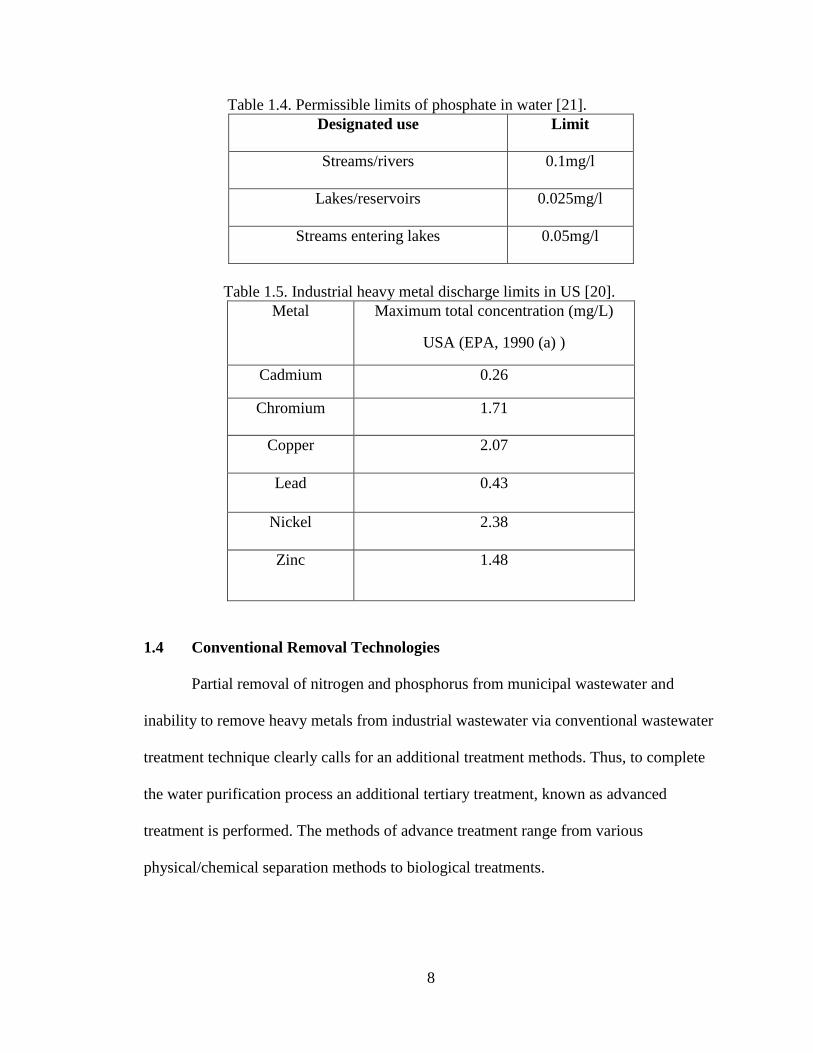
Table 1.4. Permissible limits of phosphate in water [21].
Designated use Limit
Streams/rivers 0.1mg/l
Lakes/reservoirs 0.025mg/l
Streams entering lakes 0.05mg/l
Table 1.5. Industrial heavy metal discharge limits in US [20].
Metal Maximum total concentration (mg/L)
USA (EPA, 1990 (a) )
Cadmium 0.26
Chromium 1.71
Copper 2.07
Lead 0.43
Nickel 2.38
Zinc 1.48
1.4 Conventional Removal Technologies
Partial removal of nitrogen and phosphorus from municipal wastewater and
inability to remove heavy metals from industrial wastewater via conventional wastewater
treatment technique clearly calls for an additional treatment methods. Thus, to complete
the water purification process an additional tertiary treatment, known as advanced
treatment is performed. The methods of advance treatment range from various
physical/chemical separation methods to biological treatments.
9
1.4.1 Nitrogen Removal Technology
Nitrogen removal in advanced treatment comprises two steps: nitrification
followed by denitrification. During nitrification, ammonia NH4+
is converted to nitrite
(NO2-) and this nitrite is converted to nitrate (NO3
-) by autotrophic bacteria Nitrosomonas
and Nitrobacter respectively within the aerobic zone. Then, denitrification takes place
where nitrate is reduced to gaseous nitrogen by heterotrophic bacteria such as
Flavobacterium Alcaligenes, Pseudomonas etc. Nitrifying bacteria are very sensitive and
susceptible to a variety of conditions. Organic substrates such as glucose or acetic acid
should be supplemented to heterotrophic denitrifying bacteria to support the process
(reaction).
1.4.2 Phosphorus Removal Technology
Tertiary treatment is employed as an advance treatment for removing phosphorus
from wastewater. During tertiary treatment, most of the wastewater treatment plants
around the world use chemical precipitation method to remove phosphorus from
wastewater. In this method, phosphate is retained as insoluble metal phosphate when iron
or aluminum salt is added to wastewater. Few other technologies such as crystallization,
bacteria phosphorus removal and other sludge base methods are also employed to recover
phosphorus from wastewater [22].
1.4.3 Heavy Metal Removal Technology
Several physico-chemical technologies like chemical precipitation, ion-exchange,
adsorption, filtration, phytoremediation etc. are mainly implemented for stripping toxic
heavy metals from wastewaters [23, 24, and 25]. Brief description of each method is
described below.
10
(a) Chemical Precipitation
In this process, under controlled pH, precipitation of metals is achieved by the
addition of flocculation agents such as iron chloride, aluminum hydroxide, lime and other
organic polymers.
(b) Ion Exchange
During this process, exchange of metal ions from dilute solutions takes place between
two electrolytes.
(c) Adsorption
A fluidized bed formed using granular iron hydroxide or manganese dioxide is used
to retain heavy metals from wastewater.
(d) Filtration
This technique is used if heavy metals are present in the form of suspended matter or
colloidal particles. This is a conventional membrane filtration technique where porous
membranes are used to remove heavy metals from wastewater.
1.5 Need for Novel Technology
Despite the fact that the above described nitrogen, phosphorus and heavy metal
removal methods are effective, all the methods have their own disadvantages. These
methods consume significant amounts of energy, usage of additional chemicals and
therefore are expensive. Furthermore, toxic sludge is generated as a by-product in
chemical treatment methods [26, 27] and these techniques may be ineffective when
concentration of metal in wastewater is in the range between 10–100 mg l−1
[28].
To overcome these problems, there is a need for economic and energy efficient nitrogen,
phosphorus and heavy metal removal technology. By introducing an alternative,
11
biological method (bioremediation) for the treatment of metal enriched wastewaters
containing high amounts of nitrates and phosphates, most of these issues can be mitigated
and will provide a means for cost-effective removal of contaminants in wastewater.
Bioremediation is a process in which microorganisms are employed to return water
altered by contaminants to its original condition.
1.6 Microalgae
Microalgae are phototrophic unicellular organisms found individually or in
groups that consume carbon dioxide, nitrogen and phosphorus, and release oxygen. Algae
have an affinity for polyvalent metals and are very effective in removing heavy metals,
nitrates and phosphates present in wastewater. Therefore, use of algae for bioremediation
of wastewater offers potential advantages over other techniques in use.
In recent times, algae has become of great interest since it provides several advantages
such as biofuel production, carbon dioxide mitigation, wastewater treatment, food
production and so on. Typically, algae are grown in inorganic nutrient media but the
increasing cost of inorganic fertilizers and emergence of serious problems of pollution
during the production of such fertilizers [29] has led researchers to search for an
alternative source, i.e. the use of organic materials of different origin. Animal wastes
have a long history that shows their use as a source of phosphorus, nitrogen and carbon
for microalgal growth and the production of natural food [30].
To provide an alternative method to the conventional wastewater treatment techniques,
the present study focuses on the potential of algae to treat wastewater and to remove
heavy metals ions from metal laden wastewater.
12
CHAPTER 2
LITERATURE
2.1 Wastewater Treatment with Microalgae
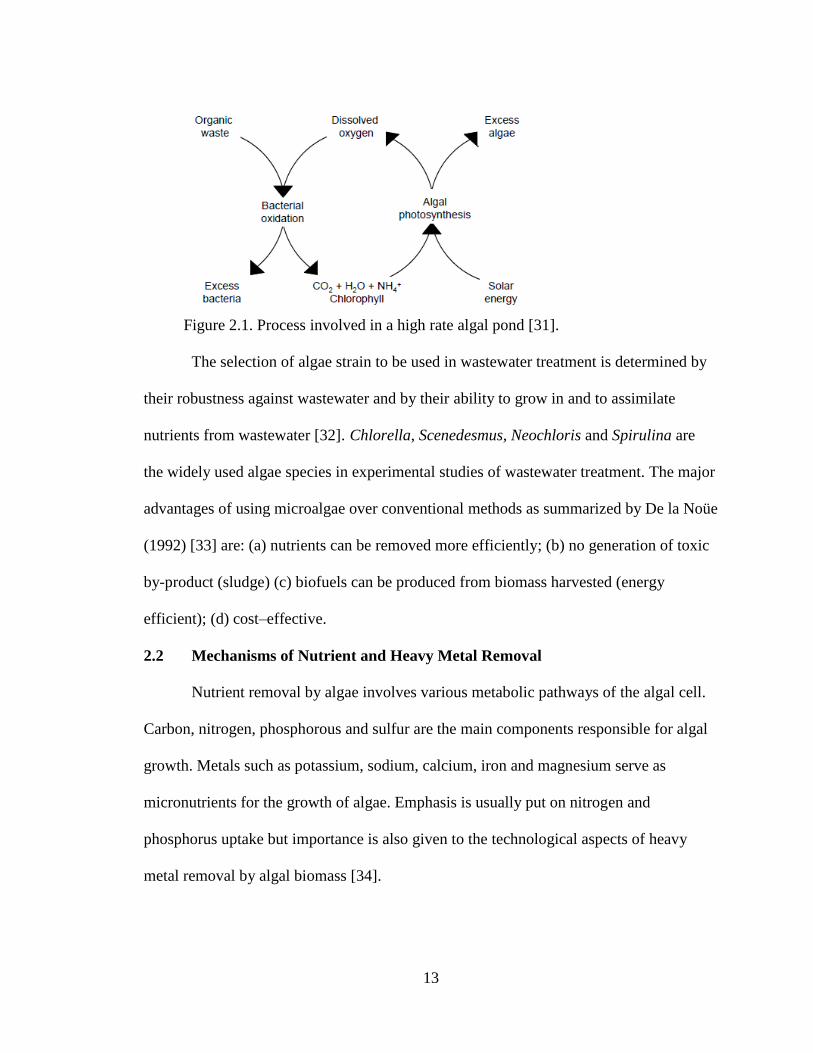
Microalgae have a great potential to solve energy and environmental challenges
around the world. Wastewater treatment with microalgae is a more environmental sound
approach to reduce nitrogen and phosphorus and to remove heavy metals from
wastewater. Microalgae can absorb significant amount of nutrients because they need
large amounts of nitrogen and phosphorus for proteins (45-60% microalgae dry weight)
and metals as micronutrients for their growth. William Oswald (1957) first developed the
idea of treating wastewater in using microalgae and performed photosynthesis in sewage
treatment [31]. Figure 2.1 briefly depicts the process involved in high rate algal pond in
which algae plays a dual role by assimilating nutrients from wastewater and supplying
oxygen to bacteria. The bacteria take up the oxygen and degrade organic material in the
wastewater, the same process which is used in activated sludge treatment [31].
13
Figure 2.1. Process involved in a high rate algal pond [31].
The selection of algae strain to be used in wastewater treatment is determined by
their robustness against wastewater and by their ability to grow in and to assimilate
nutrients from wastewater [32]. Chlorella, Scenedesmus, Neochloris and Spirulina are
the widely used algae species in experimental studies of wastewater treatment. The major
advantages of using microalgae over conventional methods as summarized by De la Noüe
(1992) [33] are: (a) nutrients can be removed more efficiently; (b) no generation of toxic
by-product (sludge) (c) biofuels can be produced from biomass harvested (energy
efficient); (d) cost–effective.
2.2 Mechanisms of Nutrient and Heavy Metal Removal
Nutrient removal by algae involves various metabolic pathways of the algal cell.
Carbon, nitrogen, phosphorous and sulfur are the main components responsible for algal
growth. Metals such as potassium, sodium, calcium, iron and magnesium serve as
micronutrients for the growth of algae. Emphasis is usually put on nitrogen and
phosphorus uptake but importance is also given to the technological aspects of heavy
metal removal by algal biomass [34].
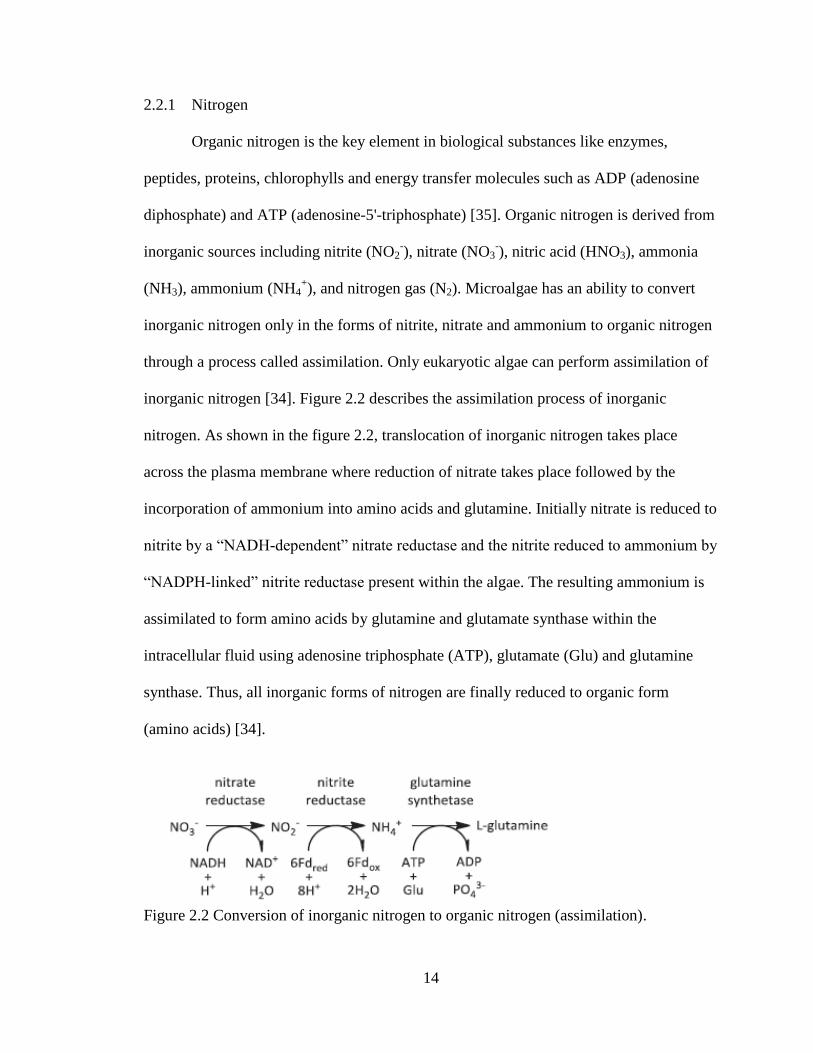
14
2.2.1 Nitrogen
Organic nitrogen is the key element in biological substances like enzymes,
peptides, proteins, chlorophylls and energy transfer molecules such as ADP (adenosine
diphosphate) and ATP (adenosine-5'-triphosphate) [35]. Organic nitrogen is derived from
inorganic sources including nitrite (NO2-), nitrate (NO3
-), nitric acid (HNO3), ammonia
(NH3), ammonium (NH4+), and nitrogen gas (N2). Microalgae has an ability to convert
inorganic nitrogen only in the forms of nitrite, nitrate and ammonium to organic nitrogen
through a process called assimilation. Only eukaryotic algae can perform assimilation of
inorganic nitrogen [34]. Figure 2.2 describes the assimilation process of inorganic
nitrogen. As shown in the figure 2.2, translocation of inorganic nitrogen takes place
across the plasma membrane where reduction of nitrate takes place followed by the
incorporation of ammonium into amino acids and glutamine. Initially nitrate is reduced to
nitrite by a “NADH-dependent” nitrate reductase and the nitrite reduced to ammonium by
“NADPH-linked” nitrite reductase present within the algae. The resulting ammonium is
assimilated to form amino acids by glutamine and glutamate synthase within the
intracellular fluid using adenosine triphosphate (ATP), glutamate (Glu) and glutamine
synthase. Thus, all inorganic forms of nitrogen are finally reduced to organic form
(amino acids) [34].
Figure 2.2 Conversion of inorganic nitrogen to organic nitrogen (assimilation).
15
2.2.2 Phosphorus
Phosphorus is found in lipids, proteins and nucleic acids. It plays a crucial role in
cell growth and metabolism of algae. During algae metabolism, phosphorus mainly in the
forms of H2PO4- and HPO4
2- is incorporated into organic compounds through a process
called phosphorylation. Phosphorylation is an active process and it requires energy. This
energy comes from the oxidation of respiratory substrates, the electron transport system
of the mitochondria, or from light. Generation of ATP from ADP takes place during
phosphorylation and microalgae is able to assimilate and store phosphorus in excess
within the cell in the form of volutin granules. These reserves will be available during the
growth cycle in the absence of phosphorus in the media. The growth rate of algae may
therefore not respond at once to changes in the external concentration of phosphorus, as
opposed to the immediate responses to temperature and light [36].
2.2.3 Heavy Metals
Microalgae also require metals for their biological functions. Selected microalgae
are cultivated for bio removal of certain metals. They have a potential to accumulate high
concentrations of metals from the contaminated aquatic systems. Metal accumulation in
algae involves two processes: an initial rapid (passive) uptake followed by a much slower
(active) uptake [37]. During the passive uptake, physical adsorption takes place in which
the metal ions are adsorbed over the cell surface very quickly just in a few seconds or
minutes and this process is metabolism-independent. Then chemisorption, a process
which is metabolism-dependent takes place in which the ions are transported slowly
across the cell membrane into the cytoplasm.
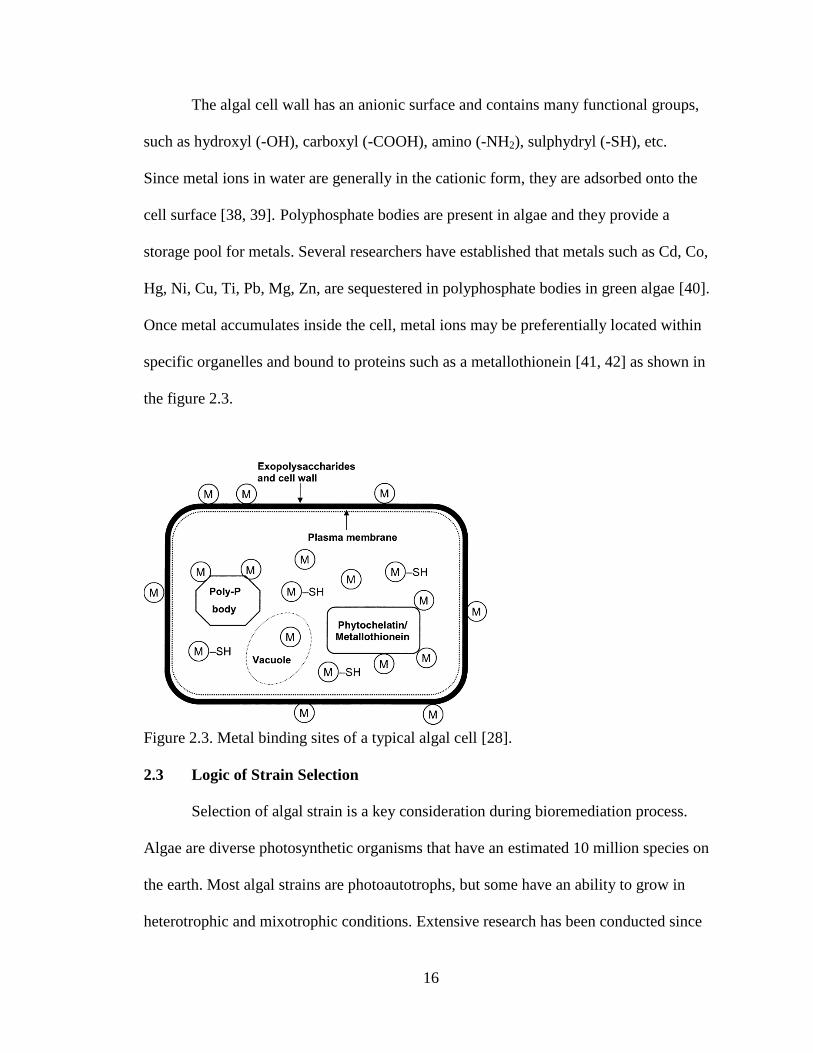
16
The algal cell wall has an anionic surface and contains many functional groups,
such as hydroxyl (-OH), carboxyl (-COOH), amino (-NH2), sulphydryl (-SH), etc.
Since metal ions in water are generally in the cationic form, they are adsorbed onto the
cell surface [38, 39]. Polyphosphate bodies are present in algae and they provide a
storage pool for metals. Several researchers have established that metals such as Cd, Co,
Hg, Ni, Cu, Ti, Pb, Mg, Zn, are sequestered in polyphosphate bodies in green algae [40].
Once metal accumulates inside the cell, metal ions may be preferentially located within
specific organelles and bound to proteins such as a metallothionein [41, 42] as shown in
the figure 2.3.
Figure 2.3. Metal binding sites of a typical algal cell [28].
2.3 Logic of Strain Selection
Selection of algal strain is a key consideration during bioremediation process.
Algae are diverse photosynthetic organisms that have an estimated 10 million species on
the earth. Most algal strains are photoautotrophs, but some have an ability to grow in
heterotrophic and mixotrophic conditions. Extensive research has been conducted since
17
the 1980’s to identify the algal strain suitable for wastewater treatment [43].
Complimenting this, current research work is focused on some of the species which have
been found to grow well in wastewater. In addition, the chosen algae should accumulate
Cd and Cr to a high concentration without suffering toxic symptoms. Chlorella vulgaris,
Scenedesmus dimorphous, Neochloris oleoabundans, Nannochloroposis, Spirulina,
Botrycoccus braunii, Dunaliella salina etc. are commonly used species for treating
wastewater and removing heavy metals [44, 45, and 46].
Among these species, Chlorella vulgaris was selected for the present study as it is
very robust compared to other species and can perform well in wastewater and have an
ability to remove heavy metals. It can also tolerate a wide range of nutrient
concentrations, temperature, and pH, making it versatile for wastewater remediation. In
addition, chlorella can grow in all three growth conditions (autotrophic, heterotrophic and
mixotrophic) and contains high lipid content (28.82 %) [47] which can be further
processed for biofuel production.
2.4 Growth Conditions of Chlorella Vulgaris
Chlorella vulgaris can be grown in autotrophic [48], heterotrophic [49] and
mixotrophic [50] conditions. During autotrophic growth, algae (Chlorella) utilizes energy
from sun or external source, nutrients (nitrogen and phosphorus) from wastewater and
carbon dioxide to increase its algal density. The major advantage of autotrophic growth
condition is that it can reduce carbon dioxide to make useful organic compounds.
However, the limitation is that light penetration is inversely proportional to the algal
density. As the density of algae increases, the light exposure to algae cell decreases
resulting in limitation of nutrient removal from wastewater.
18
During heterotrophic growth, no light is required and organic carbon source such
as glucose or glycerol acts as source of carbon. Algae uses this organic carbon for
growth.High algal densities can be obtained in heterotrophic growth as the growth is not
limited by the light. Mixotrophic growth is a combination of heterotrophic and
autotrophic growth, where carbon dioxide and organic carbon are simultaneously
assimilated and both respiratory and photosynthetic metabolism operates concurrently
[51, 52].
2.5 Growth Controlling Factors of Microalgae
Carbon, nitrogen and phosphorus are the three main factors that influence the
growth of any microalgae [53, 54]. Further, they also depend on complex interactions
among physical factors such as light intensity [55, 56], pH [57] and temperature [58].
2.5.1 Carbon
The average stoichiometric formula of algae is C106H181O45N16P [59]. More than
fifty percent of algae composition constitutes to carbon content. During photosynthesis,
microalgae assimilate inorganic carbon (CO2) and convert it to starch and oils.
Atmospheric carbon dioxide may be provided to algal cultures by means of aeration [60].
However, the concentration of CO2 in air is very low (0.033 %) and is not enough for
optimum algal growth. Therefore, supply of extra carbon dioxide up to 1 to 5 % CO2
(feasibility of obtaining from digestor gas) along with air [61] will increase the algal
density. Beside this, algae can also use organic carbon sources such as glucose, glycerol
or acetate during heterotrophic growth [61, 62, and 63]. Carbon is the key nutrient for
getting algae to pump out more oil.
19
2.5.2 Nitrogen and Phosphorus
Nitrogen is the second most important nutrient to microalgae and exists in many
forms such as NH4+, NO3
- and NO2
- etc. Algae prefer ammonium and when this is
available, no other form of nitrogen sources will be assimilated [64]. Urea can also be
used as a nitrogen source. Phosphorus is another macronutrient and algae take up
inorganic orthophosphate (PO43-
) for its growth. The mechanism of nitrate uptake and
phosphate uptake of algae was mentioned in the section 2.2.1 and 2.2.2 respectively.
Literature suggests that typically below the N: P of 30, algae growth was determined
solely by N limitation and above 30, by P limitation [65].
2.5.3 Light Intensity
Microalgae are phototrophs and they utilize energy from light. However, some
microalgae can grow in the dark using organic compounds as energy. Light intensity
affects directly the photosynthesis and growth rate of microalgae. During photosynthesis,
microalgae need light for a photochemical phase to produce ATP and NADPH [66].
Insufficient light may lead to photo oxidation resulting in growth limitation and too much
light may also cause photo inhibition lowering the photosynthetic effectivity [55, 56].
Many researchers have studied the effect of light on algae growth and concluded that
light is the most often limiting factor of algal growth. In dense cultures, algae themselves
decrease the light availability due to self-shading. When algae is cultivated in wastewater,
presence of high amounts of particulate matter further aggravates the shading effect. To
avoid this problem, proper mixing is essential as it exposes algae cells to light uniformly.
20
2.5.4 Temperature
Increase in temperature increases the algal growth until an optimum temperature
is reached [60, 62, and 67]. Increase beyond optimum temperature leads to a rapid
decline in growth rate. The optimum temperature range 15–25 ºC is favorable for most
algal species, even those which are adapted to growth at colder temperatures. At low
temperatures, microalgae easily get photo inhibited by high light intensities. Algae
sensitivity to light at low temperatures may pose an operational constraint to outdoor
wastewater treatment in cold climate. At optimum growth temperatures, microalgae can
better tolerate high light intensities before getting inhibited [64].
2.5.5 pH
Growth of algae species may also be affected by pH. Different species have
different optimum pH levels. pH usually increases due to carbon dioxide assimilation and
sometimes it reaches to 10 when no CO2 is supplied [62, 67]. It can reach 11 or more if
bicarbonate is used as a carbon source [61]. Nitrate and phosphate absorption by algae
affects the pH. Nitrate ion assimilation will raise the pH and ammonium ion assimilation
will decrease the pH as low as 3 [61, 68]. High pH may lead to phosphate precipitation in
the medium forming calcium phosphates [62, 67] and also result in algae flocculation,
thereby reducing nutrient uptake and growth.
2.6 Metal Chemistry
The toxicity of a particular metal is mainly governed by its electron distribution
and local pH [69].
21
2.6.1 Electron Distribution
Metals can be classified based on their co-ordination chemistry, a property which
is influenced by electron environment of the element. Metal ions are divided into three
categories.
1. Hard Cations- Biologically essential eg. K+, Na
+, Mg
2+ and Ca
2+.
2. Soft Cations- Non-essential and very toxic eg. Cd2+
, Cr 3+
, Cu2+
, Pb2+
and Hg2+
.
3. Borderline ions – Biologically essential and toxic eg. Fe3+
, Fe2+
, and Mn2+
The individual element characteristics are influenced by ionic potential and the
number of electrons.
(i) Ionic potential: It is defined as charge to radius ratio and metals with high
charge density metals (Cr and Cd) form a ligand whereas low charge density
metals such as alkali metals do not bind well.
(ii) Number of electrons: Soft cations eg. Cr (4s1 3d
5) Cd (4d
10) ions with
multiple electron shells are more easily polarized and form stable complexes
with biochemically active bases such as thiol groups. Hard cations are not
easily polarized, and are readily displaced from their binding site by
competing soft cations.
So when algae comes in contact with wastewater containing these metal ions, alkali
metal ions will be taken by algae for performing biological functions and toxic metal ions
form complex with anionic surface of algae. This way any toxic metals present in the
wastewater can be removed [69].
22
2.6.2 Effect of pH
The pH of the environment regulates the metal uptake and the amount of metal
bound to the surface. When pH drops, cell membrane proton responds to maintain an
internal negative charge leading to depolarization of membrane and a change in the metal
affinity of the cell surface [70].
2.7 Nutrients and Heavy Metal (Cd, Cr) Removal (current knowledge)
2.7.1 Nutrients (nitrogen and phosphorus)
To use microalgae for wastewater treatment is an old idea, and it was first by
proposed by Oswald and Gotaas in 1957 [31]. Since then several researchers have
developed techniques for exploiting the algae’s nutrient removal capacity and its growth
rate in wastewater. Numerous laboratory and pilot scale studies of wastewater treatment
with algae have been conducted [6, 71, and 72].
Algae wastewater treatment systems have traditionally been employed as tertiary
treatment systems [59, 73, and 74] and some researchers proposed them as potential
secondary treatment systems [75]. Many studies have demonstrated successful
wastewater treatment with microalgae [76, 77]. In most cases, species of the family of
Chlorella, such as Chlorella vulgaris and Chlorella pyrenoidosa [78, 79, 80, 81, and 82]
have been employed for wastewater treatment. The most widely studied microalgae
species for nutrient removal are Chlorella [83, 84], Scenedesmus [6], Spirulina [85],
Nannochloris sp. [86], Botryococcus brauinii [87] etc. Few species of Scenedesmus and
Chlorella completely remove ammonia, nitrate and total P from secondary treated
wastewater [88, 89, and 90]. Most of algae based wastewater treatment experiments were
performed at lab scale under batch culture conditions with the microalgae showing high
23
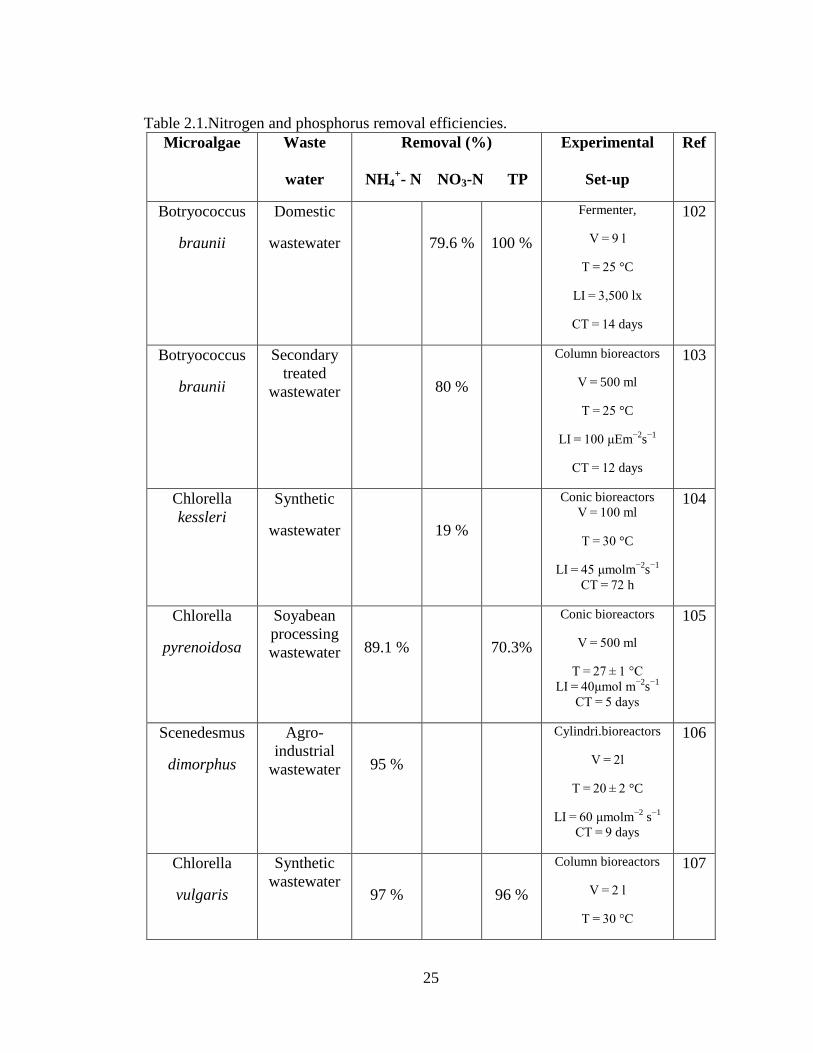
growth rates over the batch growth period. Table 2.1 shows the nitrogen and phosphorus
removal efficiencies from wastewater from several sources by microalgae [91].
Wang et.al used green algae Chlorella sp. culture to remove nutrients from the waste
water samples collected from four different locations, i.e. before primary treatment (#1),
after primary treatment (#2), after activated sludge treatment (#3) and centrate (#4) which
is the wastewater generated from sludge centrifuge. From this study, it was concluded
that Chlorella sp. successfully grew in all the samples and 82.4%, 74.7%, and 78.3% of
nitrate was removed from the samples 1, 2 and 4 respectively. Also, 90% of phosphorus
was removed from samples 1, 2 and 4 and N/P ratio dropped from 52.3 to 20.8 making
the algae culture P-limited species to N-limited species. However, only 4.7% of
phosphorus and 62.5% nitrate were removed from sample #3. The low removal of N,P
from sample #3 was probably due to the excretion of small photosynthetic organic
molecules by algae. [92].
Arbib et al. [93] studied the algal growth rate and nutrient removal rate of the
species Chlorella stigmatophor and Scenedesmus obliquus in urban wastewater at
different nitrogen and phosphorus ratios, ranging from 1:1 to 35:1. It was reported in this
study that nitrogen to phosphorus ratios ranging between 9 and 13 achieved best biomass
productivity. Renuka et al. [94] used Calthrix sp to remove nitrates and phosphates from
sewage wastewater .They found that 44–91% PO4–P and 57–58% NO3-N can be
removed and a highest dry cell weight of 0.97 mg/L can be attained in sewage wastewater
using this species. Kim et al. treated swine wastewater with Chlorella vulgaris and
reported 96 and 95.3% removal of phosphorus and nitrogen, respectively [95]. Travieso
et al. reported removal of 90.2, 84.1 and 85.5% organic nitrogen, ammonia, and total
24
phosphorus, respectively from distillery wastewater with an anaerobic fixed-bed reactor
in a microalgae pond [96].
Mohamed et. al [97] reported that Scenedesmus sp. is very common species that
is available in fresh water bodies and plays a significant role in purifying eutrophic
waters. Colak and Kaya (1988) reported removal of nitrogen (50.2%) and phosphorus
(85.7%) in industrial wastewater treatment and elimination of phosphorus (97.8%) in
domestic wastewater treated by algae. [98]. Min-kyu et.al used Scenedesmus obiliquus to
remove nitrogen and phosphorus from piggery wastewater. The authors reported 23 to
58% removal of TN and 48 to 69% removal of TP [99].
Bhatnagar et. al identified a species Chlorella minutissima in wastewater
treatment oxidation ponds in India [100]. On characterizing the species, it was found that
it was a eukaryotic species which belongs to Chlorellaceae family. They cultivated
Chlorella minutissima in high concentrations of raw sewage (municipal wastewater) and
standard BG 11 medium. The results showed that growth of Chlorella minutissima in
municipal wastewater is 146% more than the growth in standard BG 11 medium [100].
Further it was found that this species can grow well under heterotrophic and mixotrophic
conditions over a wide pH range (4-10).
Few studies have been done to investigate the influence of culture conditions on
nutrient removal efficiency and growth rate of algae. Lodi et al. (2003) studied the effect
of temperature on nutrient uptake of Spirulina platensis. He conducted experiments over
a wide range of temperatures (23-40°C) and observed the highest removal rate occurred
at 30 °C; however, the removal efficiencies were not satisfactory [101].
25
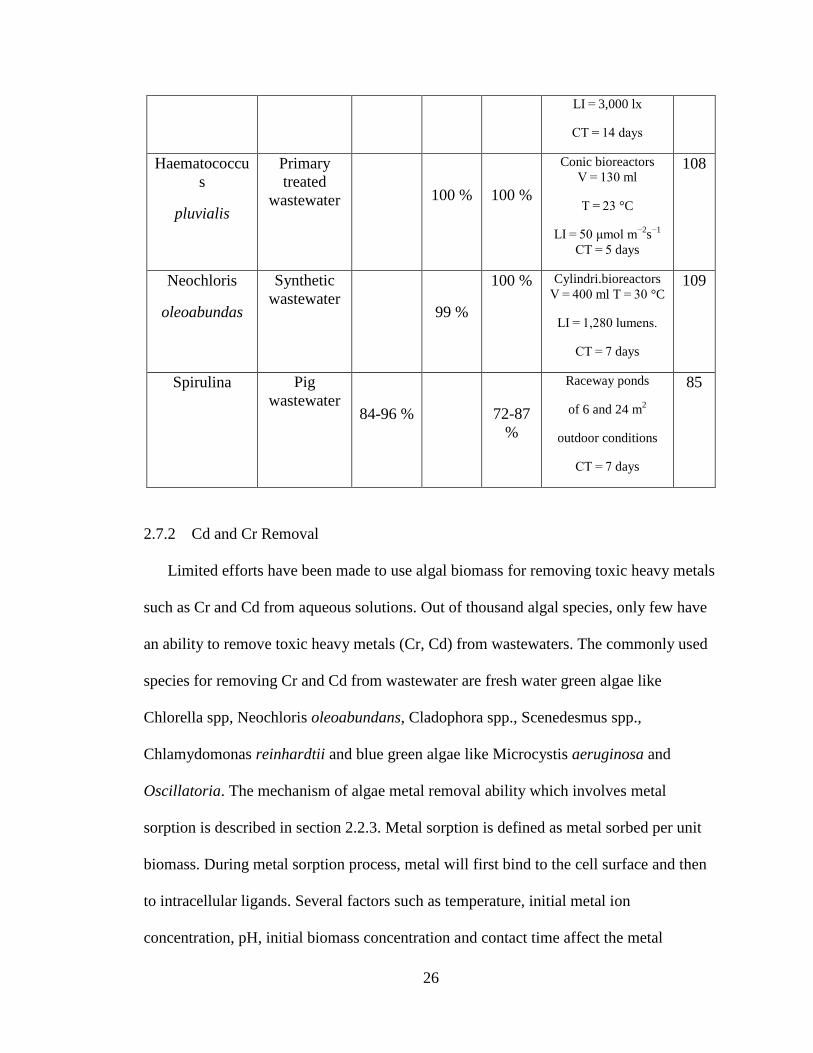
Table 2.1.Nitrogen and phosphorus removal efficiencies.
Microalgae Waste
water
Removal (%)
NH4+- N NO3-N TP
Experimental
Set-up
Ref
Botryococcus
braunii
Domestic
wastewater
79.6 %
100 %
Fermenter,
V = 9 l
T = 25 °C
LI = 3,500 lx
CT = 14 days
102
Botryococcus
braunii
Secondary
treated
wastewater
80 %
Column bioreactors
V = 500 ml
T = 25 °C
LI = 100 μEm−2
s−1
CT = 12 days
103
Chlorella
kessleri
Synthetic
wastewater
19 %
Conic bioreactors
V = 100 ml
T = 30 °C
LI = 45 μmolm−2
s−1
CT = 72 h
104
Chlorella
pyrenoidosa
Soyabean
processing
wastewater
89.1 %
70.3%
Conic bioreactors
V = 500 ml
T = 27 ± 1 °C
LI = 40μmol m−2
s−1
CT = 5 days
105
Scenedesmus
dimorphus
Agro-
industrial
wastewater
95 %
Cylindri.bioreactors
V = 2l
T = 20 ± 2 °C
LI = 60 μmolm−2
s−1
CT = 9 days
106
Chlorella
vulgaris
Synthetic
wastewater
97 %
96 %
Column bioreactors
V = 2 l
T = 30 °C
107
26
LI = 3,000 lx
CT = 14 days
Haematococcu
s
pluvialis
Primary
treated
wastewater
100 %
100 %
Conic bioreactors
V = 130 ml
T = 23 °C
LI = 50 μmol m−2
s−1
CT = 5 days
108
Neochloris
oleoabundas
Synthetic
wastewater
99 %
100 % Cylindri.bioreactors
V = 400 ml T = 30 °C
LI = 1,280 lumens.
CT = 7 days
109
Spirulina Pig
wastewater
84-96 %
72-87
%
Raceway ponds
of 6 and 24 m2
outdoor conditions
CT = 7 days
85
2.7.2 Cd and Cr Removal
Limited efforts have been made to use algal biomass for removing toxic heavy metals
such as Cr and Cd from aqueous solutions. Out of thousand algal species, only few have
an ability to remove toxic heavy metals (Cr, Cd) from wastewaters. The commonly used
species for removing Cr and Cd from wastewater are fresh water green algae like
Chlorella spp, Neochloris oleoabundans, Cladophora spp., Scenedesmus spp.,
Chlamydomonas reinhardtii and blue green algae like Microcystis aeruginosa and
Oscillatoria. The mechanism of algae metal removal ability which involves metal
sorption is described in section 2.2.3. Metal sorption is defined as metal sorbed per unit
biomass. During metal sorption process, metal will first bind to the cell surface and then
to intracellular ligands. Several factors such as temperature, initial metal ion
concentration, pH, initial biomass concentration and contact time affect the metal
27
sorption ability of algae. Several researchers have performed various experiments to
study the effect of these parameters on the algae ability to remove Cr and Cd from
wastewater.
(a) Initial metal ion concentration
Sorption and heavy metal removal ability of algae largely depend on the initial
concentration of metals in the solution. An increase in metal concentration in the solution
increases metal sorption (metal sorbed per unit biomass) increases and becomes saturated
after a certain concentration of metal in the solution [110, 111, 112]. In contrast to the
metal sorption, the metal removal capacity decreases with the increase in metal
concentration in the solution [24, 112].
(b) Biomass concentration
Biomass concentration affects the amount of heavy metal ion removed from a
solution. Roy et. al showed that increase in biomass concentration of Chlorella
minutissima decrease Cd binding per unit cell mass. Their results showed that a decrease
of 91% in Cd binding per unit cell of C. minutissima for a 12 fold increase in biomass
concentration [113]. Mehta et. al tested the effect of biomass concentration on metals by
C. vulgaris at different metal concentrations. They found that metal sorption was
maximal at the lowest tested biomass concentration [112]. Hamdy has performed
experiments with four different algae species to remove metals such as Cr, Co, Ni, Cu
and Cd from wastewater. He found that an increase in biomass concentration decreased
the metal sorption capacity of all four species [114]. Similarly, Gong et al. (2005) also
found that metal sorption capacity of Spirulina maxima decreased with increase in
biomass concentration [115].
28
A Few researchers explained that inverse proportional relationship between biomass
concentration and sorption may be due to limited availability of metal, increased
electrostatic interactions, interference between binding sites and reduced mixing at higher
biomass concentrations [116, 117]. However, there is no straightforward relationship
between and metal removal and biomass concentration.
(c) Temperature
Literature review reported contrasting results regarding the effect of temperature on
heavy metal sorption of algae. Few researchers reported an increase in algae metal
sorption with increase in temperature [118, 119]. The increase in temperature causes
bond rupture and this increases the number of active sites involved in metal sorption.
Aksu performed experiments with Chlorella vulgaris and found that with an increase in
temperature from 15 oC to 45
oC there is an increase in metal sorption from 48.1 mg/g to
60.2 mg/g which suggests that algae metal biosorption is an endothermic process [120].
On the contrary, some studies indicate the exothermic nature of metal sorption by algae.
For instance, Cruz et al. reported that an increase in ambient temperature decreased the
Cd2+
sorption by Sargassum sp. biomass. Few other studies also reported the same
conclusion [121, 122].
Interestingly, there are reports stating that temperature has no impact on metal
sorption of algae [123, 124]. Cossich et. al conducted experiments to study the
temperature effect on Cr sorption by Sargassum sp. at different pH. They reported that
the effect of temperature was not as significant as that of pH [125]. Likewise, Norris et.al
and Gadd et. al have shown that heavy metal sorption of algae is relatively unaffected
over a moderate range of temperature [123, 126].
29
(d) pH
As reported in the literature, sorption of metal ions is mainly affected by pH of the
media or the wastewater. Most of the algae species have optimum pH and various studies
have been conducted to find the optimum pH value for maximal removal of heavy
metals. Cossich et. al reported that maximum Cr (III) sorption on Sargassum sp. can be
achieved at pH 4 [125].Sheng et. al found that the optimum pH for Cr ((VI) and Cd
sorption by Padina sp. and Sargassum sp was at pH 2 [127]. Zhou et. al showed that the
sorption of Cd on Sargassum kjellmanianum was optimum at pH between 4 and 5 [45].
In general, pH range of 3 to 5 (acidic) is best optimum pH for the sorption of
metal ions. This is because most of the metal binding groups of algae are acidic. At acidic
pH, these groups cause electrostatic interactions between cationic species and generate a
negative charge at the cell surface on which all metals ions are adsorbed. At Low pH (<
2), high concentration of H+ ions are present and they will prevent metals from binding to
ligands on the cell surface [70, 128, 129, 130]. Some studies proved this phenomenon and
reported that algae possess low metal sorption ability at extremely acidic conditions (pH
< 2) [39, 112, and 131]. Table 2.2 shows optimum pH values for sorption of Cr and Cd
by algae.
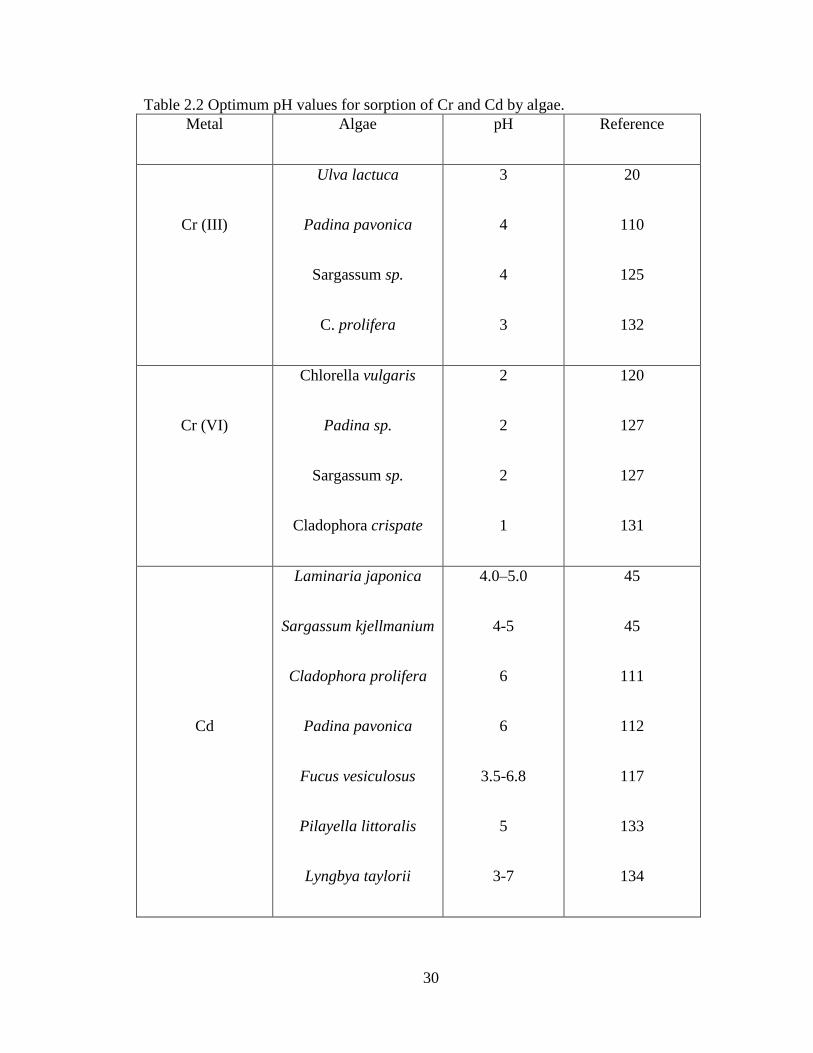
30
Table 2.2 Optimum pH values for sorption of Cr and Cd by algae.
Metal Algae pH Reference
Cr (III)
Ulva lactuca
Padina pavonica
Sargassum sp.
C. prolifera
3
4
4
3
20
110
125
132
Cr (VI)
Chlorella vulgaris
Padina sp.
Sargassum sp.
Cladophora crispate
2
2
2
1
120
127
127
131
Cd
Laminaria japonica
Sargassum kjellmanium
Cladophora prolifera
Padina pavonica
Fucus vesiculosus
Pilayella littoralis
Lyngbya taylorii
4.0–5.0
4-5
6
6
3.5-6.8
5
3-7
45
45
111
112
117
133
134
31
(e) Contact time
As mentioned in the literature, the metal sorption is very fast, and typically complete
in less than one hour. Sorption is usually achieved in 5-10 minutes for metabolism
independent uptake by algae [132]. Binding of metal ions to cell walls is considered to be
a spontaneous chemical reaction, with an equilibrium time depending only on the mass
transfer resistance [20].
32
CHAPTER 3
RESEARCH OBJECTIVES
Traditional wastewater and metal removal treatments are prohibitively expensive.
This has necessitated research into developing other alternative and cost-effective
methods. The primary objective of this study was focused on evaluating and
demonstrating potential of microalgae for bioremediation of wastewater laden with
nitrogen (N) in the form of nitrates, phosphorous (P) in the form of phosphates,
chromium (Cr(VI)) and cadmium (Cd(II)). The secondary objective was to design a
commercial system based on the experimental results that can be easily customized and is
suitable for integration into existing wastewater treatment facilities.
3.1 Specific Objectives
To determine the rate of nitrate and phosphorus removal by different algal species
and select the alga that is optimal in removing nitrates and phosphorus from
simulated and actual waste water (Dayton Water Reclamation Plant).
To evaluate the growth of selected strain and to study the effect of initial nitrate
concentration on phosphorus removal by selected strain and vice versa.
To determine the bio kinetic coefficients of nitrate and phosphate removal.
Determine the requirements of incorporating an algal treatment system within a
conventional wastewater treatment plant.
33
Investigate the capability of microalgae to remove heavy metals from wastewater
and determine the removal mechanism.
Study the effect of various parameters such as temperature, pH, light intensity,
initial biomass concentration, and metal concentration on algae metal removal
capacity.
Investigate and compare the biomass productivities of selected algae grown under
phototrophic, heterotrophic and mixotrophic conditions.
Investigate the capability of heterotrophically and mixotrophically grown algae to
remove heavy metals from wastewater.
Propose and design a commercial algae based wastewater treatment technology
(AWTS) which mainly focuses on providing a technology that is cost effective,
requires low maintenance, and has minimal operator requirements for treating
industrial wastewater containing high amounts of nitrates, phosphates and heavy
metals.
Perform life cycle cost analysis for AWTS and compare the wastewater treatment
cost with conventional process.
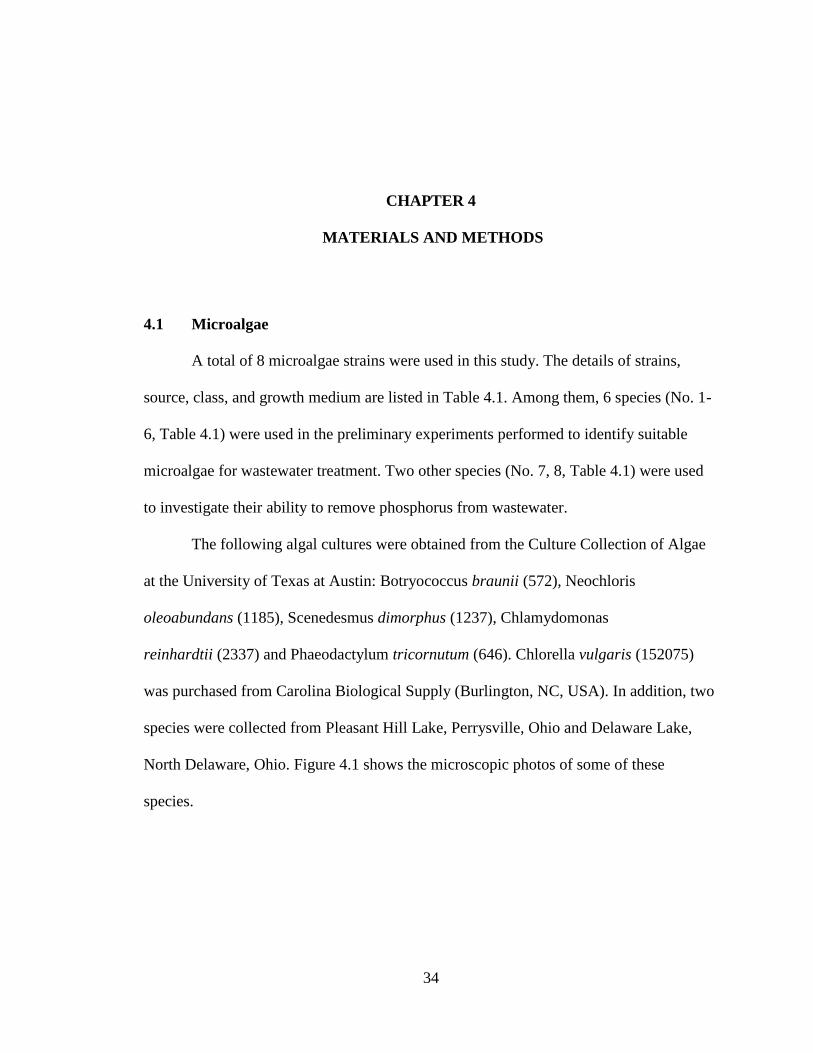
34
CHAPTER 4
MATERIALS AND METHODS
4.1 Microalgae
A total of 8 microalgae strains were used in this study. The details of strains,
source, class, and growth medium are listed in Table 4.1. Among them, 6 species (No. 1-
6, Table 4.1) were used in the preliminary experiments performed to identify suitable
microalgae for wastewater treatment. Two other species (No. 7, 8, Table 4.1) were used
to investigate their ability to remove phosphorus from wastewater.
The following algal cultures were obtained from the Culture Collection of Algae
at the University of Texas at Austin: Botryococcus braunii (572), Neochloris
oleoabundans (1185), Scenedesmus dimorphus (1237), Chlamydomonas
reinhardtii (2337) and Phaeodactylum tricornutum (646). Chlorella vulgaris (152075)
was purchased from Carolina Biological Supply (Burlington, NC, USA). In addition, two
species were collected from Pleasant Hill Lake, Perrysville, Ohio and Delaware Lake,
North Delaware, Ohio. Figure 4.1 shows the microscopic photos of some of these
species.
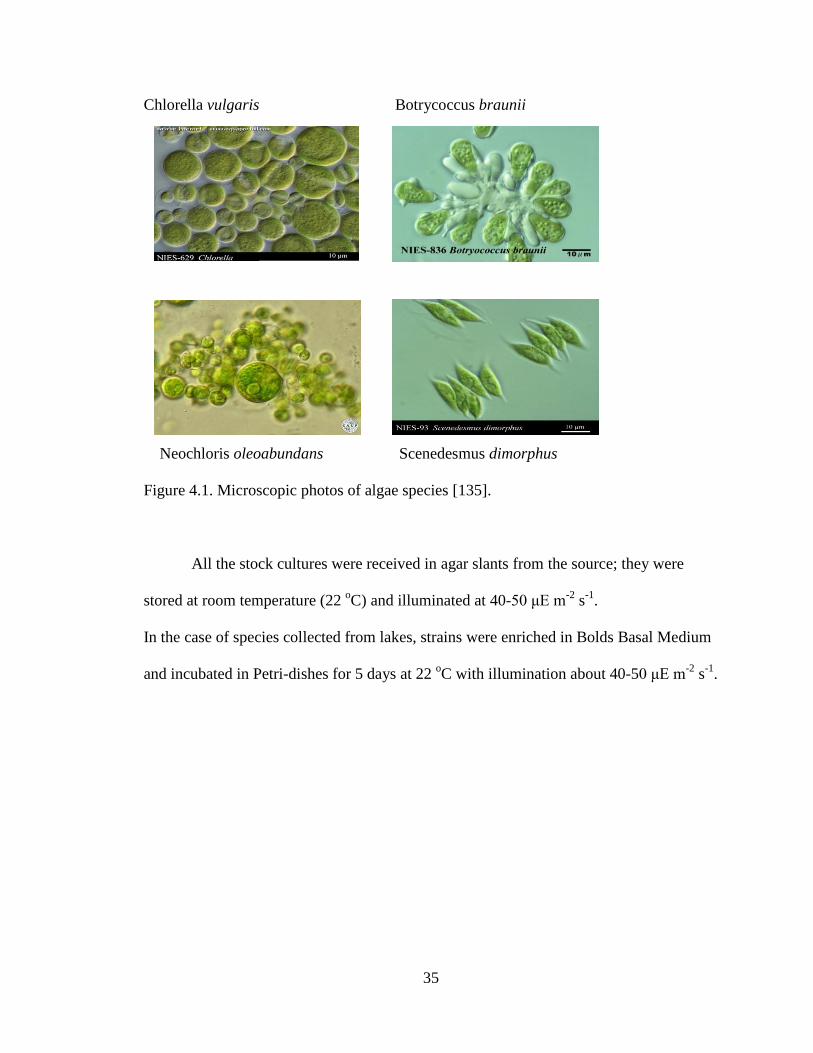
35
Chlorella vulgaris Botrycoccus braunii
Neochloris oleoabundans Scenedesmus dimorphus
Figure 4.1. Microscopic photos of algae species [135].
All the stock cultures were received in agar slants from the source; they were
stored at room temperature (22 oC) and illuminated at 40-50 μE m
-2 s
-1.
In the case of species collected from lakes, strains were enriched in Bolds Basal Medium
and incubated in Petri-dishes for 5 days at 22 oC with illumination about 40-50 μE m
-2 s
-1.
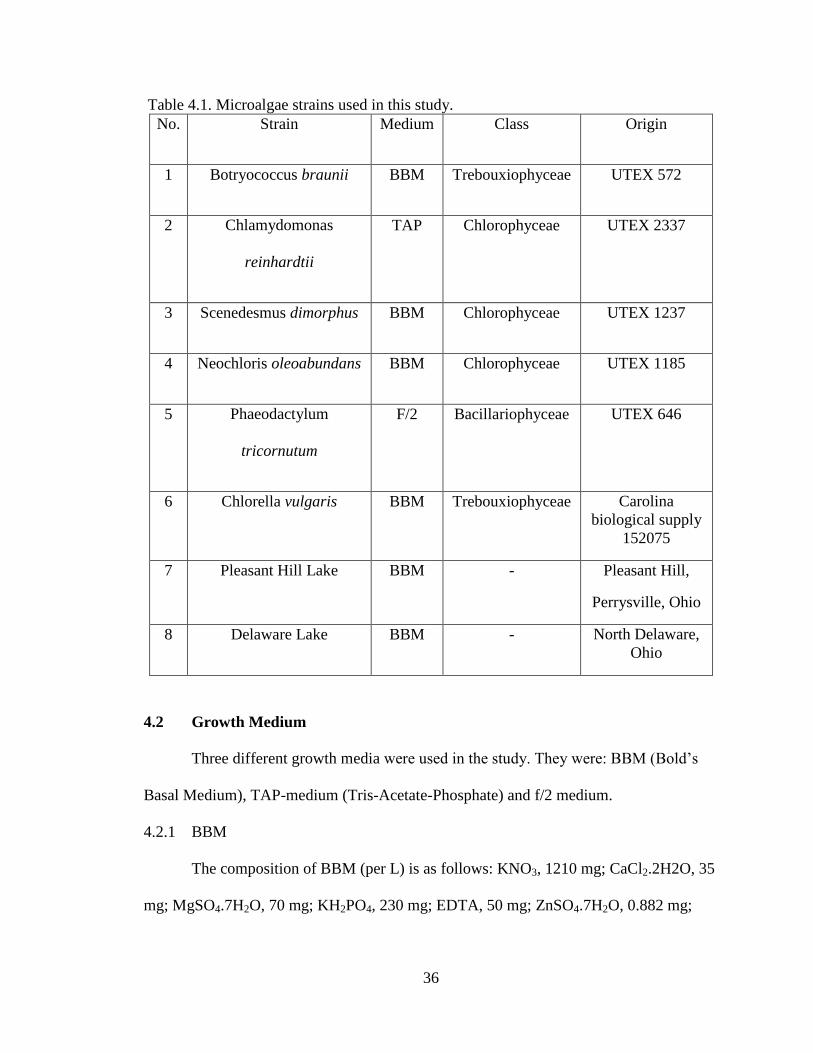
36
Table 4.1. Microalgae strains used in this study.
No. Strain Medium Class Origin
1 Botryococcus braunii BBM Trebouxiophyceae UTEX 572
2 Chlamydomonas
reinhardtii
TAP Chlorophyceae UTEX 2337
3 Scenedesmus dimorphus BBM Chlorophyceae UTEX 1237
4 Neochloris oleoabundans BBM Chlorophyceae UTEX 1185
5 Phaeodactylum
tricornutum
F/2 Bacillariophyceae UTEX 646
6 Chlorella vulgaris BBM Trebouxiophyceae Carolina
biological supply
152075
7 Pleasant Hill Lake BBM - Pleasant Hill,
Perrysville, Ohio
8 Delaware Lake BBM - North Delaware,
Ohio
4.2 Growth Medium
Three different growth media were used in the study. They were: BBM (Bold’s
Basal Medium), TAP-medium (Tris-Acetate-Phosphate) and f/2 medium.
4.2.1 BBM
The composition of BBM (per L) is as follows: KNO3, 1210 mg; CaCl2.2H2O, 35
mg; MgSO4.7H2O, 70 mg; KH2PO4, 230 mg; EDTA, 50 mg; ZnSO4.7H2O, 0.882 mg;
37
MnCl2 .4H2O, 0.144 mg; MoO3, 0.07mg; CuSO4.5H2O, 0.157 mg; and Co (NO3)2.6H2O,
0.049 mg. Solution must be autoclaved at 121 oC for 15 mins.
4.2.2 TAP Medium
Stock solutions of 1-3 (Table 4.2) were prepared and stored at 4 oC. TAP medium
was prepared by mixing 2.42 g Tris, 25 ml of solution #1, 0.375 ml of solution #2, 1 ml
of solution #3 and 1 ml of glacial acetic acid. The solution was bought to 1L by adding
water and autoclaved at 121 oC for 15 mins.
4.2.3 f/2 Medium
This medium is a slight modification of the original f medium of Guillard and
Ryther (1962). It is designated as f2 or f/2. To prepare this medium, 0.5 ml of each stock
solution (1-5) (Table 4.3) was added to 1 liter of seawater and autoclaved at 121 oC for 15
mins.
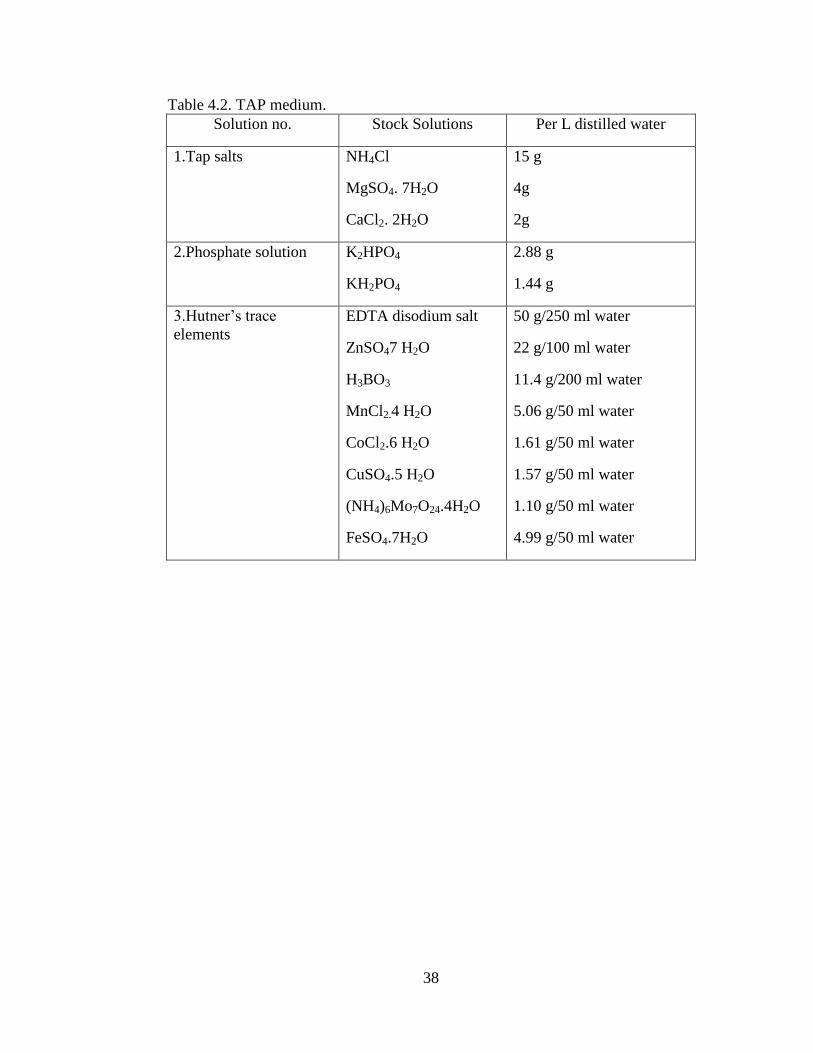
38
Table 4.2. TAP medium.
Solution no. Stock Solutions Per L distilled water
1.Tap salts NH4Cl
MgSO4. 7H2O
CaCl2. 2H2O
15 g
4g
2g
2.Phosphate solution K2HPO4
KH2PO4
2.88 g
1.44 g
3.Hutner’s trace
elements
EDTA disodium salt
ZnSO47 H2O
H3BO3
MnCl2.4 H2O
CoCl2.6 H2O
CuSO4.5 H2O
(NH4)6Mo7O24.4H2O
FeSO4.7H2O
50 g/250 ml water
22 g/100 ml water
11.4 g/200 ml water
5.06 g/50 ml water
1.61 g/50 ml water
1.57 g/50 ml water
1.10 g/50 ml water
4.99 g/50 ml water
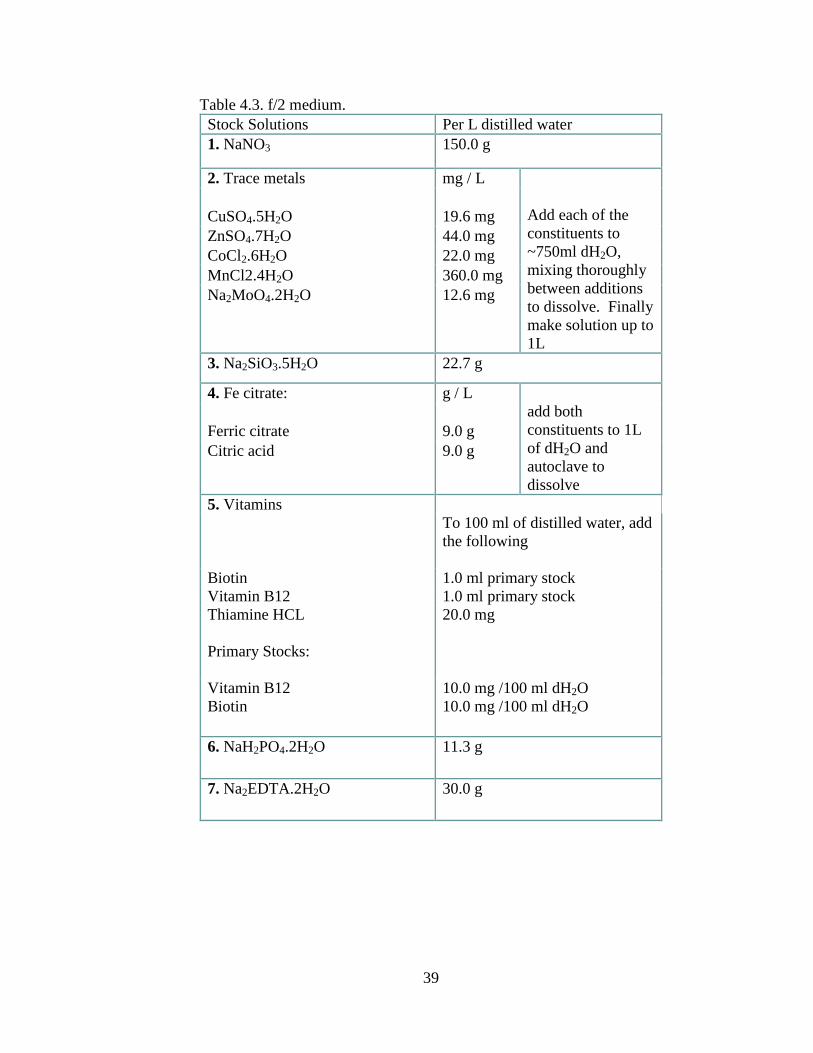
39
Table 4.3. f/2 medium.
Stock Solutions Per L distilled water
1. NaNO3 150.0 g
2. Trace metals mg / L
Add each of the
constituents to
~750ml dH2O,
mixing thoroughly
between additions
to dissolve. Finally
make solution up to
1L
CuSO4.5H2O
19.6 mg
ZnSO4.7H2O 44.0 mg
CoCl2.6H2O 22.0 mg
MnCl2.4H2O 360.0 mg
Na2MoO4.2H2O 12.6 mg
3. Na2SiO3.5H2O 22.7 g
4. Fe citrate: g / L
add both
constituents to 1L
of dH2O and
autoclave to
dissolve
Ferric citrate
9.0 g
Citric acid 9.0 g
5. Vitamins
To 100 ml of distilled water, add
the following
Biotin 1.0 ml primary stock
Vitamin B12 1.0 ml primary stock
Thiamine HCL
20.0 mg
Primary Stocks:
Vitamin B12 10.0 mg /100 ml dH2O
Biotin 10.0 mg /100 ml dH2O
6. NaH2PO4.2H2O 11.3 g
7. Na2EDTA.2H2O 30.0 g
40
4.3 Culture Conditions
To produce sufficient material (algae) for use in wastewater and heavy metal
treatment experiments, stock cultures were transferred and initially grown in 250 ml
Erlenmeyer flasks containing 100 ml of respective medium at 22 ± 2 °C with cool white
fluorescent lamps giving a continuous irradiance of 40-50 µmolm-2
sec-1
. CO2 and air was
bubbled through each culture at a flow rate of 100 ml/min and 250 ml/min, respectively.
After 2-3 weeks, when algae reaches the exponential growth phase, part of it was
harvested by centrifugation at 3000 rpm (Dynac centrifuge, serial no 103094) for 10 min
and was used in wastewater and heavy metal experimental studies.
4.4 Glassware Cleaning
Before the start of an experiment all glass apparatus were washed with phosphate
free detergent i.e. super concentrated non-foaming liquid cleanser (Decon Laboratories
Ltd, Hove), scrubbed with a nylon brush to remove stains and then rinsed with deionized
water. Glass apparatus used for heavy metal removal experiments were washed with 4%
HNO3 solution to remove all traces of bound metal and then repeatedly rinsed with
deionized water.
4.5 Experimental Setup
The same experimental set up was used for all the experiments conducted in this
study. Experiments were performed in batch photo bioreactors on a laboratory scale by
using 2000 ml cylindrical borosilicate pyrex bottles. Three ¼” holes were drilled into the
caps of the cylindrical bioreactors providing two inlets and one outlet. Carbon dioxide
and air lines were secured in the two inlet openings, and the third outlet opening was left
unobstructed to prevent oxygen and pressure buildup in the reactor. The gas flow rate
41
into the bioreactors was maintained by means of two Rota meters. The cultures were
subjected to illumination by four fluorescent lamps (Philips F40T12/DX 40 Watts) placed
horizontally and parallel to the front and back of the cylindrical photo bioreactor (Figure
4.2a).
4.6 Wastewater Experiments (Nitrate and Phosphorus Removal)
This section gives the details of the experiments performed for removing nitrate
and phosphorus from wastewater. It is divided into four sub sections. Preliminary
experiments performed for selection of strain are described in section 4.6.1. The details of
the experiments performed to investigate the nitrate and phosphorus removal rates of the
selected strain are discussed in section 4.6.2. Section 4.6.3 gives the details of the
experiments performed to test the selected strain’s ability to remove nitrogen from
different nitrogen sources. Phosphorus removal experiments were listed in section 4.6.4.
4.6.1 Preliminary Experiments (selection of microalgae)
Preliminary experiments were performed using 6 different algae strains to select
the best microalga species for nitrate and phosphate removal studies. The experimental
bioremediation system consisted of six 2 L cylindrical bioreactors placed in parallel as
shown in Figure 4.2b. The cultures were subjected to illumination by fluorescent lamps
placed vertically at the back of the reactor. The wastewater treated in this experimental
study was obtained from the Dayton Water Reclamation Plant. Samples were collected
from the treatment plant’s effluent stream which is discharged into the Great Miami
River. Initial nitrate and phosphorus content in the wastewater was measured and found
to be 7.5 mg/L and 1.56 mg/L respectively. According to NPDES, phosphorus content
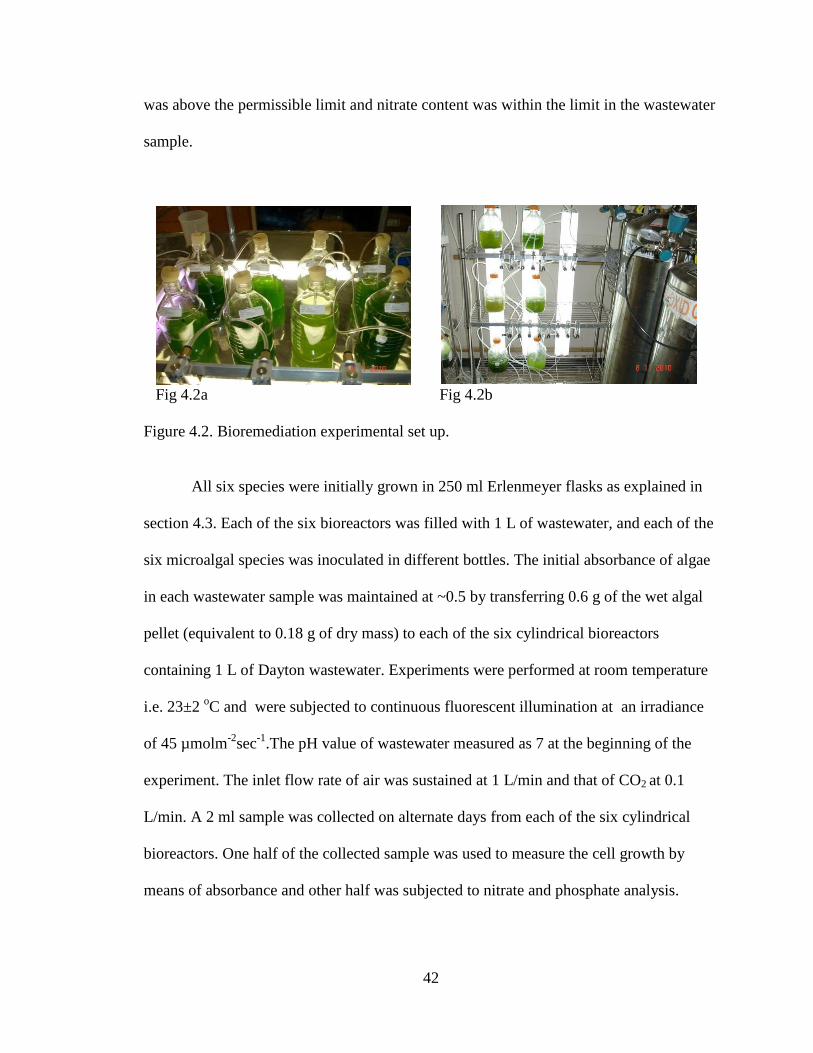
42
was above the permissible limit and nitrate content was within the limit in the wastewater
sample.
Fig 4.2a Fig 4.2b
Figure 4.2. Bioremediation experimental set up.
All six species were initially grown in 250 ml Erlenmeyer flasks as explained in
section 4.3. Each of the six bioreactors was filled with 1 L of wastewater, and each of the
six microalgal species was inoculated in different bottles. The initial absorbance of algae
in each wastewater sample was maintained at ~0.5 by transferring 0.6 g of the wet algal
pellet (equivalent to 0.18 g of dry mass) to each of the six cylindrical bioreactors
containing 1 L of Dayton wastewater. Experiments were performed at room temperature
i.e. 23±2 oC and were subjected to continuous fluorescent illumination at an irradiance
of 45 µmolm-2
sec-1
.The pH value of wastewater measured as 7 at the beginning of the
experiment. The inlet flow rate of air was sustained at 1 L/min and that of CO2 at 0.1
L/min. A 2 ml sample was collected on alternate days from each of the six cylindrical
bioreactors. One half of the collected sample was used to measure the cell growth by
means of absorbance and other half was subjected to nitrate and phosphate analysis.
43
4.6.2 Nitrate and Phosphorus Removal Experiments
Based on the preliminary experimental results, Chlorella vulgaris was found to be
the ideal species for removing nitrates and phosphates. A detail discussion of the
preliminary results will be presented in the next chapter. After the strain selection study,
nitrate and phosphorus removal rates of Chlorella vulgaris at various temperatures were
investigated. Synthetic wastewater was used instead of actual wastewater and the
concentrations of nitrate and phosphorus in actual wastewater were replicated in the
synthetic wastewater. KNO3 and KH2PO4 served as nitrate and phosphorus sources
respectively. Other nutrients in the BBM (micronutrients) required for growth of algae
are also added to the synthetic wastewater. The concentration of micronutrients is
mentioned in section 4.2.1.
The experimental set up described in section 4.5 was used and bioreactors of
volume 2 L containing 1 L of synthetic wastewater (4.2.1) were used. A culture grown
under autotrophic growth conditions was used as initial inoculum. Different sets of
experiments as shown in table 4.4 were performed varying the concentrations of nitrate
and phosphate in synthetic wastewater. Ratios of nitrogen/phosphorus varied from 0.78 to
14 similar to ratios found in the effluents from wastewater treatment plants [136]. A
nitrate (NO3-) concentration between 90.12 to 741.56 mg/L and phosphorus (P-PO4
3-)
concentration between 13.12 to 52.42 mg/L was studied. The experimental conditions are
shown in table 4.5.
Samples were taken daily in 5 ml volumes for 8 days from each reactor and
analyzed for dry cell weight and the nitrate and phosphate content. The dissolved oxygen,
pH, and temperature were monitored on a regular basis during the experiments.
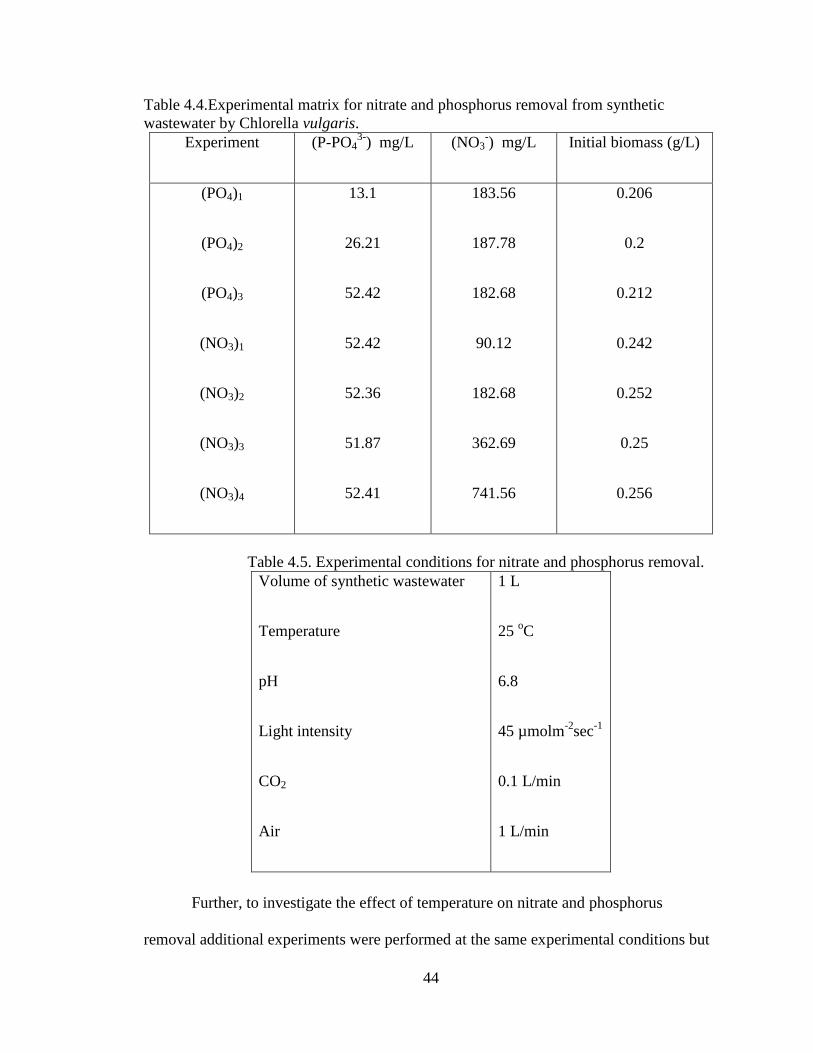
44
Table 4.4.Experimental matrix for nitrate and phosphorus removal from synthetic
wastewater by Chlorella vulgaris.
Experiment (P-PO43-
) mg/L (NO3-) mg/L Initial biomass (g/L)
(PO4)1
(PO4)2
(PO4)3
(NO3)1
(NO3)2
(NO3)3
(NO3)4
13.1
26.21
52.42
52.42
52.36
51.87
52.41
183.56
187.78
182.68
90.12
182.68
362.69
741.56
0.206
0.2
0.212
0.242
0.252
0.25
0.256
Table 4.5. Experimental conditions for nitrate and phosphorus removal.
Volume of synthetic wastewater
Temperature
pH
Light intensity
CO2
Air
1 L
25 oC
6.8
45 µmolm-2
sec-1
0.1 L/min
1 L/min
Further, to investigate the effect of temperature on nitrate and phosphorus
removal additional experiments were performed at the same experimental conditions but
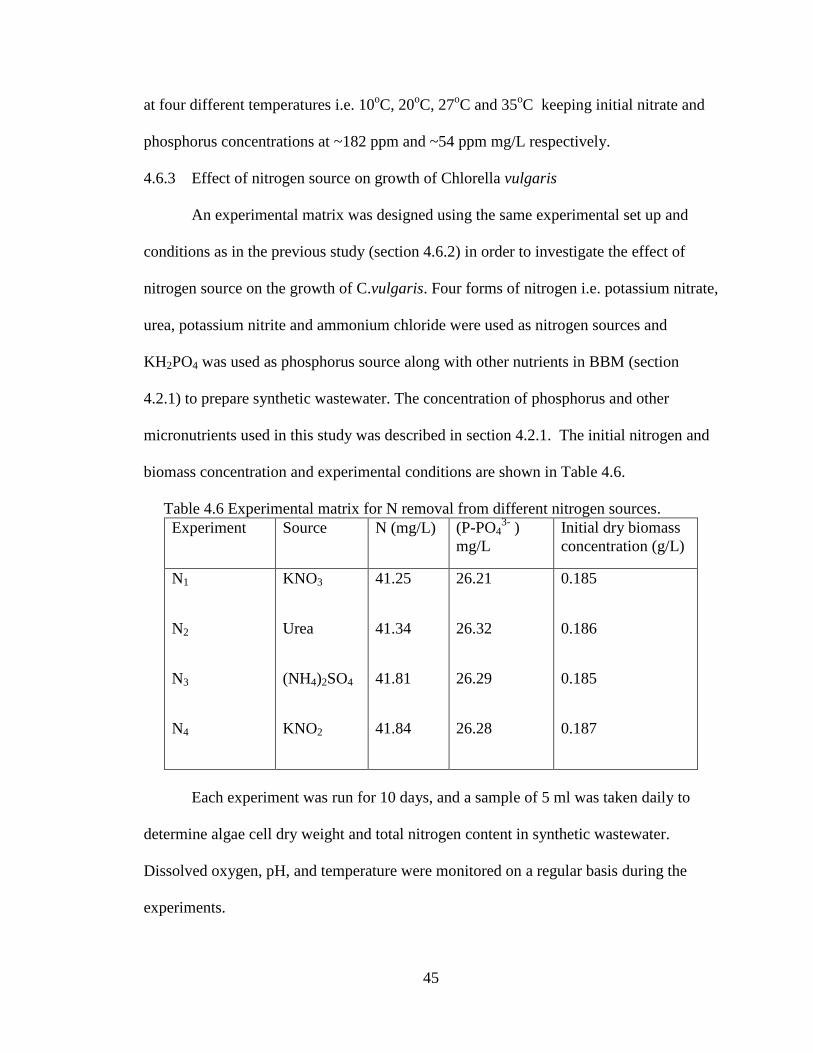
45
at four different temperatures i.e. 10oC, 20
oC, 27
oC and 35
oC keeping initial nitrate and
phosphorus concentrations at ~182 ppm and ~54 ppm mg/L respectively.
4.6.3 Effect of nitrogen source on growth of Chlorella vulgaris
An experimental matrix was designed using the same experimental set up and
conditions as in the previous study (section 4.6.2) in order to investigate the effect of
nitrogen source on the growth of C.vulgaris. Four forms of nitrogen i.e. potassium nitrate,
urea, potassium nitrite and ammonium chloride were used as nitrogen sources and
KH2PO4 was used as phosphorus source along with other nutrients in BBM (section
4.2.1) to prepare synthetic wastewater. The concentration of phosphorus and other
micronutrients used in this study was described in section 4.2.1. The initial nitrogen and
biomass concentration and experimental conditions are shown in Table 4.6.
Table 4.6 Experimental matrix for N removal from different nitrogen sources.
Experiment Source N (mg/L) (P-PO43-
)
mg/L
Initial dry biomass
concentration (g/L)
N1
N2
N3
N4
KNO3
Urea
(NH4)2SO4
KNO2
41.25
41.34
41.81
41.84
26.21
26.32
26.29
26.28
0.185
0.186
0.185
0.187
Each experiment was run for 10 days, and a sample of 5 ml was taken daily to
determine algae cell dry weight and total nitrogen content in synthetic wastewater.
Dissolved oxygen, pH, and temperature were monitored on a regular basis during the
experiments.
46
4.6.4 Phosphorus Removal by Species Acclimated to High P Environments
The results of experimental section 4.6.2 showed that Chlorella vulgaris can
remove phosphates only to a certain extent (normal uptake). To enhance the removal of
phosphate from wastewater, two species known to grow well in a high P environment
were selected to determine their ability to remove phosphates from wastewater. Two
species were collected from Pleasant Hill Lake, Perrysville, Ohio and Delaware Lake,
North Delaware, Ohio. To remove more amounts of phosphorus from wastewater, in this
study, these two species were tested to investigate their ability to remove phosphorus
from synthetic wastewater. KH2PO4 and KNO3 were used as phosphorus and nitrate
sources in synthetic wastewater along with other nutrients in BBM (section 4.2.1). The
experimental matrix is listed in Table 4.7 and experimental conditions are same as listed
in Table 4.5. Each experiment was run for 10 days, and a sample of 5 ml was taken daily
to determine algae cell dry weight and phosphorus content in synthetic wastewater.
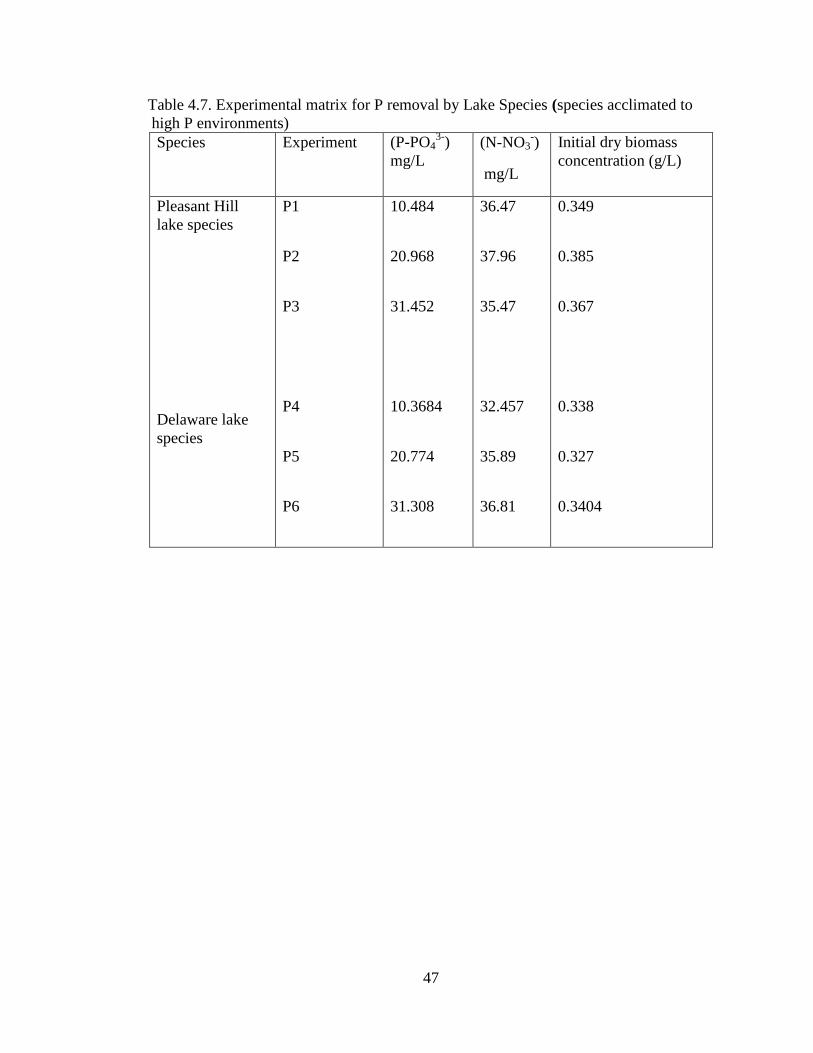
47
Table 4.7. Experimental matrix for P removal by Lake Species (species acclimated to
high P environments)
Species Experiment (P-PO43-
)
mg/L
(N-NO3-)
mg/L
Initial dry biomass
concentration (g/L)
Pleasant Hill
lake species
Delaware lake
species
P1
P2
P3
P4
P5
P6
10.484
20.968
31.452
10.3684
20.774
31.308
36.47
37.96
35.47
32.457
35.89
36.81
0.349
0.385
0.367
0.338
0.327
0.3404
48
4.7 Heavy Metal (Cr, Cd) Removal Experiments.
4.7.1 Preliminary Studies
The primary objective of the preliminary studies is to verify the capability of
species to remove Cr and Cd from synthetic wastewater. Preliminary experiments were
conducted using two microalgae species i.e. Chlorella Vulgaris and Neochloris
Oleoabundans with Cd and Cr metal concentrations in solution ranging from 50 to 350
mg/L. Both microalgae cultures used were cultivated batch wise in 250 ml Erlenmeyer
flasks as described in section 4.3. After reaching the exponential growth phase, part of it
was harvested and transferred to heavy metal containing synthetic wastewater.
Stock metal solutions of 1000 mg/L of Cd2+
and Cr6+
were prepared by dissolving
1.857 g of CdSO4, and 2.8289 g of K2Cr2O7 in 1000 ml of D.I water. The stock solutions
were diluted to obtain test solutions of desired concentration. All chemicals used in this
study were analytical grade.
Metal removal experiments were performed in 2 L bioreactor (see section 4.5)
containing 1 L of metal solution of desired concentration. Nutrients required for the
growth of algae were also added to the desired test solution. Synthetic wastewater each
containing metal concentrations of 350 mg/L and 250 mg/L of Cr6+
and Cd2+
were treated
with N. oleoabundans and a wastewater containing 350 mg/L of Cr6+
and 250 mg/l of
Cd2+
was treated using Chlorella. Pre cultured algae was added to the metal solution. The
initial biomass concentrations for these preliminary experiments are listed in Table 4.8.
Experiments were performed at room temperature i.e. 23±2 oC and were subjected to
continuous fluorescent illumination at an irradiance of 45 µmolm-2
sec-1
.The pH was
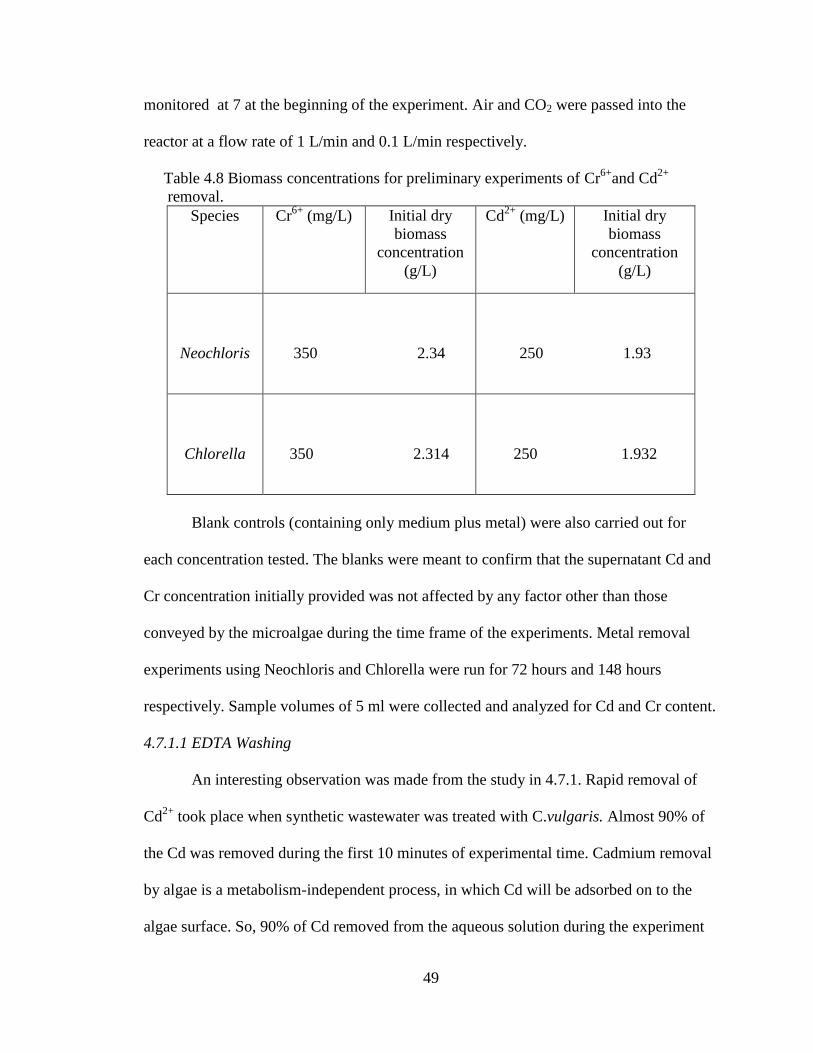
49
monitored at 7 at the beginning of the experiment. Air and CO2 were passed into the
reactor at a flow rate of 1 L/min and 0.1 L/min respectively.
Table 4.8 Biomass concentrations for preliminary experiments of Cr6+
and Cd2+
removal.
Species Cr6+
(mg/L) Initial dry
biomass
concentration
(g/L)
Cd2+
(mg/L) Initial dry
biomass
concentration
(g/L)
Neochloris
350 2.34
250 1.93
Chlorella
350 2.314
250 1.932
Blank controls (containing only medium plus metal) were also carried out for
each concentration tested. The blanks were meant to confirm that the supernatant Cd and
Cr concentration initially provided was not affected by any factor other than those
conveyed by the microalgae during the time frame of the experiments. Metal removal
experiments using Neochloris and Chlorella were run for 72 hours and 148 hours
respectively. Sample volumes of 5 ml were collected and analyzed for Cd and Cr content.
4.7.1.1 EDTA Washing
An interesting observation was made from the study in 4.7.1. Rapid removal of
Cd2+
took place when synthetic wastewater was treated with C.vulgaris. Almost 90% of
the Cd was removed during the first 10 minutes of experimental time. Cadmium removal
by algae is a metabolism-independent process, in which Cd will be adsorbed on to the
algae surface. So, 90% of Cd removed from the aqueous solution during the experiment
50
should be adsorbed on the surface. To verify this, 1ml of algae solution was taken in a
plastic cuvette and was centrifuged in a micro centrifuge (Accuspin Micro 17, serial no
41055477) for 2 mins. The supernatant was drained off and the remaining algae paste
was treated (washed) with 1 ml of 20 mM Ethylene diamine tetra acetic acid (EDTA) for
5 mins. EDTA has a property to remove surface-bound metal, leaving behind the
intracellular fractions of the algal cell [6]. The EDTA washed algae was then centrifuged
and supernatant (EDTA) was analyzed for Cd content. The results showed that Cd
content present in the EDTA is same as the Cd that is removed from the aqueous
solution. Same procedure was employed to detect on the Cr content on algae surface.
To economize the usage of EDTA and to know the minimum concentration and
minimum volume of EDTA required to remove Cd from algae surface, series of
experiments were performed varying the concentration and volume of EDTA.
5mM, 10Mm, 20 mM concentrations of EDTA each of volume 0.25, 0.5 ml and 1 ml
were tested to remove Cd from the surface of algae paste resulted from the centrifugation
of 1 ml of algae solution.
4.7.2 Cr and Cd Removal Experiments
Based on the preliminary tests, we found that Chlorella is very efficient in
removing Cr6+
and Cd2+
from synthetic wastewater. The details of the preliminary results
are discussed in section 5.2.2. After the preliminary experiments, effect of various
parameters such as initial metal concentration, contact time, initial biomass
concentration, pH and temperature on the metal removal ability of Chlorella vulgaris
were investigated.
51
The experimental set up is same as in the preliminary experimental study.
Experimental set up is discussed in detail in section 4.5. Bioreactors in which
experiments were performed are subjected to continuous fluorescent illumination at an
irradiance of 45 µmolm-2
sec-1
. Air and CO2 were passed into the reactor at a flow rate of
1 L/min and 0.1 L/min respectively. Table 4.9 and 4.10 comprises the experimental
matrix designed for removing Cr and Cd from wastewater varying the parameters such as
pH, initial metal concentration, biomass dosage and temperature. The pH was adjusted
using1 M NaOH or 1 M HCl. As the cadmium removal is very rapid, samples were
collected at 0, 5, 10, 20, 30, 60, and 90 min for Cd removal experiments and as the
chromium removal was mainly based on physical absorption, samples were collected at
0, 4, 12, 18, 24, 36, 42, 60, and 120 hours for Cr removal experiments. The collected
samples were analyzed for algae cell dry weight and for Cd and Cr content.
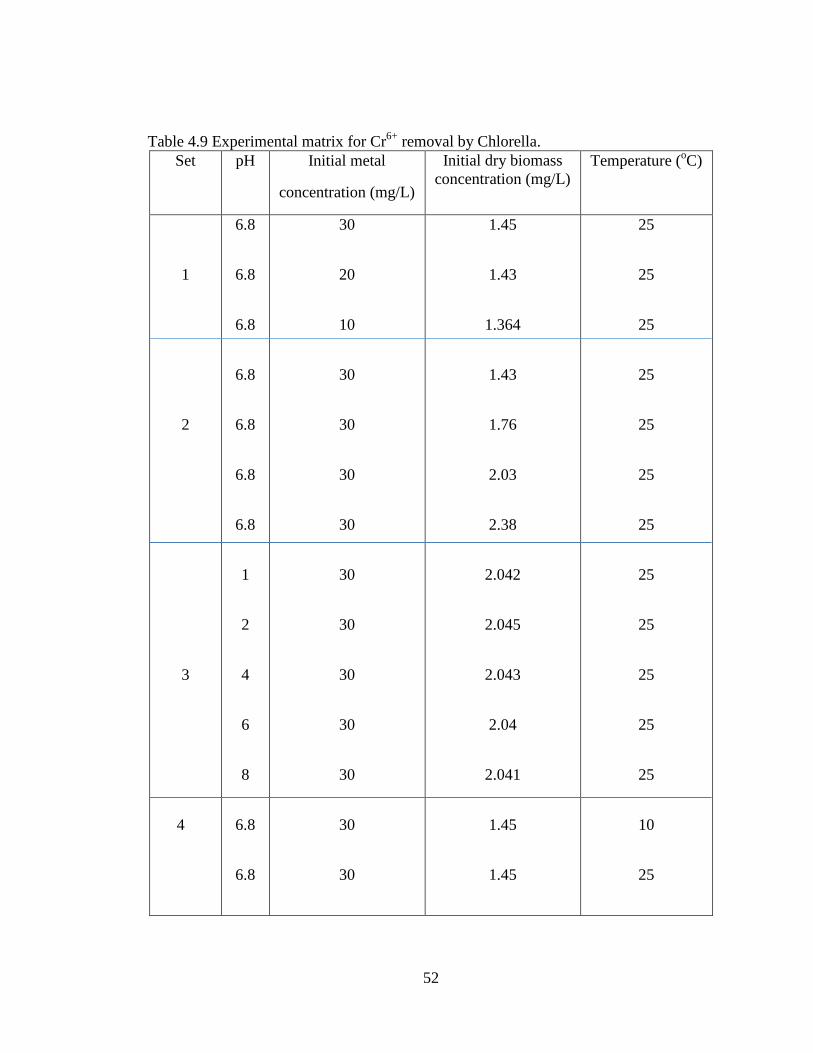
52
Table 4.9 Experimental matrix for Cr6+
removal by Chlorella.
Set pH Initial metal
concentration (mg/L)
Initial dry biomass
concentration (mg/L)
Temperature (oC)
1
2
3
4
6.8
6.8
6.8
6.8
6.8
6.8
6.8
1
2
4
6
8
6.8
6.8
30
20
10
30
30
30
30
30
30
30
30
30
30
30
1.45
1.43
1.364
1.43
1.76
2.03
2.38
2.042
2.045
2.043
2.04
2.041
1.45
1.45
25
25
25
25
25
25
25
25
25
25
25
25
10
25
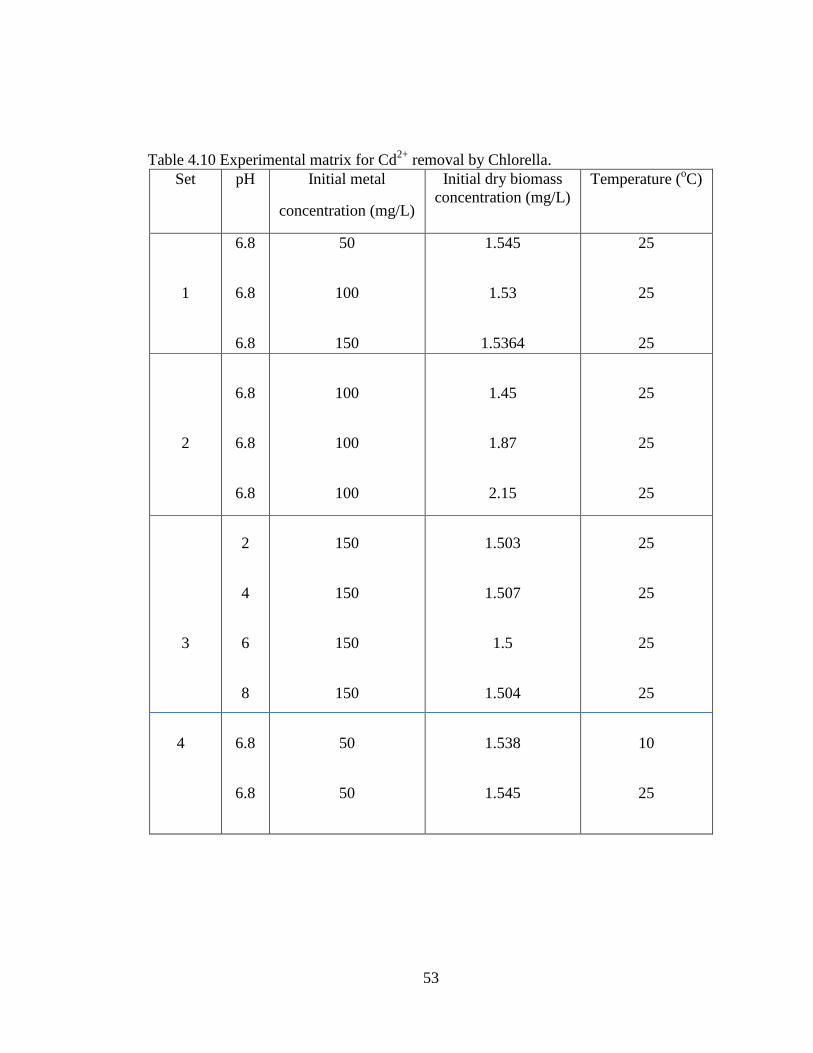
53
Table 4.10 Experimental matrix for Cd2+
removal by Chlorella.
Set pH Initial metal
concentration (mg/L)
Initial dry biomass
concentration (mg/L)
Temperature (oC)
1
2
3
4
6.8
6.8
6.8
6.8
6.8
6.8
2
4
6
8
6.8
6.8
50
100
150
100
100
100
150
150
150
150
50
50
1.545
1.53
1.5364
1.45
1.87
2.15
1.503
1.507
1.5
1.504
1.538
1.545
25
25
25
25
25
25
25
25
25
25
10
25
54
4.7.3 Heavy Metal Removal by Mixotrophically and Heterotrophically Grown Algae
The results from the study in 4.7.2 indicated that the metal uptake from the
aqueous solution will depend on the initial biomass concentration. It was observed in the
study that a larger percentage of metal was removed at higher biomass concentration.
This is because, an increase in biomass concentration increases algae cell surface and
therefore a larger amount of metal will be adsorbed on the surface.
It is known that the growth rate of mixotrophically and heterotrophcially grown algae are
higher than that of phototrophically grown algae [137,138]. So, a higher biomass
concentration can be achieved in a short time via mixotrophic and heterotrophic
conditions. Time to remove metal ions from aqueous solutions can be reduced if we can
treat synthetic wastewater with heterotrophcially and mixotrophically grown algae.
Therefore, experiments were performed to investigate the capability of heterotrophcially
and mixotrophically grown algae to remove Cr6+
and Cd2+
from synthetic wastewater.
Initially, the experiments were conducted to determine the capability of
C. vulgaris to grow under heterotrophic and mixotrophic conditions. The experimental
set up used for these studies was described in section 4.5. Algae cells were grown in 2 L
bottles containing 1 L of BBM with an organic carbon source. A culture grown under
autotrophic growth conditions served as initial inoculum (section 4.3). Glucose and
glycerol were used as organic carbon sources. The autotrophic control group was
cultivated in BBM with illumination. The details of the initial concentration of organic
carbon and initial biomass concentration used for mixotrophic and heterotrophic growth
are listed in Table 4.11. An air flow rate of 1 L/min and a CO2 flow rate of 0.1 L/min
55
were provided to mixotrophically grown species along with a light irradiance of 45
µmolm-2
sec-1
. Only air was supplied at a flow rate of 1 L/min to heterotrophically grown
species without light and CO2. Temperature of 23 oC and pH of 7.1 was maintained for
both conditions. Samples were collected daily for 4 days, and analyzed for algal biomass
concentration and lipid content.
The results of the initial experiments confirmed that C. vulgaris can grow
effectively under mixotrophic and heterotrophic conditions generating large amount of
biomass in short interval of time. Therefore, in the second phase of study, algae that was
grown under mixotrophic and heterotrophic conditions was used to treat metal
contaminated water having a concentration of 60 ppm of Cr6+
and Cd2+
ions. Samples
were taken daily for six days to measure biomass concentration and the metal removal
capability of C.vulgaris under mixotrophic and heterotrophic conditions. Lipids were
analyzed to determine potential revenue to offset costs for algae biomass generation to
remove heavy metals.
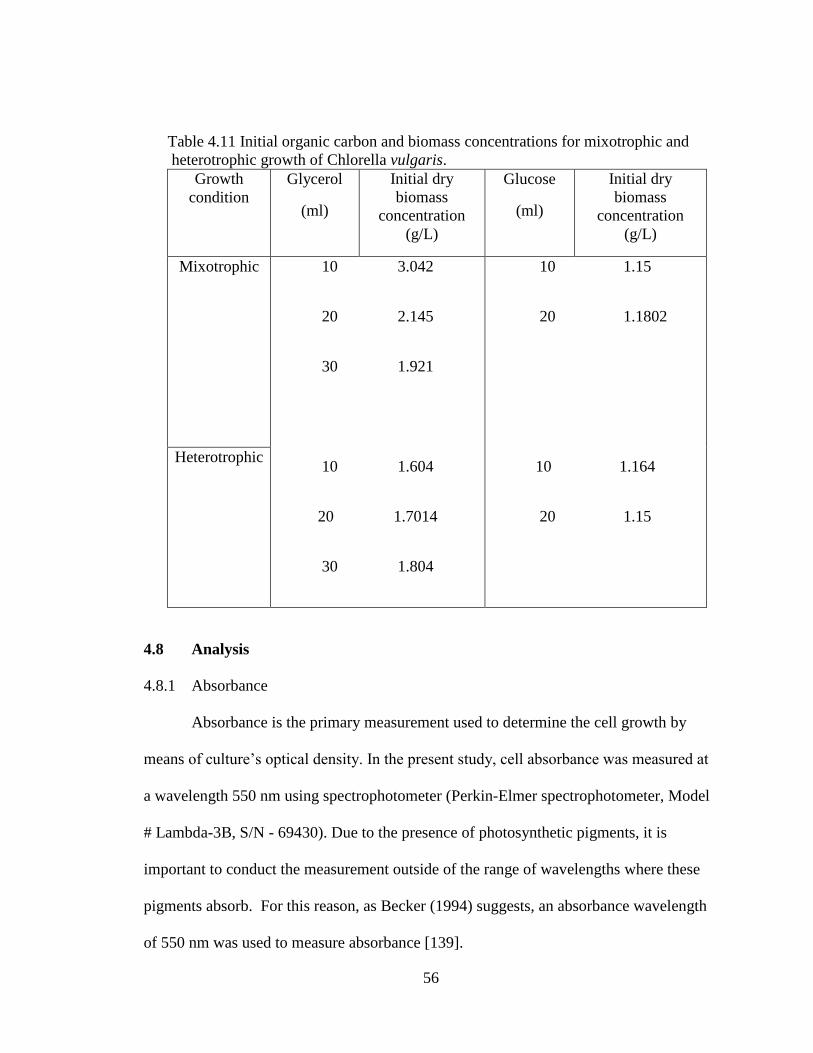
56
Table 4.11 Initial organic carbon and biomass concentrations for mixotrophic and
heterotrophic growth of Chlorella vulgaris.
Growth
condition
Glycerol
(ml)
Initial dry
biomass
concentration
(g/L)
Glucose
(ml)
Initial dry
biomass
concentration
(g/L)
Mixotrophic
10 3.042
20 2.145
30 1.921
10 1.604
20 1.7014
30 1.804
10 1.15
20 1.1802
10 1.164
20 1.15
Heterotrophic
4.8 Analysis
4.8.1 Absorbance
Absorbance is the primary measurement used to determine the cell growth by
means of culture’s optical density. In the present study, cell absorbance was measured at
a wavelength 550 nm using spectrophotometer (Perkin-Elmer spectrophotometer, Model
# Lambda-3B, S/N - 69430). Due to the presence of photosynthetic pigments, it is
important to conduct the measurement outside of the range of wavelengths where these
pigments absorb. For this reason, as Becker (1994) suggests, an absorbance wavelength
of 550 nm was used to measure absorbance [139].
57
4.8.2 Algae Cell Growth
Turbidity and Dry cell weight estimations are two of the most prominent methods
used by researchers to determine growth rate of algae. As Becker showed [68] biomass
concentration can be correlated to algae absorbance. The amount of light that passes
through the algae suspension will be inversely proportional to the algae concentration, in
accordance with Beer’s Law relating absorption to concentration. Considering the
wavelengths where Chlorophyll-a and -b absorb, an absorbance at 550 nm is
recommended and will be used to construct the standard curve [68] .Use of the standard
curve yields a linear equation that compares absorbance of the suspension at 550 nm to
the cell concentration at that particular time. The equation, in its generic form, will
appear as follows:
y = Ax….. Eq. 4.1
where A is the linear regression line fit variable, x is the A550 reading and y is the
cell concentration of the suspension.
A volume of 0.5 ml was used to measure the cell dry weight via filtration. Prior to
the filtration, 0.2 μm Whatman GF/C filters were initially placed in a temperature
chamber (micro oven) at 85 °C for 24 hours to remove moisture. After 24 hours, filters
were taken out of the oven, weighed and then 0.5 ml algae solution was filtered on pre-
weighed 0.2 μm Whatman GF/C filters. Then, the filters were again dried for 24 hours at
85 °C (optimum temperature for drying the wet algae), and re-weighed using a
microbalance (Radwag microbalance, Model no MYA31/24 error – 1 µg). The difference
58
between empty filter weight and filter with algae gives the dry cell biomass
concentration.
4.8.3 Nitrate Analysis
Nitrate analysis was done using Hach DR-890 colorimeter. A 2ml of algae
solution collected from the experiment was centrifuged for 5 min at 700xg in micro
centrifuge to separate the algae from the media. The clear supernatant was used to
measure nitrate content by cadmium reduction method (Hach Method 8049). Nitrogen
uptake was measured as nitrate. A Hach Nitra Ver 5 Nitrate reagent powder pillow was
added to the appropriate dilution of the supernatant. Final volume of the testing sample
should be 10ml. The sample was shaken for one minute and allowed to rest for five
minutes permitting the reaction to complete.
A blank was also prepared by adding Nitra Ver 5 Nitrate reagent powder pillow to
10 ml of distilled water. This blank was used to zero the colorimeter prior to testing of
samples. The cadmium metal reduces nitrates present in the sample to nitrite. This nitrite
form an amber-colored product by reacting in acidic medium with sulfanilic acid. This
amber color indicates the presence of nitrate and intensity is converted to (NO3- ) mg/L.
4.8.4 Phosphorus Analysis
Again, as described in nitrate analysis, a 2ml of algae solution collected from the
experiment was centrifuged for 5 min at 700xg in micro centrifuge to separate the algae
from the media. The clear supernatant was measured for phosphate using the Hach DR-
890 colorimeter and the molybdate-ascorbic acid method (Hach Method 8507).
Phosphate reagent powder pillow was added to the test sample that is diluted to a total
volume of 10 ml by adding D.I water. The sample mixture was shaken for 15 seconds and
59
left to sit for two minutes for the reaction to complete. A blank was prepared by
dissolving reagent powder pillow in 10 ml of distilled water. This blank was used to zero
the colorimeter prior to testing of samples. Orthophosphate present in the sample reacts
with molybdate in the reagent in the acid medium to produce a phospho-molybdate
complex. Ascorbic acid reduces this complex and forms a blue color. This blue color
indicates the presence of phosphate and the intensity is converted to (P-PO43-
) mg/L.
4.8.5 Total Nitrogen Analysis
Total N analysis was done using DR-890 colorimeter by per sulfate digestion
method (method 10072). Sample preparation and volume of sample is same as nitrate and
phosphate analysis. An alkaline per sulfate digestion converts all forms of nitrogen to
nitrate. Sodium metabisulfite added after the digestion will eliminate halogen oxide
interferences. Under acidic conditions, nitrate reacts with chromotropic acid to form a
yellow complex. The intensity of this yellow complex will determine the total N
concentration in mg/L.
4.8.6 Metal Analysis
The amount of metal present in the supernatant and the amount incorporated into
the cells were both analyzed in the samples via inductively coupled plasma mass
spectrometry (ICP-MS). ICP-MS is a relatively new method for determining multi-
element analysis and ideal for water, since the vast majority of target compounds can be
detected below 0.1 mg/l [141, 142]. It consists of Meinhart nebulizer and silica cyclonic
spray chamber with continuous nebulization. The operating conditions are listed below:
Nebulizer Gas flow rates: 0.95 l/min; Auxiliary Gas Flow: 1.2 l/min; Plasma Gas Flow:
15 l/min; Lens Voltage: 7.25 V; ICP RF Power: 1100 W;
60
The concentration of metal removed was calculated as follows: difference between the
initial metal concentration in the solution and the remaining metal concentration in the
supernatant, at each sampling time;
Percent of metal removed by algae was determined according to:
R (%) = ((Co- Ct) / Co) x 100……….Eq.4.2
Where R is the percentage of metal removed by algae, Co is the initial metal
concentration in mg/L and Ct is the remaining concentration at time t in mg/L.
Metal uptake by biomass was determined according to:
𝑞 = 𝑉 𝐶𝑜−𝐶𝑡
𝑥…………………. Eq.4.3.
where q is the metal uptake in mg (metal) g-1
biomass, V is the volume of metal
containing solution, Co is the initial metal concentration in mg/L and Ct is the remaining
concentration at time t in mg/L [143].
4.8.7 Lipid Extraction
Extraction of lipid was performed by Bligh and Dyer (1959) method. Initially
algae cells were harvested by centrifugation at 3,000 rpm for 10 min. The cells were
washed once with distilled water and re centrifuged. The pellet was dried in oven at
80°C. For 1 g of algal biomass, 1 ml of chloroform and 2 mL of methanol was added and
the mixture was agitated in vortex for 2 min. 1 mL of chloroform was again added and
the mixture was shaken vigorously for 1 min. After that, 1ml of distilled water was added
and the mixture was mixed in a vortex again for 2 min. The layers were separated by
centrifugation for 10 min at 3000 rpm. The lower layer was separated and the procedure
was again repeated with the pellet. The two supernatants collected were allowed to stand
for 2 h. Lower organic layer with the lipids was transferred to a clean pre-weighed vial
61
(W1). Evaporation was carried out and the weight of the vial was again recorded (W2).
Lipid content was calculated by subtracting W1 from W2 and was expressed as % dry cell
weight [140].
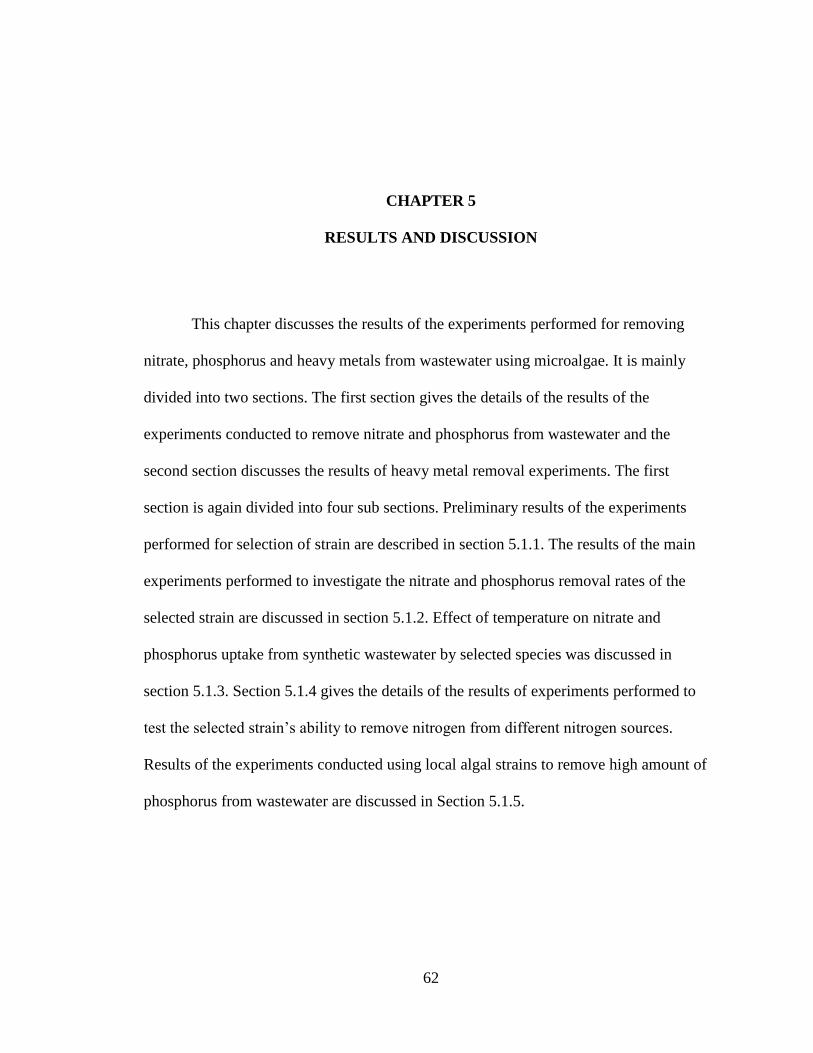
62
CHAPTER 5
RESULTS AND DISCUSSION
This chapter discusses the results of the experiments performed for removing
nitrate, phosphorus and heavy metals from wastewater using microalgae. It is mainly
divided into two sections. The first section gives the details of the results of the
experiments conducted to remove nitrate and phosphorus from wastewater and the
second section discusses the results of heavy metal removal experiments. The first
section is again divided into four sub sections. Preliminary results of the experiments
performed for selection of strain are described in section 5.1.1. The results of the main
experiments performed to investigate the nitrate and phosphorus removal rates of the
selected strain are discussed in section 5.1.2. Effect of temperature on nitrate and
phosphorus uptake from synthetic wastewater by selected species was discussed in
section 5.1.3. Section 5.1.4 gives the details of the results of experiments performed to
test the selected strain’s ability to remove nitrogen from different nitrogen sources.
Results of the experiments conducted using local algal strains to remove high amount of
phosphorus from wastewater are discussed in Section 5.1.5.
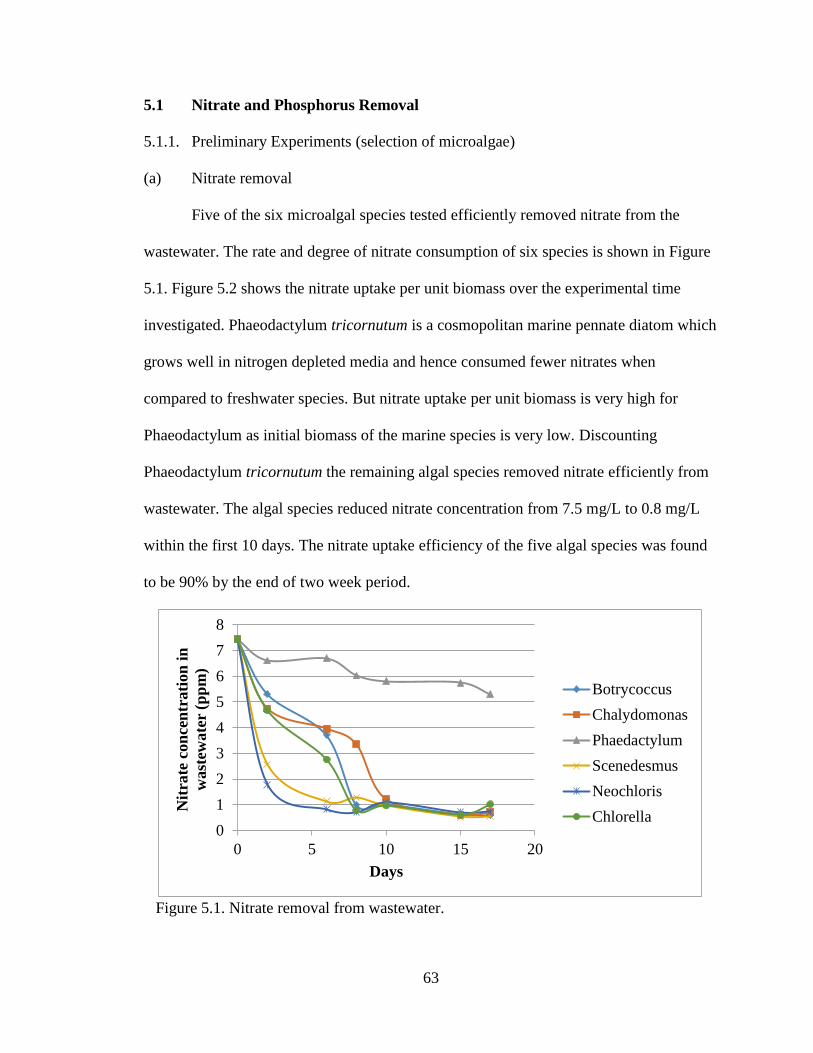
63
5.1 Nitrate and Phosphorus Removal
5.1.1. Preliminary Experiments (selection of microalgae)
(a) Nitrate removal
Five of the six microalgal species tested efficiently removed nitrate from the
wastewater. The rate and degree of nitrate consumption of six species is shown in Figure
5.1. Figure 5.2 shows the nitrate uptake per unit biomass over the experimental time
investigated. Phaeodactylum tricornutum is a cosmopolitan marine pennate diatom which
grows well in nitrogen depleted media and hence consumed fewer nitrates when
compared to freshwater species. But nitrate uptake per unit biomass is very high for
Phaeodactylum as initial biomass of the marine species is very low. Discounting
Phaeodactylum tricornutum the remaining algal species removed nitrate efficiently from
wastewater. The algal species reduced nitrate concentration from 7.5 mg/L to 0.8 mg/L
within the first 10 days. The nitrate uptake efficiency of the five algal species was found
to be 90% by the end of two week period.
Figure 5.1. Nitrate removal from wastewater.
0
1
2
3
4
5
6
7
8
0 5 10 15 20
Nit
rate
con
cen
trati
on
in
wast
ewate
r (p
pm
)
Days
Botrycoccus
Chalydomonas
Phaedactylum
Scenedesmus
Neochloris
Chlorella
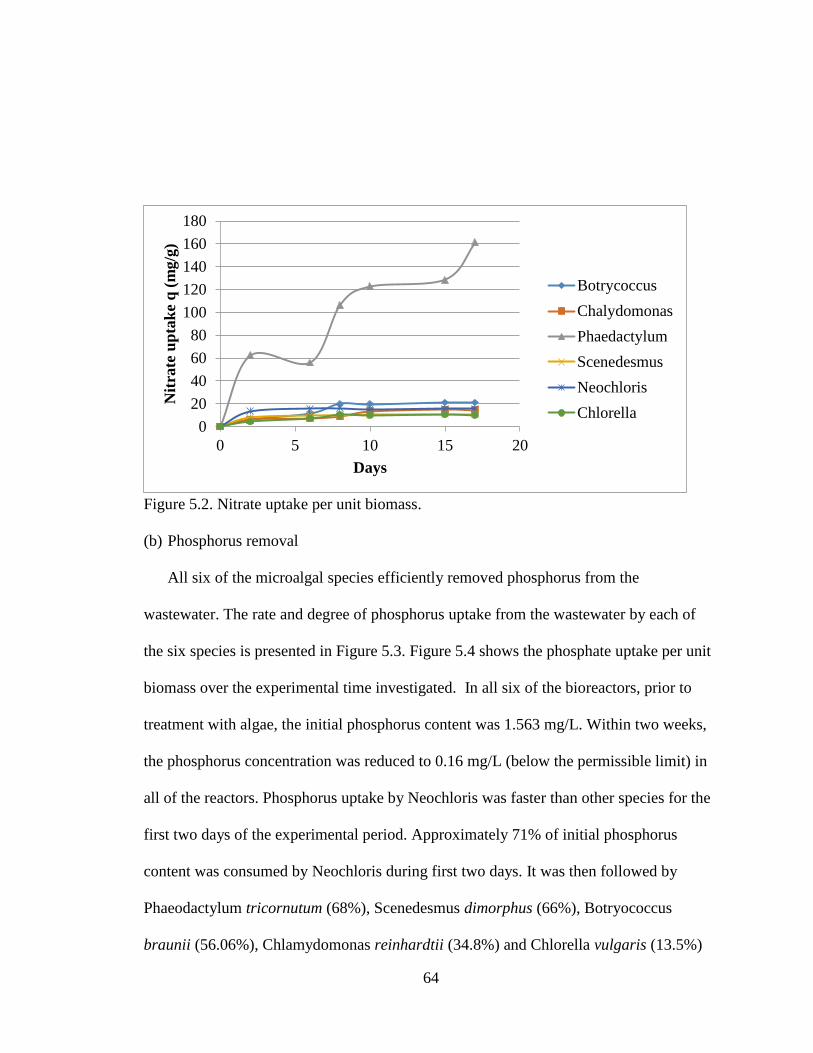
64
Figure 5.2. Nitrate uptake per unit biomass.
(b) Phosphorus removal
All six of the microalgal species efficiently removed phosphorus from the
wastewater. The rate and degree of phosphorus uptake from the wastewater by each of
the six species is presented in Figure 5.3. Figure 5.4 shows the phosphate uptake per unit
biomass over the experimental time investigated. In all six of the bioreactors, prior to
treatment with algae, the initial phosphorus content was 1.563 mg/L. Within two weeks,
the phosphorus concentration was reduced to 0.16 mg/L (below the permissible limit) in
all of the reactors. Phosphorus uptake by Neochloris was faster than other species for the
first two days of the experimental period. Approximately 71% of initial phosphorus
content was consumed by Neochloris during first two days. It was then followed by
Phaeodactylum tricornutum (68%), Scenedesmus dimorphus (66%), Botryococcus
braunii (56.06%), Chlamydomonas reinhardtii (34.8%) and Chlorella vulgaris (13.5%)
0
20
40
60
80
100
120
140
160
180
0 5 10 15 20
Nit
rate
up
tak
e q
(m
g/g
)
Days
Botrycoccus
Chalydomonas
Phaedactylum
Scenedesmus
Neochloris
Chlorella
65
during this 2-day period. Regardless of the algal specie, by the end of the two week
period 80-85% of the initial wastewater phosphorus content was removed by the algal
species in each of the reactors.
The uptake efficiency was calculated as
𝐸𝑖 =(𝐶𝑜−𝐶𝑖)
𝐶𝑜∗ 100…………………Eq.5.1
where C0 and Ci were the concentrations of contaminant at the start of experiment (day 0)
and day i, respectively.
Figure 5.3. Phosphorus removal from wastewater.
0.0
0.2
0.4
0.6
0.8
1.0
1.2
1.4
1.6
1.8
0 5 10 15 20
Ph
osp
horu
s co
nce
ntr
ati
on
(pp
m)
Days
Botrycoccus
Chalydomonas
Phaedactylum
Scenedesmus
Neochloris
Chlorella
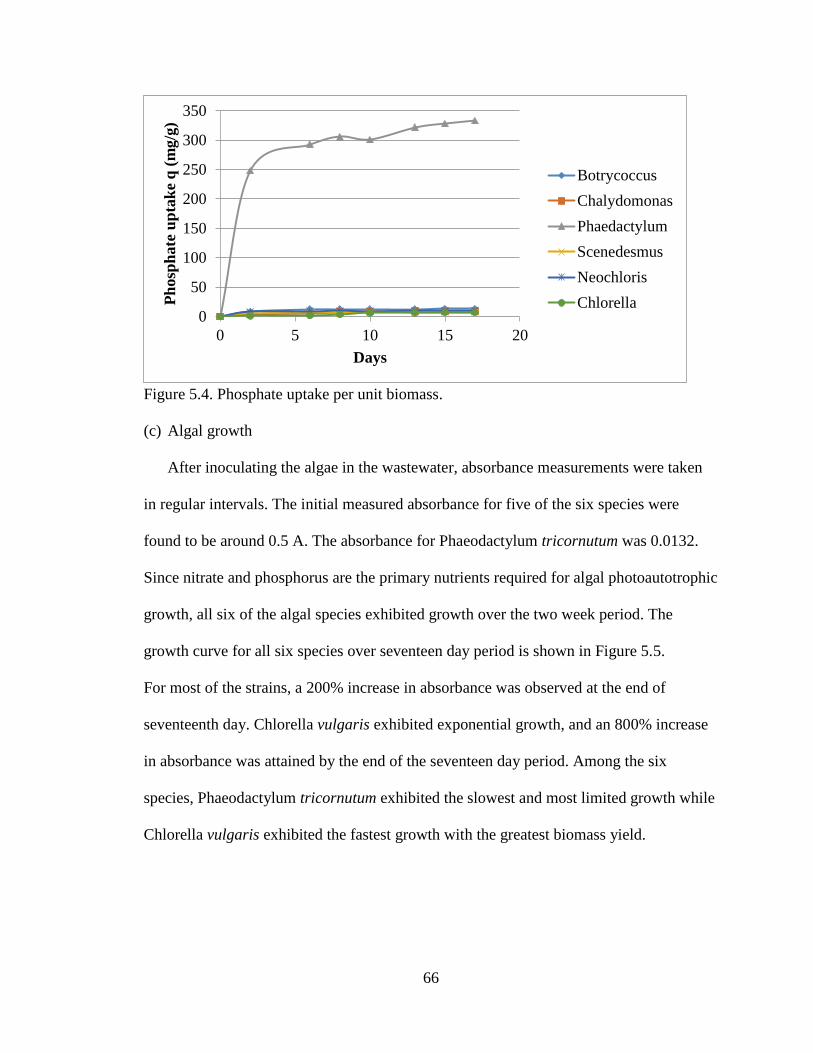
66
Figure 5.4. Phosphate uptake per unit biomass.
(c) Algal growth
After inoculating the algae in the wastewater, absorbance measurements were taken
in regular intervals. The initial measured absorbance for five of the six species were
found to be around 0.5 A. The absorbance for Phaeodactylum tricornutum was 0.0132.
Since nitrate and phosphorus are the primary nutrients required for algal photoautotrophic
growth, all six of the algal species exhibited growth over the two week period. The
growth curve for all six species over seventeen day period is shown in Figure 5.5.
For most of the strains, a 200% increase in absorbance was observed at the end of
seventeenth day. Chlorella vulgaris exhibited exponential growth, and an 800% increase
in absorbance was attained by the end of the seventeen day period. Among the six
species, Phaeodactylum tricornutum exhibited the slowest and most limited growth while
Chlorella vulgaris exhibited the fastest growth with the greatest biomass yield.
0
50
100
150
200
250
300
350
0 5 10 15 20
Ph
osp
hate
up
tak
e q
(m
g/g
)
Days
Botrycoccus
Chalydomonas
Phaedactylum
Scenedesmus
Neochloris
Chlorella
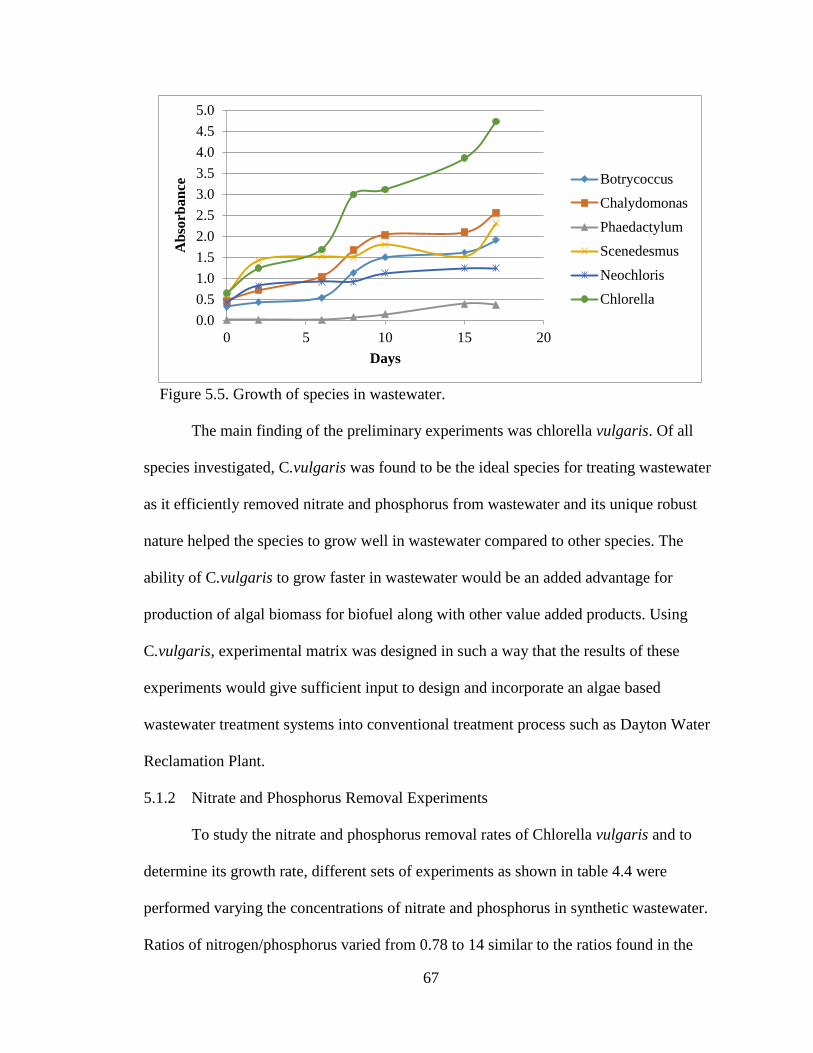
67
Figure 5.5. Growth of species in wastewater.
The main finding of the preliminary experiments was chlorella vulgaris. Of all
species investigated, C.vulgaris was found to be the ideal species for treating wastewater
as it efficiently removed nitrate and phosphorus from wastewater and its unique robust
nature helped the species to grow well in wastewater compared to other species. The
ability of C.vulgaris to grow faster in wastewater would be an added advantage for
production of algal biomass for biofuel along with other value added products. Using
C.vulgaris, experimental matrix was designed in such a way that the results of these
experiments would give sufficient input to design and incorporate an algae based
wastewater treatment systems into conventional treatment process such as Dayton Water
Reclamation Plant.
5.1.2 Nitrate and Phosphorus Removal Experiments
To study the nitrate and phosphorus removal rates of Chlorella vulgaris and to
determine its growth rate, different sets of experiments as shown in table 4.4 were
performed varying the concentrations of nitrate and phosphorus in synthetic wastewater.
Ratios of nitrogen/phosphorus varied from 0.78 to 14 similar to the ratios found in the
0.0
0.5
1.0
1.5
2.0
2.5
3.0
3.5
4.0
4.5
5.0
0 5 10 15 20
Ab
sorb
an
ce
Days
Botrycoccus
Chalydomonas
Phaedactylum
Scenedesmus
Neochloris
Chlorella
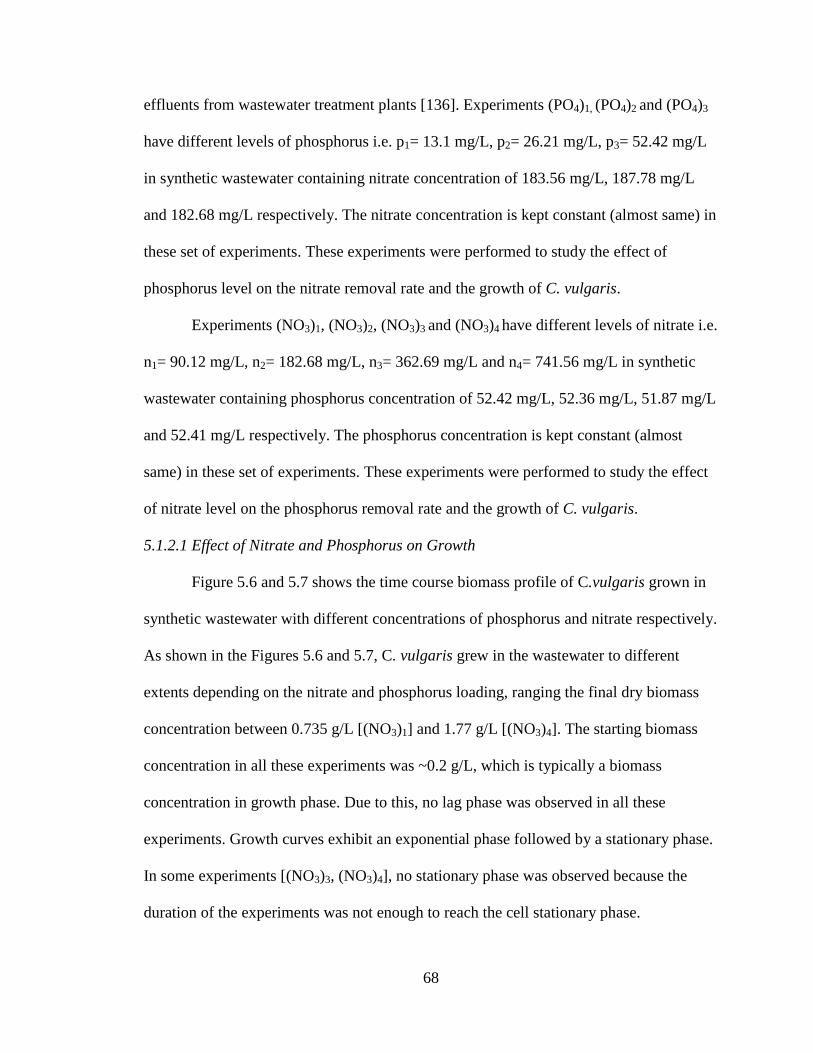
68
effluents from wastewater treatment plants [136]. Experiments (PO4)1, (PO4)2 and (PO4)3
have different levels of phosphorus i.e. p1= 13.1 mg/L, p2= 26.21 mg/L, p3= 52.42 mg/L
in synthetic wastewater containing nitrate concentration of 183.56 mg/L, 187.78 mg/L
and 182.68 mg/L respectively. The nitrate concentration is kept constant (almost same) in
these set of experiments. These experiments were performed to study the effect of
phosphorus level on the nitrate removal rate and the growth of C. vulgaris.
Experiments (NO3)1, (NO3)2, (NO3)3 and (NO3)4 have different levels of nitrate i.e.
n1= 90.12 mg/L, n2= 182.68 mg/L, n3= 362.69 mg/L and n4= 741.56 mg/L in synthetic
wastewater containing phosphorus concentration of 52.42 mg/L, 52.36 mg/L, 51.87 mg/L
and 52.41 mg/L respectively. The phosphorus concentration is kept constant (almost
same) in these set of experiments. These experiments were performed to study the effect
of nitrate level on the phosphorus removal rate and the growth of C. vulgaris.
5.1.2.1 Effect of Nitrate and Phosphorus on Growth
Figure 5.6 and 5.7 shows the time course biomass profile of C.vulgaris grown in
synthetic wastewater with different concentrations of phosphorus and nitrate respectively.
As shown in the Figures 5.6 and 5.7, C. vulgaris grew in the wastewater to different
extents depending on the nitrate and phosphorus loading, ranging the final dry biomass
concentration between 0.735 g/L [(NO3)1] and 1.77 g/L [(NO3)4]. The starting biomass
concentration in all these experiments was ~0.2 g/L, which is typically a biomass
concentration in growth phase. Due to this, no lag phase was observed in all these
experiments. Growth curves exhibit an exponential phase followed by a stationary phase.
In some experiments [(NO3)3, (NO3)4], no stationary phase was observed because the
duration of the experiments was not enough to reach the cell stationary phase.
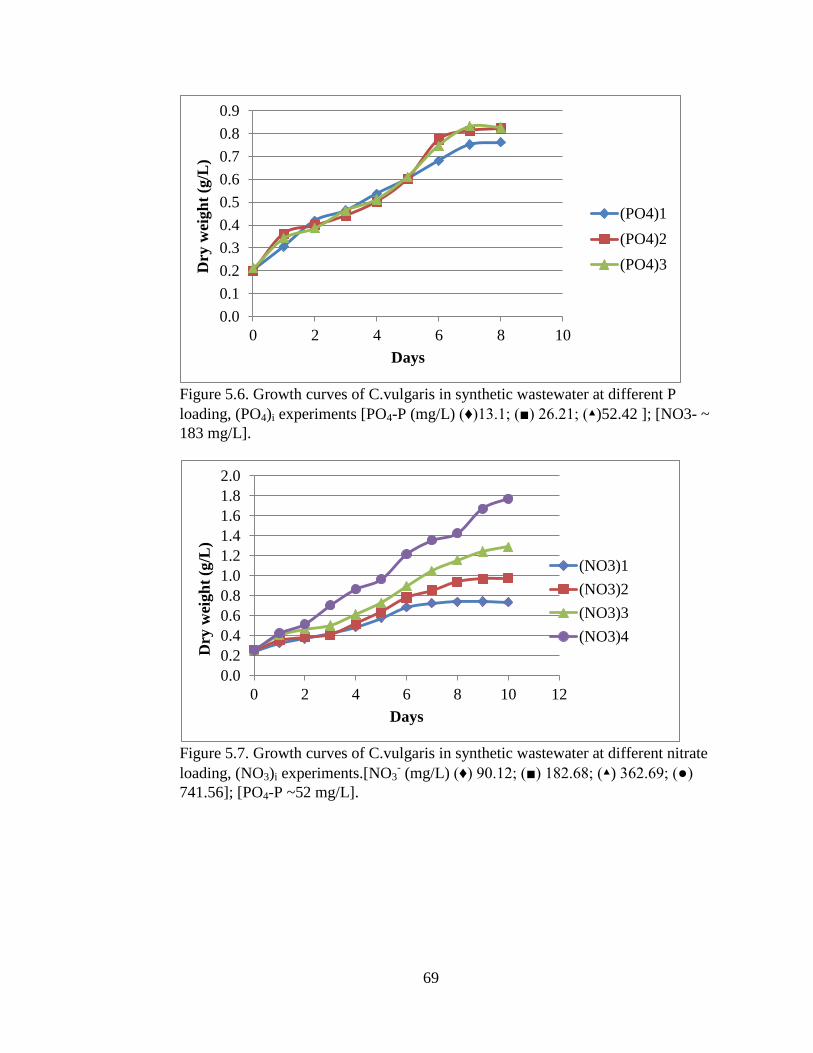
69
Figure 5.6. Growth curves of C.vulgaris in synthetic wastewater at different P
loading, (PO4)i experiments [PO4-P (mg/L) (♦)13.1; (■) 26.21; (▴)52.42 ]; [NO3- ~
183 mg/L].
Figure 5.7. Growth curves of C.vulgaris in synthetic wastewater at different nitrate
loading, (NO3)i experiments.[NO3- (mg/L) (♦) 90.12; (■) 182.68; (▴) 362.69; (●)
741.56]; [PO4-P ~52 mg/L].
0.0
0.1
0.2
0.3
0.4
0.5
0.6
0.7
0.8
0.9
0 2 4 6 8 10
Dry
wei
gh
t (g
/L)
Days
(PO4)1
(PO4)2
(PO4)3
0.0
0.2
0.4
0.6
0.8
1.0
1.2
1.4
1.6
1.8
2.0
0 2 4 6 8 10 12
Dry
wei
gh
t (g
/L)
Days
(NO3)1
(NO3)2
(NO3)3
(NO3)4
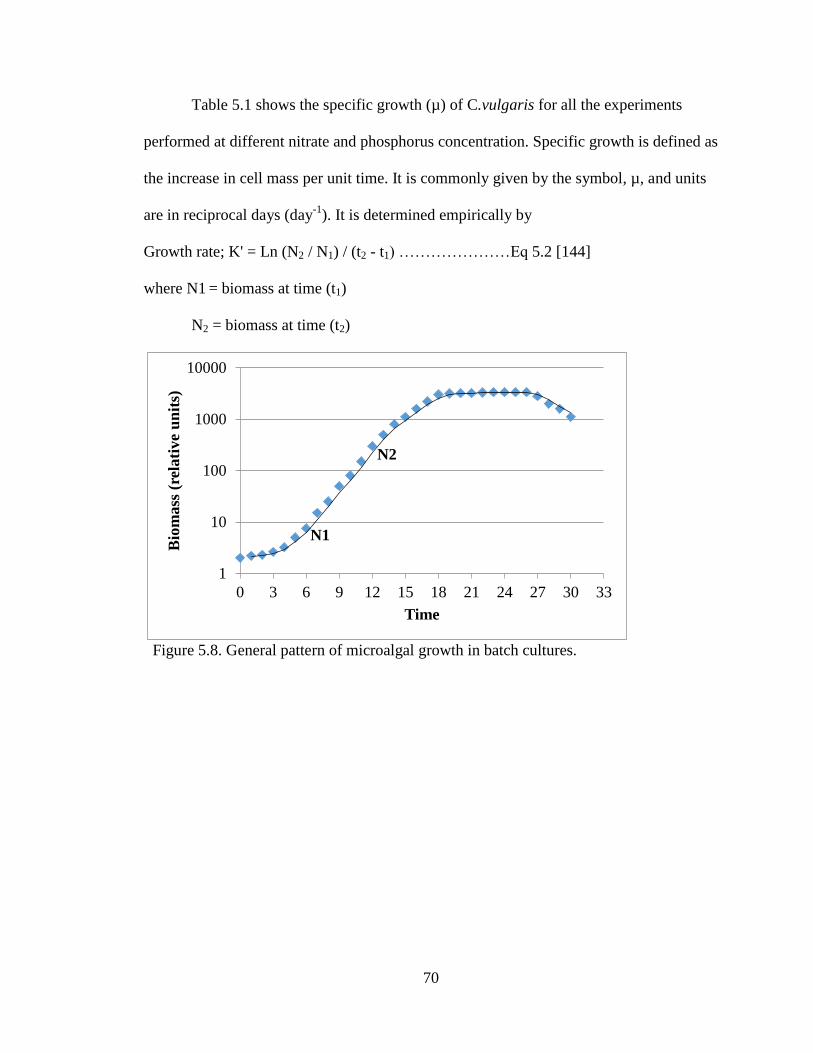
70
Table 5.1 shows the specific growth (µ) of C.vulgaris for all the experiments
performed at different nitrate and phosphorus concentration. Specific growth is defined as
the increase in cell mass per unit time. It is commonly given by the symbol, µ, and units
are in reciprocal days (day-1
). It is determined empirically by
Growth rate; K' = Ln (N2 / N1) / (t2 - t1) …………………Eq 5.2 [144]
where N1 = biomass at time (t1)
N2 = biomass at time (t2)
1
10
100
1000
10000
0 3 6 9 12 15 18 21 24 27 30 33
Bio
mass
(re
lati
ve
un
its)
Time
Figure 5.8. General pattern of microalgal growth in batch cultures.
N1
N2
71
Once the growth curve has been plotted (time on x-axis and biomass on y-axis)
careful determination of the exponential (straight line) phase of growth is needed. Two
point, N1 and N2, at the extremes of this linear phase as shown in Fig. 5.8 are taken and
substituted into the equation 5.2 [145].
Table 5.1. Specific growth rates of C.vulgaris.
Experiment Specific growth rate
(day-1
)
(PO4)1
(PO4)2
(PO4)3
(NO3)1
(NO3)2
(NO3)3
(NO3)4
0.14817
0.14742
0.1498
0.135
0.158
0.163
0.194
As regards to the set of experiments (PO4) i, where the nitrate concentration is
constant and the phosphorus concentration is varied, all growth curves are very similar
(Figure 5.6). Table 5.1 shows that the regardless of the phosphorus level in the media, the
specific growth rate of C.vulgaris was similar in all three experiments indicating that
levels of phosphorus in the media does not impact the algae growth. This observation was
supported by B. Tubea et al. (1981) who found that different levels of P resulted in no
72
significant differences in algal growth [146]. Michael DiLorenzo (2007) also reported
that phosphorus levels does not the affect micro- and macro algae growth on coral reefs
[147].
Similarly Figure 5.7 and Table 5.1 show that the growth rate of algae increased
with the increase in the nitrate concentration in the media. It can be seen from the Table
5.1 there is almost 1.5 fold increase in specific growth rate when nitrate concentration
increased was from 90.12 ppm ((NO3)1) to 741.56 ppm ((NO3)4). This indicates that the
initial nitrate content present in the media significantly affect the growth of algae. This
result was supported by the results reported by many researchers who have performed
experiments to investigate the effect of nitrate on biomass production. Chittra and
Benjamas (2011) reported a decrease in biomass when Botrycoccus spp. was exposed to
nitrogen deficient conditions [148]. Hanhua and Gao have also reported decreased growth
pattern in Nannochloropsis sp, under nitrogen deficient conditions [149]. On contrary, the
results of our study were contradicted by Pietilainen and Niinioja (2001), who found that
initial nitrate levels had no significant effect on algal growth. However, their samples
were exposed to a light and dark cycle ratio of 15:9 whereas our samples experienced
twenty four hours of light each day [150].
5.1.2.2 Effect of Initial Phosphorus Concentration on Nitrate Removal
The variation of nitrate and phosphorus concentrations with time for 8 days of
batch operation for (PO4)i set of experiments is shown in Figures 5.9 and 5.10
respectively. The experimental data of the set of experiments (PO4)i confirm the
hypothesis discussed previously about the algae growth dependency on nitrate and
phosphorus concentration. Phosphorus concentration hardly changed in the wastewater
73
during the tests (PO4)i, while nitrate was completely removed from the synthetic
wastewater in 7 days in all three experiments [(PO4)1, (PO4)2 and (PO4)3]. Regardless of
the initial phosphorus concentration in the media, removal rate of nitrate appears to be
identical and 80% of nitrate content was removed within first 5 days of the experiment
indicating that initial phosphorus content has no impact in removing nitrates from
wastewater. A total amount of ~182 mg/L of nitrate was removed in all three experiments
in 8 days by C.vulgaris having an initial biomass concentration of ~0.2 g/L. However, the
phosphorus efficiency was around 29% for (PO4)1 and (PO4)2 experiments and 62% for
(PO4)3 experiment. A total amount of 8.14,7.65 and 14.16 mg/L of phosphorus was
removed from (PO4)1, (PO4)2 experiments and (PO4)3 experiments respectively. From this
study it was found that C.vulgaris can only remove less amount of phosphorus from
wastewater. Low removal of phosphorus was also observed in another green alga
Botryococcus braunii. A study conducted by Sawayama et al., (1992) on the growth of B.
braunii in secondarily treated piggery wastewater showed that the species B. braunii
could remove only 0.29 ppm of phosphorus in 5 days [151]. This is because green algae
species like C. vulgaris are capable of absorbing phosphorus only to a limited extent. The
absorbed phosphorus is usually stored as polyphosphate granules and will be available for
the growth cycle of algae. The growth rate of algae may therefore not respond at once to
changes in the external concentration of phosphorus. Our total phosphorus removal rate
was higher than that of Sreesai and Pakpain (2007), who reported a removal of
approximately 6 ppm of total phosphorus from septage effluent wastewater by Chlorella
vulgaris [152].
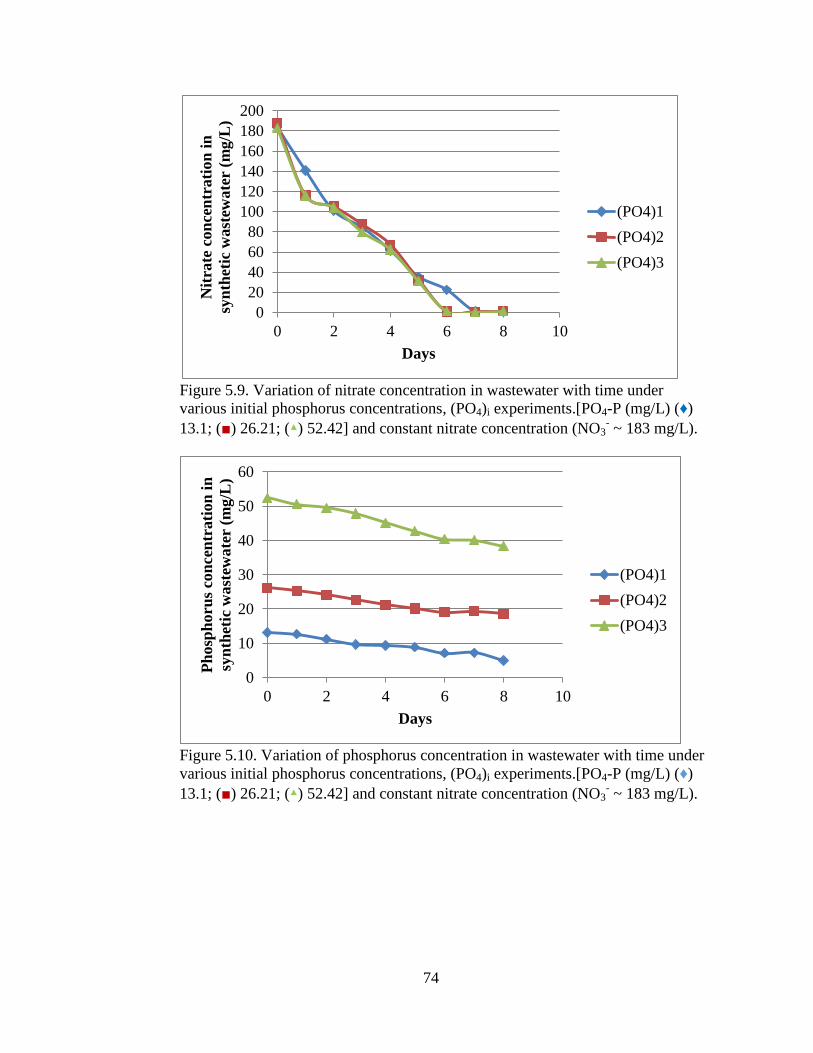
74
Figure 5.9. Variation of nitrate concentration in wastewater with time under
various initial phosphorus concentrations, (PO4)i experiments.[PO4-P (mg/L) (♦)
13.1; (■) 26.21; (▴) 52.42] and constant nitrate concentration (NO3- ~ 183 mg/L).
Figure 5.10. Variation of phosphorus concentration in wastewater with time under
various initial phosphorus concentrations, (PO4)i experiments.[PO4-P (mg/L) (♦)
13.1; (■) 26.21; (▴) 52.42] and constant nitrate concentration (NO3- ~ 183 mg/L).
0
20
40
60
80
100
120
140
160
180
200
0 2 4 6 8 10
Nit
rate
con
cen
trati
on
in
syn
thet
ic w
ast
ewate
r (m
g/L
)
Days
(PO4)1
(PO4)2
(PO4)3
0
10
20
30
40
50
60
0 2 4 6 8 10
Ph
osp
horu
s co
nce
ntr
ati
on
in
syn
thet
ic w
ast
ewate
r (m
g/L
)
Days
(PO4)1
(PO4)2
(PO4)3
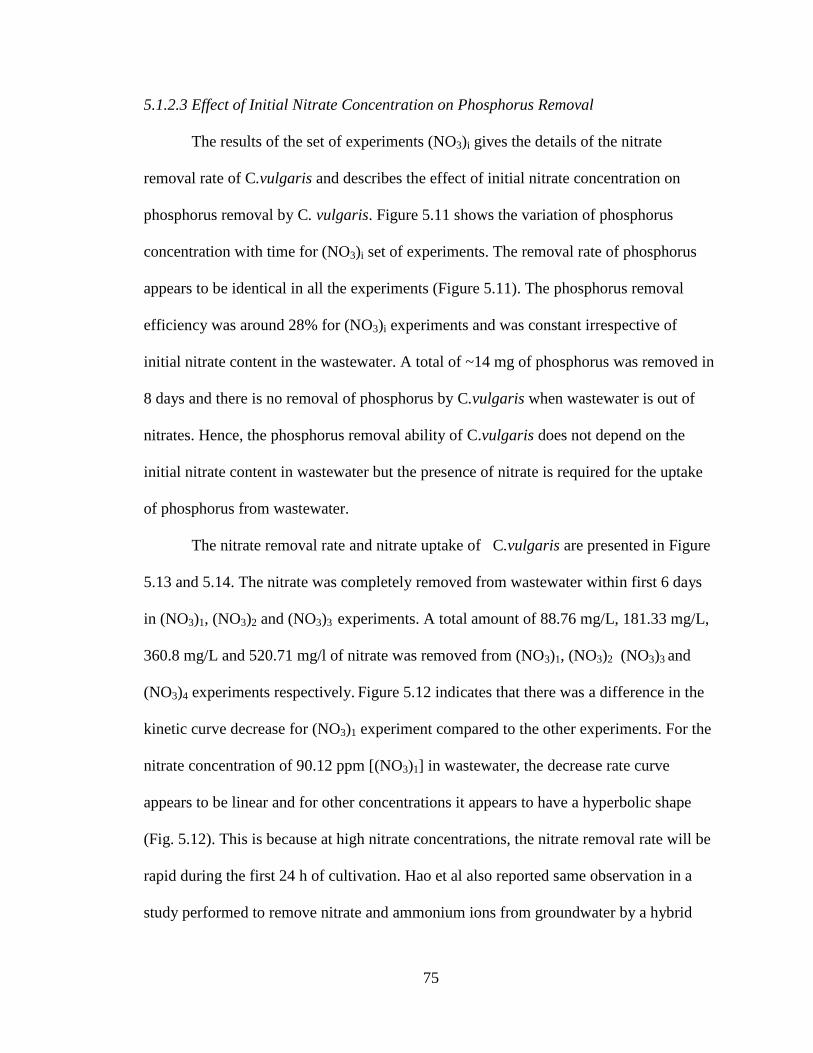
75
5.1.2.3 Effect of Initial Nitrate Concentration on Phosphorus Removal
The results of the set of experiments (NO3)i gives the details of the nitrate
removal rate of C.vulgaris and describes the effect of initial nitrate concentration on
phosphorus removal by C. vulgaris. Figure 5.11 shows the variation of phosphorus
concentration with time for (NO3)i set of experiments. The removal rate of phosphorus
appears to be identical in all the experiments (Figure 5.11). The phosphorus removal
efficiency was around 28% for (NO3)i experiments and was constant irrespective of
initial nitrate content in the wastewater. A total of ~14 mg of phosphorus was removed in
8 days and there is no removal of phosphorus by C.vulgaris when wastewater is out of
nitrates. Hence, the phosphorus removal ability of C.vulgaris does not depend on the
initial nitrate content in wastewater but the presence of nitrate is required for the uptake
of phosphorus from wastewater.
The nitrate removal rate and nitrate uptake of C.vulgaris are presented in Figure
5.13 and 5.14. The nitrate was completely removed from wastewater within first 6 days
in (NO3)1, (NO3)2 and (NO3)3 experiments. A total amount of 88.76 mg/L, 181.33 mg/L,
360.8 mg/L and 520.71 mg/l of nitrate was removed from (NO3)1, (NO3)2 (NO3)3 and
(NO3)4 experiments respectively. Figure 5.12 indicates that there was a difference in the
kinetic curve decrease for (NO3)1 experiment compared to the other experiments. For the
nitrate concentration of 90.12 ppm [(NO3)1] in wastewater, the decrease rate curve
appears to be linear and for other concentrations it appears to have a hyperbolic shape
(Fig. 5.12). This is because at high nitrate concentrations, the nitrate removal rate will be
rapid during the first 24 h of cultivation. Hao et al also reported same observation in a
study performed to remove nitrate and ammonium ions from groundwater by a hybrid
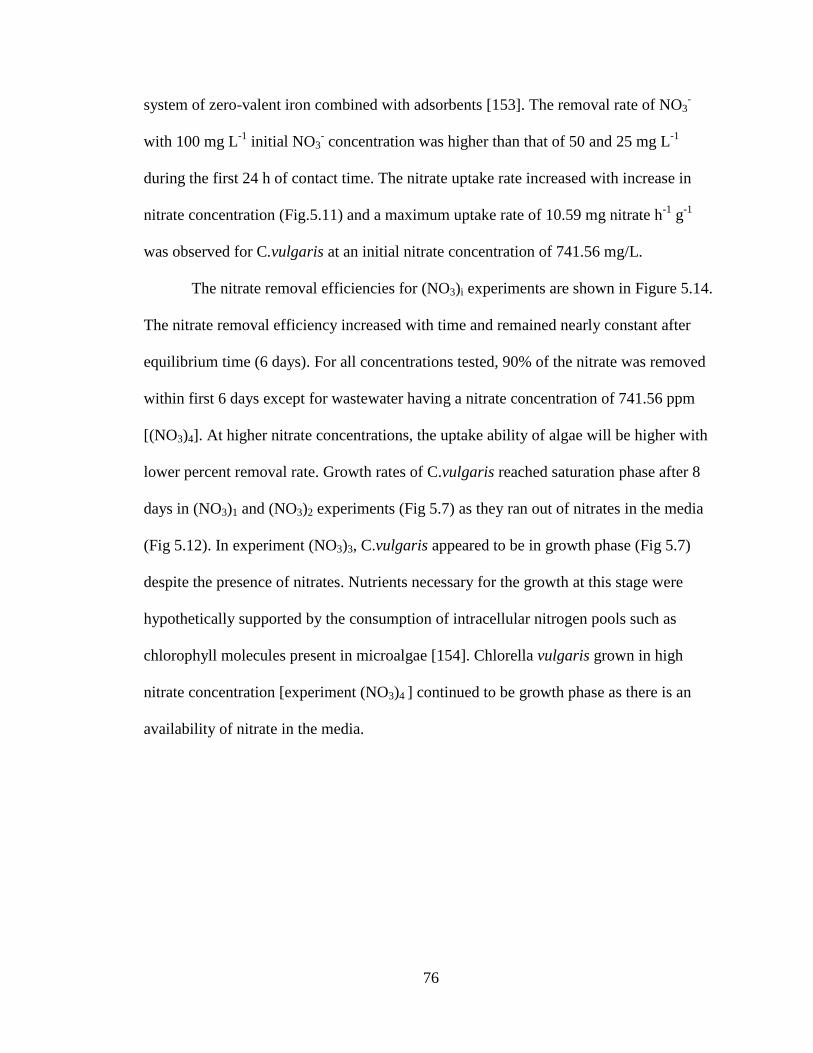
76
system of zero-valent iron combined with adsorbents [153]. The removal rate of NO3-
with 100 mg L-1
initial NO3- concentration was higher than that of 50 and 25 mg L
-1
during the first 24 h of contact time. The nitrate uptake rate increased with increase in
nitrate concentration (Fig.5.11) and a maximum uptake rate of 10.59 mg nitrate h-1
g-1
was observed for C.vulgaris at an initial nitrate concentration of 741.56 mg/L.
The nitrate removal efficiencies for (NO3)i experiments are shown in Figure 5.14.
The nitrate removal efficiency increased with time and remained nearly constant after
equilibrium time (6 days). For all concentrations tested, 90% of the nitrate was removed
within first 6 days except for wastewater having a nitrate concentration of 741.56 ppm
[(NO3)4]. At higher nitrate concentrations, the uptake ability of algae will be higher with
lower percent removal rate. Growth rates of C.vulgaris reached saturation phase after 8
days in (NO3)1 and (NO3)2 experiments (Fig 5.7) as they ran out of nitrates in the media
(Fig 5.12). In experiment (NO3)3, C.vulgaris appeared to be in growth phase (Fig 5.7)
despite the presence of nitrates. Nutrients necessary for the growth at this stage were
hypothetically supported by the consumption of intracellular nitrogen pools such as
chlorophyll molecules present in microalgae [154]. Chlorella vulgaris grown in high
nitrate concentration [experiment (NO3)4 ] continued to be growth phase as there is an
availability of nitrate in the media.
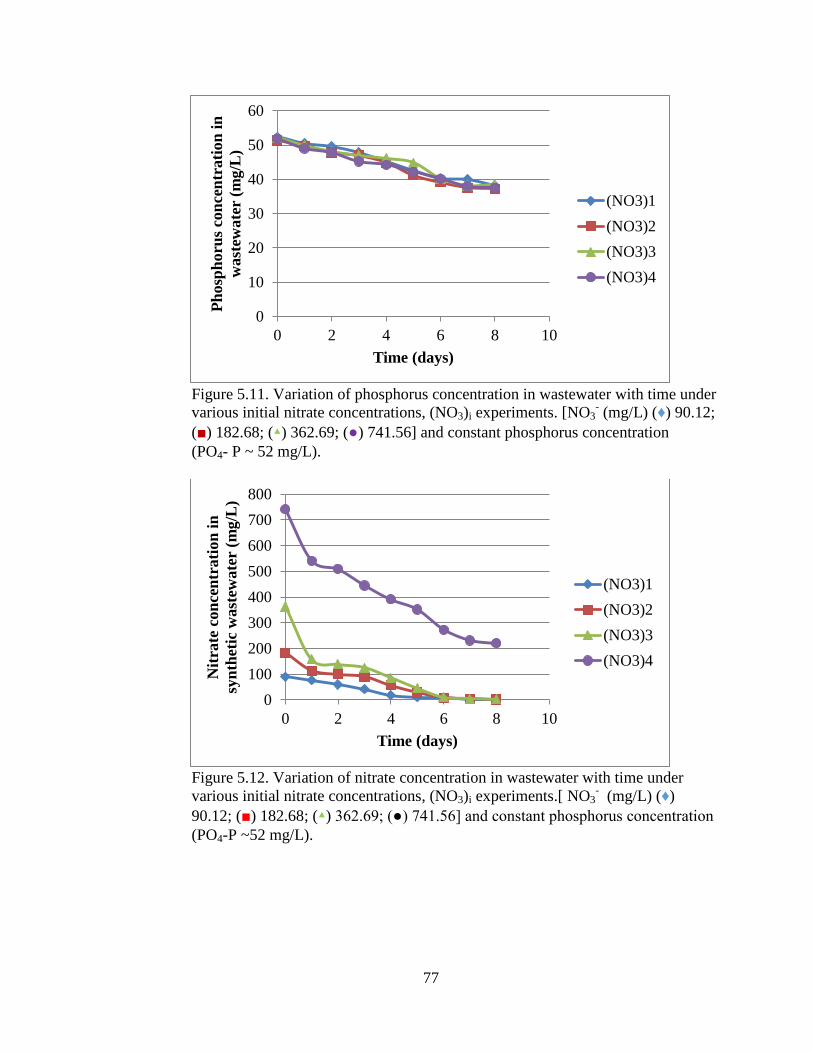
77
Figure 5.11. Variation of phosphorus concentration in wastewater with time under
various initial nitrate concentrations, (NO3)i experiments. [NO3- (mg/L) (♦) 90.12;
(■) 182.68; (▴) 362.69; (●) 741.56] and constant phosphorus concentration
(PO4- P ~ 52 mg/L).
Figure 5.12. Variation of nitrate concentration in wastewater with time under
various initial nitrate concentrations, (NO3)i experiments.[ NO3- (mg/L) (♦)
90.12; (■) 182.68; (▴) 362.69; (●) 741.56] and constant phosphorus concentration
(PO4-P ~52 mg/L).
0
10
20
30
40
50
60
0 2 4 6 8 10
Ph
osp
horu
s co
nce
ntr
ati
on
in
wast
ewate
r (m
g/L
)
Time (days)
(NO3)1
(NO3)2
(NO3)3
(NO3)4
0
100
200
300
400
500
600
700
800
0 2 4 6 8 10
Nit
rate
con
cen
trati
on
in
syn
thet
ic w
ast
ewate
r (m
g/L
)
Time (days)
(NO3)1
(NO3)2
(NO3)3
(NO3)4
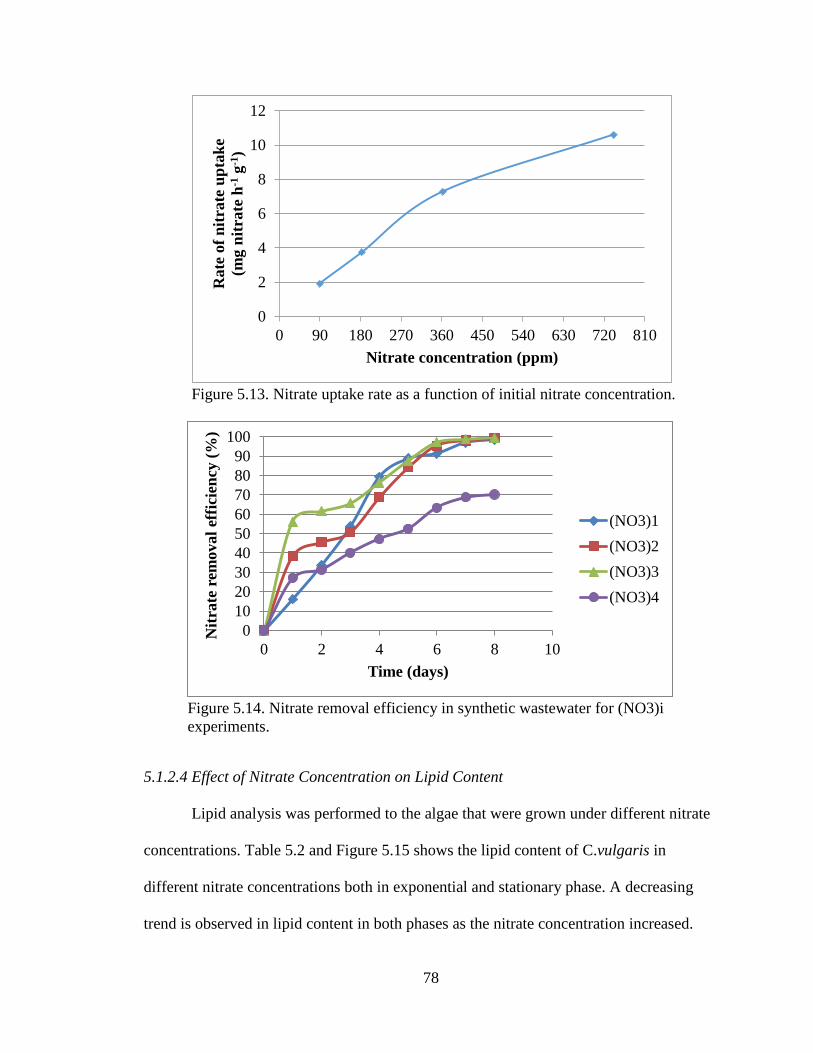
78
Figure 5.13. Nitrate uptake rate as a function of initial nitrate concentration.
Figure 5.14. Nitrate removal efficiency in synthetic wastewater for (NO3)i
experiments.
5.1.2.4 Effect of Nitrate Concentration on Lipid Content
Lipid analysis was performed to the algae that were grown under different nitrate
concentrations. Table 5.2 and Figure 5.15 shows the lipid content of C.vulgaris in
different nitrate concentrations both in exponential and stationary phase. A decreasing
trend is observed in lipid content in both phases as the nitrate concentration increased.
0
2
4
6
8
10
12
0 90 180 270 360 450 540 630 720 810
Ra
te o
f n
itra
te u
pta
ke
(mg n
itra
te h
-1 g
-1)
Nitrate concentration (ppm)
0
10
20
30
40
50
60
70
80
90
100
0 2 4 6 8 10
Nit
rate
rem
oval
effi
cien
cy (
%)
Time (days)
(NO3)1
(NO3)2
(NO3)3
(NO3)4
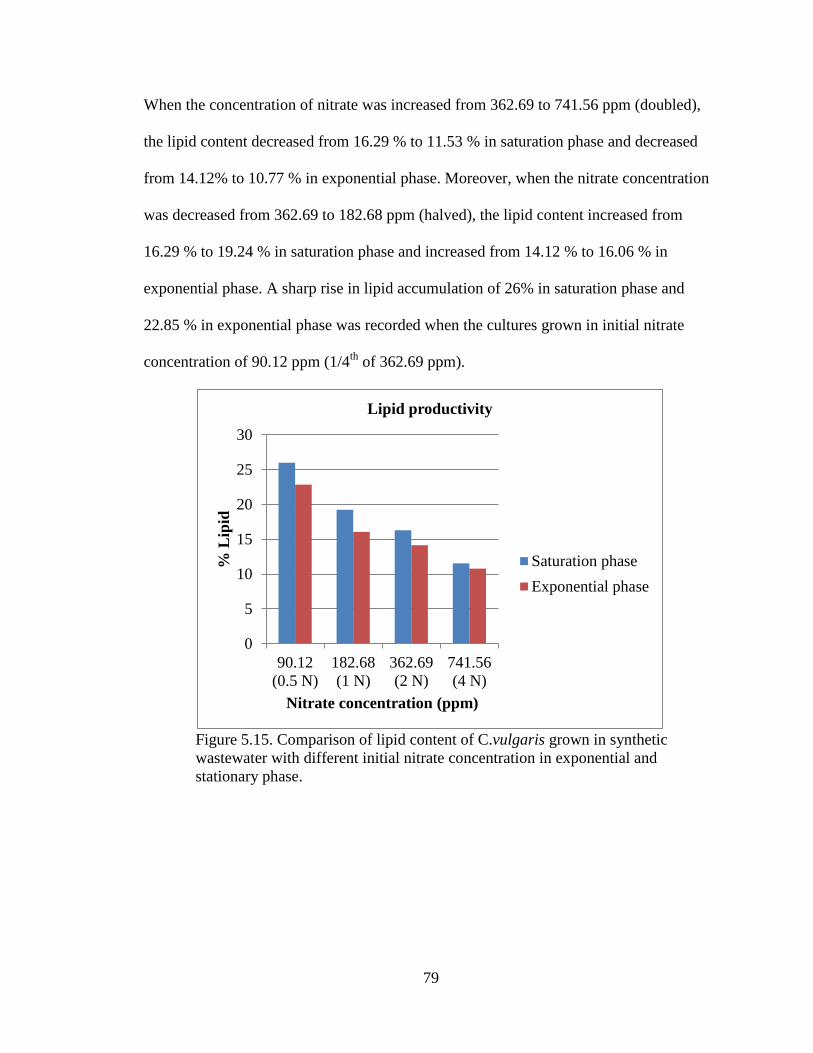
79
When the concentration of nitrate was increased from 362.69 to 741.56 ppm (doubled),
the lipid content decreased from 16.29 % to 11.53 % in saturation phase and decreased
from 14.12% to 10.77 % in exponential phase. Moreover, when the nitrate concentration
was decreased from 362.69 to 182.68 ppm (halved), the lipid content increased from
16.29 % to 19.24 % in saturation phase and increased from 14.12 % to 16.06 % in
exponential phase. A sharp rise in lipid accumulation of 26% in saturation phase and
22.85 % in exponential phase was recorded when the cultures grown in initial nitrate
concentration of 90.12 ppm (1/4th
of 362.69 ppm).
Figure 5.15. Comparison of lipid content of C.vulgaris grown in synthetic
wastewater with different initial nitrate concentration in exponential and
stationary phase.
0
5
10
15
20
25
30
90.12
(0.5 N)
182.68
(1 N)
362.69
(2 N)
741.56
(4 N)
% L
ipid
Nitrate concentration (ppm)
Lipid productivity
Saturation phase
Exponential phase
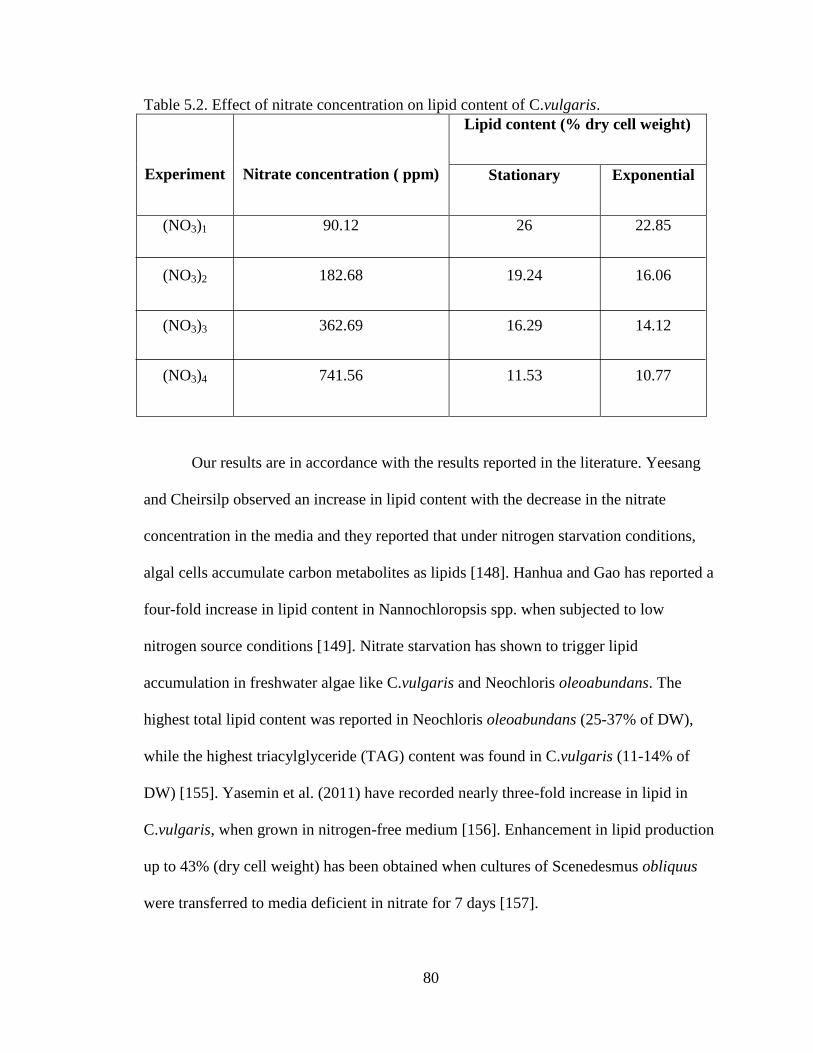
80
Table 5.2. Effect of nitrate concentration on lipid content of C.vulgaris.
Experiment
Nitrate concentration ( ppm)
Lipid content (% dry cell weight)
Stationary Exponential
(NO3)1
(NO3)2
(NO3)3
(NO3)4
90.12
182.68
362.69
741.56
26
19.24
16.29
11.53
22.85
16.06
14.12
10.77
Our results are in accordance with the results reported in the literature. Yeesang
and Cheirsilp observed an increase in lipid content with the decrease in the nitrate
concentration in the media and they reported that under nitrogen starvation conditions,
algal cells accumulate carbon metabolites as lipids [148]. Hanhua and Gao has reported a
four-fold increase in lipid content in Nannochloropsis spp. when subjected to low
nitrogen source conditions [149]. Nitrate starvation has shown to trigger lipid
accumulation in freshwater algae like C.vulgaris and Neochloris oleoabundans. The
highest total lipid content was reported in Neochloris oleoabundans (25-37% of DW),
while the highest triacylglyceride (TAG) content was found in C.vulgaris (11-14% of
DW) [155]. Yasemin et al. (2011) have recorded nearly three-fold increase in lipid in
C.vulgaris, when grown in nitrogen-free medium [156]. Enhancement in lipid production
up to 43% (dry cell weight) has been obtained when cultures of Scenedesmus obliquus
were transferred to media deficient in nitrate for 7 days [157].
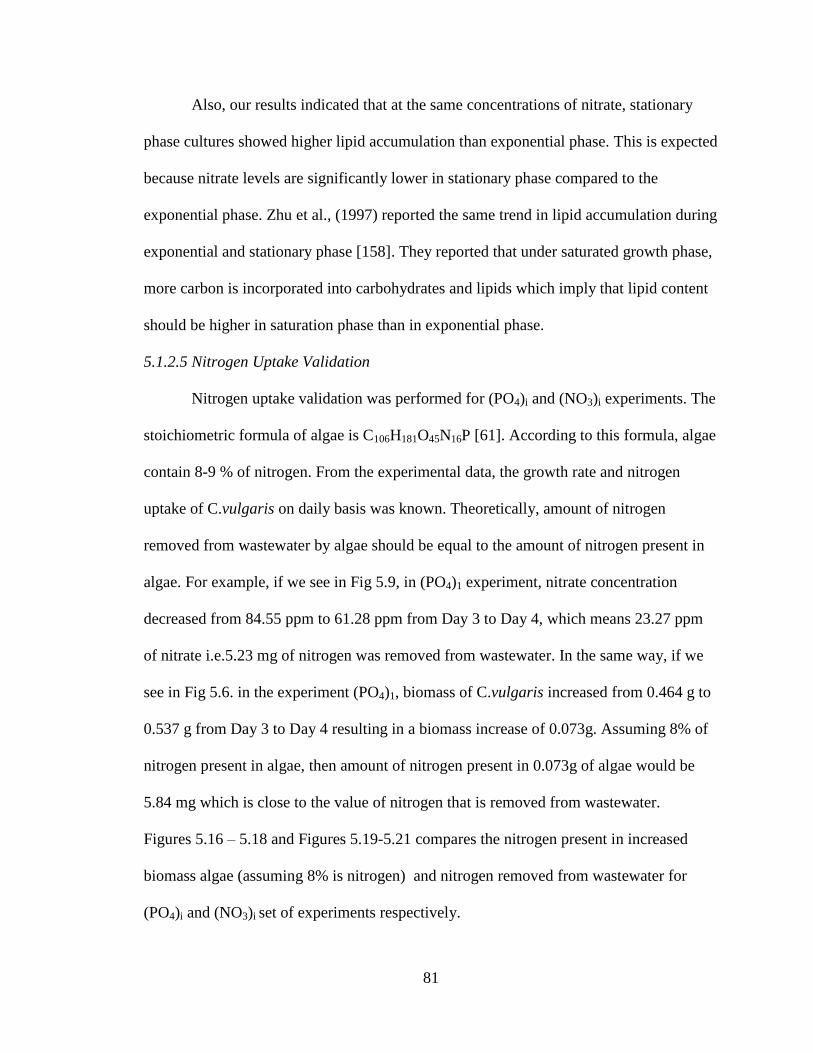
81
Also, our results indicated that at the same concentrations of nitrate, stationary
phase cultures showed higher lipid accumulation than exponential phase. This is expected
because nitrate levels are significantly lower in stationary phase compared to the
exponential phase. Zhu et al., (1997) reported the same trend in lipid accumulation during
exponential and stationary phase [158]. They reported that under saturated growth phase,
more carbon is incorporated into carbohydrates and lipids which imply that lipid content
should be higher in saturation phase than in exponential phase.
5.1.2.5 Nitrogen Uptake Validation
Nitrogen uptake validation was performed for (PO4)i and (NO3)i experiments. The
stoichiometric formula of algae is C106H181O45N16P [61]. According to this formula, algae
contain 8-9 % of nitrogen. From the experimental data, the growth rate and nitrogen
uptake of C.vulgaris on daily basis was known. Theoretically, amount of nitrogen
removed from wastewater by algae should be equal to the amount of nitrogen present in
algae. For example, if we see in Fig 5.9, in (PO4)1 experiment, nitrate concentration
decreased from 84.55 ppm to 61.28 ppm from Day 3 to Day 4, which means 23.27 ppm
of nitrate i.e.5.23 mg of nitrogen was removed from wastewater. In the same way, if we
see in Fig 5.6. in the experiment (PO4)1, biomass of C.vulgaris increased from 0.464 g to
0.537 g from Day 3 to Day 4 resulting in a biomass increase of 0.073g. Assuming 8% of
nitrogen present in algae, then amount of nitrogen present in 0.073g of algae would be
5.84 mg which is close to the value of nitrogen that is removed from wastewater.
Figures 5.16 – 5.18 and Figures 5.19-5.21 compares the nitrogen present in increased
biomass algae (assuming 8% is nitrogen) and nitrogen removed from wastewater for
(PO4)i and (NO3)i set of experiments respectively.
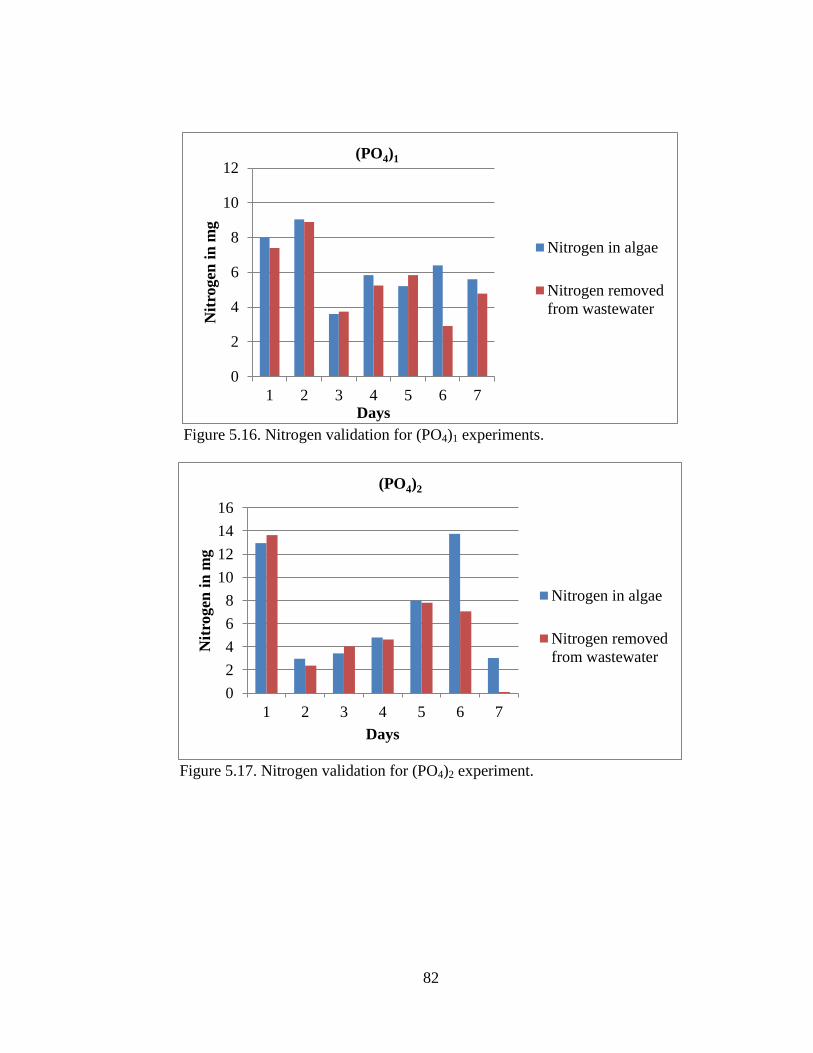
82
Figure 5.16. Nitrogen validation for (PO4)1 experiments.
Figure 5.17. Nitrogen validation for (PO4)2 experiment.
0
2
4
6
8
10
12
1 2 3 4 5 6 7
Nit
rogen
in
mg
Days
(PO4)1
Nitrogen in algae
Nitrogen removed
from wastewater
0
2
4
6
8
10
12
14
16
1 2 3 4 5 6 7
Nit
rogen
in
mg
Days
(PO4)2
Nitrogen in algae
Nitrogen removed
from wastewater
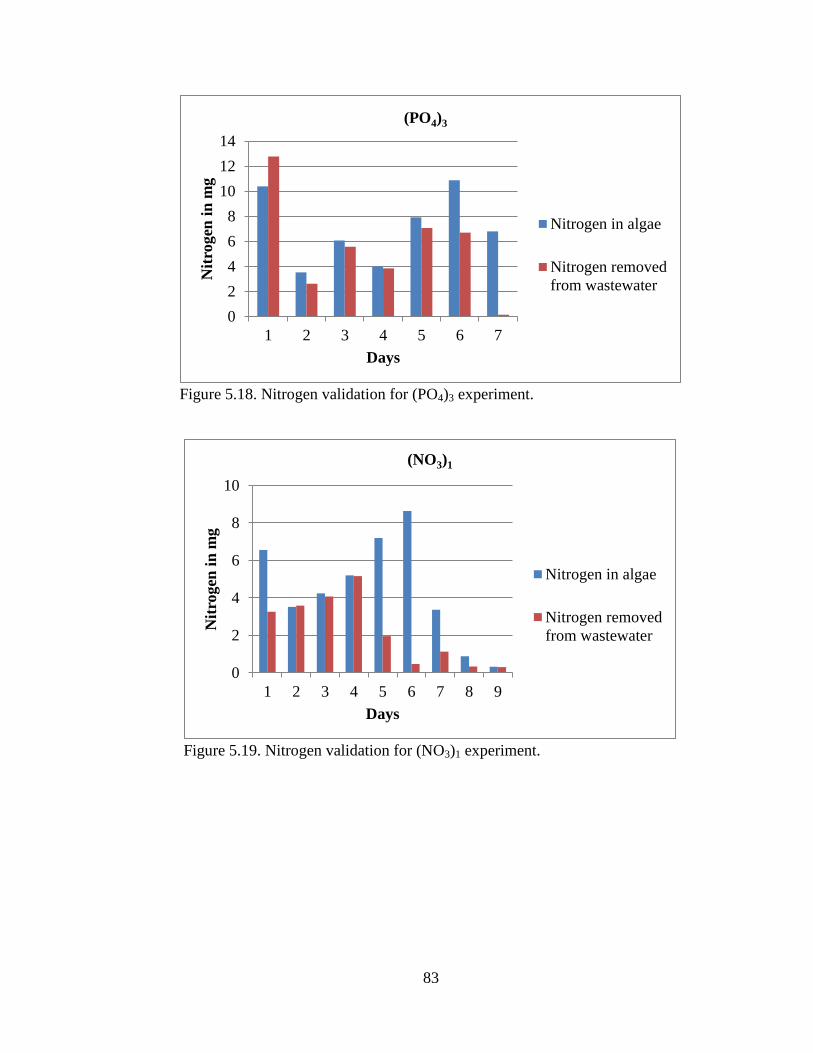
83
Figure 5.18. Nitrogen validation for (PO4)3 experiment.
Figure 5.19. Nitrogen validation for (NO3)1 experiment.
0
2
4
6
8
10
12
14
1 2 3 4 5 6 7
Nit
rog
en i
n m
g
Days
(PO4)3
Nitrogen in algae
Nitrogen removed
from wastewater
0
2
4
6
8
10
1 2 3 4 5 6 7 8 9
Nit
rogen
in
mg
Days
(NO3)1
Nitrogen in algae
Nitrogen removed
from wastewater
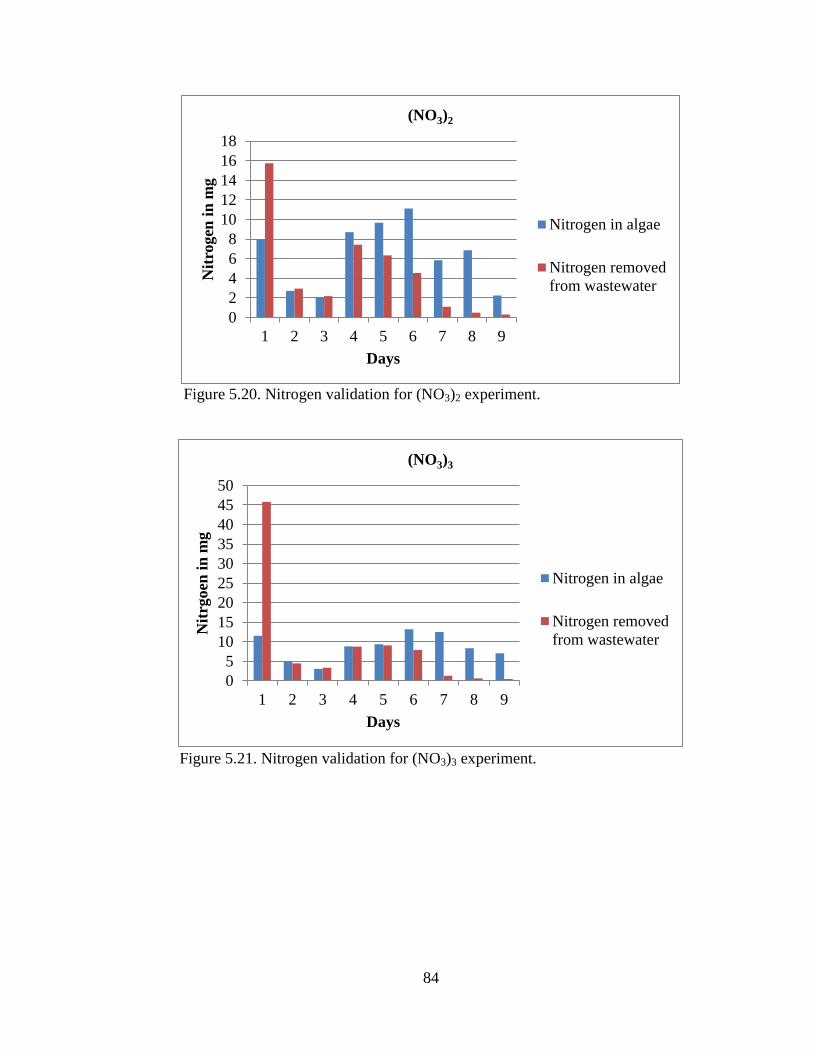
84
Figure 5.20. Nitrogen validation for (NO3)2 experiment.
Figure 5.21. Nitrogen validation for (NO3)3 experiment.
0
2
4
6
8
10
12
14
16
18
1 2 3 4 5 6 7 8 9
Nit
rogen
in
mg
Days
(NO3)2
Nitrogen in algae
Nitrogen removed
from wastewater
0
5
10
15
20
25
30
35
40
45
50
1 2 3 4 5 6 7 8 9
Nit
rgoen
in
mg
Days
(NO3)3
Nitrogen in algae
Nitrogen removed
from wastewater
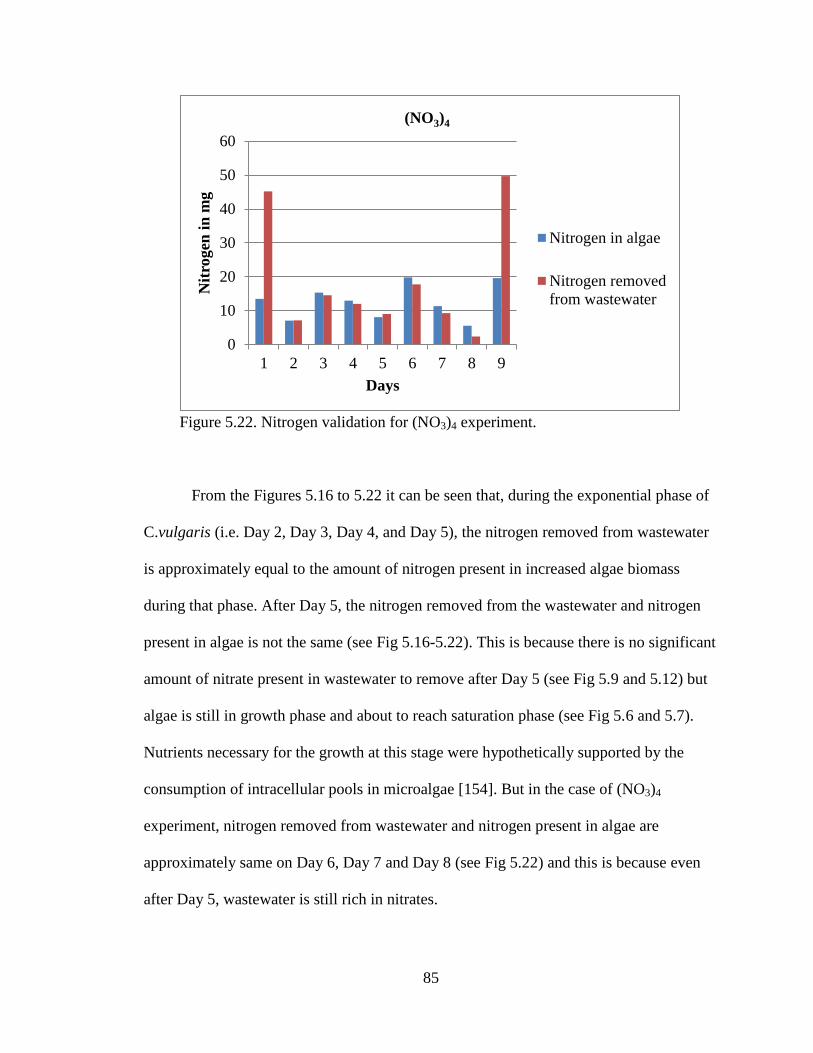
85
Figure 5.22. Nitrogen validation for (NO3)4 experiment.
From the Figures 5.16 to 5.22 it can be seen that, during the exponential phase of
C.vulgaris (i.e. Day 2, Day 3, Day 4, and Day 5), the nitrogen removed from wastewater
is approximately equal to the amount of nitrogen present in increased algae biomass
during that phase. After Day 5, the nitrogen removed from the wastewater and nitrogen
present in algae is not the same (see Fig 5.16-5.22). This is because there is no significant
amount of nitrate present in wastewater to remove after Day 5 (see Fig 5.9 and 5.12) but
algae is still in growth phase and about to reach saturation phase (see Fig 5.6 and 5.7).
Nutrients necessary for the growth at this stage were hypothetically supported by the
consumption of intracellular pools in microalgae [154]. But in the case of (NO3)4
experiment, nitrogen removed from wastewater and nitrogen present in algae are
approximately same on Day 6, Day 7 and Day 8 (see Fig 5.22) and this is because even
after Day 5, wastewater is still rich in nitrates.
0
10
20
30
40
50
60
1 2 3 4 5 6 7 8 9
Nit
rogen
in
mg
Days
(NO3)4
Nitrogen in algae
Nitrogen removed
from wastewater
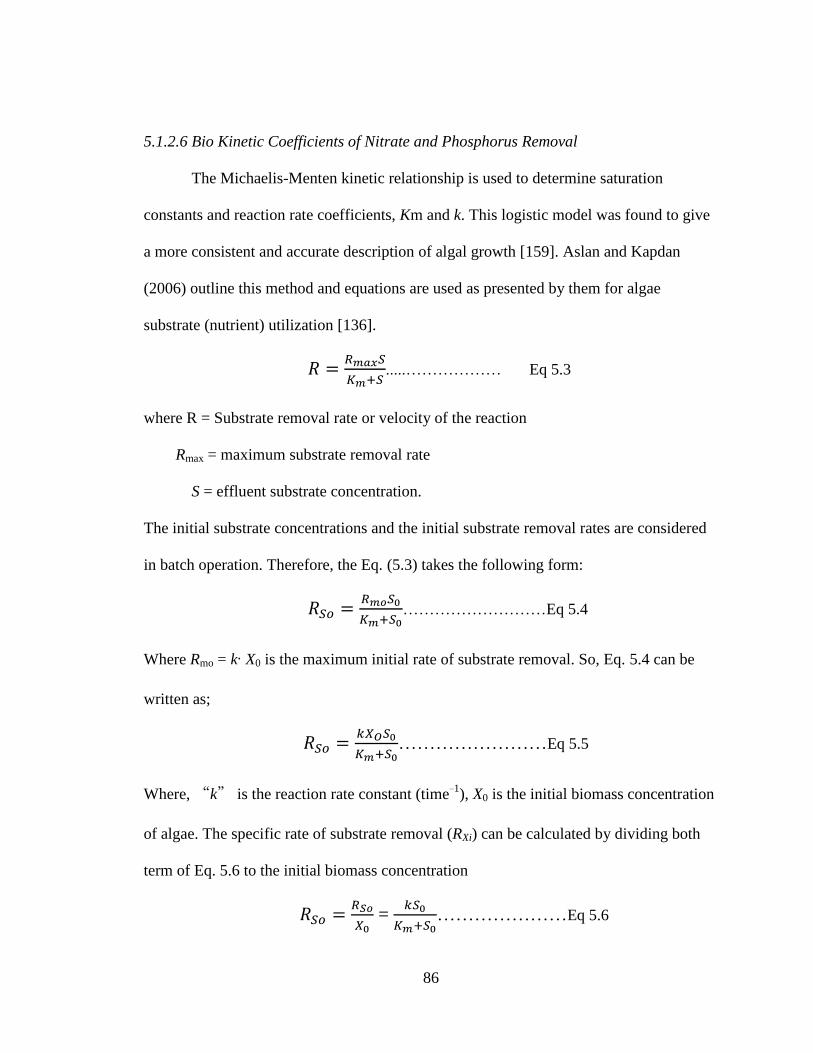
86
5.1.2.6 Bio Kinetic Coefficients of Nitrate and Phosphorus Removal
The Michaelis-Menten kinetic relationship is used to determine saturation
constants and reaction rate coefficients, Km and k. This logistic model was found to give
a more consistent and accurate description of algal growth [159]. Aslan and Kapdan
(2006) outline this method and equations are used as presented by them for algae
substrate (nutrient) utilization [136].
𝑅 =𝑅𝑚𝑎𝑥𝑆
𝐾𝑚+𝑆.....……………… Eq 5.3
where R = Substrate removal rate or velocity of the reaction
Rmax = maximum substrate removal rate
S = effluent substrate concentration.
The initial substrate concentrations and the initial substrate removal rates are considered
in batch operation. Therefore, the Eq. (5.3) takes the following form:
𝑅𝑆𝑜 =𝑅𝑚𝑜𝑆0
𝐾𝑚+𝑆0………………………Eq 5.4
Where Rmo = k·X0 is the maximum initial rate of substrate removal. So, Eq. 5.4 can be
written as;
𝑅𝑆𝑜 =𝑘𝑋𝑂𝑆0
𝐾𝑚+𝑆0……………………Eq 5.5
Where, “k” is the reaction rate constant (time−1), X0 is the initial biomass concentration
of algae. The specific rate of substrate removal (RXi) can be calculated by dividing both
term of Eq. 5.6 to the initial biomass concentration
𝑅𝑆𝑜 =𝑅𝑆𝑜
𝑋0 =
𝑘𝑆0
𝐾𝑚+𝑆0…………………Eq 5.6
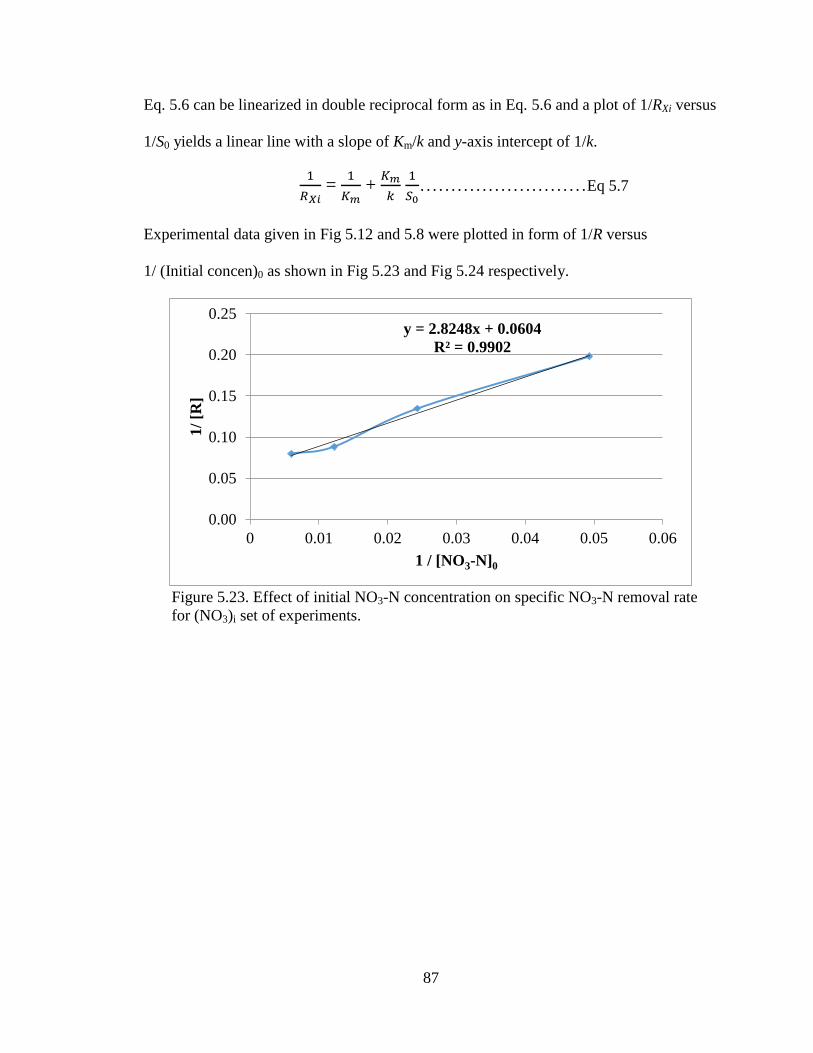
87
Eq. 5.6 can be linearized in double reciprocal form as in Eq. 5.6 and a plot of 1/RXi versus
1/S0 yields a linear line with a slope of Km/k and y-axis intercept of 1/k.
1
𝑅𝑋𝑖 =
1
𝐾𝑚 +
𝐾𝑚
𝑘
1
𝑆0………………………Eq 5.7
Experimental data given in Fig 5.12 and 5.8 were plotted in form of 1/R versus
1/ (Initial concen)0 as shown in Fig 5.23 and Fig 5.24 respectively.
Figure 5.23. Effect of initial NO3-N concentration on specific NO3-N removal rate
for (NO3)i set of experiments.
y = 2.8248x + 0.0604
R² = 0.9902
0.00
0.05
0.10
0.15
0.20
0.25
0 0.01 0.02 0.03 0.04 0.05 0.06
1/
[R]
1 / [NO3-N]0
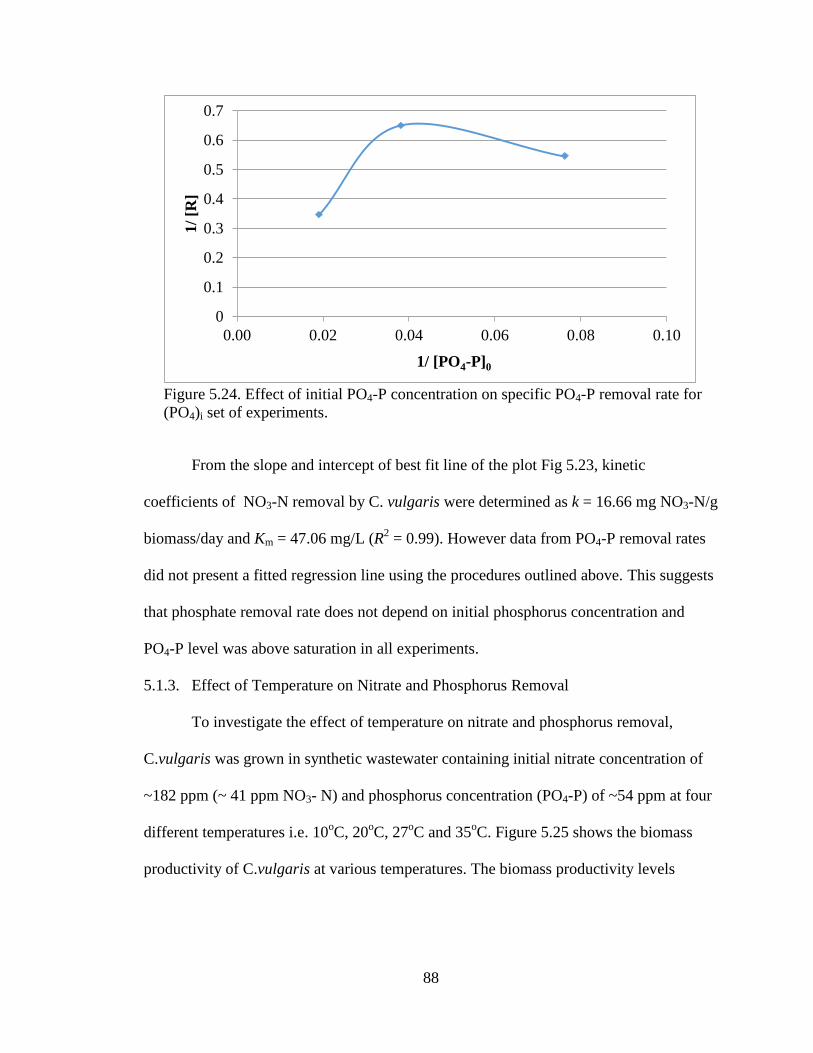
88
Figure 5.24. Effect of initial PO4-P concentration on specific PO4-P removal rate for
(PO4)i set of experiments.
From the slope and intercept of best fit line of the plot Fig 5.23, kinetic
coefficients of NO3-N removal by C. vulgaris were determined as k = 16.66 mg NO3-N/g
biomass/day and Km = 47.06 mg/L (R2 = 0.99). However data from PO4-P removal rates
did not present a fitted regression line using the procedures outlined above. This suggests
that phosphate removal rate does not depend on initial phosphorus concentration and
PO4-P level was above saturation in all experiments.
5.1.3. Effect of Temperature on Nitrate and Phosphorus Removal
To investigate the effect of temperature on nitrate and phosphorus removal,
C.vulgaris was grown in synthetic wastewater containing initial nitrate concentration of
~182 ppm (~ 41 ppm NO3- N) and phosphorus concentration (PO4-P) of ~54 ppm at four
different temperatures i.e. 10oC, 20
oC, 27
oC and 35
oC. Figure 5.25 shows the biomass
productivity of C.vulgaris at various temperatures. The biomass productivity levels
0
0.1
0.2
0.3
0.4
0.5
0.6
0.7
0.00 0.02 0.04 0.06 0.08 0.10
1/
[R]
1/ [PO4-P]0
89
Figure 5.25. Effect of temperature on algal biomass productivity.
increased with the increase in the temperature. Low growth rates were observed at low
temperatures and approximately a 50 % increase in biomass productivity was reported at
35 oC compared to 10
oC. This was expected because the reactions which make up the
process of photosynthesis in algae can be divided into two reactions i.e.
photochemical reactions and biochemical reactions. Photochemical reactions do not alter
with the change in temperature whereas biochemical reactions of photosynthesis changes
with the change in temperature. Biochemical reactions have a temperature coefficient
(Q10) of about 2 and similar to all enzyme controlled reactions, they will have an
optimum temperature above which the enzymes begin to lose their structure and the
growth starts to decline. In addition to this, temperature also has an effect on the rate of
the other biochemical reactions which synthesize the components of Chlorella cells to
enable them to grow. Temperature will also increase the rate of respiration and if the
Q10 of this process is different to the Q10 for photosynthesis, then the net effect of
temperature on growth may be influenced by the balance between photosynthesis and
respiration.
0.00
0.02
0.04
0.06
0.08
0.10
0.12
10 20 27 35
Bio
mass
pro
du
ctiv
ity
(g d
ry w
eigh
t. L
-1.d
ay
-1)
Temperature (oC)
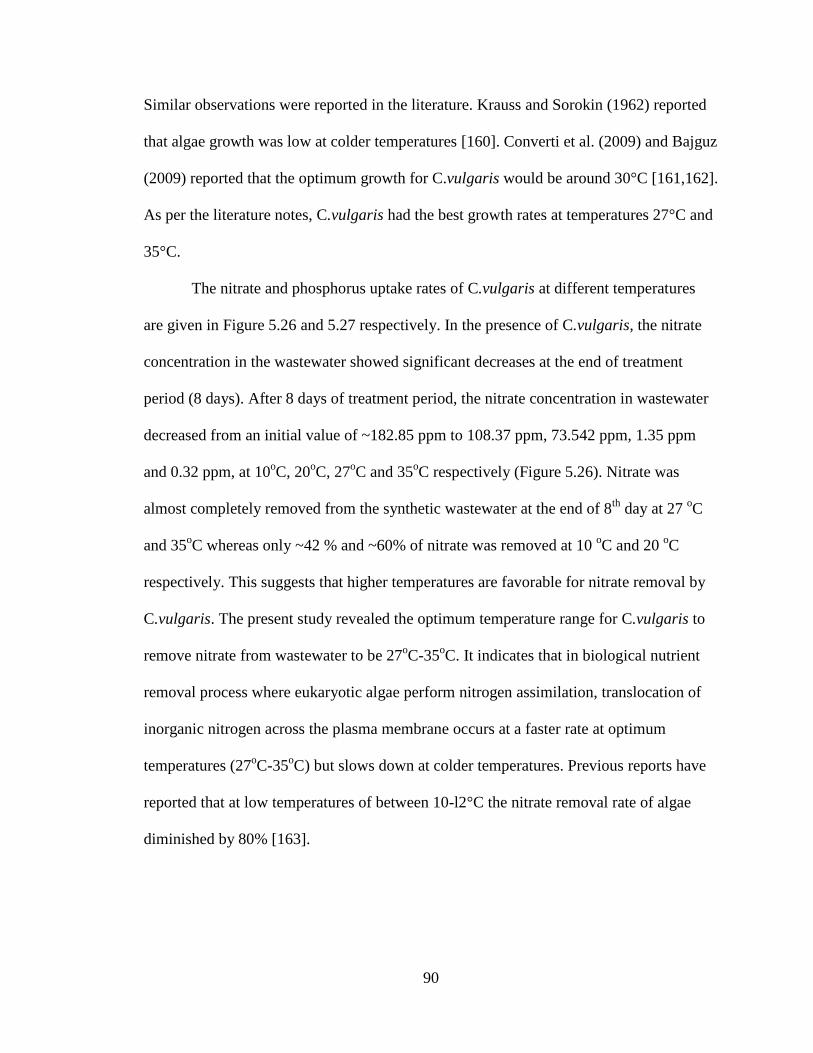
90
Similar observations were reported in the literature. Krauss and Sorokin (1962) reported
that algae growth was low at colder temperatures [160]. Converti et al. (2009) and Bajguz
(2009) reported that the optimum growth for C.vulgaris would be around 30°C [161,162].
As per the literature notes, C.vulgaris had the best growth rates at temperatures 27°C and
35°C.
The nitrate and phosphorus uptake rates of C.vulgaris at different temperatures
are given in Figure 5.26 and 5.27 respectively. In the presence of C.vulgaris, the nitrate
concentration in the wastewater showed significant decreases at the end of treatment
period (8 days). After 8 days of treatment period, the nitrate concentration in wastewater
decreased from an initial value of ~182.85 ppm to 108.37 ppm, 73.542 ppm, 1.35 ppm
and 0.32 ppm, at 10oC, 20
oC, 27
oC and 35
oC respectively (Figure 5.26). Nitrate was
almost completely removed from the synthetic wastewater at the end of 8th
day at 27 oC
and 35oC whereas only ~42 % and ~60% of nitrate was removed at 10
oC and 20
oC
respectively. This suggests that higher temperatures are favorable for nitrate removal by
C.vulgaris. The present study revealed the optimum temperature range for C.vulgaris to
remove nitrate from wastewater to be 27oC-35
oC. It indicates that in biological nutrient
removal process where eukaryotic algae perform nitrogen assimilation, translocation of
inorganic nitrogen across the plasma membrane occurs at a faster rate at optimum
temperatures (27oC-35
oC) but slows down at colder temperatures. Previous reports have
reported that at low temperatures of between 10-l2°C the nitrate removal rate of algae
diminished by 80% [163].
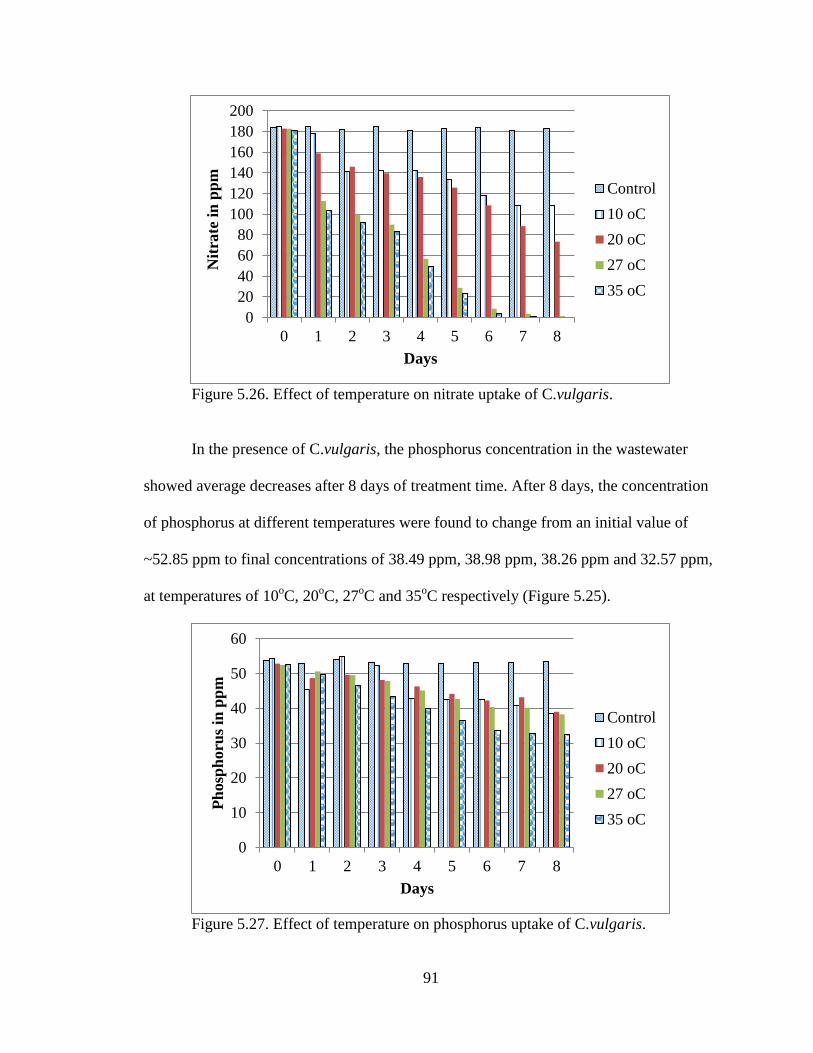
91
Figure 5.26. Effect of temperature on nitrate uptake of C.vulgaris.
In the presence of C.vulgaris, the phosphorus concentration in the wastewater
showed average decreases after 8 days of treatment time. After 8 days, the concentration
of phosphorus at different temperatures were found to change from an initial value of
~52.85 ppm to final concentrations of 38.49 ppm, 38.98 ppm, 38.26 ppm and 32.57 ppm,
at temperatures of 10oC, 20
oC, 27
oC and 35
oC respectively (Figure 5.25).
Figure 5.27. Effect of temperature on phosphorus uptake of C.vulgaris.
0
20
40
60
80
100
120
140
160
180
200
0 1 2 3 4 5 6 7 8
Nit
rate
in
pp
m
Days
Control
10 oC
20 oC
27 oC
35 oC
0
10
20
30
40
50
60
0 1 2 3 4 5 6 7 8
Ph
osp
horu
s in
pp
m
Days
Control
10 oC
20 oC
27 oC
35 oC
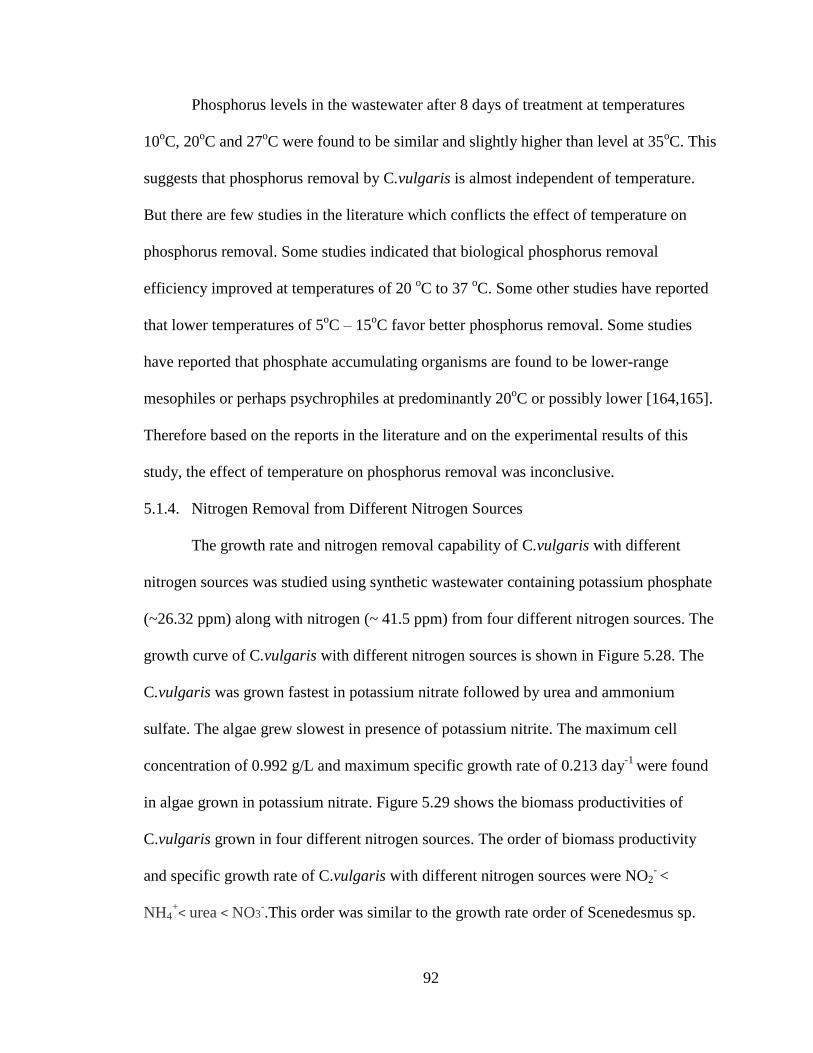
92
Phosphorus levels in the wastewater after 8 days of treatment at temperatures
10oC, 20
oC and 27
oC were found to be similar and slightly higher than level at 35
oC. This
suggests that phosphorus removal by C.vulgaris is almost independent of temperature.
But there are few studies in the literature which conflicts the effect of temperature on
phosphorus removal. Some studies indicated that biological phosphorus removal
efficiency improved at temperatures of 20 oC to 37
oC. Some other studies have reported
that lower temperatures of 5oC – 15
oC favor better phosphorus removal. Some studies
have reported that phosphate accumulating organisms are found to be lower-range
mesophiles or perhaps psychrophiles at predominantly 20oC or possibly lower [164,165].
Therefore based on the reports in the literature and on the experimental results of this
study, the effect of temperature on phosphorus removal was inconclusive.
5.1.4. Nitrogen Removal from Different Nitrogen Sources
The growth rate and nitrogen removal capability of C.vulgaris with different
nitrogen sources was studied using synthetic wastewater containing potassium phosphate
(~26.32 ppm) along with nitrogen (~ 41.5 ppm) from four different nitrogen sources. The
growth curve of C.vulgaris with different nitrogen sources is shown in Figure 5.28. The
C.vulgaris was grown fastest in potassium nitrate followed by urea and ammonium
sulfate. The algae grew slowest in presence of potassium nitrite. The maximum cell
concentration of 0.992 g/L and maximum specific growth rate of 0.213 day-1
were found
in algae grown in potassium nitrate. Figure 5.29 shows the biomass productivities of
C.vulgaris grown in four different nitrogen sources. The order of biomass productivity
and specific growth rate of C.vulgaris with different nitrogen sources were NO2- <
NH4+< urea < NO3
-.This order was similar to the growth rate order of Scenedesmus sp.
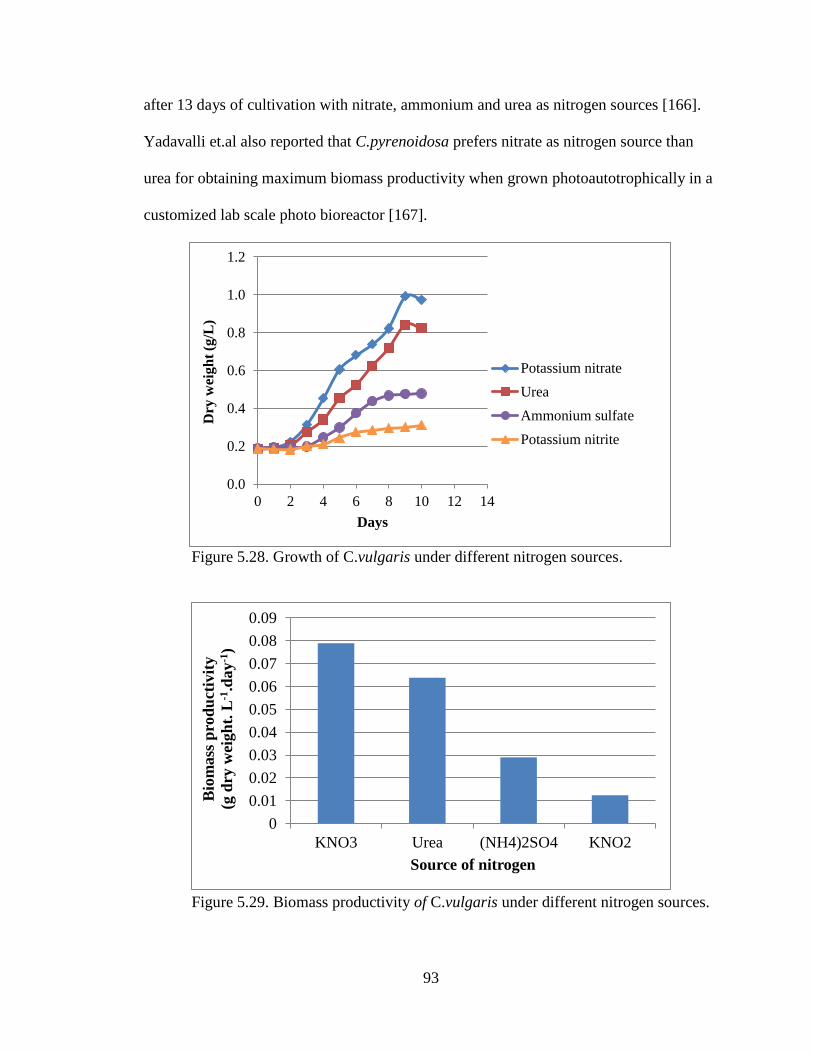
93
after 13 days of cultivation with nitrate, ammonium and urea as nitrogen sources [166].
Yadavalli et.al also reported that C.pyrenoidosa prefers nitrate as nitrogen source than
urea for obtaining maximum biomass productivity when grown photoautotrophically in a
customized lab scale photo bioreactor [167].
Figure 5.28. Growth of C.vulgaris under different nitrogen sources.
Figure 5.29. Biomass productivity of C.vulgaris under different nitrogen sources.
0.0
0.2
0.4
0.6
0.8
1.0
1.2
0 2 4 6 8 10 12 14
Dry
wei
gh
t (g
/L)
Days
Potassium nitrate
Urea
Ammonium sulfate
Potassium nitrite
0
0.01
0.02
0.03
0.04
0.05
0.06
0.07
0.08
0.09
KNO3 Urea (NH4)2SO4 KNO2
Bio
mass
pro
du
ctiv
ity
(g d
ry w
eigh
t. L
-1.d
ay
-1)
Source of nitrogen
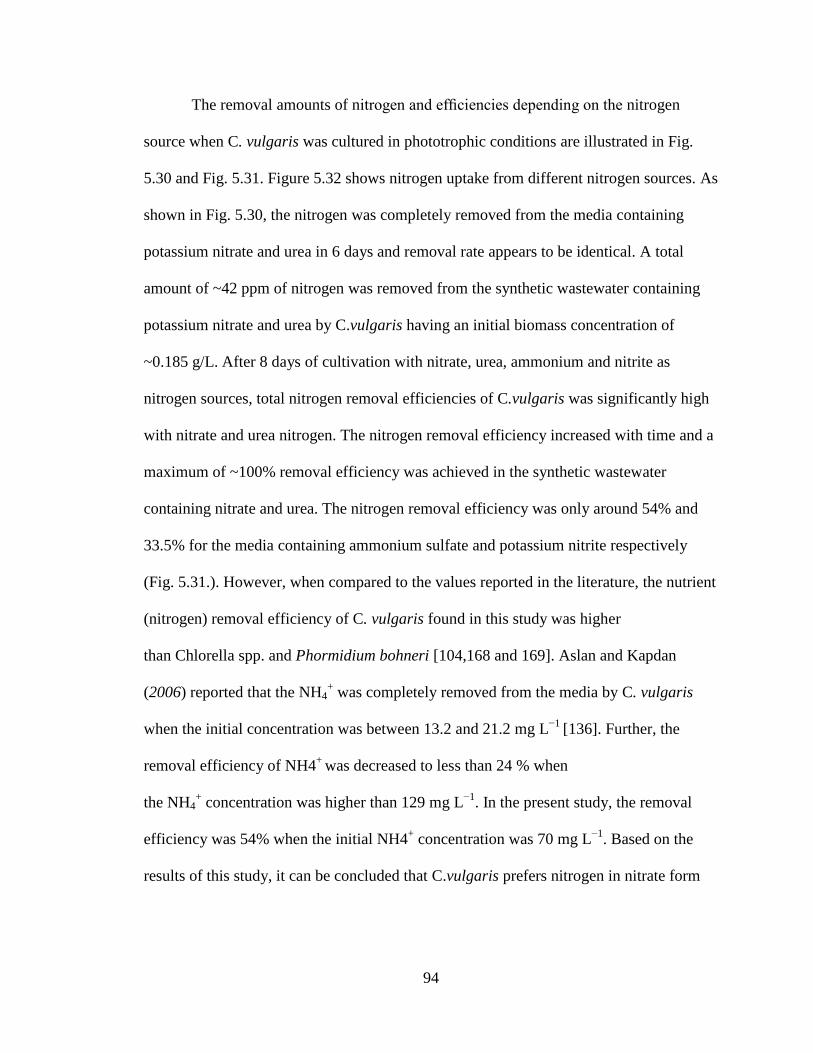
94
The removal amounts of nitrogen and efficiencies depending on the nitrogen
source when C. vulgaris was cultured in phototrophic conditions are illustrated in Fig.
5.30 and Fig. 5.31. Figure 5.32 shows nitrogen uptake from different nitrogen sources. As
shown in Fig. 5.30, the nitrogen was completely removed from the media containing
potassium nitrate and urea in 6 days and removal rate appears to be identical. A total
amount of ~42 ppm of nitrogen was removed from the synthetic wastewater containing
potassium nitrate and urea by C.vulgaris having an initial biomass concentration of
~0.185 g/L. After 8 days of cultivation with nitrate, urea, ammonium and nitrite as
nitrogen sources, total nitrogen removal efficiencies of C.vulgaris was significantly high
with nitrate and urea nitrogen. The nitrogen removal efficiency increased with time and a
maximum of ~100% removal efficiency was achieved in the synthetic wastewater
containing nitrate and urea. The nitrogen removal efficiency was only around 54% and
33.5% for the media containing ammonium sulfate and potassium nitrite respectively
(Fig. 5.31.). However, when compared to the values reported in the literature, the nutrient
(nitrogen) removal efficiency of C. vulgaris found in this study was higher
than Chlorella spp. and Phormidium bohneri [104,168 and 169]. Aslan and Kapdan
(2006) reported that the NH4+ was completely removed from the media by C. vulgaris
when the initial concentration was between 13.2 and 21.2 mg L−1
[136]. Further, the
removal efficiency of NH4+
was decreased to less than 24 % when
the NH4+ concentration was higher than 129 mg L
−1. In the present study, the removal
efficiency was 54% when the initial NH4+ concentration was 70 mg L
−1. Based on the
results of this study, it can be concluded that C.vulgaris prefers nitrogen in nitrate form
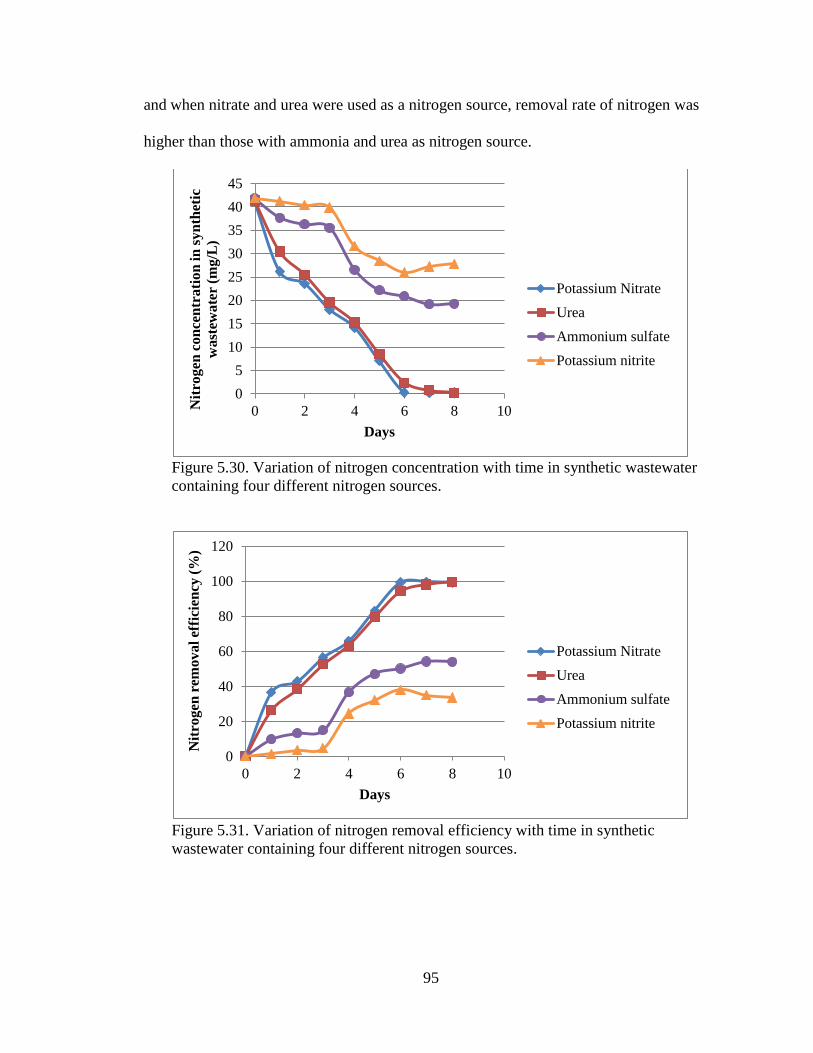
95
and when nitrate and urea were used as a nitrogen source, removal rate of nitrogen was
higher than those with ammonia and urea as nitrogen source.
Figure 5.30. Variation of nitrogen concentration with time in synthetic wastewater
containing four different nitrogen sources.
Figure 5.31. Variation of nitrogen removal efficiency with time in synthetic
wastewater containing four different nitrogen sources.
0
5
10
15
20
25
30
35
40
45
0 2 4 6 8 10Nit
rog
en c
on
cen
tra
tio
n in
sy
nth
etic
wa
stew
ate
r (m
g/L
)
Days
Potassium Nitrate
Urea
Ammonium sulfate
Potassium nitrite
0
20
40
60
80
100
120
0 2 4 6 8 10
Nit
rogen
rem
ov
al
effi
cien
cy (
%)
Days
Potassium Nitrate
Urea
Ammonium sulfate
Potassium nitrite
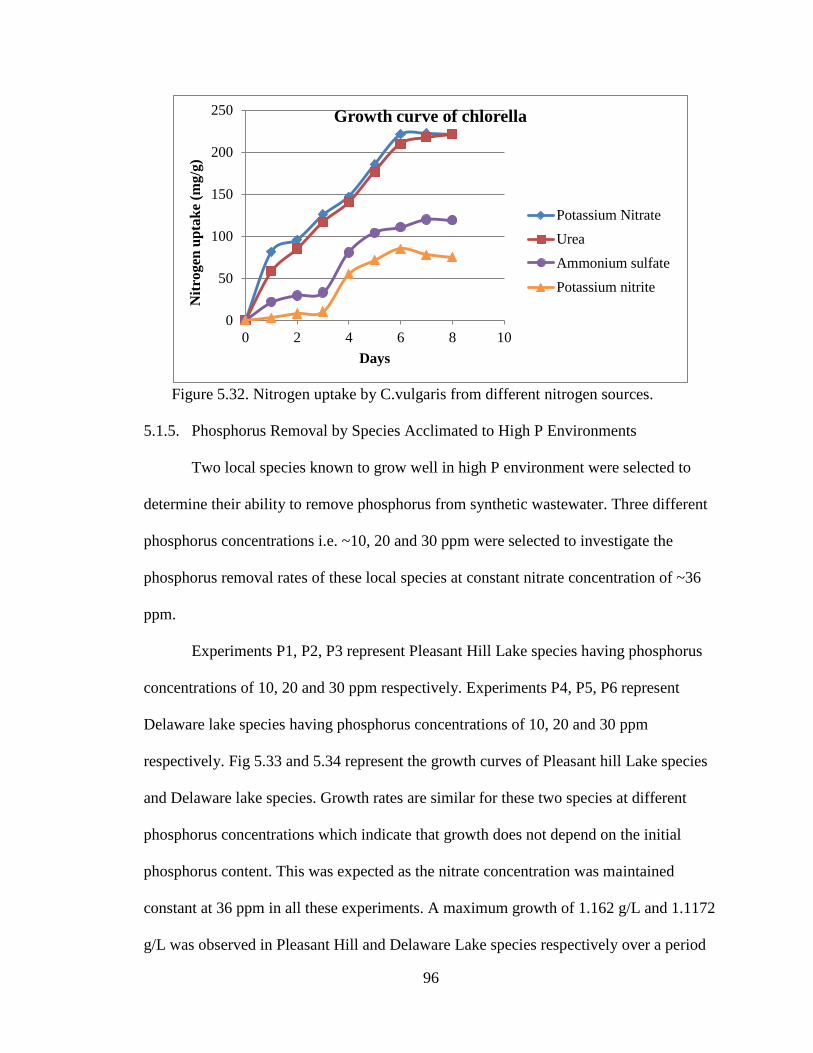
96
Figure 5.32. Nitrogen uptake by C.vulgaris from different nitrogen sources.
5.1.5. Phosphorus Removal by Species Acclimated to High P Environments
Two local species known to grow well in high P environment were selected to
determine their ability to remove phosphorus from synthetic wastewater. Three different
phosphorus concentrations i.e. ~10, 20 and 30 ppm were selected to investigate the
phosphorus removal rates of these local species at constant nitrate concentration of ~36
ppm.
Experiments P1, P2, P3 represent Pleasant Hill Lake species having phosphorus
concentrations of 10, 20 and 30 ppm respectively. Experiments P4, P5, P6 represent
Delaware lake species having phosphorus concentrations of 10, 20 and 30 ppm
respectively. Fig 5.33 and 5.34 represent the growth curves of Pleasant hill Lake species
and Delaware lake species. Growth rates are similar for these two species at different
phosphorus concentrations which indicate that growth does not depend on the initial
phosphorus content. This was expected as the nitrate concentration was maintained
constant at 36 ppm in all these experiments. A maximum growth of 1.162 g/L and 1.1172
g/L was observed in Pleasant Hill and Delaware Lake species respectively over a period
0
50
100
150
200
250
0 2 4 6 8 10
Nit
rog
en u
pta
ke
(mg
/g)
Days
Growth curve of chlorella
Potassium Nitrate
Urea
Ammonium sulfate
Potassium nitrite
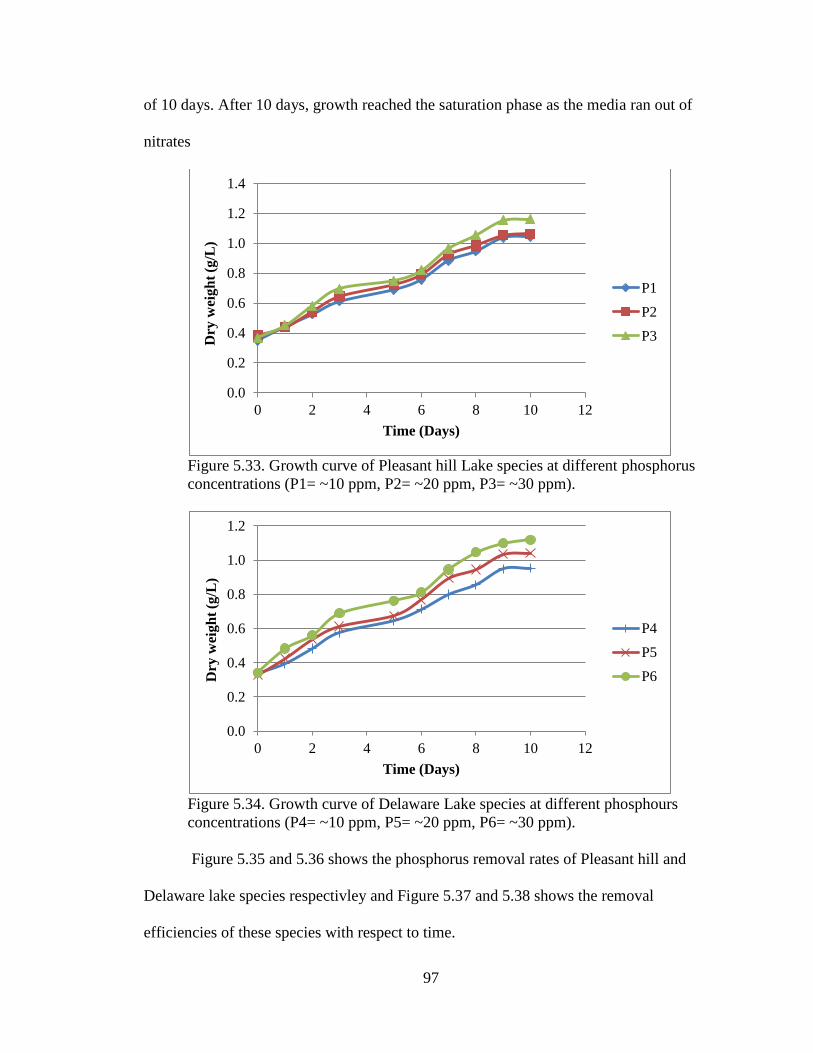
97
of 10 days. After 10 days, growth reached the saturation phase as the media ran out of
nitrates
Figure 5.33. Growth curve of Pleasant hill Lake species at different phosphorus
concentrations (P1= ~10 ppm, P2= ~20 ppm, P3= ~30 ppm).
Figure 5.34. Growth curve of Delaware Lake species at different phosphours
concentrations (P4= ~10 ppm, P5= ~20 ppm, P6= ~30 ppm).
Figure 5.35 and 5.36 shows the phosphorus removal rates of Pleasant hill and
Delaware lake species respectivley and Figure 5.37 and 5.38 shows the removal
efficiencies of these species with respect to time.
0.0
0.2
0.4
0.6
0.8
1.0
1.2
1.4
0 2 4 6 8 10 12
Dry
wei
gh
t (g
/L)
Time (Days)
P1
P2
P3
0.0
0.2
0.4
0.6
0.8
1.0
1.2
0 2 4 6 8 10 12
Dry
wei
gh
t (g
/L)
Time (Days)
P4
P5
P6
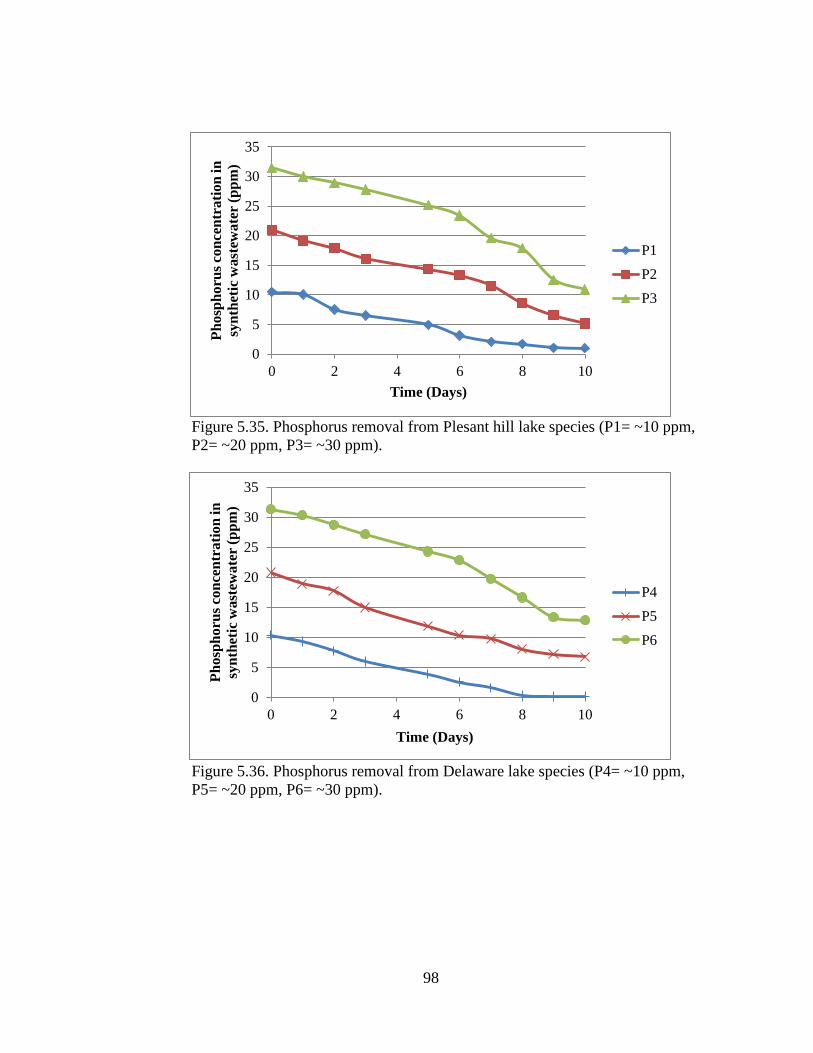
98
Figure 5.35. Phosphorus removal from Plesant hill lake species (P1= ~10 ppm,
P2= ~20 ppm, P3= ~30 ppm).
Figure 5.36. Phosphorus removal from Delaware lake species (P4= ~10 ppm,
P5= ~20 ppm, P6= ~30 ppm).
0
5
10
15
20
25
30
35
0 2 4 6 8 10
Ph
osp
ho
rus
con
cen
tra
tio
n in
syn
thet
ic w
ast
ewa
ter
(pp
m)
Time (Days)
P1
P2
P3
0
5
10
15
20
25
30
35
0 2 4 6 8 10
Ph
osp
horu
s co
nce
ntr
ati
on
in
syn
thet
ic w
ast
ewate
r (p
pm
)
Time (Days)
P4
P5
P6
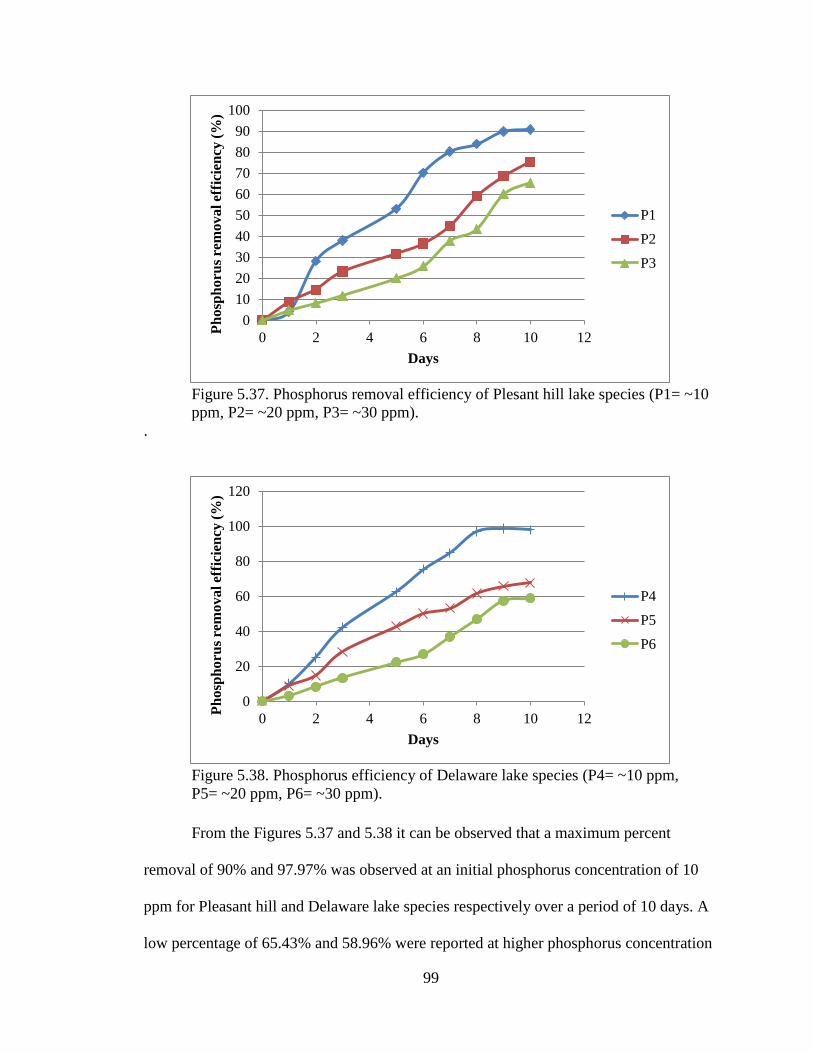
99
Figure 5.37. Phosphorus removal efficiency of Plesant hill lake species (P1= ~10
ppm, P2= ~20 ppm, P3= ~30 ppm).
.
Figure 5.38. Phosphorus efficiency of Delaware lake species (P4= ~10 ppm,
P5= ~20 ppm, P6= ~30 ppm).
From the Figures 5.37 and 5.38 it can be observed that a maximum percent
removal of 90% and 97.97% was observed at an initial phosphorus concentration of 10
ppm for Pleasant hill and Delaware lake species respectively over a period of 10 days. A
low percentage of 65.43% and 58.96% were reported at higher phosphorus concentration
0
10
20
30
40
50
60
70
80
90
100
0 2 4 6 8 10 12
Ph
osp
ho
rus
rem
ov
al ef
fici
ency
(%
)
Days
P1
P2
P3
0
20
40
60
80
100
120
0 2 4 6 8 10 12
Ph
osp
horu
s re
moval ef
fici
ency
(%
)
Days
P4
P5
P6
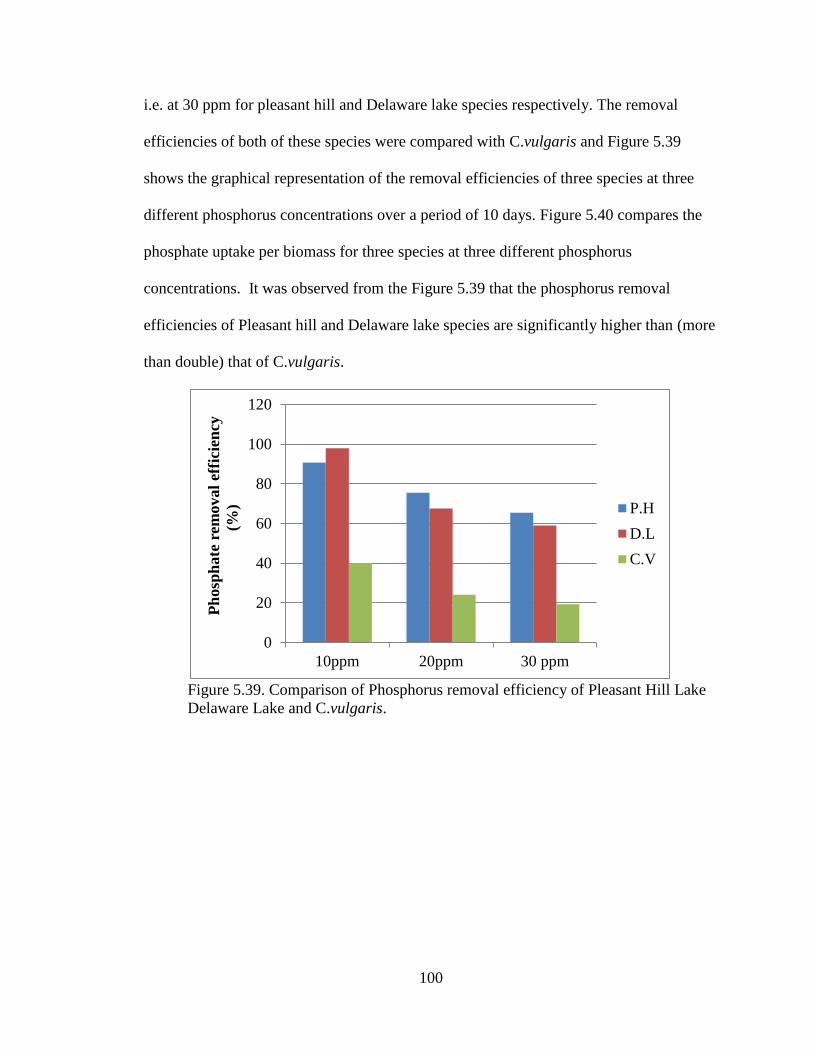
100
i.e. at 30 ppm for pleasant hill and Delaware lake species respectively. The removal
efficiencies of both of these species were compared with C.vulgaris and Figure 5.39
shows the graphical representation of the removal efficiencies of three species at three
different phosphorus concentrations over a period of 10 days. Figure 5.40 compares the
phosphate uptake per biomass for three species at three different phosphorus
concentrations. It was observed from the Figure 5.39 that the phosphorus removal
efficiencies of Pleasant hill and Delaware lake species are significantly higher than (more
than double) that of C.vulgaris.
Figure 5.39. Comparison of Phosphorus removal efficiency of Pleasant Hill Lake
Delaware Lake and C.vulgaris.
0
20
40
60
80
100
120
10ppm 20ppm 30 ppm
Ph
osp
hate
rem
oval
effi
cien
cy
(%) P.H
D.L
C.V
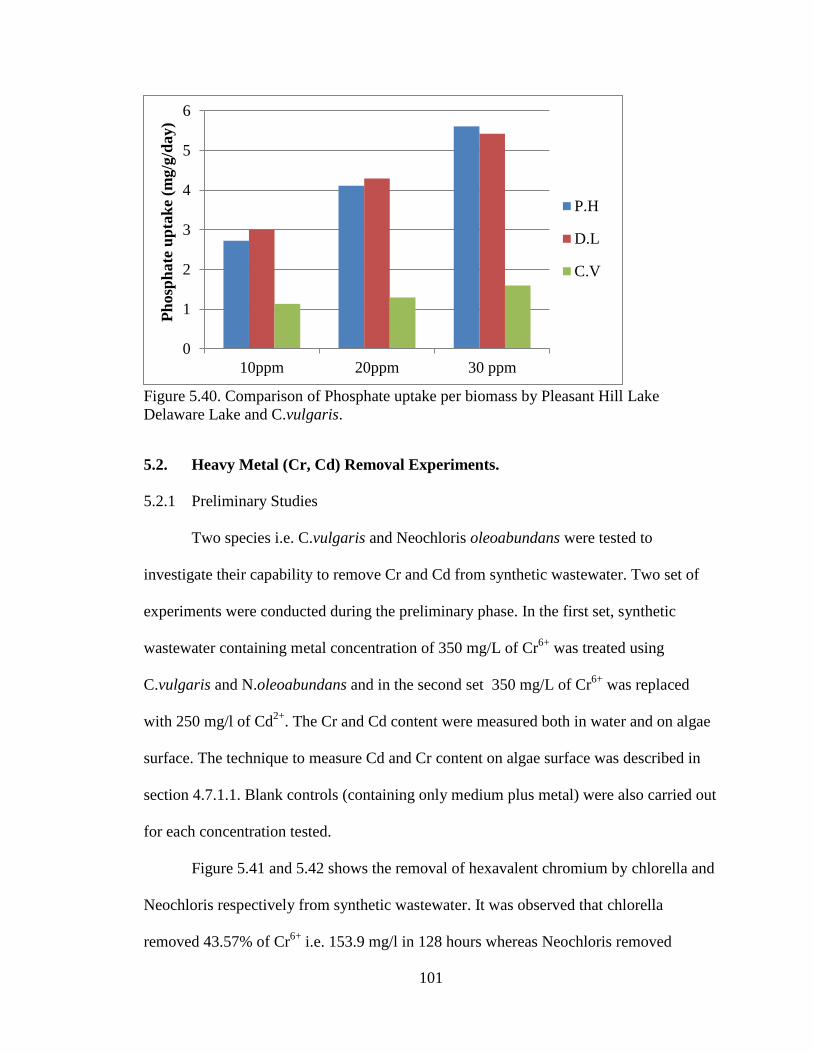
101
Figure 5.40. Comparison of Phosphate uptake per biomass by Pleasant Hill Lake
Delaware Lake and C.vulgaris.
5.2. Heavy Metal (Cr, Cd) Removal Experiments.
5.2.1 Preliminary Studies
Two species i.e. C.vulgaris and Neochloris oleoabundans were tested to
investigate their capability to remove Cr and Cd from synthetic wastewater. Two set of
experiments were conducted during the preliminary phase. In the first set, synthetic
wastewater containing metal concentration of 350 mg/L of Cr6+
was treated using
C.vulgaris and N.oleoabundans and in the second set 350 mg/L of Cr6+
was replaced
with 250 mg/l of Cd2+
. The Cr and Cd content were measured both in water and on algae
surface. The technique to measure Cd and Cr content on algae surface was described in
section 4.7.1.1. Blank controls (containing only medium plus metal) were also carried out
for each concentration tested.
Figure 5.41 and 5.42 shows the removal of hexavalent chromium by chlorella and
Neochloris respectively from synthetic wastewater. It was observed that chlorella
removed 43.57% of Cr6+
i.e. 153.9 mg/l in 128 hours whereas Neochloris removed
0
1
2
3
4
5
6
10ppm 20ppm 30 ppm
Ph
osp
hate
up
tak
e (m
g/g
/day)
P.H
D.L
C.V
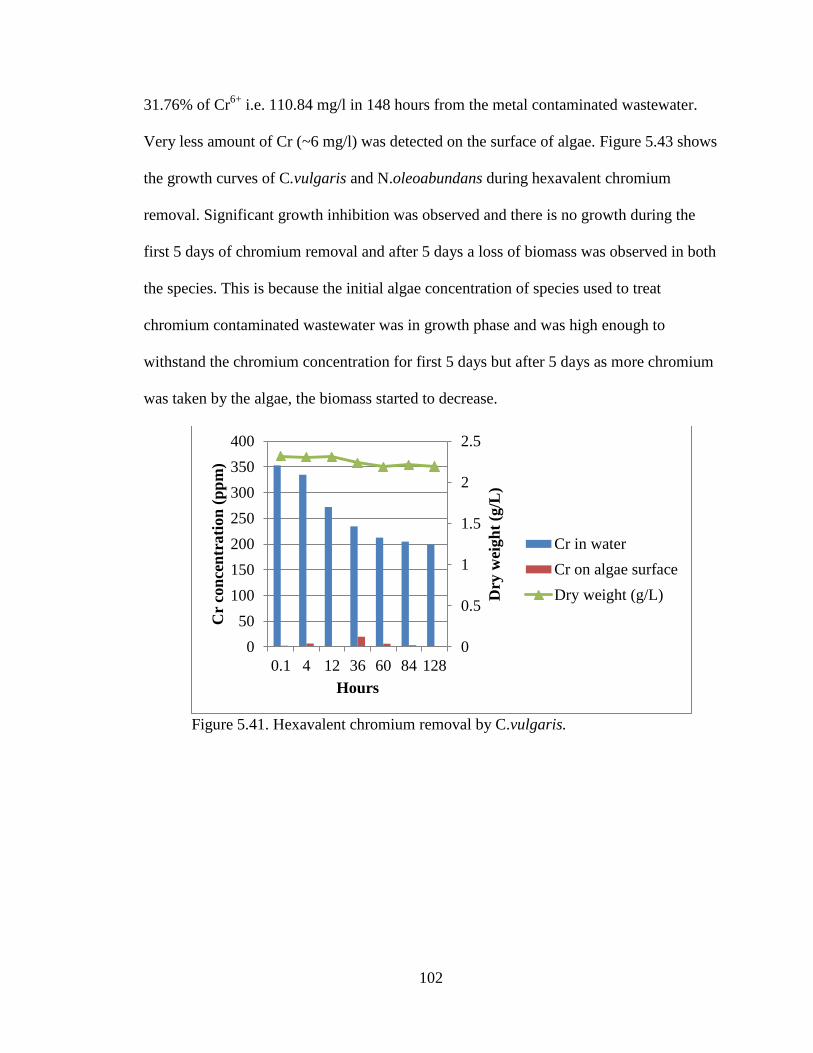
102
31.76% of Cr6+
i.e. 110.84 mg/l in 148 hours from the metal contaminated wastewater.
Very less amount of Cr (~6 mg/l) was detected on the surface of algae. Figure 5.43 shows
the growth curves of C.vulgaris and N.oleoabundans during hexavalent chromium
removal. Significant growth inhibition was observed and there is no growth during the
first 5 days of chromium removal and after 5 days a loss of biomass was observed in both
the species. This is because the initial algae concentration of species used to treat
chromium contaminated wastewater was in growth phase and was high enough to
withstand the chromium concentration for first 5 days but after 5 days as more chromium
was taken by the algae, the biomass started to decrease.
Figure 5.41. Hexavalent chromium removal by C.vulgaris.
0
0.5
1
1.5
2
2.5
0
50
100
150
200
250
300
350
400
0.1 4 12 36 60 84 128
Dry
wei
gh
t (g
/L)
Cr
con
cen
trati
on
(p
pm
)
Hours
Cr in water
Cr on algae surface
Dry weight (g/L)
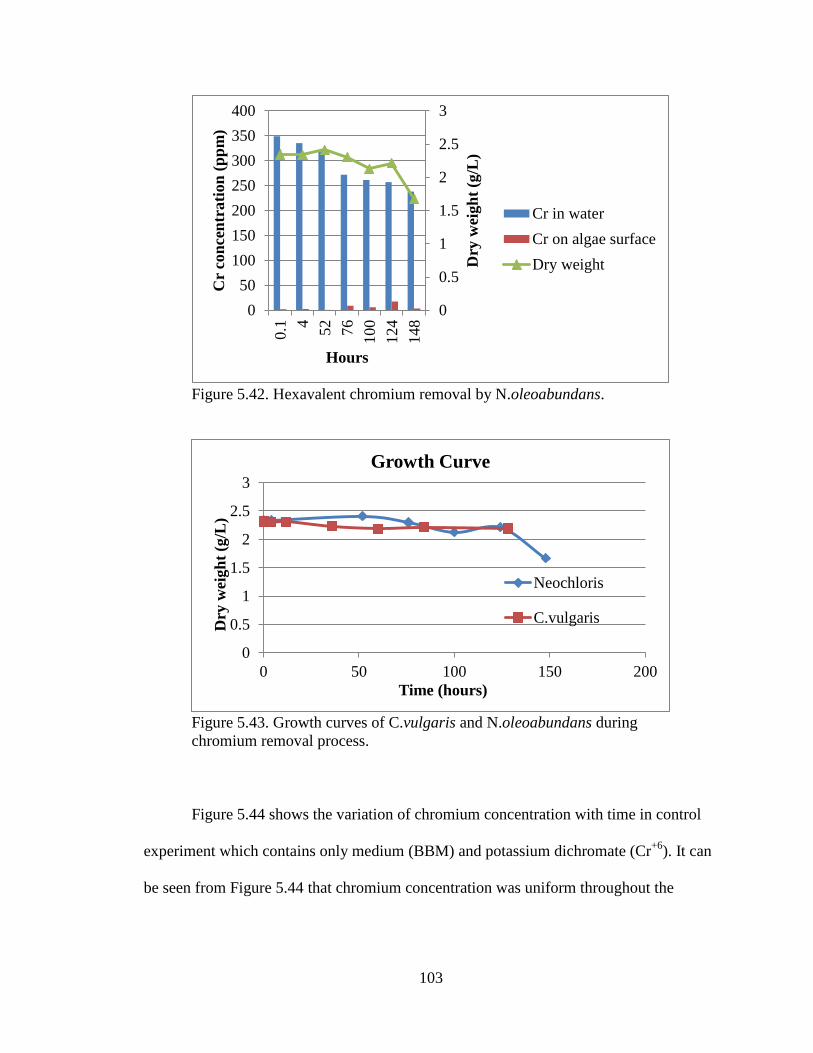
103
Figure 5.42. Hexavalent chromium removal by N.oleoabundans.
Figure 5.43. Growth curves of C.vulgaris and N.oleoabundans during
chromium removal process.
Figure 5.44 shows the variation of chromium concentration with time in control
experiment which contains only medium (BBM) and potassium dichromate (Cr+6
). It can
be seen from Figure 5.44 that chromium concentration was uniform throughout the
0
0.5
1
1.5
2
2.5
3
0
50
100
150
200
250
300
350
400
0.1 4
52
76
100
124
148
Dry
wei
gh
t (g
/L)
Cr
con
cen
tra
tio
n (
pp
m)
Hours
Cr in water
Cr on algae surface
Dry weight
0
0.5
1
1.5
2
2.5
3
0 50 100 150 200
Dry
wei
gh
t (g
/L)
Time (hours)
Growth Curve
Neochloris
C.vulgaris
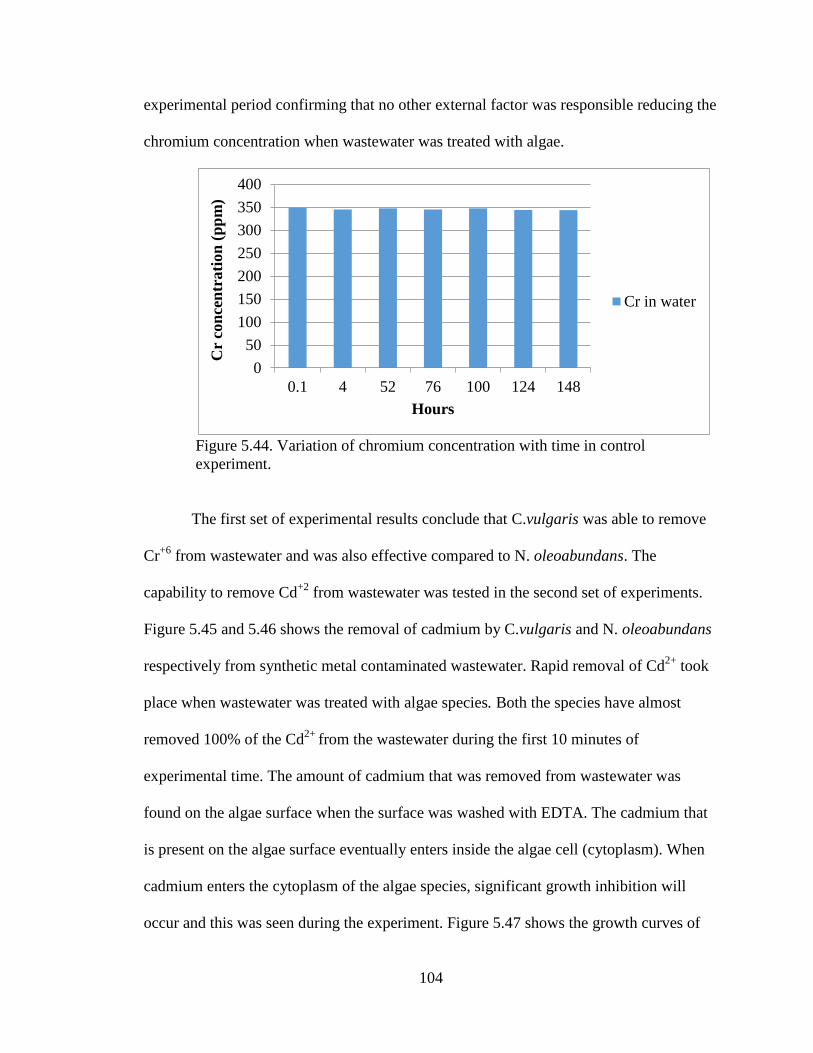
104
experimental period confirming that no other external factor was responsible reducing the
chromium concentration when wastewater was treated with algae.
Figure 5.44. Variation of chromium concentration with time in control
experiment.
The first set of experimental results conclude that C.vulgaris was able to remove
Cr+6
from wastewater and was also effective compared to N. oleoabundans. The
capability to remove Cd+2
from wastewater was tested in the second set of experiments.
Figure 5.45 and 5.46 shows the removal of cadmium by C.vulgaris and N. oleoabundans
respectively from synthetic metal contaminated wastewater. Rapid removal of Cd2+
took
place when wastewater was treated with algae species. Both the species have almost
removed 100% of the Cd2+
from the wastewater during the first 10 minutes of
experimental time. The amount of cadmium that was removed from wastewater was
found on the algae surface when the surface was washed with EDTA. The cadmium that
is present on the algae surface eventually enters inside the algae cell (cytoplasm). When
cadmium enters the cytoplasm of the algae species, significant growth inhibition will
occur and this was seen during the experiment. Figure 5.47 shows the growth curves of
0
50
100
150
200
250
300
350
400
0.1 4 52 76 100 124 148
Cr
con
cen
trati
on
(p
pm
)
Hours
Cr in water
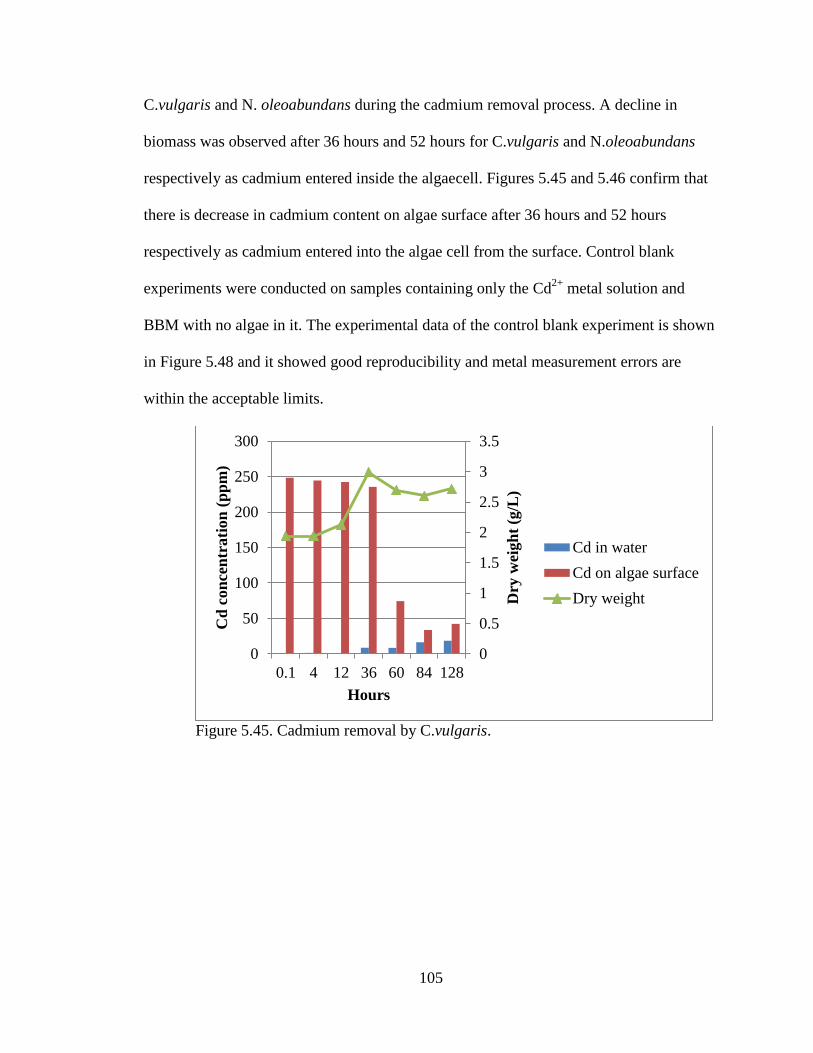
105
C.vulgaris and N. oleoabundans during the cadmium removal process. A decline in
biomass was observed after 36 hours and 52 hours for C.vulgaris and N.oleoabundans
respectively as cadmium entered inside the algaecell. Figures 5.45 and 5.46 confirm that
there is decrease in cadmium content on algae surface after 36 hours and 52 hours
respectively as cadmium entered into the algae cell from the surface. Control blank
experiments were conducted on samples containing only the Cd2+
metal solution and
BBM with no algae in it. The experimental data of the control blank experiment is shown
in Figure 5.48 and it showed good reproducibility and metal measurement errors are
within the acceptable limits.
Figure 5.45. Cadmium removal by C.vulgaris.
0
0.5
1
1.5
2
2.5
3
3.5
0
50
100
150
200
250
300
0.1 4 12 36 60 84 128
Dry
wei
gh
t (g
/L)
Cd
con
cen
trati
on
(p
pm
)
Hours
Cd in water
Cd on algae surface
Dry weight
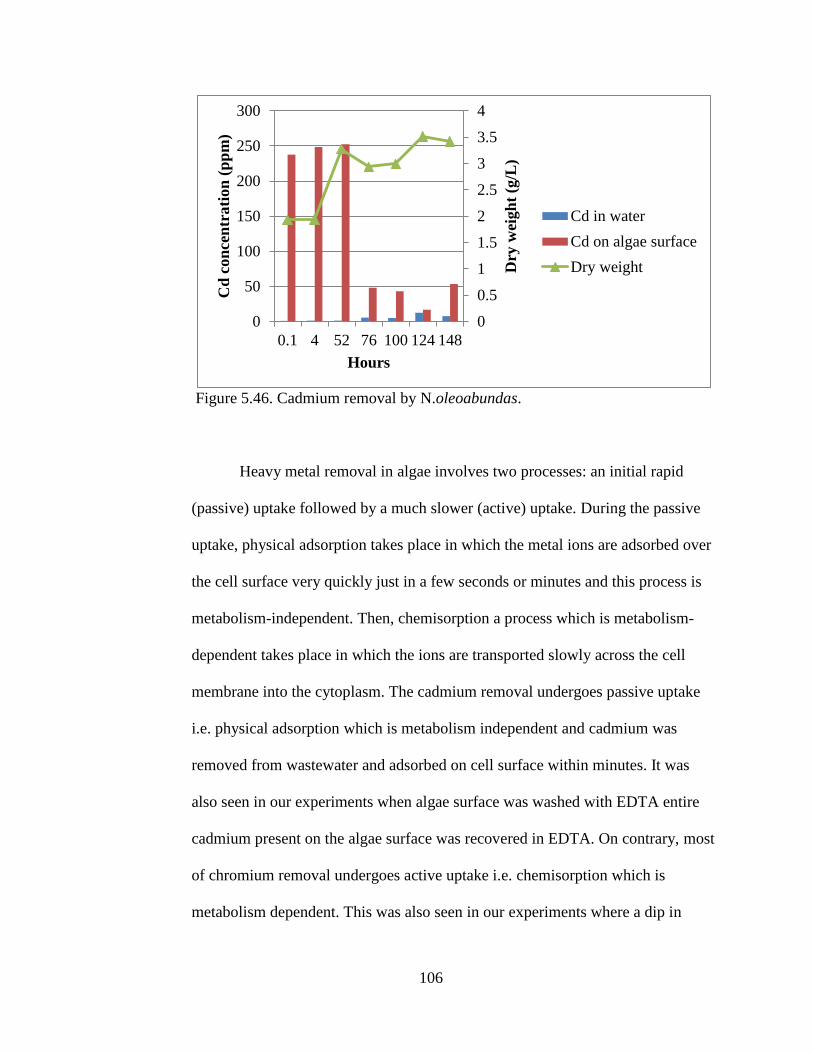
106
Figure 5.46. Cadmium removal by N.oleoabundas.
Heavy metal removal in algae involves two processes: an initial rapid
(passive) uptake followed by a much slower (active) uptake. During the passive
uptake, physical adsorption takes place in which the metal ions are adsorbed over
the cell surface very quickly just in a few seconds or minutes and this process is
metabolism-independent. Then, chemisorption a process which is metabolism-
dependent takes place in which the ions are transported slowly across the cell
membrane into the cytoplasm. The cadmium removal undergoes passive uptake
i.e. physical adsorption which is metabolism independent and cadmium was
removed from wastewater and adsorbed on cell surface within minutes. It was
also seen in our experiments when algae surface was washed with EDTA entire
cadmium present on the algae surface was recovered in EDTA. On contrary, most
of chromium removal undergoes active uptake i.e. chemisorption which is
metabolism dependent. This was also seen in our experiments where a dip in
0
0.5
1
1.5
2
2.5
3
3.5
4
0
50
100
150
200
250
300
0.1 4 52 76 100 124 148
Dry
wei
gh
t (g
/L)
Cd
con
cen
trati
on
(p
pm
)
Hours
Cd in water
Cd on algae surface
Dry weight
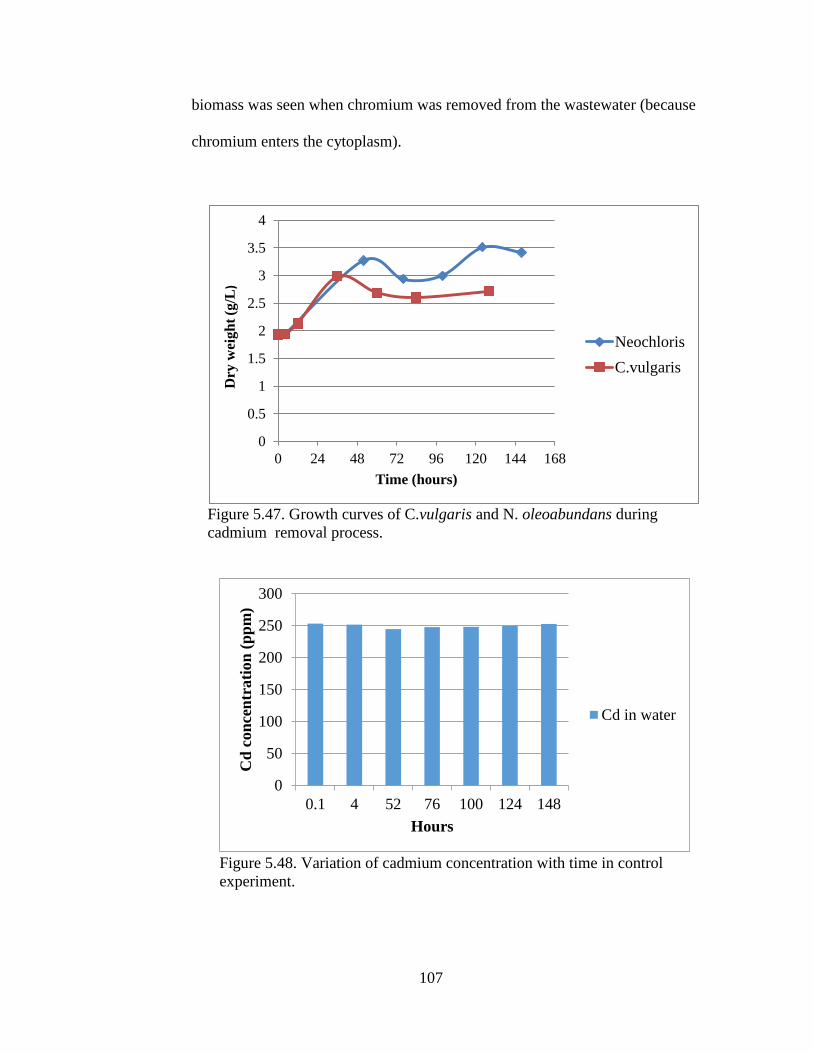
107
biomass was seen when chromium was removed from the wastewater (because
chromium enters the cytoplasm).
Figure 5.47. Growth curves of C.vulgaris and N. oleoabundans during
cadmium removal process.
Figure 5.48. Variation of cadmium concentration with time in control
experiment.
0
0.5
1
1.5
2
2.5
3
3.5
4
0 24 48 72 96 120 144 168
Dry
wei
gh
t (g
/L)
Time (hours)
Neochloris
C.vulgaris
0
50
100
150
200
250
300
0.1 4 52 76 100 124 148
Cd
con
cen
trati
on
(p
pm
)
Hours
Cd in water
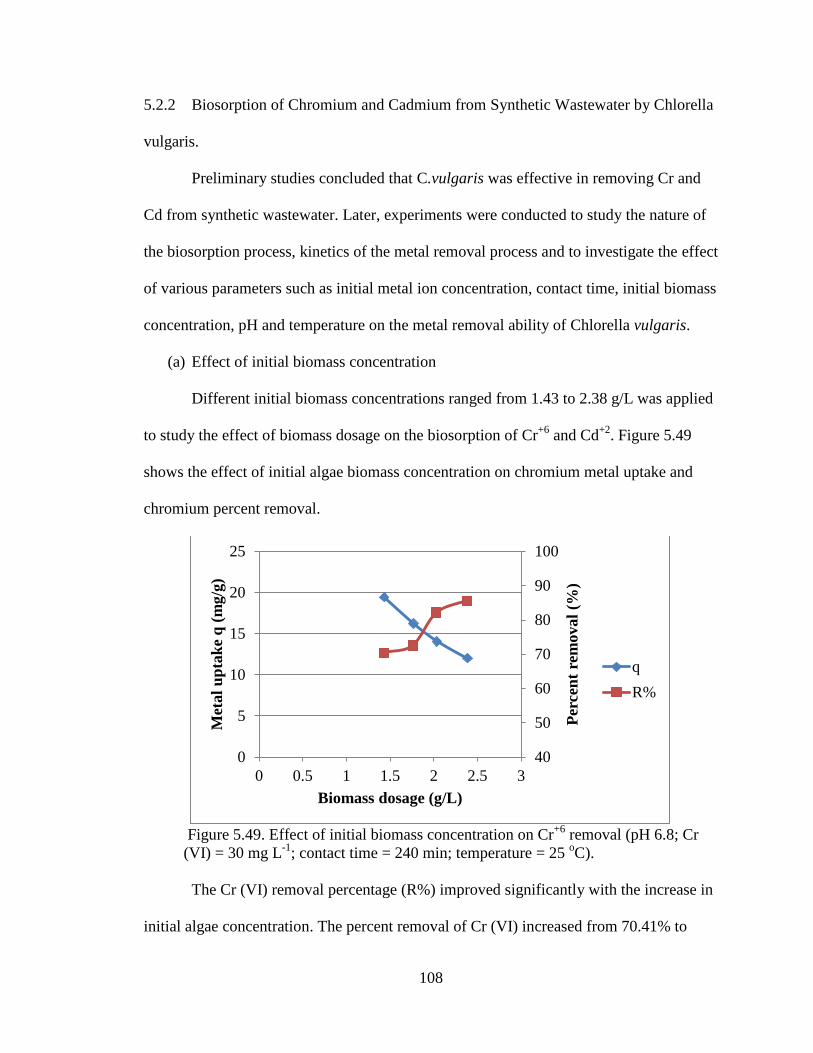
108
5.2.2 Biosorption of Chromium and Cadmium from Synthetic Wastewater by Chlorella
vulgaris.
Preliminary studies concluded that C.vulgaris was effective in removing Cr and
Cd from synthetic wastewater. Later, experiments were conducted to study the nature of
the biosorption process, kinetics of the metal removal process and to investigate the effect
of various parameters such as initial metal ion concentration, contact time, initial biomass
concentration, pH and temperature on the metal removal ability of Chlorella vulgaris.
(a) Effect of initial biomass concentration
Different initial biomass concentrations ranged from 1.43 to 2.38 g/L was applied
to study the effect of biomass dosage on the biosorption of Cr+6
and Cd+2
. Figure 5.49
shows the effect of initial algae biomass concentration on chromium metal uptake and
chromium percent removal.
Figure 5.49. Effect of initial biomass concentration on Cr
+6 removal (pH 6.8; Cr
(VI) = 30 mg L-1
; contact time = 240 min; temperature = 25 oC).
The Cr (VI) removal percentage (R%) improved significantly with the increase in
initial algae concentration. The percent removal of Cr (VI) increased from 70.41% to
40
50
60
70
80
90
100
0
5
10
15
20
25
0 0.5 1 1.5 2 2.5 3
Per
cen
t re
moval
(%)
Met
al
up
tak
e q
(m
g/g
)
Biomass dosage (g/L)
q
R%
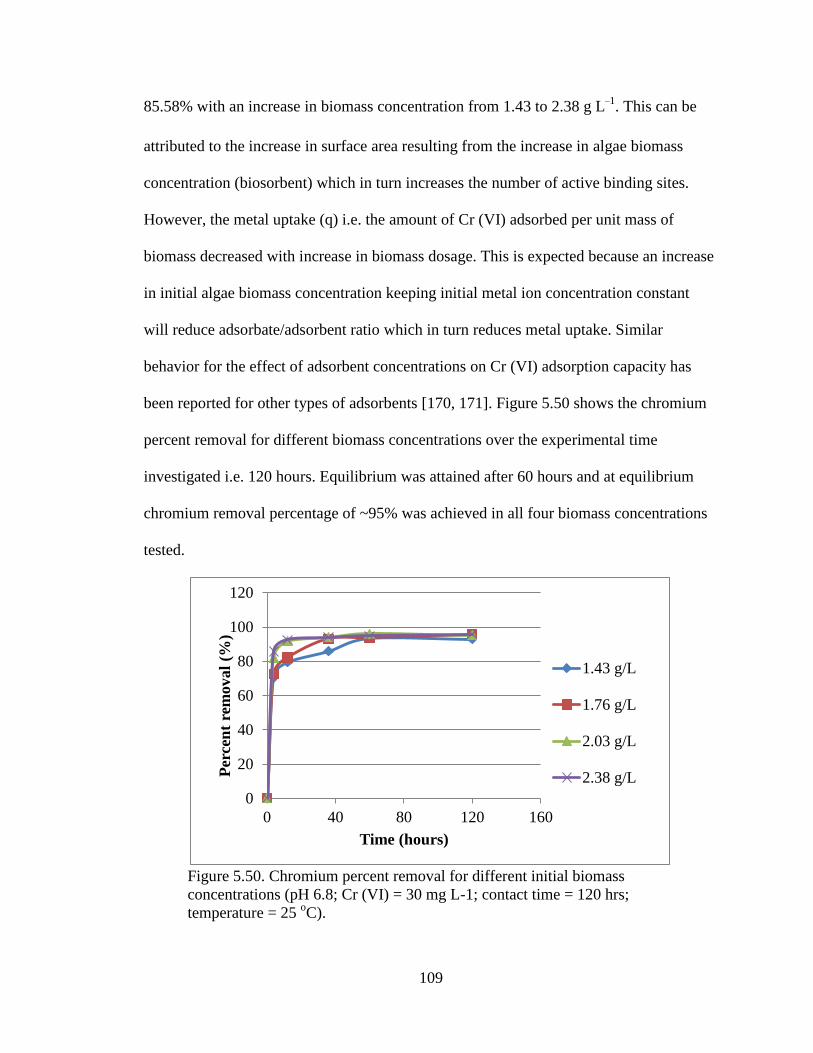
109
85.58% with an increase in biomass concentration from 1.43 to 2.38 g L−1. This can be
attributed to the increase in surface area resulting from the increase in algae biomass
concentration (biosorbent) which in turn increases the number of active binding sites.
However, the metal uptake (q) i.e. the amount of Cr (VI) adsorbed per unit mass of
biomass decreased with increase in biomass dosage. This is expected because an increase
in initial algae biomass concentration keeping initial metal ion concentration constant
will reduce adsorbate/adsorbent ratio which in turn reduces metal uptake. Similar
behavior for the effect of adsorbent concentrations on Cr (VI) adsorption capacity has
been reported for other types of adsorbents [170, 171]. Figure 5.50 shows the chromium
percent removal for different biomass concentrations over the experimental time
investigated i.e. 120 hours. Equilibrium was attained after 60 hours and at equilibrium
chromium removal percentage of ~95% was achieved in all four biomass concentrations
tested.
Figure 5.50. Chromium percent removal for different initial biomass
concentrations (pH 6.8; Cr (VI) = 30 mg L-1; contact time = 120 hrs;
temperature = 25 oC).
0
20
40
60
80
100
120
0 40 80 120 160
Per
cen
t re
moval
(%)
Time (hours)
1.43 g/L
1.76 g/L
2.03 g/L
2.38 g/L
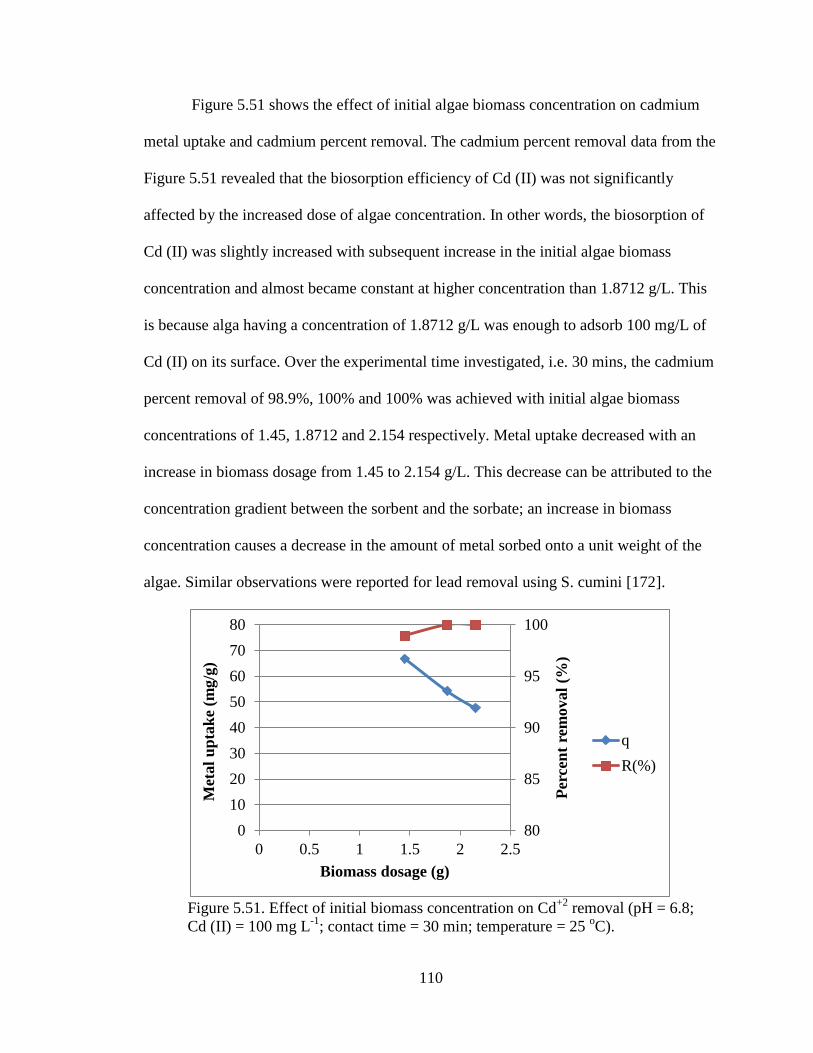
110
Figure 5.51 shows the effect of initial algae biomass concentration on cadmium
metal uptake and cadmium percent removal. The cadmium percent removal data from the
Figure 5.51 revealed that the biosorption efficiency of Cd (II) was not significantly
affected by the increased dose of algae concentration. In other words, the biosorption of
Cd (II) was slightly increased with subsequent increase in the initial algae biomass
concentration and almost became constant at higher concentration than 1.8712 g/L. This
is because alga having a concentration of 1.8712 g/L was enough to adsorb 100 mg/L of
Cd (II) on its surface. Over the experimental time investigated, i.e. 30 mins, the cadmium
percent removal of 98.9%, 100% and 100% was achieved with initial algae biomass
concentrations of 1.45, 1.8712 and 2.154 respectively. Metal uptake decreased with an
increase in biomass dosage from 1.45 to 2.154 g/L. This decrease can be attributed to the
concentration gradient between the sorbent and the sorbate; an increase in biomass
concentration causes a decrease in the amount of metal sorbed onto a unit weight of the
algae. Similar observations were reported for lead removal using S. cumini [172].
Figure 5.51. Effect of initial biomass concentration on Cd
+2 removal (pH = 6.8;
Cd (II) = 100 mg L-1
; contact time = 30 min; temperature = 25 oC).
80
85
90
95
100
0
10
20
30
40
50
60
70
80
0 0.5 1 1.5 2 2.5
Per
cen
t re
moval
(%)
Met
al
up
tak
e (m
g/g
)
Biomass dosage (g)
q
R(%)
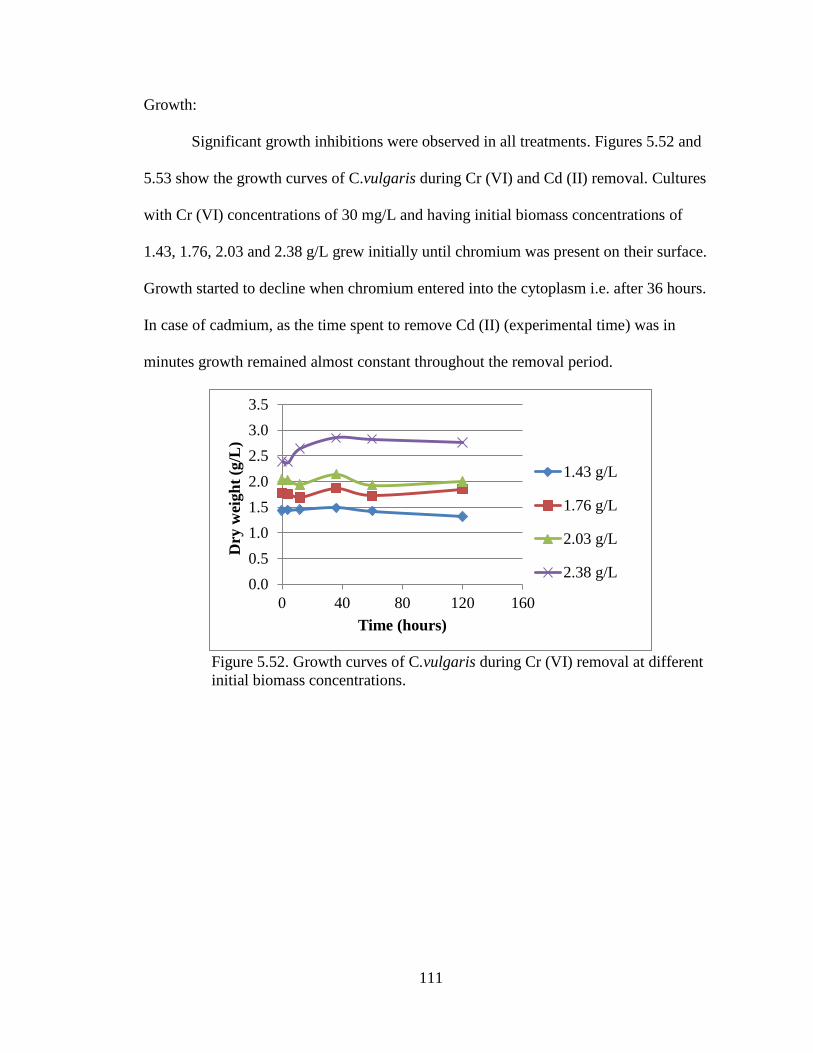
111
Growth:
Significant growth inhibitions were observed in all treatments. Figures 5.52 and
5.53 show the growth curves of C.vulgaris during Cr (VI) and Cd (II) removal. Cultures
with Cr (VI) concentrations of 30 mg/L and having initial biomass concentrations of
1.43, 1.76, 2.03 and 2.38 g/L grew initially until chromium was present on their surface.
Growth started to decline when chromium entered into the cytoplasm i.e. after 36 hours.
In case of cadmium, as the time spent to remove Cd (II) (experimental time) was in
minutes growth remained almost constant throughout the removal period.
Figure 5.52. Growth curves of C.vulgaris during Cr (VI) removal at different
initial biomass concentrations.
0.0
0.5
1.0
1.5
2.0
2.5
3.0
3.5
0 40 80 120 160
Dry
wei
gh
t (g
/L)
Time (hours)
1.43 g/L
1.76 g/L
2.03 g/L
2.38 g/L
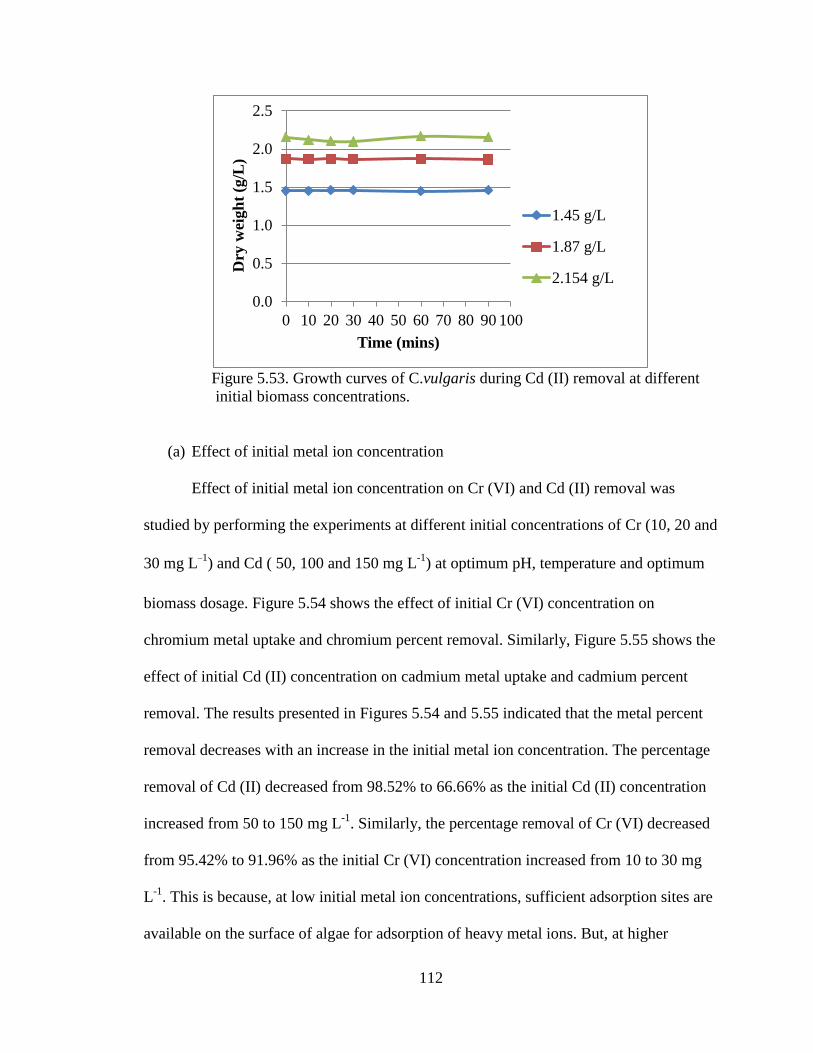
112
Figure 5.53. Growth curves of C.vulgaris during Cd (II) removal at different
initial biomass concentrations.
(a) Effect of initial metal ion concentration
Effect of initial metal ion concentration on Cr (VI) and Cd (II) removal was
studied by performing the experiments at different initial concentrations of Cr (10, 20 and
30 mg L−1) and Cd ( 50, 100 and 150 mg L-1
) at optimum pH, temperature and optimum
biomass dosage. Figure 5.54 shows the effect of initial Cr (VI) concentration on
chromium metal uptake and chromium percent removal. Similarly, Figure 5.55 shows the
effect of initial Cd (II) concentration on cadmium metal uptake and cadmium percent
removal. The results presented in Figures 5.54 and 5.55 indicated that the metal percent
removal decreases with an increase in the initial metal ion concentration. The percentage
removal of Cd (II) decreased from 98.52% to 66.66% as the initial Cd (II) concentration
increased from 50 to 150 mg L-1
. Similarly, the percentage removal of Cr (VI) decreased
from 95.42% to 91.96% as the initial Cr (VI) concentration increased from 10 to 30 mg
L-1
. This is because, at low initial metal ion concentrations, sufficient adsorption sites are
available on the surface of algae for adsorption of heavy metal ions. But, at higher
0.0
0.5
1.0
1.5
2.0
2.5
0 10 20 30 40 50 60 70 80 90 100
Dry
wei
gh
t (g
/L)
Time (mins)
1.45 g/L
1.87 g/L
2.154 g/L
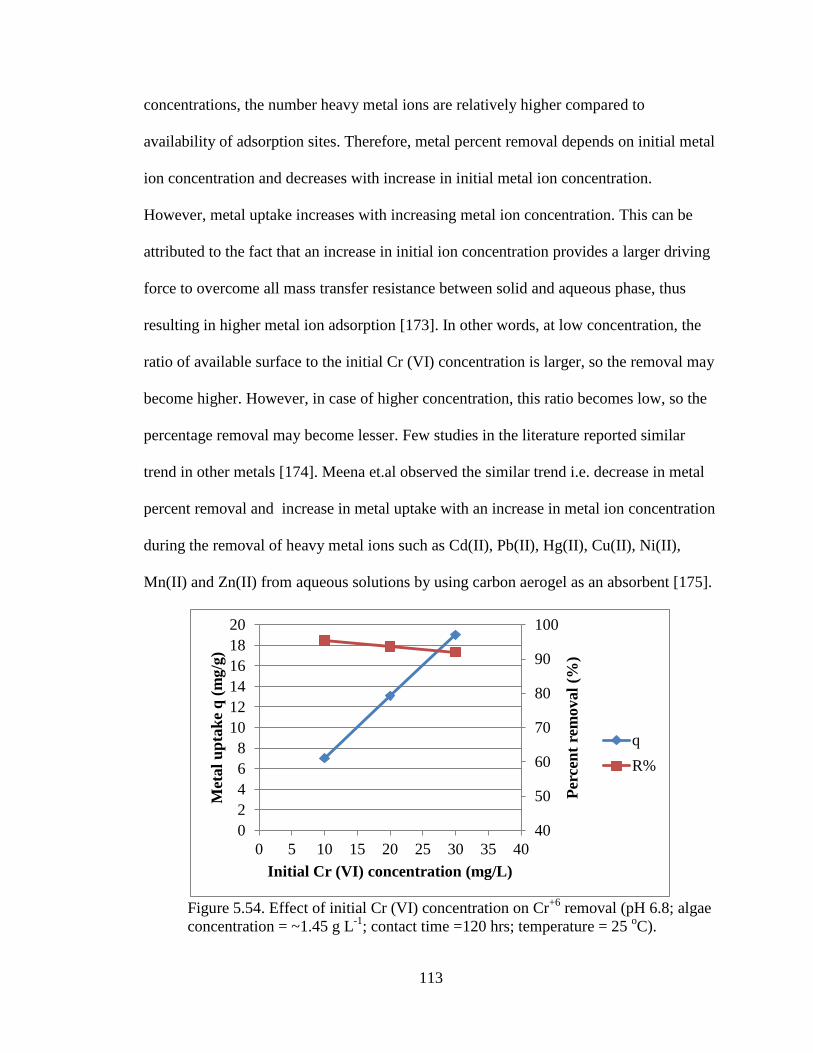
113
concentrations, the number heavy metal ions are relatively higher compared to
availability of adsorption sites. Therefore, metal percent removal depends on initial metal
ion concentration and decreases with increase in initial metal ion concentration.
However, metal uptake increases with increasing metal ion concentration. This can be
attributed to the fact that an increase in initial ion concentration provides a larger driving
force to overcome all mass transfer resistance between solid and aqueous phase, thus
resulting in higher metal ion adsorption [173]. In other words, at low concentration, the
ratio of available surface to the initial Cr (VI) concentration is larger, so the removal may
become higher. However, in case of higher concentration, this ratio becomes low, so the
percentage removal may become lesser. Few studies in the literature reported similar
trend in other metals [174]. Meena et.al observed the similar trend i.e. decrease in metal
percent removal and increase in metal uptake with an increase in metal ion concentration
during the removal of heavy metal ions such as Cd(II), Pb(II), Hg(II), Cu(II), Ni(II),
Mn(II) and Zn(II) from aqueous solutions by using carbon aerogel as an absorbent [175].
Figure 5.54. Effect of initial Cr (VI) concentration on Cr
+6 removal (pH 6.8; algae
concentration = ~1.45 g L-1
; contact time =120 hrs; temperature = 25 oC).
40
50
60
70
80
90
100
0
2
4
6
8
10
12
14
16
18
20
0 5 10 15 20 25 30 35 40
Per
cen
t re
moval
(%)
Met
al
up
tak
e q
(m
g/g
)
Initial Cr (VI) concentration (mg/L)
q
R%
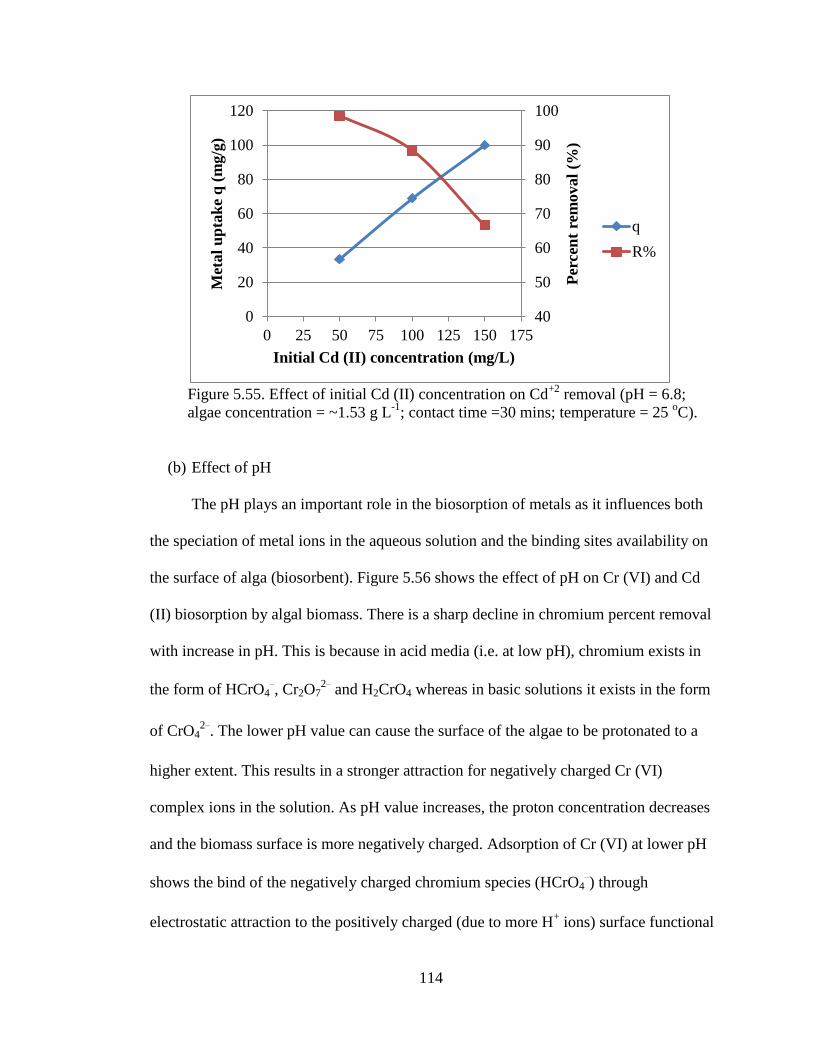
114
Figure 5.55. Effect of initial Cd (II) concentration on Cd
+2 removal (pH = 6.8;
algae concentration = ~1.53 g L-1
; contact time =30 mins; temperature = 25 oC).
(b) Effect of pH
The pH plays an important role in the biosorption of metals as it influences both
the speciation of metal ions in the aqueous solution and the binding sites availability on
the surface of alga (biosorbent). Figure 5.56 shows the effect of pH on Cr (VI) and Cd
(II) biosorption by algal biomass. There is a sharp decline in chromium percent removal
with increase in pH. This is because in acid media (i.e. at low pH), chromium exists in
the form of HCrO4−, Cr2O7
2− and H2CrO4 whereas in basic solutions it exists in the form
of CrO42−. The lower pH value can cause the surface of the algae to be protonated to a
higher extent. This results in a stronger attraction for negatively charged Cr (VI)
complex ions in the solution. As pH value increases, the proton concentration decreases
and the biomass surface is more negatively charged. Adsorption of Cr (VI) at lower pH
shows the bind of the negatively charged chromium species (HCrO4−) through
electrostatic attraction to the positively charged (due to more H+ ions) surface functional
40
50
60
70
80
90
100
0
20
40
60
80
100
120
0 25 50 75 100 125 150 175
Per
cen
t re
moval
(%)
Met
al
up
tak
e q
(m
g/g
)
Initial Cd (II) concentration (mg/L)
q
R%
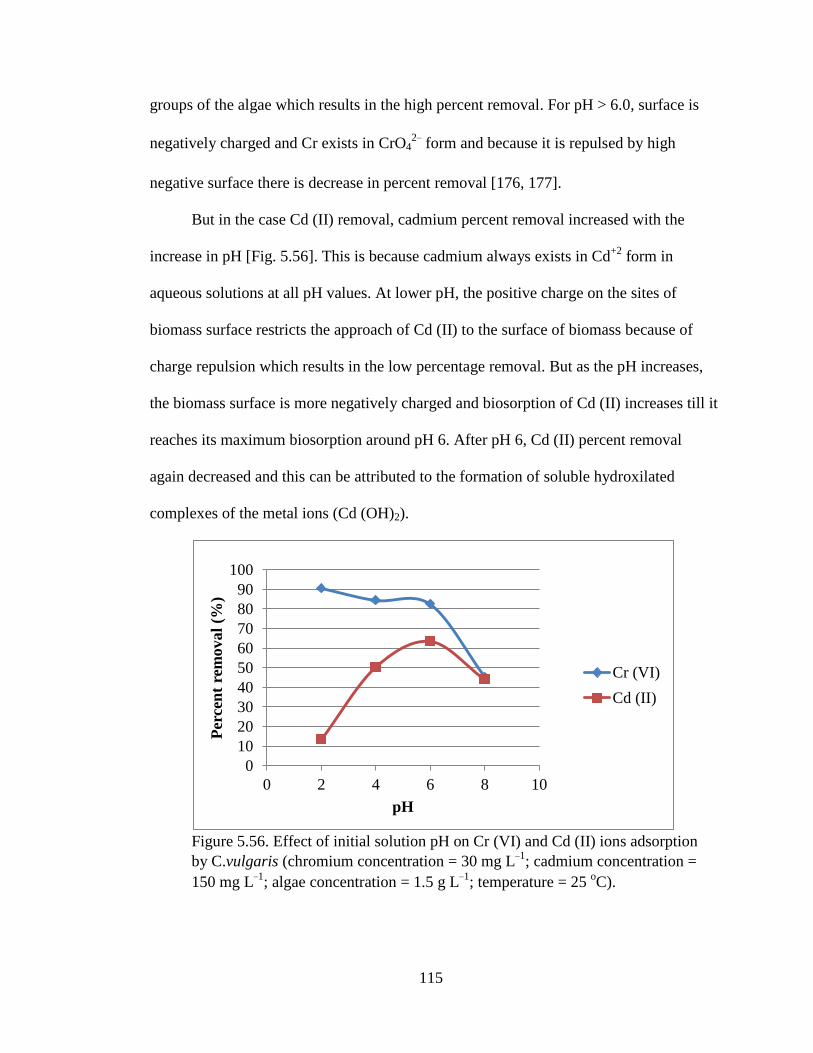
115
groups of the algae which results in the high percent removal. For pH > 6.0, surface is
negatively charged and Cr exists in CrO42− form and because it is repulsed by high
negative surface there is decrease in percent removal [176, 177].
But in the case Cd (II) removal, cadmium percent removal increased with the
increase in pH [Fig. 5.56]. This is because cadmium always exists in Cd+2
form in
aqueous solutions at all pH values. At lower pH, the positive charge on the sites of
biomass surface restricts the approach of Cd (II) to the surface of biomass because of
charge repulsion which results in the low percentage removal. But as the pH increases,
the biomass surface is more negatively charged and biosorption of Cd (II) increases till it
reaches its maximum biosorption around pH 6. After pH 6, Cd (II) percent removal
again decreased and this can be attributed to the formation of soluble hydroxilated
complexes of the metal ions (Cd (OH)2).
Figure 5.56. Effect of initial solution pH on Cr (VI) and Cd (II) ions adsorption
by C.vulgaris (chromium concentration = 30 mg L−1; cadmium concentration =
150 mg L−1; algae concentration = 1.5 g L−1; temperature = 25
oC).
0
10
20
30
40
50
60
70
80
90
100
0 2 4 6 8 10
Per
cen
t re
moval
(%)
pH
Cr (VI)
Cd (II)
116
(c) Effect of contact time
Contact time plays a significant role in the metal biosorption process. Figure 5.57
and Figure 5.58 shows the effect of contact time on the metal uptake of Cr (VI) and Cd
(II) ions using C.vulgaris. From the experimental data represented in Figures 5.57, more
than 80% Cr (VI) was removed in first 4 hours at all concentrations tested. The process
of Cr (VI) metal uptake was almost constant after the first 4 hours. The reaction rate is
rather fast at first and thereafter it proceeds at a lower rate and finally no further
significant metal uptake was observed. Figure 5.58 shows the effect of contact time on
the biosorption of Cd (II) using C.vulgaris. The results shown in Fig. 5.58 indicated that
for all the concentrations tested, biosorption of Cd (II) was rapid in the first 20 min then
was gradually increased till the equilibrium attained at 60 min, and the biosorption
became almost constant thereafter. The uptake of Cd (II) occur in two steps; a very rapid
surface biosorption followed by a slow intercellular diffusion. Similar behavior was
reported by other researchers. Chen et al., observed same trend during the biosorption of
Ni and Cu on treated alga Undaria pinnatifida [174] and the biosorption of Cd by
biomass fungal biosorbent [178].
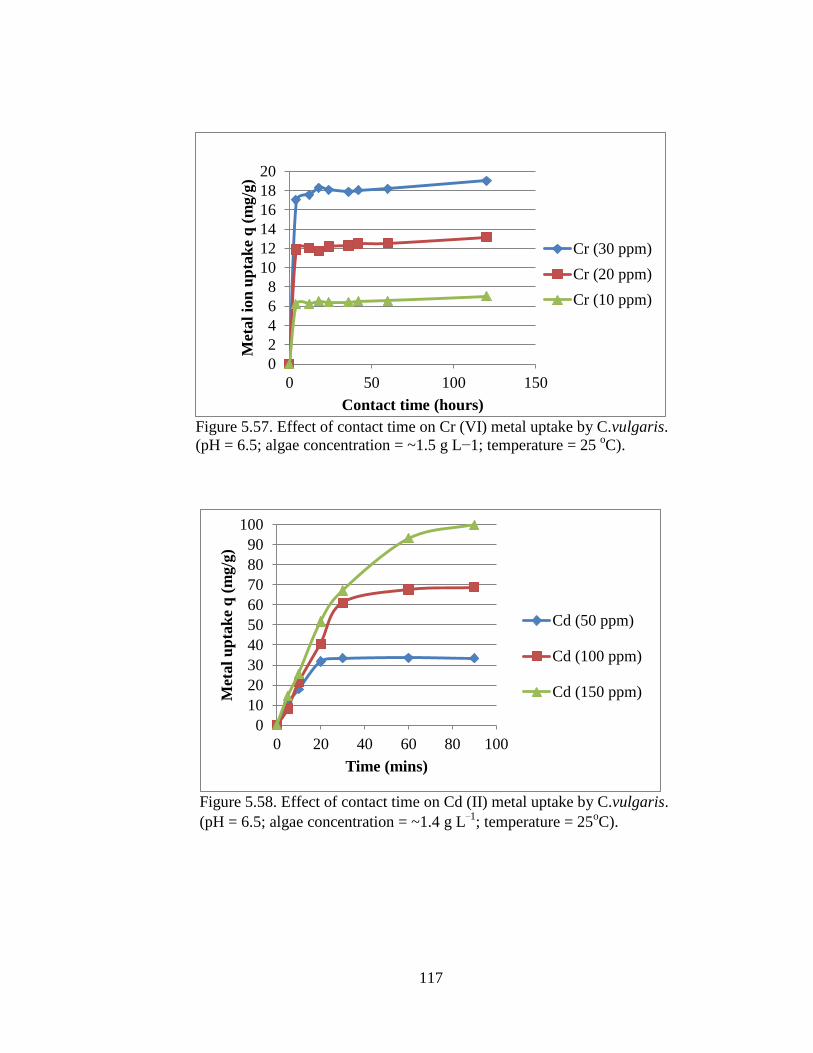
117
Figure 5.57. Effect of contact time on Cr (VI) metal uptake by C.vulgaris.
(pH = 6.5; algae concentration = ~1.5 g L−1; temperature = 25 oC).
Figure 5.58. Effect of contact time on Cd (II) metal uptake by C.vulgaris.
(pH = 6.5; algae concentration = ~1.4 g L−1; temperature = 25oC).
0
2
4
6
8
10
12
14
16
18
20
0 50 100 150
Met
al
ion
up
tak
e q
(m
g/g
)
Contact time (hours)
Cr (30 ppm)
Cr (20 ppm)
Cr (10 ppm)
0
10
20
30
40
50
60
70
80
90
100
0 20 40 60 80 100
Met
al
up
tak
e q
(m
g/g
)
Time (mins)
Cd (50 ppm)
Cd (100 ppm)
Cd (150 ppm)
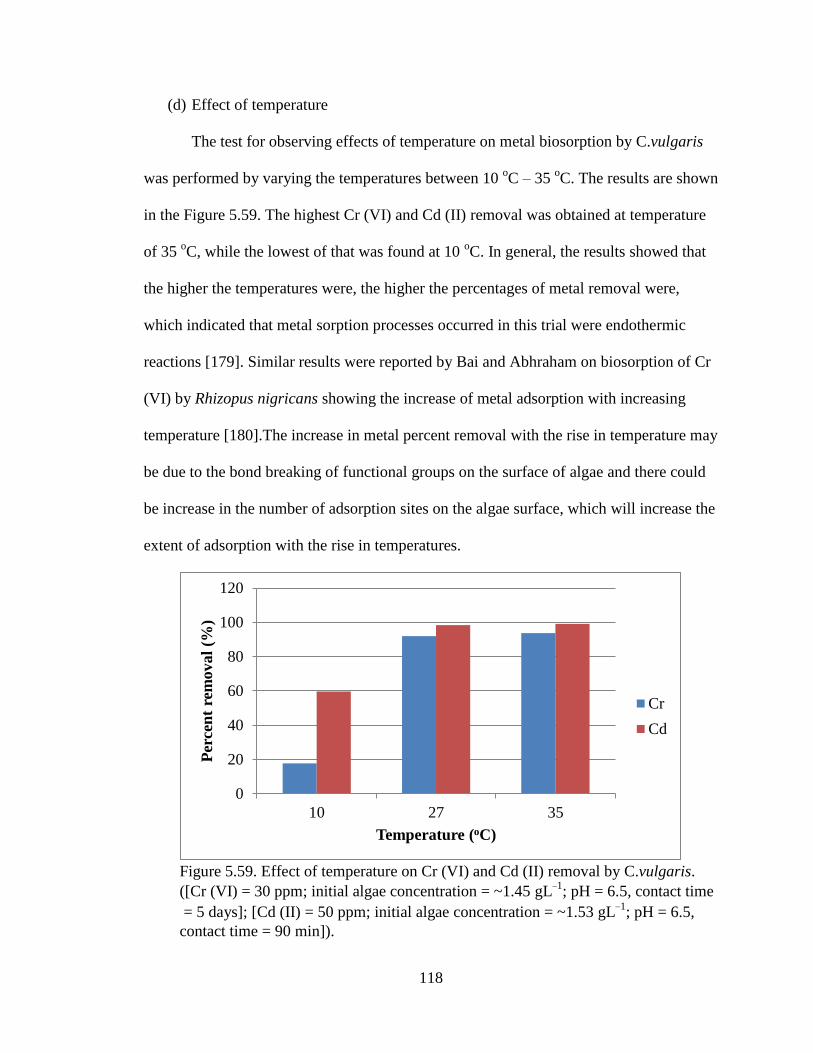
118
(d) Effect of temperature
The test for observing effects of temperature on metal biosorption by C.vulgaris
was performed by varying the temperatures between 10 oC – 35
oC. The results are shown
in the Figure 5.59. The highest Cr (VI) and Cd (II) removal was obtained at temperature
of 35 oC, while the lowest of that was found at 10
oC. In general, the results showed that
the higher the temperatures were, the higher the percentages of metal removal were,
which indicated that metal sorption processes occurred in this trial were endothermic
reactions [179]. Similar results were reported by Bai and Abhraham on biosorption of Cr
(VI) by Rhizopus nigricans showing the increase of metal adsorption with increasing
temperature [180].The increase in metal percent removal with the rise in temperature may
be due to the bond breaking of functional groups on the surface of algae and there could
be increase in the number of adsorption sites on the algae surface, which will increase the
extent of adsorption with the rise in temperatures.
Figure 5.59. Effect of temperature on Cr (VI) and Cd (II) removal by C.vulgaris.
([Cr (VI) = 30 ppm; initial algae concentration = ~1.45 gL−1; pH = 6.5, contact time
= 5 days]; [Cd (II) = 50 ppm; initial algae concentration = ~1.53 gL−1; pH = 6.5,
contact time = 90 min]).
0
20
40
60
80
100
120
10 27 35
Per
cen
t re
moval
(%)
Temperature (oC)
Cr
Cd
119
5.2.3 Kinetics Studies
The kinetics of metal sorption described by the relationship between contact time
and metal uptake by C.vulgaris for three initial Cr (VI) concentrations (10, 20 and 30
mg L−1) and three initial Cd (II) concentrations (50, 100 and 150 mg L−1) are discussed
below.
The kinetics was demonstrated to understand the sorption behavior of the
C.vulgaris and to find out the rate expressions. The kinetics of adsorption was studied by
using two kinetic models: pseudo first order and pseudo second order models.
Pseudo first order model: The model of the pseudo first order used is that of Lagergren
given by the Eq.
𝑑𝑞
𝑑𝑡= 𝑘1 (𝑞𝑒 − 𝑞𝑡)………………….Eq.5.8
Integration of Eq.5.8 in the conditions (t = 0, qt = 0) and (t = t, q = qt) gives:
log(𝑞𝑒 − 𝑞𝑡) = log 𝑞𝑒 − (𝑘1
2.303) 𝑡…….Eq.5.9
where, k1 is rate constant for adsorption (1/min) and qe and qt are amounts of adsorbed
metal (mg/g) at equilibrium and time t respectively.
If straight line obtains after plotting log (qe – qt) vs t, then it indicates that metal
adsorption is a pseudo first order. But, our experimental values didn’t follow a straight
line when data was plotted between log (qe – qt) vs t as shown in Figure 5.60. Then,
equations of Lagergren, a pseudo-second order mechanism was used for mathematical
description of adsorption of Cr (VI) and Cd (II). Adsorption constants were determined
from the equation to find out the adsorption capacity of C.vulgaris. Lagergren pseudo-
second order model kinetic equation defined as follows:
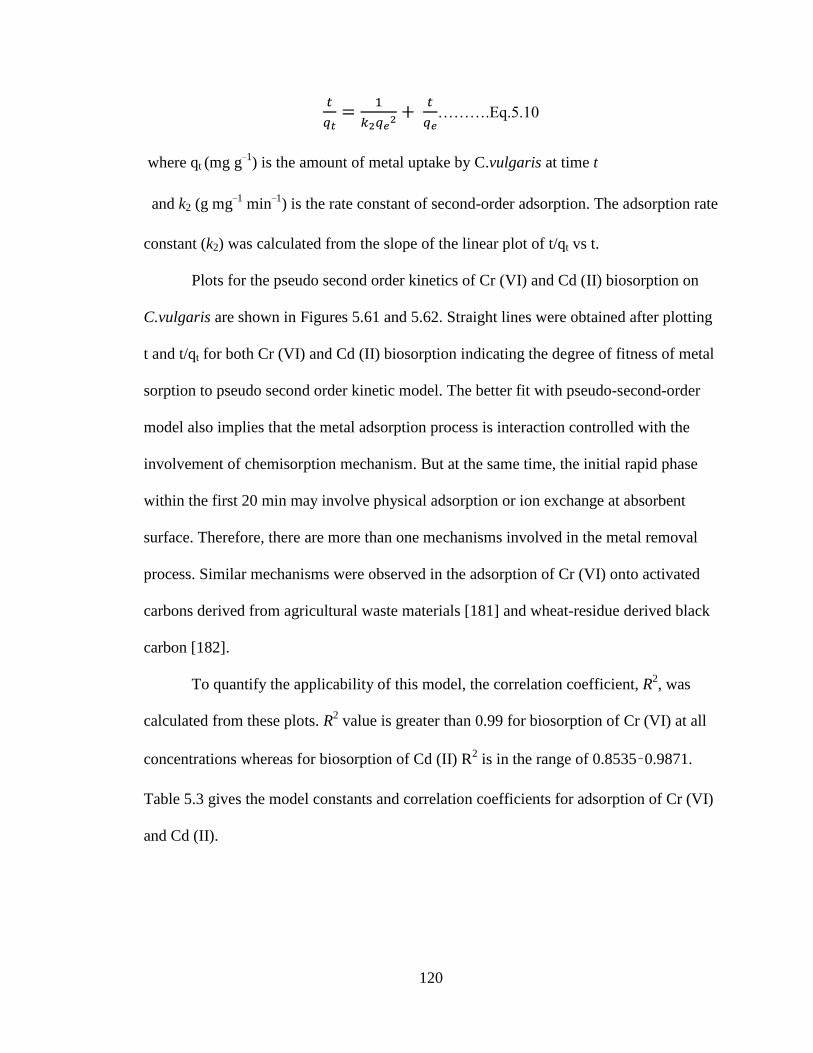
120
𝑡
𝑞𝑡=
1
𝑘2𝑞𝑒2
+ 𝑡
𝑞𝑒……….Eq.5.10
where qt (mg g−1) is the amount of metal uptake by C.vulgaris at time t
and k2 (g mg−1 min−1) is the rate constant of second-order adsorption. The adsorption rate
constant (k2) was calculated from the slope of the linear plot of t/qt vs t.
Plots for the pseudo second order kinetics of Cr (VI) and Cd (II) biosorption on
C.vulgaris are shown in Figures 5.61 and 5.62. Straight lines were obtained after plotting
t and t/qt for both Cr (VI) and Cd (II) biosorption indicating the degree of fitness of metal
sorption to pseudo second order kinetic model. The better fit with pseudo-second-order
model also implies that the metal adsorption process is interaction controlled with the
involvement of chemisorption mechanism. But at the same time, the initial rapid phase
within the first 20 min may involve physical adsorption or ion exchange at absorbent
surface. Therefore, there are more than one mechanisms involved in the metal removal
process. Similar mechanisms were observed in the adsorption of Cr (VI) onto activated
carbons derived from agricultural waste materials [181] and wheat-residue derived black
carbon [182].
To quantify the applicability of this model, the correlation coefficient, R2, was
calculated from these plots. R2 value is greater than 0.99 for biosorption of Cr (VI) at all
concentrations whereas for biosorption of Cd (II) R2 is in the range of 0.8535–0.9871.
Table 5.3 gives the model constants and correlation coefficients for adsorption of Cr (VI)
and Cd (II).
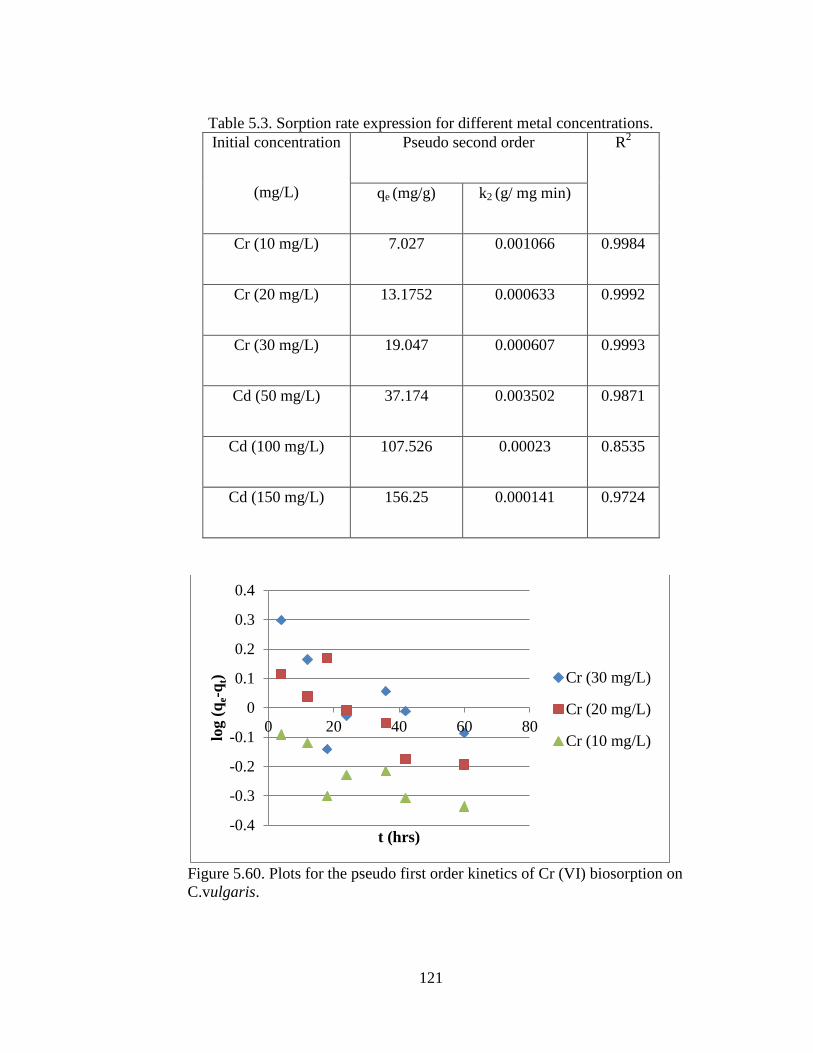
121
Table 5.3. Sorption rate expression for different metal concentrations.
Initial concentration
(mg/L)
Pseudo second order R2
qe (mg/g) k2 (g/ mg min)
Cr (10 mg/L) 7.027 0.001066 0.9984
Cr (20 mg/L) 13.1752 0.000633 0.9992
Cr (30 mg/L) 19.047 0.000607 0.9993
Cd (50 mg/L) 37.174 0.003502 0.9871
Cd (100 mg/L) 107.526 0.00023 0.8535
Cd (150 mg/L) 156.25 0.000141 0.9724
Figure 5.60. Plots for the pseudo first order kinetics of Cr (VI) biosorption on
C.vulgaris.
-0.4
-0.3
-0.2
-0.1
0
0.1
0.2
0.3
0.4
0 20 40 60 80
log (
qe-q
t)
t (hrs)
Cr (30 mg/L)
Cr (20 mg/L)
Cr (10 mg/L)
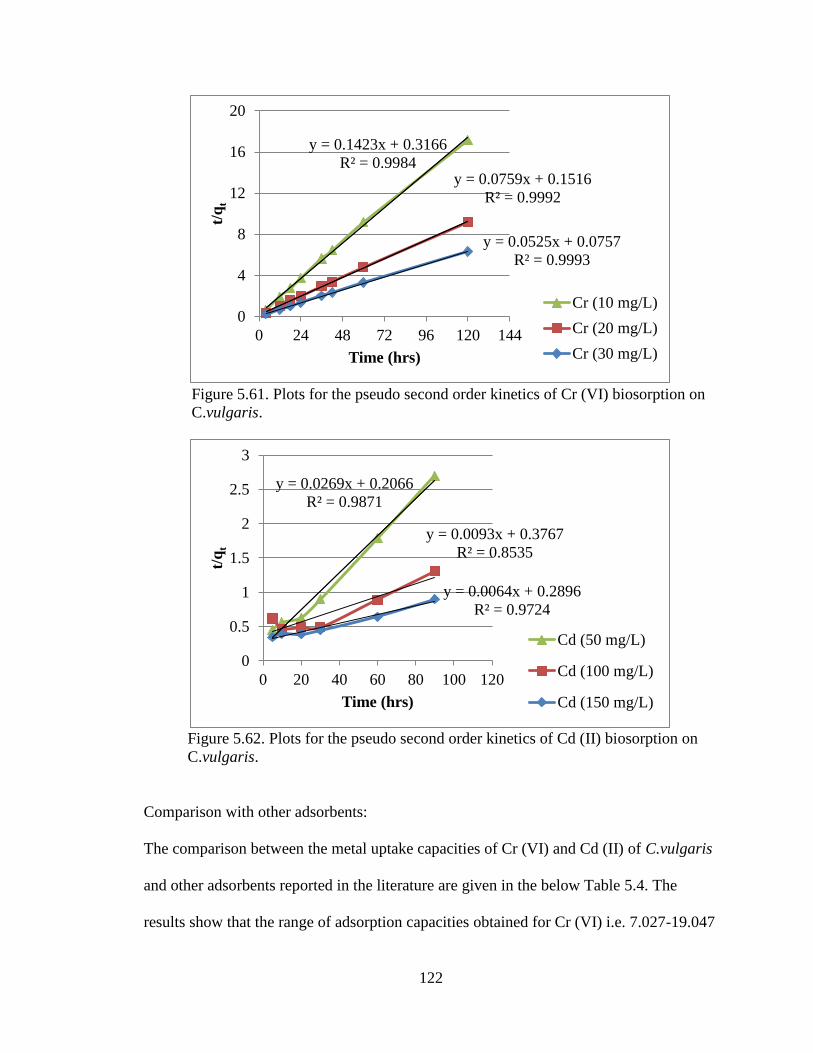
122
Figure 5.61. Plots for the pseudo second order kinetics of Cr (VI) biosorption on
C.vulgaris.
Figure 5.62. Plots for the pseudo second order kinetics of Cd (II) biosorption on
C.vulgaris.
Comparison with other adsorbents:
The comparison between the metal uptake capacities of Cr (VI) and Cd (II) of C.vulgaris
and other adsorbents reported in the literature are given in the below Table 5.4. The
results show that the range of adsorption capacities obtained for Cr (VI) i.e. 7.027-19.047
y = 0.1423x + 0.3166
R² = 0.9984 y = 0.0759x + 0.1516
R² = 0.9992
y = 0.0525x + 0.0757
R² = 0.9993
0
4
8
12
16
20
0 24 48 72 96 120 144
t/q
t
Time (hrs)
Cr (10 mg/L)
Cr (20 mg/L)
Cr (30 mg/L)
y = 0.0269x + 0.2066
R² = 0.9871
y = 0.0093x + 0.3767
R² = 0.8535
y = 0.0064x + 0.2896
R² = 0.9724
0
0.5
1
1.5
2
2.5
3
0 20 40 60 80 100 120
t/q
t
Time (hrs)
Cd (50 mg/L)
Cd (100 mg/L)
Cd (150 mg/L)
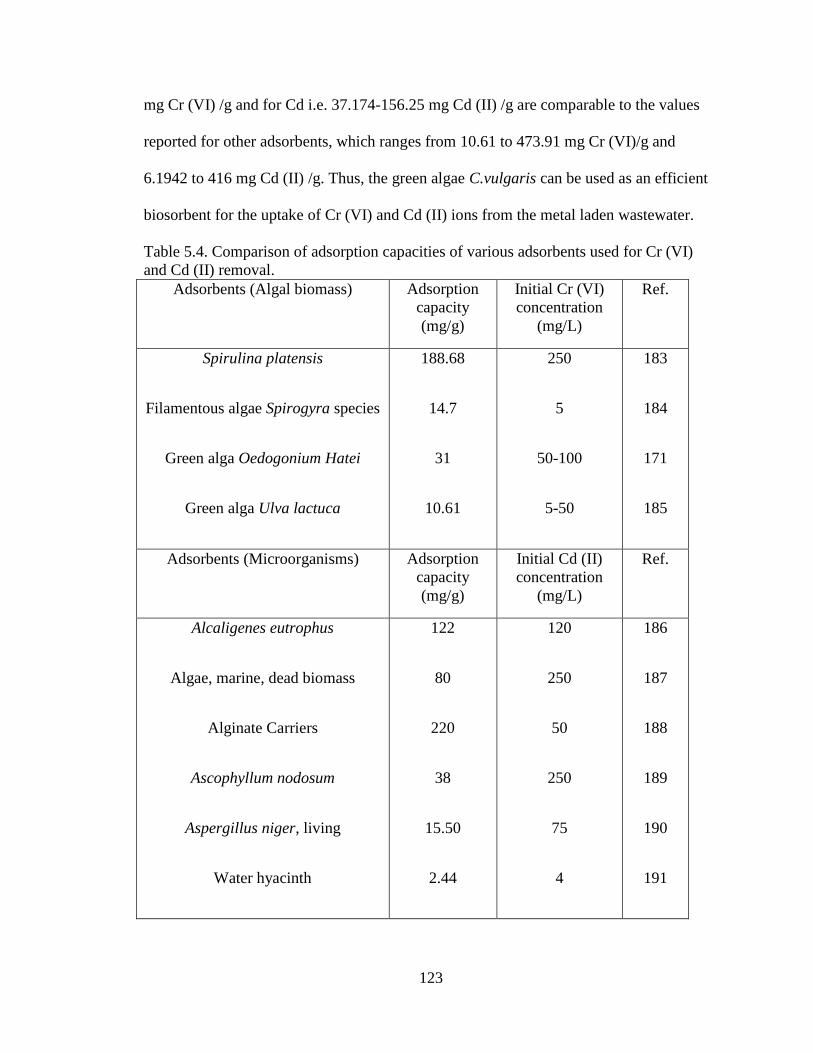
123
mg Cr (VI) /g and for Cd i.e. 37.174-156.25 mg Cd (II) /g are comparable to the values
reported for other adsorbents, which ranges from 10.61 to 473.91 mg Cr (VI)/g and
6.1942 to 416 mg Cd (II) /g. Thus, the green algae C.vulgaris can be used as an efficient
biosorbent for the uptake of Cr (VI) and Cd (II) ions from the metal laden wastewater.
Table 5.4. Comparison of adsorption capacities of various adsorbents used for Cr (VI)
and Cd (II) removal.
Adsorbents (Algal biomass) Adsorption
capacity
(mg/g)
Initial Cr (VI)
concentration
(mg/L)
Ref.
Spirulina platensis
Filamentous algae Spirogyra species
Green alga Oedogonium Hatei
Green alga Ulva lactuca
188.68
14.7
31
10.61
250
5
50-100
5-50
183
184
171
185
Adsorbents (Microorganisms) Adsorption
capacity
(mg/g)
Initial Cd (II)
concentration
(mg/L)
Ref.
Alcaligenes eutrophus
Algae, marine, dead biomass
Alginate Carriers
Ascophyllum nodosum
Aspergillus niger, living
Water hyacinth
122
80
220
38
15.50
2.44
120
250
50
250
75
4
186
187
188
189
190
191
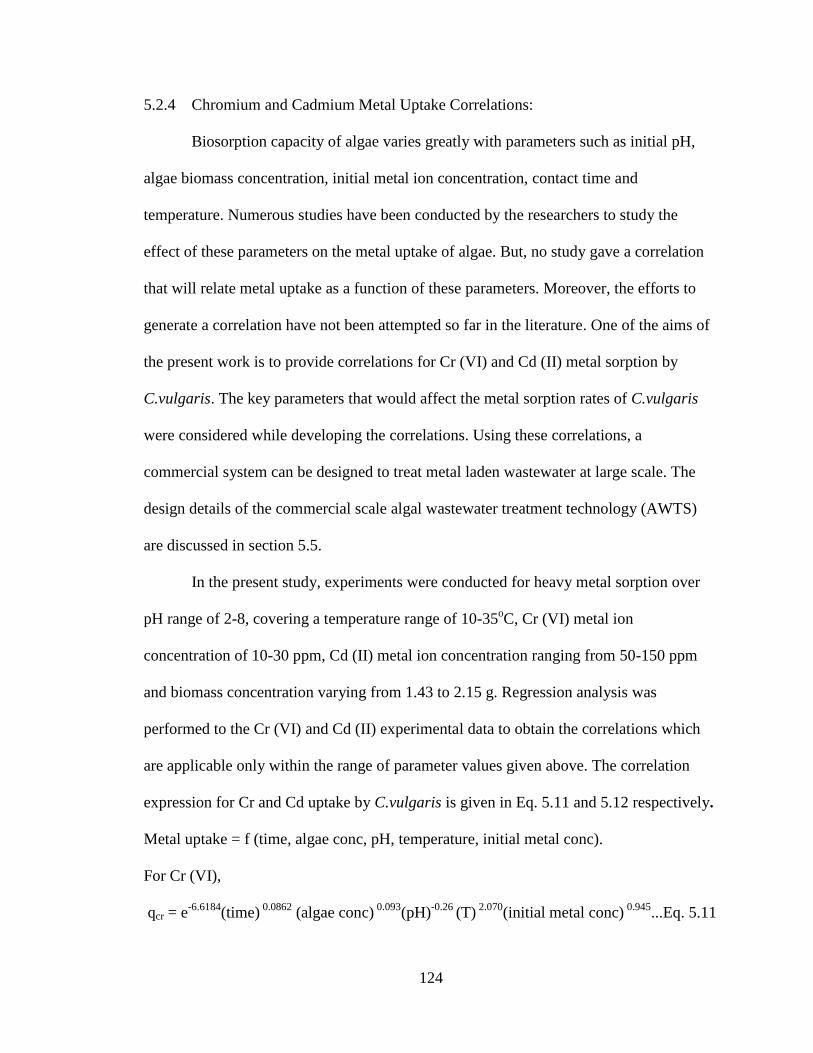
124
5.2.4 Chromium and Cadmium Metal Uptake Correlations:
Biosorption capacity of algae varies greatly with parameters such as initial pH,
algae biomass concentration, initial metal ion concentration, contact time and
temperature. Numerous studies have been conducted by the researchers to study the
effect of these parameters on the metal uptake of algae. But, no study gave a correlation
that will relate metal uptake as a function of these parameters. Moreover, the efforts to
generate a correlation have not been attempted so far in the literature. One of the aims of
the present work is to provide correlations for Cr (VI) and Cd (II) metal sorption by
C.vulgaris. The key parameters that would affect the metal sorption rates of C.vulgaris
were considered while developing the correlations. Using these correlations, a
commercial system can be designed to treat metal laden wastewater at large scale. The
design details of the commercial scale algal wastewater treatment technology (AWTS)
are discussed in section 5.5.
In the present study, experiments were conducted for heavy metal sorption over
pH range of 2-8, covering a temperature range of 10-35oC, Cr (VI) metal ion
concentration of 10-30 ppm, Cd (II) metal ion concentration ranging from 50-150 ppm
and biomass concentration varying from 1.43 to 2.15 g. Regression analysis was
performed to the Cr (VI) and Cd (II) experimental data to obtain the correlations which
are applicable only within the range of parameter values given above. The correlation
expression for Cr and Cd uptake by C.vulgaris is given in Eq. 5.11 and 5.12 respectively.
Metal uptake = f (time, algae conc, pH, temperature, initial metal conc).
For Cr (VI),
qcr = e-6.6184
(time) 0.0862
(algae conc) 0.093
(pH)-0.26
(T) 2.070
(initial metal conc) 0.945
...Eq. 5.11
125
For Cd (II),
qcd= e-4.035
(time) 0.476831
(algae conc) 1.09
(pH) 0.885
(T) 0.49
(initial metal conc) 0.945
….Eq.5.12
where the metal uptake, q, was in mg/g, algae concentrations in g/L, initial metal
concentration in mg/L, time in hours and temperature is in oC. The chromium metal
uptake correlation predicted a very strong dependency on pH, i.e. the increase in pH
would result in low Cr metal uptake. Dependency on algae concentration was relatively
less compared to the temperature effect on chromium metal uptake by C.vulgaris. In
contrast to the Cr metal uptake, Cd metal uptake of C.vulgaris strongly depend on algae
concentration and metal uptake increases with the increase in pH to certain extent
(upto pH 6).
Figure 5.63 and 5.64 shows the comparison of experimental values and correlated
values for Cr (VI) and Cd (II) metal uptake respectively. The observed experimental
metal uptake values show little variance from the correlated values. To quantify the
correlation, the correlation coefficient, R2, was calculated from these plots. R
2 is greater
than 0.99 for biosorption of Cd (II) and is 0.9653 for biosorption of Cr (VI) indicating
that the derived correlations are good fit for the experimental data.
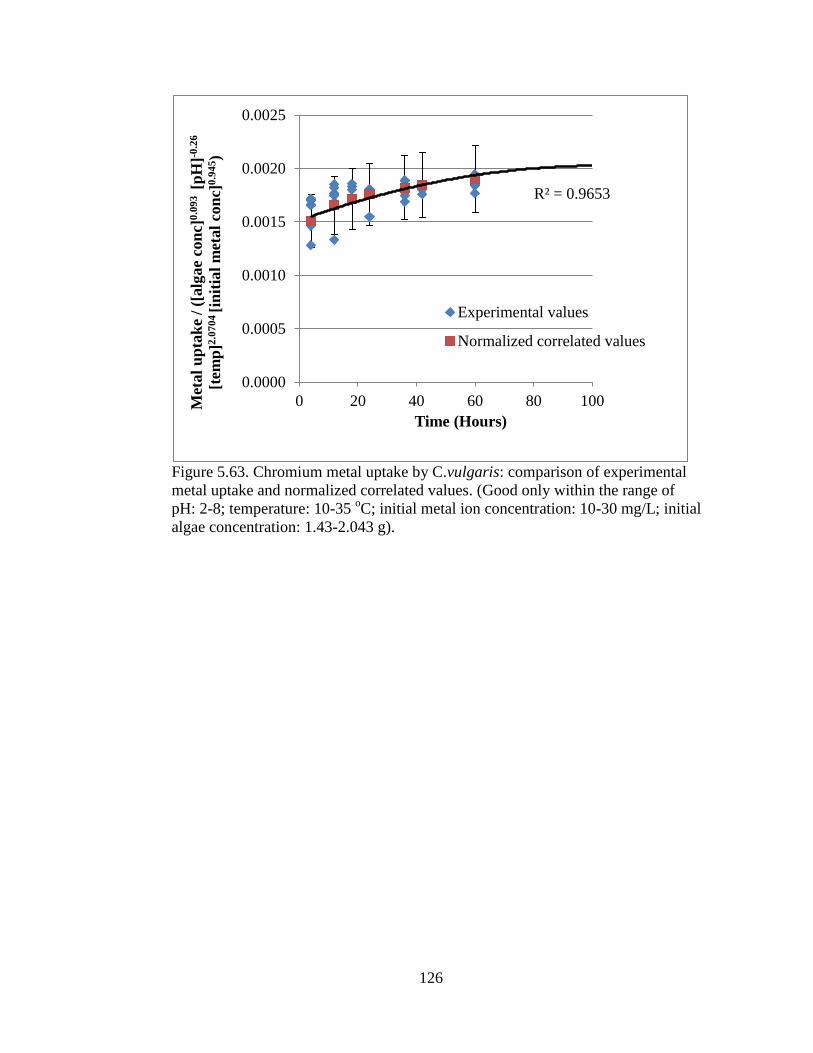
126
Figure 5.63. Chromium metal uptake by C.vulgaris: comparison of experimental
metal uptake and normalized correlated values. (Good only within the range of
pH: 2-8; temperature: 10-35 oC; initial metal ion concentration: 10-30 mg/L; initial
algae concentration: 1.43-2.043 g).
R² = 0.9653
0.0000
0.0005
0.0010
0.0015
0.0020
0.0025
0 20 40 60 80 100Met
al
up
tak
e /
([a
lga
e co
nc]
0.0
93
[p
H]-0
.26
[tem
p]2
.07
04
[in
itia
l m
etal
con
c]0
.94
5)
Time (Hours)
Experimental values
Normalized correlated values
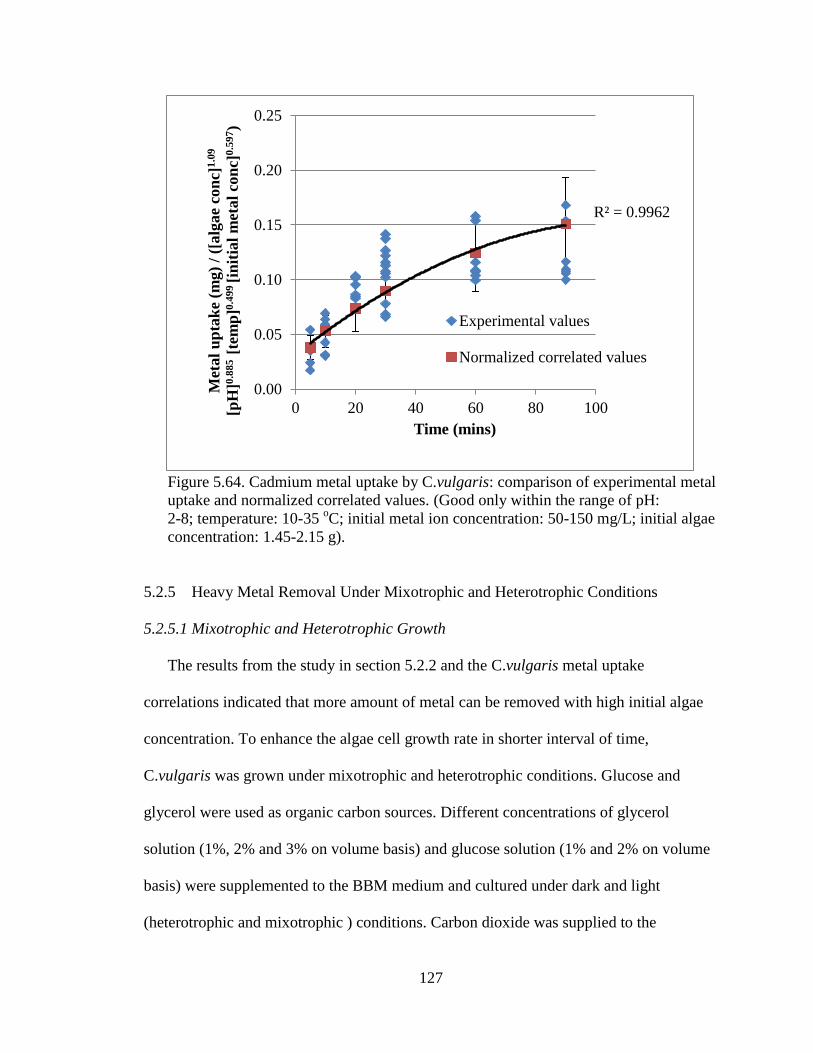
127
Figure 5.64. Cadmium metal uptake by C.vulgaris: comparison of experimental metal
uptake and normalized correlated values. (Good only within the range of pH:
2-8; temperature: 10-35 oC; initial metal ion concentration: 50-150 mg/L; initial algae
concentration: 1.45-2.15 g).
5.2.5 Heavy Metal Removal Under Mixotrophic and Heterotrophic Conditions
5.2.5.1 Mixotrophic and Heterotrophic Growth
The results from the study in section 5.2.2 and the C.vulgaris metal uptake
correlations indicated that more amount of metal can be removed with high initial algae
concentration. To enhance the algae cell growth rate in shorter interval of time,
C.vulgaris was grown under mixotrophic and heterotrophic conditions. Glucose and
glycerol were used as organic carbon sources. Different concentrations of glycerol
solution (1%, 2% and 3% on volume basis) and glucose solution (1% and 2% on volume
basis) were supplemented to the BBM medium and cultured under dark and light
(heterotrophic and mixotrophic ) conditions. Carbon dioxide was supplied to the
R² = 0.9962
0.00
0.05
0.10
0.15
0.20
0.25
0 20 40 60 80 100
Met
al
up
tak
e (m
g)
/ ([
alg
ae
con
c]1
.09
[pH
]0.8
85
[t
emp
]0.4
99
[in
itia
l m
etal
con
c]0
.59
7)
Time (mins)
Experimental values
Normalized correlated values
128
mixotrophically grown algae along with the organic carbon source. The autotrophic
control group was also cultivated in BBM with illumination.
(a) Growth curves
Results presented in Fig. 5.65 and Fig. 5.66 demonstrates the growth of
C.vulgaris under mixotrophic and heterotrophic conditions with glycerol and glucose as
organic carbon sources. The samples supplied with organic carbon sources were superior
in their growth compared to the autotrophic control. Growth rates of C.vulgaris
calculated by Eq.5.1. for different culture conditions were given in Table 5.5. The growth
rate of heterotrophic microalgae was higher followed by mixotrophic and phototrophic
microalgae. Algae grown heterotrophically with 3% glycerol as organic carbon source
achieved a growth rate of 0.86 day-1
whereas algae grown mixotrophically (with 3%
glycerol as organic carbon source) and phototrophically achieved growth rates of 0.7508
day-1
and 0.137 day-1
respectively. The heterotrophic microalgae had more than 6 times
higher growth rate than phototrophic algae. This is because the most significant
parameter for the growth of phototrophic microalgae is light intensity, while organic
carbon as a sole carbon source significantly affects to the growth of heterotrophic
microalgae, as heterotrophic microalgae grow under lightless condition [66]. Thus, the
reason for the slower growth rate of phototrophic microalgae observed in this study is
suspected to result from photo inhibition due to high microalgae cell density. In several
studies, heterotrophic microalgae presented more than 3-4 times higher growth rate than
phototrophic microalgae [192,193].
In mixotrophic conditions, more than five times higher microalgae growth was
observed compared to that in phototrophic condition. Similar observation was reported by
129
Bhatnagar et al. when C. minutissima was cultured in autotrophic, mixotrophic and
heterotrophic conditions; the growth rate in mixotrophic condition was more than 2 times
and 7 times higher than that in heterotrophic and autotrophic conditions respectively
[194]. However, when microalgae growth rate was compared between heterotrophic and
mixotrophic conditions in this study, the growth rate in mixotrophic conditions was less
than in heterotrophic condition. The low growth rate in mixotrophic culture compared to
heterotrophic culture might be due to low light intensity supplied to the mixotrophic
culture. According to Chojnacka and Noworyta, when microalgae growth rate was
compared between mixotrophic and heterotrophic conditions, the growth rate in
mixotrophic conditions with light intensity of 33 W m−2
was higher than in heterotrophic
conditions while the growth rate in mixotrophic conditions with light intensity of 17 W
m−2
was less than in heterotrophic conditions [195]. Therefore, light intensity is an
important factor for mixotrophic cultivation affecting to microalgae growth, and the
slower growth rate in mixotrophic conditions than in heterotrophic conditions observed in
this study is probably due to reduced light intensity.
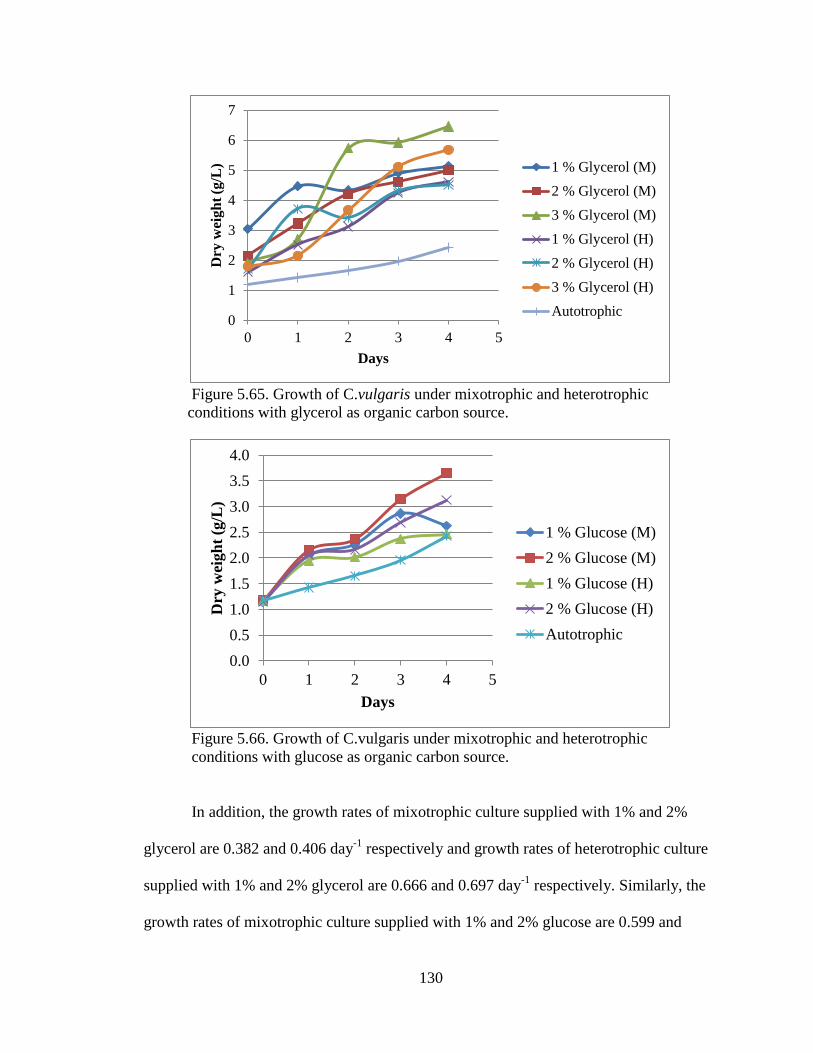
130
Figure 5.65. Growth of C.vulgaris under mixotrophic and heterotrophic
conditions with glycerol as organic carbon source.
Figure 5.66. Growth of C.vulgaris under mixotrophic and heterotrophic
conditions with glucose as organic carbon source.
In addition, the growth rates of mixotrophic culture supplied with 1% and 2%
glycerol are 0.382 and 0.406 day-1
respectively and growth rates of heterotrophic culture
supplied with 1% and 2% glycerol are 0.666 and 0.697 day-1
respectively. Similarly, the
growth rates of mixotrophic culture supplied with 1% and 2% glucose are 0.599 and
0
1
2
3
4
5
6
7
0 1 2 3 4 5
Dry
wei
gh
t (g
/L)
Days
1 % Glycerol (M)
2 % Glycerol (M)
3 % Glycerol (M)
1 % Glycerol (H)
2 % Glycerol (H)
3 % Glycerol (H)
Autotrophic
0.0
0.5
1.0
1.5
2.0
2.5
3.0
3.5
4.0
0 1 2 3 4 5
Dry
wei
gh
t (g
/L)
Days
1 % Glucose (M)
2 % Glucose (M)
1 % Glucose (H)
2 % Glucose (H)
Autotrophic
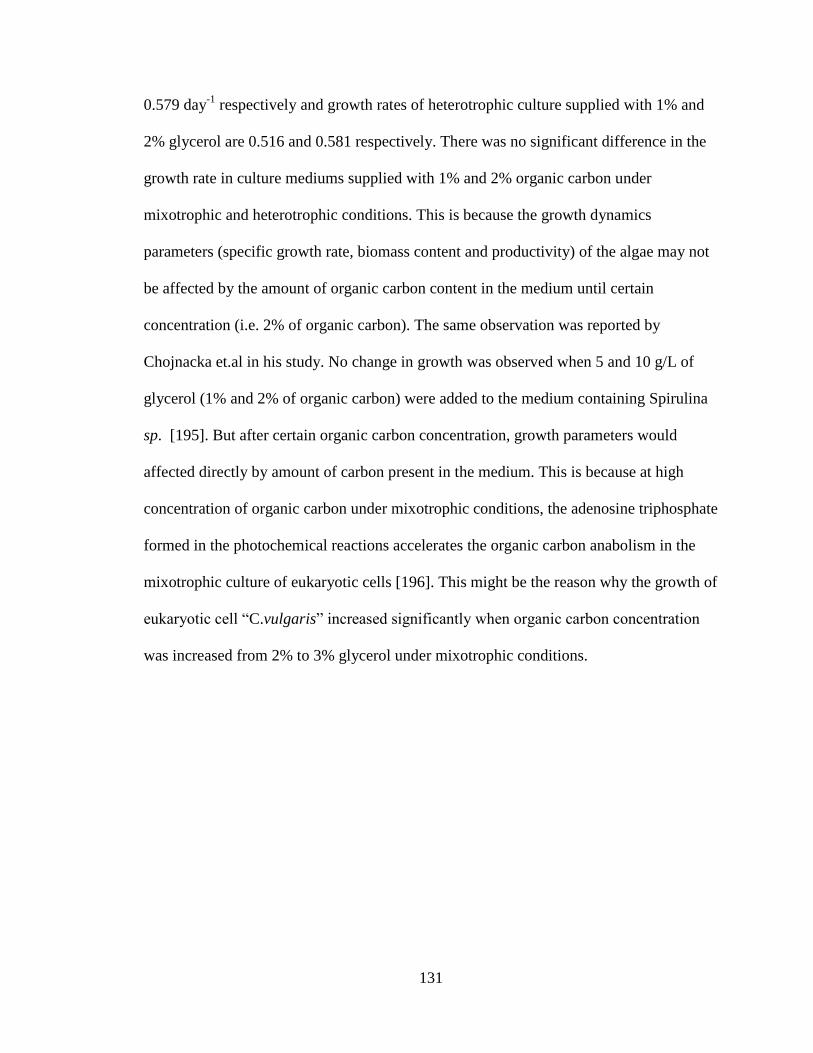
131
0.579 day-1
respectively and growth rates of heterotrophic culture supplied with 1% and
2% glycerol are 0.516 and 0.581 respectively. There was no significant difference in the
growth rate in culture mediums supplied with 1% and 2% organic carbon under
mixotrophic and heterotrophic conditions. This is because the growth dynamics
parameters (specific growth rate, biomass content and productivity) of the algae may not
be affected by the amount of organic carbon content in the medium until certain
concentration (i.e. 2% of organic carbon). The same observation was reported by
Chojnacka et.al in his study. No change in growth was observed when 5 and 10 g/L of
glycerol (1% and 2% of organic carbon) were added to the medium containing Spirulina
sp. [195]. But after certain organic carbon concentration, growth parameters would
affected directly by amount of carbon present in the medium. This is because at high
concentration of organic carbon under mixotrophic conditions, the adenosine triphosphate
formed in the photochemical reactions accelerates the organic carbon anabolism in the
mixotrophic culture of eukaryotic cells [196]. This might be the reason why the growth of
eukaryotic cell “C.vulgaris” increased significantly when organic carbon concentration
was increased from 2% to 3% glycerol under mixotrophic conditions.
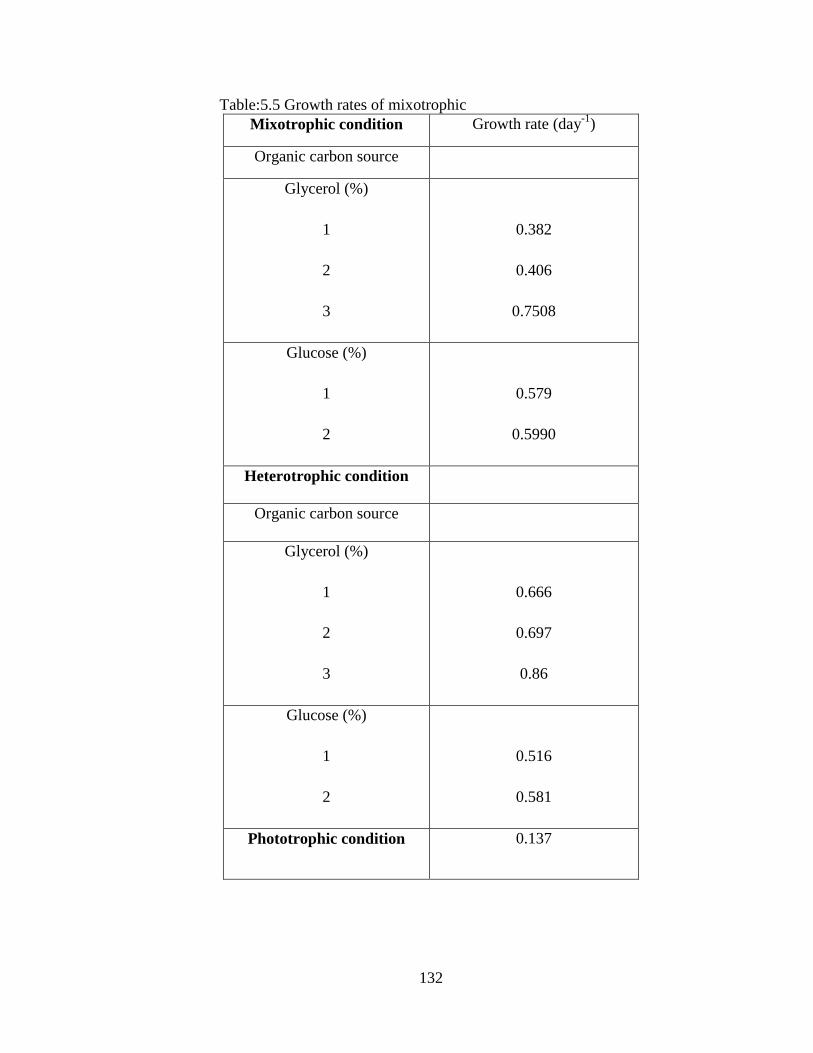
132
Table:5.5 Growth rates of mixotrophic
Mixotrophic condition Growth rate (day-1
)
Organic carbon source
Glycerol (%)
1
2
3
0.382
0.406
0.7508
Glucose (%)
1
2
0.579
0.5990
Heterotrophic condition
Organic carbon source
Glycerol (%)
1
2
3
0.666
0.697
0.86
Glucose (%)
1
2
0.516
0.581
Phototrophic condition 0.137
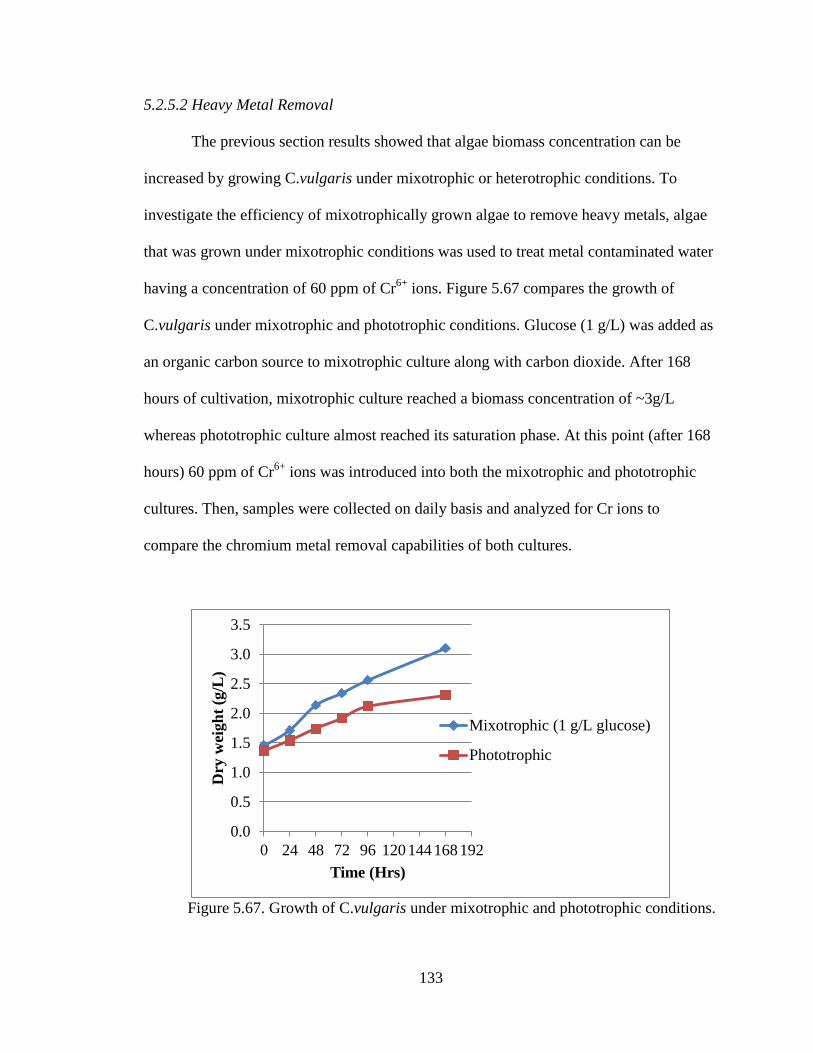
133
5.2.5.2 Heavy Metal Removal
The previous section results showed that algae biomass concentration can be
increased by growing C.vulgaris under mixotrophic or heterotrophic conditions. To
investigate the efficiency of mixotrophically grown algae to remove heavy metals, algae
that was grown under mixotrophic conditions was used to treat metal contaminated water
having a concentration of 60 ppm of Cr6+
ions. Figure 5.67 compares the growth of
C.vulgaris under mixotrophic and phototrophic conditions. Glucose (1 g/L) was added as
an organic carbon source to mixotrophic culture along with carbon dioxide. After 168
hours of cultivation, mixotrophic culture reached a biomass concentration of ~3g/L
whereas phototrophic culture almost reached its saturation phase. At this point (after 168
hours) 60 ppm of Cr6+
ions was introduced into both the mixotrophic and phototrophic
cultures. Then, samples were collected on daily basis and analyzed for Cr ions to
compare the chromium metal removal capabilities of both cultures.
Figure 5.67. Growth of C.vulgaris under mixotrophic and phototrophic conditions.
0.0
0.5
1.0
1.5
2.0
2.5
3.0
3.5
0 24 48 72 96 120144 168 192
Dry
wei
gh
t (g
/L)
Time (Hrs)
Mixotrophic (1 g/L glucose)
Phototrophic
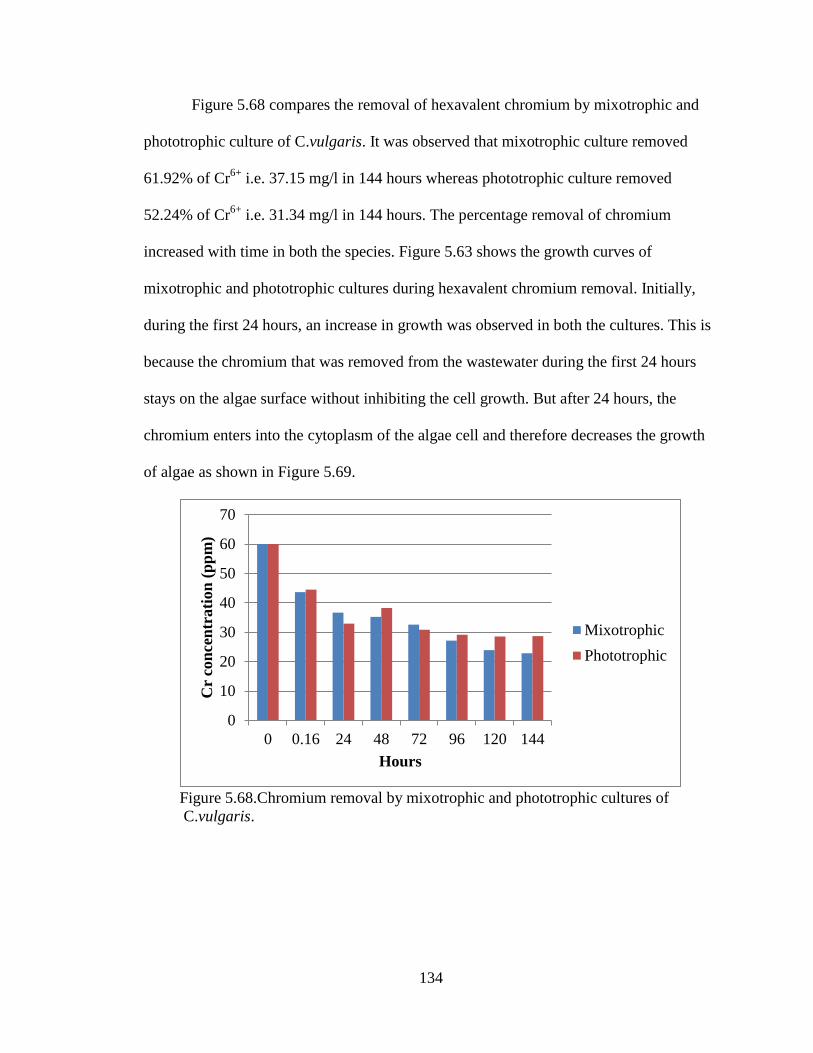
134
Figure 5.68 compares the removal of hexavalent chromium by mixotrophic and
phototrophic culture of C.vulgaris. It was observed that mixotrophic culture removed
61.92% of Cr6+
i.e. 37.15 mg/l in 144 hours whereas phototrophic culture removed
52.24% of Cr6+
i.e. 31.34 mg/l in 144 hours. The percentage removal of chromium
increased with time in both the species. Figure 5.63 shows the growth curves of
mixotrophic and phototrophic cultures during hexavalent chromium removal. Initially,
during the first 24 hours, an increase in growth was observed in both the cultures. This is
because the chromium that was removed from the wastewater during the first 24 hours
stays on the algae surface without inhibiting the cell growth. But after 24 hours, the
chromium enters into the cytoplasm of the algae cell and therefore decreases the growth
of algae as shown in Figure 5.69.
Figure 5.68.Chromium removal by mixotrophic and phototrophic cultures of
C.vulgaris.
0
10
20
30
40
50
60
70
0 0.16 24 48 72 96 120 144
Cr
con
cen
trati
on
(p
pm
)
Hours
Mixotrophic
Phototrophic
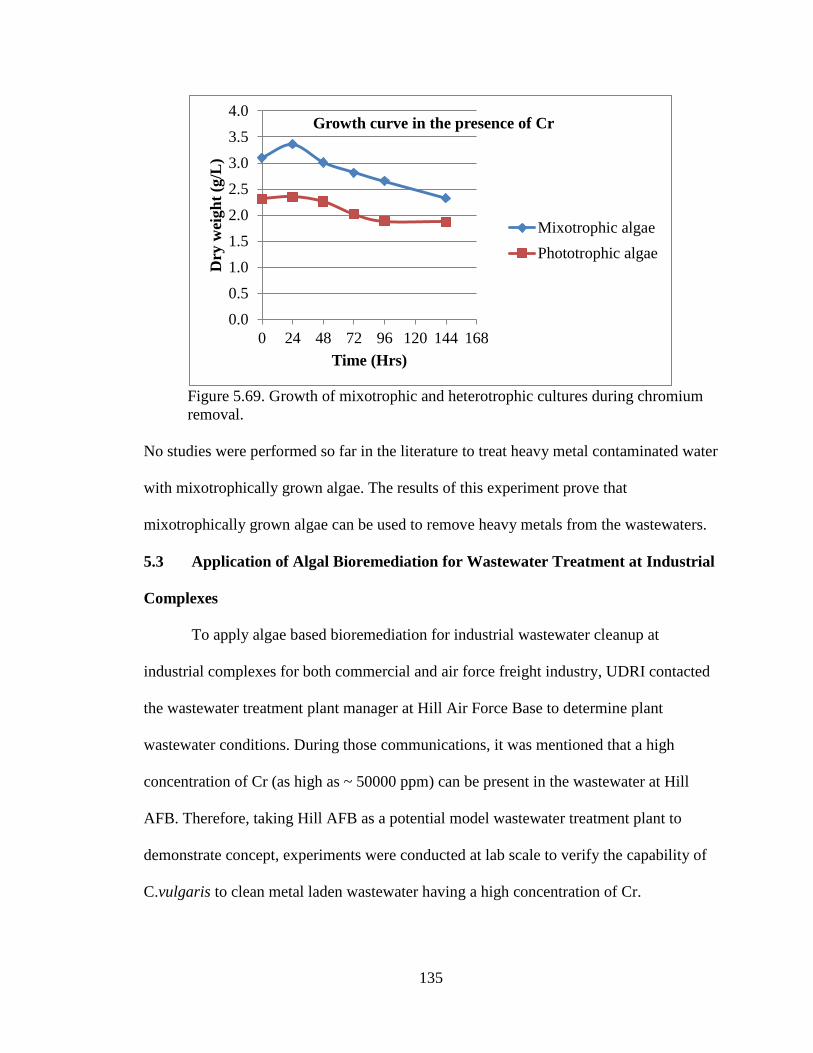
135
Figure 5.69. Growth of mixotrophic and heterotrophic cultures during chromium
removal.
No studies were performed so far in the literature to treat heavy metal contaminated water
with mixotrophically grown algae. The results of this experiment prove that
mixotrophically grown algae can be used to remove heavy metals from the wastewaters.
5.3 Application of Algal Bioremediation for Wastewater Treatment at Industrial
Complexes
To apply algae based bioremediation for industrial wastewater cleanup at
industrial complexes for both commercial and air force freight industry, UDRI contacted
the wastewater treatment plant manager at Hill Air Force Base to determine plant
wastewater conditions. During those communications, it was mentioned that a high
concentration of Cr (as high as ~ 50000 ppm) can be present in the wastewater at Hill
AFB. Therefore, taking Hill AFB as a potential model wastewater treatment plant to
demonstrate concept, experiments were conducted at lab scale to verify the capability of
C.vulgaris to clean metal laden wastewater having a high concentration of Cr.
0.0
0.5
1.0
1.5
2.0
2.5
3.0
3.5
4.0
0 24 48 72 96 120 144 168
Dry
wei
gh
t (g
/L)
Time (Hrs)
Growth curve in the presence of Cr
Mixotrophic algae
Phototrophic algae
136
High concentration Cr (VI) removal experiments were performed in falcon
centrifuge tubes of volume 50 ml containing 30 ml of Cr (VI) stock solution at ~35000
ppm and 6 g of wet biomass. Metal-bearing suspensions were kept at 25 oC on a vortexer
for 24 hours. At regular time intervals, 2 mL samples were collected from the bottles,
filtered and analyzed for residual Cr (VI) concentration and total chromium concentration
in solution. Figure 5.70 shows the variation of chromium percent removal with time for
C.vulgaris. It can be observed from the Figure 5 that the maximum chromium removal
(~30%) was achieved within the first 60 minutes. After 1 hour (60 minutes), no
significant change in the percentage removal was observed. A total of 10959 ppm of Cr
(31%) was removed at the end of 24 hours. After 24 hours, algae metal suspension was
centrifuged to separate algae from metal solution. The separated metal solution having a
Cr concentration of 23,744 ppm was again treated with 6 g of fresh wet algae paste for 24
hours. A sample of 2 ml was taken at the end of 24 hours to see the chromium removal
efficiency of C.vulgaris. Results of the analysis showed that a total of 9,129 ppm of Cr
(38%) was removed from the metal contaminated water. Figure 5.71 compares the
chromium removal of C.vulgaris for two biomass treatment cycles for 1 hour. Similarly,
an experiment was performed to investigate the capability of C.vulgaris to remove a high
concentration of cadmium from wastewater. Figure 5.72 shows the cadmium removal
capability of C.vulgaris. A total amount of 13,093 ppm of Cd was removed from the
wastewater in 1 hour. The results of these experiments proved that C.vulgaris was
capable of removing high concentrations of Cd and Cr from wastewater.
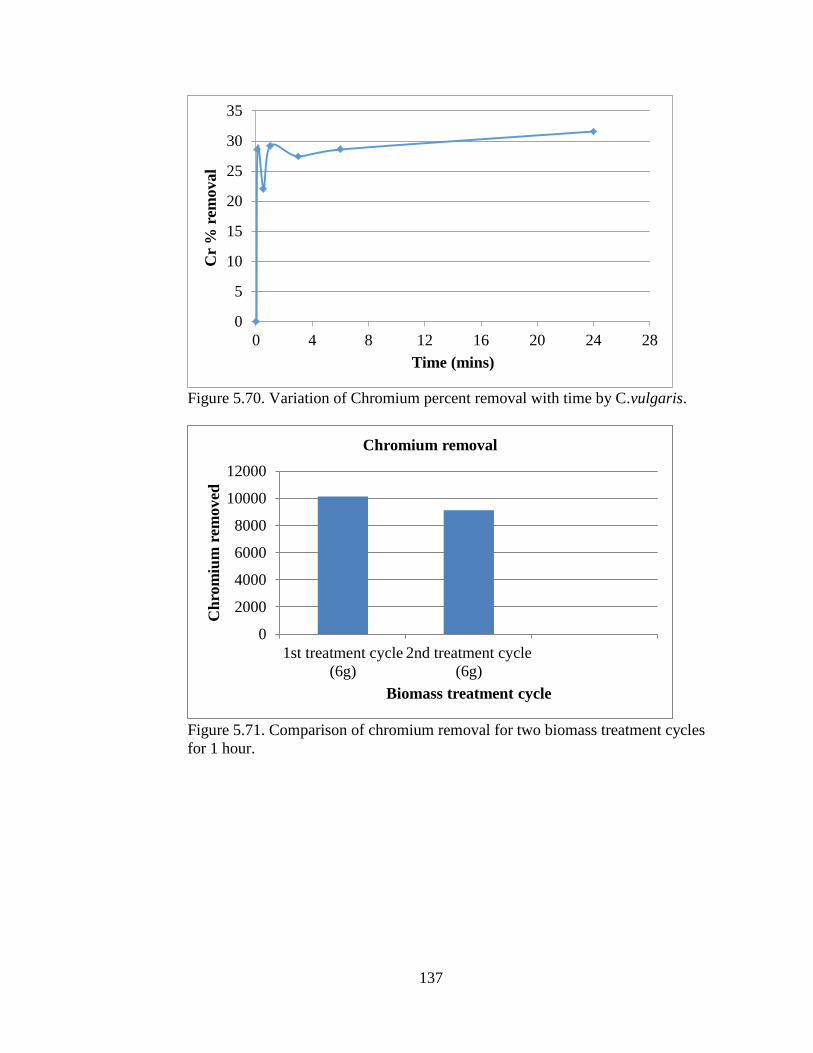
137
Figure 5.70. Variation of Chromium percent removal with time by C.vulgaris.
Figure 5.71. Comparison of chromium removal for two biomass treatment cycles
for 1 hour.
0
5
10
15
20
25
30
35
0 4 8 12 16 20 24 28
Cr
% r
emoval
Time (mins)
0
2000
4000
6000
8000
10000
12000
1st treatment cycle
(6g)
2nd treatment cycle
(6g)
Ch
rom
ium
rem
oved
Biomass treatment cycle
Chromium removal
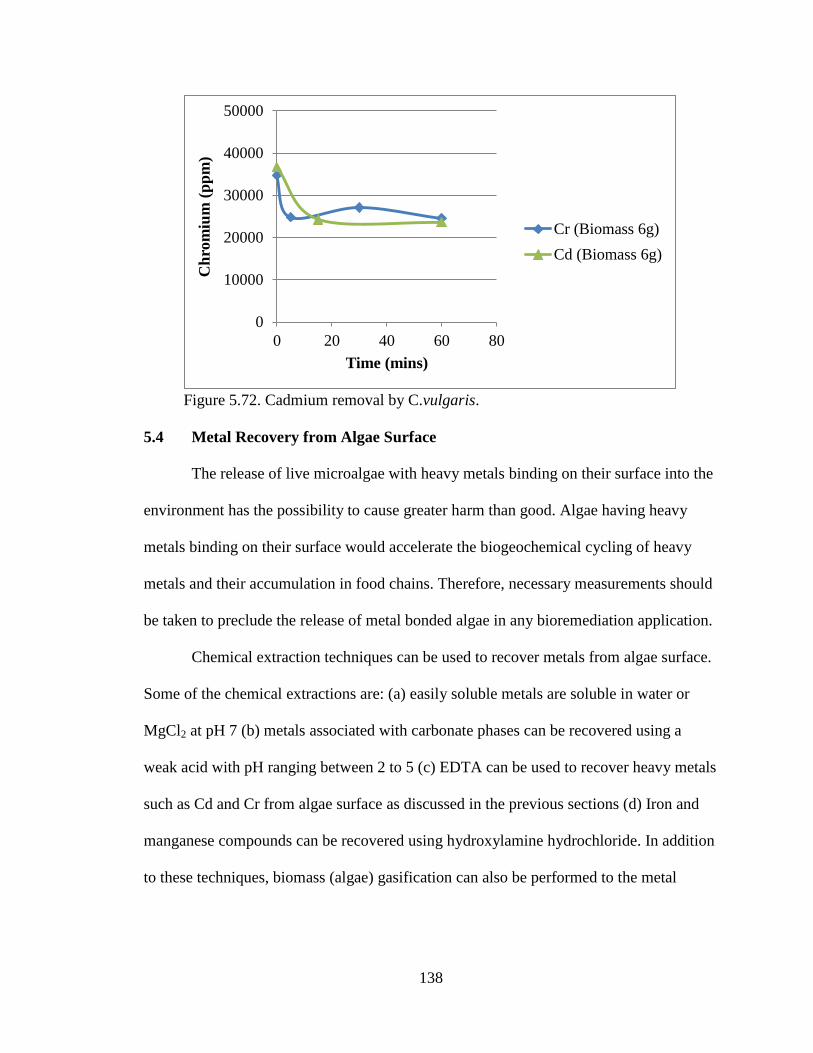
138
Figure 5.72. Cadmium removal by C.vulgaris.
5.4 Metal Recovery from Algae Surface
The release of live microalgae with heavy metals binding on their surface into the
environment has the possibility to cause greater harm than good. Algae having heavy
metals binding on their surface would accelerate the biogeochemical cycling of heavy
metals and their accumulation in food chains. Therefore, necessary measurements should
be taken to preclude the release of metal bonded algae in any bioremediation application.
Chemical extraction techniques can be used to recover metals from algae surface.
Some of the chemical extractions are: (a) easily soluble metals are soluble in water or
MgCl2 at pH 7 (b) metals associated with carbonate phases can be recovered using a
weak acid with pH ranging between 2 to 5 (c) EDTA can be used to recover heavy metals
such as Cd and Cr from algae surface as discussed in the previous sections (d) Iron and
manganese compounds can be recovered using hydroxylamine hydrochloride. In addition
to these techniques, biomass (algae) gasification can also be performed to the metal
0
10000
20000
30000
40000
50000
0 20 40 60 80
Ch
rom
ium
(p
pm
)
Time (mins)
Cr (Biomass 6g)
Cd (Biomass 6g)
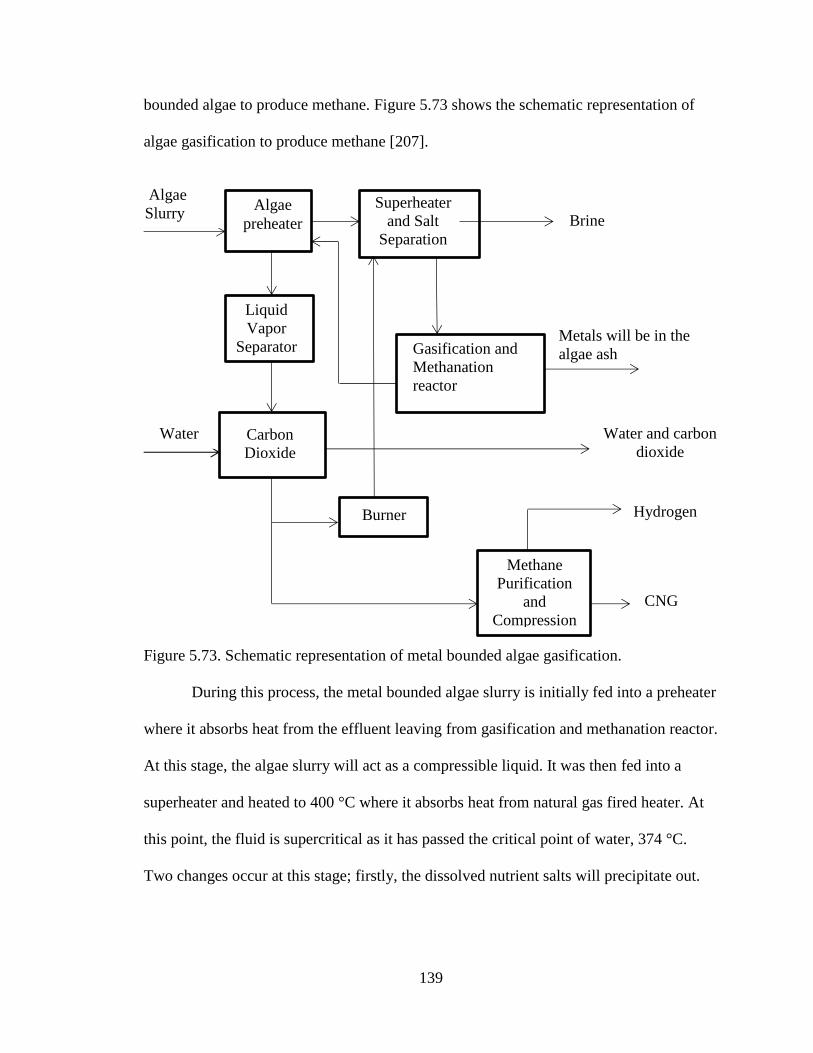
139
bounded algae to produce methane. Figure 5.73 shows the schematic representation of
algae gasification to produce methane [207].
Figure 5.73. Schematic representation of metal bounded algae gasification.
During this process, the metal bounded algae slurry is initially fed into a preheater
where it absorbs heat from the effluent leaving from gasification and methanation reactor.
At this stage, the algae slurry will act as a compressible liquid. It was then fed into a
superheater and heated to 400 °C where it absorbs heat from natural gas fired heater. At
this point, the fluid is supercritical as it has passed the critical point of water, 374 °C.
Two changes occur at this stage; firstly, the dissolved nutrient salts will precipitate out.
Algae
preheater
Superheater
and Salt
Separation
Gasification and
Methanation
reactor
Liquid
Vapor
Separator
Carbon
Dioxide
Scrubber
Methane
Purification
and
Compression
Burner
Algae
Slurry Brine
CNG
Hydrogen
Water Water and carbon
dioxide
Metals will be in the
algae ash
140
Secondly, the algae begin to degrade into a syngas. Salts are removed and the desalted
algae slurry is fed into gasification and methanation reactor where it interacts with a
Ru/C catalyst. The reaction converts the incoming algae material to a mixture of gasses
such as carbon monoxide, carbon dioxide, methane, hydrogen etc. 4-9). This reaction is
exothermic and heat produced during this reaction is used to heat the incoming algae
slurry. The gas mixture was then passed through a carbon dioxide scrubber to separate
carbon dioxide and was fed into methane purification chamber to obtain natural gas. A
secondary product hydrogen is also produced during this process. The metals bounded to
the algae surface will be present in the gasification ash and this ash can be used as an
ingredient during cement production.
5.5 Design of Algae-based Wastewater Treatment Technology (AWTS)
This report addresses major considerations for designing commercial algae based
wastewater treatment system (AWTS) to treat industrial wastewater containing high
amounts of nitrates, phosphates and heavy metals. AWTS is a technology that is cost
effective, requires low maintenance, and has minimal operator requirements. This design
is divided into two sections: the first section being devoted to algae growth under
heterotrophic conditions and other for treating industrial wastewater. Both these sections
are discussed in more detail below.
In this design open raceway pond was used for treating wastewater, a technology
already used in commercial microalgae production plants and some pilot scale biofuels
projects. The design of this report differs from existing commercial designs in cultivating
the algae heterotrophically in a continuous stirred tank reactor prior to treating
wastewater. It was demonstrated in our lab scale system and studies conducted by Bashan
141
et.al [197] shows that heterotrophically grown algae can efficiently clean wastewater
containing nitrates, phosphates and heavy metals (Cr, Cd). A correlation was developed
from the experimental studies for metal uptake of algae (chlorella vulgaris) as a function
of biomass concentration, initial metal concentration, time, pH, temperature and light
intensity. Using this correlation, for a given contaminant (nitrates, phosphates, metals)
concentration in the raceway pond, contact time and initial biomass needed to treat
wastewater can be known. The results of the lab scale experiments conducted at UDRI
proved that cost and time to clean wastewater can be reduced considerably by growing
algae heterotrophically initially as lag phase of algae can be avoided in the race way
pond. Also, known concentration of algae can be introduced directly into the pond
depending on the contaminant present in the wastewater.
5.5.1 Technology Assumptions
This report assumes that a piping network or some other collection system (e.g.,
tank trucks) is in place that carries wastewater from individual sources to the AWTS
plant. It also assumes that carbon dioxide from flue gas was separated and stored near
treatment facility to feed the algae. Paddlewheels, on a 2-hp, 1-phase, 230V/60 Hz motor
approximately 2.5m wide were used to mix the pond. Paddle wheel rotates providing a
current of 25cm/s around the pond to degasify dissolve oxygen in the pond and to ensure
that carbon dioxide is uniformly distributed over the pond.
Volume of wastewater treated in AWTS design was assumed to be 200,000 liters.
To meet this volume, a heterotrophic growth chamber of volume 25 m3 and a race way
pond of 1000 m2 area were designed. Race way pond is 77m in length, 15 m wide, and 20
cm in depth corresponding to a volume of 200,000 liters. Growth chamber is assumed to
142
be cylindrical having a diameter of 4m and height of 2m. For each batch of wastewater
(200,000 liters) treated in the pond, glucose concentration of 5 g/L will be used as an
organic carbon source for heterotrophic cell growth in the growth chamber containing
40,000 liters of algae solution. A pilot scale microfiltration system followed by
centrifugation was installed at the harvest station of the race way pond.
5.5.2 Site Location and Climatic Conditions
Generally, tropical or semi-tropical areas are the preferable locations for treating
wastewater with this technology. But to implement this design in cold climatic locations
geothermal systems are to be installed near the pond surface to maintain the temperature
shown in Table 5.6 for algae to remove contaminants from wastewater. The following
parameters are to be considered while selecting location for wastewater treatment.
(a) Evaporation: Evaporation is a major problem in dry tropical areas. A high
evaporation rate increases salt concentration in wastewater and pumping cost due
to water loss.
(b) Humidity: With high relative humidity and no winds the water may heat up (even
to 40 o C). With low humidity, high rates of evaporation occur that can have a
cooling effect on the medium. The best humidity is at an average humidity of
40%.
(c) Location: Site close to the wastewater treatment plant and heavy metal industry
would be ideal as there won’t be too much cost (long piping can be avoided)
involved for transporting waste effluent to the AWTS facility.
143
5.5.3 Design Theory
A schematic of the AWTS bioreactor set-up that is being designed for treating
wastewater is shown in Figure 5.76. It mainly consists of the heterotrophic growth
chamber (CSTR) of volume 25 m3
and an open race way pond of area 1000 m2. Both
these sections are discussed in detail below.
(a) Heterotrophic growth chamber
The components that make up the heterotrophic growth chamber include the
bioreactor, compressor and mixer. Reactor was jacketed to maintain constant temperature
throughout the process. All sensors (temperature, level, pH, pressure and dissolved
oxygen) are installed within the bioreactor. An impeller driven by a motor was installed
inside the reactor to mix the feed and to keep algae solution homogenous. Compressed air
was passed through the air filter and introduced at the bottom of the bioreactor through a
sparger. Bioreactor was equipped with air outflow and safety pressure relief valve
protected from contamination.
To design a cost effective bioreactor, the starting point of the design optimization
is to choose a bioreactor size, with specific algae of known biomass concentration (0.1
g/L). A flowchart of the entire design optimization strategy used is given in Figure 5.74
[198]. The details of each step, with accompanying equations, constraints, and references
follow. The main focus of the strategy is to minimize the cost of the CSTR. The total cost
includes both the capital cost of the equipment and the operating cost.
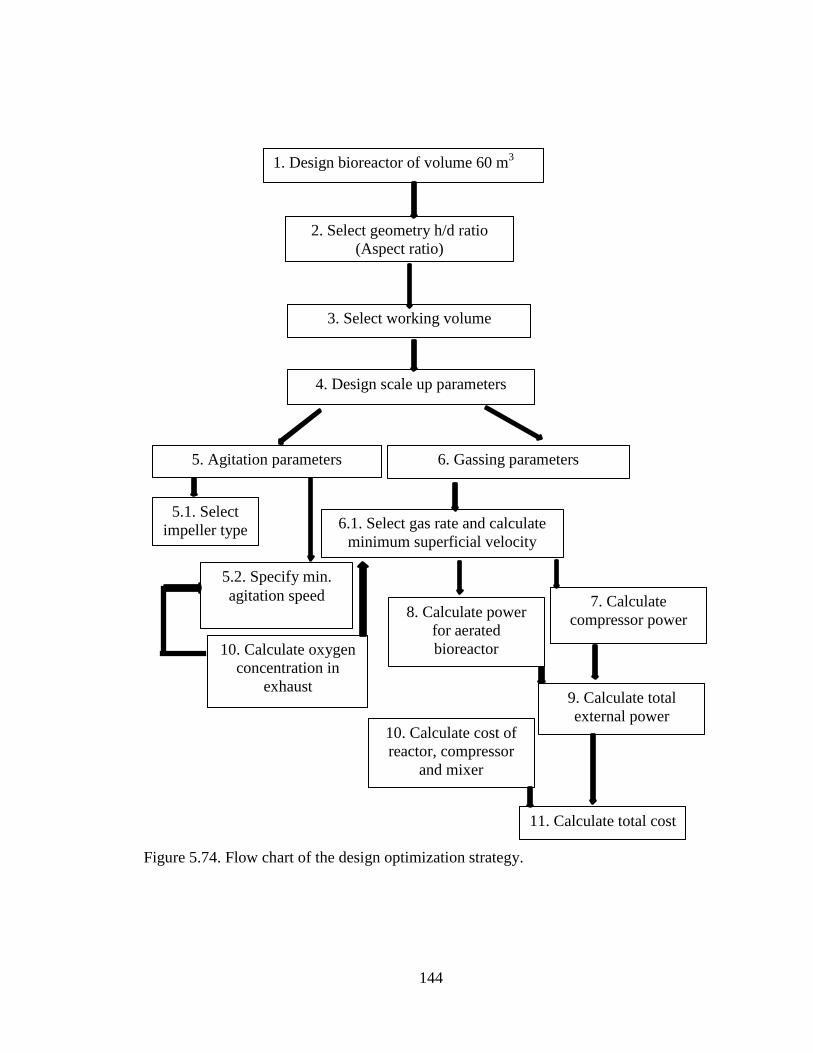
144
Figure 5.74. Flow chart of the design optimization strategy.
7. Calculate
compressor power
5.1. Select
impeller type
1. Design bioreactor of volume 60 m3
11. Calculate total cost
8. Calculate power
for aerated
bioreactor
6.1. Select gas rate and calculate
minimum superficial velocity
10. Calculate oxygen
concentration in
exhaust 9. Calculate total
external power
5.2. Specify min.
agitation speed
2. Select geometry h/d ratio
(Aspect ratio)
3. Select working volume
4. Design scale up parameters
5. Agitation parameters
6. Gassing parameters
10. Calculate cost of
reactor, compressor
and mixer
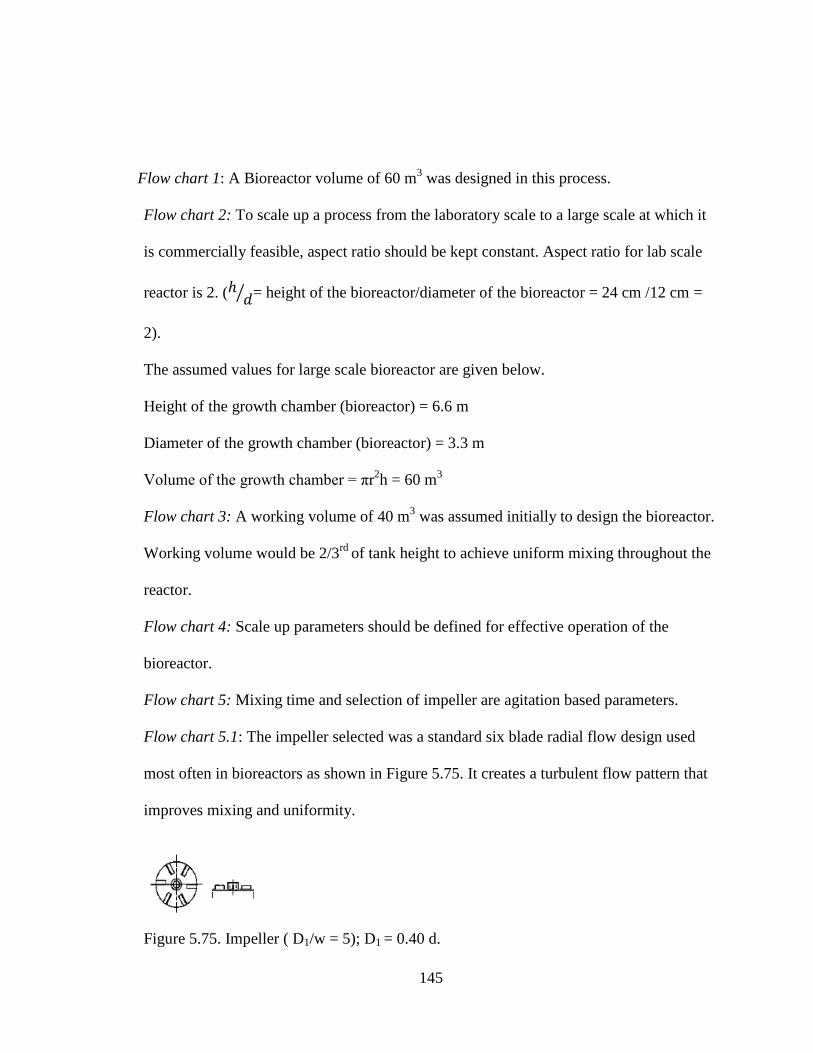
145
Flow chart 1: A Bioreactor volume of 60 m3 was designed in this process.
Flow chart 2: To scale up a process from the laboratory scale to a large scale at which it
is commercially feasible, aspect ratio should be kept constant. Aspect ratio for lab scale
reactor is 2. (ℎ𝑑⁄ = height of the bioreactor/diameter of the bioreactor = 24 cm /12 cm =
2).
The assumed values for large scale bioreactor are given below.
Height of the growth chamber (bioreactor) = 6.6 m
Diameter of the growth chamber (bioreactor) = 3.3 m
Volume of the growth chamber = πr2h = 60 m
3
Flow chart 3: A working volume of 40 m3 was assumed initially to design the bioreactor.
Working volume would be 2/3rd
of tank height to achieve uniform mixing throughout the
reactor.
Flow chart 4: Scale up parameters should be defined for effective operation of the
bioreactor.
Flow chart 5: Mixing time and selection of impeller are agitation based parameters.
Flow chart 5.1: The impeller selected was a standard six blade radial flow design used
most often in bioreactors as shown in Figure 5.75. It creates a turbulent flow pattern that
improves mixing and uniformity.
Figure 5.75. Impeller ( D1/w = 5); D1 = 0.40 d.
146
Where D1 = diameter of the impeller
d = diameter of bioreactor
w = width of the impeller
Flow chart 5.2.: The minimum agitation rate is required to create a homogeneous
environment. Theoretically, the minimum stirring (for stirring the liquid media alone)
determined from [199]
𝑁 𝑀𝐼𝑁 = (1.22 + 1.25𝑑
𝐷1) (
𝜎𝑔
𝜌𝐿)
0.25 1
𝐷1…………..Eq.5.13
d/ D1 = 1/ 0.4 = 2.5
g = 980 cm/s2
σ = surface tension of water = 72.8 dyne/cm
ρL = density of liquid = 1 g/cc
If we substitute these values in eqn (1),
Nmin = 53.79 rpm
Based on scale up factor agitation rate was given by
N2=N1 (D1/D2)1/4
N2 agitation speed in scale-up
N1 agitation speed in scale-down
D1 impeller diameter of scale-down
D2 impeller diameter of scale-up
If we substitute lab scale values (scale-down),
N2 = 125 (0.12 / 3.3)0.25
= 54 rpm
147
Hence experimental agitation rate validate the theoretical value and this is the
minimum agitation rate that has to be maintained for homogeneity.
Flow chart 6.1.: The aeration rate is optimized to meet the oxygen demand of cultured
cells and to take out the dissolved carbon dioxide from the reactor. It is usually
represented in vvm which means the vessel volumes per minute. A low initial guess of
0.1 vvm is assumed so,
Aeration rate, Q = ( 0.1
60 )VW, m
3/sec………………………Eq.5.14
This is the starting point for the mathematical optimization of aeration rate, Q, for
cost minimization during the CSTB design procedure. The superficial gas velocity is then
given by:
Superficial velocity = vs = Q / (πd2/4), m/s
Flow chart 7: The required compressor power needed for aeration is determined by the
Eq.5.15 [201]
𝑊𝐶 =2×𝑅×298𝛾𝑚𝐴𝐼𝑅
𝑀𝑊𝐴𝐼𝑅(𝛾−1)(3
𝛾−1
𝛾 − 1)……..Eq.5.15
Wc = compressor power, kW
γ = ratio of specific heats
MWAIR = molecular weight, air, g/mol
Flow chart 8: Power needed for stirring the aerated reactor, [202]
𝑃𝐺 =0.80
(1−∈𝐺)𝑁𝐴0.38𝑁𝑊𝐸
0.25 𝑃0………………....Eq.5.16 (valid for 0 < NA < 1200)
P0 = power of unaerated reactor = NP ρL N3 D1
5
where NP = power number = 2.5737 NRE0.0614
(valid for 66 < NRE < 50,000)
NP = 13.131 NRE-0.2775
(valid for conditions 1 < NRE < 100,000; NRE > 100,000 )
148
NRE = ρL N D12/µ
NA = aeration number = 𝑄
𝑁𝐷13 NWE = weber number =
𝑁2𝜌𝐿𝐷13
𝜎
εG = gas holdup = 0.113(𝑄𝑁2
𝜎)
0.57
[203]
and N = agitation speed, rev/s
Q = aeration rate, m3/s
σ = surface tension of water
ρL = density of liquid
D1 = diameter of the impeller
Flow chart 9: The total external power required by the CSTB is the sum of power used
by compressor and mixer.
PEXT = ὴc Wc + ὴM (Pa/1000)
ὴc = number of compressors
ὴM = number of mixers
Flow chart 10 & 11: Cost of the bioreactor, mixer and compressor was given in the
following section based on the present market price.
Usually the bioreactor capital cost is assumed based on six-tenths-factor rule. According
to this rule, if the cost of given unit at one capacity is known, the cost of a similar unit
with X times the capacity of the first is approximately (X)0.6
times the cost of initial unit
[200].
Cost of bioreactor to be scaled =
(Known bio reactor cost) *(Capac. of scaled bioreactor/Capac. of known
bioreactor) 0.6
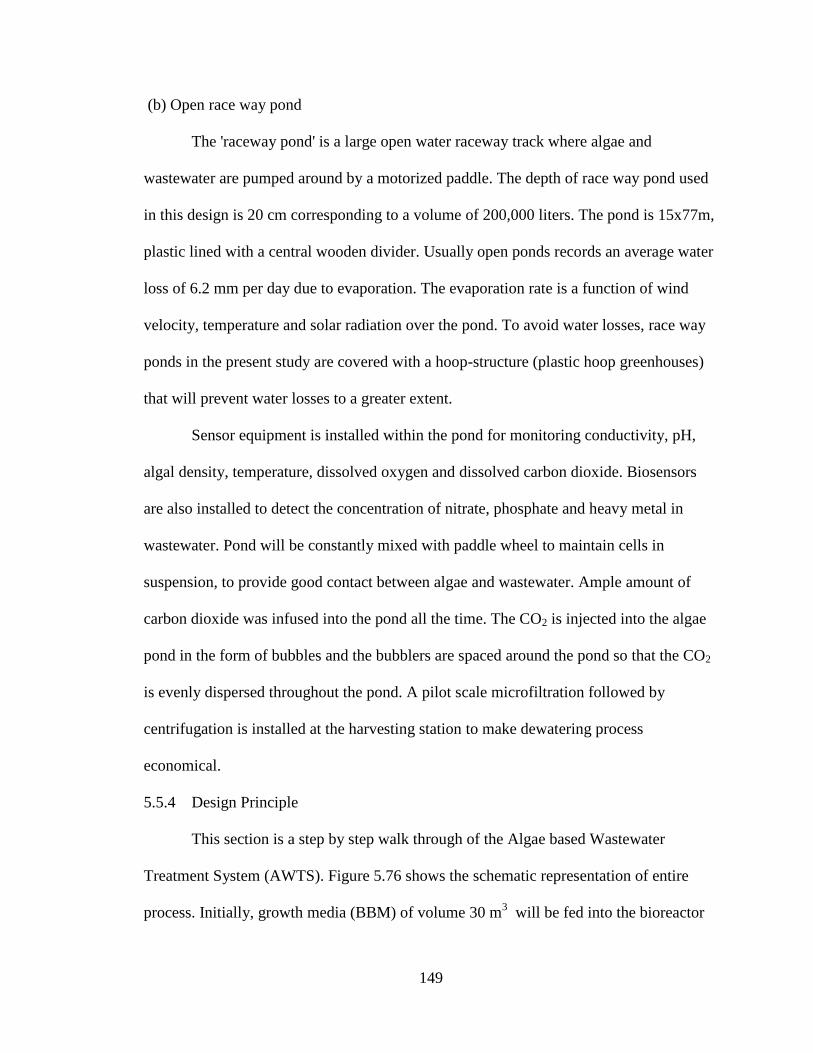
149
(b) Open race way pond
The 'raceway pond' is a large open water raceway track where algae and
wastewater are pumped around by a motorized paddle. The depth of race way pond used
in this design is 20 cm corresponding to a volume of 200,000 liters. The pond is 15x77m,
plastic lined with a central wooden divider. Usually open ponds records an average water
loss of 6.2 mm per day due to evaporation. The evaporation rate is a function of wind
velocity, temperature and solar radiation over the pond. To avoid water losses, race way
ponds in the present study are covered with a hoop-structure (plastic hoop greenhouses)
that will prevent water losses to a greater extent.
Sensor equipment is installed within the pond for monitoring conductivity, pH,
algal density, temperature, dissolved oxygen and dissolved carbon dioxide. Biosensors
are also installed to detect the concentration of nitrate, phosphate and heavy metal in
wastewater. Pond will be constantly mixed with paddle wheel to maintain cells in
suspension, to provide good contact between algae and wastewater. Ample amount of
carbon dioxide was infused into the pond all the time. The CO2 is injected into the algae
pond in the form of bubbles and the bubblers are spaced around the pond so that the CO2
is evenly dispersed throughout the pond. A pilot scale microfiltration followed by
centrifugation is installed at the harvesting station to make dewatering process
economical.
5.5.4 Design Principle
This section is a step by step walk through of the Algae based Wastewater
Treatment System (AWTS). Figure 5.76 shows the schematic representation of entire
process. Initially, growth media (BBM) of volume 30 m3
will be fed into the bioreactor
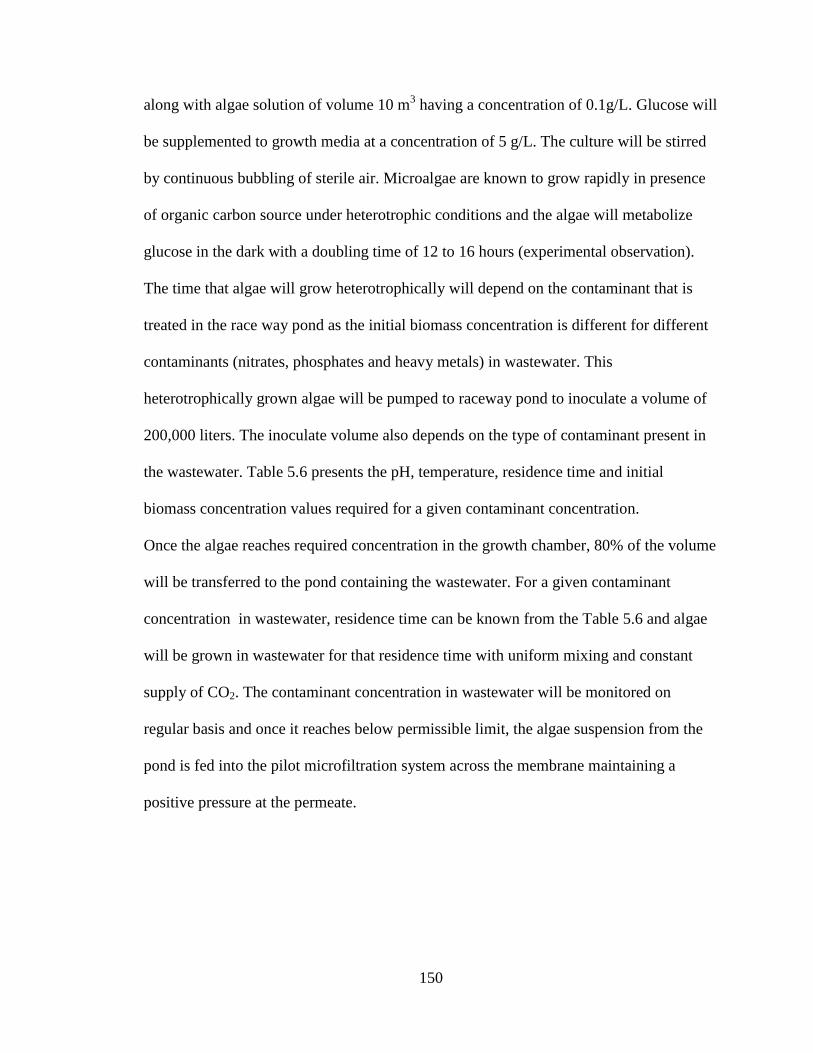
150
along with algae solution of volume 10 m3 having a concentration of 0.1g/L. Glucose will
be supplemented to growth media at a concentration of 5 g/L. The culture will be stirred
by continuous bubbling of sterile air. Microalgae are known to grow rapidly in presence
of organic carbon source under heterotrophic conditions and the algae will metabolize
glucose in the dark with a doubling time of 12 to 16 hours (experimental observation).
The time that algae will grow heterotrophically will depend on the contaminant that is
treated in the race way pond as the initial biomass concentration is different for different
contaminants (nitrates, phosphates and heavy metals) in wastewater. This
heterotrophically grown algae will be pumped to raceway pond to inoculate a volume of
200,000 liters. The inoculate volume also depends on the type of contaminant present in
the wastewater. Table 5.6 presents the pH, temperature, residence time and initial
biomass concentration values required for a given contaminant concentration.
Once the algae reaches required concentration in the growth chamber, 80% of the volume
will be transferred to the pond containing the wastewater. For a given contaminant
concentration in wastewater, residence time can be known from the Table 5.6 and algae
will be grown in wastewater for that residence time with uniform mixing and constant
supply of CO2. The contaminant concentration in wastewater will be monitored on
regular basis and once it reaches below permissible limit, the algae suspension from the
pond is fed into the pilot microfiltration system across the membrane maintaining a
positive pressure at the permeate.
151
Figure 5.76. Schematic representation of AWTS
design
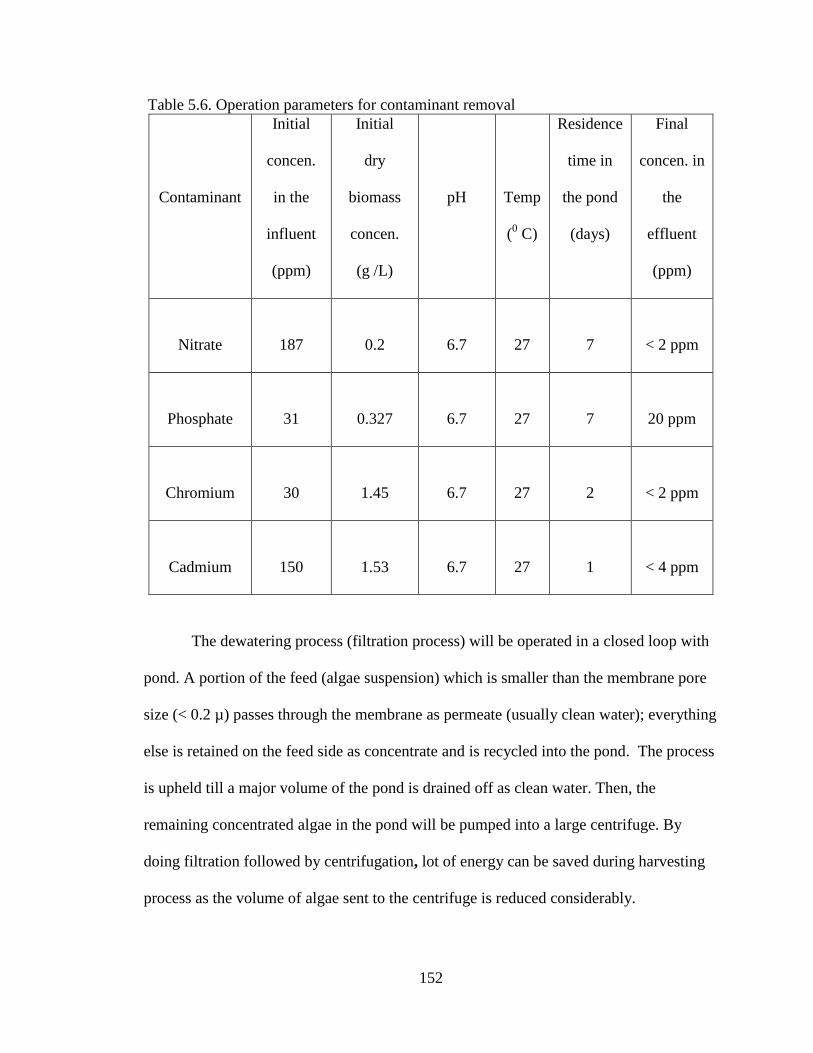
152
Table 5.6. Operation parameters for contaminant removal
Contaminant
Initial
concen.
in the
influent
(ppm)
Initial
dry
biomass
concen.
(g /L)
pH
Temp
(0 C)
Residence
time in
the pond
(days)
Final
concen. in
the
effluent
(ppm)
Nitrate
187
0.2
6.7
27
7
< 2 ppm
Phosphate
31
0.327
6.7
27
7
20 ppm
Chromium
30
1.45
6.7
27
2
< 2 ppm
Cadmium
150
1.53
6.7
27
1
< 4 ppm
The dewatering process (filtration process) will be operated in a closed loop with
pond. A portion of the feed (algae suspension) which is smaller than the membrane pore
size (< 0.2 µ) passes through the membrane as permeate (usually clean water); everything
else is retained on the feed side as concentrate and is recycled into the pond. The process
is upheld till a major volume of the pond is drained off as clean water. Then, the
remaining concentrated algae in the pond will be pumped into a large centrifuge. By
doing filtration followed by centrifugation, lot of energy can be saved during harvesting
process as the volume of algae sent to the centrifuge is reduced considerably.
153
During centrifugation, the water was forced out and algae will be settled to the
bottom of a flask in the form of a paste at about 25% algae. Half of the water coming out
from the centrifuge is recycled into the heterotrophic growth chamber to grow algae and
provide inoculant volume for the next cycle and remaining half will be discharged out as
clean water. The harvested algae paste will be processed for oil extraction or gasification.
5.5.5 Cost Estimation
Described below are the design, construction, operations, and estimated costs of
the AWTS system that uses a paddle-wheel mixed race way pond to treat wastewater.
The detail calculations are given in Appendix A. Construction costs include cost of land,
impeller, turbine, pumps, flow meters, lining material, paddlewheel, sensors, and
installation of harvesting system. Some of the key components in a race way pond system
design are discussed in detail below. The cost for pond construction [204] is given in
Table 5.7. The cost of other components used in the design, installation costs of
equipment and total cost involved in AWTS design is given in Table 5.8, 5.9 and 5.10
respectively.
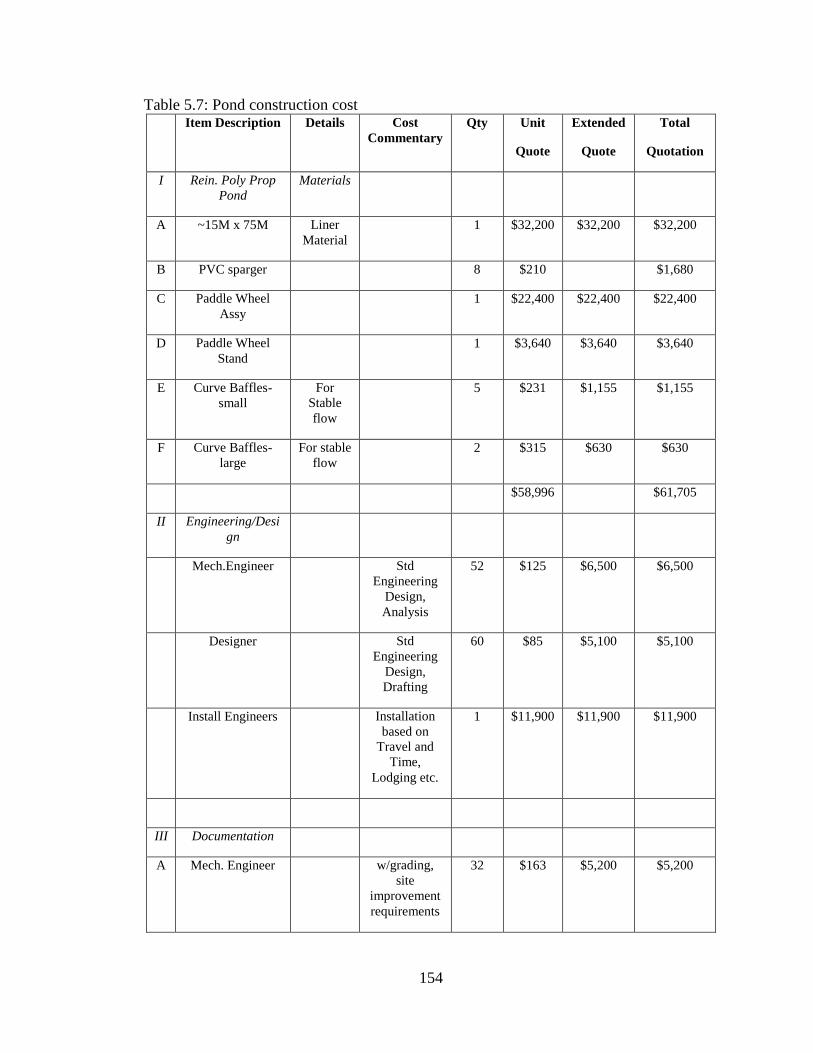
154
Table 5.7: Pond construction cost Item Description Details Cost
Commentary
Qty Unit
Quote
Extended
Quote
Total
Quotation
I Rein. Poly Prop
Pond
Materials
A ~15M x 75M Liner
Material
1 $32,200 $32,200 $32,200
B PVC sparger 8 $210 $1,680
C Paddle Wheel
Assy
1 $22,400 $22,400 $22,400
D Paddle Wheel
Stand
1 $3,640 $3,640 $3,640
E Curve Baffles-
small
For
Stable
flow
5 $231 $1,155 $1,155
F Curve Baffles-
large
For stable
flow
2 $315 $630 $630
$58,996 $61,705
II Engineering/Desi
gn
Mech.Engineer Std
Engineering
Design,
Analysis
52 $125 $6,500 $6,500
Designer Std
Engineering
Design,
Drafting
60 $85 $5,100 $5,100
Install Engineers Installation
based on
Travel and
Time,
Lodging etc.
1 $11,900 $11,900 $11,900
III Documentation
A Mech. Engineer w/grading,
site
improvement
requirements
32 $163 $5,200 $5,200
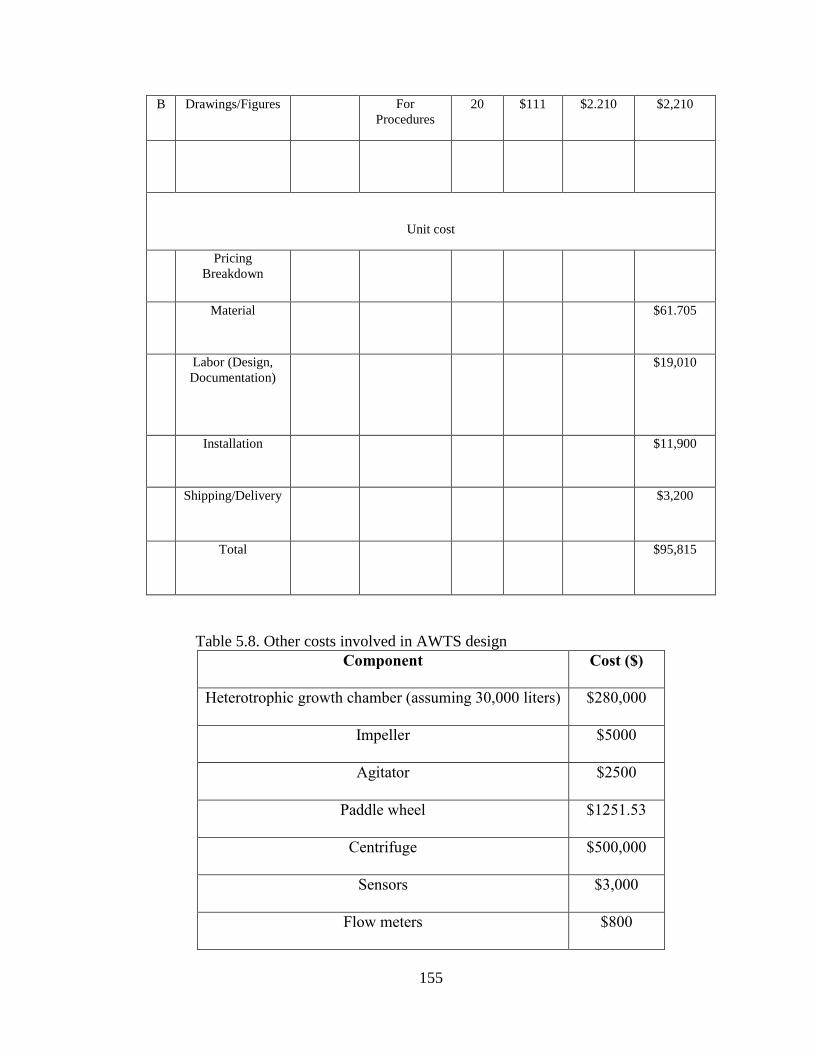
155
B Drawings/Figures For
Procedures
20 $111 $2.210 $2,210
Unit cost
Pricing
Breakdown
Material $61.705
Labor (Design,
Documentation)
$19,010
Installation $11,900
Shipping/Delivery $3,200
Total $95,815
Table 5.8. Other costs involved in AWTS design
Component Cost ($)
Heterotrophic growth chamber (assuming 30,000 liters) $280,000
Impeller $5000
Agitator $2500
Paddle wheel $1251.53
Centrifuge $500,000
Sensors $3,000
Flow meters $800
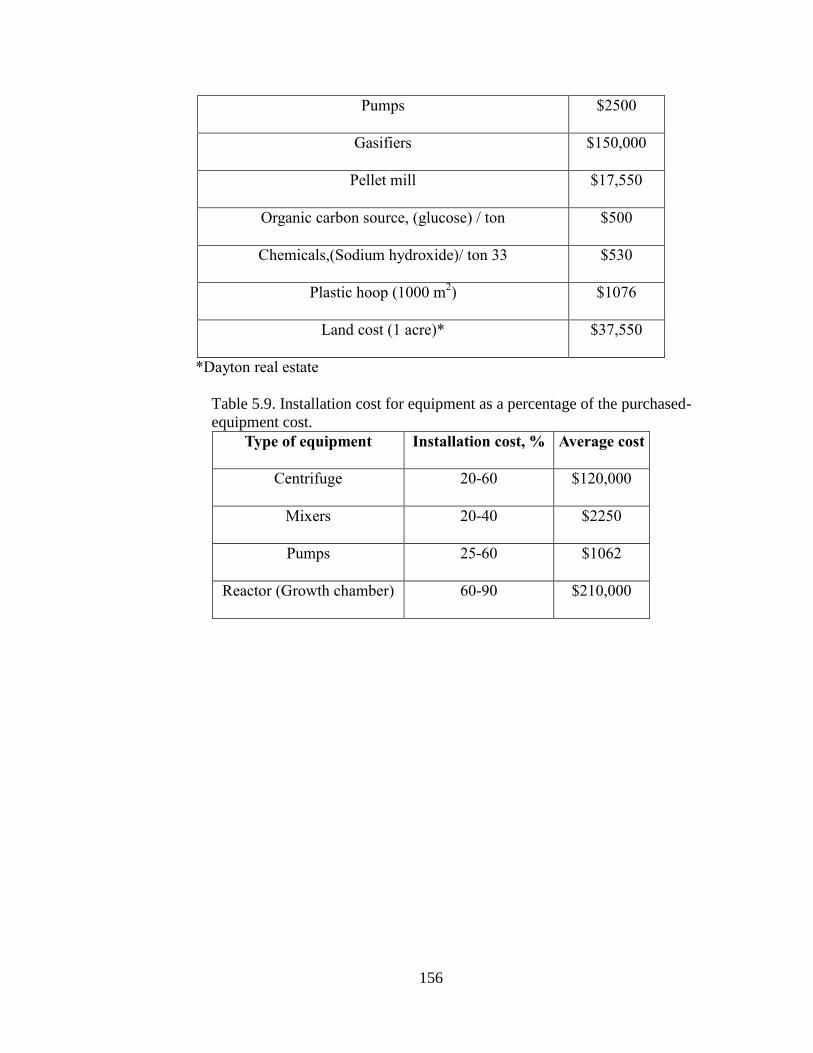
156
Pumps $2500
Gasifiers $150,000
Pellet mill $17,550
Organic carbon source, (glucose) / ton $500
Chemicals,(Sodium hydroxide)/ ton 33 $530
Plastic hoop (1000 m2) $1076
Land cost (1 acre)* $37,550
*Dayton real estate
Table 5.9. Installation cost for equipment as a percentage of the purchased-
equipment cost.
Type of equipment Installation cost, % Average cost
Centrifuge 20-60 $120,000
Mixers 20-40 $2250
Pumps 25-60 $1062
Reactor (Growth chamber) 60-90 $210,000
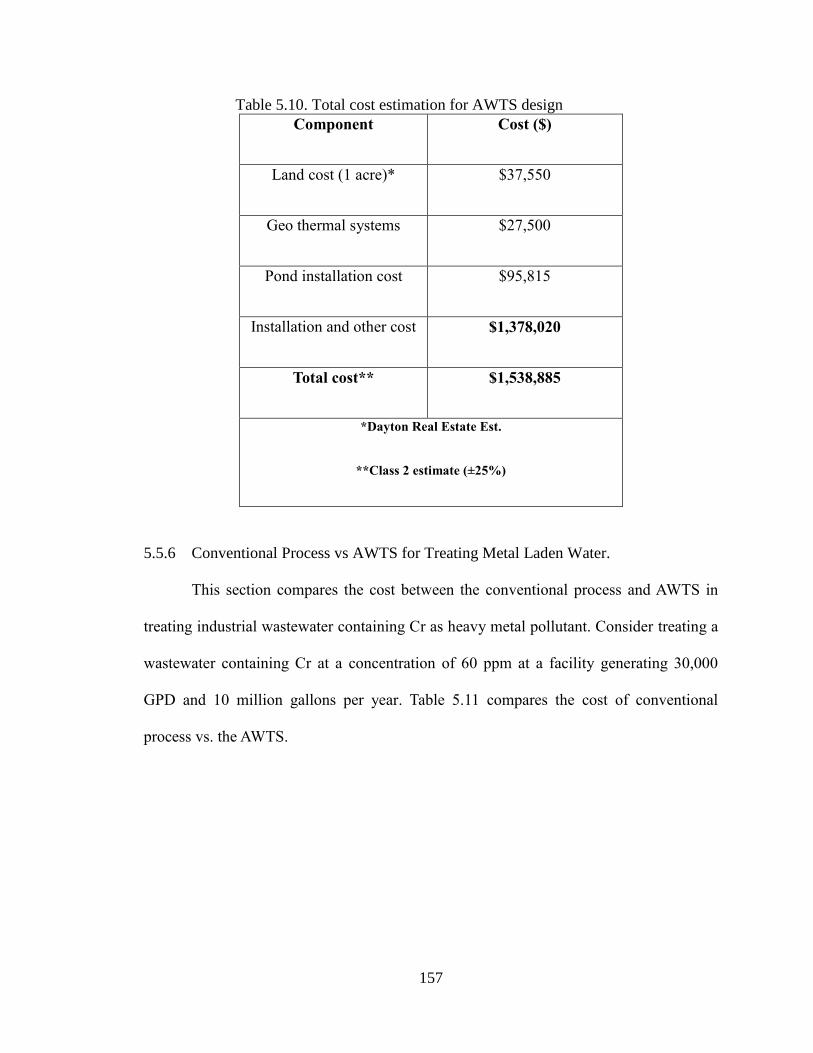
157
Table 5.10. Total cost estimation for AWTS design
Component Cost ($)
Land cost (1 acre)* $37,550
Geo thermal systems $27,500
Pond installation cost $95,815
Installation and other cost $1,378,020
Total cost** $1,538,885
*Dayton Real Estate Est.
**Class 2 estimate (±25%)
5.5.6 Conventional Process vs AWTS for Treating Metal Laden Water.
This section compares the cost between the conventional process and AWTS in
treating industrial wastewater containing Cr as heavy metal pollutant. Consider treating a
wastewater containing Cr at a concentration of 60 ppm at a facility generating 30,000
GPD and 10 million gallons per year. Table 5.11 compares the cost of conventional
process vs. the AWTS.
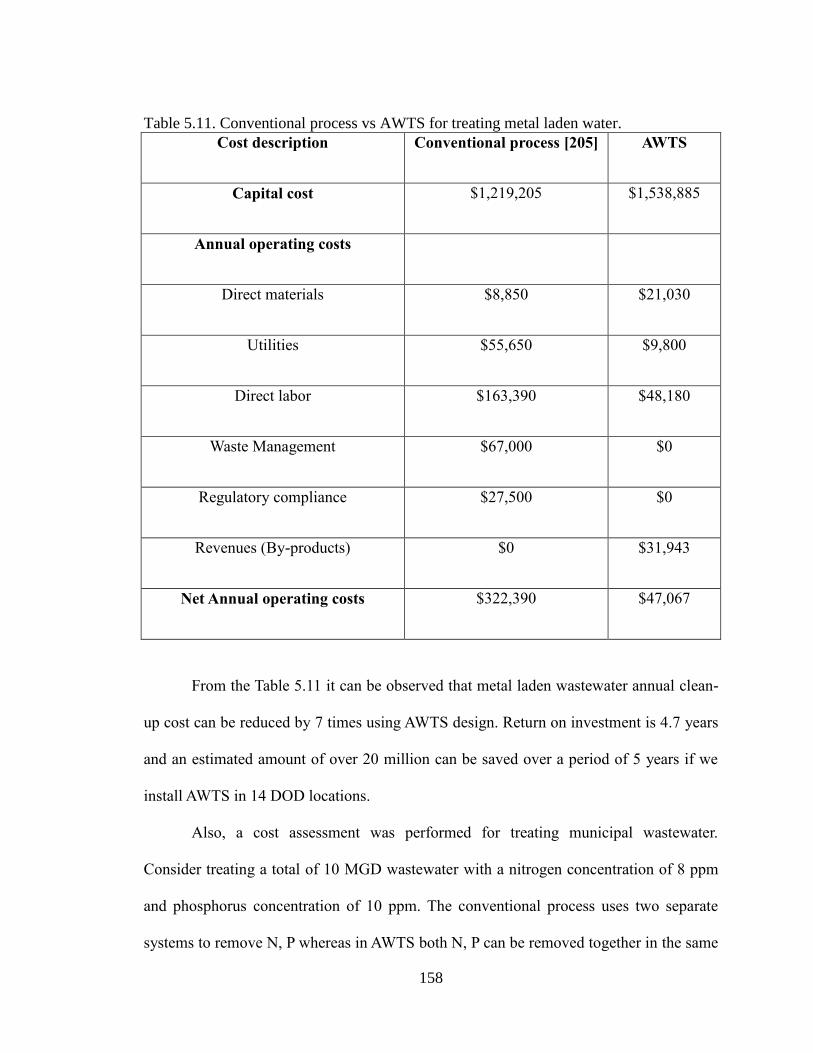
158
Table 5.11. Conventional process vs AWTS for treating metal laden water.
Cost description Conventional process [205] AWTS
Capital cost $1,219,205 $1,538,885
Annual operating costs
Direct materials $8,850 $21,030
Utilities $55,650 $9,800
Direct labor $163,390 $48,180
Waste Management $67,000 $0
Regulatory compliance $27,500 $0
Revenues (By-products) $0 $31,943
Net Annual operating costs $322,390 $47,067
From the Table 5.11 it can be observed that metal laden wastewater annual clean-
up cost can be reduced by 7 times using AWTS design. Return on investment is 4.7 years
and an estimated amount of over 20 million can be saved over a period of 5 years if we
install AWTS in 14 DOD locations.
Also, a cost assessment was performed for treating municipal wastewater.
Consider treating a total of 10 MGD wastewater with a nitrogen concentration of 8 ppm
and phosphorus concentration of 10 ppm. The conventional process uses two separate
systems to remove N, P whereas in AWTS both N, P can be removed together in the same

159
system. Table 5.12 compares the cost of the conventional process vs. AWTS for treating
municipal wastewater.
Table 5.12. Conventional process vs. AWTS for treating municipal wastewater.
Cost description Conventional process [206] AWTS
Capital cost (for N removal) $4,927,000 $1,538,885
Capital cost (for P removal) $6,969,000
Total capital cost $11,896,000 $1,538,885
O & M Cost (for N removal) $157,469 $79,010
O & M Cost (for P removal) $1,095,000
Revenues (By-products) $0 $31,943
Net Annual operating costs $1,252,469 $47,067
From Table 5.12 it can be observed that the capital cost of the AWTS system is
approximately 3 times less than the conventional process and wastewater clean-up cost
can be reduced by twenty six times. The return of investment is less than a year and
considering 10 different DOD locations, an estimated amount of 60 million can be saved
if we replace the conventional process with AWTS. If we install algae ponds near water
reclamation plants, wastewater coming from the secondary clarifier in the conventional
process can be routed to the algae pond batch wise for the removal of nitrogen and
phosphorus from wastewater. However, more experiments have to be conducted with real
municipal and industrial wastewater at larger scale in outdoor conditions in order to

160
evaluate real concerns that could hinder implementing algae based wastewater treatment
systems.
161
CHAPTER 6
SUMMARY AND FUTUREWORK
6.1. Summary
This study focused on evaluating and demonstrating potential of microalgae for
bioremediation of wastewater laden with nitrogen (N) in the form of nitrates,
phosphorous (P) in the form of phosphates, chromium (Cr(VI)) and cadmium (Cd(II)).
After screening several microalgae, Chlorella vulgaris and algae taken from Pleasant Hill
Lake were chosen as candidate species for this study. The viability of the process was
demonstrated in laboratory bioreactors and key parameters that would affect remediation
rates were studied and correlations were developed to enable customizing and designing a
commercial AWTS. A commercial AWTS system that can be easily customized and is
suitable for integration into existing wastewater treatment facilities was developed, and
capital cost estimates for system including installation and annual operating costs were
determined.
The work concludes that algal bioremediation is a viable alternate technology for
treating wastewater in an economical and sustainable way when compared to
conventional treatment processes. The annual wastewater treatment costs to remove N, P
is ~26x lower and to remove Cr, Cd is 7x lower than conventional treatment processes.
The cost benefit analysis performed shows that if this technology is implemented at Air
162
Force and other Department of Defense installations with wastewater treatment plants, it
could lead to millions of dollars in savings that could be repurposed for meeting the
warfighters needs.
6.2 Future Work
It is recommended to conduct experiments to assess removal of other toxic heavy
metals such as Arsenic (As) and Mercury (Hg) from industrial wastewater using
Chlorella vulgaris.
It is recommended to conduct experiments with the combination of various toxic
heavy metals in wastewater to investigate the synergistic/antagonistic effect on
algae metal removal efficiency.
It is recommended to conduct experiments to remove heavy metals from
wastewater using combination of algae strains and compare its metal removal
efficiency with single strain.
It is also recommended to conduct experiments with real metal laden wastewater
in outdoor conditions at larger scale in order to evaluate the efficiency of the algae
bioremediation at commercial scale.
It is recommended to perform chemical extraction techniques as well as the
gasification experiments for metal bounded algae to investigate the percentage of
metal recovery from algae surface.
It is recommended that long term experiments with the integrated system
combining the AWTS with the existing wastewater treatment plants are conducted
to assess its performance limit.
163
BIBLIOGRAPHY
1. http://www.theworldwater.org/water_facts.php.
2. http://water.epa.gov/learn/kids/drinkingwater/upload/The-Water-Sourcebooks-
Grade-Level-6-8.pdf.
3. Liu H, Ramnarayanan R and Logan BE. Production of electricity during
wastewater treatment using a single chamber microbial fuel cell. Environ. Sci.
Technol. 38: 2281.
4. De Filippis LF and Pallaghy CK. 1994. Heavy metals: sources and biological
effects. In: Rai LC, Gaur JP and Soeder CJ eds. Advances in Limnology Series:
Algae and Water Pollution, E. Scheizerbartsche Press, Stuttgart. 31-77.
5. Carey RO and Migliaccio, KW. 2009. Contribution of wastewater treatment plant
effluents to nutrient dynamics in aquatic systems: A review. Environmental
Management. 44:205-217.
6. Shi J. “Removal of nitrogen and phosphorus from municipal wastewater using
microalgae immobilized on twin-layer system” (PhD dissertation. University of
cologne, 2009).
7. USEPA (1998a). How Wastewater Treatment Works. The Basics. Cincinnati, OH:
U.S. Environmental Protection Agency.
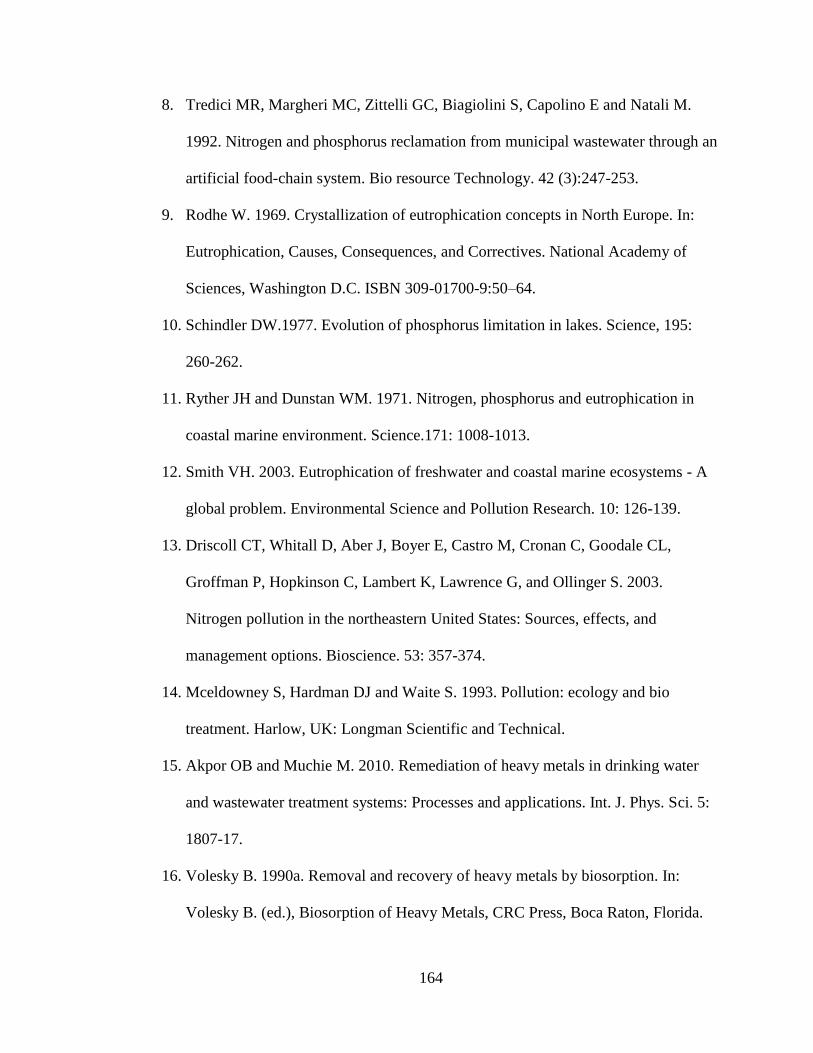
164
8. Tredici MR, Margheri MC, Zittelli GC, Biagiolini S, Capolino E and Natali M.
1992. Nitrogen and phosphorus reclamation from municipal wastewater through an
artificial food-chain system. Bio resource Technology. 42 (3):247-253.
9. Rodhe W. 1969. Crystallization of eutrophication concepts in North Europe. In:
Eutrophication, Causes, Consequences, and Correctives. National Academy of
Sciences, Washington D.C. ISBN 309-01700-9:50–64.
10. Schindler DW.1977. Evolution of phosphorus limitation in lakes. Science, 195:
260-262.
11. Ryther JH and Dunstan WM. 1971. Nitrogen, phosphorus and eutrophication in
coastal marine environment. Science.171: 1008-1013.
12. Smith VH. 2003. Eutrophication of freshwater and coastal marine ecosystems - A
global problem. Environmental Science and Pollution Research. 10: 126-139.
13. Driscoll CT, Whitall D, Aber J, Boyer E, Castro M, Cronan C, Goodale CL,
Groffman P, Hopkinson C, Lambert K, Lawrence G, and Ollinger S. 2003.
Nitrogen pollution in the northeastern United States: Sources, effects, and
management options. Bioscience. 53: 357-374.
14. Mceldowney S, Hardman DJ and Waite S. 1993. Pollution: ecology and bio
treatment. Harlow, UK: Longman Scientific and Technical.
15. Akpor OB and Muchie M. 2010. Remediation of heavy metals in drinking water
and wastewater treatment systems: Processes and applications. Int. J. Phys. Sci. 5:
1807-17.
16. Volesky B. 1990a. Removal and recovery of heavy metals by biosorption. In:
Volesky B. (ed.), Biosorption of Heavy Metals, CRC Press, Boca Raton, Florida.
165
17. http://earthrepair.ca/resources/contaminants/.
18. WHO, 1993. Guidelines for drinking-water quality, second edition, volume 1.
19. NOAA/EPA. National Oceanic and Atmospheric Administration and
Environmental Protection Agency. 1988. Strategic Assessment of Near Coastal
Waters, Chapter 3, Susceptibility and Concentration Status of Northeast Estuaries
to Nutrient Discharges. NOA A: Washington, D.C.
20. http://www.epa.gov/osw/nonhaz/municipal/pubs/snapshot.pdf.
21. Environmental Protection Agency. Wastewater treatment manuals- Primary,
Secondary & Tertiary Treatment 1997.
22. Morse GK, Brett SW, Guy JA and Lester JN. 1998. Review: Phosphorus removal
and recovery technologies. Science of the Total Environment. 212: 69-81.
23. Sandau E, Sandau P, Pulz O. and Zimmermann M. 1996. Heavy metal sorption by
marine algae and algal by-products. Acta Biotechnol. 16:103-119.
24. Mehta S. K. and Gaur J. P. 2001. Removal of Ni and Cu from single and binary
metal solutions by free and immobilized Chlorella vulgaris. European J.
Protistology.37: 261-271.
25. Eccles H. 1999. Treatment of metal-contaminated wastes: Why select a biological
process?. Trends in Biotechnol.17: 462–465.
26. Hoffmann JP. 1998. Wastewater treatment with suspended and non-suspended
algae. Journal of Phycology. 34: 757-763.
27. Tchobanoglous G, Burton FL and Stensel HD. 2003. Wastewater Engineering:
Treatment, Disposal, and Reuse, New York: McGraw-Hill.
166
28. Mehta SK and Gaur JP. 2005. Use of algae for removing heavy metal ions from
wastewater: Progress and prospects. Critical Reviews in Biotechnology. 25: 113-
152.
29. Sevrin-Reyssac J.1998. Biotreatment of swine manure by production of aquatic
valuable biomass. Agric. Ecosyst. Environ. 68: 177–186.
30. Knud-Hansen CF, Batterson TR and McNabb CD. 1993. The role of chicken
manure in production of Nile tilapia, Oreochromisniloticus. Aquaculture and
Fisheries Management. 24:483-493.
31. Oswald WJ and Gotaas HB. 1957. Photosynthesis in sewage treatment. Trans. Am.
Soc. Civ. Eng.122: 73‐105.
32. Olguín EJ. (2003). Phytoremediation: Key issues for cost-effective nutrient
removal processes. Biotechnology Advances. 22: 81-91.
33. De La Noüe J, Laliberté G. & Proulx D. 1992. Algae and Waste Water. Journal of
Applied Phycology. 4: 247-254.
34. Cai S, Park YS, Li Y. 2013. Nutrient recovery from wastewater streams by
microalgae: Status and prospects. Renewable and Sustainable Energy
Reviews.19:360-369.
35. Barsanti L, Gualtieri P.2006. Algae: anatomy, biochemistry, and biotechnology.
Boca Raton: CRC Press.
36. Karin Larsdotter. “Microalgae for phosphorus removal from wastewater in a
Nordic climate”. (PhD dissertation., Royal Institute of Technology, Sweden. 2006)
167
37. Bates SS, Tessier A, Campbell PGC, and Buffle J. 1982. Zinc adsorption and
transport by Chlamydomonas variabilis and Scenedesmus subspicatus
(Chlorophyceae) grown in semi continuous culture. J .Phycol. 18: 521–529.
38. Xue HB, Stumm W, and Sigg L. 1988. The binding of heavy metals to algal
surfaces. Water Resour. 22: 917–926.
39. Crist RH, Oberholser K, Shank N, and Nguyen M. 1981. Nature of binding
between metallic ions and algal cell walls. Environ. Sci.Technol. 15: 1212–1217.
40. Yu RQ and Wang WX. 2004. Bio kinetics of cadmium, selenium, and zinc in
freshwater alga Scenedesmus obliquus under different phosphorus and nitrogen
conditions and metal transfer to Daphnia magna. Environmental Pollution. 129:
443–456.
41. Wood LM and Wang HK. 1983. Microbial resistance to heavy metals.
Environmental Science and Technology. 17: 582A-590A.
42. Gadd GM. 1990a. Heavy metal accumulation by bacteria and other
microorganisms. Experientia. 46: 834-840
43. Sheehan J, Dunahay T, Benemann J, and Roessler PG. 1998. US Department of
Energy’s Office of Fuels Development. A look back at the US Department of
Energy’s Aquatic Species Program –Biodiesel from Algae, Close Out Report TP-
580-24190. National Renewable Energy Laboratory.
44. Ting YP, Teo WK, and Soh CY. 1995. Gold uptake by Chlorella vulgaris. J. Appl.
Phycol. 7: 97–100.
45. Zhou JL, Huang PL, and Lin RG. 1998. Sorption and desorption of Cu and Cd by
macroalgae and microalgae. Environ. Pollut. 101:67–75.
168
46. Chong AMY, Wong YS, and Tam NFY. 2000. Performance of different microbial
species in removing nickel and zinc from industrial wastewater. Chemosphere 41:
251–257.
47. Illman AM, Scragg AH and Shales SW. 2000.Increase in Chlorella strains calorific
values when grown in low nitrogen medium. Enzyme and MicrobialTechnology.27
(8): 631-635.
48. Benemann JR and Oswald WJ. 1996. Systems and economic analysis of
microalgae ponds for conversion of CO2 to biomass. Final report ed.
49. Chen F. 1996. High cell density culture of microalgae in heterotrophic growth.
Trends in biotechnology. 14 (11): 421-426.
50. Patiño R, Janssen M and Von Stockar U. 2007. A study of the growth for the
microalga Chlorella vulgaris by photo-bio-calorimetry and other on-line and off-
line techniques. Biotechnology and Bioengineering. 96 (4): 757-767.
51. Kaplan D, Richmond AE, Dubinsky Z, and Aaronson S. 1986. Algal nutrition. In:
Richmond, A. (Ed.), Handbook for Microalgal Mass Culture. CRC Press, Boca
Raton, FL., USA, pp. 147-198.
52. Lee K, and Lee CG. 2001. Effect of light/dark cycles on wastewater treatment by
microalgae. Biotechnol. Bioprocess Eng. 6:194-199.
53. Schlle J and Komor E.1986. Ammonium Uptake by Chlorella. Planta.2:232-238.
54. YunYS and Park JM. 2003. Kinetic modeling of the light-dependent
photosynthetic activity of the green microalga Chlorella vulgaris. Biotechnology
and Bioengineering. 83 (3): 303-311.
169
55. Oliver RL and Ganf GG. 2000. Freshwater blooms in the ecology of
cyanobacteria: their diversity in time and space. pp. 149–194.
56. Krüger GHJ and Elnoff JN. 1981. Defined algal production systems for the culture
of microalgae in Wastewater for aquaculture. University of the OFS,
Bloemfontein: University of the OFS Publication. Series C, No. 3.
57. Azov Y and Shelef G.1987. The effect of pH on the performance of the high-rate
oxidation ponds. Water Sci. Technol.19 (12):pp. 381–383.
58. Talbot P and De la Noüe J. 1993. Tertiary treatment of wastewater with
Phormidium bohneri (Schmidle) under various light and temperature conditions.
Water Res. 27 (1):pp.153-159.
59. Oswald WJ. 1988. Micro-algae and waste-water treatment, in Micro-algal
biotechnology, Cambridge University press: Cambridge. pp. 305–328.
60. Fontes AG, Vargas MA, Moreno J, Guerrero MG and Losada M. 1987. Factors
affecting the production of biomass by a nitrogen-fixing blue-green alga in outdoor
culture. Biomass 13: pp.33–43.
61. Fogg GE. 1975. Algal cultures and phytoplankton ecology. Second edition 1975
ed. Wisconsin: The university of Wisconsin press.
62. Borowitzka MA. 1998. Limits to growth in Wastewater treatment with algae.pp
203–226.
63. Kawaguchi K. 1980. Microalgae production systems in Asia. pp 25–33.
64. Bhaya D, Schwarz R and Grossman R. 2000. Molecular responses to
environmental stress. pp. 397–442.
170
65. Rhee GY. 1978. Effects of N: P atomic ratios and nitrate limitation on algal
growth, cell composition, and nitrate uptake. Limnology and Oceanography.23:
pp. 10–25.
66. Cheirsilp B and Torpee S. 2012. Enhanced growth and lipid production of
microalgae under mixotrophic culture condition: Effect of light intensity, glucose
concentration and fed-batch cultivation, Bio resource Technology.
67. Chevalier P, Proulx D, Lessard P, Vincent WF and Dela Noüe J.2000. Nitrogen
and phosphorus removal by high latitude mat-forming cyanobacteria for potential
use in tertiary wastewater treatment. J. Appl. Phycol. 12: pp.105–112.
68. Becker EW. 1994. Microalgae, Biotechnology and Microbiology. Cambridge
University Press.
69. Paul JP. 1994. Removal of cadmium from polluted water by immobilized algae.
Durham theses. Durham University.
70. Campbell PGC and Stokes PM. 1985. Acidification and toxicity of metals to
aquatic biota. Can. J. Fish.Aquat. Sci. 42: 2034-2049.
71. Shelef G and Soeder CJ. 1982. Algal Biomass: production and use. Elsevier/North
Holland Biomedical Press, Amsterdam. p 852.
72. Zhu G, Peng Y, Li B, Guo J, Yang Q and S. Wang. 2008. Biological removal of
nitrogen from wastewater. Rev. Environ. Contam. Toxicol. 192: pp. 159–195
73. Lavoie A and De la Noüe J. 1985. Hyper concentrated cultures of Scenedesmus
obliquus. A new approach for wastewater biological tertiary treatment. Water
Res.19: pp. 1437–1442.
171
74. Martin C, De la Nobe, and Picard G. 1985. Intensive cultivation of freshwater
microalgae on aerated pig manure .Biomass. 7: pp. 245–259.
75. Tam NFY and Wong YS.1995. Wastewater treatment with microorganisms. The
commercial Press (H.K.) Ltd. 2D Finnie St. Quarry Bay, Hong Kong.
76. Li Y, Chen YF, Chen P, Min M, Zhou W, Martinez B, Zhu J and Ruan R.2011.
Characterization of a microalgae Chlorella sp. well adapted to highly concentrated
municipal wastewater in nutrient removal and biodiesel production. Bioresour.
Technol. 102: pp. 5138–5144.
77. Li Y, Chen P, Min M, Zhou W, Bing H and Ruan R. 2011. Integration of algae
cultivation as biodiesel production feedstock with municipal wastewater treatment:
strains screening and significance evaluation of environmental factors. Bioresour.
Technol.102: pp. 10861–10867
78. Tam NFY and Wong YS. 1989. Wastewater nutrient removal by Chlorella
pyrenoidosa and Scenedesmus sp. Environ. Pollut.58: pp. 19–34.
79. Tam NFY and Wong YS. 1990. The comparison of growth and nutrient removal
efficiency of Chlorella Pyrenoidosa in settled and activated sewages. Environ.
Pollut. 65: pp. 93–108.
80. Cheung YH and Wong MH. 1981. Properties of animal manure and sewage
sludges and their utilization for algal growth. Agr. Wastes. 3: pp. 109–122.
81. Lau PS, Tam NFY and Wong YS. 1995. Effect of algal density on nutrient
removal from primary settled wastewater. Environ. Pollut. 89: pp. 59–66.
172
82. Lau PS, Tam NFY and Wong YS. 1998. Operational optimization of batch wise
nutrient removal from wastewater by carrageen an immobilized Chlorella vulgaris.
Water Sci. Technol. 1:pp. 185–192.
83. Cho S, Luong TT, Lee D, Oh YK and Lee T. 2011. Reuse of effluent water from a
municipal wastewater treatment plant in microalgae cultivation for biofuel
production. Bioresour. Technol. 102(18): pp.8639–8645.
84. Ji MK et al. 2013. Simultaneous nutrient removal and lipid production from
pretreated piggery wastewater by Chlorella vulgarisYSW-04. Appl. Microbiol.
Biot. 97(6): pp. 2701–2710.
85. Olguin EJ, Galicia S, Mercado G, and Pérez T. 2003. Annual productivity of
Spirulina (Arthrospira) and nutrient removal in a pig recycling process under
tropical conditions. J. Appl. Phycol.15 (2):pp. 249–257.
86. Jiménez-Pérez MV, Sánchez-Castill P, Romera O, Fernández-Moreno D, and
Pérez-Martínez C. (2004). Growth and nutrient removal in free and immobilized
planktonic green algae isolated from pig manure. Enzyme Micro. Technol. 34(5):
pp.392–398.
87. An JY, Sim SJ, Lee JS, and Kim BK. 2003. Hydrocarbon production from
secondarily treated piggery wastewater by the green alga Botryococcus braunii. J.
Appl. Phycol.15 (2): pp.185–191.
88. Martinez ME, Sanchez S, Jimenez JM, Yousfi F and Munoz L. 2000. Nitrogen and
phosphorus removal from urban wastewater by the microalga Scenedesmus
obliquus. Bioresour. Technol.73: pp. 263–272.
173
89. Ruiz-Marin A, Mendoza-Espinosa LG and Stephenson T. 2010. Growth and
nutrient removal in free and immobilized green algae in batch and semi-continuous
cultures treating real wastewater. Bioresour. Technol. 101: pp. 58–64.
90. Zhang ED, Wang B, Wang QH, Zhang SB, and Zhao BD. 2008. Ammonia-
nitrogen and orthophosphate removal by immobilized Scenedesmus sp isolated
from municipal wastewater for potential use in tertiary treatment. Bioresour.
Technol. 99: pp. 3787–3793.
91. Pires JCM, Alvim-Ferraz MCM and Martins FG et al. 2013. Environmental
Science and Pollution Research. Volume 20 (8): pp. 5096-5105.
92. Wang L, Min M, Li Y, Chen P, Chen Y, Liu Y, Wang Y and Ruan R. 2010.
Cultivation of green algae Chlorella sp. in different wastewaters from municipal
wastewater treatment plant. Applied Biochemistry and Biotechnology.162:pp.
1174–1186.
93. Arbib Z, Ruiz J, Pablo Alvarez-Díaz, Garrido-Pérez C, Barragan J and Perales JA.
2013. Photobiotreatment: influence of nitrogen and phosphorus ratio in wastewater
on growth kinetics of Scenedesmus obliquus. International Journal of
Phytoremediation, volume.15 (8): pp. 774-88.
94. Renuka N, Sood A, Ratha SK, Prasanna R and Ahluwalia AS. 2013. Nutrient
sequestration, biomass production by microalgae and phytoremediation of sewage
water. International Journal of Phytoremediation. 15 (8):pp. 789–800.
95. Kim SB, Lee SJ, Kim CK, Kwon GS, Yoon BD and Oh HM. 1998. Selection of
microalgae for advanced treatment of swine wastewater and optimization of
174
treatment condition Korean Journal of Applied Microbiology and Biotechnology.
26: 76-82.
96. Hodaifa G, Martinez E and Sanchez S. 2008. Use of industrial wastewater from
olive-oil extraction for biomass production of Scenedesmus obliquus. Bioresource
Technology. 99:pp. 1111-1117.
97. Mohamed NA. 1994. Application of algal ponds for wastewater treatment and
algal production. (M.Sc. Thesis. Cairo Univ.)
98. Colak O and Kaya Z. 1988. A study on the possibilities of biological wastewater
treatment using algae. Doga Biyolji Serisi.12 (1): pp. 18–29.
99. Ji, Min-Kyu, Abou-Shanab, Reda AI, Hwang and Jae-Hoon. 1999. Removal of
Nitrogen and Phosphorus from Piggery Wastewater Effluent Using the Green
Microalga Scenedesmus obliquus. Journal of Environmental Engineering. Volume:
139 (9): pp.1198-1205.
100. Bhatnagar A, Bhatnagar M, Chinnasamy S and Das K. 2010. Chlorella
minutissima- a promising fuel alga for cultivation in municipal wastewaters. Appl.
Biochem. Biotechnol. 161: pp. 523–536.
101. Lodi A, Binaghi, Solisio C, Converti A and Del Borghi M. 2003. Nitrate and
phosphate removal by Spirulina platensis. J. Ind. Microbiol. Biotechnol. 30: 656-
660.
102. Sydney EB, da Silva TE, Tokarski A, Novak AC, de Carvalho JC, Woiciecohwski
AL, Larroche C and Soccol CR. 2011. Screening of microalgae with potential for
biodiesel production and nutrient removal from treated domestic sewage. Appl
Energ .88(10): pp.3291–3294.
175
103. Hernandez JP, De-Bashan LE, Rodriguez DJ, Rodriguez Y and Bashan Y. 2009.
Growth promotion of the freshwater microalga Chlorella vulgaris by the nitrogen-
fixing, plant growth-promoting bacterium Bacillus pumilus from and zone soils.
Eur J Soil Biol 45(1):pp.88–93.
104. Lee K and Lee CG. 2001. Effect of light/dark cycles on wastewater treatments by
microalgae. Biotechnol Bioprocess Eng 6:pp.194–199.
105. Su HY, Zhang YL, Zhang CM, Zhou XF and Li JP. 2011. Cultivation of Chlorella
pyrenoidosa in soybean processing wastewater. Bioresour Technol 102(21):
pp.9884-9990.
106. Gonzalez LE, Canizares RO and Baena S. 1997. Efficiency of ammonia and
phosphorus removal from a Colombian agro industrial wastewater by the
microalgae Chlorella vulgaris and Scenedesmus dimorphus. Bioresour Technol
60(3):pp. 259–262.
107. Peng YJ, Li C and Zhang DW. 2011. Lipid production of Chlorella vulgaris
cultured in artificial wastewater medium. Bioresour Technol 102(1):pp. 101–105.
108. Kang CD, An JY, Park TH and Sim SJ. 2006. Astaxanthin biosynthesis from
simultaneous N and P uptake by the green alga Haematococcus pluvialis in
primary-treated wastewater. Biochem Eng J 31(3):pp. 234–238.
109. Wang B and Lan CQ. 2011. Biomass production and nitrogen and phosphorus
removal by the green alga Neochloris oleoabundans in simulated wastewater and
secondary municipal wastewater effluent. Bioresour Technol 102(10):pp. 5639–
5644.
176
110. Da Costa ACA and Leite SGF. 1991. Metal biosorption by sodium alginate
immobilized Chlorella homosphaera cells. Biotechnol. Lett. 13: pp.359–362.
111. Aloysius R, Karim MIA and Arif AB.1999. The mechanism of cadmium removal
from aqueous solution by non-metabolising free and immobilized live biomass of
Rhizopus oligosporus. World J. Microbiol. Biotechnol. 15:pp.571–578.
112. Mehta SK and Gaur JP. 2001a. Characterization and optimization of Ni and Cu
sorption from aqueous solution by Chlorella vulgaris. Ecol. Eng. 18:pp.1–13.
113. Roy D, Greenlaw PN and Shane BS. 1993. Adsorption of heavy metals by green
algae and ground rice hulls. J . Environ. Sci. Health, Part A. 28:pp.37–50.
114. Hamdy AA. 2000. Biosorption of heavy metals by marine algae. Curr. Microbiol.
41:pp. 232–238.
115. Gong R, Ding Y, Lio H, Chen Q and Liu Z. 2005. Lead biosorption and
desorption by intact and pretreated Spirulina maxima biomass
Chemosphere.58:pp.125–130.
116. Meikle AJ, Gadd GM and Reed RH. 1990. Manipulation of yeast for transport
studies: Critical assessment of cultural and experimental procedures. Enzyme
Microb. Technol. 12:pp.865–872.
117. Fourest E, Canal C and Roux JC. 1994. Improvement of heavy metal biosorption
by fungal mycelial by-products: Mechanism and influence of pH. Appl. Microbiol.
Biotechnol. 37:pp. 399–403.
118. Tsezos M and Volesky B. 1981. Biosorption of uranium and thorium. Biotechnol.
Bioeng. 23:pp.583–604.
177
119. Kuyucak N and Volesky B. 1989c. Accumulation of cobalt by marine alga.
Biotechnol. Bioeng. 33:pp.809–814.
120. Aksu Z and Acikel U. 1999. A single-staged bio separation process for
simultaneous removal of copper (II) and chromium (VI) by using C. vulgaris.
Process Biochem.34:pp. 589–599.
121. Aksu Z. 2001. Biosorption of reactive dyes by dried activated sludge. Equilibrium
and kinetic modeling. Biochem. Eng. J. 7:pp.79–84.
122. Benguell B and Benaissa H. 2002. Cadmium removal from aqueous solution by
chitin: Kinetic and equilibrium studies. Water Res. 36: pp.2463–2474.
123. Norris PR and Kelly DP.1979. Accumulation of cadmium and cobalt by
Saccharomyces cerevisiae. J. Gen. Microbiol. 99:pp.317–324.
124. Zhao Y, Hao Y, and Ramelow GJ. 1994. Evaluation of treatment techniques for
increasing the uptake of metal ions from solution by non-living seaweed algal
biomass. Environ. Monit. Assess. 33:pp.61–70.
125. Cossich ES, Tavares CRG and Ravagnani TMK. 2002. Biosorption of chromium
(III) by Sargassum sp. biomass. Electronic J. Biotechnol. 5:pp.133–140.
126. De Rome L and Gadd GM. 1987. Copper adsorption by Rhizopus arrhizus,
Cladosporium resinae and Penicillium italicum. Applied Microbiology and
Biotechnology.26:pp.84‑90
127. Sheng PX, Tan LH, Chen JP and Ting YP. 2004b. Biosorption performance of
two brown marine algae for removal of chromium and cadmium. J. Dispersion Sci.
Technol. 25:pp.679–686.
178
128. Peterson HG, Healey FP, and Wagemann R. 1984. Metal toxicity to algae: a
highly pH dependent phenomenon. Can. J. Fish. Aquat. Sci. 41:pp.974–979.
129. Gensemer RW. 1991. The effects of pH and aluminum on the growth of the
acidophilic diatom Asterionella ralfsii var. Americana. Limnol. Oceanogr.
36:pp.123–131.
130. Parent L and Campbell PG C. 1994. Aluminum bioavailability to the green alga
Chlorella pyrenoidosa in acidified synthetic soft water. Environ. Toxicol. Chem.
3:pp.587–598.
131. O¨ zer D, Aksu Z, Kutsal T and Caglar A. 1994. Adsorption isotherms of lead (II)
and chromium (VI) on Cladophora crispata. Environ. Technol. 15:pp.439–448.
132. Gadd, G.M. 1988. Special microbial processes, in Biotechnology, Rehm H.J., ed.
VCH verlagsgesellSchaft, Weinheim, Germany.6:pp.401-433.
133. Carrilho EN and Gilbert TR. 2000. Assessing metal sorption on the marine alga
Pilayella littoralis. J. Environ. Mon. 2:pp.410–415.
134. Klimmek S, Stan HJ, Wilke A, Bunke G and Buchholz R. 2001. Comparative
analysis of the biosorption of cadmium, lead, nickel, and zinc by algae. Environ.
Sci. Technol. 35: pp.4283–4288.
135. http://www.algaebase.org/search/images/.
136. Aslan S and Kapdan IK. 2006. Batch kinetics of nitrogen and phosphorus removal
from synthetic wastewater by algae. Ecol Eng 28:pp.64–70.
137. Wen ZY and Chen F. 2000. Production potential of eicosapentaenoic acid by the
diatom Nitzschia laevis. Biotechnology Letters. 22(9):pp.727–733.
179
138. Heredia-Arroyo T, Wei W, Ruan R and Hu B. 2011.Mixotrophic cultivation of
Chlorella vulgaris and its potential application for the oil accumulation from non-
sugar materials. Biomass and Bioenergy. 35(5):pp. 2245–2253, 2011.
139. Becker EW. 1994. Microalgae: Biotechnology and Microbiology. Cambridge,UK.
140. Bligh EG and Dyer WJ. 1959. A rapid method for total lipid extraction and
purification.Can.J.Biochem.Physiol.37:911-917.
141. Adrian Ammann A. 2007. J. Mass Spectrom. 42:pp.419–427.
142. Thomas R. 2004. Practical Guide to ICP-MS, Marcel Dekker Inc.
143. Gksungur Y, Uren S and Güvenç U. 2005.Biosorption of cadmium and lead ions
by ethanol treated waste baker’s yeast biomass, Bioresour. Technol. 96:pp.103-
109.
144. Levasseur MPA, Thompson and Harrison PJ. 1993. Physiological acclimation of
marine phytoplankton to different nitrogen sources. J.Phycol. 29:pp.87-595.
145. Susan I, Blackburn, Malcolm A, McCausland, Bolch CJS, Newman SJ and Jones
GJ. 1996. Effect of salinity on growth and toxin production in cultures of the
bloom-forming cyanobacterium Nodularia spumigena from Australian waters.
146. Tubea B. et al. 1981. The effects of nutrient, pH and herbicide levels on algal
growth. Hydrobiologia. 79:pp. 221-227.
147. McClanahan a TR, Carreiro-Silva M, DiLorenzo M. 2007. Effect of nitrogen,
phosphorous, and their interaction on coral reef algal succession in Glover’s Reef,
Belize. Marine Pollution Bulletin. 54: pp.1947–1957.
180
148. Yeesang C and Cheirsilp B. 2011. Effect of nitrogen, salt, and iron content in the
growth medium and light intensity on lipid production by microalgae isolated from
freshwater sources in Thailand. Bioresource Technol.102: pp.3034-3040.
149. Hu H and Gao K. 2005. Response of growth and fatty acid compositions of
nannochloropsis sp. to environmental factors under elevated CO2 concentration.
Biotechnol Lett., 28: pp.987-992.
150. Pietilainen O and Niinioja R. 2001. Nitrogen and phosphorus as algal growth
limiting factors in a boreal lake, in: W.D. Williams (Ed.), International Association
of Theoretical and Limnology-Proceedings. 27: pp. 2944-2947.
151. Sawayama S, Minowa T, Dote Y, and Yokoyama S. 1992. Growth of the
hydrocarbon rich microalga Botryococcus braunii in secondarily treated
sewage. Appl. Microbiol. Biotechnol. 38:135.
152. Sreesai S and Pakpain P. 2007. Nutrient Recycling by Chlorella vulgaris from
sepage effluent of the Bangkok city, Thailand. ScienceAsia. 33:pp.293-299.
153. Hao XD, Heijnen JJ and Van Loosdrecht MCM. 2002. Sensitivity analysis of a
biofilm model describing a one-stage completely autotrophic nitrogen removal
(CANON) process. Biotechnol. Bioeng. 77: pp. 266-277.
154. Borchardt MA. 1996. Nutrients. In: Algal ecology. San Diego (CA): Academic
Press, Inc. pp.183–227.
155. Pruvost J, Van Vooren G, Le Gouic B and Couzinet-Mossion, A.& Legrand J.
2011. Systematic investigation of biomass and lipid productivity by microalgae in
photobioreactors for biodiesel application. Bioresource Technology.102: pp.150-
158.
181
156. Mutlu YB, Isik O, Uslu L, Koc K and Durmaz Y. 2011. The effects of nitrogen
and phosphorus deficiencies and nitrite addition on the lipid content of Chlorella
vulgaris (Chlorophyceae). African J. Biotechnol.10: pp.453-456.
157. Gouveia L and Oliveira AC. 2009. Microalgae as a raw material for biofuels
production. J Ind Microbiol Biotechnol. 36: pp.269-274.
158. Zhu CJ, Lee YK and Chao TM. 1997. Effects of temperature and growth phase on
lipid and biochemical composition of Isochrysis galbana TK1. J. Applied Phycol.
9: pp.451-457.
159. Stringfellow W, Borglin S and Hanlon J. 2006. Measurement and modeling of
algal biokinetics in highly eutrophic waters. Information Bridge: DOE Scientific
and Technical Information. Retrieved 19 January 2010 from
http://www.osti.gov/bridge/product.biblio.jsp?osti_id=898947.
160. Sorokin C and Krauss RW. 1962. Effects of temperature and illuminance on
Chlorella growth uncoupled from cell division. Pl.Physiol. 37: pp.37-42.
161. Bajguz A. 2009. Brassinosteroid enhanced the level of abscisic acid in Chlorella
vulgaris subjected to short-term heat stress. Journal of Plant Physiology.166:pp.
882-886.
162. Converti A, Casazza AA, Ortiz EY, Perego P and M. Del Borghi. 2009. Effect of
temperature and nitrogen concentration on the growth and lipid content of
Nannochloropsis oculata and Chlorella vulgaris for biodiesel production. Chemical
Engineering and Processing 48: pp.1146-1151.
163. Baltic Marine Environment Protection. 1990. Seminar on nutrients removal from
municipal waste water. Baltic Sea Environment Proceedings, No. 36.
182
164. Mulkerrins D, Dobson ADW and Colleran E. 2004.Parameters affecting
biological phosphate removal from wastewaters. Environ. Inter. 30: pp.249 259.
165. Panswad T, Doungchai A and Anotai J. 2003. Temperature effect on microbial
community of enhanced biological phosphorus removal system. Water Res. 37:
pp.409 415.
166. Xin L, Hong-ying H, Ke G, Ying-xue S. 2010. Effects of different nitrogen and
phosphorus concentrations on the growth, nutrient uptake, and lipid accumulation
of a freshwater micro alga Scenedesmus sp. Bioresour Technol 101: pp.5494–
5500.
167. Yadavalli R, Ramgopal Rao S and Rao CS. 2012. Lipid accumulation studies in
chlorella pyrenoidosa using customized photobioreactor- Effect of nitrogen source,
light intensity and mode of operation. International Journal of Engineering
Research and Applications.2: pp.2446-2453.
168. Dumas A, Laliberte G, Lessard P and Noue J. 1998. Biotretament of fish farm
effluents using the cyanobacterium Phormidium bohneri. Aquacult Eng 17:pp. 57–
68.
169. Valderrama LT, DelCampo CM, Rodriguez CM, De-Bashan LE and Bashan Y
(2002) Treatment of recalcitrant wastewater from ethanol and citric acid
production using the micro alga Chlorella vulgaris and macrophyte Lemna
minuscula. Water Res 36: pp.4185–4192.
170. Baral SS, Das SN, and Rath P.2006.Hexavalent chromium removal from aqueous
solution by adsorption on treated sawdust. Biochem. Eng. J. 31:pp.216–222.
183
171. Gupta VK and Rastogi A.2009.Biosorption of hexavalent chromium by raw and
acid-treated green alga Oedogonium hatei from aqueous solutions. J. Hazard.
Materials. 163:pp.396–402.
172. Ozsoy HD, Kumbur H, Saha B and Leeuwen JHV. 2008. Use of Rhizopus
oligosporus produced from food processing wastewater as a biosorbent for Cu (II)
ions removal from the aqueous solutions. Bioresource Technology. 99: pp.4943-
4948.
173. Singh, S.K., et al. 2011. An integrated approach to remove Cr (VI) using
immobilized Chlorella minutissima grown in nutrient rich sewage wastewater.
Bioresour. Technol.
174. Chen Z, Ma W and Han M. 2008. Biosorption of nickel and copper onto treated
alga (Undaria pinnatifida): application of isotherm and kinetic models, J. Hazard.
Materials.155: pp.327-333.
175. Meena AK, Mishra GK, Raj PK, Rajagopal C and Nagar PN. 2005. Removal of
heavy metal ions from aqueous solutions using carbon aerogel as an adsorbent.
Journal of Hazardous Materials. 122:pp.161–170.
176. Li H, Li Z, Liu T, Xiao X, Peng Z and Deng L. 2008.A novel technology for
biosorption and recovery hexavalent chromium in wastewater by bio-functional
magnetic beads. Bioresour. Technol. 99: pp. 6271–6279.
177. Sahu SK, Verma Vijay K, Bagchi D, Kumar V and Pandey BD.2008. Recovery of
chromium (VI) from electroplating effluent by solvent extraction with tri-n-butyl
phosphate. Indian J. Chem. Technol. 15: pp. 397–402.
184
178. Yin PH, Yu QM, Jin B and Ling Z. 1999. Biosorption removal of cadmium from
aqueous solution by using pretreated fungal biomass cultured from starch
wastewater. Water Res. 33: pp.1960–1963.
179. Kurniasih, Ariesyady HD, Sulaeman A and Kardena E. 2013. Biosorption of
Chromium (VI) using immobilized algal-bloom biomass: Kinetics and Equilibrium
studies. International Journal of Environmental and Resource. 2:pp. 24-31.
180. Bai S and Abraham TE. 2001. Biosorption of Cr (VI) from aqueous solution by
Rhizopus nigricans. Bioresource technology. 79(1): pp. 73-81.
181. Mohan D, Singh KP and Singh VK. 2005. Removal of hexavalent chromium from
aqueous solutions using low-cost activated carbons derived from agricultural waste
materials and activated carbon fabric cloth. Ind. Eng. Chem. Res. 44: pp. 1027–
1042.
182. Wang XS, Chen LF, Li FY, Chen KL, Wan WY and Tang YJ. 2010. Removal of
Cr (VI) with wheat-residue derived black carbon: reaction mechanism and
adsorption performance. J. Hazard. Mater. 175: pp. 816–822.
183. Gokhale SV, Jyoti KK and Lele SS.2008.Kinetic and equilibrium modeling of
chromium (VI) biosorption on fresh and spent Spirulina platensis/Chlorella
vulgaris biomass. Bioresour. Technol.99: pp. 3600–3608.
184. Gupta VK, Shrivastava AK and Jain N.2001.Biosorption of chromium (VI) from
aqueous solutions by green algae spirogyra species. Water Res.35: pp. 4079–4085.
185. Sikaily AE, Khaled NA and Abdelwehab O.2007.Removal of toxic chromium
from wastewater using green alga Ulva lactuca and its activated carbon. J. Hazard.
Mater. 148: pp. 216–228.
185
186. Mahvi A, Nouri HJ, Omrani G A and Gholami F. 2007. Application of Platanus
orientalis leaves in removal of cadmium from aqueous solution, World Appl. Sci.
Journal. 2: pp. 40–44.
187. Herrero R, Cordero B, Lodeiro P, Rey-Castro C, and Sastre de Vicente ME. 2006.
Interactions of cadmium (II) and protons with dead biomass of marine algae Fucus
sp, Mar. Chem. 99: pp. 106–116.
188. Zadrozna MK, Klimiuk E and Baryla IW. 2004. Cyclical cadmium adsorption and
desorption by activated sludge immobilized on alginate carriers, Polish J. Environ.
Stud.13: pp. 161–169.
189. Lodeiro P, Cordero B, Barriada JL, Herrero R and Sastre de Vicente ME. 2005.
Biosorption of cadmium by biomass of brown marine macroalgae, Bioresour.
Technol. 96: pp. 1796–1803.
190. Liu YG, Fan T, Zeng GM, Li X, Tong Q, Ye F, Zhou M, Xu WH and Huang Y.
2006. Removal of cadmium and zinc ions from aqueous solution by living
Aspergillus niger, Trans. Nonferr. Metal Soc. China.16: pp.681–686.
191. Lu X, Kruatrachue M, Pokethitiyook P and Homyok K. 2004. Removal of
cadmium and zinc by water hyacinth, Eichhornia crassipes, Science Asia30: pp.
93–103.
192. Shi XM, Zhang XW and Chen F.2000. Heterotrophic production of biomass and
lutein by Chlorella protothecoides on various nitrogen sources. Enzyme and
Microbial Technology. 27: pp. 312–318.
186
193. Liang YN, Sarkany N and Cui Y. 2009.Biomass and lipid productivities of
Chlorella vulgaris under autotrophic, heterotrophic and mixotrophic growth
conditions. Biotechnology Letters.31: pp. 1043–1049.
194. Bhatnagar A, Chinnasamy S, Singh M, Das KC. 2011.Renewable biomass
production by mixotrophic algae in the presence of various carbon sources and
wastewaters. Applied Energy. 88: pp. 3425–3431.
195. Chojnacka K and Noworyta A. 2004. Evaluation of Spirulina sp. growth in
photoautotrophic, heterotrophic and mixotrophic cultures, Enzyme Microbial
Technol. 34:pp.461-465.
196. Yamane Y, Utsunomiya T, Watanabe M and Sasaki K. 2001. Biomass production
in mixotrophic culture of Euglena gracilis under acidic conditions and its growth
energetics. Biotechnol.Lett. 23. Pp.1223-1228.
197. Perez-Garcia O, de-Bashan LE, Hernandez JP, Bashan Y (2010) Efficiency of
growth and nutrient uptake from wastewater by heterotrophic, autotrophic, and
mixotrophic cultivation of Chlorella vulgaris immobilized with Azospirillum
brasilense. J Phycol 46:800–812
198. Powell, E.P., Hill, G.A., Optimization of Continuously Stirred Tank Bioreactor
Design for Cost Minimization: Effect of microbial species and operating
conditions. International Journal of Chemical Reactor Engineering, Volume 6,
2008, page 1642.
199. Oldshue, J.Y., Fluid Mixing Technology, McGraw Hill, New York (1983).
200. Perry, R.H., Green, D.W, Perry’s Chemical Engineers’ Handbook, Toronto, 7th
Ed. (1997).
187
201. Eliezier, E.D., Power Absorption by New and Hybrid Mixing Systems under
Gassed and Ungassed Conditions, in Ho, C.S., Oldshue, J.Y., Biotechnology
Processes: Scale-up and Mixing, American Institute of Chemical Engineers, New
York, NY (1987).
202. Bailey, J.E., Ollis, D.F., Biochemical Engineering Fundamentals, McGraw Hill,
Toronto, 2nd Ed. (1986).
203. Hassan, I.T.M., Robinson, C.W., Stirred-Tank Mechanical Power Requirement
and Gas Holdup in Aerated Aqueous Phases, AIChE J., Vol. 23, No. 1, 48-56
(1977).
204. Personal Communication from NanoVoltaics Inc: Algae, Nanomaterials, Solar.
205. Cost and performance report.2003. Environmental Security Technology
Certification Program (ESTCP) project: CP-9805.
206. Hartman P and Cleland J. 2007. Wastewater treatment performance and cost data
to support an affordability analysis for water quality standards. ICF International
Lexington, Massachusetts.
207. Zachary WR. 2010. Gasification of algae for the production of CNG. (Thesis.
University of Arizona).
208. http://saps.org.uk/saps-associates/browse-q-and-a/462-how-does-temperature-
affect-the-growth-of-algae-chlorella.
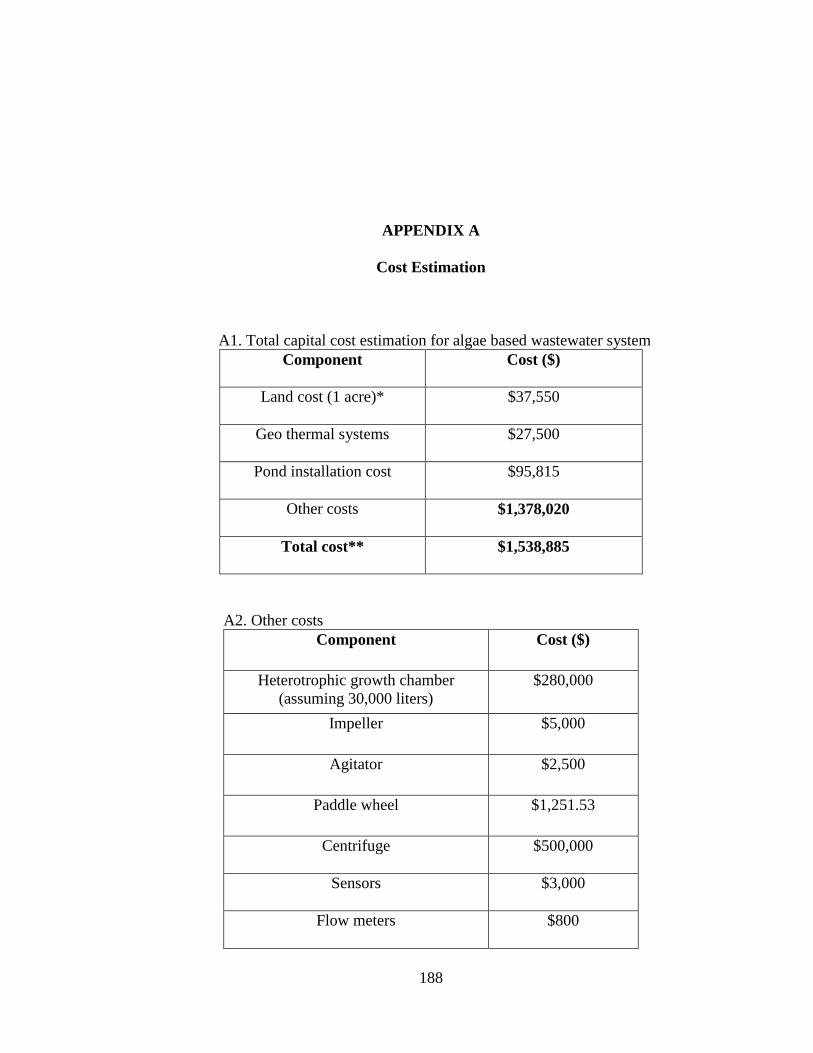
188
APPENDIX A
Cost Estimation
A1. Total capital cost estimation for algae based wastewater system
Component Cost ($)
Land cost (1 acre)* $37,550
Geo thermal systems $27,500
Pond installation cost $95,815
Other costs $1,378,020
Total cost** $1,538,885
A2. Other costs
Component Cost ($)
Heterotrophic growth chamber
(assuming 30,000 liters)
$280,000
Impeller $5,000
Agitator $2,500
Paddle wheel $1,251.53
Centrifuge $500,000
Sensors $3,000
Flow meters $800
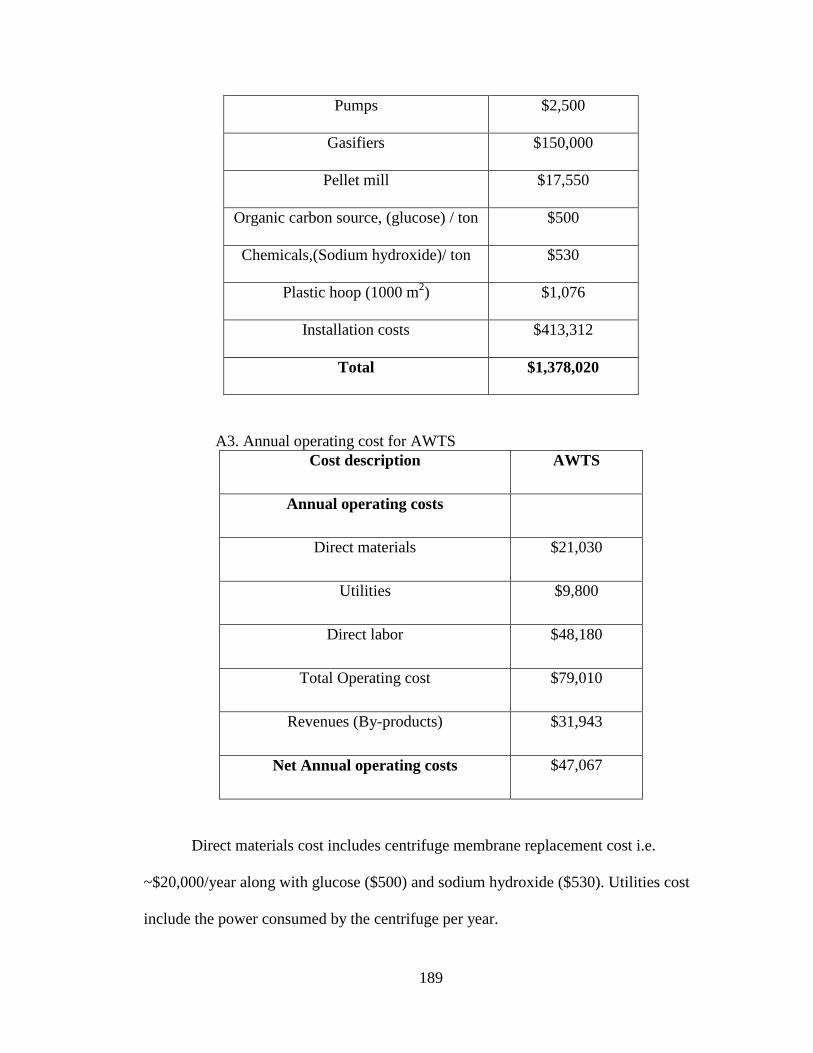
189
Pumps $2,500
Gasifiers $150,000
Pellet mill $17,550
Organic carbon source, (glucose) / ton $500
Chemicals,(Sodium hydroxide)/ ton $530
Plastic hoop (1000 m2) $1,076
Installation costs $413,312
Total $1,378,020
A3. Annual operating cost for AWTS
Cost description AWTS
Annual operating costs
Direct materials $21,030
Utilities $9,800
Direct labor $48,180
Total Operating cost $79,010
Revenues (By-products) $31,943
Net Annual operating costs $47,067
Direct materials cost includes centrifuge membrane replacement cost i.e.
~$20,000/year along with glucose ($500) and sodium hydroxide ($530). Utilities cost
include the power consumed by the centrifuge per year.
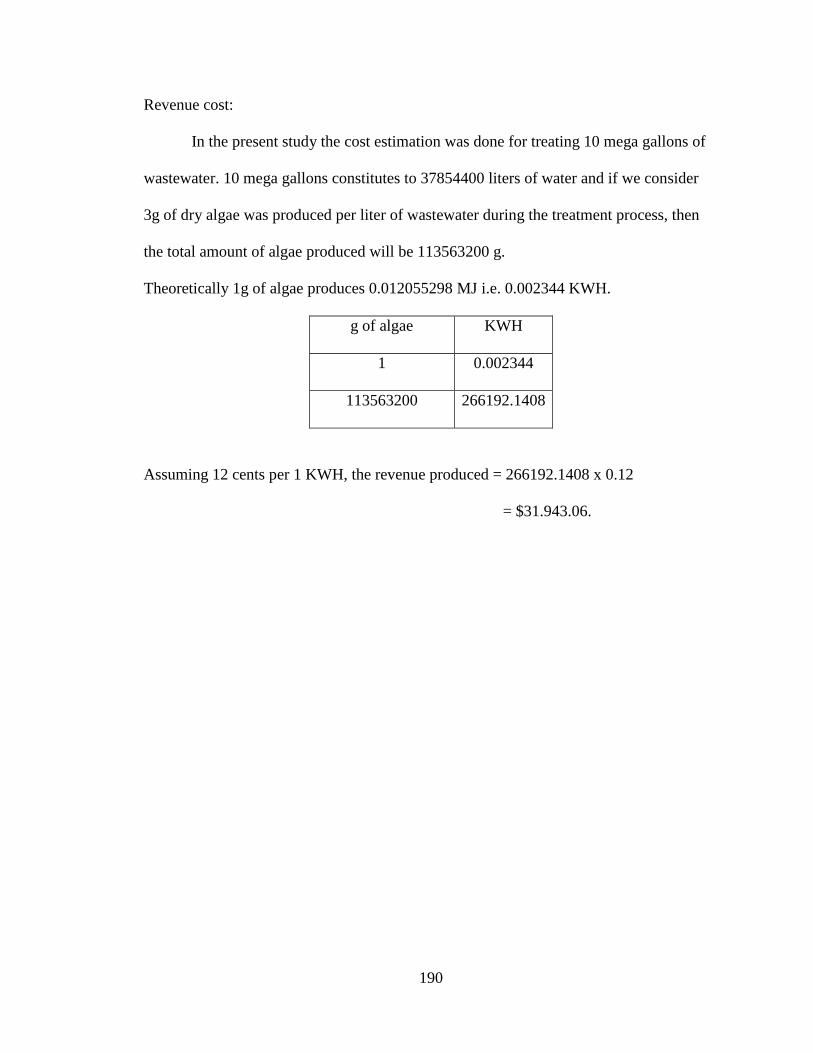
190
Revenue cost:
In the present study the cost estimation was done for treating 10 mega gallons of
wastewater. 10 mega gallons constitutes to 37854400 liters of water and if we consider
3g of dry algae was produced per liter of wastewater during the treatment process, then
the total amount of algae produced will be 113563200 g.
Theoretically 1g of algae produces 0.012055298 MJ i.e. 0.002344 KWH.
g of algae KWH
1 0.002344
113563200 266192.1408
Assuming 12 cents per 1 KWH, the revenue produced = 266192.1408 x 0.12
= $31.943.06.


