figure3 5 tce in groundwater.mxd 1/18/2017 ag017958 · 221 sunset phase 1 sitewide soil vapor...
TRANSCRIPT
#
#
#
## #
#
#
#
#
!?
!?
!?
!?
!?
!?
!?
&<&<
&<&<
&<&<&<&<&<
&<&<
&<&<&<&<
&<&<
&<
&<
&<
&<&<
&<&<
&<
&<&<
&<&<
Daws
on R
oad
Mulberry Drive
Sunset Drive
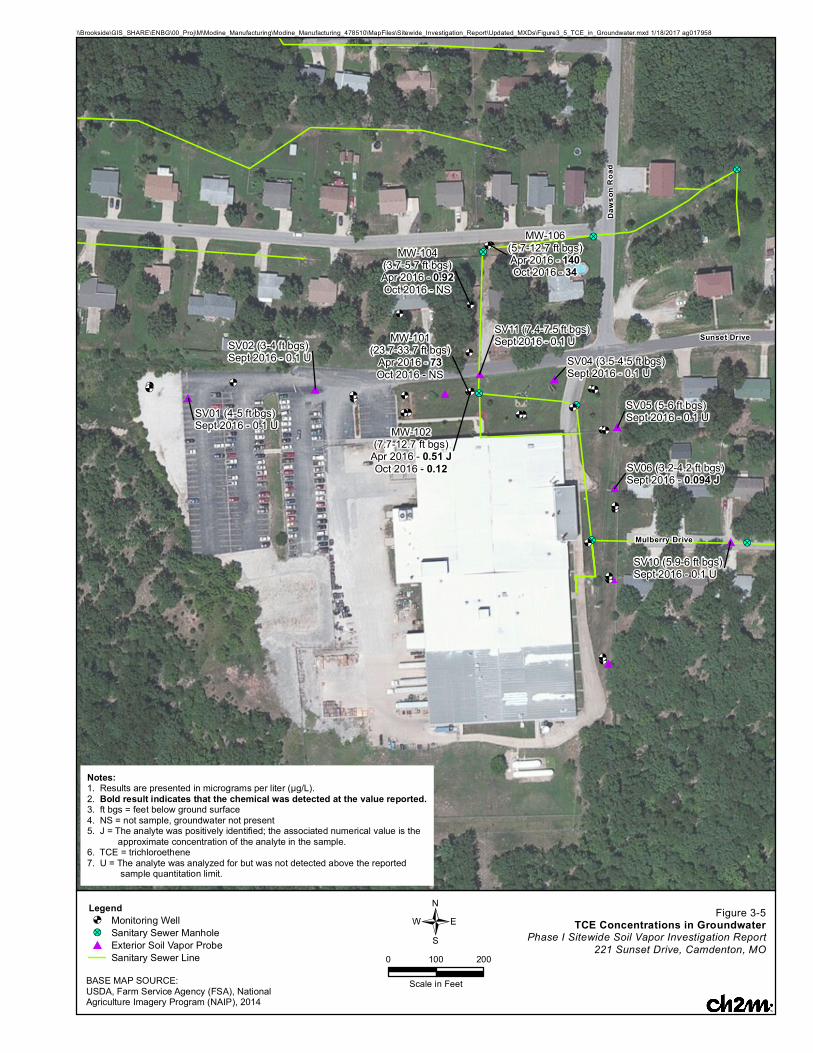
MW-104(3.7-5.7 ft bgs)Apr 2016 - 0.92Oct 2016 - NS
SV06 (3.2-4.2 ft bgs)Sept 2016 - 0.094 J
SV01 (4-5 ft bgs)Sept 2016 - 0.1 U
SV02 (3-4 ft bgs)Sept 2016 - 0.1 U SV04 (3.5-4.5 ft bgs)
Sept 2016 - 0.1 U
SV05 (5-6 ft bgs)Sept 2016 - 0.1 U
SV10 (5.9-6 ft bgs)Sept 2016 - 0.1 U
SV11 (7.4-7.5 ft bgs)Sept 2016 - 0.1 UMW-101
(23.7-33.7 ft bgs)Apr 2016 - 73Oct 2016 - NS
MW-102(7.7-12.7 ft bgs)
Apr 2016 - 0.51 JOct 2016 - 0.12
MW-106(5.7-12.7 ft bgs)Apr 2016 - 140Oct 2016 - 34
Figure 3-5TCE Concentrations in Groundwater
Phase I Sitewide Soil Vapor Investigation Report221 Sunset Drive, Camdenton, MO/
0 200100
Scale in Feet
\\Brookside\GIS_SHARE\ENBG\00_Proj\M\Modine_Manufacturing\Modine_Manufacturing_478510\MapFiles\Sitewide_Investigation_Report\Updated_MXDs\Figure3_5_TCE_in_Groundwater.mxd 1/18/2017 ag017958
Notes:1. Results are presented in micrograms per liter (µg/L).2. Bold result indicates that the chemical was detected at the value reported.3. ft bgs = feet below ground surface4. NS = not sample, groundwater not present5. J = The analyte was positively identified; the associated numerical value is the approximate concentration of the analyte in the sample.6. TCE = trichloroethene7. U = The analyte was analyzed for but was not detected above the reported sample quantitation limit.
BASE MAP SOURCE:USDA, Farm Service Agency (FSA), NationalAgriculture Imagery Program (NAIP), 2014
Legend&< Monitoring Well!? Sanitary Sewer Manhole# Exterior Soil Vapor Probe
Sanitary Sewer Line

!?
!?!?
!?
!?!?
!?
!?
&<&<
&<&<
&<&<&<&<&<
&<&<
&<&<&<&< &<&<
&<
&<&<
&<&<
&<&<
&<
&<&<
&<&<#*
#*
#*
#* #* #*#*
#*
#* #*
#*
Hulett Lagoon
FormerManufacturing
Facility
MW-111SMW-111D
MW-116SMW-116D
MW-117SMW-110DMW-110S
MW-109DMW-109S
MW-108SMW-108D
MW-115DMW-119D
MW-119SMW-100 MW-101
MW-102MW-103
MW-104MW-107
MW-106MW-105
MW-114SMW-114D
MW-118S
MW-112SMW-112D
MW-113SMW-113D
Suns
et La
ne
Forestway Drive
Oak Hill Drive
Mulberry Drive
Daws
on R
oad
Sunset Drive
Bent Tree Lane
SV18
SV12SV13
SV14
SV16SV17
SV15
SV19
SV07
SV06
SV08
SV01
SV02
SV03
SV04
SV05
SV10 SV09
SV11
B'
B
C'
C
A A'
FIGURE 4-1Cross-Section Transects
Phase I Sitewide Soil Vapor Investigation Report221 Sunset Drive, Camdenton, MO/
0 200 400Feet
\\Brookside\GIS_SHARE\ENBG\00_Proj\M\Modine_Manufacturing\Modine_Manufacturing_478510\MapFiles\Sitewide_Investigation_Report\Updated_MXDs\Figure4_1_Cross_Section_Lines.mxd ag017958 1/17/2017
Legend&< Monitoring Well#* Exterior Soil Vapor Probe!? Sanitary Sewer Manhole
Sanitary Sewer Line
Cross-Section Transect A-A'Cross-Section Transect B-B'Cross-Section Transect C-C'
BASE MAP SOURCE:USDA, Farm Service Agency (FSA), National AgricultureImagery Program (NAIP), 2014
EN1117161155MKE Fig4-2_A-A'_Sunset_v4.ai 04.27.17 tdaus
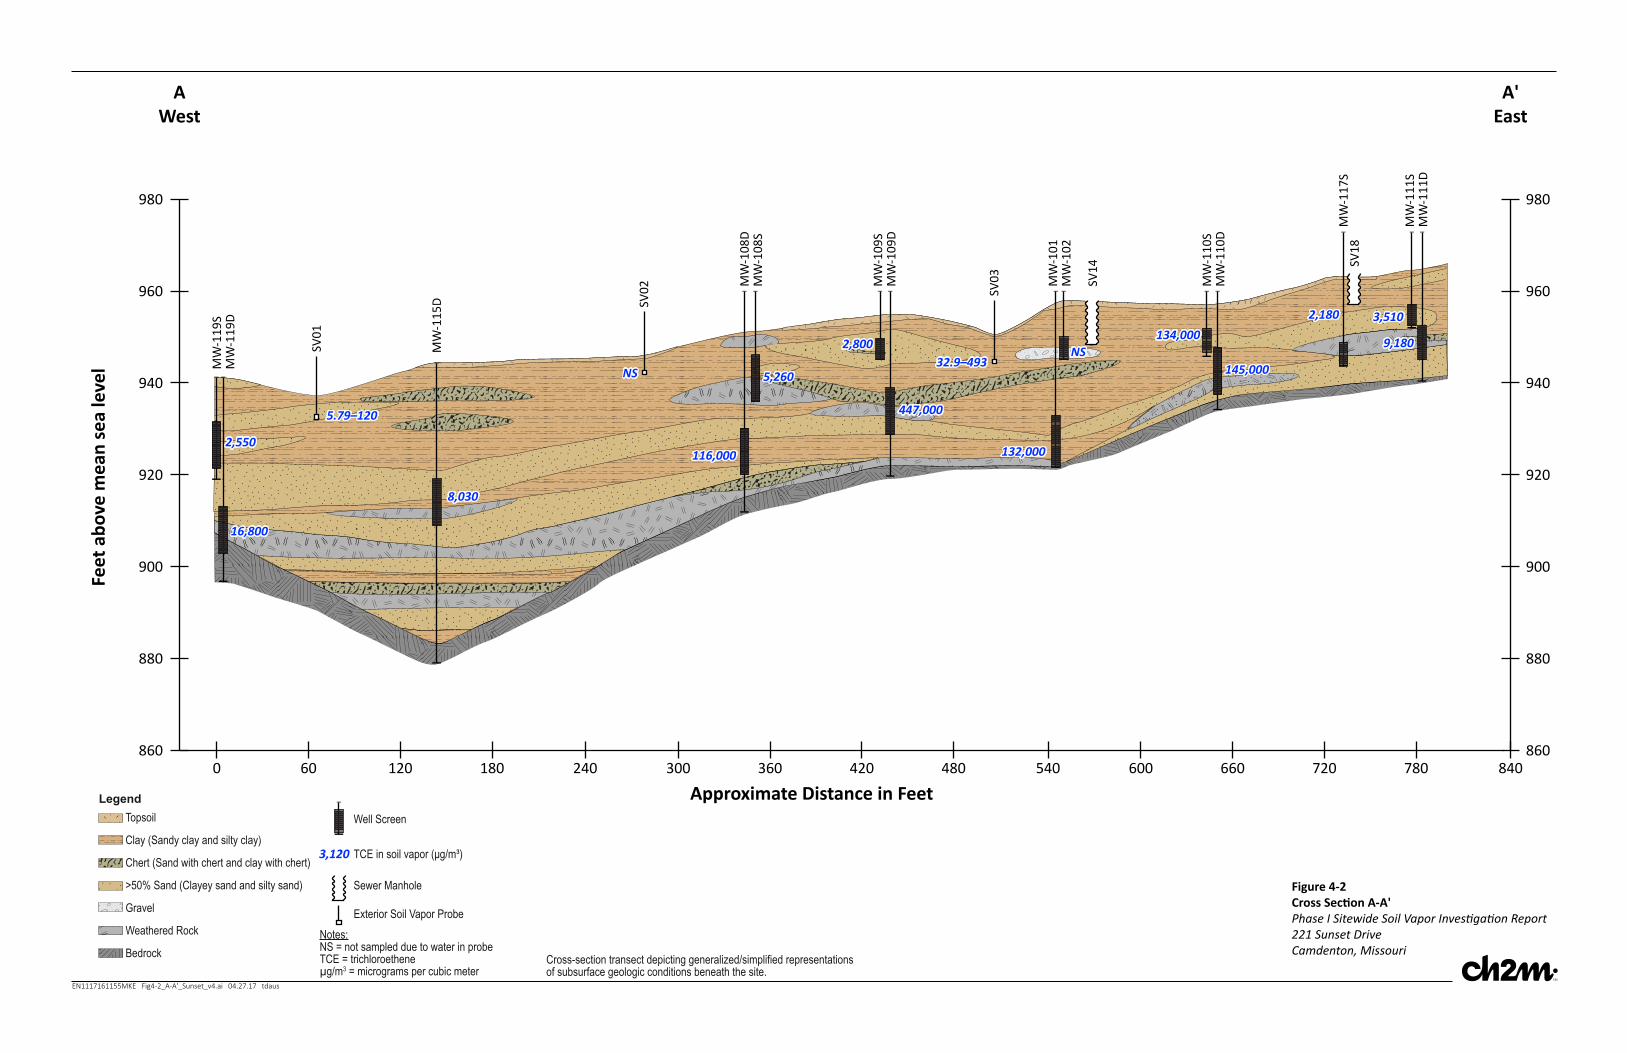
Figure 4-2 Cross Section A-A'Phase I Sitewide Soil Vapor Investigation Report221 Sunset DriveCamdenton, Missouri
980
AWest
Feet
abo
ve m
ean
sea
leve
l
Approximate Distance in Feet
960
940
920
900
880
8600 60 120 180 240 540300 360 420 480 840600 660 720 780
980
A'East
960
940
920
900
880
860
MW
-119
SM
W-1
19D
MW
-115
D
SV01
SV02 SV
03MW
-108
DM
W-1
08S
MW
-109
SM
W-1
09D
MW
-111
SM
W-1
11D
MW
-110
SM
W-1
10D
SV14
MW
-117
S
MW
-101
MW
-102
SV18
Topsoil
Clay (Sandy clay and silty clay)
Chert (Sand with chert and clay with chert)
>50% Sand (Clayey sand and silty sand)
Gravel
Weathered Rock
Bedrock
Legend
2,550
5,260
2,800134,000
2,180 3,510
2,550
16,80016,800
8,0308,030
5,260
116,000116,000
447,000447,000
2,800134,000
145,000145,000
2,180 3,510
9,1809,180
Well Screen
Sewer Manhole
Exterior Soil Vapor Probe
TCE in soil vapor (μg/m³)3,120
5.79–1205.79–120
NSNS
Notes:NS = not sampled due to water in probeTCE = trichloroetheneµg/m3 = micrograms per cubic meter
32.9–49332.9–493NSNS
132,000132,000
Cross-section transect depicting generalized/simplified representations of subsurface geologic conditions beneath the site.

Figure 4-3 Cross Section B-B'Phase I Sitewide Soil Vapor Investigation Report221 Sunset DriveCamdenton, Missouri
Feet
abo
ve m
ean
sea
leve
l
Approximate Distance in Feet
980
B South
970
960
950
940
930
920
980
970
960
950
940
930
9200 40 80 120 320160 200 240 280 360 400 440 480
B'North
MW
-114
SM
W-1
14D
MW
-113
SM
W-1
13D M
W-1
12S
MW
-112
D
MW
-116
DM
W-1
16S
MW
-111
DM
W-1
11S
Topsoil
Clay (Sandy clay and silty clay)
Chert (Sand with chert and clay with chert)
>50% Sand (Clayey sand and silty sand)
Weathered Rock
Bedrock
Legend
SV8
SV7
SV6 SV
5
EN1117161155MKE Fig4-3_B-B'_Sunset_v4.ai 04.27.17 tdaus
Cross-section transect depicting generalized/simplified representations of subsurface geologic conditions beneath the site.
49,500
255,000
3,120
8,6803,510
49,500
80.3–8,03080.3–8,030
360,000360,000
255,000
91,80091,800
3,120
255,000255,000
8,680
31,40031,400
3,510
9,1809,180
Well Screen
Sewer Manhole
Exterior Soil Vapor Probe
TCE in soil vapor (μg/m³)3,120
Notes:ND = TCE not detected in soil vaporTCE = trichloroetheneµg/m3 = micrograms per cubic meter
15,700–119,00015,700–119,000
31.7–40531.7–405 ND–3.88ND–3.88

Figure 4-4 Cross Section C-C'Phase I Sitewide Soil Vapor Investigation Report221 Sunset DriveCamdenton, Missouri
Feet
abo
ve m
ean
sea
leve
l
Approximate Distance in Feet
980
C Southeast
970
960
950
940
930
980
970
960
950
940
930500 100 150 200 450250 300 350 400 500 550 600 650
C'Northwest
MW
-118
S
MW
-117
S
MW
-110
DM
W-1
10S
MW
-103
MW
-104
?
?
?
??
?
MW
-105
SV12
SV14
SV16
SV11
Well Screen
Sewer Manhole
Exterior Soil Vapor Probe
Topsoil
Clay (Sandy clay and silty clay)
Chert (Sand with chert and clay with chert)
Fresh Chert and Limestone
>50% Sand (Clayey sand and silty sand)
Weathered Rock
Bedrock
Legend
SV18
EN1117161155MKE Fig4-4_C-C'_Sunset_v4.ai 04.27.17 tdaus
Cross-section transect depicting generalized/simplified representations of subsurface geologic conditions beneath the site.
1,270,000 2,180134,000
7,540150
1,270,000 2,180134,000
726,000726,000
145,000145,000
7,540150
TCE in soil vapor (μg/m³)3,120
Notes:TCE = trichloroetheneµg/m3 = micrograms per cubic meter
NSNS