field management plan for viejo project · field management plan for viejo project ... viejo system...
TRANSCRIPT

Field Management Plan for
Viejo Project
Charles J. Kim Engineer
Southern California Edison Jan 8, 2003

2
Table of Contents
I. Purpose of Document...............................................................................................................3
II. Introduction to EMF ...............................................................................................................3
III. EMF Characteristics..............................................................................................................3
IV. Science, Public Health, and Policy ........................................................................................4
V. Transmission & Subtransmission Design with Magnetic Field Reduction Measures ............6
VI. Substation Design with Magnetic Field Reduction Measures...............................................8
VII. Viejo Substation Project .......................................................................................................9
VIII. Magnetic Field Reduction Measures for Viejo Project ......................................................11
IX. Final Recommendations for Reducing Magnetic Fields .......................................................16
References....................................................................................................................................18
Appendix A: Field Model for Existing 220 and 66 kV Lines ......................................................19
Appendix B: Fields Model for the Proposed 220 and 66 kV Lines (Alternative 1-A) .................21
Appendix C: 2D Modeling for Alternative 1-B ...........................................................................23
Appendix D: 2D Modeling of Alternative 1-B & 1-C..................................................................25
Appendix E: 3D Modeling of Viejo Substation ...........................................................................27
Appendix F: Drawing for Viejo Project .......................................................................................31

3
I. Purpose of Document EMF field management plans are prepared for all new and upgraded electric utility transmission, subtransmission and substation facilities in accordance with the California Public Utility Commission’s decision [1] to implement “no-cost and low-cost” [2] methods to reduce power frequency magnetic fields from new electric utility facilities. This document is intended to provide an overview of the proposed Viejo System Project and the EMF design considerations applied to it. A brief review of the pertinent science, policies, and design considerations is also provided. II. Introduction to EMF Electric and magnetic fields occur from a variety energy sources that are electrical in nature. These energy sources and their associated electric and magnetic fields have been described and categorized within the electromagnetic spectrum [3]. The spectrum is organized by the frequency at which the electrical polarity of an energy source changes or oscillates with respect to time (in seconds). The frequency of an electric or magnetic field is expressed as Hertz (Hz). For instance, the earth’s magnetic field does not change at any appreciable rate and is considered static. This lies at the extreme low end of the electromagnetic spectrum at zero Hz. At the opposite end of the electromagnetic spectrum are the gamma rays. These fields have an extremely high frequency (1021) and a tremendous amount of energy. This is called ionizing radiation because this energy can ionize molecules. The spectrum includes; visible light, microwaves, radio waves, and electricity.
Figure 1: Electromagnetic Spectrum
The electricity we use each day is generated, transmitted, and distributed at a constant frequency of 60 Hz, also referred to as “power frequency”. The unit of measure for electrical power is Watts. Watts can be described as a product of electrical voltage and flow of charge (electrical current measured in Amp). Power-frequency electric and magnetic fields are referred to as EMF. These fields are the focus of this document. III. EMF Characteristics

4
Voltage or electrical pressure on any energized conductor exerts a force field known as an electric field. This electric field is measured in units of Volts per meter (V/m) and is dependent on the amount of charge. Therefore, a conductor energized at a higher level will have a higher electric field associated with it. Electric fields interact with other neighboring positive or negative charges to cause attracting or repelling forces. Like fields repel whereas unlike fields attract. The strength of this field rapidly decreases with distance from the source, just like the heat and light of a candle falls off with distance. The electric field can easily be shielded. Trees, fences, buildings, and most other structures can shield electric fields from an overhead power line. The earth will shield the electric field from buried power lines. The strength of the electric field from a power line depends on the voltage level, the distance away from the line, and design of the system. The use of electricity causes electric charges to flow as electric current. The current on a conductor creates magnetic fields. The unit of measure of magnetic fields is milliGauss (mG). The strength of magnetic fields diminishes quickly as you move away from the source, just like the electric field. However, the magnetic field is much more difficult to shield than electric fields. Trees, buildings, or the earth do not shield magnetic fields. Magnetic fields interact with neighboring magnetic fields and the resultant field depends on the magnitude and direction of each magnetic field source, i.e. currents. All Edison facilities contain multiple currents on circuits and depending on their arrangement can increase or decrease the strength of the magnetic field. Therefore, consideration of the direction and magnitude of the current and the configuration of conductors on poles or underground can be used to design facilities with reduced magnetic fields. Power frequency electric fields and magnetic fields from electric utility facilities act independently of one another and are considered separately. Each field can be calculated and/or measured for power line facilities. This document will focus only on power frequency magnetic fields associated with the utility facilities of the proposed project. IV. Science, Public Health, and Policy During recent years, questions have been raised about the possible health effects of power frequency EMF. Scientific communities have been unable to determine if EMF causes health effects or to establish any standard level of exposure that is known to be harmful [4]. Current scientific research focuses on exposure to magnetic fields rather than electric fields. This document also focuses on the magnetic fields. Because disease prevention may involve setting standards that limit exposures or emissions, public health brings science into the policy arena. One of the most important principles of public health policy is to make sure that resources are spent where they will do they most good.[4]. Typically, when public health and policy makers set exposure standards, they focus on the first health effects identified: the acute effects of high-level exposure. Setting standards for low-level exposures can be difficult and controversial, especially when the risks are uncertain and unproven, and the benefits of the proposed standards are intangible [5]. So far, research on EMF effects on human health has not found sufficient evidence to link EMF exposure to the risk of cancer or other disease. Accordingly, the CPUC decision 93-11-013 states in its conclusions of law: “It is not appropriate to adopt any specific numerical standard in association with EMF until we have a firm scientific basis for adopting any particular value”. If even the highest risk estimates reported in some of the literature are real, the individual risk is likely to be small, particularly compared to other health risks and compared to the benefits we derive from electric power. As a result, public policies that address the EMF question will have to be extremely flexible and to offer a self-correcting interaction between scientific research and policy making. Using such a model, we can respond appropriately as we learn more about the EMF issue [6]. In 1993, a California Public Utilities Commission decision (D.93-11-013) created an EMF research and information program. This program was managed by the California Department of health Services (CDHS)

5
and funded by utility ratepayers. The purpose of the program was to perform search and policy analysis, and provide education and technical help to benefit Californians. Input to the CDHS was provided by a Stakeholders Advisory Consultant Group (SAC) with representatives of the public, consumer groups, health and scientific experts, and labor and utility representatives. More input also came from state agencies, consultants and special interest groups during the open-forum discussion periods at the SAC meetings. In 2002, three scientists for California Department of Health Services concluded:
• To one degree or another, all three of the DHS scientists are inclined to believe that EMFs can cause some degree of increased risk of childhood leukemia, adult brain cancer, Lou Gehrig’s Disease, and miscarriage.
• They strongly believe that EMFs do not increase the risk of birth defects, or low birth weight. • They strongly believe that EMFs are not universal carcinogens, since there are a number of cancer
types that are not associated with EMF exposure. • To one degree or another they are inclined to believe that EMFs do not cause an increased risk of
breast cancer heart disease, Alzheimer’s Disease, depression or symptoms attributed by some to a sensitivity to EMFs. However,
• All three scientists had judgments that were “close to the dividing line between believing and not believing” that EMFs cause some degree of increased risk of suicide, or
• For adult leukemia, two of the scientists are “close to the dividing line between believing or not believing” and one was “prone to believe” that EMF cause some degree of increased risk.
In 1996, the National Academy of Sciences (NAS) issued a report finding that there is no clear, convincing evidence to show that residential exposures to electric and magnetic fields (EMF) are a threat to human health. The NAS is a private, non-profit society of distinguished scholars that advises the federal government on scientific and technical issues [7]. The federal government has also conducted EMF research as a part of a $45-million research program managed by the National Institute of Environmental Health Sciences. This program, known as the EMF RAPID (Research and Public Information Dissemination) Program, submitted a final report to the U.S. Congress on June 15, 1999 [8]. The report conclude that:
• “The scientific evidence suggesting that EMF exposures pose any health risk is weak.” • “EMF exposures cannot be recognized as entirely safe because of weak scientific evidence that
exposures may pose a leukemia hazard.” • “The power industry should continue its current practice of siting power lines to reduce exposures
and continue emphasis on educating both the public and provides of electricity about ways to reduce exposure.”
In 2001, Britain’s NRPB (National Radiological Protection Board) arrived at a similar conclusion:
“After a wide-ranging and thorough review of scientific research, an independent Advisory Group to the Board of NRPB has concluded that the power frequency electromagnetic fields that exist in the vast majority of homes, are not a cause of cancer in general. However, some epidemiological studies do indicate a possible small risk of childhood leukemia associated with exposures to unusually high levels of power frequency magnetic fields.”
In 2002, World Health Organization’s International Agency for Research on Cancer concluded: “… ELF magnetic fields are possibly carcinogenic to humans, based on consistent statistical associations of high-level residential magnetic fields with a doubling of risk of childhood leukemia. Children who are exposed to residential ELF magnetic fields less than 0.4 microTesla have no increased risk for leukemia. … In contrast, no consistent evidence was found that childhood exposures to ELF electric or magnetic fields are associated with brain tumors or any other kinds of solid tumors. No consistent evidence was found that residential or occupational exposures of adults to ELF magnetic fields increase risk for any kind of cancer.”
6
The Southern California Edison Company (SCE) is aware of the public's concerns about the potential health effects of power-frequency electric and magnetic fields. Notwithstanding the health, safety, and economic benefits of electricity, SCE recognizes and takes seriously its responsibility to address these EMF concerns. In order to better understand electric and magnetic fields and to respond to the current uncertainty, SCE will continue to: • Assist the California Public Utilities Commission and other appropriate local, state, and federal
governmental agencies in the development and implementation of reasonable, uniform regulatory guidance.
• Provide balanced, accurate information to our employees, customers, and public agencies, including
providing EMF measurements and consultation to our customers upon request. • Take appropriate no-cost and low-cost steps to minimize field exposures from new facilities and
continue to consult and advise our customer with respect to existing facilities, subject to CPUC guidance.
• Support appropriate research programs to resolve the key scientific questions about EMF. • Research and evaluate occupational health implications and provide employees who work near
energized facilities with timely, accurate information about field exposures in their work environment. V. Transmission & Subtransmission Design with Magnetic Field Reduction Measures The methods described here to reduce magnetic fields may lower electric fields as well. The focus of the design considerations implemented for this project is on methods to reduce the magnetic field. SCE has identified methods to reduce magnetic fields unique to its facilities and has incorporated these techniques into the "EMF Design Guidelines for New Electrical Facilities: Transmission, Substation, Distribution" manual [9]. Using these guidelines, “no- and low-cost” measures to reduce fields will be implemented wherever available and practical in accordance with CPUC decision 93-11-013. The criteria will be based on the following recommendations and assumptions: • Determine the number and size of the areas that need to be considered for EMF reduction.
• Prioritize these areas.
• Cost of reduction technique(s) incorporated in the design will determine the number of areas that can be mitigated along the route of the project.
• Low-cost measures must be applied equitably to similar priority areas to ensure fairness; • Total cost of mitigation should not exceed 4 percent of the total cost of the project. • Total field reduction must be fifteen percent (15%) or greater; and
• The solution selected should not jeopardize the reliability nor downgrade the operating characteristics of the system. It should not create a hazard to maintenance personnel nor to the public in general.
7
If it is not possible to route/reroute around areas of EMF concern, then the following steps should be considered: • Selection of the proper phasing arrangement is usually the most effective way to reduce fields for two
circuits on the same structure or two or more circuits on the same right-of-way. • Increased pole height and split-phase technique using paralleled three phase circuits should be
investigated if only one circuit exists on the route; and • The phasing arrangement selected should be reviewed by System Operations to determine impact of
net-through unbalance on the system when dealing with bulk-power circuits. If only one or two areas of a transmission line project need to be mitigated, other effective methods may be considered to reduce EMF provided that costs do not exceed 4 percent of total project cost. These methods may include: • Raising the height of the line for several spans, • Buying additional right-of-way to increase width of corridor, • Selecting a more compact, balanced-type configuration. For a wood-pole subtransmission project, the most cost-effective procedure may be raising the pole height or selecting a compact, balanced configuration. The selection of a particular pole-top configuration for new line and rebuilds is based on which configuration offers the most economy and still meets the necessary requirements. In addition, existing conditions and future system requirements are also considered. When installing electrical facilities that involve both Distribution (< 50kV) and Transmission (> 50kV), the following guidelines should be followed: • When overbuilding (or under-building) existing facilities, determine the phasing on the existing
circuits and then phase the new circuit or circuits accordingly. In most cases this proves to be a very satisfactory method for minimizing fields;
• Where new or reworked sub-transmission facilities are being considered on the same structures with
distribution circuits, the most effective field reduction measures may be those applied to the distribution circuits. Where common structures are involved, the 4-percent cost for field-reduction measures may be applied to any of the involved circuits;
• The total field reduction must be fifteen percent (15%) or greater. Preliminary Screening Questions 1) Can the low-cost field reduction measure be implemented using SCE approved equipment and
designs? 2) Is there sufficient physical space to implement the measure? 3) Can the measure be implemented without creating an unsafe condition? 4) Can the measure be implemented without materially reducing reliability? 5) Can the measure be implemented without materially increasing O&M cost? 6) Does the measure conform to good engineering practices?

8
The strength of fields at various distances from power line facilities can be calculated and/or measured. The use of computer programs can expedite the performance of calculations needed to estimate the value of the magnetic fields at any given point along the transmission and subtransmission line. SCE has developed the “Fields” program. It can model the magnetic fields from conductors and cables. By utilizing this program, designers can determine the best options for reducing EMF at “no- and low-cost.” The Fields program will be used to model the transmission and subtransmission line for purposes of examining various field reduction measures. VI. Substation Design with Magnetic Field Reduction Measures For a substation design, following “preliminary Screen Questions,” Table titled “No-Cost” Field Reduction Measures for New and Major Upgrade Substation Construction and “Low-Cost” Field Reduction Measures for New and Major Upgrade Substation Construction will be used to determine EMF reduction measure(s) to be implemented in final design.
Preliminary Screen Questions
• Can the low-cost field reduction measure be implemented using Edison approved equipment and design?
• Is there sufficient physical space to implement the measure? • Can the measure be implemented without creating an unsafe condition? • Can the measure be implemented without materially reducing reliability? • Can the measure be implemented without materially increasing O&M cost? • Does the measure conform to good engineering practices?
The strength of fields at various distances from power line facilities can be calculated and/or measured. The use of computer programs can expedite the performance of calculations needed to estimate the value of the magnetic fields at any given point within or around a substation system. SCE has also developed the “3D Fields” program [10]. It can model the magnetic fields from three-dimensional components used in a substation. By utilizing this program, designers can determine the best options for reducing EMF at “no- and low-cost.” The 3D Fields program will be used to model the substation examining various field reduction measures.

9
VII. Viejo Substation Project
Project Description SCE is proposing to construct the Viejo Substation near the corner of Icon and Definition streets in the City of Lake Forest, and a 66,000 volts (66 kV) power line that will extend approximately 3.1 miles along SCE’s existing 220 kV corridor from the proposed Viejo Substation to Chiquita Substation. Chiquita Substation is located on the southeast corner of Olympiad Road and Alicia Parkway in the City of Mission Viejo. The proposed Viejo Substation is located approximately one-quarter mile north of El Toro Road, one mile east of Santa Margarita Park, and east of and adjacent to the Foothill Transportation Corridor (SR 241). The proposed project is required to maintain reliable electrical service and to serve the area’s growing demand for electricity.
The new substation would transform electricity from 220,000 volts (220 kV) to 66 kV, and from 66 kV to 12 kV. The proposed 66 kV power line would extend approximately 3.1 miles from the proposed Viejo Substation to the Chiquita Substation located on the southeast corner of Olympiad Road and Alicia Parkway in the City of Mission Viejo. The addition of the new 66 kV line will be accomplished by dismantling and installing new 66 kV structures; see Figure 2 & Figure 3 below.
Figure 2: Existing Structures
Figure 3: New 66 kV Structures with Existing
220 kV Structure
At the proposed Viejo Substation, SCE plans to route one of the existing 220 kV lines (currently San Onofre – Chino 220 kV transmission line) into the substation
FMP Base Case

10
The total cost of this project is approximately $42.4 million dollars. Transmission and substation engineers implemented magnetic field reduction measures early in the design phase. Magnetic field reduction measures include using taller poles, reducing line-to-line spacing, optimal phasings, distance to occupied spaces (e.g., such as homes and commercial buildings), and use of the existing 220 kV corridor. Therefore, the total construction cost ($42.4 million dollars) includes the cost of “low-cost” options.
Alternatives Alternative 1A – Proposed Viejo Project This is the proposed design, and the main focus of this document; See “Project Description” section above. Alternative 1B – Viejo Project: Overhead/Underground Installation Alternative 1B to the proposed 66 kV subtransmission line would involve installing the line partially underground and partially overhead within a portion of the existing SCE 220 kV corridor. The route would begin at the proposed Viejo Substation site, extend east to the SCE existing 220 kV corridor and continue south within the existing 220 kV corridor. The overhead lines would eventually terminate and connect to underground cables via a riser pole at Santa Margarita Parkway just north of Flamenco Park and south of Pinecrest Park. The line would continue underground from Santa Margarita Parkway and travel west within Santa Margarita Parkway and then travel south within Marguerite Parkway. From Marguerite Parkway, the line would continue south to Olympiad Road, cross Alicia Parkway and turn into the Chiquita Substation located on the southeast corner of Olympiad Road and Alicia Parkway. If this option were chosen, magnetic reduction measures would include:
• Use taller poles: • Use compact pole-head configuration
Alternative 1C – Viejo Project: All Underground Installation Alternative 1C to constructing the proposed 66 kV subtransmission line underground within city streets. To minimize cost associated with right-of-way acquisition, the line would be installed within existing roadways. The route would begin at the Viejo substation site, extend approximately 200 feet north within the proposed substation site access road and then travel underground within Definition Road to Glenn Ranch Road. The line would then turn and travel southwest within the Glenn Ranch Road corridor, south within Portola Parkway, under SR 241 Foothill Transportation Corridor and continue south on Santa Margarita Parkway. From Santa Margarita Parkway, the line would be located within Marguerite Parkway and travel south to Olympiad Road, cross Alicia Parkway and turn into the Chiquita Substation located on the southeast corner of Olympiad Road and Alicia Parkway. If this option were chosen, magnetic field reduction measures would include:
• Split-phase underground system Alternative 2 – Santiago Substation & System Upgrade Santiago Substation has two 220 kV source lines, the SONGS-Santiago #1 and #2 lines. There are presently four 280 MVA transformer banks serving two bus sections. An upgrade of the Santiago System would require the addition of two 280 MVA transformers, construction of additional 66 kV subtransmission lines to deliver the power, and upgrades to the 220 kV transmission system. Based on evaluations of the existing subtransmission line network, the reconfiguration of the substation necessitates the construction of approximately 26-circuit miles of subtransmission lines. These line additions would be required to provide adequate line capacity to deliver power to project areas.

11
Alternative 2 addresses the immediate need for additional transformer capacity; however, it does not eliminate the eventual need for the Viejo project (i.e., Alternative 1). It also does not address the need for increased reliability as no improvements are made to the operational flexibility of the existing Santiago System. Alternative 1 requires approximately 3 to 4 miles of a new 66 kV subtransmission line compared to 26 miles of subtransmission lines; this is not a “low-cost” EMF option. Therefore, no EMF reduction measures are considered for “Alternative 2.” Preliminary engineering study indicates that choosing either Alternative 1B or Alternative 1C would cost approximately $46 to $49 million dollars. Choosing either Alternative 1B or Alternative 1C is not a “low” EMF cost option. Therefore, this document includes only magnetic field calculations based upon preliminary engineering designs for reference purpose (See Appendix C and D). If either Alternative 1B or Alternative 1C is chosen, a detailed FMP will be prepared with a detailed engineering design.
VIII. Magnetic Field Reduction Measures for Viejo Project For the purpose of examining “magnetic field reduction” measures, this project can be divided into two parts: Part I: Transmission and Subtransmission Line
• San Onofre – Viejo 220 kV & Viejo – Chino 220 kV Transmission Lines • Chiquita – O’Neil-Viejo 66 kV Subtransmission Line • Chiquita – Viejo No. 1 66 kV Subtransmission Line • Chiquita – Viejo No 2 66 kV Subtransmission Line
Part II: Viejo Substation Field Management Plan, therefore, is divided into two parts.
Part I: FMP for Transmission and Subtransmission Lines
“No-Cost” Field Reduction Measures for New, Major Upgrade, and Relocation Transmission Line Project Above 50 kV
Included in Design
Not Included in Final Design
Limited Space
Safety Issue
O&M Reliability
Issue
Cost Issue
Good Engineering Practice
Optimum phasing for maximum cancellation (new construction, multiple circuits only)
√
Select alternate route for power lines See Note 1

12
Table 1: “No-Cost” Field Reduction Measures for Transmission Line Project
Note 1: SCE currently owns the 220 kV corridor necessary for this project, and using existing right-of-way is the no cost option.
“Low Cost” Field Reduction Measures for 220 kV Transmission Line Only At the proposed Viejo Substation, SCE plans to route a 220 kV transmission line (currently San Onofre – Chino 220 kV transmission line) into the substation. This requires modifying three existing 220 kV Lattice Steel Towers (LST) and adding ten more tubular steel poles (get-away poles) to properly direct the 220 kV lines. Therefore, the magnetic field reduction measures applicable to work are as follows:
• Use taller poles: • Use smaller phase-to-phase spacing • Optimally phase circuits entering and existing substation.
“Low Cost” Field Reduction Measures for 66 kV Subtransmission Lines Only This project adds one more 66 kV subtransmission line originating from the proposed Viejo Substation to the existing Chiquita Substation. In order to accommodate one more circuit, existing double-circuit tubular steel poles will be replaced with H-Frame tubular steel structures; see “Figure 2: Existing Structures” & “Figure 3: New 66 kV Structures with Existing 220 kV Structure.” The magnetic field reduction measures applicable to this work are as follows:
• Use taller structures • Use smaller phase-to-phase spacing • Optimally phase circuits within the corridor • Place lines farther away from the existing 66 kV pole locations which would move them
farther from residential housing. Field Modeling Assumptions The “Fields” program is used to evaluate the magnetic field characteristics of the proposed base case construction, and various magnetic field reduction alternatives. The models applicable to this project are found in the appendix. Magnetic field strength is calculated at a height of three feet above ground (assuming flat terrain). Calculations of resultant magnetic field are expressed in units of milliGauss (mG), and represent the results of two-dimensional magnetic fields. The results in the magnetic field models are for comparison of construction methods only and cannot be assumed to represent actual milliGauss (mG) levels found at any particular point along the line route. In addition, because of the numerous and complex variables that affect magnetic field strength, SCE makes no guarantee or representation that magnetic field levels presented in this document will in any way reflect the actual measured values once construction of the proposed line is completed. Historical data gathered from July 1 to September 30, 2002 reflects the following 95 percentile loading conditions:

13
• Chiquita-Limestone-Moulton 66 kV: 360 Amp • Chiquita-Limestone-O’Neill 66 kV: 380 Amp • San Onofre – Serrano 220 kV: 910 Amp • San Onofre – Chino 220 kV: 780 Amp
Year 2005 forecasting loadings for existing 66 kV lines without this project are as follows:
• Chiquita-Limestone-Moulton 66 kV: 660 Amp • Chiquita-Limestone-O’Neill 66 kV: 662 Amp
Year 2005 forecasting loading for proposed 66 kV lines are as follows:
• Viejo-Chiquita No. 1 66 kV: 537 Amp • Viejo-Chiquita No. 2 66 kV: 537 Amp • Viejo-Chiquita-O’Neill 66 kV: 536 Amp
For modeling following loadings are used with an assumption that they are balanced. For Existing Design Chiquita-Limestone-Moulton 66 kV: 370 Amp Chiquita-Limestone-O’Neill 66 kV: 370 Amp
• San Onofre – Serrano 220 kV: 910 Amp • San Onofre – Chino 220 kV: 780 Amp
Note: 370 Amp is used for both 66 kV lines in order to use historical loading data in the modeling. 370 Amp is the average of two lines’ historical data. For Proposed Design
• Viejo-Chiquita No. 1 66 kV: 300 Amp • Viejo-Chiquita No. 2 66 kV: 300 Amp • Viejo-Chiquita-O’Neill 66 kV: 300 Amp • San Onofre – Serrano 220 kV: 910 Amp • San Onofre – Chino 220 kV: 780 Amp
Note: 300 Amp is used for all 66 kV lines in order to use historical loading in the modeling. 300 Amp is determined by finding the ratio of historical data and forecasted data and multiply the factor to the average of forecasted loadings for new lines (i.e. (360+380)/(660+662) * ( (537+537+536)/3 ) = 300 Amp) Power flow direction for 220 kV is in the opposite direction of 66 kV circuits. Figure 4 below shows a magnetic field level comparison of existing and proposed designs. The proposed 66 kV H-frame structures are approximately 15 feet taller (on average) than the existing tubular steel poles. Moreover, the 66 kV circuit-to-circuit spacing is reduced from 16 feet to 10~12 ft. Conductor tension for 66 kV lines will be increased for the proposed design in order to make sagging distance comparable (or shorter in some cases) to the existing design. All circuits are optimally phased1. As a result, there will be a 36~58% magnetic field reduction at the edges of the right-of-way, compared to existing conditions. The proposed phasing sequences are as follows (from top-to-bottom):
1 This project should not increase the magnetic fields level outside of the project scope. Therefore, a San Onofre – Chino 220 kV line phasing is selected first to lower the magnetic fields for the entire 220 kV route.

14
• San Onofre – Serrano 220 kV: B-A-C (same as existing phasing) • San Onofre – Viejo 220 kV: C-A-B • Viejo – Chino 220 kV: C-A-B • Chiquita-O’Neill-Viejo 66 kV: B-A-C • No. 1 Chiquita – Viejo 66 kV: A-C-B • No. 2 Chiquita – Viejo 66 kV: C-B-A
The proposed phasing is a “no- and low-cost” option for this project.
Part II: FMP for Viejo Substation Major power equipment setback distances and line entering and exiting the substation are the main focus of reducing magnetic fields. Following tables are used to evaluate “no- and low-cost” mitigation option to reduce the magnetic fields. Reduction measures are examined at the edge of the substation property line.
0.0
5.0
10.0
15.0
20.0
25.0
30.0
35.0
40.0
45.0
0 10 20 30 40 50 60 70 80 9010
011
0120 13
014
0150 16
0170 180 19
0200
Distance (unit: ft)
Bm
ax (
unit:
mG
)
Existing
Proposed
0.0
5.0
10.0
15.0
20.0
25.0
30.0
35.0
40.0
45.0
0 10 20 30 40 50 60 70 80 9010
011
0120 13
014
0150 16
0170 180 19
0200
Distance (unit: ft)
Bm
ax (
unit:
mG
)
Existing
Proposed
Figure 4: Magnetic Field Level Comparison of Existing and Proposed Designs

15
“No-Cost” Field Reduction Measures for New and Major Upgrade Substation Construction
Included in Design
Not Included in Final Design
Limited Space
Safety Issues
O&M Reliability
Issues
Cost Issue
Good Engineering
Practice Transformers and air core reactors > 15 ft from substation property line
√
Switch-racks, capacitor banks & bus > 8 ft from substation property line
√
Underground cable duct banks > 12 feet from “side” substation property line
N/A
Phase circuits entering or exiting the substation for minimum fields
√
Construct transfer/operating bus configuration with the transfer bus facing the nearest property/fence line
√
Table 2: "No-Cost" Field Reduction Measures for Substation
“Low-Cost” Field Reduction Measures for New and Major Upgrade Substation Construction Field Reduction Measures Meets Prelim.
Screen Reduction
Score (mG*ft)
Cost Priority Rank
Adopt in Final
Design Increase height of get-away pole/tower by 5 feet See Note 2 √ Increase height of get-away pole/tower by additional 5 ft (10 feet total)
Increase height of get-away pole/tower by additional 5 ft (15 feet total)
Increase depth of underground by 1 feet Increase depth of underground by additional 1 feet (total 2 feet0
N/A
Increase depth of underground by additional 1 feet (total 3 feet)
N/A
Replace get-way pole head configuration with lower field reduction
√ High Low High √
Compact substation design so as to maximize clearances to fence
Note 3
Purchase additional property to increase clearance to fence
√ High High Low Note 3
Table 3: "Low-Cost" Magnetic Fields Reduction Measures for Substation
Note 2: Per engineering and safety (such as line clearance), 75 feet or taller tubular steel poles and towers will be used for getaways. Therefore, 3D Model reflects 75 feet getaway poles as a worst case (in terms of magnetic fields). Note 3: Not a ‘No- and Low-Cost” option.
3D Magnetic Field Modeling Assumptions The “3D Fields” program is used to evaluate the magnetic field characteristics of the proposed base case construction, and various magnetic field reduction alternatives. The models applicable to this project are found in the appendices.
16
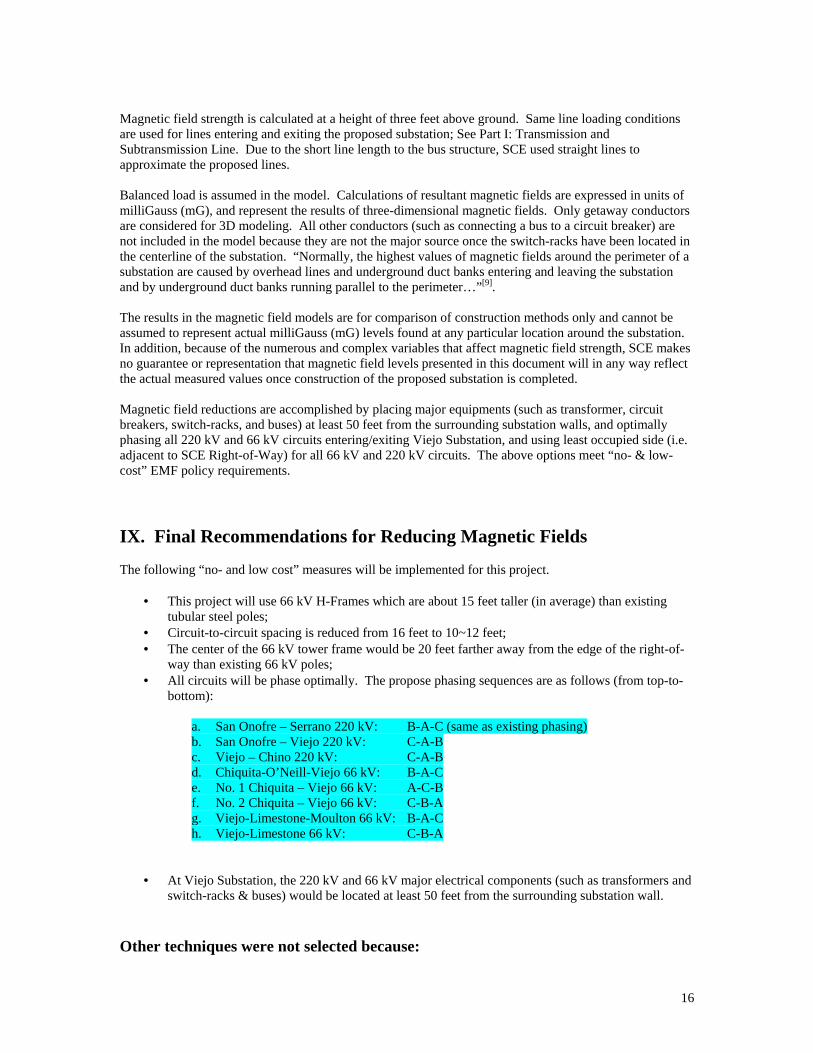
Magnetic field strength is calculated at a height of three feet above ground. Same line loading conditions are used for lines entering and exiting the proposed substation; See Part I: Transmission and Subtransmission Line. Due to the short line length to the bus structure, SCE used straight lines to approximate the proposed lines. Balanced load is assumed in the model. Calculations of resultant magnetic fields are expressed in units of milliGauss (mG), and represent the results of three-dimensional magnetic fields. Only getaway conductors are considered for 3D modeling. All other conductors (such as connecting a bus to a circuit breaker) are not included in the model because they are not the major source once the switch-racks have been located in the centerline of the substation. “Normally, the highest values of magnetic fields around the perimeter of a substation are caused by overhead lines and underground duct banks entering and leaving the substation and by underground duct banks running parallel to the perimeter…”[9]. The results in the magnetic field models are for comparison of construction methods only and cannot be assumed to represent actual milliGauss (mG) levels found at any particular location around the substation. In addition, because of the numerous and complex variables that affect magnetic field strength, SCE makes no guarantee or representation that magnetic field levels presented in this document will in any way reflect the actual measured values once construction of the proposed substation is completed. Magnetic field reductions are accomplished by placing major equipments (such as transformer, circuit breakers, switch-racks, and buses) at least 50 feet from the surrounding substation walls, and optimally phasing all 220 kV and 66 kV circuits entering/exiting Viejo Substation, and using least occupied side (i.e. adjacent to SCE Right-of-Way) for all 66 kV and 220 kV circuits. The above options meet “no- & low-cost” EMF policy requirements.
IX. Final Recommendations for Reducing Magnetic Fields The following “no- and low cost” measures will be implemented for this project.
• This project will use 66 kV H-Frames which are about 15 feet taller (in average) than existing tubular steel poles;
• Circuit-to-circuit spacing is reduced from 16 feet to 10~12 feet; • The center of the 66 kV tower frame would be 20 feet farther away from the edge of the right-of-
way than existing 66 kV poles; • All circuits will be phase optimally. The propose phasing sequences are as follows (from top-to-
bottom):
a. San Onofre – Serrano 220 kV: B-A-C (same as existing phasing) b. San Onofre – Viejo 220 kV: C-A-B c. Viejo – Chino 220 kV: C-A-B d. Chiquita-O’Neill-Viejo 66 kV: B-A-C e. No. 1 Chiquita – Viejo 66 kV: A-C-B f. No. 2 Chiquita – Viejo 66 kV: C-B-A g. Viejo-Limestone-Moulton 66 kV: B-A-C h. Viejo-Limestone 66 kV: C-B-A
• At Viejo Substation, the 220 kV and 66 kV major electrical components (such as transformers and switch-racks & buses) would be located at least 50 feet from the surrounding substation wall.
Other techniques were not selected because:

17
• Shielding is not applicable to this project; • Current reduction is not applicable to this project; • The measure does not reduce the magnetic fields from the proposed line more than 15%; • The measure does not meet SCE’s engineering and safety requirements; • The substation is an unmanned facility; • The measure is not a “no- and low-cost” option.
The recommendations above meet CPUC-approved EMF Design Guidelines as well as all national and state safety standards for new electric facilities.
18
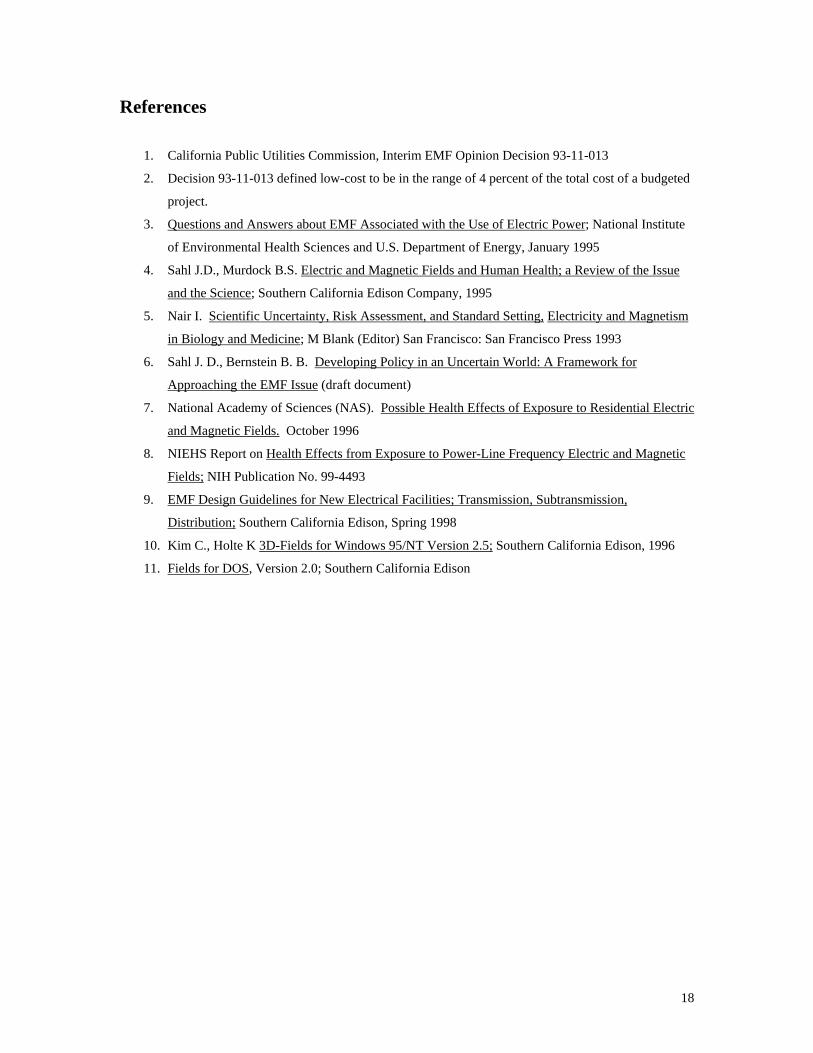
References
1. California Public Utilities Commission, Interim EMF Opinion Decision 93-11-013
2. Decision 93-11-013 defined low-cost to be in the range of 4 percent of the total cost of a budgeted
project.
3. Questions and Answers about EMF Associated with the Use of Electric Power; National Institute
of Environmental Health Sciences and U.S. Department of Energy, January 1995
4. Sahl J.D., Murdock B.S. Electric and Magnetic Fields and Human Health; a Review of the Issue
and the Science; Southern California Edison Company, 1995
5. Nair I. Scientific Uncertainty, Risk Assessment, and Standard Setting, Electricity and Magnetism
in Biology and Medicine; M Blank (Editor) San Francisco: San Francisco Press 1993
6. Sahl J. D., Bernstein B. B. Developing Policy in an Uncertain World: A Framework for
Approaching the EMF Issue (draft document)
7. National Academy of Sciences (NAS). Possible Health Effects of Exposure to Residential Electric
and Magnetic Fields. October 1996
8. NIEHS Report on Health Effects from Exposure to Power-Line Frequency Electric and Magnetic
Fields; NIH Publication No. 99-4493
9. EMF Design Guidelines for New Electrical Facilities; Transmission, Subtransmission,
Distribution; Southern California Edison, Spring 1998
10. Kim C., Holte K 3D-Fields for Windows 95/NT Version 2.5; Southern California Edison, 1996
11. Fields for DOS, Version 2.0; Southern California Edison

19
Appendix A: Field Model for Existing 220 kVand 66 kV Lines Input Data
Output Data DIST B Horz B Vert B PROD B MAX (Ft) (mG) (mG) (mG) (mG) 0 11.5 26.0 28.5 27.0 5 14.7 27.2 30.9 29.3 10 18.5 28.0 33.6 31.6 15 22.8 28.2 36.3 33.9 20 27.4 27.7 39.0 36.2 25 32.2 26.5 41.7 38.3 30 36.5 24.8 44.1 40.2 35 40.0 23.2 46.2 41.7 40 42.2 22.7 47.9 42.6 45 42.8 23.8 48.9 42.8 50 41.8 26.2 49.3 42.2 55 39.8 28.7 49.1 41.0 60 37.4 30.2 48.1 39.3 65 35.4 30.4 46.6 37.2 70 33.8 29.1 44.6 35.4 75 32.5 27.1 42.3 34.0 80 30.8 25.0 39.7 32.9 85 28.3 23.6 36.9 31.7 90 25.0 23.0 34.0 30.4 95 20.8 23.0 31.0 28.8 100 16.1 23.1 28.1 26.9 105 11.1 22.7 25.3 24.8 110 6.3 21.6 22.5 22.5 115 3.8 19.7 20.1 20.0 120 5.7 17.3 18.2 17.4 125 7.5 15.6 17.4 15.9

20
130 7.0 16.1 17.6 16.8 135 3.7 18.2 18.6 18.5 140 2.9 19.6 19.8 19.6 145 8.3 19.0 20.7 19.6 150 12.4 17.0 21.0 18.5 155 14.0 15.1 20.6 16.8 160 13.5 14.2 19.6 14.8 165 11.8 13.8 18.1 13.8 170 9.8 13.2 16.5 13.3 175 8.2 12.4 14.9 12.6 180 7.1 11.4 13.4 11.7 185 6.3 10.2 12.0 10.9 190 5.9 9.1 10.8 10.0 195 5.6 8.1 9.8 9.3 200 5.3 7.2 9.0 8.6 Note: Edges of the Right-of-Way are located at Distance “0 ft” and “200 ft.”
21
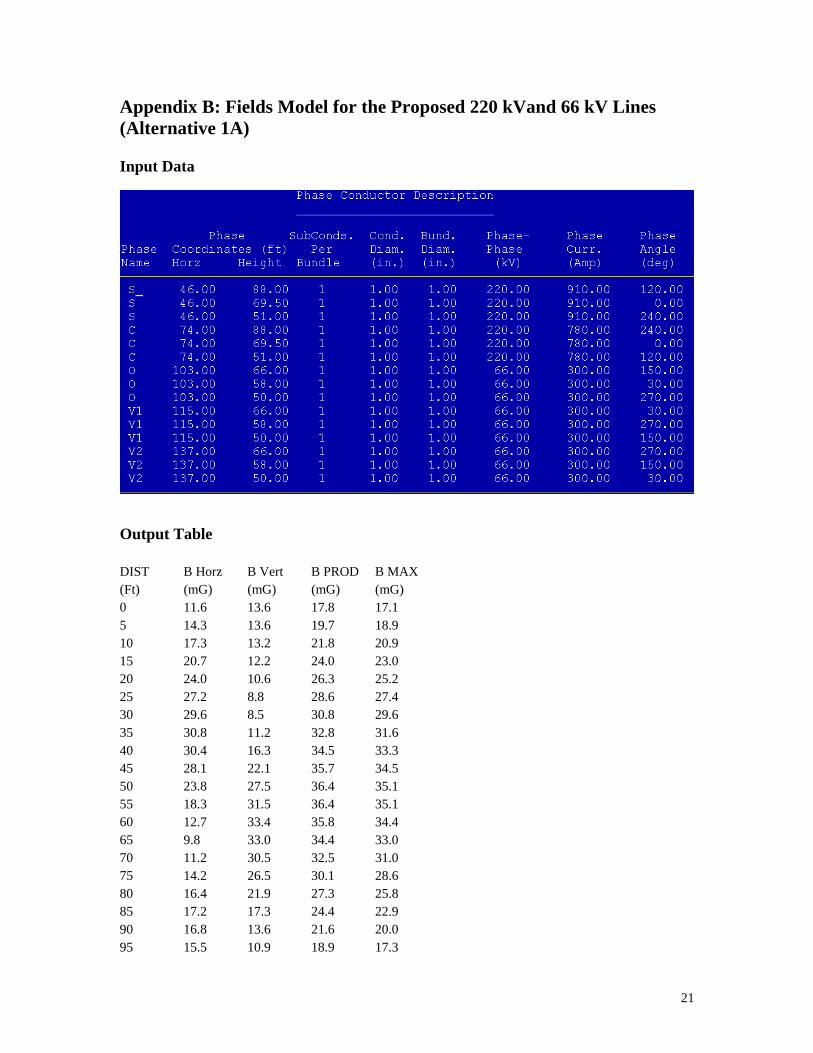
Appendix B: Fields Model for the Proposed 220 kVand 66 kV Lines (Alternative 1A) Input Data
Output Table DIST B Horz B Vert B PROD B MAX (Ft) (mG) (mG) (mG) (mG) 0 11.6 13.6 17.8 17.1 5 14.3 13.6 19.7 18.9 10 17.3 13.2 21.8 20.9 15 20.7 12.2 24.0 23.0 20 24.0 10.6 26.3 25.2 25 27.2 8.8 28.6 27.4 30 29.6 8.5 30.8 29.6 35 30.8 11.2 32.8 31.6 40 30.4 16.3 34.5 33.3 45 28.1 22.1 35.7 34.5 50 23.8 27.5 36.4 35.1 55 18.3 31.5 36.4 35.1 60 12.7 33.4 35.8 34.4 65 9.8 33.0 34.4 33.0 70 11.2 30.5 32.5 31.0 75 14.2 26.5 30.1 28.6 80 16.4 21.9 27.3 25.8 85 17.2 17.3 24.4 22.9 90 16.8 13.6 21.6 20.0 95 15.5 10.9 18.9 17.3

22
100 14.0 9.2 16.7 15.1 105 12.6 8.3 15.1 13.4 110 11.6 8.0 14.0 12.3 115 11.0 7.8 13.5 11.7 120 10.8 7.5 13.2 11.6 125 11.0 7.1 13.1 11.6 130 11.2 6.3 12.9 11.6 135 11.3 5.4 12.5 11.5 140 11.2 4.6 12.1 11.2 145 10.7 4.2 11.4 10.7 150 9.8 4.2 10.7 10.1 155 8.7 4.6 9.9 9.4 160 7.5 4.9 9.0 8.6 165 6.3 5.1 8.1 7.8 170 5.2 5.1 7.3 7.0 175 4.2 5.0 6.5 6.3 180 3.3 4.8 5.8 5.6 185 2.6 4.5 5.2 5.0 190 2.1 4.1 4.6 4.5 195 1.6 3.8 4.1 4.0 200 1.3 3.4 3.7 3.5 Note: Edges of the Right-of-Way are located at Distance “0 ft” and “200 ft.”

23
Appendix C: 2D Modeling for Alternative 1B
Overhead Construction Input Data
Note: 70 feet wood pole (10 feet into ground) with 5 feet sagging is for this model. Taller pole would reduce magnetic fields more. 300 Amps is used for loading. Forecasted loading is about 540 Amps. Maximum Magnetic Fields
TO 325 or similar pole head configuration would be used for Alternative 1B.
0
2
4
6
8
10
-100 -80
-60
-40
-20 0 20 40 60 80 100
Distance (unit: ft)
Bmax
(uni
t: m
G)

24

25
Appendix D: 2D Modeling of Alternative 1B & 1C
Underground Construction Input Data
Note: 300 Amps (i.e. 150 Amps for split-phase) is used for loading. Forecasted loading is about 540 Amps. Maximum Magnetic Fields Typical 66 kV Underground Duct Configuration
0
1
2
3
-100 -80
-60
-40
-20 0 20 40 60 80 100
Distance (unit: ft)
Bm
ax (u
nit:
mG
)

26

27
Appendix E: 3D Modeling of Viejo Substation
Figure 5: View of Getaway Conductors & Substation Property Lines
Substation Property Line
220 kV
66 kV R-O-W
Definition Street
Substation Property Line
220 kV
66 kV R-O-W
Definition Street
28
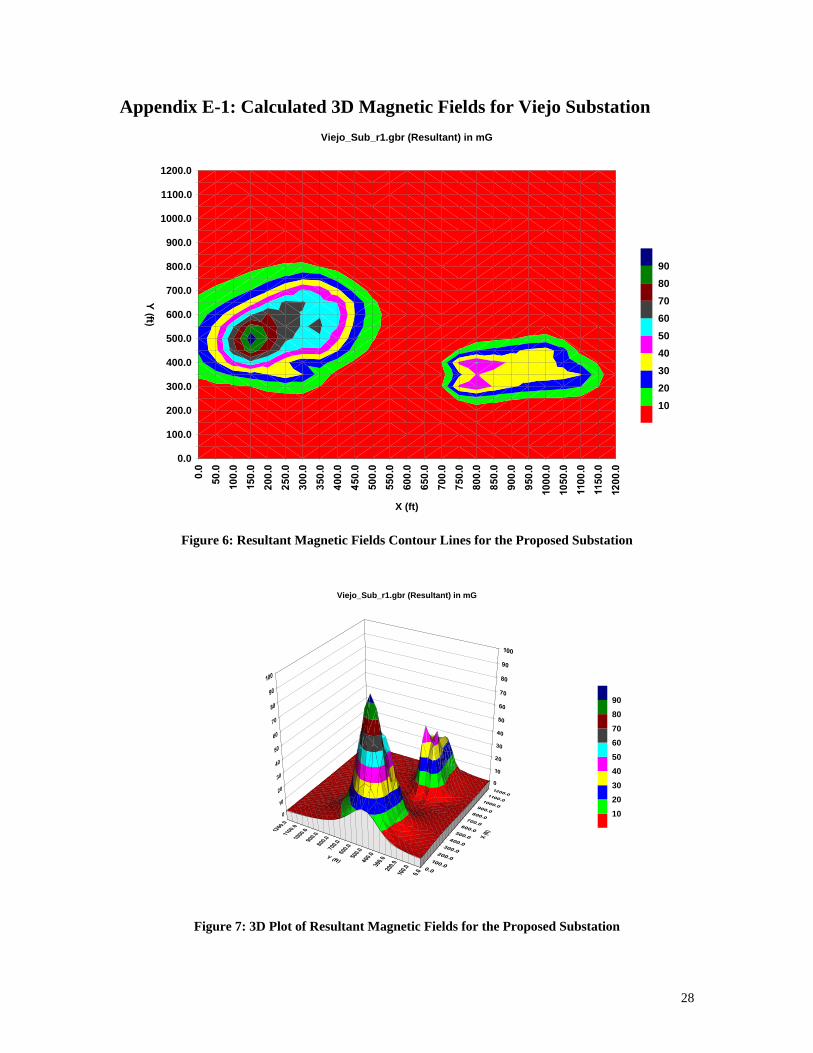
Appendix E-1: Calculated 3D Magnetic Fields for Viejo Substation
X (ft)
1200.0
1100.0
1000.0
900.0
800.0
700.0
600.0
500.0
400.0
300.0
200.0
100.0
0.0
102030405060708090
Viejo_Sub_r1.gbr (Resultant) in mG
Figure 6: Resultant Magnetic Fields Contour Lines for the Proposed Substation
102030405060708090
Viejo_Sub_r1.gbr (Resultant) in mG
Figure 7: 3D Plot of Resultant Magnetic Fields for the Proposed Substation
29
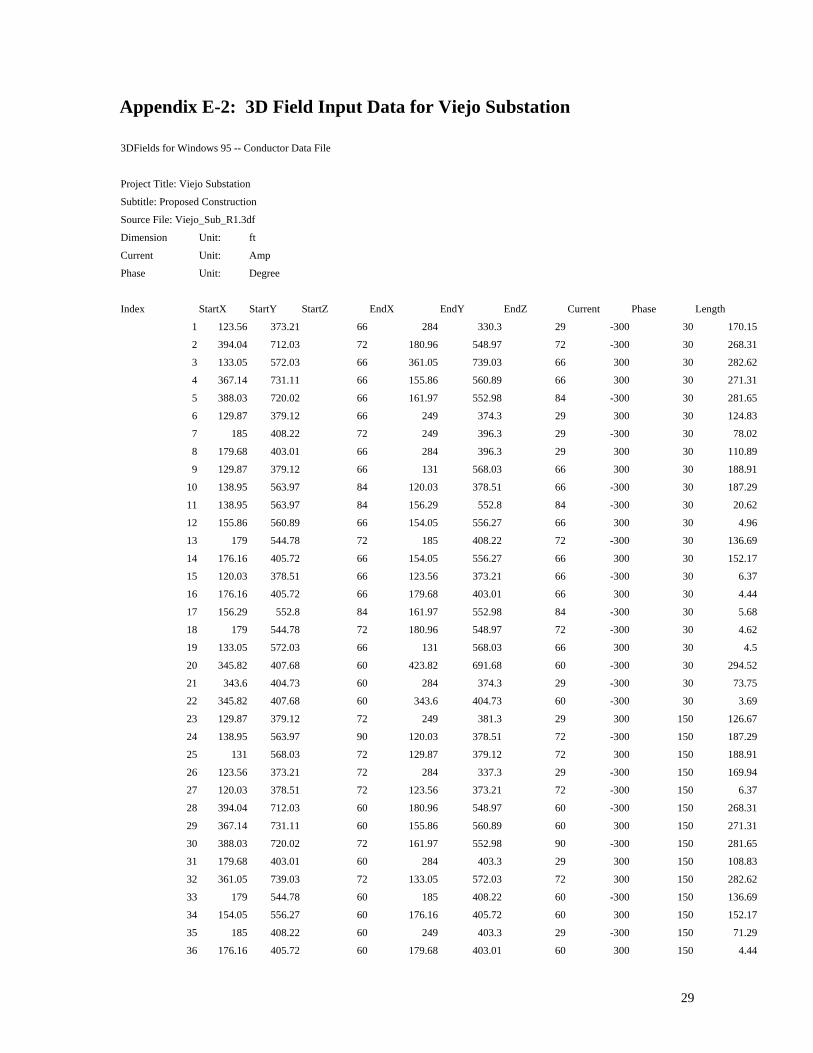
Appendix E-2: 3D Field Input Data for Viejo Substation 3DFields for Windows 95 -- Conductor Data File
Project Title: Viejo Substation
Subtitle: Proposed Construction
Source File: Viejo_Sub_R1.3df
Dimension Unit: ft
Current Unit: Amp
Phase Unit: Degree
Index StartX StartY StartZ EndX EndY EndZ Current Phase Length
1 123.56 373.21 66 284 330.3 29 -300 30 170.15
2 394.04 712.03 72 180.96 548.97 72 -300 30 268.31
3 133.05 572.03 66 361.05 739.03 66 300 30 282.62
4 367.14 731.11 66 155.86 560.89 66 300 30 271.31
5 388.03 720.02 66 161.97 552.98 84 -300 30 281.65
6 129.87 379.12 66 249 374.3 29 300 30 124.83
7 185 408.22 72 249 396.3 29 -300 30 78.02
8 179.68 403.01 66 284 396.3 29 300 30 110.89
9 129.87 379.12 66 131 568.03 66 300 30 188.91
10 138.95 563.97 84 120.03 378.51 66 -300 30 187.29
11 138.95 563.97 84 156.29 552.8 84 -300 30 20.62
12 155.86 560.89 66 154.05 556.27 66 300 30 4.96
13 179 544.78 72 185 408.22 72 -300 30 136.69
14 176.16 405.72 66 154.05 556.27 66 300 30 152.17
15 120.03 378.51 66 123.56 373.21 66 -300 30 6.37
16 176.16 405.72 66 179.68 403.01 66 300 30 4.44
17 156.29 552.8 84 161.97 552.98 84 -300 30 5.68
18 179 544.78 72 180.96 548.97 72 -300 30 4.62
19 133.05 572.03 66 131 568.03 66 300 30 4.5
20 345.82 407.68 60 423.82 691.68 60 -300 30 294.52
21 343.6 404.73 60 284 374.3 29 -300 30 73.75
22 345.82 407.68 60 343.6 404.73 60 -300 30 3.69
23 129.87 379.12 72 249 381.3 29 300 150 126.67
24 138.95 563.97 90 120.03 378.51 72 -300 150 187.29
25 131 568.03 72 129.87 379.12 72 300 150 188.91
26 123.56 373.21 72 284 337.3 29 -300 150 169.94
27 120.03 378.51 72 123.56 373.21 72 -300 150 6.37
28 394.04 712.03 60 180.96 548.97 60 -300 150 268.31
29 367.14 731.11 60 155.86 560.89 60 300 150 271.31
30 388.03 720.02 72 161.97 552.98 90 -300 150 281.65
31 179.68 403.01 60 284 403.3 29 300 150 108.83
32 361.05 739.03 72 133.05 572.03 72 300 150 282.62
33 179 544.78 60 185 408.22 60 -300 150 136.69
34 154.05 556.27 60 176.16 405.72 60 300 150 152.17
35 185 408.22 60 249 403.3 29 -300 150 71.29
36 176.16 405.72 60 179.68 403.01 60 300 150 4.44

30
37 156.29 552.8 90 138.95 563.97 90 -300 150 20.62
38 155.86 560.89 60 154.05 556.27 60 300 150 4.96
39 180.96 548.97 60 179 544.78 60 -300 150 4.62
40 161.97 552.98 90 156.29 552.8 90 -300 150 5.68
41 133.05 572.03 72 131 568.03 72 300 150 4.5
42 423.82 691.68 66 345.82 407.68 66 -300 150 294.52
43 345.82 407.68 66 343.6 404.73 66 -300 150 3.69
44 343.6 404.73 66 284 381.3 66 -300 150 64.04
45 129.87 379.12 60 249 388.3 29 300 270 123.44
46 138.95 563.97 78 120.03 378.51 60 -300 270 187.29
47 131 568.03 60 129.87 379.12 60 300 270 188.91
48 123.56 373.21 60 284 344.3 29 -300 270 165.94
49 120.03 378.51 60 123.56 373.21 60 -300 270 6.37
50 394.04 712.03 66 180.96 548.97 66 -300 270 268.31
51 367.14 731.11 72 155.86 560.89 72 300 270 271.31
52 388.03 720.02 60 161.97 552.98 78 -300 270 281.65
53 179.68 403.01 72 284 410.3 29 300 270 113.07
54 361.05 739.03 60 133.05 572.03 60 300 270 282.62
55 179 544.78 66 185 408.22 66 -300 270 136.69
56 154.05 556.27 72 176.16 405.72 72 300 270 152.17
57 185 408.22 66 249 410.3 29 -300 270 73.96
58 176.16 405.72 72 179.68 403.01 72 300 270 4.44
59 156.29 552.8 78 138.95 563.97 78 -300 270 20.62
60 155.86 560.89 72 154.05 556.27 72 300 270 4.96
61 180.96 548.97 66 179 544.78 66 -300 270 4.62
62 161.97 552.98 78 156.29 552.8 78 -300 270 5.68
63 133.05 572.03 60 131 568.03 60 300 270 4.5
64 423.82 691.68 72 345.82 407.68 72 -300 270 294.52
65 345.82 407.68 72 343.6 404.73 72 -300 270 3.69
66 343.6 404.73 72 284 388.3 29 -300 270 75.31
67 1058 450 73.5 744 385.4 39 -780 0 322.43
68 1058 450 55 744 397.2 39 -780 120 318.81
69 1058 450 92 744 409 39 -780 240 321.07
70 1146 343 78.5 744 289.4 39 780 0 407.48
71 1146 343 60 744 301.2 39 780 120 404.71
72 1146 343 97 744 313 39 780 240 407.27
73 0 0 0 928 0 0 0 0 928
74 928 0 0 928 515 0 0 0 515
75 928 515 0 0 515 0 0 0 928
76 0 515 0 0 0 0 0 0 515

31
Appendix F: Drawing for Viejo Project
• Substation Plot Plan • Area Map