february2018 phoenix metro - zillowstatic · zillow r is the leading real estate and rental...
TRANSCRIPT
www.zillow.com/research/
APRIL2018 Phoenix Metro
National Home Values
Current: $215,600Monthly Change: 0.8%Quarterly Change: 2.7%Annual Change: 8.7%Negative Equity*: 9.1%
Phoenix Home Values
Current: $253,100Monthly Change: 0.7%Quarterly Change: 2.1%Annual Change: 8.6%Negative Equity*: 8.7%
Home Values Forecast
(next 12 months)
National: 4.3%Phoenix Metro: 4.2%
Major Cities - Home Values
PhoenixCurrent: $229,000Monthly Change: 0.7%Annual Change: 10.1%
MesaCurrent: $236,000Monthly Change: 0.7%Annual Change: 8.3%
ChandlerCurrent: $296,400Monthly Change: 0.6%Annual Change: 6.4%
GlendaleCurrent: $220,500Monthly Change: 0.6%Annual Change: 9.1%
GilbertCurrent: $314,900Monthly Change: 0.5%Annual Change: 7.1%
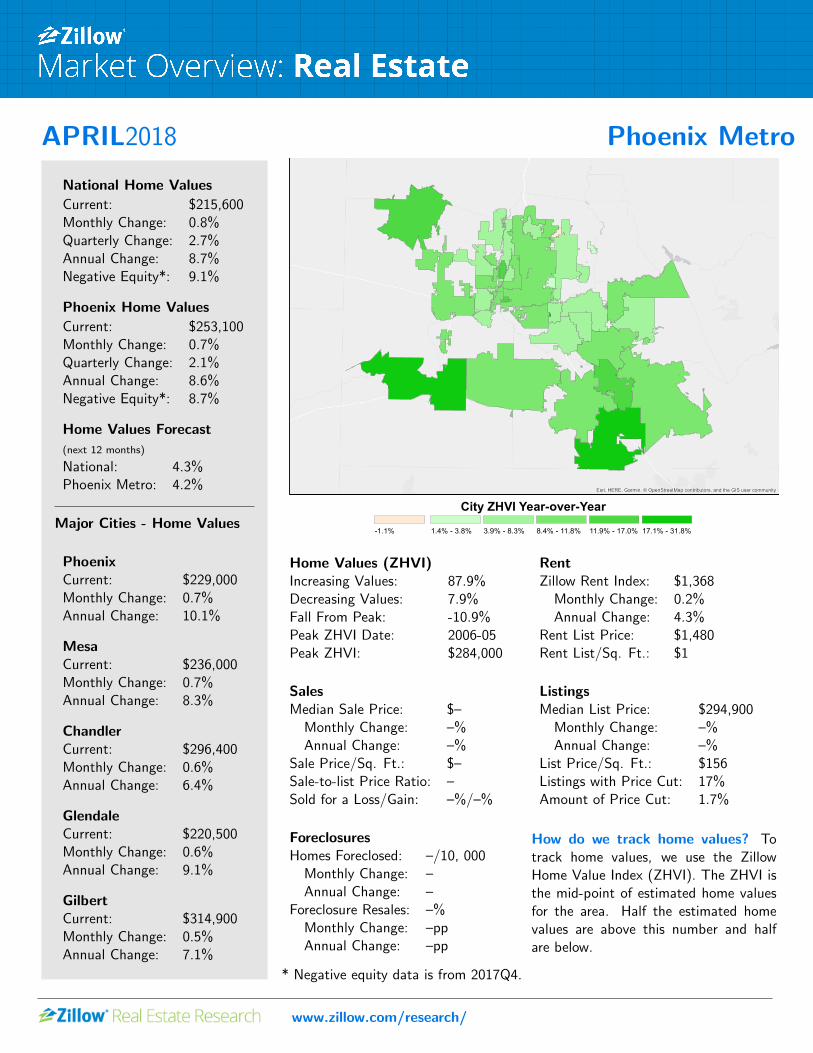
Esri, HERE, Garmin, © OpenStreetMap contributors, and the GIS user community
City ZHVI Year-over-Year-1.1% 1.4% - 3.8% 3.9% - 8.3% 8.4% - 11.8% 11.9% - 17.0% 17.1% - 31.8%
Home Values (ZHVI)Increasing Values: 87.9%Decreasing Values: 7.9%Fall From Peak: -10.9%Peak ZHVI Date: 2006-05Peak ZHVI: $284,000
RentZillow Rent Index: $1,368Monthly Change: 0.2%Annual Change: 4.3%
Rent List Price: $1,480Rent List/Sq. Ft.: $1
SalesMedian Sale Price: $–Monthly Change: –%Annual Change: –%
Sale Price/Sq. Ft.: $–Sale-to-list Price Ratio: –Sold for a Loss/Gain: –%/–%
ListingsMedian List Price: $294,900Monthly Change: –%Annual Change: –%
List Price/Sq. Ft.: $156Listings with Price Cut: 17%Amount of Price Cut: 1.7%
ForeclosuresHomes Foreclosed: –/10, 000Monthly Change: –Annual Change: –
Foreclosure Resales: –%Monthly Change: –ppAnnual Change: –pp
How do we track home values? Totrack home values, we use the ZillowHome Value Index (ZHVI). The ZHVI isthe mid-point of estimated home valuesfor the area. Half the estimated homevalues are above this number and halfare below.
* Negative equity data is from 2017Q4.
APRIL2018
*The top 20 largest cities and top 10 (or all) counties within the metro are listed. Additional counties, cities, neighborhoods and ZIP codes may be
available online at www.zillow.com/research/data by emailing [email protected]
Zillow Research:Zillow R© is the leading real estate and rental marketplace dedicated to empowering consumers with data, inspiration and knowledge around the placethey call home, and connecting them with the best local professionals who can help. In addition, Zillow operates an industry-leading economics andanalytics bureau led by Zillow’s Chief Economist Dr. Svenja Gudell. Dr. Gudell and her team of economists and data analysts produce extensive housingdata and research covering more than 450 markets at Zillow Real Estate Research. Zillow also sponsors the quarterly Zillow Home Price ExpectationsSurvey, which asks more than 100 leading economists, real estate experts and investment and market strategists to predict the path of the Zillow HomeValue Index over the next five years. Zillow also sponsors the bi-annual Zillow Housing Confidence Index (ZHCI) which measures consumer confidence inlocal housing markets, both currently and over time. Launched in 2006, Zillow is owned and operated by Zillow Group (NASDAQ: Z), andheadquartered in Seattle.
www.zillow.com/research/
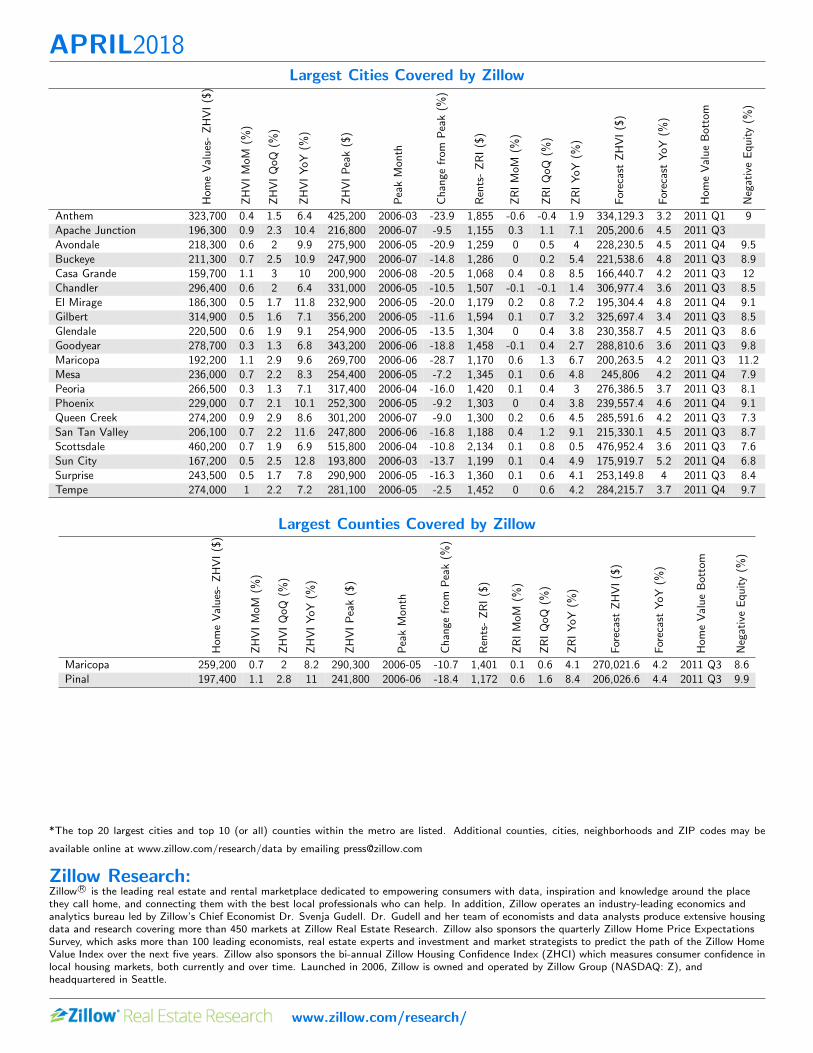
Largest Cities Covered by Zillow
Hom
eValues-ZHVI($)
ZHVIMoM
(%)
ZHVIQoQ
(%)
ZHVIYoY
(%)
ZHVIPeak($)
PeakMon
th
Change
from
Peak(%
)
Rents-ZRI($)
ZRIMoM
(%)
ZRIQoQ
(%)
ZRIYoY
(%)
ForecastZHVI($)
ForecastYoY
(%)
Hom
eValueBottom
NegativeEquity(%
)
Anthem 323,700 0.4 1.5 6.4 425,200 2006-03 -23.9 1,855 -0.6 -0.4 1.9 334,129.3 3.2 2011 Q1 9Apache Junction 196,300 0.9 2.3 10.4 216,800 2006-07 -9.5 1,155 0.3 1.1 7.1 205,200.6 4.5 2011 Q3Avondale 218,300 0.6 2 9.9 275,900 2006-05 -20.9 1,259 0 0.5 4 228,230.5 4.5 2011 Q4 9.5Buckeye 211,300 0.7 2.5 10.9 247,900 2006-07 -14.8 1,286 0 0.2 5.4 221,538.6 4.8 2011 Q3 8.9Casa Grande 159,700 1.1 3 10 200,900 2006-08 -20.5 1,068 0.4 0.8 8.5 166,440.7 4.2 2011 Q3 12Chandler 296,400 0.6 2 6.4 331,000 2006-05 -10.5 1,507 -0.1 -0.1 1.4 306,977.4 3.6 2011 Q3 8.5El Mirage 186,300 0.5 1.7 11.8 232,900 2006-05 -20.0 1,179 0.2 0.8 7.2 195,304.4 4.8 2011 Q4 9.1Gilbert 314,900 0.5 1.6 7.1 356,200 2006-05 -11.6 1,594 0.1 0.7 3.2 325,697.4 3.4 2011 Q3 8.5Glendale 220,500 0.6 1.9 9.1 254,900 2006-05 -13.5 1,304 0 0.4 3.8 230,358.7 4.5 2011 Q3 8.6Goodyear 278,700 0.3 1.3 6.8 343,200 2006-06 -18.8 1,458 -0.1 0.4 2.7 288,810.6 3.6 2011 Q3 9.8Maricopa 192,200 1.1 2.9 9.6 269,700 2006-06 -28.7 1,170 0.6 1.3 6.7 200,263.5 4.2 2011 Q3 11.2Mesa 236,000 0.7 2.2 8.3 254,400 2006-05 -7.2 1,345 0.1 0.6 4.8 245,806 4.2 2011 Q4 7.9Peoria 266,500 0.3 1.3 7.1 317,400 2006-04 -16.0 1,420 0.1 0.4 3 276,386.5 3.7 2011 Q3 8.1Phoenix 229,000 0.7 2.1 10.1 252,300 2006-05 -9.2 1,303 0 0.4 3.8 239,557.4 4.6 2011 Q4 9.1Queen Creek 274,200 0.9 2.9 8.6 301,200 2006-07 -9.0 1,300 0.2 0.6 4.5 285,591.6 4.2 2011 Q3 7.3San Tan Valley 206,100 0.7 2.2 11.6 247,800 2006-06 -16.8 1,188 0.4 1.2 9.1 215,330.1 4.5 2011 Q3 8.7Scottsdale 460,200 0.7 1.9 6.9 515,800 2006-04 -10.8 2,134 0.1 0.8 0.5 476,952.4 3.6 2011 Q3 7.6Sun City 167,200 0.5 2.5 12.8 193,800 2006-03 -13.7 1,199 0.1 0.4 4.9 175,919.7 5.2 2011 Q4 6.8Surprise 243,500 0.5 1.7 7.8 290,900 2006-05 -16.3 1,360 0.1 0.6 4.1 253,149.8 4 2011 Q3 8.4Tempe 274,000 1 2.2 7.2 281,100 2006-05 -2.5 1,452 0 0.6 4.2 284,215.7 3.7 2011 Q4 9.7
Largest Counties Covered by Zillow
Hom
eValues-ZHVI($)
ZHVIMoM
(%)
ZHVIQoQ
(%)
ZHVIYoY
(%)
ZHVIPeak($)
PeakMon
th
Change
from
Peak(%
)
Rents-ZRI($)
ZRIMoM
(%)
ZRIQoQ
(%)
ZRIYoY
(%)
ForecastZHVI($)
ForecastYoY
(%)
Hom
eValueBottom
NegativeEquity(%
)
Maricopa 259,200 0.7 2 8.2 290,300 2006-05 -10.7 1,401 0.1 0.6 4.1 270,021.6 4.2 2011 Q3 8.6Pinal 197,400 1.1 2.8 11 241,800 2006-06 -18.4 1,172 0.6 1.6 8.4 206,026.6 4.4 2011 Q3 9.9