february2018 denver metro - zillowstatic r is the leading real estate and rental marketplace...
TRANSCRIPT
www.zillow.com/research/
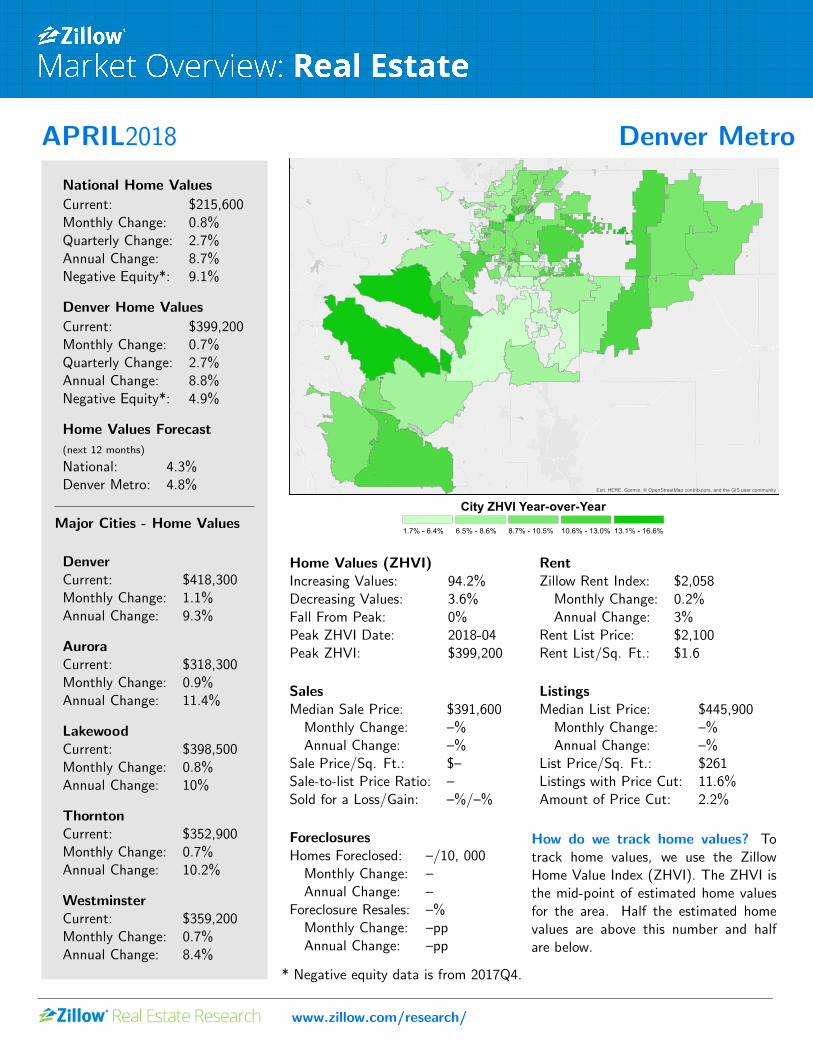
APRIL2018 Denver Metro
National Home Values
Current: $215,600Monthly Change: 0.8%Quarterly Change: 2.7%Annual Change: 8.7%Negative Equity*: 9.1%
Denver Home Values
Current: $399,200Monthly Change: 0.7%Quarterly Change: 2.7%Annual Change: 8.8%Negative Equity*: 4.9%
Home Values Forecast
(next 12 months)
National: 4.3%Denver Metro: 4.8%
Major Cities - Home Values
DenverCurrent: $418,300Monthly Change: 1.1%Annual Change: 9.3%
AuroraCurrent: $318,300Monthly Change: 0.9%Annual Change: 11.4%
LakewoodCurrent: $398,500Monthly Change: 0.8%Annual Change: 10%
ThorntonCurrent: $352,900Monthly Change: 0.7%Annual Change: 10.2%
WestminsterCurrent: $359,200Monthly Change: 0.7%Annual Change: 8.4%
Esri, HERE, Garmin, © OpenStreetMap contributors, and the GIS user community
City ZHVI Year-over-Year1.7% - 6.4% 6.5% - 8.6% 8.7% - 10.5% 10.6% - 13.0% 13.1% - 16.6%
Home Values (ZHVI)Increasing Values: 94.2%Decreasing Values: 3.6%Fall From Peak: 0%Peak ZHVI Date: 2018-04Peak ZHVI: $399,200
RentZillow Rent Index: $2,058
Monthly Change: 0.2%Annual Change: 3%
Rent List Price: $2,100Rent List/Sq. Ft.: $1.6
SalesMedian Sale Price: $391,600
Monthly Change: –%Annual Change: –%
Sale Price/Sq. Ft.: $–Sale-to-list Price Ratio: –Sold for a Loss/Gain: –%/–%
ListingsMedian List Price: $445,900
Monthly Change: –%Annual Change: –%
List Price/Sq. Ft.: $261Listings with Price Cut: 11.6%Amount of Price Cut: 2.2%
ForeclosuresHomes Foreclosed: –/10, 000
Monthly Change: –Annual Change: –
Foreclosure Resales: –%Monthly Change: –ppAnnual Change: –pp
How do we track home values? Totrack home values, we use the ZillowHome Value Index (ZHVI). The ZHVI isthe mid-point of estimated home valuesfor the area. Half the estimated homevalues are above this number and halfare below.
* Negative equity data is from 2017Q4.

APRIL2018
*The top 20 largest cities and top 10 (or all) counties within the metro are listed. Additional counties, cities, neighborhoods and ZIP codes may be
available online at www.zillow.com/research/data by emailing [email protected]
Zillow Research:Zillow R© is the leading real estate and rental marketplace dedicated to empowering consumers with data, inspiration and knowledge around the placethey call home, and connecting them with the best local professionals who can help. In addition, Zillow operates an industry-leading economics andanalytics bureau led by Zillow’s Chief Economist Dr. Svenja Gudell. Dr. Gudell and her team of economists and data analysts produce extensive housingdata and research covering more than 450 markets at Zillow Real Estate Research. Zillow also sponsors the quarterly Zillow Home Price ExpectationsSurvey, which asks more than 100 leading economists, real estate experts and investment and market strategists to predict the path of the Zillow HomeValue Index over the next five years. Zillow also sponsors the bi-annual Zillow Housing Confidence Index (ZHCI) which measures consumer confidence inlocal housing markets, both currently and over time. Launched in 2006, Zillow is owned and operated by Zillow Group (NASDAQ: Z), andheadquartered in Seattle.
www.zillow.com/research/
Largest Cities Covered by Zillow
Hom
eV
alu
es-
ZH
VI
($)
ZH
VI
MoM
(%)
ZH
VI
QoQ
(%)
ZH
VI
YoY
(%)
ZH
VI
Pea
k($
)
Pea
kM
onth
Ch
ange
from
Pea
k(%
)
Ren
ts-
ZR
I($
)
ZR
IM
oM(%
)
ZR
IQ
oQ(%
)
ZR
IY
oY(%
)
For
ecas
tZ
HV
I($
)
For
ecas
tY
oY(%
)
Hom
eV
alu
eB
otto
m
Neg
ativ
eE
qu
ity
(%)
Arvada 406,600 0.7 2.9 8 406,600 2018-04 0.0 2,038 0.4 1.4 3.2 425,787.8 4.7 2011 Q3 3.5Aurora 318,300 0.9 2.9 11.4 318,300 2018-04 0.0 1,843 0.5 1.3 3.8 336,358.1 5.7 2011 Q4 5Brighton 339,200 0.5 1.9 9.8 339,200 2018-04 0.0 1,908 0.5 2.1 4.7 356,159 5 2011 Q1 4.5Broomfield 424,000 0.2 1.3 7.6 424,000 2018-04 0.0 2,155 0 0.4 2.1 442,601 4.4 2011 Q3 3.8Castle Rock 466,600 0 0.8 6.2 466,600 2018-04 0.0 2,448 0.5 1.3 2.8 484,197.4 3.8 2011 Q4 5.7Centennial 449,800 0.5 2.1 6.6 449,800 2018-04 0.0 2,290 -0.6 -0.8 2.8 468,273.8 4.1 2011 Q2 3.8Columbine 423,700 0.8 2.9 6 423,700 2018-04 0.0 2,164 0.5 1.7 5.4 440,293.3 3.9 2011 Q3Commerce City 345,300 0.6 2.2 9.1 345,300 2018-04 0.0 1,903 0 -0.3 3 361,614.9 4.7 2011 Q4 5.6Denver 418,300 1.1 3.4 9.3 418,300 2018-04 0.0 2,070 0.4 1.5 4.8 439,525.3 5.1 2011 Q3 6Englewood 368,900 0.8 2.9 11 368,900 2018-04 0.0 1,902 0.9 2.9 1.8 389,801.4 5.7 2011 Q4 4.2Evergreen 563,700 1.1 3.6 8.5 563,700 2018-04 0.0 2,459 0.4 0.6 -2.5 589,981.5 4.7 2012 Q1 3.8Highlands Ranch 469,600 0.1 0.7 5.3 469,600 2018-04 0.0 2,424 0.3 0.7 1.1 485,028.3 3.3 2011 Q2 6Ken Caryl 391,700 0.8 3.2 9.4 391,700 2018-04 0.0 2,058 0.2 0.7 5.2 409,938.2 4.7 2011 Q3 3.1Lakewood 398,500 0.8 3 10 398,500 2018-04 0.0 2,002 0.3 0.8 3.2 419,041.9 5.2 2011 Q3 3.9Littleton 432,400 0.5 1.8 8.1 432,400 2018-04 0.0 2,164 0.5 1.6 5.2 453,846.9 5 2011 Q2 3.7Northglenn 319,300 0.7 2.5 10.3 319,300 2018-04 0.0 1,862 0.3 0.8 5.2 336,046.5 5.2 2011 Q4 4.5Parker 469,600 0.2 1.3 7.3 469,600 2018-04 0.0 2,445 0.3 1.3 2 488,153.9 4 2011 Q4 5.5Thornton 352,900 0.7 2.6 10.2 352,900 2018-04 0.0 1,944 0.1 0.5 3.7 370,541 5 2011 Q4 5.1Westminster 359,200 0.7 2.7 8.4 359,200 2018-04 0.0 1,931 0.3 0.2 1.9 375,991.4 4.7 2011 Q4 4.2Wheat Ridge 420,700 0.5 2.5 11.8 420,700 2018-04 0.0 1,905 -0.4 -1.2 -1.2 444,535.9 5.7 2011 Q3 3.6
Largest Counties Covered by Zillow
Hom
eV
alu
es-
ZH
VI
($)
ZH
VI
MoM
(%)
ZH
VI
QoQ
(%)
ZH
VI
YoY
(%)
ZH
VI
Pea
k($
)
Pea
kM
onth
Ch
ange
from
Pea
k(%
)
Ren
ts-
ZR
I($
)
ZR
IM
oM(%
)
ZR
IQ
oQ(%
)
ZR
IY
oY(%
)
For
ecas
tZ
HV
I($
)
For
ecas
tY
oY(%
)
Hom
eV
alu
eB
otto
m
Neg
ativ
eE
qu
ity
(%)
Adams 328,900 0.8 2.6 10.6 328,900 2018-04 0 1,873 0.4 1.2 4.3 346,643.7 5.4 2011 Q4 5.0Arapahoe 370,700 0.5 2.3 9.2 370,700 2018-04 0 2,010 0.6 1.6 3.7 389,368.4 5 2011 Q4 4.7Broomfield 423,200 0.1 1.1 7.4 423,200 2018-04 0 2,155 0 0.4 2.1 441,621.9 4.4 2011 Q3 4.2Clear Creek 328,900 1.3 3.5 6.1 328,900 2018-04 0 1,757 -0.7 -1.7 0.8 343,303.8 4.4 2012 Q2 6.2Denver 417,300 1.1 3.5 9.4 417,300 2018-04 0 2,069 0.4 1.6 4.9 438,282.3 5 2011 Q3 6.1Douglas 477,400 0.2 1.2 6.8 477,400 2018-04 0 2,451 0.3 0.7 1.4 495,188.6 3.7 2011 Q4 5.9Elbert 481,300 0.1 0.8 9.1 481,300 2018-04 0 2,666 -0.4 -1.8 0.2 502,787.2 4.5 2011 Q4 3.3Gilpin 1,735 -0.6 -1.2 -0.2 7.1Jefferson 418,200 0.7 3 8.7 418,200 2018-04 0 2,057 0 0.4 2 437,937.7 4.7 2011 Q3 3.5Park 325,300 0.9 3.1 12.4 325,300 2018-04 0 1,637 0.6 1.7 7.8 344,301.3 5.8 2011 Q4 4.8