february 20210 - minorityaffairs.gov.in
TRANSCRIPT


0February 2021Report 2021/UCSS10/4
Volume 4: Ministry of Minority Affairs
Evaluation of Centrally Sponsored Schemes inSocial Inclusion, Law and Order and Justice Delivery

Copyright ©2021 Development Monitoring and Evaluation Office (DMEO), NITI Aayog, Government of India
All rights reserved. This report or any portion thereof may not be reproduced or used in any manner whatsoever without the express written permission of DMEO, NITI Aayog, Government of India.
All information, ideas, views, opinions, estimates, advice, suggestions, recommendations (hereinafter 'content') in this publication should neither be understood as professional advice in any manner nor interpreted as policies, objectives, opinions or suggestions of the Development Monitoring and Evaluation Office (DMEO), NITI Aayog. Readers are advised to use their discretion and seek professional advice before taking any action or decision, based on the contents of this publication. The content in this publication has been obtained or derived from sources believed by DMEO to be reliable but DMEO does not represent this information to be accurate or complete. DMEO does not assume any responsibility and disclaim any liability for any loss, damages, caused due to any reason whatsoever, towards any person (natural or legal) who uses this publication.
Analysis by KPMG Advisory Services Pvt. Ltd.Survey Partner: Hansa Research Pvt. Ltd.
www.dmeo.gov.inwww.niti.gov.in

Evaluation of Centrally Sponsored Schemes inSocial Inclusion, Law and Order and Justice Delivery
Volume 4: Ministry of Minority Affairs


Dr. Rajiv Kumar Vice Chairman National Institution for Transforming India Government of India New Delhi, India
MESSAGE
Constitutional guarantee of equality, and the government system has been working for years to increase investment in human capital to realize equality of opportunity and equity of life outcomes for historically marginalized segments of society. These include the Scheduled Castes (SC), Scheduled Tribes (ST) and Other Backward Classes (OBC). Further, there are other socially vulnerable groups such as religious minorities, socio-economically backward classes, people with disabilities, children whose parents are engaged in unclean occupations, transgender community, etc. who face gross inequalities in the availability of opportunities and access to basic services, including healthcare, education and livelihood.
Though there has been a significant decrease in multidimensional poverty over the past decade for these traditionally disadvantaged groups, they continue to remain amongst the poorest strata of the society and lack due representation. Social inclusion is integral to the vision for New India and is a core theme of the Government of India’s development agenda. The Government’s commitment to social inclusion is reflected in various policy documents such as Strategy for New India @75, India Three Years Action Agenda, and the National Development Agenda (2017-2032) etc., along with overarching objectives defined in the Sustainable Development Goals.
With the larger vision of building and sustaining a new India, innovative use of technology must become sine qua non for targeted interventions, with a particular focus on ensuring the benefits of India’s demographic dividend do not leave out the marginalized and vulnerable, particularly persons belonging to SC, ST, Minorities etc. The Government has taken a large number of concerted efforts to reach out to the vulnerable groups, especially through the Centrally Sponsored Schemes (CSS). These schemes aim to address a gamut of issues faced by the most vulnerable communities and, therefore, promote social equity, inclusive development, and equitable justice delivery. The schemes range from scholarship schemes for SCs, STs and OBCs to area and infrastructure development in vulnerable areas.
This report is an important accomplishment in capturing the performance of 31 Centrally Sponsored Schemes across five Ministries. These include schemes for Development of Scheduled Castes and Development of Other Vulnerable Groups (Ministry of Social Justice & Empowerment); Development of Scheduled Tribes (Ministry of Tribal Affairs); Development of Minorities (Ministry of Minority

Affairs); Modernization of Police Force and Border Area Development Programme (Ministry of Home Affairs) and Infrastructure Facilities for Judiciary (Ministry of Law and Justice).
This evaluation study provides a sectoral perspective of social inclusion in India and has identified key issues and gaps pertaining to identified socially excluded groups and strengthening of institutional machineries for security and justice delivery for all. The intent of the evaluation is to capture the broader canvas of effectiveness, efficiency, impact, and scope for value additions to bring innovation and sustainability across these schemes, thereby assessing the overall sectoral impact on the national economy. I hope all the stakeholders find the evaluation report helpful, among others, to unlock the growth potential of the sector while integrating different programmes and holistically approaching the sector’s development agenda.
FEBRUARY 2021 NEW DELHI INDIA
Dr. Rajiv Kumar


Amitabh Kant Chief Executive Officer National Institution for Transforming India Government of India New Delhi, India
MESSAGE
NITI Aayog’s mandate is to facilitate developmental transformation in India, and through the Development Monitoring and Evaluation Office (DMEO) we are working towards institutionalizing outcomes monitoring and accountability. While evaluations have been carried out in India since 1950s, this evaluation study has been unique in both its scope and its methods. For the first time, all the Centrally Sponsored Schemes (CSS) have been covered and evaluated both from sector perspective (top down) and scheme perspective (bottom up). Simultaneously conducting multiple large-scale studies across sectors has also allowed for rich cross learning experience, standardization and adoption of leading evaluation methodologies and quality processes. This is an evidence generation and implementation research that is forward looking and cutting-edge.
Evidence generation, however, is not enough - uptake must be ensured too. The study provides evidence backed recommendations to improve Government service delivery, at sector level, umbrella scheme and the scheme level for five Ministries – Social Justice and Empowerment, Tribal Affairs, Minority Affairs, Law and Justice, and Home Affairs. The findings from this study must now be used to drive reform and future policy initiatives across the Ministries and Departments within its remit.
In the larger context of the XVth Finance Commission and devolution of funds from the Centre towards the States, these evaluation studies would also play an important role in advancing cooperative federalism. This study examines heterogeneous implementation of Centrally Sponsored Schemes and identifies sub-national best practices amenable to scaling up at national level, facilitating learning among States and with the Centre.
Finally, to make hard evidence the basis of policy decision-making in the country, concerted effort at all levels of the governments—central, state, local governments— is required to shift from measuring physical and financial progress, to measuring and taking decisions based on outcomes and impacts. This study is a step in that direction, and there remains a long, promising path ahead.
FEBRUARY 2021 NEW DELHI INDIA
Amitabh Kant


PREFACE The Government of India (GoI) spends close to Rs. 10 lakh crore annually on development activities, through nearly 750 schemes implemented by Union Ministries. Of these 750, 128 are Centrally Sponsored Schemes (CSS), implying that they are funded jointly by the Centre and the States, and implemented by the States. Over the years, federalism and the expectations of government service delivery in India have evolved, and this vast proliferation of schemes is in sore need of rationalization. Rationalisation of schemes is expected to improve Centre-State relations, the effectiveness and efficiency of public finance, and the quality of service delivery to citizens.
To this end, all schemes were mandated to undergo third party evaluations, to provide an evidentiary foundation to the 15th Finance Commission for scheme continuation from 2021-22 to 2025-26. The task of conducting these CSS evaluations was granted to NITI Aayog, specifically to Development Monitoring and Evaluation Office (DMEO). This volume is thus a part of a historic exercise undertaken between April 2019 and August 2020, to evaluate 128 CSS, under 28 Umbrella CSS, under 10 Packages or Sectors. The studies together cover close to 30% of the GoI’s development expenditure, amounting to approximately Rs. 3 lakh crore (USD 43 billion) per annum.
In order to fulfill this mandate to the highest standard possible, to optimize both the robustness and the uptake of the evidence generated, DMEO adopted a nationally representative mixed-methods evaluation methodology and a consultative review process for the reports. Altogether, the project incorporates the direct input of approximately 33,000 individuals, through 17,500 household interviews, 7,100 key informant interviews, and 1,400 focus group discussions. The views of Central, State, district, block, ward, and village administrations, as well as non-governmental experts and civil society organizations have been elicited. Through qualitative and quantitative analysis of secondary literature, validated by this primary data collection, analysis was done at three levels: the sector, the umbrella CSS, and the scheme itself. The key parameters for analysis, including relevance, effectiveness, efficiency, sustainability, impact, and equity (REESIE), have been selected based on international best practices in evaluation. In addition, across 10 packages, certain cross-cutting themes have been identified for analysis, including transparency, sustainability, gender, technology, private sector, etc. The reports thus produced then underwent a consultative review process involving NITI Aayog subject matter divisions, concerned Ministries and Departments, and external experts. The entire project was implemented through 10 consultant firm teams selected from the private sector through an open tender process, managed by a small but fiercely dedicated team at DMEO.
Over the course of this project, hundreds of people across the country have pushed themselves through festivals, monsoon rains, cyclones, and a global pandemic, COVID-19, to present these volumes. DMEO owes a debt of gratitude to each and every one of these contributors, but especially to all the beneficiaries interviewed, for sharing their precious time and experiences with our teams. Ultimately, this exercise, like all others by the Government of India, is in service of the sovereign citizens of this country.


ACKNOWLEDGEMENTS We would like to express our gratitude to Dr. Rajiv Kumar, Vice-Chairman NITI Aayog, and Shri Amitabh Kant, Chief Executive Officer, who have been the driving force, first in entrusting this important responsibility to the Development Monitoring and Evaluation Office (DMEO) and subsequently as mentors throughout the study, in providing all necessary support and guidance for the completion of the project. We also express our gratitude to the Ministry of Finance for recognizing the crucial need for evidence in the deliberations and decisions pertaining scheme budget allocations.
Our invaluable partner in this exercise has been the Ministry of Minority Affairs with all its officials, without whose cooperation this evaluation would not have been possible. We would especially like to thank Sh. Pramod Kumar Das (Secretary), Ms. Nigar Fatima Husain (Joint Secretary), Mr. Ravi Sunder (Deputy Secretary), and Mr. Shubendu Shekhar Srivastava (Under Secretary) for their unending support throughout the course of the study. We are grateful to them for providing us access to available data, for patiently sharing their expertise through Key Informant Interviews (KIIs), and for providing their vital comments on the draft reports during various stages of the study. A detailed list of the Key Informant Interviews can be found in the annexures to this report.
In the spirit of Centrally Sponsored Schemes in our federal structure, equally important partners in this endeavor have been the State Governments of Assam, Arunachal Pradesh, Bihar, Gujarat, Haryana, Himachal Pradesh, Kerala, Madhya Pradesh, Maharashtra, Mizoram, Odisha, Punjab, Telangana and Uttarakhand, and their Chief Secretaries for providing both ground support and operational independence to our field partners for the primary study. Officials across the State governments have extended their gracious cooperation to the study, for which we are deeply thankful.
Next, we must thank our external expert Dr. R.R. Prasad, NIRD, Hyderabad (Social Justice) for helping refine and rationalize the report through his insightful comments, corrections, and feedback. From the fundamentals of the sector to the latest developments, he helped ensure that the report was as comprehensive, cogent, and technically robust as possible, within the short timeframes available.
M/s KPMG Advisory Services Private Ltd., the consultant firm, has done a remarkable job, particularly given the significant challenges of scale, time, and resources presented by this project. Adding to the constraints, the global pandemic and the COVID-19 lockdown did not stop them from delivering top quality work. Particular appreciation is due to Mr. Amit Dutta (Team Leader) and his team, Mr. Pranav Priyadarshi (Deputy Team Leader), Mr. Trinanjan Chakraborty (Monitoring and Evaluation Expert), Mr. Arvind Garimella (Social Justice Lead), Col. Naresh Jethwani (Internal Security Lead), Justice Balbir Singh (Judicial Expert), Mr. Balwinder Singh (Police Services Expert), Mr. Jignesh Thakkar (Safeguards Specialist), Mr. Rajesh Ranjan (IT Specialist), Mr. Vivek Agarwal (Public Institution Expert), Ms. Zainab Patel (Gender and Social Inclusion Specialist), Ms. Punita Bansal (Statistician), Mr. Brijendra Singh (Finance Specialist), Ms. Akansha Sinha (Climate Change Specialist), Mr. Mohammed Gulrez (Social Sector Specialist), Mr. Ashwin Madhusudanan (Judicial Services Expert), Mr. Kinshuk Pal (Economist), Mr. Devashish Dass (Manager), Ms. Garima Singh

(Associate Director), Mr. Pratap Lata (Senior Consultant), Ms. Aditi Sharma, (Senior Consultant), Ms. Bhavi Gumber (Consultant), Ms. Avnika Nagar (Consultant), Ms. Shweta Singha (Consultant), Ms. Aashi Srivastava (Associate Consultant) and Ms. Rashmi Pandey (Editor) from the KPMG support team and the field partners - Hansa Research Group Pvt. Ltd and Frameworks. They conducted data collection across 14 States of India, involving complex planning and logistics, through monsoons, festive seasons, a cyclone, and a pandemic.
At NITI Aayog, this exercise would not have gotten off the ground without the consistent support of the Procurement Management Committee and Bid Evaluation Committee, particularly Mr. Sonjoy Saha (Adviser, PPP/PAMD), Shri M.C. Jauhari (Adviser, Social Justice & Empowerment vertical), Mr. Rakesh Ranjan (Senior Consultant), Shri Avinash Mishra (Adviser, Law & Justice vertical) and Ms. Sanchita Shukla (Director, Internal Finance Division). Staff at the NITI Aayog Social Justice & Empowerment, particularly Dr. Muniraju (Deputy Adviser) and Mr. S. Venkatesan (Consultant) have also been instrumental in seeing this project to fruition. The Internal Finance Division further merits special mention here for their extensive efforts.
DMEO team has been at the core of the evaluation studies - in this package specifically, Ms. Meghanjalli Routh, Mr. Ankit Choudhary, Mr. Manoj Pankaj, Mr. Vijender Kumar, and Ms. Priyanka Sethi worked on every last detail of this herculean endeavour, under the guidance of Mr. Akhilesh Kumar, Director, and Dr. Shweta Sharma, Consultant-II. Special thanks are extended to Ms. Harkiran Sanjeevi, ex-Deputy Director General who played an important role in completing the study. The team would also like to thank Mr. Jayanta Kumar Patel, Mr. Rajpal Singh, Mr. Saumya Chakravarty, Ms. Ishita Kandra, and Mr. Kapil Saini for their support at various stages of the study. Across packages, Deputy Director General Mr. Ashutosh Jain also oversaw coordination, standardization, and monitoring of the study design, analysis, and implementation processes. They were supported by the Evaluations Core Team: Dr. Shweta Sharma, Mr. Anand Trivedi, Ms. Sanjana Manaktala, Ms. Vatsala Aggarwal, Mr. O.P. Thakur, and Mr. Jayanta Patel. The Primary Data Quality Review team comprising Mr. Venugopal Mothkoor, Mr. Paresh Dhokad, Mr. Krishn Kant Sharma, Ms. Fatima Mumtaz, Ms. Priyanka Dua, Ms. Veenu Singh, Ms. Devika Kannan, and Mr. Asad Fatmi contributed across packages in data quality and analysis. The DMEO administration and accounts officers, including Mr. D. Bandopadhyay, Mr. Munish Singhal, Mr. D.S. Sajwan, Mr. Manoj Kumar, and others provided vital support on documentation, approvals, payments, etc.
In accordance with the massive scope and scale of the exercise, this report owes its successful completion to the dedicated efforts of a wide variety of stakeholders.

i
Table of Contents
List of Abbreviations ............................................................................................................................................................. iii
List of Figures ......................................................................................................................................................................... viii
List of Tables ............................................................................................................................................................................... x
List of Case Studies ................................................................................................................................................................ xi
Overview ..................................................................................................................................................................................... 1
Chapter I. Sector level analysis .................................................................................................................................. 2
1. Background of the sector ........................................................................................................................................ 2
1.1. Background ........................................................................................................................................................ 2
1.2. Framework for sector analysis .................................................................................................................. 2
1.3. Social inclusion and exclusion .................................................................................................................... 5
1.4. Extent of social exclusion ............................................................................................................................. 6
1.5. Extent of social exclusion in India ............................................................................................................ 7
1.6. Minority population in the country ....................................................................................................... 10
2. Performance of the sector .................................................................................................................................... 11
2.1. Historical trends and evolution of social inclusion policies ........................................................ 11
2.1.1. Constitutional provisions for protection of vulnerable groups ....................................... 11
2.1.2. Evolution of social inclusion themes in Five Year Plans ..................................................... 13
2.2. Sector outcomes ............................................................................................................................................. 16
2.2.1. Markets ................................................................................................................................................... 16
2.2.2. Services ................................................................................................................................................... 18
2.2.3. Spaces ...................................................................................................................................................... 27
3. Issues and challenges ............................................................................................................................................. 29
3.1. Gap analysis of sectoral issues ................................................................................................................. 30
3.1.1. Denial of equal access to assets and employment opportunities .................................... 30
3.1.2. Low levels of educational progress and limited opportunities for skill up-gradation (lack of opportunities) ..................................................................................................................................... 30
3.1.3 Poor access to healthcare ................................................................................................................ 31
3.1.4. Low representation in Parliament and State Assemblies (low empowerment) ...... 31
3.2. Intervention gaps at sector level ............................................................................................................. 32

ii
3.2.1 Interventions by nodal Ministry ................................................................................................... 32
3.2.2. Interventions by other Central Ministries, State Governments ...................................... 33
3.2.3. Interventions by donors, multi-lateral/bi-lateral organizations ................................... 33
3.2.4. Interventions by private and public sector (including CSR) ............................................ 34
3.2.5. Interventions by NGO, voluntary organisations, other charitable institutions ........ 36
3.2.6. Institution wise interventions at a glance................................................................................ 37
3.2.7. Remaining gaps in sector-level interventions ........................................................................ 45
3.3. Gap map synthesis of sector and CSS schemes ................................................................................. 46
3.3.1 Diagrammatic representation of gap map synthesis ........................................................... 48
4. Key recommendations ........................................................................................................................................... 50
5. Conclusion .................................................................................................................................................................. 54
Chapter II. Umbrella programme for development of minorities ............................................................... 55
1. Scheme level analysis ............................................................................................................................................. 55
1.1. Pradhan Mantri Jan Vikas Karyakram ................................................................................................... 55
1.1.1. Background of scheme ..................................................................................................................... 55
1.1.2. Performance of scheme .............................................................................................................. 60
1.1.3. Issues and challenges ....................................................................................................................... 96
1.1.4. Key recommendations ..................................................................................................................... 98
1.1.5. Conclusion .......................................................................................................................................... 101
Chapter III. Conclusion ................................................................................................................................................ 102
1.1. Synthesis of scheme .................................................................................................................................. 102
1.2. Summary of scheme rationalization ................................................................................................... 102
Annexure 1: List of Key Informant Interviews and Focus Group Discussions .......................................... 106
Annexure 2: Physical progress under PMJVK ......................................................................................................... 108
Annexure 3: Bibliography ............................................................................................................................................... 109

iii
List of Abbreviations ACR Additional Class Room
AISHE All India Higher Education Survey
AWC Anganwadi Centre
BLC Block Level Committee
BLF Block Level Facilitators
BDO Block Development Officer
CAG Comptroller and Auditor General
CBA Cost-Benefit Analysis
CDK Children’s Development Khazana
CHC Community Health Centre
CoV Concentration Villages
CPM Critical Path Method
CPWD Central Public Works Department
CS Central Sector
CSC Common Service Centres
CSO Civil Society Organizations
CSR Corporate social responsibility
CSS Centrally Sponsored Schemes
CWC Child Welfare Centre
DBT Direct Benefit Transfer
DHS Directorate of Health Services
DLC District Level Committee
DNT De-notified Tribes
DISHA District Infrastructure Scheme Advisory
DPO District Planning Officer
DPR Detailed Project Report
EBB Educationally Backward Blocks

iv
EC Empowered Committee
EFC Expenditure Finance Committee
EU European Union
FGD Focus Group Discussion
FPTP First-Past-the-Post
FYP Five Year Plan
IAY Indira Awas Yojana
ICDS Integrated Child Development Services
ICSSR Indian Council of Social Science Research
ICT Information and Communications Technology
IEC Information Education Communication
IEG Institute of Economic Growth (IEG)
IMEDA Indian Minorities Economic Development Agency
IIPA Indian Institute of Public Administration
IT Information Technology
ITI Industrial Training Institute
JAM Jan-Dhan, Aadhaar, and Mobile
JNV Jawahar Navodaya Vidyalaya
JRY Jawahar Rojgar Yojana
KGBV Kasturba Gandhi Balika Vidyalayas
KII Key Informant Interview
KV Kendriya Vidyalayas
LGBT Lesbian, Gay, Bisexual, and Transgender
MCA Minority Concentrated Area
MCB Minority Concentrated Block
MCD Minority Concentrated District
MCD-Hq Minority Concentrated District- Headquarters
v
MCT Minority Concentrated Town
MDD Minority Development Department
MIS Management Information System
MLA Member of Legislative Assembly
MLC Mobile Learning Centre
MoE Ministry of Education
MoHFW Ministry of Health and Family Welfare
MoMA Ministry of Minority Affairs
MP Member of Parliament
MPI Multidimensional Poverty Index
MRG Minority Rights Group International
MsDP Multi-sectoral Development Programme
NASSCOM National Association of Software and Service Companies
NAWADCO National Waqf Development Corporation Limited
NCM National Commission for Minorities
NFHS National Family Health Survey
NGO Non-governmental Organisation
NHM National Health Mission
NIC National Informatics Centre
NMDFC National Minorities Development and Finance Corporation
NREGS National Rural Employment Guarantee Scheme
NSS National Sample Survey
NT Notified Tribes
OBC Other Backward Classes
ODF Open Defecation Free
OOMF Output Outcome Monitoring Frameworks
OPHI Oxford Poverty and Human Development Initiative
PERT Programme Evaluation and Review Technique

vi
PFMS Public Finance Management System
PHC Public Health Centre
PHSC Primary Health Sub-Centre
PIB Press Information Bureau
PLFS Periodic Labour Force Survey
PMJVK Pradhan Mantri Jan Vikas Karyakram
PMU Project Monitoring Unit
PoWER Partnership for Women’s Empowerment and Rights
PPP Public-Private Partnership
PR Proportional Representation
PRI Panchayati Raj Institution
PWD Public Works Department
PwD Persons with Disability
RE Revised Estimate
RSMA Rashtriya Madhyamik Shiksha Abhiyan
RTI Right to Information
RUSA Rashtriya Uchchatar Shiksha Abhiyan
SBCC Social and Behaviour Change Communication
SC Scheduled Caste
SECC Socio-Economic and Caste Census
SHG Self Help Group
SLC State Level Committee
SSA Sarva Shiksha Abhiyan
SLSC State Level Screening Committee
SNT Semi-notified Tribes
SPWC Special Programme for Women and Children
SROI Social Return on Investment
ST Scheduled Tribe

vii
TISS Tata Institute of Social Sciences
TRYSEM Training of Rural Youth for Self-Employment
TSMFC Telangana State Minorities Finance Corporation
U5MR Under-five Mortality Rate
UC Utilisation Certificate
UNDP United Nations Development Programme
UN-ECOSOC United Nations Economic and Social Council
UNESCO United Nations Educational, Scientific and Cultural Organization
USTTAD Upgrading the Skills and Training in Traditional Arts/ Crafts for Development
UT Union Territory
WASH Water Sanitation and Hygiene
WPR Workforce Participation Rate
YOY Year-on-Year

viii
List of Figures Figure 1: Framework for sector analysis ....................................................................................................................... 4
Figure 2: Comparison of income across social groups, in Indian Rupees ........................................................ 8
Figure 3: Rising inequality in India ................................................................................................................................ 10
Figure 4: Incidence of poverty across minority groups (in %)........................................................................... 17
Figure 5: Literacy rates of minorities (in %) (Census 2011) ............................................................................... 18
Figure 6: Enrolment of minorities at primary school level ( in %) ................................................................... 19
Figure 7: Enrolment of minorities at middle school level (in %) ...................................................................... 19
Figure 8: Enrolment of minorities at secondary school level (in %) ............................................................... 20
Figure 9: Enrolment of minorities at higher secondary school level (in %) ................................................. 20
Figure 10: Out of school children (religious group-wise) (in %) ...................................................................... 21
Figure 11: Factors contributing to school drop-out in selected states (in %) ............................................. 22
Figure 12: Enrolment of minorities in higher education (in %) ........................................................................ 22
Figure 13: Percentage share in enrolment of Muslims and other minorities (in %) ................................ 23
Figure 14: Minority women’s access to money and credit (aged 15-49) (in %) ......................................... 23
Figure 15: Minority women’s freedom of access to go alone to places (aged 15-49)(in %) .................. 24
Figure 16: Minority women’s participation in decision making (aged 15-49) (in %) .............................. 24
Figure 17: Under-five Mortality Rate (U5MR) per 1000 live births in minorities (in %) ....................... 25
Figure 18: Prevalence of anaemia in minority children of age 6-59 months (in %) ................................. 26
Figure 19: Prevalence of anaemia in minority women (in %) ............................................................................ 27
Figure 20: Key initiatives of the Ministry .................................................................................................................... 32
Figure 21: Journey of MsDP to PMJVK .......................................................................................................................... 56
Figure 22: Broad institutional structure of PMJVK .................................................................................................. 57
Figure 23: Role of different committees involved in plan approval and implementation ...................... 57
Figure 24: Household profile of the target group for evaluation of PMJVK (in %) (N=608) ................. 58
Figure 25: Respondent profile of the target group for evaluation of PMJVK (in %) (N=608) ............... 59
Figure 26: Importance of PMJVK facilities (in %) (n=468) ................................................................................. 63
Figure 27: Minorities and their status in states ........................................................................................................ 64
Figure 28: Awareness about facilities developed under PMJVK (in %) (N=608) ....................................... 65
Figure 29: State-wise analysis of IEC activities (N=608) ...................................................................................... 66
Figure 30: Facilities identified by the respondents (in %) (N=608) ................................................................ 67

ix
Figure 31: Source of information about PMJVK facilities (in %) (n=252) ..................................................... 68
Figure 32: Strategic focus areas of PMJVK scheme .................................................................................................. 69
Figure 33: Analysis of assets sanctioned and completed (2014-15 to 2018-19) ....................................... 70
Figure 34: Accessibility to the PMJVK facilities (in %) (n=252) ........................................................................ 71
Figure 35: Percentage of completed projects under PMJVK ................................................................................ 73
Figure 36: Involvement of MP/MLAs in scheme implementation (N=608) .................................................. 77
Figure 37: Usage of IT under PMJVK (n=338) ........................................................................................................... 81
Figure 38: Perception of facilities being beneficial ( in %) (n=252) ................................................................ 86
Figure 39: Analysis of the satisfaction with “quality of educational asset” and perception of being “overall beneficial” (n=103) .............................................................................................................................................. 87
Figure 40: Comparison of areas with an education related asset to those without an education asset{N= 608 (overall); n=103 (with education asset)} ........................................................................................ 88
Figure 41: Analysis of the satisfaction with “quality of health asset” and perception of being “beneficial” (n=45) ................................................................................................................................................................ 88
Figure 42: Comparison of areas with a health-related asset to those without health-related assets {N= 608 (overall); n=45 (with health asset)} ..................................................................................................................... 89
Figure 43: Facilities that villagers aspire to have in their village (in %) (N=608) ..................................... 90
Figure 44: Equity in terms of participation in trainings, meetings related to the scheme (n=338) ... 91

x
List of Tables Table 1: Status of deprivation in India ............................................................................................................................ 9
Table 2: Focus on social development and inclusion under India’s Five-Year Plans ................................ 13
Table 3: Gap map synthesis of sector and CSS schemes ........................................................................................ 46
Table 4: Gap analysis of sectoral issues ....................................................................................................................... 49
Table 5: Revised parameters for identification of MCAs under PMJVK .......................................................... 55
Table 6: Output outcome performance of the scheme ........................................................................................... 73
Table 7: Status of monitoring mechanism under the scheme ............................................................................. 80
Table 8: Outlay and expenditure (Rs. in crore) of MsDP/PMJVK in past 5 years ....................................... 83
Table 9: Cross-sectional thematic assessment of PMJVK ...................................................................................... 92
Table 10: Suggestive list of NGOs working on minority issues ....................................................................... 100
Table 11: Rationalization based on recommended parameters ..................................................................... 102
Table 12: Summary of scheme rationalization ....................................................................................................... 103

xi
List of Case Studies
Box 1: ‘Progress Panchayat’ initiative in MCAs ......................................................................................................... 68
Box 2: Limited participation of state officials in scheme implementation .................................................... 75
Box 3: IT Initiatives of Arunachal Pradesh .................................................................................................................. 81
Box 4: Directorate of Minorities, Karnataka: Use of ICT (Information and Communications Technology) for simplicity of operation and handling of public records ....................................................... 82
Box 5: Issue of delays in planning and implementation mechanism .............................................................. 83
Box 6: Status of implementation of PMJVK projects in Assam ........................................................................... 85
Box 7: Facilities for ‘Divyang Jan’ and ‘Elderly’ ......................................................................................................... 91

1
Overview Pradhan Mantri Jan Vikas Karyakram (PMJVK) has been a milestone in the socio-economic and educational empowerment of minority communities. It is an area development scheme that aims at improving the socio-economic conditions of the minorities and reducing imbalances in the identified Minority Concentrated Areas (MCAs) by providing basic amenities for improving the quality of life. The scheme has been assessed through the lens of Relevance, Effectiveness, Efficiency, Sustainability, Impact, and Equity (REESIE) framework and cross-cutting themes. The evaluation team undertook a detailed review of the scheme performance from relevant reports/documents (national and international) including operating guidelines, monitoring reports, progress reports, evaluation reports, financial data, among others, to understand the nuances of the schemes and the results. Quantitative data such as primary data collected, scheme MIS (Management Information System) data shared by the Ministry as well as budget documents have been used to assess the key outcomes, facilitators, and barriers of the schemes. The evaluation team also conducted formal discussions with national, state, and district-level stakeholders to strengthen the understanding and access inputs from a wide range of stakeholders. These were conducted in person as well as via video conference. Findings of the evaluation have been further strengthened by gathering perspectives of asset users through household interviews across eight sample states under the evaluation study.
Brief Evaluation Overview
The PMJVK scheme has been a great achievement for the Ministry in bridging the development deficit in the MCAs of the country. The restructuring of the programme in 2018-19 indeed brought in significant improvement with a greater focus on women-centric projects. Under MoMA, a PMJVK Empowered Committee (EC) has been constituted to appraise, recommend and approve the projects in the state proposals. The scheme has contributed to up-gradation of school infrastructure, providing additional classrooms, new hostels, Community Health Centers (CHCs), Primary Health Centers (PHCs), health sub-centers, Industrial Training Institutes (ITIs), polytechnics, skill training centers, drinking water supply projects, sadbhav mandaps, market sheds, etc.
Attention has been given to improve transparency and dissemination of information by including an online module along with geotagging of projects.
Primary data and content analysis of national/state/district Key Informant Interviews (KIIs) reveal that majority of the projects implemented under the scheme are relevant for the minority communities. However, baseline surveys have not been conducted across all sample states. There is inadequate manpower/technical expertise to examine the Detailed Project Reports (DPRs). Analysis of state and district KIIs also revealed inadequate human resource as well as lack of capacity building trainings to state/district stakeholders. Infrastructure projects take a lot of time due to land issues, tendering process, cost escalation issues, and technical sanctions. The scheme has created a visible impact, as observed from the primary data collected.
Overall the scheme is well aligned to address the national priorities and concerns of minorities. It is responsive towards the changing situation of religious minorities as reflected in the strategic alterations made in the design and approach of PMJVK compared to Multi-sectoral Development Programme (MsDP).

2
Chapter I. Sector level analysis
1. Background of the sector This section provides a broad conceptual framework for defining and understanding ‘social inclusion’1 as a sector in its multiple dimensions. It attempts to provide a specific overview of the social inclusion sector in India in terms of identifying key socially excluded groups, their degree of social exclusion, highlighting issues and underlying factors for social exclusion, and the role of key stakeholders and institutions, including state and non-state actors, which have shaped the sector’s evolution in India. Most importantly, the sector analysis aims to identify and analyse the gaps that remain to be addressed for the various socially excluded groups in the country and provide key recommendations for strengthening this country’s sector. This analysis has been conducted utilizing the World Bank Inclusion Framework and using Markets, Spaces, and Services as the guiding denominators. Social inclusion and exclusion in the minority sector require a holistic perspective, as inferred from international and national literature.
1.1. Background ‘Inclusive growth’ or ‘Social inclusion’ have become part of governments’ common lexicon and other development agencies across the globe. This theme has gained currency in recent times due to major socio-economic transitions and trends that the world has witnessed in recent times. Several factors such as demographic shifts, economic volatility, climate change, food price shocks, armed conflict, civil protests, and human migration, and the recent COVID-19 pandemic are creating tremendous pressure on societies globally. These factors are disproportionately impacting socially disadvantaged groups by exacerbating existing marginalization and vulnerabilities. This has created an urgent need to address social exclusion.
The United Nations Secretary-General, during the launch of COVID-19 Global Humanitarian Response Plan on 23 March 2020, said, “We must come to the aid of ultra-vulnerable – millions upon millions of people who are least able to protect themselves. This is a matter of basic human solidarity. It is also crucial for combating the virus. This is the moment to step up for the vulnerable.”
Social inclusion is integral to New India’s vision and a core theme of the Government of India’s development agenda. NITI Aayog, in its Strategy for New India@75, has clearly defined objectives for India to achieve by the year 2022-23, one of which is to build an inclusive society.2 The COVID-19 crisis has further highlighted the need for strong social protection measures covering different vulnerable groups across the country.
1.2. Framework for sector analysis For social inclusion, different scholars have propounded different methodologies and approaches. Burchardt et al. proposed an outcome-based approach for understanding social inclusion by studying the individual’s participation across five parameters (consumption, savings, production, political and
1 World Bank definition of Social Inclusion: Social inclusion is the process of improving the terms on which individuals and groups take part in society—improving the ability, opportunity, and dignity of those disadvantaged on the basis of their identity. World Bank, Inclusion framework, Last accessed on 16th November 2020 2 NITI Aayog (2018), Strategy for New India @ 75,Last accessed on 30th April 2020

3
social).3 Scholars such as Graham Room and Gore & Figueiredo propounded a rights-based approach to the issue of social exclusion. They analyzed from the lens of civil, political enforcement, and social rights of citizenship.4 Graham Room shifted from the concept of poverty associated solely with income and expenditure towards a “multidimensional, dynamic and relational concept,” which further helped shed light on social and health inequalities.5 Experts such as Amartya Sen and Michael Mann adopted a relational perspective on the issue. Sen studied it as the disadvantage faced by socially excluded groups from being denied the shared opportunities enjoyed by other groups. Also, Mann tried to understand it from an individual’s placement in the social network built on power dynamics.6 Naila Kabeer has advocated for the inter-sectional analytical framework for social inclusion, examining it as “the product of institutional processes, group dynamics, and social practices.”7
To ensure consistency of applicability, adoption, relativity, and comparison, the evaluation team has referenced the literature on social inclusion widely and adapted the World Bank framework on social inclusion8 to present a coherent conceptual framework for sector analysis. The framework broadly covers the critical aspects of social inclusion, performance of the sector, as well as contribution of government’s affirmative actions and schemes in terms of improving the sector outcomes that has led to conclusions in terms of achievements and remaining gaps. Figure 1 presents the schematic of the framework.
3 Burchardt, Tania, Julian Le Grand, David Piachaud, (2002), Social Exclusion in Britain 1991-1995, Last accessed on 26th September 2020 4 Janie Mathieson et al, (2008), Social Exclusion: Meaning, measurement and experience and links to health inequalities – A review of literature, Last accessed on 26th Sep 2020; Klasen, Stephen, (2002), Social exclusion and children in OECD countries: some conceptual issues, Last accessed on 26th September 2020 5 Janie Mathieson et al, (2008), Social Exclusion: Meaning, measurement and experience and links to health inequalities – A review of literature, Last accessed on 26th September 2020 6 ibid 7 Naila Kabeer (2000), IDS Bulletin, Social Exclusion, Poverty and Discrimination: Towards an Analytical Framework, Last accessed on 30th April 2020 8 International Bank for Reconstruction and Development, The World Bank (2013), Inclusion Matters: The foundation for shared prosperity, Last accessed on 30th April 2020

4
Figure 1: Framework for sector analysis
Source: KPMG Analysis
The above framework has been utilized for sector analysis. Its key components are as follows:
• Firstly, the sector has been defined based on what constitutes social exclusion, who the socially excluded or vulnerable groups are, and why they have remained excluded. The role of key stakeholders including governments, private sector, Non-Governmental Organisations (NGOs), Civil Society Organisations (CSOs), and other development agencies, in addressing the issue have been highlighted. This section also presents a historical perspective on interventions to reduce social exclusion or promote social inclusion in the country.
• In the next step, the framework elucidates how social exclusion manifests into systematic deprivation of the vulnerable groups. It analyses the performance of marginalized groups on various socio-economic indicators compared to the general population across domains such as Markets, Services, and Spaces to comment on the extent of social exclusion.
• The next component that is affirmative action/scheme analysis focuses on the outputs and outcomes of the government interventions and how they have contributed towards enhancing the ability, opportunity, and dignity of socially excluded population and led to the reduction of social exclusion in terms of one of two broad level sector outcomes: reducing disparities and protection of rights. The performance of umbrella schemes have been analyzed using the Relevance, Effectiveness, Efficiency, Sustainability, Impact, and Equity framework looking at aspects like planning and design, budgetary allocation, and scheme governance.

5
• Finally, the concluding section of the analysis highlights the achievements and gaps to be further addressed. This section also focuses on barrier analysis, identifying future areas of research and good practices, etc. to draw conclusions and takeaways for the evaluation.
1.3. Social inclusion and exclusion The term ‘social inclusion’ traces its origin to several theoretical constructs of social welfare that straddle diverse development economics, political science, sociology, and philosophy. However, the term has come to assume a wide array of connotations globally for different stakeholder groups and across other geographical regions.
The World Bank Group defines social inclusion as “the process of improving the terms for individuals and groups to take part in society.” It involves “improving the ability, opportunity, and dignity of those disadvantaged based on their identity, to take part in society”.9. A fair society offers equal opportunities to all its members; however, various social groups continue to be excluded owing to their identity which includes gender, race, caste, ethnicity, religion, geographical location, sexual orientation, economic or disability status, among others.
Social exclusion has a strong correlation to poverty as it creates interrelated, multidimensional, and chronic deprivations. According to Silver, “Social exclusion is usually defined as a dynamic process of progressive multidimensional rupturing of the ‘social bond’ at the individual and collective levels.”10 It encompasses various forms of social disadvantages, including lack of access to quality education, health, and housing, in addition to material poverty. Social exclusion results from failure of a society to grant equitable access and recognition in different spheres of life such as education, health, job opportunities, and resources, etc.11 Amartya Sen has aptly observed that “Social exclusion can, thus, be constitutively a part of capability deprivation as well as instrumentally a cause of diverse capability failures”.12 De Haan also propounded that social exclusion depicts both the multidimensional outcomes as well as the processes of deprivation.13 According to various theorists, social exclusion is a process rather than an outcome. Due to the multidimensional nature of this process, there is an interaction of multiple dimensions of disadvantage which may reinforce one another thereby exacerbating the impact.
Exclusion from society in all its dimensions has adverse and debilitating effects on human capital development as it exacts substantial social, economic, and political costs. Inequitable growth and rising inequality can threaten the social fabric of any society and also provides drivers for social unrest and rising crime due to their self-reinforcing and cumulative impact. India’s widening inequalities in terms of income and access to basic services are further aggravating the historical divisions of class, caste, gender, and other social identities.
Social exclusion may be erroneously interpreted to be the same as poverty and income inequality and, as an extension, social inclusion may be viewed as being limited only to financial inclusion. The
9 Urban, Disaster Risk Management, Resilience and Land Global Practice, World Bank (2019), Social Inclusion., Last accessed on 12th April 2020 10 Silver, Hilary, (2007), The Process of Social Exclusion: The Dynamics of an Evolving Concept, Last accessed on 22nd September 2020 11 C.J. Sonowal, TISS, (2017), Indian Tribes and Issue of Social Inclusion and Exclusion Last accessed on 12th April 2020 12 Sen, Amartya, Office of Environment and Social Development, Asian Development Bank, (2000), Social Exclusion: Concept, Application and Scrutiny, Last accessed on 22nd September 2020 13 de Haan, Arjan, (1999), DFID London, Social Exclusion: Towards an Holistic Understanding of Deprivation, Last accessed on 26th September 2020

6
term social inclusion, however, transcends the elimination of poverty and requires that the broader issue of social exclusion be addressed. It is important not only in terms of economic rights and opportunities but also in terms of voice and empowerment of all social groups.14 Social inclusion in many cases may not be about economic or income disparity at all; for instance, discrimination against Lesbian, Gay, Bisexual, and Transgender (LGBT) is practiced commonly even in many high-income and developed societies and also against high-income individuals.
As per a World Bank Group publication,15 a sustainable path towards ending extreme poverty and promoting shared prosperity would also involve creating an inclusive society, not only in terms of economic welfare but also in terms of the voice and empowerment of all groups. An inclusive society must have institutions, structures, and processes that empower local communities to hold their governments accountable. It also requires the participation of all groups in society, including traditionally marginalized groups, such as ethnic minorities and indigenous populations, in decision-making processes.
Social inclusion perpetuates social justice, which is both a process and a goal.16 Social justice aims to ensure that each individual, irrespective of their caste, sex, race, or other identities, has an equal opportunity to be a contributing member of society. It aims at ensuring equal access to opportunities for all, thereby advancing their growth and development. It ensures access to quality resources such as education, healthcare, and employment. Social justice is achieved when the limitations set by society no longer prevent an individual’s success and growth.
A socially appropriate environment is one in which the primary hindrances to growth are lack of own capabilities or potential to succeed, or uncontrollable events, as societal systems are conducive to development. The process of attaining social justice should also be one that is participatory, inclusive, and affirming of human agency and capacities for working collaboratively to create change.
1.4. Extent of social exclusion Human societies across nations and cultures practice social discrimination and exclusion based on individuals’ or groups' identities. Caste, ethnicity, religion, gender, age, and disability status are the most common basis for identity-based discrimination.
Socially excluded populations exist in one form or another in every country, big and small, developed or developing, and democratic or otherwise. For example, in a country like Vietnam, which has made considerable progress on poverty reduction, its indigenous people have a much lower likelihood of being covered under health programmes or receiving necessary vaccinations.17 During the financial crisis of 2008, African Americans in the United States were twice as likely to be unemployed as the
14 United Nations, Department of Economic and Social Affairs, (2019),Analyzing and Measuring Social Inclusion in a Global Context Last accessed on 25th April 2020 15 International Bank for Reconstruction and Development / The World Bank (2013), Inclusion Matters: The foundation for shared prosperity Last accessed on 6th March 2020 16 Adams, M., Bell, L. A., & Griffin, P. (Eds.). (2007).Teaching for diversity and social justice (2nd ed.) New York, NY: Routledge, Last accessed on 25th April 2020 17 Målqvist, Mats et al., Ethnic minority health in Vietnam: a review exposing horizontal inequity, (2013), Global Health Action vol. 6 1-19, Last accessed on 19th September 2020
7
white population.18 The ethnic minority of Quechua-speaking women in Bolivia were found to have 28 percent lower chance to complete secondary school than Spanish-speaking Bolivian men.19
In countries across the world, excluded social groups are systemically denied or deprived of the benefits that accrue from development investments. For example, in Uganda, where access to electricity among households is generally low, less than 5 percent of the minority Lugbara and Ngakaramajong populations reported having access to electricity compared with almost 50 percent of the majority Buganda group who were surveyed.20 A similar picture emerged when it came to the issue of access to clean water.
While several indices have been developed over the decades to measure human development, welfare, happiness, and wealth, effective measurement of the social, economic, and political costs of social exclusion are still challenging. Despite methodological constraints, some attempts have been made. In this regard, some World Bank studies have found that occupational segregation can restrict the free movement of talent and resources in an economy that can result in sizeable productivity losses to the entire economy.21 A study undertaken in Romania on the impact of excluding the ethnic minority Roma indicated a cost of 887 million euros in lost productivity annually. Similar studies in Bolivia showed that the exclusion of ethnic minorities affected agricultural productivity by almost 36 percent. Other recent studies have indicated that disabled children have a lower probability of starting school than children without disabilities and have lower retention rates when compared.22
1.5. Extent of social exclusion in India In Indian society, the social classes are divided based on the caste system wherein everyone is ascribed a caste-based on the family they are born into.23 In India, some of the key segments which face social injustice and exclusion, based on their identity at birth, are the Scheduled Castes (SC), Scheduled Tribes (ST)24, Other Backward Classes (OBC), and minorities. There are deficiencies in service delivery, especially in areas predominantly inhabited by vulnerable communities.25 According to the Census 2011,26 these vulnerable groups together constituted over 70 percent of India’s total population.
India has not undergone a significant reduction in multi-dimensional poverty. As a matter of fact, in 2020, India ranks 62nd out of 107 countries with an Multidimensional Poverty Index (MPI) score of 0.123 and 27.91 percent headcount ratio, based on the National Family Health Survey- 4 (NFHS-4), 2015-16 data.27 In 2018, India was at 53rd place out of 105 countries with an MPI Score of 0.121 and
18 Andy Kroll, The African American Jobs Crisis and the New Jim Crow, (2011), Race, Poverty & the Environment Vol. 18, No. 2, Last accessed on 19th September 2020 19 Footnote 18 20 Footnote 19 21 The World Bank, Policy Research Working Paper 8583, (2018), Occupational Segregation and Declining Gender Wage Gap, Last accessed on 19th September 2020 22 Footnote 19 23 B. R. Suryawanshi, Nishikant Dhande, ResearchGate (2013), Socio-Economic Development among Scheduled Caste: A Study of Mahatma Phule Backward Class Development Corporation in Select District of Maharashtra, Last accessed on 12th April 2020 24 C.J. Sonowal (2008), Indian Tribes and Issue of Social Inclusion and Exclusion, Studies of Tribes and Tribals, Last accessed on 12th April 2020 25 Ministry of Health and Family Welfare, NVBDP, Report on Safeguard Policy Issues for Vulnerable Communities, Last accessed on 22nd December 2020 26Ministry of Rural Development, Government of India, (2011), Socio Economic and Caste Census, Last accessed on 3rd November 2020 27 Footnote 26

8
27.51% headcount ratio based on the Directorate of Health Services (DHS), 2015-16 data.28
According to the Global MPI 2018 released by the United Nations Development Programme (UNDP) and the Oxford Poverty and Human Development Initiative (OPHI), India has made noteworthy progress in reducing multidimensional poverty.29 271 million people moved out of poverty between 2005 and 2016 in India. The poor, as per the MPI, in India stood at approximately 640 million between 2005-2006 which accounted for 55.1 percent of the total population. This has reduced to 364 million people or 27.9 percent people living in poverty in 2015-2016.30
Even though the traditionally disadvantaged groups across states, castes, religions, and ages have experienced the maximum decrease in Multidimensional Poverty Index through the decade, indicating that they have been moving up, they continue to remain amongst the poorest strata of the society. SCs, STs, OBCs, Safai Karamchari, De-notified Tribes (DNTs), Notified Tribes (NTs) and Semi-notified Tribes (SNTs), Minorities belong to the poorest economic strata of Indian society and face severe economic and social exclusion, segregation in housing, denial, and restrictions of access to public and private services and employment.31 They tend to constitute a substantial proportion of casual labour in the country. In a breakdown analysis of caste data in the public and private sector, it was found that discrimination accounts for 19.4 percent and 31.7 percent lower wages for SC in the public and private sectors respectively when compared to the higher castes.32 This shows that unequal labour market outcomes are caused due to systemic inequalities in a caste-based society. Backward classes such as Scheduled Caste face extreme exclusion from society in terms of access to education, healthcare, government services, markets, employment, and the use of land and water resources.33 Similarly, in the case of Muslims which constitute the largest minority in India, the dynamics of employment are seldom pleasant and are often limiting for long-term economic emancipation.34 The vulnerable groups, be it religious or ethnic, lag behind other social groups (Figure 2).
Figure 2: Comparison of income across social groups, in Indian Rupees
Source: NFHS IHDS 2011-12 Data cited in Bharti, Nitin Kumar, (2018), Wealth Inequality, Class and Caste in India, 1961-2012
28 Ministry of Health and Family Welfare (2015-16), National Family Health Survey (NFHS-4), Last accessed on 26th April 2020 29 Oxford Poverty and Human Development Initiative, (2018), Global MPI 2018, Last accessed on 19th September 2020 30 UNDP (2018), 271 million fewer poor people in India, Last accessed on 31st April 2020 31 Ministry of Social Justice & Empowerment (2017), National Commission for DNT and Semi-Nomadic Tribes, Idate Commission, Last accessed on 13th April 2020 32 Singhari, S., & Madheswaran, S., Working Paper 361, The Institute for Social and Economic Change (2016), Social Exclusion And Caste Discrimination in Public and Private Sectors in India : A Decomposition Analysis, Last accessed on 6th April 2020 33 Pradeep. B Kadun, Ravindra Gadkar, ResearchGate (2014), Social Exclusion –Its types and impact on Dalits in India, Last accessed on 12th April 2020 34 Phillipa Williams (2017), Working at the margins? Muslim middle-class professionals in India and the limits of ‘labour agency’, Environment and Planning A: Economy and Space, Last accessed on 15th September 2020
89356 75216104099
167013 164633
105538 113222
SC ST OBC Forward Caste(Brahmin)
Forward Caste(Non-Brahmin)
Muslim Overall

9
Although major progress has been made in reducing multidimensional poverty in India, acute deprivation is prevalent in nutrition, health, school education, and sanitation for 364 million Indians. More than half of all multi-dimensionally poor individuals in India live in the four poorest states – Bihar, Jharkhand, Madhya Pradesh, and Uttar Pradesh.35 These constitute 196 million multi-dimensionally poor people. There is, however, accelerated progress in many states. For instance, Jharkhand recorded the maximum strides among all states in reducing multidimensional poverty. Similarly, Arunachal Pradesh, Chandigarh, Nagaland, and Bihar have also made significant strides.36 Poor nutrition is the main reason which contributes majorly towards the MPI across most of the states.37 This is followed by no family member holding a minimum of six years of education as another contributing factor. There has been a reduction in nutrition deprivation in India from 44.3 percent to 21.2 percent in 2005-06 and 2015-16 respectively. Besides this, there has been a decrease in the rate of child mortality from 4.5 percent in 2005-06 to 2.2 percent in 2015-16. There has also been a decrease in several challenges such as deprivation of cooking fuel, sanitation, and safe drinking water. Table 1 shows the reduction rate of several different parameters that contribute towards the concept of multidimensional poverty.
Table 1: Status of deprivation in India
S. No Category Year 2005-06 Year 2015-16
1 Deprivation of nutrition 44.3 percent 21.2 percent
2 Child Mortality Rate 4.5 percent 2.2 percent
3 Deprivation of cooking fuel 52.9 percent 26.2 percent
4 Deprivation in sanitation 50.4 percent 24.6 percent
5 Deprivation of safe drinking water 16.6 percent 6.2 percent
6 Deprivation of electricity 29.1 percent 8.6 percent
7 Deprivation of housing 44.9 percent 23.6 percent
8 Deprivation of assets 37.6 percent 9.5 percent
Source: Global Multidimensional Poverty Index-2018 by United Nations Development Programme (UNDP)
While multidimensional poverty has reduced in India significantly, inequality has been rising sharply. The Inequality Report by Oxfam India38 in 2019 projects a stark picture of the economic disparities in the country. The inequalities between different social groups have substantially increased in India. The Gini Wealth Coefficient (a statistical measure of income or wealth inequality) of the country has moved up from 81.2 percent in 2008 to 85.4 percent 2018. Some of the other key findings of this report are summarized in Figure 3.
35 UNDP (2019), 2019 Global Multidimensional Poverty Index (MPI), Last accessed on 25th April 2020 36 Footnote 35 37 Footnote 35 38 Oxfam (2019), Public Good or Private Wealth? Oxfam Inequality Report The India Story, Last accessed on 23rd April 2020

10
Figure 3: Rising inequality in India
1.6. Minority population in the country According to the Census of India 2011,39 the percentage of religious minorities in the country was 19.3 percent of the overall population. Among the minority groups, Muslims constitute the largest minority group40 accounting for 14.2 percent, Christians comprise 2.3 percent, Sikhs 1.7 percent, Buddhists account for 0.7 percent, Jains for 0.4 percent, and Parsis account for less than one percent of the total population. The largest minority groups in terms of population are Muslims, followed by Christians. A brief overview of their demographical concentration has been provided below:
Muslim: In terms of demographical concentration, as per Census 2011, the Muslim community is present in states of Assam (34 percent), West Bengal (27 percent), Kerala (26 percent), Uttar Pradesh (19 percent), and Bihar (17 percent); whereas in Lakshadweep (97 percent) and Jammu/Kashmir (68 percent), Muslims constitute a majority in terms of population.
Christian: The north-eastern states constitute majority of India’s Christian population, with Nagaland (88 percent), Mizoram (87 percent), and Meghalaya (75 percent) being predominantly Christian states.
Sikh: Sikh community is majorly concentrated in Punjab (57 percent), followed by dispersed distribution near the region in Chandigarh (13 percent), Haryana (4.91), Delhi (3.4 percent), and Uttarakhand (2.3 percent).
Buddhist: Buddhist community is largely concentrated in Sikkim (27 percent), Arunachal Pradesh (11.7 percent), and Mizoram (8.5 percent). However, the largest number of Buddhists are concentrated in Maharashtra, with 77.36 percent of all Buddhists in India.
39Census 2011, Last accessed on 12th April 2020 40 Prime Minister’s High Level Committee Cabinet Secretariat, GoI, (2006), Sachar Committee Report: Social, economic and educational status of the Muslim community of India., Last accessed on 24th January 2020
• India's top 10 percent of the population holds 77.4 percent of the total national wealth, while the top 1 percent holds 52.53 percent of the wealth.
• The bottom 60 percent who constitute most of the population, hold 4.8 percent of the national wealth. • In 2018, wealth of top 1 percent of India increased by 39 percent, wealth of bottom 50 percent increased
a dismal 3 percent. • The total wealth of Indian billionaires was higher than the total Union Budget of India for the fiscal year
2018-19. • In 2018, the total wealth of 119 Indian billionaires increased by Rs. 80.2 billion, equivalent to the
combined direct tax revenue of the country Rs. 86.2 billion (in 2016-17) • Scheduled Tribes and Muslims, despite the largest reduction of poverty, continue to have the highest
rate of poverty • 31% Muslims continue to remain poor, with every third Muslim being multi-dimensionally poor • As per the report, 8.6% of the country’s population lives in “severe poverty”
Source: Oxfam (2019), Public Good or Private Wealth? Oxfam Inequality Report The India Story; Global Multidimensional Poverty Index - 2018 by United Nations Development Programme (UNDP)

11
Jain and Parsi: Jain community is primarily concentrated in Maharashtra at 1.25 percent, with other states having less than one percent Jain. The Parsi community remains extremely small with less than a lakh Parsis in India.
Notably, a large section of tribal communities is classified as Hindus in the Census, notwithstanding that tribals are often followers of animism and/or indigenous belief systems. This has led to a demand for “Tribal Religion” as part of the next census exercise as the community is not appreciative of the default Hindu classification and views it as an attempt to usurp the religious autonomy of tribal communities.41 The conflict between ‘Christian’ and ‘Sarna’ tribals (non- Christian indigenous tribals) is a classic example of misuse of socio-economic benefits. It has been reported that majority of the Sarnas have converted to Christianity to receive benefits of reservation as a minority as well as STs.42 Hence, in November 2020, a resolution was passed for the provision of a separate ‘Sarna Code’ for tribal communities that will allow members of these communities to identify as Sarna, instead of any other religious minority group. 2. Performance of the sector The Constitution of India, vide Article 29 which acts as a legal fulcrum for preservation and cultivation of minority rights, states the following: Any section of the citizens residing in the territory of India or any part thereof having a distinct language, script, or culture of its own shall have the right to conserve the same.43 The term minority has not been delineated, despite being featured four times in the Constitution, through Article 29, rights, entitlements, and recognition germinate outwards. According to the Hon’ble Court, the criterion to determine minority status is to be done state-wise (i.e. by the state authorities) as the reorganization of states has been carried out on linguistic lines.44
However, recently, a demand can be observed to recognize Hindus as a minority in selective states wherein they are numerically lesser than other inhabitants.45
Despite efforts to improve the status of vulnerable communities, some religious minorities have been lagging consistently on indicators such as health, employment rate, and Work Participation Rate (WPR). The unemployment rate in usual status (2018-19)46 is highest among Christians and Sikhs, both at 7.2 percent, followed by Muslims at 6.8 percent.47 Among religious groups, iron deficiency is highest among Sikhs at 39.7 percent as compared to 12.3 percent among Christians and 19.7 percent among Muslims.48
2.1. Historical trends and evolution of social inclusion policies 2.1.1. Constitutional provisions for protection of vulnerable groups
Given the huge proportion of vulnerable groups in India, social justice and inclusion have been a priority for the Indian State. The Indian Constitution ensures its citizens the liberty of expression,
41 Akash Poyam (2020), Faith in Numbers, Caravan Magazine, Last accessed on 15th September 2020 42 Panda, P., Kumar, A. (2018), Ethnicity, Religion, and Identity Politics among Tribes in Jharkhand, Economic and Political Weekly, Last accessed on 22nd September 2020 43 Article 29, Constitution of India 44 TMA Pai Foundation vs. State of Kerala 2002 (8) SCC 481 45 Faizan Mustafa (2019), Can Hindus be minority?, Tribune India, Last accessed on 15th September 2020 46 Usual Status means considering both principal activity status + subsidiary economic activity status (ps+ss) 47 Annual Report, PLFS (2018-19), Released in June 2020, Last accessed on 22nd December 2020 48 Comprehensive National Nutrition Survey, 2016-2018, Last accessed on 22nd December 2020

12
belief, faith and worship, equality of status, and opportunity. It further prescribes safeguards for advancing the social, economic, and political status of backward classes in the society. The terms Scheduled Caste and Scheduled Tribes are present in the Constitution and there are provisions for Other Backward Classes as well. The Constitution of India has prescribed protection and safeguards for the SCs, STs, and other weaker sections such as minorities, either specially or by way of insisting on their general rights as citizens with the object of promoting their educational and economic interests and removing social disabilities.49
The Preamble to the Constitution assures all citizens social, economic, and political justice. Articles 14, 15, 16, and 17 of the Constitution advocate different parameters of social justice. Article 14 provides every individual equality before law within the territory of India, while Article 15 prohibits discrimination against any citizen on grounds of religion, race, caste, or place of birth. Article 16 provides equality of opportunity for all citizens in matters relating to employment. Article 16(4A) speaks of “reservation in matters of promotion to any class or classes of posts in the services under the State in favour of SCs/STs, which are not adequately represented in the services under the State”. Article 17 has helped do away with all manifestations of the concept of ‘untouchability’. All the above provisions work towards eliminating social exclusion in different forms. Article 46, with its provision of promoting the educational and economic interests of the weaker sections of the society, especially those of scheduled caste and scheduled tribe, lies at the heart and soul of social justice. This Article protects them from all forms of exploitation and social injustice. The Constitution does not define the term ‘Minority’. However, recognition and protection are provided through Articles 29 and 30, which concurrently provide cultural and educational rights to minorities. The Constitution, therefore, confers upon minorities protection with regards to conserving and preserving the language, script, and culture; ability to establish and administer educational institutions; protection against discrimination in the matter of state aid to minority-operated institutions; and protection against denial of admission in state-aided and/or run institutions.
The Constitution provides for the preferential treatment of the backward classes for their upliftment in society.50 Article 330 and Article 332 of the Constitution respectively provide for reservation of seats in favour of the scheduled castes and the scheduled tribes in the House of the People and the legislative assemblies of the states. Under Part IX, relating to the Panchayats, and Part IXA of the Constitution, relating to the municipalities, reservation for scheduled castes and scheduled tribes in local bodies has been envisaged and provided. Article 335 provides that the claims of the members of the scheduled castes and the scheduled tribes shall be taken into consideration, consistently with the maintenance of efficiency of administration, in the making of appointments to services and posts in connection with the affairs of the Union or a state. Article 338 provides for a National Commission for the Scheduled Castes and Scheduled Tribes with duties to investigate and monitor all matters relating to safeguards provided for them, to inquire into specific complaints, and to participate and advise on the planning process of their socio-economic development, etc. In a parallel manner, Article 350A facilitates instruction in mother tongue at the primary education level, in case of linguistic minorities, and Article 350B provisions for the appointment of a special officer, appointed by the President of India to investigate and report on matters relating to linguistic minorities.
49 Khurshid, Salman (2019), Governance, Constitution and Social Justice for Civil Services Examination Last accessed on 26th March 2020 50 Galanter (1961), Structure and Change in Indian Society, Last accessed on 14th March 2020

13
2.1.2. Evolution of social inclusion themes in Five Year Plans
In 1950, the Government of India established the Planning Commission as India’s apex planning body to create and execute India’s Five-Year Plans. India’s first Five Year Plan was tabled in Parliament in 1951 and for over the next six decades, Five Year Plans continued to be India’s model of development planning. Five Year Plans were developed up to the 12th plan period (2012-17). The Five-Year Plans in India evolved based on the needs of the times and focused on key development priorities. The focus of the initial plans (1st and 2nd) was broadly on economic development in areas such as agriculture, irrigation, power, transport, and industrial development. However, from a social inclusion perspective, they also emphasized the provision of basic services such as water and sanitation and women empowerment. During the 3rd, 4th, and 5th plan periods, the focus of planning expanded to cover balanced regional development, rural welfare, poverty alleviation, and social equality and justice. The 6th and 7th plans gave considerable emphasis on growth, reducing unemployment, self-reliance, and social justice. Post-liberalization, in the early 1990s, the focus of the 8th and 9th Five Year Plans was on enabling accelerated economic development and bringing a renewed emphasis on social objectives through affirmative action and by universalization of education and healthcare. The 10th, 11th and 12th plans strongly advocated inclusive growth principles, balancing economic growth together with improving the condition of vulnerable sections of the society such as women and children, backward classes through services such as health, education, and employment generation. A summary of how the Five-Year Plans have focused on the social inclusion agenda over the years is provided below:
Table 2: Focus on social development and inclusion under India’s Five-Year Plans
Plan and Period Description
First Five-Year Plan (1951-56)
• Broadly focused on the primary sector (e.g. agriculture, power, and transport), but also put considerable focus on social development areas
• Water supply and sanitation were included in the national agenda and subsequently, the first National Water Supply Programme was launched in 1954 as a part of the government’s health plan
Second Five Year Plan (1956-61)
• Led to the announcement in Industrial Policy in 1956 accepting the establishment of socialistic pattern of society as the goal of economic policy, with focus on production, investment, and employment
• It emphasized that “social welfare is concerned with the wellbeing of the entire community”
• Introduced the concept of Mahila Mandals to act as focal points of development of women at the grass-root level
• Provided for welfare measures such as women should be protected against injurious work and should receive maternity benefits, and included crèches for children, and the principle of equal pay for equal work
Third Five Year Plan (1961-66)
• The plan considered for the first time the aim of balanced regional growth

14
Plan and Period Description
• This gave special emphasis on women and children’s welfare. The most significant event was the establishment of the Department of Social Welfare in the country in 1964
• In social welfare, the largest share was provided for expanding rural welfare services and condensed course of education
• Laid down a set of ‘national minimum’ for the standard of living focused on food, work, educational opportunity, health and sanitation facilities, housing, and the minimum level of income
Fourth Five Year Plan (1969-74)
• This plan focused on growth with social justice and equality • Focus was on creating employment and providing a ‘national minimum’ to people
and emphasized weaker sections of the society • Family planning was touched upon for the first time during this plan. It also gave
special attention to the need of the destitute children
Fifth Five Year Plan (1974-79)
• The plan had a major focus on poverty alleviation, leading to the ‘Twenty-point Programme’ of the government
• Proposed to achieve two main objectives: removal of poverty (Garibi Hatao) and attainment of self-reliance
• The price wage policy was initiated to mitigate the effect of the high rate of inflation on wage earners
• Promotion of high rate of growth, better distribution of income, and significant growth in the domestic rate of savings were key instruments
• Several new programmes were launched; important among them was Integrated Child Development Scheme (ICDS) launched in 1975. There was also a National Policy on Children developed in 1974 and National Children Board was consequently set-up
Sixth Five Year Plan (1980-85)
• The plan focused on decreasing poverty and unemployment. Schemes such as Training of Rural Youth for Self-Employment (TRYSEM) that provided slack season unemployment were introduced
• Poverty alleviation was given priority and Integrated Rural Development Programme, National Rural Youth Employment Programme, and Tribal Rural Youth for Self-Employment scheme were launched
• The focus was on improving the quality of life of people with special reference to economically and socially weaker sections, through a minimum needs program
• Special Programme for Women and Children (SPWC) launched in 1983
Seventh Five Year Plan (1985-90)
• Growth, modernization, self-reliance, and social justice were the guiding principles for this plan
• Decentralization of planning and public participation in development was emphasized. There was also a focus on alleviation of poverty and reduction in interclass, inter-regional, and rural-urban disparities
• The Jawahar Rojgar Yojana (JRY) was launched in 1989 to create wage employment for the rural poor

15
Plan and Period Description
• National Literacy Mission was launched in 1988
Eighth Five Year Plan (1992-97)
• The decentralization of planning happened, with the 73rd and 74th Constitutional Amendment Act bringing Panchayati Raj under the constitutional mandate
• An increased thrust was on the social sector- education and healthcare • The plan created facilities for universalization of elementary education, health for
all by the year 2000, mid-day meal program was also launched in August 1995 • It attempted to accelerate economic growth and thereby improve the quality of life
of the people • Mandal Commission recommended affirmative action of reservation for OBCs,
which was introduced along with existing reservation for SC and ST groups
Ninth Five Year Plan (1997-02)
• The plan focused on “Growth with Social Justice & Equality “ • There was a renewed emphasis on ‘social’ objectives and basic minimum services
such as safe drinking water, primary health services, universalization of primary education, and nutrition support to certain groups
Tenth Five Year Plan (2002-07)
• The plan set-up ‘monitorable targets’ for development, including a reduction in gender gaps in literacy, wage rate, access to potable drinking water, etc.
• State-wise break up of targets and growth was done to ensure balanced development of all states
• National Rural Employment Guarantee Act, 2005 was approved and implemented in the form of the National Rural Employment Guarantee Scheme (NREGS)
• Social and economic empowerment of women and gender justice were also focused on
Eleventh Five Year Plan (2007-12)
• The plan focused on several interrelated components such as rapid growth, reducing poverty, creating employment opportunities, access to essential services in health and education, an extension of employment opportunities, environmental sustainability, and reduction of gender inequality
• The Right to Children to Free and Compulsory Education Act 2009 was also enacted and launched during this period
Twelfth Five Year Plan (2012-17)
• The broad aims of this plan were to achieve “Faster, Sustainable and more inclusive growth”
• The plan aimed towards the betterment of the conditions of SC, ST, and OBC and minorities
• Focused on generating at least 50 million employment opportunities for youth, eliminating gender and social gaps through welfare measures
• The 14th Finance commission set-up in 2015 recommended devolution of a higher share of taxes from the centre to states, thereby enabling the states to play a greater role in development at local levels based on their needs
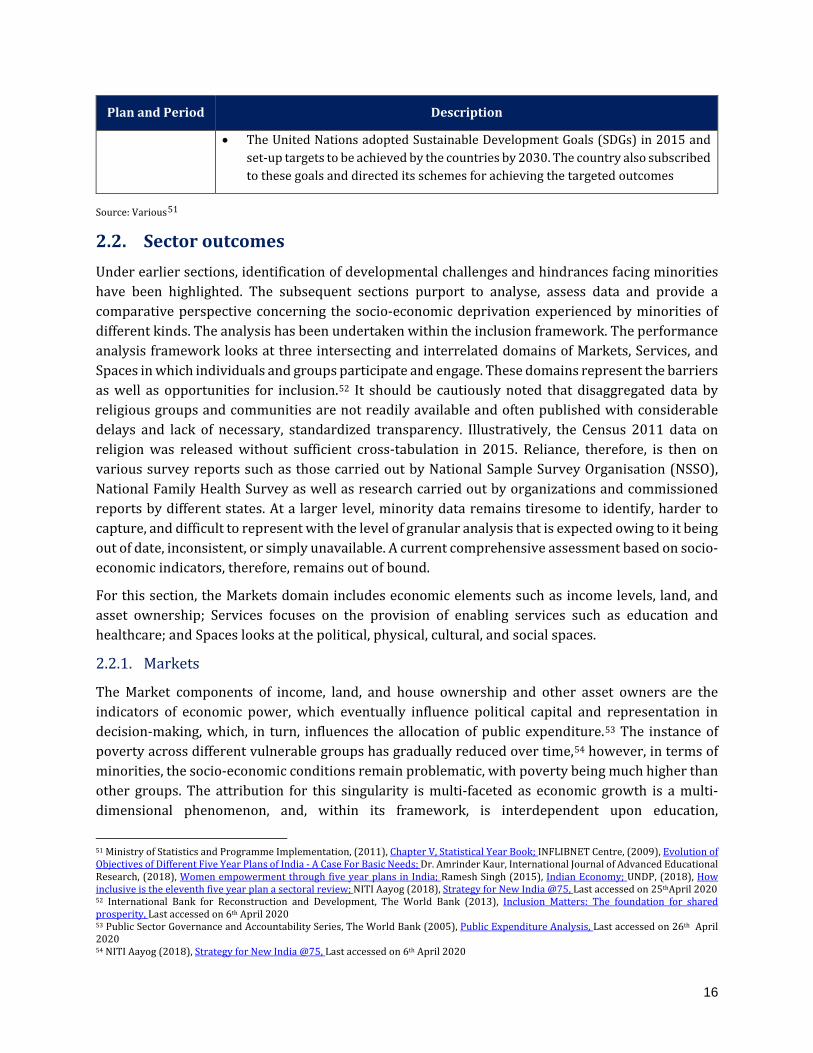
16
Plan and Period Description
• The United Nations adopted Sustainable Development Goals (SDGs) in 2015 and set-up targets to be achieved by the countries by 2030. The country also subscribed to these goals and directed its schemes for achieving the targeted outcomes
Source: Various51
2.2. Sector outcomes Under earlier sections, identification of developmental challenges and hindrances facing minorities have been highlighted. The subsequent sections purport to analyse, assess data and provide a comparative perspective concerning the socio-economic deprivation experienced by minorities of different kinds. The analysis has been undertaken within the inclusion framework. The performance analysis framework looks at three intersecting and interrelated domains of Markets, Services, and Spaces in which individuals and groups participate and engage. These domains represent the barriers as well as opportunities for inclusion.52 It should be cautiously noted that disaggregated data by religious groups and communities are not readily available and often published with considerable delays and lack of necessary, standardized transparency. Illustratively, the Census 2011 data on religion was released without sufficient cross-tabulation in 2015. Reliance, therefore, is then on various survey reports such as those carried out by National Sample Survey Organisation (NSSO), National Family Health Survey as well as research carried out by organizations and commissioned reports by different states. At a larger level, minority data remains tiresome to identify, harder to capture, and difficult to represent with the level of granular analysis that is expected owing to it being out of date, inconsistent, or simply unavailable. A current comprehensive assessment based on socio-economic indicators, therefore, remains out of bound.
For this section, the Markets domain includes economic elements such as income levels, land, and asset ownership; Services focuses on the provision of enabling services such as education and healthcare; and Spaces looks at the political, physical, cultural, and social spaces.
2.2.1. Markets
The Market components of income, land, and house ownership and other asset owners are the indicators of economic power, which eventually influence political capital and representation in decision-making, which, in turn, influences the allocation of public expenditure.53 The instance of poverty across different vulnerable groups has gradually reduced over time,54 however, in terms of minorities, the socio-economic conditions remain problematic, with poverty being much higher than other groups. The attribution for this singularity is multi-faceted as economic growth is a multi-dimensional phenomenon, and, within its framework, is interdependent upon education,
51 Ministry of Statistics and Programme Implementation, (2011), Chapter V, Statistical Year Book; INFLIBNET Centre, (2009), Evolution of Objectives of Different Five Year Plans of India - A Case For Basic Needs; Dr. Amrinder Kaur, International Journal of Advanced Educational Research, (2018), Women empowerment through five year plans in India; Ramesh Singh (2015), Indian Economy; UNDP, (2018), How inclusive is the eleventh five year plan a sectoral review; NITI Aayog (2018), Strategy for New India @75, Last accessed on 25thApril 2020 52 International Bank for Reconstruction and Development, The World Bank (2013), Inclusion Matters: The foundation for shared prosperity, Last accessed on 6th April 2020 53 Public Sector Governance and Accountability Series, The World Bank (2005), Public Expenditure Analysis, Last accessed on 26th April 2020 54 NITI Aayog (2018), Strategy for New India @75, Last accessed on 6th April 2020

17
employment, health, and nutrition, among other abstracts such as societal harmony, accessibility to social groups, and institutions.
● Income and incidence of poverty
Figure 4: Incidence of poverty across minority groups (in %)
Source: Amit Thorat (2013), Religious Communities in India: A Development Profile and KPMG Analysis Note: Other categories include Zoroastrianism, Bon, Judaism, Sanamahism, Kirat Mundhum, Sarna sthal, Animism, etc.
Looking at the rural poverty figures, the incidence of poverty amongst minorities is higher for the Buddhists, Zoroastrians, and Muslims and lowest for Christians, Sikhs, and Jains. In terms of urban poverty, Muslims have the most incidence of poverty followed by Buddhists. The problems of access to education, economic and social participation result in an institutionalized cycle of poverty, with limited space to manoeuvre out and move to the higher, more socially influential strata of society.
The Socio-Economic and Caste Census 2011 (SECC)55 was undertaken as part of the 2011 Census of India and was a significant step towards measuring the levels of deprivation across different caste groups in India. Since the 1931 Census of India, the SECC 2011 was India’s first caste-based census ever. In 2017, the SECC was accepted by the Government of India as the main reference point to identify beneficiaries and transfer funds for social schemes in rural areas in place of the ‘poverty line’ indicator, which was used as the basis earlier. The SECC data is used across all key programmes of the Ministry of Rural Development such as Mahatma Gandhi Employment Guarantee Act (MGNREGA), the National Food Security Act, and the Deen Dayal Upadhyaya Grameen Kaushalya Yojana. However, the SECC groups minorities in a vague ‘Other’ category, without the necessary disaggregation, resulting in a survey that patently excludes clarified socio-economic representation of 20 percent of the nation’s population from a necessary, mandated scrutiny to develop and calibrate policies.
Some of the key findings of the SECC 2011 concerning the vulnerable groups on their income deprivation were as follows:56
55Ministry of Rural Development, Government of India, (2011), Socio Economic and Caste Census, Last accessed on 25th April 2020 56Footnote 55
40.5
16.2
28.9
2.5
29.2
36.0
5.0
35.4
28.228.6
12.4
23.3
2..5
41.3
22.9
6.010.7
25.6
Buddhist Christian Hindu Jain Muslim Other Sikh Zoroastrian All groups
Rural Urban

18
— Almost 73 percent (17.97 crores) of India’s 24.49 crore households live in villages. 60percent (10.74 crores) of these rural households are considered to be deprived. SC/ST categories constitute 29.42 percent (5.29 crores) of the rural families.
— The monthly income of 74.5 percent (13.40 crores) of rural households is up to Rs. 5000 for their highest earner.
— 38.6 percent (6.8 crores) of rural households obtain a major share of their income from manual labour and are landless.
— The percentage of urban households that qualify as poor stands at 35 percent. — Manual scavenging engages 1,80,657 households as a means to their livelihood. Maharashtra has
63,713 manual scavenger households, which ranks it the highest amongst states, followed by Madhya Pradesh, Uttar Pradesh, Tripura, and Karnataka
The SECC 2011 throws significant light on the economic status of SC, ST, women, and PwD-led households but does not provide the necessary insight into minorities, an omission that requires course correction before the next exercise is undertaken.
2.2.2. Services
Equitable access to services is critical to achieving social inclusion. Education and health services play a critical role in enhancing human development potential. Access to transport services drives mobility, promoting access to opportunities. Access to clean water, sanitation and energy are key to maintaining a basic quality of life.
● Educational status
Education is considered to an incomparable agent of social change as education levels calibrate access to opportunities and economic power and also confidence within society and households.
Figure 5: Literacy rates of minorities (in %) (Census 2011)
Source: Census 2011 and KPMG Analysis
In terms of literacy, broadly, Jain, Christian, and Sikh have the highest prevailing literacy rates. Between the minority classifications, Jains have the highest overall literacy rate at 94.88 percent,
80.874.7
87.680.0
88.396.7
64.6
62.081.4
70.3
74.092.9
72.968.5
84.5
75.381.2
94.8
National Muslims Christians Sikhs Buddhist JainsMales Females Total
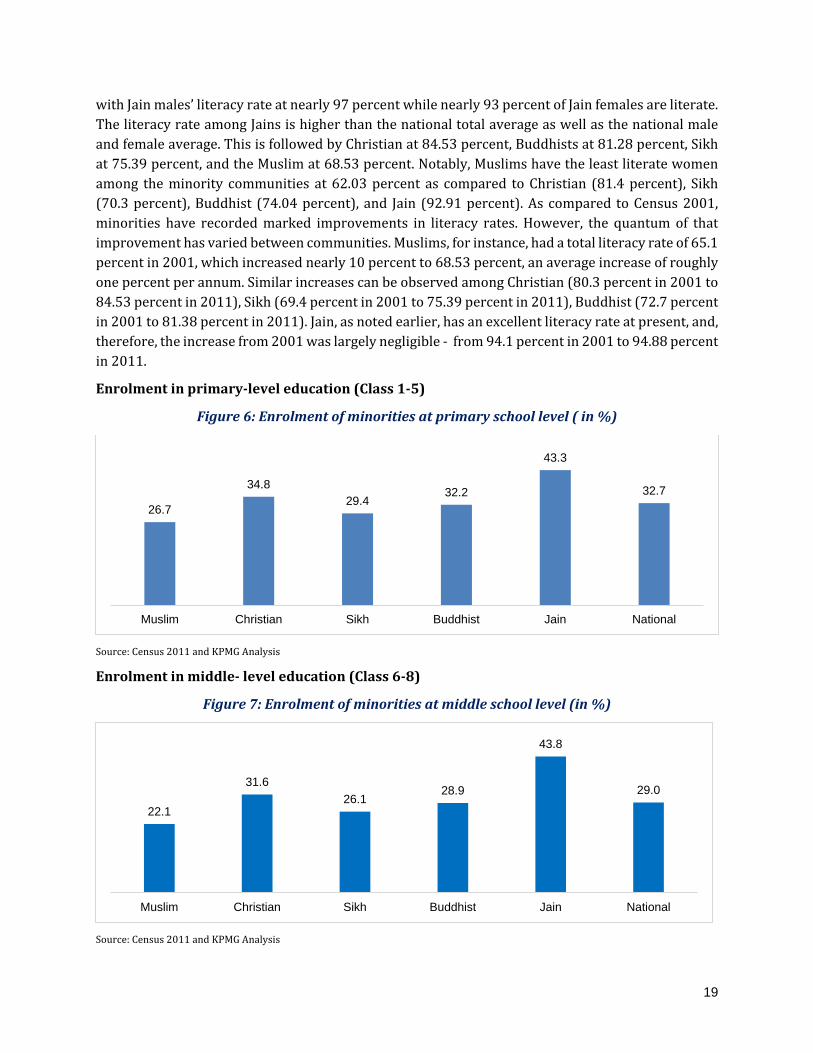
19
with Jain males’ literacy rate at nearly 97 percent while nearly 93 percent of Jain females are literate. The literacy rate among Jains is higher than the national total average as well as the national male and female average. This is followed by Christian at 84.53 percent, Buddhists at 81.28 percent, Sikh at 75.39 percent, and the Muslim at 68.53 percent. Notably, Muslims have the least literate women among the minority communities at 62.03 percent as compared to Christian (81.4 percent), Sikh (70.3 percent), Buddhist (74.04 percent), and Jain (92.91 percent). As compared to Census 2001, minorities have recorded marked improvements in literacy rates. However, the quantum of that improvement has varied between communities. Muslims, for instance, had a total literacy rate of 65.1 percent in 2001, which increased nearly 10 percent to 68.53 percent, an average increase of roughly one percent per annum. Similar increases can be observed among Christian (80.3 percent in 2001 to 84.53 percent in 2011), Sikh (69.4 percent in 2001 to 75.39 percent in 2011), Buddhist (72.7 percent in 2001 to 81.38 percent in 2011). Jain, as noted earlier, has an excellent literacy rate at present, and, therefore, the increase from 2001 was largely negligible - from 94.1 percent in 2001 to 94.88 percent in 2011.
Enrolment in primary-level education (Class 1-5)
Figure 6: Enrolment of minorities at primary school level ( in %)
Source: Census 2011 and KPMG Analysis
Enrolment in middle- level education (Class 6-8)
Figure 7: Enrolment of minorities at middle school level (in %)
Source: Census 2011 and KPMG Analysis
26.7
34.829.4
32.2
43.3
32.7
Muslim Christian Sikh Buddhist Jain National
22.1
31.626.1
28.9
43.8
29.0
Muslim Christian Sikh Buddhist Jain National

20
Enrolment in secondary-level education (Class 9-10)
Figure 8: Enrolment of minorities at secondary school level (in %)
Source: Census 2011 and KPMG Analysis
Enrolment in higher secondary-level education (Class 11-12)
Figure 9: Enrolment of minorities at higher secondary school level (in %)
Source: Census 2011 and KPMG Analysis
At different levels of educational enrolment, the trend amongst minorities concentrates towards Jains, who, at every level, have a higher percentage of enrolment, at a much higher level than the prevailing national average, with the enrolment percentage never going below 40 percent. Similarly, both Christians and Sikhs have higher than average enrolment levels at the secondary (Christians 39 percent; Sikhs 37 percent) and senior secondary (Christians 37 percent; Sikhs 33 percent) levels, while Buddhist enrolment experiences a drop at the higher secondary level at nearly 32 percent as compared to 38 percent at the secondary level. (Figure 9)
At all levels, however, Muslim enrolment remains the lowest, with only 24 percent enrolment at the secondary level and 19 percent at the senior secondary level. Notably, the drop-out rate for Muslims
24.3
39.3 37.1 38.1
65.1
35.1
Muslim Christian Sikh Buddhist Jain National
19.3
37.733.1 31.9
70.1
29.1
Muslim Christian Sikh Buddhist Jain National

21
remains high. At the primary (Classes 1 to 8) level, the drop-out gap is in the negative for Haryana, Assam, Uttar Pradesh, Jharkhand, Uttarakhand, Madhya Pradesh, Jammu and Kashmir, Rajasthan, and Andhra Pradesh. At the senior secondary level (Classes 10 to 12), the gap remains negative in Delhi, Telangana, Haryana, Jharkhand, Uttar Pradesh, Gujarat, West Bengal, Jammu and Kashmir, Tamil Nadu, Uttarakhand, Assam, and Maharashtra.57 Error! Reference source not found. provides an overview of out of school children across different religions.
Minority communities: Drop-out rates and social exclusion
The high rate of drop-out remains a pressing concern with respect to the socio-economic mobilization of minorities. However, a study carried out by National Productivity Council (NPC)58 shows that across different states, the drop-out rates for minorities remain varied, with eight states namely Assam, Bihar, Haryana, Jharkhand, Maharashtra, Rajasthan, Uttar Pradesh, and West Bengal having the highest drop-out rates while states of Gujarat, Punjab, and Kerala having overall low drop-out for minorities. The factors that contribute to drop-outs also vary between different states, but primarily consist of poverty and/or low income; migration to another place for work; need to support the family; and early marriage, in case of female children.
Figure 10: Out of school children (religious group-wise) (in %)
Source: Handbook of Social Welfare Statistics 2018 and KPMG Analysis
57 Ministry of Minority Affairs (2017), GoI, Committee on the Establishment of Educational Institutions for Educationally Backward Minorities, Last accessed on 19th September 2020 58 Ministry of Minority Affairs (2017), GoI, Study to Find out the Reasons for High Drop-out Rates among all Minority Communities, Last accessed on 25th April 2020
2.732.97
1.95
4.43 4.344.58
1.521.77
1.061.26 1.33
1.06
2.973.13
2.54
All Rural Urban
Hindus Muslims Christians Others All

22
Figure 11: Factors contributing to school drop-out in selected states (in %)
Source: NPC Study and KPMG Analysis
Enrolment in higher education
Figure 12: Enrolment of minorities in higher education (in %)
Source: Census 2011 and KPMG Analysis
At the higher education (graduate) level, Jain and Christian minorities have the largest share of enrolment, followed by Sikh and Buddhist. Notably, apart from Buddhist (10.7 percent) and Muslim (6.74 percent), the three other minorities perform higher than the national average (11.81 percent).
20
8590
55 52
19
9
32
90
22
5
29 26 26 25
14 12
4440
19 17 16
75 74
6051
12
21
47
13
75
31
20 11
27
82
4
Assam Bihar Haryana Jharkhand Maharashtra Rajasthan UttarPradesh
West Bengal Gujarat Punjab
Availability of Teachers Low Income/Poverty Migration of Parents/Family
Early Marriage for Girls Illiteracy of Parents Need to Support Parents
6.7
16.212.8
10.7
43.4
11.8
Muslim Christian Sikh Buddhist Jain National

23
Figure 13: Percentage share in enrolment of Muslims and other minorities (in %)
Source: All India Survey on Higher Education (AISHE) 2018-19 and KPMG Analysis
The census data presented earlier highlights considerable educational gaps among minorities, with Muslims overwhelmingly experiencing the most deprivation in terms of accessing and maintaining themselves in formal education. At the higher education level, however, the gap has observed a decline with the Muslim community increasing its enrolment year-on-year (YOY) as compared to other minority communities, with enrolment percentage increasing from 4.48 percent in 2014-15 (1.9 percent for other minorities) to 5.24 percent in 2018-19 (2.32 percent for other minorities).
● Gender inequality
Equal access to women in resources and socio-economic participation remains a key driver for not just economic growth and prosperity, but also societal inclusion. While women empowerment has remained on international agendas and domestic priorities, gender inequality in all spheres remains severe in India, with women being subject to rampant discrimination, exclusion, and violence.59 In the context of minorities, the gendered perspective remains critical to ensure the enhancement of women’s participation in the workforce and dignity in society.
Women's access to money and credit
Figure 14: Minority women’s access to money and credit (aged 15-49) (in %)
Source: Ministry of Health and Family Welfare (2015-16), National Family Health Survey (NFHS-4), and KPMG Analysis
59 Renu Batra et al. (2016), Gender Inequality Issues in India, Advances in Developing Human Resources, Last accessed on 20th September 2020
4.4 4.6 4.9 4.8 5.2
1.9 1.9 2.2 2.2 2.3
2014-15 2015-16 2016-17 2017-18 2018-19
Muslim Other Minority Communities
41.9 39.3 41.2 41.9
57.7 65.654.0 44.5
66.959.5 55.6
69.7
41.3035.4
52.244.1 46.0 45.6
8.10 5.612.5
2.5 6.6 5.7
Hindu Muslim Christian Sikh Buddhist/Neo-buddhist Jain
Whohave moneythat theycan decidehow to use
Whohave bank orsavings accountthat theythemselves use
Whohave know ofa microcreditprogramme
Whohave takena loan from amicrocreditprogramme

24
Women's freedom of movement
Figure 15: Minority women’s freedom of access to go alone to places (aged 15-49)(in %)
Source: Ministry of Health and Family Welfare (2015-16), National Family Health Survey (NFHS-4), and KPMG Analysis
Women's participation in decision making
Figure 16: Minority women’s participation in decision making (aged 15-49) (in %)
Source: Ministry of Health and Family Welfare (2015-16), National Family Health Survey (NFHS-4), and KPMG Analysis
Access to finance, spatial mobility and decision-making are essential apparatuses of a dignified existence. In the case of women, they become crucial parameters to assess the levels of equality and equity that they have within the household, on a broader scale, in the particular ethnographic segment and on a large-scale, the society.
With respect to financing (Figure 14), Jain and Christian women have the most liberty with 69.7 percent of Jain women have a saving account and 65.6 percent having financial autonomy in terms of expenditure. Similarly, 66.9 percent of Christian women have their own bank/savings account. Christian women are the most aware of micro-credit programmes at 52.2 percent. In all four financial autonomy indicators, Muslim women have the lowest participation, with 39.3 percent possessing
44.459.6
58.972.7 77.3
41.1
52.456.3
74.172.5
39.149.9
52.763.1
60.6
3242.4
48.458.3
56.3
7.7 4.6 4.5 3.5 1.9
Muslim Christian Sikh Buddhist/Neo-Buddhist Jain
The market The health facility Places outside the village/community All three places Not allowed to go to any of the three places
72.8 81.2 8283.3
8272.1
82.3 73.178.9
83.271.7
82.879.3
86.6 82.7
60.471 67.4 72.9 71.1
17.79.2 11.7 9.3 8.9
Muslim Christian Sikh Buddhist/Neo-Buddhist Jain
Own healthcare Making major household purchasesVisits to her family/relatives Participation in all three decisionsParticipation in none of the three decisions

25
financial autonomy and 44.5 percent having a bank account. In terms of intra-minority comparison, Sikh women have the lowest percentage in terms of borrowing from the micro-credit programme.
In mobility (Figure 15), Buddhist women have the largest latitude, with 58.3 percent being allowed to go to the market, health facility, and places outside the village/community alone, followed by Jain (56.3 percent) and Sikh (48.4 percent). Jain women also have the lowest instance of complete restriction with only 1.9 percent of women stating they were not allowed to go to any of the three places unaccompanied. Muslim women have the highest percentage of non-access, with 7.7 percent women not being allowed to go to any of the three places and 32 percent women being allowed to go to all three places, as compared to Christian (42.4 percent), Sikh (48.4 percent), Jain (56.3 percent) and Buddhist (58.3 percent).
In decision-making (Figure 16), Buddhist women have the largest share of being able to participate in all three decisions i.e., healthcare, major purchases, and visits to relatives, at 72.9 percent, followed by Jain women (71.1 percent) and Christian women (71 percent). Both Sikh and Muslim women enjoy limited comparative liberty, with 57.4 percent Sikh and 50.4 percent Muslim women participating in all three decision-making activities. Muslim women have the lowest decision-making participation with 17.7 percent of women not being permitted to engage in and arrive at a decision in all three spheres, followed by Sikh (11.7 percent) and Buddhist (9.3 percent).
Participation of women in decision-making and financial and social autonomy of women is critical to development, as growth should be agnostic and not contingent upon gender. The socio-economic conditions of women and institutionalized discrimination deprives them of financial, social, health, and sexual autonomy, leading to psychological trauma and physical hardship, and, in many cases, death owing to spousal or social violence.60 Among minorities and other vulnerable groups, women empowerment remains a substantial gap that requires redressal, particularly, as noted above, in the case of women belonging to Muslim backgrounds, wherein subjugation and lack of liberties remain persistent and result in multi-dimensional deprivation.61
● Healthcare status
Figure 17: Under-five Mortality Rate (U5MR) per 1000 live births in minorities (in %)
Source: Ministry of Health and Family Welfare (2015-16), National Family Health Survey (NFHS-4), and KPMG Analysis
60 Khatidja Chantler (2018), Muslim women and gender based violence in India and the UK, Critical Social Policy, Last accessed on 21st September 2020 61 Saumya Verma (2019), Muslim Women in India: A Struggle for Dignified Existence, Amity International Journal of Juridical Sciences, Last accessed on 21st September 2020
49.9
32.2 34.9 34.4
57.1
Muslim Christian Sikh Buddhist/Neo-Buddhist Other

26
The child mortality rates among minorities remain some of the highest among minorities but still better than the ‘others’ category, with the Muslim community having the highest U5MR among the four identified minorities, and higher than the national average of India (49.7). While India has the highest under-five mortality rate in the world.62 with India missing its target of reducing its child mortality rate as set under the Millennium Development Goals by a considerable margin.63 The number of total stillbirths in India is the highest globally. The overall rate of stillbirths in India was 10 per 1000 total births. The increase in the number of stillbirths was positively associated with socio-economic deprivation indicators. These indicators include female illiteracy and prevalence of the caste and religious discrimination. Approximately nine percent of women reported that they chewed tobacco, which was causally related to an increase in the number of stillbirths. Despite India turning into an emerging market that is experiencing a rapid transition in the health sector, the disparity in risk of stillbirths continues to persist, depending upon the socio-economic status of women.64
The highest perinatal mortality rates65 are for the states of Uttar Pradesh, Chandigarh, and Chhattisgarh,66 with a PMR of 56.4, 48.7, and 48.2 respectively. The states with the lowest PMR include Kerala, Mizoram and Dadra, and Nagar Haveli.
● Nutritional status
Figure 18: Prevalence of anaemia in minority children of age 6-59 months (in %)
Source: Ministry of Health and Family Welfare (2015-16), National Family Health Survey (NFHS-4), and KPMG Analysis
62 World Bank, Estimates Developed by the UN Inter-agency Group for Child Mortality Estimation (UNICEF, WHO, World Bank, UN DESA Population Division ), Last accessed on 7th April 2020 63 World Health Organization, NCD Report, Burden: Mortality, Morbidity, and risk factors. Chapter 1, Last accessed on 25th April 2020 64 Bmj Open (2018), Stillbirth among women in nine states in India: rate and risk factors in study of 886,505 women from the annual health survey, Last accessed on 6th April 2020 65 Ministry of Health and Family Welfare (2015-16), National Family Health Survey (NFHS-4), Last accessed on 26th April 2020 66Ministry of Rural Development, Government of India, (2011), Socio Economic and Caste Census, Last accessed on 10th April 2020
27.925.3 27.5 27.6
30.529.9
18.6
27.6 27.8
22
1.7 0.9 1.2 1.6 0.4
59.5
44.8
56.3 5753
Muslim Christian Sikh Buddhist/Neo-Buddhist Jain
Mild Moderate Severe Any anaemia

27
The prevalence of anemia among children aged 6 to 59 months is a critical indicator of overall nutritional availability and the socio-economic condition of the family. The prevalence of anemia among minorities remains significant, with Muslims accounting for the largest prevalence of severe anemia at 1.7 percent and any anemia at 59.5 percent. In terms of the prevalence of any kind of anemia, however, all recognized minority groups suffer from it, with the lowest prevalence being observed among Christians.
Figure 19: Prevalence of anaemia in minority women (in %)
Source: Ministry of Health and Family Welfare (2015-16), National Family Health Survey (NFHS-4), and KPMG Analysis
The incidence of anemia remains substantial in women belonging to minority backgrounds, with all groups - Muslim, Christian, Sikh, and Buddhist/Neo-Buddhist - observing a 50 percent prevalence of any kind of anemia. Sikh women have the largest prevalence of mild anemia whereas Christian women have the largest prevalence, at 12.1 percent, of moderate anemia. The reasons for the extent of anemic prevalence range from lack of access to adequate nutrition and health care services to simply the lack of awareness of the consequences of being anemic. A similar trend was observed in the prevalence of anemia in children aged 6-59 months. The prevalence of anemia among women has been socially patterned and has been parallel to the wealth status, education status, and social status. Socio-economic inequalities67 continue to impact the anemia rate persistently.
2.2.3. Spaces
Social exclusion typically manifests in the form of denial of rights to access, represent or participate in physical, social, cultural, and political spaces, and this discrimination further reinforces the processes of exclusion through denial of dignity and basic human rights.
67 Balarajan YS, Fawzi WW, Subramanian SV; BMJ OPEN (2013), Changing patterns of social inequalities in anemia among women in India: cross-sectional study using nationally representative data., Last accessed on 26th March 2020
38.534.6
41 39.5
30.7
11.2 12.1 10.5 11.28.1
0.9 0.9 0.5 1 0.5
50.647.5
52 51.6
39.2
Muslim Christian Sikh Buddhist/Neo-Buddhist Jain
Mild Moderate Severe Any anaemia

28
● Political representation
The Constitution of India posits the democratic republic as being secular and socialist, therefore, discrimination based on religion and, as a corollary, bias in favour of religion by the State itself remain domains that, theoretically, are positioned as being out of bounds. However, in practice, political populism based on both caste and religion remains highly prevalent with concessions and possibilities routinely being promised.68 While detrimental to the constitutional spirit, such activities remain injurious to the well-being of minorities themselves. As noted in the earlier sections, religiously motivated voting and preferences driven by political sops lead to dissatisfaction amongst the minorities and inadequate representation in the decision-making sphere.69 Similarly, for minority communities, maintaining conformity with constitutional values of secularism itself remains a sensitive domain, leading to instances of social disarray.
“In minority politics, it does not present minority communities in a homogenized manner. We put forward the affluent minorities and ones that do not have any community representation, their demands are not met.”
- Social sector expert, Tata Institute of Social Sciences
“Muslims find it very hard to be heard in the political process even though their numbers are very large with them being more than a quarter of the population in some states. After the 2019 elections, only 5 percent of Indian MPs are Muslim, while they constitute 15 percent of the total population.”
- Social sector expert, Centre for the Study of Social Systems, JNU
● Personal Laws and discrimination
Historically, minorities, similar to vulnerable groups such as scheduled castes and tribes, have been subject to discriminatory practices, motivated by prejudice and antiquated notions of class and religion. The constitutional framework, through fundamental rights and other non-discriminatory articles, has attempted to whittle down discrimination and promote equality, equity and inclusiveness through a neutral approach towards religious identities and creed.
However, the legislative framework remains a sphere wherein ambiguous differentiation and homogenization hamper minority interests. The Hindu Marriage Act, 1955, mandates ceremonial marriage for recognition purposes. However, Sikh, Jain, and Buddhist communities have been deemed Hindu as per Explanation II provided for Article 25 (B) under the Constitution; the said communities are issued marriage certificates under Hindu personal laws, unlike Muslim, Christian, and Jain communities which are governed by separate personal laws. In the case of Sikhs, the Anand, Marriage Act, 1909, was amended in 2012 to separate the Sikh community from the Hindu Marriage Act and provide dedicated legislative recognition to Sikh marriages. However, except for Haryana, no state has framed rules for the said Act, and, in practice, it has become otiose. The artificial differentiations festered by the legislations not only invite selective deprivations but also invite injurious circumstances about matrimonial lives of minorities, such as in the case of the Indian
68 Alam M.S. (2020) Muslim Minorities in India: Trapped in Exclusion and Political Populism. In: Kaul V., Vajpeyi A. (eds) Minorities and Populism – Critical Perspectives from South Asia and Europe, Philosophy and Politics - Critical Explorations, vol 10., Last accessed on 15th November 2020 69 Sony Pellissery (2016), Minorities, Democracy and Capitalism, Centre for Study of Social Exclusion and Inclusive Policy National Law School of India University, Last accessed on 19th September 2020

29
Divorce Act, 2001, which prohibits marriage ceremonies for Christians if one party is non-christian, restricting inheritance, alimony and property ownership for inter-faith couples.
● Exclusion from affirmative action
The designated and constitutionally recognized vulnerable groups of ‘Scheduled Castes and Tribes’ remain a continuous priority for affirmative action through state mechanisms and judicial pronouncements. However, the sections of the society that partook in religious conversion to detach themselves from stigma and prejudice remain excluded from socio-economic benefits offered by affirmative action policies. Paragraph 3 of The Constitution (Scheduled Castes) Order, 1950,70 limited the classification of scheduled castes to only Hindus, a factum which was later expanded to include Sikhs in 1956 and Buddhists in 1991. However, it continues to exclude Dalit communities that have converted to Islam or Christianity, resulting in non-access to mobilization benefits. Unlike scheduled tribes, the scheduled castes, therefore, have not been made religious-neutral, leading to exclusion, hardship, and contestation by minority religious groups and associations.71
In this regard, it is important to highlight what the National Commission for Religious and Linguistic Minorities (Ranganath Misra Commission) recommended in 2007:72
“…We recommend that Para 3 of the Constitution (Scheduled Castes) Order 1950 – which originally restricted the Scheduled Caste net to the Hindus and later opened it to Sikhs and Buddhists, thus still excluding from its purview the Muslims, Christians, Jains, and Parsis, etc. – should be wholly deleted by appropriate action to completely de-link the Scheduled Caste status from religion and make the Scheduled Castes net fully religion-neutral like that of the Scheduled Tribes.”
Notwithstanding the legislative and constitutional framework, the extent of exclusionary practices remains substantial and comprehensive, encapsulating not merely elements of society, but also institutions and organs of the State.
While the assessment of religion-oriented acts of discrimination and violence remains beyond the bounds of inquiry, the underlying nature of such instances constitute influential density and depth, as violence is merely one outcome of religious prejudice, and rather, the axiomatic differentiation which has been galvanized in the past few years undermine critical aspects of socio-economic development, leading not only to physical violence but also diminishing aspects of economic and social harmony.
3. Issues and challenges The quantum and category of interventions being implemented or executed by different stakeholders vary considerably, as domain-specific and/or large-scale social initiatives are usually undertaken by the state with private participation through NGOs, multi-laterals, etc., participating financially and/or technically assist certain initiatives. The following sections highlight key sector-level issues,
70 Ministry of Law (1950), GoI, The Constitution (Scheduled Castes) Order, Last accessed on 22nd September 2020 71 Padmanabh Samarendra (2016), Religion, Caste and Conversion: Membership of a Scheduled Caste and Judicial Deliberations, Economic & Political Weekly, Last accessed on 22nd September 2020 72 Ministry of Minority Affairs (2007), GoI, Report of the National Commission for Religious and Linguistic Minorities, Last accessed on 22nd September 2020

30
identification of interventions and remaining gaps, and a gap map synthesis to better understand the outstanding gaps analysis focuses on sector-level issues.
3.1. Gap analysis of sectoral issues The gaps analysis at the sector level focuses on a review of three key areas of welfare viz. enabling empowerment of minority groups, improving basic access to services, and creating opportunities for their advancement. The gaps and related interventions have further been categorised under markets, services, and spaces for better appreciation of the interventions under these by the various institutions and synthesis of gap map of the sector. The identified gaps at the sector level are as follows:
3.1.1. Denial of equal access to assets and employment opportunities (lack of opportunities)
According to the India Human Development Report of 2011,73 the deprivation of Muslim minorities is quite visible in terms of ownership of assets. Muslims and Buddhists are the poorest religious groups in the country (with 25 percent of their population falling in the poor category).74 According to NSS data of 2011-12,75 Muslims and Buddhists also record the lowest access to agricultural land. Further, most minorities lack ownership of assets and access to regular salaried jobs, because of which households move into casual wage labour. This is evident as 54 percent of Buddhists depend on casual wage employment; a major percentage of Muslim minorities are self-employed or engaged in traditional occupations. The 68th Round of the National Sample Survey revealed that Muslims recorded the highest proportion in terms of casual labour and self-employment as the dominant income source.76 The problems related to inclusionary aspects remain multi-dimensional for Muslims, as the differentiated treatment that is often meted out results in them not getting equal access to housing and prompting concentration of the Muslim population into fragmented, localized communities, often suffering from the infrastructural deficit.77 The difficulty in securing access to relevant housing accommodation, as a corollary, also invites hindrances for economic mobilization, leading to further socio-economic deficit.
3.1.2. Low levels of educational progress and limited opportunities for skill up-gradation (lack of opportunities)
Low levels of education and professional skills have led to a higher occurrence of employment in low-paying informal sector jobs among the minorities. The highest proportion of out of school children in the country belongs to Muslim minority groups (4.43 percent), followed by Christians (1.52 percent) and others (1.26 percent).78 As per the All India Higher Education Survey (AISHE),79 while state-wise, category-wise enrolment of Muslim vis-à-vis other minority communities has improved over the years, going from 4.48 percent (1.90 percent for other minorities) in 2014-15 to 5.24 percent (2.32
73 Institute of Applied Manpower Research, New Delhi, (2011), India Human Development Report: Towards social inclusion. Last accessed on 16th April 2020 74Ministry of Statistics and Programme Implementation (MOSPI), GoI, (2012), NSS Consumption Expenditure Survey, 68th Round, 2011-12., Last accessed on 17th April 2020 75 Footnote 74 76Footnote 74 77 Sukhadeo Thorat et al (2015), Caste and Religion Matters in Access Urban Rental Housing Market, Economic & Political Weekly, Last accessed on 25th April 2020 78Kapur, Avani and Iyer, Smriti, Sarva Shiksha Abhiyan (SSA) (2015), Sarva Shiksha Abhiyan (SSA) Budget Briefs 2015-16, Last accessed on 31st April 2020 79 Ministry of Human Resource Development, GoI (2019), All India Survey on Higher Education 2018-19 Last accessed on 25th April 2020

31
percent for other minorities) in 2018-19, the growth is limited and comparable to ST enrolment (5.5 percent). Even when compared to other vulnerable groups such as SC (14.9 percent) and OBC (36.3 percent), the enrolment trails behind. As a point of reference, the general category has been stated to have 43.3 percent enrolment in 2018-19.
Lack of facilities for up-gradation of skills and educational opportunities has led to lower WPR amongst most minorities.80 According to Census 2011,81 WPR amongst Muslims, Sikhs, and Jains was lower than the national average. Due to the high concentration of Muslim minorities in self-employment activities, they require access to adequate financing and credit, which is not very easily available, negatively affecting the sustainability of their livelihood. The socio-economic conditions of the Muslim minorities are highly impacted as a result of such financial exclusion.82
3.1.3. Poor access to healthcare
Muslims also lack access to other key services, thereby having poor indicators in areas of health and nutrition. In terms of under-five stunted children, 31 percent belong to the minorities and similar is the case of under-five underweight children.83According to the High-Level Expert Group appointed by the Planning Commission of India,84 religious minorities, amongst other marginalized communities, have a high risk for diseases apart from the probability of being excluded from health services. In minority concentrated areas, there has been a lack of adequate health care services - PHCs, Aanganwadi centres, safe drinking water, and drainage facilities, thereby making health conditions a matter of concern.85
“In states like Uttar Pradesh, Bihar, West Bengal there is a high drop-out rate due to poor health conditions, particularly in minorities. Most children are from BPL families and hence, their parents are unable to provide them with better facilities. Most of the children live in unhygienic conditions, and their parents also don’t pay attention to their children's health.”
- Social sector expert, National Productivity Council
3.1.4. Low representation in Parliament and State Assemblies (low empowerment)
From the first Lok Sabha (1952-1957) till the 17th Lok Sabha (2019-present), the percentage of Muslims in Lok Sabha averages at six percent as compared to the relative Muslim share in population, which is 11 percent at present. Additionally, from 1952 till 2019, the representation of Muslims in Lok Sabha has crossed the six percent mark only twice, once in the 7th Lok Sabha (1980-1984), which coincidentally was the highest share in history at nine percent, and then for the second time in 8th Lok Sabha (1984-1989) at eight percent. While Rajya Sabha fares comparatively better, with average representation since 1952 being pegged at 12 percent, the representation is suspected to be on a gradual decline, with seven percent representation in Rajya Sabha in 2019. Similarly, Muslim
80 Ministry of Minority Affairs, GoI, Press Information Bureau, New Delhi, (2015), Improvement of Economic Conditions of Muslims., Last accessed on 23rd April 2020 81Census 2011, Last accessed on 26th March 2020 82 Planning Commission, GoI, (2008), Eleventh Five Year Plan (2007–2012), Inclusive growth, Volume I, Last accessed on 25th April 2020 83Ministry of Health and Family Welfare 2017, Last accessed on 10th January 2020 84 Planning Commission, Public Health Foundation of India, (2011), High Level Expert Group Report on Universal Health Coverage for India., Last accessed on 7th February 2020 85Ministry of Minority Affairs, GoI, (2017). Impact Assessment of MsDP in India, Last accessed on 6th March 2020

32
representation in various state assemblies has reduced from eight percent in 2014 to seven percent in 2018.
While the reasons for low representation and disparity are subjects of a complex psephological inquiry, the spatial distribution, along with the first-past-the-post (FPTP) electoral system, has been highlighted by scholars as being key hindrances in achieving greater representation equity. 86 The alternative method of proportional representation (PR) was considered perilous by the Constituent Assembly, owing to the erstwhile demographic profile of the country, with illiteracy being cited as the reason for adopting FPTP rather than PR, with the assumption being that given the circumstances the FPTP system would ensure better representation as compared to the PR system. However, the weaknesses of FPTP have become evident with successive elections across assemblies and Lok Sabha. Taking the disparity inducing vulnerability into account, the Law Commission had recommended a hybrid model, combining FPTP and PR, as far back as in 1997, with an additional 25 percent seats for PR while the existing FPTP system would continue to operate.87 The Commission arrived at this to ensure better representation and re-calibration of navigation to move the election dynamics away from majoritarian momentum. This was once again highlighted by the Law Commission in 2015,88 but no action regarding this has so far been officially taken by the government.
3.2. Intervention gaps at sector level Intervention gaps have been analysed through a review of key schemes and interventions by different Government, private and voluntary sector agencies and the remaining gaps despite the interventions.
3.2.1. Interventions by nodal Ministry
In 2007, the Minorities Division along with Waqf Unit moved out of the Ministry to form a separate Ministry of Minority Affairs (MoMA).
The figure presents the main objective and target beneficiaries of MoMA. The mandate of the ministry includes the formulation of overall policy and planning, coordination, evaluation, and review of the regulatory framework and development programmes for the benefit of the various groups.
MoMA is the nodal authority and ministry for initiatives, policy, and planning for minorities. The Ministry operates key schemes for the benefit of minorities under five broad heads of empowerment, namely educational, economic, infrastructure,
86 Adnan Farooqui (2020), Political representation of a minority: Muslim representation in contemporary India, India Review, Last accessed on 15th September 2020 87 The Law Commission of India (1997), 170th Report on Reform of Electoral Laws, Last accessed on 15th September 2020 88 The Law Commission of India (2015), 255th Report on Electoral Reforms, Last accessed on 15th September 2020
Figure 20: Key initiatives of the Ministry
Source: KPMG Analysis

33
special needs, and support to institutions. Under infrastructure, for instance, Pradhan Mantri Jan Vikas Karyakram or PMJVK (erstwhile Multi-sectoral Development Programme) is administered by the Ministry, promoting holistic development of minority concentrated areas (as per Census 2011). Under economic empowerment, the Ministry runs Seekho aur Kamao (Learn and Earn) which focuses on skill development to improve socio-economic indicators for minorities, among other schemes.
Apart from various developmental schemes, the Ministry promotes welfare through superintendence and operation of other associated entities such as The National Commission for Minorities. The Commission was established in 1992 and adheres to the UN Declaration as passed by the General Assembly in 1992.89 The Commission’s chief responsibility includes, but is not limited to, the development of minorities, promoting minority welfare, monitoring of constitutional and statutory safeguards as provided for the minorities as well as any other matter which may be referred to it by the Government of India.
Similarly, the National Minorities Development and Finance Corporation (NMDFC) was established in 1994 and operates under the aegis of the Ministry to support the economic development of vulnerable and backward sections within the minority communities. NMDFC is a public sector enterprise and operates on a not-for-profit basis to encourage minority development.
MoMA has its own budget for the implementation of various schemes, programmes, and initiatives. allocations to MoMA increased by 43 percent (2010-11 to 2014-15) and 27 percent (2014-15 to 2018-19). However, utilization of the budgetary allocations has remained challenging. The Ministry was allocated Rs. 4,700 crores for FY 2018-19, out of which the actual expenditure that was incurred was Rs. 3,853 crores or 81.98 percent, and the unutilized funds totaling Rs. 851 crores were surrendered by the Ministry. In FY 2019-20, out of the Rs. 4,700 crore budgetary allocation, the Ministry was able to utilize only Rs. 1,291 crores or 24.47 percent till October 2019, giving rise to concerns and questions by the Parliamentary Committee. 90
3.2.2. Interventions by other Central Ministries, State Governments
The focus on minorities, while a primary task of the Ministry, is supported and augmented by other government initiatives at the central level and departments for minorities established by various state governments. Notably, different states such as Andhra Pradesh, Bihar, Maharashtra, Uttar Pradesh, etc., have set-up the State Minorities Commission to support and encourage minority growth. As different states have differentiated concentration of minority communities, the budget allocation made by the state governments also varies; an analysis of the budgetary allocations made by seven states in FY 2017-18 highlights inconsistent allocations.91
3.2.3. Interventions by donors, multi-lateral/bi-lateral organizations
Among the multi-lateral and bi-lateral organizations (hereinafter referred to as donors), the interventions range from financial assistance for running focused programmes (to Central and state(s) governments), technical assistance, capacity development, monitoring and evaluation,
89 UNHR (1992), Declaration on the Rights of Persons Belonging to National or Ethnic, Religious and Linguistic Minorities, Last accessed on 25th April 2020 90 Ministry of Minority Affairs (2019), Standing Committee on Social Justice and Empowerment 2019-20, Last accessed on 25th April 2020 91 Rehnuma (2017) Minority Appeasement: Myth or Reality – A ground report on Minority Welfare in 7 States, Last accessed on 15th September 2020

34
and improving governance of the programmes and schemes. Donor(s), however, are consistently seen as influences through which government programmes, or those supported by the donors, can be effectively implemented while incorporating principles of good governance and technical expertise in the focus areas. Primarily, the interventions seek to address existing socio-economic gaps through targeted programmes focused on the vulnerable population groups.
3.2.4. Interventions by private and public sector (including CSR)
The Corporate sector has varying perspectives on how well they are promoting the diversity and inclusion agenda. Notably, the private sector adopts a class-agnostic approach towards vulnerable groups, that is to say, the stratified distinctions of scheduled caste, tribe, Muslim, Jain, etc., generally do not operate as guiding factors of inclusion and rather, the philosophy is that of diverse inclusion (whether gendered or not) of different backgrounds without a policy-driven preference for one over the other. However, the performance, insofar as inclusion is concerned, remains average, with gaps appearing in areas of both gender and class/group.
However, while the private sector has increasingly taken to adopting more inclusive policies and, as a corollary, focusing on recruitment towards marginalized groups such as scheduled caste and tribes. Minorities such as Muslims and others remain largely excluded in terms of participation. The gap is seriously pronounced at the senior level, with analysis indicating that out of all the directors and senior executives in the BSE 500 companies, only 2.67 percent or 62 out of 2,324 are Muslim. BSE 100 companies fare better, but not by a large margin, with only 4.60 percent Muslims in senior, executive, and management positions. In comparison to other vulnerable groups such as SC and STs, Muslims remain extremely deprived, even in urban areas.92
Furthermore, as per the Status of Corporate Responsibility report,93 over 70 percent of the businesses in India have less than one percent employees who are persons with disabilities. Out of the businesses surveyed, 53 percent had a male to female ratio of 10:1 or worse and only about 12 percent of the companies had a workforce of women that was more than 30 percent. The study covers 300 randomly selected private and public sector companies from the top 500 BSE listed companies and came to these conclusions after analyzing the Business Responsibility Reports of 253 private companies and 47 public sector companies.94 The Rights of Persons with Disabilities Act, 2016, mandates every government undertaking to appoint not less than four percent of PwDs. However, only three out of the 47 Public Sector Undertakings (PSUs) surveyed had three percent or more of employees with disabilities. In the top 200 companies it was found that, overall, women form 14 percent of the Board of Directors, which merely meets the mandatory requirement for a woman member in a Board (of 6-7 members). 135 of the surveyed companies had only one female board director.95
On the brighter side, on the issue of gender diversity and participation in the workplace, National Association of Software and Service Companies (NASSCOM), a leading industry body focused on catalyzing/developing the IT/ITES sector in India has been able to cover some ground. It claims, as
92 Naren Karunakaran (2015), Muslims constitute 14% of India, but just 3% of India Inc, ET Intelligence Group, Last accessed on 15th September 2020 93 Praxis, (2019), Status of Corporate Responsibility in India, Last accessed on 7th February 2020 94 Praxis, (2017),Status of Corporate Responsibility in India, 2017, Last accessed on 25th April 2020 95 Department of Empowerment of Persons with Disabilities (Divyangjan), Ministry of Social Justice and Empowerment, GOI (2016), Right of Persons with Disabilities Act, 2016, Last accessed on 26th March 2020

35
per its latest industry data, that 1.3 million women employees constitute more than 34 percent of the total IT/ITES sector workforce in India and more than 24 percent of women employees are in managerial positions. PwDs, however, constitute only one percent.96 Vedanta, a leading mining and metals player in the country, is looking to increase the representation of women in its workforce to 30 percent by end of 2020 from about 11 percent at present.97
The Private Sector in India also contributes in a major way to social development through CSR spending. As per KPMG’s annual India’s CSR Reporting Survey 2018,98 CSR spending by India’s largest firms (top 100 listed companies) in 2018 was Rs. 7,536.30 crores (around USD one billion). The CSR expenditure of these companies was 47 percent higher in 2018 than in 2014, the year when provisioning of at least two percent of net profits for CSR became mandatory for large private and public sector firms (turnover of Rs. 1,000 crores or a profit of over Rs. five crores in a year). There was, however, a significant drop in the number of projects implemented in 2018. 1,517 CSR projects were commissioned, lower than the 1,897 projects in 2016-17, indicating that companies have started more focused projects rather than spreading too thin. Companies in the energy and power sector led the overall CSR spending in India followed by those in the Banking and Financial Services Industry (BFSI).
CSR spending in 2018 was largely focused on education and healthcare sectors, which received 50 percent of all CSR spends at Rs. 3,893 crores and these sectors accounted for 60 percent of projects commissioned. Rural and environment-related projects were the next most preferred. Education, health, and rural development alone accounted for 65 percent of the total CSR spend in 2017-18 on all Schedule VII activities.
The expenditure on reducing inequality, which relates to promoting gender equity, setting up homes and hostels for women, orphans, and elderly, and measures for reducing inequalities faced by socially and economically backward groups, accounted for Rs. 525 crores or seven percent of all Schedule VII activities. During 2017-18, the CSR contribution to the Prime Minister’s Relief Fund or any other fund set-up by the Central Government for socio-economic development and relief welfare of the SC, ST, OBC, minorities, and women rose to Rs. 71 crores from only Rs. 2 crores in 2016-17. 96 percent of this total expenditure for welfare funds has been made by PSUs.
Companies used multiple channels to expend their funds towards CSR projects. 84 of the 100 companies surveyed implemented their CSR projects through a combination of direct implementation, their foundations, or through implementing partners. Close to 99 percent of the 100 companies surveyed successfully implemented their planned CSR policy, up from 55 percent in 2014-15. The survey also found that over 90 percent of companies have stand-alone CSR committees. These committees are run by independent directors, of which 64 percent include at least one woman. CSR activities for the majority of organizations centre around their geographical presence, with the idea being to develop associated regions through specially marked funds and initiatives.
96 NASSCOM (2019), Diversity and Inclusion, Last accessed on 23rd February 2020 97Economic Times, (2019), Corporate India tweaks variables for solving gender diversity equation, Last accessed on 25th February 2020 98 KPMG India (2018), India’s CSR Reporting Survey, Last accessed on 6th January 2020

36
3.2.5. Interventions by NGO, Voluntary Organisations and Other Charitable Institutions
The role of NGOs or third sector organizations in India has gained greater significance in recent decades concerning socially excluded groups. NGOs have witnessed a major proliferation in the number and seen a major expansion in their activities. These NGOs are providing a wide gamut of development services, working closely with the government and the private sector in implementing various programmes around advocacy and awareness building, literacy and education, livelihoods generation, community development, and capacity building. The NGOs, over the decades, have supported the creation of a vast social infrastructure for the economically weaker sections, women, children, and marginalized groups such as minorities, scheduled caste, and tribal communities.
Most NGOs in the country have largely focused on developmental activities at the grass-root level and, in many cases, have also tried to fill in the gap where government institutions and departments have failed in reaching highly marginalized groups with essential services like education and healthcare. Over the years, the participation and engagement of NGOs across different sectors have exponentially increased and as per the Government, over 12,000 NGOs are working in the sector of minority issues towards the upliftment and development of minorities.99
Some of the key NGOs and research organizations in India that are creating impact specifically for the upliftment of minority groups through grass-roots engagements, research, and awareness initiatives include:
• Indian Minorities Economic Development Agency (IMEDA) is a not-for-profit organization focusing on skill development, employment, and opportunity generation for individuals, communities, and associated stakeholders. It aims to bridge the gaps of communication and assistance between economic opportunity and stakeholders to economically empower minority youth and promote development. 100
• Aga Khan Foundation, founded in 1967, is a leading international group of not-for-profit agencies working towards sustainable development and socio-economic upliftment of marginalized communities in a multi-dimensional manner, including preservation of culture, heritage, architecture, and so on. 101
• Minority Rights Group International (MRG) was founded in 1969 and works internationally to defend, preserve and support the rights, entitlements, and culture of disadvantaged minorities and ethnic groups. The organization conducts socio-economic training, skill development, educational initiatives as well as provides legal support and media awareness through publications to safeguard the rights of minorities around the world. The organization enjoys consultative status with the United Nations Economic and Social Council (UN-ECOSOC) and observer status with the African Commission for Human and Peoples’ Rights. 102
• OXFAM India: It is a leading international NGO implementing a programme ‘By the People’, which is a four-year long project supported by the European Union (EU) and aims to address challenges that the marginalized communities majorly face, such as lack of access to basic rights like food, health, education, forest rights, etc. OXFAM India supports 56 marginalized community-led
99 Government of India (2020), NGO Darpan, Sector 42: Minority Issues 100 IMEDA (2020), About us, Last accessed on 15th September 2020 101 Aga Khan Foundation, (2020), About us, Last accessed on 15th September 2020 102 Minority Rights Group International (2020), About us, Last accessed on 15th September 2020

37
organizations which are majorly run by Muslims, Scheduled Caste, and tribals across six states of India to fight against socio-economic exclusion.103
• Dr. K.R. Narayanan Centre for Dalit and Minorities Studies104 was established in 2005 at Jamia Milia Islamia and seeks to take a multi-disciplinary approach towards the study of scheduled castes and minorities to promote growth, inclusivity, public discourse and enable the social and economic upliftment of the marginalized groups.
• Tata Institute of Social Sciences (TISS) ‘Centre for Study of Social Exclusion and Inclusive Policies’: It is a centre that came into existence in 2007 intending to implement intellectual activities by teaching courses in social exclusion and social justice, maintain databases by collecting information on social exclusion, publishing research findings on social exclusion and social justice. UGC has now collaborated with this initiative and such centres are being created across various universities and colleges in India.105
• Indian Institute of Economic Growth (IEG) ‘Social Change and Social Structure Unit’: It is a research centre that primarily focuses on issues like social inclusion, exclusion, gender relations, social change, social structure, etc. This institute has been researching these issues since 1967 when it was a part of United Nations Educational, Scientific and Cultural Organization’s (UNESCO’s) Asian Regional Centre.106
3.2.6. Institution wise interventions at a glance
Different stakeholders holding differently powered positions, adopt varying approaches to social problems and their redressal. Apart from primary Central Ministries, other Central Ministries, State Governments, Donors, Private/CSR, and NGOs/voluntary organisations intervene to enable empowerment, improve access and create opportunities for minority groups. The key interventions in these gap areas are as follows:
103 Oxfam, (2016) By The People: Civil society organizations led by members of marginalized communities influencing governance processes for inclusive development Last accessed on 13th February 2020 104 Dr. K.R. Narayanan Centre for Dalit and Minorities Studies (2020), Introduction, Last accessed on 15th September 2020 105 TISS (2007), Centre for Study of Social Exclusion and Inclusive Policies, Last accessed on 7th February 2020 106 Prof. Amita Baviskar, Institute of Economic Growth, (2019) Social Change and Social Structure Unit, Last accessed on 19th February 2020

38
A. Enabling empowerment
Central Ministries State Governments/Departments Donors Private/CSR NGO/Voluntary Sector
Markets related
Min. of Minority Affairs
Intervention: Seekho aur Kamao (Learn & Earn) to promote skill development
Outcome: Greater employability and economic mobility of minorities
Min. of Minority Affairs
Intervention: USTTAD (Upgrading the Skills and Training in Traditional Arts/ Crafts for Development)
Outcome: Economic mobilization of traditional arts and culture to promote growth
Telangana State Minorities Finance Corporation (TSMFC)
Intervention: Under its aegis, TSMFC provides grant-in-aid through subsidies, loans, and skill development to economically empower minorities such as shops, vocations, enterprises, etc.
Outcome: Grassroot economic development of minorities through different endeavours and fields of work/occupation
Telangana State Christian (Minorities) Finance Corporation (TSCMFC)
Intervention: Similar to TSMFC, TSCMFC provides aid to construct churches, pilgrimages etc. and provides economic support for professional development
Indian Oil Corporation
Intervention: Supported Multi-Skill Development Institute in Digboi, focussing on marginalized, population
Outcome: Employment generation and opportunities for the marginalized
Bill and Melinda Gates Foundation
Intervention: Partnership for Women’s Empowerment and Rights (PoWER) initiative sought to target marginalized women farmers and families to increase their income and create market linkages
Outcome: Greater access and participation of farmer families to markets, economic upliftment

39
Central Ministries State Governments/Departments Donors Private/CSR NGO/Voluntary Sector
Outcome: Cultural, religious preservation and economic development of minorities
Services related
Min. of Minority Affairs
Intervention: Scholarship schemes across pre, post-matric levels
Outcome: Improving enrolment ratio of minority students across schools and reducing dropouts to improve educational indicators
Spaces related
Min. of Minority Affairs
Intervention: Hamari Dharohar – preserving minority culture and heritage
Outcome: Preservation and accumulation of arts,
Govt. of Odisha
Intervention: Bhima Bhoi Bhinnakshyama Samarthya Abhiyan in Odhisha is a comprehensive scheme for PwDs that seeks to organize Samrthya Sibirs for providing an integrated platform with a range of services such as issuance of certificates, selection for
UN Development Programme
Intervention:
Through Access to Justice Project, seeks to cultivate literacy regarding laws, rights and entitlements across marginalized
ITC Limited
Intervention: Women Empowerment Programme targets marginalized women living in extreme poverty by facilitating economic mobility through micro-
Butterflies India
Intervention: The Children’s Development Khazana (CDK) programme targets street children and children from underprivileged/impoverished backgrounds to help develop themselves as entrepreneurs by learning the fundamentals

40
Central Ministries State Governments/Departments Donors Private/CSR NGO/Voluntary Sector
crafts, languages, practices, etc. of minority communities as cultural totems to ensure continuity and longevity of traditional arts, crafts, and heritage
skill training, fitting of disability aids and appliances, etc., formation of SHGs
Group: PwD
Outcome: Holistic social support to persons with disabilities
Govt of Kerala
Intervention: Sayamprabha Home scheme, facilitates elderly care by providing day-care facilities in collaboration with local self-government institutions
Group: Senior Citizens
Outcome: Elderly care and support with community involvement to promote a better quality of life for the senior citizens
sections of the society
Outcome: Improved legal literacy, improvement of marginalized representation in the paralegal field, enhanced awareness of legal rights and entitlements
financing and entrepreneurship.
Outcome: Improved economic capacity of extremely marginalized women and households
of accountancy, banking and management, and knowledge of social and financial management.
Outcome: Development of discipline, knowledge, and basic financial literacy/skills in children, promoting formal schooling and economic participation

41
B. Improving access
Central Ministries State Governments/ Departments
Donors Private/CSR NGO/Voluntary Sector
Markets related
Min. of Minority Affairs
Intervention: Nayi Roshni – to develop leadership in minority women through capacity building and information dissemination
Outcome: Improved participation of women in various fields, development of confidence in community, and promotion of gender equality
World Bank
Intervention: Integrated irrigation and agricultural transformation project in Andhra Pradesh to uplift marginalized farmers and make them climate resilient by promoting sustainable practices and establishing green infrastructure
Outcome: Enhanced income, socio-economic participation, and reducing gender inequalities
Services related
Min. of Minority Affairs
Intervention: Jiyo Parsi – arresting declining population of Parsi community through holistic interventions
Asian Development Bank
Intervention: Urban services improvement
Mahindra Trust
Intervention: Nanhi Kali initiative to ensure girls from marginalized backgrounds are provided
HelpAge India Mobile
Intervention: Healthcare Unit

42
Central Ministries State Governments/ Departments
Donors Private/CSR NGO/Voluntary Sector
Outcome: Improving fertility rate for parsis and providing necessary social welfare to reduce the economic burden on economically backward households
Min. of Minority Affairs
Intervention: Pradhan Mantri Jan Vikas Karyakram (PMJVK)
Outcome: Comprehensive development of minority concentrated areas to improve facilities and access to services, WASH, etc.
project – clean piped water supply to households in Madhya Pradesh
Outcome: Better health and well-being, access to clean drinking water, and WASH promotion
UN Population Fund
Intervention: Samriddhi project in Madhya Pradesh seeks to impart educational, leadership, and gender perspectives to promote safety, hygiene, sexual well-being, livelihood among marginalized adolescent girls
Outcome: Reducing gender inequalities, greater access to social assertion for girls
with 10 years of formal schooling
Outcome: Reducing gender inequalities, improving access to formal schooling, and promoting inclusivity
(MHU) operates across all states, to provide the elderly (from marginalized communities) with primary healthcare facilities
Group: Senior Citizens
Outcome: Enhanced access to primary health care for persons living in rural/under-developed areas
Save the Children
Intervention: Operates Mobile Learning Centre (MLC) in Mumbai, to target out-of-school children, street children from marginalized communities
Outcome: Promoting learning for out-of-school children and improving enrolment

43
Central Ministries State Governments/ Departments
Donors Private/CSR NGO/Voluntary Sector
of marginalized children in formal schooling
C. Creating opportunities
Central Ministries State Governments/ Departments
Donors Private/CSR NGO/Voluntary Sector
Markets related
Min. of Rural Development
Intervention: Through DDUGKY train youth population across domains for livelihood and employment opportunities
Outcome: Skill development and employment for marginalized persons
Department for International Development
Intervention: Supported GROW Bihar to create a better investment climate for industrial, economic, and social growth
Outcome: Greater economic development of minorities and other marginalized groups owing to enhanced opportunities
Services related
Min. of Human Resource Development
Intervention: Kasturba Gandhi Balika Vidyalayas (KGBV) cover Educationally Backward Blocks (EBBs) with low
Katha Lab Schools
Intervention: Focuses to elevate marginalized youth and women by

44
Central Ministries State Governments/ Departments
Donors Private/CSR NGO/Voluntary Sector
female rural literacy, specifically targeting girls from marginalized backgrounds
Outcome: Improving female literacy in rural areas, reducing gender inequalities, and promoting inclusion
providing them with the training of skills and ideas to promote livelihood and employment generation
Group: SC, ST, OBC, Minority
Outcome: High-quality education for marginalized individuals, community development through engagements, and pioneering pedagogical methods leading to better educational outcomes

45
3.2.7. Remaining gaps in sector-level interventions
A considerable amount of progress has been made in terms of minority development and inclusion of minorities into the mainstream facets of society. However, despite the evolution, serious gaps of inclusion remain, with minorities being comparatively more susceptible to socio-economic deprivations, limited access, and discrimination. Some key issues identified with minority communities are:
• Lack of an integrated approach focused on the holistic development of minorities
Minority communities have extremely limited access to the formal sector, with the majority of Muslims being self-employed and/or engaged in informal, wage-driven sectors leading to poor financial inclusion and economic hardship.107 The socio-economic indicators of minorities lag behind that of other classes, with intra-minority disparities being severe, resulting in inadequate access to critical tools of social mobilization such as welfare asset, mechanisms of education, WASH, skill development, employment, financing; as well as access to credit and institutional outreach, among many others.108 There is a multitude of independent schemes and interventions focusing on a specific need area in a silo, without considering a holistic household view of the beneficiaries, in terms of coverage, saturation, and exclusions. Even government schemes across ministries that target beneficiaries for specific services, do not have an integrated view of the coverage of the beneficiary household in terms of other public or private schemes.
These targeted interventions, rather than being based on any scientific need gap assessment of the vulnerable groups or reliable baseline studies, tend to focus on the relative preferences of the agencies. For example, in the case of CSR-based interventions, it can be seen that these activities by the majority of the organizations tend to centre around their geographical presence, with the idea being to develop associated regions through specially marked funds and initiatives.
At a macro-level (across all agencies), it can be seen that the interventions are disproportionately focused on markets-related aspects (e.g. livelihood, employment, education & skill training, etc.), with a lower focus on services (health, social insurance, nutrition) and spaces-related aspects. This disproportionate focus in some areas of development while neglecting other areas, fails to effectively meet the all-round development needs of the vulnerable groups.
• Issues of religious identities and social cohesion
The issues of religious identities and social adjustment remain deeply seated within most minority communities in India. The aspect of adjusting religious identity harmoniously with societal values creates internal alienation and manifests in external conflict through aggression, violence, and similar expressions. Insecurity regarding the preservation of religious and ethnic identities through social customs, mores, and values leads to insularity, hampering integration into the mainstream folds of the society, leading to social and economic deprivations and strained relations with other communities, religions, and state agencies. The problems of asserting and maintaining identity are intensified owing to acts and instances of discrimination by other communities and religious identities, as perceived and experienced by minorities regarding food, culture, practices, and
107 H. Barbara, P. Aseem, (2010), Social Discrimination in India: A Case for Economic Citizenship, Oxfam India, Last accessed on 19th November 2020 108 Footnote 107

46
religious customs and values; giving rise to fear, social isolation, and apprehension about occupying the spatial bounds of the social fabric, at times, manifesting in physical acts of violence and turmoil.109 Furthermore, minorities themselves do not constitute a homogenous whole but rather formulate a fragmented set of factions, tracing their history through different periods and varying social lenses, resulting in intra-minority conflict and envy.
• Issues of inadequate representation in formal public and private spaces
Minorities form a fragmented coalition of different groups and communities. Within the larger group, different identities experience differing levels of deprivation and lack of access. Muslims, in particular, occupy extremely limited representative space in terms of formal publicly functioning organs in sectors of bureaucracy, judiciary, lawmakers, government officials.110 A similar case is with private participation in companies and organizations wherein participation of white-collar Muslims remains low, while informal, blue-collar, and wage-driven workers remain to fluctuate, leading to a significant portion of Muslims practicing hereditary vocations and existing outside of the formal socio-legal fold.
• Challenges of data and transparent information for welfare
At a higher level, the assessment of minority development and its dimensions are often stifled by the lack of availability of sufficiently disaggregated data.111 While certain states may have greater data availability regarding minorities than others, public domain macro-level data by government organs and machinery remain sparse, difficult to identify, and, with delayed publications, persistently remain under the risk of becoming antiquated. This cumulatively results in reliance on private investigations and inquiries into the status of minorities, hampering the ability of organizations, government machinery, and individuals to holistically assess the developmental trajectory of minorities.
3.3. Gap map synthesis of sector and CSS schemes A synthesis of sector-level objectives, key issues, schemes, and interventions, and their relative performance areas and next steps has been attempted below to identify the outstanding gaps and required interventions.
Table 3: Gap map synthesis of sector and CSS schemes
Gap map synthesis of sector and CSS schemes Objectives of the sector
Major issues Schemes addressing the issue
Scheme components intended to address the issue
Component performance
Way forward
Enhancement of Educational Outcomes
Low literacy, poor awareness of rights,
Scholarship Schemes, Naya Savera;
Supporting multi-level education, modernizing Madarsa
Women participation remains limited, multiplicities of
Scholarship recommendations as provided in the evaluation
109 Independent Advisory Group on Country Information, (2018), Country Policy and Information Note India: Religious minorities, Last accessed on 19th November 2020 110 Adnan Farooqui (2020), Political representation of a minority: Muslim representation in contemporary India, India Review, Last accessed on 15th September 2020 111 Ministry of Minority Affairs, (2019), Sachar Committee Report Recommendations, Last accessed on 19th November 2020

47
Gap map synthesis of sector and CSS schemes Objectives of the sector
Major issues Schemes addressing the issue
Scheme components intended to address the issue
Component performance
Way forward
entitlements and benefits
Sarva Shiksha Abhiyan, Improving Madrasa education
education, women’s hostels
scholarship schemes leading to logistical issues and problems
“Girls dropouts have significantly decreased. Those studying in private schools receive a scholarship of INR 5000 which has helped them to cut off the extra expenses like uniforms, books, etc. The parent's burden reduced, hence the dropouts decreased”
-Social sector expert, Association of Socio-Economic Empowerment of the Marginalized
may be considered
Improved Health and Wellness Services for the Minorities
Malnutrition, anemia, lack of healthcare and access to facilities, social violence, dwindling demographics of Parsis
Ayushman Bharat, Integrated Child Development Services (ICDS), Jiyo Parsi
Providing healthcare, supporting lactating mothers, increasing Parsi population
Health indicators of minorities, particularly Muslims remain troublesome and lag behind other minorities
Demarcated focus on minorities’ health and welfare through specific interventions rather than umbrella initiatives
Improved Access to Employment and Finance
High unemployment, informal occupations, low access to credit
Seekho aur Kamao; Nai Manzil; Upgrading Skill and Training in Traditional Arts/Crafts for Developme
Economic participation through the development of skills, inclusion into the formal sector through credit access, and capacity building
Participation in formal employment remains low, data is sparse and difficult to find, most Muslims engage in informal/vocational occupations
Increasing public office participation through affirmative action, tax incentives, and benefits may be considered to increase private

48
Gap map synthesis of sector and CSS schemes Objectives of the sector
Major issues Schemes addressing the issue
Scheme components intended to address the issue
Component performance
Way forward
nt (USTTAD), DDU-GKY, Micro-credit programmes
stakeholders’ interest and engagement
Better Infrastructure
Poor access to infrastructure, lack of services and facilities
PMJVK; Waqf Management
Holistic development of Minority Concentrated Areas (MCDs) and supervision/support in Waqf matters
Many MCDs remain undeveloped as per the Standing Committee Report, access to services and quality infrastructure is inconsistent and under-developed, Waqfs continue to have low revenues and limited engagement
PMJVK recommendations as provided in the evaluation may be considered
Enabling Culture Preservation, Enhancing Rights and Women Empowerment
Discrimination, violence, high levels of gender inequality
Nai Roshni; Hamari Dharohar; Kasturba Gandhi Balika Vidyalayas (KGBVs)
Gender equality through capacity development of women, preserving culture, arts and crafts, increasing girl child participation
Gender equality in minorities remains low with the Muslim community providing the least liberties and access as per NHFS-4, religion-oriented violence, discord, and discrimination remain persistent and unchecked
Specific focus on gender equality to empower women and reduce disparities, identification of problem areas, and utilizing community/CSO participation to improve indicators and inclusion
3.3.1. Diagrammatic representation of gap map synthesis
Infographic attempts at organisation and broad assessment of the spectrum of interventions through a color-coded gap matrix. It should be noted that that the analysis is not exhaustive, as, given the number of interventions, a comprehensive assessment would always be limited by time and resources. However, the matrix provides a macro overview of areas that require additional consideration and areas that are functioning as intended by overarching policies.

49
Table 4: Gap analysis of sectoral issues
Interventions gap map at sector level
Objectives of the sector
Major issues CS CSS State Schemes
Other interventions (e.g. multi-lateral, non-governmental organisations, policy, law, etc.
Enhancement of educational outcomes
Low literacy, poor awareness of rights, entitlements, and benefits
Improvement of health and wellness services for the minorities
Malnutrition, anemia, lack of healthcare and access to facilities, social violence, dwindling demographics of Parsis
Improved access to employment and finance
High unemployment, informal occupations, low access to credit
Better infrastructure
Poor access to infrastructure, lack of services and facilities
Enabling culture, preservation, enhancing rights, and women empowerment
Discrimination, violence, high levels of gender inequality
Legend
Satisfactory Average Needs improvement

50
4. Key recommendations • Lifecycle and sectoral approach towards addressing minority deprivations Minorities in India constitute 20 percent of the population, with differentiated socio-economic capacities, cultures, and varying degrees of inclusion into spheres of public and formal life. In other words, minorities are not a homogeneous entity and contain different social groups, occupying different geographical locations across the country. The general pattern of welfare-oriented interventions by different agencies - central ministries, state governments, multilateral and bilateral donors, private entities (CSR, trusts), and NGOs/voluntary sector indicates a generalized pattern focusing on market-related areas such as employment, livelihood, and skill training; with the lesser emphasis being extended towards services (including housing, health, water, transport, insurance, etc.), and spaces (social, political, cultural, etc.) segment, leading to lopsided results and inconsistent developments.
The approach towards interventions, therefore, requires calibration of design to firstly, apprise the nodal ministries of interventions and their consequent progress, and secondly, ministries and government entities could then distribute and equitably allocate resources and attention towards all three spheres of markets, services, and spaces. The said method, that of broad-based reach-outs rather than silo-based targeted policy manoeuvring, will result in a holistic, developmental approach towards social inclusion and social protection for the minorities.
It is further suggested to track the entire life cycle of required interventions for the different minorities and to identify the stages at which different areas of support are required (e.g. nutrition-related support for early life stages, education for children from primary schooling unto senior secondary, higher studies/skill education, linkage to livelihood opportunities/entrepreneurship support, old-age pensions, food, and other support, during old age, etc.), and ensure that interventions/schemes are designed to cater to these different stages.
“Women’s linkage with the market, up-gradation of the skills and proper wages, social security mechanism for the women working in biddi-making, jewellery making, and dye-making will lead to better wages, improve their standard of living and also better participation in democratic process of the country and thereby making them more empowered citizens.”
- Social sector expert, Bharatiya Muslim Mahila Andolan
“In any kind of a development activity that the state initiates, it should be implemented in a reverse hierarchy. Girls should be prioritised.”
- Social sector expert, Tata Institute of Social Sciences
There is also a requirement for a needs-assessment on the requirements as per the life cycle of support for any minority group and to design and deploy the interventions for the group accordingly. For example, the Muslim community observes the largest multi-dimensional deprivations, however, within the folds of the community itself, differentiated stratification exists. The Sachar Committee observed and highlighted three main layers: ashraf, ajlaf and arzal, with ashrafs being socio-economically well equipped, ajlafs being comparable to OBCs, and arzals being similar to lowest

51
castes.112 In such a scenario, if ashrafs face access issues relating to nutrition and well-being, supporting ashraf children, then, becomes the primary focus rather than a generalized intervention. It could be recommended to first map out interventions being rolled out by different departments and agencies for these minority populations, and based on the gaps identified, appropriate interventions may be designed, and appropriate agencies selected to implement these.
Another area of opportunity for the government and other key players involved in this sector is to make use of the Jan-Dhan, Aadhaar, and Mobile (JAM); JAM trinity has provided immense opportunities to effectively target and provide benefits to the households. The increased use of direct benefits transfers, which have grown in a very short time since its inception in 2013 to cover 426 schemes across 56 ministries amounting to more than INR 3891 billion of funds being transferred through DBT involving 27.45 billion transactions expected in 2020-21. However, with such rapid progress and underlying enablers for DBT, it would be pertinent to be able to track benefits arriving under different schemes at a household level.
To have an integrated view of social benefits delivery at the household level. Apart from building a common digital interface that can report on converged KPIs, there is also a strong need to rapidly map, and assess these schemes at the level of target beneficiary identification, scheme operations, and implementation, financial management, and scheme monitoring to identify the potential linkages and interlocks in these schemes.
This will enable the Government to focus on a set of benefits across the lifecycle of needs for a vulnerable household and ensure that interventions/ schemes are designed to cater to these different needs and stages (e.g. affordable housing, nutrition-related support for the maternal and early child, provision of food and cooking fuel, healthcare protection for the entire family, education/ higher studies/ skill education for children, linkages to livelihood opportunities/ entrepreneurship support for working population, and old-age pensions and social insurance for senior citizens).
The JAM trinity, which is being used for most of the Direct Benefit Transfer (DBT) schemes, provides immense opportunities to be able to track benefits arriving under different schemes at a household level.
— This will help in providing disaggregated data by households for benefits being realized
— It will help in assessing the eligibility and resulting uptake of benefits by the households
— Identify any pattern in the uptake of such scheme benefits by social groups/ geographical areas (villages, etc.).
— Based on the above data, there could be an identification of issues being faced by eligible beneficiaries/ households due to different reasons (non-functional accounts, lack of available services, etc.)
— In the long term, it would provide inputs for the redesign of the schemes in case the beneficiaries are not able to avail of the scheme benefits and to help to identify the areas for revision in the scheme guidelines.
112 P.S. Krishnan (2010), Understanding the Backward Classes of Muslim Society, Economic & Political Weekly, Last accessed on 21st September 2020

52
— Also based on need/identified gaps, newer schemes could be designed to be able to comprehensively provide required benefits to the targeted beneficiaries.
Overall, this approach will enable to saturate the benefits at a household level, identify missing beneficiaries, and also identify new areas of convergence and innovation to optimize administrative and financial resources required to reach the beneficiaries. Most importantly, economic and social wellbeing can be more effectively and holistically measured.
• Comprehensive minority database for identifying gaps, issues and promoting transparent analysis
— The availability of transparent and accessible disaggregated data remains a major lacuna concerning minority communities. Limited availability of categorized data not only hinders assessment, analysis, and discourse of developmental initiatives but leads to inefficiencies in the implementation of execution of policy decisions, with opaque functioning and limited transparency. Census 2011 data on religion-wise population, for example, was released only in 2015. The delays and lack of disaggregation obfuscate an understanding of ground-level challenges, and, as a consequence, strain resources that could otherwise be channelled elsewhere by organizations and institutions into conducting their surveys and analysis to better appreciate gaps and scenarios present.
— It is suggested, therefore, that at both central and state level, mechanisms to collect, report and provide disaggregated annually updated data on minorities may be utilized to provide timely and accurate development indices and realities for public consumption and stakeholder assistances. The mechanism can be established at a central level with de-centralized uploading and reporting of statistics, similar to how reporting for several centrally sponsored schemes are carried out, with the framework being devised collaboratively through civil society engagement to ensure inclusivity of sensitive indicators and indices.
“Beneficiary identification should be linked to SECC database and a social registry should be created that allows for regular updation. Such database has to be updated rapidly, both in terms of reducing exclusion errors.”
- Social sector expert, Centre for Policy Research
“Map pan India level indicators based on vulnerable groups, for implementation of schemes across states which will be helpful to improve the performance of the scheme.”
- Social sector expert, Tata Trust
Additionally, the Socio-Economic Caste Census (SECC) should be re-calibrated to focus on, in a disaggregated manner, minority communities, rather than classifying the said communities as ‘others’ in demographical assessments.

53
• Enhancing representation of Minorities in public positions — The diversity of demographics, particularly in terms of minorities and vulnerable groups, has
historically been inadequately represented in government positions and positions of power and social influence, such as policing and law-making. Despite the advancement over the years, minority representation in legislature remains poor, with declining participation across both state assemblies and Lok Sabha/Rajya Sabha. Regarding legislation, it is suggested that Proportional Representation (PR), as envisioned and recommended by the Law Commission in 1997 and then subsequently in 2015, may be utilized to promote and enhance the participatory representation of minorities in the legislature.
— Similarly, while the percentage of minorities in government jobs has increased from 5.3 percent in 2014 to 9.3 percent in 2017,113 minority participation in the police continues to remain poor. Police remains a critical state instrumentality and one that is rife with prejudice for minorities, vulnerable groups, and migrants, leading to injustice and violence.114 It is suggested, therefore, that enhanced recruitment of minorities into the policing framework should be carried out on a priority basis. Pre-training, awareness campaigns, and demarcated vacancy-filling drives for minority recruitment may be considered.
“Promote community participation and awareness generation to combat misconceptions -prejudices, biases through lectures, seminars. Booklets, social media”
-Independent expert
• Addressing minority development gaps through partnerships with minority religious institutions
The effectuation of developmental enterprise at a large scale remains a pressing challenge for governments as regardless of the welfare nature of the policy, resources, and capacities to implement and execute it remains limited. Furthermore, governance interventions are impersonal by nature and lack direct relationships with communities. Owing to this characteristic, the enterprises are often unable to penetrate sufficiently into the minority societies, resulting in trust deficits with potential beneficiaries and stakeholders. Across many minority religions, charity and philanthropy remain religious dictums and are conscientiously followed, with different minorities engaging in charity and social work through settled institutions.
It is suggested that a partnership ecosystem that employs religious institutions’ intrinsic reach and persuasive capacities in their respective communities and government welfare initiatives can be utilized to address developmental deficits at micro-levels within most vulnerable communities and sub-communities. In such a partnership, the logistical schematics can be developed by governance organs through necessary consultation and ground-level implementation can be greatly assisted by religious organizations in tandem with civil society and non-profit organizations for organized execution. There is enough evidence from the development world that the involvement and funding of local stakeholders are more effective, efficient, and sustainable as it enables services and benefits to reach the last mile. There is therefore a need for the Government to engage and work with them
113 See As stated by Union Minority Affairs Minister, Mukhtar Abbas Naqvi in the Rajya Sabha in 2017 114 Common Cause (2019), Status of Policing in India Report 2019, Last accessed on 22nd September 2020

54
more closely. The key to building the resilience of communities to economic and social shocks is building the leadership capacity of community-based organisations.
5. Conclusion India remains a land of multi-lateral diversities, encompassing different cultures, languages, heritages, religions, beliefs, values, and practices. Following liberalization in 1991, the socio-economic indices and capacities across the country have inclined, however, the impact in many respects has not been able to reach the most vulnerable of the society. Minorities of different kinds permeate the geographical boundaries, with most, observed in earlier sections, suffering from deprivations of different kinds – social, economic, political, and others.
While the constitutional and legislative frameworks endeavour to bring about representation and participation, a great many gaps across different sectors remain and are routinely experienced by marginalized minority communities placed differently across the social spectrum. In education, health, economic capacity, and representation, minorities of different kinds remain behind other groups and cumulatively, experience kaleidoscopic scarcity. At times, the alienation and differentiation manifest outwardly in forms of violence, commotion, and prejudice leading to crimes, community insurrection, and disorder wherein, at other times, a passive disenfranchisement is experienced at different junctures and fields, facilitated by deep-seated apprehension, wariness of beliefs, customs, and lifestyles of other communities and intra-communities.
In this regard, social inclusion and inclusivity remain high order priorities, necessary to shape the political, executive, and governance philosophies to enhance their ground-level effectiveness through a greater share in education, finances, and multi-lateral representation and participation. Allowing the society to develop and prosper in a manner wherein positive change does not become hamstrung to limited groups and identities and rather, is available, accessible, and experienced by all communities irrespective of their identities, affiliations, or belief systems.
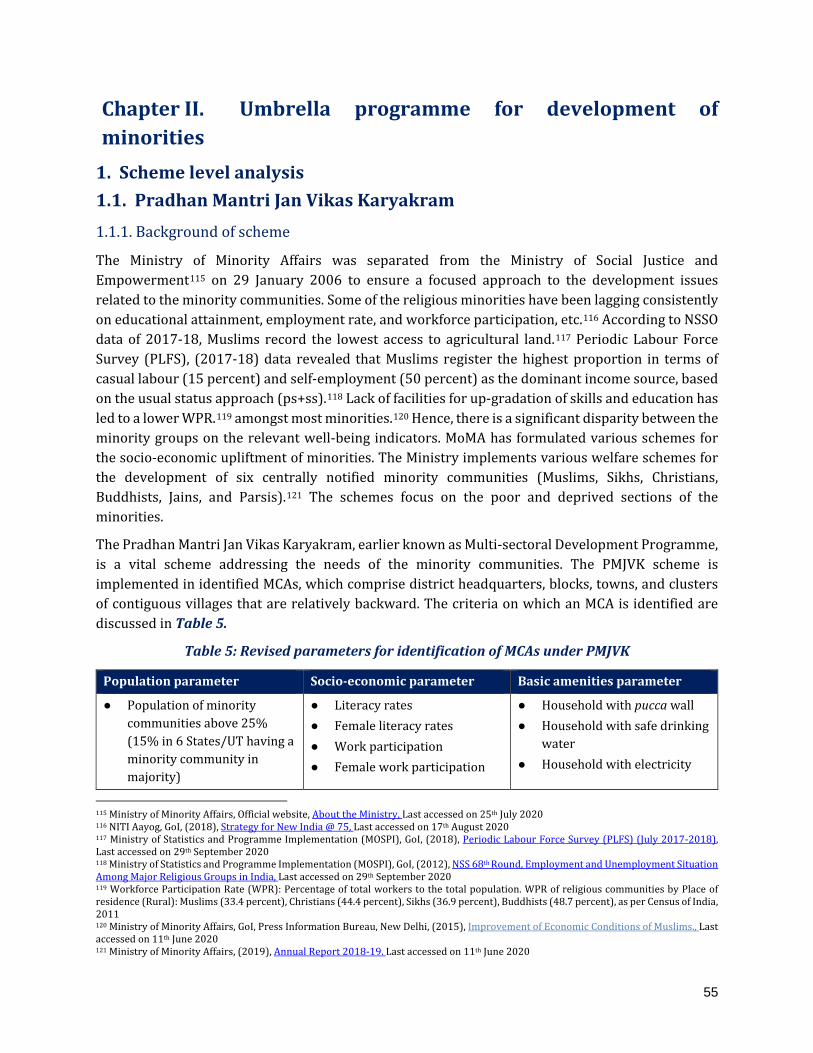
55
Chapter II. Umbrella programme for development of minorities
1. Scheme level analysis 1.1. Pradhan Mantri Jan Vikas Karyakram 1.1.1. Background of scheme
The Ministry of Minority Affairs was separated from the Ministry of Social Justice and Empowerment115 on 29 January 2006 to ensure a focused approach to the development issues related to the minority communities. Some of the religious minorities have been lagging consistently on educational attainment, employment rate, and workforce participation, etc.116 According to NSSO data of 2017-18, Muslims record the lowest access to agricultural land.117 Periodic Labour Force Survey (PLFS), (2017-18) data revealed that Muslims register the highest proportion in terms of casual labour (15 percent) and self-employment (50 percent) as the dominant income source, based on the usual status approach (ps+ss).118 Lack of facilities for up-gradation of skills and education has led to a lower WPR.119 amongst most minorities.120 Hence, there is a significant disparity between the minority groups on the relevant well-being indicators. MoMA has formulated various schemes for the socio-economic upliftment of minorities. The Ministry implements various welfare schemes for the development of six centrally notified minority communities (Muslims, Sikhs, Christians, Buddhists, Jains, and Parsis).121 The schemes focus on the poor and deprived sections of the minorities.
The Pradhan Mantri Jan Vikas Karyakram, earlier known as Multi-sectoral Development Programme, is a vital scheme addressing the needs of the minority communities. The PMJVK scheme is implemented in identified MCAs, which comprise district headquarters, blocks, towns, and clusters of contiguous villages that are relatively backward. The criteria on which an MCA is identified are discussed in Table 5.
Table 5: Revised parameters for identification of MCAs under PMJVK
Population parameter Socio-economic parameter Basic amenities parameter
● Population of minority communities above 25% (15% in 6 States/UT having a minority community in majority)
● Literacy rates ● Female literacy rates ● Work participation ● Female work participation
● Household with pucca wall ● Household with safe drinking
water ● Household with electricity
115 Ministry of Minority Affairs, Official website, About the Ministry, Last accessed on 25th July 2020 116 NITI Aayog, GoI, (2018), Strategy for New India @ 75, Last accessed on 17th August 2020 117 Ministry of Statistics and Programme Implementation (MOSPI), GoI, (2018), Periodic Labour Force Survey (PLFS) (July 2017-2018), Last accessed on 29th September 2020 118 Ministry of Statistics and Programme Implementation (MOSPI), GoI, (2012), NSS 68th Round, Employment and Unemployment Situation Among Major Religious Groups in India, Last accessed on 29th September 2020 119 Workforce Participation Rate (WPR): Percentage of total workers to the total population. WPR of religious communities by Place of residence (Rural): Muslims (33.4 percent), Christians (44.4 percent), Sikhs (36.9 percent), Buddhists (48.7 percent), as per Census of India, 2011 120 Ministry of Minority Affairs, GoI, Press Information Bureau, New Delhi, (2015), Improvement of Economic Conditions of Muslims., Last accessed on 11th June 2020 121 Ministry of Minority Affairs, (2019), Annual Report 2018-19. Last accessed on 11th June 2020

56
Population parameter Socio-economic parameter Basic amenities parameter ● Religion-specific socio-
economic and basic amenities indicators at the district /block/town
● Household with latrine facility (new parameter)
Source: MoMA (2019), Guidelines for implementation of PMJVK, Last accessed on 11 July 2020
The PMJVK scheme aims to improve the socio-economic conditions of the minorities and reduce imbalances in the identified MCAs by providing basic amenities for improving the quality of life. The projects taken up under PMJVK are related to the creation of infrastructure, primarily in the sectors of education, health, and skill development. Besides, innovative schemes such as Hunar Hub for improving the socio-economic and living conditions of minority communities are also being implemented that is centre funded non-gap filling projects to address the development deficits in the MCAs.122
In 2008-09, the Government of India launched an area development programme MsDP as a Centrally Sponsored Scheme under MoMA, as highlighted in Figure 21. The MsDP scheme was restructured in 2018 and henceforth implemented as "PMJVK" during the remaining 14th Finance Commission period, i.e. up to 2019-20.123 The restructuring of the scheme aimed to facilitate better reach, inclusive growth of minority communities, and to promote social harmony.
Figure 21: Journey of MsDP to PMJVK
Source: KPMG Analysis
122 PIB, GoI, (2018), Skill Development Schemes Through Selected Project Implementing Agencies, Last accessed on 11th June 2020 123 Ministry of Minority Affairs, (2019), Annual Report 2018-19, Last accessed on 11th June 2020

57
● Implementation arrangements
The implementation of MsDP/PMJVK scheme follows a bottom-up approach. It has been divided into four levels by creating committees that have been highlighted in Figure 22.
The project plans proposed by Block Level Committee are scrutinized at all levels from the district to the centre, before it reaches the Empowered Committee (EC) of PMJVK. Figure 23 provides functions of different committees and involvement in the approval of the project plan.
Figure 23: Role of different committees involved in plan approval and implementation
*Screening Committee- A committee at the ministry level headed by the Additional/Joint Secretary that screen the proposals sent by the State Level Committee (SLC) and then submits them to the EC.
Source: Footnote 124
● Sample characteristics
The present evaluation of the scheme is based on both primary and secondary research. The sample size considered for the minority groups is 608, spread across Assam, Bihar, Uttarakhand, Odisha, Punjab, Kerala, Maharashtra, and Telangana.
Source: MoMA (2019), Guidelines for implementation of PMJVK
Figure 22: Broad institutional structure of PMJVK

58
Figure 24 presents the profile of the minority households covered for the survey under PMJVK. The majority of the respondents belonged to the annual income category of below Rs. 1 lakh per annum. The majority of the respondents lived in semi-pucca houses 18 percent of the households did not have access to toilets, and 20 percent of the households lacked drainage facilities. In terms of respondents’ religious background, Muslim formed the dominant respondents compared to other minority groups.
Figure 24: Household profile of the target group for evaluation of PMJVK (in %) (N=608)
Source: KPMG Primary Data
63%
20%
6%
10%
1%
Less than Rs 1 lakh
Between Rs 1 lakh to Rs 1.5 lakhs
Between Rs 1.5 lakhs to Rs 2 lakhs
More than Rs 2 lakhs
Refused to answer
Annual Household Income
Open kutcha 32%
Open pucca 22%
Underground 12%
No drainage
26%
Type of Drainage
Pit 33%
Septic tank/flush
system 49%
No toilet 18%
Type of Toilet
Kucha 26%
Semi - pucca 44%
Pucca 30%
Type of House
Yes 29%
No 71%
Ownership of Agriculture Land
Islam 71%
Christianity 20%
Other 1%Religion followed
Yes 12%
No 88%
Differently Abled

59
Figure 25 represents the profile of the respondents. The majority of the respondents belonged to 21-30, 31-40, and 41-50 age groups, with similar numbers in each of these age brackets. It may be noted that a significant proportion of the respondents was illiterate (21 percent). Among the literates, the majority of the respondents (24 percent) were studying in Class 9-10. In terms of economic activity, the majority of the respondents were daily or non-wage workers. Agriculture and allied activities were reported to be the dominant occupation sector. Also, the majority of the respondents were main workers who had worked for more than six months till last year. 91 percent of the total sample also reported that they have a bank account.
Figure 25: Respondent profile of the target group for evaluation of PMJVK (in %) (N=608)
Source: KPMG Primary Data Note: Main worker: More than 6 months; Marginal worker: 3-6 months; Non-worker: Not worked at all
Occupation Sector % Agriculture and allied 33 Mining 2 Manufacturing - textiles 3 Manufacturing - non-textiles 1 Services - trade 6 Services - non-trade 11 Services - construction 9 Others 35
Occupation
2%
2%
5%
6%
9%
12%
19%
21%
24%
Diploma/certificate
Post-graduate
Graduate
Pre-primary
Higher secondary
Primary (upto 5)
Middle (classes 6-8)
Illiterate
Secondary (classes 9-10)Education
Yes 91%
No 9%
Bank Account
Marginal worker5%
Non-worker31%
Working Status last year
18%23% 22% 21%
16%
20 orbelow
21 to 30 31 to 40 41 to 50 51+
Age Profile
Male 67%
Female 33%
Gender

60
1.1.2. Performance of scheme
● Relevance
a) All India significance
The programme is operational in 33 States and UTs, indicating wide acceptance and participation of implementing States. Five new States/UTs (Himachal Pradesh, Tamil Nadu, Nagaland, Goa, and Puducherry) have implemented PMJVK. With the addition of new States/UTs, the programme’s outreach has increased manifold, reflecting the multi-ethnic, multi-cultural, multi-lingual, and multi-religious character of India.
b) Appropriateness of scheme design
The programme, by design, adopts multiple approaches to attain its goal. While some activities target individual and family levels, others are implemented at the community level. For scale and operations, MCAs have been identified that cover towns, districts, blocks, and clusters of villages within a five km radius. The programme aims at integrated development of MCAs to provide better socio-economic infrastructure facilities to minorities to bring them at par with the national average.
c) Relevance of scheme objectives
As per the guidelines of the PMJVK scheme,124 the scheme mainly focuses on the creation of infrastructure in these sectors, besides innovative schemes for improving the socio-economic conditions of minorities. To ensure the overall development of the minority communities, there is a greater focus on projects related to education, health, and skill development, with particular attention to women-oriented projects. The projects aim to reduce the gap between minority communities and other groups, thereby promoting inclusive development.
d) Alignment of the scheme to national priorities
This scheme aligns with the Prime Minister’s New 15 Point Programme to ensure the development of facilities (hostels, schools, Aanganwadi centres, health centres, etc.) and access to resources (education, health, skill development, drinking water supply, etc.) for the target population. The projects developed are available to all communities residing in the MCAs. It is one of India’s largest area development schemes, with an annual financial allocation of Rs. 1,600 crores in 2020-21. PMJVK is also the biggest CSS under the Core of the Core Schemes for Development of Minorities in India. This scheme contributes to National Development Agenda by contributing towards ‘building an inclusive society’ for the minority population, with special attention to women. The scheme focuses on education and health areas, which are also the major focus areas of the National Development Agenda.
e) Evolution of the scheme over time
Better Reach: In the restructured format of the programme (PMJVK), population percentage criteria have been relaxed, and village clusters with 25 percent or more minority population are covered, making the programme more relevant. In MsDP, areas with at least 50 percent of the minority population were covered for intervention.
124 Ministry of Minority Affairs (2019), Guidelines for implementation of PMJVK (PMJVK), Last accessed on 15th July 2020

61
More Focus on Empowering Women: Almost all the MCAs present a landscape where women and girls are denied opportunities due to several factors such as low levels of literacy, limited access to job opportunities, and lack of access to health, WASH, and nutrition services, among others. While MsDP did not cover women-centric projects, at least 33-40 percent of funds under PMJVK design are earmarked for the creation of assets/facilities for women/girls, making the scheme more targeted and relevant for vulnerable women and girls. Women-centric projects are being implemented prominently under two sectors - education and sanitation.
Focus on Local Area Development: Realizing that districts are too big a unit for planning, MoMA switched to blocks as a unit of planning, funding, and implementation of projects.
The MsDP was launched in 90 Minority Concentrated Districts (MCDs). These are districts with 25 percent or more minority population as per the Census 2001. In terms of coverage, MCDs contained only 37 percent of the minority population. It was designed as an umbrella programme to intensify developmental activities in the MCDs.125 However, a quick appraisal of development initiatives undertaken in the MCDs revealed that the benefits were not reaching the intended target groups due to the territorial expanse of the district. This realization led to a strategic change, from districts to blocks, for the implementation of schemes under the MsDP.126
The MsDP, revised in 2013-14, was implemented in 710 Minority Concentration Blocks (MCBs) and 66 Minority Concentration Towns (MCTs). The scheme was restructured in 2018-19 and thereafter implemented as Pradhan Mantri Jan Vikas Karyakram in 109 Minority Concentration District Headquarters (MCDHQs), 870 MCBs, and 321 MCTs.127
Land for Construction: Under MsDP, only government/government body land could be used for construction.128 Recognizing that it was a challenge to find encumbrance-free land within MCAs, the Ministry has now allowed construction on Waqf Board land, land of central organizations, land of central/state universities, and land of minority communities that is free of any lease amount/nominal amount, for a particular period on a lease basis.129
Flexibility in Choosing Implementing Agencies: Unlike MsDP wherein only state government/UTs could implement projects, PMJVK allows central ministries/organizations, central/state universities, CPSEs/undertakings, defense organizations, and armed police forces/central paramilitary forces or agencies with which Public-Private Partnership (PPP) has been approved to act as implementing agencies, in addition to states and UTs.
f) Innovative aspects of the scheme design
Backed by Demonstration and Research: PMJVK has been redesigned into its present avatar after incorporating the learnings from the decade-long implementation of MsDP.130 As mentioned, the
125 Mohd Sanjeer Alam (2016), Affirmative Action for Minorities in India: Constraints and Possibilities, Social and Education History, Vol.5, No. 3, September. 2016, pp. 260-261, Last accessed on 7th February 2020 126 IIPA, (2017), Impact Assessment of MsDP in India, Last accessed on 13th February 2020 127 PIB, GoI, Pradhan Mantri Jan Vikas Karyakram is being implemented in 1300 identified Minority Concentration Areas in the country 128 Ministry of Minority Affairs (2019), Guidelines for implementation of PMJVK, Last accessed on 15th July 2020 129 Footnote 128 130 Ministry of Social Justice and Empowerment, (2018), 62nd Report Standing Committee on Social Justice and Empowerment (2017-18), Last accessed on 14th January 2020

62
programme has not only expanded its outreach by relaxing the selection criteria but has also provided better socio-economic infrastructure facilities to minority communities.
100 percent Funding for Innovative Projects: Innovative projects such as Hunar Hubs have been allowed in MCD HQs for enabling artisans/entrepreneurs to carry out exhibitions/melas/food courts/skill training in MCD HQs. This asset may be 100 percent funded by the Ministry. Market sheds for agricultural produce may also be constructed under PMJVK.
Innovative Projects: As per the MIS report shared by MoMA, innovative projects such as Hunar Hubs and Sadbhav Mandaps have been prioritized under the scheme’s new format. There are 20 states where Common Service Centres (CSCs) have been sanctioned so far, with 137 units. Under market sheds (Hunar Hubs), 630 market shed projects have been approved across ten states, with 560 units in Assam and West Bengal.
Alignment with Prime Minister’s New 15 Point Programme: The State Level Committee (SLC) constituted for implementation of the Prime Minister’s New 15 Point Programme for the Welfare of Minorities, headed by the Chief Secretary131, serves as the SLC for the implementation of PMJVK. The central government nominates two Members of Parliament (MPs) from Lok Sabha and one from Rajya Sabha representing the state and three Members of Legislative Assembly (MLAs) of Legislative Assembly are nominated by the state government for the SLC. The District Level Committee (DLC) for Prime Minister’s New 15 Point Programme132 serves as the DLC for MsDP. MPs and MLAs representing the district are included in the DLC. Further, the central government nominates one MP from Rajya Sabha representing the state for the DLC. The state authorities organize the meetings of State and District Level Committees.
Public-Private Partnership to Boost Infrastructure: Implementation of projects and operationalization of assets has been allowed through PPP mode, wherever feasible. The PPP model has been introduced in the revised scheme in May 2018, as discussed during National KIIs. Except for a few projects, there has been no request from any of the States/ UTs to allow projects on the PPP model. The state KIIs revealed that PPP under PMJVK has not worked out. On a pilot basis, the PPP model is being implemented in a residential school project in Nagaland, as shared during national KII. However, one of the major issues with the PPP model was that handing over assets to the private sector for operations generally did not work. Thus, an undertaking was signed with the Nagaland state government stating that the state government would take full responsibility for running the residential school if the PPP model fails. Karnataka also proposed a hospital under the PPP model, which the ministry rejected based on the aforementioned reason.
Adhering to Guidelines of other Ministries and Eliminating Duplication: The scheme does not permit any change in the guidelines of any existing CSS for implementation in MCAs under PMJVK. The states/UTs ensure that the number of units taken up is being accounted for in the physical register of the ministry. Also, state and centre officials conduct physical inspections wherever required.133 Further, PMJVK guidelines134 recommend that states should ensure that the proposals have the approval of the SLC of PM’s 15 Point Programme and Mission Director of Centrally
131 Ministry of Minority Affairs (2019), Guidelines for implementation of PMJVK, Last accessed on 15th July 2020 132 Footnote 131 133 Ministry of Minority Affairs, GoI, Empowered Committee Minutes, Last accessed on 13th July 2020 134 Ministry of Minority Affairs, Guidelines for implementation of PMJVK, Last accessed on 19th February 2020

63
Sponsored Schemes concerned. This is to ensure that proposals are as per the specifications/norms/standards set by the line ministries/departments involved. In this manner, States are able to prevent duplication of efforts.
g) Importance of PMJVK facilities for minority communities
State and district officials reported that the scheme aims to serve the needs of both individuals and the (minority) community at large. More considerable emphasis is on the community projects such as health facilities, school buildings, toilets, etc. The respondents who identified common PMJVK facilities completed in their village/area were questioned whether they would have still gone out to seek a similar facility had it not been developed under PMJVK. Figure 26 reveals that the majority of the PMJVK facilities (except educational facilities) are essential for the respondents.
Figure 26: Importance of PMJVK facilities (in %) (n=468)
Source: KPMG Primary Data
h) Constraints of the scheme design
Exclusion of Certain Groups not Recognized by the National Commission for Minorities Act, 1992: Minority groups in India is notified based on their population at the national level. As per Census 2011,135 Hindus are a minority in eight States/UTs – Arunachal Pradesh (29 percent), Mizoram (2.75 percent), Meghalaya (11.53 percent), Nagaland (8.75 percent), erstwhile Jammu and Kashmir (28.44 percent), Manipur (31.39 percent), Punjab (38.40 percent) and Lakshadweep (2.5 percent). But since National Commission for Minority (NCM) Act 1992 has not declared Hindu as a
135 Ministry of Rural Development, Government of India, (2011), Socio Economic and Caste Census, Last accessed on 26th March 2020
Health Education Sanitation Drinking-
Water Supply
Skill Development
Anganwadi Hostel
Incidence 18% 41% 48% 32% 3% 43% 1%
n 45 103 121 80 7 109 3
73%
44%
74%80%
100%
53%67%
27%
56%
26%18%
39% 33%
2% 8%
Health Education Sanitation Drinking watersupply
Skilldevelopment
Anganwadi Hostel
Yes No No response

64
minority group in these states, Hindus living in the mentioned states do not receive any of the minority scheme benefits, including MsDP/PMJVK. Likewise, the Jews in Maharashtra, although not eligible for national minority schemes such as the PMJVK, are included in the state government schemes for minorities. Minority Communities have been defined as per the provision of the NCM Act, 1992. However, the projects sanctioned under the PMJVK scheme are constructed in MCAs and does not restrict any person living in the catchment area from using these assets. The assets created under PMJVK are Schools, Colleges, ITIs, Polytechnics, PHCs, CHCs, Sadbhav Mandaps, Sports facilities, Anganwadi Centres, Working Women Hostels, etc. The population residing in the catchment area uses these assets, not only by the minority communities. As such, all communities avail the benefits of the scheme.
It is pertinent to note that the Supreme Court in TMA Pai Foundation and others Vs. State of Karnataka and others (2002) has held that for Article 30, a minority, whether linguistic or religious, is determinable for a State and not by taking into consideration the country’s population. 136
Figure 27: Minorities and their status in states
Source 1: D.A.V. College vs the State of Punjab, AIR 1737, 1971 SCR 688 Source 2: Mio, M., Dasgupta, A., Routledge, (2018), Rethinking social exclusion in India: Castes, Communities, and the State
Less Focus on Creating Awareness: Discussions with district and state officials revealed that there has been a limited focus on generating awareness about PMJVK facilities. However, banners, hoardings, press releases, Panchayat Sabhas, are used to create awareness about the PMJVK facilities. The survey findings reveal that around 59 percent of the respondents in eight states are unaware of the common PMJVK facilities. More than 50 percent of respondents in Assam, Odisha, and Maharashtra reported that they were aware of the facilities developed under PMJVK.
136 Raza, S.A. (2016). Minority Educational Institutions and the Supreme Court after the T. M. A. Pai Judgment., Last accessed on 19th February 2020
THE HINDUS IN PUNJAB:
In DAV v/s State of Punjab, the major question was whether Hindus in the State of Punjab could be construed as a minority group under Article 29 of the Constitution. That article guarantees that “every section of citizens” living anywhere in India who have their own distinct language has a right to conserve that language (or script or culture). The question in this case was whether Hindus, being a majority in the country, can be construed as a minority in the State of Punjab. The Court ruled that they could be and that, therefore, DAV College could not be forced to obey a state law saying that instruction for certain courses had to be carried out in Punjabi in the Gurumukhi script. The question that arises is, what can be done to cater to the needs of such minority groups that has not been recognized by the National Commission for Minorities Act, 1992?
GUJARAT DOES NOT RECOGNIZE MINORITIES:
Every state having religious minority groups enjoy the benefits provided under PMJVK Scheme. However, Gujarat is an exceptional case. In Gujarat there is no concept of a religious minority and for that specific reason, they haven’t taken any project under MsDP/PMJVK. If a community requires any kind of development, the development will be done entirely and not for a community even if it is a religious minority group or other kind of minority groups that exist in Gujarat. So, Gujarat Government has not applied for a single project MsDP/PMJVK. According to budget allocation data of last 5 years, no budget has been allocated to Gujarat state till 2018.
However, in 2018, Gujarat became the third state in India to grant religious minority status to Jews after West Bengal and Maharashtra.

65
In the remaining five states, people had limited or no knowledge about PMJVK facilities. Telangana had zero respondent cognizant about the PMJVK facilities, as highlighted in Figure 28. A minority sample was covered in Shamshabad town of Rangareddy district of Telangana. Under PMJVK, only bicycles were provided to school-going girls. As a result, most of the respondents were unaware of the scheme, and any PMJVK facility. Based on the FGD (Focus Group Discussion) conducted in Barari and Hajipur villages of Katihar district in Bihar, a lack of awareness about PMJVK facilities was observed amongst respondents. The respondents during FGD informed that they do not receive any scheme related information from district officials. Also, during gram sabha meetings, village projects are discussed in general instead of scheme-specific projects. Hence, they are unaware of any facility developed under PMJVK specifically.
State officials of Kerala informed that awareness activities are carried out after every three months across 14 districts. Meetings with religious minority leaders are conducted every year to ensure the dissemination of information to every sect of minority communities. However, the level of awareness in Kerala is very low. It was observed during FGD in Thrissur, Kerala that respondents are well aware of the facilities, but they are unaware that the facilities have been developed under the PMJVK scheme. State officials of Kerala informed that even though awareness activities are conducted across all minority districts, participation of minorities in these activities are quite limited.
Figure 28: Awareness about facilities developed under PMJVK (in %) (N=608)
Source: KPMG Primary Data
55 percent of household respondents reported that there had been no trainings, meetings, or exhibitions were conducted against only 23 percent responded positively. Figure 29 shows that Punjab is the only state where more than 50 percent of respondents reported that PMJVK-related trainings, meetings, exhibitions were held. The majority of the States such as Assam, Odisha, Uttarakhand, Telangana, Maharashtra, and Bihar recorded more than 50 percent of respondents who stated that no PMJVK-related trainings, meetings, exhibitions had been organized.
40%
23%
84%
52%
37%
26%
96%
60%
77%
16%
48%
63%
100%
74%
4%
Bihar
Kerala
Maharashtra
Odisha
Punjab
Telangana
Uttarakhand
Assam
No Yes

66
Figure 29: State-wise analysis of IEC activities (N=608)
Total respondents
Bihar Kerala Maharashtra Odisha Punjab Telangana Uttarakhand Assam
608 183 83 43 60 60 62 62 55
Source: KPMG Primary Data
For commonly identified facilities (Figure 30), 100 percent of respondents in Kerala stated educational facilities, followed by 88 percent in Uttarakhand for Anganwadi, and 83 percent in Maharashtra also mentioned sanitation facilities.
In Kerala, the maximum number of projects have been completed under the education sector (94 percent of 209 sanctioned projects)137 and, hence, respondents could identify the educational facilities. In Uttarakhand, the maximum number of projects sanctioned under the nutrition has been completed (86.7 percent of 467 sanctioned projects).
Odisha is the only sample state where a 100 percent completion rate has been observed, followed by Mizoram (96 percent). Other sample states such as Assam, Bihar, Maharashtra, Kerala, Telangana, Uttarakhand recorded completion rates below 50 percent at an overall level.
In Assam, the completion rate across all sectors is comparatively less as compared to other sample states. However, the primary survey reveals an exceptionally high awareness level about PMJVK facilities in Assam as highlighted in Figure 28. Hence, respondents in Assam could identify all PMJVK facilities except skill development programmes under which very few projects have been approved so far. Similar is the case for the state of Maharashtra, Bihar, and Punjab.
In Odisha, a greater number of sanitation projects and nutrition projects (e.g. setting up of Anganwadi centres) have been completed as compared to other sectors. Hence, the majority of the respondents could identify sanitation projects and nutrition projects.
137 MoMA, GoI, (2020), Physical Progress Report under PMJVK
18%
4%
42%
20%
56%
5%
31% 35%
67%
42%51%
67%
31%
52% 55%64%
15%
54%
7%13% 13%
43%
15%
2%
Bihar Kerala Maharashtra Odisha Punjab Telangana Uttarakhand Assam
Yes No Dont know/Cannot Say

67
Figure 30: Facilities identified by the respondents (in %) (N=608)
Source: KPMG Primary Data
A clause has been inserted for state/UTs to ensure that the sanctions, activities, and projects are given adequate publicity through print media, electronic media, and IT interfaces in the scheme’s restructured programme.
Besides the above, the Ministry has conducted zonal and national conferences for the dissemination of information to the state/district level officials. A zonal conference was organized in Lucknow on January 18, 2018, for Northern States (Uttar Pradesh, Bihar, Haryana, erstwhile Jammu and Kashmir, Himachal Pradesh, Punjab, Chandigarh, Delhi, and Uttarakhand). Another zonal conference was organized in Guwahati on May 5, 2018, for Eastern States (Tripura, Manipur, Sikkim, Arunachal Pradesh, Mizoram, Nagaland, Meghalaya, Assam, Odisha, West Bengal, Bihar, and Jharkhand). A national conference was held in Delhi on July 16, 2018, in which principal secretary/secretary-level officers from states/UTs participated. Meetings are regularly held between SLC, EC (Empowered Committee), and NAWADCO (National Waqf Development Corporation Limited) through video conferencing to discuss the project plans and for approval. The minutes of the meeting conducted till the year 2020 are available in the public domain.138
Also, during state and district KIIs, it was informed that the Central Government has started a unique initiative ‘Progress Panchayat’ where officials from Centre and state, as well as local people, come together to interact and discuss implementation issues relating to the social, educational, and economic development of minorities and corresponding actions taken. District officials of Uttarakhand, Kerala, and Maharashtra shared that local people positively responded to this initiative.
138 Ministry of Minority Affairs, GoI, Empowered Committee Minutes
23% 25%
10% 9%13%
23%
59%
100%
22%26%
17%
81%
13%
58%
83%
71%
4%
19%
42%
26%
5%
56%
35%
78%
25%
13%5% 3% 3% 6%
47%
75%
58%
88%
28%
3% 6%2%
Bihar Kerala Maharashtra Odisha Punjab Uttarakhand Assam
Health Education Sanitation Drinking Water Supply Skill development programmes Nutrition

68
Box 1: ‘Progress Panchayat’ initiative in MCAs
55 percent of the respondents who were aware of the scheme reported informal sources such as friends, relatives as the source of information. In contrast, about 50 percent reported awareness through formal sources such as Panchayati Raj Institution (PRI) members/sarpanch, FLWs at the village, advertisement in the newspaper, district/block officials, as highlighted in Figure 31. Also, it is worth noting that more than 50 percent of the respondents who were aware reported that they learned about the facilities through one or two sources. 17 percent of the respondents mentioned other sources such as ASHA workers, Anganwadi centres, posters, advertisements, etc.
“Panchayat and social media are the major sources of information on the scheme.”
- FGD, Chatama, Nalbari, Assam
“We get to know about the PMJVK projects from district officials.”
- FGD, Balia Manjhour, Kishanganj, Bihar
Figure 31: Source of information about PMJVK facilities (in %) (n=252)
Source: KPMG Primary Data
1%
3%
13%
17%
50%
55%
Don't Know/ Can't Say
No Response
Saw the facility during/ after the construction
Other
Formal Sources
From friends/relatives
Percentage of respondents
Progress Panchayat is a special initiative undertaken by MoMA to review the implementation of Central Schemes for Minorities as well as increase awareness in MCAs about the various schemes implemented by the Ministry. It is a platform where the Government officials, Ministers from both Centre and State as well as the local people come together to interact and discuss implementation status of minority schemes. They discuss the issues related to social, educational and economic development of minorities and actions that need to be taken. They seek ground level report to fulfil the needs of the minorities.
This initiative has given a boost to all the sanctioned works and has successfully established coordination among various States. This has proved to be a ‘mile stone’ for the empowerment of minorities.
Through this initiative, recent projects that has been undertaken by Ministry such as Sadbhav Mandaps and Hunar Hubs were popularised that it would serve as a community centre with toilet facilities and would have facilities for education & skill development, disaster relief, awareness campaigns, sports facility, social & cultural gatherings, and other such events.
Source: MoMA, (2019), Annual Report 2018-19

69
● Effectiveness
a) Outputs under the scheme
A priori, the scheme seems effective, since a total of 3,76,283 social infrastructure projects have been completed since inception, targeting the development deficits in MCAs and the existing vulnerabilities of minority communities. However, there is mixed evidence in programme implementation, as well as the results and the same has been summarized here.
Strategic Focus of the Scheme: MsDP had adopted seven focus areas that have helped create a visible impact in the MCAs by promoting social inclusion. The primary focus areas were housing, education, health, drinking water supply, innovative projects, sanitation, and other regions (Figure 32). Out of these focus areas, education, health, and skill development are the priority sectors, as per the guidelines.139
Figure 32: Strategic focus areas of PMJVK scheme
Source: MIS Database, PMJVK
Physical Performance of the Scheme: Since the scheme's inception, multiple socio-economic infrastructure projects in the Minority Concentration Areas have been developed. The projects related to housing, skill training, Anganwadi centres, education, and WASH facilities (hand pump, drinking water facilities), among others, have been prioritized.140 Such a selection of projects addresses the multidimensional aspects of poverty (housing, nutrition, literacy, health, and skill development) among the minority population.
Analysis of the number of assets sanctioned and completed between 2014-15 to 2018-19 reveals that the number of projects sanctioned has decreased vis-a-vis completion rate. As per state and district officials, the primary reason behind the reduction in completion rate was land conflict, as highlighted
139 Ministry of Minority Affairs, Guidelines for implementation of PMJVK, Last accessed on 19th February 2020 140 Ministry of Minority Affairs, (2019), MIS for PMJVK, Last accessed on 25th July 2020

70
during state KII with officials from Maharashtra; Sitamarhi district, Bihar; and Gurdaspur district, Punjab. National KIIs highlighted tendering process and cost escalation issues. As reported during National KIIs, non-utilisation is related to land issues, for which revision in the scheme is being proposed. The Ministry has no control over disputes faced by the States/ UTs relating to land. This issue of non-availability of land leading to delay in implementation of sanctioned projects is being taken up in the Expenditure Finance Committee (EFC) for the scheme w.e.f. 2021-22 to 2025-26. Also, there has been a reduction in the number of projects during 2017-18 and 2018-19 mainly due to policy decisions of not sanctioning individual beneficiary projects or smaller projects such as additional Class Rooms, etc. The focus under PMJVK is now towards more significant community projects which would have a greater socio-economic impact in the long run. Figure 33 presents the same.
Figure 33: Analysis of assets sanctioned and completed (2014-15 to 2018-19)
US: Units sanctioned; UC: Units completed; WIP: Work in progress; UD: Units dropped Source: PMJVK MIS Database shared by PMJVK Division (2014-15 to 2018-19), Ministry of Minority Affairs
Ease of access to PMJVK facilities was enquired by probing into the distance of PMJVK facilities from home. The majority of the respondents reported that most of the facilities constructed under PMJVK were within one km of distance from their home, which indicates that the facilities are easily accessible, as highlighted in Figure 34. Key informants gave credit to PMJVK for providing easy access to facilities across sample states.
57869
26917
12484 11210
38.2%
8.7%
28.9%
2.5%
14.4% 10.7%
45.3%
0.3%
0.4%
1.0%0.2%
0.0%
0%
5%
10%
15%
20%
25%
30%
35%
40%
45%
50%
0
10000
20000
30000
40000
50000
60000
70000
2015-16 2016-17 2017-18 2018-19
US UC WIP UD

71
Figure 34: Accessibility to the PMJVK facilities (in %) (n=252)
Total respondents
Bihar Kerala Maharashtra Odisha Punjab Uttarakhand Assam
252 74 19 36 31 23 16 53
Source: KPMG Primary Data
b) Issues faced in scheme implementation
As per discussion with officials from MoMA, the current focus is on developing large projects that are gap-filling in nature and promote sustainable development. For example, as per guidelines, it is mandatory for all big projects constructed under the PMJVK such as hostels, schools, colleges, ITIs, polytechnics, Sadbhav Mandaps, Common Service Centres, etc., to have provision for rainwater harvesting. The EC for PMJVK regularly holds monthly meetings to review the sanctioned projects and sanction new projects. Excerpts from various EC minutes141 reveal a plethora of issues in implementation across states and UTs. Some of them are mentioned below.
The project DPR requires approvals at multiple levels. At the district level, the district committee approves the DPR and then sends it to the state government for further approval. Once the state government approves, the empowered committee gives the final approval at the ministry level. District officials reported that the approval process takes at least three months, and a sanctioned letter is received within a month. Usually, the fund disbursement process takes 15-20 days or one month. Generally, they are ordered to complete a sanctioned project within a year. However, the implementation process always gets delayed for various reasons and, as a result, usually, the approved project cannot be completed within one year.
141 Ministry of Minority Affairs, GoI, Empowered Committee Minutes, Last accessed on 16th March 2020
58%
72%81%
86%
71%
83%
33%40%
23% 18%10%
29%
10%
33%
2% 5% 1%
34%
4% 7%
Health Education Sanitation DrinkingWater Supply
Skilldevelopmentprogrammes
Nutrition Hostelfacilities
Less than 1 km Between 1-10 kms More than 10 kms No Response

72
Also, issues such as low network coverage and land-related issues cause delays in completing projects such as CyberGram projects, health-related projects, and ACR projects.142 District officials of Bihar reported that due to land conflicts, several projects fail to begin. In Sitamarhi, out of 300 proposed Anganwadi centres, only 44 Anganwadi Centres have been completed. District officials of sample states informed that 256 centres were dropped due to the unavailability of land. Also, due to inadequate human resources, difficulties arise in conducting a proper baseline survey in MCAs.
c) Sector-wise performance of the scheme
Education Projects: State and district officials of all sample states stated that priority is given to education, followed by the health sector. Under these sectors, construction of health centres or health services, additional classrooms and hostels for girls, working women hostels are undertaken. Kerala is one state where 100 percent of respondents identified educational projects as the most common facility. Secondary data also shows that 90 percent of the projects sanctioned in the state of Kerala are educational projects. A very low completion rate has been recorded in education projects across sample states (except Kerala, Mizoram, and Telangana), as highlighted in Annexure 2.
Health Projects: The evaluation team found that only 0.43 percent of the completed projects are health projects, as highlighted in Figure 35. The 62nd Standing Committee on Social Justice and Empowerment143 found that MoMA has taken up projects like the construction of PHCs, health sub-centres, and labour rooms in PHCs. Hence, a total of 4,393 units/projects were sanctioned in the 11th and 12th Plan Period. However, the number of completed units has been lesser as compared to the number of sanctioned projects. During the 11th Plan, only 1,971 units have been completed out of 2,537 sanctioned health projects/units. In the 12th Plan, only 461 units have been functional out of 1,856 health-related projects. Therefore, the Committee was not satisfied with the progress made by the Ministry in this regard. As the health of the people is one of the basic indicators of development of an area, the Committee recommended further action by the Ministry, in conjunction with the Health Ministry and State Governments where these projects are being implemented, is required. Further to the advisory to the States/UTs dated 08/11/2018, the Empowered Committee sanctioned quarters for doctors, nurses, and other medical staff members in health centres. So far, around 187 units of medical/staff quarters have been sanctioned in MCAs of Arunachal Pradesh, Assam, Haryana, Manipur, Mizoram, Tripura, and West Bengal.
Based on the Ministry’s MIS database, health, sanitation, and innovative projects record the lowest number of completed projects, as highlighted in Figure 35. Since sports projects have been recently undertaken across north-eastern states, the projects have not been completed yet.
Pradhan Mantri Awas Yojana (PMAY) shows the highest completion rate till 2016-17. However, the evaluation team was informed during National KIIs that since 2017-18, individual housing projects have been put on low priority. It was decided that very limited focus will be on individual beneficiary projects. The major focus will be on community infrastructure projects such as schools, residential
142 Ministry of Minority Affairs, GoI, Empowered Committee Minutes, Last accessed on 13th July 2020 143 Ministry of Social Justice and Empowerment, (2018), 62nd Report Standing Committee on Social Justice and Empowerment (2017-18), Last accessed on 14th January 2020

73
schools, hostels, smart classrooms, colleges, primary health centres, community health centres, skill centres, working women hostels, community centres, etc. to have a larger and more visible impact in the MCAs.
“Changes observed in the last five years due to PMJVK scheme are the construction of boundary wall, facilities such as toilet near the mosque, and community toilets.”
-FGD, Towmura, Nalbari, Assam
“More than five community toilets are currently under construction in the village under PMJVK. This will solve the issue of open defecation.”
-FGD, Patwa, Kishanganj, Bihar
During national KII discussions, the evaluation team was informed that to address the issue of incomplete projects; priority has been accorded to projects in the education, health, and skill development sectors. Out of total projects sanctioned by the Ministry under the scheme, from 2018-19 onwards till March 31, 2020, around 80 percent of projects pertained to these three priority sectors. In so far as residential schools are concerned, to date, 172 such schools have been sanctioned.
d) Outcomes under the scheme
The performance of the scheme based on the Output Outcome Framework (OOMF) has been highlighted in Table 6.
Table 6: Output outcome performance of the scheme
Output indicators (As per OOMF Dashboard, August 16, 2020) S. No. Indicator Target 2018-
19 Progress 2018-19
Target 2019-20
Progress 2019-20
1 Number of projects taken up in identified areas
** 78.76 2,000 573
2 Number of projects taken up in identified areas- Anganwadi Centres
NA NA 200 94
3 Number of projects taken up in identified areas- Toilet Units
NA NA 250 386
4 Number of projects taken up in identified areas
NA NA 520 8,118
5 Number of assets geotagged ** * 2,290 * Outcome indicators (As per OOMF Dashboard, August 16, 2020)
Source: MIS Database, PMJVK
Education5.86%
Skill development36.02%
Health0.43%
Drinking Water Supply9.12%
Nutrition4.92%
Innovative projects0.04%
Sports projects0.00%
Sanitation0.16%
Miscellaneous2.34%
PMAY41.11%
Figure 35: Percentage of completed projects under PMJVK

74
S. No. Indicator Target 2018-19
Progress 2018-19
Target 2019-20
Progress 2019-20
1 Improved access to health- construction projects in Health
NA NA 250 276
2 Improved access to health, basic amenities, drinking water, etc. - construction projects in Sanitation
NA NA 250 386
3 Improved access to education- construction projects in Education
NA NA 2,225 7,280
4 Increase in number of Common Service Centres
NA NA 100 136
5 Percentage of households with pucca walls & safe drinking water & electricity
** * ** *
* Data not provided by Ministry ** Targets not amenable (as per Ministry)
Source: NITI Aayog
Education and skill development have been two thrust areas under MsDP and now under PMJVK. As per discussion with MoMA officials, improvement in literacy rate (overall and gender-wise) and improvement in the Worker Population Ratio (overall and gender-wise) are the critical outcomes targeted by PMJVK.
Though MoMA has not carried out any socio-economic assessment of minorities in MCAs. However, the ‘Literacy Rates’ and the ‘Worker Population Ratio’ for the minorities have shown healthy growth over a decade (Census 2001-2011). The data reveals that from 2001 to 2011, India's overall literacy rate increased 8.2 percentage points from 64.8 percent to 73 percent. There has been a significant improvement in the literacy rate among Muslims by 9.4 percentage points, from 59.1 percent in 2001 to 68.5 percent in 2011. Despite the improvement in literacy rate, Muslims, at 68.5 percent (2011), are still way behind other religious communities. An increase has been observed among Christian (80.3 percent in 2001 to 84.53 percent in 2011), Sikh (69.4 percent in 2001 to 75.39 percent in 2011), Buddhist (72.7 percent in 2001 to 81.38 percent in 2011). Jain, as noted earlier, has an excellent literacy rate at present, and, therefore, the increase from 2001 was largely negligible - from 94.1 percent in 2001 to 94.88 percent in 2011.
The WPR is still low among minorities such as Muslims (30.1 percent), Sikhs (34.1 percent), etc.144 It is worth noting that the WPR of Christians (37.7 percent) is above Hindus (36.6 percent).145
The foregoing analysis indicates that the educational interventions under the programme seem to have a positive contribution to the literacy rate among the largest minority group (Muslims). The low WPR among Muslims, however, remains a concern, and, therefore, skill development projects need a big push.
144 Annual Report, PLFS (2018-19), Released in June 2020, Last accessed on 22nd December 2020 145 Footnote 143

75
e) Coordination between various levels - Centre, state, and district:
State officials informed that the Central Government approaches the states every three months and asks them to send their proposals. These are reviewed and post that, MoMA conducts an empowered committee meeting where states present their proposals and if the committee and their technical consultant of NAWADCO are convinced that the project is approved. This process takes close to six months. There is no challenge in terms of coordination in the project approval process.
MoMA has to deal with a specific counterpart in all states/UTs. The State Minority Department or the Department dealing with the welfare of minorities at the state level is the nodal Ministry/Department for forwarding proposals and implementing the PMJVK scheme at the state level.
Analysis of the EC minutes146 reveals that the states have not prioritized the projects, especially during the MsDP period. In many instances, it has been noted that the proposal was forwarded to MoMA without the approval of SLSC. In some cases, the proposal was not supplemented with details, as mandated by PMJVK guidelines, resulting in non-approval of the project. In other instances, the states/UTs requested for a change in location of the project or a complete change of projects. A few states have inadequately provided annexures detailing project and cost break-up.
Such issues reflect the lack of involvement/participation/monitoring by senior state officials at the planning and execution phase, leading to sub-optimal results. A case in point is illustrated from the review of projects approved during the 11th Plan, 12th Plan, and during 2017-18 for Assam, Karnataka, Punjab, and Uttarakhand.
Box 2: Limited participation of state officials in scheme implementation
States such as Telangana and Maharashtra have reported a robust implementation mechanism and have also been among a few better performing states, as reported during national KIIs. For example, in Telangana, three engineering wings undertook the construction of projects on behalf of the government departments.
“One is the Panchayati Raj Department, the other is CPWD (Central Public Works Department), and the third is EWIDC (Education Welfare Infrastructure Development Corporation). These departments handle all the engineering aspects of our projects. The Commissionerate deals with the funding aspects and the user agency apprises their requirements.”
- Director, Minority Department, Telangana
146 Ministry of Minority Affairs, GoI, Empowered Committee Minutes, Last accessed on 13th July 2020
The Empowered Committee reviewed the status of projects sanctioned for identified areas of Assam, Karnataka, Punjab and Uttarakhand during 11th Plan, 12th Five Year Plan & 2017-18. The Secretary, MoMA noted the absence of Principal Secretary/Secretary-in-charge of the scheme. The Additional Secretary, in-charge of PMJVK was advised to confirm the availability of senior officers in future as the proposals can be taken up only with their participation. The Committee observed that there are a number of projects from the 11th plan which have not even started and requested the representative of the State for the reason for delay. Source: Second EC: Review of Projects in Assam, Karnataka, Punjab and Uttarakhand

76
Similarly, in Maharashtra, a district planning officer as the nodal officer works with the district collector. The DPO, along with the support staff, is only responsible for minority-related schemes. Each district has its own set-up. The DPO identifies the district's needs as per the scheme. The Public Works Department (PWD) prepares the DPR. In the case of schools, the school education department prepares a DPR. The DPO’s role is to plan and execute and coordinate with all the executing authorities. The DPO has to ensure that the work is completed. The collector takes the overall view of the project to be completed in the district. The requirement of the people is considered based on project needs and it is allocated to different officers as per the schemes. The budget is fixed as per the size of the building to be constructed and PWD prepares the budget. The budget plan is then forwarded to the state and Centre for further approval.
However, there are states which are currently facing administrative challenges, such as the state of Mizoram. District officials of Mizoram reported that initially, the schemes were under one department, the social welfare department, but two to three months back, they have been brought under the minority department. So, there is a transition at the state level, and such significant changes in the department have been a huge challenge for the district officials while coordinating.
f) Coordination of other ministries, NGOs, and community in PMJVK
One of the key strategies of PMJVK outlined in the guidelines147 is convergence with the on-going CSS implemented by other ministries/departments such as Health and Family Welfare, Women and Child Development, Rural Development, Human Resource Development, Skill Development, Housing, and Urban Affairs, among others. As informed during national KIIs, the EC, headed by the Secretary (MoMA), has members from the Department of Expenditure, concerned line Ministry and chief engineer dealing with the sector of the project, NITI Aayog, ICSSR, etc. Wide-ranging discussions are held during the EC meetings on the project proposals with the line ministry in particular and the concerned state representatives. Also, the technical expert plays a vital role in the EC about cost analysis and examination of the building plan. Similarly, before being referred to the EC for consideration, the proposals are discussed in detail in the SLC. The state government's concerned line ministry is involved during the formulation of the proposals at the state level. The concerned line ministry at the state level also has an important role to play post-approval of the project as the projects are commissioned and made operational by that particular ministry, which also takes care of the recurring expenditure and running cost of the project.
There have also been efforts to converge the PMJVK scheme with other CSS implemented by the ministries/departments. As a result, MoMA has sanctioned new Kendriya Vidyalayas (KVs), new Jawahar Navodaya Vidyalaya (JNVs) in MCAs, and sanction smart classes in KVs constructed with funds received from the Ministry of Education and already functioning in the MCAs. There have also been efforts in the convergence of the scheme under which Anganwadi Centres are funded by the Ministry of Women and Child Development. Convergence has also taken place with the Ministry of Health and Family Welfare for the construction of CWCs, PHCs, and PHSCs in the MCAs.
As stated during national and state KIIs, projects are formulated at the grass-root level by the block level officials of the state and placed before the Block Level Committee, which consists of the block level head of PRI as chairman, BDO as co-chairman, block-level officers of
147 Ministry of Minority Affairs (2019), Guidelines for implementation of PMJVK , Last accessed on 16th March 2020

77
education/health/ICDS/welfare/leading bank/principal of ITI (if any) and representatives from reputed NGO/civil society. Many of the members in the BLC represent minority communities. Involvement of the target group directly into the life cycle of the project may slow down the process as there would be conflicting interests. As regards the involvement of MPs and MLAs at the time of needs assessment and during the project implementation, the public representatives of the MCA are already members of the DLC and SLC. Also, Gram Panchayat/Municipal bodies' involvement in the approval of the plans for MCB/MCT/COV/MCD has been reported across all sample states.
In Telangana, it was reported that the local representatives were always involved to ensure that they were aware of the projects being undertaken for their benefit. There is a district-level committee with MLAs and state-level committees with MPs. At the local level, sarpanches and the corporators are also involved. As for the community, the religious boards are involved, which have even helped in acquiring land for setting-up schools.
In terms of the involvement of MPs/MLAs, only 28 percent of the respondents informed that MLA/MPs were involved in the planning and implementation of the scheme, as highlighted in Figure 36. 36 percent of the respondents reported that MPs/MLAs do not play any role in scheme implementation. Assam and Maharashtra are the only few states where more than 50 percent of the respondents reported involvement of MPs/MLAs in scheme implementation.
States such as Punjab, Uttarakhand, Telangana, Maharashtra, Arunachal Pradesh, Gujarat, and Kerala reported that elected representatives of the minority communities participate in the needs assessment and planning of projects for districts. District officials reported that MPs/MLAs were a part of both district and state-level committees.
During state KIIs with Telangana, Maharashtra, Uttarakhand, Gujarat, Arunachal Pradesh, and Odisha, the evaluation team was informed that there is limited involvement of NGOs/private sector in the implementation process. Similarly, 44 percent of household respondents reported that there is no involvement of NGOs/private sector in the scheme. The participation of NGOs has been reported to be negligible due to the prioritization of government sector undertakings. NGOs are not allowed to implement the projects. They are usually involved in the DLC. In Kerala, NGOs such as MES and NGOs working for the Christian community are involved in planning out the projects.
Vetting of Proposals/DPRs: The evaluation team was informed during national KIIs that the DLC and the SLC do have the power to make changes in the proposals but, generally, the proposals, if found not in order, are rejected by these committees. The responsibility of vetting the proposal and DPRs mainly lies with the SLC. The SLC is supposed to ensure that the project is as per the guidelines
Source: KPMG Primary Data
Figure 36: Involvement of MP/MLAs in scheme implementation (N=608)
No response
28%
No 44%
Yes28%

78
of the scheme as well as ensure availability of encumbrance-free land, provision of state share, decide timelines for construction, analyse cost break-up ensuring that the same is as per SSR/CPWD, give an undertaking to the Ministry that the location of the project is within the identified MCA, etc. PWD engineers and private agencies are also involved at the state level in the preparation of DPRs. The SLC gets adequate technical advice from the state line ministry, the ministry dealing with minorities in the state, and technical bodies like the PWD/state corporations. At the ministry level, there is no adequate workforce/technical expertise to examine the DPRs. However, a technical expert from NAWADCO is engaged by the Ministry for the examination of proposals, and the representative of NAWADCO is also invited for the EC meetings for providing technical inputs. Hence, there are adequate provisions for technical examination of the proposals/DPRs. These project plans are forwarded to EC for further approval.
g) Factors crucial to the success/failure of the scheme
Limited Baseline/needs Assessment studies: Before any programme intervention, a comprehensive situational analysis needs to be undertaken to identify effective intervention areas/projects, and, establish baseline information (benchmarks) against which the programme outcomes can be measured. PMJVK falls short on this critical parameter.
As stated during national KIIs, there exists a provision in the PMJVK for conducting a state-wise baseline survey of the MCAs to assess critical gaps in MCAs. A baseline survey has been undertaken in some of the states with funds provided by the Ministry. However, assessment of the needs of an MCA is a continuous process that is regularly undertaken by the local state government officials, the Block Level Facilitators (BLFs) appointed by the states with central, local public representatives, NGOs operating in the area, etc. Depending on the availability of funds at the central and state level, the states choose critical areas that require immediate attention and accordingly propose projects. The evaluation team has been informed that the baseline survey data is not available with the Ministry.
Also, state and district officials reported that needs assessment studies are not undertaken. Block-level officers/MPs/MLAs identify the gaps and needs of village people, and accordingly, the demands are made. Based on those demands, DPRs are prepared by DLC. State officials reported that the Centre has suggested no fixed baseline survey procedure. The guidelines call for a baseline survey to be done. However, the modalities for conducting the study are not very well laid out in the guidelines, which could be a reason for baseline surveys not being conducted across states. To approve any project based on existing gaps in the district, Ministry compares the available Ministry of Education (MoE), Ministry of Health and Family Welfare (MoHFW), etc. data to check whether the community is actually in need of a school, PHCs, Anganwadi Centres (AWCs), etc.
Delays in submission of UCs: The 4th Standing Committee report148 stated that for any construction project under PMJVK to initiate, availability of free land, basic facilities such as electricity, water are the pre-requisites. Also, states/UTs follow a procedure for awarding work to implementing agencies, which affects the timely execution of projects. Also, big construction projects have a longer gestation period.
148 MoMA, GoI, (2020), 4th Report of Standing Committee on Social Justice and Empowerment: Demand for Grants 2019-20, Last accessed on 14th July 2020

79
Shortage of resources: District officials informed about a shortage of technical human resources in the department. Also, they stated that the available technical staff lacks the technical knowledge required to prepare a DPR. Bihar district officials informed that they get Rs. one lakh per year for running the office. They have 3-4 regular staff in the office, which is inadequate. They do not have support staff at the block level. State officials have reported that the allocated administrative cost is significantly less. Also, a shortage of resources in the facilities developed under the PMJVK was reported in the FGD at Panisal village, Kishanganj district of Bihar.
● Efficiency
To ascertain whether the resources made available to the projects have been used appropriately and efficiently, the efficiency of processes and achieving the outputs and outcomes have been analysed. Further, the adequacy of the budget and financial performance of the scheme has been discussed in this section. While it is clear from the KIIs with MoMA officials that implementing states/UTs have been able to utilize their project budget to a varying degree, it is also evident that the efficiency with which they have delivered/are delivering against the programme outputs and outcomes is heavily dependent on the institutional structure of the implementing agency. Discussion with MoMA officials, however, indicates that the budget allocation for various projects varies from state to state, and the percentage of budget allocated to a project is observed to have a positive association with its reach and effectiveness. The following section discusses some of the important parameters of efficiency.
a) Efficiency of systems and processes in PMJVK
Provisions related to creating awareness among minority communities through transparency and dissemination of information have been built into the scheme by including an online module and geotagging of projects. Efforts have been made to bring all states and UTs under the Public Finance Management System (PFMS) and use the system to monitor fund utilization.
Accountability: Before any PMJVK facility is sanctioned, data is cross verified, such as whether there is a demand for additional classrooms or enrolment of minority students in the school. District officials informed that baseline information is collected for the minority population. For example, district officials in Bihar reported that the baseline data is collected from District Rural Development Agency.
Transparency: As per the guidelines of PMJVK,149 it aims to ensure that the information of the projects is reaching the target group with the help of print media, audio-video publicity, outdoor publicity, and media campaign. This ensures greater transparency and publicity of information. However, only one percent of the total budget is allocated for Information Education Communication (IEC) activities, Project Monitoring Unit (PMU), baseline survey, and other expenses at the central level. Therefore, creating awareness among minority populations rests with the implementing states/UTs, as per guidelines. Also, district officials confirmed that the status of physical progress is available in the public domain.
Project MIS and Monitoring: The guidelines of the MsDP, as well as the PMJVK suggest the following monitoring methods for projects approved under the scheme:
149 Ministry of Minority Affairs, (2018), Guidelines for implementation of PMJVK, Last accessed on 16th March 2020

80
Table 7: Status of monitoring mechanism under the scheme
Monitoring mechanism Operational/Non-operational Views of the sample states
Monitoring through the committees constituted at various levels, starting from block to the Centre
Operational District officials informed that BLC monitors the programme at the village level, and a quarterly progress report is sent to the DLC of 15 Point Programme by BLC
Monitoring through Project Monitoring Unit to be set-up at the Centre
It is under consideration. At present, the projects are monitored by the section manned by the Ministry's contractual and regular staff. The Cabinet has approved the setting-up of a PMU as part of the restructured programme implemented as PMJVK and the matter is under active consideration of the Ministry
A web portal to be put in place for online monitoring
Available online. Ministry is at an advanced level of talks with ISRO for Geo Tagging of all the assets created under the scheme so far and those to be approved in the future
State and district officials informed that there is a central dashboard maintained by Ministry for which states share data with the Ministry regularly
The IT cells created at the state level with Ministry funds to form an integral part of the monitoring mechanism
Operational as per states’ requirement
Sample states do not have any IT cell
Monitoring through independent agencies or qualified monitors
Option available with states/UTs Sample states reported that they do not have any third-party monitoring system
Monitoring through conferences at the national, regional, state, or district levels and officials’ visits to the project sites
Operational State and district officials reported that they regularly interact with centre officials to discuss the physical progress or any other issues
Monitoring with the involvement of community through social audit mechanism
Option available with states/ UTs. Performance audits have been conducted by Comptroller and Auditor General (CAG)
Monitoring information dissemination and status of implementation through the
Option available with states/ UTs Sample states are unaware of such a monitoring mechanism

81
Monitoring mechanism Operational/Non-operational Views of the sample states
District Development Coordination and Monitoring Committee of Ministry of Rural Development (DISHA) framework
Source: KPMG Analysis
The MoMA is in the advanced stages of developing an MIS for the project. A simple dashboard is currently in place150. However, it only provides information related to the projects approved since inception, the progress of projects, data on funds released, and visualization of projects being implemented. The MIS does not allow monitoring of the performance of functionaries implementing the programme. Further, it does not support MoMA officials to monitor the key outcome indicators. As per discussion with MoMA officials, complete information of asset users is currently unavailable (across villages/MCAs). This reduces the efficiency of the MIS.
Use of IT in Driving Efficiency: A web portal has been put in place for the submission of project proposals, progress reports, and other government documents online regularly. However, the states are currently not uploading progress reports and UCs on a real-time basis, and MoMA shared the same during KII. 43 percent of the respondents were unaware of any involvement of IT/technology usage under the scheme, as highlighted in Figure 37. Geotagging of projects has recently started in the year 2019. As informed during state and district KIIs, currently, states are geotagging those projects that have been sanctioned in the year 2019. Arunachal Pradesh has developed a state monitoring app that is used for geo-tagging of projects under the scheme. Geotagging has been reported to have not begun in the Sitamarhi district of Bihar.
Box 3: IT Initiatives of Arunachal Pradesh
150 (https://moma.dashboard.nic.in/DashboardF.aspx)
Source: KPMG Primary Data
Geotagging is done before, during and completion with photographs, before money is released under PMJVK. Arunachal Government has developed a monitoring app named, ‘Arunachal Monitoring’ which is used for Geo tagging and photos. The data is collected and uploaded directly on the portal. A 50% release of funds has been released for that, so when district propose for the remaining 50%, then states ask for photographs of current status, and districts upload photos and then later on when states want the authorization, they would ask for photos at that stage. So, this is digitally as well as physically monitored along with the committee, so there are three layers of monitoring. All infrastructure on the field is being mapped with digital mapping, MIS. Source: State and District KII, Arunachal Pradesh
Figure 37: Usage of IT under PMJVK (n=338)
No response33%
No 35%
Yes 32%

82
Box 4: Directorate of Minorities, Karnataka: Use of ICT (Information and Communications Technology) for simplicity of operation and handling of public records
Unlocking synergies with other government programmes/state governments: PMJVK works alongside Prime Minister’s New 15 Point Programme. Both the schemes are being implemented through the same department in the state government/UT administration. Besides, the local body's plans for Minority Concentration Town are submitted to DLC for Prime Minister’s New 15 Point Programme.
b) Utilization of budget
Being a part of the Core of the Core Scheme for Development of Minorities, the programme has an average annual outlay of more than Rs. 1,400 crores (2019-20). This is approximately 30 percent of the entire budget of the Ministry and one of the largest financially backed CSS in India (Table 8). Adequacy of the budget is an important parameter to develop large social and economic infrastructure projects, and the programme has the necessary support and attention from the Ministry in this aspect. However, the financial utilization has been less than the budget over the years and has been discussed below.
To address issues such as shortage of human resources at state/district level, as well as lack of accountability and transparency, State Minority Department of Karnataka introduced user-friendly applications and incentivized state/district officials for greater participation and better performance. Also, the state has been reported to be one of the top performing states under PMJVK during national KIIs. The state has undertaken innovative solutions to ensure on-time delivery of projects, as well as generating awareness through involvement of NGOs.
Karnataka Minorities Department adopted strategies to bring about transformation and positive impact:
Use of Information Technology – NIC (National Informatics Centre) developed the state minority website where details related to all the schemes, progress reports, as well as PMU data is available in a comprehensive manner.
Capacity Building and Training- The department also provided training to 30 district welfare officers and 60 data entry operators on the usage of applications.
Information Centres- In order to generate awareness about the schemes undertaken by the state department, information centres have been set-up to assist minority beneficiaries.
Concurrent Evaluation- The department proactively shares data with Karnataka Resident Data Hub and also conducted training for all district welfare officers and data entry operators.
Involvement of NGOs: NGOs have played a significant role in implementing minority schemes in the state. NGOs such as Karnataka Zakat Foundation, Cigma Foundation, Talent Research Foundation, Rayan Foundation, Millat NGO, etc. create awareness about minority schemes in the minority-dominated areas.
IT initiatives undertaken by the state department have increased efficiency of outputs/processes and have led to timely reporting of physical progress under the PMJVK scheme. Also, they have helped in greater coverage of beneficiaries as well as in achieving 98 percent utilization of the budget earmarked for financial year (2017-18) for the department. Around eight schemes in the department have been made online since 2016-17. The shortage of resources at district level has also been addressed through district information centres which are well equipped with staff. The shift from paper-based to data-based system has led to faster dissemination of information amongst stakeholders, ease of data sharing with different stakeholders, reduction in paper-based documentation and greater transparency. Source: State KII, Karnataka

83
Table 8: Outlay and expenditure (Rs. in crore) of MsDP/PMJVK in past 5 years
2014-15 2015-16 2016-17 2017-18 2018-19 2019-20
Budget Estimates (BE) 1250 1251.6 1125 1200 1320 1470
Revised Estimates (RE) 770.94 1126.6 1125 1200 1320 1700
% Utilisation between BE and RE
61% 90% 100% 100% 100% 115%
Actual Expenditure 768.21 1120.33 1084.63 1197.07 1156.1 1698.29
% expenditure by RE 99% 99% 96% 99% 87% 99.89%
Source: MoMA
The funding pattern for gap-filling projects under PMJVK is the same as followed in the concerned schemes of the line ministries. The funds are released in two installments of 50 percent each. The second installment is released on the utilization of 60 percent of the first installment (within 12 months from the end of the financial year) and the release of the corresponding share by state/UTs. State and district officials reported that 60 percent is the Central Government share and 40 percent is the state government share. No challenges are faced in receiving funds from the Centre, but delays occur in fund disbursement from the state government. District official of Punjab informed that one of the proposals sanctioned from the Centre was not implemented in the block due to non-receipt payment from the state government.
Also, a look at some of the sanction orders related to MsDP posted on the MoMA website reveals that the second installment of projects approved in 2012 or 2014 is being released in 2018.151
Box 5: Issue of delays in planning and implementation mechanism
An analysis of the spending pattern under CSS and share of central grant indicates that the Centre’s share, at approximately 60 percent, in CSS was the least for Telangana and the highest for the Hilly
151 Sanction Order dated 18-06-2018 / Uttar Pradesh / Aligarh and Bijnor Block/ reference Ministry’s sanction letter 3/19(21)/2012-PP-I and 3/19(46)/2013-PP-I
The Committee found that during 11th Plan allocation of Rs. 3,780 crores for MsDP was provided for, of which Rs. 2935.93 crores had been released to various States/UTs till 31.3.2012. In 11th Plan, Bihar utilized 71.58 % of the funds allocated to the State under the programme. The Committee also found that during 12th Plan the States of Assam, Manipur, Haryana, Karnataka, Odisha, and Telangana utilized only 4.44%, 7.67%, 12.82%, 7.84%, 23.03% and 12.59 % of allocated funds, respectively. The Committee noted that the low utilization of funds is mainly due to long gestation period of some projects, non-availability/ dispute of land, cost escalation, delay in transfer to funds by the States to the implementing agencies. The Committee recommended that the Ministry should tackle these issues at various levels with the State Governments and other Ministries so that the funds allocated for the schemes are utilized by all the State Governments fully”.
Source: Ministry of Social Justice and Empowerment, (2018), 62nd Report Standing Committee on Social Justice and Empowerment (2017-18), Last accessed on 14th January 2020

84
States, North-East Region, and union territories. Understandably, states with the highest minority population in the country like Uttar Pradesh, West Bengal, Bihar, and Assam were allocated most of the funds. Cumulatively, these four states have a total approved project value of more than Rs. Eight thousand crores over the lifespan of the scheme.
District officials of the Sitamarhi district of Bihar reported that only 50 percent of the budget had been spent due to delays in project implementation. Infrastructure projects take a lot of time due to land conflict, tendering process, cost escalation issues.
In Telangana, for toilets and Anganwadis, the funds requested were way less than what was required. Therefore, either the state or the centre was needed to allocate more funds, which could not be decided. All of this led to lower utilization of funds between 2016-17 to 2019-20.
Kerala state officials informed that there are issues in project completion. The technical sanction is a major issue in terms of implementation. Delays happen due to various process approvals—for example, delays in receiving sanction orders from coastal zone authority. Also, raw materials are scarce in hilly areas and rugged terrain such as Wayanad.
‘Delays in completion of projects usually happen due to limited working season’
-Director, SJETA, Arunachal Pradesh
‘Delays usually happen in the approval of tenders.’
- Deputy Secretary, Minority Department, Gujarat
c) Time over-run of projects
As per KIIs with MoMA, project time over-runs have been one of the significant challenges faced by executing as well as implementing agencies in ensuring timely completion of projects. These over-runs vary from a few months to up to four years, placing the project viability at risk. Also, funds for the sanctioned projects are released by the Ministry immediately after approval. The first installment of the central share is released within 10–15 days of approval of the project. The second installment is released after full utilization of the first installment by the states/UTs/central organizations and furnishing of UCs with QPRs and photographs of the assets under construction. During state KIIs with Telangana, Maharashtra, Arunachal Pradesh, Gujarat, Kerala, Odisha, and Uttarakhand, the evaluation team was informed that there had been no delays in the release of funds from the Centre.
As per discussion with officials from MoMA, there is no mechanism in place to control cost and time over-run. Though the guidelines recommend states to bear the cost escalation on account of delays/time over-runs in implementation, however, extant literature reveals that in many cases, the projects which witnessed cost escalation and delays were dropped since states could not arrange additional finance. New projects were proposed in their place, and the states/UTs returned to the initial starting point (proposal phase). In certain cases, the replacement project/asset has been proposed in a different location, reducing the potential benefits for the originally proposed MCA population. As per discussion with MoMA officials, state and district KIIs, some of the key challenges faced have been the following:

85
Some projects have reported changes in site location and finalization of project design, leading to delay in construction. This has led to time over-runs due to changes in site location, as has been observed in states such as Sikkim, Tripura, Mizoram, and Arunachal Pradesh. The main reasons that have been cited for change in site location include geographic remoteness of the project site, inappropriate assessment of geological and topographical factors at the proposal stage, unavailability of land, non-participation of local institutions/leaders.
Box 6: Status of implementation of PMJVK projects in Assam
● Impact
PMJVK aims to improve the socio-economic conditions of the minority communities through affirmative action so that the marginalized have access to better amenities and opportunities to participate in society. The scheme is operational in 32 states and UTs, indicating wide acceptance and participation of implementing states. While MsDP was implemented in 27 states, five new states/UTs (Himachal Pradesh, Tamil Nadu, Nagaland, Goa, and Puducherry) have started implementing the programme recently. The outreach of the programme has increased manifold.
States have been requested to submit big proposals that would have a substantial impact in the MCAs such as new schools, hostels, residential schools, colleges, ITIs, polytechnics, working women hostels, health-related projects, skill development projects, common service centres, etc. Due to the intensive efforts of the Ministry, proposals have been received from all implementing states/UTs (including new states).
Unlike MsDP, wherein only state government/UTs could implement projects, PMJVK allows central ministries/organizations, central/state universities, CPSEs/undertakings, defense organizations, and armed police forces/central paramilitary forces to act as implementing agencies in addition to states and UTs. Under MsDP, only government/government body land could be used for construction. Recognizing that finding encumbrance-free land within MCAs is a challenge, Ministry has allowed construction on Waqf Board land, land of central organizations, land of central/state universities, and the land of minority communities on lease.
Focus is on local area development: Realizing that the district is too big a unit for planning, MoMA switched to blocks as a unit of planning, funding, and implementation of projects. Ministry has also taken steps for convergence of the PMJVK scheme with other schemes of GoI in priority sectors i.e. education, health, skill development, and women-centric projects. The Ministry has taken affirmative actions to ensure utilization of grants under PMJVK. Some important measures are:
The Committee observed that there are a number of projects from the 11th plan which have not even started and requested the representative of the State for the reason for delay. The representative of the State informed that few of the projects could not be started due to cost escalation and the State is preparing alternate proposals for those projects. The committee also observed that number of completed projects is very low and there are many projects for which status is not reported. The representative stated that funds could be released by the State Government only in 2016-17, which has caused the delay in the implementation of 12th plan projects. As regards bigger projects like ITI, Polytechnics and Hostels, the State has been directed to submit the status to the Ministry on priority basis. Source: MoMA, (2018), EC Minutes, Second EC: Review of Projects in Assam

86
a) intimation and follow-up with states/UTs for submission of fresh proposals; b) pursuing submission of pending UCs so that subsequent releases could be made; and c) regular review meetings with states/UTs through EC meetings to expedite implementation
of projects
As mentioned, the rubric of PMJVK centres around a “hitherto neglected minority area development” approach, wherein interventions have been made in multiple sectors such as creation and improvement of social and economic infrastructure, providing better access to amenities such as drinking water, sanitation, health, nutrition, electricity, housing and building the capacity of minority communities for employment through education, skill development, and empowerment. Considering this basic rubric of the programme, the scheme has had a positive impact on infrastructure facilities development. The field study data reveals that respondents identified several items, all flowing out of PMJVK, as highlighted in Figure 30. Starting from improvement in school enrolment status to health care facilities or improvement in job/livelihood, the recorded data confirms the impact of PMJVK on their day-to-day life. However, it is to be noted that not every individual has reaped benefits in minority populated areas.
Access to educational institutions, health care, safe drinking water and sanitation, facilities- Impact on life quality: When respondents were asked whether they have benefitted from the facilities or not, the majority of the respondents informed that they have indeed benefited from the facilities available in their village/area, be it health, sanitation, education, drinking water supply, or Anganwadi centres. However, skill development programmes and hostel facilities have created a limited impact as compared to other sectors. Health, education, and sanitation infrastructure have made the maximum impact compared to other infrastructure projects, as highlighted in Figure 38. District officials of Assam reported that drinking water and sanitation projects such as toilet facilities, handpumps, tube wells had improved access to safe water, sanitation, and hygiene.
Figure 38: Perception of facilities being beneficial (in %) (n=252)
Total respondents
Bihar Kerala Maharashtra Odisha Punjab Uttarakhand Assam
252 74 19 36 31 23 16 53
Source: KPMG Primary Data
In terms of change in the situation of villages after the initiation of PMJVK, more than 50 percent of respondents reported that the number of schools increased in states such as Uttarakhand,
67% 71%84% 89% 95% 95% 96%
33% 29%16% 11% 5% 5% 4%
Hostelfacilities
Skilldevelopmentprogrammes
Nutrition DrinkingWater Supply
Sanitation Education Health
Beneficial Not beneficial

87
Maharashtra, and Bihar. Enrolment of children in schools has also improved in these states. More than 50 percent of respondents reported no change in the situation, in states such as Assam, Telangana, and Kerala, in terms of school infrastructure. However, the enrolment of children in schools has recorded significant improvement in the sample states, except Punjab. Punjab is the only state where 79 percent of the respondents reported enrolment of children in schools to have shown no improvement.
State and district officials of Uttarakhand, Telangana, and Kerala reported that under PMJVK, free bicycles were given to girls that made their travel to schools easier and boosted their morale and confidence.
In the context of primary education, additional classrooms were reportedly built in all the states. In total, around 42,390 classrooms were constructed across the states covered. Apart from ACRs, school buildings and teaching aids have also been sanctioned across the majority of sample states.
“Two additional classrooms were built in Narayanpur High School under the scheme. Community toilets were built, and houses were provided to families. This has led to up-gradation of the village and brought in positivity among the people to do something good for the village.”
-FGD, Narayanpur, Nalbari, Assam
“Construction of lower primary school buildings under MsDP. Increase in enrolment of minority students in schools has been observed in the last 3-4 years.”
- FGD, Bhadra Bangal, Nalbari, Assam
“With the construction of the school in the village, more students are attending regular classes.”
- FGD, Loharkatha, Nalbari, Assam
Education-related assets have a strong correlation with the perception of the quality of the asset and satisfaction with the same, as highlighted in Figure 39.
Figure 39: Analysis of the satisfaction with “quality of educational asset” and perception of being “overall beneficial” (n=103)
Source: KPMG Primary data
Areas with education-related assets show a markedly higher proportion of respondents saying that the situation has improved/got better for the number of schools, enrolment of children in school, and the number of students going for higher education, as highlighted in Figure 40.
66% 93%
34% 43%
Overall Satisfaction with Asset
Asset Rated Beneficial
Asset Rated Not Beneficial
Education Assets
7%
57%
Not satisfied with Asset

88
Figure 40: Comparison of areas with an education related asset to those without an education asset {N= 608 (overall); n=103 (with education asset)}
Source: KPMG Primary data
Health-related assets have a strong correlation with perception of the asset's quality and satisfaction, as highlighted in Figure 41.
“Health centres have been built under PMJVK. Since the health centres have been constructed, we do not have to go far in case anyone in the family falls sick. Also, medicines are easily available.”
-FGD, Kishanganj, Bihar
However, 34 percent of the respondents rated the facilities as ‘not beneficial’ and ‘dissatisfied’ with assets quality. District officials informed that there is a shortage of human resources to run the facilities.
Figure 41: Analysis of the satisfaction with “quality of health asset” and perception of being “beneficial” (n=45)
Source: KPMG Primary data
Health facilities have improved in states such as Telangana, Maharashtra, and Assam. However, there has been no change in states such as Uttarakhand, Punjab, Odisha, and Kerala. Areas with health-related assets show a higher proportion of respondents saying that the situation has improved/got
2%11%40%
50%
58%39%
WithEducation
Asset
Overall
Perception of Number of Schools
Better
Same asBeforeWorse
9%12%17%
26%
74%62%
WithEducation
Asset
Overall
Perception of Enrolment of Children in School
Better
Same asBeforeWorse 25%23%
33%31%
42%46%
WithEducation
Asset
Overall
Perception of no. of children dropping from
school
Better
SameasBefore
71% 97%
29% 31%
Overall Satisfaction with Asset
Asset Rated Beneficial
Asset Rated Not Beneficial
Health Assets
3%
69%
Not satisfied with Asset

89
better with respect to the number of clinics/hospitals, the incidence of communicable and non-communicable diseases, as highlighted in Figure 42.
Figure 42: Comparison of areas with a health-related asset to those without health-related assets {N= 608 (overall); n=45 (with health asset)}
Source: KPMG Primary data
Socio-economic impact of skill development training in the beneficiaries’ day to day life: Skill development programmes created a positive impact till the 12th Five Year Plan. Since 2017-18, skill development is not a priority sector. There is no significant improvement in the livelihood status of the respondents in states such as Telangana, Punjab, Maharashtra, Kerala, and Bihar. Minority concentrated districts both in Bihar and Assam have not launched skill training programmes since inception.
● Sustainability
The evaluation team has based its analysis of the sustainability of the scheme on two key categories, i.e., the sustainability of outputs, whether the assets created under the project will sustain in the future, and mechanisms adopted to implement and monitor the scheme
a) Implementation risks and mitigation measures
The recommendations in the 66th Standing Committee Report, mainly about the identification of beneficiaries; monitoring mechanism; projects of central agencies; providing basic amenities for Health workers; electrification and road connectivity of MCAs; backwardness of MCAs; advisory to states for inviting members of parliament for SLC meetings; utilization of funds by states/UTs; assessment of the programme; provision of online modules; and proper dissemination of information to all, have been accepted and action was taken by the Ministry. As a follow-up, Ministry has sanctioned several projects related to accommodation for medical workers, projects of central
2%19%
27%
46%
71%
35%
WithHealthAsset
Overall
Perception of Number of govt. clinic/hospitals/health
clinics
Better
Same asBefore
Worse7%
20%20%
32%
73%
48%
WithHealthAsset
Overall
Perception of management of
communicable diseases
Better
Same asBefore
Worse 22%17%
20%35%
58%48%
WithHealthAsset
Overall
Perception of management of non-
communicable diseases
Better
Same asBefore
Worse

90
agencies viz Aligarh Muslim University, Kerala Central University, Kendriya Vidyalaya Sangathan, Navodaya Vidyalaya Samiti, etc. States/UTs have been advised from time-to-time to ensure the participation of nominated MPs in the SLC meetings. The Empowered Committee regularly reviews the progress of construction of projects and also utilization of funds with the states/UTs. To strengthen the monitoring mechanism, adequate provisions in the guidelines have been inserted.
Reduction in housing projects since 11th and 12th FYP (Para no 2.25):152 PMJVK is primarily an area development scheme with provision for the creation of infrastructure projects as community assets. With the Cabinet's approval, it has been decided that individual beneficiary projects such as housing will not be taken-up under the PMJVK. Such projects will continue to be taken up by the mainstream Ministry.
During the primary survey, household respondents were probed regarding the kind of facilities they would like to have in their village. Analysis of the responses shows that most of them preferred school building and toilet facilities in the vicinity as compared to other facilities, as highlighted in Figure 43. Also, state officials mentioned that certain areas are currently beyond the scope of the scheme, such as road construction, madrasas under education, etc.
There are certain issues highlighted by state and district officials that might affect the sustainability of the scheme, such as lack of skilled resources to prepare a DPR. DPRs are not designed based on needs assessment studies, baseline surveys, etc.
Figure 43: Facilities that villagers aspire to have in their village (in %) (N=608)
Source: KPMG Primary Data
152 Ministry of Social Justice and Empowerment, (2018), 66th Report Standing Committee on Social Justice and Empowerment (2018-19), Last accessed on 14th July 2020
86% 85%84%
81%80%
77%
75%
School building Toilet Drinking watersupply
Anganwadi ACRs Degreecolleges
Hostel
Percentage of respondents (Yes responses)

91
● Equity
Considering that the scheme's genesis is backed by Sachar Committee’s research and findings in 2006 around the condition of Muslims in India, the scheme, in design, is equity-focused and scores high on this criterion. PMJVK, in its design, endeavours to facilitate a socially secure and just environment for minorities. The infrastructure facilities and services aim to reduce inequity and make all minority groups feel safe, secure, self-reliant, and empowered.
Box 7: Facilities for ‘Divyang Jan’ and ‘Elderly’
a) Promotion of equity through the scheme
As per interaction with MoMA, 60 percent of the Muslim population is now covered by MCAs under PMJVK. With PMJVK focusing on affirmative actions for minorities, especially Muslims in MCAs, the scheme seems to be progressing with an equity-focused approach. The interventions aim at reducing discrimination and inequity by providing access to facilities and services.
Gender equity- Access to PMJVK facilities: 55 percent of the respondents reported that the scheme benefits are equally available to all community members. A special focus has been given to women. Construction of maternity delivery units in PHCs, CHCs, female toilets in schools, hostels, working women hostels, bicycles for girls have been reported across all sample states. Health facilities developed under PMJVK have improved the availability of basic health services, including regular health check-ups of pregnant women and new-born babies. The problem of educated unemployment or underemployment, particularly among minority women, has been reported in Punjab and Assam.
The majority of the Sikh households responded that they have participated in scheme-related trainings and meetings, as highlighted in Figure 44. Christian and Muslim households reported limited participation in IEC activities.
Figure 44: Equity in terms of participation in trainings, meetings related to the scheme (n=338)
Source: KPMG Primary Data
Exclusion of MCAs from the scheme: Exclusion of MCAs has been reported in two states namely, Uttarakhand and Maharashtra. In Uttarakhand, a block named Sahaspur, where 30 percent of the
30%
63%
23%
64%
32%
48%
6%
5%
29%
Islam
Sikhism
Christianity
No response No Yes
Para No. 9.12 of PMJVK guidelines states that the infrastructure constructed under the scheme should be barrier-free and accessible to persons with disability and should follow the guidelines and space standards of Barrier-Free Built Environment for persons with disability and elderly persons as published by Central Public Works Department, Government of India.

92
population is a minority, gets excluded as per the criteria set under PMJVK. Certain pockets in Maharashtra, where there is a high Muslim population, do not fall under the scheme's ambit. However, covering more areas under PMJVK has been taken up in the EFC of the scheme for the next five years, w.e.f. 2021-22.
● Cross-sectional analysis
This section assesses the scheme on various cross-sectional themes. The assessment is supported by findings from available secondary data on the scheme, and KIIs conducted so far.
Table 9: Cross-sectional thematic assessment of the scheme
S No Theme Analysis 1 Accountability & transparency
Availability of data records and reports in the public domain
● Physical and financial progress data is available in the public domain
● Quarterly progress reports are shared with Ministry through the online portal
● Ministry does maintain EC minutes on the website
Planning and monitoring mechanisms
● Central-level: EC -EC considers and approves plans of MCD HQs/MCBs/MCTs/COVs received from the states/UTs/central organizations. It also monitors the implementation of the programme as the Oversight Committee
● State-level: SLC - Scrutinizes block/town/cluster/village plans submitted by DLC
● District level: DLC - Facilitates the preparation and implementation of district plans and ensures effective monitoring. Scrutinizes plans submitted by BLC and submits them to SLC
● Block-level: BLC - Prepares the plan of MCB/COV as well as monitors the programme at block/cluster of village level
● MoMA has developed an online monitoring system ● States submit progress reports through the online system ● As discussed during national KIIs, monitoring is carried out
through the committees constituted at various levels, starting from block to the Centre
Evaluation mechanisms ● The last evaluation study was done during 2017-18 by the
Indian Institute of Public Administration
Citizen accountability
● MoMA does not have a project/scheme-specific, but a central citizen/client, the charter that captures all schemes
● Ministry has the grievance redressal and Right to Information (RTI) filling mechanism in place. As confirmed during national KIIs, these mechanisms are functioning effectively
● RTI section of the Ministry Website has proactive disclosures on various datasets such as institutional arrangements, the budget allocated to each programme/agency, Particulars of facilities available to citizens for obtaining information, etc

93
S No Theme Analysis ● Also, details of Central Public Authorities are available under the
RTI section ● For any sort of grievances, Ministry has a ‘Samadhan helpline’
with all necessary details available on the Ministry website
Financial accountability
● The funds are released in two installments of 50 percent each, and the second installment is released on the utilization of 60 percent of the first installment (within 12 months from the end of the financial year) and release of the corresponding share by State/UTs
● The second installment is released after full utilization of the first installment by the states/UTs/central organizations and furnishing of UCs with QPRs and photographs of the assets under construction
● As informed during national KIIs, pending UCs is largely under control, except for some states in the NE
Field visits by programme managers
● BLFs are engaged on a contractual basis to keep an on-ground check of the projects being implemented under the programme
● BLFs prepare the progress report and other required reports for the programme
● Facilitates geotagging of assets to be taken up under the programme
● Facilitates getting PMJVK details and its updates under the DISHA framework
2 Direct/indirect employment generation
Employment generation
● As discussed with Ministry, the objective has never been to generate income for the people or contribute towards poverty alleviation in the MCAs. However, the scheme focuses on developing infrastructure for skill development such as ITIs, polytechnic institutes, skill training institutes
● Skill centres have been one of the priority community infrastructure projects
● Innovative projects such as Hunar Hubs have been allowed in MCD HQs for enabling artisans/entrepreneurs to carry out exhibitions/melas/food courts/skill training in MCD HQs. This asset maybe 100 percent funded by the Ministry. Market sheds for agricultural produces may also be constructed under PMJVK
3 Gender mainstreaming
Inclusiveness in scheme design/planning
● While MsDP did not cover women-centric projects, under PMJVK design, at least 33-40 percent of funds are earmarked for the creation of assets/facilities for women/girls, making the scheme more targeted and relevant for vulnerable women and girls
● Gender-friendly interventions are in place (bicycles for girls, hostels and schools for girls/women, and skill development training)
● Under community infrastructure, the focus is on developing working women hostels

94
S No Theme Analysis ● Gender budgeting is being practiced “For any programme, gender should be a cross cutting theme, not only at the planning, but also at the implementation and output level.”
- Social sector expert, CINI 4 Use of IT/technology in driving efficiency
Deployment of IT-enabled mechanisms for monitoring of the schemes
● MoMA has initiated geotagging and digitization of Waqf properties in all parts of the country so that such properties can be used for the welfare of the minorities
● Scheme MIS is currently being upgraded to capture disaggregated data related to schemes
● Lack of IT cell across states
5 Unlocking synergies
● Line ministry is involved by the EC during the consideration of new proposals of the state
● Efforts to converge the PMJVK scheme with other CSS implemented by the ministries/departments have been made by MoMA
● Ministry has been able to sanction new KVs, new JNVs in MCAs, and also sanction smart classes in KVs constructed with funds received from the MoHRD and already functioning in the MCAs
“The nodal agency does not operate independently, but often with different departments like education and health.”
-Social sector expert, Centre for Social Justice, Jharkhand ● There have also been efforts put into the convergence of the
scheme under which Anganwadi Centres are funded by the Ministry of Women & Child Development. Convergence has also taken place with the Ministry of Health and Family Welfare for the construction of CWCs, PHCs, PHSCs in the MCAs
6 Stakeholder and beneficiary behavioural change
Fund Allocation ● Ministry has a separate head of “Advertising and Publicity”
exclusively under PMJVK scheme wherein there is a provision of Rs. 2 crores in BE 2020-21
Mechanisms to promote and ensure behaviour change
● As per guidelines, Sadbhav Mandap (Bhawan) as innovative projects will be sanctioned that can serve as a platform for dissemination/awareness activities of various schemes and programmes of MoMA
● The asset is also used for social gathering, skill training, coaching, sports, etc
● Limited awareness observed, based on primary survey “Central government developed a lot of schemes, but the schemes are not known to people on the ground level. They only know about Maa Card, Ayushman Card, etc., but schemes like Nayi Roshni, MSDP are not known to them. Such schemes that can bring in significant changes on a large scale are not known at the ground level.”
- Social sector expert, Maa Education & Charitable Trust, Gujarat 7 Climate change & sustainability

95
S No Theme Analysis
Climate resilience ● Co-benefits approaches that are suitable for the local context
have been taken under consideration
Sustainable practices ● The focus is on developing large projects ● Effective waste management/end-of-life system is not in place
for resources used in the projects under the scheme
Awareness and capacity building
● Not a major focus under the scheme
8 Reforms & regulations
Adoption of models acts and reforms at governance, institutional and administrative level
● Revision of guidelines have contributed to the following: ⮚ better outreach ⮚ more focus on empowering women ⮚ greater emphasis on local area development ⮚ priority on long-term projects ⮚ access to encumbrance-free land ⮚ flexibility in choosing implementing agencies
This has led to the holistic development of minority areas 9 Impact on and role of the private sector, community, and civil society/NGOs in the scheme
Private sector participation
● As discussed during national KIIs, the PPP model has not been successful under this scheme. One of the major reasons for the failure of the PPP model is that handing over the asset to the private sector for an operation does not work out, as informed during national KIIs
● Assessing the needs of an MCA is a continuous process that is regularly done by the local state govt. officials, the BLFs appointed by the states with central, local public representatives, NGOs operating in the area, etc
● Limited participation of NGOs “The private sector, CSRs, NGOs can make a difference. There are not enough local bodies to implement the plans made in Delhi.”
-Social sector expert, Delhi University ● A technical expert from NAWADCO is engaged by the Ministry
for the examination of the proposals and the representative of NAWADCO is also invited for the EC meetings for giving technical inputs
10 Research and developments
● National Commission for Minorities conduct studies, research,
and analysis on the issues relating to the socio-economic and educational development of minorities
Source: KPMG Analysis
Legend
Satisfactory Needs Improvement Unsatisfactory Not Applicable

96
1.1.3. Issues and challenges
Based on the primary data, interactions with state/district officials, literature review consisting of scheme guidelines, past evaluation reports, Audit reports, insights gathered during a pilot visit, and a few other research documents available in the public domain, impediments to the effective implementation of the scheme have been highlighted in this section. The evaluation team has highlighted the challenges witnessed during the reporting period of 2014-15 to 2018-19. The interventions are in the right direction. However, the scheme must focus more on the “last mile” delivery. This section is written with that perspective.
• Design
The scheme focuses on education, health, and skill development, which is expected to reduce the development gap between the national average and the minorities with regards to backward parameters. The MCAs have been identified and monitored based on two groups of indicators - one relating to socio-economic indicators and the other relating to basic amenities. The four specific socio-economic indicators are (i) literacy rate, (ii) female literacy rate, (iii) work participation rate, and (iv) female work participation rate. The four indicators relating to basic amenities are (i) percentage of households with pucca walls, (ii) percentage of households with safe drinking water, (iii) percentage of households with electricity, and (iv) percentage of households with latrine facility within the premise.153
Appropriateness of key parameters of backwardness (Relevance): Regarding the percentage of households with pucca walls, it may be pointed out that in hilly MCAs such as Arunachal Pradesh, Assam, Mizoram, Uttarakhand, Ladakh, Jammu, etc., the type of housing is driven by the local climatic conditions. Socio-cultural practices and climate of these states, as well as states from coastal regions (Kerala, Gujarat, Odisha, West Bengal) or desert/border regions of Rajasthan, often determine the construction of a house. Therefore ‘pucca walls’ may have less significance (nationally) as a barometer for development.
Although the Ministry has issued directives regarding the “priority sectors”, however, the list of priority projects under these sectors have not been taken into consideration in the guidelines.
The basis of the scheme traces back to Sachar Committee recommendations in 2006. There have been no recent research studies conducted to identify the evolving needs of minorities.
• Implementation
DPR related issues (Effectiveness):
o Lack of skilled resources to prepare a DPR. o DPRs are not prepared based on needs assessment studies, baseline surveys, etc.
Institutional mechanism and governance (Sustainability): Shortage of workforce has been reported across states. States fail to conduct a proper baseline survey to identify the actual needs of minorities due to a shortage of skilled resources. District officials informed that there is a shortage of technical human resources in the department. Even if there is an adequate number of technical staff,
153 Ministry of Minority Affairs (2019), Guidelines for implementation of PMJVK, Last accessed on 15th July 2020

97
they lack in technical knowledge required to prepare a DPR. Bihar district officials informed that they have 3-4 regular staff in the office, which is inadequate. They lack support staff at the block level.
Fund flow efficiency and utilization (Efficiency): District officials reported that they do experience delays in fund disbursement from the state government. For example, a district official of Punjab informed that one of the proposals that got sanctioned from the Centre was not implemented in the block due to the non-receipt of payment from the state government.
Capacity building (Sustainability): Geotagging and MIS dashboards are recent IT initiatives undertaken by Ministry wherein states have been asked to geotag the projects that are in progress and completed. When state and district officials were asked whether any sort of training was provided for such IT initiatives, the evaluation team was informed that they did not receive any kind of training for such initiatives. Hence, they face difficulties in carrying out such initiatives.
Asymmetrical performance among states (Effectiveness): Rate of completion of projects varies across states. However, delays in project completion usually happen due to land conflict, tendering process, cost escalation issues, as reported by state and district officials.
• Impact
Measuring target group impact (Impact): The scheme aims to support infrastructure development in the identified MCAs, and there is a considerable lag between the project approval, construction, and commissioning. This may also impact the viability of the asset created for multiple reasons. In the absence of an MIS that can establish the count of the target population who have been impacted by the project, it becomes challenging to understand the real benefits from the scheme. For lack of assets user database, the asset created usage pattern is not determinable and cannot feed into the system to make evidence-based decisions. It is essential to assess whether the minority community can utilize the infrastructure so created. The non-availability of accurate data on minority families living below the poverty line does not allow the scheme to be restructured.
Institutional Mechanism and Governance
Fund flow efficiency and utilization
Unavailability of resource persons
Capacity Building Monitoring and Evaluation
Legend
High Medium Low

98
1.1.4. Key recommendations
• Design
Necessary
Suggested list of projects under priority list: Since the Ministry has already identified the priority sectors (health, education, skill development), list of priority projects that maybe be considered under priority sectors has been listed below:
o Health: PHC, CHC, Sub Health Centres (SHC), Anganwadi, mini-Anganwadi, diagnostic centres, Nutrition rehabilitation centre, generic drug stores, ambulance services, residential units for doctors and health care staff
o Education: Construction of schools, hostels, computer literacy centres/digital education centres, science laboratories in schools, basic support infrastructure - drinking water units, toilets in schools, slow learner centres, residential unit for centres
o Skill development: Skill development centres, ITI, polytechnics
‘Sports and sanitation’ as priority sectors: ‘Sports and sanitation’ sectors may be added as priority sectors since sports is a priority sector for the government, and sanitation projects have been reported to be a significant focus across all sample states.
Increasing coverage under the scheme: To ensure that projects should reach the minority communities across all states, all districts of North-Eastern states, Delhi, Ladakh, and Jammu & Kashmir may be considered.
Desirable
New research to identify development needs: New research for identification of evolving needs of minorities in the field of education, healthcare, skill development, protection of rights, and preservation of traditional art/craft/skills is suggested. The evaluation team understands that budget is available for the same, and the National Commission for Minorities may carry out research studies on areas that may be beneficial for the upliftment of the minorities. It may be pointed out that think-tanks and research institutions such as Tribal Research Institutes (for STs), Ambedkar Foundation (for SCs), National Institute of Social Defence (for OVGs) are essaying a similar role for other vulnerable groups. Based on the interaction with state/district officials, the evaluation team observed that there is certain MCAs that do not fall within the ambit of the scheme. The exclusion of MCAs can be an area of research that the Ministry could focus on in collaboration with the National Commission for Minorities.
DPR template: The guidelines should specify a structure or template for DPR that should include information on problems to be addressed by the project, information on target beneficiaries, legal framework, environmental impact assessment, the proposed date for commencement with PERT/CPM chart, risk analysis, financial and economic analysis, and sustainability. Since DPR is an important document for sanctioning projects, it is recommended that MoMA develop and circulate a standard template to capture project information on several important indicators for sanctioning a project.

99
Flexi-Fund to reduce asymmetry among states: Within the overall budget, 10 percent may be kept as flexi-fund and 90 percent as regular funding. Central and State governments may adopt a performance-linked financing model. Performance of projects may be defined as a combination of immediate results (outputs) and outcomes. Such a performance incentive-driven allocation mechanism can ensure self-correction by the states in key sectors.
A flexi fund proposal needs to be prepared if any state wants to avail the funds. The proposal should mention how innovatively (technology, PPP, etc) state plans to complete the projects on time. The impact of the project should be highlighted, and the focus should be on the idea and innovative solutions to solve local issues. MoMA may conduct flexi committee meetings two- times/once in a year where the proposals will be presented by states and discussed between MoMA representatives. Such a fund may be used for strengthening district-level machinery/infrastructure, engaging technical support (especially in large districts), and any other local need. The flexi fund should not be used for regular activities such as procurement of land, infra, etc. for which regular sources of the fund are available under the scheme.
The project/activities proposed for seeking flexi funds should address a local issue that impacts the lives of minorities. The impact should be quantified. MoMA would reserve the right to reject/accept proposals. Soft activities such as innovative communication or the use of tech (big data, analytics) to accelerate usage may be mentioned in flexi proposals.
Social and Behaviour Change Communication (SBCC): SBCC frameworks may be developed and used in areas where the need is felt (limited awareness, low utilization of assets in MCAs, etc.). Ministry may have different sets of approaches for other sectors being covered under the scheme. States may choose any approach based on their need. In case a flexi-fund (as per guidelines issued by the Department of Expenditure) is introduced/approved, the same may be used for innovative communication and awareness-building initiatives.
Public-private partnership model to link new or existing private institutes with rural facilities to address the issue of shortage of resources. Similar to Karnataka PPP policy for ‘Infrastructure Projects’ 2018, the model can be strengthened by establishing a PPP committee at every district. These committees can identify the procedural issues that PPP projects are likely to face at the local level. The deputy commissioner may head these PPP Committees.
Develop an Awareness generation plan that may be organised at the Gram panchayat level every month or every quarter. Camps may be organised at the gram panchayat level quarterly. Upon completion of the camps, the best panchayats in each district may be awarded at the district level.
• Planning
Necessary
Involve Gram Sabha/local bodies to conduct the baseline survey. They can prepare their needs assessment report, which may be submitted to the district level officers.
Also, the minority welfare department can coordinate with Zila Panchayat engineers or block-level engineers for the preparation of DPRs.
• Implementation

100
Necessary
User instruction manual on systems and processes: The Ministry has taken significant steps towards adopting technology to monitor the scheme. Hence, the evaluation team notes that a manual can be created so that the technical wing in the states dealing with the MIS or central dashboard of PMJVK can learn about different features available under the e-initiatives undertaken and use those effectively for better implementation of the scheme. MoMA may provide proper training as per training requirements of the state/UTs.
Partnership with NGO/private foundations/CSRs/CBOs in PMJVK: Most of the problems in PMJVK are around limited awareness of the scheme, which has come across uniformly; advocacy around socio-economic issues; lack of involvement of the community in O&M; and limited human resources. Partnership with relevant organizations may improve the sustainability and outreach of the scheme. Hence, as a starting point, state governments can develop a database of prominent NGOs/CBOs working in education, health, and other sectors. Once empanelled by the State government, NGOs/CBOs can focus on the soft components by creating awareness as well as undertaking baseline studies, needs assessment to understand the needs of minorities, advocacy around socio-economic issues, monitoring of the facilities, and reporting to the state government regarding the evident gaps that need to be addressed. Based on the list of NGOs available at ‘NGO Darpan’ site of NITI Aayog, the following list of NGOs have been suggested across sample states:
Table 10: Suggestive list of NGOs working on minority issues
Sample states List of NGOs
Arunachal Pradesh
• Sadhanarama Bana Vihara Foundation • Tawang District Youth Welfare Society • Monyul Buddhist Culture Preservation Society • Zion Mission
Bihar • Abdali Welfare Society • Rajdhani Samaj Kalyan Sansthan • Zakir Husain Mahila Vikas Mandal • AMS Educational and Welfare Foundation
Gujarat • Sanchetana Community Health and Research Centre • Lakshya Trust • Shree Swami Vivekanand Yuvak Mandal • Yuva Skill Foundation
Himachal Pradesh
• Madrassa Quadria Missarwala • Ramdha Buddhist Society • Family and welfare project society • Sarva Shiksha Foundation
Kerala • Mujahid Education Trust • Karunyavarsham Charitable Trust • Kripa Samithy • Nilambur Muslim Orphanage Committee
Madhya Pradesh
• Sathiya Welfare Society • Mudra Social Welfare Society • Aariola Prakesh Punj Shiksha Samiti

101
Sample states List of NGOs
• Rahini Samaj Kalyan Samiti
Maharashtra • Salam Educational and other welfare society • Udgir Taluka Yuva Vikas Sanstha • SAMPARC • Kalamnuri Viyamshala and KridaMandal Kalamnuri
Mizoram • Chhimtuipui Socio-Economic Development Organisation • Mizo Hmeichhe Insuihkhawm Pawl Serkhan Branch • Young Chakma Association • HOI PHILOI
Odisha • Rural Development Action Cell • Global Vision • Nilachal Seva Pratisthan • Development Action Society Foundation
Punjab • Gulzari Lal Memorable Charitable Society • Rehbar Foundation • Kaushalya Devi Educational Society • Christian Research and Aids Foundation
Telangana • Samdani Educational Society • Jagruthi Rural and Urban Development Society • Zenith Educational and Welfare Society • Asharafia Educational Society
Uttarakhand • Institute of Social Development • Malala Foundation • Himalayan Institute for Rural Awakening • Society for the Upliftment of Villagers and Development of Himalayan Areas
Source: NGO Darpan, NITI Aayog Note: This is not an exhaustive list.
Regular monitoring using the OOMF designed by DMEO: An online monitoring mechanism using which data on OOMF may be bi-annually shared by BLFs with the states. States may share the data with the Ministry annually so that performance based on OOMF is annually tracked by the Ministry.
• Sustainability
Assets user MIS: Such MIS will provide data with respect to the users of the assets created under the scheme. This data will also help in gaining insights about patterns of use and utility percentage of the assets. It may also provide answers to questions like, “can there be an alternate use of the asset when it is not being utilized for its primary purpose for a few hours?”. Periodical surveys of end-users from the community may be operationalized to capture their feedback and experience of using these assets and measuring their satisfaction. A Project Monitoring Unit may be set up to analyse the beneficiary level data and to generate progress reports from the MIS.
1.1.5. Conclusion
The scheme has contributed to reducing vulnerability among the minorities by securing socio-economic assets, together with measures for improving basic amenities in the MCAs. By ensuring a focus on minorities, women, youth, and children in its design, MsDP/PMJVK has reinforced inclusion

102
patterns. Importantly, its design and approach have evolved from MsDP to PMJVK, responding to the needs of minorities. The restructuring of the programme in 2013-14 has ensured greater focus on women-centric projects. Earlier, it was more welfare-oriented, but now it has shifted focus towards creating durable public assets with intergenerational benefits in education, health, and skill development. It is noteworthy to mention that the scheme covers the major socio-economic sectors such as health, education, skill development, and implements innovative projects such as Hunar haat and Sadbhav Mandap to ensure the welfare of minorities through ‘3Es’- Education, Employment and Empowerment. Hence, the scheme is relevant to the strategic priorities of India.
Chapter III. Conclusion 1.1. Synthesis of scheme NITI Aayog Package 10: Evaluation of CSS for Social Inclusion, Law and Order and Justice Delivery has evaluated one Scheme under the Umbrella Scheme for the development of minorities. The scheme's evaluation was carried out using a REEISE framework, which led to a holistic understanding of their performance and significance. The evaluation has observed that the scheme aims to improve the socio-economic conditions of minorities.
Attempts have been made by the scheme to reduce the gaps between minority communities and other groups, thereby promoting inclusive development. Despite experiencing challenges in implementing and monitoring the scheme, it is worth noting that the scheme has positively impacted minority communities. Also, state/district officials have revealed the importance of this scheme for the minorities. It has touched the lives of the minorities in the districts covered under this study.
However, it is worth noting that the present scheme’s success depends upon better coverage of the scheme. Also, there is a need to ensure adequate human resources as well as capacity building. There is a need to address such bottlenecks by developing mechanisms to allocate funds on time, to utilize funds optimally.
1.2. Summary of scheme rationalization The rationalization of the scheme has been analysed upon the following recommended parameters which are as follows:
Table 11: Rationalization based on recommended parameters
Parameters Performance
Schemes with similar objectives ● The scheme design is unique
Schemes that have lost relevance ● The scheme is highly relevant for the minority communities
Schemes with minimum prima facie impact ● The scheme is operational in 33 states and UTs, indicating wide acceptance and participation of implementing states. Prima facie impact is high
Schemes with similar implementation capacities
● Scheme implementation capacity is common for all the minority schemes

103
Parameters Performance ● There is a lot of convergence with the line department
for the implementation of the scheme
Schemes with overlaps ● No overlaps were observed
Schemes which require funding flexibility ● No issue observed in relation to funds under the scheme
Based on forward and backward linkages ● There have been efforts to converge the PMJVK scheme with other CSS implemented by the ministries/departments.
● Convergence with schemes of other ministries/departments such as convergence with Ministry of Human Resource Development for sanction of Kendriya Vidyalayas, Jawahar Navodaya Vidyalayas in MCAs, Ministry of Women & Child Development for sanction of Anganwadi Centres, Ministry of Health and Family Welfare for construction of CHCs, PHCs and SHCs in the MCAs, etc. Only the gaps are addressed under the PMJVK scheme
Based on value chain analysis ● No integration between minority schemes to address the inputs side and hence, shortage of resources
The summary of the recommendations for the rationalization of PMJVK under the current evaluation study is provided as follows:
Table 12: Summary of scheme rationalization
REESIE REEISE Sub -components
Performance Summary
Relevance
Scheme Design The scheme is well aligned with national priorities. Operational in 33 states and UTs. Parameters for the identification of MCAs are not well defined
Needs of the Community
Innovative Aspects
Scheme Revisions
Needs-Based Assessment
Aligned to National Priorities
Effectiveness
Outputs and Outcomes
Good coordination achieved at centre, state, and district levels. Limited awareness about the scheme and its facilities. Reduction in projects sanctioned: Discontinuation of individual beneficiary projects or
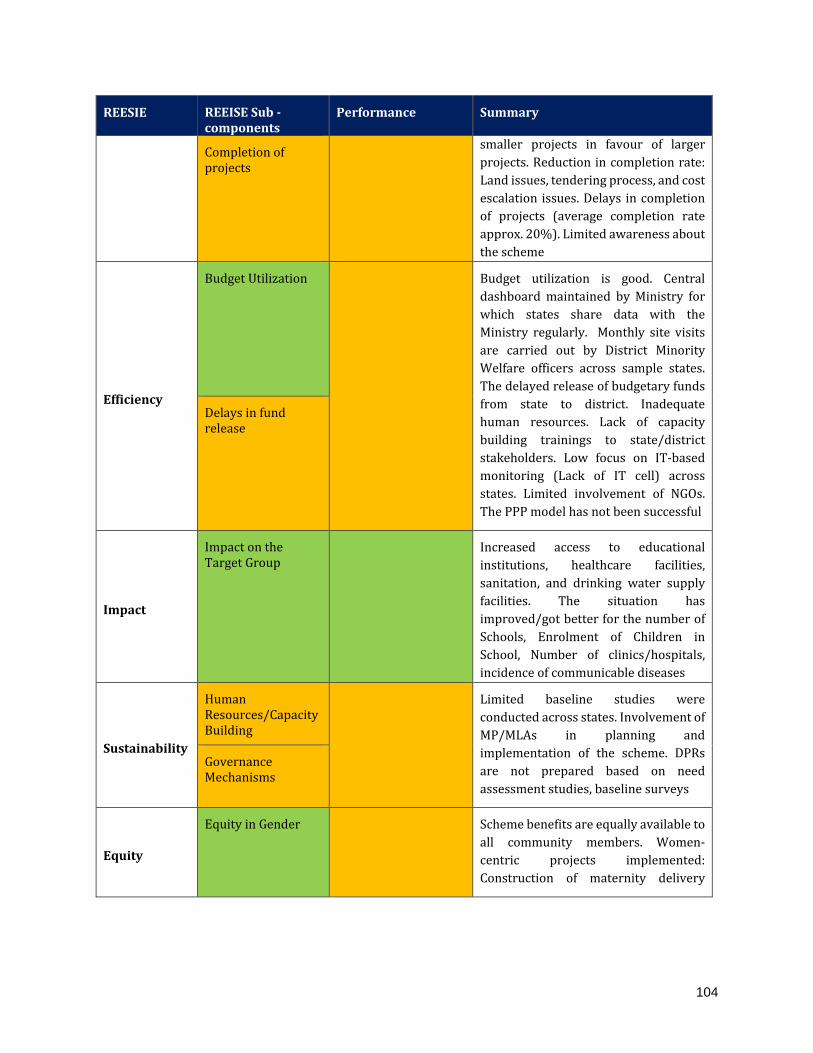
104
REESIE REEISE Sub -components
Performance Summary
Completion of projects
smaller projects in favour of larger projects. Reduction in completion rate: Land issues, tendering process, and cost escalation issues. Delays in completion of projects (average completion rate approx. 20%). Limited awareness about the scheme
Efficiency
Budget Utilization Budget utilization is good. Central dashboard maintained by Ministry for which states share data with the Ministry regularly. Monthly site visits are carried out by District Minority Welfare officers across sample states. The delayed release of budgetary funds from state to district. Inadequate human resources. Lack of capacity building trainings to state/district stakeholders. Low focus on IT-based monitoring (Lack of IT cell) across states. Limited involvement of NGOs. The PPP model has not been successful
Delays in fund release
Impact
Impact on the Target Group
Increased access to educational institutions, healthcare facilities, sanitation, and drinking water supply facilities. The situation has improved/got better for the number of Schools, Enrolment of Children in School, Number of clinics/hospitals, incidence of communicable diseases
Sustainability
Human Resources/Capacity Building
Limited baseline studies were conducted across states. Involvement of MP/MLAs in planning and implementation of the scheme. DPRs are not prepared based on need assessment studies, baseline surveys
Governance Mechanisms
Equity
Equity in Gender Scheme benefits are equally available to all community members. Women-centric projects implemented: Construction of maternity delivery

105
REESIE REEISE Sub -components
Performance Summary
Exclusion of MCAs units in PHCs, CHCs, female toilets in schools, working women hostels, bicycles for girls. Exclusion of MCAs have been reported in states such as Uttarakhand and Maharashtra
Way forward
Going forward, greater emphasis should be on needs-based assessment and a robust monitoring mechanism. It is also important to ensure adequate capacity building and sensitization to ensure the inclusion of MCAs. The scheme OOMF needs to be annually tracked and monitored by the Ministry. The scheme should introduce the following modifications for its rationalization and higher impact –
● Establishing baseline surveys across all states to ensure effective planning and will also help in measuring the impact of the projects
● Overall improvement of fund flow systems in terms of fund availability and utilization timelines by addressing human resource availability and technical skill gaps
● Strengthening institutional structure at the district level and below, investing in their capacity building and re-enforcing their critical role in scheme implementation and monitoring
● Improving the monitoring and results framework by undertaking periodic monitoring and evaluation of scheme interventions and their effect on end beneficiaries
Legend
High Medium Low
Based on the REESIE analysis, the current evaluation study analyses the performance of the scheme on the following components:
Name of Scheme
Scheme performance
(based on weighted analysis
of output, outcome, financial
performance of EESI+E)
Relevance of the
scheme
Summarize decision for
rationalization Way Forward
Pradhan Mantri Jan Vikas
Karyakram
Greater emphasis should be on needs-based assessment and a robust monitoring mechanism
Legend
To be continued To be merged To be discontinued

106
Annexure 1: List of Key Informant Interviews and Focus Group Discussions
S No Name of the Respondent Designation of the
Respondent Organisation/Department of the Respondent/District/State
National KII 1 Nigar Fatima Husain Joint Secretary Ministry of Minority Affairs 2 Ravi Sunder Deputy Secretary Ministry of Minority Affairs 3 Shubhendu Shekhar Srivastava Under Secretary Ministry of Minority Affairs 4 Avatthi Ramaiah Professor Tata Institute of Social Sciences
5 Sanjay Kumar Director Centre for the Study of Developing Societies
6 Yamini Aiyar Director and Chief Executive Centre for Policy Research
7 RR Prasad Advisor NITI Aayog 8 Pavithra Kumar Chief Program Director Tata Trust
9 Vaishali Kolhe Associate Professor Centre for Disability Studies, TISS Mumbai
10 Surinder S Jodhka Professor Centre for the Study of Social Systems, School of Social Sciences, JNU
11 Ram Puniyani Independent Expert 12 Abhijit Dasgupta Retired Professor Delhi University 13 Indrani Bhattacharyya CEO CINI
14 Mir Khan Social Sector Expert Maa Education & Charitable Trust, Sabarkantha, Gujarat
15 Zakia Soman Founder Bharatiya Muslim Mahila Andolan
16 SQ Masood Social Activist & Independent Expert
Association of Socio-Economic Empowerment of the Marginalized (ASEEM)
17 Ranu Jain Professor Tata Institute of Social Sciences 18 Birender State Coordinator Centre for Social Justice, Jharkhand
19 Gayatri District Coordinator Centre for Social Justice, Chhattisgarh
20 Mansingh District Coordinator Centre for Social Justice, Chhattisgarh
21 Rishi P Singh Retired officer National Productivity Council State KII
1 Yumlum Kaha Director Social Justice, Empowerment and Tribal Affairs Department, Arunachal Pradesh
2 Shahnawaz Qasim Directors Minority Department, Telangana 3 Dinesh Sonavane Deputy Secretary Minority Department Maharashtra 4 Raees Ahmad Deputy Director Minority Department, Uttarakhand 5 G P Patel Deputy Secretary Minority Dept. Gujarat
6 Moideen Kutty A. B. Director Directorate of Minority Welfare, Kerala

107
7 Ranjana Chopra Principal Secretary ST & SC Development, Minorities, & Backward Classes Welfare Department, Odisha
8 Poonam Guha Director ST & SC Development, Minorities, & Backward Classes Welfare Department, Odisha
District KII
1 Mitali Namchum District Collector Lower Dibang Valley, Arunachal Pradesh
2 R.K. Sharma District Planning Officer Namsai, Arunachal Pradesh
3 Saubodh Kumar District Minority Welfare Officer Kishanganj, Bihar
4 Pankaj Kumar Jaiswal Deputy Social Welfare Officer Sitamarhi. Bihar
5 Niranjan Kumar District Minority Welfare Officer Sitamarhi, Bihar
6 Deepak Arya District Magistrate Balaghat, Odisha 7 Lalzorama District Collector Mamit, Mizoram 8 Surendra Pandey District Magistrate Champawat, Uttarakhand
9 Harpreet Singh Senior Assistant, District Welfare Officer Gurdaspur, Punjab
S No Village District State
FGD 1 Towmura Nalbari Assam 2 Narayanpur Nalbari Assam 3 Bhadra Bangal Nalbari Assam 4 Chatama Nalbari Assam 5 Loharkatha Nalbari Assam 6 Barari Katihar Bihar 7 Hajipur Katihar Bihar 8 Taran Tara Kishanganj Bihar 9 Panisal, Kishanganj, Bihar Kishanganj Bihar
10 Patwa, Kishanganj, Bihar Kishanganj Bihar 11 Balia, Kishanganj, Bihar Kishanganj Bihar

108
Annexure 2: Physical progress under PMJVK (US: Units sanctioned, UC: Units completed)
State Status Total Percentage of sanctioned projects completed
Total education projects sanctioned
Percentage of sanctioned education projects completed
Total health projects sanctioned
Percentage of sanctioned health projects completed
Assam US 139300 34.1%
13826 16.6%
610 22.0%
UC 47473 2293 134 Bihar US 118629
4.6% 7875
1.8% 1226
1.9% UC 5444 140 23
Gujarat US 60 0.0%
60 0.0%
0 No projects sanctioned UC 0 0 0
Himachal Pradesh
US 1 0.0%
0 No projects sanctioned
1 0.0%
UC 0 0 0 Kerala US 2160
24.4% 270
84.4% 33
75.8% UC 528 228 25
Madhya Pradesh
US 1373
139 6.5%
1 0.0%
UC 1046 9 0 Maharashtra US 41079
27.8% 565
30.3% 32
0.0% UC 11439 171 0
Mizoram US 3389 95.7%
208 87.5%
53 34.0%
UC 3244 182 18 Odisha US 7629
100.6% 273
15.8% 21
100.0% UC 7672 43 21
Punjab US 652 0.0%
134 0.0%
13 0.0%
UC 0 0 0 Telangana US 7530
41.8% 587
63.0% 9
0.0% UC 3146 370 0
Uttarakhand US 2311 49.9%
160 40.0%
34 11.8%
UC 1153 64 4
Source: Ministry of Minority Affairs

109
Annexure 3: Bibliography 1. Adams M., Bell L. A., Griffin P. (2007) Teaching for diversity and social justice, Routledge, Last
accessed on 11th October 2020
2. Adnan. F. (2020), Political representation of a minority: Muslim representation in contemporary India. India Review, Last accessed on 5th August 2020
3. Aga Khan Foundation, (2020), About us, Last accessed on 15th September 2020
4. Akash. P. (2020), Faith in Numbers, Caravan Magazine, Last accessed on 15th September 2020
5. Alam M.S. (2020) Minorities and Populism – Critical Perspectives from South Asia and Europe, Philosophy and Politics - Critical Explorations, Last accessed on 15th September 2020
6. Alam S. (2016), Affirmative Action for Minorities in India: Constraints and Possibilities, Social and Education History, Vol.5, No. 3, Sept. 2016, pp. 260-261, Last accessed on 7th February 2020
7. Altijani N, Carson C., Choudhury S. S., Rani A., Sarma U.C., Knight M., Nair M. (2018), Stillbirth among women in nine states in India: rate and risk factors in study of 886,505 women from the annual health survey, BMJ Open, Last accessed on 6th April 2020
8. Balarajan Y.S., Fawzi W.W., Subramanian S.V. (2013), Changing patterns of social inequalities in anaemia among women in India: cross-sectional study using nationally representative data., BMJ Open, Last accessed on 26th March 2020
9. Baviskar A. (2019) Social Change and Social Structure Unit, Institute of Economic Growth, Last accessed on 19th February 2020
10. Bhalotra S. (2014), Religion, politician identity and development outcomes: Evidence from India, Journal of Economic Behavior & Organization, Last accessed on 15th September 2020
11. Burchardt, Tania, Grand J. L., Piachaud D. (2002), Social Exclusion in Britain 1991-1995, Last accessed on 26th September 2020
12. Census 2011, Last accessed on 12th April 2020
13. Common Cause (2019), Status of Policing in India Report 2019, Last accessed on 22nd September 2020
14. Economic Times (2019), Corporate India tweaks variables for solving gender diversity equation, Last accessed on 25th February 2020
15. Galanter (1961), Structure and Change in Indian Society, Last accessed on 14th March 2020
16. Govt of Maharashtra (2019), Report of the Comptroller and Auditor General of India on General and Social Sector for the year ended March 2018, Last accessed on 16th March 2020
17. High Court of Meghalaya, PIL Petition, Last accessed on 16th September 2020
18. Haan D., Arjan (1999), DFID London, Social Exclusion: Towards a Holistic Understanding of Deprivation, Last accessed on 26th September 2020
19. IIPA (2017), Impact Assessment of MsDP in India, Last accessed on 13th February 2020
110
20. IMEDA (2020), About us, Last accessed on 15th September 2020
21. Institute of Applied Manpower Research, New Delhi (2011), India Human Development Report: Towards social inclusion. Last accessed on 16th April 2020
22. International Bank for Reconstruction and Development, The World Bank (2013), Inclusion Matters: The foundation for shared prosperity Last accessed on 30th April 2020
23. Jamia Milia Islamia (2020), K R Narayanan Centre for Dalit and Minorities Studies, Last accessed on 15th September 2020
24. Janie M., et al (2008), Social exclusion and children in OECD countries: some conceptual issues, Last accessed on 26th September 2020
25. Kadun P.B. , Gadkar R. (2014), Social Exclusion –Its types and impact on Dalits in India, Research Gate, Last accessed on 12th April 2020
26. Kapur, Avani, Iyer, Smriti (2015), Sarva Shiksha Abhiyan (SSA) Budget Briefs 2015-16, Last accessed on 31st April 2020
27. Kroll A. (2011) The African American Jobs Crisis and the New Jim Crow, Race, Poverty & the Environment Vol. 18, No. 2, Last accessed on 10th December 2020
28. Khatidja C. (2018), Muslim women and gender based violence in India and the UK, Critical Social Policy, Last accessed on 21st September 2020
29. Kabeer N. (2000), Social Exclusion, Poverty and Discrimination: Towards an Analytical Framework, IDS Bulletin, Last accessed on 30th April 2020
30. Karunakaran N. (2015), Muslims constitute 14% of India, but just 3% of India Inc, ET Intelligence Group, Last accessed on 15th September 2020
31. Khurshid S. (2019), Governance, Constitution and Social Justice for Civil Services Examination Last accessed on 26th March 2020
32. KPMG India (2018), India’s CSR Reporting Survey Last accessed on 6th January 2020
33. Krishnan P.S. (2010), Understanding the Backward Classes of Muslim Society, Economic & Political Weekly, Last accessed on 21st September 2020
34. Law Commission of India (1997), 170th Report on Reform of Electoral Laws, Last accessed on 15th September 2020
35. Law Commission of India (2015), 255th Report on Electoral Reforms, Last accessed on 15th September 2020
36. Målqvist M., et al. (2013) Ethnic minority health in Vietnam: a review exposing horizontal inequity, (2013), Global Health Action vol. 6 1-19, Last accessed on 21st September 2020
37. Ministry of Health and Family Welfare, GoI (2016), National Family Health Survey (NFHS-4), Last accessed on 26th April 2020
38. Ministry of Health and Family Welfare, GoI, (2017), Home Page, Last accessed on 10th January 2020

111
39. Ministry of Human Resource Development, GoI (2019), All India Survey on Higher Education 2018-19, Last accessed on 4th January 2021
40. Ministry of Law, GoI (1950), The Constitution (Scheduled Castes) Order, Last accessed on 22nd September 2020
41. Ministry of Minority Affairs, GoI (2007), Report of the National Commission for Religious and Linguistic Minorities, Last accessed on 22nd September 2020
42. Ministry of Minority Affairs, GoI (2016), Evaluation of Prime Minister’s New 15 Point Programme For Welfare of Minorities, Last accessed on 15th September 2020
43. Ministry of Minority Affairs, GoI (2017), Committee on the Establishment of Educational Institutions for Educationally Backward Minorities, Last accessed on 19th September 2020
44. Ministry of Minority Affairs ), GoI (2017), Study to Find out the Reasons for High Drop-out Rates among all Minority Communities, Last accessed on 22nd September 2020
45. Ministry of Minority Affairs, GoI (2019), Sixty-Sixth Standing Committee on Social Justice and Empowerment, Last accessed on 18th September 2020
46. Ministry of Minority Affairs, GoI (2019), Status of Follow-Up Action on The Decisions of Government on Sachar Committee Recommendations (as on 31.03.2019), Last accessed on 16th September 2020
47. Ministry of Minority Affairs, GoI (2019), Guidelines for implementation of PMJVK (PMJVK), Last accessed on 15th July 2020
48. Ministry of Minority Affairs, GoI (2020), Guidelines for the Implementation of Prime Minister’s New 15 Point Programme for the Welfare of Minorities, Last accessed on 15th September 2020
49. Ministry of Minority Affairs, GoI (2019), MIS for PMJVK, Last accessed on 13th July 2020
50. Ministry of Minority Affairs, GoI (2017), Impact Assessment of MsDP in India, Last accessed on 6th March 2020
51. Ministry of Minority Affairs, GoI, Empowered Committee Minutes, Last accessed on 13th July 2020
52. Ministry of Social Justice and Empowerment, Department of Empowerment of Persons with Disabilities (Divyangjan), GoI (2016), Right of Persons with Disabilities Act, 2016, Last accessed on 26th March 2020
53. Ministry of Rural Development, GoI (2011), Socio Economic and Caste Census, Last accessed on 26th March 2020
54. Ministry of Social Justice & Empowerment, GoI (2017), National Commission for DNT and Semi-Nomadic Tribes, Idate Commission, Last accessed on 13th Apr 2020
55. Ministry of Social Justice and Empowerment, GoI (2018), 62nd Report Standing Committee on Social Justice and Empowerment (2017-18), Last accessed on 14th Jan 2020
56. Ministry of Social Justice and Empowerment, GoI (2018), 66th Report Standing Committee on Social Justice and Empowerment (2018-19), Last accessed on 14th July 2020
112
57. Ministry of Social Justice and Empowerment, GoI (2020), 4th Report of Standing Committee on Social Justice and Empowerment: Demand for Grants 2019-20, Last accessed on 15th July 2020
58. Ministry of Statistics and Programme Implementation, GoI (2012), NSS Consumption Expenditure Survey, 68th Round, 2011-12, Last accessed on 15th July 2020
59. Ministry of Statistics and Programme Implementation, GoI (2011), Chapter V, Statistical Year Book, Last accessed on 15th September 2020
60. Minority Rights Group International (2020), About us, Last accessed on 15th September 2020
61. Mustafa F. (2019), Can Hindus be minority?, Tribune India, Last accessed on 15th September 2020
62. NGO Darpan, GoI (2020), Sector 42: Minority Issues, Last accessed on 26th September 2020
63. NASSCOM (2019), Diversity and Inclusion Last accessed on 23rd February 2020
64. Oxfam (2019), Public Good or Private Wealth? Oxfam Inequality Report The India Story, Last accessed on 23rd April 2020
65. Oxfam (2016) By The People: Civil society organizations led by members of marginalized communities influencing governance processes for inclusive development Last accessed on 13th February 2020
66. Oxford Poverty and Human Development Initiative (2018), Global MPI 2018, Last accessed on 13th February 2020
67. Pellissery S. (2016), Minorities, Democracy and Capitalism, Centre for Study of Social Exclusion and Inclusive Policy National Law School of India University, Last accessed on 19th September 2020
68. Press Information Bureau, GoI (2015), Improvement of Economic Conditions of Muslims, Last accessed on 14th January 2020
69. Pew Research Center (2015), The Future of World Religions: Population Growth Projections, 2010-2050, Last accessed on 15th September 2020
70. PIB, GoI (2018), Skill Development Schemes Through Selected Project Implementing Agencies, Last accessed on 14th January 2020
71. Planning Commission, GoI (2008), Eleventh Five Year Plan (2007–2012), Inclusive growth, Volume I, Last accessed on 25th April 2020
72. Planning Commission, Public Health Foundation of India (2011), High Level Expert Group Report on Universal Health Coverage for India., Last accessed on 7th February 2020
73. Praxis (2017),Status of Corporate Responsibility in India, 2017, Last accessed on 25th April 2020
74. Prime Minister’s High Level Committee, GoI (2006), Social, Economic and Educational Status of the Muslim Community of India: A Report, Last accessed on 16th September 2020
75. Raza S.A. (2016), Minority Educational Institutions and the Supreme Court after the T. M. A. Pai Judgment., Last accessed on 19th February 2020

113
76. Rehnuma (2017) Minority Appeasement: Myth or Reality – A ground report on Minority Welfare in 7 States, Last accessed on 15th September 2020
77. Samarendra P. (2016), Religion, Caste and Conversion: Membership of a Scheduled Caste and Judicial Deliberations, Economic & Political Weekly, Last accessed on 22nd September 2020
78. Suryawanshi B.R., Dhande N. (2013), Socio-Economic Development among Scheduled Caste: A Study of Mahatma Phule Backward Class Development Corporation in Select District of Maharashtra, Research Gate, Last accessed on 12th April 2020
79. Sen A. (2000), Social Exclusion: Concept, Application and Scrutiny, Last accessed on 22nd September 2020
80. Silver H., (2007), The Process of Social Exclusion: The Dynamics of an Evolving Concept, Last accessed on 22nd September 2020
81. Singhari, S., Madheswaran, S., (2016), Social Exclusion And Caste Discrimination in Public and Private Sectors in India : A Decomposition Analysis, The Institute for Social and Economic Change, Last accessed on 6th April 2020
82. Thorat S. (2015), Caste and Religion Matters in Access Urban Rental Housing Market, Economic & Political Weekly, Last accessed on 15th September 2020
83. TISS (2007), Centre for Study of Social Exclusion and Inclusive Policies, Last accessed on 7th February 2020
84. TMA Pai Foundation vs. State of Kerala 2002 (8) SCC 481, Last accessed on 15th September 2020
85. Verma S. (2019), Muslim Women in India: A Struggle for Dignified Existence, Amity International Journal of Juridical Sciences, Last accessed on 21st September 2020
86. Verma S. (2015), More religious minorities live in urban areas than rural, Times of India, Last accessed on 15th September 2020
87. UNDP (2018), 271 million fewer poor people in India, Last accessed on 31st April 2020
88. UNDP (2019), 2019 Global Multidimensional Poverty Index (MPI), Last accessed on 15th September 2020
89. Williams P. (2017), Working at the margins? Muslim middle-class professionals in India and the limits of ‘labour agency’, Environment and Planning A: Economy and Space, Last accessed on 15th September 2020
90. World Bank (2018), Occupational Segregation and Declining Gender Wage Gap, Last accessed on 15th September 2020
91. World Bank (2005), Public Expenditure Analysis, Last accessed on 26th April 2020

Development Monitoring and Evaluation Office
NITI Bhawan, Sansad Marg, New Delhi-110001
[email protected] | https://dmeo.gov.in/
Commentary,Narration and Analysis Survey Partner