fcf pitch updated, carolyn fisher
TRANSCRIPT
First Commonwealth Financial Corp.
Recommendation: Hold, PT-$10Carolyn Fisher 3/24/16

Overview Business Overview Thesis Financial Overview Historical Performance Relative Valuation Dividend Discount Model Competitive Analysis

First Commonwealth Financial (FCF) Market Capitalization: $782 mm Current price: $8.88 52 Week High/Low: $7.85-9.95 Intrinsic Value: $10 Upside/Downside: +8% P/E: 15.8x Forward P/E: 12.27x P/B: 1.13 ROE: 6.9% SIF Banking Current Weight: 33%, Russell 2000V
43%
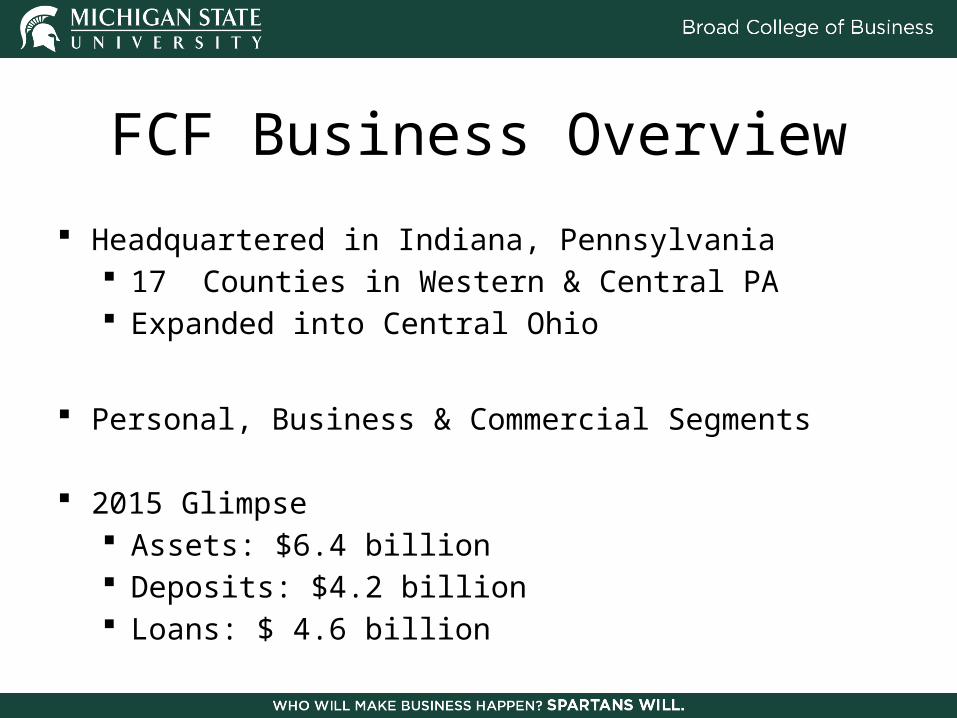
FCF Business Overview Headquartered in Indiana, Pennsylvania
17 Counties in Western & Central PA Expanded into Central Ohio
Personal, Business & Commercial Segments
2015 Glimpse Assets: $6.4 billion Deposits: $4.2 billion Loans: $ 4.6 billion

Management Team Thomas Michael Price
President and Chief Executive Officer of First Commonwealth Financial Corporation. Prior: President of First Commonwealth Bank, formerly Chief Executive Officer of the Cincinnati and Northern Kentucky Region of National City Bank
James R. Reske Executive Chief Financial Officer and Treasurer since April
2014. Prior: Executive Vice President, Chief Financial Officer, and Treasurer at United Community Financial Corporation in Youngstown.
Robert Emmerich Executive Vice President and Chief Credit Officer of First
Commonwealth Bank since 2009. Prior: 31-year career at National City Corporation, Executive Vice President & Chief Credit Officer for Consumer Lending.
First Commonwealth Financial Corp.
Thesis & Catalysts
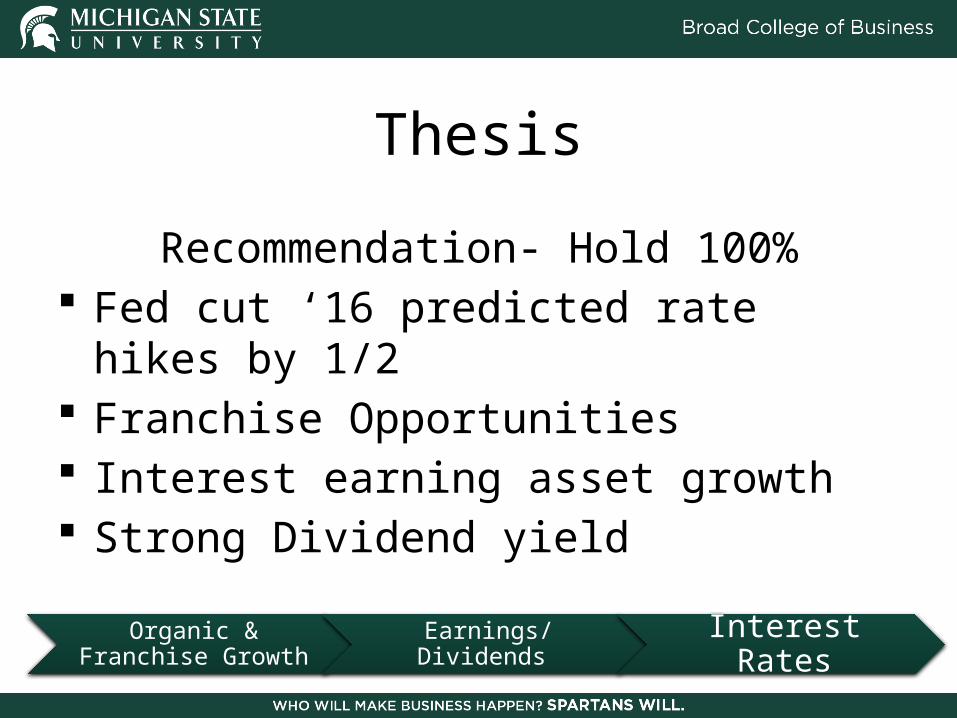
ThesisRecommendation- Hold 100%
Fed cut ‘16 predicted rate hikes by 1/2
Franchise Opportunities Interest earning asset growth Strong Dividend yield
Organic & Franchise Growth Earnings/ Dividends Interest Rates
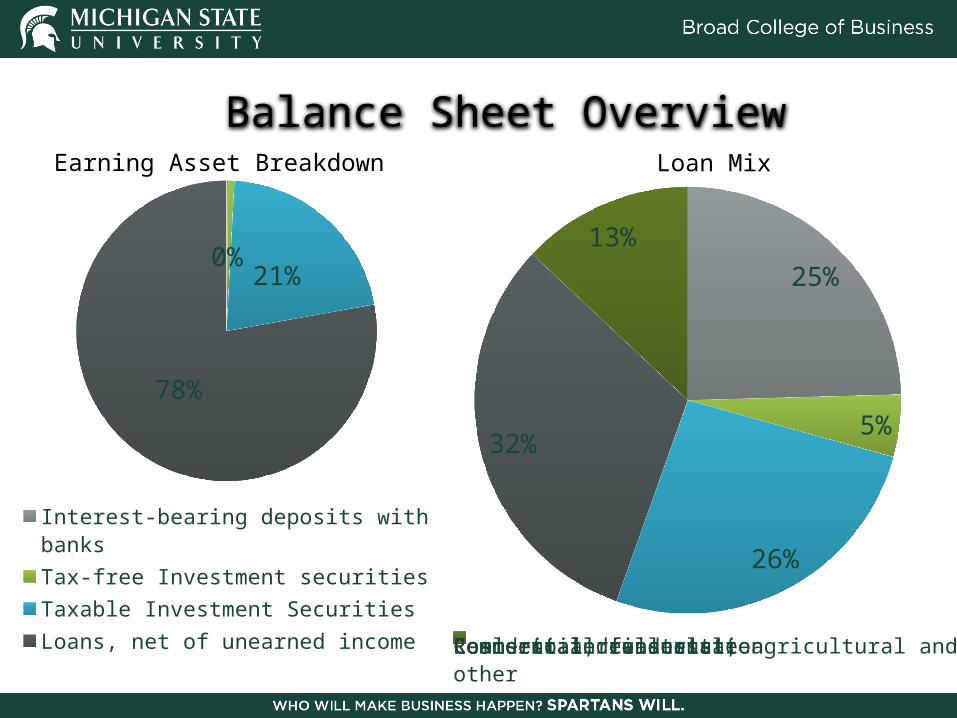
25%
5%
26%
32%
13%
Commercial, financial, agricultural and otherReal estate constructionResidential real estateCommerical real estateLoans to individuals
Balance Sheet Overview
0% 21%
78%
Interest-bearing deposits with banksTax-free Investment securitiesTaxable Investment SecuritiesLoans, net of unearned income
Loan MixEarning Asset Breakdown

Interest Earning Assets & Deposit Mix
2013 2014 2015$5,400,000$5,600,000$5,800,000$6,000,000
Interest- Earning Assets
Organic & Franchise Growth Earnings/ Dividends Interest Rates
Deposit MixNon- Interest Bearing Checking Accounts 27%
Interest Bearing Checking Accounts, Money Market & Savings Accounts 59%CDs and IRAs 14%
%change 2014 %change 2015
-3.0%
-1.0%
1.0%
3.0%
5.0%
Interest IncomeInterest- Earning Assets
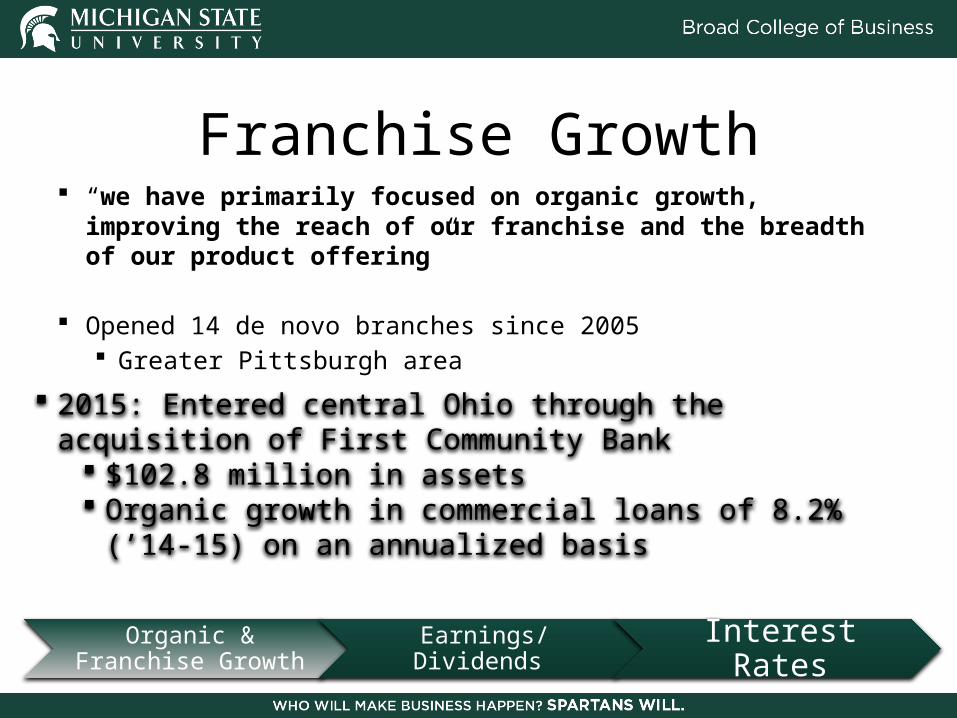
Franchise Growth “we have primarily focused on organic growth, improving
the reach of our franchise and the breadth of our product offering”
Opened 14 de novo branches since 2005 Greater Pittsburgh area
2015: Entered central Ohio through the acquisition of First Community Bank
$102.8 million in assets Organic growth in commercial loans of 8.2% (’14-
15) on an annualized basis
Organic & Franchise Growth Earnings/ Dividends Interest Rates

Credit Quality & Income Statement Highlights
2011 2012 2013 2014 20150.00%0.20%0.40%0.60%0.80%1.00%1.20%1.40%1.60% Charge-offs as a Percentage of Total Loans
Income Statement Highlights 2014 Q4 2015 Q4 % ChangeNet Interest Margin 3.27% 3.28% +0.3%ROA 0.71% 0.78% +10%ROE 6.18% 6.98% +13%Net Income 44,453 50,143 +13%Diluted Earnings per Share 0.48 0.56 +17%
Organic & Franchise Growth Earnings/ Dividends Interest Rates
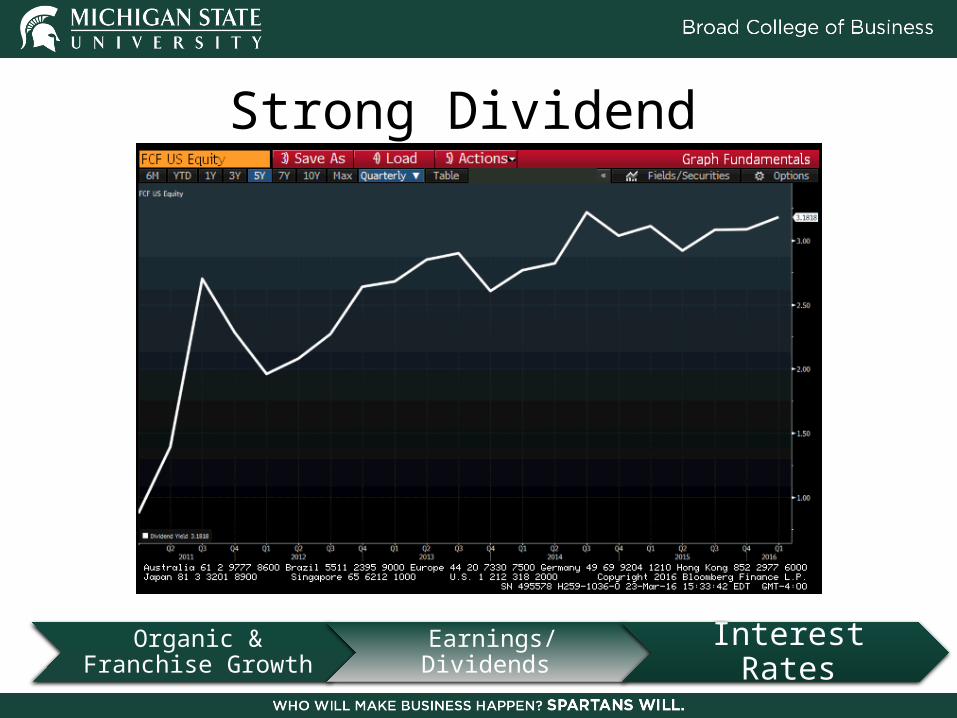
Strong Dividend
Organic & Franchise Growth Earnings/ Dividends Interest Rates
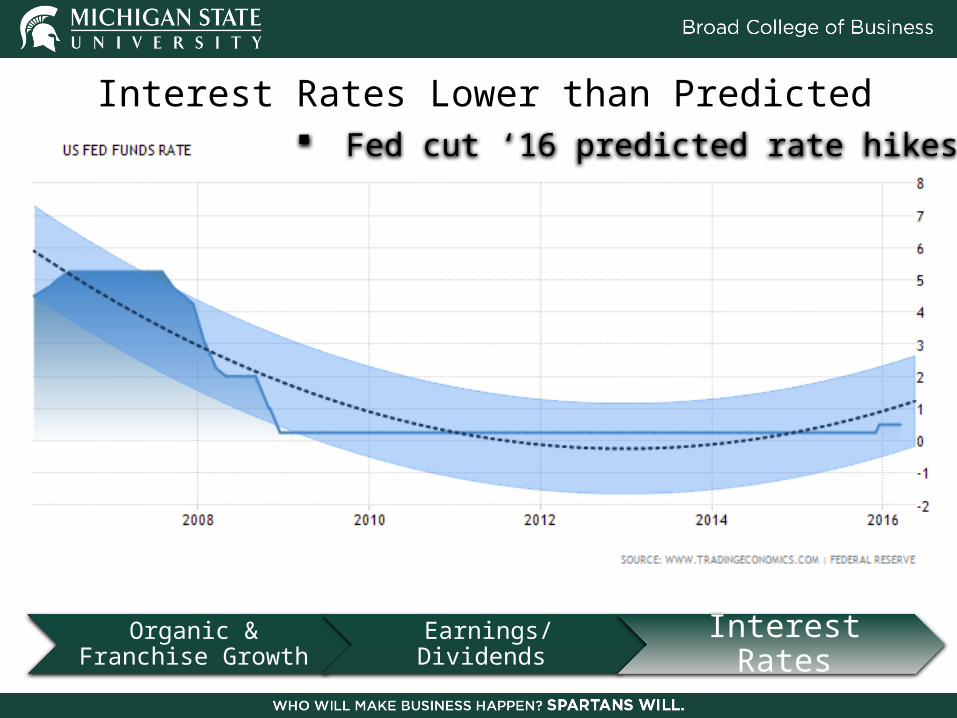
Interest Rates Lower than Predicted Fed cut ‘16 predicted rate hikes by 1/2
Organic & Franchise Growth Earnings/ Dividends Interest Rates
First Commonwealth Financial Corp.
Valuation

Key Metrics 2012 2013 2014 2015
% Change
Net Interest Margin 3.63 3.42 3.26 3.28 0%Teir 1 Capital Ratio 13% 12% 12% 12% 2%Efficiency Ratio 68% 68% 69% 66% -5%
Squeezed margins due to low interest rate Acquisitions feed into efficiency ratio

FCF HTLF WIBC LKFN HAFC CHCO STBA Industry0.0
2.0
4.0
6.0
8.0
10.0
12.0
14.0
16.0
18.0
0.0%
0.5%
1.0%
1.5%
2.0%
2.5%
3.0%
3.5%
4.0%
P/E P/B NMI
Relative Valuation

Assumptions 80 basis point interest rate increase
by 2018 4% Organic loan growth YOY
Conservative 2 recent stock repurchases
After 2016, assume stable

Scenario Analysis Implied P/B Implied P/E Price UpsideBear 1 15 $9 0%Base 1.2 16 $10 8%Bull 1.3 17 $10 13%
Weighted average of DDM, P/E Multiple, P/B Multiple valuation methods
Over valued P/E causing upside, while future cash flows are week leaving DDM with a downside
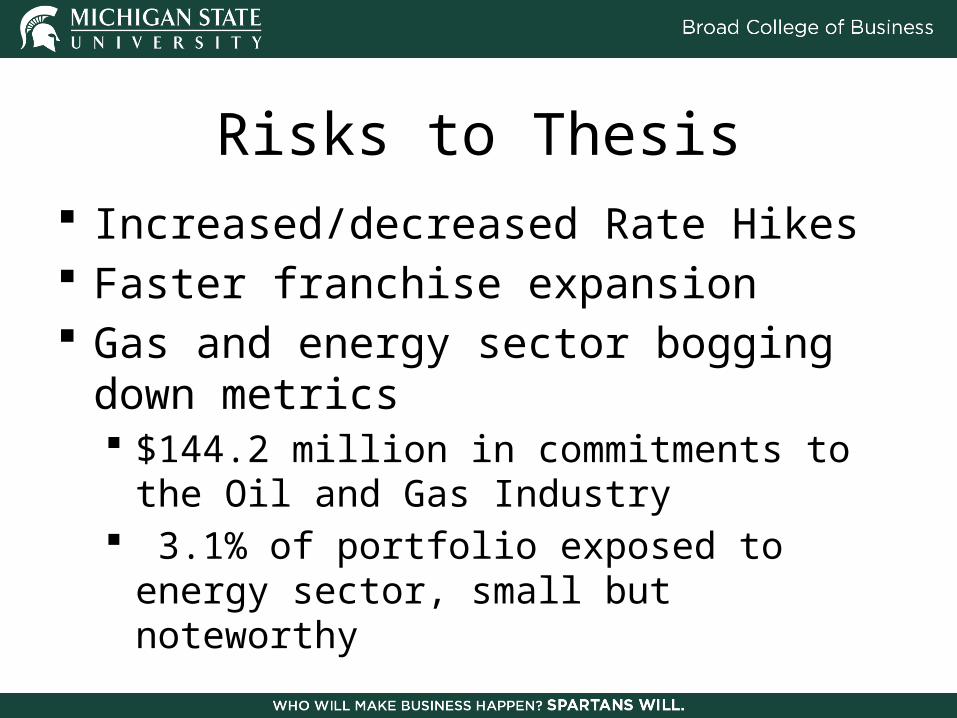
Risks to Thesis Increased/decreased Rate Hikes Faster franchise expansion Gas and energy sector bogging down
metrics $144.2 million in commitments to the Oil
and Gas Industry 3.1% of portfolio exposed to energy
sector, small but noteworthy
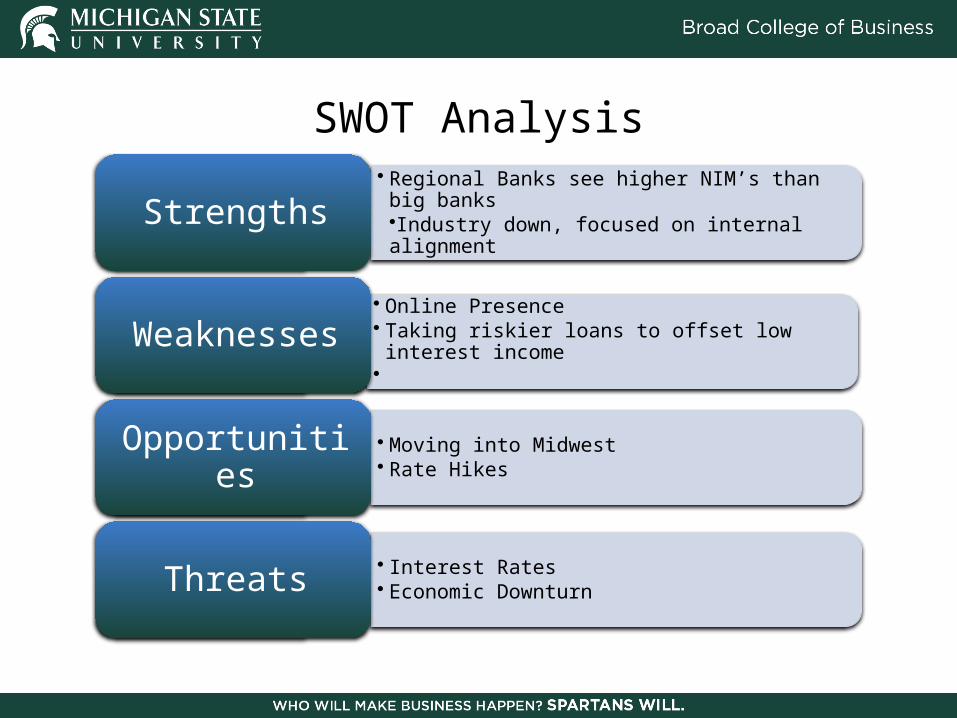
SWOT Analysis• Regional Banks see higher NIM’s than big banks•Industry down, focused on internal alignment
Strengths
• Online Presence• Taking riskier loans to offset low interest income
• Weaknesses
• Moving into Midwest• Rate HikesOpportunities
• Interest Rates• Economic DownturnThreats
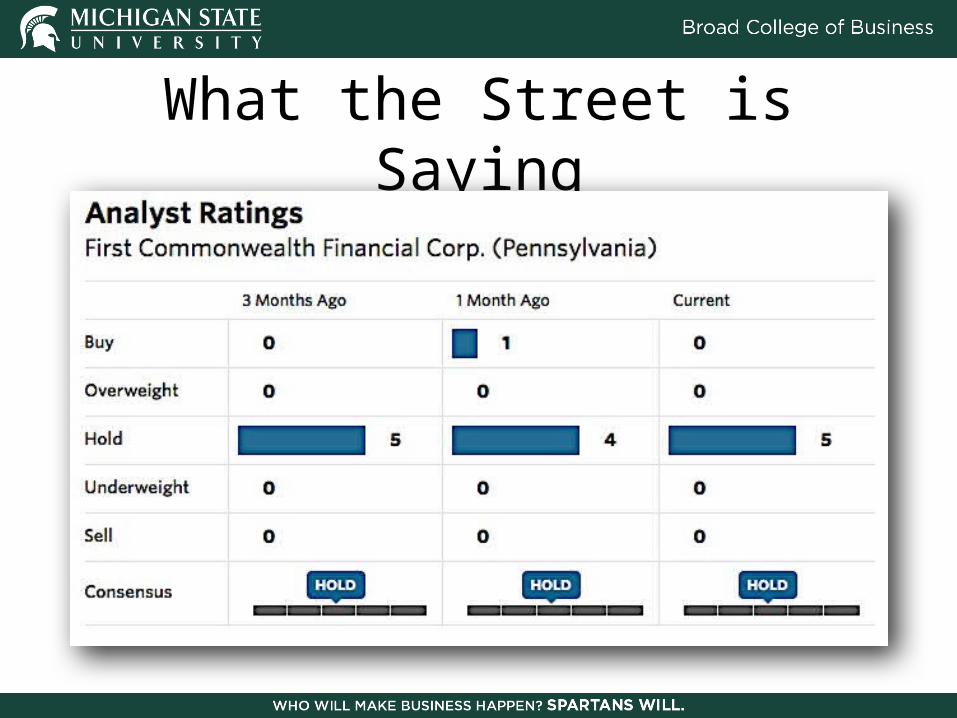
What the Street is Saying

Insider Transactions
First Commonwealth Financial Recommendation- Hold 100% Current price: $8.85 Intrinsic Value: $10 Upside/Downside: 8% P/E: 15.8x Forward P/E: 12.27x P/B: 1.13 ROE: 6.9%
QUESTIONS?