familial spastic paraparesis: evaluation of locus heterogeneity, anticipation, and haplotype mapping...
TRANSCRIPT
American Journal of Medical Genetics (Neuropsychiatric Genetics) 74:26–36 (1997)
© 1997 Wiley-Liss, Inc.
Familial Spastic Paraparesis: Evaluation of LocusHeterogeneity, Anticipation, and Haplotype Mapping of the SPG4 Locus on the Short Arm of Chromosome 2
Wendy H. Raskind,1,2* Margaret A. Pericak-Vance,5,6,7 Felicia Lennon,5 John Wolff,2,4 Hillary P. Lipe,4
and Thomas D. Bird2,3,4
1Department of Medicine, Division of General Internal Medicine, University of Washington School of Medicine, Seattle,Washington
2Department of Medical Genetics, University of Washington School of Medicine, Seattle, Washington3Department of Neurology, University of Washington School of Medicine, Seattle, Washington4Department of Neurology, Seattle Veterans Affairs Medical Center, Seattle, Washington5Department of Medicine, Duke University Medical Center, Durham, North Carolina6Department of Genetics, Duke University Medical Center, Durham, North Carolina7Department of Ophthalmology, Duke University Medical Center, Durham, North Carolina
Familial spastic paraparesis (SPG) is a clin-ically and genetically heterogeneous groupof disorders. At least three loci have beenimplicated in autosomal dominant pure SPGand mutations in either of two loci maycause the X-linked form. Although the pene-trance is high for all forms by age 60, thereis wide variation in clinical characteristics,including age of onset. Two-point and multi-point linkage analyses in nine families pro-vided supportive evidence that the mostcommon form of SPG is linked to chromo-some 2 (SPG4). Haplotype analysis localizedthe critical region to a 6 cM interval be-tween D2S392 and D2S367. By haplotypeanalysis, the disease in at least one familydoes not appear to be linked to any of thepresently known SPG loci, suggesting thatthere is at least one additional SPG gene.Evaluation of ages of onset in 11 familiesgave suggestive evidence for anticipationwith mean age of onset in parents (41.3years) being older than mean age of onset inchildren (26.9 years; P , 0.005). Am. J. Med.Genet. 74:26–36, 1997. © 1997 Wiley-Liss, Inc.
KEY WORDS: familial spastic paraplegia;genetic linkage analysis; ge-netic heterogeneity
INTRODUCTIONThe pure form of SPG is characterized by slowly
progressive spasticity of the lower extremities with associated hyperreflexia, extensor plantar responses,and the absence of additional features such as mentalretardation, peripheral neuropathy, or retinopathy seenin the complicated forms [Sutherland, 1975: McKusick,1990]. Autosomal dominant, autosomal recessive, andX-linked recessive pure SPG have been reported. Boththe X-linked and autosomal forms are genetically het-erogeneous. One subset of X-linked spastic paraplegia isallelic to Pelizaeus-Merzbacher disease [Saugier-Veberet al., 1994; Cambi et al., 1996]. A locus on chromosome8 appears to be involved in one autosomal recessiveform of SPG [Hentati et al., 1994a], whereas SPG3,SPG4, and SPG6 loci on chromosomes 14q [Hazan et al.,1993], 2p [Hentati et al., 1994b], and 15q [Fink et al.,1995], respectively, have been implicated in the autoso-mal dominant form. Nine multigenerational familieswere studied here to investigate the relative frequenciesof the subtypes and the gene localizations. In recentyears, expansion of trinucleotide repeat sequences inthe relevant genes has been found to be the etiologicmechanism for many neurologic disorders, includingHuntington’s disease and dominant hereditary ataxias[reviewed in Sutherland and Richards, 1995]. The instability in the expanded sequence leads to further enlargement of the sequence length in subsequentmeioses, resulting in increased severity and earlier on-set of disease in successive generations. Because of theapparent propensity for this mechanism to be operativein neurologic disorders, we evaluated age of onset infamilies with SPG for evidence of anticipation.
MATERIALS AND METHODSClinical History
Partial pedigrees of nine multigenerational familieswith SPG (FSP01, FSP02, FSP03, FSP04, FSP06,
Contract Grant sponsor: NIH; Contract Grant numberCA16448; Contract grant number NS26630.
*Correspondence to: Dr. Wendy H. Raskind, Department ofMedicine, Box 357720, University of Washington, Seattle, WA98195-7720.
Received 16 January 1996; Revised 15 July 1996
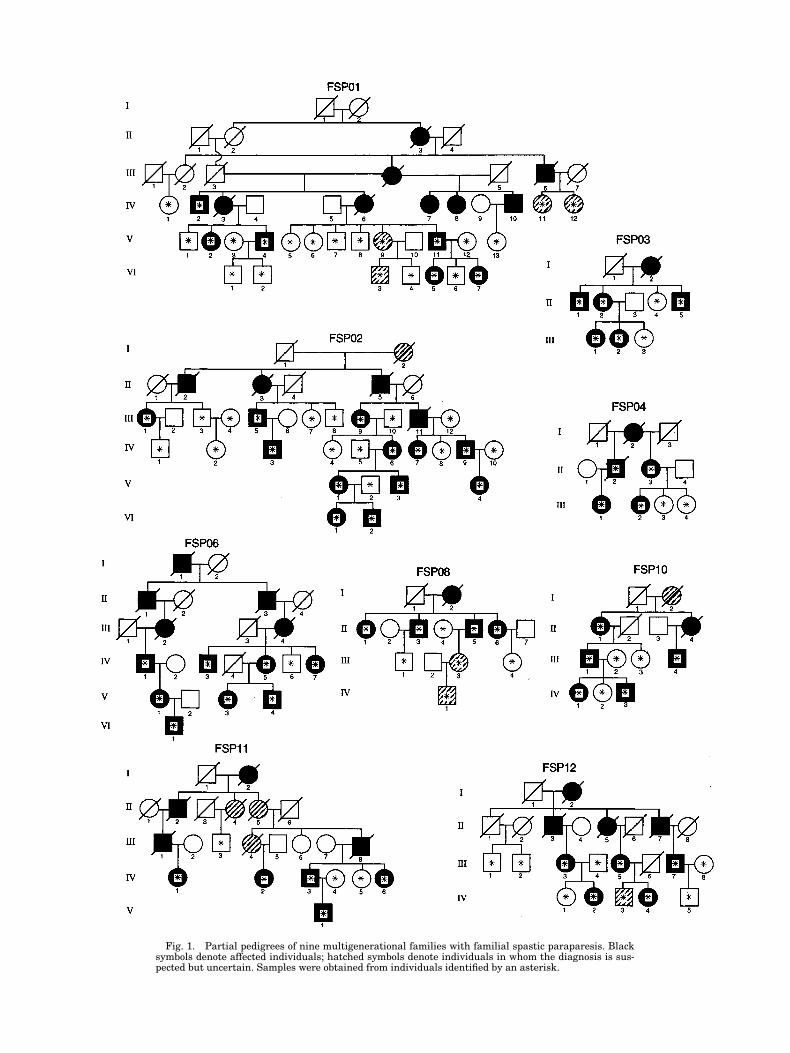
Fig. 1. Partial pedigrees of nine multigenerational families with familial spastic paraparesis. Blacksymbols denote affected individuals; hatched symbols denote individuals in whom the diagnosis is sus-pected but uncertain. Samples were obtained from individuals identified by an asterisk.
FSP08, FSP10, FSP11, and FSP12) are shown in Fig-ure 1. These pedigrees depict sampled and examinedfamily members and their pertinent relatives. Allprobands had bilateral hyperreflexia and Babinski re-sponses documented by a neurologist (TDB). No familymember had mental retardation, peripheral neuropa-thy, retinopathy, or other signs of complicated SPG. Thepossibility of misassigning disease status was mini-mized by obtaining samples only from individuals whowere clinically evaluated by us or by another neurolog-ical specialist or whose medical records documentedthe diagnosis. Samples were obtained from 110 individ-uals, 57 of whom were documented as affected.
Evaluation for AnticipationBecause of suggestive evidence of X-linkage, family
FSP01 was excluded from the analysis for anticipation.Three additional families with pure SPG that were toosmall for linkage analysis were included, for a total of11 families analyzed for anticipation. For each individ-ual evaluated, the age of onset was considered to be theage at which the person and another family memberagreed that he or she first noted difficulty walking orrunning in comparison with peers. Asymptomatic indi-viduals diagnosed with SPG by physical exam onlywere not assigned an age of onset. If age of onset wasknown for both generations, the mean age of onset wascalculated for the parents and children and the differ-ences were analyzed with a two-tailed Student’s t-test.
DNA AnalysesUnder protocols approved by the Institutional Re-
view Board of the University of Washington, blood sam-ples were obtained from individuals marked by an as-terisk (Fig. 1). DNA was extracted from leukocytes orcell lines and PCR-amplified as previously described[Raskind et al., 1995]. One primer of each pair was end-labeled with [g32]P by a T4 kinase reaction. In somecases, multiplex PCR reactions with two to three primersets were done when the range of allele sizes allowedclear separation of products. Primers for the lociD2S174, D2S170, D2S392, D2S390, D2S352, D2S400,D2S367, D2S177, D14S70, D14S69, D14S75, D14S306,D14S269, D14S587, D14S66, D15S122, D15S128,D15S156, D15S165, PLP, DXS52, DXS15, and F8Cwere obtained from Research Genetics.
Linkage AnalysisLinkage analyses were performed using the MLINK
and LINKMAP subprograms of the LINKAGE packageversion 5.0 [Lathrop et al., 1984] as implemented inFASTLINK (vs) [Schaffer et al., 1994] and using thecomputer program Vitesse [O’Connell and Weeks, 1995].Fastlink was used to evaluate linkage in family FSP01,which contained a consanguinous marriage. At pres-ent, the Vitesse program cannot analyze complex pedi-grees of this nature. Biological relatives of affected in-dividuals were scored as “affected,” “at risk” if theywere clinically unaffected, or “unknown” if the physi-cal exam was ambiguous. Only biologically unrelatedspouses were scored “unaffected” for this rare disease.Autosomal dominant inheritance with a gene frequency
of 0.0001 for the disease allele was assumed for theSPG locus.
Calculations were done under two conditions. In oneanalysis, a probability was assigned to at-risk individ-uals and all family members were included. Risks wereassigned based on age at examination of the at-risk individuals. Because the average age of onset can dif-fer substantially among families, family specific agecurves for early, intermediate, and late onset familieswere constructed based on age stratifications previ-ously suggested by several studies [Harding et al.,1983; Hentati et al., 1994b; Lennon et al., 1995]. Thecriteria for early onset were onset by age 20 and 96%penetrance by age 20. For families exhibiting interme-diate age of onset, a straight line age correction fromages 10–40 was used, with penetrance reaching a max-imum of 80% at age 40. Similarly, for families exhibit-ing a late age of onset, a straight line age correctionfrom ages 10–70 was used, with penetrance reaching amaximum of 80% at age 70. In a second analysis (“lowpenetrance,” “affecteds-only”), phenotypic data were in-cluded only on affected individuals, whereas genotypicinformation was included on all family members. Thisconservative approach decreases the chance to excludelinkage falsely based on potential crossovers in older“normal” individuals who may actually carry the dis-ease gene but have not expressed it. Confidence inter-vals for the linkage analyses were determined usingthe 1-lod-down method [Ott, 1991]. Using these specifi-cations, allowing for heterogeneity (alpha 5 0.5) andassuming a four allele system with a polymorphic in-formation content (PIC) of 0.70, 1000 replicates weresimulated for each family. Average and maximum lodscores were calculated, as well as the probability forachieving a lod score above 3.0 [Ploughman andBoehnke, 1989].
Allele sizes and frequencies for the marker loci wereobtained from the Genome Data Base (GDB). Allelesizes on the autoradiographs were standardized bycomparison to DNAs from CEPH family 1331 [Daussetet al., 1990; CEPH]. The order and distance betweenthe marker loci were determined from several linkagemaps in the GDB (CEPH sex-averaged linkage mapsC2M59, C15M7, C15M25, C14M16, primary linkageaverage map C14M21, and integrated linkage averagemap C14M25). The markers that were most informa-tive overall and those that were most likely to flank theSPG3 and SPG4 genes (D2S174, D2S400, D2S367,D2S177, D14S306, D14S269, and D14S587) were usedfor the multipoint analysis. For computational feasibil-ity, recording of the marker loci to four allele systemsfor the analysis of family FSP01 using Fastlink wasperformed as previously described [Speer, 1995].
To evaluate evidence of heterogeneity, admixtureanalysis (HOMOG) was performed using the two-pointlod scores for each autosomal chromosomal location except D2S170, D2S393, and D2S390. For the multi-point analysis, admixture analysis as implemented inHOMOG3R [Ott, 1991] was used. In order to furtherexamine potential heterogeneity, haplotypes were con-structed by hand for all tested markers on the fourchromosomes to evaluate consistency of linkage assign-ments.
28 Raskind et al.
Linkage AnalysesTwo-point LOD scores were calculated for seven chro-
mosome 14q markers, five chromosome 2p markers,and four chromosome 15q markers previously found tobe linked to SPG3, SPG4, and SPG6, respectively. Sim-ulation studies suggested that four of the nine families(FSP01, FSP02, FSP06, and FSP11) have the potentialfor a lod score above 2.0 but only FSP01 and FSP02could produce a lod score above 3.0 (data not shown).Evidence for linkage to chromosome 15 was not ob-tained in any of the nine families, and close linkage wasexcluded in FSP1, FSP2, FSP3, FSP6, FSP11, andFSP12 (data not shown). Lod scores for the individualfamilies for markers on chromosomes 2 and 14 obtainedwith all individuals included in the analysis are givenin Table III. To allow for the possibility that the fami-lies contain many asymptomatic SPG gene carrierswho have not yet expressed the disease, a low pene-trance analysis was also done in which phenotypic datawere included only on affected individuals, whereasgenotypic information was included on all family mem-bers. As expected, consistent but lower lod scores wereobtained under this assumption (data not shown). Be-cause of the extent of locus heterogeneity, lod scores forthe combined families are not presented.
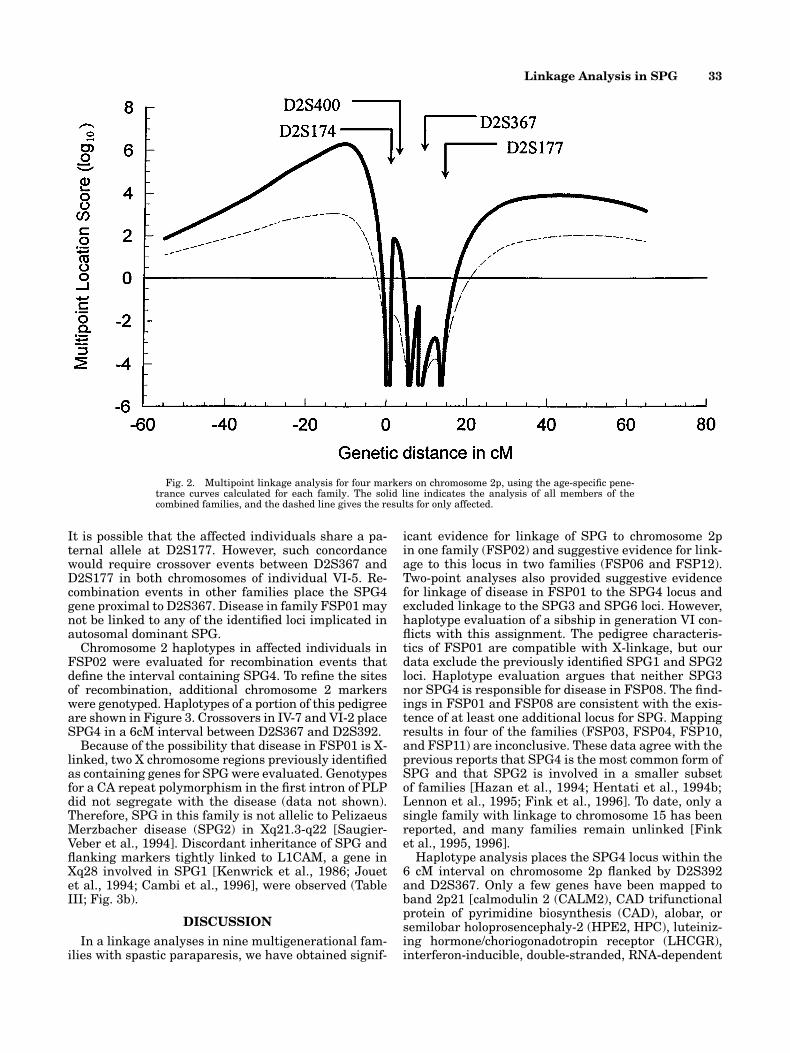
Admixture analysis (HOMOG) using the 2-point lodscores failed to show evidence for heterogeneity inthese data (P . 0.5). Similar findings were obtainedwhen the multipoint location scores (log10) were exam-ined. Joint analysis of the multipoint location scores forchromosomes 2 and 14 (HOMOG3R) also failed to showevidence for heterogeneity (data not shown). The loglikelihood difference between the hypotheses by link-age and homogeneity and linkage and heterogeneity is0.0. However, it is known from previous studies thatSPG is heterogeneous and the patterns of the multi-point analyses for the individual chromosomes suggestthere is heterogeneity in our data set as well. Using re-sults of markers on chromosome 2 that flank the criti-cal region for SPG4 [Hazan et al., 1994], a peak multi-point location score of 6.23 was obtained for a positionproximal to D2S174 (Fig. 2). This location is outside thecritical region for SPG4.
Disease in family FSP02 is very likely linked toSPG4. A maximum lod score of 5.12 at u 5 0.00 was ob-tained for D2S352 and significant evidence againstlinkage to chromosome 14 was obtained for multiplemarkers. Maximum lod scores at u 5 0 of 1.92 forD2S352 and 1.895 for D2S177 for FSP6 and FSP12, re-spectively, are suggestive evidence for linkage of dis-ease to SPG4 in these families as well. In addition, inboth families, the pattern of lod scores makes linkage tochromosome 14 very unlikely and the chromosome 14haplotypes were discordant (not shown). The individ-ual lod scores for linkage to markers on chromosomes 2and 14 do not approach significance in families FSP03and FSP04, and their small size does not allow exclu-sion of as yet unidentified SPG loci. However, all fouraffected individuals tested in FSP03 share a chromo-some 2 haplotype, whereas the chromosome 14 haplo-types are discordant (data not shown).
Linkage Analysis in SPG 29
RESULTSPedigree Evaluation
SPG segregated in each of the families with a patternconsistent with autosomal dominant inheritance. Infamily FSP01, the greater severity and earlier age ofonset in males compared with females, the cases of ap-parent nonpenetrance in females, and the lack of male-to-male transmission suggested that inheritance inthis family may be X-linked. There were no definite in-stances of reduced penetrance in the other eight fami-lies. In families FSP02, FSP10, FSP11, and FSP12, instances of male-to-male transmission rules out X-linked inheritance; the remaining pedigrees containfew opportunities to evaluate male-to-male transmis-sion. The mean age of onset, range, and standard devi-ation for each family is shown in Table I. FamiliesFSP01, FSP03, FSP06, and FSP08 show a late age ofonset, with the average age at diagnosis . 40 years andno diagnoses made before age 17. In contrast, all fouraffected individuals in family FSP10 evidenced symp-toms during the first decade. Some members of familyFSP11 also were diagnosed in the first decade, but therange was much broader, with an intermediate age ofonset distribution. Similar findings were seen in fami-lies FSP2, FSP4, and FSP12.
Table II gives the differences between mean age ofonset in parents and children in 11 families. There were34 instances in which the age of onset was earlier in theaffected child (range 1–48 years earlier) and only six in-stances in which the age of onset in the child was equalto or greater than that of the parent (range 0–21 yearslater). There was no detected relationship of age of onset to sex of parent or child. Mean age of onset in parents was 41.3 6 18.4 years (n 5 25) and mean age of onset in children was 26.9 6 20.4 years (n 5 40) (P , 0.005). The affected persons included in this anal-ysis represent 59% of the total persons at risk in eachsibship, making it unlikely that the families containmany SPG gene carriers who have not yet expressedthe disease. These observations suggest that anticipa-tion may occur in some forms of SPG.
TABLE I. Age of Onset
No. affected Mean age of onset 6 SDFamily individuals studied (range)
FSP01 9 42.7 6 17.0(25–72)
FSP02 15 22.7 6 18.1(2–53)
FSP03 7 49.0 6 18.8(17–75)
FSP04 5 35.8 6 15.9(12–52)
FSP06 7 37.1 6 21(2–60)
FSP08 6 57.0 6 13.7(35–72)
FSP10 4 6.5 6 3.1(3–10)
FSP11 7 26.6 6 16.8(6–46)
FSP12 6 35.0 6 12.8(18–54)

30 Raskind et al.
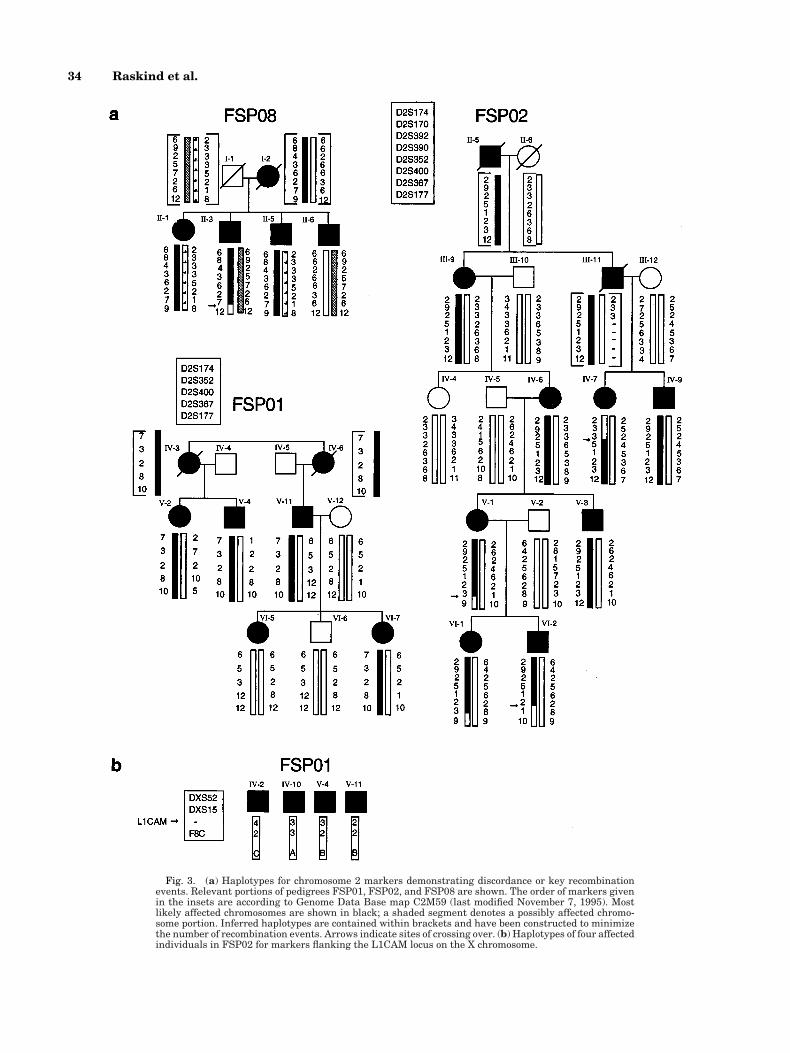
In several families the haplotypes provided sugges-tive evidence that the disease is not caused by theSPG4 gene. Pertinent portions of three pedigrees areshown in Figure 3a. The haplotypes in FSP08 are in-consistent with linkage to chromosome 2. The genotypesof unsampled individuals I-1 and I-2 were arbitrarilyassigned, but reversing the genotypes does not abolishthe discordance. No single haplotype is shared by allfour affected siblings in generation II. Generally nega-tive lod scores for chromosome 2 markers support thisconclusion. The analysis for linkage to SPG3 is incon-clusive in this family and would require one individual(II-1) who has hyperactive tendon reflexes and bilateralBabinski responses to be unaffected by SPG, as well as one individual (III-4) to be a nonexpressing carrierfor the haplotypes to support linkage (haplotypes notshown). The linkage assignments are uncertain in
FSP10 and FSP11, but the patterns of haplotypes aremore consistent with linkage of the disease to SPG3(haplotypes not shown).
Evaluation of family FSP01 is more complex. Two-point analysis provides evidence against close linkageof SPG to chromosome 14 markers when either all in-dividuals or only affected individuals are included(data not shown for the latter analysis). When all indi-viduals are included, a maximum lod score of 2.621 wasobtained for D2S174 at u 5 0.10, suggestive lod scoreswere seen for markers D2S352 and D2S367 and a peakmultipoint location score of 2.94 was obtained for a sitebetween D2S400 and D2S367. However, the paternalhaplotype of affected individual VI-7 appears to be en-tirely discordant with that of her affected sister, VI-5(Fig. 3a). Both sisters have pathologically hyperactivereflexes and take baclofen for flexor spasms of the legs.
TABLE II. Comparison of Mean Age of Onset in Parents and Children
Parenta Child DifferenceFamily Sex Age of onset Sex Age of onset (yrs)
FSP02 M 32 F 53 121M 45 M 14 231F 50 F 35 215F 35 F 25 210F 35 M 2 233F 25 F 2 223F 25 M 2 223M 30 F 30 0M 30 M 9 221M 9 F 8 21
FSP03 F 75 M 50 225F 75 F 65 210F 75 M 50 225F 65 F 17 248F 65 F 36 229
FSP04 M 45 F 42 23F 52 F 28 224F 52 F 12 240
FSP06 M 50 F 2a248
F 60 F 36 224F 60 M 40 220
FSP08 F 60 F 70 110F 70 F 35 235F 70 F 72 12F 70 M 54 216F 70 M 51 219
FSP10 F 17 M 5 212M 5 F 8 13M 5 M 3 22
FSP11 M 42 M 24 218M 42 F 42 0M 24 M 17 27
FSP12 F 39 F 18 221F 54 M 42 212
FSP14 M 50 M 4 246M 50 F 6 244
FSP15 F 45 F 20 225FSP16 M 35 M 18 217
M 18 F 17 21M 18 M 13 25
mean 41.3 6 18.4 mean 26.9 6 20.4 P , .005n 5 25 n 5 40
a In family FSP06, there is one grandparent-grandchild pair. The parent of the child meets our criteriafor FSP but is asymptomatic. Therefore, an age of onset cannot be assigned.
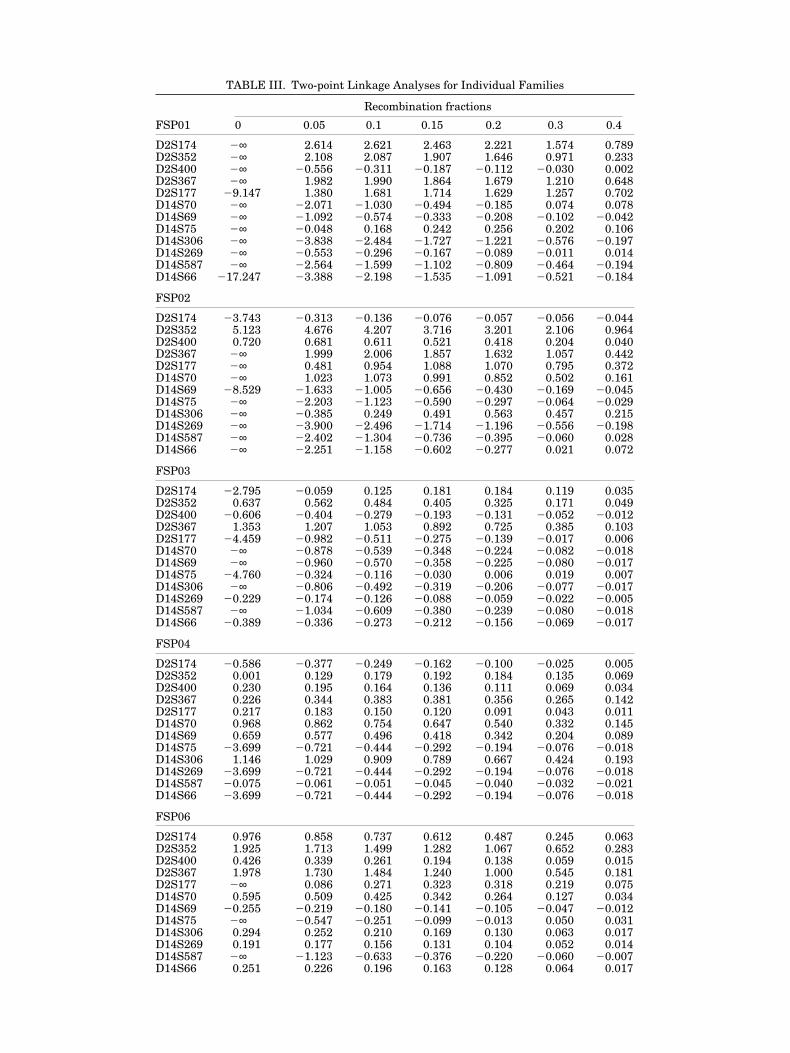
TABLE III. Two-point Linkage Analyses for Individual Families
Recombination fractions
FSP01 0 0.05 0.1 0.15 0.2 0.3 0.4
D2S174 2∞ 2.614 2.621 2.463 2.221 1.574 0.789D2S352 2∞ 2.108 2.087 1.907 1.646 0.971 0.233D2S400 2∞ 20.556 20.311 20.187 20.112 20.030 0.002D2S367 2∞ 1.982 1.990 1.864 1.679 1.210 0.648D2S177 29.147 1.380 1.681 1.714 1.629 1.257 0.702D14S70 2∞ 22.071 21.030 20.494 20.185 0.074 0.078D14S69 2∞ 21.092 20.574 20.333 20.208 20.102 20.042D14S75 2∞ 20.048 0.168 0.242 0.256 0.202 0.106D14S306 2∞ 23.838 22.484 21.727 21.221 20.576 20.197D14S269 2∞ 20.553 20.296 20.167 20.089 20.011 0.014D14S587 2∞ 22.564 21.599 21.102 20.809 20.464 20.194D14S66 217.247 23.388 22.198 21.535 21.091 20.521 20.184
FSP02
D2S174 23.743 20.313 20.136 20.076 20.057 20.056 20.044D2S352 5.123 4.676 4.207 3.716 3.201 2.106 0.964D2S400 0.720 0.681 0.611 0.521 0.418 0.204 0.040D2S367 2∞ 1.999 2.006 1.857 1.632 1.057 0.442D2S177 2∞ 0.481 0.954 1.088 1.070 0.795 0.372D14S70 2∞ 1.023 1.073 0.991 0.852 0.502 0.161D14S69 28.529 21.633 21.005 20.656 20.430 20.169 20.045D14S75 2∞ 22.203 21.123 20.590 20.297 20.064 20.029D14S306 2∞ 20.385 0.249 0.491 0.563 0.457 0.215D14S269 2∞ 23.900 22.496 21.714 21.196 20.556 20.198D14S587 2∞ 22.402 21.304 20.736 20.395 20.060 0.028D14S66 2∞ 22.251 21.158 20.602 20.277 0.021 0.072
FSP03
D2S174 22.795 20.059 0.125 0.181 0.184 0.119 0.035D2S352 0.637 0.562 0.484 0.405 0.325 0.171 0.049D2S400 20.606 20.404 20.279 20.193 20.131 20.052 20.012D2S367 1.353 1.207 1.053 0.892 0.725 0.385 0.103D2S177 24.459 20.982 20.511 20.275 20.139 20.017 0.006D14S70 2∞ 20.878 20.539 20.348 20.224 20.082 20.018D14S69 2∞ 20.960 20.570 20.358 20.225 20.080 20.017D14S75 24.760 20.324 20.116 20.030 0.006 0.019 0.007D14S306 2∞ 20.806 20.492 20.319 20.206 20.077 20.017D14S269 20.229 20.174 20.126 20.088 20.059 20.022 20.005D14S587 2∞ 21.034 20.609 20.380 20.239 20.080 20.018D14S66 20.389 20.336 20.273 20.212 20.156 20.069 20.017
FSP04
D2S174 20.586 20.377 20.249 20.162 20.100 20.025 0.005D2S352 0.001 0.129 0.179 0.192 0.184 0.135 0.069D2S400 0.230 0.195 0.164 0.136 0.111 0.069 0.034D2S367 0.226 0.344 0.383 0.381 0.356 0.265 0.142D2S177 0.217 0.183 0.150 0.120 0.091 0.043 0.011D14S70 0.968 0.862 0.754 0.647 0.540 0.332 0.145D14S69 0.659 0.577 0.496 0.418 0.342 0.204 0.089D14S75 23.699 20.721 20.444 20.292 20.194 20.076 20.018D14S306 1.146 1.029 0.909 0.789 0.667 0.424 0.193D14S269 23.699 20.721 20.444 20.292 20.194 20.076 20.018D14S587 20.075 20.061 20.051 20.045 20.040 20.032 20.021D14S66 23.699 20.721 20.444 20.292 20.194 20.076 20.018
FSP06
D2S174 0.976 0.858 0.737 0.612 0.487 0.245 0.063D2S352 1.925 1.713 1.499 1.282 1.067 0.652 0.283D2S400 0.426 0.339 0.261 0.194 0.138 0.059 0.015D2S367 1.978 1.730 1.484 1.240 1.000 0.545 0.181D2S177 2∞ 0.086 0.271 0.323 0.318 0.219 0.075D14S70 0.595 0.509 0.425 0.342 0.264 0.127 0.034D14S69 20.255 20.219 20.180 20.141 20.105 20.047 20.012D14S75 2∞ 20.547 20.251 20.099 20.013 0.050 0.031D14S306 0.294 0.252 0.210 0.169 0.130 0.063 0.017D14S269 0.191 0.177 0.156 0.131 0.104 0.052 0.014D14S587 2∞ 21.123 20.633 20.376 20.220 20.060 20.007D14S66 0.251 0.226 0.196 0.163 0.128 0.064 0.017
32 Raskind et al.
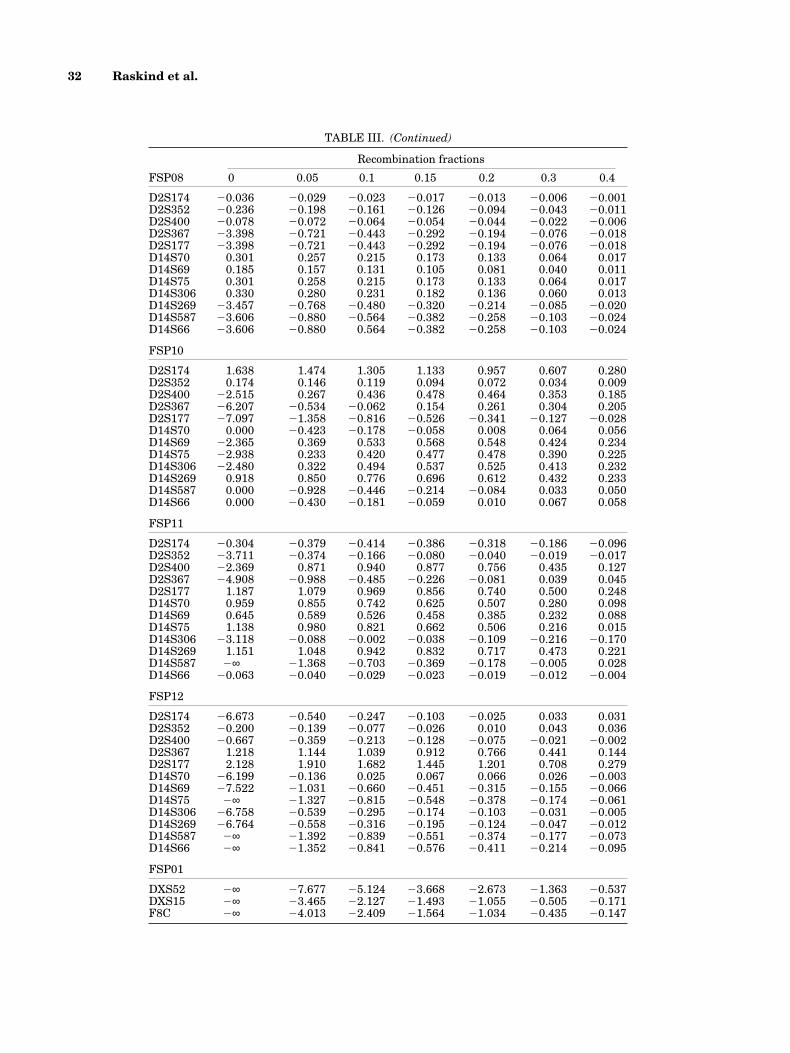
TABLE III. (Continued)
Recombination fractions
FSP08 0 0.05 0.1 0.15 0.2 0.3 0.4
D2S174 20.036 20.029 20.023 20.017 20.013 20.006 20.001D2S352 20.236 20.198 20.161 20.126 20.094 20.043 20.011D2S400 20.078 20.072 20.064 20.054 20.044 20.022 20.006D2S367 23.398 20.721 20.443 20.292 20.194 20.076 20.018D2S177 23.398 20.721 20.443 20.292 20.194 20.076 20.018D14S70 0.301 0.257 0.215 0.173 0.133 0.064 0.017D14S69 0.185 0.157 0.131 0.105 0.081 0.040 0.011D14S75 0.301 0.258 0.215 0.173 0.133 0.064 0.017D14S306 0.330 0.280 0.231 0.182 0.136 0.060 0.013D14S269 23.457 20.768 20.480 20.320 20.214 20.085 20.020D14S587 23.606 20.880 20.564 20.382 20.258 20.103 20.024D14S66 23.606 20.880 0.564 20.382 20.258 20.103 20.024
FSP10
D2S174 1.638 1.474 1.305 1.133 0.957 0.607 0.280D2S352 0.174 0.146 0.119 0.094 0.072 0.034 0.009D2S400 22.515 0.267 0.436 0.478 0.464 0.353 0.185D2S367 26.207 20.534 20.062 0.154 0.261 0.304 0.205D2S177 27.097 21.358 20.816 20.526 20.341 20.127 20.028D14S70 0.000 20.423 20.178 20.058 0.008 0.064 0.056D14S69 22.365 0.369 0.533 0.568 0.548 0.424 0.234D14S75 22.938 0.233 0.420 0.477 0.478 0.390 0.225D14S306 22.480 0.322 0.494 0.537 0.525 0.413 0.232D14S269 0.918 0.850 0.776 0.696 0.612 0.432 0.233D14S587 0.000 20.928 20.446 20.214 20.084 0.033 0.050D14S66 0.000 20.430 20.181 20.059 0.010 0.067 0.058
FSP11
D2S174 20.304 20.379 20.414 20.386 20.318 20.186 20.096D2S352 23.711 20.374 20.166 20.080 20.040 20.019 20.017D2S400 22.369 0.871 0.940 0.877 0.756 0.435 0.127D2S367 24.908 20.988 20.485 20.226 20.081 0.039 0.045D2S177 1.187 1.079 0.969 0.856 0.740 0.500 0.248D14S70 0.959 0.855 0.742 0.625 0.507 0.280 0.098D14S69 0.645 0.589 0.526 0.458 0.385 0.232 0.088D14S75 1.138 0.980 0.821 0.662 0.506 0.216 0.015D14S306 23.118 20.088 20.002 20.038 20.109 20.216 20.170D14S269 1.151 1.048 0.942 0.832 0.717 0.473 0.221D14S587 2∞ 21.368 20.703 20.369 20.178 20.005 0.028D14S66 20.063 20.040 20.029 20.023 20.019 20.012 20.004
FSP12
D2S174 26.673 20.540 20.247 20.103 20.025 0.033 0.031D2S352 20.200 20.139 20.077 20.026 0.010 0.043 0.036D2S400 20.667 20.359 20.213 20.128 20.075 20.021 20.002D2S367 1.218 1.144 1.039 0.912 0.766 0.441 0.144D2S177 2.128 1.910 1.682 1.445 1.201 0.708 0.279D14S70 26.199 20.136 0.025 0.067 0.066 0.026 20.003D14S69 27.522 21.031 20.660 20.451 20.315 20.155 20.066D14S75 2∞ 21.327 20.815 20.548 20.378 20.174 20.061D14S306 26.758 20.539 20.295 20.174 20.103 20.031 20.005D14S269 26.764 20.558 20.316 20.195 20.124 20.047 20.012D14S587 2∞ 21.392 20.839 20.551 20.374 20.177 20.073D14S66 2∞ 21.352 20.841 20.576 20.411 20.214 20.095
FSP01
DXS52 2∞ 27.677 25.124 23.668 22.673 21.363 20.537DXS15 2∞ 23.465 22.127 21.493 21.055 20.505 20.171F8C 2∞ 24.013 22.409 21.564 21.034 20.435 20.147
Linkage Analysis in SPG 33
It is possible that the affected individuals share a pa-ternal allele at D2S177. However, such concordancewould require crossover events between D2S367 andD2S177 in both chromosomes of individual VI-5. Re-combination events in other families place the SPG4gene proximal to D2S367. Disease in family FSP01 maynot be linked to any of the identified loci implicated inautosomal dominant SPG.
Chromosome 2 haplotypes in affected individuals inFSP02 were evaluated for recombination events thatdefine the interval containing SPG4. To refine the sitesof recombination, additional chromosome 2 markerswere genotyped. Haplotypes of a portion of this pedigreeare shown in Figure 3. Crossovers in IV-7 and VI-2 placeSPG4 in a 6cM interval between D2S367 and D2S392.
Because of the possibility that disease in FSP01 is X-linked, two X chromosome regions previously identifiedas containing genes for SPG were evaluated. Genotypesfor a CA repeat polymorphism in the first intron of PLPdid not segregate with the disease (data not shown).Therefore, SPG in this family is not allelic to PelizaeusMerzbacher disease (SPG2) in Xq21.3-q22 [Saugier-Veber et al., 1994]. Discordant inheritance of SPG andflanking markers tightly linked to L1CAM, a gene inXq28 involved in SPG1 [Kenwrick et al., 1986; Jouet et al., 1994; Cambi et al., 1996], were observed (TableIII; Fig. 3b).
DISCUSSIONIn a linkage analyses in nine multigenerational fam-
ilies with spastic paraparesis, we have obtained signif-
icant evidence for linkage of SPG to chromosome 2p in one family (FSP02) and suggestive evidence for link-age to this locus in two families (FSP06 and FSP12).Two-point analyses also provided suggestive evidencefor linkage of disease in FSP01 to the SPG4 locus andexcluded linkage to the SPG3 and SPG6 loci. However,haplotype evaluation of a sibship in generation VI con-flicts with this assignment. The pedigree characteris-tics of FSP01 are compatible with X-linkage, but ourdata exclude the previously identified SPG1 and SPG2loci. Haplotype evaluation argues that neither SPG3nor SPG4 is responsible for disease in FSP08. The find-ings in FSP01 and FSP08 are consistent with the exis-tence of at least one additional locus for SPG. Mappingresults in four of the families (FSP03, FSP04, FSP10,and FSP11) are inconclusive. These data agree with theprevious reports that SPG4 is the most common form ofSPG and that SPG2 is involved in a smaller subset of families [Hazan et al., 1994; Hentati et al., 1994b;Lennon et al., 1995; Fink et al., 1996]. To date, only asingle family with linkage to chromosome 15 has beenreported, and many families remain unlinked [Fink et al., 1995, 1996].
Haplotype analysis places the SPG4 locus within the6 cM interval on chromosome 2p flanked by D2S392and D2S367. Only a few genes have been mapped toband 2p21 [calmodulin 2 (CALM2), CAD trifunctionalprotein of pyrimidine biosynthesis (CAD), alobar, orsemilobar holoprosencephaly-2 (HPE2, HPC), luteiniz-ing hormone/choriogonadotropin receptor (LHCGR),interferon-inducible, double-stranded, RNA-dependent
Fig. 2. Multipoint linkage analysis for four markers on chromosome 2p, using the age-specific pene-trance curves calculated for each family. The solid line indicates the analysis of all members of the combined families, and the dashed line gives the results for only affected.
34 Raskind et al.
Fig. 3. (a) Haplotypes for chromosome 2 markers demonstrating discordance or key recombinationevents. Relevant portions of pedigrees FSP01, FSP02, and FSP08 are shown. The order of markers givenin the insets are according to Genome Data Base map C2M59 (last modified November 7, 1995). Mostlikely affected chromosomes are shown in black; a shaded segment denotes a possibly affected chromo-some portion. Inferred haplotypes are contained within brackets and have been constructed to minimizethe number of recombination events. Arrows indicate sites of crossing over. (b) Haplotypes of four affectedindividuals in FSP02 for markers flanking the L1CAM locus on the X chromosome.
protein kinase (PRKR), nonerythrocytic-1 beta spectrin(beta-fodrin; SPTBN1), follicle-stimulating hormonereceptor (FSHR, ODG1), and the F, S solute carrier fam-ily (SLC3A1)]. CALM is centromeric to the SPG criticalregion. The positions of the other genes relative to theSTRP markers used for linkage mapping are not known,but none has an obvious relationship to SPG from aphysiologic or pharmacologic standpoint.
There has been an attempt to divide SPG into twosubgroups based on age of onset. Type I SPG is charac-terized by onset of symptoms before age 35 in mostcases, whereas most cases of Type II SPG have onset af-ter age 35 [Harding, 1981, 1983]. It is unclear that thisclassification is biologically relevant. Five of six type IIfamilies studied by Hazan et al. [1994] were linked tochromosome 2, as was a family whose average age ofonset was in an intermediate range. This group previ-ously reported linkage to chromosome 14 of SPG in afamily whose average age of onset was 6 years (range2–50 years) [Hazan et al., 1993]. Three late onset SPGfamilies and one early onset family reported by Hentatiet al. [1994b] had high likelihood of linkage to chromo-some 2, and a family with very early onset (mean age ofonset ,5 years) showed likelihood of linkage to chro-mosome 14. Perhaps very early age of onset is associ-ated more often with SPG2. In this study, we were notable to assign linkage for the family with the earliestonset (FSP10).
A disease in which successive generations tend tohave earlier onset and increased severity is said to ex-hibit “anticipation.” Instability of intragenic tandemlyrepeated trinucleotide codons has been found to be thebiologic basis of this genetic phenomenon in other neu-rologic disorders. There may be a systematic bias inages of onset determined from historical informationbecause subsequent members may recognize theirsymptoms earlier than the first case in the family. How-ever, our data showing earlier age of onset in 34 of 40evaluable parent (or grandparent)/child pairs are con-sistent with anticipation. Other investigators have re-ported age of onset patterns in a few SPG families thatsuggest anticipation in both SPG3 [Gispert et al., 1995]and SPG4 [Hazan et al., 1994].
Study of additional families will be needed to deter-mine whether specific SPG genes have distinguishingclinical characteristics, whether anticipation is gener-ally associated with this class of disorders, and to per-form more detailed mapping of the loci. SPG is likely tobe a disease of layer V pyramidal neurons in primarymotor cortex, which presumably utilize glutamate asan excitatory neurotransmitter, GABA as an inhibitoryneurotransmitter, and serotonin as both an inhibitoryand excititory neurotransmitter [Behan and Maia, 1974;Spain 1994; Van Brederode and Spain, 1995]. Identifi-cation of genes involved in SPG will advance our un-derstanding of normal human motor system function-ing and suggest possible treatment strategies for thedisease.
ACKNOWLEDGMENTSWe appreciate the participation of the patients and
their families, without whose cooperation this work
would not have been possible. We are grateful to Dr.Robert Currier for referring family FSP12. This re-search was supported by NIH grants CA 16448(W.H.R., J.W.) and NS26630 (MAP-V, FL), researchfunds from the Department of Veterans Affairs (T.D.B.H.P.L., J.W.), and a grant from the Muscular Dystro-phy Association (MAP-V).
REFERENCESBehan WMH, Maia M (1974): Strumpell’s familial spastic paraplegia:
genetics and neuropathology. J Neurol Neurosurg Psychiat 37:8–20.Cambi F, Tang X-M, Cordray MS, Fain PR, Keppen LD, Barker DF
(1996): Refined genetic mapping and proteolipid protein mutationanalysis in X-linked pure hereditary spastic paraplegia. Neurol46:1112–1117.
CEPH-Genethon Genetic Map Data [database online]. Available fromInternet: ,http://gc.bcm.tmc.edu:8088/bio/access_gdata.html..
Cottingham W Jr, Idury RM, Schaffer AA (1993): Faster sequentialgenetic linkage computations. Am J Hum Genet 53:252–263.
Dausett J, Cann H, Cohen D, Lathrop M, Lalouel JM, White R (1990):Centre D’Etude du Polymorphisme Humain [CEPH]: Collabora-tive genetic mapping of the human genome. Genomics 6:575–577.
Fink JK, Heiman-Patterson T, Bird T, Cambi F, Dube M-P, Figelwicz D,Haines JL, et al. (1996): Hereditary spastic paraplegia: advancesin genetic research. Neurology 46:1507–1514.
Fink JK, Wu CT, Jones SM, Sharp GB, Lange BM, Lesicki A, Reinglass T, et al. (1995): Autosomal dominant familial spasticparaplegia: tight linkage to chromosome 15q. Am J Hum Genet56:188–192.
GDB(TM) Human Genome Data Base [database online]. Baltimore:Johns Hopkins University, 1990–. Updated daily. GDB Data Type:Map. GDB IDs: G00-351-034. [cited 7 Nov 1995]; G00-139-614[cited 3 Aug 95]; G00-591-941 [cited 3 Aug 95]; G00-355-649 [cited13 Oct 95]; G00-377-036 [cited 3 Aug 95]; G00-388-765 [cited 14Oct 95]. Available from Internet: ,URL:http://gdbwww.gdb.org/gdb/browser/docs/topq.html..
Gispert S, Santos N, Damen R, Voit T, Schulz J, Klockgether T, Orozco G, et al. (1995): Autosomal dominant familial spastic para-plegia: reduction of the FSP1 candidate region on chromosome 14qto 7 cM and locus heterogeneity. Am J Human Genet 56:183–187.
Harding AE (1981): Hereditary “pure” spastic paraplegia: A clinicaland genetic study of 22 families. J Neurol Neurosurg Psychiatry44:163–167.
Harding, A.E. (1983): Classification of the hereditary ataxias andparaplegias. Lancet i:1151–1155.
Hazan J, Fontaine B, Bruyn RPM, Lamy C, van Deutekon JCT, RimeC-S, Durr A, et al. (1994): Linkage of a new locus for autosomaldominant familial spastic paraplegia to chromosome 2p. HumMolec Genet 3:1569–1573.
Hazan J, Lamy C, Melki J, Munnich A, de Recondo J, Weissenbach J(1993): Autosomal dominant familial spastic paraplegia is geneti-cally heterogeneous and one locus maps to chromosome 14q. NatGenet 5:163–167.
Hentati A, Pericak-Vance MA, Hung WY, Belal S, Laing N, Boustany RM, Hentati F, et al. (1994a): Linkage of ‘pure’ autoso-mal recessive familial spastic paraplegia to chromosome 8 mark-ers and evidence of genetic locus heterogeneity. Hum Mol Genet3:1263–1267.
Hentati A, Pericak-Vance MA, Lennon F, Wasserman B, Hentati F,Juneja T, Angrist MH, et al. (1994b): Linkage of a locus for auto-somal dominant familial spastic paraplegia to chromosome 2pmarkers. Hum Molec Genet 3:1867–1871.
Jouet M, Rosenthal A, Armstrong G, MacFarlane J, Stevenson R, Paterson J, Metzenberg A, Ionasescu V, Temple K, Kenwrick S(1994): X-linked spastic paraplegia (SPG1), MASA syndrome andX-linked hydrocephalus result from mutations in the L1 gene. NatGenet 7:402–407.
Kenwrick SV, Ionasescu G, Ionasescu C, Searby A, King M, Dubowitz M,Davies KE (1986): Linkage studies of X-linked recessive spasticparaplegia using DNA probes. Hum Genet 73:264–266.
Lathrop GM, Lalouel JM, Ott J (1984): Strategies for multilocus link-age analysis in humans. Proc Natl Acad Sci USA 81:3443–3446.
Linkage Analysis in SPG 35
Pelizaeus-Merzbacher disease are allelic disorders at the proteo-lipid protein locus. Nature Genet 6:257–261.
Schaffer AA, Gupta K, Shriram K and Cottingham RW (1994): Avoid-ing recomputation in linkage analysis. Hum Hered 44:225–237.
Spain WJ (1994): Serotonin has different effects on two classes of Betzcells from the cat. J Neurophysiol 72:1925–1937.
Speer MC (1995): Use of LINKAGE programs for linkage analysis. In Dracopoli NC, Haines JL, Korf BR, Moir DT, Morton CC, Seidman CE, Seidman JG, Smith DR (eds): “Current Protocols inHuman Genetics, Vol. 1: Human Genetics–Laboratory Manuals.”New York: Wiley & Sons, pp 1.7.1–1.7.53.
Sutherland GR, Richards RI (1995): Simple tandem DNA re-peats and human genetic disease. Proc Natl Acad Sci USA 92:3636–3641.
Sutherland JM (1975): Familial spastic paraplegia. In Vinken PJ,Bruyn GW (eds): “Hereditary Neurological Disorders,” Vol. 22:Handbook of Clinical Neurology. “Amsterdam: North Holland, pp421–431.
Van Brederode JFM, Spain WJ (1995): Differences in inhibitorysynaptic input between layer II–III and layer V neurons of the catneocortex. J Neurophysiol 74:1149–1166.
36 Raskind et al.
Lennon F, Gaskell PC, Wolpert C, Aylsworth AS, Malin D, Warner C,Farrell CD, Boustany RN, Albright SG, Kingston HM, Cummings WJK, Hogan EL, Vance JM, Pericak-Vance MA (1995):Linkage and heterogeneity in hereditary spastic paraparesis. AmJ Hum Genet 57 (suppl):A217 (abs 1255).
McKusick VA (1990): “Mendelian Inheritance in Man.” Baltimore:Johns Hopkins University Press.
O’Connell JR, Weeks DE (1995): The Vitesse algorithm for rapid exactmultilocus linkage analysis via genotype set-recoding and fuzzy in-heritance. Nat Genet 11:402–408.
Ott J (1991): “Analysis of human genetic linkage.” Baltimore: JohnsHopkins University Press, pp. 198–213.
Ploughman LM, Boehnke M (1989): Estimating the power of a proposedlinkage study for a complex trait. Am J Hum Genet 44:543–551.
Raskind WH, Conrad EU, Chansky H, Matsushita M (1995): Loss ofheterozygosity in chondrosarcomas for markers linked to heredi-tary multiple exostoses loci on chromosomes 8 and 11. Am J HumGenet 56:1132–1139.
Saugier-Veber P, Munnich A, Bonneau D, Rozet J-M, Le Merrer M, Gil R, Boespflug-Tanguy O (1994): X-linked spastic paraplegia and