faisal hossain editor earth science satellite applications
TRANSCRIPT

Springer Remote Sensing/Photogrammetry
Faisal Hossain Editor
Earth Science Satellite ApplicationsCurrent and Future Prospects

Springer Remote Sensing/Photogrammetry

More information about this series at http://www.springer.com/series/10182

Faisal HossainEditor
Earth Science SatelliteApplicationsCurrent and Future Prospects
123

EditorFaisal HossainUniversity of WashingtonSeattle, WAUSA
ISSN 2198-0721 ISSN 2198-073X (electronic)Springer Remote Sensing/PhotogrammetryISBN 978-3-319-33436-3 ISBN 978-3-319-33438-7 (eBook)DOI 10.1007/978-3-319-33438-7
Library of Congress Control Number: 2016936681
© Springer International Publishing Switzerland 2016This work is subject to copyright. All rights are reserved by the Publisher, whether the whole or partof the material is concerned, specifically the rights of translation, reprinting, reuse of illustrations,recitation, broadcasting, reproduction on microfilms or in any other physical way, and transmissionor information storage and retrieval, electronic adaptation, computer software, or by similar or dissimilarmethodology now known or hereafter developed.The use of general descriptive names, registered names, trademarks, service marks, etc. in thispublication does not imply, even in the absence of a specific statement, that such names are exempt fromthe relevant protective laws and regulations and therefore free for general use.The publisher, the authors and the editors are safe to assume that the advice and information in thisbook are believed to be true and accurate at the date of publication. Neither the publisher nor theauthors or the editors give a warranty, express or implied, with respect to the material contained herein orfor any errors or omissions that may have been made.
Printed on acid-free paper
This Springer imprint is published by Springer NatureThe registered company is Springer International Publishing AG Switzerland

Preface
We present here the book titled ‘Earth Science Satellite Applications: Current and FutureProspects.’ When talking about prospects of satellite applications, it is important to talkabout capacity, or capacity building for handling satellite (or Earth Observation) systems.Capacity building using Earth Observing (EO) systems and data (i.e., from orbital andnon-orbital platforms) to enable societal applications may be defined as the network of softand hard components comprising human, non-human, technical, non-technical, hardware,and software dimensions necessary to successfully cross the gap between science andresearch and societal application taken from “Hossain et al. (2016)”.
In today’s world, it has become quite clear that the capacity building community ofscientists and stakeholders need to be better prepared to take advantage of therapidly emerging, abundant scientific output and remote sensing data from satellitemissions by converting them into decision-making products for end users.
An organization is said to have resilient capacity when it can retain and continueto build capacity in the face of unexpected shocks or stresses. Shocks may alsoinclude extreme events such as disasters and losing key staff with technical andinstitutional knowledge. So how do we change this course and take full advantageof satellite Earth observational capability towards a more sustainable, safer futurein the coming decades?
To address this key question and strengthen the global societal applications andcapacity building community’s voice, a 3-day workshop was held in Tacoma(Washington) during June 23–25, 2015, in anticipation of the 2017–2027 NRCDecadal Survey. This edited book is a result of this workshop. The workshop wassponsored by the NASA Applied Sciences Program as an E2 Topical Workshop,Symposium, and Conference (TWSC) event. It brought together experts from theapplied sciences community already engaged in capacity building across variousthemes for the stakeholder community; NASA Applied Sciences and CapacityBuilding programmatic personnel; and several international stakeholder agencieswith a history of using and a need for EO systems and data. The workshop aimed todebate issues to formulate a vision and a path forward for the NASA AppliedSciences and Capacity Building community.
v

First, we provide in this book international perspectives from around the worldon the value of EO/satellite systems for societal systems and the hurdles toachieving full potential of earth observations. Such perspectives have been gatheredfrom various corners of the world such as Asia, Africa, and Americas. The bookalso provides a thematic breakdown of societal applications such as disasters, waterresources, health, and ecosystems. A program to engage the application communityearly in the process for making planned satellite missions for societally relevant isalso discussed. Finally, the book provides a real-world and optimistic scenario ofhow one stakeholder agency was able to benefit from the engagement with scientificcommunity and take advantage of satellite system for flood management.
This book would not have been possible without the active support of Dr. NancySearby, Program Manager of NASA Capacity Building Program, Lawrence Friedl,Dan Irwin (SERVIR), Ashutosh Limaye (SERVIR), International Center ofIntegrated Mountain Development (ICIMOD), Asian Disaster Preparedness Center(ADPC), Regional Center for Mapping of Resources (RCMRD), and Greg Miller(University of Washington). In addition, we also acknowledge the role of numerousparticipants of the workshop (many of them now authors of various chapters) whoprovided valuable input to the discussion.
We hope that readers benefit from this book and ponder with scientists andstakeholders alike how best to move forward with building durable capacity ofsatellite EO systems in the future.
Faisal HossainOn behalf of the Capacity Building and Satellite Application Community
Reference
Hossain, F., Serrat-Capdevila, A., Granger, S., Thomas, A., Saah, D., Ganz, D., et al. (2016, In press).A global capacity building vision for societal applications of Earth observing systems and data:Key questions and recommendations. Bulletin of the American Meteorological Society. doi:10.1175/BAMS-D-15-00198.1, http://journals.ametsoc.org/doi/pdf/10.1175/BAMS-D-15-00198.1.
vi Preface

Contents
Part I International Perspectives of Satellite Earth ObservationData for Societal Benefit
The Role of Earth Observation for Managing Biodiversityand Disasters in Mesoamerica: Past, Present, and Future . . . . . . . . . . . 3Victor H. Ramos and Africa I. Flores
Reform Earth Observation Science and Applications to TransformHindu Kush Himalayan Livelihoods—Services-Based Vision 2030 . . . . . 27M.S.R. Murthy, Deo Raj Gurung, Faisal Mueen Qamer,Sagar Bajracharya, Hammad Gilani, Kabir Uddin, Mir Matin,Birendra Bajracharya, Eric Anderson and Ashutosh Limaye
Integrating Earth Observation Systems and Data into DisasterPreparedness in the Lower Mekong: Experiences from the AsianDisaster Preparedness Center . . . . . . . . . . . . . . . . . . . . . . . . . . . . . . . 63David J. Ganz, Peeranan Towashiraporn, N.M.S.I. Arambepola,Anisur Rahman, Aslam Perwaiz, Senaka Basnayake, Rishiraj Duttaand Anggraini Dewi
Land Cover Mapping for Green House Gas Inventories in Easternand Southern Africa Using Landsat and High Resolution Imagery:Approach and Lessons Learnt . . . . . . . . . . . . . . . . . . . . . . . . . . . . . . . 85Phoebe Oduor, Jaffer Ababu, Robinson Mugo, Hussein Farah,Africa Flores, Ashutosh Limaye, Dan Irwin and Gwen Artis
Part II Thematic Perspectives of Satellite Earth ObservationData for Societal Benefit
Role of Earth Observation Data in Disaster Response and Recovery:From Science to Capacity Building . . . . . . . . . . . . . . . . . . . . . . . . . . . 119Guy Schumann, Dalia Kirschbaum, Eric Anderson and Kashif Rashid
vii

Applying Earth Observations to Water Resources Challenges . . . . . . . . 147Christine M. Lee, Aleix Serrat-Capdevila, Naveed Iqbal,Muhammad Ashraf, Benjamin Zaitchik, John Bolten, Forrest Meltonand Bradley Doorn
Use of Remotely Sensed Climate and Environmental Informationfor Air Quality and Public Health Applications . . . . . . . . . . . . . . . . . . 173William Crosson, Ali Akanda, Pietro Ceccato, Sue M. Estes,John A. Haynes, David Saah, Thomas Buchholz, Yu-Shuo Chang,Stephen Connor, Tufa Dinku, Travis Freed, John Gunn,Andrew Kruczkiewicz, Jerrod Lessel, Jason Moghaddas, Tadashi Moody,Gary Roller, David Schmidt, Bruce Springsteen, Alexandra Sweeneyand Madeleine C. Thomson
Satellite Remote Sensing in Support of Fisheries Managementin Global Oceans . . . . . . . . . . . . . . . . . . . . . . . . . . . . . . . . . . . . . . . . 207Dovi Kacev and Rebecca L. Lewison
Improving NASA’s Earth Observation Systems and Data ProgramsThrough the Engagement of Mission Early Adopters . . . . . . . . . . . . . . 223Vanessa M. Escobar, Margaret Srinivasan and Sabrina Delgado Arias
Application of Satellite Radar Altimeter Data in OperationalFlood Forecasting of Bangladesh . . . . . . . . . . . . . . . . . . . . . . . . . . . . . 269Amirul Hossain and Md. Arifuzzaman Bhuiyan
viii Contents

Part IInternational Perspectives of Satellite Earth
Observation Data for Societal Benefit

The Role of Earth Observationfor Managing Biodiversity and Disastersin Mesoamerica: Past, Present, and Future
Victor H. Ramos and Africa I. Flores
Abstract Mesoamerica is a term used sometimes in cultural context, but in thisarticle we are using it to name the land bridge between North and South America,made up of the SouthernMexico States (Chiapas, Quintana Roo, Yucatán, Campechey Tabasco), Guatemala, Belize, El Salvador, Honduras, Nicaragua, Costa Rica, andPanama. With an area of approximately 755,000 square kilometers, it is one of themost heterogeneous regions of the world in terms of elevation, land forms, climate,natural ecosystems and human populations. In the general context given, the potentialof Earth observation (EO) to assist the management of natural resources, biodiversityand disasters in the region is clear. In this chapter, we discuss the current state of EOapplications and future perspectives related to land-use change, ecosystem dynamicsand biodiversity and solid-earth hazards. We hope that this contribution can identifycurrent and future challenges related to obtaining the biggest societal benefit of EOand suggest actions to take advantage of anticipated innovations and data availability.
1 Introduction
Mesoamerica is a term used sometimes in cultural context, but in this article we areusing it to name the land bridge between North and South America, made up of theSouthern Mexico States (Chiapas, Quintana Roo, Yucatán, Campeche y Tabasco),
V.H. Ramos (&)National Council of Protected Areas, Guatemala-Monitoring and Evaluation Center(CONAP-CEMEC), Antiguo Hospital de San Benito, Petén, Guatemala, USAe-mail: [email protected]
V.H. RamosWildlife Conservation Society (WCS), Avenida 15 de Marzo, Calle Fraternidad, Flores,Petén, Guatemala, USA
A.I. Flores (&)University of Alabama in Huntsville, Huntsville, USAe-mail: [email protected]
A.I. FloresNASA-SERVIR Science Coordination Office, Huntsville, AL, USA
© Springer International Publishing Switzerland 2016F. Hossain (ed.), Earth Science Satellite Applications,Springer Remote Sensing/Photogrammetry, DOI 10.1007/978-3-319-33438-7_1
3

Guatemala, Belize, El Salvador, Honduras, Nicaragua, Costa Rica, and Panama.With an area of approximately 755,000 km2, it is one of the most heterogeneousregions of the world in terms of elevation, land forms, climate, natural ecosystems,and human populations.
With an estimated population of 58 million inhabitants by 2015, of which closeto one third are under 15 years of age, the population is expected to grow to 69million inhabitants by 2030 (Celade 2004, 2014; CONAPO 2014). Populationgrowth dynamics vary from country to country with extremes in Guatemala, whichis projected to have between 2015 and 2030 a 1.87 %/year increase in populationand El Salvador that is projected to have 0.39 %/year increase for the same period.Ethnic diversity is another characteristic of human populations in Mesoamerica,with over 60 different ethnic/linguistic groups (Center for Support of Native Lands,National Geographic 2002). Around one third of the population lives with less thanUS$4/day and therefore they are considered poor, although the trend appears to bethe reduction of this number (World Bank 2013).
The region has also been the scene of violent conflicts, including civil wars inGuatemala, El Salvador and Nicaragua that concluded by the end of the 1990s decade.More recently, and in connectionwith common crime, gangs, and organized crime, fourof the eight countries in Mesoamerica (Honduras, El Salvador, Belize, and Guatemala)have been included in the top ten ranking of murder rates per 100,000/inhabitants(UNODC2013). The aggregate effects of poverty and violence are the believed cause ofmassive migrations, highlighted recently by the crises of unaccompanied childrenmigrating from Central America and Mexico into the U.S. (Pierce 2015).
Mesoamerica is one of the original proposed global biodiversity hotspots andcontains 24,000 species of plants, 2859 species of vertebrates and is one of theleading regions of the world regarding the presence of endemic species (Myers et al.2000). The northern part of the region is one of the eight centers of origin ofdomesticated plants, for world crops like maize, beans, peppers, tomato, cotton, andcacao (Vavilov and Freier 1951). Around 28 % of all the terrestrial area is undersome kind of formal protection (UNEP-WCMC 2014) but there is concernregarding the limitations of the effectiveness of protected areas in conservingbiodiversity, preventing deforestation and degradation(Blackman et al. 2015),which is often interpreted as the results of economical and social issues and thegeneral scarcity of resources to manage and administer protected areas.
Deforestation is one of the biggest threats for biodiversity and protected areas inMesoamerica. An estimated 5 million hectares of forest have been lost between2000 and 2013 in the eight countries of the region (Hansen et al. 2013).Deforestation has been historically linked to the promotion of colonization bygovernments, spontaneous migration and more recently to the increasing impor-tance of agro-industrial crops like oil palm (Rival and Levang 2015). Fire in thewild-lands is closely related to agricultural expansion because of the almost uni-versal use of fire as a clearing tool and is the other big threat to biodiversity. Severefire events occurred in 1998, 2003, and 2005 when hundreds of thousands ofhectares of forests and savannas burned for several months and smoke of thoseburnings reached the U.S. (Wang et al. 2006).
4 V.H. Ramos and A.I. Flores

Mesoamerica is also a region vulnerable to disasters that cause periodicallyimportant human and material losses. Statistics between 1990 and 2014 indicatethat there have been 36 earthquakes, 104 floods, 17 landslides, 82 storms, and 21volcanic events. These disasters have caused more than 28 thousand deaths, lefthomeless close to one million people and caused US$50 billion in damages(Guha-Sapir et al. 2009).
In the general context given, the potential of Earth Observation (EO) to assist themanagement of natural resources, biodiversity, and disasters in the region is clear.In this chapter, we discuss the current state of EO applications and future per-spectives related to Land-use Change, Ecosystem Dynamics and Biodiversity, andSolid-Earth Hazards. We hope that this contribution can identify current and futurechallenges related to obtaining the biggest societal benefit of EO and suggestactions to take advantage of anticipated innovations and data availability.
2 Current State
2.1 Land-Use Change, Ecosystem Dynamics,and Biodiversity
Wide availability and free access of remote sensing data along with advances incommunications technology have made possible, relatively recently, an exponentialgrowth of the use of EO data. The turning point in this growth of applications wasprobably the decision to make freely available all Landsat data in the U.S.Geological Survey (USGS) archive by 2008, when distribution went from a fewthousand scenes by year to millions by year (Turner et al. 2015). Mesoamerica is noexception to that trend and increasingly more uses and applications are present ingovernment, private, and academic contexts.
To characterize the recent progress and current state in the use of EO data inapplications related to land use change, ecosystems, and biodiversity carried on inMesoamerica we selected examples at national and regional scales. Information on19 cases has been collected, 11 of them focused at the national level, and 8 areregional or multicountry level. A summary of these cases is presented in Table 1.
The earliest analysis included in Table 1 (Vreugdenhil et al. 2002) was the Mapof Ecosystems of Central America and had the primary objective to describe theecosystems to establish a baseline of biodiversity in the region and serve as a basisfor biological monitoring programs. The map was also intended to be used as areference in the design of the Mesoamerican Biological Corridor. The map wasderived using visual interpretation of Landsat scenes with local experts in eachcountry, helping to delineate ecosystems with a strong emphasis on field verifica-tion and ecosystem data collection. The map was perhaps the first time EO data wasused at the regional scale, and still today is used even if the acquisition date of theLandsat scenes ranged between 1997 and 1999.
As expected, the most often used EO data comes from the Landsat Project(63 %), followed by the Moderate Resolution Imaging Spectroradiometer (MODIS)
The Role of Earth Observation for Managing Biodiversity … 5

Tab
le1
Selected
EO
applications
inMesoamericaon
land
-use
change,ecosystem
dynamics,andbiod
iversity
Descriptio
nCou
ntry
coverage
Sensors
Acquisitio
ndate
Metho
dInstitu
tion
References
Map
oftheecosystemsof
Central
America
GT,BZ,
HN,SV
,NI,CR,
PA
Landsat
1997
–19
99Visualinterpretatio
nof
remotesensingdata,field
verificatio
n
World
Bankandthe
Com
isiónCentroamericana
deAmbiente
yDesarrollo
(CCAD)
Vreug
denh
ilet
al.
(200
2)
Chang
esin
land
cover
anddeforestationin
Central
America19
90–
2008
GT,BZ,
HN,SV
,NI,CR,
PA
AVHRR,
Landsat,
MODIS,
Spot
Vegetation,
MERIS,
AlosPalsar
1981
–20
10Datacompilatio
n,digital
classificatio
nof
remote
sensingdata,field
verificatio
n
CentrodelAgu
adelTrópico
Húm
edopara
AméricaLatina
yel
Caribe(CATHALAC)
Cherrington
etal.
(201
1)
Ocean
Algal
bloo
mmon
itoring
for
Mesoamerica
MX,
GT,BZ,
HN,SV
,NI,CR,
PA
MODIS
2005
–
present
SeaD
AS(SeaWiFSData
AnalysisSy
stem
)im
age
processing
Mesoamerican
Regional
VisualizationandMon
itoring
System
(SERVIR)
Graveset
al.
(200
7)
PotentialIm
pactsof
clim
atechange
onBiodiversity
inCentral
America,
Mexico,
Dom
inican
Repub
lic
MX,
GT,BZ,
HN,SV
,NI,CR,
PA,DO
Inpu
tsrelatedto
land
use
derivedfrom
Landsat
1997
–20
05Dataintegration,
clim
ate
change
anom
aliesderivatio
nCentrodelAgu
adelTrópico
Húm
edopara
AméricaLatina
yel
Caribe(CATHALAC)
And
ersonet
al.
(200
8)
Using
EOdatato
improv
eREDD+po
licy
MX,
GT,BZ,
HN,SV
,NI,CR,
PA,DO
Landsat,
MODIS,
SRTM,
TRMM
1995
–
present
Dataintegration,
decision
tools,digitalclassificatio
nof
remotesensingdata
Resou
rces
fortheFu
ture,Inc
andMesoamerican
Regional
VisualizationandMon
itoring
System
(SERVIR)
Blackman
(201
3)
(con
tinued)
6 V.H. Ramos and A.I. Flores

Tab
le1
(con
tinued)
Descriptio
nCou
ntry
coverage
Sensors
Acquisitio
ndate
Metho
dInstitu
tion
References
Operatio
nalprog
ram
for
thedetectionof
hot-spots
usingremotesensing
techniqu
es
MX,
GT,BZ,
HN,SV
,NI,CR,
PA
AVHRR,
MODIS
1998
–
present
AVHRR
andMODIS
fire
detectionalgo
rithmsadapted
totheregion
Com
isiónNacionalpara
elCon
ocim
ientoyUso
dela
Biodiversidad
(CONABIO
)
Flasse
andCeccato
(199
6)Giglio
etal.(20
03)
Resslet
al.(200
9)
MAD-M
EX:Autom
atic
Wall-to-W
allLandCov
erMon
itoring
forthe
Mexican
REDD-M
RV
Prog
ram
Using
All
Landsat
Data
MX
Landsat
1993
–20
08Digitalclassificatio
nof
remotesensingdata
Com
isiónNacionalpara
elCon
ocim
ientoyUso
dela
Biodiversidad
(CONABIO
),Com
isiónNacionalFo
restal
(CONAFO
R),Institu
toNacionalde
Estadísticay
Geografía
(INEGI)
Gebhardtet
al.
(201
4)
ANational,DetailedMap
ofFo
restAbo
vegrou
ndCarbo
nStocks
inMexico
MX
Landsat,
AlosPalsar,
SRTM
2000
–20
08Mod
elingof
therelatio
nship
betweenfusedop
tical
and
SARdata
andfieldabov
egrou
ndbiom
ass
measurements
Com
isiónNacionalFo
restal
(CONAFO
R),Woo
dsHole
ResearchCenter(W
HRC)
Cartusetal.(20
14)
Mangrov
esof
Mexico:
extent,distribu
tion,
and
mon
itoring
MX
Aerial
photos,
SPOT,
Landsat
1970
–20
10Visualinterpretationof
aerial
photos,digitalclassificatio
nof
remotesensingdata
Com
isiónNacionalpara
elCon
ocim
ientoyUso
dela
Biodiversidad
(CONABIO
)
Rod
rígu
ez-Zúñiga
etal.(201
3)
Ano
velSatellite-based
Ocean
Mon
itoring
System
forMexico
MX,
GT,BZ,
HN,SV
,NI,CR,
PA
MODIS
2002
–
present
Algorith
msto
obtain
surface
temperature,andoceancolor
prod
ucts,chloroph
yll–a
concentration,
total
suspendedmatter
concentration,
chloroph
yll
fluo
rescence
andother
variables
Com
isiónNacionalpara
elCon
ocim
ientoyUso
dela
Biodiversidad
(CONABIO
)
CerdeiraLóp
ez(201
1)
(con
tinued)
The Role of Earth Observation for Managing Biodiversity … 7

Tab
le1
(con
tinued)
Descriptio
nCou
ntry
coverage
Sensors
Acquisitio
ndate
Metho
dInstitu
tion
References
Dyn
amicsof
forestcover
inGuatemala
GT
Landsat,
Aster
2000
–20
10Digitalclassificatio
nof
remotesensingdata
Institu
toNacionald
eBosqu
es(INAB),Con
sejo
Nacionald
eÁreas
Protegidas
(CONAP),
Universidad
delValle
deGuatemala(U
VG),Ministerio
deAmbiente
yRecursos
Naturales
(MARN),
Universidad
RafaelLandívar
INAB,CONAP,
UVG,U
RL(201
2)
GeospatialInform
ation
System
forFire
Managem
ent(SIG
MA-I)
inGuatemala
GT
MODIS,
Landsat,
TRMM
1998
–20
09Datacompilatio
n,digital
classificatio
nof
remote
sensingdata
Con
sejo
Nacionalde
Áreas
Protegidas
(CONAP),
Institu
toNacionald
eBosqu
es(INAB),Coo
rdinadora
Nacionalpara
laReducción
deDesastres
(CONRED),
Ministeriode
Ambiente
yRecursosNaturales
(MARN)
CONAP,
INAB,
CONRED,M
ARN
(201
0)
Forestcoverand
deforestationin
Belize:
1980
–20
10
BZ
Landsat
1979
–20
10Digitalclassificatio
nof
remotesensingdata
CentrodelAgu
adelTrópico
Húm
edopara
AméricaLatina
yel
Caribe(CATHALAC),
LandInform
ationCentre,
ForestDepartm
ent
Cherrington
etal.
(201
0)
AMODIS
generatedland
covermapping
ofHon
duras:abase-line
layo
utto
create
anatio
nal
mon
itoring
center
HN
MODIS
2009
Digitalclassificatio
nof
remotesensingdata
University
ofUtah,
Escuela
Nacionalde
Ciencias
Forestales
Riveraet
al.
(201
1)
(con
tinued)
8 V.H. Ramos and A.I. Flores

Tab
le1
(con
tinued)
Descriptio
nCou
ntry
coverage
Sensors
Acquisitio
ndate
Metho
dInstitu
tion
References
App
licationof
low
resolutio
nsatellite
data
forthedetectionand
mon
itoring
offire
inNicaragua
NI
AVHRR
1996
–20
03AVHRR
andMODIS
fire
detectionalgo
rithms
Ministeriode
Agricultura
yFo
restal,Ministeriode
Ambiente
yRecursos
Naturales
Mejía
etal.(200
4)
Classificatio
nof
coastal
marineecosystemsin
Costa
Rica
CR
RapidEye,
Worldview
220
09–20
11Digitalclassificatio
nof
remotesensingdata
Coastal
MarineBiodiversity
Project,Sistem
aNacionalde
Áreas
deCon
servación,
DeutscheGesellschaftfür
Internationale
Zusam
menarbeit
BIO
MARCC,
SINAC,GIZ
(201
2)
Con
sistenthistorical
time
series
ofactiv
itydata
from
land
usechange
inCosta
Rica
CR
Landsat,
RapidEye
2000
–20
12Digitalclassificatio
nof
remotesensingdata
Agresta
Sociedad
Coo
perativ
a,DigitalIm
age
Processing
,Universidad
deCosta
Rica,
Universidad
Politécnica
deMadrid
Agresta,Dim
ap,
Universidad
deCosta
Rica,
Universidad
Politécnica
deMadrid(201
5)
High-fidelitynatio
nal
carbon
mapping
for
resource
managem
entand
REDD+
PALandsat,
MODIS,
airborne
LiDAR
2008
–20
12Mod
elingof
therelatio
nship
betweenLiDAR,fieldabov
egrou
ndbiom
ass
measurementsandop
tical
remotesensingdata
Departm
entof
Global
Ecology
,CarnegieInstitu
tion
forScience
Asner
etal.(20
13)
Highresolutio
nmapping
offorestandforesttypes
inCentral
America
GT,BZ,
HN,SV
,NI,CR,
PA
Rapideye
2011
–20
13Digitalob
ject
oriented
classificatio
nof
remote
sensingdata
REDD-CCAD/GIZ
Prog
ram
andnatio
nalcoun
terpart
agencies
Jimenez
(201
3)
Cou
ntry
codes:MX
=Mexico,
GT=Guatemala,
BZ=Belize,
SV=ElSalvador,HN
=Hon
duras,NI=Nicaragua,CR
=Costa
Rica,
PA=Panamá
The Role of Earth Observation for Managing Biodiversity … 9
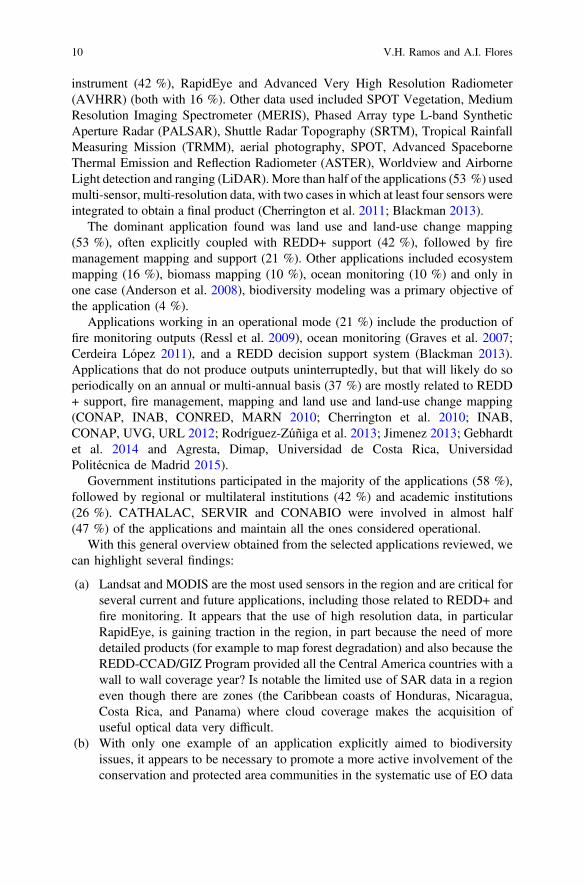
instrument (42 %), RapidEye and Advanced Very High Resolution Radiometer(AVHRR) (both with 16 %). Other data used included SPOT Vegetation, MediumResolution Imaging Spectrometer (MERIS), Phased Array type L-band SyntheticAperture Radar (PALSAR), Shuttle Radar Topography (SRTM), Tropical RainfallMeasuring Mission (TRMM), aerial photography, SPOT, Advanced SpaceborneThermal Emission and Reflection Radiometer (ASTER), Worldview and AirborneLight detection and ranging (LiDAR). More than half of the applications (53 %) usedmulti-sensor, multi-resolution data, with two cases in which at least four sensors wereintegrated to obtain a final product (Cherrington et al. 2011; Blackman 2013).
The dominant application found was land use and land-use change mapping(53 %), often explicitly coupled with REDD+ support (42 %), followed by firemanagement mapping and support (21 %). Other applications included ecosystemmapping (16 %), biomass mapping (10 %), ocean monitoring (10 %) and only inone case (Anderson et al. 2008), biodiversity modeling was a primary objective ofthe application (4 %).
Applications working in an operational mode (21 %) include the production offire monitoring outputs (Ressl et al. 2009), ocean monitoring (Graves et al. 2007;Cerdeira López 2011), and a REDD decision support system (Blackman 2013).Applications that do not produce outputs uninterruptedly, but that will likely do soperiodically on an annual or multi-annual basis (37 %) are mostly related to REDD+ support, fire management, mapping and land use and land-use change mapping(CONAP, INAB, CONRED, MARN 2010; Cherrington et al. 2010; INAB,CONAP, UVG, URL 2012; Rodríguez-Zúñiga et al. 2013; Jimenez 2013; Gebhardtet al. 2014 and Agresta, Dimap, Universidad de Costa Rica, UniversidadPolitécnica de Madrid 2015).
Government institutions participated in the majority of the applications (58 %),followed by regional or multilateral institutions (42 %) and academic institutions(26 %). CATHALAC, SERVIR and CONABIO were involved in almost half(47 %) of the applications and maintain all the ones considered operational.
With this general overview obtained from the selected applications reviewed, wecan highlight several findings:
(a) Landsat and MODIS are the most used sensors in the region and are critical forseveral current and future applications, including those related to REDD+ andfire monitoring. It appears that the use of high resolution data, in particularRapidEye, is gaining traction in the region, in part because the need of moredetailed products (for example to map forest degradation) and also because theREDD-CCAD/GIZ Program provided all the Central America countries with awall to wall coverage year? Is notable the limited use of SAR data in a regioneven though there are zones (the Caribbean coasts of Honduras, Nicaragua,Costa Rica, and Panama) where cloud coverage makes the acquisition ofuseful optical data very difficult.
(b) With only one example of an application explicitly aimed to biodiversityissues, it appears to be necessary to promote a more active involvement of theconservation and protected area communities in the systematic use of EO data
10 V.H. Ramos and A.I. Flores

in the region. Several frameworks that propose specific ways in which EO canhelp biodiversity and conservation have emerged recently (Secades et al.2014; Rose et al. 2015; Skidmore et al. 2015) and they should be examined togive direction to regional and national efforts.
(c) REDD+ is an emerging driving factor in the development of EO applications.All or almost all the countries in Mesoamerica have joined the Forest CarbonPartnership Facility (FCPF) and the UN-REDD Program. That implies that, togo forward with REDD, there is an obligation to build robust and transparentnational forest monitoring systems that will, at least, produce baseline andconsistent frequent information related to land use, land-use change, forestbiomass, and forest degradation. That represents clear opportunities to developEO applications, that will need to persist in the long term, and that may haveadditional uses and benefit fields like ecosystem and biodiversity monitoring.
(d) The role of SERVIR and CATHALAC has been crucial in the advances in theregion and both deserve the credit for substantial progress in the transfer ofknowledge, the training of human resources in the region and the developmentof relevant applications. However, the dependence on projects with a limitedlife-span that, with a few exemptions, wrap up after the project has finishedand the funding has depleted is an issue that has to be addressed. If long-termapplications are necessary and desirable, a bigger share of the costs ofimplementation have to be absorbed by the local governments and other localstakeholders with a clear long-term vision. Public institutions involvement inthe selected examples is relatively high, but, they often act as cooperationrecipients, and that needs to transition to full adoption of applications,included the costs that may entail.
(e) Mexico is, clearly, the regional leader in terms of systematic use andhigh-level of sophistication of EO applications used in land-use monitoring,biodiversity, and ecosystems. The experience and capabilities of Mexicaninstitutions are already being used to transfer technology and knowledge to theother countries in the region trough the “South-South cooperation to exchangeexperiences and capacities on MRV systems and REDD+” project (http://mrv.cnf.gob.mx/index.php/en/) and also through the provision of EO-derived datato users in the region (Ressl et al. 2009).
2.2 Solid-Earth Hazards, Resources, and Dynamics
The unique location of Mesoamerica as an isthmus between North and SouthAmerica and in the Inter-tropical Convergence Zone positions this region as one themost biodiverse territories on Earth. On the other hand, this unique location alsomakes the region more prone to a range of natural hazards, such as volcaniceruptions, earthquakes, hurricanes, heavy rains, floods, landslides, droughts, andstorm surges, to mention some (REDLAC 2008). The high presence of hazards in
The Role of Earth Observation for Managing Biodiversity … 11

combination with socioeconomical and political issues creates high vulnerabilityconditions for the population. More than half of the population in Central Americaand the Caribbean are at risk from multiple hazards (Dilley 2005).
This region has a high mortality risk from geophysical (earthquakes and vol-canoes) and hydrological (floods, cyclone, and landslides) hazards (Dilley 2005). ElSalvador, Costa Rica, Guatemala, Dominican Republic, Nicaragua, and Hondurasrank among the top 15 countries at relatively high mortality risk from multiplehazards (Dilley 2005).
Further, according to the Climate Risk Index, the top ten countries more affectedby disasters between 1997 and 2006 were led by Honduras and Nicaragua at aglobal level (Harmeling 2007; REDLAC 2008).
According to the EM-DAT International Disaster Database (Guha-Sapir et al.2009) from 1960 to 2015 there have been 497 natural disasters in Mesoamerica andDominican Republic that include drought, earthquake, extreme temperature, flood,landslide, mass movement (dry), storms, volcanic activity, and wildfire. Twohundred of these disasters occurred between 2001 and 2015. This means that about40 % of the disasters reported in the past half century have occurred in the past15 years. The accuracy of these disaster estimations may very depending upon themethodology used to collect the data, but it shows a general trend of disasters on therise in Mesoamerica, which aligns with the global trend. Among the most frequentdisasters in Mesoamerica and Dominican Republic are floods and stormsaccounting for 34 and 27 %, respectively, of the total disasters reported between1960 and 2015 (Fig. 1). The third most frequent disaster in the region is earth-quakes. Accounting for 13 %. In the 2001–2015 period, the trend of disasteraffecting the region is the same.
The use of EO to provide actionable information in the case of disasters has beenwidely used in Mesoamerica and the Caribbean. There are several examples of the
Fig. 1 Types of naturaldisasters which affectedMesoamerica and DominicanRepublic from 1960 to 2015.Data source EM-DAT TheInternational DisasterDatabase (Guha-Sapir et al.2009)
12 V.H. Ramos and A.I. Flores

use of satellite remote sensing to assess the damages inflicted by disasters, tomonitor weather events, and to provide valuable information for early warning(REDLAC 2008). This section will focus on examples in which EO data have beenused primarily in post-disaster assessment, particularly for response and recoverypurposes.
An example of the use of EO in disaster response is the International CharterSpace and Major Disasters, (Charter for short). The Charter is “an internationalcollaboration among EO mission owners/operators to provide space-based data andinformation in support of relief efforts during emergencies caused by major dis-asters” (Gevorgyan and Briggs 2014).
The Charter only supports the phase of immediate response to a disaster(Courteille 2015; Gevorgyan and Briggs 2014). It was created in 1999, afterHurricane Mitch had struck Mesoamerica, at the Third United Nations Conferenceon the Exploration and Peaceful Use of Outer Space (UNISPACE) in Vienna,where the European Space Agency (ESA) and the French space agency (CNES)proposed to supply satellite imagery to emergency responders (Rocchio 2014).
Since its activation in 2000 the Charter has covered more than 400 disasters inover 110 countries worldwide (Courteille 2015). The charter is now composed of15 members from different space agencies and/or mission operators around theworld. From the U.S., the National Oceanographic and Atmospheric Administration(NOAA), with its fleet of meteorological satellites, and the U.S. Geological Surveyare authorized members of the Charter.
The Charter first provided satellite data to Mesoamerica in 2001 for an earthquakein El Salvador. Since then it has provided data for 27 different disasters coveringMesoamerica and the Hispaniola (Haiti and Dominican Republic). See Table 2.
The Charter has been activated mainly for hydrological-related disasters inMesoamerica (Fig. 2). Hurricanes, tropical storms, heavy rains, and the resultingflooding and landslides account for more than 70 % of the major disasters inMesoamerica and the Hispaniola that have triggered the Charter activation (Fig. 2).
Once the Charter has been activated, a project manager (PM) takes charge toquickly analyze the collected data and create value-added products for firstresponders (Rocchio 2014). Different types of satellite data are acquired through theCharter such as passive and active satellite remote sensing data, and from mediumto high spatial resolution.
The Water Center for the Humid Tropics of Latin America and the Caribbean(CATHALAC), in Panama, has acted as the project manager of 9 out of the 27Charter activations in Mesoamerica and Hispaniola. Refer to Table 2. CATHALACfirst hosted SERVIR in 2005. SERVIR links EO and geospatial technologies withdevelopmental decision-making in SERVIR regions. Proven success of SERVIR inMesoamerica has resulted in expansion to other regions. Currently SERVIR activelyworks in Eastern and Southern Africa, the Hindu Kush-Himalaya region, and theLower Mekong region. CATHALAC—in the context of SERVIR and acting as theMesoamerican hub- has served to connect the scientific, analytical, anddecision-making needs of its users in the region. In Mesoamerica, SERVIR providedrapid response support during disasters by acquiring expedited satellite images, and
The Role of Earth Observation for Managing Biodiversity … 13

Tab
le2
Internationalcharterspaceandmajor
disaster
activ
ations
forCentral
AmericaandHispaniola(200
0–Oct
2015
),organizedby
activ
ationdate
No.
Call
IDTyp
eof
disaster
Cou
ntry
Title
Date
charter
activ
ation
Charter
requ
estor
PMAdd
ition
alinform
ation
11
Earthqu
ake
SVEarthqu
akeand
Landslid
ein
El
Salvador
1/15
/01
French
CivilProtectio
nAgency
CNES
229
Cyclone
MX
Hurricane
inYucatan,
Mexico
10/5/02
NationalFo
restry
Agencyof
Mexico(CONAFO
R)viathe
French
Ministryof
theInterior
(COGIC)
ESA
Hurricane
Isidore
351
Floo
dand
land
slide
DO
Floo
ding
inthe
Dom
inican
Repub
lic
11/27/03
UNOOSA
UNOSA
T
464
Floo
dand
land
slide
HTand
DO
Floo
dsin
Haiti
andin
the
Dom
inican
Repub
lic
5/26
/04
UNOOSA
onbehalfof
UNOCHA
/Red
Cross
UNOSA
T
572
Cyclone
HT
Hurricane
inHaiti
9/21
/04
UnitedNations
Office
forOuter
SpaceAffairs
(UNOOSA
)CNES
Hurricane
Jeanne
610
6Cyclone
GTand
SVHurricane,
flood
s,land
slides
inCentral
America;
Volcanic
erup
tionin
El
Salvador
10/5/05
SIFE
M-A
rgentin
a;UN-O
CHA
Institu
toNacional
delAgu
aHurricane
Stan,Santa
Ana
volcano
erup
tion
(con
tinued)
14 V.H. Ramos and A.I. Flores

Tab
le2
(con
tinued)
No.
Call
IDTyp
eof
disaster
Cou
ntry
Title
Date
charter
activ
ation
Charter
requ
estor
PMAdd
ition
alinform
ation
717
3Cyclone
MX
Hurricane
inMexico
8/21
/07
USG
SCATHALAC
Hurricane
Dean
817
6Cyclone
NIand
HN
Hurricane
inNicaragua
9/4/07
SIFE
MCATHALAC
Hurricane
Felix
918
3Cyclone
DO
Floo
ding
and
hurricanein
the
Dom
inican
Repub
lic
10/30/07
Public
Safety
Canada
CATHALAC
Tropical
storm
Noel
1018
4Floo
dand
land
slide
MX
Floo
ding
inMexico
11/2/07
SIFE
MfortheNationalCenter
forDisasterPreventio
nof
Mexico
CATHALAC
1122
0Cyclone
HT
Hurricanesin
Haiti
8/30
/08
USG
Son
behalfof
Haiti
Office
ofU.S.
ForeignDisaster
Assistance;
CNES
Hurricane
Hanna,
Hurricane
Ike,
Hurricane
Gustav
1222
9Floo
dand
land
slide
HN
Floo
din
Hon
duras
10/27/08
UNITAR/UNOSA
Ton
behalf
ofUN
OCHA
ESA
1323
7Earthqu
ake
CR
Earthqu
akeand
land
slidein
Costa
Rica
1/9/09
SIFE
M(SistemaFederalde
Emergencias)
CONAE
Turrialba
Volcano
erup
tion
1427
8Cyclone
SVFloo
dandocean
storm
inEl
Salvador
11/10/09
UNITAR/UNOSA
Ton
behalf
ofUN
OCHA;
USG
Son
behalfof
Centrode
Gob
ierno,
ElSalvador
CATHALAC
Hurricane
Ida (con
tinued)
The Role of Earth Observation for Managing Biodiversity … 15

Tab
le2
(con
tinued)
No.
Call
IDTyp
eof
disaster
Cou
ntry
Title
Date
charter
activ
ation
Charter
requ
estor
PMAdd
ition
alinform
ation
1528
7Earthqu
ake
HT
Earthqu
akein
Haiti
1/13
/10
French
CivilProtectio
n,UNOOSA
onbehalfof
UN
Peacekeeping
Mission
inHaiti
(MIN
UST
AH),Pu
blic
Safety
ofCanada,
American
Earthqu
akeHazards
Prog
rammeof
USG
S
CNESin
collabo
ratio
nwith
theSA
FER
project
inthefram
eworkof
theGMESinitiative.
1631
2Cyclone
GT
Ocean
Storm
inGuatemala
5/30
/10
USG
Son
behalfof
CONRED
CATHALAC
Tropical
storm
Agatha
1732
9Cyclone
MX
Hurricane
Karl,
Mexico
9/22
/10
USG
Son
behalfof
Mexico
NationalCenterforDisaster
Protectio
n
USG
S
1834
2Cyclone
HT
Ocean
Storm
inHaiti
11/5/10
Public
Safety
Canada
CSA
Tropical
storm
Tom
as
1934
8Floo
dand
land
slide
PAFloo
din
Panama
12/9/10
USG
Son
behalfof
SINAPR
OC/Panam
aCATHALAC
2037
8Cyclone
Central
America,
SV
Floo
din
El
Salvador
10/19/11
UNITAR/UNOSA
Ton
behalf
ofUN
OCHA
UNITAR/UNOSA
Ton
behalfof
UN
OCHA
Tropical
depression
2139
6Volcanic
erup
tion
GT
Eruptionof
lava
from
Fuego
volcanoin
Guatemala
5/21
/12
SIFE
Mon
behalfof
SECONRED
CONAE
2241
8Cyclone
HT
Hurricane
Sand
yin
Haiti
10/29/12
UNITAR/UNOSA
Ton
behalf
ofUNOCHA
SERTIT
Hurricane
Sand
y(con
tinued)
16 V.H. Ramos and A.I. Flores

Tab
le2
(con
tinued)
No.
Call
IDTyp
eof
disaster
Cou
ntry
Title
Date
charter
activ
ation
Charter
requ
estor
PMAdd
ition
alinform
ation
2342
0Earthqu
ake
GT
Earthqu
ake
Guatemala
11/8/12
SIFE
Mon
behalfof
SE-CONRED
CONRED
2449
6Fire
DO
Fire
inLaVega,
Dom
inican
Repub
lic
7/30
/14
USG
Son
behalfof
Centrode
Operacion
esde
Emergenciasof
theDom
inican
Repub
lic(COE)
DLR
2550
1Floo
dand
land
slide
PAFloo
dand
land
slidein
the
Repub
licof
Panama
8/18
/14
USG
Son
behalfof
SINAPR
OC/Chiriqu
iProvince
/Mun
icipality
ofTierraAlta
CATHALAC
2652
5Volcanic
erup
tion
CR
Turrialba
Volcano
inCosta
Rica
3/14
/15
USG
SOFD
A-U
SGS
Volcano
Disaster
AssistanceProg
ram
2754
5Floo
dand
land
slide
GT
Landslid
ein
Guatemala
10/7/15
USG
Son
behalfof
National
EmergencyOperatio
nsCenter
ofGuatemala
CATHALAC
Source
compilatio
nof
data
from
:https://w
ww.disasterscharter.o
rg/Visitedon
Octob
er20
15.PM
=Projectmanagers
CallID
=Charter
ID#perdisaster.CONAE
Com
isionNacionalde
Actividades
Espacialesde
Argentin
a;CONRED
NationalCoo
rdinationforDisaster
Reductio
nof
Guatemala,
CSA
CanadianSp
aceAgency;
DLR
German
Aerospace
Center;OFDAOffice
ofUS.
ForeignDisasterAssistance;
SERTITService
Regionald
eTraitementd
’lmageetde
Teledetectio
n;SIFEM
Sistem
aFederald
eEmergencias;SINAPROCSistem
aNacionald
eProteccion
Civilde
Panama;
UNITAR
UnitedNations
Institu
teforTrainingandResearch;
UN
OCHA
UnitedNations
Office
fortheCoo
rdinationof
Hum
anitarian
Affairs;UNOSA
TOperatio
nalSatellite
App
lications
Prog
ramme
The Role of Earth Observation for Managing Biodiversity … 17

creating and sharing value-added products with end users (Flores et al. 2012). Whileit is no longer an active SERVIR hub, CATHALAC continues to meet the needs ofits network of users by applying space data to disaster response support.
Flores et al. (2012) describes the type of EO data and information used inSERVIR-Mesoamerica from 2004 to 2011 to create value added products providedfor monitoring, response, recovery and general disaster awareness.
Table 3 lists the EO-derived measurements and/or products used bySERVIR-Mesoamerica from 2004 to 2011 to generate added-value products for avariety of disasters.
Then, Table 4 lists the respective satellite sensors from which the derived EOmeasurement and/or product were generated, respectively.
Some Level 3 satellite-derived products such as land cover, and model productssuch as gridded population distribution were used to link the physical hazard(cyclone, heavy rain, flood, landslide, etc.) with the human or ecological factor atrisk (Flores et al. 2012).
The majority of the satellite sensors used by SERVIR-Mesoamerica to provideadded value products were from passive remote sensors that collect electromagneticenergy reflected or emitted by Earth’s surface. Using this type of sensors provesdifficult when estimating flooded areas during heavy rain and high cloud coverageconditions. Active remote sensors, such as C-band SAR and L-band SAR on boardof Radarsat 1 and 2 and ALOS, respectively, were used heavily in cases with highcloud coverage particularly to map flooded areas during disasters. Hyper spectralsatellite remote sensing was used primarily for water quality assessment duringcases of algal blooms and was also used for monitoring volcano activity.
Some of the satellite data used by SERVIR-Mesoamerica to address disasters wasacquired through the Charter, but not all. SERVIR-Mesoamerica also providedvalue-added products to smaller disaster events that did not trigger the Charteractivation.
Fig. 2 Charter Activationsby Disaster Type in CentralAmerica, South of Mexico,and Hispaniola from January2001 to October 2015. Sourcecompilation of data from:https://www.disasterscharter.org/, Visited on October2015. Note Cyclone disastersinclude hurricanes, tropicalstorms, and tropicaldepressions
18 V.H. Ramos and A.I. Flores

Tab
le3
EO-derived
measurementand/or
prod
uctused
bySE
RVIR-M
esoamericafrom
2004
to20
11to
analyzedifferenttype
ofdisasters
Source
Summarized
from
(Floreset
al.20
12)
The Role of Earth Observation for Managing Biodiversity … 19

Table 4 List of satellite sensors used to generate each derived measurement and/or product bySERVIR-Mesoamerica from 2004 to 2011
EO-derived measurement and/or product Sensor, satellite
Elevation data SRTMASTER, Terra
Rainfall Imager, GOES seriesMVIRI, Meteosat-7/5VISSR, GMSTMI, TRMMSSM/I, DMSP seriesAMSR-E, AquaAMSU-B, NOAA series
Multispectral VNIR reflectance/radiance AVHRR, POES seriesMODIS, Aqua/TerraASTER, TerraALI, EO-1Landsat seriesSPOTGeoEye-1IkonosQuickBirdWorldview-1 & 2Formosat-2
Hyperspectral VNIR reflectance/radiance Hyperion, EO-1
Fire and thermal anomalies MODIS, Aqua/Terra
Burned area MODIS, Aqua/Terra
Surface temperature Landsat Thermal Infrared (TIR)
Land cover, tree cover maps MODIS, Aqua/TerraMERIS, EnvisatLandsat seriesASTER, TerraSPOTL-Band SAR (PALSAR), ALOS
Relative Humidity AIRS and AMSU, Aqua
Synthetic Aperture Radar (SAR) images C-band SAR, Radarsat-1 & Radarsat-2C-band SAR, ERS-2L-Band SAR (PALSAR), ALOS
SRTM-water body SRTM
Gridded population distribution DMS series
Near real-time cloud movement Imager, GOES series
Source Summarized from (Flores et al. 2012)ASTER Advanced Spaceborne Thermal Emission and Reflection Radiometer, AVHRR AdvancedVery High Resolution Radiometer; GMS Geostationary Meteorological Satellite; GOESGeostationary Operational Environmental Satellite; MERIS Medium Resolution ImagingSpectrometer; MVRI Meteosat Visible Infra red Imager; TRMM Tropical Rainfall MeasuringMission; PALSAR Phased Array type L-band Synthetic Aperture Radar; POES Polar OperationalEnvironmental Satellite; SSM/I Special Sensor Microwave Imager; VISSR Visible/Infra SpinScan-Radiometer
20 V.H. Ramos and A.I. Flores

SERVIR started in Mesoamerica when Landsat data was still not freely available,however, through SERVIR the region started getting access to such datasets andused for environmental monitoring and disaster response. As SERVIR-Mesoamericastarted building up during its 5 years it also increased the generation of valued-addedproducts for disasters to attend user needs in the region.
Today disaster response agencies across the region are heavily using EO data toaddress disaster response. As example national disaster institutions in Mesoamericahave become more involved in the Charter process to obtain satellite data, such isthe case of SINAPROC in Panama, and CONRED in Guatemala. This last one haseven acted as a project manager of the Charter.
3 Future Prospects
3.1 Land-Use Change, Ecosystem Dynamics,and Biodiversity
Despite the challenges, the future looks promising for EO in Mesoamerica. Accessto free and open data is growing at a very fast pace. Beyond Landsat we can alreadyuse data of the Sentinel constellation that may solve problems related to cloudcoverage (Sentinel-1) and provide a new and valuable resource for middle reso-lution optical data (Sentinel-2). Already free, or being put to public access arehistorical data of SPOT and ALOS PALSAR providing an additional opportunity toadd more layers of EO data. Data continuity for middle resolution data appears tobe solved in the mid-term, with for example, plans to build, and launch Landsat 9underway.
We think that REDD+, fire and climate change monitoring are going to bepivotal for EO applications in the near future in Mesoamerica. REDD+ processeshave started in all the countries in the region, and a great part of the success of themechanism relies on the premise of being able to monitor forests continuously andwith a level of detail that will need to resolve at a highest resolution possibledeforestation and degradation of forests.
Fire, closely related to REDD+, because is a cause of forest degradation, is anincreasing problem in the region and also a phenomenon of interest that can bemonitored using EO. We will need to be able to go from just monitoring fire, toactually helping to modify significantly its management with early alert systemstied to regulations on the use of fire as an agricultural tool, for example.
REDD+ and fire applications have the potential to be designed in such a way,that products and outputs can be used in other fields, including biodiversity,ecosystem monitoring, climate change, water management, and agriculture.Because of that, communication and collaboration between remote sensing scien-tists, conservation practitioners and natural resource managers is fundamental.
The Role of Earth Observation for Managing Biodiversity … 21

3.2 Solid-Earth Hazards, Resources, and Dynamics
The current disaster trend indicates that disasters are increasing at the local andglobal scale (Guha-Sapir et al. 2009).1 This is particularly dangerous for regionslike Mesoamerica that have a high mortality risk from geophysical and hydrologicalhazards (Dilley 2005). The use of EO data has proven useful for disaster responseand recovery and given the increasing positive trend of events it is expected that therole of EO in disaster management will intensify in years to come.
The current availability of new satellite data such as the Visible Infrared ImagingRadiometer Suite VIIRS on board of Suomi National Polar-orbiting Partnership(NPP), and Landsat 8 will allow continuity of products already used inMesoamerica for disaster monitoring and response, such as the case of MODISproducts used for fire monitoring, burned areas, and land cover to mention some. Inaddition, new missions such as the Soil Moisture Active Passive (SMAP) willgenerate new understanding of weather and climate patterns.
A pressing need of the technical community using satellite data for disasterassessment, particularly for response and recovery is the access to radar data to mapfloods under high cloud cover. The majority of the disasters in this region arerelated to hydrological hazards Figs. 1 and 2, which trigger other set of hazardousevents, such as floods and landslides.
The new C-band SAR sensor, Sentinel 1 from the new European EOProgramme, Copernicus, will be instrumental in providing information during highcloud coverage. The advantage of Sentinel 1 when compared to other radar data isthat is freely available. This will open its use and application not only fordisaster-related analyses but also for other applications.
NASA and Indian Space Research Organization (ISRO) SAR Mission (NISAR)also promises to become a source of valuable data for disaster risk managementwith the potential ability to measure deformation before and after geophysicalhazard events.
4 Conclusion and Way Forward
There is no doubt about the fact that EO holds an immense potential in applicationsrelated to land use, ecosystems, biodiversity, and disaster risk management. Wethink that is also true that this potential has not been fully used in Mesoamerica (andelsewhere in the tropics). There are several challenges to improve on that:
1Disaster trends. Interactive graphs that show various trends and relationships within the EM-DATdata. EM-DAT: The OFDA/CRED International Disaster Database—http://www.emdat.be/disaster_trends/index.html.
22 V.H. Ramos and A.I. Flores

(a) Governments in the region that, in most cases, are the potential users with thepower to modify policies and effectively generate change, invest very little inagencies in charge of natural resources, ecosystems, and biodiversity man-agement. Therefore, these agencies often lack the resources to maintaintechnical units in charge of applications of EO.
(b) EO data is often presented in formats that are not legible enough for theaudiences that can influence and make decisions, including the general public.The message that EO delivers has to be clear and understandable to all.
(c) There is often a disconnection between user needs and products. We have toexamine carefully if the processes we use to choose what to do is backed byenough feedback from the people and entities that will actually use EOproducts to make decisions.
(d) It is critical to understand that one of the main values of EO data relies onsystematic, long-term observations that actually lead to information onchanges and trends. Applications that emphasize research and demonstrationobviously are critical for the development of EO, but the ones that can be usedoperationally and with a clear, practical purpose are those that function andprovide societal benefits over a long time.
(e) We have to aim, when possible, at the use of EO application products tosupport compliance, regulations, and law enforcement. Doing that will rep-resent a technical and perhaps legal challenge, but it would be a significantcontribution to governance and environmental justice.
(f) At regional and local scale the use of EO data should be appropriately inte-grated into the operational processes of disaster risk management agencies tosupport all the phases of disaster risk management. The generation ofgeospatial-baseline information primarily in urban areas is critical to properlyassess pre and post-event damage needed for immediate response andrecovery. Such baseline information becomes more critical in this region thatis undergoing population growth and is prone to natural hazards includingearthquakes.
References
Agresta, DIMAP, Universidad de Costa Rica, and Universidad Politécnica de Madrid (2015).Índice de cobertura como base para la estimación de la degradación y aumento de existenciasde carbono, Agresta, Dimap, Universidad de Costa Rica, Universidad Politécnica de Madrid,Costa Rica.
Anderson, E., Cherrington, E., Flores, A., Pérez, J., Carrillo, R., & Sempris, E. (2008). Potentialimpacts of climate change on biodiversity in Central America, Mexico, Dominican Republic.Panamá: Centro del Agua del Trópico Húmedo para América Latina y el Caribe(CATHALAC).
Asner, G. P., et al. (2013). High-fidelity national carbon mapping for resource management andREDD+. Carbon Balance and Management, 8(1), 7. doi:10.1186/1750-0680-8-7.
The Role of Earth Observation for Managing Biodiversity … 23

BIOMARCC, SINAC, & GIZ (2012). Clasificación sistemas marino costeros costa Pacífica deCosta Rica. Costa Rica: BIOMARCC, SINAC, GIZ
Blackman, A. (2013). Evaluating forest conservation policies in developing countries using remotesensing data: An introduction and practical guide. Forest Policy and Economics, 34, 1–16.doi:10.1016/j.forpol.2013.04.006.
Blackman, A., Pfaff, A., & Robalino, J. (2015). Paper park performance: Mexico’s naturalprotected areas in the 1990s. Global Environmental Change, 31, 50–61. doi:10.1016/j.gloenvcha.2014.12.004.
Cartus, O., Kellndorfer, J., Walker, W., Franco, C., Bishop, J., Santos, L., & Fuentes, J. (2014).A national detailed map of forest aboveground carbon stocks in Mexico. Remote Sensing, 6(6),5559–5588. doi:10.3390/rs6065559.
CELADE. (2004). America Latina y el Caribe: Estimaciones y proyecciones de población 1950–2050. Chile: CEPAL.
CELADE (2014). Estimaciones y proyecciones de población a largo plazo 1950–2100Center for the Support of Native Lands, and National Geographic (2002). Indigenous peoples and
natural ecosystems in Central America and Southern Mexico.Cerdeira-Estrada, S., & López-Saldaña, G. (2011). Nuevo Sistema Satelital de Monitoreo
Oceánico para México. Ciencias marinas, 37(2), 237–247.Cherrington, E., Ek, E., Cho, P., Howell, B., Hernández, B., Anderson, E., Flores, A., García, B.,
Sempris, E., & Irwin D. (2010). Forest cover and deforestation in Belize: 1980–2010. Panamá:Centro del Agua del Trópico Húmedo para América Latina y el Caribe (CATHALAC)
Cherrington, E., Hernández, B., García, B., Oyuela, M. & Clemente, A. (2011). Changes in landcover and deforestation in Central America 1990–2008. Panamá: Centro del Agua del TrópicoHúmedo para América Latina y el Caribe (CATHALAC).
CONAP, INAB, CONRED, & MARN (n.d.). Sistema de Información Geoespacial para Manejode Incendios en la República de Guatemala (SIGMA-I). Guatemala: CONAP, INAB,CONRED, MARN.
CONAPO (2014). Dinámica demográfica 1990–2010 y proyecciones de población 2010–2030Courteille, J. -C. (2015). International Charter “Space and Major Disasters” space-based
information in support of relief efforts after major disastersDilley, M. (2005). Natural disaster hotspots: A global risk analysis, disaster risk management
(series no. 5). Washington, DC: World Bank.Flasse, S., Ceccato, P. (1996). A contextual algorithm for AVHRR fire detection. International
Journal of Remote Sensing, 17(2), 419–424.Flores, A., Anderson, E., Irwin, D., & Cherrington, E. (2012). Contributions of servir in promoting
the use of space data in climate change and disaster management. Naples, Italy: InternationalAstronautical Federation.
Gebhardt, S., et al. (2014). MAD-MEX: Automatic wall-to-wall land cover monitoring for theMexican REDD-MRV program using all landsat data. Remote Sensing, 6(5), 3923–3943.doi:10.3390/rs6053923.
Gevorgyan, Y., & Briggs S. (2014). International charter “Space and major disasters”.Giglio, L., Descloitres, J., Justice, C. O., & Kaufman, Y. J. (2003). An enhanced contextual fire
detection algorithm for MODIS. Remote Sensing of Environment, 87(2–3), 273–282. doi:10.1016/S0034-4257(03)00184-6.
Graves, S., Yubin He M., & Hardin D. (2007). SERVIR at the age of four: The development of anenvironmental monitoring and visualization system for Mesoamerica. University of MarylandUniversity College.
Grupo Regional Interagencial de Riesgo, Emergencia y Desastres de America Latina y el Caribe(REDLAC) (2008). Diez años después del huracán Mitch: panorama de la tendencia de lagestión del riesgo de desastre en Centroamérica.
Guha-Sapir, D., Below, R. & Hoyois, P. (2009). EM-DAT:International disaster database—www.emdat.be, http://www.emdat.be/advanced_search/index.html (Retrived from 2 November2015)
24 V.H. Ramos and A.I. Flores

Hansen, M. C., et al. (2013). High-resolution global maps of 21st-century forest cover change.Science, 342(6160), 850–853. doi:10.1126/science.1244693.
Harmeling, S. (2007). Global climate risk index 2008. Bonn, Berlin: Germanwatch.INAB, CONAP, UVG, & URL (2012). Mapa de Cobertura Forestal de Guatemala 2010 y
Dinámica de la Cobertura Forestal 2005–2010. Guatemala: INAB, CONAP, UVG, URL.Jimenez, A. (2013). Metodología para el mapeo de tipos de bosques en el contexto de la
cuantificación de la biomasa y el carbono forestal.Mejía, S., Valerio, L., & Coronado, C. (2004). Aplication of low resolution satellite data for the
detection and monitoring of fire in Nicaragua (pp. 413–417). Istanbul, Turkey: ISPRS.Myers, N., Mittermeier, R. A., Mittermeier, C. G., da Fonseca, G. A. B., & Kent, J. (2000).
Biodiversity hotspots for conservation priorities. Nature, 403(6772), 853–858. doi:10.1038/35002501.
Pierce, S. (2015). Unaccompanied Child Migrants in U.S. Communities, Immigration Court andSchools. Washington, DC: Migration Policy Institute.
Ressl, R., Lopez, G., Cruz, I., Colditz, R. R., Schmidt, M., Ressl, S., & Jiménez, R. (2009).Operational active fire mapping and burnt area identification applicable to Mexican NatureProtection Areas using MODIS and NOAA-AVHRR direct readout data. Remote Sensing ofEnvironment, 113(6), 1113–1126. doi:10.1016/j.rse.2008.10.016.
Rival, A., & Levang, P. (2015). The oil palm (Elaeis guineensis): Research challenges beyondcontroversies. Palms, 59(1), 33–49.
Rivera, S., Lowry, J. L., Sánchez, A. J. H., Ramsey, R. D., Lezama, R., & Velázquez, M. (2011).A MODIS generated land cover mapping of Honduras: a base-line layout to create a nationalmonitoring center. Revista de teledetección: Revista de la Asociación Española deTeledetección, 35, 94–108.
Rocchio, L. E. P. (2014). Mapping disaster: A global community helps from space landsat scienceRodríguez, M., et al. (2013). Manglares de México: extensión, distribución y monitoreo. México:
CONABIO.Rose, R. A., et al. (2015). Ten ways remote sensing can contribute to conservation: Conservation
remote sensing questions. Conservation Biology, 29(2), 350–359. doi:10.1111/cobi.12397.Secades, C., O´Connor, B., Brown, C., & Walpole M. (2014). Earth observation for biodiversity
monitoring: A review of current approaches and future opportunities for tracking progresstowards the Aichi Biodiversity Targets. Montréal, Canada: Technical Series, Secretariat of theConvention on Biological Diversity.
Skidmore, A. K., et al. (2015). Environmental science: Agree on biodiversity metrics to track fromspace. Nature, 523(7561), 403–405. doi:10.1038/523403a.
Turner, W., et al. (2015). Free and open-access satellite data are key to biodiversity conservation.Biological Conservation, 182, 173–176. doi:10.1016/j.biocon.2014.11.048.
UNEP-WCMC (2014). World database on protected areas (WDPA).UNODC. (2013). Global study on homicide. Vienna, Austria: UNODC.VAVILOV, N. I., & FREIER, F. (1951). Studies on the origin of cultivated plants.Vreugdenhil, D., Meerman, J., Meyrat, A., Gomez, L. D., & Graham, D. (2002). Map of the
ecosystems of Central America : Main report. Washington, DC.: World Bank.Wang, J., Christopher, S. A., Nair, U. S., Reid, J. S., Prins, E. M., Szykman, J., & Hand, J. L.
(2006). Mesoscale modeling of Central American smoke transport to the United States: 1.“Top-down” assessment of emission strength and diurnal variation impacts. Journal ofGeophysical Research, 111(D5). doi:10.1029/2005JD006416.
World Bank. (2013). Shifting gears to accelerate shared prosperity in Latin America and theCaribbean. Washington, DC: World Bank.
The Role of Earth Observation for Managing Biodiversity … 25
Reform Earth Observation Scienceand Applications to Transform HinduKush Himalayan Livelihoods—Services-Based Vision 2030
M.S.R. Murthy, Deo Raj Gurung, Faisal Mueen Qamer,Sagar Bajracharya, Hammad Gilani, Kabir Uddin, Mir Matin,Birendra Bajracharya, Eric Anderson and Ashutosh Limaye
Abstract The Hindu Kush Himalayas (HKH) region with 210 million peopleliving in the region poses significant scientific and technological challenges forlivelihood improvement due to subsistence economy, livelihood insecurity, pov-erty, and climate change. The inaccessibility and complex mountain environmentalsettings carved special niche for Earth Observation (EO) science and significantcontributions were made in the food security and disaster risk reduction sectors. Thedifferentiated capacities of users to develop and use EO capabilities, challenges inoutreaching the EO products to last mile users call for innovative ways of pack-aging EO products into actionable knowledge and services. This calls for greatdegree of reformation on EO community to tailor-made region specific EO sensorsand models, mechanisms of synergizing EO knowledge with local traditionalsystems in addressing multiscale, and integrated end-to-end solutions. The paperaddresses prospects and challenges of 2015–2030 to achieve success in threecritical livelihood support themes viz food security, floods, and forest-based carbonmitigation. Different improvements in EO sensor and models to extend less than aday, all-weather imaging, improved hydro-meteorological forecasts, vegetationstress, and community carbon monitoring models are identified as priority areas ofimprovement. We envisage and propose mechanisms on how these EO advancescould amalgamate into Essential HKH Variables (EHVs) on the lines of globalEssential Climate Variables (ECVs) to provide turnkey-based actionable knowledge
M.S.R. Murthy (&) � D.R. Gurung � F.M. Qamer � S. Bajracharya � H. Gilani � K. Uddin �M. Matin � B. BajracharyaInternational Center for Integrated Mountain Development, Kathmandu, Nepale-mail: [email protected]
E. Anderson � A. LimayeEarth Science Office, NASA Marshall Space Flight Center, Huntsville, AL 35808, USA
E. AndersonEarth System Science Center, University of Alabama in Huntsville, Huntsville, AL 35899,USA
© Springer International Publishing Switzerland 2016F. Hossain (ed.), Earth Science Satellite Applications,Springer Remote Sensing/Photogrammetry, DOI 10.1007/978-3-319-33438-7_2
27

and services through global and regional cooperation. The complex web of usersand orienting them toward adoption of EO services through multi-tier awareness,expertise development, policy advocacy, and institutionalization is also discussed.The paper concludes that the EO community needs to reform significantly inblending their science and applications with user-driven, need-based domains toprovide better societal services and HKH livelihood transformation.
1 Introduction
The Hindu Kush Himalayan (HKH) region extends 3,500 km over all or part ofeight countries from Afghanistan in the west to Myanmar in the east (Fig. 1). It isthe source of 10 large Asian river systems and provides water, ecosystem services,and the basis for livelihoods to a population of around 210.53 million people in theregion. The basins of these rivers provide water to 1.3 billion people, a fifth of theworld’s population. The human poverty, livelihood insecurity, food insecurity,gender, and social inequity continue to be the major detriments of livelihood qualityacross the region. The subsistence livelihood practices, globalization, liberalization,climate change, and vulnerability to disasters compounded with fragility,marginality, and inaccessibility are conceived as the critical factors regulating HKHregion. Due to the very nature of mountain specificity, climate change is reported tolargely govern the developmental trends of transitions from subsistence systems tocommercial systems, increasing efficiency and productivity, high-value,niche-based and nonfarm products, and increased mobility–migration and remit-tances (Rasul 2014).
Fig. 1 The Hindu Kush Himalayan (HKH) region
28 M.S.R. Murthy et al.

The mean annual increase in temperatures by 2–3 °C are reported to have greaterimpacts on people and ecosystems of the HKH region (Anderson and Bows 2008;Hansen et al. 2013; Solomon et al. 2009). The high-resolution cryospheric–hy-drological model projections have estimated increase in runoff levels due toincreased precipitation in the upper Ganges, Brahmaputra, Salween, and Mekongbasins, and from accelerated melt in the upper Indus (Lutz et al. 2014). The glaciersin the Himalaya are reported to be retreating faster than those in the Hindu Kushand Karakorum, with losses over 30 years of 5–55 % of area (Bajracharya et al.2015). The impact of rising temperatures and loss of ice and snow in the region areaffecting, for example, water availability (amounts, seasonality).
The ecosystem boundary shifts (tree line movements, high-elevation ecosystemchanges), altered carbon fluxes, biodiversity change (endemic species loss, changesin predator–prey relations), and global feedbacks (monsoonal shifts, loss of soilcarbon) are a few critical ecosystem impacts reported over HKH region due toclimate change (Bates et al. 2008; Burkett et al. 2005; Holtmeier and Broll 2005;Parmesan 2006; Wang et al. 2000). The changes in rangeland calendars, rangelanddegradation, and productivity losses across the entire HKH region due to unsus-tainable grazing practices and climate change are reported. The fragile mountainagriculture practices coupled with climate change impacts in terms of recurringdroughts and floods have made mountain agriculture systems highly vulnerable tochange and unsustainable production (Abbas et al. 2014; Sigdel and Ikeda 2010).The disaster frequency and associated societal and economic impact has increasedby several folds (Etkin 1999; Kim and Marcouiller 2015).
While scientific data and information on the Himalayas are crucial to understandongoing climatic and socioeconomic change processes in order to support policyplanning and informed decision-making, the Himalayan region has a major data gapdue to highly inaccessible terrain, inadequacy of resources and technologies, harshclimatic conditions, and lack of investments in long-term scientific research. EarthObservation (EO)-derived information bears special significance in the mountainareas, as it helps to access remote regions and to gain insights of regional scenarios,especially the climatic and broader environmental changes. The EO products todayserve as major inputs to policy, planning and targeted interventions, contributing tobuilding social capitals, natural resources assets, and environmental gains on thelong-term basis (Jayaraman 2009).
The geospatial services help through cost and time savings, new/improvedservices, value of information, and extending strategic edge for planning. The inseason crop production forecasts, disaster emergency and risk reduction, improvednatural resources planning and nature conservation, building physical and socialinfrastructure, and natural resources assets are a few demonstrated examples, wheregeospatial systems contributed to effective economy and livelihood improvements.Sankar (2002) estimated that the value of Indian remote sensing products by pro-viding value-added information and optimizing costs of conventional field surveysis around USD 427M. EO systems have contributed to disaster emergency planningand risk reduction processes, leading to avoided loss of life and property (Milleret al. 2011; Blaikie et al. 2014; Brown and Woolridge 2015).
Reform Earth Observation Science and Applications … 29

Across the HKH region, there are good number of success stories in takingadvantage of the science and observations afforded by satellites to make societalimpacts and benefits (Gupta et al. 2015; Pilon and Asefa 2011). There are differ-entiated capacities among the HKH regional member countries with regard to theutilization of EO and geospatial technologies. The combined observational powerof the multiple Earth observing satellites is currently not being harnessed holisti-cally to produce more durable societal benefits. A fundamental challenge for thecoming decade is to ensure that established societal needs help and guide scientificpriorities more effectively, and that emerging scientific knowledge is activelyapplied to obtain societal benefits. New observations, analyses, better interpretiveunderstanding, enhanced predictive models, broadened community participation,and improved means for information dissemination are all needed. Achieving thesebenefits further requires the observation and science program to be closely linked todecision support structures that translate knowledge into practical informationmatched to and cognizant of society’s needs.
It is in this context, the present chapter reviews the current scenario anddevelopments made during 2010–2015, and discusses prospects and challengesduring 2015–2030 in evolving toward user-oriented EO applications for improvingHKH livelihoods. Our analysis and suggestions are focused to address fouressential elements: (1) new advances required in EO sensors to address increasingneeds and challenges of natural resources and disaster sectors; (2) customizationand new package of EO systems required to understand geophysical and bio-physical complexities of mountain systems; (3) research and value-added systemsto be improvised to move toward a service provision mode addressing societalbenefits; and (4) gaps, challenges, and practices to be addressed for the betterintegration of stakeholder communities to achieve meaningful utilization of ser-vices. The data and information from the published literature, proceedings ofstakeholder consultation meetings, current availability of datasets and infrastruc-ture, and scenario of capacity building in the region formed the basis for our study.We present our analysis in three sections: (1) current scenario assessment,(2) prospects and challenges for the period 2015–2030 and (3) conclusions andrecommendations. The study focused on three major livelihood critical areas vizfood security, forest-based carbon mitigation and floods.
2 Current Scenario Assessment (2010–2015)
The current scenario assessment has drawn the findings and recommendations ofneeds and status assessment studies from SERVIR-Himalaya program. SERVIR (anacronym meaning “to serve” in Spanish) was initiated during 2005 as a jointventure between NASA and the U.S. Agency for International Development(USAID), to provide satellite-based EO data and science applications to helpdeveloping nations in Central America, Eastern and Southern Africa (in 2008), andthe Hindu Kush Himalayas (in 2010) to improve their environmental
30 M.S.R. Murthy et al.

decision-making. The requirements of the local and national institutions and diverseend users have been conceived as the basis for developing geospatial scienceapplications. The key regional issues, national priorities, and capacities of theinstitutions of the regional member countries were assessed before initiating thedesign and development of information products and services within theSERVIR-Himalaya framework. A literature review was also carried out to analyzethe existing documents, workshops, and study reports dealing with the issues of theHKH and the use of geospatial technologies to understand the past and ongoinginitiatives, and identification of suitable institutions and people to participate in theneeds and capacity assessment process.
For a more comprehensive need assessment and identification of priorityapplications, country-level stakeholder workshops were held consisting of focusedgroup discussions and questionnaire under the themes of cryosphere, ecosystemsand biodiversity, disaster risk reduction, and transboundary air pollution. Anassessment of decision support tools and geospatial portals were also done in viewof potential SERVIR products development. For each of these themes,SERVIR-Himalaya program assessed of major issues, identified and engaged keystakeholders in the countries, maintained awareness of ongoing initiatives, andsynthesized gaps and opportunities. Further, a regional inception workshop wasorganized for more focused discussion on regional-level needs of SERVIR-Himalaya consisting of experts and professionals from all the eight countries of theHKH including the representatives from USAID and NASA.
The generic framework on current scenario assessment and user integration inapplication development was done in two phases: (1) product design, testing, anddevelopment (2) operational product delivery systems. The Phase-1 has essentiallyguided the strategic application development based on user diversity, needs, currentground support systems, technology potential facilitating the product design, test-ing, and development. The second phase addressed the ground operational segment,user diversity, and application use. Accordingly three critical application areas viz,Geo-societal applications using EO data for food security and disasters, assessmentand monitoring support for climate change mitigation and adaptations, enablingsystems/platforms for multithematic data and products organization, analysis, anddissemination.
Based on the information and knowledge gained through needs and capacityassessment studies undertaken as mentioned above, a table consisting of qualitativescoring against different parameters for six geospatial application products over thethree thematic areas is developed (Table 1). The assessment included seven majorvariables with 22 subvariables addressing information needs, development, anduptake. The land cover change assessment monitoring and forest biomass quan-tification are the two applications considered as part of forest-based climate changemitigation programs of Ministries of Forests and Soil Conservation. The crop sownarea and condition assessment are the two application considered to support NepalFood Security program of Ministry of Agriculture Development. The multiscaledisaster risk assessment and flood risk decision support system to strengthen floodrisk reduction systems operated by Ministry of Home Affairs, Nepal. In this article,
Reform Earth Observation Science and Applications … 31

Table 1 Needs and Status of Geospatial Applications over HKH Region-2010 (Based onStakeholder discussions held as part of NASA-SERVIR-Himalaya program during 2010)(3 = High, 2 = Medium, 1 = Low)
Forest carbon mitigation Season crop monitoring Flood DRRCovermonitoring
Periodiccarbonassessment
Areaassessment
Conditionassessment
Riskreduction
Earlywarning
1. Needs/applicationDirect/basic 3 3 3 3Complimentary 3 3Periodicity 3 3 3 3 2 3Long-term need 3 3 3 3 3 32. Databases/tools/systems availableHistorical/currentdatabases
1 2 1 1 1 1
Standardprocedure/methodsfollowed
2 1 1 1 1 1
Operationalsystems
2 2 1 1 1 1
3. AwarenessStrategic level 2 1 2 2 1 1Operational level 2 2 3 3 3 24. Expertise availableNational 2 2 1 1 1 1Local 1 1 1 1 1 15. Ground operational systemsInfrastructure 3 2 1 1 2 1Dedicated expertise 2 2 1 1 1 1Information uptakesystems
2 1 2 2 2 2
Recurringbudgetary support
NIL NIL NIL NIL NIL NIL
Inter institutionalsystems
1 1 3 3 3 3
6. Technology operational systemsOpen accesssatellite datacontinuity
3 3 3 3 2 2
Open accesssoftware
1 1 2 2 3 2
Reliableoperationalmethods
2 1 3 3 2 1
Open accessdissemination tools
3 3 3 3 3 2
7. Information useGovernment 2 2 1 1 1 1NonGovernment 1 1 1 1 1 1
32 M.S.R. Murthy et al.

we focus on the experiences and challenges regarding geospatial data and infor-mation availability, user capacities on product development and use. A very limiteddiscussion on scientific methods and accuracies followed during product develop-ment will be mentioned, whereas such details can be obtained from supportingreferences.
3 Agriculture and Food Security
Agriculture is the most important livelihood sector in the HKH region and providesa substantial proportion of rural income and employment opportunities to its esti-mated 210 million inhabitants. Typically, the very nature of subsistence-orientedfarming is structured around a traditional weather calendar based on undisturbedclimate (Vedwan and Rhoades 2001). The dramatic climatic and environmentalchanges that are taking place in the Himalaya are reported to have profound impacton the conditions for food production. Alongside socioeconomic changes includingeconomic globalization, increasing accessibility, and land use conflicts, dynamicdemography is affecting the subsistence agriculture systems across HKH region.Geographical constraints often restrict the flow of goods to and from isolated areas;landslides, mud falls, and soil degradation not only adversely affect crop yields andfarming practices but also restrict transport and the advantages it brings.
Food security is a significant challenge in the HKH region, where the harshbiophysical conditions and short growing seasons constrain agricultural produc-tivity and can create food deficits (Kurvits et al. 2014). As a so-called climatechange hotspot, climate change, and extreme weather events like floods anddroughts are projected to impact food security in mountain regions like the HKHparticularly hard (Murthy et al. 2014). Recent vulnerability assessments show thatover 40 % of households in the mountainous region of the HKH are facingdecreasing yields in their five most important crops as a result of floods, droughts,frost, hail, and disease (Bhandari et al. 2015).
A few of the basic challenges addressing food security in the region lies on howto improve the underlying productivity of natural resources and cropping systems tomeet increasing farmers demand and to produce food which is safe, wholesome andnutritious and promotes human well-being. Case studies on agricultural transfor-mation of mountain areas show how farming of High-Value Crops (HVC) hasincreased food security and employment, thus improving living conditions formountain people (Badhani 1998; Partap 1999; Sharma and Sharma 1997; Tulachan2001). The development of multifunctional agriculture systems, sustainable man-agement of mountain agriculture practices such as terrace agriculture, shiftingcultivation, developing narrow climate, and geographic niche-based local croppingsystems, evolving resilient productive systems against climate disasters, improvingwater efficient and high crop intensity regimes in low elevations are a few priorityareas which require scientific support and policy-level interventions on a continual
Reform Earth Observation Science and Applications … 33

basis. On the other hand, the development of effective communication systems andimproved accessibility are also identified as potential windows through whichuseful and timely information and material would reach the farmers to face bothenvironmental and social challenges.
Recent developments in use of Earth observation satellite data in combinationwith ground-based information, can reveal valuable information about environ-mental conditions that can subsequently impact the livelihoods of farmers.A Geographic Information System (GIS) and remote sensing technologies arehelpful to identify regions experiencing unfavorable crop growing conditions andfood supply shortfalls and to determine food insecure areas and/or populations(Minamiguchi 2004). Similarly, increase in use of Information CommunicationsTechnologies (ICTs) in facilitating rural development by providing agriculturalextension services and real-time market price information, availability of ruralpayphone can play a significant role in enhancing the ability of rural families tocontinue, and perhaps enhance their contribution to national agricultural productionand postharvest activities (Anderson and Bows 2008). These scientific and tech-nological interventions involve in-depth operational research and application with afocus to leap forward into useful ground applications. In this context, an under-standing of the current capacities on technological and user operational segmentsand the future scenario and needs over the decade in adoption of EO-basedactionable information would stand as most supporting information.
3.1 Current Scenario Assessment
In the current national food security assessment system across the region, theDistrict Agricultural Development Offices are responsible for the collection of cropsituation data from field for national- and subnational-level analysis. Thesewell-placed traditional systems need to be strengthened for better decision-makingusing substantial capacity developed for crop condition monitoring and productionestimation using EO systems. Globally, satellite remote sensing has become anintegral component of operational agricultural monitoring systems, enabling cropanalysts to track development of growing season, and provide actionable infor-mation to decision-makers for developing effective agricultural policies and timelyresponse to food shortfalls (Wu et al. 2014; Zhang et al. 2010). Yet, the lack ofsynergistic use of space and ground-based systems in the HKH region is limitingthe potential of spatially explicit decision-making processes and translating theknowledge as crop advisory systems. The integration of satellite-based climate andsoil moisture information with crop growth models is urgently need to allow for andimprove assessments of drought scenarios and crop yield estimations and forecasts.
Across the HKH region, differentiated capacities and operational systems prevail,requiring different levels of technological intervention (Table 1). For example, thesignificant efforts are being made through FEWSNET program in Afghanistan and inPakistan, The Pakistan Space and Upper Atmosphere Research Commission
34 M.S.R. Murthy et al.

(SUPARCO) in collaboration with provincial agriculture departments of Sindh andPunjab in Pakistan, has recently established satellite-based crop monitoring system,where high-resolution optical data acquired during peak growth seasons of Februaryfor rabi crops and September for kharif crops to assess seasonal yield forecast formajor crops. However in Nepal, Bangladesh, and Myanmar, the adoption of remotesensing data is at very preliminary level. While there is a general agreement onsignificant need on such information, there are no dedicated institutional setup andexpertise available. Practitioners in operational positions tend to possess moderateexperience in remote sensing technology, but such awareness at higher strategic levelsis very limited. On the other end of the spectrum, targeted end users of remote sensingproducts have very low technical expertise in interpreting technically complex prod-ucts. This stresses the need for developing more customized and actionableinformation.
The recent efforts of NASA/SERVIR-Himalaya in developing national crop anddrought monitoring systems over Nepal using satellite-based information and theirintegration with quarterly food security bulletins of Ministry of Agriculture andDevelopment and World Food Program reveal possible leads could be achievedthrough effective user involvement. However, formidable challenges remain for theEO community in downscaling the national-level near-real-time crop monitoringsystems into farm/site-level advisory systems, designing systems to effectivelyinform evolving operational crop insurance mechanisms, and improvingAgro-Pastoral, Silvi-Agro-Pastoral flows and linkages to enhance livelihoods overhigh-altitude Himalayas.
3.2 Prospects and Challenges
The small farmer holdings, mixed crop conditions, persistent cloud cover, rain fedsystems experiencing temperature stress, diseases, and land degradation are a few ofthe key elements within food security domain, where EO and improved sensorsneed to play vital role. The frontier technologies and modeling frameworks shouldhelp to integrate local knowledge with scientific data and technical skills to improveknowledge on mountain-specific traditional production systems, as well as localcropping systems within narrow climate and geographic niches. Given that uniqueclimate and geographic niches often occur across boundaries, frameworks forregional and transboundary collaboration are important. Such frameworks wouldpromote international benefit of technology interventions that would otherwise notbe realized if only national perspectives are considered.
3.2.1 Crop Identification and Monitoring
A summary of the availability and continuity for remote sensing data products forthe effective agriculture monitoring in the HKH region is give in Table 2.
Reform Earth Observation Science and Applications … 35

Table 2 Needs and challenges of geospatial application—agriculture development in HKHregion
Thrustareas/croptypes
Current systems (2010–2015)
Technologycontinuity/new systems(2015–2030)
Ground segments (2015–2030)
Majorcereal crops
• Medium resolutionOptical + SWIR(MODIS 250 m, MERIS300 m)
• Continuity of similarsystem SAR(Sentinel-1A, 1B)
• Improving accuracy ofsubnational agriculturestatistics
High-altitudelocal crops
• Medium tohigh-resolutionOptical + SWIR andHyperspectral data(Landsat 30 m, CBERS,Hyperion)
• No such data available
• High-resolutionOptical + SWIR(Sentinel-2)
• High-resolutionmultispectral data
• Introducing basicGIS/Mobile apps toagriculture extensionstaff
• Significant technologyeffort to be made onmethodologystandardization todevelopmicrowave-based croparea estimates
Crop sownarea
• Medium resolutionOptical + SWIR(MODIS 250 m, MERIS300 m)
• In season sown areaassessment generated
• Time lag in generation,reliability of estimatesdue to elimination ofsmall crop holdings,cloud infestation effectsthe operational use
• High-resolutionOptical + SWIR(Sentinel-2) with hightemporal capability,better radiometricresolution
• Availability ofMicrowave sensors toaddress could effects
• Introducing area-framesampling approach andintegration of UAV
Crop stress • Medium resolutionOptical + SWIRLandsat TM Waterstress, diseasestress-based operationalmethodologies lacking
• Use ofsatellite/model-basedsoil moisture inputslacking
• Continuity of similarsystems Landsat TMtype of sensor withadditional bands of rededge and moisture
• ExperimentalHyperspectral data
• SMOS-based/similarproducts assimilation tobe achieved
• Improving infrastructureon automated ago-metstations
• Research efforts/projectsto be implanted over rededge andhyperspectral-based pilotstudies
• Pilot studies on soilmoisture assessment andintegration to beintroduced
Cropadvisories
• Reliable real time spatialclimate data, streamflow, soil moistureproducts almost lacking
• Crop production modelsintegrating hydrometdata, soil moisture, cropspecific data as aboveare at research level
• Integrated regionalspecific models todeveloped to providepolicy and operationallevel crop advisories
• Research studies ondeveloping regionspecific spatial hydrometproducts and cropproduction models to beaugmented
36 M.S.R. Murthy et al.

The current MODIS/SPOT-based temporal crop monitoring systems needcontinuity with more customization in data processing and delivery mechanismslinking diversity of users. The improved spatial resolution, as well as, enhancedradiometry are required for achieving better accuracy to assess small farmerholdings, and discrimination of mixed cropping systems. Most of the rice crop isgrown in kharif season (monsoon), coinciding with the over cast cloudy conditionsof the sky most of the time. The dedicated microwave missions, data accessmechanisms, and R&D to identify observables needed in terms of polarizations,frequencies, and spatial and temporal resolutions are essential to study kharif seasoncrop growth systems. High-resolution thermal infrared data along with shorterwavelengths (VIS, NIR and SWIR) would enhance the process modeling pertainingto energy and water balance and characterizing thermal environments of the agri-cultural crops. This would help toward estimating the water requirements/evapotranspiration which is useful in modeling crop stress and productivity inthe context of rainfed and drought scenario.
Atmospheric effects are significant source of errors in multitemporal analysis ofsatellite data over the mountain regions. This calls for inclusion of specific atmo-spheric correction channels or independent atmospheric correction sensor to facil-itate estimation of atmospheric parameters such as water vapor content and aerosoloptical thickness in the upcoming sensors. Toward improving the accuracy ofsurface parameters, retrieval multiangular observation system is required fordetermining the Bidirectional Distribution Function (BRDF). This could beimplemented with multiangle imaging sensor of five views having four bands inVNIR region. The improved information and knowledge from such new sensorsystems could extend extensively to food production and availability components offood security in mountainous regions.
3.2.2 Supporting Food Security Through Agro Advisories—MovingAcross Scales
Negative impacts of climate trends on crop production have been more commonthan positive impacts, as evident in some high-altitude regions. There have beenseveral periods of rapid food and cereal price increases following climate extremesin key producing regions, indicating a sensitivity of current markets to climateextremes, among other factors affecting the food availability (Trostle 2010). Inaddition, the episodic response of food production to climate also impairs thesupply chain systems of local people, threatening food availability. EO-based cropmonitoring and geospatial models on crop productivity provide only a partialassessment of food security–climate change relationships in terms of food pro-duction and not specifically on food availability.
It is of particular concern how to link this multitude of information topolicy-based issues involving sustainable development communities, assessing andensuring food security prospects. Engagement of these policy communities requires
Reform Earth Observation Science and Applications … 37

much a broader and comprehensive scalable framework to translate productivityand production information from crop and farming systems respectively to foodsecurity systems. The geospatial technology plays a critical role in monitoring,assessing, and modeling food production through crop simulation models, continualmonitoring of growth profiles over crop cycle, crop production estimations usingspectral and ground-based yield data, and risk assessment, with the goal of mini-mizing losses and improving production stability against natural disasters(Belmonte et al. 2003; Grigera et al. 2007). The applicable satellite systems onprecipitation (GPM) and soil moisture (SMAP) and regionalized climate forecastsystems constitute primary information support needed for crop growth monitoringsystems (El Sharif et al. 2015). In addition to biophysical monitoring, informationon different farm specific local practices, agronomic challenges, and regional micro-and macroeconomics are drivers of food production and availability. This empha-sizes that significant coupling of information across scales and disciplines is neededto understand linkages of food production and availability (Fig. 2; Table 2).
In order to move across sectoral scales, the EO community could play a criticalrole in coupling environmental models (e.g., climate forecasts, hydro-meteorologicaldynamics, crop growth, and productivity) with spatial econometric models. Such aneffort is only possible with joint efforts of multiple expert communities, relevantsubject domain experts, and policy-level decision-makers. Currently, such efforts arefar from beginning in this region, and hence call for long-term multi-institutionalinitiatives to address the serious problems of food security exacerbated by climatechange.
Fig. 2 Climate change impacts and food security moving across spatial scales: From cropproduction to food security
38 M.S.R. Murthy et al.

3.2.3 Alleviating Food Distress Through Bio-Resources Management
The high-altitude Himalayan livelihoods largely comprise of natural resource-basedsubsistence ecosystems. Apart from less agriculture land availability, the harshclimate, rough terrain, poor soils, and short growing seasons often lead to lowagricultural productivity and food availability. The sustained food security hence isalso determined by grasslands function and associated livestock patterns, avail-ability of forest-based resources, and balanced inter flow of material regulatingthese three interconnected ecosystems. The mountain-specific practices like terracecultivation, shifting cultivation, narrow niche-based cropping systems, multifunc-tional agriculture, and harnessing local water springs become pertinent in suchareas. The Agro-Pastoral, Silvi-Pastoral, and Silvi-Agro-Pastoral systems also standas great players in the region. By looking at HKH region mountain farming trends,Tulachan (2001) suggests focusing on crop–livestock farming systems, which willpose less pressure on common property resources such as forests and communitylands, leading to positive impacts on the environment.
The effective functions of interactive ecosystems are largely governed by localinnovations and practices of indigenous and local communities embodying tradi-tional lifestyles. This is demonstrated in the wisdom developed over many gener-ations through holistic, traditional, and scientific utilization of the lands, naturalresources, and environment. It is generally passed down by word of mouth, fromgeneration to generation and is, for the most part, undocumented. However climatechange, globalization, and increased disasters are forcing many livelihoods to shifttoward new practices like unsustainable production of cash crops, water harvesting,and use of pesticides in agricultural fields, leading to vanishing traditional culturalpractices. While traditional knowledge is valid and necessary, however in the age, itis only beneficial when blended with enormous contemporary scientific knowledge.The adaptability to new practices requires appropriate infrastructure and scientificknowledge associated with vulnerability, disaster management, and unsustainableextraction of bioresources to ensure food security.
In this context, EO systems and associated geospatial technology play promisingroles at multiple scales for understanding local practices, relevance, and changinginternal and external drivers. Contemporary EO systems and models are naturalframeworks to integrate downscaled high-resolution climate forecasts,high-resolution Digital Elevation Models (DEMs), large-scale land cover andbioresource inventories, crop and rangeland calendars and productivity, landdegradation, and spatial explicit ecosystems services assessment and flows(Table 2). Such comprehensive biophysical information previously not availablecould be integrated with traditional knowledge and practices and social and eco-nomic drivers, through agent-based models, spatial econometric models, and otherself-learning algorithms to delineate or stratify socioecological regimes across largebioclimatic regions of the high-altitude systems.
Locations and characteristics of such socioecological strata as defined by acertain degree of similarity in structure and function would constitute a cluster offood distress units. These clusters could be further studied using three models:
Reform Earth Observation Science and Applications … 39

(1) bioresources capital system, (2) bioresources support system, and(3) bio-resources use system. The integrated analysis of these different systems onspatial and temporal dimension would provide alternate scenarios of ensuring foodsecurity through sustainable management of bioresources. The different compo-nents of three subsystems and integration frameworks are given in Fig. 3.
The pilot testing and implementation of best possible scenarios across fooddistressed villages provide model concepts of bridging traditional and scientificknowledge for ensuring food security. Such an approach would also provide aframework for upscaling over the similar socioecological strata identified else-where. In this light, it necessary that the EO community reaches the last mile tostakeholders to implant technological bottom-up simple innovations, developingcoupled traditional and scientific knowledge bases, cost optimization, and scala-bility. The strengthening of local participatory and governance systems, identifyingappropriate capacity building needs and institutionalization, are also very critical toeffective application of EO to addressing food security challenges.
4 Forest-Based Climate Change Mitigation
Carbon sequestration, carbon substitution, and carbon conservation are the pro-cesses through which forests can contribute to the mitigation of climate change.Contrasting a typical Land cover, Land-use and Forestry (LCLUF) approach, an
Fig. 3 Bioresource inventorization and quantification
40 M.S.R. Murthy et al.

Agriculture, Forestry and Other Land-Use (AFOLU) approach greatly expands thepotential for carbon sequestration in the land-use sector with greater benefits for thecountries of the HKH. The forests of HKH region are estimated to mitigate 3500megatons (MT) of carbon through avoided deforestation and degradation and 47MT of carbon through improved forest management over next 20 years. Therefore,flexible, robust, credible, and well-tested Sustainable Forest Management(SFM) and integrated land-use management frameworks are needed to support thesimultaneous reduction of carbon emissions, sequestration of carbon, and ensuredprovision of ecosystem goods and services.
The Collaborative Partnership on Forests (CPF) consisting of 14 majorforest-related international organizations, institutions, and secretariats, developedthe strategic framework on forest-based carbon mitigation and climate change.Among the six critical messages of the framework, one of the messages stresses theneed for reliable, consistent, and continual information support to develop effectiveassessment and diagnosis, planning, implementation, and monitoring. In addition tothe strong local context-based knowledge and action, the use of geospatial infor-mation emanating from multisensor remote sensing information is strongly advo-cated both for mitigation and adaptation strategies (IPCC 2006).
Globally, the practice of using geospatial science-based evidential informationhas significantly increased with the advent of open access satellite data, informationproducts, mobile, and web-based data collection and dissemination platforms(Elwood 2010). However, due to differentiated capacities of HKH countries, thereis a wide gap in terms of: (1) application and use of geospatial systems for forestcover change assessment and monitoring, (2) cost effective multiscale carbonmonitoring to support the Reducing emissions from Deforestation and ForestDegradation (REDD) strategies, and (3) evolving planning and monitoring strate-gies for forest-based vulnerability and adaptation planning (Boyd and Foody 2011).Periodic land cover change assessments, forest degradation assessments, and bio-mass quantification, stand as three fundamentals for forest-based carbon mitigationstrategies.
4.1 Current Scenario Assessment
A significant effort has been made over the region in developing periodic nationalland cover change data bases in the region as part of ICIMOD regional collabo-ration with regional member countries through the NASA-SERVIR-Himalaya ini-tiative (Gilani et al. 2015a, b; Uddin et al. 2015). The details of current status ondata availability are given in Table 3. However, dedicated operational systems andframework are lacking to produce periodic change assessment. Globally availableannual tree cover and global change monitoring systems using Landsat TM dataneed significant improvement for regional-level applications. Satellite-basedcommunity-level forest cover monitoring and degradation assessment tools using
Reform Earth Observation Science and Applications … 41

high-resolution data are at research stage to bring out cost effective, user friendlyopen source methodologies (Gilani et al. 2015a, b).
Currently, assessment of forest growing stock is done at national and subnationallevels. National growing stock estimates are developed using national-level mul-tisource forest inventories. In order to address sustainable forest management, thenational forest inventories are made exhaustive in terms of parameters and datacollected across the entire country. Most of the national inventories follow sys-tematic sampling with fixed grids and proportional temporary and permanentsample points chosen for data collection. In view of this complexity, nationalinventories involve intensive field sampling and are thus time and cost intensive.The estimates are generally planned over a 5-year time interval. However, due totime and cost constraints, biomass assessments in most HKH countries, apart fromChina and India, have not been carried out at regular intervals to support the needfor forest carbon monitoring (Du et al. 2014; FSI 2011).
Equally, national-level growing stock estimates over large countries do notprovide realistic subnational scenarios, while the next lower level assessments doneat the district level are designed with district-specific requirements in terms ofsampling design and time. The application of satellite remote sensing in opti-mization of cost and time to produce periodic biomass assessment is at early stagesof application. Significant emphasis has been placed on developing such infor-mation, awareness, and expertise at both operational and at strategic levels, andinstitutional frameworks exist across the different countries of the region. However,improvements are needed on scientific methods being followed as well as oncapacity building efforts on developing operational frameworks and assimilatingnew technologies to address periodicity, reliability, cost, and turnaround time.
4.2 Prospects and Challenges (up to 2030)
4.2.1 Land Cover Change Assessments
In recent years, at the global level, numerous efforts have been made to providesatellite-based medium-resolution land cover and forest cover information. Mostcommonly used are Landsat images, which are of long standing and widely used forcontinuous land cover monitoring (Gong et al. 2012; Hansen et al. 2013; Kim et al.2014). At the global to regional level, these data products are developed throughsupercomputing techniques to provide reasonable results. At the national levels,more coordination, collaboration and ground validation are very much needed.Further synergies between national and global and regional partners need to beestablished. At this stage, significant effort needs to be made, to improve opera-tional frameworks on Monitoring, Reporting, and Validation (MRV), ranging fromground data collection techniques to institutionalized delivery and use of products.The land cover monitoring needs in HKH over the next decade definitely requiredata continuity from Landsat TM type of high-resolution satellite systems. The
42 M.S.R. Murthy et al.
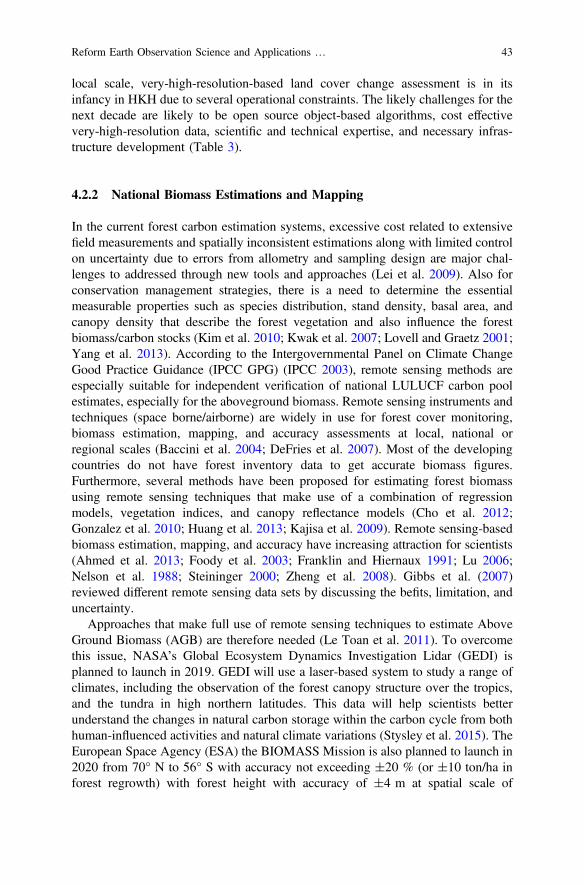
local scale, very-high-resolution-based land cover change assessment is in itsinfancy in HKH due to several operational constraints. The likely challenges for thenext decade are likely to be open source object-based algorithms, cost effectivevery-high-resolution data, scientific and technical expertise, and necessary infras-tructure development (Table 3).
4.2.2 National Biomass Estimations and Mapping
In the current forest carbon estimation systems, excessive cost related to extensivefield measurements and spatially inconsistent estimations along with limited controlon uncertainty due to errors from allometry and sampling design are major chal-lenges to addressed through new tools and approaches (Lei et al. 2009). Also forconservation management strategies, there is a need to determine the essentialmeasurable properties such as species distribution, stand density, basal area, andcanopy density that describe the forest vegetation and also influence the forestbiomass/carbon stocks (Kim et al. 2010; Kwak et al. 2007; Lovell and Graetz 2001;Yang et al. 2013). According to the Intergovernmental Panel on Climate ChangeGood Practice Guidance (IPCC GPG) (IPCC 2003), remote sensing methods areespecially suitable for independent verification of national LULUCF carbon poolestimates, especially for the aboveground biomass. Remote sensing instruments andtechniques (space borne/airborne) are widely in use for forest cover monitoring,biomass estimation, mapping, and accuracy assessments at local, national orregional scales (Baccini et al. 2004; DeFries et al. 2007). Most of the developingcountries do not have forest inventory data to get accurate biomass figures.Furthermore, several methods have been proposed for estimating forest biomassusing remote sensing techniques that make use of a combination of regressionmodels, vegetation indices, and canopy reflectance models (Cho et al. 2012;Gonzalez et al. 2010; Huang et al. 2013; Kajisa et al. 2009). Remote sensing-basedbiomass estimation, mapping, and accuracy have increasing attraction for scientists(Ahmed et al. 2013; Foody et al. 2003; Franklin and Hiernaux 1991; Lu 2006;Nelson et al. 1988; Steininger 2000; Zheng et al. 2008). Gibbs et al. (2007)reviewed different remote sensing data sets by discussing the befits, limitation, anduncertainty.
Approaches that make full use of remote sensing techniques to estimate AboveGround Biomass (AGB) are therefore needed (Le Toan et al. 2011). To overcomethis issue, NASA’s Global Ecosystem Dynamics Investigation Lidar (GEDI) isplanned to launch in 2019. GEDI will use a laser-based system to study a range ofclimates, including the observation of the forest canopy structure over the tropics,and the tundra in high northern latitudes. This data will help scientists betterunderstand the changes in natural carbon storage within the carbon cycle from bothhuman-influenced activities and natural climate variations (Stysley et al. 2015). TheEuropean Space Agency (ESA) the BIOMASS Mission is also planned to launch in2020 from 70° N to 56° S with accuracy not exceeding ±20 % (or ±10 ton/ha inforest regrowth) with forest height with accuracy of ±4 m at spatial scale of
Reform Earth Observation Science and Applications … 43

Table 3 Needs and challenges of geospatial spatial applications—land cover and forestdegradation at national and local level
Thrust areas Current system(2010–2015)
Technology continuity/newsystems (2015–2030)
Ground segments(2015–2030)
National level
Land cover • Consistent periodical landcover change dataavailable exceptMyanmar
• Dedicated operationalsystems and frameworklacking to produceperiodic changeassessment
• Global annual Tree covermonitoring systemavailable usingLANDSAT TM andMODIS data needsimprovement in terms ofproduct type and quality
• Continuity ofLandsat TM type ofsensors
• Regionalized automatedalgorithms and provisionof computing platformsattracts users to adoptspace-based monitoringsystems
• Significant effort need tobe made to evolveoperational framework onmonitoring, awarenessexpertise andinstitutionalizing
• Synergies with global andregional partners to beestablished
• Research studies onregional algorithms totake place
Forestdegradation
• Landsat-based periodiccrown closure changesused as one of themeasures. Need to bemade operational
• Operational algorithms tobe evolved on crownclosure changeassessments as terraineffects and shadowslimits reliableclassification
• Adoption of red edge andmoisture-based remotesensing studies shownsignificant promise ondegradation assessment.
• Availability of red edge,moisture and thermalsensors on similar linesof ASTER is veryimportant.
• Significant researchstudies dovetailed withuser needs to take place
Local level
Land cover • Satellite-basedcommunity forestmonitoring tools usinghigh-resolution data areat research stage
• Cost and technologyoptimization andframework foroperational use lacking
• Multispectralhigh-resolution sensorssystems are limited, needfor developing countriesin spatial planningprocess is critical, opensource object-basedalgorithms and S/W arelacking to analyseshigh-resolution images
• Enhanced localized EOplanning acquisitionshelpful (e.g., fromInternational SpaceStation (ISS) platformssuch as ISS-SERVIREnvironmental ResearchVisualization System(ISERV) or other)
• Interventions of GEO orSystems likeInternational Disastercharter, Subsidyprovisions fromcommercial systems are afew cost optimizations tobe attempted
• Research focus to go onobject extractionalgorithms
(continued)
44 M.S.R. Murthy et al.

100–200 m (Le Toan et al. 2011). Another NASA-ISRO Synthetic Aperture Radar,Mission (NISAR) is also in pipeline to be launched in 2020. According toAlvarez-Salazar et al. (2014) NISAR’s unprecedented coverage in space and timewill reveal biomass variability far more comprehensively than any other mea-surement method.
In the HKH region, where steep terrain and complex forest characteristics canplay problem for accurate inversion of the satellite data, robust validation effortsbased on field measurements are needed. Although, sporadic efforts in the form offiled campaign are being made to produce national and subnational measurements.A more structure effort and network of institutions are needed to bring the validatedsatellite products and to make them available for national usages.
Capacity building and long-term technical back stopping are also essential tostrengthen the local partners who can take advantages of global products.Indigenous human resource adequately trained with new technology will ensurecontinuity of efforts as well as influence the decision-making process.
4.2.3 Forest Degradation Assessment—REDD MRV Systems
A few of the critical challenges of REDD MRV systems are reliable estimation ofdeforestation, afforestation, forest enhancement, and degradation. Currently, fairlygood satellite-based global to sub national monitoring systems are available tomonitor forest cover gain and loss (Gibbs et al. 2007). However, quantification ofchanges in carbon fluxes due to forest cover change dynamics is still a complicatedtask (Sasaki and Putz 2009) and stands important as it contributes to larger pro-portion of carbon dynamics. The national-scale degradation assessments to quantifycarbon fluxes are related to timber and fuelwood extractions, grazing, and fireimpacts (Miettinen et al. 2014). Significant efforts need to be made to providecrown closure changes-based degradation assessment to support carbon assessmentusing remote sensing data. At the national level, operational algorithms to beevolved on crown closure change-based forest degradation assessment. Availability
Table 3 (continued)
Thrust areas Current system(2010–2015)
Technology continuity/newsystems (2015–2030)
Ground segments(2015–2030)
Degradationassessment
• Critical need exists tosupport communityforestry programspromising research andoperational aspects to betested
• Very limited studies wereavailable
• Future satellite systemsshould consider thisglobal need of localdegradation assessment,large proportion ofstakeholders for spacedata could belong to thiscommunity, sensors onthe similar linesRapidEye supported with1 m BW will be indemand
• Research work onpiloting, demonstration,capacity building isneeded. Involvement ofglobal expertise isimportant
• Studies on linking tonational scales andpackaging for use at locallevel as simplemonitoring tools ischallenge
Reform Earth Observation Science and Applications … 45

of red edge, moisture and thermal sensors, and application are important fordetection of changes and mapping degraded areas. However, such nationalapproaches are not suitable at local scale community forestry systems due to lack ofdriver data and microlevel canopy changes. In this context, adoption ofcommunity-based forest monitoring tools involving local stakeholders is beingtested as one of the alternate systems. Danielsen et al. (2011) have explained therole, accuracies, and economics of community-based, forest-based monitoringsystems. The community-based monitoring systems involve scientifically identifiedpermanent sample plots over individual community forest areas, developing pro-tocols and training and periodic measurements of different parameters at specifiedintervals (Poudel et al. 2014). One of the critical challenges of thesecommunity-based monitoring systems is efficacy of low-intensity permanent sam-ple points representing the large area under study, lack of spatial extrapolationpower to address changes beyond the sample plots such as forest cover losses anddegradation over the entire study area (Härkönen 2002). In such a case, difficultiesalso arise in the inability of point-specific measurements to reliably quantify carbondynamics due to leakage, additionality, and persistence. In an effort to handle thesechallenges, integration of remote sensing systems with field-based measurementsare being evaluated to assess potential application and operational feasibility forcommunity-level MRV systems (Palmer Fry 2011) addressing challenges ondetecting local-level changes and integration with local filed monitoring systems.Remote sensing-based spatial explicit estimates provide wall to wall coverage,enabling decision-makers, and managers to understand the dynamics beyondpoint-based estimates (Baccini et al. 2012; De Sy et al. 2012). Integration of forestmeasured and monitoring data collected by the local communities with satellitesystems could provide precise and accurate reporting of degraded hotspots (Fig. 4).Affordable, very-high-resolution multispectral data is going to be a huge need in thecontext of upcoming REDD initiatives to enable assessments of local species andstand-level degradation and biomass change assessment (Table 4). The adoption ofmultiresolution satellite systems also helps to address biomass estimations at spe-cies-, stand-, and forest-type levels, enabling a spatial linkage of different scales ofinformation to reach from community level to national estimates.
5 Flood
The HKH region encompasses high-mountain landscapes and is prone to naturaldisasters of myriad types due to active geotectonic setting, sensitivity to climateextremes, fragile ecology, large degree of poverty, lack of infrastructure, and pooraccessibility to services. An increasing trend in the recurrence of natural disastersand associated impacts due to floods, glacial lake out bursts, landslides, and forestfire is reported over HKH region. The total recorded major disasters events during1900–1910 to 2000–2010 have increased from 7 to 617 involving millions ofhuman and economic losses, even when not considering local-level events. The
46 M.S.R. Murthy et al.

unprecedented scale of disaster events like flood (Fig. 5), landslides, and forest firein recent years are found to have close links with increasing incidents of extremeclimate events. In addition, rapid but unsustainable development, populationexplosion, and economic development in the HKH region are expected to inflate thecost of flood impacts.
The uncertainties involved in understanding high-altitude land surface andatmospheric processes and extreme climate dynamics are identified as primary
Fig. 4 Synchronization of satellite images and ground photographs
Reform Earth Observation Science and Applications … 47

Table 4 Needs and challenges of geospatial spatial applications—forest carbon monitoring at thenational and local level
Thrust areas Current system(2010–2015)
Technologycontinuity/newsystems (2015–2030)
Ground segments(2015–2030)
Nationalcarbonaccounting
• National growingstock assessmentdesigns andmeasurements inplace.
• Limited interventionsfrom remote sensingtakes place toimprove samplingdesigns andestimations
• Periodic assessments,needs and frameworklacking to supportmonitoring carbonfluxes
• Sampling designs anddemonstrationsinvolving optical,microwave andLiDAR datadepicting cost anddata optimizationrequired
• Regionalmicrowave-basedheight retrievalalgorithms areneeded
• Capacity building onmicrowave-basedbiomass assessmentsand spatial modellingat user end is anurgent need
• Ground campaignsthrough mobilizationof local forestcommunities underthe guidance of forestofficers
Communitycarbonmonitoring
• Community-levelfield-basedmonitoring tested ina few countries
• Complimentary useof remote sensingand field technologyto enhance thematiccontent and costoptimization to beimplanted
• Species- andcanopy-level proxyindicators andstratification, canopygeometry andspecies-basedparametric andnonparametricmodels to bedeveloped
• Researchcollaboration,technical training andinfrastructuredevelopment needed
factors for such increased risk. To overcome these challenges, we need to invest oninnovative and low-cost systems to develop reliable predictive models and toolswith monitoring capabilities that integrate local knowledge and ensure timelycommunication of actionable information. A significant need to build long-termresilience against disasters, acting upon hazard and risk by building robust andplanned infrastructure and mitigation systems is also advocated.
5.1 Current Scenario Assessment
The role of geospatial tools which includes both remote sensing and GIS in spatialplanning in the context of different thematic focus, including disaster has long beenrecognized in flood management (Abdalla and Li 2010; Goodchild 2006; Tahir2007; Uddin et al. 2013). The improved availability of operational all-weathercapability satellites, constellation of satellite systems, satellite-based rainfall map-ping and estimation systems, Unmanned Aerial Vehicles (UAV), low-cost
48 M.S.R. Murthy et al.

ground-based sensors, mobile-based communications, spatially explicit simulationand statistical models, and open access high-resolution data and informationproducts have improved globally the efficiency of disaster early warning andemergency response systems.
The cooperation among regional and international agencies in terms of datasharing, response synergies, and risk reduction platforms are also contributing tothe disaster management. During the last decade, HKH countries stand high ininvoking and obtaining support from the International Charter for Space and MajorDisaster for disaster response. The current level of adoption of these systems acrossthe region is presented in Table 1. These seed attempts need be to furtherstrengthened as several technological and institutional gaps and challenges do existswhich needs to be addressed over the coming decade. The major thrust need to bedrawn on flood risk reduction systems consisting reliable flood risk reductioninformation and early warning systems which are described as below.
5.2 Prospects and Challenges
5.2.1 Flood Risk Reduction Information and Planning
The Sendai Framework articulates amongst others, the need for improved under-standing of disaster risk in all its dimensions of exposure, vulnerability and hazard
Fig. 5 HKH causality by flood
Reform Earth Observation Science and Applications … 49

characteristics to mainstream Disaster Risk Reduction (DRR) in developmentthrough risk informed policy and investment (Sendai Framework for DRR 2015–2030). Risk informed policy and investment has become imperative in view ofrising trend of extreme events due to climate change, and rapid economic devel-opment on the other hand compromising safety concerns. Tracking loss and damageassociated with natural hazards at national and subnational levels help us monitorthe impacts of disaster, thus forming the basis for risk informed policy andinvestment, and a means to evaluate success of DRR investment. Pre- andPost-2015 framework for DRR puts emphasis on “Record, analyse, summarize anddisseminate statistical information on disaster occurrence, impacts and losses,”(Sendai Framework for Disaster Risk Reduction 2015–2030).
An overview of the status, gaps, and challenges on evolving geospatial supportfor disaster risk reduction systems is given in Table 5. The spatial delineation offlood risk zones using historical flood events, inundation maps, land cover, set-tlements, topographic variability, drainage patterns, and river network have beenprepared as a case example for a watershed in Nepal to support planning and reduceassociated life and property losses (http://apps.geoportal.icimod.org/raptiflood).However, the currently available risk reduction databases over highly critical areasare not appropriate available and if available are not for operational working at locallevel. The availability of local scale high-resolution DEM, infrastructure and set-tlements databases, and inundation scenario for various return periods and incre-mental rainfall situation has been a serious gap of information and is of urgent needin the HKH region.
The adoption of very-high-resolution data due to cost constraints and lack ofreliable feature extraction algorithms in developing such information also needs tobe addressed. The calibration and development of open source physical models toincorporate run off and inundation scenarios to support operational planning is ofurgent need. The development of Decision Support Systems (DSS) to integrate andanalyze such diverse thematic datasets to support informed decision-making forpre-flood risk reduction planning at local levels is also lacking. The technologydemonstration with cost effective and user friendly DSS has still to go a long way inthe region. These database and information systems are also most needed duringflood emergencies for damage assessment, relief, and recovery operations. Thecross-sectoral institutional understanding and institutional strengthening towardevolving national disaster emergency data infrastructure, associated policy supportsystems, integration with traditional knowledge systems, and adoption of DSS onthe similar lines of China and India is of immediate need.
In this regards, the recent collaborative effort of Ministry of Home Affairs(MoHA), Nepal and ICIMOD, Kathmandu under SERVIR-Himalaya program onestablishing online multiscale disaster information and risk assessment is worthmentioning (http://apps.geoportal.icimod.org/disaster/). It is essentially based on adecade-long disaster loss database from MoHA. The online product is directlyrelevant to policy makers and planners to make risk informed policy decisions andinvestments through better comprehension of disaster and impact in the temporaland spatial perspectives. The system provides temporal trends of disaster impacts
50 M.S.R. Murthy et al.

represented by loss of lives and economic loss, a basis for evaluating success ofDRR interventions at national, district, and subdistrict level. The local scale DSShelping flood risk planning developed over local watershed of Nepal is an anothergood example. Similarly, great relevance exists to develop such systems overBangladesh, Bhutan, Myanmar, and Pakistan.
Table 5 Needs and challenges of geospatial spatial applications—flood risk reduction planning
Thrust area/response,recovery
Current systems (2010–2015)
Technologycontinuity/new systems(2015–2030)
Ground segment(2015–2030)
High-resolution terrain • 2–5 m DEM availableover limited area
• 90 and 30 m DEM inpublic domain
• Ortho rectified DEMneeds to be prepared
• Higher resolutionDEM needs to begenerated over criticalflood plains
• Ground-level localorganization to beinvolved andstrengthened
Infrastructure/settlementinputs
• Less than 1 m data-basedmapping of vulnerableareas lacking
• Feature extractionalgorithms, periodicdata updating
• Data cost optimizationmechanisms to beaddressed
• Significant researchon featureextraction
• Local institutionalinvolvement to beaddressed
Inundation inputs • Inundation maps producedbased on optical data
• Optical data limited bycloud cover
• Microwave-based mapsnot in operational use
• Processing of microwavedata in steep terrain still abig challenge
• Operational dataavailabilitymechanisms andalgorithms
• Cost optimizationmethods to beoptimized
• Collaboration withGlobal FloodMonitoring System(GFMS)
• Dedicated SARmission less than aday revisit,all-weathercapability, satelliteconstellation
Real time damageassessment
• MODIS and Landsat TMused but do not meet allneeds due to resolutionlimitations
• Significant limitation inproviding damage relatedinputs in real time
• Lack of framework tointegrate data sourcesfrom multisensors andsystems
• Strengthenhydrologicalmodelling approachesand undertake researchto prepare inundationmaps
• Large swath,high-resolution,high-temporal opticaldata to providecoverage within lessthan 1 day
• Continued availabilityof SAR missions onopen access basis
• Possible synergiesbetween low Earthorbit (LEO) andavailable geostationaryorbit (GEO) systems inthe region
• Ground segmentscapability toprocess hightemporal andspatial dataproducts
• Satelliteconstellation,formation flyingconcepts
• Microwave-basedalgorithms andprocessingcapacities atground
• Research studies onLEO-GEOintegration studies
Reform Earth Observation Science and Applications … 51

5.2.2 Flood Risk Reduction and Flood Early Warning
Flood management necessitates the real-time event capture both spatially andtemporally. Disaster events like floods, for example, are relatively faster in nature,having different temporal and spatial dimensions than drought and croppests/diseases, which are slow onset types. This necessarily calls for critical inputsfrom EO systems. The significant cloud cover problems during flood seasons in theHKH region necessitate all-weather capability EO systems. The quantification ofcatchment physical characteristics, such as topography and land use, and catchmentvariables such as soil moisture and snow cover supporting flood risk reduction arewell supported using high and low-resolution polar orbital earth resource satellites.However, there has been a significant weakness in turnaround time in providingreliable information during flood events in the region. The reliable medium-termclimate forecasts, real-time inundation levels and associated damages have beenalways a limiting element from EO systems (Table 6). It is important to progresstoward all-weather capability systems to: (i) increase time and frequency of cov-erage, (ii) improve coverage access and delivery, (iii) increase resolution of DigitalTerrain Model (DTM) for local applications—this includes very local (1 m)information (town, small watershed, etc.), and (iv) achieve the ability to access EOproducts and services on real and near-real-time basis.
The satellite constellation with elements of autonomy and ‘formation flying’mode on a long-term basis should aim to provide less than a day revisit andall-weather capability. The suite of satellite systems of LEO, GEO satellites, and adedicated SAR mission would add substantial strength to real-time monitoring ofthe floods and also capturing the moving targets like cyclones (Table 6). There areseveral global and regional LEO systems and GEO systems of China and Indiaoperating over the region. However, there is no significant effort made to assess therealistic quantitative assessment on synergetic benefit of all these systems, associ-ated gaps, and challenges. Most of the collaborations and responses are limited tothe emergency response during flood events thorough international space charter.These aspects should be discussed at international GEO summits or evolvingregional GEOs to evolve more synergistic suite of satellite systems. The disastermonitoring satellite if launched is perhaps one of the first attempts in this direction.The regional partners need to be encouraged to participate in such global missionsbefore launch for fruitful product development and use.
One of the major challenges in the context of floods is on the understanding ofclimate and its variability. It necessitates studies on various atmospheric parametersand processes leading to operational applications and predicting major climaticevents with high accuracy. The aim would be to deliver reliable climate informationin useful ways to maximize opportunities for decisions and help to minimize risksdue to floods. In this context, the efforts from SERVIR on providing climate dataand forecasts through ClimateSERV are worth mentioning (http://climateserv.nsstc.nasa.gov). The real-time and effective use of GPM and SMAP missions to provideregional products is one of the important elements for the coming decade, especiallyin terms of validating and customizing products. Such efforts could lead to reduced
52 M.S.R. Murthy et al.
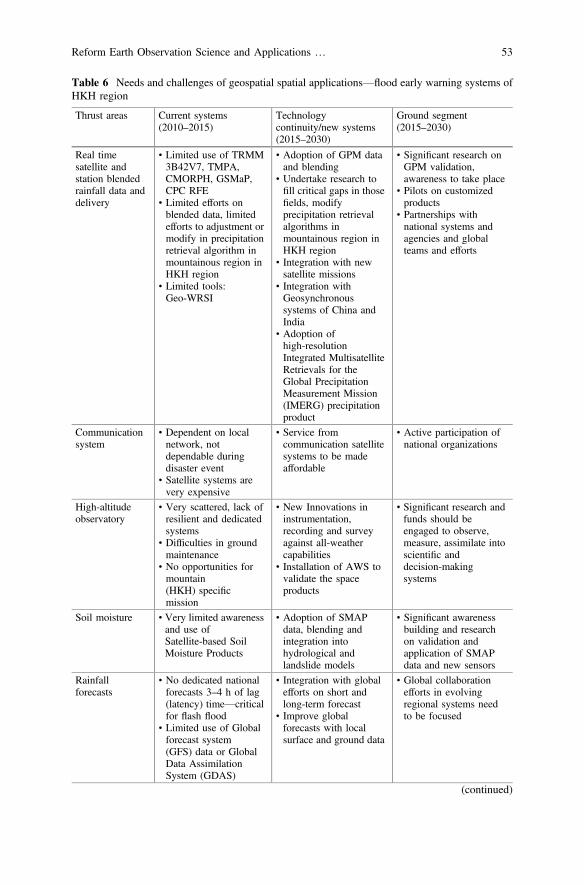
Table 6 Needs and challenges of geospatial spatial applications—flood early warning systems ofHKH region
Thrust areas Current systems(2010–2015)
Technologycontinuity/new systems(2015–2030)
Ground segment(2015–2030)
Real timesatellite andstation blendedrainfall data anddelivery
• Limited use of TRMM3B42V7, TMPA,CMORPH, GSMaP,CPC RFE
• Limited efforts onblended data, limitedefforts to adjustment ormodify in precipitationretrieval algorithm inmountainous region inHKH region
• Limited tools:Geo-WRSI
• Adoption of GPM dataand blending
• Undertake research tofill critical gaps in thosefields, modifyprecipitation retrievalalgorithms inmountainous region inHKH region
• Integration with newsatellite missions
• Integration withGeosynchronoussystems of China andIndia
• Adoption ofhigh-resolutionIntegrated MultisatelliteRetrievals for theGlobal PrecipitationMeasurement Mission(IMERG) precipitationproduct
• Significant research onGPM validation,awareness to take place
• Pilots on customizedproducts
• Partnerships withnational systems andagencies and globalteams and efforts
Communicationsystem
• Dependent on localnetwork, notdependable duringdisaster event
• Satellite systems arevery expensive
• Service fromcommunication satellitesystems to be madeaffordable
• Active participation ofnational organizations
High-altitudeobservatory
• Very scattered, lack ofresilient and dedicatedsystems
• Difficulties in groundmaintenance
• No opportunities formountain(HKH) specificmission
• New Innovations ininstrumentation,recording and surveyagainst all-weathercapabilities
• Installation of AWS tovalidate the spaceproducts
• Significant research andfunds should beengaged to observe,measure, assimilate intoscientific anddecision-makingsystems
Soil moisture • Very limited awarenessand use ofSatellite-based SoilMoisture Products
• Adoption of SMAPdata, blending andintegration intohydrological andlandslide models
• Significant awarenessbuilding and researchon validation andapplication of SMAPdata and new sensors
Rainfallforecasts
• No dedicated nationalforecasts 3–4 h of lag(latency) time—criticalfor flash flood
• Limited use of Globalforecast system(GFS) data or GlobalData AssimilationSystem (GDAS)
• Integration with globalefforts on short andlong-term forecast
• Improve globalforecasts with localsurface and ground data
• Global collaborationefforts in evolvingregional systems needto be focused
(continued)
Reform Earth Observation Science and Applications … 53

uncertainty in climate projections by providing timely information on the forcingand feedbacks contributing to changes in the Earth’s climate. The blending ofnational hydromet measurements systems and regional hydromet systems likeHYCOS with GPM missions would enable the provision of real-time climateinformation for both flood forecasts and flood damage assessments. In addition,real-time applications of satellite altimetry-based flow information in conjunctionwith regional specific in situ measurements and hydrological models on evolvingflood warning systems as developed in Bangladesh should be further tested.A summary of progressive events leading to development of effective flood earlywarning and risk management systems is presented in Fig. 6.
5.2.3 Flood Emergency Response
Emergency responders and managers need near-real-time situation reports asflooding unfolds to be able to appropriately deploy response interventions.Traditional data collection means are limited in timely and updated informationgathering at wider geographical scope. Satellite data with wide viewing scope andhigh temporal frequency when considered in unison with multiple sensors bridgesthis critical gap, effectively feeding in near-real-time information into
Table 6 (continued)
Thrust areas Current systems(2010–2015)
Technologycontinuity/new systems(2015–2030)
Ground segment(2015–2030)
Run off/flowlevels
• Hydrological modelsused
• Satellite Altimetrymodels over plains arebeing attempted
• Adoption of GFS datagenerated by IMD, andWeather and ResearchForecast (WRF) datagenerated by ICIMOD
• Improved hydrologicalforecasts using bettersatellite-based inputinformation as above
• Altimetry models to befurther tested
• Continuity ofAltimetry-based sensors
• Dedicated SAR Mission(regional hydrology)
• SatelliteConstellation-Less thana day revisit, largeswath, high-resolutionoptical sensors
• Small satellite missionsprocess understanding
• Improve regionalcoordination andsharing of data
• Significant research onhydrological modellingmodels to be strengthenInstitutional linkagesand traditionalknowledge systems tobe integrated to makeactionable products
54 M.S.R. Murthy et al.

decision-making processes. Advances of space science are now able to providemultispectral satellite images with submeter spatial resolution of any corner of theEarth. Under ideal environmental situations, satellite-based mapping can provideinformation on progression of flood hazards, pockets of vulnerable exposures, andsafe sites for evacuation, minimizing impact from the event. On the software side,there are algorithms to automatically delineate inundation layers to map flood extentand assessment of situation when event happens. Cloud cover precludes groundobservations and poses a major challenge, but microwave EO satellite systems haveshown a lot of promise in overcoming this challenge. Operational challenges withmicrowave systems are affordability, inadequate temporal frequency, and need forrigorous processing techniques to adequately address terrain influence, especially inthe HKH region.
The role of models in flood scenario development, though a proven concept, ischallenged by unavailability of exposure data and necessary input data such asrainfall and topography. Rainfall pattern in mountainous terrain are affected byorographic influence and current satellite-based rainfall product (GPM with 0.1°
Fig. 6 Summary of progressive events leading to development of effective flood risk managementsystems
Reform Earth Observation Science and Applications … 55

spatial resolution) do not capture rainfall distribution and spatial variability ade-quately. There is need for satellite-based rainfall products with higher spatial res-olution to capture spatial variability of rainfall for improving discharge estimatesand inundation scenario.
The internet has revolutionized the way information sharing and delivery hap-pens. Internet-based delivery systems reliant on elaborate infrastructure are oftenabsent in disaster prone far-flung communities, where decisions must be made thatare often not within national delivery mechanisms. Mobiles services, despiteremarkable penetration, have not reached many poor communities living in disasterprone area. Moreover, SMS-based delivery mechanisms, despite being a preferredcommunication mechanism, have not made the difference as one would expect(http://sm4good.com/2013/05/02/code-conduct-sms-natural-disasters/). A new formof delivery mechanism needs to evolve such that it operates in conjunction withcommunity-based DRR apparatus. Satellite-based communication systems such asVSAT are still limited by high cost, and unless high-value infrastructure areinvolved it is often not the choice. Solutions targeting developing countries need tobe simple and cost effective so that scaling up of the system is not hindered bymanagement and financial constraints.
6 Conclusions
The HKH mountains serve as globally significant natural resource regimes andclimate regulation systems. In the context of climate change and transboundaryissues, the understanding of mountain ecosystems needs utmost priority andimportance. There is an urgent need to orient EO efforts to characterize, monitor, andmodel the mountain systems in the way designed to study oceans and atmosphere.Current satellite-based EO systems and associated products play a limited role inunderstanding high mountain cryopshere dynamics, associated hydrology regimes,and the erosion of ecosystem services. The ability of current ground sensor networksis also limited in monitoring high-altitude climatology, atmospheric chemistry, anddispersion, vegetation stress degradation of biodiversity and associated services.
Primary efforts for the region with respect to EO include the validation andcustomization of satellite-based rainfall and soil moisture products, their integrationinto climate and hydrological forecasts, and building end-user capacity andstrengthening institutions that can benefit from EO. The future endeavors shouldalso focus toward better quantification of snow/ice depth to understand precursorsof hydrological dynamics, disaster vulnerability, and upstream/downstreamdynamics across nations (water availability, life security). This should facilitatepackaging EO observations into more reliable, readily usable and customizedregion specific climate services related to natural resource and disaster sectors.Essential EO-informed products needed to support mountain livelihoods will beeasy-to-access and interpret, and be of high-spatial and temporal resolution. It willcover vegetation composition, stress, and productivity for food security and
56 M.S.R. Murthy et al.

ecosystem services assessment, disaster support information for response andrecovery, and vegetation degradation and biomass maps to address carbon moni-toring. The combined use of satellite, ground and model-based studies to monitorand assess land degradation and air quality also contributes to ecosystem health.
All these applications needed to be packaged into Essential EHVs in line withECVs and provided on turnkey basis through global and regional cooperation onthe similar lines MODIS value-added products. The EHVs underlines the conceptof converting information into actionable products and services. In this context,various global efforts like WRI, Silva carbon, WMC, GEO, NASA, MAIRS andSAARC, and regional/national efforts would be closely networked through adedicated mountain centers and platforms such as ICIMOD. An improvement onthe currently disaggregated nature of these projects would be to work on a moreprogrammatic basis.
The different dimensions of enhancements in EO capabilities are required todevelop above-mentioned products. A few of the critical to address include:
• Improved satellite-based stereogramatic capabilities to understand and quantifysnow and ice depth
• Oriented and customized sensors and products to better monitor and forecastmountain climate
• Satellite constellation systems to enhance repetitive cover to address disaster andresources monitoring-related aspects
• Strengthening advanced planning and data acquisition systems for disasters• Active sensor (microwave)-based turnkey products for disasters• Short-term experimental small satellites to study geophysical and biophysical
mountain complexities• Satellite—Sensor webs to address problems like flash floods, glacier melts, and
glacier lake outbursts• High radiometric and spectral channels-based systems to monitor ecosystem
processes, invasion, stress, productivity, and water quality
These developments could only be realized through the integration of appro-priate ground measurement and validation systems. The lack of reliability ornonusage of ground-based information/data while developing sophisticated modelsand algorithms are found to ultimately minimize the accuracy, dependability, anduse of global turnkey products. The following would strengthen the region:
• Provision of common pool data• Development and provision of algorithms and products to encourage replication,
improvements, and utilization• Strengthening of forecasting abilities and related systems• Cloud computing platforms
With the advent of developing and availability of tailor-made services, the usercapacity building efforts should focus more on services specifications, potentialapplication, need and method of integration with local datasets for value-addedservices, sustainability, and institutionalization approaches.
Reform Earth Observation Science and Applications … 57

It is also essential to reorient and enable user segments so as to achieve enhanceduptake of actionable products. These efforts could include:
• Popularizing and bringing larger awareness among users• Infusing local flavor to dissemination systems• Empowering simple local mechanisms, institutions, and uptake systems• Developing and building dedicated a larger tier and network of policy, scientific,
and local user communities• Introducing key facilitators and practitioners who can take actionable products
to a diversity of users• Enhancing the layperson’s understanding of the use of online web applications
and ability to contribute more accurate data through crowd source systems.
The weak bridge between researchers/products and policy makers on the utilizationof available satellite resources should be addressed as one of the major capacitybuilding initiatives in the HKH countries. Integration of global expertise andexperience in blending innovation mechanisms with local knowledge both fromtop-down and bottom-up approaches facilitates for policy advocacy at local scales.Regular interaction between researchers and application developers with policymakers for better understanding and ensured uptake of EO-informed systems is alsonecessary. While these approaches and mechanisms are standard, the major focushas traditionally been oriented toward service development with minimal policysupport. Focusing on drawing policy support for EO service use is the formidablechallenge to overcome in the coming decade to ensure EO systems advance the lastmile toward sustained use.
Acknowledgement The authors thank ICIMOD and NASA for all the support in developing thismanuscript. We also thank NASA- and USAID-supported SERVIR-Himalaya program for thenecessary support to undertake the current scenario assessment. The views expressed by ICIMODauthors are at individual level and do not necessarily represent the institution.
References
Abbas, S., Nichol, J. E., Qamer, F. M., & Xu, J. (2014). Characterization of drought developmentthrough remote sensing: a case study in Central Yunnan, China. Remote Sensing, 6(6),4998–5018.
Abdalla, R., & Li, J. (2010). Towards effective application of geospatial technologies for disastermanagement. International Journal of Applied Earth Observation and Geoinformation, 12(6),405–407.
Ahmed, R., Siqueira, P., & Hensley, S. (2013). A study of forest biomass estimates from LiDAR inthe northern temperate forests of New England. Remote Sensing of Environment, 130,121–135.
Alvarez-Salazar, O., Hatch, S., Rocca, J., Rosen, P., Shaffer, S., Shen, Y., Sweetser, T., &Xaypraseuth, P. (2014). Mission design for NISAR repeat-pass Interferometric SAR. Pages92410C-92410C-92410. SPIE Remote Sensing. International Society for Optics and Photonics.
58 M.S.R. Murthy et al.

Anderson, K., & Bows, A. (2008). Reframing the climate change challenge in light of post-2000emission trends. Philosophical Transactions of the Royal Society of London A: Mathematical,Physical and Engineering Sciences, 366(1882), 3863–3882.
Baccini, A., Friedl, M., Woodcock, C., & Warbington, R. (2004). Forest biomass estimation overregional scales using multisource data. Geophysical Research Letters, 31, 1–4.
Baccini, A., et al. (2012). Estimated carbon dioxide emissions from tropical deforestationimproved by carbon-density maps. Nature Climate Change, 2(3), 182–185.
Badhani, K. (1998). Enterprise-based transformation of hill agriculture: a case study of vegetablegrowing farmers in Garampani area, Nainital district, India.
Bhandari, T. S., Shrestha, H. M., & Dhital, K. R. (2015). Soil Study in Mustang. http://www.icimod.org/?q=20204.
Bajracharya, S. R., Maharjan, S. B., Shrestha, F., Guo, W., Liu, S., Immerzeel, W., & Shrestha, B.(2015). The glaciers of the Hindu Kush Himalayas: Current status and observed changes fromthe 1980s to 2010. International Journal of Water Resources Development (ahead-of-print),pp. 1–13.
Bates, B., Kundzewicz, Z. W., Wu, S., & Palutikof, J. (2008). Climate change and Water:Technical Paper vi, Intergovernmental Panel on Climate Change (IPCC).
Belmonte, A. C., Jochum, A. M., & Garcia, A. C. (2003). Space-assisted irrigation management:Towards user-friendly products, in paper presented at ICID Workshop on Remote Sensing ofCrop Evapotranspiration, Montpellier.
Blaikie, P., Davis, C. I., & Wisner, B. (2014). At Risk: Natural Hazards, People’s Vulnerabilityand Disasters. Routledge.
Boyd, D. S., & Foody, G. M. (2011). An overview of recent remote sensing and GIS basedresearch in ecological informatics. Ecological Informatics, 6(1), 25–36.
Brown, M., & Wooldridge, C. (2015). Identifying and quantifying benefits of meteorologicalsatellites. Bulletin of the American Meteorological Society doi:10.1175/BAMS-D-14-00224.1.
Burkett, V. R., Wilcox, D. A., Stottlemyer, R., Barrow, W., Fagre, D., Baron, J., et al. (2005).Nonlinear dynamics in ecosystem response to climatic change: Case studies and policyimplications. Ecological complexity, 2(4), 357–394.
Cho, M. A., et al. (2012). Mapping tree species composition in South African savannas using anintegrated airborne spectral and LiDAR system. Remote Sensing of Environment, 125,214–226.
Danielsen, F., et al. (2011). At the heart of REDD+: A role for local people in monitoring forests?Conservation Letters, 4(2), 158–167.
DeFries, R., Achard, F., Brown, S., Herold, M., Murdiyarso, D., Schlamadinger, B., & de Souza,C. (2007). Earth observations for estimating greenhouse gas emissions from deforestation indeveloping countries. Environmental Science & Policy, 10(4), 385–394.
De Sy, V., Herold, M., Achard, F., Asner, G. P., Held, A., Kellndorfer, J., & Verbesselt, J. (2012).Synergies of multiple remote sensing data sources for REDD+ monitoring. Current Opinion inEnvironmental Sustainability, 4(6), 696–706.
Du, L., Zhou, T., Zou, Z., Zhao, X., Huang, K., & Wu, H. (2014). Mapping forest biomass usingremote sensing and national forest inventory in china. Forests, 5(6), 1267–1283.
El Sharif, H., Wang, J., & Georgakakos, A. P. (2015). Modeling regional crop yield and irrigationdemand using SMAP type of soil moisture data. Journal of Hydrometeorology, 16(2),904–916.
Elwood, S. (2010). Geographic information science: Emerging research on the societalimplications of the geospatial web. Progress in Human Geography, 34(3), 349–357.
Etkin, D. (1999). Risk transference and related trends: Driving forces towards moremega-disasters. Global Environmental Change Part B: Environmental Hazards, 1(2), 69–75.
Foody, G. M., Boyd, D. S., & Cutler, M. E. J. (2003). Predictive relations of tropical forestbiomass from Landsat TM data and their transferability between regions. Remote Sensing ofEnvironment, 85, 463–474.
Reform Earth Observation Science and Applications … 59

Franklin, J., & Hiernaux, P. Y. H. (1991). Estimating foliage and woody biomass in Sahelian andSudanian woodlands using a remote sensing model. International Journal of Remote Sensing,12, 1387–1404.
FSI. (2011). Carbon stock in India’s forests reports. Forest Survey of India (FSI), Ministry ofEnvironment and Forest Dehradun.
Gibbs, H. K., Brown, S., Niles, J. O., & Foley, J. A. (2007). Monitoring and estimating tropicalforest carbon stocks: Making REDD a reality. Environmental Research Letters, 2(4), 045023.
Gilani, H., Shrestha, H. L., Murthy, M. S., Phuntso, P., Pradhan, S., Bajracharya, B., & Shrestha,B. (2015a). Decadal land cover change dynamics in Bhutan. Journal of EnvironmentalManagement, 148, 91–100.
Gilani, H., Murthy, M. S. R., Bajracharya, B., Karky, B. S., Koju, U. A., Joshi, G., Karki, S.,Sohail, M. (2015b). Assessment of change in forest cover and biomass using geospatialtechniques to support REDD+ activities in Nepal, 60.
Gong, P., et al. (2012). Finer resolution observation and monitoring of global land cover: firstmapping results with Landsat TM and ETM+ data. International Journal of Remote Sensing,34(7), 2607–2654.
Gonzalez, P., Asner, G. P., Battles, J. J., Lefsky, M. A., Waring, K. M., & Palace, M. (2010).Forest carbon densities and uncertainties from LiDAR, QuickBird, and field measurements inCalifornia. Remote Sensing of Environment, 114(7), 1561–1575.
Goodchild, M. F. (2006). GIS and disasters: Planning for catastrophe. Computers, Environmentand Urban Systems, 30(3), 227–229.
Grigera, G., Oesterheld, M., & Pacín, F. (2007). Monitoring forage production for farmers’decision making. Agricultural Systems, 94(3), 637–648.
Gupta, A. S., Tarboton, D., Hummel, P., Brown, M., & Habib, S. (2015). Integration of an energybalance snowmelt model into an open source modeling framework. Environmental Modellingand Software, 68, 205–218.
Hansen, M. C., et al. (2013). High-resolution global maps of 21st-century forest cover change.Science, 342(6160), 850–853.
Härkönen, E. (2002). 1999 inventory of Nepal’s forest resources. Mountain Research andDevelopment, 22(1), 85–87.
Huang, W., Sun, G., Dubayah, R., Cook, B., Montesano, P., Ni, W., & Zhang, Z. (2013) Mappingbiomass change after forest disturbance: Applying LiDAR footprint-derived models at key mapscales. Remote Sensing of Environment, 134(0), 319–332.
Holtmeier, F. K., & Broll, G. (2005). Sensitivity and response of northern hemisphere altitudinaland polar treelines to environmental change at landscape and local scales. Global Ecology andBiogeography, 14(5), 395–410.
IPCC. (2003). Good Practice Guidance for Land Use, Land-Use Change and Forestry, IPCCCNational Greenhouse Gas Inventories Programme, Institute for Global Environment Strategies,Kanagawa, Japan.
IPCC. (2006). Guidelines for National Greenhouse Gas Inventories, IPCCC National GreenhouseGas Inventories Programme, Institute for Global Environment Strategies, Kanagawa, Japan.
Jayaraman, V. (2009). Status and trends of space applications for achieving internationally agreeddevelopment goals.
Kajisa, T., Murakami, T., Mizoue, N., Top, N., & Yoshida, S. (2009) Object-based forest biomassestimation using Landsat ETM+ in Kampong Thom Province, Cambodia. Journal of ForestResearch, 14(4), 203–211.
Kwak, D.-A., Lee, W.-K., Lee, J.-H., Biging, G. S., & Gong, P. (2007). Detection of individualtrees and estimation of tree height using LiDAR data. Journal of Forest Research, 12,425–434.
Kim, S. R., Kwak, D. A., Lee, W. K., Son, Y., Bae, S. W., Kim, C., & Yoo, S. (2010). Estimationof carbon storage based on individual tree detection in Pinus densiflora stands using a fusion ofaerial photography and LiDAR data. Science China Life Science, 53, 885–897.
60 M.S.R. Murthy et al.
Kim, D.-H., Sexton, J. O., Noojipady, P., Huang, C., Anand, A., Channan, S., et al. (2014).Global, Landsat-based forest-cover change from 1990 to 2000. Remote Sensing ofEnvironment, 155, 178–193.
Kim, H., & Marcouiller, D. W. (2015). Natural disaster response, community resilience, andeconomic capacity: A case study of coastal Florida. Society & Natural Resources, 1–17.
Kurvitz, T., Kaltenborn, B., Nischalke, S., Karky, B., Jurek, M., & Aase, R.H. (Eds.). (2014). TheLast Straw: Food security in the Hindu Kush Himalayas and the additional burden of climatechange. ICIMOD and GRID-Arendal, 60 p.
Le Toan, T., et al. (2011). The BIOMASS mission: Mapping global forest biomass to betterunderstand the terrestrial carbon cycle. Remote Sensing of Environment, 115(11), 2850–2860.
Lei, X. D., Tang, M. P., Lu, Y. C., Hong, L. X., & Tian, D. L. (2009). Forest inventory in China:Status and challenges. International Forestry Review, 11(1), 52–63.
Lovell, J. L., & Graetz, R. D. (2001). Filtering pathfinder AVHRR land NDVI data for Australia.International Journal of Remote Sensing, 22(13), 2649–2654.
Lu, D. (2006). The potential and challenge of remote sensing based biomass estimation.International Journal of Remote Sensing, 27, 1297–1328.
Lutz, A., Immerzeel, W., Shrestha, A., & Bierkens, M. (2014). Consistent increase in High Asia’srunoff due to increasing glacier melt and precipitation. Nature Climate Change, 4(7), 587–592.
Miettinen, J., Stibig, H.-J., & Achard, F. (2014). Remote sensing of forest degradation in SoutheastAsia—Aiming for a regional view through 5–30 m satellite data. Global Ecology andConservation, 2, 24–36.
Miller, H. M., Sexton, N. R., Koontz, L., Loomis, J., Koontz, S. R., & Hermans, C. (2011). Theusers, uses, and value of Landsat and other moderate-resolution satellite imagery in the UnitedStates—Executive report: U.S. Geological Survey Open-File Report 2011–1031, 42 p.
Minamiguchi, N. (2004). Drought and Food Insecurity Monitoring with the Use of GeospatialInformation by the UN FAO, paper presented at Regional Workshop on Agricultural DroughtMonitoring and Assessment Using Space Technology, Hyderabad, India.
Murthy, M., Bajracharya, B., Pradhan, S., Shrestha, B., Bajracharya, R., Shakya, K., Wesselman,S., Ali, M., Bajracharya, S., & Pradhan, S. (2014). Adoption of Geospatial Systems towardsevolving Sustainable Himalayan Mountain Development. ISPRS-International Archives of thePhotogrammetry, Remote Sensing and Spatial Information Sciences, 1, 1319–1324.
Nelson, R., Krabill, W., & Tonelli, J. (1988). Estimating forest biomass and volume using airbornelaser data. Remote Sensing of Environment, 24, 247–267.
Palmer Fry, B. (2011). Community forest monitoring in REDD+: The ‘M’ in MRV?Environmental Science & Policy, 14, 181–187.
Parmesan, C. (2006). Ecological and evolutionary responses to recent climate change. AnnualReview of Ecology, Evolution, and Systematics, 637–669.
Partap, T. (1999). Sustainable land management in marginal mountain areas of the Himalayanregion. Mountain Research and Development, 251–260.
Pilon, P. J., & Asefa, M. K. (2011). Comprehensive Review of the World Hydrological CycleObserving System.
Poudel, M., Thwaites, R., Race, D., & Dahal, G. R. (2014). REDD + and community forestry:Implications for local communities and forest management: A case study from Nepal.International Forestry Review, 16(1), 39–54.
Rasul, G. (2014). Food, water, and energy security in South Asia: A nexus perspective from theHindu Kush Himalayan region. Environmental Science & Policy, 39, 35–48.
Sankar, K. (2002). Evaluation of groundwater potential zones using remote sensing data in UpperVaigai river basin, Tamil Nadu, India. Journal of the Indian Society of Remote Sensing, 30(3),119–129.
Sasaki, N., & Putz, F. E. (2009). Critical need for new definitions of “forest” and “forestdegradation” in global climate change agreements. Conservation Letters, 2(5), 226–232.
Sharma, H. R., & Sharma, E. (1997). Mountain agricultural transformation processes andsustainability in the Sikkim Himalayas, India.
Reform Earth Observation Science and Applications … 61

Sigdel, M., & Ikeda, M. (2010). Spatial and temporal analysis of drought in Nepal usingstandardized precipitation index and its relationship with climate indices. Journal of Hydrologyand Meteorology, 7(1), 59–74.
Solomon, S., Plattner, G.-K., Knutti, R., & Friedlingstein, P. (2009). Irreversible climate changedue to carbon dioxide emissions. Proceedings of the National Academy of Sciences, 106(6),1704–1709.
Steininger, M. K. (2000). Satellite estimation of tropical secondary forest aboveground biomassdata from Brazil and Bolivia. International Journal of Remote Sensing, 21, 1139–1157.
Stysley, P., Coyle, B., Clarke, G., Poulios, D., & Kay, R. (2015). High Output MaximumEfficiency Resonator (HOMER) Laser for NASA’s Global Ecosystem Dynamics Investigation(GEDI) Lidar Mission.
Tahir, M. A. (2007). The needs and geospatial technologies available for disaster management inurban environment. In IEEE 3rd International Conference on Paper Presented at RecentAdvances in Space Technologies, 2007. RAST’07.
Trostle, R. (2010), Global Agricultural Supply and Demand: Factors Contributing to the RecentIncrease in Food Commodity Prices (rev). DIANE Publishing.
Tulachan, P. M. (2001). Mountain agriculture in the Hindu Kush-Himalaya: Aregionalcomparative analysis. Mountain Research and Development, 21(3), 260–267.
Uddin, K., Gurung, D. R., Giriraj, A., & Shrestha, B. (2013). Application of remote sensing andGIS for flood hazard management: A Case Study from Sindh Province, Pakistan. AmericanJournal of Geographic Information System, 2(1), 1–5.
Uddin, K., Shrestha, H. L., Murthy, M., Bajracharya, B., Shrestha, B., Gilani, H., et al. (2015).Development of 2010 national land cover database for the Nepal. Journal of EnvironmentalManagement, 148, 82–90.
Wang, G., Gertner, G., Parysow, P., & Anderson, A. (2000). Spatial prediction and uncertaintyanalysis of topographic factors for the revised universal soil loss equation (RUSLE). Journal ofSoil and Water Conservation, 55(3), 374–384.
Wu, B., Meng, J., Li, Q., Yan, N., Du, X., & Zhang, M. (2014). Remote sensing-based global cropmonitoring: experiences with China’s CropWatch system. International Journal of DigitalEarth, 7(2), 113–137.
Yang, X., Strahler, A. H., Schaaf, C. B., Jupp, D. L. B., Yao, T., Zhao, F., et al. (2013).Three-dimensional forest reconstruction and structural parameter retrievals using a terrestrialfull-waveform lidar instrument (Echidna®). Remote Sensing of Environment, 135, 36–51.
Zhang, X., Wu, B., Ling, F., Zeng, Y., Yan, N., & Yuan, C. (2010). Identification of priority areasfor controlling soil erosion. Catena, 83(1), 76–86.
Zheng, D., Heath, L. S., & Ducey, M. J. (2008). Spatial distribution of forest aboveground biomassestimated from remote sensing and forest inventory data in New England, USA. Journal ofApplied Remote Sensing, 2, 021502.
62 M.S.R. Murthy et al.

Integrating Earth Observation Systemsand Data into Disaster Preparednessin the Lower Mekong: Experiencesfrom the Asian Disaster PreparednessCenter
David J. Ganz, Peeranan Towashiraporn, N.M.S.I. Arambepola,Anisur Rahman, Aslam Perwaiz, Senaka Basnayake, Rishiraj Duttaand Anggraini Dewi
Abstract The Lower Mekong Region, which comprises Cambodia, Lao PDR,Myanmar, Thailand and Vietnam, faces significant challenges associated with rapideconomic, social, and environmental changes. Many of these challenges areexacerbated by climate change and natural disasters afflicting the region. Theregions’ sustainable development challenges will worsen as people recognize thatthey are exposed to more and more dangerous and unacceptable levels of risk fromdisasters. This chapter addresses the pressing challenges for sustainability anddisaster preparedness and explores the role of earth observation systems.
1 Overview
The Lower Mekong Region, which comprises Cambodia, Lao PDR, Myanmar,Thailand, and Vietnam, faces significant challenges associated with rapid eco-nomic, social, and environmental changes. Many of these challenges are exacer-bated by climate change and natural disasters afflicting the region. The regions’sustainable development challenges will worsen as people recognize that they areexposed to more and more dangerous and unacceptable levels of risk from disasters.In addition, major environmental changes such as alterations to water regimes andthe loss or degradation of natural forests are linked to challenges in maintainingecosystem services, conserving biodiversity, and maintaining soil and water quality.All of these challenges highlight the need for improved governance and decisionmaking to ensure better outcomes across all three aspects of triple bottom line
D.J. Ganz (&) � P. Towashiraporn � N.M.S.I. Arambepola � A. RahmanA. Perwaiz � S. Basnayake � R. Dutta � A. DewiAsian Disaster Preparedness Center (ADPC), 979/69 Paholyothin Rd.,Sam Sen Nai, Phayathai, Bangkok 10400, Thailande-mail: [email protected]
© Springer International Publishing Switzerland 2016F. Hossain (ed.), Earth Science Satellite Applications,Springer Remote Sensing/Photogrammetry, DOI 10.1007/978-3-319-33438-7_3
63

accounting—economic, social, and environmental. Accounting or auditing systemsare being integrated into a risk assessment framework so that decisions andwell-designed Disaster Risk Management (DRM) lead to outcomes which maintaineconomic, social, and environmental services (i.e., maintaining livelihoods) as wellas the DRM fundamentals of protecting lives and traditional assets.
Geospatial data and Earth observation data collected by a growing number ofsatellite-borne instruments and new techniques for robust geospatial analyses con-tribute significantly to more timely and informed decision making for societal ben-efits, especially in the context of climate change and increasing exposure to disasters.Despite an increase in the amount of data and the frequency of data acquisition, inorder for it to be deemed useful, such information and technologies must reach theright people and institutions at the right time and in the right form for a givenplanning, policy, or other decision-making context. Disaster risk management ben-efits greatly from the use of geospatial and Earth observation technologies becausespatial methodologies can be fully explored for serving different purposes fromassessment/analysis to application in decision-making process. The use of geospatialand Earth observation data has become an integral part of the DRM community ofpractice. Some of the technologically advanced tools in different application areashave been pilot tested by the Asian Disaster Preparedness Center (ADPC), both in thepast and now as it is applied within sound project management for DRM principles.
ADPC has found this integration of geospatial and Earth observation data ascritical for successful DRM as well as for widely accepted societal applications.These types of data have demonstrated a wide diversity of applications, fromaddressing the types of hazards to covering all aspects of the risk managementspectrum—starting with prevention and mitigation, through preparedness andresponse, to rehabilitation and reconstruction. In recent years, there is a growinginternational recognition that governments must take the full lead in assessment andrecovery planning, with support from various development partners. Therefore,ADPC has been working with these development partners to build up the country’sinstitutional arrangements and capacities, using internationally accepted method-ologies which need to adapted to specific country requirements in order to getappropriate buy-in. A similar approach is going to be needed for integratinggeospatial and Earth observation data into the full risk management spectrum. In thispaper, the authors highlight nearly 30 years of experience from one of the capacitydevelopment leaders in the broader Asian region. Two case studies present thelessons learned for the broader geospatial and Earth observation community, espe-cially perspectives from the DRM subsector that are engaged for better uptake ofgeospatial information. It should be noted that the geospatial community has beenquick to expand into the disaster relief and response arenas; however, in this reviewof its experience, the ADPC highlights a few applications of geospatial data undertwo disaster risk reduction (DRR) contexts where the focus is on better decisionmaking utilizing the best of what is available and the ability of these countries toproperly integrate this kind of information into better disaster preparedness planning,safer land-use planning, regulatory zoning for disaster-resilient development, andappropriate and timely weather forecasting and early warning systems.
64 D.J. Ganz et al.

These two case studies document the existing use of geospatial informationthrough its projects: what type of data was developed, how it was integrated, andthen served into successful decision-support tools for making different decisions ina disaster risk management context. As in other fields of application, the mosteffective use of remote sensing and GIS is when it builds local capacity to usegeospatial data freely for specific intended purposes and outcomes. DRM is nodifferent in that regard and consideration must be given to the types of softwarepackages for modeling, scenario development, information storage, and sustain-ability of these approaches when we make them available to technicalspecialists/practitioners. But the benefits of these geospatial approaches and tech-niques also should be enjoyed not only by technical specialists but also the otherstakeholders including the general public. All of them to a different degree shouldbe able to use them for analysis of the hazard environment, to assess the vulner-abilities and risk, as well as to plan for responding to early warning systems,prepare better and to mitigate the impacts of disasters. For that more investmentsneed to be made in the area of data generation, development of key information,facilitate sharing, capacity building, and to promote wide utilization of relatedgeo-information in disaster-resilient development.
1.1 Current State of Play and ADPC’s Regional Role
Over the last 10 years, significant progress has been made in developing institu-tions, policies, and legislation for disaster risk management, especially in the LowerMekong region. Further, capacities for risk assessment and identification, disasterpreparedness, response, and early warning capacities and in reducing specific riskhave been significantly strengthened through robust institutional development andgovernance structures. Despite these advancements, the DRM community in theLower Mekong will still need to learn how to use and integrate the best availablespatial technologies and Earth observation data for creating disaster-resilientdevelopment. The region continues to rapidly develop and take advantage of itsnatural resources, cheap labor, and newly founded economic community.
ADPC’s programs are being developed in support of the above needs and metingpriorities of the national and local Governments of the region. ADPC has developedand delivered the Strategy 2020 in year 2011 during its 25th anniversary celebra-tions to present its approach for attending to regional needs and addressing gaps.The ADPC strategy 2020 has been constituted under three core programmatic areasof focus (Fig. 1), founded upon ADPC’s comparative technical advantage, as wellas the results and outcomes that could be expected and would be needed for disasterrisk reduction (DRR) and climate change adaptation (CCA), over the next decade.The ongoing three core programs areSCIENCE—Enhanced capacity of countries in utilization of science-based infor-mation to understand risk.SYSTEMS—Strengthened systems for effective management of risk at all levels incountries, especially at subnational and local levels.
Integrating Earth Observation Systems and Data … 65

APPLICATIONS—Improved and grounded application of risk reduction measuresin development.ADPC programs are designed to encompass a wide diversity in application, adopta multi-hazard approach, and cover all aspects of the risk management spectrum. Thecore programs that will be implemented under the above strategy (during 2012–2020) are focused on “Investing in People” and pursue a broad scientific approach torisk reduction, engrossed with unmet needs of sustainable development and povertyreduction, driven with an overall aim of safer communities and sustainable devel-opment through DRR in accordance with the United Nations MillenniumDeclaration and the Millennium Development Goals (MDG) and the SendaiFramework for Action (2015–2030). It encompasses “Gender Equality andWomen’s Empowerment” by addressing inequalities and promoting women’s rightsas well as inclusiveness of all vulnerable groups in society.
The objectives of ADPC’s core programs to provide targeted, sustained, tech-nical support, and services to the Asia Pacific region in DRR, CCA and develop-ment are echoed in many of the regional support strategies and priorities ofdevelopment partners.
1.2 Key Challenges
Geo-information, especially those related to hazards, vulnerability, and risk, are notwell-integrated or mainstreamed into the spatial planning process. Those profes-sionals and policy makers mandated by Government institutions to take on land-use
Fig. 1 ADPC coreprogrammes
66 D.J. Ganz et al.

planning and implement sustainable development will need to develop a harmo-nized approach to apply hazard and risk knowledge for risk mitigation throughintegrated spatial planning, especially in a highly risk-prone region like the LowerMekong. This has developed in a number of DRR subdisciplines or fields, such asIntegrated Fire Management, but more emphasis is needed to apply geospatial andEarth observation data when designing multi-hazard resiliency strategies and adoptmore holistic and integrated land-use planning. Similarly, very limited research hasbeen carried out to assess the relationship between the cascading effects of landcover changes with hydro-meteorological hazard occurrence and the subsequentlong-term impacts on the environment, especially through the loss of ecosystemservices. These are significant challenges facing the integration of geo-information.
Recent scientific advances in satellite technologies and the availability of spatialand Earth observation data and products are still not well understood by the vastarray of stakeholders in the Lower Mekong region. There is significant demandfrom these stakeholders/end users for this kind of information, especially in theform of decision-support tools for applying new science to a fairly well-disciplinedfield such as DRR. There is an understanding that the science exists but varyinglevels of awareness on how it can be applied to different decision contexts. There isalso a varying level of understanding of technical matters within the governinginstitutions of the Lower Mekong, often prompting a response by donors andNGOS to develop capacity building programs and follow-up trainings. Moreemphasis needs to be given on capacity building and transfer of knowledge fromthe national level to subnational levels as well as down to the community levels. Inorder to get this kind of information to end users at the subnational, district,commune, and village levels, much of the capacity building materials needs to betranslated in the national languages and sometimes even in the local dialects.Training of trainers is needed to help disseminate these capacity building programsto the appropriate end users.
The implementation of risk management measures such as disaster preparednessplanning, safer land-use planning, regulatory zoning, weather forecasting, and earlywarning systems are needed to be considered essential components in sustainabledevelopment in the Lower Mekong subregion. Related vulnerabilities and risks,whether it be to dam infrastructure, irrigation, and transportation infrastructure,have not been integrated or mainstreamed into the investment planning process bythose mandated to review cost benefits of these projects within Lower Mekonggovernment institutions. Subsequently, there is no legal basis or institutional pro-cess to review the added costs or avoided costs of building infrastructure in areas ofhigh vulnerability and risk. If hidden costs or benefits are not fully accounted for,people will tend to make uninformed choices leading to inefficient outcomes andunsustainable development. The geospatial community must continue to advocatethe use of the best available information in investment planning and build inresiliency measures with a triple bottom line approach, or just avoid the hiddencosts of disaster relief and recovery, and be explicit to these Lower MekongGovernment institutions how these benefits from sustainable development are in thebest interest of all involved.
Integrating Earth Observation Systems and Data … 67

1.3 Other Potential Challenges
• Weak capacities in government institutions that inhibit them from takingadvantage of the opportunities offered by the space community, including lackof skills of staff, inadequate hardware, and software to process satellite imagery,as well as lack of access to high-resolution satellite imagery due to its high cost;
• Poor coordination among stakeholders at the national level to make use of Earthobservations (EO);
• Weak cooperation and coordination among international and regional organi-zations involved in Earth observation when it comes to assisting countries tomake use of Earth observation in efforts focusing on disaster risk reduction.
2 Future Directions
2.1 Measuring and Accounting for Ecosystem Services
Analyzing extensive risk highlights a key development challenge of our time: howto strengthen risk governance capacities fast enough to address the rapidlyincreasing exposure of population and assets that accompanies economic growthand recognizes the values associated with functioning ecological systems.Extensive risk exists wherever development occurs, and risk drivers such as badlyplanned and managed urbanization, environmental degradation, and povertydirectly construct it. Extensive disaster losses and their impacts on health, educa-tion, structural poverty, and displacement go unaccounted for in the Lower Mekongsubregion, hiding the real cost of disasters. The actors involved in Lower Mekongdevelopment remain unconcerned about ecosystems due to inadequate under-standing of the connection between ecosystems and life-threatening disasters. TheLower Mekong region also harbors some of the world’s most diverse yet threatenednatural systems in the world. Rapid and unsustainable economic development isthreatening the integrity and continuity of high priority conservation landscapes inthe region. A challenge facing the region’s governments therefore is how to developtheir economies sustainably and equitably while at the same time conservingecosystems and their services upon which our societies and economies are built. Todo this effectively and to enable countries to make the transition toward a ‘greeneconomy,’ one significant piece of missing information is the value of naturalcapital—the stock of natural assets (land, water, biodiversity) that supports theprovision of ecosystem services (WWF Living Planet Report 2014)—and anunderstanding of how these values are to be mainstreamed into developmentplanning, DRM, and other public policy as well as local business decisions that areoften driving land-use changes.
The undervaluation of ecosystem services poses a major problem to effective,equitable, and sustainable conservation and development decision making,
68 D.J. Ganz et al.

especially in the Lower Mekong subregion. Because economists and the DRMcommunity have traditionally focused on the value of commercial land and resourceuses as well as traditional damage/loss assessments, some of the most valuableecosystem services and the true costs of disasters have remained hidden, unac-counted for in infrastructure and post-disaster assessments. As a result, decisionshave often been made on the basis of incomplete and flawed information—and,unsurprisingly, ecosystem resilience and biodiversity conservation have typicallynot emerged as a profitable land, resource, or DRM investment option. This has, inturn, resulted in missed economic opportunities, and at worst has incurred sub-stantial costs and losses.
ADPC has recognized the need to incorporate ecosystem resilience in its DRMstrategies. It has begun to support officials at the national and subnational levels toenhance their existing knowledge on ecosystem management and restoration ofdegraded ecosystems. Enhancing weather and climate data utilization and intro-ducing new technological interventions are critical in order to mitigate undesirableimpacts within the ecosystem, especially the flow of ecosystem services for DRMapproaches like maintaining natural floodplain and watercourses that feed intodeltas and mangrove ecosystems. Space-based information not only providesinformation on extent of ecosystems, but also provides much insight into thedynamics and health of these ecosystems. Geospatial information can be analyzedin conjunction with the field-based information at all functional levels includingbiospheres, biomes, landscape, ecosystems, habitats, and communities. As a tool, itmay be used to monitor remote and difficult areas such as highlands and steepslopes, where the role of ecosystem is often critical for downstream impacts. Thereare also a number of advanced sensors which now provide the capacity to monitorecosystems on a more frequent basis (i.e., return intervals and higher resolution).
The Lower Mekong countries—along with the international community, regio-nal civil societies, the DRM community, and private sector actors—recognize thatthe invisibility of natural capital risks unsustainable economic development in thelong term because of the high likelihood of loss of critical benefits that natureprovides and the lack of linkages between these critical benefits and disaster pre-paredness. To ensure more informed decisions for sustainable development aremade, an important next step is to help Lower Mekong government institutions, theDRM community, and private sector actors to collect, map, and generate infor-mation on natural capital stocks and flows as well as their impact on climate changeresilience and disaster mitigation. In this context, there is a need for increased andimproved use of decision-support tools and capacity that
• Integrates ecosystem protection with developmental planning to ensure thatecosystems remain balanced and robust, and development is resilient to disastersand climate change;
• Uses the best available Earth observation data to identify and monitor whatecosystem services are generated in key ecosystems in the Lower Mekong;
Integrating Earth Observation Systems and Data … 69

• Provides Lower Mekong government institutions, the DRM community, andprivate sector actors with the socioeconomic value of these services to localpopulations, national, and regional economies;
• Uses the best available Earth observation data to provide insights on howecosystem services may be affected, including trade-offs between ecosystemservices and economic return, by different policy interventions (e.g., land-useplanning, improved forest management regimes), risk events like climatechange, flooding, drought, and/or the immediate business decisions that need tobe taken to balance these trade-offs using a comprehensive accounting frame-work (such a triple bottom line accounting).
It is this data generation and subsequent mainstreaming which will help facilitate atransition within Lower Mekong to a green economy and support the restorationand maintenance of the region’s natural capital.
2.2 Measuring Urban Resiliency
Healthy communities are the basis of our physical, mental, and social well-being.And the core foundation of healthy communities is a healthy environment andlifestyle security. For hundreds of millions of people whose livelihoods dependdirectly on the resources and services that nature provides, the link is obvious.Southeast Asia’s economic rise is being fueled by the booming growth of its cities.Today, just over one-third of ASEAN’s population lives in cities, and these urbanareas account for two-thirds of the region’s GDP. More than 90 million people areexpected to move to cities by 2030, bringing the urban share to almost 45 % of thepopulation and 76 % of GDP (ASEAN Community 2015). For the ever-growingnumber of people who live in cities, increasingly detached from the natural world,the importance of healthy ecosystems may not be so immediately apparent—andyet the effects of environmental problems can be just as striking, from air and waterpollution to extreme weather events.
The global population landscape has changed in the past decade. For the firsttime in history, the majority of the world’s population lives in cities, with urban-ization growing fastest in the developing world. Statistically, this is the result ofnatural growth, rural–urban migration and reclassification of rural to urban land(Buhaug and Urdal 2013). The urbanization trend in the Lower Mekong has a lot todo with environmental security, resource scarcity (farming and grazing lands,forests, and water), environmental degradation, frustration with reliance onincreasingly unpredictable natural systems, and natural hazards all pushing peopleto leave behind their rural settings in search of greater livelihood and lifestylesecurity. This in turn has significant consequences for the health of the cities thatabsorb them.
The majority of the world’s population lives in cities with urbanization growingfastest in the developing world. This trend has a lot to do with environmental
70 D.J. Ganz et al.

security: resource scarcity (farming and grazing lands, forests, and water), envi-ronmental degradation, frustration with reliance on increasingly unpredictablenatural systems, and natural hazards all pushing people to leave behind their ruralsettings in search of greater livelihood and lifestyle security. This in turn hassignificant consequences for the health of the cities that absorb them.
Since 1995, ADPC has been working in the field of Urban Disaster Preparednessacross Asia and the Pacific. While the urban areas in Asia are rapidly expanding sohas the associated urban disaster risk. With a goal to address challenges associatedwith increased urban risk and sustainable development, ADPC is working with therespective cities to develop future resilience by assisting cities and its communitiesto quickly identify challenges and gaps needed to ensure greater resilience is builtup at the local level. ADPC has also developed a robust set of specific indicators tomeasure the resilience at this local level. Measures of urban resiliency and the stockand flow of ecosystem services in a city environment may be built into a citygeospatial database if city planners and regulators can see the power and applicationof these types of datasets. With the development of these indicators and geospatialdatasets, ADPC also utilizes a methodology to measure the effectiveness of pastprojects, namely in Mandalay City, Myanmar and Dhaka City, Bangladesh (pre-sented in the case study below), building upon risk-sensitive, urban land-useplanning and contingency planning. Following this analysis, ADPC and Cityauthorities are able to integrate the lessons learned from this methodology into anyupcoming and future DRM project design allowing for flexibility in how urbanDRM is applied dependent on available financial resources, available data relatingto hazards and its population, and institutional capacity of a given city. Based ontheir identified needs and priorities, City governments may select the most appro-priate level of risk assessment as well as design DRM strategies that arecost-effective, building upon the strengths of the existing institutional capacity. Theintegration of geospatial data will certainly assist in developing a risk-informedurban society and build awareness to the prevailing risk environment. However,more investments will be needed in the area of urban resiliency data generation,indicator tracking, capacity building, and data sharing to promote wide utilizationof related geo-information in urban disaster-resilient development. In this context,there is a need for increased and improved use of decision-support tools andcapacity that
• Uses the best available Earth observation data to identify and monitor urban riskthrough better urban resiliency data generation;
• Defines growth patterns and reviews existing land-use and zoning plans basedupon new information, in particular areas with high risk;
• Builds upon existing metrics and urban parameters such as impervious surfaces,land surface albedo, land surface emissivity, land surface temperature, and landcover/land use;
• Contributes toward the establishment of a global data infrastructure for urbandata and products. GEO is developing the architecture, data management policy,data portals, software, and tools needed to improve global coverage and data
Integrating Earth Observation Systems and Data … 71

accuracy of urban observing systems through integrating satellite data observedfrom multiple platforms/sensors and different resolutions, with in situ data; and
• Provides well-designed scenarios for urban growth where outputs can improvethe adaptation and resiliency of urban society even in a context whereweather-related disasters may increase in frequency and impacts due to climatechange.
It is this data generation and subsequent mainstreaming which will help facilitate atransition for Lower Mekong cities to move toward urban disaster-resilientdevelopment.
3 Case Studies
3.1 Natural Hazard Risk Mapping and ImprovedPost-disaster Recovery in Lao PDR
In September 2009, Typhoon Ketsana ravaged Lao PDR’s southern provincescausing widespread destruction, affecting more than 180,000 people. Twenty-eightstorm-related deaths were reported. It was the first time Lao PDR had experienceddisasters of this magnitude with losses to life and livelihoods.
Two years later, Typhoons Haima and Nokten (June 2011) hit the northern andcentral parts of Lao PDR causing serious erosion and landslides from heavy rainand flooding. Some of the most important infrastructures were severely damagedincluding the irrigation system, roads, bridges, hospitals, and schools. Again, thesetyphoons had a direct impact on local people’s lives and livelihoods, and signifi-cantly disrupted the delivery of public services.
Because of these typhoons as well as other natural hazards in Lao PDR, UNDP—with technical support of ADPC—initiated a project to assess and map outvarious hazards and their corresponding risks including those from floods andlandslides for the entire country. Through a series of geospatial analyses, the resultof that initiative was presented as maps where the areas of varying levels of hazards(e.g., flood depth and the area’s susceptibility to landslides) and risk (the conse-quences on the people and assets) were demarcated. These maps helped the gov-ernment of Lao PDR in identifying risk-prone provinces where risk mitigationactivities should be prioritized. Figure 2 illustrates the national landslide suscepti-bility map for Lao PDR.
Learning that certain provinces are more prone to floods and landslides than theothers, the Ministry of Planning and Investment (MPI) of the Government ofLao PDR, with support from the World Bank and technical assistance of ADPC,took an initiative to further the study to detailing out possible impacts of thosenatural phenomena on important infrastructure sectors such as irrigation and roadsin selected pilot provinces. The outcomes of this initiative were aimed at main-streaming disaster risk information into public infrastructure investments by the
72 D.J. Ganz et al.
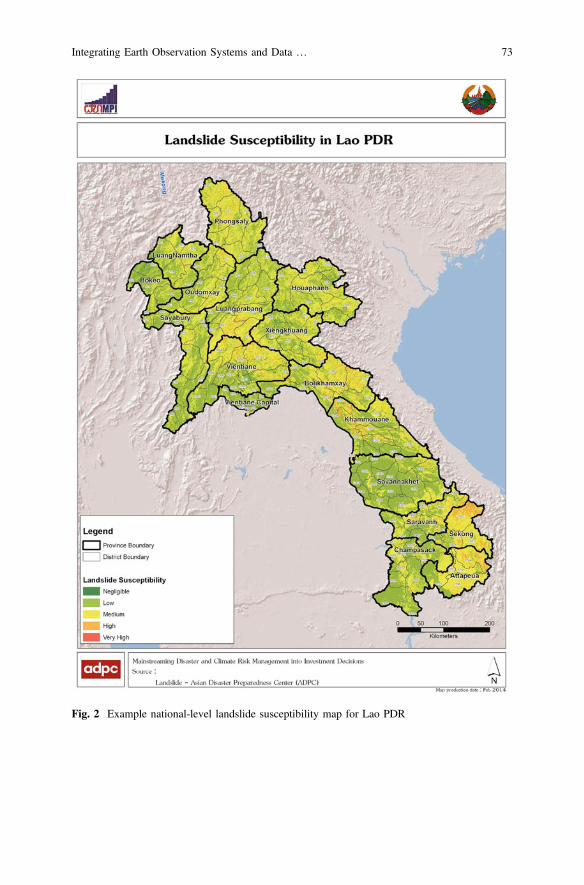
Fig. 2 Example national-level landslide susceptibility map for Lao PDR
Integrating Earth Observation Systems and Data … 73

Ministry of Agriculture and Forestry (MAF) and the Ministry of Public Works andTransport (MPWT)—the project’s governmental partners, thereby reducing thevulnerability of the provincial and national economy to natural hazards.
The project determined, based on the national mapping initiative, that Bolikhandistrict, Bolikhamxay Province, and Beng district, Oudomxay Province, are thepilot districts for detailed evaluation of the risk and its applications for informedinvestment decision. Assessments of the frequency, severity, and geographicallocation/coverage of floods and landslides were carried out for the two pilot dis-tricts, the results of which were displayed as maps in a GIS environment (Fig. 2).
Assets that would be at risk from future floods and landslides such as roads,bridges, irrigation head works, and rural houses in the two districts were added to ageospatial database, containing information not only on the location, but also theattributes of each asset type. By doing so, it allowed straightforward geospatialanalyses with the hazard intensity layers. Moreover, it will allow the provincial/district-level agencies to maintain and update the data with ease in the future.
Before this initiative by MPI, the World Bank, and ADPC, the occurrences oflandslides were not recorded in a systematic manner in Lao PDR. Whether it ismajor or minor road systems, there were rarely any proper assessments or subse-quent slope stabilization measures taken to improve the stability of the slope. Oneof the project objectives was to address this issue. ADPC worked closely with theLao PDR government to develop an inventory system using GIS that could easilyrecord landslide data and demonstrate the level of vulnerability for decision makersto take appropriate decisions on road improvements, reconstruction, and rehabili-tation of damaged areas. It was estimated that landslide and road repairs may reachas high as 50 and 80 % of annual emergency maintenance costs (Hearn et al. 2008a,b). During some years, this can amount to direct cost of $5 million USD annuallyfrom emergency road and irrigation maintenance budgets (SEACAP 2008).
The developed geospatial framework for documenting these landslides and slopefailures also went so far as to document the roles and responsibilities of differentlevels of the Department of Roads (DoR) in inventory preparation, data storage, andsharing as well as in follow-up interventions, utilization of inventory data inmanaging a reliable road transportation system in Lao. The geospatial inventory hasprovided the Government of Lao PDR to analyze the vulnerability and risk of itstransportation and irrigation systems in a systematic way so that they may takeappropriate decisions in a timely manner. This has in turn facilitated risk-aversedecision making that takes on suitable proactive measures that are taken in a timelyand cost-effective manner to reduce disruptions to the transportation network due tolandslide occurrences.
Inevitably, tropical storms and flooding will continue to affect various govern-ment sectors in Lao PDR and especially susceptible areas like KhammouaneProvince. Many people, especially the poorest, their livelihoods, properties, andassets are directly affected by these natural and man-made events. The ProvincialGovernment in Khammouane Province has identified the need to boost its capac-ities for post-disaster recovery and reconstruction relating to damage and lossassessment, institutional and financial arrangements, disaster-resilient investments,
74 D.J. Ganz et al.

and project management. The Khammouane Department of Planning andInvestment, through the Khammouane Development Project, was supported by theWorld Bank to provide technical services for institutional development and capacitybuilding activities for post-disaster reconstruction in the province.
ADPC has been working closely with the World Bank and the Government ofLao PDR to enhance existing provincial and district-level institutional arrangementsfor post-disaster reconstruction. This has been accomplished by developing clearguidelines and procedures that estimate the post-disaster damages, losses, and cor-responding needs of the various sectors affected. Ultimately, the ProvincialGovernment must have the capacity to respond swiftly to the impacts of a disaster sothe community and local economy can recover quickly. This includes the ability touse geospatial information in successful post-disaster planning and reconstruction.
APDC’s work in Khammouane Province is distinctive from other projects inwhich it provides support specifically to the subnational levels while fully alignedwith national-level arrangements. It is ADPC’s experience that much of thegeospatial information used for post-disaster reconstruction is held primarily at thenational level. This geospatial information is critical for the post-disaster recon-struction, especially for performing damage and loss assessments, institutional andfinancial arrangements, disaster-resilient investments, and project management atthe Provincial and District levels. In this Laotian context, ADPC has found that therelationship between the Provincial and District levels is really the critical catalystfor post-disaster reconstruction to be successful. The investments can only besustainable if the responsibilities, functions, and procedures are well understood bythe relevant authorities. ADPC’s technical assistance in Khammouane Provinceforms a key component of its mission to reduce disaster and climate risk impacts oncommunities and countries in the Lower Mekong subregion by working withgovernments, development partners, and key stakeholders at multiple levels. Keylessons learned from ADPC’s interventions in Lao PDR include
• Geo-information related to flood and landslide hazards, related vulnerabilitiesand, risk to irrigation and road sector infrastructure have not been integrated ormainstreamed into investment planning process by professionals attached to themandated Government institutions. Hence, there is no legal basis or institutionalprocess to continue utilization of such information in investment planning.
• The road sector engineers find it difficult to follow the methodology providedfor inventorying landslides in the road network although several training andcapacity building programs have been organized to transfer the knowledge.A similar situation has been observed in generating flood return period maps forsome of the minor catchments. Further interventions are needed for betterknowledge transfer to these sectors.
• Certain efforts are essential to be undertaken for developing data sharing pro-tocols, data standardization, and also to develop a common data sharing plat-form for DRR-related information in future. One mandated institution should begiven the responsibility for creating enabling environment for data collection,storage, and sharing with other agencies.
Integrating Earth Observation Systems and Data … 75

3.2 Improved Earthquake Risk Assessment and RiskReduction Strategies in Bangladesh and Mandalay City,Myanmar
The use of GIS and Remote Sensing (RS) technology in DRM is extremely ben-eficial because spatial methodologies can be fully explored throughout a riskassessment process. The risk assessments for DRM to be designed and functionproperly must be carried out at different scales of analysis, ranging fromregional/national scale to the community level. Each of these levels of analysis hasits own objectives and spatial data requirements for hazard inventories, exposurecoverage of elements, environmental data, and dependent and independent factorsto consider that will trigger additional downstream and/or post-disaster effects. Costeffectiveness, speedy delivery, and data accuracy are some of the key advantages ofusing GIS-/RS-based tools and geospatial products for DRR decision making uti-lizing integrated risk information. Due to the possibility of generating alternativescenarios in a spatial context, the Government authorities will have the advantagefor taking best and cost-effective solutions in reducing the risk while maximizingtheir investments in DRM strategies.
Unfortunately, the development and utilization of risk information fordisaster-resilient urban development is not widely practiced in Asia, especially theLower Mekong region. The use of GIS and RS technology is especially applicablewhen conducting risk assessment in large cities, where the level of detail isinherently needed to capture the heterogeneity. Comprehensive building andinfrastructure databases are needed for exposure surveys and well-integrated, vul-nerability assessment surveys. If city-level risk information can be provided inopen-access formats which can used and understood not only by professionals butalso the general public, then urban development and risk reduction decision makingwould become an open and transparent process. Therefore, there is tremendousvalue in providing risk information using a geospatial platform that people can useand understand easily. Spatial visualization of risk information within the city willhelp authorities to identify geo-political areas, population, infrastructure, sectors ofthe economy, and vulnerable members of civil society (elderly, handicapped, youth,etc.) that will be impacted by a pending earthquake event. This also allows forestimating the value of physical damages, economic losses, and reductions inecosystem services arising after a potential earthquake event.
A widely used application that has been tested extensively by ADPC is theintegration of GIS and RS Earth observations into earthquake hazard and riskassessments. This was conducted for nine large cities including Dhaka, Bangladesh,and Mandalay City in Myanmar. In this case study, we describe how this Earthobservation data can be used to
• help city authorities to define the growth patterns in the city and reviewingexisting land-use plans based upon new information, in particular areas withhigh potential risk;
76 D.J. Ganz et al.

• analyze the factors which enhance the futuristic risk and to take appropriatemeasures to introduce risk-sensitive land-use planning regulations, including butnot limited to;
– siting, design, and construction of public and private structures consideringearthquake and other associated hazard risk (such as landslides, liquefaction,subsidence, etc.),
– guidelines for earthquake resistant buildings suggesting improvements to thequality of buildings via building codes and best practices, and
– retrofitting solutions and safer construction practices in high-risk zones;
• assist city authorities to monitor and enforce various land-use policies, espe-cially building standards and codes. This may include enhancing policies andsystems for quality assurance;
• provide a baseline to monitor trends in changes of environmental conditions,climate change impacts, and impact from climate sensitive hazards; and
• analyze vulnerability considering the aspects of gender, culture, livelihoods, etc.and take appropriate measures in reducing the vulnerability of those traditionallyvulnerable groups.
Spatial databases were developed for nine Asian cities including the base maps forconducting the hazard and vulnerability assessments, comprehensive risk assess-ment, and scenario-based contingency planning in electoral wards. These spatialdatabases for each city have first considered which physical features are mostimportant to collect. Based upon the availability of existing data and baselineinformation on these respective cities, ADPC designed an appropriate andcost-effective methodology to acquire missing information by conducting physicalfeature surveys and collecting and verifying necessary attribute information.
In Myanmar, ADPC carried out a seismic hazard and risk assessment forMandalay City, the country’s second largest city. The assessment involves exten-sive use of geospatial information that includes the high-resolution satellite datasuch as Corona, Geo-Eye, IKONOS, and World View 2 which helped experts toextract information on building footprints, infrastructure, geo-morphological fea-tures, etc. for earthquake hazard and risk assessment. Space-based geodetic mea-surements using the Global Positioning System in synergy with ground-basedseismological measurements, interferometric data, and high-resolution digital ele-vation models as well as imaging spectroscopy were all used effectively to developseismic hazard and risk assessments. The same approach for this kind of seismichazard and risk assessment in Mandalay City was used for cities of Bangladesh withthe Comprehensive Disaster Management Program (CDMP), under the Ministry ofDisaster Management and Relief. Earthquake indicators that may be detected fromspace were also observed using ground-based monitoring stations. These includefactors such as surface deformation, land surface changes, and geo-morphologicalfeatures such as land form changes, electromagnetic and ionospheric anomalies inthe fault-line areas, as well as seismicity. Multispectral and multi-temporal satellite
Integrating Earth Observation Systems and Data … 77

images were analyzed for building continuity and regional relationships of activefaults as well as for geologic and seismic hazard mapping.
QuickBird images of the cities were used to demarcate physical features such asthe road alignment, building outline, water body boundary, and river boundary.However, the maps generated here were still missing information that would becritical for the earthquake risk assessment process, but could not have been gatheredthrough remotely sensed techniques. As a result, a field data collection and veri-fication process was introduced. Each of the digital features would need a set ofattribute data that would dictate its risk to earthquakes. Those information includethe number of floors in a building, construction materials, structural weak points,the number of bridge spans, bridge type, and road surface materials, for examples.Base maps for those cities can be considered complete for use by the risk assess-ment specialists only after these attribute information could be added to thegeospatial database. These city-level base maps are useful not only for riskassessment purposes, but city officials can also use them for non-disaster relatedpurposes such as monitoring the progress of collection of taxes and revenues, anddesigning public service facilities (such as water and electricity distribution, gar-bage disposal, impervious surfaces, drainage/storm drain runoff and releases,transportation, and school design). As previously discussed with issues that willneed to be addressed in future Earth observations, measures of urban resiliency andthe stock and flow of ecosystem services in a city environment may also be builtinto a city geospatial database if city planners and regulators can see the power andapplication of these types of datasets.
The steps followed during base map preparation are given in detail within Fig. 3.The final outputs of the initiative for assessing earthquake risk in these cities are
hazard and risk maps that would inform city officials and DRR practitioners on the
Fig. 3 Base map development process using QuickBird images
78 D.J. Ganz et al.

areas in the city that is prone to damage caused by earthquakes. Estimated damagesto buildings, roads, bridges, pipelines, as well as the number of casualties and itsgeographical distribution across the cities were illustrated. Figure 4 shows anexample of the risk maps showing damage expected on concrete buildings inMandalay City of Myanmar.
The main beneficiaries of geospatial information related to earthquake risk arethe city authorities who are supposed to make major decisions on sustainable urbandevelopment investments in order to develop safer and resilient urban habitat andinfrastructure. The city residents and other migrant populations to the city alsobenefit directly and indirectly from this type of baseline assessment. In theory, theyshould have access to better information and potentially relocate to live within saferenvironments (either outside of a high-risk zone or within buildings that are built toappropriate building standards). Therefore, it is critically important for cityauthorities to take steps to communicate this geospatial risk information and allassociated issues to the communities, disaster management practitioners, privatesector, and all vested stakeholders, whether they are part of the tax base or justvulnerable populations living within high-risk areas.
Typically, when city authorities introduce revisions to their legal and institutionalmandates and/or jurisdictions, they will include developing risk managementschemes and plans as a part of safer urban development planning process. Duringthis planning process, Government institutions may also give priority to the high-riskareas with the greatest potential for loss of lives and/or economic damages.Quantitative inputs from risk assessment utilizing Earth observation data providecity authorities with critical information to define changes or modifications to publicpolicies to minimize disaster impacts. Prime examples can be drawn from the case ofthe earthquake risk assessment initiatives in Myanmar and Bangladesh. The city ofMymensingh, Bangladesh, benefited from being one of the cities that is equippedwith geospatial earthquake risk information, had taken another important step toapply such information into its formal urban planning procedure. This was donethrough careful engagement of stakeholders to review the hazard and risk infor-mation and existing policies before making a proposal to demarcateearthquake-prone areas into the Strategic Development of the city. Similarly, inMyanmar, the outcomes of the earthquake risk assessment of Mandalay City wasincorporated as examples in the Guidelines for Integrating Disaster Risk Informationinto Urban Land Use Planning in Myanmar, which was accepted by the Ministry ofConstruction, Myanmar, as a framework for future planning decisions (Fig. 5).
The geospatial risk information developed in these nine cities will serve as thebaseline for monitoring the progress of risk reduction interventions undertaken.Risk information also serves to define the city government’s capacity to meet itsown post-disaster needs and address these by identifying the external assistanceneeded to respond in the case of devastating earthquake event. This would includedefining the financial needs and priorities for economic recovery and reconstruction
Integrating Earth Observation Systems and Data … 79

Fig. 4 Earthquake risk map for Mandalay City: distribution of damage expected on concretebuildings in the city
80 D.J. Ganz et al.

in case of such an event. High-impact earthquake events usually create emergencyneeds within the city to treat the injured, dispose of the dead, provide temporaryshelter to the affected population, and organize the provision of food, water andother important logistics for immediate relief as well as economic recovery andreconstruction. Risk information will help city authorities to identify these needsand develop a well-integrated earthquake response mechanism that includes theproper coordination among all city jurisdictional levels (city, wards, individualinstitutions, community institutions, institutions addressing vulnerable populationssuch as the elderly, etc.).
Therefore, given the spatial implications of the impact of earthquakes, incor-porating spatial analysis based on hazard and vulnerability mapping into thescenario-based contingency planning process is also essential. It allows plannersand emergency managers to look at risk and potential impact as per the emergencyclusters and identify cluster needs/gaps/challenges. The inclusion of spatial plan-ning during the contingency planning process also promotes an integration ofdisaster preparedness into long-term physical planning to make sure the clusterlevel requirements are met during the long-term city planning.
Fig. 5 Vulnerable housing in Mandalay City
Integrating Earth Observation Systems and Data … 81

4 Conclusions
Developing a geodatabase inventory structure ensured the integration of Earthobservation solutions into traditional approaches for assessing seismic hazard andlandslide occurrences. Effective utilization of GIS and remote sensing data forearthquake disaster risk management-related decision making and scenario-basedcontingency planning was carried out for the first time in numerous cities.Developing an accurate database consisting of large number of building footprints,infrastructure, lifeline, and service facilities for cities like Chittagong, Dhaka,Sylhet, and Mandalay required research and development in many areas, includingdata collection, structuring, and field verification of comprehensive set of spatialdata. Similarly, database development for landslide occurrences in Lao PDR hasbeen transformative for local governments that needed institutional strengthening torespond swiftly to the impacts of a disaster so that community and local economiescan recover quickly. This includes the ability to use geospatial information insuccessful post-disaster planning and reconstruction. In both contexts, incorporatinggeospatial and Earth observation information into hazard and vulnerability mappingallowed Governments to consider scenario-based contingency planning. In theLower Mekong, which has seen its share of weather-related disasters, this kind ofintegration has allowed planners and emergency managers to look at risks, potentialimpacts, and identify needs and gaps in all aspects of the risk management spectrum—starting with prevention and mitigation, through preparedness and response, torehabilitation and reconstruction.
There are many different actors involved in the DRM process at local, national,regional, and international levels. Their capacity to integrate technology andinformation changes on a geographic and development basis, and their differentmandates determine the nature of their varying needs for data and information.
No single organization or government has a responsibility to meet internationalrequirements for satellite-based DRM data. Working with user organizations toidentify resources to leverage initial ‘in-kind’ contributions of data, the internationalcommunity can make meaningful progress toward increasing the use of Earthobservation data in DRM. This may enable the purchase of commercial imageryand ultimately increase the number of satellites designed and built to support DRM.It is also clear from the texts of agreements such as the UNFCCC or other relatedconventions on biodiversity and desertification that satellite data can help todevelop a wealth of information to address monitoring and verification needs, notjust for disasters but the underlying conditions that lead to decisions that impact theway disasters are addressed. The United Nations agencies are planning for thepost-Sendai framework (United Nations 2015) with renewed emphasis on concreteactions to implement the recommendations. In this new framework, satellites andEarth observation data will play a critical role, particularly in reducing the under-lying risk factors and strengthening disaster preparedness for effective response.Satellite data can supply regular, detailed updates on the status of hazards on aglobal, regional, or national basis. The Lower Mekong is an important place for
82 D.J. Ganz et al.

such regional data to be consolidated to assist the transition to a green economy andsupport the restoration and maintenance of the region’s natural capital.
Reducing the severity of disasters requires the integration of observations,exploiting predictive modeling, and disseminating timely and accurate informationneeded by all actors involved in response and risk mitigation. The implementationof risk management measures such as disaster preparedness planning, safer land-useplanning, regulatory zoning, weather forecasting, and early warning systems areneeded and should be considered essential components for sustainable developmentof the Lower Mekong subregion.
Earth observation’s contribution to the provision of refined risk assessmentincludes up to date localization and characterization of the asset at risk; informationto support prevention plan elaboration; supporting anticipation (such as weatherforecasting and early warning systems); as well as crisis management operations(rescue, recovery) and to help understand the resulting environmental damages,ecosystem services, and natural recovery mechanisms better.
It is true that many of the current generation of satellite systems were notdesigned specifically for DRM activities; however, the rapid pace of technologyadvance has led to the launch of increasingly flexible and powerful systems. Thesemissions are now multipurpose and offer exceptional coverage and scope. Takencollectively, the world’s satellite systems offer a unique tool for DRM. Forexample, the requirements of disaster management centers concerning plain floodhazard have been gathered in consultation with national civil protection authorities:reference mappings are needed within the day of the hazard impact, while rapidmapping of the flood extent is needed within a few hours or within a day, every day.Similar analysis has produced a characterization of requirements for other hazardtypes and other phases of DRM such as early warning—for a range of differenthydro-meteorological or geophysical hazards—situational awareness during andafter disasters, precise damage assessment, and support to recovery andreconstruction.
DRR depends on concrete measures put in place at the community level byinformed national and local authorities (ministries of interior, environment,development planning, land use, agriculture, river basin administrations, mayors,civil protection, etc.). DRM work relates to different aspects of development andterritorial management that concern a variety of domains such as water, sanitation,habitat, transportation, and energy. They are managed by different types of orga-nizations with mandates attached to a specific domain, like basin authorities lookingat hydrological risks, and geologists and road engineers looking at geohazards suchas landslides. Beyond local and national actors, international development orga-nizations are increasingly more involved in development programs with riskmanagement components. As DRR activities are increasingly undertaken withnational and regional users (such as the Mekong River Commission), through thesponsorship and guidance of international players (international financial institu-tions such as the World Bank or development agencies such as the UNDP andUSAID), the uptake of new systems and satellite-based data in operational supportto disaster management will certainly increase. There is nothing planning can do to
Integrating Earth Observation Systems and Data … 83

reduce the number and severity of hazards. Nonetheless, the integration of relevant,timely, and comprehensive EO datasets into disaster mitigation activities will be thelargest factor contributing to reducing the loss of life and damage to property in theLower Mekong region. ADPC will continue to and further advance the use of EOfor improved disaster risk management both pre- and post-events, specifically ondisaster risk assessment, climate-related early warning, emergency response plan-ning, and post-disaster recovery, as well as an integration of EO and disaster riskreduction into future development planning. A better preparedness and systematicefforts toward risk reduction based on long-term development and environmentalconcerns will achieve the ultimate goal of achieving a green economy whilereducing the number and scale of actual disasters caused by hazards.
References
Asian Development Bank and the International Labour Organisation. (2014). ASEAN Community2015: Managing integration for better jobs and shared prosperity.
Buhaug, H., & Urdal, H. (2013). An urbanization bomb? Population growth and social disorder incities. Global Environmental Change 23(1).
Hearn, G. J., Hunt, T., Aubert, J., & Howell, J. (2008a). Landslide impacts on the road network ofLao PDR and the feasibility of implementing a slope management programme. In The FirstWorld Landslide Forum. Satellite Conference, Sendai, Japan, 11–12 Nov 2008.
Hearn, G. J., Hunt, T., Howell, J., & Carruthers, N. (2008b). Mainstreaming stabilisation trials tostrengthen slope management practices in Lao PDR. South East Asia Community AccessProgramme. Department for International Development (DFID), UK. Report SEACAP21-0042008 (p. 9).
SEACAP. (2008). Feasibility study for a national programme to manage slope stability. South EastAsia Community Access Programme. Department for International Development (DFID), UK.Final Report SEACAP21/002 (p. 41).
United Nations. (2015). Sendai Framework for Disaster Risk Reduction: 2015–2030 (p. 35).WWF 2014. Living Planet Report. (2014). Species and spaces, people and places. WWF
International, Gland, Switzerland (p. 180).
84 D.J. Ganz et al.

Land Cover Mapping for Green HouseGas Inventories in Eastern and SouthernAfrica Using Landsat and High ResolutionImagery: Approach and Lessons Learnt
Phoebe Oduor, Jaffer Ababu, Robinson Mugo, Hussein Farah,Africa Flores, Ashutosh Limaye, Dan Irwin and Gwen Artis
Abstract Africa is rich in natural resources including minerals, natural habitats andvegetation (African Bank 2007). However, these resources are under sustainedpressure from a population that is growing at a faster rate than anywhere else on theglobe (African Institute for Policy Development 2012). Substantial changes in landcover have been observed at national and local scales on the continent by variousstudies in the recent past. The rapidly growing population increases demand forfood and land for settlement, a challenge that is further compounded by climatechange. The effects of climate change make the African populace vulnerable tounpredictable weather patterns, floods, droughts and rising sea levels that threatenlow coastal towns. This chapter addresses the pressing challenges of environmentalmanagement and sustainability in Eastern Africa.
1 Introduction
1.1 Drivers of Land Cover Change in Africa
Africa is rich in natural resources including minerals, natural habitats, and vege-tation (African Bank 2007). However, these resources are under sustained pressurefrom a population that is growing at a faster rate than anywhere else on the globe(African Institute for Policy Development 2012). Substantial changes in land coverhave been observed at national and local scales on the continent by various studiesin the recent past. The rapidly growing population increases demand for food andland for settlement, a challenge that is further compounded by climate change.
P. Oduor (&) � J. Ababu � R. Mugo (&) � H. FarahRegional Centre for Mapping of Resources for Development, Nairobi, Kenyae-mail: [email protected]
R. Mugoe-mail: [email protected]
A. Flores � A. Limaye � D. Irwin � G. ArtisSERVIR Science Coordination, NASA Marshall Space Flight Centre, Huntsville, USA
© Springer International Publishing Switzerland 2016F. Hossain (ed.), Earth Science Satellite Applications,Springer Remote Sensing/Photogrammetry, DOI 10.1007/978-3-319-33438-7_4
85

The effects of climate change make the African populace vulnerable to unpre-dictable weather patterns, floods, droughts, and rising sea levels that threaten lowcoastal towns. One of the important characteristics of land cover changes inSub-Saharan Africa is the increasing areas under cropland and settlement, as well asdecreasing natural vegetation including forestland and bushland.
A number of studies on the continent’s ecosystems has shown similar land coverconversion patterns as well as driving forces. Mertz et al. (2007) identified wood-lands and dry forests as the least protected and thus most threatened ecosystems onthe continent, findings they attributed to population growth, climate change, as wellas weak environmental management and policy frameworks. Tropical deforestationis also caused by multiple factors and not just single variables (Helmut and Lambin2002). The wide spectrum of the key drivers is the combination of settlementexpansion, agricultural expansion, and wood extraction with distinct regional vari-ations. Again, most households in Africa remain unconnected to power grids, andtherefore the majority of them still rely on firewood and charcoal for energy, makingforest and grazing land more vulnerable across the continent (EIA 2009).
Researchon the interactive effects of poverty and rural population indicates that fastercropland expansion is attributed to poverty in densely populated rural areas (Nkonyaet al. 2013). On the other hand, the rapid rate of urbanization in Africa and Sub-SaharanAfrica in particular is explained by the rate of urban growth on the continent, which faroverwhelms the capacity and efforts bygovernments to deliver essential services such ashousing, water, education, electricity, health services, and waste disposal (AfricanInstitute for Policy Development 2012). The result is often overcrowded informal set-tlements. This is an area that requires extensive study, because the understanding ofchange trajectories and potential future scenarios is essential for a sustainable devel-opment strategy by any geographic region.While Africa has witnessed the largest forestloss over the past few decades than ever before (Nkonya et al. 2013), afforestation andother conservationmeasures in some countries have significantly reduced the net loss offorest area, and set the area under forest cover on the increase (FAO 2010).
Since the 1970s, satellite technology has enabled the monitoring of the earthfrom space. The continent of Africa has been receptive and supportive, studyingotherwise expensive or inaccessible areas often repeatedly. However, low tomedium resolution satellite images are often used, providing limited quantitativedata on land cover change (Bégué et al. 2011; Cabral et al. 2011). The continentstruggles to create a balance between simply sustaining a growing population, andinvesting in economic development.
1.2 The Challenge of an Increasing Carbon Footprintfor Africa
The total carbon emissions for Africa are still less than that of some developed andmiddle level economy countries like the United States, China, India, and Russia. Sincethe 1950s, Carbon emissions for Africa have increased 12fold, measuring 311 million
86 P. Oduor et al.

metric tons of Carbon in the year 2008 (Boden et al. 2011). Africa’s biggest emitter isSouth Africa, accounting for some 40 % of the continent’s CO2 emissions. SouthAfrica derives most of her electricity from coal, and is the 12th biggest emitter in theworld (EIA 2009). Egypt is the second largest emitter contributing 17 % of the con-tinent’s emissions. This data were based on annual 2009 CO2 emissions from energyconsumption alone excluding other GHG sectors. Other GHG sectors such forestry,agriculture, land use, and waste, are rather complex and require investment, which is amajor challenge for many countries. The most consistent, transparent, and accurateways of handling information related to climate change have been proposed, but therate of uptake in Africa is disturbingly low. African countries need to put in placenational GHG inventory systems that will simplify their climate change reportingobligations to the UNFCCC, by managing inventory data in those internationallyaccepted ways. This will also streamline their own internal interagency reporting. Manyof Africa’s national economies remain hindered by historical standards due to botheconomic and political causes, including weak economic and political institutions,insufficient infrastructure in quantity and quality, negative perceptions of internationalinvestors, political disturbances, and protracted civil unrest, and equally importantly,the effect of disease (particularly HIV/AIDS). These present daunting challenges togrowth in a number of African countries, especially where funds need to be allocatedfor technological advancement, alternative source of livelihoods and education.
1.3 Existing Gaps and the Contribution of the GHG Project
The Project on land cover mapping and capacity building for the development ofgreenhouse gas inventories was implemented over a period of 3 years, across ninecountries with varying landscapes and characteristics. Its main aim was to producebaseline land cover maps, as well as build the capacity of the participating countriesfor future mapping tasks. While maps can have many uses, their main purpose wasto support the development of the GHG Inventories.
The project was successful on many levels, contributing to filling the gaps inskills, expertise, and working procedures, as well as, strengthening the existingendeavors at the institutional level in the nine participating countries. Training wason various concepts in GIS and remote sensing, with particular emphasis on landcover mapping using remotely sensed datasets, fieldwork exercises using handheldGPS devices, scene identification and downloading of Landsat satellite imagery,development of metadata for archived datasets, the different approaches on the use ofa boundary to restrict a study site in a GIS environment among other key concepts.
In many instances, the project contributed to formalizing and fostering collabo-ration between key government institutions. In Tanzania for example, the teampledged to source for budgetary allocation from their government, in order to con-tinue meetings to advance the agenda on GHG Inventories development. The projectoffered a meeting platform for representatives from many institutions in each par-ticipating country during the workshops. The initial workshop where ancillary data
Land Cover Mapping for Green House Gas Inventories in Eastern … 87
are collected brought together many institutions that are custodians to variousdatasets. In many countries, it enabled officials from the institutions to be also awareof, and access what their counterparts were keeping. This is because each institutionwas to declare what datasets they held based on a predefined checklist.
One major strength of the project was its partnership design. Apart from thegovernment agencies upon whose goodwill and relations activities were scheduledand implemented, the project brought together strategic partners in the UnitedStates and Africa. At the core of the network was the RCMRD and NASA, underthe SERVIR Project, with financial support from the USAID. A Technical AdvisoryBoard (TAB) constituted to provide technical advice on the map developmentprocess comprised of representatives from UNFCCC, NASA’s Earth ScienceOffice, the University of Colorado, RCMRD and the ICF International. TheColorado State University, the developers of the ALU Tool for GHG Inventorieswere also a strategic partner.
1.4 Background on the Participating Countries
The nine countries where the project was implemented had varying landscapes,climate and characteristics, but very similar regional setting in Sub-Saharan Africa.From Ethiopia to the north of Eastern Africa to Namibia and Lesotho in the farSouthern Africa, all the countries face similar pressures on existing naturalresources, a rapidly growing population, inadequate expertise, and facilities ingovernment institutions, as well as overdependence on rainfed agriculture. Most ofthe countries are landlocked, with relatively high population densities in highresource areas, e.g., Rwanda (Byamukama et al. 2010). According to the AfricanDevelopment Bank (2011), environmental degradation in Ethiopia is mainly drivenby high population growth, urbanization, agriculture, and poverty and infrastructureexpansion. In most countries agricultural activities contribute to the highest per-centage of net GHG emissions. The GHG Inventories (1995–2000) show thatMalawi is a net emitter of GHG; and the agriculture, forestry, and land use sectorremain key contributors (96 %), based on their second national communicationdone in 2001. Stiebert (2013) identified the agriculture sector as the main con-tributor to greenhouse gasses in Rwanda, accounting for about 65 % ofnon-LULUCF emissions for Rwanda in 2010. This was attributed to emissionsfrom soil cultivation. The countries were also prone to natural disasters and extremeweather events. McSweeney et al. (2010) observed that like many countries inAfrica, Zambia was one of the most severely affected countries by the 1997/1998 ElNiño phenomenon, suffering flooding and destruction. In Botswana, rainfall isunreliable as some two-thirds of the country is covered by the Kalahari Desertsands, and is not suitable for agricultural production. However, Botswana’s naturalresources consist of the unique Okavango Delta, some wetlands, arable land,woodlands mineral resources, and wildlife and mineral resources Wingqvist andDahlberg (2008). Tanzania too is well endowed with natural resources, being hometo the Serengeti, a prominent tourist destination in Africa (Agrawala et al. 2003).
88 P. Oduor et al.

Even for a dry country like Namibia, the variety of ecosystems, natural habitats,and wildlife species are remarkable. Internationally known biodiversity “hotspots”include the Sperrgebiet, located in southern Namibia in the Succulent Karoo floralkingdom, and the rugged Namib Escarpment, which is part of Africa’s greatwestern escarpment. The main land uses in Namibia include farming for crops andanimal husbandry, conservation on state protected areas, communal conservancies,resettlement; government agriculture farms, and mining (MET 2010). Anothersimilarity in the countries was the rapid rate of deforestation. According to theWorld Bank (2015), the rate of deforestation in Uganda is very high at 2.3 %, wellabove the Sub-Saharan and world average of 0.6 %. Biomass fuel such as firewood,charcoal, animal dung, and crop residues remains the main energy source forEthiopia, and as such, environmental degradation is mainly driven by high popu-lation growth, urbanization, agriculture, and poverty and infrastructure expansion(César and Ekbom 2013; African Development Bank 2011).
1.5 The Datasets and Rationale
The Landsat imagery were used in this project. Landsat images presented numerousspatiotemporal advantages compared to other satellite datasets available for landcover mapping, primarily because they provided consistency and reliability innational coverage for the selected countries and epochs. They are also freelyavailable and downloadable where internet connection is fairly stable. The Landsatlifespan over the last four decades has been continuous with new releases beinglaunched before the lifespan of the previous launches, making it a reliable datasource that is useful in tracking land cover and land use change over time.
In this work, the interpretations derived from image classifications were sup-ported by ancillary data, since the accuracy of the information gathered-based solelyon spectral variability is often insufficient (Gercek 2004). This project accessed awide range of ancillary datasets including the literature, layers of spatial map-basedthematic data, topographical data, as well as, nonspatial data. These were especiallyvital, where land cover classes had low spectral separability. It was observed thatinitial classification accuracy was especially high, where the country had sharedplenty of ancillary data, and where the project technicians had utilized it as required.
2 Working Structure in the Countries
2.1 Regional Scope
The project initially covered six countries: Malawi, Rwanda, Tanzania, Zambia,Namibia, and Botswana. In 2014/2015, three more countries were included:Ethiopia, Uganda, and Lesotho.
Land Cover Mapping for Green House Gas Inventories in Eastern … 89

2.2 Implementation Structure for a Country
2.2.1 Inception Meetings
The main objective of holding these meetings was to create awareness of the projectto all relevant stakeholders at the same time taking advantage of the meetings fordefinition of national land cover classification schemes. Through this it was pos-sible to define the classification schema to be used for the country that not onlyconforms to the guidelines of the UNFCCC and IPCC but also meets the nationaldefinition and stakeholder requirements as far as land cover maps are concerned.
2.2.2 Ancillary Data Collection Process
The main objective for this process was to ensure that consistent and accurateinformation was made available for proper definition of national land cover classi-fication schemes. In addition, gathering existing and or historical land cover land usemaps and previously collected ground reference data was an important step in thisprocess. Finally, the project ensured that enough relevant ancillary datasets wereavailable for classification of Landsat imagery to the required classes/categories.
2.2.3 Maps and Analysis
Scheme I maps depict the six IPCC land cover categories: forestland, grassland,wetland, cropland, settlements, and otherland. Scheme II maps on the other handrepresented a subcategorization of Scheme I maps and were country specific. Theywere defined by the country and could be rolled back to Scheme I maps. Mappingwas done at RCMRD with respect to the two Classification schemas developed,ancillary data, using Landsat Images. Tables 1 and 2 present details of Scheme Iand Scheme II classes, as defined in this work.
Table 1 Scheme I LandCover classes for Malawi,Rwanda, Zambia, Namibia,Botswana, Tanzania,Ethiopia, Uganda, andLesotho
Index Land cover Used in
1. Cropland All
2. Forestland All
3. Grassland All
4. Wetland All
5. Settlement All
6. Otherland All
90 P. Oduor et al.

2.2.4 Field Validation
Once the first draft of the maps was finalized, a fieldwork session was organizedwithin the country. Field validation for the later epochs was done in collaborationwith the stakeholders in the country to collect reference points for accuracyassessment and for further refinement of the maps.
2.2.5 Peer Review and Technical Advisory Board
The initial map review was done internally at RCMRD through a project teammeeting, and then a broader RCMRD technical review meeting was convened to
Table 2 Scheme II Land Cover Classes, which were defined based on country preferences andare unique in each country
No. Country Classes
1. Namibia Forestland, Woodlands, Planted Forest, Grassland, Savanna Grassland,Shrubland, Annual Cropland, Perennial Cropland, Wetland, Water Body,Settlement, Rock Outcrop, Bare Soil, Desert Dune, Desert Sand
2. Botswana Dense Forest, Moderate Forest, Sparse Forest, Woodlands, Planted Forest,Open Shrubland, Closed Shrubland, Open Grassland, Closed Grassland,Cropland, Wetland, Water Body, Settlement, Otherland, Pans
3. Malawi Dense Forest, Moderate Forest, Sparse Forest, Planted Forest, OpenShrubland, Closed Shrubland, Open Grassland, Closed Grassland, AnnualCropland, Perennial Cropland, Wetland, Water Body, Settlement, Otherland
4. Zambia High Dense Forest, Medium Dense Forest, Open Dense Forest, PlantedForest, Open Shrubland, Closed Shrubland, Open Grassland, ClosedGrassland, Annual Cropland, Perennial Cropland, Wetland, Water Body,Settlement, Otherland
5. Rwanda Dense Forest, Moderate Forest, Sparse Forest, Planted Forest, OpenShrubland, Closed Shrubland, Open Grassland, Closed Grassland, AnnualCropland, Perennial Cropland, Wetland, Water Body, Settlement, Otherland
6. Ethiopia Dense Forest, Moderate Forest, Sparse Forest, Woodlands, Open Shrubland,Closed Shrubland, Open Grassland, Closed Grassland, Annual Cropland,Perennial Cropland, Wetland, Water Body, Settlement, Rock Outcrop, Baresoil, Lava Flow, Salt Pan
7. Tanzania Dense Forest, Moderate Forest, Sparse Forest, Woodlands, Planted Forest,Open Bushland, Closed Bushland, Open Grassland, Closed Grassland,Annual Cropland, Perennial Cropland, Wetland, Water Body, Settlement,Rock Outcrop, Bare soil, Salt Crust, Snow/Icecap
8. Lesotho Natural Forest, Planted Forest, Shrubland, Grassland, Orchards, AnnualCropland, Wetland, Water Body, Settlement, Otherland
9. Uganda Dense Forest, Moderate Forest, Sparse Forest, Dense Woodlands, ModerateWoodlands, Sparse Woodlands, Planted Forest, Open Shrubland, ClosedShrubland, Open Grassland, Closed Grassland, Annual CommercialCropland, Perennial Commercial Cropland, Wetland, Water Body,Settlement, Otherland
Land Cover Mapping for Green House Gas Inventories in Eastern … 91
assess issues highlighted at the project team review level. Once the comments fromthese had been sufficiently addressed, the map products were submitted to thespecific country technical team for further reviews. The feedback obtained from thiswas used to further refine the maps before further validation was done to check theaccuracy and have the initial outputs. These were then submitted to the TechnicalAdvisory Board for further comments. Often, the TAB members provided its inputvia teleconferences after having reviewed the products individually. This wasbasically the final review process, after which the maps were corrected and pack-aged for dissemination. However, the window for country review did not close as inmany instances the comments kept coming and necessary discussions or correctionswere effected as required.
2.2.6 Dissemination Workshops
This workshop was the final output of the project and had the following keyobjectives:
• To hand over map products developed by RCMRD to the Government• To introduce online platforms for sharing the map products.• To discuss other possible uses of the land cover maps, apart from the primary
goal of supporting the development of GHG Inventory• To offer expert training in the areas of land cover mapping, as a follow up to
earlier training held at RCMRD.• To share technical knowledge and interact with the stakeholders at a formal
project wrap up forum.
2.2.7 Visualization Platform
All final land cover maps developed were uploaded onto a visualization platformdeveloped to foster efficiency of data access, wider coverage, and sustainability indissemination efforts. Two tools referred to as Compare and Statistics were pro-vided on the platform. The Compare tool allows the user to visually compare landcovers of the same schema across different epochs visually while the Statistics toolenables the user to derive statistics based on an administrative jurisdiction providedfor in the country. The platform also allows a user to download the files as well astheir styles or legends, and detailed metadata should further processing be required.
• http://geoportal.rcmrd.org/layers/• http://apps.rcmrd.org/landcoverviewer/
92 P. Oduor et al.

2.3 Impact and Way Forward
Provision of the land cover maps in an interactive process which also addressedcapacity building needs of the relevant agency within then respective countries hashad the following short and long-term impacts:
• Availability of a readily available dataset for use in the agriculture, forestry, andland use sectors.
• Accessibility of regionally consistent land cover datasets for GHG estimationprocesses to enable countries developed comparable products.
• Capacity development in land cover map development was a significant steptoward sustainability of such initiatives.
• Creation or activation of a network of institutions with common objectives(preparation of input maps for GHG processes), within and among countries hasfostered synergy and collaborations.
Stakeholders involved in the project in the different Countries:Ministries/Departments of:
(1) Forestry(2) Land Management(3) Surveys and mapping(4) Environment(5) Land use and/or planning(6) Land use(7) Natural resources(8) Wildlife(9) Agriculture
(10) Universities(11) International organizations(12) Climate and meteorology(13) Water and wetlands(14) Private sector.
3 Land Cover Mapping Methodology
3.1 Data Acquisition
The large volumes of Landsat images required for this project were initially sup-plied by GDI Consulting and Training, a US consultancy firm, having appliedinitial image corrections. Later on, RCMRD required more images and downloadedthem directly from USGS website from time to time. This project also accessed a
Land Cover Mapping for Green House Gas Inventories in Eastern … 93

wide range of ancillary data from each country, which included literature, layers ofmap-based thematic data, topographical data, as well as, non-spatial data. For eachcountry, these were provided by the government agencies, departments and min-istry officials, during the workshop on ancillary data collection.
3.2 Preprocessing
According to Shahrokhi (2004), problems with image pixels including position andperturbation in value can lead to feature misinterpretation. It is therefore importantto employ manual or automatic techniques to correct for such defects on theradiometric, atmospheric, and geometric integrity of the satellite images.Radiometric quality is influenced by sensor characteristics and detector responsesand includes striping, drop lines, other noise elements, and missing bands or data inimage data sets. Atmospheric quality on the other hand is dependent upon imageacquisition conditions and includes haze and cloud cover, while geometric qualityis determined by sensor characteristics and also satellite situation such as attitude,position, velocity, and perturbations. The Earth’s surface relief also affects geo-metric quality of the images. Compromise in geometric quality is shown by lack ofband to band co-registration as well as image to map co-registration.
Encountering such problems on a project involving regional land cover mappingover a long period of time was almost inevitable. However, no major correctionswere carried out on the images acquired from USGS in recent times since they werealready preprocessed and included a UTM projection with a WGS84 datum.However, selected ancillary data required to be projected to the Landsat imagery’sUTM projection and WGS84 datum, in order to enable overlays. The project hadthe advantage of selecting images over a 3-year window period, and therefore areplacement image was the most immediate remedy whenever a defective imagewas encountered. However, image enhancement techniques were applied as neededprimarily to improve detection and identification of the various land cover classes,and minimize the effect varying spectral characteristics. The images were clipped tothe national boundary, usually buffered to include a 10 km distance, in case otherversions of the boundary emerged later on.
3.3 Supervised Classification
The project applied the maximum likelihood Classifier, which basically evaluatesthe variance and covariance of each class, in order to determine where to assign apixel, and is proven to give the best results (Al-Ahmadi and Hames 2008). Thesupervised classification method relies heavily on the prior knowledge of theanalyst. With sufficient information from visual interpretation and other ancillarydata, the analyst therefore would select ‘training sites’ by digitizing around a
94 P. Oduor et al.

homogenous feature. This was done for every visually identified and distinct landcover class. Severally, it was found necessary to collect training sites for furthersegmentation of subclasses, to be later combined. For instance, where the class“Annual Cropland” would have variations in interpretations, corresponding tovarious stages of crop cultivation and growth, as well as different crop species.These were initially classified as different classes using different training sites.
While there have been a number of comparative studies which found a few othermethods to have better classification results than supervised classification (Kim1993; Liu 2002), supervised classification has numerous advantages. It is fasteronce the training sites have been collected, as compared to manual digitizationmethods. This makes it suitable for large scale projects such as the regional landcover mapping tasks in this project. The accuracy of the results is also increased bymaintaining “pixel hygiene” in the training sites. In addition, separability analysesas well as contingency matrix can be carried out to check that the classes do notoverlap in statistics. The training sites are also reusable, for example where animage was replaced with that of nearly the same time. Compared to unsupervisedclassification, the information classes are generated as predetermined by the analyst.Supervised classification is a commonly used method in many countries andcapacity building efforts were largely aided by the fact that most participants hadused it even though in a geographically smaller project.
In order to ensure uniformity and seamlessness among the Landsat scenes, chainclassification was adopted. This involves selecting common training sites on twoadjacent scenes in the overlap area. These are then used on both scenes to reduceedge differences between them. Alternatively, training sites from the two imagescan be harmonized and applied for the classification of the preceding image.
3.4 Post Classification
Image post classification refers to the series of operations carried out after an imagehas been initially classified. The post classification processes used in this workincluded combining classes, color coding, and edge matching for neighboringscenes among others. Due to the emergence of subcategories of almost each par-ticular land cover class, class combination was carried out. Further, there was theneed to reduce the noise from scattered pixels, these were filtered away based onlogical operations, to reduce the “salt and pepper effect”, usually associated withpixel-based classification methods. After rigorous quality checks and comparisons,a legend was assigned and the classified images mosaicked. The legend informa-tion, including specific names and colors were stored in a country-specific decisiontree. These were then coded using the decision tree and a national mosaic created.Where only a small region of the image mosaic needed corrections, it was subsetand corrected using the classification editor, an extension in the ENVI Software. Itis worth noting that the settlements class was generated in a different way. Due to itsspectral similarity to bare lands and cropland, it was manually digitized on Google
Land Cover Mapping for Green House Gas Inventories in Eastern … 95

Earth, set at the corresponding time, rasterized to later mosaic onto the classificationusing a decision tree rule.
3.5 Quality Checks and Control
Numerous quality checks and control were applied to classification output, inrelation to the interpreted satellite imagery, Google Earth imagery, availableancillary data, and ground truth point data. These included both the internal checkswithin the project team and at the institutional level, as well as by the respectivecountry technical staff and the independent project Technical Advisory Board. Eachof these reviews at least for the initial six countries, ended up with very particularrecommendations to be carried out by the project team. The corrections were dis-cussed and assigned to individual project staff or a team to address. With correc-tions and refinements at each country, the errors got fewer and team expertise grew.
3.6 Validation
3.6.1 Sampling
Ground reference data generally cannot be collected for large portions of the entireproject area, therefore samples are frequently used (Lillesand and Kiefer 1994).Ground reference data is collected to train the computer to recognize the variousland cover categories latent in the imagery and to assess the categorical accuracy ofthe resulting classification, as it was in this project, because there was only one fielddata collection activity. Since the ground-referencing activity was limited in timeand resources, thus unable to extensive coverage within a country, there was acomplementary unbiased approach, to take care of temporal differences between theimage dates, and the time of field data were collected. The approach used requiredthat stratified random points were generated within the boundary of the country.Approximately, a thousand points were generated for each country. A buffer of30 m was generated from the points, and the resulting polygons overlaid on Landsatimages, Google Earth, and other high resolution images for the independentinterpretation.
3.6.2 Accuracy Assessment
The accuracy assessment was carried out using ground-referencing data, and pointdata from the interpretation of high resolution images including Google Earth. Thelatter was especially important for the year 2000 accuracies, for whichground-referencing data were not applicable as the data were obtained in the years
96 P. Oduor et al.

2012–2014. The centroids of the independently interpreted polygons were com-bined with selected ground-referencing points for accuracy assessment. This wasapplied to the ‘current year’ classification; 2010 or 2014. However, ground truthdata were not applied in the accuracy assessment of the first epoch; 2000 for mostcountries and 2003 for Ethiopia. The accuracy assessment of the developed mapwas done through the construction and analysis of an error matrix in ENVI soft-ware, and the acceptable minimum threshold for overall accuracy according toUSGS classification was 75 %.
4 Output
The project was tied to various outputs, some of which were modified or furtherclarified in the course of implementation. Primarily, baseline land cover maps wererequired for each of the nine countries. These were delivered in three epochs of theyears 1990 (for Malawi and Rwanda), 2000 and 2010. However, after the initial twocountries, it was agreed that maps for subsequent countries would be developed fortwo epochs representing years 2000 and 2010. The last three countries to bemapped (Ethiopia, Uganda, and Lesotho), preferred different mapping epochs.These were: Ethiopia, 2003 and 2008; Uganda, 2000 and 2014; and Lesotho, 2000and 2014. Since the maps were made in two schemas, a total of forty maps weredeveloped for the nine countries. Two epochs per year of mapping, implying fourmaps per country except Malawi and Rwanda for which six maps were made.
The maps, alongside project reports, training manuals and visualization softwarewere delivered to the countries officially during the dissemination workshops,packaged in an interactive DVD. They were also shared with the country point ofcontact alongside the raw images interpreted, in portable computer devices. Afterdissemination, the maps were also made available online, and the link (http://apps.rcmrd.org/landcoverviewer/) to access the data was shared with the technicalexperts and the wider user community. It was expected that with the official han-dover, the map products and related reports be available for public consumption aswas envisioned in the project goal. Another key output of the project was institu-tional capacity building on the mapping methods and allied technology, includingthe use of handheld GPS devices in ground-referencing.
4.1 The Land Cover Maps
This subsection presents the twenty maps developed for the nine countries,alongside the accuracy summaries achieved. The maps were generated by theinterpretation of Landsat images with a spatial resolution of 30 m, and the requiredminimum accuracy was 80 % for the Schema I maps, and 75 % for the Schema IImaps. Scheme II maps are not presented.
Land Cover Mapping for Green House Gas Inventories in Eastern … 97

Table 3 presents a summary of maps generated for each country, and therespective years for which they were done. Table 4 presents overall accuracies andKappa Coefficients from accuracy assessments.
Figures 1, 2, 3, 4, 5, 6, 7, 8, 9 shows Scheme I maps developed for Botswana,Ethiopia, Lesotho, Malawi, Namibia, Rwanda, Tanzania, Uganda, and Zambia(Figs. 10, 11 and 12).
4.2 Ancillary Data Collection Workshops
For each of the nine countries, there was an initial workshop with the mainobjective of sharing existing ancillary data within the country, to aid in the mappingprocesses. Additionally, an agreement was made on the legend of the nationallydefined land cover classes, for the Schema II maps. Combined statistics on atten-dance are presented in Table 5. These workshops were conducted within thespecific countries, and event facilitators have not been included in the counts.
4.3 Capacity Building Workshops
Among the project activities, there were two capacity building workshops arrangedfor each country, the first one was to sponsor two participants for a 2 week ‘on thejob training’ at RCMRD. This happened during the map interpretation period, andparticipants were able to offer useful insights into the mapping experience. Somecountries sponsored additional participants for the training including Botswana andZambia. Uganda on the other hand preferred that the ‘on the job training’ beconducted in their country to attract more participants.
The second planned training workshop was the 1 week training in the country.This was done during the dissemination workshop week, and the participants
Table 3 Two sets of maps (Scheme I and II) per year per country were produced as shown
No. Country 1990 2000 2003 2008 2010 2014
1. Rwanda x x x
2. Botswana x x
3. Ethiopia x x
4. Lesotho x x
5. Malawi x x x
6. Tanzania x x
7. Namibia x x
8. Zambia x x
9. Uganda x x
98 P. Oduor et al.

Tab
le4
Overallpercentage
accuracies
andKappa
coefficientsformapsdevelopedfornine
coun
tries
Epo
ch19
9020
0020
0320
0820
1020
14
Map
schema
III
III
III
III
III
III
Botsw
ana
Overallaccuracy
––
91.5
75.5
––
––
91.05
75.94
––
Kappa
coefficient
––
0.79
20.67
––
––
0.84
50.70
2–
–
Ethiopia
Overallaccuracy
––
––
8876
.52
86.68
82.28
––
––
Kappa
coefficient
––
––
0.79
0.71
10.82
0.79
8–
––
–
Lesotho
Overallaccuracy
––
92.5
85–
––
––
–85
.18
77.85
Kappa
coefficient
––
0.83
90.78
7–
––
––
–0.77
70.71
8
Malaw
iOverallaccuracy
85.81
78.33
82.74
77.65
––
––
83.09
77.1
––
Kappa
coefficient
0.79
0.73
40.76
60.72
6–
––
–0.77
40.72
5–
–
Nam
ibia
Overallaccuracy
––
89.29
75.51
––
––
88.73
76.95
––
Kappa
coefficient
––
0.82
50.70
6–
––
–0.81
40.71
8–
–
Rwanda
Overallaccuracy
82.2
79.8
82.74
77.65
––
––
81.3
76.41
––
Kappa
coefficient
0.75
30.75
40.76
60.72
6–
––
–0.74
10.71
5–
–
Tanzania
Overallaccuracy
––
86.63
79.48
––
––
80.18
75.38
––
Kappa
coefficient
––
0.80
60.76
––
––
0.73
10.71
8–
–
Ugand
aOverallaccuracy
––
90.27
86.34
––
––
––
84.22
79.11
Kappa
coefficient
––
0.87
0.84
4–
––
––
–0.78
40.76
Zam
bia
Overallaccuracy
––
89.05
75.51
––
––
85.53
76.46
––
Kappa
coefficient
––
0.82
70.70
6–
––
–0.79
30.71
7–
–
Land Cover Mapping for Green House Gas Inventories in Eastern … 99

ranged between 10 and 15 per country. There were other training events whosestatistics are not included herein. For example, before the start of eachground-referencing activity, the participants were trained on the sampling methodsand the use of handheld GPS devices in fieldwork for 2 days. Another importantevent was the 2 week workshop at RCMRD on land cover mapping in the East andSouthern Africa Region organized by the US Department of Interior in March 2014.This was attended by many participants from the project countries, and they spentthe second week in the Project Lab learning and assessing the maps for theirrespective countries. The numbers for all the capacity building workshops aresummarized in Table 6.
4.4 Dissemination Workshops
The final major project activity for each country was the data disseminationworkshop, an event during which high ranking officials in the respective govern-ments were invited. The dissemination workshops were held in the same week asthe in country training. Statistics on the in country trainings are presented inTable 7.
Fig. 1 Botswana Scheme I Land Cover Maps for 2000 and 2010
100 P. Oduor et al.

Fig. 2 Ethiopia Scheme I Land Cover Maps for 2003 and 2008
Land Cover Mapping for Green House Gas Inventories in Eastern … 101

Fig. 3 Lesotho Scheme I Land Cover Maps for 2000 and 2014
102 P. Oduor et al.

Fig. 4 Malawi Scheme I Land Cover Maps for 1990, 2000 and 2010
Fig. 5 Namibia Scheme I Land Cover Maps for 2000 and 2010
Land Cover Mapping for Green House Gas Inventories in Eastern … 103

4.4.1 The Interactive DVD
During the dissemination workshop, the interactive DVD was introduced, as well asthe links to the online map viewer.
The interactive DVD contained:
• Land Cover Maps• Technical Reports
– Training Manual– Accuracy Reports
4.4.2 The Web Portals
All Land cover maps in either Scheme I or II are downloadable from the locationslisted below, including the respective styles and metadata.
(1) http://geoportal.rcmrd.org/layers/(2) http://apps.rcmrd.org/landcoverviewer/
Fig. 6 Rwanda Scheme I Land Cover Maps for 1990, 2000 and 2010
104 P. Oduor et al.

Fig. 7 Tanzania Scheme I Land Cover Maps for 1990, 2000 and 2010
Land Cover Mapping for Green House Gas Inventories in Eastern … 105

Fig. 8 Uganda Scheme I Land Cover Maps for 2000 and 2014
106 P. Oduor et al.
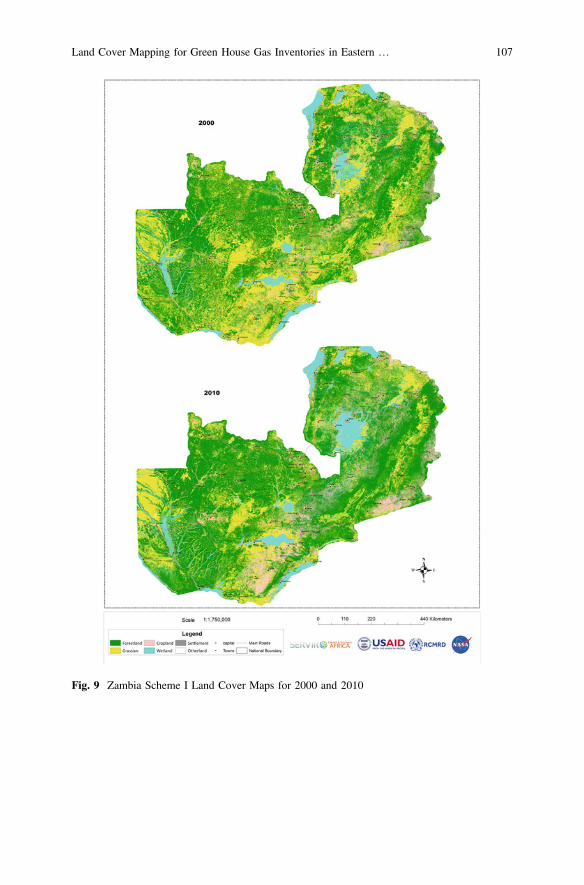
Fig. 9 Zambia Scheme I Land Cover Maps for 2000 and 2010
Land Cover Mapping for Green House Gas Inventories in Eastern … 107

Fig. 10 Synergy meeting at Surveys and Mapping, Botswana, during the Ancillary DataCollection Workshop
Fig. 11 The Ethiopia Data Dissemination Workshop. The workshop was graced by the StateMinister for Forest and Environment in Ethiopia, Ato Kebede Yimam, the Director General ofRCMRD, Dr. Hussein Farah, and the Director General of Ethiopia Mapping Agency, Ato SultanMohammed
108 P. Oduor et al.

Fig. 12 First Page of the Interactive DVD (Lesotho)
Table 5 Number of persons attending the ancillary data collection workshops, and the respectiveinstitutions that they represented
Country Number ofparticipants
Institutions represented
1. Namibia 11 Ministry of Environment and Tourism (MET), NamibiaStatistics Agency (NSA), Ministry of Agriculture, Water andForestry—Department of Forestry and National Centre forRemote Sensing, United Nations Development Programme(UNDP)
2. Malawi 14 Department of Environmental Affairs, Le Bocage, Mt.OryMoka, Mauritius, Land Resources ConservationDepartment, Lilongwe City Council, Surveys Department,Department of Animal Health and Livestock Development,Ministry of Natural Resources, Energy and Environment,Forestry Research Institute of Malawi, Crop ProductionDepartment
3. Rwanda 16 Rwanda Environmental Management Authority (REMA),Rwanda Agriculture Board (RAB), University of Rwanda(NUR), World Agro-forestry Centre (ICRAF), National
(continued)
Land Cover Mapping for Green House Gas Inventories in Eastern … 109

Table 5 (continued)
Country Number ofparticipants
Institutions represented
Institute of Statistics of Rwanda (NISR), Rwanda NaturalResources Authority (RNRA)
4. Botswana 9 University of Botswana (UB), Surveys and Mapping,Meteorology Department, Statistics
5. Tanzania 12 Vice President’s Office (VPO)-Division of Environment,National Bureau of Statistics (NBS), TanzaniaMeteorological Agency (TMA), Ministry ofAgriculture-National Food Security, Ministry of Livestockand Fisheries, University or Dares Salaam- Institute ofResource Assessment
6. Zambia 13 Centre of Energy for Engineering, Ministry of Lands, Energyand Water Department-Department of Survey, Department ofForestry and Department of Natural Resources andEnvironmental Protection, University of Zambia, Ministry ofAgriculture, FAO, Zambia Wildlife Authority (ZAWA)
7. Uganda 9 National Forest Authority (NFA), National Environmentmanagement Authority (NEMA), Ministry of Water andEnvironment, Uganda Wildlife Authority (UWA)
8. Ethiopia 31 Ethiopia Mapping Agency (EMA), Ministry of Environmentand Forestry (MoEF), Central Statistical Agency of Ethiopia(CSA), National Population Council (NPC), EthiopianWildlife Conservation Authority (EWCA), MPC, NationalMeteorology Agency (NMA)
9. Lesotho 14 Ministry of Local Government, Department of Land Use andDepartment of Land Surveys and Physical Planning, Ministryof Forestry, Meteorology, Maseru City Council
Table 6 A summary of number of persons who participated in the ‘On job training’ and Incountry training workshops per country, and the respective institutions they represented
Country Number ofparticipants
Institutions represented
1. Namibia 18 Ministry of Environment and Tourism (MET), NamibiaStatistics Agency (NSA), Ministry of Agriculture, Waterand Forestry—Department of Forestry and NationalCentre for Remote Sensing, UNDP, National RemoteSensing Center-Forestry
2. Malawi 17 Department of Environmental Affairs, Le Bocage, Mt.OryMoka, Mauritius, Land Resources ConservationDepartment, Lilongwe City Council, SurveysDepartment, Department of Animal Health and LivestockDevelopment, Ministry of Natural Resources, Energy andEnvironment, Forestry Research Institute of Malawi,Crop Production Department
(continued)
110 P. Oduor et al.

Table 6 (continued)
Country Number ofparticipants
Institutions represented
3. Rwanda 19 Rwanda Environmental Management Authority (REMA),Rwanda Agriculture Board (RAB), University of Rwanda(NUR), World Agro-forestry Centre (ICRAF), NationalInstitute of Statistics of Rwanda (NISR), Rwanda NaturalResources Authority (RNRA)
4. Botswana 20 University of Botswana (UB), Surveys and Mapping,Meteorology Department, Statistics
5. Tanzania 14 Vice President’s Office (VPO)-Division of Environment,National Bureau of Statistics (NBS), TanzaniaMeteorological Agency (TMA), Ministry ofAgriculture-National food security, Ministry of Livestockand Fisheries, University or Dares Salaam-Institute ofResource Assessment
6. Zambia 19 Centre of Energy for Engineering, Ministry of Lands,Energy and Water Department-Department of Survey,Department of Forestry and Department of NaturalResources and Environmental Protection, University ofZambia, Ministry of Agriculture, Food and AgricultureOrganization (FAO), Zambia Wildlife Authority(ZAWA)
7. Uganda 20 National Forest Authority(NFA), National Environmentmanagement Authority (NEMA), Ministry of Water andEnvironment, Uganda Wildlife Authority (UWA)
8. Ethiopia 12 Ethiopia Mapping Agency (EMA), Ministry ofEnvironment and Forestry (MoEF), Central StatisticalAgency of Ethiopia (CSA), National Population Council(NPC), Ethiopian Wildlife Conservation Authority(EWCA), MPC, National Meteorology Agency (NMA)
9. Lesotho 16 Ministry of Local Government, Department of land Useand Department of Land Surveys and Physical Planning,Ministry of Forestry, Meteorology, Maseru City Council
Table 7 A summary of number of persons participating in the dissemination workshops in eachof the countries, and their respective institutions
Country Number ofparticipants
Institutions represented
1. Namibia 15 Ministry of Environment and Tourism (MET), NamibiaStatistics Agency (NSA), Ministry of Agriculture, Water,National Remote Sensing Center-Forestry, Ministry ofLands and Resettlement (MLR)
2. Malawi 15 Department of Environmental Affairs, Land ResourcesConservation Department, Lilongwe City Council,Survey’s Department, Department of Animal Health andLivestock Development, Ministry of Natural Resources,Energy and Environment, Forestry Department
(continued)
Land Cover Mapping for Green House Gas Inventories in Eastern … 111

5 Discussion and Conclusion
The ‘GHG’ Project was successfully implemented over a period of 3 years, startingin March 2012 and ending in September 2015. Its main objective was to developbaseline land cover maps for nine countries, while also building the capacities ofgovernment agencies in such relevant areas. This mandate was achieved in the ninecountries: Botswana, Ethiopia, Lesotho, Malawi, Namibia, Rwanda, Tanzania,Uganda, and Zambia. In total 40 maps were produced, four maps for all countriesexcept Malawi and Rwanda who got six maps each. These were mapped for twotime slices, basically the year 2000 and 2010, and an additional 1990 for Malawiand Rwanda. Each time slice had two maps; the priority Schema I map which
Table 7 (continued)
Country Number ofparticipants
Institutions represented
3. Rwanda 16 Rwanda Environmental Management Authority (REMA),Rwanda Agriculture Board (RAB), RHA, University ofRwanda (NUR), Rwanda Natural Resources Authority(RNRA), Center for GIS-University of Rwanda
4. Botswana 10 University of Botswana (UB), Surveys and Mapping,Department of Town and Regional Planning (DTRP),Ministry of Agriculture
5. Tanzania 12 Vice President’s Office (VPO)-Division of Environment,National Environment Management Council (NEMC),Ministry of Agriculture, Sokoine University ofAgriculture (SUA), Institute of Resource Assessment(IRA), Ministry of Livestock and Fisheries, ArdhiUniversity (ARU), University or Dares Salaam- Instituteof Resource Assessment, Tanzania Forest Agency (TFS)
6. Zambia 11 Centre of Energy, Environment and Engineering,Ministry of Lands, Energy and WaterDepartment-Department of Survey, Department ofForestry and Department of Natural Resources andEnvironmental Protection, Biocarbon Partners, Ministryof Agriculture, FAO REDD+, National Remote SensingCenter (NRSC)
7. Uganda 11 National Forest Authority(NFA), National Environmentmanagement Authority (NEMA), Ministry of Water andEnvironment, Uganda Wildlife Authority (UWA),Makerere University
8. Ethiopia 10 Ethiopia Mapping Agency (EMA), Ministry ofEnvironment and Forestry (MoEF), Central StatisticalAgency of Ethiopia (CSA)
9. Lesotho 14 Ministry of Local Government, Department of land useand Department of Land Surveys and Physical Planning,Ministry of Forestry, Meteorology, Maseru City Council
112 P. Oduor et al.

comprised of the six IPCC land cover categories, and a Schema II map whichcomprised of some 12–15 land cover categories, defined by the specific country.The main purpose of the maps developed under this project was to support nationalprocesses in reporting to the UNFCCC on GHG emission estimates. However,many countries have also found additional uses that the maps can offer, especiallythe nationally defined Schema II map products.
Over 120 government officials representing about 50 institutions in the regionwere trained in the course of the project. A network of about 50 key institutions wasestablished courtesy of the numerous project activities implemented, including theworkshops on capacity building, ground-referencing exercises, on the job trainings,training, and dissemination workshops. The project was also able to leveragesupport from other agencies to support capacity building efforts at RCMRD.A good example was a USGS led workshop (March 2013) on land cover mappingin the Eastern and Southern Africa, during which participants from project countriesspent an additional 1 week in the project lab for capacity building. The project alsodelivered a process manual to guide the trainees which bears descriptive step bystep processes of map-creation activities, with illustrations and screen shots.A country-specific copy was shared with every trained participant. The project alsoattracted the interest of undergraduate and graduate students, who gladly took upinternships from time to time, some of whom were international students. Duringthe dissemination workshops, the maps and related project reports, as well asmanuals were shared in a country-specific interactive DVD. Each participant got acopy. Additionally, the maps and related documentation for each country werereleased to the public via the online platform.
Some of the challenges encountered during the implementation phases includeloss of project time due to unforeseeable time lags associated with staff turnover aswell as the assumption that all the countries required the same mapping effort, andwere ready to adopt the project implementation schedules. The project team alsoencountered technical challenges from time to time, prompting the team to beinnovative and creative, in order to meet the strict project deadlines. These chal-lenges were eventually overcome through the cooperation of leadership at variouslevels and institutions.
The project also was one of its kind in the region, and that enabled it to identify anumber of trends regarding the regional environment. There are significant changesin the land use and land cover in Eastern and Southern Africa, with the mostaffected categories being the cropland and settlement whose areas are steadilyincreasing, as well as the forestland and shrub land which are declining. However,the biophysical conditions in the countries covered were very diverse, with equallyvarying land cover characteristics and change patterns. It was also evident that thecooperation of national government was aided in part by the long standing cordialrelations with the RCMRD. This relationship facilitated sharing of ancillary data,requests for invitation letters to their countries, and invitations to participate inproject activities. The requirement for voluntary reporting to the UNFCCC and themuch needed technology also made the institutions to look forward to the project.
Land Cover Mapping for Green House Gas Inventories in Eastern … 113

The ‘GHG’ Project used Landsat data to a large extent, as the primary source ofEarth Observation data for mapping work. The Landsat archive is one of the keyNASA Earth Observation data sources that have significantly improved data accessfor research and public utility projects. In this work, access to Landsat data pro-vided a number of cutting edge advantages important for such a project: (1) theLandsat data were freely available and presented one of the most comprehensiveland cover EO datasets in history; (2) the project leveraged on a wealth of practicalexperience in analyzing and interpreting the Landsat data, drawn from extensiveand diverse applications in land cover projects; (3) like in a number of other NASAsatellites, the Landsat program provides continuity, presenting a remarkableopportunity for both historical and future comparisons of land cover classes in thesame areas, with EO data from the same constellation of satellites; (4) the com-plimentary information derived from high resolution EO imagery such asWorldview (whose acquisition was supported by the SERVIR Project) greatlyimproved the interpretation of land cover classes in this project; (5) the spinoff toolsand technologies emanating from working with the freely available EO datademonstrate the enormous potential for spurring innovation that can generatepractical solutions for societal benefit. Finally, it is evident that supporting accessand application of NASA EO data (e.g., Landsat, MODIS, ISERV), as well as fromother space agencies (e.g., Sentinel) for tackling environmental related challenges indeveloping countries can generate remarkable results whose benefits will promotechange in the future.
Having successfully implemented this project, we recommend that: (1) facili-tating the transfer of methods, lessons learnt, and technology developed under thisproject to other countries in the region would greatly improve regional skillstransfer; (2) additional capacity development efforts in the countries wouldstrengthen the institutions’ capabilities in land cover mapping; (3) development ofprocess manuals using open source software, including R and Quantum GIS, wouldbe beneficial to agencies within the region who work with lean budgets; (4) the ninecountries that participated in the project would further benefit from this initiative byleveraging on the capacity built to access additional funding to advance theirreporting of GHG emission estimates to the UNFCCC; (5) exploring alternativemapping methods and software can spur creativity and faster map compilations;(6) offering additional support to the countries to use the data with the differentavailable toolkits (e.g., ALU tool), alongside other sector data to aid the GHGemission estimation processes, would further improve their national capacities.Finally, systematic and concerted efforts that build upon existing capacity fromsuch a project can spur policy interventions which can guide operational use of EOdata in addressing societal environmental challenges.
114 P. Oduor et al.

References
AfDB. (2011). Federal Democratic Republic of Ethiopia, Country strategy paper 2011-2015.African Development Bank.
African Institute for Policy Development. (2012). Population Dynamics, Climate Change, andSustainable Development in Africa. Retrieved from https://www.afidep.org/?wpfb_dl=17.
African Bank. (2007). Chapter 4. Africa’s Natural Resources: The Paradox of Plenty.Agrawala, S., Moehner, A., Hemp, A., Van Aalst, M., Hitz, S., Smith, J., Meena, H.,
Mwakifwamba, M. S., Hyera, T., & Mwaipopo, O. U. (2003). Development and ClimateChange in Tanzania: Focus on Mount Kilimanjaro. Organisation for Economic Co-operationand Development.
Al-Ahmadi, F. S., & Hames, A. S. (2008). Comparison of Four Classification Methods to ExtractLand Use and Land Cover from Raw Satellite Images for Some Remote Arid Areas, Kingdomof Saudi Arabia. JKAU; Earth Science, Vol. 20 No. 1, pp. 167–191 (2009 A.D./1430 A.H.).
Bégué, A., Vintrou, E., Ruelland, D., Claden, M., & Dessay, N. (2011). Can a 25-year trend inSoudano-Sahelian vegetation dynamics be interpreted in terms of land use change? A remotesensing approach. Global Environmental Change, 21, 413–420.
Boden, T. A., Marland, G., & Andres, R. J. (2011). Global, Regional, and National Fossil-FuelCO2 Emissions. Carbon Dioxide Information Analysis Center, Oak Ridge National Laboratory,U.S. Department of Energy, Oak Ridge, Tenn., U.S.A. doi:10.3334/CDIAC/00001_V2011.
Byamukama, B., Carey, C., Cole, M., Dyszynski, J., & Warnest, M. (2010). National Strategy onClimate Change and Low Carbon Development for Rwanda. Baseline Report. Retrieved from:http://cdkn.org/wp-content/uploads/2010/12/FINAL-Baseline-Report-Rwanda-CCLCD-Strategy-super-low-res.pdf.
Cabral, A. I. R., Vasconcelos, M. J., Oom, D., & Sardinha, R. (2011). Spatial dynamics andquantification of deforestation in the central-plateau woodlands of Angola (1990–009). AppliedGeography, 31, 1185–1193.
César, E., & Ekbom, A. (2013). Ethiopia Environmental and Climate Change policy brief. Sida’sHelpdesk for Environment and Climate Change. Available: www.sidaenvironmenthelpdesk.se/.
Energy Information Administration (EIA). (2009). Office of Integrated Analysis and Forecasting.U.S. Department of Energy.
Food and Agriculture Organization of the United Nations (FAO). (2010). Global Forest ResourcesAssessment 2010. Main report.
Gercek, D. (2004). Improvement of image classification with the integration of topographic data.In Proceedings of ISPRS Congress, Vol. XXXV, part B8, 12–23 July 2004, Istanbul, Turkey(International Society of Photogrammetry and Remote Sensing). Available: http://www.isprs.org/proceedings/XXXV/congress/yf/papers/929.pdf.
Helmut, J. G., & Lambin, E. F. (2002). Proximate Causes and Underlying Driving Forces ofTropical Deforestation. Oxford Journals: Science & Mathematics: BioScience 52(2), 143–150.
Kim, C. (1993). Limitations of supervised classification and possible application for forestdamages using airborne MSS data. Geoscience and Remote Sensing Symposium, 1993.IGARSS’93.
Lillesand, T. M., & Kiefer, R. W. (1994). Remote sensing and image interpretation (3rd ed.,750 pp). New York: Wiley.
Liu, X. (2002). Supervised Classification and Unsupervised Classification ATS Class ProjectReport: Available: https://www.cfa.harvard.edu/*xliu/presentations/.
McSweeney, C., New, M., & Lozano, G. (2010). UNDP Climate Change Country Profiles:Zambia. Available: http://www.geog.ox.ac.uk/research/climate/projects/undp-cp/index.html?country=Zambia&d1=Reports.
Mertz, O., Ravnborg, H. M., Lövei, G. L., Nielsen, I., & Konijnendijk, C. C. (2007). Ecosystemservices and biodiversity in developing countries. Biodiversity and Conservation, 2007(16),2729–2737.
Land Cover Mapping for Green House Gas Inventories in Eastern … 115

Nkonya, E., Koo, J., Kato, E., & Guo, Z. (2013). Trends and Patterns of Land Use Change andInternational Aid in Sub-Saharan Africa. WIDER Working Paper 2013/110, United NationsUniversity, World Institute for Development Economics Research (UNU-WIDER).
Republic of Namibia. Ministry of Environment and Tourism, MET. (2010). National Policy onClimate Change for Namibia.
Shahrokhi, S. M. (2004). An automated system for environmental monitoring and disasterwarning. Iran Space Agency (ISA). Available: http://www.unoosa.org/pdf/sap/2004/iran/presentations/jalayerian.pdf
Stiebert, S. (2013). Republic of Rwanda: greenhouse gas emissions baseline projection: Publishedby the International Institute for Sustainable Development.
Wingqvist, G. O., & Dahlberg, E. (2008). Botswana Environmental and Climate Change Analysis.Sida INEC. Available: http://www.sida.se/globalassets/global/countries-and-regions/africa/botswana/environmental-policy-brief-botswana.pdf.
World Bank. (2015). Uganda Country Profile. Available: http://www.worldbank.org/en/country/uganda/overview/.
116 P. Oduor et al.

Part IIThematic Perspectives of Satellite Earth
Observation Data for Societal Benefit

Role of Earth Observation Datain Disaster Response and Recovery:From Science to Capacity Building
Guy Schumann, Dalia Kirschbaum, Eric Anderson and Kashif Rashid
Abstract Risks from natural hazards such as floods, droughts, earthquakes, andlandslides are rising due to increasing populations living in more marginal areas andclimatic variability, but our ability to provide warnings and mitigation strategies atshort, medium, and long timescales is often challenged by the lack of groundobservations in the most vulnerable areas. Satellite remote sensing offers uniqueglobal observational capabilities that can provide key insight into the multi-facetedtopics of disaster hazard and risk assessment, response, and recovery in a way thatground-based systems cannot do alone. From the vantage point of space, satelliteplatforms can provide estimates of important hazard-related variables, but havevarying degrees of accuracies and spatial resolutions. In some cases these data areused to support direct disaster response such as maps showing the spatial extent ofthe disaster or impact analyses from detecting pre- and post-event changes on thelandscape. Examples of such direct support include the disastrous flood events inMalawi in January 2015 and in the southwestern United States in May and June2015, and the devastating high-magnitude earthquake that hit Nepal in April 2015(National Planning Commission 2015).
G. Schumann (&)Remote Sensing Solutions, Inc., Monrovia, CA, USAe-mail: [email protected]
G. SchumannSchool of Geographical Sciences, University of Bristol, Bristol, UK
D. Kirschbaum (&)NASA Goddard Space Flight Center, Greenbelt, MD 20771, USAe-mail: [email protected]
E. Anderson (&)University of Alabama in Huntsville, Huntsville, AL 35805, USAe-mail: [email protected]
E. AndersonNASA Marshall Space Flight Center, Huntsville, AL 35805, USA
K. RashidUnited Nations World Food Programme, Rome, Italy
© Springer International Publishing Switzerland 2016F. Hossain (ed.), Earth Science Satellite Applications,Springer Remote Sensing/Photogrammetry, DOI 10.1007/978-3-319-33438-7_5
119

1 Overview
Timely responses during such disasters are often enabled by data and tools thatwere developed with data from Earth observing satellites leveraging the rapiddissemination of satellite information. For example, NASA and the DartmouthFlood Observatory use direct observations of flood water extent from instrumentslike the moderate resolution imaging spectroradiometer (MODIS) on NASA’s Terraand Aqua satellites and these data are available within hours of acquisition. Thismethod complements modeling efforts such as the Global Flood Monitoring System(GFMS, http://flood.umd.edu) that uses near-real-time satellite-based precipitationinformation to model potential flood inundation, allowing scientists to compareresults and ultimately improve their flood estimates. The availability of opticalimagery such as from EO-1, Landsat, or commercial imagery from Digital Globeallows for rapid mapping of landslides following a major trigger, such as theGorkha Earthquake in Nepal in April, 2015. The mapping efforts providedimportant information to aid in disaster response and recovery efforts.
Looking to the future, the challenge and question is how best to link EarthObservation (EO) imagery and products together to provide more robust hazardassessment and monitoring systems. Ensuring sustainable value and use of themany platforms, data, and tools offered by satellites and the scientific communityrequires an intimate engagement between the latter and a wide range of stakeholders(Hossain 2015). This issue has become imminent in recent years, as the stronginterplay between human activity and nature drives change on almost all continents.There have been success stories that took advantage of the science and observationsafforded by satellites to have spectacular societal impacts or provide unprecedentedassistance during major disasters.
Despite the gradual development of more mature remote sensing technology andsatellite missions for routine environmental monitoring, there is a general lack ofcapacity building needed in most regions to take fullest advantage of the tremendousinflux of satellite environmental data that are and will become available in the nearfuture. In order to unlock the observational capability of satellites to enhance andaccelerate societal applications around the world, scientists, stakeholders, andhumanitarian and development agencies need to collaborate closer and ensure sus-tainable synergies. These partnerships and relationships take time to develop and mustbe nurtured to most effectively transition scientific research to real-world applications.In reality, these collaborations are typically slow and can prove difficult to establish. Fordisaster assessment and response, there is a wealth of timely data that can significantlycontribute to improving rapid hazard response and recovery; however, few communi-ties are able to take full advantage of these remote sensing data and products. Therefore,a goal looking to the future is to collaborate and coordinate information from an everincreasing number of satellite missions and work with the spectrum of users to moreeffectively convert data and science into actionable products for better decision-making.
This chapter outlines several examples, where the intersection of remote sensingdata and science has had a significant impact on applications and decision-making
120 G. Schumann et al.

and has been used to assist relief services during disasters. The following sectionsdescribe the role Earth Observation (EO) data play in landslide monitoring,earthquake disaster response (using the Nepal 2015 disaster), and in assisting floodrelief services in the Lower Zambezi (in collaboration with the United NationsWorld Food Programme). We recapture these success stories and report current andfuture prospects as well as challenges.
2 Landslide Hazard Assessment and Monitoring UsingRemotely Sensed Data
2.1 Introduction
Mass movements, including debris flows, landslides, mudflows, rockfalls, etc.,(herein referred to as landslides) occur in every country on earth and cause thou-sands of fatalities and significant destruction each year (Petley 2011; Kirschbaumet al. 2015c). Landslides can range in size from a few meters to several kilometers.They occur over a broad range of lithologies, morphologies, hydrologic settings,and climate zones and can be triggered by intense or prolonged rainfall, earth-quakes, rapid freezing and thawing of the surface, and anthropogenic activities,among others (Fig. 1). The location, size, and timing of landslide events can beextremely challenging to forecast or evaluate because of the local scales at whichthey occur and the complex interactions these events have with triggering events.
EO data have played an important role in advancing the mapping and hazardassessment capabilities over local to global scales. However, there remain somelimitations to effectively applying these data to landslide mapping, monitoring, andhazard assessment. Building capacity to better utilize EO data for landslideassessment has been developing over the past decade, and significant advancementshave been made to better utilize remote sensing data for landslide hazard
Fig. 1 Global Landslide Catalog (2007–2015) developed at NASA showing number of fatalitiesfor reported events. The Global Landslide Catalog was compiled from media reports, onlinedisaster databases and other sources and contains nearly 7000 events (see Kirschbaum et al. 2010)
Role of Earth Observation Data in Disaster Response … 121

assessment. However, there remain some challenges in effectively applying EO datafor actionable landslide hazard information. This section provides a few examplesof current activities in landslide mapping, monitoring, and hazard assessment andsuggests some of the opportunities and challenges of the landslide hazard mappingcommunity in utilizing and building capacity to use EO data.
2.2 Current and Past Approaches
There are many different approaches to landslide hazard assessment and monitoring.One approach to estimating landslide behavior is using a deterministic model to focuson site-specific analysis at a local (hillslope) scale (e.g. Iverson 2000; Baum et al.2010). In this approach, one needs to account for the way that extreme rainfall interactswith topography, how the water infiltrates the surface and how the subsurfaceresponds to the increased presence of water. These different interactions can varysignificantly over one to several meters. The surface and triggering information neededto successfully monitor and assess the hazard is typically obtained from in situ sources(e.g., rain gauges, soil moisture sensors, local high-resolution digital elevation models)and is rarely available from EO data at the resolution needed to conduct the analyses.
Statistical landslide hazard mapping approaches relate potential causal factors (e.g.,slope, soil type, distance to drainage, geology) with past local or regional landslideinventories using methods such as logistic regression (e.g. Dai et al. 2004; Ayalew andYamagishi 2005; Mathew et al. 2009), artificial neural networks (e.g. Ermini et al.2005; Melchiorre et al. 2008; Pradhan and Lee 2010), or frequency ratio (e.g., Lee andPradhan 2007; Kirschbaum et al. 2012). These approaches usually produce a staticsusceptibility map that provides information on the relative or probabilistic potentialfor landslide activity in a specific area. These studies have ranged from local to globalscales and in many cases rely on EO data for homogenous surface inputs.
A third approach that focuses on landslide hazard monitoring considers thetiming of landslides triggered by rainfall using an archive of previous events.Techniques consider the intensity of rainfall over short to prolonged periods byrelating the intensity and duration (I-D) of a storm with previous landslide occur-rence. I-D thresholds have been derived statistically and empirically on the global(Caine 1980; Hong et al. 2006; Guzzetti et al. 2008), regional (Dahal and Hasegawa2008; Brunetti et al. 2010; Saito et al. 2010), and local scales (Larsen and Simon1993; Saito et al. 2010). Typically, these I-D thresholds utilize in situ networks ofrain gauges but some studies have considered the feasibility of applyingsatellite-based precipitation to estimate thresholds over broader areas (Rossi et al.2014; Kirschbaum et al. 2015a).
A common theme in all landslide studies is the need for landslide inventorieswith sufficient information to validate landslide monitoring and hazard assessmentsystems. Unfortunately, there is a dearth of this information in general and openlyavailable data in particular. Unlike monitoring networks for hurricanes or earth-quakes, global systems have not been created to routinely identify the location,timing, and extent of landslide events. Different types of landslide maps can be
122 G. Schumann et al.

prepared depending on the purpose of the inventory and extent of the study area.Traditional landslide inventory methods include obtaining a series of aerial photosand conducting field surveys to compile a database of landslides for a particulararea over time. Optical remote sensing data has been applied to assess the landslidedensity, areal extent, and frequency (Petley et al. 2002; Hervas et al. 2003). Othersensors, such as Synthetic Aperture Radar techniques, are being used more often tolocally evaluate displacement of landslides and changes over time (Mazzanti 2011).Freely available EO data provide a significant potential capability to this field forimproved and more systematic landslide inventory mapping and analysis.
2.3 Application of EO Data in Landslide Studies
The increased availability, accessibility, and resolution of remote sensing data hasprovided new opportunities to explore issues of landslide mapping, hazard assess-ment, and monitoring at a range of spatial scales. Table 1 highlights some of the EOdatasets that have been utilized for landslide hazard assessment and monitoring fromNASA’s fleet. Of the surface variables responsible for slope failures, elevation (andits derived products) remains the most important variable in nearly every model forlandslide hazard assessment and monitoring. In terms of NASA data, the ShuttleRadar Topography Mission (SRTM, Farr et al. (2007)) has produced data that havenow been released at 3-arc s which can be used to derive slope, curvature, aspect,distance to drainage, etc. State variables that provide both the preconditions andtriggering conditions for landslides include soil moisture information from the SoilMoisture Active Passive (SMAP) mission and precipitation from GPM. The pres-ence of past burned areas can increase the susceptibility for landslides due to veg-etation loss. This data can be obtained from the moderate resolution imagingspectroradiometer (MODIS) both for past burned areas and active fires.
Finally, an important component of all landslide studies is a robust landslideinventory to validate the landslide model or identify previous instability. Opticalimagery such as Landsat, EO-1, or ASTER can provide valuable information overthe landscape with the advantages of repeat overpasses (Landsat) or the ability totask specific areas (EO-1 and ASTER). High-resolution commercial imagery pro-vides additional information to classify specific landslides on a slope, but can belimited by the availability and cost. Lastly, SAR capabilities have been used toidentify elevation changes from repeat overpasses, but the techniques are not yetwidely used for larger area landslide inventory mapping.
2.4 Regional Landslide Hazard Assessment and Monitoringin Central America
One of the challenges with utilizing remotely sensed EO data within a landslidehazard assessment or monitoring system is the scale at which the study is
Role of Earth Observation Data in Disaster Response … 123

undertaken. Studies are frequently limited to an area where there is sufficient in situinformation to fully parameterize the model. We present a case study here for aregional landslide “nowcasting” system that has been developed over CentralAmerica utilizing primarily NASA EO data.
2.4.1 Model Description
The Landslide Hazard Assessment for Situational Awareness (LHASA) model wasimplemented in Central America and the Caribbean by integrating a regional sus-ceptibility map and satellite-based rainfall estimates into a binary decision tree,considering both daily and antecedent rainfall (Kirschbaum et al. 2015a). LHASAproduces a pixel-by-pixel nowcast in near-real time at a resolution of 30 arc s toidentify areas of moderate and high landslide hazard. The main goal of this systemis to provide a set of tools at the regional level to characterize areas of potentiallandslide hazard that emergency response agencies, other in country groups orinternational aid organizations can use to improve their situational awareness andfocus attention in areas that may need support.
Table 1 Example of some NASA and other EO data and products useful for landslide hazardassessment (acronyms need to be spelled out—SRTM, SMAP, MODIS, GPW V3)
Data type EO data set Resolution Extent Source
Elevation Shuttle RadarTopography Mission(SRTM)
30 arc-s(*90 m)and 3-arcs(*30 m)
65°N-S
http://www2.jpl.nasa.gov/srtm/
Forestcover andloss
Global Forest Change2000–2013
30m/99.6 %
Global http://glad.umd.edu/projects/gfm/
Rainfall Global PrecipitationMeasurement(GPM) missionIntegrated Multi-satellitERetrievals for GPM(IMERG)
0.1°,30-min
65°N-S
http://pmm.nasa.gov
Soilmoisture
Soil Moisture ActivePassive (SMAP)
Population LandScan and GriddedPopulation of the world,version 3 (GPW V3)
1 km Global http://web.ornl.gov/sci/landscan/; http://sedac.ciesin.columbia.edu/data/collection/gpw-v3
Active fireandburnedareas
Moderate ResolutionImagingSpectroradiometer(MODIS)
1 km Global http://modis-fire.umd.edu/
124 G. Schumann et al.

The landslide susceptibility map going into the LHASA model was developedfor Central America and the Caribbean islands by combining three globallyavailable datasets (slope, soil type and road networks) and one regional dataset(fault zones) using a fuzzy overlay methodology (Kirschbaum et al. 2015b). Thisprimarily heuristic model allows for flexibility both in testing a range of differentcontributing variables as well as incorporating information from landslide inven-tories that greatly vary in their size, spatiotemporal scope, and collection methods.The resulting susceptibility map provides a relative indication of landslide sus-ceptibility across the over 700,000 km2 considered at a resolution of 30 arc s(Fig. 2). We tested a range of satellite-derived products including SRTM DEM,forest cover derived from MODIS and AVHRR. After a modified sensitivityanalysis, slope, topsoil clay content, presence of roads, and distance to fault zoneswere included as variables in the susceptibility map.
To provide an indication of potential timing of the landslide activity, TRMMMulti-satellite Precipitation Analysis (TMPA) data was evaluated over its entirearchive at the time (2000–2014). An antecedent rainfall index (ARI) was calculatedto account for pre-event soil moisture and both daily rainfall and antecedent rainfallpercentiles were computed for each 0.25° × 0.25° pixel. Using landslide infor-mation obtained from the Global Landslide Catalog (Kirschbaum et al. 2010,2015c), the study then computed precipitation thresholds based on the occurrence
Fig. 2 Landslide susceptibility map for Central America and the Caribbean showing very low tovery high susceptibility. Source Kirschbaum et al. (2015a)
Role of Earth Observation Data in Disaster Response … 125

of rainfall at the reported landslide locations. A decision tree framework wasestablished to generate moderate hazard, high hazard, or Null nowcasts based on thethresholds for susceptibility, ARI, and daily rainfall (Fig. 3).
The model is updated every day and is currently running in a prototype mode at:http://ojo-streamer.herokuapp.com/meso. This system provides information on allof the input variables (precipitation, susceptibility, and resulting nowcasts), so thatindividual users can diagnose the conditions at their location of interest as well assee what LHASA generates for potential nowcasts.
2.4.2 Applications and Challenges
The landslide system developed for Central America has a flexible framework thatis customizable for other regions with a small level of effort. Currently, this systemhas been applied in a prototype form in Nepal and Peru. This workflow is alsocurrently being expanded to a global model utilizing a similar approach.
This system provides an overview of potential landslide activity at both regionaland soon global perspectives that currently does not exist. By coupling an indi-cation of susceptibility with the intensity of recent rainfall at that pixel, it provides aregional perspective that can provide valuable situational awareness to a range ofdifferent end users including the international aid organizations such as the
Fig. 3 LHASA Decision tree model. Source Kirschbaum et al. (2015a)
126 G. Schumann et al.

International Federation of the Red Cross,1 global disaster centers such as thePacific Disaster Center,2 the intelligence and military communities, and others. Theframework in which the LHASA system is housed can also allow users to easilyextract the underlying data from this model including remotely sensed precipitation,susceptibility, and landslide nowcasts in a variety of different formats.
The challenges in this system lie in the broad regional and global frameworks onwhich this system was designed. Due to its coarse spatial resolution (*0.01° orapproximately 1 km), it has limited applicability for local emergency responsegroups who may need more detailed, slope-specific information. There is alwaysthe potential for increasing the resolution of this product in some areas, however, amajor challenge stems from the current resolution of triggering data, namely pre-cipitation, as well as the relative dearth of landslide inventories for model cali-bration and validation.
2.5 Conclusions
Landslide hazard assessment and monitoring is rarely undertaken at regional orglobal scales due to the prevailing methodologies that predominately utilize in situdata as well as the techniques that require detailed landslide inventories and trig-gering data. Of all the limitations of conducting landslide hazard assessment overlarger areas and making full use of remotely sensed data, the most challengingelement to overcome is the paucity of landslide inventory data beyond site-specificlocal studies. Optical imagery from EO-1, Landsat imagery can fill a critical need tobetter identify large landslides. Commercial imagery, such as from DigitalGlobe,provides higher resolution data to map an area. While optical methods are at themercy of cloudless skies, SAR capabilities can penetrate clouds and allow fordetection of changes on a landscape on the order of centimeters. All of these remotesensing capabilities have been used before for landslide detection; however, there isstill a need for established, globally acknowledged mapping standards and guide-lines to better utilize remote sensing imagery for landslide inventory assessment.Systems such as LHASA demonstrate the feasibility of applying remotely senseddata in a regional or global context to increase awareness, better understand thetriggering conditions and ultimately improve response to landslide activity.
1www.ifrc.org/.2http://www.pdc.org/.
Role of Earth Observation Data in Disaster Response … 127

3 Nepal 2015 Earthquake: Addressing InternationalDevelopment Challenges Through Scientific Networks
3.1 Introduction
Reaping the societal benefits that Earth Observation Systems (EOS) takes concertedefforts on the part of scientists and managers to understand the specific needs ofbeneficiaries. It also requires a clear understanding of entry points for EOS productsand tools in decision-making processes. This not only requires a well-informed usergroup (potential beneficiaries) but also a group of applied scientists and capacitybuilders who can translate societal needs into possible data- or application-informedsolutions. At the nexus of international development and applied sciences isSERVIR, a joint effort led by the U.S. National Aeronautics and SpaceAdministration (NASA) and the U.S. Agency for International Development(USAID), along with international organizations around the world who have greatcapacity in connecting challenges posed by environmental, climate change, anddisaster management with scientific data and products. A capacity building project,SERVIR strengthens developing countries’ abilities to access and apply Earthobservation data to manage challenges in the areas of food security, water resources,land use change, and natural disasters.3
To do this, SERVIR has created a network of scientists, technologists, trainers,and decision-makers, who collaborate to use Earth observations and geospatialtechnologies to codevelop solutions to environmental challenges. Foci of SERVIRefforts are in regional hubs, which are international organizations or consortia thathave been selected for their history and experience of using GIS and remote sensingfor environmental challenges. SERVIR hubs function to apply appropriate scienceand cutting edge technologies to plug into or become part of existing decisionsupport systems. Active SERVIR regions include Eastern & Southern Africa, led bythe Regional Centre for Mapping of Resources for Development (RCMRD; http://www.rcmrd.org/), the Hindu Kush Himalaya region, led by the International Centrefor Integrated Mountain Development (ICIMOD; http://www.icimod.org/), and theLower Mekong region served by a consortium of the Asian Disaster PreparednessCenter (ADPC; http://www.adpc.net/), Spatial Informatics Group, StockholmEnvironment Institute, and Deltares. USAID regional and bilateral missions play anactive role in funding the hubs and articulating the development challenges, while aScience Coordination Office (SCO, previously called a the SERVIR CoordinationOffice (CO)) at NASA provides scientific and technical backstopping to hubs andmanages an Applied Sciences Team (AST). This AST works to address end-userneeds in SERVIR regions in direct collaboration with hubs. SERVIR addresses awide variety of thematic areas, focusing on food security, land cover/land use andecosystems, water and water-related disasters, and weather and climate.
3https://www.servirglobal.net/.
128 G. Schumann et al.

Given its position to accelerate applications of EO data in decision-makingcontexts in many regions of the world, SERVIR has been leveraged in many casesto provide technical input into emergency mapping and disaster response support,often in the form of rapid satellite image acquisition and interpretation (Boccardo2013). Some of the earliest and strongest demands for information have come fromfire mapping needs (Lewis 2009). Applications and customizations ofsatellite-based fire information are often taken up very quickly by environmentalmanagement and disaster management communities, likely for two reasons: first,the high applicability and accessibility of the Fire Information for ResourceManagement System (FIRMS) (Davies et al. 2009) and MODIS active fire products(Giglio 2010; Justice et al. 2011), and second, a close understanding of the chal-lenges that forest and fire managers face. To further facilitate design and opera-tionalization of such systems, applications have been cofunded and codevelopedbetween SERVIR hubs and with government ministries and departments them-selves. Summaries and examples of disaster response support provided inMesoamerica, Eastern and Southern Africa, and the Hindu Kush Himalaya can befound in Bajracharya et al. (2014), Flores Cordova et al. (2012), Gurung et al.(2014), Graves et al. (2005), Hardin et al. (2005), Macharia et al. (2010) and Wanget al. (2011). Throughout the communication and collaboration that occurs duringneeds assessments, product development, and iterations thereof, a vibrant networkof scientists, technologists, managers, trainers, development professionals, anddecision-makers, have been formed. The remainder of this section focuses on thedescription on one of the many subnetworks that we argue allowed for a successfulintegration of Earth observations into disaster response support.
3.2 Role of Earth Observations in the 2015 NepalEarthquake Facilitated by SERVIR Network
The 25 April 2015 magnitude 7.8 earthquake and aftershocks (including the 12May 2015 magnitude 7.3 aftershock) in Nepal led to over 9000 deaths, widespreaddamage to buildings and infrastructure, over 4000 landslides, avalanches, and othereconomic ramifications (National Planning Commission 2015; Kargel et al. 2016).Immediately following the earthquake, ICIMOD and the participants in theSERVIR network came into play to provide EOS-derived products to informdecision-makers the extent and magnitude of the impact, particularly around thestate of geohazards (ICIMOD 2015).
Before the earthquake, though, a preexisting network of science data productproviders and end users existed (Fig. 4). During the earthquake, ICIMOD and theNASA/SERVIR Coordination Office leveraged the preexisting network to connectICIMOD and government agencies in Nepal with an even broader network ofscience data product providers (Fig. 5). Some 40 volunteer landslide mappers in theU.S., organized by the University of Arizona, NASA, and USGS; and another 40 orso volunteer mappers in Nepal, organized by ICIMOD, were able to put EOS
Role of Earth Observation Data in Disaster Response … 129

products to immediate use by plugging into this strong network that ICIMOD andSERVIR had developed over the previous 5 years. The main audiences forvalue-added products were the Ministry of Home Affairs, Prime Minister’s Office,
Fig. 4 Network connections before earthquake response (prior to April 2015). Orange Disasterresponse coordination, Purple Science/technical collaboration, Gray Project managementconnection, Blue Imaging needs communicated and images provided, Red Landslide mapping,Green Value-added products demanded and provided
Fig. 5 Network connections during earthquake response (April–June 2015). The demand forsituational awareness that satellite images and their analysis provide mushroomed during theearthquake response. The surge in landslide mapping efforts (red) produced information andproducts that were readily transferred through a previously existing network, allowing them toreach government and nongovernment end users in Nepal
130 G. Schumann et al.

and numerous other government agencies in Nepal. USAID offices in Washington,D.C., and in Nepal provided crucial funding and project management support,while the NASA/SERVIR CO connected Earth science data users in Nepal to a vastnetwork of Earth scientists within NASA and outward through its affiliates.
Figures 4 and 5 depict lenses of NASA/SERVIR and ICIMOD for the eventresponse. It is important to note that there were even more collaborators withICIMOD from other countries, more connections between Nepal and the US, moreconnections between ICIMOD and other Nepal agencies, and more connectionsbetween International Charter and international space agencies, than depicted here.
What is the lesson learned here? When it comes to reaping benefits of EO dataaround the world, networks are not formed overnight. Meaningful responses todisasters rely on existing networks of scientific and technical collaboration, aspresented in this brief case study. As of late October 2015, 5760 ad hoc productsand 5840 images have been contributed to the USGS Hazard Data DistributionSystem, the US’s platform for organizing and disseminating its contributions to theCharter (USGS 2015). The absorption and use of such a volume of products andsatellite images require significant capacity to translate these intermediate outputsinto actionable information.
3.3 Conclusions
Much is left to be done toward standardization for international disaster response(McCann and Cordi 2011), but certainly a strong history of collaboration andvibrant network of collaborators eases the connections between how Earth obser-vations can play a role in meeting the demands during disaster response. Eventhough the network analysis presented is from specific project and organizationallenses, it is telling to see how many “connections” there were before the crisis.Also, many more connections were made during the crisis, but it is difficult to knowwhether the same quantity and quality of connections could have been made duringthe crisis response had there not been the previous network connectivity. Withoutsuch prior connections and capacities, we hypothesize that there would not havebeen as effective a response from the EO side.
4 Mapping and Predicting Flood Hazard in the LowerZambezi for the Humanitarian Aid Sector
4.1 The Situation
The Zambezi River is the fourth largest river in Africa and is an important sourcefor biodiversity, agriculture and hydroelectric power. The river flows into the IndianOcean and through eight countries (Zambia, Angola, Namibia, Botswana,
Role of Earth Observation Data in Disaster Response … 131
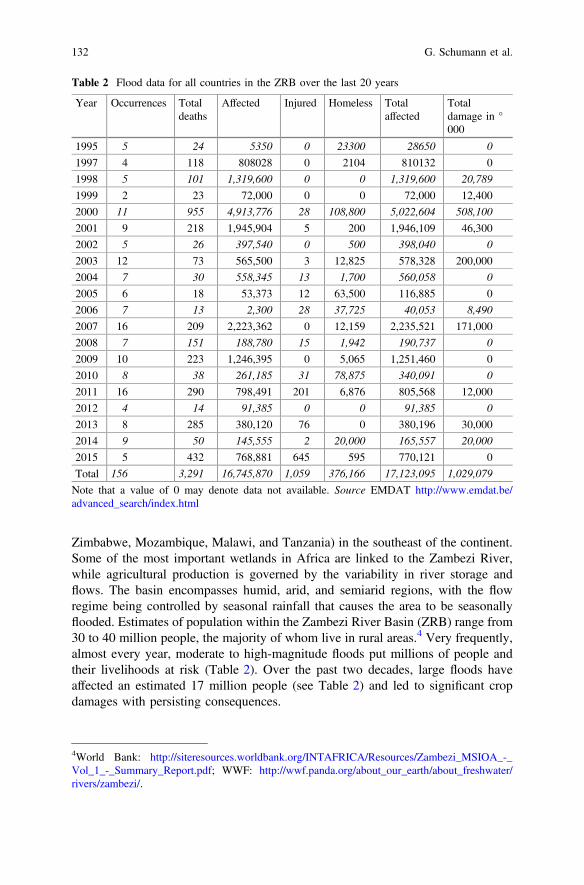
Zimbabwe, Mozambique, Malawi, and Tanzania) in the southeast of the continent.Some of the most important wetlands in Africa are linked to the Zambezi River,while agricultural production is governed by the variability in river storage andflows. The basin encompasses humid, arid, and semiarid regions, with the flowregime being controlled by seasonal rainfall that causes the area to be seasonallyflooded. Estimates of population within the Zambezi River Basin (ZRB) range from30 to 40 million people, the majority of whom live in rural areas.4 Very frequently,almost every year, moderate to high-magnitude floods put millions of people andtheir livelihoods at risk (Table 2). Over the past two decades, large floods haveaffected an estimated 17 million people (see Table 2) and led to significant cropdamages with persisting consequences.
Table 2 Flood data for all countries in the ZRB over the last 20 years
Year Occurrences Totaldeaths
Affected Injured Homeless Totalaffected
Totaldamage in °000
1995 5 24 5350 0 23300 28650 0
1997 4 118 808028 0 2104 810132 0
1998 5 101 1,319,600 0 0 1,319,600 20,789
1999 2 23 72,000 0 0 72,000 12,400
2000 11 955 4,913,776 28 108,800 5,022,604 508,100
2001 9 218 1,945,904 5 200 1,946,109 46,300
2002 5 26 397,540 0 500 398,040 0
2003 12 73 565,500 3 12,825 578,328 200,000
2004 7 30 558,345 13 1,700 560,058 0
2005 6 18 53,373 12 63,500 116,885 0
2006 7 13 2,300 28 37,725 40,053 8,490
2007 16 209 2,223,362 0 12,159 2,235,521 171,000
2008 7 151 188,780 15 1,942 190,737 0
2009 10 223 1,246,395 0 5,065 1,251,460 0
2010 8 38 261,185 31 78,875 340,091 0
2011 16 290 798,491 201 6,876 805,568 12,000
2012 4 14 91,385 0 0 91,385 0
2013 8 285 380,120 76 0 380,196 30,000
2014 9 50 145,555 2 20,000 165,557 20,000
2015 5 432 768,881 645 595 770,121 0
Total 156 3,291 16,745,870 1,059 376,166 17,123,095 1,029,079
Note that a value of 0 may denote data not available. Source EMDAT http://www.emdat.be/advanced_search/index.html
4World Bank: http://siteresources.worldbank.org/INTAFRICA/Resources/Zambezi_MSIOA_-_Vol_1_-_Summary_Report.pdf; WWF: http://wwf.panda.org/about_our_earth/about_freshwater/rivers/zambezi/.
132 G. Schumann et al.

The countries within the ZRB and in particular the downstream country ofMozambique with its vast delta area, suffer from weak infrastructure and resourcesand thus lack the foundational data required to establish effective flood manage-ment, mitigation, and relief services plans, let alone an operative flood forecastingsystem. Despite some local flood forecasting efforts in the ZRB, according to theWorld Meteorological Organization (WMO) there is currently no integrated floodwarning system in the basin, primarily due to poor communication facilities andlimited exchange of information and data in real time (WMO 2009). Furthermore,flow and water level measurement stations are exiguous in most countries in theregion.
This general lack of information regarding the most serious and regular naturalhazard in the region exacerbates the challenges faced by humanitarian emergencyresponse to flood events. The United Nations World Food Programme (WFP) is thefood aid arm of the UN and one of the largest providers of disaster assistance to theregion. In addition to rapid emergency food aid, WFP also provides additionallogistics and emergency telecommunications assistance to organizations that arepart of the overall flood response. Reliable maps showing the extent of rivers andfloodplain inundation as well as associated effects on critical infrastructure providemaximum situational awareness in support of preparedness, response, and recoveryactivities.
Ideally, these types of situational or logistics operational planning maps (Fig. 6)should be delivered in near-real time to WFP field officers on the ground. Atpresent, the only consistently and freely available flood maps delivered in near-realtime are provided by a unique global flood monitoring system funded by NASAusing daily images from the Moderate Resolution Imaging Spectroradiometer(MODIS) onboard NASA’s Terra spacecraft (as illustrated in Fig. 7). With com-posite MODIS images, NASA produces cloud-free maps showing the preciselocations of flooded areas where there may be concomitant (and significant) pop-ulation displacement. NASA also makes the raw GIS data available for downloadenabling overlay of the MODIS analysis on operational planning maps. These mapsare used by WFP staff to pinpoint the worst-hit areas. With the new compositeimages, there is a dramatic increase in mapping accuracy as well as a daily timelineof the progression or recession of the flood waters. Observations of floodplaininundation over time allow disaster relief agencies like WFP to identify seriousflood events and allocate resources and direct operations accordingly.
The challenge faced by both the humanitarian aid sector and the scientificcommunity is twofold: (1) the data received by the flood response teams need to beactionable information (timely, clear, simple to understand and compatible withstandard mapping software such as ESRI) and (2) should not provide a determin-istic, but a probable range of floodplain inundation variables (volume, area, depths),preferably with long lead times, in the form of a simple early warning system. Thiswould allow humanitarian aid agencies such as WFP to more effectively allocateand preposition resources that would ensure the most efficient aid distribution andemergency response. Also, it would allow local and national authorities in theregion to ensure sustainable management in the areas of food security and water
Role of Earth Observation Data in Disaster Response … 133

Fig. 6 Example of a map sent to field response teams in the humanitarian aid sector, in this caseby WFP. This map shows flood evolution in the Lower Zambezi based on MODIS satelliteimagery for the event in February 2008. The map was produced by the Information Technology forHumanitarian Assistance, Cooperation and Action (ITHACA) Institute in Turin, Italy. ITHACA isone of the top-level academic institutions who are enabling WFP to take advantage of recentadvances in remote sensing technology. With this type of help, WFP has rapid access to satelliteimagery analysis of disaster areas. The detailed maps help guide and inform its humanitarianoperations
134 G. Schumann et al.

supply. Most importantly, it would provide the potentially affected communitiestime to prepare accordingly.
4.2 The Challenge
4.2.1 The Scientific World: Thriving to Do It Right
With flood frequency likely to increase as a result of altered precipitation patternstriggered by climate change, there is a growing demand for more data and, at thesame time, improved flood inundation modeling. This is essential for the devel-opment of more reliable flood forecasting systems over large scales that account forerrors and inconsistencies in both observations and modeling. It is clear that there isan ever increasing abundance of forecast models and data that predict the
Fig. 7 Inundation surrounds the Zambezi River in the image in b, captured by the MODIS onFebruary 10, 2007. Mozambique was experiencing its worst floods in 6 years when the Zambeziovertopped its banks in January and February 2007, reported the United Nations Office for theCoordination of Humanitarian Affairs (OCHA). As of February 12, 2007, an estimated 29 peoplehad died and 60,000 had been evacuated from the riverbanks. These images show the lowerZambezi where it meets the Shire River flowing south from Malawi, one of the most severelyaffected regions in Mozambique. The image in b provides a remarkably cloud-free view of thefloods, while the image in a, taken on December 31, 2006, shows the region before the rain startedin January. Images such as these are provided by the MODIS Rapid Response Team and theDartmouth Flood Observatory (http://floodobservatory.colorado.edu) on a daily basis (© NASAEarth Observatory)
Role of Earth Observation Data in Disaster Response … 135

magnitude, frequency, and impacts of extreme weather events, such as floods.Recent and ongoing advances in Numerical Weather System (NWS) modeldevelopment (ECMWF models, NOAA NCEP models, and WRF models) canprovide forecasts of rainfall fields and even streamflow at a high spatial resolutionthat can deliver accurate information at the appropriate regional and basin scale forhydrology.
However, predicting flood inundation in 2-D in near-real time and particularlywith long lead times (i.e. 10 + days) as required by flood relief services is still amajor challenge and only a couple of flood inundation models are actually capableof delivering data at (local) scales appropriate for flood disaster management andemergency response, let alone in near-real time. Over the last few decades, therehave been major advances in the fields of remote sensing, numerical weatherprediction, and flood inundation modeling (Pappenberger et al. 2005). At the sametime, there are currently attempts to roll out models on a continental to global scale(Thielen et al. 2009; Alfieri et al. 2013; Pappenberger et al. 2012; Paiva et al. 2011,2013; Winsemius et al. 2013). In this context, see in particular Sampson et al.(2015) for an illustration of the type of 2-D flood hazard model used in Schumannet al. (2013) for flood inundation forecasting in the Lower Zambezi.
These models, with a few exceptions, predict at a point discharge level withrelatively little attention to accuracy at the appropriate inundation model grid scale.Typical grid resolutions of continental or global scale models dealing with floodinundation processes are in the order of a few tens of square kilometers (Yamazakiet al. 2011; Pappenberger et al. 2012), which is often too coarse to resolve inun-dation pattern details necessary to understand associated local risks. The type ofhydrodynamic model presented by Paiva et al. (2013) in an Amazon River casestudy moves certainly in the right direction in terms of large-scale hydrology andin-channel hydrodynamics but it employs a simple fill operation for the floodplainwith prediction of storage volume only. Since the model lacks floodplain hydrau-lics, it cannot reproduce inundation area dynamically. In addition to these short-comings, most models employed in flood forecasting and mapping use simple flowrouting schemes that only account for the kinematic force term in hydrodynamicsbut ignore diffusion and backwater effects.
Consequently, during many major flood events particularly in coastal areas, suchas Cyclone Eline associated with the devastating floods in Mozambique in 2000 orthe Hurricane Sandy and Katrina events in the U.S., commonly used flood modelsare inadequate. This is worsened by the fact that oftentimes downstreamcoastal-ocean boundaries in inland inundation models are not represented correctlyor missing altogether. The main reason for this is not because such estuary modelsdo not exist but rather that accurate representation of boundary conditions is neededat very high spatial resolution. Advances in computing only made this possible veryrecently. In addition, there is a gap between the coastal and riverine scientificcommunities as these two fields employ computer models that, despite solving verysimilar hydrodynamic equations, require different forcing and input data.
In an attempt to overcome some of the challenges noted, Schumann et al. (2013)built a first large-scale flood inundation forecasting model for data-poor regions and
136 G. Schumann et al.

tested it on the Lower Zambezi basin. In their application, the Variable InfiltrationCapacity (VIC) hydrology model (Liang et al. 1994) is forced with medium-rangeweather forecast reanalysis data to provide flow at entry points to a flood model.The flood model applied is the computationally efficient 2-D hydrodynamic model,LISFLOOD-FP (Bates et al. 2010), complemented with a subgrid channel formu-lation (Neal et al. 2012) to generate flood inundation variables for the LowerZambezi basin. Their forecast system (Fig. 8) showed good performance levels inboth in-channel water levels during the calibration phase (18 cm in error) andflooded area predictions during the validation phase (86 % fit compared to aLandsat image of the 2007 event).
4.2.2 The Decision-Making World: Delivering Actionable Information
It is clear that there is an ever increasing abundance of extreme event data, from allkinds of models and observational systems, as well as other types of geospatial datasets available to describe and quantify the processes, magnitude, frequency, andimpacts from extreme weather and climate change, such as floods. The scientificcommunity is working to provide an enormous volume of valuable geospatialdatasets to the public that can deliver information at various temporal and spatialresolutions spanning the entire natural process of an extreme event. This
Fig. 8 Schematic of the calibration of the VIC hydrology model and the setup of the forecast flowgeneration (left panel). Illustration of the LISFLOOD-FP flood simulation (1 km resolution) at thetime of the (a) ICESat-1 overpass and (b) Landsat overpass in February 2007, using the VICbaseline hydrographs shown. ICESat-1 water level locations and Landsat flood edge points arealso shown. The color shading represents flooded area and water depths in m (right panel).Modified from Schumann et al. (2013)
Role of Earth Observation Data in Disaster Response … 137

information can be in the form of event reanalysis, probabilistic forecast or scenarioprojections.
However, this wealth of information is completely under-utilized by emergencyresponse teams, due to a number of reasons, most of which relate to its relativenovelty: (1) limited time and personnel capacity to understand, extract, process, andhandle new types of geospatial datasets; (2) limited near-real-time data accessibility,bandwidth, and sharing capacity; (3) incompatibility between user platforms andgeospatial data formats; (4) data availability may be simply unknown and/or datalatency may be inadequate; and (5) limited understanding by scientists and engi-neers about end user information product and timing needs; and (6) limited feed-back from end users as to the usefulness and accuracy of the information when thedata is actually made available.
In order to address this frequently encountered mismatch between data avail-ability and end-user needs, geospatial data layers of extreme event prediction rel-evant to stakeholders should be delivered in an easily accessible format, through auser friendly web-based interface such as one that could be provided by Google,Inc., Amazon.com, Inc. or Environmental Systems Research Institute, Inc. (Esri) forinstance.
4.3 Meeting Midway
4.3.1 Innovation
Flood prediction is a major component of any integrated flood management plan,which in turn constitutes an essential part of efficient water resources prediction andmanagement. The Global Flood Working Group (GFWG), a consortium of topscientists and decision-makers concerned with flooding, has identified the need forbetter flood forecasting up to 30-days lead time as one of their primary objectivesand scientific pillars, especially in data-poor regions. A possible way forward maybe to develop a simple and robust satellite-assisted operational early warning sys-tem that can be used to predict with a long lead time (>30 days) a possible range ofanomalous flood water conditions that can manifest themselves in the form ofinundation area, volume, and depth above the mean condition. In order to achieveoptimal use of such a system for emergency flood relief services, the modelingframework proposed for the Lower Zambezi area in collaboration with thehumanitarian aid sector (WFP) and through space agency funding support (NASA,13-THP13-0042) needs to address the following aspects, which makes it unique andquite different from existing (flood) early warning systems:
• Establishing a very long term record of forecast flood inundation that can bequeried using observed antecedent and present satellite soil moisture data (e.g.from satellite missions such as ESA’s SMOS or NASA’s SMAP) as well asforecast rainfall data or forecast flows, or indeed any relevant near-real time
138 G. Schumann et al.

observed or gauged flood variables for that matter. In fact, one may decide touse data assimilation techniques, such as presented by Neal et al. (2009) forexample, to augment the model (forecast) accuracies. Figure 4 (Pillar 1)schematizes one possible modeling framework.
• This flood inundation early warning system or ‘dynamic library’ can be appliedwithout the need to run models and provides not a deterministic but a probablerange of flood inundation with long lead times.
• The proposed system computes actual floodplain flow processes by solving theshallow water equation, using LISFLOOD-FP after Bates et al. (2010) and Nealet al. (2012), and outputs actual flood inundation at high spatial resolution(1 km). Moreover, it is tuned towards a specific high-risk region and thedecision-making needs of one of the largest humanitarian organizations (WFP),which is to look at possible flood inundation projections and not only in-channelflow predictions. This is important since floodwaters exiting the channel willspread across the terrain and inundate the floodplain where the risk and hazardthen inevitably become localized. Note that most existing regional to globalso-called flood (forecasting) models are often hydrologic models and simulatein-channel flow only, and oftentimes with only relatively basic water flowalgorithms.
• Easily transitional to end user and flexible for a wide range of water-relatedissues. The proposed system is tailored specifically towards easy implementa-tion in a variety of decision-making operations.
This is the first time such a system is presented for the ZRB and potentiallyoperated. Currently, neither any operational flood early warning systems nor floodforecasting model dynamically computes inundation patterns at acceptable resolu-tions across floodplains in data-poor regions. Furthermore, given that many floodmodel runs are performed a priori using a wide range of possible flows, manyinundation scenarios can easily be uploaded to a server made accessible tohumanitarian agencies as well as the scientific community. This allows data queriesto be performed easily and files to be downloaded as needed. Also, such a systemwould be straightforward to scale up to a global level (following for example amodel setup similar to that described in Sampson et al. 2015) to address other floodprone hotspots which require almost yearly attention by emergency responders(Fig. 9).
4.3.2 The Way Forward
The Current Situation
In order to respond most efficiently to flood events in the region, WFP needs areliable long lead-time forecast of high-resolution floodplain inundation for itsdecision-making process. At WFP, most of the advanced remote sensing infor-mation is processed/managed at HQ level in Rome, Italy. Data and maps are made
Role of Earth Observation Data in Disaster Response … 139

available to field offices in order to help with strategic planning for the humanitarianresponse. Since computer resources are fairly limited at both HQ and field level, theWFP relies at the moment heavily on support from both the remote sensing com-munity and the weather forecast community, primarily in the form of NRT floodmapping from MODIS, real-time satellite precipitation as well as rainfall forecastsand the GDACS Global Flood Detection System (Version 2) (GDACS GFDS) runby the EC-JRC in collaboration with the UN and Dartmouth Flood Observatory(DFO). However, none of these systems provide forecast on floodplain inundationdespite it being such valuable information. The main reason for this is that the typesof 2-D hydrodynamic models (i.e. flood models) needed to simulate floodplaininundation at high enough spatial resolutions (at least 1 km grids) cannot currentlybe run within an operational forecast mode since these models typically have a highcomputational burden and require very accurate topographic boundary conditions.
A New Approach: Combining Global Flood Model Layers with SatelliteData for Decision-Makers
Facilitating Satellite Data Use for Decision-Makers: The ‘Early Bird Catches theWorm’
The NASA Early Adopter Programs (see the chapter on Early Adopter for moredetails on page 231) are designed to provide specific support to so-called ‘EarlyAdopters’ in prelaunch applied research to facilitate feedback on NASA missionproducts (e.g. SMAP, http://smap.jpl.nasa.gov/science/early-adopters) pre-launch,and accelerate the use of products post-launch. Working with WFP as a SMAPearly adopter, Schumann et al. (2014) started to look into simplifying model outputdelivery, extending forecast lead time and augmenting performance. As outlined
Fig. 9 Schematic of the flood inundation forecasting system proposed for the flood prone regionsin the Lower Zambezi basin. Pillar 1 (personal communication, Neal (2014)) presents one possiblemodeling framework that can be adopted. Pillar 2 illustrates the ‘dynamic’ library that will be theoutput of the modeling in Pillar 1. This library of possible flood inundation scenarios can then bequeried by decision-makers at WFP in our case (Pillar 3)
140 G. Schumann et al.

earlier, in this particular setup, they used ECMWF archived forecast rainfall tocompute flows that generate daily inundation patterns over a period of about10 years using the coupled VIC-LISFLOOD-FP forecast model. These simulationsallow generating a library of flood model outputs (inundated area, floodplain watervolume), essentially from a long time series of rainfall data. They then used thislibrary to correlate and log-regress ECMWF rainfall, satellite soil moisture, andmodel output floodplain inundation volume. Subsequently, the regression model isapplied as a predictor for flood inundation variables and conditions. Using bothforecast rainfall and soil moisture conditions to predict flood inundation volume hasmuch higher skill than using rainfall as a sole predictor (correlation of 0.88 vs. 0.49). In the Mozambique test case, their regression model had a relative bias of17 %, with a relative error in predicting the 2007 flood event of 33 %. In otherwords, based on rainfall forecasts and satellite soil moisture observations that WFPwould have access to, a simple regression can be queried to predict a range ofplausible floodplain inundation volume and area contained in the library, with along lead time. This ‘dynamic library’ could be extended and hosted by theJRC-UN GDACS GFDS platform, which WFP can easily access and is alreadyfamiliar with.Enabling Free and Seamless Data Access with High-End Web-Based Data AnalysisPlatforms
Current efforts can be augmented by including satellite and other observed ormodeled data layers from national agency data centers into web-based data analysisplatforms (e.g. Google Earth Engine) thereby enhancing deliverables that plan tomake satellite-based flood maps and global flood model simulations easily acces-sible through such online platforms. Multiple data layers, such as for instancerainfall products from the Global Precipitation Measurement (GPM) mission or soilmoisture fields, can be handled to feed in seamlessly with the already planned datalayers, i.e., flood hazard data from DFO and maps from a global high-resolutionflood hazard model (Fig. 10). The result would be a multilayer flood event hazardchain ranging from a flood driver layer (i.e., precipitation from the GPM mission)through flood onset layers (soil moisture products) to flood event hazard layers(from NRT MODIS combined with global flood model maps). In addition tomaking all this available on the platforms such as provided by Google, Inc., onecould envisage employing new ICT technologies to deliver these layers seamlesslyand tailored to targeted, more local, stakeholders. New mature geospatial tech-nologies can leverage current data system capabilities such as provided by NASA’sECHO, NSIDC and EOSDIS (Worldview) for example, and allow interoperabilitybetween multiple interactive map viewers on both mobile and traditional computingplatforms. These solutions are now sustainable and extensible thereby increasingthe efficiency for decision-makers and enabling new users to benefit from Earthscience data.
Role of Earth Observation Data in Disaster Response … 141

5 Outlook
The case studies reported in this chapter illustrate great potential and possible waysforward on how the scientific community can engage with the stakeholder com-munity to address most urgent issues, locally, regionally, and globally using EOdata. Such connections could allow meaningful discussion that has up to now beenlargely uncoordinated, oftentimes only taking place on a voluntary effort basis.Such connections are however necessary to globalize and accelerate societalapplications that utilize satellite data. This need is further reinforced by the fact thatalthough societal benefits from satellite observations share a number of commonfeatures, what works for one region may not necessarily work for another region,even when the problems are similar.
It is clear that the satellite technology and science communities must engagewith the stakeholder community to discuss what is possible and most urgentlyneeded. These communities must determine priorities in order to scale up the dataand efforts most efficiently in order to benefit societal applications in the bestpossible way (Hossain 2015). In anticipation of even more data and applicationsfrom Earth observing satellites, the Earth science community should engage intoidentifying key applications alongside key scientific issues. Using these keyapplications as a guide, the Earth science community needs to establish strongconnections with regional stakeholder communities from all around the world,allowing for more rapid dissemination and discovery of EO data at the local level.
Fig. 10 Illustration of one example of new and innovative solutions/approaches.a High-resolution map layers of global flood hazard from 1:100 year return period flow basedon the LISFLOOD-FP model (© University of Bristol/SSBN Ltd) made freely available onGoogle’s visualization platform for noncommercial use. Here the area of the Lower Zambezi isshown with flood depth ranging from 1 m (light blue) to 5 m (pink). b MODIS near-real-timeflood map (© DFO) of a river near the northern border of Texas during the devastating floods inMay/June 2015 (in red) overlain on the 1:100 year flood hazard layer from the global flood modelshown in a (in blue). Note that combining satellite observations and models allows to overcomecommonly encountered limitations in real-time flood mapping, such as obstruction by cloud and/orforest cover as depicted in the image in the top panel in b
142 G. Schumann et al.

Currently, the scientific community has varying perspectives on how thesetechnologies and activities should be pursued in the coming years for the benefit ofdecision-making and societies in general. Since it will undoubtedly take time andeffort to reach consensus, communities should begin to build stronger collabora-tions and engage to address the challenges that lie ahead.
References
Alfieri, L., Burek, P., Dutra, E., Krzeminski, B., Muraro, D., Thielen, J., & Pappenberger, F.(2013). GloFAS—global ensemble streamflow forecasting and flood early warning. Hydrologyand Earth System Sciences, 17, 1161–1175. doi:10.5194/hess-17-1161-2013.
Ayalew, L., & Yamagishi, H. (2005). The application of GIS-based logistic regression forlandslide susceptibility mapping in the Kakuda-Yahiko Mountains. Central Japan,Geomorphology, 65, 15–31. doi:10.1016/j.geomorph.2004.06.010.
Bajracharya, B., Murthy, M. S. R., & Shrestha, B. (2014). SERVIR HIMALYA: Enabling improvedenvironmental management and livelihoods in the HKH. ISPRS-International Archives of thePhotogrammetry, Remote Sensing and Spatial Information Sciences, 1, 1277–1281.
Bates, P. D., Horritt, M. S., & Fewtrell, T. J. (2010). A simple inertial formulation of the shallowwater equations for efficient two-dimensional flood inundation modelling. Journal ofHydrology, 387(1–2), 33–45.
Baum, R. L., Godt, J. W., & Savage, W. Z. (2010). Estimating the timing and location of shallowrainfall induced landslides using a model for transient, unsaturated infiltration. Journal ofGeophysical Research, 115(F03013). doi:10.1029/2009JF001321.
Boccardo, P. (2013). New perspectives in emergency mapping. European Journal of RemoteSensing, 46, 571–582.
Brunetti, M. T., Peruccacci, S., Rossi, M., Luciani, S., Valigi, D., & Guzzetti, F. (2010). Rainfallthresholds for the possible occurrence of landslides in Italy. Natural Hazards and EarthSystems Sciences, 10, 447–458.
Caine, N. (1980). The rainfall intensity: Duration control of shallow landslides and debris flows.Geografiska Annaler Series A, Physical Geography, 62(1/2), 23–27.
Dahal, R. K., & Hasegawa, S. (2008). Representative rainfall thresholds for landslides in the NepalHimalaya. Geomorphology, 100, 429–443. doi:10.1016/j.geomorph.2008.01.014.
Dai, F. C., Lee, C. F., Tham, L. G., Ng, K. C., & Shum, W. L. (2004). Logistic regressionmodelling of storm-induced shallow landsliding in time and space on natural terrain of LantauIsland, Hong Kong. Bulletin of Engineering Geology and the Environment, 63, 315–327.doi:10.1007/s10064-004-0245-6.
Davies, D. K., Ilavajhala, S., Wong, M. M., & Justice, C. O. (2009). Fire information for resourcemanagement system: Archiving and distributing MODIS active fire data. IEEE Transactionson Geoscience and Remote Sensing, 47(1), 72–79.
Ermini, L., Catani, F., & Casagli, N. (2005). Artificial neural networks applied to landslidesusceptibility assessment. Geomorphology, 66(1–4), 327–343. doi:10.1016/j.geomorph.2004.09.025.
Farr, T. G., Rosen, P. A., Caro, E., Crippen, R., Duren, R., et al. (2007). The shuttle radartopography mission. Reviews of Geophysics, 45(RG2004). doi:10.1029/2005RG000183.
Flores Cordova, A. I., Anderson, E. R., Irwin, D., & Cherrington, E. (2012). Contributions ofSERVIR in promoting the use of space data in climate change and disaster management. In63rd International Astronautical Congress 2012. Conference Proceedings. Naples, Italy.
Giglio, L. (2010). MODIS collection 5 active fire product user’s guide version 2.4. ScienceSystems and Applications, Inc.
Role of Earth Observation Data in Disaster Response … 143

Graves, S., Hardin, D., Sever, T., & Irwin, D. (2005). Data access and visualization for SERVIR:An environmental monitoring and decision support system for Mesoamerica. In Earth ScienceTechnology Conference.
Gurung, D. R., Shrestha, M., Shrestha, N., Debnath, B., Jishi, G., Bajracharya, R., et al. (2014).Multi scale disaster risk reduction systems, space and community based experiences over HKHregion. ISPRS—International Archives of the Photogrammetry, Remote Sensing and SpatialInformation Sciences, 1, 1301–1307.
Guzzetti, F., Peruccacci, S., Rossi, M., & Stark, C. P. (2008). The rainfall intensity–durationcontrol of shallow landslides and debris flows: An update. Landslides 5, 3–17. doi:10.1007/s10346-007-0112-1.
Hardin, D., Graves, S., Sever, T., & Irwin, D. (2005). Visualizing Earth science data forenvironmental monitoring and decision support in Mesoamerica: The SERVIR project. In AGUSpring Meeting Abstracts,1.
Hervas, J., Barredo, J. I., Rosin, P. L., Pasuto, A., Mantovani, F., & Silvano, S. (2003). Monitoringlandslides from optical remotely sensed imagery: The case history of Tessina landslide, Italy.Geomorphology, 54, 63–75. doi:10.1016/S0169-555X(03)00056-4.
Hong, Y., Adler, R., & Huffman, G. (2006). Evaluation of the potential of NASA multi-satelliteprecipitation analysis in global landslide hazard assessment. Geophysical Reseach Letters, 33(L22402), 1–5. doi:10.1029/2006GL028010.
Hossain, F. (2015). Data for all: Using satellite observations for social good, Eos, 96. doi:10.1029/2015EO037319.
ICIMOD. (2015). Nepal earthquake 2015: Disaster relief and recovery information platform(NDRRIP). Retrieved 2015, October 25, from http://apps.geoportal.icimod.org/ndrrip/.
Iverson, R. M. (2000). Landslide triggering by rain infiltration. Water Resources Research, 36(7),1897–1910.
Justice, C. O., Giglio, L., Roy, D., Boschetti, L., Csiszar, I., Davies, D., et al. (2011).MODIS-derived global fire products. In Land remote sensing and global environmentalchange (pp. 661–679). New York: Springer.
Kargel, J. S., Leonard, G. J., Shugar, D. H., Haritashya, U. K., Bevington, A., Fielding, E. J., et al.(2016). Geomorphic and geologic controls of geohazards induced by Nepal’s 2015 Gorkhaearthquake. Science, 351(6269).
Kirschbaum, D. B., Adler, R., Hong, Y., Hill, S., & Lerner-Lam, A. (2010). A global landslidecatalog for hazard applications: Method, results, and limitations. Natural Hazards, 52(3),561–575. doi:10.1007/s11069-009-9401-4.
Kirschbaum, D. B., Adler, R., Hong, Y., Kumar, S., Peters-Lidard, C., & Lerner-Lam, A. (2012).Advances in landslide nowcasting: Evaluation of a global and regional modeling approach.Environmental Earth Sciences, 66(6), 1683–1696. doi:10.1007/s12665-011-0990-3.
Kirschbaum, D. B., Stanley, T., & Simmons, J. (2015a). A dynamic landslide hazard assessmentsystem for Central America and Hispaniola. Natural Hazards and Earth System Sciences, 1–32.
Kirschbaum, D. B., Stanley, T., & Yatheendradas, S. (2015b). Modeling landslide susceptibilityover large regions with fuzzy overlay. Landslides. doi:10.1007/s10346-015-0577-2.
Kirschbaum, D. B., Stanley, T., & Zhou, Y. (2015c). Spatial and temporal analysis of a globallandslide catalog. Geomorphology. doi:10.1016/j.geomorph.2015.03.016.
Larsen, M. C., & Simon, A. (1993). A rainfall intensity-duration threshold for landslides in ahumid-tropical environment, Puerto Rico. Geografiska Annaler Series A-physical Geography,75(1/2), 13–23.
Lee, S., & Pradhan, B. (2007). Landslide hazard mapping at Selangor, Malaysia using frequencyratio and logistic regression models. Landslides, 4, 33–41. doi:10.1007/s10346-006-0047-y.
Lewis, S. (2009). Remote sensing for natural disasters: Facts and figures. Science andDevelopment Network. Retrieved 2015, October 16, from http://www.scidev.net/global/earth-science/feature/remote-sensing-for-natural-disasters-facts-and-figures.html.
Liang, X., Lettenmaier, D. P., Wood, E. F., & Burges, S. J. (1994). A simple hydrologically basedmodel of land surface water and energy fluxes for general circulation models. Journal ofGeophysical Research: Atmospheres (1984–2012), 99(D7), 14415–14428.
144 G. Schumann et al.

Macharia, D., Korme, T., Policelli, F., Irwin, D., Adler, B., & Hong, Y. (2010). SERVIR-Africa:Developing an integrated platform for floods disaster management in Africa. In 8thInternational Conference African Association of Remote Sensing of the Environment(AARSE), Addis Ababa, Ethiopia, 25–29 October, 2010.
Mathew, J., Jha, V. K., & Rawat, G. S. (2009). Landslide susceptibility zonation mapping and itsvalidation in part of Garhwal Lesser Himalaya, India, using binary logistic regression analysisand receiver operating characteristic curve method. Landslides, 6, 17–26. doi:10.1007/s10346-008-0138-z.
Mazzanti, P. (2011). Displacement monitoring by terrestrial SAR interferometry for geotechnicalpurposes. Geotechnical Instrumentation News, (June), 25–28.
McCann, D. G., & Cordi, H. P. (2011). Developing international standards for disasterpreparedness and response: How do we get there? World Medical & Health Policy, 3, 1–4.doi:10.2202/1948-4682.1154.
Melchiorre, C., Matteucci, M., Azzoni, A., & Zanchi, A. (2008). Artificial neural networks andcluster analysis in landslide susceptibility zonation. Geomorphology, 94(3–4), 379–400.doi:10.1016/j.geomorph.2006.10.035.
National Planning Commission. (2015). Nepal earthquake 2015: Post disaster needs assessment.Government of Nepal. Retrieved 2016, January 14, from http://www.npc.gov.np/images/download/PDNA_Volume_A.pdf.
Neal, J. (2014). Personal communication. Bristol, UK: School of Geographical Sciences,University of Bristol.
Neal, J., Schumann, G., Bates, P., Buytaert, W., Matgen, P., & Pappenberger, F. (2009). A dataassimilation approach to discharge estimation from space. Hydrological Processes, 23,3641–3649. doi:10.1002/hyp.7518.
Neal, J. C., Schumann, G., & Bates, P. D. (2012). A subgrid channel model for simulating riverhydraulics and floodplain inundation over large and data sparse areas. Water ResourcesResearch, 48. doi: 10.1029/2012WR012514.
Paiva, R. C. D., Collischonn, W., & Tucci, C. E. M. (2011). Large scale hydrologic andhydrodynamic modelling using limited data and a GIS based approach. Journal of Hydrology,406, 170–181.
Paiva, R. C. D., Collischonn,W., & Buarque, D. C. (2013). Validation of a full hydrodynamic modelfor large-scale hydrologic modelling in the Amazon. Hydrological Processes, 27, 333–346.
Pappenberger, F., Beven, K. J., Hunter, N., Gouweleeuw, B., Bates, P., De Roo, A., & Thielen,J. (2005). Cascading model uncertainty from medium range weather forecasts (10 days)through a rainfall-runoff model to flood inundation predictions within the European FloodForecasting System (EFFS). Hydrology and Earth System Sciences, 9(4), 381–393.
Pappenberger, F., Dutra, E., Wetterhall, F., & Cloke, H. (2012). Deriving global flood hazard mapsof fluvial floods through a physical model cascade. Hydrology and Earth System Sciences, 16,4143–4156.
Petley, D. N. (2011). Global deaths from landslides in 2010 (updated to include a comparison withprevious years). Landslide Blog. Retrieved from http://blogs.agu.org/landslideblog/.
Petley, D. N., Crick, W. D. O., & Hart, A. B. (2002). The use of satellite imagery in landslidestudies in high mountain areas. In The Proceedings of the 23rd Asian Conference on RemoteSensing (ACRS 2002), Kathmandu.
Pradhan, B., & Lee, S. (2010). Landslide susceptiblity assessment and factor effect analysis:Backpropagation artifical neural networks and their comparison with frequency ratio andbivariate logistic regression modelling. Environmental Modelling and Software, 25, 747–759.doi:10.1016/j.envsoft.2009.10.016.
Rossi, M., Kirschbaum, D., Luciani, S., & Guzzetti, A. C. M. F. (2014). Comparison of satelliterainfall estimates and rain gauge measurements in Italy, and impact on landslide modeling.Natural Hazards and Earth System Sciences (in preparation).
Saito, H., Nakayama, D., & Matsuyama, H. (2010). Relationship between the initiation of ashallow landslide and rainfall intensity—Duration thresholds in Japan. Geomorphology,118(1–2), 167–175. doi:10.1016/j.geomorph.2009.12.016.
Role of Earth Observation Data in Disaster Response … 145

Sampson, C., Christopher, C., Smith, A. M., Bates, P. D., Neal, J. C., Alfieri, L., & Freer, J. E.(2015). A high-resolution global flood hazard model. Water Resources Research. doi:10.1002/2015WR016954.
Schumann, G. J.-P., Neal, J. C., Voisin, N., Andreadis, K. M., Pappenberger, F.,Phanthuwongpakdee, N., et al. (2013). A first large scale flood inundation forecasting model.Water Resources Research, 49(10), 6248–6257.
Schumann, G. J.-P., Andreadis, K., Niebuhr, E., Rashid, K., & Njoku, E. (2014). A simple satelliteand model based index for forecasting large-scale flood inundation in data-poor regions. InProceedings of the EGU General Assembly, 1157, EGU, 28 April–2 May 2014.
Thielen, J., Bartholmes, J., Ramos, M.-H, & De Roo, A. (2009). The European flood alert systempart 1: Concept and development. Hydrology and Earth System Sciences, 13, 125–140.
USGS. (2015). Hazards Data Distribution System (HDDS) Explorer—USGS. Retrieved 2015,October 28, from http://hddsexplorer.usgs.gov.
Wang, J., Hong, Y., Li, L., Gourley, J. J., Khan, S. I., Yilmaz, K. K., et al. (2011). The coupledrouting and excess storage (CREST) distributed hydrological model. Hydrological SciencesJournal, 56(1), 84–98.
Winsemius, H. C., Van Beek, L. P. H., Jongman, B., Ward, P. J., & Bouwman, A. (2013).A framework for global river flood risk assessments. Hydrology and Earth System Sciences,17, 1871–1892.
WMO. (2009). Regional Consultation Meeting on Zambezi River Basin Flood Forecasting andEarly Warning Strategy and WMO Information System (WIS) and WIGOS Pilot Project, FinalReport, WMO and USAID, Maputo, Mozambique, Africa, 1–5 Dec. 2009. Geneva,Switzerland: World Meteorological Organization (WMO).
Yamazaki, D., Kanae, S., Kim, H., & Oki, T. (2011). A physically-based description of floodplaininundation dynamics in a global river routing model. Water Resources Research, 47, W04501.doi:10.1029/2010WR009726.
146 G. Schumann et al.
Applying Earth Observations to WaterResources Challenges
Christine M. Lee, Aleix Serrat-Capdevila, Naveed Iqbal,Muhammad Ashraf, Benjamin Zaitchik, John Bolten, Forrest Meltonand Bradley Doorn
Abstract Since 2007, significant strides have been made to build the appliedresearch and Earth observations (EO) capacity building community and developpathways for NASA and Earth observations to help address challenges in waterresources. Water is both a critical research topic (e.g. understanding the globalwater cycle) as well as a critical resource for civilization. As a result, there is aconsensus that information about water availability could be valuable for improvedmanagement and for water security. The biggest challenge in developing usefulapplications is finding a way to translate research products, intended to addressresearch questions, to applications that can yield a societal benefit. This chapteraddresses the current challenges and future prospects of earth observing systems inthe field of water resources.
C.M. Lee (&)NASA Jet Propulsion Laboratory, California Institute of Technology, Pasadena, USAe-mail: [email protected]
A. Serrat-CapdevilaUniversity of Arizona, Tuscon, AZ, USA
N. Iqbal � M. AshrafPakistan Council of Research in Water Resources, Islamabad, Pakistan
B. ZaitchikJohns Hopkins University, Baltimore, USA
J. BoltenNASA Goddard Space Flight Center, Greenbelt, USA
F. MeltonCooperative for Research in Earth Science and Technology,NASA Ames Research Center, Moffett Field, USA
B. DoornNASA Headquarters, Washington, DC, USA
© Springer International Publishing Switzerland 2016F. Hossain (ed.), Earth Science Satellite Applications,Springer Remote Sensing/Photogrammetry, DOI 10.1007/978-3-319-33438-7_6
147

1 Overview and Current Status
Scientists from remote sensing and capacity building communities have made sig-nificant progress in applying satellite data and hydrologic models to address a rangeof water resource management challenges. Much of this progress occurred followingthe release of the Earth Science and Applications from Space (“the Decadal Survey”)in 2007, which identified priority areas for Earth Science, among which were Earthobservations for water-related missions (NRC 2007). The Decadal Survey alsounderscored the importance of societal benefit and applications (NRC 2007). Theconvergence of this movement towards building capabilities to understand the globalhydrologic cycle and the increasing awareness and understanding of water securityissues (United Nations 2015) uniquely position the Earth observations and remotesensing communities to, through applications, provide direct support to addressingwater resources challenges. However, while there is consensus that water availabilityinformation could be valuable for improved management and for water security(GEOSS 2014), the process for doing so is fraught with numerous challenges. Forexample, finding an appropriate way to translate data, originally intended to addressresearch questions, to applications that can yield direct societal benefits, is among themost difficult challenges faced by the research-to-operations community. Barriers tothis translation are often related not just to technical capacity, but also institutional,organizational, and resource (such as access to infrastructure) capacity and the needto build a common language among team members around a partnership or project.
Currently, there are 18 NASA Earth observing missions that enable scientificinsights into the water cycle and also provide useful information to those facingwater-related challenges. One prime example of this is in the United States: the U.S.Drought Monitor (USDM) has been an important activity that integrates variousdatasets to reflect drought conditions. USDM also utilizes and references satellitedata to communicate and illustrate the onset and extent of drought events, includingthe flash drought in the central U.S. in 2012, and the ongoing multi-year drought inCalifornia and Western U.S. (National Drought Mitigation Center et al.).
The following case studies represent science applications development that lookto address critical water security issues in East Africa (Mara Basin, Nile RiverBasin), South Asia, and with a global lens. These case studies prioritize partnershipdevelopment and capacity building, citing such efforts as essential to enablingimproved access to and use of Earth observations-based information for theirrespective decision contexts.
The two key challenges in working in the water resources domain include thefollowing:
1. Water basins cross political boundaries—that is, where water is contained andavailable is different from how water is managed and treated. Hydrologicboundaries, which can also vary based on whether one is considering watersupply on land surfaces or subsurface, are not the same as managementboundaries. This issue exists in the U.S., where water is transported across stateboundaries to support cities/populations that are hundreds of miles away from its
148 C.M. Lee et al.
watershed of origin. This is also an issue in transboundary water basins in, forexample, the Nile River in East Africa or the Mekong in Southeast Asia, whichspan multiple countries. Critically, management decisions, such as the con-struction of dams, can impact neighboring countries sharing that basin.
2. Water security is dependent on howmuchwater is available, andwater availabilityis dependent on hydrology (what is physically present and accessible) anddemands—i.e., who is using water and for what purpose (drinking, sanitation,agriculture, municipal, and industrial), which is also closely tied to infrastructureand development. Security as it relates to freshwater availability is also extremelyvulnerable to weather and climate conditions, including changes in precipitationseasonality and inter-annual variability (Feng et al. 2013), precipitation type/phase(rain vs snow) (Barnett et al. 2005), and extremes such as floods and droughts.
Other critical challenges for this community include
3. Understanding how and what water-related information is useful;4. Bridging the research to operations gap; and5. Resources to fund activities on the partner or user end can be difficult to obtain
The following case studies examine how applied scientists and researchers havefacilitated the use of Earth observations to develop improved data products andsupport water management practices.
2 Case Study 1. East Africa Mara Basin (2011-present)
Aleix Serrat-Capdevila
The SERVIR Water Africa—Arizona Team Project in the Mara Basin
Summary of Project. As part of the NASA-U.S. Agency for InternationalDevelopment (USAID) SERVIR (Sistema Regional de Visualización y Monitoreo)Program and its Applied Sciences Team (AST), the University of Arizona has beenworking with government agencies and stakeholders from three basins in Africa tobetter inform water and environmental management decisions. The project supportsbasin-level water management by developing monitoring and forecasting toolsusing Earth observations and meteorological forecasts with rainfall-runoff hydro-logic models. Since different satellite rainfall products and models have differentstrengths and weaknesses, a multi-product and multi-model approach was adopted,with the aim of identifying the most suitable approach to supporting decisions.
The three basins that this project focused on are in Africa: the Tekeze River inEthiopia and Eritrea, the Upper Zambezi in Zambia and Angola, and the Mara Riverin Kenya and Tanzania. These basins vary by size, topography, latitudes, andmanagement challenges. In this case study, we focus on the Mara River Basin. Theproject has a three-pronged approach to provide operational capabilities forhydrologic monitoring and forecasting (Fig. 1), which are as follows:
Applying Earth Observations to Water Resources Challenges 149

(1) Real-time monitoring and short-term forecasting of rainfall and streamflow:use of real-time satellite estimates of precipitation, 7-day meteorologicalforecasts, and rainfall-runoff models to provide 7–10 day streamflow forecasts.
(2) Medium-term seasonal forecasting: use of downscaled and bias-corrected6-month ahead seasonal forecasts from sister AST project to run our hydro-logic models.
(3) Long-term projections of future climate change impacts on regional waterresources, using bias-corrected multimodel projections of rainfall and tem-perature to drive our hydrologic models.
Description of Target Region. The Mara Basin is located in Kenya andTanzania between the equator and 2° S, draining into Lake Victoria. Most of itswater comes from the highlands of the Mau plateau, where the Mau Forest and teaplantations are, and flows down the Mau escarpment via two main tributaries, theNyangores and the Amala, which unite to form the Mara River upstream of thegrasslands and savannas of the Massai Mara (Kenya) and Serengeti (Tanzania)national parks (McClain et al. 2014). As many other basins in Kenya, the sus-tainability challenges in the Mara Basin are related to population growth, land-usechange, and increased water abstractions, leading to the decrease of ecosystemservices and functions. The Mau forest is a natural regulating system that buffersfloods, enhances infiltration, and maintains base flows downstream in the gamereserves during the dry seasons.
Management Challenges in Agriculture. Human encroachment for woodextraction and expansion of agricultural land (Fig. 2) affect these functions as wellas increases the volume of abstracted water upstream in the basin. In addition,
Fig. 1 The three-pronged approach to develop operational monitoring and forecasting capabilitiesto support water and environmental management activities at different time horizons, ranging fromshort-term water allocation and ecological management, to seasonal allocation and drought/floodpreparedness, and long-term adaptation and resilience planning
150 C.M. Lee et al.

current development plans in the basin include the construction of dams and theexpansion of agriculture, a vision that is shared across Africa (UN Water/Africa2015). As permitted, abstractions have increased in Kenyan basins, and the numberof days with very low downstream flows during the dry seasons has progressivelyincreased as well. Poor monitoring and forecasting capabilities are considerableobstacles to the sustainable management of water resources, the long-term viabilityof agricultural development, and the conservation of natural ecosystems that gen-erate important tourism revenues.
2.1 Understanding User Requirements for DecisionMakings
The process for developing useful monitoring and forecasting applications fordecision-making starts by understanding the decision-making challenges and con-text in which these will be used; an important element for success for an applica-tions project is continued engagement with and participation from end users whosedecisions could potentially benefit from the application being developed.
To develop an understanding and working partnership with our users (andultimately understand their management context, challenges, and opportunities tobenefit existing decision practices), we approached partnership developmentthrough several avenues including
(1) we worked with an in-region partner, who was a hub and bridge to countryministries who were our end users. That partner is the Regional Center forMapping of Resources for Development (RCMRD—Nairobi SERVIR Hub);
(2) we established regular communications with our end users through meetingsand informal discussions;
Fig. 2 Land use change in the Mara Basin: the expansion of small-scale agricultural fields (left) isa significant pressure on the Mau Forest Reserve (right). Tea plantations can be seen, used here asbuffer to prevent human encroachment (Image source: Google)
Applying Earth Observations to Water Resources Challenges 151
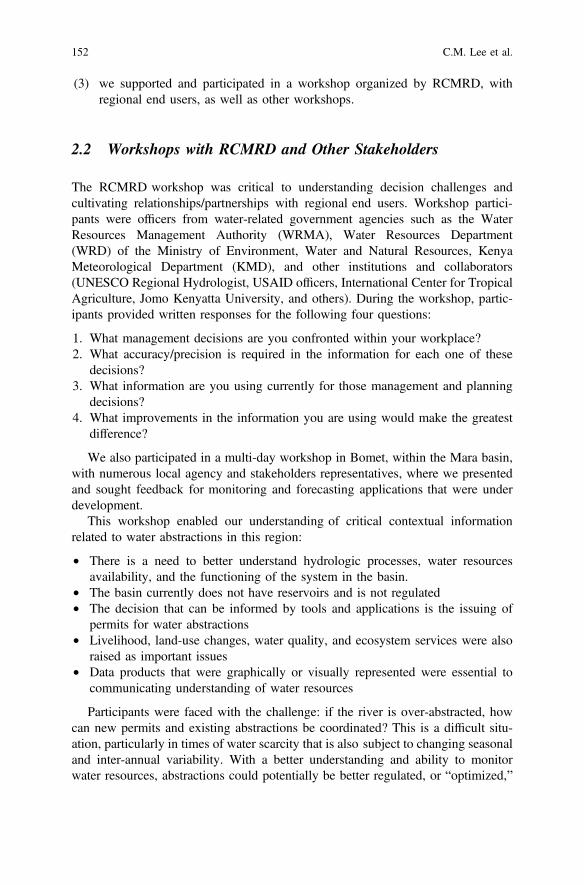
(3) we supported and participated in a workshop organized by RCMRD, withregional end users, as well as other workshops.
2.2 Workshops with RCMRD and Other Stakeholders
The RCMRD workshop was critical to understanding decision challenges andcultivating relationships/partnerships with regional end users. Workshop partici-pants were officers from water-related government agencies such as the WaterResources Management Authority (WRMA), Water Resources Department(WRD) of the Ministry of Environment, Water and Natural Resources, KenyaMeteorological Department (KMD), and other institutions and collaborators(UNESCO Regional Hydrologist, USAID officers, International Center for TropicalAgriculture, Jomo Kenyatta University, and others). During the workshop, partic-ipants provided written responses for the following four questions:
1. What management decisions are you confronted within your workplace?2. What accuracy/precision is required in the information for each one of these
decisions?3. What information are you using currently for those management and planning
decisions?4. What improvements in the information you are using would make the greatest
difference?
We also participated in a multi-day workshop in Bomet, within the Mara basin,with numerous local agency and stakeholders representatives, where we presentedand sought feedback for monitoring and forecasting applications that were underdevelopment.
This workshop enabled our understanding of critical contextual informationrelated to water abstractions in this region:
• There is a need to better understand hydrologic processes, water resourcesavailability, and the functioning of the system in the basin.
• The basin currently does not have reservoirs and is not regulated• The decision that can be informed by tools and applications is the issuing of
permits for water abstractions• Livelihood, land-use changes, water quality, and ecosystem services were also
raised as important issues• Data products that were graphically or visually represented were essential to
communicating understanding of water resources
Participants were faced with the challenge: if the river is over-abstracted, howcan new permits and existing abstractions be coordinated? This is a difficult situ-ation, particularly in times of water scarcity that is also subject to changing seasonaland inter-annual variability. With a better understanding and ability to monitorwater resources, abstractions could potentially be better regulated, or “optimized,”
152 C.M. Lee et al.

with a balance be found between much-needed environmental flows during the dryseason, which support the Masai Mara and Serengeti ecosystems, and other uses.
Bringing together stakeholders and sectors to build awareness and familiaritywith remote sensing information and applications was very valuable for this project.Furthermore, we were able to begin providing a basis for a common language andan expanded understanding of the basin system (from the scientists’ perspectivesand from the partners’ perspectives). These interactions also facilitated the identi-fication of future opportunities to collaborate and evolve the partnership and project.Other decision and planning contexts that this project could provide value toincludes the planning and constructions of future reservoirs, preparing for droughtand floods, and ecocystems protections (particularly during dry season).
In response to learning these additional priorities and feedback, wewere able to adaptour model development efforts and translated our calibration approach to give equalimportance to simulating low flows as well as high flows. We also took into accountstakeholder feedbackaboutdata latencychallengesandautomatedour operational onlinebroadcasting platform to update rainfall estimates in as products become available.
In addition to learning about areas of needs, our partnership also allowed us tocommunicate regularly about how to effectively use the application outputs—e.g.under what conditions and in what scenarios. For example, our rainfall-runoffapplications did not always appear to be well-suited for flood alerts, as the relativeerrors in satellite estimates can accumulate during flood events, impacting magnitudeand timing-of-event characteristics. We also emphasized the importance of usingknowledge of uncertainty as a way to understand how precise simulated products areover a given timeframe. As generate practice, we shared guidance for how to useknowledge of uncertainty in conjunction with deterministic models.
Currently, the project provides bias-corrected and downscaled rainfall monitoringdisplays over its pilot basins, including in the Mara (Fig. 3); multimodel/productsimulations and bias-corrected streamflows, with a good uncertainty characterizationin model runs; and a merged forecast, probabilistically assimilating the individualmodel–product combination forecasts and their uncertainty (Roy et al. 2016). Thestreamflow monitoring and 7–10 day forecasts are operational in the Mara basin andthe Zambezi, and they are being implemented in the Tekeze basin. The seasonalforecasting system is operational in the Upper Zambezi. The monitoring displaysand forecasts can be found for the three pilot basins at the project site www.swaat.arizona.edu with interactive visualizations for the streamflow forecasts (Fig. 4), forimproved access and communication with agencies and stakeholders.
Conclusions. The project is entering its fourth year as of the end of 2015, duringwhich these toolswill be fully transferred toRCMRD(theSERVIRHub inNairobi) andinterested agencies, while we also continue to run and broadcast the forecasts online.
The face-to-face interactions were essential to build trust, strengthen connectionswith key individuals, and build a foundation for future work, new data acquisition,results sharing, and implementation. The continued dialog with users and stake-holders enables the project to incorporate feedback on an on-going basis andunderstand how useful a technical will be and how it will be used after itsdelivery. As such, tracking the trajectory of communications can, in itself, be a
Applying Earth Observations to Water Resources Challenges 153

reflection of how valuable the tool is to the stakeholders. Ideally, such tools can beevolving applications that are fine-tuned as new remote sensing products becomeavailable and management needs evolve.
3 Case Study 2. Africa Nile River Basin (2009–2014)
Benjamin Zaitchik
NASA’s Project Nile—Distributed hydrological information for water manage-ment in the Nile Basin
Summary of Project. This work aimed to apply NASA tools in support of scien-tifically informed water management in nations that share the Nile basin (Fig. 5).Over the course of the project (2009–2014), U.S. scientists at Johns Hopkins
Fig. 3 Real-timebias-corrected satelliteestimates over the MaraBasin. In the case of TMPA(left) and CMORPH (notshown), estimates at 0.25°were bias-corrected anddownscaled using theCHIRPS reference dataset at0.05°. In the case ofPERSIANN-CCS, estimateswere bias-corrected andre-gridded from their original0.04°–0.05° to obtain aconsistent input torainfall-runoff models.Figure rendered by T. Roy
154 C.M. Lee et al.

Fig. 4 Experimental interactive displays of streamflow simulations, with 95 % confidenceintervals and a merged forecast from Bayesian model averaging. Aggregated basin precipitation isshown in the upper part of the visualization. Note that the user can select the model and productcombinations to be shown. Visualizations by M. Durcik and simulation work by T. Roy, A.Serrat-Capdevila, J. Valdes and H. Gupta
Applying Earth Observations to Water Resources Challenges 155

Fig. 5 The Nile basin, which spans eleven countries. The Project Nile domain included the entirebasin, and at partner request the project’s LDAS and ALEXI products were extended to include thefull territory of all of these countries except for the Democratic Republic of Congo
156 C.M. Lee et al.

University, NASA, U.S. Department of Agriculture (USDA), and the University ofWisconsin worked with partners at USAID, the Nile Basin Office Eastern NileRegional Technical Office (NBI-ENTRO), the Ethiopian National MeteorologicalAgency and Environmental Protection Agency, and Addis Ababa University. Theteam developed satellite-based land cover maps, produced satellite-derived evapo-transpiration estimates using a new Meteosat implementation of the USDAAtmosphere Land Exchange Inverse model (ALEXI), and implemented a Land DataAssimilation System (LDAS) customized to match identified information needs.
The work led to improved water balance estimates across the Nile Basin,enhancements to NASA modeling tools, and ongoing collaborations of flood anddrought response and climate change adaptation in the Nile and surrounding regions.The research accomplishments of the project are represented in a number ofpeer-reviewed publications (Anderson et al. 2012a, b; Berhane et al. 2014; Foltz et al.2013; Satti et al. 2015; Shortridge, et al. 2015; Simane et al. 2013; Wilusz et al. inreview; Yilmaz et al. 2014; Zaitchik et al. 2012). Water resource applicationsaddressed in these publications include drought monitoring (Anderson et al. 2012a,b), wetlandmapping (Wilusz et al. in review), estimates of irrigatedwater use (Yilmazet al. 2014), climate vulnerability analysis (Foltz et al. 2013), agricultural land clas-sification (Simane et al. 2013), and hydroeconomic optimization (Satti et al. 2015).
NASA Data and Transboundary Water Challenges. Project Nile exemplifiedthe potential that NASA products have to inform decision making in a contentioustransboundary basin. In 2011, LDAS and ALEXI outputs were featured in the NileBasin Initiative Donors Meeting in Copenhagen and the Ethiopian NationalAdaptation Plan of Action (NAPA) was submitted to the United Nations FrameworkConvention on Climate Change to the Nile Basin Initiative’s Atlas of the Nile Basin.In each case, the objectivity, trans-national consistency, and non-political nature ofNASA-based analysis facilitated open discussion of hydrology of the basin.Demonstrations of decision support were also performed with the Ethiopian Ministryof Water, Irrigation and Energy, in which Project Nile LDAS was used to drive aWater Evaluation and Planning (WEAP) system model for the Lake Tana basin.Data were also provided to decision makers at Egyptian Ministry of WaterResources and Irrigation, with a similar analysis in mind. There were discussions ofmaking the Project Nile LDAS available as a near real-time data product distributedthrough NASA data servers, but given geographic overlap with other NASA projectsit was decided that LDAS innovations accomplished in Project Nile could be fed intoother LDAS systems that cover East Africa, including FEWSNET LDAS (FLDAS),which is now distributing a similar analysis through NASA data portals.
Additional Benefits ofProject Nile.Project Nile has been leveraged for numerousfollow-on collaborations across East Africa and, in the case of ALEXI, all of Africa.From a capacity building perspective it has yielded lasting relationships with projectpartners in Ethiopia, Sudan, Egypt, Kenya, and Uganda, who continue to engage tolearn about new NASA products and to improve their modeling skills. We have heldworkshops for government scientists and academics from Ethiopia, Sudan, Kenya,Rwanda, and Uganda on satellite-based land cover mapping, the theory and use ofALEXI, and the application of Project Nile LDAS to water resource analysis.
Applying Earth Observations to Water Resources Challenges 157

Challenges: Contention Around Water in the Nile Basin. This project alsoencountered significant challenges that were not rooted in technical or scientificelements of the work but instead were the product of changing geopolitical land-scapes. At the time the proposal was written, the Nile Basin Initiative (NBI) wasworking toward a comprehensive water-sharing framework that would include allmember States. During the life of the project, however, the Ethiopian governmentbegan construction on the largest hydropower dam in Africa over intense Egyptianobjections, resulting in Egypt and Sudan abandoning NBI negotiations for severalyears, which was then compounded by several transitions in government in Egypt,the founding of South Sudan and its subsequent political turmoil. These events,among others, complicated relationships within NBI. NBI-ENTRO experiencednearly 100 % staff turnover and several changes in strategic vision, while NBIpolitical leadership embraced, then rejected, and subsequently re-embraced theprinciple of collaborating with NASA for water resource analysis. We workedaround these complications by broadening our base of partners at national gov-ernment agencies, international organizations, and universities in the region,allowing the project to continue providing value to the region project’saccomplishments.
Partnerships Lessons Learned. There is no question that the stated capacitybuilding goals of the project suffered due to these institutional difficulties: whileProject Nile has contributed to the technical understanding of the Nile water bal-ance and its end products have been utilized by decision makers, political barriersand staff turnover within the NBI made it not feasible to achieve operationalhand-off to NBI-ENTRO in the timeframe that we were working.
Given this experience, Project Nile has shares a few important considerations forother applied sciences projects that may have a focus in transboundary basinswhere political instability can be a huge facet of the project landscape:
(1) Considerations for partnering with regional organizations (with membersstates) or working directly with country ministries. In the case of working intransboundary water basins, this consideration is well illustrated by comparingoptions for partnering organizations: for example, international river com-missions in the developing world, with multiple member states, are generallythought to hold the most promise for advancing collaborative water man-agement, as opposed to unilateral development by each member country.However, these organizations are not always fully empowered (both techni-cally and politically) to make substantive progress in these areas relative tomember countries. We encountered this tension between regional river com-missions and member countries when considering whether to work with therelatively high capacity water ministries in one or more Nile basin countries orto attempt to partner with NBI despite their relative political (and hencetechnical) fragility. Insomuch as the success of an Applied Sciences project isdefined in terms of successful transition of an advanced NASA product,modeling or observation system, in our case, there was an advantage toworking with single countries. If the goal is to apply NASA analysis in
158 C.M. Lee et al.

partnership to advance scientifically informed water sharing; however, thenworking with basin commissions may be the more appropriate partner. Indeed,providing a NASA analytical backbone for these organizations has thepotential to empower them in the eyes of their member States.
(2) Considerations for partnering with an operational agency or a research entity.Partnering with an academic or research institute may have allowed ProjectNile to sidestep some of the challenges related to political circumstances thatthen impeded development of capacity for project hand-off. It is possible thatProject Nile would have been able to transit an improved model or product toanother research group or university with greater institutional and staff sta-bility. This may be because many countries’ operational water resourceagencies not have the political and financial flexibility to be fully engagedpartners: data are proprietary, decision support systems can be resistant tochange, and staff and IT time may not be available.
While development and provision of a mature analysis tool has the potential tomotivate cost-sharing investments from the end user, our experience with ProjectNile would suggest an alternate strategy for projects that are higher risk or requirepreliminary demonstration to win buy-in. For that subset of projects, it can be morevaluable and productive to partner with an academic organization or an independentresearch center, where there is the flexibility and mandate to work on transformativeanalysis. Such projects are unquestionably “applied” in their objectives, but theyfall on the low end of the Applications Readiness Level (ARL) scale and mightneed partnership from a research group even more than they need immediate accessto decision makers. Furthermore, many lower capacity countries turn to universitiesand research centers for their technical and scientific expertise and in that way theseentities can serve as a conduit to an operational partner. Capacity building, thus,that is focused on non-political research institutions would likely have additionalbenefits for member states. We have found that these secondary partnerships withnon-politicized, in-region academic and research centers provided the best datasharing relationships and strongest capacity building legacy for Project Nile.
4 Case Study 3 Pakistan: Role of Earth Observationfor Operational Groundwater Resource Managementin Pakistan: A Capacity Building Perspectivefrom Pakistan (2014-)
Naveed Iqbal
Challenge Summary. Sustainable groundwater resource management is essentialto ensure food security and sustainable socioeconomic development of an agrariancountry like Pakistan. Surface water availability is scarce and subject to limitedstorage, increasing population, variable climate conditions, and the occurrence of
Applying Earth Observations to Water Resources Challenges 159
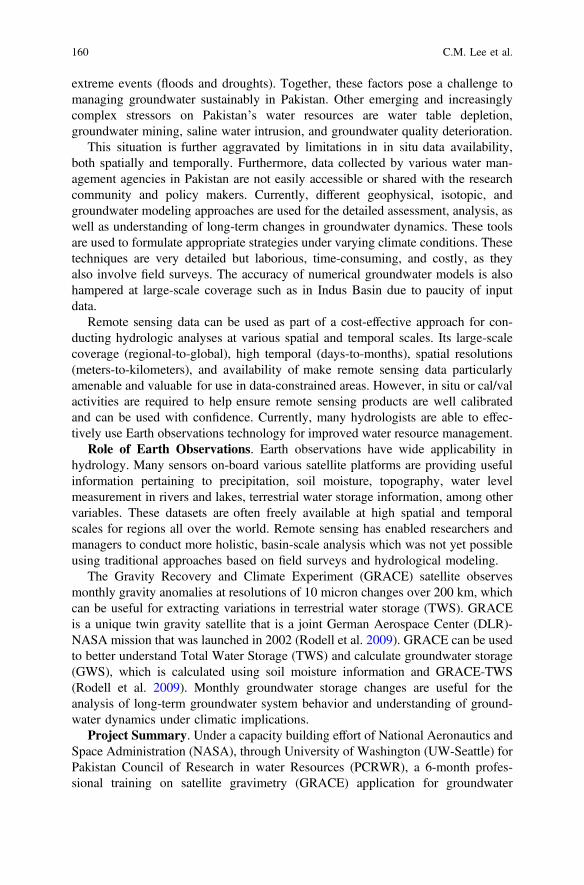
extreme events (floods and droughts). Together, these factors pose a challenge tomanaging groundwater sustainably in Pakistan. Other emerging and increasinglycomplex stressors on Pakistan’s water resources are water table depletion,groundwater mining, saline water intrusion, and groundwater quality deterioration.
This situation is further aggravated by limitations in in situ data availability,both spatially and temporally. Furthermore, data collected by various water man-agement agencies in Pakistan are not easily accessible or shared with the researchcommunity and policy makers. Currently, different geophysical, isotopic, andgroundwater modeling approaches are used for the detailed assessment, analysis, aswell as understanding of long-term changes in groundwater dynamics. These toolsare used to formulate appropriate strategies under varying climate conditions. Thesetechniques are very detailed but laborious, time-consuming, and costly, as theyalso involve field surveys. The accuracy of numerical groundwater models is alsohampered at large-scale coverage such as in Indus Basin due to paucity of inputdata.
Remote sensing data can be used as part of a cost-effective approach for con-ducting hydrologic analyses at various spatial and temporal scales. Its large-scalecoverage (regional-to-global), high temporal (days-to-months), spatial resolutions(meters-to-kilometers), and availability of make remote sensing data particularlyamenable and valuable for use in data-constrained areas. However, in situ or cal/valactivities are required to help ensure remote sensing products are well calibratedand can be used with confidence. Currently, many hydrologists are able to effec-tively use Earth observations technology for improved water resource management.
Role of Earth Observations. Earth observations have wide applicability inhydrology. Many sensors on-board various satellite platforms are providing usefulinformation pertaining to precipitation, soil moisture, topography, water levelmeasurement in rivers and lakes, terrestrial water storage information, among othervariables. These datasets are often freely available at high spatial and temporalscales for regions all over the world. Remote sensing has enabled researchers andmanagers to conduct more holistic, basin-scale analysis which was not yet possibleusing traditional approaches based on field surveys and hydrological modeling.
The Gravity Recovery and Climate Experiment (GRACE) satellite observesmonthly gravity anomalies at resolutions of 10 micron changes over 200 km, whichcan be useful for extracting variations in terrestrial water storage (TWS). GRACEis a unique twin gravity satellite that is a joint German Aerospace Center (DLR)-NASA mission that was launched in 2002 (Rodell et al. 2009). GRACE can be usedto better understand Total Water Storage (TWS) and calculate groundwater storage(GWS), which is calculated using soil moisture information and GRACE-TWS(Rodell et al. 2009). Monthly groundwater storage changes are useful for theanalysis of long-term groundwater system behavior and understanding of ground-water dynamics under climatic implications.
Project Summary. Under a capacity building effort of National Aeronautics andSpace Administration (NASA), through University of Washington (UW-Seattle) forPakistan Council of Research in water Resources (PCRWR), a 6-month profes-sional training on satellite gravimetry (GRACE) application for groundwater
160 C.M. Lee et al.

resource management is conducted at University of Washington (UW). During thisspecialized training, the effectiveness of GRACE satellite for the groundwaterresource management at operational scales is evaluated. The Variable InfiltrationCapacity (VIC) hydrological model is applied on Indus Basin for the simulation ofmonthly soil moisture and surface runoff information at a spatial scale of0.1° × 0.1° from 2003 to 2010. The GWS changes are inferred from GRACE-TWSusing VIC model-generated soil moisture and runoff data.
Variations in TWS range from −34 to −5 mm over Punjab Province from 2003 to2010 (Fig. 6), potentially due to groundwater use for anthropogenic applications inPunjab Province. Agriculture is the largest user of groundwater and the area is famousas the main food basket of the country due to fertile agriculture land. Punjab Provinceconsists of four riverine flood plains locally known as Thal, Chaj, Rechna, and Baridoabs (area between the two rivers). These doabs are bound by River Indus and itsfour major tributaries (Jhelum, Chenab, Ravi, and Sutlej). Our analysis utilizesGRACE data and indicates that groundwater storage is being depleted at an averagerate of about 12.96 mm/year and 6.78 mm/year in Bari and Rechna doabs and,7.34 mm/year and 3.54 mm/year km3/year in Thal and Chaj doabs over the period2003–2010 (Fig. 7). In Bari and Rechna doabs, the depletion trend is found to bemore persistent than in Thal and Chaj doabs due to their intermixed trends of rechargeand depletion. Massive flooding in late July 2010 has played a role in significantlydecreasing the groundwater depletion rate. It has been observed that GRACE is moresensitive to the significant changes in the groundwater storage variations caused by
Fig. 6 Variations in terrestrial water storage anomalies over Indus Basin from 2003 to 2010
Applying Earth Observations to Water Resources Challenges 161

depletion or recharge at appropriate scales. Furthermore, its effectiveness increaseswith large-scale and persistent groundwater storage trends over long periods.
The groundwater storage information is a key parameter for improvinggroundwater resource management (Jin and Feng 2013). The month-to-yearlyspatial and temporal changes in groundwater storage are useful for formulatingappropriate groundwater management strategies. It is envisaged that aGRACE-based application is a cost-effective tool for the understanding basin-scalehydrology and monitoring groundwater behavior at operational level. This appli-cation will help provide scientific information in a cost-effective way fordecision-making and for policy recommendations.
Earth observations are widely available and has been shown to be applicable anduseful for natural resources management. An opportunity is presented here, in thatthe community can now work to maximize the benefit of freely available Earthobservations information through applications. Building capacity within the enduser community (researchers and managers, for example) is a very importantcomponent for translating knowledge to the benefit of mankind. It is an integral linkbetween the data providers and end-user community.
Challenges in Capacity Building for Earth Observations Use. Two majorchallenges in building capacity to use Earth observations in Pakistan are infras-tructure development (hardware and software) and trained personnel. Findingsupport to establish a properly equipped geospatial lab can also be a challenge, butthere have been recent investments at the government and private sector level to
Fig. 7 Changes in groundwater storage anomalies over Upper Indus Basin from 2003 to 2010
162 C.M. Lee et al.

help. Many universities have started various satellite remote sensing (SRS) andgeographic information science (GIS) programs and are producing skilled technicalpersonnel. The high computation power that is required to run the latest versions ofrelated software and specialized skillsets in the field of Earth observations remain abarrier to being able to fully realize the potential of Earth observations for opera-tional use.
Examples of Capacity Building Activities. Conferences and workshops (withtrainings) are a useful approach for generating and expanding awareness of satellitedata but a more integrated program, such as a technical exchange or permanentappointment within a trained research team, fully equipped with necessary tools,would enable continued progress in capacity building. Another challenge isretention of skilled personnel, many of whom transition to other positions, creatinga gap for a much-needed skillset within the institution.
Capacity building is a continuous process that may require extensive effort in aniterative manner. Furthermore, capacity building is only effective if it is two-waystreet, where all parties are contributing and gaining equally. A personnel exchangeis a type of collaboration that can be extremely effective, more so than a shorttraining course or participation in a conference is. Through these types of concrete,collaborative projects, experts can share their knowledge of applications and helpdevise solutions for ongoing challenges at the institutional level.
We have observed that the efficacy of capacity building efforts led by researchersat the University of Washington, and supported by NASA, with PCRWR, is verymuch dependent on ongoing and continued collaborations. The Memorandum ofUnderstanding (MoU) between UW and PCRWR (signed on Nov 2, 2015) willfurther strengthen the relationships between these two organizations. The futurejoint activities will also help ensure the sustainability of the current effort. Thisapproach will help PCRWR become more independent by improving its researchinfrastructure and building a team of specialized professionals.
The operational adoption of GRACE as a tool for groundwater monitoring andresource management and the continuity of GRACE satellite mission in the form ofGRACE Follow-on (GRACE-FO) are linked and very important. The expertise onVIC hydrological model for the simulation of soil moisture and surface runoffdatasets, assistance for high computation, and relevant softwares are also keyrequirements for PCRWR. The collaboration between NASA and PCRWR will alsohelp address real-world issues in the field of sustainable water resource manage-ment in Pakistan. It will also enable the application of Earth observations as ascientific tool for the social benefit.
Being a federal research and development organization, PCRWR is helping boththe groundwater managers and farmers address water resources concerns as well asinforming policy recommendations for decision-makers. Different capacity buildingtraining programs are being offered by PCRWR on the various water conservationand management techniques for effective water resource management. In this way,capacity building of PCRWR will ultimately help to benefit the operational man-agers and farmers to achieve the goal of sustainable water resource management.
Applying Earth Observations to Water Resources Challenges 163

PCRWR would like to see future joint activities include the use of Earth obser-vations and physical modeling-based tools development for the early warning offloods and droughts, addressing transboundary water issues, real-time soil moisture,and evapotranspiration estimations. Applications that utilize Earth observations forthe water cycle budgeting in general could also be of great value in the context ofdisasters mitigation and sustainable water resource management.
5 Case Study 4: Enhancing Global Crop Assessmentof the USDA Foreign Agriculture Service with NASASoil Moisture Products (2014-)
John Bolten
Project Summary. One example of the operational application of globalsatellite-based observations for improved decision-making is the NASA-USDAGlobal Soil Moisture Product employed by the Foreign Agricultural Service (FAS).The development of this global product was envisioned to improve the USDA FASglobal crop assessment decision support system via the integration of NASA soilmoisture data products. USDA FAS crop yield forecasts affect decisions made byfarmers, businesses, and governments by predicting fundamental conditions inglobal commodity markets. Regional and national crop yield forecasts are made bycrop analysts based on the Crop Condition Data Retrieval and Evaluation (CADRE)Data Base Management System (DBMS). Soil moisture availability is a majorfactor impacting these forecasts and the CADRE DBMS system predominantlyestimates soil moisture from a simple water balance model (the Palmer model)based on precipitation and temperature datasets operationally obtained from theWorld Meteorological Organization and U.S. Air Force Weather Agency.
To improve understanding and prediction of agricultural growth in varyingclimate regimes, land cover, crop type, and management strategies, it is necessary torecognize the important role that soil moisture plays in the carbon, water, andenergy cycles, as well as in regulating crop growth and health. Near-surface soilmoisture (i.e., the amount of water in the first few inches of soil) is a criticalcomponent of all of these cycles. The volume of water in the first few inches of soilcontrols infiltration and has a direct influence on the amount of water that reacheslower layers of the soil column. It also constrains land surface temperature byaffecting the fraction of latent and sensible heat of the land surface. As a result,observations of near-surface soil moisture are used to help monitor and predictregional flood and drought events (Dai et al. 2004; Komma et al. 2008; Norbiatoet al. 2008). In addition, regional variations in soil moisture availability can providea leading signal for subsequent anomalies in vegetative health and productivity(Adegoke and Carleton 2002; Ji and Peters 2003). Thus, soil moisture hasincreasingly become a key input to crop forecasting and basin management
164 C.M. Lee et al.

strategic strategies, as well as many large-scale flood, drought, and agriculturalmonitoring systems (Mo et al. 2011).
However, very few networks exist due to their high cost of installation andmaintenance. In addition, the heterogeneous nature of soil moisture causes in situmethods to be locally restrictive and they do not accurately capture the basin-scalesoil-moisture changes that are often needed for water resources managementapplications (Engman and Gurney 1991). To this end, ground-based observationalsoil moisture data alone are not sufficient to provide accurate water budget infor-mation, and can be greatly improved through the addition of satellite-based regionalobservations of near-surface soil moisture.
Targeting Decision Making of the USDA Foreign Agriculture Service.The USDA FAS attempts to anticipate the impact of drought on regional agricul-tural productivity by monitoring soil moisture conditions using a quasi-global soilwater balance model (Bolten et al. 2002). However, the accuracy of such models isdependent on the quality of their required meteorological inputs and is thus ques-tionable over data-poor regions of the globe and can be improved through theintegration of satellite-based soil moisture observations. In this case, the Palmer soilmoisture model implemented by the FAS is driven by daily precipitation andnear-surface air temperature observations (Palmer 1965). However, over much ofthe globe, particularly food insecure areas that are of interest to the FAS, theseobservations are sparse or do not exist. For example, agricultural areas in SouthAfrica and Brazil are significantly lacking in reliable networks of gage-basedprecipitation and temperature observations. As a result, the modeled soil moistureover these areas has a high uncertainty, which leads to inaccurate estimates ofagricultural productivity. A key challenge for the USDA FAS is to provide monthlyglobal estimates of agricultural productivity over areas like these lacking reliableobservations of precipitation, temperature, or soil moisture.
The main objective of the project is to enhance the U.S. Department ofAgriculture (USDA) Foreign Agricultural Service (FAS) global crop assessmentdecision support system via the integration of NASA soil moisture products throughthe implementation of data assimilation tools. The baseline soil moisture estimatesused by USDA FAS are developed using the two-layer Palmer model, which is aphysically based hydrologic model forced by daily precipitation and minimum andmaximum temperature measurements acquired from the U.S. Air Force WeatherAgency. Integration of the satellite observations is done using a 1-D EnsembleKalman Filter (EnKF) technique set to run with 30-ensemble member (Bolten et al.2010).
The Palmer model estimates of surface and root-zone soil moisture are derivedfrom the two-layer Palmer water balance model currently used operationally byUSDA FAS. The two-layer Palmer model is based on a bucket-type modelingapproach as described in Palmer (Palmer 1965). It estimates the available watercapacity (AWC) of the top model layer, assumed to be 2.54 cm at field capacity,and the AWC of the second layer (i.e., root-zone layer) is calculated using soiltexture, depth to bedrock, and soil type derived from the Food and AgricultureOrganization (FAO) Digital Soil Map of the World available from the FAO at
Applying Earth Observations to Water Resources Challenges 165

http://www.fao.org/ag/agl/lwdms.stm#cd1. In this fashion, water-holding capacityfor both layers (incorporating near-surface soil moisture and groundwater) rangesbetween 2.54 and 30 cm according to soil texture and soil depth.Evapotranspiration is calculated from the modified FAO Penman-Monteith methodand observations of daily min/max temperature. Further modeling details areavailable in (Bolten et al. 2010). Required daily rainfall accumulation and airtemperature datasets are obtained from the U.S. Air Force Weather Agency(AFWA) Agriculture Meteorological (AGRMET) system which derives a dailyrainfall accumulation product based on microwave sensors on variouspolar-orbiting satellites, infrared sensors on geostationary satellites, a model-basedcloud analysis, and World Meteorological Organization (WMO) surface gageobservations (Bolten et al. 2010).
The NASA-USDA Global Soil Moisture Product was initially developed usingsoil moisture observations from the EOS Advanced Microwave ScanningRadiometer (AMSR-E), which provided quasi-global soil moisture observationsfrom 2002 to 2011. The product has transitioned to other satellites as they havebecome available, including the onset of data availability from the ESA SoilMoisture and Ocean Salinity (SMOS) in 2009 and NASA Soil Moisture Active andPassive (SMAP) in 2015 (Entekhabi et al. 2010; Kerr and Levine 2008). As a result,the system is envisaged to provide over 15-year heritage of global soil moisturewhich should result in a significant expansion in our ability to study the impact ofretrieving surface soil moisture using satellite remote sensing for many agriculturaland hydrological applications.
AMSR-E stopped producing reliable observations in October of 2011. Thecurrent operational system ingests soil moisture observations acquired from the SoilMoisture Ocean Salinity (SMOS) mission and it is in preparation for switching todata provided by the NASA’s Soil Moisture Active Passive (SMAP) mission. Dueto the failure of the SMAP active instrument soon after launch, the system is beingmodified to incorporate soil moisture observations from the AdvancedScatterometer ASCAT instrument onboard the EUMETSAT METOP satellite.
The soil moisture product is based on the implementation of an EnsembleKalman Filter (EnKF). The EnKF is a nonlinear extension of the standard Kalmanfilter and has been successfully applied to a number of land surface data assimi-lation problems (e.g., Reichle 2005). The current system has been found to functionadequately using a 30-member Monte Carlo ensemble size (Bolten and Crow 2012)and is being modified to dually assimilate both SMAP and ASCAT soil moistureobservations.
The soil moisture products generated by this system have been operationallydelivered to USDA FAS since 2013 and have been fully incorporated into theUSDA FAS Crop Explorer decision support system since April of 2014 (Fig. 8).Products include surface and subsurface soil moisture, total soil profile soil mois-ture, and soil moisture anomalies for the surface and subsurface layer. The productshave become an invaluable part of the USDA FAS CADRE (Crop Assessment DataRetrieval and Evaluation) and are routinely used by USDA FAS crop analysts andexperts to assess and improve their global yield predictions that are included in the
166 C.M. Lee et al.

Fig. 8 Examples of the global soil moisture products being operationally delivered to
Applying Earth Observations to Water Resources Challenges 167

monthly USDA World Agricultural Supply and Demand Estimate (WASDE)report. Furthermore, since its public release, several additional agencies haveexpressed interest in utilizing the data including USDA National AgriculturalStatistics Service (NASS), which is responsible for assessing the nation’s cropconditions and developing yield estimates for the WASDE report as well.
Lessons Learned. One of the keys to success of this project is that it is lever-aging off of an existing partnership between NASA and USDA within a userdecision context. By addressing specific elements of a partner’s existing process forassessing crop productivity, this project is able to provide a quantifiable benefit withits primary focus on enabling improved yield forecasting products, capacitybuilding activities, and a more extensive process to define which decision to targetand understand user requirements and constraints.
6 Conclusion
The case studies in this chapter represent a diversity of application activitiesworking to bridge the gap between Earth observations for research and waterresource applications needs on an international landscape. They each present dif-ferent perspectives and approaches with respect to geography, barriers-faced,partnerships, capacity building, and the application targets themselves. Summarizedbelow are the common threads and lessons learned from the case studies.
• Partnerships are the key to addressing water resource issues, particularlyin transboundary water basins. Most of the projects found success when acommon understanding was achieved between the NASA funded investigatorsand end users. However, as Zaitchik indicated, one key element of success isunderstanding what types of partners are the best match for the maturity of theapplication (e.g., research institutions versus a regional coordinating body).Zaitchik also notes that identifying a partner with high potential for being able tosustain the use of a transitioned product is also important, and that this must beweighed against what may appear to be a broader impact (e.g., targeting mul-tiple states through a multilateral organization versus working with specificcountry ministries.)
• Capacity building is essential and needs to be a continuous process. In thecase of Serrat-Capdevila’s work, and Iqbal’s case study, we observe that con-tinuous engagements with partners are critical, and that single, one-off activitiessuch as workshops can have limited impact. In some cases, as pointed out byIqbal, the next level in capacity building is to develop joint activities that allowmembers of respective partner organizations to be rooted within each other’steams. Hosting members of the partners’ teams within home institutions canhelp team members develop a good understanding of constraints (both techni-cally and otherwise) and allow continuity in training and access to technicalmaterials and expertise.
168 C.M. Lee et al.

• Potential is huge for Earth observations to benefit end users and to addressglobal or regional water challenges. In Bolten’s work, NASA soil moistureproducts can greatly benefit USDA FAS, which is employing a global scalemodel for crop assessment. By targeting an existing element (soil moisture) ofan existing process, partner buy-in becomes less of a hurdle since the partner’sdecision making framework is not being overhauled by a new tool. Thepotential for Earth observations to provide value to water resources stakehold-ers, such as research entities or organizations or operational agencies, has alsobeen demonstrated in Serrat-Capdevila, Zaitchik, and Iqbal’s work, and tar-geting various hydrologic variables, such as precipitation, streamflow, evapo-transpiration, and groundwater.
Finally, it is also very important to effectively assess and communicate thebenefits of this work, and connect those benefits back to the use of Earth obser-vations. Continuing to evaluate and articulate benefits of Earth observations is avital challenge that is being addressed by the case studies outlined in this chapterand an ongoing focus of the Earth science applications community.
References
Adegoke, J. O., & Carleton, A. M. (2002). Relations between soil moisture and satellite vegetationindices in the U.S. Corn Belt. Journal of Hydrometeorology, 3(4), 395–405. http://doi.org/10.1175/1525-7541(2002)003<0395:RBSMAS>2.0.CO;2.
Anderson, M. C., Allen, R. G., Morse, A., & Kustas, W. P. (2012). Use of Landsat thermalimagery in monitoring evapotranspiration and managing water resources. Remote Sensing ofEnvironment, 122, 50–65. http://doi.org/10.1016/j.rse.2011.08.025.
Anderson, W. B., Zaitchik, B. F., Hain, C. R., Anderson, M. C., Yilmaz, M. T., Mecikalski, J., &Schultz, L. (2012). Towards an integrated soil moisture drought monitor for East Africa.Hydrology and Earth System Sciences, 16(8), 2893–2913. http://doi.org/10.5194/hess-16-2893-2012.
Barnett, T. P., Adam, J. C., & Lettenmaier, D. P. (2005). Potential impacts of a warming climateon water availability in snow-dominated regions. Nature, 438(7066), 303–9. http://doi.org/10.1038/nature04141.
Berhane, F., Zaitchik, B., & Dezfuli, A. (2014). Subseasonal analysis of precipitation variability inthe Blue Nile River Basin. Journal of Climate, 27(1), 325–344. http://doi.org/10.1175/JCLI-D-13-00094.1.
Bolten, J. D., & Crow, W. T. (2012). Improved prediction of quasi-global vegetation conditionsusing remotely-sensed surface soil moisture. Geophysical Research Letters, 39(19), n/a–n/a.http://doi.org/10.1029/2012GL053470.
Bolten, J. D., Crow, W. T., Zhan, X., Jackson, T. J., & Reynolds, C. A. (2010). Evaluating theutility of remotely sensed soil moisture retrievals for operational agricultural droughtmonitoring. IEEE Journal of Selected Topics in Applied Earth Observations and RemoteSensing, 3(1), 57–66. http://doi.org/10.1109/JSTARS.2009.2037163.
Bolten, J. D., Crow, W. T., Zhan, X., Reynolds, C. A., & Jackson, T. J. (2002). Assimilation of asatellite-based soilmoisture product into a two-layer water balance model for a global cropproduction decision support system. In S. K. Park & L. Xu (Eds.), Data assimilation foratmospheric, oceanic and hydrologic applications (pp. 449–463). Berlin, Heidelberg: SpringerBerlin Heidelberg. http://doi.org/10.1007/978-3-540-71056-1.
Applying Earth Observations to Water Resources Challenges 169

Chen, J., Famigliett, J. S., Scanlon, B. R., & Rodell, M. (2015). Groundwater storage changes:Present status from GRACE observations. Surveys in Geophysics. http://doi.org/10.1007/s10712-015-9332-4.
Dai, A., Trenberth, K. E., & Qian, T. (2004). A global dataset of palmer drought severity index for1870–2002: Relationship with soil moisture and effects of surface warming. Journal ofHydrometeorology, 5(6), 1117–1130. http://doi.org/10.1175/JHM-386.1.
Engman, E. T., & Gurney, R. J. (1991). Remote sensing in hydrology. Chapman and Hall.Retrieved from http://www.springer.com/us/book/9789401066709.
Entekhabi, D., Njoku, E. G., O’Neill, P. E., Kellogg, K. H., Crow, W. T., Edelstein, W. N., VanZyl, J. (2010). The Soil Moisture Active Passive (SMAP) Mission. Proceedings of the IEEE,98(5), 704–716. http://doi.org/10.1109/JPROC.2010.2043918.
Feng, X., Porporato, A., & Rodriguez-Iturbe, I. (2013). Changes in rainfall seasonality in thetropics. Nature Climate Change, 3(9), 811–815. http://doi.org/10.1038/nclimate1907.
Foltz, J., Gars, J., Özdoğan, M., Simane, B., & Zaitchik, B. (2013). Weather and welfare inEthiopia. Agricultural and Applied Economics Association.
GEOSS. (2014). GEOSS water strategy: From observations to decisions. Retrieved April 7, 2015,from http://ceos.org/document_management/Ad_Hoc_Teams/WSIST/WSIST_GEOSS-Water-Strategy-Full-Report_Jan2014.pdf.
Ji, L., & Peters, A. J. (2003). Assessing vegetation response to drought in the Northern great plainsusing vegetation and drought indices. Remote Sensing of Environment, 87(1), 85–98. http://doi.org/10.1016/S0034-4257(03)00174-3.
Jin, S., & Feng, G. (2013). Large-scale variations of global groundwater from satellite gravimetryand hydrological models, 2002–2012. Global and Planetary Change, 106, 20–30. http://doi.org/10.1016/j.gloplacha.2013.02.008.
Kerr, Y. H., & Levine, D. (2008). Foreword to the Special Issue on the Soil Moisture and OceanSalinity (SMOS) Mission. IEEE Transactions on Geoscience and Remote Sensing, 46(3), 583–585. http://doi.org/10.1109/TGRS.2008.917807.
Komma, J., Blöschl, G., & Reszler, C. (2008). Soil moisture updating by Ensemble KalmanFiltering in real-time flood forecasting. Journal of Hydrology, 357(3–4), 228–242. http://doi.org/10.1016/j.jhydrol.2008.05.020.
McClain, M. E., Subalusky, A. L., Anderson, E. P., Dessu, S. B., Melesse, A. M., Ndomba, P. M.,Mligo, C. (2014). Comparing flow regime, channel hydraulics, and biological communities toinfer flow–ecology relationships in the Mara River of Kenya and Tanzania. HydrologicalSciences Journal, 59(3–4), 801–819. http://doi.org/10.1080/02626667.2013.853121.
Mo, K. C., Long, L. N., Xia, Y., Yang, S. K., Schemm, J. E., & Ek, M. (2011). Drought indicesbased on the climate forecast system reanalysis and ensemble NLDAS. Journal ofHydrometeorology, 12(2), 181–205. http://doi.org/10.1175/2010JHM1310.1.
National Research Council. (2007). Earth science and applications from space: Nationalimperatives for the next decade and beyond. doi:10.17226/11820
National Drought Mitigation Center, US Department of Agriculture, US Department ofCommerce, & National Oceanic and Atmospheric Administration. (n.d.). United StatesDrought Monitor. Retrieved from http://droughtmonitor.unl.edu/.
Norbiato, D., Borga, M., Degli Esposti, S., Gaume, E., & Anquetin, S. (2008). Flash flood warningbased on rainfall thresholds and soil moisture conditions: An assessment for gauged andungauged basins. Journal of Hydrology, 362(3–4), 274–290. http://doi.org/10.1016/j.jhydrol.2008.08.023.
Palmer, W. C. (1965). Meteorological Drought. U.S. Weather Bureau Research Paper 45.Parker, D. D., & Zilberman, D. (1996). The use of information services: The case of CIMIS.
Agribusiness, 12(3), 209–218. http://doi.org/10.1002/(SICI)1520-6297(199605/06)12:3<209::AID-AGR2>3.0.CO;2-4.
Reichle, R. H. (2005). Global assimilation of satellite surface soil moisture retrievals into theNASA Catchment land surface model. Geophysical Research Letters, 32(2), L02404. http://doi.org/10.1029/2004GL021700.
170 C.M. Lee et al.

Rodell, M., Velicogna, I., & Famiglietti, J. S. (2009). Satellite-based estimates of groundwaterdepletion in India. Nature, 460(7258), 999–1002. http://doi.org/10.1038/nature08238.
Roy, T., Serrat-Capdevila, A., Gupta, H., & Valdes, J. (2016). A platform for probabilisticmulti-model and multi-product streamflow forecasting. Submitted to Water ResourcesResearch.
Satti, S., Zaitchik, B., & Siddiqui, S. (2015). The question of Sudan: A hydro-economicoptimization model for the Sudanese Blue Nile. Hydrology and Earth System Sciences, 19(5),2275–2293. http://doi.org/10.5194/hess-19-2275-2015.
Shortridge, J. E., Guikema, S. D., & Zaitchik, B. F. (2015). Empirical streamflow simulation forwater resource management in data-scarce seasonal watersheds. Hydrology and Earth SystemSciences Discussions, 12(10), 11083–11127. http://doi.org/10.5194/hessd-12-11083-2015.
Simane, B., Zaitchik, B., & Ozdogan, M. (2013). Agroecosystem analysis of the choke mountainwatersheds, Ethiopia. Sustainability, 5(2), 592–616. http://doi.org/10.3390/su5020592.
UN Water/Africa. (2015). The Africa Water Vision for 2025: Equitable and Sustainable Use ofWater for Socioeconomic Development.
United Nations. (2015). Transforming Our World: The 2030 Agenda for Sustainable Development(SDG#6: Clean Water and Sanitation).
Wilusz, D., Zaitchik, B., Anderson, M., Hain, C., Yilmaz, M., & Mladenova, I. (n.d.). Monthlymonitoring of flooded area in the sudd wetland using low resolution SAR imagery from 2007–2011. In Review.
Yilmaz, M. T., Anderson, M. C., Zaitchik, B., Hain, C. R., Crow, W. T., Ozdogan, M., Evans,J. (2014). Comparison of prognostic and diagnostic surface flux modeling approaches over theNile River Basin. Water Resources Research, 50(1), 386–408. http://doi.org/10.1002/2013WR014194.
Zaitchik, B. F., Simane, B., Habib, S., Anderson, M. C., Ozdogan, M., & Foltz, J. D. (2012).Building climate resilience in the Blue Nile/Abay Highlands: A role for Earth system sciences.International Journal of Environmental Research and Public Health, 9(2), 435–61. http://doi.org/10.3390/ijerph9020435.
Applying Earth Observations to Water Resources Challenges 171
Use of Remotely Sensed Climateand Environmental Information for AirQuality and Public Health Applications
William Crosson, Ali Akanda, Pietro Ceccato, Sue M. Estes,John A. Haynes, David Saah, Thomas Buchholz, Yu-Shuo Chang,Stephen Connor, Tufa Dinku, Travis Freed, John Gunn,Andrew Kruczkiewicz, Jerrod Lessel, Jason Moghaddas,Tadashi Moody, Gary Roller, David Schmidt, Bruce Springsteen,Alexandra Sweeney and Madeleine C. Thomson
Abstract Earth’s environment has direct and dramatic effects on its inhabitants inthe realms of health and air quality. The climate, even in an unaltered state, posesgreat challenges but also presents great opportunity for the mankind to survive andflourish. Anthropogenic factors lead to even greater stress on the global ecosystemand to mankind, particularly with respect to air quality and the concomitant health
W. Crosson (&)Universities Space Research Association, Marshall Space Flight Center, Huntsville, AL, USAe-mail: [email protected]
A. AkandaCivil and Environmental Engineering Department, University of Rhode Island, Kingston, RI,USA
P. Ceccato � T. Dinku � A. Kruczkiewicz � J. Lessel � A. Sweeney � M.C. ThomsonInternational Research Institute for Climate and Society, The Earth Institute, ColumbiaUniversity, New York, USA
S.M. EstesUniversity of Alabama in Huntsville, Huntsville, AL, USA
J.A. HaynesNational Aeronautics and Space Administration, Washington, DC, USA
D. Saah � T. Buchholz � T. Freed � J. Moghaddas � T. Moody � G. Roller � D. SchmidtSpatial Informatics Group, LLC, 3248 Northampton Ct., Pleasanton, CA, USA
D. SaahUniversity of San Francisco, Geospatial Analysis Lab, 2130 Fulton Street, San Francisco,CA, USA
T. BuchholzGund Institute for Ecological Economics, University of Vermont, 617 Main Street,Burlington, VT, USA
Y.-S. Chang � B. SpringsteenPlacer County Air Pollution Control District, 110 Maple Street, Auburn, CA, USA
© Springer International Publishing Switzerland 2016F. Hossain (ed.), Earth Science Satellite Applications,Springer Remote Sensing/Photogrammetry, DOI 10.1007/978-3-319-33438-7_7
173

issues. While the use of remote sensing technology to address issues is in itsinfancy, there is tremendous potential for using remote sensing as part of systemsthat monitor and forecast conditions that directly or indirectly affect health and airquality. This chapter discusses current status and future prospects in this field andpresents three case studies showing the great value of remote sensing assets indistinct disciplines.
Glossary—List of Acronyms
AQAST Air Quality Applied Sciences TeamAMSR-E Advanced Microwave Scanning Radiometer—Earth Observing
SystemCALIPSO Cloud-Aerosol Lidar and Infrared Pathfinder Satellite ObservationsCDC Centers for Disease Control and PreventionCHIRPS Climate Hazards Group InfraRed Precipitation with StationCMAP Climate Prediction Center (CPC) Merged Analysis of PrecipitationCMORPH CPC MORPHing techniqueDoD Department of DefenseENACTS Enhancing National Climate ServicesEO Earth ObservationEPA Environmental Protection AgencyEVI Enhanced Vegetation IndexGEO-CAPE Geostationary Coastal and Air Pollution EventsGHG Greenhouse GassesGPCP Global Precipitation Climatology ProjectGIMMS Global Inventory Monitoring and Modeling StudiesGPM Global Precipitation MeasurementGRACE Gravity Recovery and Climate ExperimentGTS Global Telecommunication SystemHAQ Health and Air QualityHyspIRI Hyperspectral Infrared ImagerLST Land Surface TemperatureMODIS Moderate Resolution Imaging SpectroradiometerMOPITT Measurement of Pollution in the TroposphereNAAQS National Ambient Air Quality StandardNDVI Normalized Difference Vegetation IndexNMS National Meteorological ServiceNOAA National Oceanic and Atmospheric Administration
S. ConnorSchool of Environmental Sciences University of Liverpool, Liverpool, UK
J. GunnSpatial Informatics Group—Natural Assets Laboratory (SIG-NAL), 11 Pond Shore Drive,Cumberland, ME, USA
174 W. Crosson et al.

PACE Pre-Aerosol, Clouds, and ocean EcosystemsPM2.5 Particulate Matter smaller than 2.5 microns in diameterSeaWiFS Sea-Viewing Wide Field of View SensorSMAP Soil Moisture Active/PassiveSMOS Soil Moisture and Ocean SalinitySWOT Surface Water and Ocean TopographyTEMPO Tropospheric Emissions: Monitoring of PollutionTRMM Tropical Rainfall Measuring MissionVCAP Vectorial CAPacity modelVL Visceral LeishmaniasisVIIRS Visible Infrared Imager Radiometer SuiteVOC Volatile Organic CompoundsWHO World Health Organization
1 Introduction
The 2007 Earth Science Decadal Survey (NRC 2007), in its vision for the future ofEarth science and applications, specifically called for “a vision that includes advancesin fundamental understanding of the Earth system and increased application of thisunderstanding to serve the nation and the people of the world”. The survey goes on toemphasize the role of remote sensing for improving air quality and health conditions:“Further improvements in the application of remote sensing technologies will allowbetter understanding of disease risk and prediction of disease outbreaks, more rapiddetection of environmental changes that affect human health, identification of spatialvariability in environmental health risk, targeted interventions to reduce vulnerability tohealth risks, and enhanced knowledge of human health-environment interactions.”Finally, the Survey issues the challenge facing the Earth science community:“Addressing these societal challenges requires that we confront key scientific questionsrelated to … transcontinental air pollution … impacts of climate change on humanhealth, and the occurrence of extreme events, such as severe storms, heat waves, …”
Recognizing the great potential of remote sensing assets for advancing knowl-edge and applications in air quality and health, in 2001 NASA’s Applied SciencesProgram defined health and air quality (HAQ) as one of its applications areas tosupport the use of Earth observations, particularly regarding infectious andvector-borne diseases and environmental health issues. The area also addressesissues of toxic and pathogenic exposure and health-related hazards and their effectsfor risk characterization and mitigation. HAQ promotes uses of Earth observingdata and models regarding implementation of air quality standards, policy, andregulations for economic and human welfare. The area also addresses effects ofclimate change on public health and air quality to support managers and policymakers in planning and preparations.
Specifically within air quality the key question being addressed by HAQ is:
Use of Remotely Sensed Climate and Environmental … 175
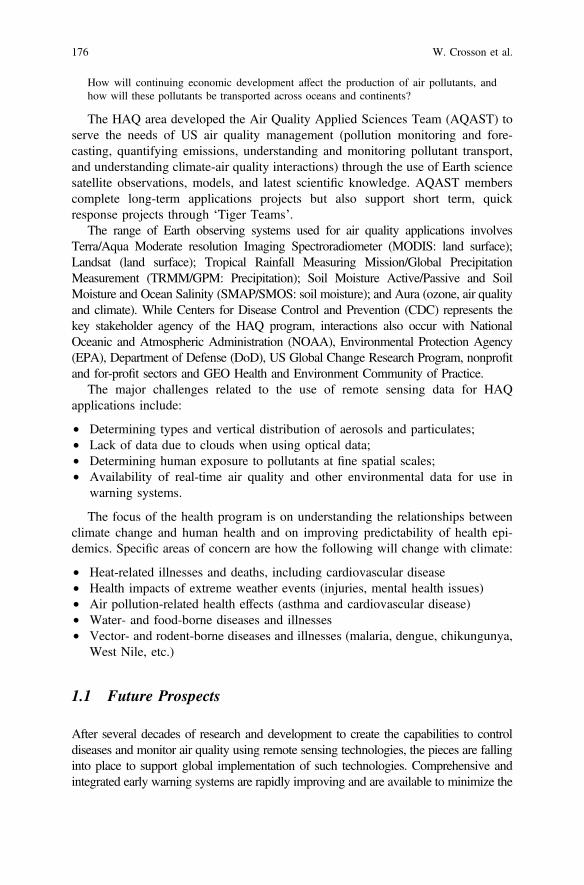
How will continuing economic development affect the production of air pollutants, andhow will these pollutants be transported across oceans and continents?
The HAQ area developed the Air Quality Applied Sciences Team (AQAST) toserve the needs of US air quality management (pollution monitoring and fore-casting, quantifying emissions, understanding and monitoring pollutant transport,and understanding climate-air quality interactions) through the use of Earth sciencesatellite observations, models, and latest scientific knowledge. AQAST memberscomplete long-term applications projects but also support short term, quickresponse projects through ‘Tiger Teams’.
The range of Earth observing systems used for air quality applications involvesTerra/Aqua Moderate resolution Imaging Spectroradiometer (MODIS: land surface);Landsat (land surface); Tropical Rainfall Measuring Mission/Global PrecipitationMeasurement (TRMM/GPM: Precipitation); Soil Moisture Active/Passive and SoilMoisture and Ocean Salinity (SMAP/SMOS: soil moisture); and Aura (ozone, air qualityand climate). While Centers for Disease Control and Prevention (CDC) represents thekey stakeholder agency of the HAQ program, interactions also occur with NationalOceanic and Atmospheric Administration (NOAA), Environmental Protection Agency(EPA), Department of Defense (DoD), US Global Change Research Program, nonprofitand for-profit sectors and GEO Health and Environment Community of Practice.
The major challenges related to the use of remote sensing data for HAQapplications include:
• Determining types and vertical distribution of aerosols and particulates;• Lack of data due to clouds when using optical data;• Determining human exposure to pollutants at fine spatial scales;• Availability of real-time air quality and other environmental data for use in
warning systems.
The focus of the health program is on understanding the relationships betweenclimate change and human health and on improving predictability of health epi-demics. Specific areas of concern are how the following will change with climate:
• Heat-related illnesses and deaths, including cardiovascular disease• Health impacts of extreme weather events (injuries, mental health issues)• Air pollution-related health effects (asthma and cardiovascular disease)• Water- and food-borne diseases and illnesses• Vector- and rodent-borne diseases and illnesses (malaria, dengue, chikungunya,
West Nile, etc.)
1.1 Future Prospects
After several decades of research and development to create the capabilities to controldiseases and monitor air quality using remote sensing technologies, the pieces are fallinginto place to support global implementation of such technologies. Comprehensive andintegrated early warning systems are rapidly improving and are available to minimize the
176 W. Crosson et al.

impact of deadly diseases and environmental hazards such as floods and extreme heat(Hossain 2015), and the barriers to implementation, namely cost and data managementcapabilities, are being torn down. Data and good intentions alone, however, are notsufficient. Capacity-building efforts are needed in many countries to improve technologytransfer, and to better structure national information systems and decision-making pro-cesses, if these nations are to derive full benefit from this powerful technology.
In spite of these major advances, the global scientific community is onlybeginning to scratch the surface of potential societal applications of remote sensingdata. Based on current plans of NASA and other national space agencies, Earthobservation data will be abundant in the coming decades, and much of the data willbe well suited for applications in health and air quality. In order to bring the benefitsof these data to society, a well-designed strategy for effective use of these data tomonitor, forecast, and warn the public is critical. This strategy must engage multiplefactions within the Earth science community—remote sensing scientists fordeveloping useful products, developers to create analysis and visualization tools,and social scientists, educators and public officials to devise effective messaging toconvey critical information to the public in a way that promotes action.
There are several existing sensors and missions that are well-suited to provideniche data sets for health and air quality applications, such as:
• Measurement of Pollution in the Troposphere (MOPITT, http://terra.nasa.gov/about/terra-instruments/mopitt)
• Cloud-Aerosol Lidar and Infrared Pathfinder Satellite Observations (CALIPSO,http://science.nasa.gov/missions/calipso/)
• SMAP (http://science.nasa.gov/missions/smap/)• SMOS (http://www.esa.int/Our_Activities/Observing_the_Earth/SMOS)• Aura (http://science.nasa.gov/missions/aura/).
Even more useful inputs to HAQ monitoring and forecasting applications will beprovided by sensors that are still in the pre-formulation phase, including:
• Pre-Aerosol, Clouds, and Ocean Ecosystems (PACE; http://decadal.gsfc.nasa.gov/PACE.html);
• Tropospheric Emissions: Monitoring of Pollution (TEMPO; http://science.nasa.gov/missions/tempo/);
• Hyperspectral Infrared Imager (HyspIRI; http://hyspiri.jpl.nasa.gov/);• Geostationary Coastal and Air Pollution Events (GEO-CAPE; http://geo-cape.
larc.nasa.gov/)
Other satellite and sub-orbital sensors, not yet to the pre-formulation phase, may bekey elements of a future (*2030) HAQ system. For example, nanosatellites, includingCubeSats (http://www.nasa.gov/mission_pages/cubesats/index.html) flying in constella-tions may play an important role in a future HAQ observational system. Troposphericand stratospheric environmental observations from small unmanned aerial vehicles maybe commonplace within this time frame. Also, crowd sourced environmental mea-surements and health outcomes, the ‘complementary system of observations of human
Use of Remotely Sensed Climate and Environmental … 177

activities’ recommended in the Decadal Survey (NRC 2007), may be extremely usefulfor calibration and validation of HAQ models, but the path to bring these into themainstream is not currently clear.
2 Case Studies
2.1 Wildfires and Public Health
With as much as 40 % of terrestrial carbon in the U.S. being stored in forests(Pacala et al. 2007), sequestration of greenhouse gasses (GHGs) in terrestrial bio-mass has become an important element in strategies aimed at mitigating globalclimate change. Carbon dioxide emissions from wildfire in the U.S. have beenestimated to be equivalent to approximately 4–6 % of anthropogenic sources at thecontinental scale (Wiedinmyer and Neff 2007).
The Western U.S. has millions of acres of overstocked forestlands at risk of large,uncharacteristically severe wildfire. There are a variety of factors contributing to thisrisk, including human-induced changes from nearly a century of timber harvest,grazing, and particularly, fire exclusion (North et al. 2015; Miller et al. 2009). Forinstance, the mid-elevation conifer forests of the Sierra Nevada, California, contain vastareas of high density, relatively homogenous, second growth coniferous forests that areincreasingly prone to high-severity fires (Miller et al. 2009). Historic factors con-tributing to these conditions include the elimination of burning by Native Americansduring the mid- to late ninetenth century (Anderson 2005), removal of large treesthrough the early twentieth century via railroad and selective logging (Stephens 2000),a nearly 100-year policy of fire exclusion (North et al. 2015; Stephens and Ruth 2005),and extensive use of clear-cut harvesting and overstory removals on public landsthrough the 1980s (Hirt 1996).
State and federal agencies have been very effective at suppressing the vast majorityof wildfire ignitions (Dombeck et al. 2004), but the total area burned in the U.S. hasincreased in recent decades (Westerling et al. 2014). The US Forest Service (USFS)estimates that an average of more than 73,000 wildfires burn about 7.3 million acreseach year of private, state, and federal land and more than 2,600 structures (USFS2015) nationwide. Though the number of wildland fires decreased since 1960, the totalacreage burned each year is trending upwards. Large fires covering over 100,000 acresare more frequent and cover more acreage now than in the 1990s (NIFC 2015). Trendsof both increased fire sizes and uncharacteristically severe burning have beendemonstrated throughout the western U.S. (Miller et al. 2009) and increasing fire sizesare expected to continue under changing climates (Westerling et al. 2006). For decades,scientists and managers have understood that the threat fire would pose to forests in thiscondition (Biswell 1959, 1989). In the western U.S., however, it was not until the early1990s that federal land management agencies were given direction to manipulatestands, with the specific objective of modifying landscape level fire behavior.
178 W. Crosson et al.

Fire is a natural disturbance process that has an important role in determiningforest species composition, structure, and stand development pathways. Fire hasbeen a regular occurrence in these forests for millennia and continues to be today,despite the changes in spatial and temporal patterns over the last century (Biswell1959; Kilgore and Taylor 1979; Collins et al. 2011). Most low to moderate intensityfires in western U.S. forests historically included some patches of high-severity fire(Arno et al. 2000; Fulé et al. 2003; Beaty and Taylor 2008; Perry et al. 2011).Current wildfire high-severity patch sizes and areas in some forests that onceburned frequently with low-moderate intensity fire regimes are well outside his-torical conditions (Miller et al. 2009).
Fire also drives large-scale transformations that can impede the ability of foreststo deliver ecosystem services such as carbon sequestration (Millar and Stephenson2015). In western U.S. forests, which include some of the globally highest densitiesof carbon storage, fires can drive the significant loss of carbon stocks from forests tothe atmosphere (Gonzalez et al. 2015). High-severity fires also impair the futuresequestration of carbon from likely shifts in ecosystem composition, shiftingecosystems from forest to grasslands and shrublands (Savage and Mast 2005;Roccaforte et al. 2012).
The purpose of this western US-based case study is to describe the significanceand consequences of high-severity wildfires in terms of GHG emissions and airquality impacts. This chapter describes the current state of science in terms ofmanagement options as well as impediments toward lowering GHG emissions fromwildfires. We also present a carbon offset methodological framework that accountsfor GHG emission reductions from these treatments that could be used to reduceoverall treatment costs.
2.1.1 Wildfire Emissions and Air Quality
Fire converts carbon stored in the forest floor materials and live and dead vegetation toatmospheric CO2, CO, CH4, other gasses, and particulate matter (Stephens et al. 2007).These other emissions include nitrogen oxides (NOx), NH3, SO2, and fine particulates(Urbanski 2014). Along with the protection of people, property, and atmospheric GHGemissions, concerns of local air quality impacts from smoke have become anotherimportant goal of land management (Schweizer and Cisneros 2014).
Wildfires can have a significant adverse impact on regional air quality,depending on fuel load, terrain, and atmospheric conditions. During recent majorwildfires, ambient air levels of particulate matter (PM2.5) have been measured atover 10 times that of the U.S. EPA National Ambient Air Quality Standard(NAAQS) (MDEQ 2007; CARB 2009). Wildfires have also been directly respon-sible for exceedances of the ground level ozone NAAQS through generation ofNOx and volatile organic compounds (VOC) precursors (SMAQMD 2011).
Air pollutants from wildfires are a well-established threat to public health,particularly increasing the risk for lung and heart disease and respiratory infections.
Use of Remotely Sensed Climate and Environmental … 179

Exposure to air pollutant emissions from wildfires has been definitively linked to anincrease in local hospital admissions, particularly children from ages 1–4 and theelderly over 65, for respiratory related conditions including eye, nose and throatirritation, chest pain, and asthma, bronchitis, pneumonia, and chronic obstructivepulmonary disease (Delfino et al. 2009).
2.1.2 Effects of Fuel Treatments
Effectiveness of Fuel Treatments
It is virtually impossible to exclude fire from most fire-prone landscapes, such asthose found across the western U.S., over long periods of time (Reinhardt et al.2008). During extreme weather conditions, suppression efforts can become over-whelmed and fires can quickly grow to cover very large areas. Suppression effortscan be rendered ineffective under less than extreme weather conditions when fueland forest structure conditions result in relatively homogenous forests prone tohigh-intensity burning. This may be particularly true as the effects of climatechange are manifested on fire severity trends (Millar et al. 2007; Miller et al. 2009).‘‘No treatment’’ or ‘‘passive management’’ (Agee 2002; Stephens and Ruth 2005)perpetuates the potential for exacerbated fire behavior in forests (Moghaddas et al.2010).
Modification of fuel structures and reduction of unnaturally high fuel loads inorder to alter fire patterns and behavior are a primary component of planning effortssuch as the National Cohesive Wildland Fire Management Strategy (Wildland FireLeadership Council 2011) and the Sierra Nevada Forest Plan Amendment (USFS2004). Various methods for fuel modification, collectively termed “fuel treatments,”include shredding of understory biomass (mastication), removal of sub-merchantable small diameter trees and understory biomass (e.g., thinning frombelow), pre-commercial and commercial timber harvest (e.g., whole tree removal),and prescribed fire to remove surface fuels (shrub, grass, and down woody debris)and trees with low branches (ladder fuels). These treatments reduce or alter firebehavior, spatial patterns, effects on ecosystems and GHG emissions mainly byreducing the potential for crown fires and therefore fire severity (Moghaddas andCraggs 2007; Stephens et al. 2009a, b, c, 2012a; Moghaddas et al. 2010). Thesestudies document treatment effects on fire behavior across several treatment typesand provide guidance on designing treatments for forest stands.
Efficacy and effects of fuel treatments in real world situations has beendemonstrated in real wildfire conditions (Moghaddas and Craggs 2007; Saffordet al. 2009), but the majority of scientific evidence for their use comes frommodeling efforts (Stephens and Moghaddas 2005; Stephens et al. 2009a;Moghaddas et al. 2010; Collins et al. 2011). Overall, there is clear consensus in thepublished literature that fuel treatments, specifically those that incorporate thinningfrom below and treat surface fuels with prescribed fire, reduce potential fire severityunder a range of moderate to extreme weather conditions.
180 W. Crosson et al.

If climate change impacts continue even under the most conservative projec-tions, it is likely that coniferous forests in the Sierra Nevada will experience longerfire seasons (Westerling et al. 2006) which are relatively drier and more conduciveto high-intensity fire (Miller et al. 2009). To reduce this hazard, there is not one fueltreatment strategy. Rather, a combination of strategies is needed, especially whendealing with complex landscapes and management objectives.
Though now recognized as an important tool for fire protection and ecosystemprocess restoration, detailed strategies for application of the various techniques indifferent vegetation types at a landscape scale are still under study (Collins et al.2010, 2011). Where the management of naturally ignited wildfires for resourcebenefit is a viable management option, further research is needed to support theintegration of fuel treatments and beneficial fire use as a fuel management strategy.At a landscape scale, this is a difficult proposal and will likely challenge many ofthe current paradigms within management, policy, and regulatory frameworks(Germain et al. 2001; Collins et al. 2010).
Carbon Consequences of Fuel Treatments
Concerns over global climate change seemingly place fuel treatments that reducenear-term forest carbon stocks at odds with long-term carbon sequestration objec-tives in terrestrial vegetation as a means of climate change mitigation. Thoughwildfires also combust biomass and can be a significant source of atmosphericcarbon emissions in the near-term (Randerson et al. 2006; Ager et al. 2010), theymay also act as mechanisms for long-term carbon sequestration in some systems.
Several recent studies have investigated whether the potential future GHGemissions avoided through fuel treatment can offset immediate losses of storedcarbon and carbon emitted during operations, and even possibly result in netpositive carbon storage over longer time periods (Hurteau and North 2009, 2010;North et al. 2009; Stephens et al. 2009b, 2012a; Ager et al. 2010; Reinhardt andHolsinger 2010; Campbell et al. 2011; North and Hurteau 2011; Stephens et al.2012a, b; Saah et al. 2012, 2015).
Carbon stored in forests is reduced in the short term through fuel treatments thatare designed to reduce fire severity and smoke emissions. Other short term emis-sions include fossil fuel emissions from machinery used during treatments andprocessing of biomass and emissions from prescribed fires. While Campbell et al.(2011) found that more carbon is lost to treatments than what would be spared fromloss by wildfire, particularly if fire is infrequent, others have concluded that in thelong term, fuel treatments may result in overall increases in stored carbon, forexample through reduced fire effects, carbon sequestration in large, fire resistanttrees (Stephens et al. 2009a, b, c; Hurteau and North 2010), and in the form ofdurable wood products which might replace other fossil fuel intensive products(product substitution). Whether residues from fuel treatments are used to generateelectricity or if it is burned on site in piles can also greatly affect GHG benefits as
Use of Remotely Sensed Climate and Environmental … 181

well as air pollutant balances (Jones et al. 2010; Lee et al. 2010; Springsteen et al.2011, 2015).
Some carbon pools, such as soil organic matter, are relatively unchanged bywildfire regardless of the fire’s severity. In a nationwide study of fire and firesurrogate treatment effects on carbon storage, Boerner et al. (2008) found thenetwork-wide effects of these treatments on soil carbon modest and transient. Forabove ground carbon pools, Hurteau et al. (2008) pointed out that thinning can bethought of as increasing ‘rotation length’ by moving more forest carbon into longerresidence-time storage. Thinning in Sierra Nevada mixed conifer leads to carbonstorage in fewer, but larger, trees which are more representative of pre-settlementforest conditions. Hurteau and North (2009) concluded that the 1865 reconstructionstand structure, in which current stand density was reduced while large, fire resistantpines were retained, may be the best stand structure for achieving high carbonstorage while minimizing potential wildfire emissions in fire-prone forests.
Whether or not fuels treatments safeguard enough carbon to offset their carboncost depends on many factors including initial forest structure and carbon stocks,existing fuel loads, expected wildfire frequency and severity, fuel treatment typeand intensity, and the fate of merchantable forest products. In general, overstorythinning plus prescribed fire removes more carbon than other common fuel treat-ment types while prescribed fire only or understory thinning only removes the least.
2.1.3 Carbon Offset Protocol for Avoided Wildfire Emissions
For western US forests, the paradox around carbon sequestration is that policies arein place that encourages carbon sequestration through afforestation, reforestation,and other silvicultural practices (CAR 2012). In contrast, the treatments that reducecarbon loss to wildfire are poorly acknowledged by current climate-sensitive policy.This is especially relevant when considering that long-term wildfire carbon emis-sions can be three times the size of their direct carbon emissions during the fireitself (Stephens et al. 2009a, b, c).
As market-based approaches to mitigating global climate change are beingconsidered and implemented, one important emerging strategy for changing theeconomics of fuels treatments is to sell carbon emission offsets. Offsets are tradablecertificates or permits representing the right to emit a designated amount of carbondioxide or other GHGs. These offsets are generated when projects or actions reduceGHG emissions beyond what is required by permits and rules, and can be traded,leased, banked for future use, or sold to other entities that need to provide emissionoffsets (Sedjo and Marland 2003). In the case of fuel treatments, carbon emissionoffsets can theoretically be generated by projects that reduce potential emissionsfrom wildfire, as by modifying the probability of extreme fire behavior for a givenportion of land. In 2006, the California legislature enacted Assembly Bill 32: TheGlobal Warming Solutions Act (AB32), setting emissions goals for 2020 anddirecting the Air Resources Board to develop reduction measures to meet targets(State of California 2006). Forest management (including fuel treatments) is one
182 W. Crosson et al.

area that has been targeted for project-based offset development. The EPA andagencies implementing AB32 require that carbon emission offsets be quantifiable,real, permanent, enforceable, verifiable, and surplus.
Development of carbon emission offsets as an effective tool for forest and firemangers, therefore, requires an integrated approach that considers wildfire proba-bilities and expected emissions, as well as net expected carbon sequestration or lossover time.
Fuels treatments involve tradeoffs between reducing the risk of carbon loss dueto wildfires and increasing carbon emissions due to the fuels treatment themselves.Typically fuel treatments increase carbon emissions in the short term but in specificcontexts can reduce long-term carbon emissions when wildfires are considered.A key issue is the probability of fire occurring after treatment implementation.Treatments that are not impacted by wildfire do not mitigate potential emissions,and can therefore be carbon sources as opposed to sinks (Campbell et al. 2011).
The Climate Action Reserve’s Forest Project Protocol Version 3.3 (CAR 2012)provides forest owners with a platform to market carbon stored in their forest. Byacknowledging the mitigation potential of wildfire-related carbon losses throughfuel reduction treatments (Hurteau and North 2010), this protocol does not classifyfuel reduction treatments as an immediate emission (Hurteau and North 2009).However, a clear framework that accounts for the net emission savings andendorsed by leading carbon market platforms such as the California Air ResourcesBoard is missing to date. Necessary steps toward development of such a protocolare under way (e.g., Saah et al. 2012). Methodological development will require aconsensus on how to approach the following framework elements: (1) delineate andcharacterize appropriate spatial scales; (2) define acceptable treatment and notreatment (baseline) forest management practices; (3) identification of appropriateforest growth and yield models; (4) definition of forest biomass removals life cycleassessment boundaries; (5) defining mechanisms for determining fuel treatmenteffectiveness and longevity; (6) quantification methods for determining directwildfire emissions and indirect treatment effects of fuel treatments on fire within thegreater landscape; (7) parameters for determining the probability of fire ignition andfire return interval; (8) standards for quantifying the risk of vegetation conversionafter high-severity fires (e.g., forest converted permanently to brush land); and,(9) acceptable practice for prorating total short and long-term emissions.
2.2 Water-Borne Diseases
The World Health Organization (WHO) reports that over 3.5 million people dieannually because of various water-related diseases (WHO/UNICEF 2014). Over abillion people in the world still lack access to safe water, and over two billion lacksufficient sanitation facilities. Due to the insufficient safe water and sanitationaccess in many parts of the world, and lack of knowledge and understanding of themicroscale and macroscale processes and transmission pathways of many
Use of Remotely Sensed Climate and Environmental … 183

water-related diseases, the burden of water-borne diseases remains unacceptablyhigh (Akanda et al. 2014).
As the world is rapidly urbanizing, most of the world’s emerging megacities willbe situated in coastal areas of Asia and Africa (Akanda and Hossain 2012). Many ofthese regions will experience significant shifts in regional climate patterns andcoastal sea level rise. As a result, the relationship between climate, water, and healthwill become more intimate, existing vulnerabilities will worsen, and natural dis-asters such as droughts and floods will expose millions to displacement, unsafeliving conditions, and water-borne diseases. There is great potential to channel theefforts and skillsets of the satellite remote sensing community for public healthbenefits to reduce the burden from water-related diseases by providing timely andefficient prediction of water-related disasters, assessment of population vulnerabilityin regions at risk, and strengthening prevention efforts with operational earlywarning systems, as well as, education and outreach.
For example, the ongoing seventh pandemic of cholera started in the 1960s andhas affected over seven million people in over 50 countries. The WHO estimatesthat cholera affects over three million people and causes 250–300 thousand deathsevery year. Despite the continuous progress on the research on the causativepathogen V. cholerae and the development of vaccines, there is limited under-standing of the causative pathways and the role of large-scale physical processesand climate phenomena in propagating outbreaks across regions (Akanda et al.2014). This case study analyzes how satellite remote sensing can be used indetecting appropriate large-scale processes behind endemic and epidemic choleraoutbreaks in South Asia, where combination of droughts and floods and coastalecological conditions create a favorable transmission environment.
The timing of seasonal cholera outbreaks can be anticipated reasonably well inendemic settings such as the Bengal delta region of South Asia or in the Lakesregion in Sub-Saharan Africa (Jutla et al. 2015a, b). However, the potential mag-nitude or the location of outbreaks remains hard to anticipate, and the preemptivepositioning of the appropriate level of human and material resources in anticipationof outbreaks have been especially difficult. Predictions based on the larger scaleprocesses that have sufficient system memory can add significant ‘lead-time’ aheadof impending outbreaks for preemptive preparations. Such predictions can bevaluable for endemic regions by adding the potential timing, intensity, and locationof outbreaks; and especially for epidemic regions by identifying regions at risk ofpotential outbreaks and assessing the population vulnerability to cope with suchdisasters (Akanda et al. 2012).
The bacterium V. cholerae can survive, multiply, and proliferate in favorableaquatic and brackish estuarine environments (Colwell and Huq 2001). Primaryoutbreaks of cholera have been reported in coastal areas of South Asia, Africa, andSouth America over the last several decades (Huq and Colwell 1996; Griffith et al.2006). Ever since the first correlative study relating cholera incidence withincreased algae in the waters of rural South Asia, various studies have postulatedconnections between coastal cholera outbreaks and plankton abundance in themarine environment (Cockburn and Cassanos 1960; Huq and Colwell 1996).
184 W. Crosson et al.

The endemic and epidemic outbreaks in South Asia have been linked to anumber of environmental and climatic variables, such as precipitation (Longiniet al. 2002; Pascual et al. 2002; Hashizume et al. 2008), coastal phytoplanktonabundance (Lobitz and Colwell 2000), floods (Koelle et al. 2005), water temper-ature (Colwell 1996), peak river level (Schwartz et al. 2006), and sea surfacetemperature (Cash et al. 2008). The link with environmental factors have also beenstudied for other cholera affected regions in the world, such as Southeast Asia(Emch et al. 2008), Sub-Saharan Africa (Hashizume et al. 2008), southern Africa(Bertuzzo et al. 2008), and South America (Gil et al. 2004).
Cholera incidence in the Bengal Delta region shows distinct seasonal and spatialvariations in shape of single annual and biannual peaks, in sharp contrast to thetypically seen single peaks in other regions (Akanda et al. 2009). The outbreaks inthis region typically propagate from the coastal areas in spring to the inland areas infall aided by the monsoon season in between. In sum, the transmission processexhibits two distinctly different transmission cycles, pre-monsoon andpost-monsoon, influenced by coastal and terrestrial hydroclimatic processes,respectively, revealing a strong association of the space time variability of incidencepeaks with seasonal processes and extreme hydroclimatic events (Akanda et al.2011).
Application of remote sensing to study cholera dynamics has been an emergingresearch area with the availability of longer and more accurate datasets over the lastfew decades (Jutla et al. 2015b). A principal motivation for using satellite remotesensing in monitoring the environmental conditions conducive for the cholerapathogen stemmed from the fact that it shows strong association with coastalphytoplankton (Colwell 1996). Although, chlorophyll variations on a daily scaleexhibited random variability with very limited memory (Uz and Yoder 2004),earlier studies by Lobitz and Colwell (2000) showed promise in monitoring thecoastal growth environment for the bacteria with the help of chlorophyll mea-surements in coastal Bay of Bengal. In this endemic region, the seasonal freshwaterscarcity from upstream regions in the flat deltaic landscape provides a vast growthenvironment during the dry spring months, which can be monitored by studying thespace–time variability of chlorophyll in northern Bay of Bengal and thus linkingcoastal processes to predicting cholera outbreaks in the region (Akanda et al. 2013).
Jutla et al. (2012) quantified the space–time distribution of chlorophyll in thecoastal Bay of Bengal region using data from SeaWiFS (Sea-Viewing WideField-of-View Sensor) using 10 years of data (2000–2009). A key finding of thestudy was that while the variability of chlorophyll at daily scale resembled whitenoise, chlorophyll values showed distinct seasonality at monthly scales and withincreased spatial averaging. The first cholera outbreaks near the coastal areas inspring were found to be correlated with the northward movement of theplankton-rich seawater and increased salinity of the estuarine environment favoringincreased growth and abundance of the cholera bacteria in river corridors. In afollow-up study, Jutla et al. (2013) showed that seasonal endemic cholera outbreaksin the Bengal Delta region can be predicted up to three months in advance with aprediction accuracy of over 75 % by using satellite-derived chlorophyll (as a
Use of Remotely Sensed Climate and Environmental … 185
surrogate for coastal plankton and pathogen growth) and air temperature (as asurrogate for upstream snowmelt and freshwater flow) data. A high predictionaccuracy was achievable because the two seasonal peaks of cholera in spring andfall were predicted using two separate models representing distinctive seasonalenvironmental processes. The inter-annual variability of pre-monsoon choleraoutbreaks in spring were satisfactorily linked with coastal plankton blooms, and thepost-monsoon cholera outbreaks in fall were related to breakdown of sanitaryconditions due to monsoon flooding and subsequent inundation in floodplainregions (Akanda et al. 2013; Jutla et al. 2013).
With more than a decade of terrestrial water storage data from the Gravity Recoveryand Climate Experiment (GRACE) mission, conditions have recently emerged forpredicting cholera occurrence with increased lead-times. The lead–lag relationshipsbetween terrestrial water storage in the Ganges–Brahmaputra–Meghna basin of SouthAsia and endemic cholera in Bangladesh were investigated in a study by Jutla et al.(2015a). Availability of data on water scarcity and abundance in large river basins, aprerequisite for developing cholera forecasting systems, are difficult to obtain. Theubiquitous use of river water for irrigation, sanitation, and consumption purposes in thisheavily populated basin region exposes the riverine societies to the infectious disease(Akanda et al. 2013). Open mixing of water bodies and channels with V. cholerae leadsto transmission through breakdown in sanitation in heavy monsoon rainfall, andinundated areas are enriched with bacteria already present in the ecosystem. Accordingto Jutla et al. (2015a); water availability showed a strong asymmetrical association withcholera prevalence in spring (τ = − 0.53; P < 0.001) and in autumn (τ = 0.45;P < 0.001) up to 6 months in advance. The study concluded that one unit (centimeterof water) decrease in water availability in the basin increased the odds of spring choleraprevalence above normal by 24 %, while an increase in regional water by one unit dueto flooding increased odds of above average fall cholera by 29 %.
Satellite remote sensing data were also used successfully to capture the changesin hydroclimatic conditions related to the infamous cholera outbreak of 2008 inZimbabwe. The first cases of cholera in Zimbabwe were reported to the WorldHealth Organization in August 2008; but between then and June 2009, a massiveoutbreak erupted with a total of 98,522 cholera cases and 4,282 deaths(WHO/UNICEF 2009). The case fatality ratio in this epidemic, i.e., the ratio ofdeaths to total cases reported as a measure of the intensity of the epidemic, werefound to be much higher than those reported in other countries or areas whereappropriate treatment was available. In a recent study by Jutla et al. (2015b),large-scale hydroclimatic processes estimated using TRMM-based precipitation andgridded air temperature were linked with epidemiological data to assess risk ofdisease occurrence in a retrospective manner.
Although the precise location of the region of a disease outbreak could not bedetermined with the existing resolution of the TRMM data, a provincial analysisapproach (averaging of all pixels in a particular province) showed strong correlationof precipitation and air temperature (Jutla et al. 2015b). The study postulates that ifanomalous temperature in a vulnerable region is followed by heavy precipitation,the risk of a cholera outbreak increases significantly, especially in areas where the
186 W. Crosson et al.

drinking water source and sanitation infrastructure are poorly maintained orunavailable. The empirical observations and relationships between satellite sensedprecipitation and temperature for the 2008 Zimbabwe cholera outbreaks wereexpanded for five other countries (Mozambique, South Sudan, Rwanda, CentralAfrican Republic, and Cameroon) in the Sub-Saharan Africa region. The studyshowed that anomalous above average air temperatures, followed by above averageprecipitation at least 1 month in advance were correlated and statistically significantwith the first reporting of cholera outbreaks in all sites.
The results demonstrate that satellite data measurements of climatic and environ-mental variables such as precipitation, temperature, terrestrial water storage, and coastalchlorophyll can be meaningful predictors over a range of space and time scales and canbe effective in monitoring ecological conditions conducive for the pathogen V. choleraeand developing a cholera prediction model with several months lead time. Such anapproach also shows the potential of newer missions with the increased ability tomonitor hydrological and environmental conditions such as river elevation fromSurface Water and Ocean Topography (SWOT) and soil moisture from SMAP. Thefindings and understandings derived from South Asia and Sub-Saharan Africa mayserve as the basis for the development of “climate informed” early warning systems forpreempting epidemic cholera outbreaks in vulnerable regions and prompting effectivemeans for intervention in vulnerable regions.
2.3 Vector-Borne Diseases
Epidemics of vector-borne diseases still cause millions of deaths every year.Malaria remains a major global health problem, with an estimated three billionpeople at risk of infection in over 109 countries, 250 million cases annually and onemillion deaths. Malaria is highly sensitive to climate variations, thus climateinformation can either be used as a resource, for example in the development ofearly warning systems (DaSilva et al. 2004), or must be accounted for when esti-mating the impact of interventions (Aregawi et al. 2014).
In Ethiopia, the determinants of malaria transmission are diverse and localized(Yeshiwondim et al. 2009), but altitude (linked to temperature) is a major limitingfactor in the highland plateau region, and rainfall in the semiarid areas. A devastatingepidemic caused by unusual weather conditions was documented in 1958, affectingmost of the central highlands between 1600 and 2150 m elevation with an estimatedthree million cases and 150,000 deaths (Fontaine et al. 1961). Subsequently, cyclicepidemics of various dimensions have been reported from other highland areas, withintervals of approximately 5–8 years with the last such epidemic occurring in 2003.Most of these epidemics have been attributed to climatic abnormalities, sometimesassociated with El Nino, although other factors such as land-use change may also beimportant.
Endemic regions of Visceral leishmaniasis (VL) exist within East Africa with ageographic hotspot in the northern states of South Sudan. This region experiences
Use of Remotely Sensed Climate and Environmental … 187

seasonal fluctuations in cases that typically peak during the months of Septemberthrough January (SONDJ) (WHO 2013; Gerstl et al. 2006; Seaman et al. 1996). Inthe northern states of South Sudan alone, VL epidemics have recently beenobserved with a reported 28,512 new cases from 2009 to 2012 (Ministry of Health—Republic of South Sudan 2013). Without proper treatment, mortality in SouthSudan is high, with numbers approaching 100,000 during one multi-year epidemicin the late 1980s and early 1990s (Seaman et al. 1996).
The habitat of the VL vector P. orientalis is determined by specific ecologicalconditions including the presence of specific soils, woodlands, and mean maximumdaily temperature (Thomson et al. 1999; Elnaiem et al. 1999; Elnaiem 2011).Research has also documented associations between environmental factors and VLthat may contribute to outbreaks of the disease including: relative humidity(Salomon et al. 2012; Elnaiem et al. 1997), precipitation (Gebre-Michael et al.2004; Hoogstraal and Heyneman 1969), and normalized difference vegetation index(NDVI) (Elnaiem et al. 1997; Rajesh and Sanjay 2013). Additionally, Ashford andThomson (1991) suggested the possibility of a connection between a prolongedflooding event in the 1960s and the corresponding 10-year drop in VL within thenorthern states of South Sudan. Although the importance of environmental vari-ables in relation to the transmission dynamics of VL has been established, the lackof in situ data within the study region has led to inconclusive results regarding theserelationships. By exploiting the advantages of sustained and controlled Earthmonitoring via NASA’s Earth observations, the relationship between environmentalfactors and the spatiotemporal distribution of VL in the northern states has beenshown (Sweeney et al. 2014), therefore showing how Earth observations can beused for mapping risks of leishmaniasis.
Recently, methodology has been developed which use remote sensing to monitorclimate variability, environmental conditions, and their impacts on the dynamics ofinfectious diseases. These methods and results are described in the followingsections.
2.3.1 Climate and Environmental Factors: How Do They Help?
To date much of the debate has centered on attribution of past changes in diseaserates to climate change, and the use of scenario-based models to project futurechanges in risk for specific diseases. While these can give useful indications, theunavoidable uncertainty in such analyses, and contingency on other socioeconomicand public health determinants in the past or future, limit their utility as decisionsupport tools. For operational health agencies, the most pressing need is thestrengthening of current disease control efforts to bring down current disease ratesand manage short-term climate risks, which will, in turn, increase resilience tolong-term climate change. The WHO and partner agencies are working through arange of programs to (i) ensure political support and financial investment in pre-ventive and curative interventions to reduce current disease burdens; (ii) promote acomprehensive approach to climate risk management; (iii) support applied research,
188 W. Crosson et al.

through definition of global and regional research agendas, and targeted researchinitiatives on priority diseases and population groups (Campbell-Lendrum et al.2015).
Risk Maps
A risk map can aid in understanding the relationship between the diseases and theclimate. Figure 1 shows how a risk map was produced to understand the rela-tionship between climate and malaria in Eritrea. This analysis indicates that malariaincidence exists across a rather sharp spatial gradient in Eritrea and that this vari-ation is driven by climatic factors. It is clear that malaria is high in the western partof Eritrea and peaks in September–October immediately after the July–August rainyseason. Conversely, in the highlands of Eritrea (central green part), malaria inci-dence is low because of low temperatures at the high altitudes. On the east coast,there are some areas where malaria peaks in January because of rainfall that occursoccasionally in December.
Fig. 1 A climate risk map showing the spatiotemporal stratification of malaria incidences inEritrea at district level. Source: Ceccato et al. (2007)
Use of Remotely Sensed Climate and Environmental … 189

Early Warning System
The WHO has developed a framework for creating an early warning system formalaria (DaSilva et al. 2004), which can be used as a framework for floods, naturaldisasters, droughts, and other events that have a relationship with climate andenvironmental factors. The framework is composed by four components:
1. Vulnerability assessment2. Climate forecasting3. Monitoring of climate and environmental factors, including precipitation, tem-
perature, presence of vegetation, or water bodies that influence mosquitodevelopment
4. Case surveillance
2.3.2 Accessing Quality Data Through Earth Observations
Decision-makers and researchers often face a lack of quality data required foroptimal targeting the intervention and surveillance of vector-borne diseases. Thedecisions are critical as they impact on the lives of many people: “bad data createbad policies”. Climate data and information—whether station- or satellite-generated—can increasingly be accessed freely online. Station data, of varying quality, cantypically be obtained from a country’s National Meteorological Service (NMS).However, station data are not always available. Some of the station data providedby the NMS are freely available through the Global Telecommunication System(GTS) but often lack of the required spatial resolution needed.
Satellites provide raw global data that are continuously archived. In many casesthe raw data may be free, but not all interfaces allow free access to their archiveddata. Sources for satellite-generated climate data are varied, and a selection isprovided below. The following are likely to be the most useful of the freelyavailable satellite-based estimates.
Precipitation
• Global Precipitation Climatology Project (GPCP) combines satellite and stationdata. The monthly data extend from 1979 onwards. This product has a low(2.5°) spatial resolution, but is of interest when creating long time series tounderstand trends in past precipitation.
• Climate Prediction Center (CPC) Merged Analysis of Precipitation (CMAP),similar to GPCP, combines satellite and station data to produce 5-day andmonthly aggregations at a 2.5° spatial resolution.
• CPC MORPHing technique (CMORPH) provides global precipitation estimatesat very high spatial (8 km) and temporal (30 min) resolution. This product is
190 W. Crosson et al.

suitable for real-time monitoring of rainfall, provided a long history is notrequired, as data are only available from January 1998.
• Tropical Rainfall Measuring Mission (TRMM) provides monthly estimates ofprecipitation in the tropics at 0.25° spatial resolution. They are available fromJanuary 1998, with a latency of about a month or more. The TRMM missionended in 2015.
• Global Precipitation Measurement (GPM) provides estimates of precipitationglobally. They are available from March 2014 to present at 0.1° spatial reso-lution. The GPM is an extension of the TRMM rain-sensing package.
• Enhancing National Climate Services (ENACTS) program combines all avail-able rain gauge data from the National Meteorology Agencies of Ethiopia,Gambia, Ghana, Madagascar, Mali, Rwanda, Tanzania, and Zambia withsatellite data for the last 30 years with high spatial resolution (4 km) and a10-day temporal resolution. ENACTS is expected to expand other countries inAfrica.
• Climate Hazards Group InfraRed Precipitation with Station (CHIRPS) data areproduced using a similar technique to that of ENACTS. CHIRPS provides dailyrainfall from 1981–present at a 0.05° resolution and covers 50°S–50°N. Moredetails of CHIRPS are given in Sect. 2.3.3.
Temperature
In many parts of the world, the spatial distribution of weather stations is limited andthe dissemination of temperature data is variable, therefore limiting their use forreal-time applications. Compensation for this paucity of information may beobtained by using satellite-based methods. The estimation of near-surface airtemperature (Ta) is useful for tracking vector-borne diseases. It affects the trans-mission of malaria (Ceccato et al. 2012) in the highlands of East Africa. Airtemperature is commonly obtained from synoptic measurements from weatherstations. However, the derivation of Ta from satellite-derived land surface tem-perature (Ts) is far from straightforward. Studies showed that it is possible toretrieve high-resolution Ta data from the MODIS Ts products (Vancutsem et al.2010; Ceccato et al. 2010). Ts is available from MODIS dating to *2000 and fromVisible Infrared Imager Radiometer Suite (VIIRS) since 2012 at a 1 km spatialresolution. Separate estimates for daytime and nighttime temperatures are available,from which daily maximum and minimum air temperature estimates can be derived.
Vegetation
Remote sensing can be used to distinguish vegetated areas from other surfacecovers. Various vegetative properties can be gleaned from indices such as the
Use of Remotely Sensed Climate and Environmental … 191

NDVI, including, but not limited to, leaf area index, biomass, and greenness.Practitioners can access data on vegetation cover through the following sources:
• Global NDVI from legacy NASA sensors is available from NASA’s GlobalInventory Monitoring and Modeling Studies (GIMMS) for the period from 1981to date. The dataset has been shown to be valid in representing vegetationpatterns in certain regions (but not everywhere) and should be used with caution(Ceccato 2005).
• MODIS NDVI and enhanced vegetation index (EVI) are available for 16-dayperiods from April 2000 at 250 m resolution. The NDVI is an updated extensionto the Global NDVI.
2.3.3 Improving Data Quality and Accessibility
To address the spatial and temporal gaps in climate data as well as the lack ofquality-controlled data, approaches are being developed based on the idea ofmerging station data with satellite and modeled data. Some of these methods aredeveloping platforms in which the now-quality-improved data can be accessed,manipulated and integrated into the programs of national-level stakeholders andinternational partners.
ENACTS Approach
The IRI has been working with national meteorological agencies in Africa(Ethiopia, Gambia, Ghana, Madagascar, Mali, Rwanda, Tanzania, and Zambia) toimprove the availability, access, and use of climate information by nationaldecision-makers and their international partners. The approach, ENACTS, is basedon three pillars (Dinku et al. 2011, 2014a, b):
1. Improving data availability: Availability of climate data is improved bycombining quality-controlled station data from the national observation networkwith satellite estimates for rainfall and elevation maps and reanalysis productsfor temperature. The final products are datasets with 30 or more years of rainfalland temperature for a 4 km grid across the country.
2. Enhancing access to climate information: Access to information products isenhanced by making information products available online.
3. Promoting the use of climate information: Use of climate information ispromoted by engaging and collaborating directly with potential users.
By integrating ground-based observations with proxy satellite and modeled data,the ENACTS products and services overcome issues of data scarcity and poorquality, introducing quality-assessed and spatially complete data services intonational meteorological agencies to serve stakeholder needs. One of the strengths of
192 W. Crosson et al.

ENACTS is that it harnesses all local observational data, incorporatinghigh-definition information that globally produced or modeled products rarelyaccess. The resulting spatially and temporally continuous data sets allow for thecharacterization of climate risks at a local scale. ENACTS enables analysis ofclimate data at multiple scales to enhance malaria control and elimination decisions.
CHIRPS Approach
A similar approach has been developed by CHIRPS, a near-global rainfall datasetcovering 1981-present (http://pubs.usgs.gov/ds/832/pdf/ds832.pdf). CHIRPSincorporates 0.05° resolution satellite imagery with in situ station data to creategridded rainfall time series for trend analysis and seasonal drought monitoring.Two CHIRPS products are produced operationally: a rapid preliminary version, anda later final version. The preliminary product, which uses only a single stationsource, GTS, is available for the entire domain 2 days after the end of a pentad. Thefinal CHIRPS product takes advantage of several other stations sources and iscomplete sometime after the 15th of the following month. Final monthly, dekad,pentad, and daily products are calculated at that time.
Fig. 2 Monthly inundation anomalies (AMJJ) and VL cases summed over SONDJ for LankienMedical Center in Jonglei State
Use of Remotely Sensed Climate and Environmental … 193

2.3.4 Examples of Analysis
Inundation Products for Leishmaniasis
Surface inundation datasets have been developed to examine inundation dynamics(McDonald et al. 2011) using the QuikSCAT and Advanced Microwave ScanningRadiometer—Earth Observing System (AMSR-E) active/passive microwave data-sets over the period 2004–2009 for the South Sudan (Schroeder et al. 2010). Threeenvironmental variables (NDVI, precipitation, and inundation) aided in determiningwhether wet or dry years were more conducive to the transmission of leishmaniasis.
Inundation during April–July also exhibited a strong inverse relationship withVL cases in SONDJ. Results are typified by the Lankien Medical Center analysis
Fig. 3 Landsat image over the Rift Valley in Ethiopia, represented with false color combinationof the middle infrared, near-infrared and red. Green indicates vegetation, blue shows water bodies,and pink–brown shows bare soils. Green dots represent villages with low malaria transmission,yellow and orange dots represent villages with medium to medium high malaria transmission, andred dots represent villages with high malaria transmission
194 W. Crosson et al.

where below average inundation during April displays an inverse relationship withVL cases in the following SONDJ (Fig. 2).
Water Bodies Products for Malaria
Using Landsat images at 30 m resolution, it is possible to map small water bodieswhere mosquitoes will breed and transmit diseases such as malaria, dengue fever,chikungunya, West Nile Fever and Zika (Pekel et al. 2011). This is done bycombining the middle infrared channel (sensitive to water absorption), thenear-infrared channel (sensitive to bare soil and vegetation canopy), and the redchannel (sensitive to chlorophyll absorption). In Fig. 3, malaria data are overlaid ona Landsat image for the Rift Valley in Ethiopia. Villages with low malaria trans-mission are located either in the highland areas where temperature is the limiting
Fig. 4 MODIS nighttime LST showing difference of temperatures according to the elevation inthe highlands of Ethiopia
Use of Remotely Sensed Climate and Environmental … 195

factor or in the dry Rift Valley. Villages with high malaria transmission are locatedin the dry valley where green vegetation and water bodies are present.
Temperature for Malaria
Nighttime Aqua MODIS Land Surface Temperature (LST) in the highlands ofEthiopia close to the Rift Valley is overlaid in Fig. 4 with altitude lines showingthat for a same altitude, temperature can be either favorable for mosquitoes breeding(>16 °C) or unfavorable (<16 °C). This information is important for the Ministry ofHealth to target control measure to fight malaria.
Time series of MODIS LST can show how the temperature varies in the high-lands and therefore impacts the transmission of malaria. Integrating precipitationand temperature into a vectorial capacity model (VCAP), allows the Ministries ofHealth in Africa to assess the risk of malaria transmission in the epidemic zones ofAfrica (Ceccato et al. 2012).
3 Conclusion and Way Forward
The challenge issued by the 2007 Decadal Survey (NRC 2007): “Addressing thesesocietal challenges requires that we confront key scientific questions related to …transcontinental air pollution … impacts of climate change on human health, andthe occurrence of extreme events, such as severe storms, heat waves, …” frames apowerful approach for building a future in which Earth observation (EO) data areused to greatly improve quality of life globally through advances in air quality andhuman health monitoring, forecast, and warning systems. Key to this approach is tomobilize, through better EO data and associated analytical tools, modeling, andtraining, the capacity-building community that is reliant on EO data. The partici-pants in a 2015 ‘NASA E2 Capacity Building Workshop’ noted that it was time forthe EO-based capacity-building community to broaden the focus of current EOapplication programs (such as NASA’s Applied Sciences program) to tackle thesecritical issues through application of EO-based (orbital and non-orbital) science.The participants posed the following key questions related to health and air quality:
• How can we better adapt to the impact of climate change on changing vector-and water-borne disease burden on vulnerable populations?
• If capacity to build EO-based health monitoring improves around the world,how do we measure the societal impact in terms of quality of life and livessaved?
• How can we identify the most impactful intervention strategy for endemic andepidemic diseases in order to design EO-based decision-making tools?
196 W. Crosson et al.

• How can the use of small satellites, unmanned aerial systems, and crowdsourcing programs (citizen science) assist in building and improving more rel-evant health and air quality monitoring tools that currently use data from con-ventional satellites?
• What type of disease-relevant and region-specific EO tools is needed toempower the health community?
• Recognizing the inherent nexus between water and water-borne disease, howcan we facilitate greater interaction between technical experts in the water andhealth communities?
The participants also made the following recommendations related to health andair quality:
• A greater focus is needed on understanding how EO systems can best addressthe impact of climate change on future disease burden.
• Recognizing the strong connections of water resources (availability) withwater-borne diseases, water community technical experts that use EO systemsand data should partner more effectively with the traditional health community.
• There needs to be greater investment in small satellites and citizen scienceprograms (volunteered geographic information) for health monitoring.
• Programs need to be in place that facilitate clearer communication and trustbuilding between the health stakeholder community and scientists who use EOdata for capacity building of health institutions around the world.
• In an effort to build durable capacity of EO systems, space agencies and othernational or global organizations should identify strategic partners from philan-thropic and private sector organizations with overlapping priorities that rely onmonitoring of environmental and Earth science data in their operations.
NASA’s HAQ program has mapped a vision statement to define where it aspiresto be in 2030 in terms of global capacity. The program will issue the followinghealth ‘grand challenges’ to the community:
Malaria—Risk characterization models will be deployed regionally. A unifieddynamic malaria risk model would be a major achievement for end users worldwideand would provide economic savings by scale and elimination of duplicativemodels.
Vector-borne diseases: The World Health Organization and other health officialswill have access to global risk maps of infectious diseases associated with viralhemorrhagic fevers on a daily basis to aid health officials’ preparedness.
Monitoring and forecasting Harmful Cyanobacterial Blooms (HABs):Cyanobacterial harmful algal blooms are a concern for water supplies due to theirpotential to produce toxins in lakes and estuaries. In cooperation with NOAA, newsatellite-derived products will be developed for the issuance of daily HAB bulletinsto pertinent US end users.
The air quality ‘grand challenges’ for 2030 are:Accurate ground level aerosol and constituent and ozone measurements will
routinely be obtained from a combination of remote sensing, in situ observations,
Use of Remotely Sensed Climate and Environmental … 197

and models. Total columnar aerosol and ozone estimates are routinely made fromsatellite sensors, but these have limited value for determining human exposure toharmful pollutants.
The HAQ program will have established strong relationships with federal, state,local, and international partners to identify unique applications of satellite obser-vations and realize their operational use. These applications will provide criticalcomponents for integration with forecast models and decision support systems.NASA’s participation in health and air quality applications research and relatedtransition to operations activities currently performed with EPA, NOAA, CDC, andothers will fill a significant niche in national capabilities and will be vital compo-nents in future domestic and international programs.
In other words, by 2030, the goal is for EO products developed under the HAQprogram to be widespread, regularly accessed, and indispensable to the public andend users. The HAQ program will be known as the ‘go to’ program for informationabout vector-borne and infectious disease risks, environmental health risks, anddangerous air pollution episodes.
References
Agee, J. K. (2002). The fallacy of passive management. Conservation in Practice, 3(1), 18–26.doi:10.1111/j.1526-4629.2002.tb00023.x.
Ager, A. A., Vaillant, N. M., & Finney, M. A. (2010). A comparison of landscape fuel treatmentstrategies to mitigate wildland fire risk in the urban interface and preserve old forest structure.Forest Ecology and Management, 259, 1556–1570.
Akanda, A. S., & Hossain, F. (2012). The climate-water-health nexus in emerging megacities. EOSTransactions, 93(37), 353–354.
Akanda, A. S., Jutla, A. S., & Islam, S. (2009). Dual peak cholera transmission in Bengal Delta: Ahydroclimatological explanation. Geophysical Reseach Letters, 36, L19401.
Akanda, A. S., Jutla, A. S., Alam, M., de Magny, G. C., Siddique, A. K., Sack. R. B., et al. (2011).Hydroclimatic influences on seasonal and spatial cholera transmission cycles: Implications forPublic Health Intervention in Bengal Delta. Water Resources Research, 47, W00H07.
Akanda, A. S., Jutla, A. S., Gute, D. M., Evans, T., & Islam, S. (2012). Reinforcing choleraintervention through prediction aided prevention. Bulletin of the World Health Organization,90, 243–244.
Akanda, A. S., Jutla, A. S., Gute, D. M., Sack, B. R., Alam, M., Huq, A., et al. (2013). PopulationVulnerability to Biannual Cholera Peaks and associated Macro-scale drivers in the BengalDelta. American Journal of Tropical Medicine and Hygeine, 89(5), 950–959.
Akanda, A. S., Jutla, A. S., & Colwell, R. R. (2014). Global diarrhea action plan needs integratedclimate-based surveillance. The Lancet Global Health, 2(2), e69–e70.
Anderson, M. K. (2005). Tending the wild: Native American knowledge and the management ofCalifornia’s natural resources. Berkeley, CA: University of California Press.
Aregawi, M., Lynch, M., Bekele, W., Kebede, H., Jima, D., Taffese, H.S., et al. (2014). Measureof trends in malaria cases and deaths at hospitals, and the effect of antimalarial interventions,2001–2011, Ethiopia. PLoS ONE 9(1), e106359.
198 W. Crosson et al.

Arno, S. F., Parsons, D. J., & Keane, R. E. (2000). Mixed-severity fire regimes in the NorthernRocky Mountains: Consequences of fire exclusion and options for the future. Proceedings ofthe Wilderness Science in a Time of Change Conference. RMRS Proceedings 15 (Vol. 5,pp. 225–232). USDA Forest Service, Rocky Mountain Research.
Ashford, R. W., & Thomson, M. (1991). Visceral Leishmaniasis in Sudan. A delayed developmentdisaster. Annals of Tropical Medicine and Parasitology, 85, 571–572.
Beaty, R. M., & Taylor, A. H. (2008). Fire history and the structure and dynamics of a mixedconifer forest landscape in the northern Sierra Nevada, Lake Tahoe Basin, CA. Forest Ecologyand Management, 255, 707–719.
Bertuzzo, E., Azaele, S., et al. (2008). On the space-time evolution of a cholera epidemic. WaterResources Research, 44, W01424.
Biswell, H. (1959). Man and fire in ponderosa pine in the Sierra Nevada of California. Sierra ClubBulletin, 44, 44–53.
Biswell, H. H. (1989). Prescribed burning in California wildland vegetation management.Berkeley, CA: University of California Press.
Boerner, R. E. J., Huang, J., & Hart, S. C. (2008). Fire, thinning, and the carbon economy: Effectsof fire and fire surrogate treatments on estimated carbon storage and sequestration rate. ForestEcology and Management, 255, 3081–3097.
Campbell, J. L., Harmon, M. E., & Mitchell, S. R. (2011). Can fuel-reduction treatments reallyincrease forest carbon storage in the western U.S. by reducing future fire emissions? Frontiersin Ecology and the Environment. doi:10.1890/110057.
Campbell-Lendrum, D., Manga, L., Bagayoko, M., & Sommerfeld, J. (2015). Climate change andvector-borne diseases: What are the implications for public health research and policy?Philosophical Transactions of the Royal Society B, 370, 20130552. doi:10.1098/rstb.2013.0552.
CARB (California Air Resources Board), Summer Wildfire PM Exceptional Event Demonstration.(2009). http://www2.epa.gov/air-quality-analysis/exceptional-events-submissions-table#PM10.
Cash, B. A., Rodo, X., & Kinter III, J. L (2008). Links between Tropical Pacific SST and choleraincidence in Bangladesh: Role of the Eastern and Central Tropical Pacific. Journal of Climate,21, 4647–4663.
Ceccato, P. (2005). Operational Early Warning System Using SPOT-VGT and TERRA-MODIS toPredict Desert Locust Outbreaks. Proceedings of the 2nd VEGETATION International UsersConference, March 24–26, 2004. Antwerpen. In: F. Veroustraete, E. Bartholome, W.W. Verstraeten, (Eds.), Luxembourg: Luxembourg: Office for Official Publication of theEuropean Communities, ISBN 92-894-9004-7, EUR 21552 EN, 475 p.
Ceccato, P., Ghebremeskel, T., Jaiteh, M., Graves, P. M., Levy, M., Ghebreselassie, S., et al.(2007). Malaria stratification, climate and epidemic early warning in Eritrea. American Journalof Tropical Medicine and Hygiene, 77, 61–68.
Ceccato, P., Vancutsem, C., & Temimi, M. (2010). Monitoring air and land surface temperaturesfrom remotely sensed data for climate-human health applications. International Geoscienceand Remote Sensing Symposium (IGARSS), 178–180.
Ceccato, P., Vancutsem, C., Klaver, R., Rowland, J., & Connor, S. J. (2012). A vectorial capacityproduct to monitor changing malaria transmission potential in epidemic regions of Africa.Journal of Tropical Medicine, 2012, Article ID 595948. doi:10.1155/2012/595948, 6 pp.
Climate Action Reserve (CAR). (2012). Climate Action Reserve’s Forest Project Protocol Version3.3. Retrieved October 29, 2015 from http://www.climateactionreserve.org/how/protocols/forest/dev/version-3-3/.
Use of Remotely Sensed Climate and Environmental … 199
Cockburn, T. A., & Casanos, J. G. (1960). Epidemiology of Endemic Cholera. Public HealthReports, Vol. 75, No. 9.
Collins, B. M., Stephens, S. L., Moghaddas, J. J., & Battles, J. (2010). Challenges and approachesin planning fuel treatments across fire-excluded forested landscapes. Journal of Forestry, 108(1), 24–31.
Collins, B. M., Everett, R. G., & Stephens, S. L. (2011). Impacts of fire exclusion and managed fireon forest structure in an old growth Sierra Nevada mixed-conifer forest. Ecosphere, 2, art 51.
Colwell, R. (1996). Global climate and infectious disease: The cholera paradigm. Science, 274(5295).
Colwell, R., & Huq, A. (2001). Marine ecosystems and cholera. Hydrobiologia, 460.DaSilva, J., Garanganga, B., Teveredzi, V., Marx, S. M., Mason, S. J., & Connor, S. J. (2004).
Improving epidemic malaria planning, preparedness and response in Southern Africa. MalariaJournal, 3, 37.
Delfino, R. J., Brummel, S., Wu, J., Stern, H., Ostro, B., Lipsett, M., et al. (2009). The relationshipof respiratory and cardiovascular hospital admissions to the southern California wildfires of2003. Occupational and Environmental Medicine, 66, 189–197.
Dinku, T., Ceccato, P., & Connor, S. J. (2011). Challenges to satellite rainfall estimation overmountainous and arid parts of East Africa. International Journal of Remote Sensing, 32(21),5965–5979.
Dinku, T., Block, P., Sharoff, J., & Thomson, M. (2014a). Bridging critical gaps in climateservices and applications in Africa. Earth Perspectives, 1(15).
Dinku, T., Kanemba, A., Platzer, B., & Thomson, M. C. (2014b). Leveraging the climate forimproved malaria control in Tanzania. Earthzine. http://www.earthzine.org/2014/02/15/.
Dombeck, M. P., Williams, J. E., & Wood, C. A. (2004). Wildfire policy and public lands:Integrating scientific understanding with social concerns across landscapes. ConservationBiology, 18, 883–889.
Elnaiem, D. A. (2011). Ecology and control of the sand fly vectors of Leishmania donovani in EastAfrica, with special emphasis on Phlebotomus orientalis. The Journal of Vector Ecology, 36(s1), S23–S31.
Elnaiem, D. A., Hassan, H. K., & Ward, R. D. (1997). Phlebotomine sandflies in a focus ofvisceral leishmaniasis in a border area of eastern Sudan. Annals of Tropical Medicine andParasitology, 91(3), 307–318.
Elnaiem, D. A., Hassan, H. K., & Ward, R. D. (1999). Associations of Phlebotomus orientalis andother sandflies with vegetation types in eastern Sudan focus of kala-azar. Medical andVeterinary Entomology, 13, 198–203.
Emch, M., Feldacker, C., Yunus, M., Streatfield, P. K., DinhThiem, V., Canh do, G., et al. (2008).Local environmental predictors of cholera in Bangladesh and Vietnam. The American Journalof Tropical Medicine and Hygiene, 78(5), 823–832.
Fontaine, R. E., Najjar, A. E., & Prince, J. S. (1961). The 1958 malaria epidemic in Ethiopia.American Journal of Tropical Medicine and Hygiene, 10, 795–803.
Fulé, P. Z., Crouse, J. E., Heinlein, T. A., Moore, M. M., Covington, W. W., & Verkamp, G.(2003). Mixed severity fire regime in a high-elevation forest: Grand Canyon, Arizona.Landscape Ecology, 18, 465–486.
Gebre-Michael, T., Malone, J. B., Balkew, M., Ali, A., Berhe, N., Hailu, A., et al. (2004).Mapping the potential distribution of Phlebotomus martini and P. orientalis (Diptera:Psychodidae), vectors of kala-azar in East Africa by use of geographic information systems.Acta Tropica, 90, 73–86.
Germain, R. H., Floyd, D. W., & Stehman, S. V. (2001). Public perceptions of the USDA ForestService public participation process. Forest Policy and Economics, 3, 113–124.
Gerstl, S., Amsalu, R., & Ritmeijer, K. (2006). Accessibility of diagnostic and treatment centresfor visceral leishmaniasis in Gedaref State, northern Sudan. Tropical Medicine andInternational Health, 11(2), 167–175.
200 W. Crosson et al.

Gil, A. I., Louis, V. R., Rivera, I. N. G., Lipp, E., Huq, A, Lanata, C.F., et al. (2004). Occurrenceand distribution of Vibrio cholerae in the coastal environment of Peru. EnvironmentalMicrobiology, 6(7), 699–706.
Gonzalez, P., Battles, J. J., Collins, B. M., Robards, T., & Saah, D. S. (2015). Aboveground livecarbon stock changes of California wildland ecosystems, 2001–2010. Forest Ecology andManagement. doi:10.1016/j.foreco.2015.03.040.
Griffith, D. C., Kelly-Hope, L. A., & Miller, M. A. (2006). Review of reported cholera outbreaksworldwide, 1995–2005. The American Journal of Tropical Medicine and Hygiene, 75(5), 973–977.
Hashizume, M., Armstrong, B., Hajat, S., Wagatsuma, Y., Faruque, A. S., Hayashi, T., et al.(2008). The Effect of Rainfall on the Prevalence of Cholera in Bangladesh. Epidemiology, 19(1).
Hirt, P. W. (1996). A conspiracy of optimism: Management of the national forests since WorldWar Two. Lincoln, Neb: University of Nebraska Press.
Hoogstraal, H., & Heyneman, D. (1969). Leishmaniasis in the Sudan Republic. The AmericanJournal of Tropical Medicine and Hygiene, 18(6). International Soil Reference andInformation Centre (ISRIC)—World Soil Information, 2013. Soil property maps of Africa at1 km. www.isric.org.
Hossain, F. (2015). Data for all: Using satellite observations for social good. Eos, 96. doi:10.1029/2015EO037319. Retrieved October 14 2015.
Huq, A., & Colwell, R. R. (1996). Vibrios in the marine and estuarine environment: TrackingVibrio cholerae. Ecosystem Health, 13(9).
Hurteau, M., & North, M. (2009). Fuel treatment effects on tree-based forest carbon storage andemissions under modeled wildfire scenarios. Frontiers in Ecology and the Environment, 7,409–414.
Hurteau, M., & North, M. (2010). Carbon recovery rates following different wildfire riskmitigation treatments. Forest Ecology and Management, 260, 930–937.
Hurteau, M. D., Koch, G. W., & Hungate, B. A. (2008). Carbon protection and fire risk reduction:Toward a full accounting of forest carbon offsets. Frontiers in Ecology and the Environment, 6(9), 493–498. doi:10.1890/070187.
Jones, G., Loeffler, D., Calkin, D., & Chung, W. (2010). Forest treatment residues for thermalenergy compared with disposal by onsite burning: Emissions and energy return. BiomassBioenergy, 34, 737–746.
Jutla, A. S., Akanda, A. S., & Islam, S. (2012). Satellite remote sensing of space-time planktonvariability in the Bay of Bengal: Connections to cholera outbreaks. Remote Sensing ofEnvironment, 123, 196–206.
Jutla, A. S., Akanda, A. S., & Islam, S. (2013). A framework for predicting endemic cholera usingsatellite derived environmental determinants. Environ Modeling and Software, 47, 148–158.
Jutla, A., Unnikrishnan, A., Akanda, A. S., Huq, H., & Colwell, R. R. (2015a). Predictive timeseries analysis linking Bengal cholera with terrestrial water storage measured from GRACEsensors. American Journal of Tropical Medicine and Hygiene (Accepted).
Jutla, A., Aldaach, H., Billian, H., Akanda, A. S., Huq, A., & Colwell, R. R. (2015b). Satellitebased assessment of hydroclimatic conditions related to cholera in Zimbabwe. PLoS-ONE.doi:10.1371/journal.pone.0137828.
Kilgore, B. M., & Taylor, D. (1979). Fire history of a sequoia-mixed conifer forest. Ecology, 60,129–142.
Koelle, K., Rodo, X., Pascual, M., Yunus, M., & Mostafa, G. (2005). Refractory periods andclimate forcing in cholera dynamics. Nature, 436, 4.
Lee, C., Erickson, P., Lazarus, M., & Smith, G. (2010). Greenhouse gas and air pollutantemissions of alternatives for woody biomass residues. Seattle, WA: Stockholm EnvironmentalInstitute. http://data.orcaa.org/reports/all-reports-entries/woody-biomass-emissions-study/.
Lobitz, B., Beck, L. Huq, A. Wood, B. Faruque A., & Colwell, R. (2000). Climate and infectiousdisease: Use of remote sensing for detection of vibrio cholerae. PNAS, 97(4).
Use of Remotely Sensed Climate and Environmental … 201

Longini, M., Zaman, K., Yunus, M., & Siddique, A. K. (2002). Epidemic and Endemic CholeraTrends over a 33-Year Period in Bangladesh. J. Infec. Dis., 186, 246–251.
McDonald, K. C., Chapman, B., Podest, E., Schroeder, R., Flores, S., Willacy, K., et al. (2011).Monitoring inundated wetlands ecosystems with satellite microwave remote sensing in supportof earth system science research. Conference Paper, 34th International Symposium on RemoteSensing of Environment—The GEOSS Era: Towards Operational Environmental Monitoring,4p.
MDEQ (Montana Department of Environmental Quality), Exceptional Events Demonstration forPM10 and PM2.5 Data for 2007 Wildfires (2007). http://www2.epa.gov/sites/production/files/2015-05/documents/mt_deq_demonstration_121407.pdf.
Millar, C. I., & Stephenson, N. L. (2015). Temperate forest health in an era of emerging megadisturbance. Science, 349(6250), 823–826.
Millar, C. I., Stephenson, N. L., & Stephens, S. L. (2007). Climate change and forests of the future:Managing in the face of uncertainty. Ecological Applications, 17(8), 2145–2151. doi:10.1890/06-1715.1.
Miller, J. D., Safford, H. D., Crimmins, M., & Thode, A. E. (2009). Quantitative evidence forincreasing forest fire severity in the Sierra Nevada and southern Cascade Mountains, Californiaand Nevada, USA. Ecosystems, 12, 16–32.
Moghaddas, J. J., & Craggs, L. (2007). A fuel treatment reduces fire severity and increasessuppression efficiency in a mixed conifer forest. International Journal of Wildland Fire, 16(6),673–678. doi:10.1071/WF06066.
Moghaddas, J. J., Collins, B. M., Menning, K., Moghaddas, E. E. Y., & Stephens, S. L. (2010).Fuel treatment effects on modeled landscape-level fire behavior in the northern Sierra Nevada.Canadian Journal of Forest Research, 40, 1751–1765.
National Fire Interagency Fire Center (NIFC). (2015). 1997–2014 large fires. Retrieved 10October, 2015 from https://www.nifc.gov/fireInfo/fireInfo_stats_lgFires.html.
National Research Council (NRC). (2007). Earth science and Applications from space: Nationalimperatives for the next decade and beyond. Washington, DC: The National Academies Press.doi:10.17226/11820.
North, M. P., & Hurteau, M. D. (2011). High-severity wildfire effects on carbon stocks andemissions in fuels treated and untreated forest. Forest Ecology and Management, 261, 1115–1120.
North, M. P., Stine, P., O’Hara, K., Zielinski, W., & Stephens, S. (2009). An ecosystemsmanagement strategy for Sierra mixed-conifer forests. PSW GTR-220 with addendum.Albany, CA, USA: USDA Forest Service, Pacific Southwest Research Station.
North, M. P., Stephens, S. L., Collins, B. M., Agee, J. K., Aplet, G., Franklin, J. F., et al. (2015).Reform forest fire management. Science, 349(6254), 1280–1281.
Pacala, S., Birdsey, R. A., Bridgham, S. D., Conant, R. T., Davis, K., Hales, B., et al. (2007). TheNorth American carbon budget past and present. In: A. W. King, L. Dilling, G. P. Zimmerman,D. M. Fairman, R. A. Houghton, G. Marland (Eds.), The First State of the Carbon Cycle Report(SOCCR): The North American Carbon budget and implications for the global carbon cycle(Vol. 29–36, pp. 167–170). Asheville, NC: National Oceanic and Atmospheric Administration,National Climatic Data Center.
Pascual, M., Bouma, M., & Dobson, A. (2002). Cholera and climate: Revisiting the quantitativeevidence. Microbes and Infection, 4(2).
Pekel, J. F., Ceccato, P., Vancutsem, C., Cressman, K., Vanbogaert, E., & Defourny, P. (2011).Development and application of multi-temporal colorimetric transformation to monitorvegetation in the Desert Locust Habitat. IEEE Journal of Selected Topics in Applied EarthObservations and Remote Sensing, 4(2), 318–326.
Perry, D. A., Hessburg, P. F., Skinner, C. N., Spies, T. A., Stephens, S. L., Taylor, A. H., et al.(2011). The ecology of mixed severity fire regimes in Washington, Oregon, and NorthernCalifornia. Forest Ecology and Management, 262, 703–717.
Rajesh, K., & Sanjay, K. 2013. Change in global climate and Prevalence of VisceralLeishmaniasis. International Journal of Scientific and Research Publications, 3(1).
202 W. Crosson et al.
Randerson, J., Liu, H., Flanner, M. Chambers, S., Jin, Y., Hess, P., et al. (2006). The impact ofboreal forest fire on climate warming. Science, 314, 1130–1132.
Reinhardt, E., & Holsinger, L. (2010). Effects of fuel treatments on carbon-disturbancerelationships in forests of the northern Rocky Mountains. Forest Ecology and Management,259, 1427–1435.
Reinhardt, E. D., Keane, R. E., Calkin, D. E., & Cohen, J. D. (2008). Objectives andconsiderations for wildland fuel treatment in forested ecosystems of the interior western UnitedStates. Forest Ecology and Management, 256(12), 1997–2006. doi:10.1016/j.foreco.2008.09.016.
Roccaforte, J. P., Fulé, P. Z., Chancellor, W. W., & Laughlin, D. C. (2012). Woody debris and treeregeneration dynamics following severe wildfires in Arizona ponderosa pine forests. CanadianJournal of Forest Research, 42, 593–604.
Saah, D., Robards, T., Moody, T., O’Neil-Dune, J., Moritz, M., Hurteau, M., et al. (2012).Developing an Analytical Framework for Quantifying Greenhouse Gas Emission Reductionsfrom Forest Fuel Treatment Projects in Placer County, California. Prepared for: United StatesForest Service: Pacific Southwest Research Station, 130p.
Saah, D., Schmidt, D., Roller, G., Moody, T. J., Moghaddas, J. J., & Freed, T. (2015). Carbonstorage and mass balances: Characteristics of forest carbon and the relationship between fireseverity and emissions in the Sierra Nevada Mountains, California, USA. Prepared for:California Energy Commission CEC-600-10-006, 95p.
Safford, H. D., Schmidt, D. A., & Carlson, C. H. (2009). Effects of fuel treatments on fire severityin an area of wildland–urban interface, Angora Fire, Lake Tahoe Basin, California. ForestEcology and Management, 258, 773–787. doi:10.1016/j.foreco.2009.05.024.
Salomon, O. D., Quintana, M. G., Mastrangelo, A. V., & Fernandez, M. S. (2012). Leishmaniasisand climate change—case study: Argentina. Journal of Tropical Medicine. doi:10.1155/2012/601242.
Savage, M., & Mast, N. J. (2005). How resilient are southwestern ponderosa pine forests aftercrown fires? Canadian Journal of Forest Research, 35, 967–977.
Schroeder, R. M., Rawlins, A., McDonald, K. C., Podest, E., Zimmermann, R., & Kueppers, M.(2010). Satellite microwave remote sensing of North Eurasian inundation dynamics:Development of coarse-resolution products and comparison with high-resolution syntheticaperture radar data. Environmental Research Letters, special issue on Northern Hemispherehigh latitude climate and environmental change, 5, 015003 (7 pp). doi:10.1088/1748-9326/5/1/015003.
Schwartz, B. S., Harris, J. B., Khan, A. I., Larocque, R. C., Sack, D. A., Malek, M. A., et al.(2006). Diarrheal epidemics in Dhaka, Bangladesh, during three consecutive floods: 1988,1998, 2004. The American Journal of Tropical Medicine and Hygiene, 74(6).
Schweizer, D., & Cisneros, R. (2014). Wildland fire management and air quality in the southernSierra Nevada: Using the Lion Fire as a case study with a multi-year perspective on PM 2.5impacts and fire policy. Journal of Environmental Management, 144, 265–278.
Seaman, J., Mercer, A. J., & Sondorp, E. (1996). The epidemic of visceral leishmaniasis in westernUpper Nile, southern Sudan: course and impact from 1984 to 1994. International Journal ofEpidemiology, 25(4), 862–871.
Sedjo, R. A., & Marland, G. (2003). Inter-trading permanent emissions credits and rentedtemporary carbon emissions offsets: Some issues and alternatives. Climate Policy, 3, 435–444.
SMAQMD (Sacramento Metropolitan Air Quality Management District). (2011). ExceptionalEvents Demonstration for 1-Hour Ozone Exceedance in the Sacramento RegionalNonattainment Area due to 2008 Wildfires.
Springsteen, B., Christofk, T., Eubanks, S., Mason, T., Clavin, C., & Storey, B. (2011). Emissionreductions from woody biomass waste for energy as an alternative to open burning. Journal ofthe Air and Waste Management Association, 61, 63–68.
Springsteen, B., Christofk, T., York, R. A., Mason, T., Baker, S., Lincoln, E., et al. (2015). Forestbiomass diversion in the Sierra Nevada: Energy, economics and emissions. CaliforniaAgriculture, 69(3), 142–149.
Use of Remotely Sensed Climate and Environmental … 203

State of California. (2006). Assembly Bill 32: The California Global Warming Solutions Act of2006. Nunez, F. September 27, 2006.
Stephens, S. L. (2000). Mixed conifer and upper montane forest structure and uses in 1899 fromthe central and northern Sierra Nevada, CA. Madrono, 47, 43–52.
Stephens, S. L., & Moghaddas, J. J. (2005). Silvicultural and reserve impacts on potential firebehavior and forest conservation: Twenty-five years of experience from Sierra Nevada mixedconifer forests. Biological Conservation, 125(3), 369–379. doi:10.1016/j.biocon.2005.04.007.
Stephens, S. L., & Ruth, L. W. (2005). Federal forest-fire policy in the United States. EcologicalApplications, 15(2), 532–542. doi:10.1890/04-0545.
Stephens, S. L., Martin, R. E., & Clinton, N. D. (2007). Prehistoric fire area and emissions fromCalifornia’s forests, woodlands, shrublands and grasslands. Forest Ecology and Management,251, 205–216.
Stephens, S. L., Moghaddas, J., Hartsough, B., Moghaddas, E., & Clinton, N. E. (2009a). Fueltreatment effects on stand level carbon pools, treatment related emissions, and fire risk in aSierran mixed conifer forest. Canadian Journal of Forest Research, 39, 1538–1547.
Stephens, S. L., Moghaddas, J., Edminster, C., Fiedler, C., Hasse, S., Harrington, M., et al.(2009b). Fire treatment effects on vegetation structure, fuels, and potential fire severity inwestern U.S. forests. Ecological Applications, 19, 305–320.
Stephens, S. L., Moghaddas, J. J., Edminster, C., Fiedler, C. E., Haase, S., Harrington, M., et al.(2009c). Fire treatment effects on vegetation structure, fuels, and potential fire severity inwestern U.S. forests. Ecological Applications, 19(2), 305–320. doi:10.1890/07-1755.1. PMID:19323192.
Stephens, S. L., McIver, J. D., Boerner, R. E. J., Fettig, C. J., Fontaine, J. B., Hartsough, B. R.,et al. (2012a). Effects of forest fuel reduction treatments in the United States. BioScience, 62,549–560.
Stephens, S. L., Boerner, R. E. J., Moghaddas, J. J., Moghaddas, E. E. Y., Collins, B. M., Dow, C.B., et al. (2012b). Fuel treatment impacts on estimated wildfire carbon loss from forests inMontana, Oregon, California, and Arizona. Ecosphere, 3(5), 38. http://dx.doi.org/10.1890/ES11-00289.1.
Sweeney, A., Kruczkiewicz, A., Reid, C., Seaman, J., Abubakar, A., Ritmeijer, K., et al. (2014).Utilizing NASA Earth observations to explore the relationship between environmental factorsand Visceral Leishmaniasis in the Northern States of the Republic of South Sudan. EarthzineIEEE.
Thomson, M. C., Elnaiem, D. A., Ashford, R. W., & Connor, S. J. (1999). Towards a kala azar riskmap for Sudan: Mapping the potential distribution of Phlebotomus orientalis using digital dataof environmental variables. Tropical Medicine and International Health, 4(2), 105–113.
Urbanski, S. (2014). Wildland fire emissions, carbon, and climate: Emission factors. ForestEcology and Management, 317, 51–60.
US Forest Service (USFS). (2004). Sierra Nevada Forest Plan Amendment (SNFPA) FinalSupplemental Environmental Impact Statement (FEIS) and Record of Decision (ROD).January 2004.
US Forest Service (USFS). (2015). Managing Wildfires. http://www.fs.fed.us/managing-land/fire.Uz, B. M., & Yoder, J. A. (2004). High frequency and mesoscale variability in SeaWiFS
chlorophyll imagery and its relation to other remotely sensed oceanographic variables. DeepSea Research II, 51(10–11), 1001–1017. doi:10.1016/j.dsr2.2004.03.003.
Vancutsem, C., Ceccato, P., Dinku, T., & Connor, S. J. (2010). Evaluation of MODIS Landsurface temperature data to estimate air temperature in different ecosystems over Africa.Remote Sensing of Environment, 114(2), 449–465.
Westerling, A. L., Hidalgo, H. G., Cayan, D. R., & Swetnam, T. W. (2006). Warming and earlierspring increase western U.S. forest wildfire activity. Science, 313(5789), 940–943. doi:10.1126/science.1128834. PMID:16825536.
Westerling, A., Brown, T., Schoennagel, T. Swetnam, T., Turner, M., & Veblen, T. (2014).Briefing: Climate and wildfire in western U.S. forests. In: V. A. Sample; R. P. Bixler (Eds.),Forest conservation and management in the Anthropocene: Conference proceedings.
204 W. Crosson et al.

Proceedings. RMRS-P-71. Fort Collins, CO: US Department of Agriculture, Forest Service.Rocky Mountain Research Station. pp. 81–102.
WHO/UNICEF. (2009). Diarrhea: Why children are still dying and what can be done, Geneva,Switzerland.
WHO/UNICEF. (2013). Ending Preventable Child Deaths from Pneumonia and Diarrhea by2025. The Integrated Global Action Plan for Pneumonia and Diarrhea (GAPPD). Retrievedfrom www.unicef.org/media/files/Final_GAPPD_main_Report-_EN-8_April_2013.pdf.
WHO/UNICEF. (2014). Neglected Tropical Diseases: The 17 neglected tropical diseases.Retrieved from http://www.who.int/neglected_diseases/diseases/en/.
Wiedinmyer, C., & Neff, J. C. (2007). Estimates of CO2 from fires in the United States:Implications for carbon management. Carbon Balance and Management, 2(1), 1–12.
Wildland Fire Leadership Council. (2011). A National Cohesive Wildland Fire Strategy. http://www.forestsandrangelands.gov/strategy/documents/reports/1_CohesiveStrategy03172011.pdf.Accessed 10/29/2015.
Yeshiwondim, A. K., Gopal, S., Hailemariam, A. T., Dengela, D. O., & Patel, H. P. (2009). Spatialanalysis of malaria incidence at the village level in areas with unstable transmission inEthiopia. International Journal of Health Geographics, 8, 5. doi:10.1186/1476-072X-8-5.
Use of Remotely Sensed Climate and Environmental … 205

Satellite Remote Sensing in Supportof Fisheries Management in Global Oceans
Dovi Kacev and Rebecca L. Lewison
Abstract The world’s oceans are dynamic: environmental conditions andecosystems in marine environments fluctuate spatially and temporally on multiplescales. Spatially, the ocean varies with water depth, ocean currents, and oceanicfronts. This abiotic and biotic variability makes managing resources in the dynamicocean environment extremely difficult, and as a result, fisheries management oftenserves as one of the textbook examples of an unstructured or ‘wicked’ environ-mental problem. This chapter provides an overview of the role satellite remotesensing can play in ocean and fisheries management. Currently, there are very fewapplications available that enable managers to use satellite earth observations in ascientifically robust but straightforward manner. The chapter recommends collab-oration between researchers, scientists, data analysts and conservation practitionersto develop accessible tools, all the while ensuring such approaches are scientificallyrobust and defensible and are directly meeting the needs of the managementcommunity. Continued support and resources for satellite earth observations, dis-tribution, integration, and management-relevant science are needed to maximize thereturn on this investment in support of sustainable fisheries.
1 Fisheries Management in a Dynamic Ocean: Overview
The world’s oceans are dynamic: environmental conditions and ecosystems inmarine environments fluctuate spatially and temporally on multiple scales (Hazenet al. 2013). For example, sea surface temperature fluctuates temporally daily,seasonally, and in multi-year cycles such as the El Nino, Southern Oscillation(ENSO) cycle. Spatially, the ocean varies with water depth, ocean currents, andoceanic fronts. Other abiotic conditions like currents, eddy structure, and salinitythresholds also fluctuate in both predictable and non-predictable ways. Bioticconditions in the ocean are just as complex (Haury et al. 1978). Habitat associations
D. Kacev � R.L. Lewison (&)Department of Biology, San Diego State University, 5500 Campanile Drive,San Diego, CA 92182-4614, USAe-mail: [email protected]
© Springer International Publishing Switzerland 2016F. Hossain (ed.), Earth Science Satellite Applications,Springer Remote Sensing/Photogrammetry, DOI 10.1007/978-3-319-33438-7_8
207

of species or assemblages vary in space and time, as ocean conditions change, andbiotic patterns, such as migration or persistent movement pathways, i.e., corridors,are far more dynamic than in terrestrial systems (Hazen et al. 2012). This abioticand biotic variability makes managing resources in the dynamic ocean environmentextremely difficult, and as a result, fisheries management often serves as one of thetextbook examples of an unstructured or ‘wicked’ environmental problem (Balintet al. 2011; Hisschemöller and Hoppe 1995).
In the US, ocean fisheries management is legislated by several legislative instru-ments with theMagnuson Stevens Act as the primary law governing marine fisheries.The Magnuson–Stevens Act was originally enacted as the Fishery Conservation andManagement Act of 1976. Two major recent sets of amendments to the law were theSustainable Fisheries Act of 1996 and the Magnuson–Stevens Fishery ConservationandManagement ReauthorizationAct (MSFCMA) of 2006. TheMSFCMAand otherrelevant policies mandate a management approach that balances the often conflictingobjectives of economic viabilitywith ecological sustainability, i.e.,fisheriesmanagersare taskedwith protecting target and nontarget species and stocks, protecting essentialhabitats as well as supporting viable fishing economies.
Globally, fisheries management is often a part of a larger ecosystem-basedmanagement framework; a transition from single-species, stock assessments, ormanagement plan to ecosystem approaches which requires the ability to monitor theocean conditions and variability that drive many biotic and abiotic processes(Scheurell and Williams 2005; Wells et al. 2008). The vast temporal and spatialscales of the global oceans, the limited ability to collect ocean data directly, and themove to manage ocean systems rather than ocean species has led to the reliance onadvancing technology in satellite remote sensing (SRS) data (Collie et al. 2013).Hereafter, the term SRS will be used to signify Earth observation (EO) in theprevious chapters.
2 Current Status of Ocean SRS: The FisheriesManagement Context
Traditional approaches to collect oceanographic data relied on ship board equipmentand observer driven measurements. However, since the early 1970s, fisheries sci-entists have implemented airborne remote sensing (ARS) using balloons, helicopters,and airplanes to study oceans from above (reviewed in Santos 2000; Klemas 2013). Insome areas, ARS relies on naked-eye observations from flown transects over oceanwaters. Although the human eye and airborne sensors have a wide spatial range andhigh resolution, ARS is limited by human skill and endurance as well as by waterdepth and both water and atmospheric visibility (Klemas 2013). The addition ofairborne sensors like cameras, low-light-televisions, infrared cameras, and LiDAR(Light Detection and Ranging) has made ARS more reliable, but they are still limitedtemporally and spatially (Klemas 2013; Rose et al. 2000).
208 D. Kacev and R.L. Lewison

With rapid increases in satellite technology and data storage in recent years, SRShas become an essential element of fisheries management due to its ability to collectdata at regular intervals for long time periods across the entire globe (Chassot et al.2011; Pettorelli et al. 2014). The scale and scope of SRS data allow for theimplementation of near-real-time ecosystem and forecast models that can be appliedto ocean management. To contextualize the application of SRS technology tofisheries management, we describe some of the most common SRS data used infisheries.
Sea surface temperature: Sea surface temperature (SST) is a measure of theenergy from the molecules at the top layer of the ocean and was one of the firstsatellite-sensed ocean variables applied to fisheries. Thermal infrared sensors thatmeasure SST, when there is no cloud cover have been deployed for over fourdecades (Klemas 2013). SST can be used to detect oceanic fronts and large-scaleclimatic fluctuations. Maps of SST are directly relevant to fisheries because of thetemperature preferences of individual fish species. Satellite platforms use differentbands sensitive to the thermal infrared, allowing precise, daily measurement of SSTover the world’s oceans (Fig. 1). Currently, the most common data source for SSTis the NASA-deployed MODIS sensor.
Ocean color: The color in most of the world’s oceans is in the visible lightregion (wavelengths of 400–700 nm) and varies with the concentration of chloro-phyll and primary ocean producers, phytoplankton. When more phytoplankton arepresent, the concentration of plant pigments increases and the greener the waterbecomes. Subtle changes in ocean color signify various types and quantities ofmarine phytoplankton. Changes in ocean color signify changes in chlorophyllconcentrations and can be used to infer biological productivity (Fig. 2). Ocean color
Fig. 1 This image shows the global weekly average SSTs, January 30 2011–February 5 2011.Image credit Earth System Research Laboratory Physical Sciences Division. Public domain
Satellite Remote Sensing in Support of Fisheries Management in Global Oceans 209

data is also useful for detecting terrestrial runoff and tracking oil spills (Wilson,IOCCG). Currently, the most commonly used satellite sensors for ocean colorinclude Nimbus-7, SeaWiFS, and MODIS.
Sea surface salinity: Salinity in the ocean is defined as the grams of salt per 1000grams of water. Since salt dissolves in sea water creating increased reflectivity anddecreased emissivity. Salinity can be determined using microwave radiometerswhen accounting for SST. Salinity varies due to evaporation and precipitation overthe ocean as well as river runoff and ice melt. Along with SST, it is a major driver of
Fig. 2 Chlorophyll concentration during El Niño (top) and La Niña (lower) where blue representslow concentrations, while yellow, orange and red indicate high concentrations. Image credit GSFCOcean Color team and GeoEye, NASA Earth Observatory. Public domain
210 D. Kacev and R.L. Lewison

abiotic processes like ocean circulation (Fig. 3). The most commonly used salinitysensors are the European SMOS and the NASA-launched Aquarius/SAC-D.
Ocean currents: Because of the complexity, the range of temporal and spatialscales and the dependence on local conditions, satellite remote sensing is an idealtool to measure ocean currents. Currents are responsible for water exchange betweendifferent parts of the ocean. Satellite sensors are not capable of measuring oceancurrents directly. However, remotely sensed data are used to assess current velocitywith a variety of methods and products including Ocean Surface Current AnalysesRealtime (OSCAR; http://www.oscar.noaa.gov, http://podaac.jpl.nasa.gov), as wellas Mercator/SURCOUF (Larnicol et al. 2006; http://www.mercator-ocean.fr), andthe Centre de Topographie des Océans et de l’Hydrosphère (CTOH; Sudre andMorrow 2008; http://ctoh.legos.obs-mip.fr). These products provide global surfacecurrent data directly calculated from satellite altimetry and ocean vector winds. Thecurrent sensors for ocean currents include Jason-2/OSTM and QuikSCAT.
Sea surface height: Just as bathymetry measures the relief or topography of theocean floor, sea surface height measures the topography of the ocean surface. In thecontext of fisheries, sea surface height is often used to calculate anomalies, whichare related to eddy structure and strength and other important features in under-standing fish species and community distributions (Fig. 3). Sea surface height datais available from Topex/Poseidon and Jason-1 and currently from Jason-2, OceanSurface Topography Mission.
3 Utility of SRS in Fisheries Management
The formidable challenges of fisheries management, i.e., the concurrent objectivesof harvesting and protecting living marine resources have been a joint focus of theNational Oceanic and Atmospheric Administration (NOAA) and the National
Fig. 3 A map of surface salinity levels recorded between August and September, 2010 and 2011.Image credit SMOS GLOSCAL Cal/Val project. Public domain
Satellite Remote Sensing in Support of Fisheries Management in Global Oceans 211

Aeronautics and Space Administration (NASA) for decades. For example, NOAAand NASA sponsored a 2006 workshop, “Integrating Satellite Data IntoEcosystem-Based Management of Living Marine Resources,” to identify specificways to incorporate Earth science satellite observations, data, and associatedmodels into NOAA fisheries management (EOS 2006). A similar workshop wasconvened in 1996 (Boehlert and Schumaker 1997). The interest in capitalizing onSRS to support fisheries management and the larger goals of ecosystem-basedmanagement continues to expand and develop. Here, we describe some of the keyareas of SRS application in fisheries management.
3.1 Identifying Ocean Features and Regions
Ocean features such as ocean currents, eddies, and fronts often serve as aggregatingfeatures for fisheries target species. The spatial and temporal scale of many of thesefeatures makes them difficult to study with traditional, shipboard, or ARS methods.SRS, in contrast, has the capacity to monitor these dynamic ocean features on broadscales as it can combine thousands of daily, global satellite images using a numberof different data integration methods.
Detecting ocean fronts is often central to identifying important fishing areas andthere are several methods that use SRS data to do so including gradient measurementand histogram-based methods (Chassot et al. 2011). The gradient method can detectfronts on a scale >4 km using time-averaged data although it can be limited when theSRS data are noisy. A more widely used approach is the histogram-based method(Kahru et al. 1995; Chassot et al. 2011), which uses single image analyses and candetect mesoscale circulation patterns such as eddies, which are often important forfish recruitment processes and tracking marine pollutants (Klemas 2012a).
Studying large-scale ocean currents is also vital to studying large marineecosystems. SRS, like infrared SST, is used to track currents such as the GulfStream Kuroshio currents which moves warm water and creates warm water eddiesalong the current boundaries (Klemas 2012b). Another SRS approach to studyinglarge marine ecosystems is to use “feature mapping,” which uses SRS imagery totrack the movement of ocean abnormalities such as chlorophyll plumes (oceancolor) or temperature anomalies (SST). By tracking the displacement of thesefeatures relative to fixed and coastal landmarks, current speeds can be estimatedfrom SRS images.
3.2 Identifying Species-Specific Habitat Features
One of the fundamental goals of fishery management is to support fisheries catchesor yield. Beyond measuring general ocean features, directly mapping the distri-bution and ocean habitat for target species is often a central objective of fisheries
212 D. Kacev and R.L. Lewison

management applications. The use of fishery logs, fishery-independent surveys, andfish tagging combined with SRS data is common to study and predict fish distri-butions, where concurrent SRS ocean data are analyzed to understand current andprojected future habitat associations for target species. Analyses of in situ biologicaldata paired with SRS data has been identified as one of most powerful means todetermine habitat preferences on large spatial scales (Cushing 1982; Bakun 1996;Chassot et al. 2011).
One oceanographic feature often associated with fish distribution is SST (Ramoset al. 1996; Klemas 2013). An early application of SRS on sardine (Sardina pil-chardus), an economically important fisheries target species in the Atlantic, usedSST to map sardine distribution (Santos and Fiuza 1992). These authors found thatsardines were clustered around upwelling areas, ocean regions where cold, nutrientrich water from depth displaces warmer, surface waters. Similar patterns have beenfound with numerous other fish species, e.g., some species of tuna tend to be foundin upwelling regions, particularly near thermal fronts (Santos 2000), areas wherecold and warm water masses meet. In some cases, thermal limits for target speciescan be determined by comparing fish distribution to SST data (Klemas 2013), evenrelatively small changes in temperature as some fish are sensitive to water changeson the magnitude of 0.1 °C. Fish species distribution can also be influenced byregional productivity as measured by chlorophyll concentration (ocean color).A general trend indicates that viable fishery populations require a chlorophyllconcentration; at least 0.2 mg/m3 (FAO 2003). Particularly in pelagic habitats,which are typically characterized by low biological productivity, fish tend to befound along ocean fronts with high chlorophyll levels (e.g., Royer et al. 2004;Santos 2000).
Species-specific habitat models have become a key element of many fisheriesstock assessments, which are population models or evaluations that are used to setharvest levels. Zwolinski et al. (2011) used a combination of predictive habitatmodeling and previous catch data to demonstrate how SRS data can be used toimprove fishery survey design for Pacific sardine (Sardinops sagax), the targetspecies for an economically important fishery in the Northwest United States. In the1930s, excessive fishing pressure along with environmental fluctuations led to astock collapse in the species (Radovich 1982) but the stock recovered sufficientlyfor the fishery to resume in the 1990s (Smith and Moser 2003). Despite the largespatial range of sardine, several recent studies have suggested that sardine distri-bution is limited temporally by SST (*12–16 °C; e.g., Checkley et al. 2000; Lynn2003; Weber and McClatchie 2010). To build a Pacific sardine habitat suitabilitymodel, Zwolinski et al. (2011) used 12 years of sardine presence data and SRS data,including SST, chlorophyll a (ocean color), and SSH. In order to avoid future stockcollapse, the Pacific Fishery Management Council has set harvest rates based onannual stock assessment for the species, which requires SRS data.
Satellite Remote Sensing in Support of Fisheries Management in Global Oceans 213

3.3 Identifying Movement or Migration Pathways
Long distancemovements of bothfisheries target and nontarget populations challengefisheries management (Rose et al. 2000) and understanding the ecological drivers ofmovement patterns on both spatial and temporal scales is essential for management ofhighly migratory target and nontarget species. The field of biotelemetry has expandedrapidly over the past two decades with developments in satellite tracking technology(Bograd et al. 2010; Hammerschlag et al. 2011). These technological developmentshave led to an increased understanding in the spatial and temporal scale of animalmovements, and combining SRS data with these new types of movement data havebroadened the understanding of the drivers andmechanisms behind these movements(Chassot et al. 2011).
Over the past decade, pop-up satellite archival tags (PSATs) have been developedthat allow scientists to track species at depth with high frequency temperature‐depth-light sensors. PSATs provide previously unavailable observations of fishspecies that rarely use the surface water over relatively large ocean areas. Pairing datafrom PSATs and SRS has also led to new insights into migration and movementpatterns of difficult-to-monitor highly migratory fish species. Studying an econom-ically important species, the porbeagle sharks (Lamna nasus), in the southwest PacificOcean, Francis et al. (2015) used SRS and PSAT data to quantify the horizontal andvertical migration of porbeagles, revealing that, seasonally, porbeagles make hori-zontal movements of hundreds to thousands of kilometers but also capturing the largedaily vertical migrations that this species makes. By integrating a merged SRS pro-duct and data from PSAT deployments, Luo et al. (2015) identify new insights intomigration pathways for yellowfin tuna (Thunnus albacares), blue marlin (Makairanigricans), white marlin (Tetrapturus albidus), and sailfish (Istiophorus platypterus)in the Caribbean Sea and Gulf of Mexico, where these species were found to trackhighly specific ocean front and eddy features.
3.4 Forecasting Fishing Hotspots
Marine fisheries are an important global food source, accounting for at least 15 %of the world’s animal protein consumption (FAO 2009). The costs associated withcommercial fishing, including fuel and search costs, can be substantial (Santos2000). As such, commercial fishers rely on SRS data to help find productive fishinggrounds in an efficient manner. The application of SRS to identifying productivefishing grounds started as early as the 1960s with the availability of SST and oceancolor data (Chassot et al. 2011). Since then, many countries have allocated publicfunds to provide SRS data to fishermen, a step aimed at reducing fishing costs andincreasing productivity (Santos 2000). SRS data has been shown to reduce thesearch time by 50 % for US commercial fishing fleets (Santos 2000) resulting instatistically higher catch rates (Wright et al. 1976).
214 D. Kacev and R.L. Lewison
In the US, NOAA has provided SRS data on ocean fronts and SST on a regularbasis since 1980 (reviewed in Santos 2000). Even in these early years, economicanalyses demonstrated that SRS support saved the Northwest salmon and albacorefisheries upwards; $500,000 per year (Breaker 1981). Similar analysis showed thatindividual New England fishers saved thousands of dollars in fuel costs per year(Cornillon et al. 1986). The Japan Fisheries Information Service Centre, oftendescribed as the most well organized commercial fishery support service (Santos2000), also synthesizes SRS data to share with commercial fishers to increase infishery efficiency and reduce seafood prices for consumers (Yamanaka 1988).Similar SRS data is collected by governments around the globe which is sharedwith their respective fishing industries (reviewed in Santos 2000).
3.5 Identifying Bycatch Hotspots
Fisheries bycatch, the incidental catch of unused or unmanaged species (Davieset al. 2009) poses a substantial impediment to fisheries sustainability (Hall et al.2000; Kelleher 2005). Bycatch of juvenile target species, foundational species, likesponges or corals, as well as long-lived marine megafauna has both direct andindirect ecological effects that are challenging to mitigate and manage (Lewisonet al. 2004). SRS data are a critical element to many applications that have beendeveloped to avoid or minimize bycatch. Characterization of bycatch spatial pat-terns (Gardner et al. 2008) and hotspots (Lewison et al. 2009) in conjunction withresearch on animal movement patterns has identified relationships between a widerange of SRS products like SST, chlorophyll, and SSH and other ocean, fishery, orgear characteristics and bycatch (James et al. 2005; Polovina et al. 2006; Sims et al.2008; Zydelis et al. 2011; Briscoe et al. 2014). For example, using SRS data tocharacterize oceanographic conditions and habitat features associated with log-gerhead and leatherback turtles off Hawaii, the NOAA-led program Turtlewatchcreates weekly maps for fishermen depicting ocean areas where bycatch of bothspecies is more likely (Howell et al. 2008, 2015). SRS data paired with sophisti-cated predictive ocean models integrating oceanographic and telemetry data havealso been developed to forecast the presence of high-risk bycatch species likebluefin tuna in eastern Australia, guiding dynamic spatiotemporal fisheriesrestriction decisions (Hobday et al. 2010).
3.6 Marine Reserve Identification and Monitoring
The development of marine protected areas (MPAs) has been recognized as oneimportant tool in maintaining marine biodiversity and supporting fisheries yields(Brown et al. 2015). The Convention on Biological Diversity set a target of con-serving 10 % of available habitats by the year 2020 (https://www.cbd.int/sp/targets/).
Satellite Remote Sensing in Support of Fisheries Management in Global Oceans 215

As MPA designation continues to reach the 2020 target, the challenge of protectedarea selection is central to planning activities. SRS data provides planners andmanagers with quantifiable information on biotic and abiotic conditions which is akey element for marine reserve design (Kachelriess et al. 2014). In the context ofMPAs implementation, SRS data are also vital to monitor the environmental corre-lates of biodiversity (Soykan and Lewison 2015), monitor MPA-protected systems,and assess the impacts of human threats to biodiversity (Kechelriess et al. 2014).
Two of the major impediments to MPA implementation are characterizing howto designate protected areas that promote biodiversity and how to monitor humanimpacts on MPA efficacy. SRS data is vital for optimally designating and managingprotected areas (Pettorelli et al. 2014). Kechelriess et al. (2014) defined three dis-crete ways that SRS data can improve MPA design and management: (1) moni-toring environmental correlates to biodiversity, (2) monitoring habitats withinMPAs, and (3) assessing anthropogenic impacts and threats. SRS-based habitdesignation is routinely incorporated into terrestrial reserve design (Lengyel et al.2008) and a similar approach has been proposed for pelagic systems (e.g., Hobdayet al. 2011). Currently, SST, ocean color, and current patterns have all been used tocharacterize pelagic habitats, and incorporating a range in each of those environ-mental variables can help build MPAs that are more representative of the ocean atlarge. In coastal, marine systems, SRS can be used to identify structural biota andsubstrate such as mangroves, seagrass beds, kelp forests, and coral reefs (reviewedin Kachelriess et al. 2014). The ability to pinpoint these biomes at large scale canhelp managers incorporate each into networks of MPAs.
One of the primary criticisms of MPAs is the resources required to enforce them.SRS data can aid in MPA monitoring at large spatial and temporal scales withoutthe need for expensive ship time. Ocean color sensors can detect suspended par-ticles in the water column indicative of terrestrial runoff (Kachelreiss et al. 2014).Monitoring the presence of these suspended particles helps assess the interaction ofland use and marine ecosystem health. Ocean color sensors can also detect thepresence of and spreading of oil spills in protected areas. Both large and small oilspills can have devastating impacts on marine habitats. SRS allows them to bedetected early to allow for rapid response. Finally, SRS allows for the detection ofillegal fishing vessels within MPA boundaries. Large, heavily fished species areoften the conservation targets of MPAs and illegal or underreported fishing canhave detrimental population and community level results. The ability of remoteoptical sensors to pick out boats in remote reserves can minimize the impact ofillegal fishing. As satellite technology and data precision and accuracy increasesand MPAs get implemented, SRS data are likely to continue to serve as aninstrumental tool in MPA design and monitoring.
216 D. Kacev and R.L. Lewison
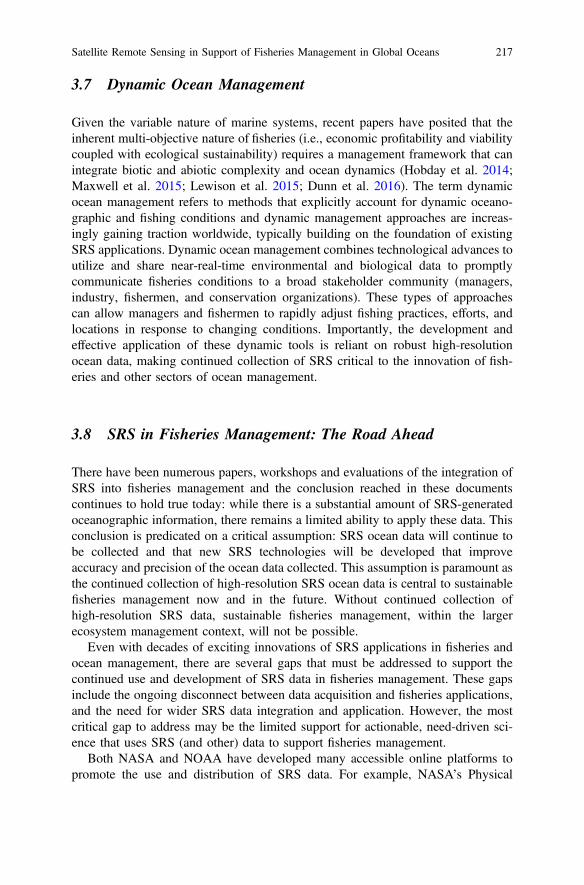
3.7 Dynamic Ocean Management
Given the variable nature of marine systems, recent papers have posited that theinherent multi-objective nature of fisheries (i.e., economic profitability and viabilitycoupled with ecological sustainability) requires a management framework that canintegrate biotic and abiotic complexity and ocean dynamics (Hobday et al. 2014;Maxwell et al. 2015; Lewison et al. 2015; Dunn et al. 2016). The term dynamicocean management refers to methods that explicitly account for dynamic oceano-graphic and fishing conditions and dynamic management approaches are increas-ingly gaining traction worldwide, typically building on the foundation of existingSRS applications. Dynamic ocean management combines technological advances toutilize and share near-real-time environmental and biological data to promptlycommunicate fisheries conditions to a broad stakeholder community (managers,industry, fishermen, and conservation organizations). These types of approachescan allow managers and fishermen to rapidly adjust fishing practices, efforts, andlocations in response to changing conditions. Importantly, the development andeffective application of these dynamic tools is reliant on robust high-resolutionocean data, making continued collection of SRS critical to the innovation of fish-eries and other sectors of ocean management.
3.8 SRS in Fisheries Management: The Road Ahead
There have been numerous papers, workshops and evaluations of the integration ofSRS into fisheries management and the conclusion reached in these documentscontinues to hold true today: while there is a substantial amount of SRS-generatedoceanographic information, there remains a limited ability to apply these data. Thisconclusion is predicated on a critical assumption: SRS ocean data will continue tobe collected and that new SRS technologies will be developed that improveaccuracy and precision of the ocean data collected. This assumption is paramount asthe continued collection of high-resolution SRS ocean data is central to sustainablefisheries management now and in the future. Without continued collection ofhigh-resolution SRS data, sustainable fisheries management, within the largerecosystem management context, will not be possible.
Even with decades of exciting innovations of SRS applications in fisheries andocean management, there are several gaps that must be addressed to support thecontinued use and development of SRS data in fisheries management. These gapsinclude the ongoing disconnect between data acquisition and fisheries applications,and the need for wider SRS data integration and application. However, the mostcritical gap to address may be the limited support for actionable, need-driven sci-ence that uses SRS (and other) data to support fisheries management.
Both NASA and NOAA have developed many accessible online platforms topromote the use and distribution of SRS data. For example, NASA’s Physical
Satellite Remote Sensing in Support of Fisheries Management in Global Oceans 217

Oceanography Distributed Active Archive Center (PO.DAAC), an element of theEarth Observing System Data and Information System (EOSDIS) provides SRSdata to a wide community of users (https://podaac.jpl.nasa.gov/). Similarly,NOAA’s ERDDAP web-based data server (http://coastwatch.pfeg.noaa.gov/erddap/information.html) provides a simple, consistent way to combine and downloadmultiple sets of SRS data in common file formats. These and many similar effortshave made tremendous advances in delivering SRS data to the community ofpotential users. However, these efforts have not permeated the fisheries manage-ment community and there remains untapped potential in the development of SRSapplications in direct service of fisheries management.
Robust fisheries management, of course, relies, on robust oceanographic data.However, in many cases, SRS and other oceanographic data are necessary but notsufficient, for robust fisheries management. Fisheries management also requires theintegration of data on policy, social structure, culture, economics, and other relatedfields (Hall et al. 2007). Integrated frameworks that merge natural and social sci-ence data have been developed and applied to identify the factors affectingecosystem management (Chan et al. 2012; Schultz et al. 2015), however, thesetypes of integrated frameworks that merge SRS data with socioeconomic, policyand other data are still rare in a fisheries management context.
The final issue to be addressed is the critical need for actionable,management-driven science that uses SRS and other data to support fisheriesmanagement. Despite the growing, and in many areas of the world desperate, needfor practical and implementable solutions to fisheries management problems, thereare still comparatively fewer resources focused on actionable, applied science thatcan support innovative management solutions. This, in part, stems from a discon-nect between the scientific and management communities. Analyzing SRS data isfundamentally complex and often requires highly specialized analytic tools andskills. For some fisheries managers and decision makers, this can be prohibitive. Tointerpret and apply SRS data or merge it with other in situ biological or other dataalso requires tools to apply the data into decision-making. There are very fewapplications available that enable managers to use SRS data in a scientificallyrobust but straightforward manner. This integration requires collaboration betweenresearchers, scientists, data analysts and conservation practitioners to developaccessible tools, all the while ensuring such approaches are scientifically robust anddefensible and are directly meeting the needs of the management community. Evenwith the remarkable advances in SRS sensors and platforms, the applications ofSRS data in support of fisheries management have not yet fully capitalized on therich SRS data sets. Given the substantial global investment in SRS technology andthe ever-increasing pressure for sustainable fisheries worldwide, continued supportand resources for SRS data distribution, integration, and management-relevantscience are needed to maximize the return on this investment in support of sus-tainable fisheries.
218 D. Kacev and R.L. Lewison

References
Bakun, A. (1996). Patterns in the ocean: Ocean processes and marine population dynamics(p. 323). University of California Sea Grant, San Diego, California, USA, in cooperation withCentro de Investigaciones Biologicas de Noroeste, La Paz, Baja California Sur, Mexico.
Balint, P. J., Stewart, R. E., Desai, A., & Walters, L. C. (2011). Wicked environmental problems:Managing uncertainty and conflict. Washington, DC: Island Press.
Boehlert, G. W., & Schumacher, J. D. (1997). Changing oceans and changing fisheries:Environmental data for fisheries research and management. NOAA Technical MemorandumNMFS. NOAA-TM-NMFS-SWFSC-23.
Bograd, S. J., Block, B. A., Costa, D. P., & Godley, B. J. (2010). Biologging technologies: Newtools for conservation. Introduction Endangered Species Research, 10, 1–7. doi:10.3354/esr00269.
Breaker, L. C. (1981). The applications of satellite remote sensing to West Coast fisheries. MarineTechnology Society Journal, 15, 32–40.
Briscoe, D., Hiatt, S., Lewison, R., & Hines, E. (2014). Modeling habitat and bycatch risk fordugongs in Sabah.Malaysia. Endanger Species Research, 24, 237–247. doi:10.3354/esr00600.
Brown, C. J., White, C., Beger, M., Grantham H. S., Halpern, B. S., Klein, C. J., et al. (2015).Fisheries and biodiversity benefits of using static versus dynamic models for designing marinereserve networks. Ecosphere, 6 (10). Article Number: 182.
Chan, K. M. A., Guerry, A. D., Balvanera, P., Klain, S., Satterfield, T., Basurto, X., et al. (2012).Where are cultural and social in ecosystem services? A framework for constructiveengagement. BioScience, 62, 744–756. doi:10.1525/bio.2012.62.8.7.
Chassot, E., Bonhommeau, S., Reygondeau, G., Nieto, K., Polovina, J. J., Huret, M., et al. (2011).Satellite remote sensing for an ecosystem approach to fisheries management. ICES Journal ofMarine Science, 68(4), 651–666. doi:10.1093/icesjms/fsq195/.
Checkley, D. M., Dotson, R. C., & Griffith, D. A. (2000). Continuous, underway sampling of eggsof Pacific sardine (Sardinops sagax) and northern anchovy (Engraulis mordax) in spring 1996and 1997 off southern and central California. Deep-Sea Research Part II-Topical Studies InOceanography, 47(5–6), 1139–1155.
Collie, J. S., Adamowicz, W. L., Beck, M. W., et al. (2013). Marine spatial planning in practice by:Estuarine Coastal And Shelf. Science, 117, 1–11.
Cornillon, P., et al. (1986). Sea surface temperature charts for the southern New England fishingcommunity. The Marine Technology Society Journal, 20(2), 57–65.
Costa, D. P., Breed, G. A., & Robinson, P. W. (2012). New insights into Pelagic migrations:Implications for ecology and conservation. D.J. Futuyma (Eds.). Annual Review of EcologyEvolution and Systematics, 43, 73–96.
Cushing, D. H. (1982). Detection of fish (p. 200). London: Pergamon Press.Davies, R. W. D., Cripps, S. J., Nickson, A., & Porter, G. (2009). Defining and estimating global
marine fisheries bycatch. Marine Policy, 33, 661–672. doi:10.1016/j.marpol.2009.01.003.Dunn, D. C., Maxwell, S. M., Boustany, A. M., & Halpin, P. N. (2016). Dynamic ocean
management increases the efficiency and efficacy of fisheries management. Proceedings of theNational Academy of Sciences, 113(3), 668–673. doi:10.1073/pnas.1513626113.
EOS. (2006). Using satellite data products to manage living marine resources. Eos, 87(41),437–438.
FAO. (2003). The application of remote sensing technology to marine fisheries: An introductorymanual (Section 7). Food and Agriculture Organization Corporate Document Repository.
FAO. (2009). The state of world fisheries and aquaculture 2008. Rome, Italy: FAODocumentation Group. 176 p.
Francis, M. P., Holdsworth, J. C., & Block, B. A. (2015). Life in the open ocean: Seasonalmigration and diel diving behaviour of Southern Hemisphere porbeagle sharks (Lamna nasus).Marine Biology, 162, 2305–2323. doi:10.1007/s00227-015-2756-z.
Satellite Remote Sensing in Support of Fisheries Management in Global Oceans 219

Gardner, B., Sullivan, P. J., Morreale, S. J., et al. (2008). Spatial and temporal statistical analysis ofbycatch data: Patterns of sea turtle bycatch in the North Atlantic. Canadian Journal ofFisheries and Aquatic Sciences, 65(11), 2461–2470.
Hall, M. A., Alverson, D. L., & Metuzals, K. I. (2000). By-catch: Problems and solutions. MarinePollution Bulletin, 41, 204–219. doi:10.1016/S0025-326X(00)00111-9.
Hall, M., Nakano, H., Clarke, S., Thomas, S., Molloy, J., Peckham, S., et al. (2007). Working withfishers to reduce bycatches. In S. Kennelly (Ed.), Bycatch reduction in the world’s fisheries(pp. 235–288). Dordrecht: Springer.
Hammerschlag, N., Gallagher, A. J., Lazarre, D. M., et al. (2011). Range extension of theEndangered great hammerhead shark Sphyrna mokarran in the Northwest Atlantic: Preliminarydata and significance for conservation. Endangered Species Research, 12(2), 111–116.
Haury, L. R., McGowan, J. A., & Wiebe, P. H. (1978). Patterns and processes in the time-spacescales of plankton distributions. In J.H. Steele (Ed.), Spatial patterns in plankton communities(pp. 277–327). Plenum Press.
Hazen, E. L., Maxwell, S. M., Bailey, H., Bograd, S. J., Hamann, M., Gaspar, P., et al. (2012).Ontogeny in marine tagging and tracking science: Technologies and data gaps.Marine EcologyProgress Series, 457, 221–240.
Hazen, E. L., Jorgensen, S., Rykaczewski, R. R., Bograd, S. J., Foley, D. G., Jonsen, I. D., et al.(2013). Predicted habitat shifts of Pacific top predators in a changing climate. Nature ClimateChange, 3, 234–238.
Hisschemoller, M., & Hoppe, R. (1995). Coping with intractable controversies: The case forproblem structuring in policy design and analysis. Knowledge, Technology and Policy, 8(4),40–60. doi:10.1007/bf02832229.
Hobday, A. J., Hartog, J. R., Timmis, T., & Fielding, J. (2010). Dynamic spatial zoning to managesouthern bluefin tuna capture in a multi-species longline fishery. Fisheries Oceanography, 19,243–253. doi:10.1111/j.1365-2419.2010.00540.x.
Hobday, A. J., Smith, A. D. M., Stobutzki, I. C., Bulman, C., Daley, R., Dambacher, J. M., et al.(2011). Ecological risk assessment for the effects of fishing. Fisheries Research, 108, 372–384.doi:10.1016/j.fishres.2011.01.013.
Hobday, A. J., Maxwell, S. M., Forgie, J., Mcdonald, J., Darby, M., Seto, K., et al. (2014).Dynamic ocean management: Integrating scientific and technological capacity with law, policyand management. Stanford Environmental Law Journal, 33, 125–165. https://journals.law.stanford.edu/sites/default/files/stanford-environmental-law-journal-selj/print/2014/03/i_hobday_final.pdf.
Howell, E. A., Hoover, A., Benson, S. R., Bailey, H., Polovina, J. J., Seminoff, J. A., et al. (2015).Enhancing the TurtleWatch product for leatherback sea turtles, a dynamic habitat model forecosystem-based management. Fisheries Oceanography, 24, 57–68. doi:10.1111/fog.12092.
Howell, E., Kobayashi, D., Parker, D., Balazs, G., & Polovina, J. (2008). TurtleWatch: A tool toaid in the by-catch reduction of loggerhead turtles Caretta caretta in the Hawaii-based pelagiclongline fishery. Endanger Species Research, 5, 267–278. doi:10.3354/esr00096.
James, M., Ottensmeyer, C., & Myers, R. (2005). Identification of high-use habitat and threats toleatherback sea turtles in northern waters: New directions for conservation. Ecology Letters, 8,195–201. doi:10.1111/j.1461-0248.2004.00710.x.
Kachelriess, D., Wegmann, M., Gollock, M., et al. (2014). The application of remote sensing formarine protected area management. Ecological Indicators, 36, 169–177.
Kahru, M., Hakansson, B., & Rud, O. (1995). Distributions of the sea-surface temperature fronts inthe baltic sea as derived from satellite imagery. Continental Shelf Research, 15(6), 663–679.Published: MAY 1995.
Kelleher, K. (2005). Discards in the World’s Marine Fisheries: An Update. Technical Paper.No. 470. Rome: FAO Fisheries. p. 131.
Klemas, V. (2012a). Remote sensing of coastal plumes and ocean fronts: Overview and case study.Journal Of Coastal Research 28(1A_S), 1–7.
Klemas, V. (2012b). Remote sensing of environmental indicators of potential fish aggregation: Anoverview. Baltica, 25(2), 99–112.
220 D. Kacev and R.L. Lewison

Klemas, V. (2013). Fisheries applications of remote sensing: An overview. Fisheries Research,148, 124–136.
Larnicol, G., Guinehut, S., Rio, M.-H., Drevillon, M., Faugere, Y., & Nicolas, G. (2006). Theglobal observed ocean products of the French mercator project. In Proceedings of 15 Years ofprogress in radar altimetry Symposium, ESA Special Publication, pp. 614.
Lengyel, S., Déri, E., Varga, Z., Horváth, R., Tóthmérész, B., Henry, P.-Y., et al. (2008). Habitatmonitoring in Europe: A description of current practices. Biodiversity and Conservation, 17,3327–3339. doi:10.1007/s10531-008-9395-3.
Lewison, R., Crowder, L., Read, A., & Freeman, S. (2004). Understanding impacts of fisheriesbycatch on marine megafauna. Trends in Ecology and Evolution, 19, 598–604. doi:10.1016/j.tree.2004.09.004.
Lewison, R. L., Soykan, C. U., & Franklin, J. (2009). Mapping the bycatch seascape: Multispeciesand multi-scale spatial patterns of fisheries bycatch. Ecological Applications, 19, 920–930.doi:10.1890/08-0623.1.
Lewison, R., Hobday, A., Maxwell, S., Hazen, E., Hartog, J., Dunn, D., et al. (2015). Dynamicocean management: Identifying the critical ingredients of dynamic approaches to oceanresource management. BioScience, 65, 486–498. doi:10.1093/biosci/biv018.
Luo, J., Ault, J. S., Shay, L. K., Hoolihan, J. P., Prince, E. D., Brown, C. A., et al. (2015). Oceanheat content reveals secrets of fish migrations. PLoS ONE, 10(10): e0141101. doi:10.1371/journal.pone.0141101.
Lynn, R. J. (2003). Variability in the spawning habitat of Pacific sardine (Sardinops sagax) offsouthern and central California. Fisheries Oceanography, 12(6), 541–553.
Maxwell, S. M., Hazen, E. L., Lewison, R. L., Dunn, D. C., Bailey, H., Bograd, S. J., et al. (2015).Dynamic ocean management: Defining and conceptualizing real-time management of theocean. Mar. Policy, 58, 42–50. doi:10.1016/j.marpol.2015.03.014.
Pettorelli, N., Nagendra, H., Willians, R., Rocchini, D., & Fleishman, E. (2014). A new platform tosupport research at the interface of remote sensing, ecology and conservation. Remote Sensingin Ecology and Conservation, 1, 1–3. doi:10.1002/rse2.1.
Polovina, J., Uchida, I., Balazs, G., Howell, E., Parker, D., & Dutton, P. (2006). The Kuroshioextension bifurcation region: A pelagic hotspot for juvenile loggerhead sea turtles. Deep SeaResearch II, 53, 326–339. doi:10.1016/j.dsr2.2006.01.006.
Radovich, J. (1982). The collapse of the California sardine fishery. What have we learned,pp. 56–77.
Ramos, A. G., Santiago, J., Sangra, P., & Canton, P. (1996). An application of satellite-derived seasurface temperature data to the skipjack and albacore tuna fisheries in the north-east Atlantic.International Journal of Remote Sensing, 17, 749–759. doi:10.1080/01431169608949042.
Rose, G. A., deYoung, B., Kulka, D. W., Goddard, S. V., & Fletcher, G. L. (2000). Distributionshifts and overfishing the northern cod (Gadus morhua): A view from the ocean. CanadianJournal of Fisheries and Aquatic Sciences, 57, 644–663. doi:10.1139/f00-004.
Royer, F., Fromentin, J.-M., & Gaspar, P. (2004). Association between bluefin tuna schools andoceanic features in the western Mediterranean. Marine Ecology Progress Series, 269, 249–263.
Santos, A. M. P. (2000). Fisheries oceanography using satellite and airborne remote sensingmethods: A review. Fisheries Research, 49(1), 1–20.
Santos, A. M. P, & Fiúza, A. F. G. (1992). Supporting the Portuguese fisheries with satellites. InESA ISY-1 (ESA SP-341), pp. 663–668.
Scheuerell, M. D., & Williams, J. G. (2005). Forecasting climate-induced changes in the survivalof Snake River spring/summer Chinook salmon (Oncorhynchus tshawytscha). FisheriesOceanography, 14(6), 448–457.
Schultz, L., Folke, C., Österblom, H., & Olsson, P. (2015). Adaptive governance, ecosystemmanagement, and natural capital. Proceedings of the National Academy of Sciences, 112(24),7369–7374.
Sims, M., Cox, T., & Lewison, R. (2008). Modeling spatial patterns in fisheries bycatch:Improving bycatch maps to aid fisheries management. Ecological Applications, 18, 649–661.doi:10.1890/07-0685.1.
Satellite Remote Sensing in Support of Fisheries Management in Global Oceans 221

Smith, P. E., & Moser, H. G. (2003). Long-term trends and variability in the larvae of Pacificsardine and associated fish species of the California Current region. Deep Sea Research Part II:Topical Studies in Oceanography, 50(14), 2519–2536.
Soykan, C. U., & Lewison, R. L. (2015). Using community-level metrics to monitor the effects ofmarine protected areas on biodiversity. Conservation Biology. doi:10.1111/cobi.12445.
Sudre, J., & Morrow, R. (2008). Global surface currents: A new product for investigating oceandynamics. Ocean Dynamics, 58(2):101–118.
Weber, E. D., & McClatchie, S. (2010). Predictive models of northern anchovy Engraulis mordaxand Pacific sardine Sardinops sagax spawning habitat in the California Current. MarineEcology Progress Series, 406, 251–263.
Wright, D. J., Woodworth, B. M., & O’Brien, J. J. (1976). A system for monitoring the location ofharvestable coho salmon stocks. Marine Fisheries Review, 38, 1–7.
Wells, B. K., Field, J. C., Thayer, J. A., Grimes, C. B., Bograd, S. J., Sydeman, W. J., et al. (2008).Untangling the relationships among climate, prey and top predators in an ocean ecosystem.Marine Ecology Progress Series, 364, 15–29.
Yamanaka, I. (1988). The fisheries forecasting system in Japan for coastal pelagic fish, (No. 301).Food and Agriculture Organisation.
Zwolinski, J. P., Emmett, R. L., & Demer, D. A. (2011). Predicting habitat to optimize sampling ofPacific sardine (Sardinops sagax). ICES Journal of Marine Science: Journal du Conseil, 68(5),867–879.
Zydelis, R., Lewison, R. L., Shaffer, S., Moore, J., Boustany, A., Roberts, J., et al. (2011).Dynamic habitat models: Using telemetry data to project fisheries bycatch. Proceedings of theRoyal Society B: Biological Sciences, 282, 1–10. doi:10.1098/rspb.2011.0330.
222 D. Kacev and R.L. Lewison

Improving NASA’s Earth ObservationSystems and Data Programs Throughthe Engagement of Mission EarlyAdopters
Vanessa M. Escobar, Margaret Srinivasan and Sabrina Delgado Arias
Abstract This chapter provides an overview of the NASA Early Adopter Programfrom the perspective of three new and planned satellite earth observing missions—SMAP, ICESat-2 and SWOT. The level of activity and engagement of the mission’sapplications is directly related to the maturity of the mission products and algo-rithms. Early Adopters were introduced to NASA through the SMAP MissionApplications Program in 2010 and it quickly became adopted by other missions(ICESat-2 2013 and SWOT in 2014). Early Adopters work with the mission sci-entists to test the thematic uses and applications of mission products, while pro-viding feedback on the accomplishments and challenges of the data.
1 Overview
This chapter will give an overview of the NASA Early Adopter Program from theperspective of three missions, SMAP, ICESat-2, and SWOT. The development of aNASA Applications Program is broken up into stages that complement thedevelopment of science product development. The level of activity and engagementof the mission’s applications is directly related to the maturity of the missionproducts and algorithms. Early Adopters were introduced to NASA through theSMAP Mission Applications Program in 2010 and it quickly became adopted byother missions (ICESat-2 2013 and SWOT in 2014). Early Adopters work with themission scientists to test the thematic uses and applications of mission products,while providing feedback on the accomplishments and challenges of the data. EarlyAdopters are a subset of the mission’s community of users that volunteer theirefforts and resources to use prelaunch mission data in their organization. The Early
V.M. Escobar (&) � S.D. AriasNASA GSFC, Greenbelt, USAe-mail: [email protected]
M. Srinivasan (&)NASA JPL, Pasadena, USAe-mail: [email protected]
© Springer International Publishing Switzerland 2016F. Hossain (ed.), Earth Science Satellite Applications,Springer Remote Sensing/Photogrammetry, DOI 10.1007/978-3-319-33438-7_9
223

adopter feedback, experience, and recommendations are incorporated into themission development through strategic communication activities and outreach thathelp the mission scientist gain an outside perspective of how the science can beused by society. In return, the early adopters are provided guidance and mentorshipfrom the science team in the development of their research and they are given theopportunity to present their results to NASA before any mission data becomepublically available, accelerating the early adopters research results, and applica-tions after launch. NASA embraced the effort of including Early Adopters into themission life cycle as a new standard for future missions during the SMAP missionlife cycle. Understanding how NASA data are used in different types of applicationswill continue to inform future science for NASA. Incorporating user feedbackduring mission development and fostering Early Adopters in the developmentstages of the mission life cycle is also a way of accelerating product knowledge andrelevance after launch. The Early adopter program is part of NASA’s new approachfor making science an integral part of society. Through the Early Adopters, mis-sions incorporate feedback and leverage relationship in an effort to make scienceapplications more impactful and relevant to the everyday users. ApplicationPrograms and Early Adopters are redefining how NASA develops science andshares knowledge with the public. The new decadal survey missions now requireEarly Adopters to be a part of the project architecture from conception through theend of the mission’s life cycle, making sure science is not only unique and infor-mative but useful and impactful.
2 Introduction
Satellite data provide continuous information for most Earth systems. These dataare valuable for developing scientific products that explain the how earth’s systemsare integrated. These data can be integrated into models and decision supportsystems that enhance our knowledge and enable improved natural resource man-agement, disaster prevention and response, and other benefits to society. However,the value is best understood through thematic presentations and explicit commu-nications describing how the data impacts our everyday lives. Providing sciencedata in a user-friendly fashion (format, language, scale, etc.) to decision-makers is apriority for NASA, particularly for the issues that surround climate and climatechange. Although satellite data and products prove to be useful, it is still necessaryto describe the utility of those product and link them to societal relevant topics sothe science resonates with the everyday user and benefactor of the information.Asking, ‘how can we identify the policies and decisions that benefit from inte-grating satellite data products?’ is how NASA is addressing applications for futuremissions. One of NASA’s Applied Sciences Program (ASP) strategic goals forscience applications is to “ensure that NASA’s flight missions plan for and supportapplications goals in conjunction with their science goals, starting with projectplanning and extending through the project life cycle” (NASA 2009). An action
224 V.M. Escobar et al.

item related to this goal is to “evaluate the potential for current and planned NASAmissions to meet societal needs through applied sciences participation in missionscience teams.”
United States launched its first Earth satellite on January 31, 1958, whenExplorer 1 documented the existence of radiation zones encircling the Earth. Withover 20 satellites orbiting in operations today, NASA remains a leading force inscientific research. The objectives of the existing missions are strategic, identified indecadal surveys from the National Academy of Sciences, and created to meetnational or agency objectives. Others are competed missions selected in response toopen solicitations. All missions are challenging endeavors that seek to understandscience at different capacities and applications.
These missions take years to evolve and they progress in phases (Pre Phase Athrough Phase F). Each phase of a mission has specific science objectives and goalsit must reach before “graduating” to the next phase. Phases Pre-Phase A through Dare the “pre-launch” stages of a mission where the algorithms for the science are indevelopment and the calibration and validation of field data against those algo-rithms are in full effect. As the mission progresses from Phase A to Phase D, ascience definition (SDT) team is selected to design the science products for themission. During this process is when the applications of the science products aredefined. Pre-launch can take anywhere from 5 to 8 years to complete beforereaching launch (Phase E). Phase E is the “operational” stage of the mission lifecycle, beginning at launch, Phase E lasts until the satellite is decommissioned.Phase E is where the satellite observations are developed into actual scienceproducts promised by the mission. Leading up to Phase E, the SDT also isrecompleted as a new science team (ST), no longer in development of algorithms.The focus of the science team is now to calibrate and validate the actual satelliteobservations with the algorithms developed in the prelaunch phases of the mission’slife cycle. Phase E is also the phase were the public has access to the data and canstart using the mission products in their research. Because NASA is a researchorganization, the operational stages of a mission are designed to last 3–5 years.Some mission lasts much longer than the 3–5 year life expectancy (like MODIS)and continue to operate until it is no longer operational. However, the intent is tohave 3–5 years collected and then handed off to an operational user (NOAA,USGA, DoD, etc.) for its continued use. Phase E, traditionally, is when societylearns most about the applications of the science products. However, learning aboutapplications after the design and development mission have all been made, makes itan expensive challenge for implementing feedback or making improvements to thescience products. Early Adopters were introduced to NASA by the Soil MoistureActive Passive (SMAP) mission in an effort to implement feedback into the designof mission product development. The introduction of Early Adopters to NASA willforever change the way science is developed.
In 2007, the National Research Council (NRC) released the first Decadal Surveyfor Earth Science (National Research Council 2007). The Decadal Survey outlinedresearch initiatives of national importance for the next decade and identified thedevelopment of applications of satellite data as a priority for all future missions.
Improving NASA’s Earth Observation Systems … 225

The Applied Sciences Division responded to the NRC guidance by ‘identifyingapplications leads for all Tier 1 Decadal Survey missions and making applicationsan integral part of all decadal survey missions’. The intent of this response is forthose leading application for missions to engage with the project scientists duringthe prelaunch development process and to facilitate interaction with the relevantcommunities of users to ensure that mission data products will achieve maximumvalue. Because satellite missions can take a decade or more to develop, engagingwith potential data users during the early stages of mission development is the bestway to ensure that new observations meet the most urgent demands of users andhave the broadest impact. Through early engagement in the prelaunch developmentstage of a project, each individual mission’s applications program generates feed-back loops that feed into the development of products making more relevant anduser-friendly data products at launch. This feedback helps connects end users withscience data product developers and distributors (such as the Distributed ActiveArchive Centers (DAACs)), increasing the visibility of the products and enablingthe maximum benefit to society from satellite missions.
The 2007 Decadal Survey served as the catalyst for the development of a for-malized Applications Program for NASA missions (National Research Council2007). The NASA Applied Science Program redefined the way it conducts appli-cations through the NRC guidance and is quickly providing examples of socioe-conomic benefits of satellite data through project-specific Early Adopter Programs.The Early Adopter program is a component within each NASA Mission’sApplications Program (Moran et al. 2015).
3 The Early Adopter Program
Early Adopters are an inclusive community of users, representing science, com-mercial, private, academic, and federal organizations that are willing to workalongside mission scientists and provide feedback to the mission scientists relatedto how the science product(s) are used in their field of expertise. The goal of theEarly Adopter Program is to facilitate feedback on mission products prelaunch, andto accelerate the use of these products post-launch, by providing specific guidanceand early mission data access to Early Adopters who commit to engage in appliedresearch. The Early Adopter program is a non-funded activity that leveragesexisting resources, relationships, and opportunities. The program provides aframework for building a broad and well-defined user community during the pre-launch phases of the mission to maximize the use of data products after launch andto provide early insight into the range of potential uses of the mission data (Moranet al. 2014).
NASA’s SMAPMission was the first to implement an Early Adopter Program intothe mission development structure during prelaunch stage of the mission and con-tinued working with EarlyAdopters through operations. The overarching objective ofthe program was to broaden and strengthen the knowledge of the community to the
226 V.M. Escobar et al.

science of SMAP, improve the knowledge of the applications for the science team anddemonstrate the value of the data uses in ways that facilitate the science to helpsociety. The Early Adopter program will identify communities of users for the EarthObservation (EO) missions at NASA that will communicate lessons learned for howthe mission data are used in areas of society that have an impact on health, naturalresources, and the economy. Early Adopters promote applications research to providea fundamental understanding of how the mission data products can be scaled andintegrated into an organization’s policy, business or management activities toimprove decision-making efforts (Escobar and Arias 2015). Through their use of theEarly Adopter program, NASA Earth Observer (EO) missions described in thischapter create the necessary feedback loops between the mission and user commu-nities for an understanding of the utility of mission data products within differentdecision-making contexts. As a result of SMAP’s success with Early Adopters, theprogram was highlighted as a best practice in the 2012 National AcademiesMidterm Assessment report (http://www.nap.edu/catalog/13405/earth-science-and-applications-from-space-a-midterm-assessment-of).
All Early Adopters are unique because the conduct applied research at a varietyof spatial and temporal scales, aimed towards answering targeted questions thatclearly link how science is helping our everyday lives. The benefit of participatingin an Early Adopter program is not only the access to early mission data but also therelationships that develop within science team and other Early Adopters (Fig. 1).Mission scientists benefit greatly from Early Adopter feedback, gaining perspectiveon the utility and challenges of the mission data, while they are still in development.Using feedback early in mission development allows for corrections and adjust-ments to data products can be made without an increased cost to the mission. Theseadjustments address things like latency, format and resolution, optimizing cost, andimproving the mission understanding of uses of products after launch.
Feedback provides opportunity for improvements to data products not onlythrough mission product design but also data delivery. One example of thisimprovement comes from the 2012 community assessment of the SMAP commu-nity (Brown and Escobar 2014). Here the goal of the assessment was to solicit datarequirements, accuracy needs and current understanding of the SMAP mission bythe user community. The SMAP user community was asked to describe accuracyneeds for spatial, temporal, and latency characteristics of their data use andapplications. The results of the assessment identified gaps in the fields of scientificresearch, operations, and those involved in public policy and decision-making. Theresults showed 80 % of the reviewers were involved in carrying out soil moisturerelated research, and 60 % of those reviewers stated that they were not involvedpolicy or decision-making applications (Brown and Escobar 2014). By making theGoogle Earth file format, (KMZ), a standard format for SMAP data product, themission enabled policy and decision-making communities who use satellite data, touse a more familiar format for applying SMAP to their efforts. Feedback such asthis continues to bring value to NASA and the applications of mission data.
Participants in the Early Adopter program not only gain exclusive access to earlymission data but they get increased engagement with the mission science team. The
Improving NASA’s Earth Observation Systems … 227
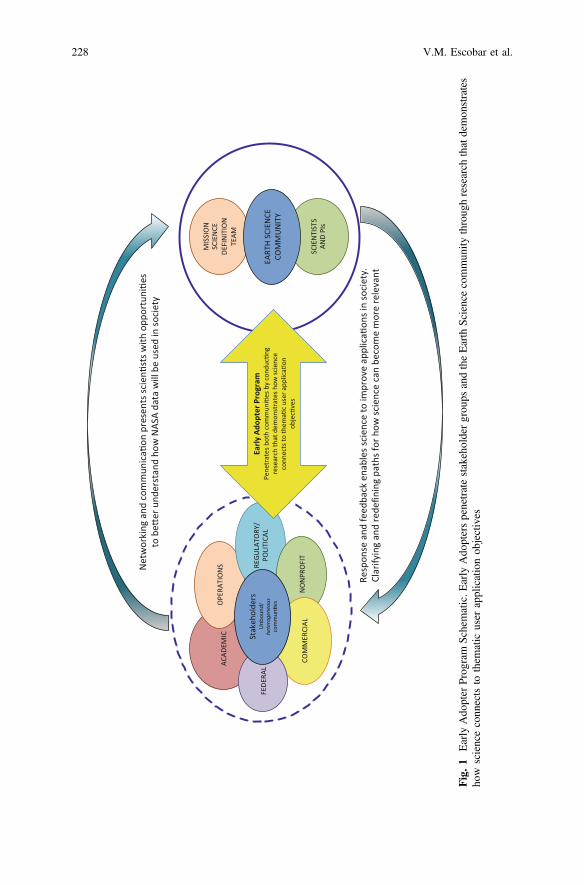
Fig.1
Early
Ado
pter
Prog
ram
Schematic.E
arly
Ado
pterspenetratestakeholdergrou
psandtheEarth
Sciencecommun
itythroug
hresearch
thatdemon
strates
how
scienceconn
ectsto
them
atic
user
applicationob
jectives
228 V.M. Escobar et al.

early mission data provides an advanced into what the mission will produce afterlaunch. This gives the Early Adopter time to prepare and develop methods foringesting the data; cutting back on time and resources needed had waited to adoptthe data after launch. Early Adopters benefit from early mission science andtechnology to improve their operating or decision-making systems. Both the mis-sion scientists and the Early Adopters gain the unique opportunity to developrelationships that help identify the impact of science and implement lessons learnedthat reveal products that inform societally relevant applications.
How an Early Adopter Program is implemented and how it evolves is unique toeach mission and the science objectives of that mission. NASA’s SMAPMission, theIce Cloud and Elevation Satellite (ICESat-2) Mission and Surface Water and OceanTopography (SWOT) Mission have each designed their Early Adopter Program inaccordance with the mission science objectives and a targeted user community.Throughout the life of the program, the applications of the mission science and thetargeted community expand to include new applications and users organically.The SMAP, ICESAt-2, and SWOT projects are currently at different stages in theproject life cycle, therefore each project has different activities they are conductingwith their Early Adopter community. All three missions use their Early Adopterprogram as bridges between the mission science and the end users providing the-matically specific sample of how the mission science will benefit from their researchobjective, which is directly linked to a policy or decision process that is relevant tothe user community. The objectives of this chapter are to provide you an under-standing of NASA’s Early Adopter Program, demonstrate how the program worksfor three different NASA missions, and give examples of the type of research EarlyAdopters are conducting for missions at different phases of the mission life cycle.
4 Examples of Mission Early Adopters and Case Studies
The Early Adopter programs described below are a learning experience that providedirection for how mission planning is conducted at NASA and setting some contextfor the next NRC decadal survey in 2017.
5 NASA’s SMAP Mission
One of the first missions recommended by the NRC decadal survey was the SMAPmission (Fig. 2), launched on January 31 2015. The SMAP mission is designed toprovide global soil moisture and freeze–thaw measurements from space for appli-cations in fields of weather, climate, drought, flood, agricultural production, humanhealth, and national security. The SMAP mission provides high quality; daily,global soil moisture data, which have both high science and applications value.SMAP measurements are used to enhance the understanding of processes that link
Improving NASA’s Earth Observation Systems … 229

the water, energy, and carbon cycles, and to extend the capabilities of weather andclimate prediction models (Brown et al. 2012). The satellite orbit provides an 8-dayrevisit with optimum coverage of global land area at 3-day average intervals.
The range of applications in weather, flooding, drought, agriculture, health, andnational security for SMAP are defined partly by the spatial resolution and latencyof the SMAP products, ranging from approximately 1–3 km for the syntheticaperture radar (SAR) data to the 39 km × 47 km radiometer data, nominallyreferred to as 40-km resolution (Moran et al. 2015). The high resolution of the radaris critical for accurate determination of freeze–thaw state, and the low-resolutionradiometer measurements are key to deriving the soil moisture product. The radarand radiometer measurements are combined to generate a mid-resolution productthat optimizes the resolution and accuracy attributes of the radar and radiometer.Sadly, after 10 weeks of postlaunch measurements the SMAP radar stoppedtransmitting on July 7 2015. In response, the SMAP Early Adopters conductedinvestigations of products other than soil moisture and freeze/thaw to increase thescience and applications value of SMAP radiometer data stream. The EarlyAdopters are conducting short-term studies with the 10-week SMAP radar/radiometer product stream to report on the value of the unique SMAP radar/radiometer data for applications.
Some Early Adopters and the SMAP community are assisting to develop and testSMAP science recovery of higher resolution soil moisture and FT. The SMAPApplications Team is engaging with Early Adopters to provide feedback to themission. This unexpected, yet important, effort will provide lessons learned toNASA Headquarters.
In 2009, SMAP Project funded the first formal Applications Program thatengaged with data users (science and commercial) early enough in the missiondesign to have impact on the developed mission products. The SMAP Early AdopterProgram was initiated in 2010 to support prelaunch applied research, which providedfundamental knowledge of how SMAP data products could be scaled and integratedinto users’ policy, business, and management activities to improve decision-makingefforts. Since its inception, the SMAP Early Adopter Program has been recognizedby NASA Headquarters as the most valuable component of the SMAP ApplicationsProgram. SMAP Early adopters are formally defined as those users who have a direct
Fig. 2 SMAP Satellite ImageCredit: NASA JPL
230 V.M. Escobar et al.

or clearly defined need for SMAP-like data and who are planning to apply their ownresources to demonstrate the utility of SMAP data for their particular system ormodel.
The goal of the SMAP Early Adopter is to provide quantitative metrics designedto benefit the users, as well as the SMAP Project. With a total of 55 Early Adopters(Fig. 3 and Appendix 1), SMAP Early Adopters conduct research in unprecedentedprelaunch preparation for SMAP applications, provided critical feedback to themission to improve product specifications, are helping improve the distribution ofproducts for postlaunch applications, and provide perspective to the impact SMAPdata products have on societal areas of interest. After launch in early 2015, EarlyAdopters continued to work on their research effort with the use of real observa-tions, each one achieving unique milestone as they progressed. Because EarlyAdopter feedback was so important to the mission, Phase E case studies wereproposed as part of the post-launch applications efforts. Case studies are exampleprojects that demonstrate scientific and societal impact through the efforts of theresearch. For SMAP Phase E case studies, select Early Adopters demonstrate howSMAP science data are (1) ingested and (2) used technically by their organization,(3) while providing feedback about any challenges, changes, or improvements totheir system processes. The Phase E case studies for SMAP show the data life cycleand scientific knowledge gain from the products. Through case studies, SMAPlearns about how the use of the data affects the research hypothesis of the EarlyAdopters but also understand if the science has the potential to impact an appli-cation or a decision. The SMAP mission plans to qualify the results for six indi-vidual case studies and publish their results after 2018. In this next section, the mostrecent SMAP Early Adopter case study preliminary results are presented.
Fig. 3 The logos of 55 SMAP Early Adopters
Improving NASA’s Earth Observation Systems … 231

6 SMAP Early Adopter Examples
SMAP Early Adopters are a diverse and international group of scientist, engineers,manages, and entrepreneurs representing applications in a broad range of areas(Fig. 4). The examples of SMAP Early Adopters that follow provide an overview ofthe program and the areas of SMAP applications. The examples below as a sampleof the contributions that continue to be made to the project and demonstrate thevalue of early mission engagement and stakeholder relationships. The project isenormously grateful for the effort of our Early Adopter community. More results,updates on Early Adopters, and biographies can be found on the SMAP MissionApplications website at http://smap.jpl.nasa.gov/science/applications/.
6.1 Weather and Climate Forecasting
Soil moisture information is important for temperature and precipitation forecast-ing. Initialization of numerical weather prediction and seasonal climate models withaccurate soil moisture information enhances their prediction skills and extends theirskillful lead times. Improved seasonal climate predictions benefit climate-sensitivesocioeconomic activities, including water management, agriculture, fire, flood, anddrought hazards monitoring. SMAP data products are used to constrain land surfacemodels. NOAA researchers Kyle McDonald, Michael Ek, Marouane Temimi, XiwuZhan, and Weizhong Zhen are working together on the development of proxies for
Fig. 4 A simulated image of SMAP radar data scaled backscatter triplets in the order VV, HH,and HV to a 24-bit color map and overlain with the locations of 37 of 55 early adopters conductingapplied research over local-to-global domains, and specific applications in Africa, the Middle East,and the North Pole (Moran et al. 2015)
232 V.M. Escobar et al.

SMAP freeze/thaw data product. They plan to use SMAP data to assess theimprovement in the performance of the NCEP Noah land surface model and assessthe assimilation of SMAP freeze/thaw product on the performance NCEP weatherforecast models. NOAA Soil Moisture Product System (SMOPS) will ingestavailable satellite soil moisture observations to NOAA’s National WeatherPrediction and other operations and research. Preliminary test shows that SMOPScould retrieve soil moisture products from L1B TB (Fig. 5) data with shorterlatency, ultimately helping improve operational weather predictions.
SMAP has a total of seven Early Adopters focused on weather and climate fore-casting. Table 1 lists SMAPEarlyAdopterswho addressweather related applications.
6.2 Droughts and Wildfires
Soil moisture strongly affects plant growth and hence agricultural productivity,especially during conditions of water shortage and drought. Soil moisture infor-mation can be used to predict wildfires, determine prescribed burning conditions,and estimate smoldering combustion potential of organic soils. For wildfires,SMAP soil moisture products provide more useful and accurate data on toxicair-quality events and smoke whiteouts (thus increasing transportation safety) andcan inform prescribed fire activities (increasing efficiency). Early Adopters focusedon drought will use data assimilation to assimilate SMAP data into land surfacemodels. These models can be run at any scale, and the SMAP retrievals act as aconstraint on the model, so while the loss of the radar does mean that there is areduced quality of information, it is not a fundamental limitation.
Fig. 5 SMAP data product table
Improving NASA’s Earth Observation Systems … 233

Famine Early Warning Systems Network (FEWS NET), was created in 1985 bythe US Agency for International Development (USAID) after devastating faminesin East and West Africa, FEWS NET is a leading provider of early warning andanalysis on acute food insecurity and provides objective, evidence-based analysis tohelp government decision-makers and relief agencies plan for and respond tohumanitarian crises in Central Asia and North Africa. Analysts and specialists in 22field offices work with US government science agencies, national governmentministries, international agencies, and NGOs to produce forward-looking reports onmore than 36 of the world’s most food-insecure countries.
The network of researchers and analysts provide monthly reports and mapsdetailing current and projected food insecurity, timely alerts on emerging or likelycrises and specialized reports on weather and climate, markets and trade, agricul-tural production, livelihoods, nutrition, and food assistance.
Improved seasonal soil moisture forecasts using SMAP data will benefit famineearly warning systems particularly in sub-Saharan Africa and South Asia, wherehunger remains a major human health factor and the population harvests its foodfrom rain-fed agriculture in highly monsoonal (seasonal) conditions. Improving theability to forecast agricultural drought has the potential to improve forecasts offood-related economic stresses in local areas within this region, and this willimprove both medium-term and long-term decision-making among several agenciesabout where, when and how to distribute food aid. In order for SMAP soil moisturedata to be informative to the FEWS-NET analysis, the data need to show clear valueof SMAP data for estimating agricultural drought, and relevance to forecasting local
Table 1 Weather and climate forecasting early adopters
Weather and climate forecasting
Researcher Organization
* Stephane Bélair Meteorological Research Division, EnvironmentCanada (EC)
* Lars Isaksen and Patricia de Rosnay European Centre for Medium-Range WeatherForecasts (ECMWF)
* Xiwu Zhan, Michael Ek, JohnSimko and Weizhong Zheng
NOAA National Centers for EnvironmentalPrediction (NCEP), NOAA National EnvironmentalSatellite Data and Information Service(NOAA-NESDIS)
* Michael Ek, Marouane Temimi,Xiwu Zhan and Weizhong Zheng
NOAA National Centers for EnvironmentalPrediction (NCEP), NOAA National EnvironmentalSatellite Data and Information Service(NOAA-NESDIS), City College of New York(CUNY)
* John Galantowicz Atmospheric and Environmental Research, Inc.(AER)
◊ Jonathan Case, Clay Blankenshipand Bradley Zavodsky
NASA Short-term Prediction Research andTransition (SPoRT) Center
◊ Steven Quiring Texas A&M University
* Early Adopters selected in 2011–2012. ◊ Early Adopters selected from 2013 forward
234 V.M. Escobar et al.

food availability and economic stress. Primarily, this is expected to happen bydemonstrating that SMAP can facilitate improvements to monthly rainfall estimatesused by FEWS-Net analysts. The primary challenge is if the value ofSMAP-derived drought analysis products is not clearly demonstrated in casestudies, the analysts will not incorporate this information into their routine efforts.So far, this SMAP Early Adopter project has demonstrated that SMAP generallyquantitatively and qualitatively agrees with precipitation-forced model simulationsof soil moisture drought. This shows that SMAP can be expected to do no harm.The “no-harm” analysis must be expanded to cover some very clear and specificsignificant past events, rather than just statistics calculated over the entire historicalrecord. For more information about FEWS NET, please visit www.fews.net.
Table 2 lists Early Adopters who are working with SMAP data products toaddress applications focused on drought and wildfires.
6.3 Flood and Landslide
Floods affect more people globally than any other type of natural hazard, causingsome of the largest economic, social, and humanitarian losses (Zurich Reinsurance2015). Soil moisture is a key variable in water-related natural hazards includingfloods and landslides. High-resolution observations of soil moisture and landscapefreeze/thaw status will lead to improved flood forecasts, especially for intermediateto large watersheds where most flood damage occurs. The use of SMAP data willhelp improve the communication and response of government agencies andemergency managers to a full range of emergencies and disasters. SMAP Early
Table 2 Drought and wildfires early adopters
Droughts and wildfires
Researcher Organization
* Jim Reardon and GaryCurcio
US Forest Service (USFS)
* Chris Funk, Amy McNallyand James Verdin
USGS & UC Santa Barbara
◊ Brian Wardlow and MarkSvoboda
Center for Advanced Land Management Technologies(CALMIT), National Drought Mitigation Center (NDMC)
◊ Uma Shankar The University of North Carolina at Chapel Hill—Institutefor the Environment
◊ Javier Fochesatto University of Alaska
◊ Amir AghaKouchak University of California, Irvine
◊ Renato D’Auria ALTEC S.p.A
◊ Rong Fu University of Texas; SMAP contact: Randy Koster
* Early Adopters selected in 2011–2012. ◊ Early Adopters selected from 2013 forward
Improving NASA’s Earth Observation Systems … 235

Adopter, Dr. Luca Brocca from the Research Institute for Geo-HydrologicalProtection in Italy is working with SMAP data to address flood prediction estimatesto better inform the Umbria Region Civil Protection Centre and the NationalDepartment of Civil Protection. There are hosts of ways in which research canenhance flood resilience. Understanding potential flood threats to help aid inplanning resources for preparedness and flood response is one way Dr. Brocca isfocused on improving. Dr. Brocca’s SMAP EA project aims is to understanding thecapability of using SMAP soil moisture for operational hydrological applicationsthroughout Europe. Specifically, his Early Adopter project uses soil moisture datafor (1) assimilation into continuous rainfall runoff modeling to demonstrate theimpact on runoff prediction with emphasis on extremes, and (2) to address theestimation of rainfall from soil moisture data. The work on data assimilation will beimplemented by the Umbria Region Civil Protection Centre for improving the earlywarning system for flood and landslide forecasting in Umbria, Italy (Fig. 6). Theuse of soil moisture data to correct and/or replace precipitation estimates are appliedto the entire Italian territory for the hydrometeorological and hydraulic riskassessment at the Italian Department of Civil Protection. Combining this applica-tions research with the operational user’s guide to improve communications of theflood risk to come will help people make better choice and take mitigating actions.
Fig. 6 Umbria Region SoilMoisture Network
236 V.M. Escobar et al.

As an Early Adopter, during the prelaunch stages of SMAP, Dr. Brocca workedwith the mission to apply simulated data as a “fit” for his early model runs and preparefor using real SMAP observations. Using proxy data (European soil moisture data setsSMOS, (Soil Moisture Ocean Salinity) Mission), and prelaunch preparations withSMAP, Dr. Brocca was able to quickly demonstrate how the ground observations inthe Umbria Region Soil Moisture Network correlated very well with the SMAP soilmoisture passive data through the real-time monitoring network operating (Fig. 7).ThroughDr. Brocca’swork, theUmbria RegionCivil ProtectionCentre will have a 6–8 month lead time for implementing the most up to date satellite data to inform floodplanning enabling better preparedness and community planning for early warningsystems that save lives and get people to safety faster. The SMAP project intends toassess how this Early Adopter research will potentially impact the decisions made byflood management and emergency response personnel at the Italian Department ofCivil Protection and provides that feedback to NASA.
Table 3 lists all SMAP Early Adopters working with SMAP data products toaddress flood and landslide applications.
Fig. 7 Soil Moisturecorrelation between SMAPand in situ data from UmbriaRegion Soil MoistureNetwork
Table 3 Flood and landslides
Floods and landslides
Researcher Organization
* Fiona Shaw Willis, Global Analytics
* Kashif Rashid and EmilyNiebuhr
UN World Food Programme
◊ Konstantine Georgakakos Hydrologic Research Center
◊ Luca Brocca Research Institute for Geo-Hydrological Protection, ItalianDept. of Civil Protection
◊ Jennifer Jacobs University of New Hampshire
◊ Huan Wu, Xiwu Zhan, andRobert F. Adler
University of Maryland, NASA Jet Propulsion Laboratory(JPL), and NOAA/NESDIS/STAR
◊ G. Robert Brakenridge Dartmouth Flood Observatory, University of Colorado
* Early Adopters selected in 2011–2012. ◊ Early Adopters selected from 2013 forward
Improving NASA’s Earth Observation Systems … 237

6.4 Agriculture Productivity
According to UN projections, the world’s population could reach 9.15 billion by2050, creating a 60 % increase in demand for food. Research on global agriculturalproductivity focuses on quantifying comparable productivity growth measures forcountries and regions worldwide. SMAP data will provide information on wateravailability and environmental stress for estimating plant productivity and potentialyield. The availability of direct observations of soil moisture status and the timingand extent of potential frost damage from SMAP will enable significant improve-ments in operational crop productivity and water stress information systems byproviding realistic soil moisture and freeze/thaw observations as inputs for agri-cultural prediction models. Improved models will provide crucial information fordecision-makers managing water and other resources, especially in data-sparseregions. Another Early Adopter for the SMAP mission is the USDA NationalAgricultural Statistics Service (NASS). The USDA publishes weekly national andstate-level reports of crop progress, crop conditions, and soil moisture during thegrowing season (Bolten et al. 2009). These reports require accurate, spatially andspectrally detailed, timely satellite data and products of soil moisture, inundation,drought, etc., for monitoring and assessment of agriculture. The USDA’s NationalAgricultural Statistics Service conducts hundreds of surveys every year and pre-pares reports covering virtually every aspect of U.S. agriculture. SMAP EarlyAdopters Zhengwei Yang and Rick Mueller efforts focus are to study the feasibilityof using SMAP mission results to support US national crop condition monitoringand other NASS operational data needs, such as crop yield modeling needs, toimprove NASS cropland soil moisture monitoring results in consistency, reliability,objectivity, and efficiency, and to reduce survey burden and cost.
Production and supplies of food and fiber, prices paid and received by farmers,farm labor and wages, farm finances, chemical use, and changes in the demo-graphics of US producers. NASS currently relies heavily on 4,000 “enumerators”around the country to produce its assessments of crop conditions and soil moisture.SMAP data is a gold mine of objective, reliable and accurate moisture data for theagency. It promises to sharpen NASS’s reporting and possibly replace part of thatenumerator network, which would be a huge cost savings to the agency, accordingto Rick Mueller, head of spatial analysis research at NASS. NASS is also preparingto use SMAP data to improve its state-by-state assessments of soil moisture releasedin USDA’s weekly crop progress reports.
Below in Table 4 are the Early Adopters working with SMAP data products toaddress agricultural productivity.
238 V.M. Escobar et al.

6.5 Human Health
Soil moisture has a direct effect on dust generation and air quality in desert and aridenvironments. Improved seasonal soil moisture forecasts using SMAP data helpinform early warning systems for famine in agriculture/food production, it willbenefit environmental risk models and early warning systems related to thepotential expansion of many disease vectors that are constrained by the timing andduration of seasonal frozen temperatures. Indirect benefits are realized, as SMAPdata will enable better weather forecasts that lead to improved predictions of heatstress and virus spreading rates. SMAP Early Adopter, Dr. Hosni Ghedira, Dr. ImenGherboudj, and Dr. Naseema from the Masdar Institute in the United Arab Emiratesare working on health applications using SMAP data. The team is quantifying theeffects of soil moisture on the total dust emission over the Middle East and NorthAfrica (MENA) region (as illustrated in Fig. 8) using a parameterization schemethat requires satellite/reanalysis data, such as soil moisture, wind speed, soil texture,grain size distribution, soil erodibility, aeolian surface roughness, and vegetationcover, all either measured or estimated. This Early Adopter research is expected toimprove the accuracy of estimating dust emissions. To date, Dr. Ghedira and his
Table 4 Agricultural productivity
Agricultural productivity
Researcher Organization
* Catherine Champagne Agriculture and Agri-Food Canada (AAFC)
* Zhengwei Yang and Rick Mueller USDA National Agricultural Statistical Service(NASS)
* Amor Ines and Stephen Zebiak International Research Institute for Climate andSociety (IRI) Columbia University
* Jingfeng Wang, Rafael Bras, ArisGeorgakakos and Husayn El Sharif
Georgia Institute of Technology (GT)
* Curt Reynolds USDA Foreign Agricultural Service (FAS)
◊ Alejandro Flores Boise State University
◊ Barbara S. Minsker University of Illinois and sponsored by JohnDeere Inc.
◊ Lynn J. Torak U.S. Geological Survey, Georgia Water ScienceCenter
◊ Kamal Labbassi Faculty of Sciences, MARSE, El Jadida,Morocco
◊ Shibendu Ray Mahalanobis National Crop Forecast Centre,New Delhi, India
◊ Niladri Gupta Tocklai Tea Research Institute
* Early Adopters selected in 2011–2012. ◊ Early Adopters selected from 2013 forward
Improving NASA’s Earth Observation Systems … 239

team have run an analysis of their research comparing maps from the EuropeanSpace Agency’s Soil Moisture and Ocean Salinity (SMOS) mission and theAdvanced Microwave Scanning Radiometer—Earth Observing System (AMSR-E).The simulated dust flux shows better correlation with the SMOS soil moistureestimates than the AMSR-E soil moisture estimates, especially in the seasonal scale.Results demonstrated that when the soil moisture increases by 10 %, the dust fluxesdecrease by 20–45 % over the Arabian Peninsula desert and less by 20 % overNorth Africa deserts. Information about increases or decreases dust fluxes can laterbe shared with public health organizations as an early warning of potential duststorms that could impact respiratory conditions. This Early Adopter research con-tinues to be modified as new information from SMAP becomes available.
Table 5 shows all SMAP Early Adopters focused on health applications.
Fig. 8 Dust storm in Abu Dhabi. Source http://forum.skyscraperpage.com
Table 5 Human health early adopters
Human health
Researcher Organization
* Hosni Ghedira Masdar Institute, UAE
* Kyle McDonald and Don Pierson City College of New York (CUNY) and CRESTInstitute, New York City Dept. of EnvironmentalProtection
◊ James Kitson, Andrew Walkerand Cameron Hamilton
Yorkshire Water, UK
◊ Luigi Renzullo Commonwealth Scientific and Industrial ResearchOrganisation (CSIRO), Australia
◊ David DuBois New Mexico State University
* Early Adopters selected in 2011–2012. ◊ Early Adopters selected from 2013 forward
240 V.M. Escobar et al.

6.6 National Security
National security includes mobility of soldiers and equipment through data scarceremote regions around theworld. Information on surface soil moisture and freeze/thawis critical to evaluating ground mobility of military vehicles through these areas. Theintegration of soilmoisture has been determined to be the singlemost critical parameterin state-of-the-groundmobility models Soil moisture and freeze/thaw data are key to abroad array of military and civil works capabilities including road and bridge building,dam and levee assessment/construction, mining, forestry, and tactical decision aiddesign and development. The application of SMAP data to unmanned vehicle appli-cations is essential to effective autonomous cross-country route selection as well asroute recommendations to the users of these vehicles.
SMAP Early Adopter, Mr. Derek Ward, Lockheed Martin, is working in col-laboration with all U.S. Department of Defense (DoD) Early Adopters to developcomprehensive feedback for worldwide route invariant mobility predictions forfriendly, neutral, and threat vehicles across the globe. The objective is to use SMAPdata paired with high-resolution soil type data to provide enhanced manned/unmanned ground vehicle mobility mapping. The group examined the use of SMAPdata for assessing the movement of a variety of manned and unmanned vehiclesoperating in a cross-country mode in the Pacific Rim. Preliminary result from thisDoD effort demonstrated success in using SMAP radar data (when available) overthe mapped terrain; areas that previously looked dark (saturated and un-maneuverable in terms of vehicle weight, tire pressure and soils strength)appeared bright and “useable” and able to sustain the weight, tire pressure ofspecified vehicles without risk of getting stuck (Fig. 9). This detailed informationwas only made possible through the use of the observed soil moisture contentmeasured by the SMAP radar paired with existing high resolution-soil maps. Sincethe loss of the SMAP radar, the passive product from SMAP (radiometer) is used toderive a radar analog by pairing the lower resolution radiometer soil moisturemeasurements with existing 1 km resolution soil type maps. Knowing the under-lying soil type/saturation behaviors, elevation data, reported local weather, as well asthe measured radiometer soil saturation value allows an inference to be made of thecurrent soil type saturation state at the native resolution of the soil map (1 km). Thismethodology scales easily to instrument resolution, and so enables a completeexploration of the instrument resolution space, while providing breakpoints anddesired specifications for future passive or active instruments. Direct comparison ofthe radar data to the radiometer/soil type high resolution-inference, is also possible.Vehicle specific mobility maps generated for this effort helped assess the value andpotential impact of this instrument, but more importantly provided NASA with amore detailed understanding of how such soil saturation data is used operationally—defining a path for DoD, NATO, ESA, and NASA to collaborate in the future withregards to instrument specification, design, and most importantly joint funding ondual use missions. Table 6 lists the Early Adopters working in the area of NationalSecurity.
Improving NASA’s Earth Observation Systems … 241

In addition to the application topics presented above, SMAP has Early Adoptersin areas of decision services such as technology-communication, software, andpolicy. These commercial applications will help improve technology used forcommunicating information with regards to farming, drought, emergency responseto weather, and carbon emissions. Table 7 lists SMAP Early Adopters in othergeneral application for communicating and expanding.
Table 6 National security early adopters
National security
Researcher Organization
* John Eylander and SusanFrankenstein
U.S. Army Engineer Research and DevelopmentCenter (ERDC) Cold Regions Research andEngineering Laboratory (CRREL)
* Gary McWilliams, George Mason, Li,Andrew Jones and Maria Stevens
Army Research Laboratory (ARL); U.S. ArmyEngineer Research and Development Center(ERDC) Geotechnical and Structures Laboratory(GSL); Naval Research Laboratory (NRL); andColorado State University (CSU)
◊ Kyle McDonald City College of New York (CUNY)
◊ Georg Heygster Institute of Environmental Physics, University ofBremen, Germany
◊ Lars Kaleschke Institute of Oceanography, University of Hamburg
◊ Jerry Wegiel Headquarters Air Force Weather Agency
◊ Matthew Arkett Canadian Ice Service
◊ Derek Ward Lockheed Martin Missiles and Fire Control
◊ David Keith U.S. National Ice Center, Naval ResearchLaboratory
◊ Christopher Jackson and FrankMonaldo
NOAA NESDIS Center for Satellite Applicationsand Research (STAR)
* Early Adopters selected in 2011–2012. ◊ Early Adopters selected from 2013 forward
Fig. 9 Canadian LeopardTank in Afghanistan, stuck intransit. Courtesy of Derekward
242 V.M. Escobar et al.
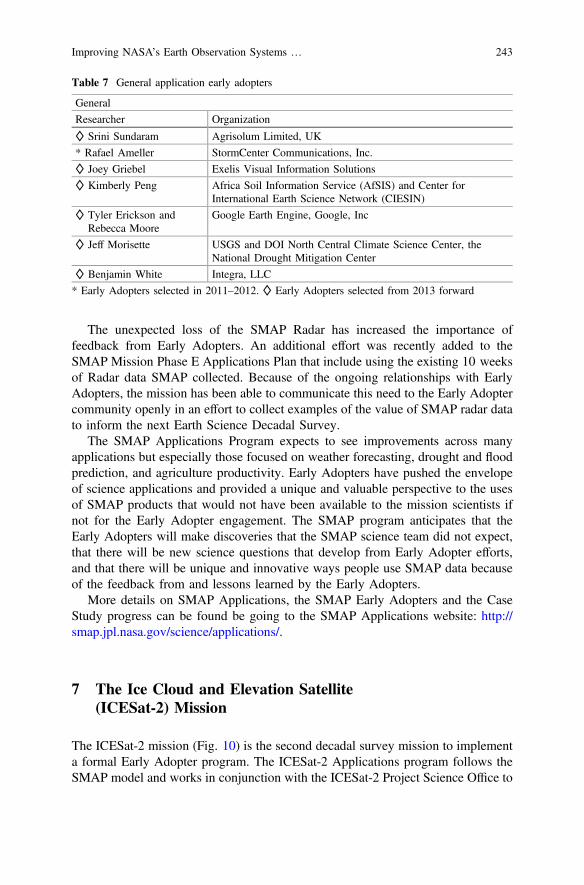
The unexpected loss of the SMAP Radar has increased the importance offeedback from Early Adopters. An additional effort was recently added to theSMAP Mission Phase E Applications Plan that include using the existing 10 weeksof Radar data SMAP collected. Because of the ongoing relationships with EarlyAdopters, the mission has been able to communicate this need to the Early Adoptercommunity openly in an effort to collect examples of the value of SMAP radar datato inform the next Earth Science Decadal Survey.
The SMAP Applications Program expects to see improvements across manyapplications but especially those focused on weather forecasting, drought and floodprediction, and agriculture productivity. Early Adopters have pushed the envelopeof science applications and provided a unique and valuable perspective to the usesof SMAP products that would not have been available to the mission scientists ifnot for the Early Adopter engagement. The SMAP program anticipates that theEarly Adopters will make discoveries that the SMAP science team did not expect,that there will be new science questions that develop from Early Adopter efforts,and that there will be unique and innovative ways people use SMAP data becauseof the feedback from and lessons learned by the Early Adopters.
More details on SMAP Applications, the SMAP Early Adopters and the CaseStudy progress can be found be going to the SMAP Applications website: http://smap.jpl.nasa.gov/science/applications/.
7 The Ice Cloud and Elevation Satellite(ICESat-2) Mission
The ICESat-2 mission (Fig. 10) is the second decadal survey mission to implementa formal Early Adopter program. The ICESat-2 Applications program follows theSMAP model and works in conjunction with the ICESat-2 Project Science Office to
Table 7 General application early adopters
General
Researcher Organization
◊ Srini Sundaram Agrisolum Limited, UK
* Rafael Ameller StormCenter Communications, Inc.
◊ Joey Griebel Exelis Visual Information Solutions
◊ Kimberly Peng Africa Soil Information Service (AfSIS) and Center forInternational Earth Science Network (CIESIN)
◊ Tyler Erickson andRebecca Moore
Google Earth Engine, Google, Inc
◊ Jeff Morisette USGS and DOI North Central Climate Science Center, theNational Drought Mitigation Center
◊ Benjamin White Integra, LLC
* Early Adopters selected in 2011–2012. ◊ Early Adopters selected from 2013 forward
Improving NASA’s Earth Observation Systems … 243

provide a framework for building a broad and well-defined user community duringthe prelaunch phases of the mission with the goal to maximize the use of the dataproducts after launch in 2017. The application program seeks to identify applica-tions related to the mission science objectives driving the instrument design—studies of ice sheets, sea ice, and vegetation—and those related to areas of interestto the mission for which its developing data products, but for which it does not havemandated science requirements: atmosphere, inland water, and ocean.
The ICESat-2 Applications Team seeks to achieve the greatest possible utility ofNASA’s Investment in Earth Science and observations by enabling its application topractical societal needs. The program is structured to address three overarchinggoals: (1) enhance applications research, (2) increase collaboration, and (3) accel-erate applications. The main objective for enhancing applications research is toshow the expected and actual value that the satellite data has for different end users.
In the prelaunch period of the mission, the applications program is identifyingand collaborating with a variety of organizations and individuals in order tounderstand and clarify their specific requirements and needs for ICESat-2-like data.The following are some of the questions that the program seeks to elucidate throughengagement with different stakeholders:
• WHY? What key decisions need to be addressed?• WHAT? What are current data sources and existing data requirements?• WHEN? What are latency needs?• HOW? How do we translate science to end use and decision support? What
methods are needed?
In 2013, the ICESat-2 mission accepted its first Early Adopter and continues toattract individuals and groups from all over the world who volunteer to test theutility of ICESat-2 for a specific decision process or operation. One year prior to itsexpected launch date of October 2017, the Early Adopter program now hosts 16early adopters who are providing insight into a range of potential uses for themission, as described below.
Fig. 10 ICESat-2 SatelliteImage Credit: Orbital; Earthimage illustrating AMSR-Esea ice; Image Credit NASAScientific VisualizationStudio
244 V.M. Escobar et al.

7.1 ICESat-2 Applications
ICESat-2 Early Adopters have identified various applications their research canpotentially inform with the use of the new satellite observations. The next sectiondescribes the Early Adopter research that supports the primary objectives of themission or those related to sea ice, ice sheets, and vegetation.
7.1.1 Sea Ice
ICESat-2 has a science objective to estimate sea ice thickness to examineice/ocean/atmosphere exchanges of energy, mass, and moisture. It will producemonthly maps of sea ice above-water height, or freeboard, for the Arctic andSouthern Oceans. Four Early Adopters (Table 8) are exploring the use of ICESat-2for prediction of the changing ice environment. The following snapshots of theirwork where developed from their Early Adopter proposals.
Investigators from the U.S. Naval Research Laboratory have proposed to useICESat-2 within the Navy’s Arctic Cap NOWCAST Forecast System to improveice edge forecasts in the northern hemisphere. Successful implementation isexpected will translate to improved quality of the U.S. Navy, NOAA, and NationalGuard’s National Ice Center’s ice analysis and tactical sea ice forecasts which are ofessence for navigation and arctic shipping (Fig. 11), as well as contribute toincreasing the public’s understanding of recent changing conditions in the Arctic(Posey et al. 2013).
Andrew Roberts and the researchers at the Naval Postgraduate School,University of Colorado at Boulder, and Los Alamos National Laboratory areworking together to develop an ICESat-2 emulator that can be used in earth systemmodels to sample simulated sea ice freeboard (sea ice above-water height) and snowcover. The emulator is expected to allow an apple-to-apple comparison of sea icestate statistics (e.g., ice concentration, ice thickness, and snow cover) with theupcoming ICESat-2 observations that would not be possible with the currentsampling regime used within the models. Successful implementation of the
Table 8 Sea ice application early adopters
Prediction of changing ice environment—sea ice
Early adopter PI(s) Organization
* Pamela G. Posey Naval Research Laboratory at John C. Stennis SpaceCenter
◊ Andrew Roberts, AlexandraJahn, Adrian Turner
Naval Postgraduate School, University of Colorado atBoulder & Los Alamos National Laboratory
◊ Andy Mahoney Geophysical Institute, University of Alaska Fairbanks
◊ Stephen Howell Environment Canada, Climate Research Division
* Early Adopters selected in 2013. ◊ Early Adopters selected from 2014 forward
Improving NASA’s Earth Observation Systems … 245
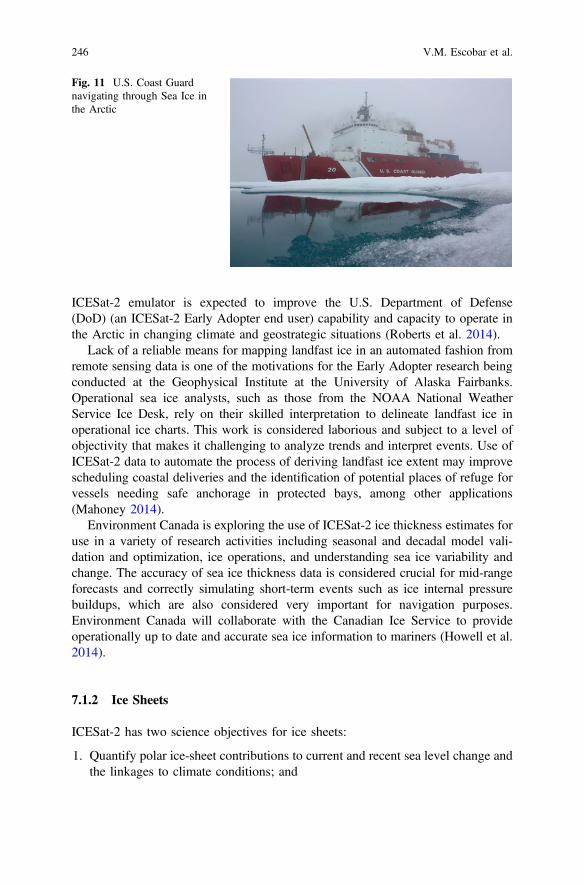
ICESat-2 emulator is expected to improve the U.S. Department of Defense(DoD) (an ICESat-2 Early Adopter end user) capability and capacity to operate inthe Arctic in changing climate and geostrategic situations (Roberts et al. 2014).
Lack of a reliable means for mapping landfast ice in an automated fashion fromremote sensing data is one of the motivations for the Early Adopter research beingconducted at the Geophysical Institute at the University of Alaska Fairbanks.Operational sea ice analysts, such as those from the NOAA National WeatherService Ice Desk, rely on their skilled interpretation to delineate landfast ice inoperational ice charts. This work is considered laborious and subject to a level ofobjectivity that makes it challenging to analyze trends and interpret events. Use ofICESat-2 data to automate the process of deriving landfast ice extent may improvescheduling coastal deliveries and the identification of potential places of refuge forvessels needing safe anchorage in protected bays, among other applications(Mahoney 2014).
Environment Canada is exploring the use of ICESat-2 ice thickness estimates foruse in a variety of research activities including seasonal and decadal model vali-dation and optimization, ice operations, and understanding sea ice variability andchange. The accuracy of sea ice thickness data is considered crucial for mid-rangeforecasts and correctly simulating short-term events such as ice internal pressurebuildups, which are also considered very important for navigation purposes.Environment Canada will collaborate with the Canadian Ice Service to provideoperationally up to date and accurate sea ice information to mariners (Howell et al.2014).
7.1.2 Ice Sheets
ICESat-2 has two science objectives for ice sheets:
1. Quantify polar ice-sheet contributions to current and recent sea level change andthe linkages to climate conditions; and
Fig. 11 U.S. Coast Guardnavigating through Sea Ice inthe Arctic
246 V.M. Escobar et al.

2. Quantify regional signatures of ice-sheet changes to assess mechanisms drivingthose changes and improve predictive ice sheet models.
Proposed Early Adopter research (Table 9) using ICESat-2 ice surface elevationproducts include work by the Florida Atlantic University (FAU) and the StateUniversity of New York (SUNY) at Buffalo. The following snapshots of their workwere developed from their Early Adopter proposals. Figure 12 shows a typicalpolar ice sheet.
Early Adopter research proposed by researchers at FAU involves using the newICESat-2 elevation information to compute a more precise past/current ice volumedischarge for automatically generating an improved Dynamic DEM (DDEM).The DDEM is expected will allow for improved monitoring of sudden increases insea level for coastal communities (Nagarajan et al. 2013).
Improved volcanic deformation monitoring and eruption forecasting are twomotivations for the current Early Adopter research being conducted at the SUNY atBuffalo. ICESat-2 observations may allow for the generation of high spatial andtemporal resolution Digital Elevation Models (DEMs) needed as model inputs forthe prediction of evolving pyroclastic density currents. These hot avalanches ofvolcanic rock and gas pose a hazard during ongoing eruptive crises when topo-graphic changes make in-filled valleys less able to contain them. Another focus ofthis research involves determining surface change histories related to subglacial
Table 9 Land ice application early adopters
Hazard monitoring and forecasting—land ice
Early adopter PI(s) Organization
* Greg Babonis State University of New York at Buffalo
* Sudhagar Nagarajan Florida Atlantic University
* Early Adopters selected in 2013. ◊ Early Adopters selected from 2014 forward
Fig. 12 Polar ice sheet.Image Credit: ChristyHansen, NASA, 2012
Improving NASA’s Earth Observation Systems … 247
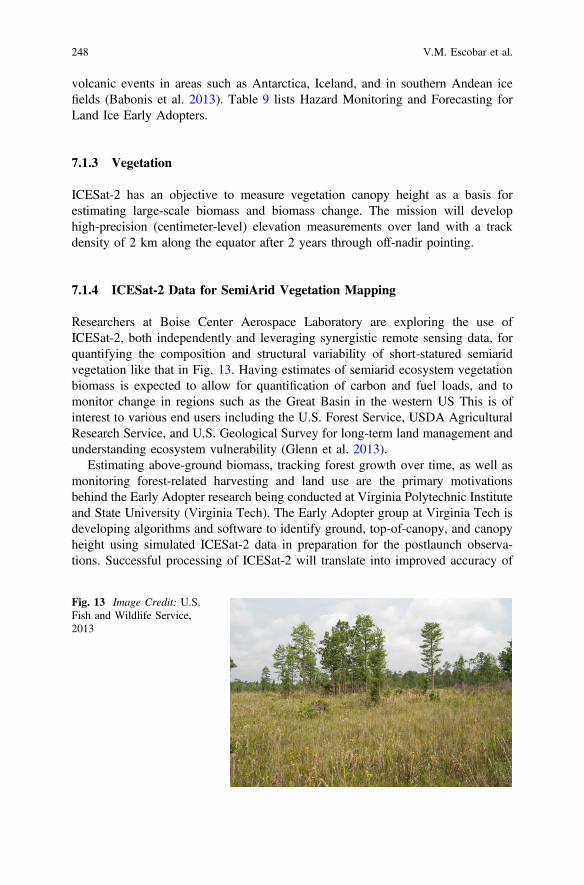
volcanic events in areas such as Antarctica, Iceland, and in southern Andean icefields (Babonis et al. 2013). Table 9 lists Hazard Monitoring and Forecasting forLand Ice Early Adopters.
7.1.3 Vegetation
ICESat-2 has an objective to measure vegetation canopy height as a basis forestimating large-scale biomass and biomass change. The mission will develophigh-precision (centimeter-level) elevation measurements over land with a trackdensity of 2 km along the equator after 2 years through off-nadir pointing.
7.1.4 ICESat-2 Data for SemiArid Vegetation Mapping
Researchers at Boise Center Aerospace Laboratory are exploring the use ofICESat-2, both independently and leveraging synergistic remote sensing data, forquantifying the composition and structural variability of short-statured semiaridvegetation like that in Fig. 13. Having estimates of semiarid ecosystem vegetationbiomass is expected to allow for quantification of carbon and fuel loads, and tomonitor change in regions such as the Great Basin in the western US This is ofinterest to various end users including the U.S. Forest Service, USDA AgriculturalResearch Service, and U.S. Geological Survey for long-term land management andunderstanding ecosystem vulnerability (Glenn et al. 2013).
Estimating above-ground biomass, tracking forest growth over time, as well asmonitoring forest-related harvesting and land use are the primary motivationsbehind the Early Adopter research being conducted at Virginia Polytechnic Instituteand State University (Virginia Tech). The Early Adopter group at Virginia Tech isdeveloping algorithms and software to identify ground, top-of-canopy, and canopyheight using simulated ICESat-2 data in preparation for the postlaunch observa-tions. Successful processing of ICESat-2 will translate into improved accuracy of
Fig. 13 Image Credit: U.S.Fish and Wildlife Service,2013
248 V.M. Escobar et al.

canopy height estimates for both of the government and private industry end usersidentified for this research: the USDA Forest Service and the American ForestManagement (Wynne et al. 2013).
Early Adopter research being conducted at the Hunter College of the CityUniversity of New York proposes using ICESat-2 data within an existing webservice architecture that already fuses GLAS data with Landsat-scale datasets ondemand. ICESat-2 is expected to provide additional vegetation structure informa-tion at high spatial resolution that may improve the accuracies of the currentvegetation products generated by a web service, including vegetation heights andmaps of vertical foliage profiles (Ni-Meister 2014).
Of expressed interest to the USDA Forest Service Pacific Northwest StationForest Inventory is the Early Adopter research proposed by the GeophysicalInstitute at the University of Alaska Fairbanks, which consists of analyzing theICESat-2 prelaunch data to differentiate high latitude vegetation architecture type,landscape gradients and stands, and improve classification in two scenarios: ArcticTundra and Boreal Forest. Successful post-launch processing of ICESat-2 data willbenefit the continuous monitoring of vast regions of responsibility by the USDAForest Service (Fochesatto and Huettmann 2015). Table 10 lists these EarlyAdopters, and Table 11 lists those for Inland Water and Atmosphere applications.
The table in Appendix 2 shows the work proposed by all of the ICESat-2 Earlyadopters. It provides an initial look at how the ICESat-2 observations can beintegrated into applications of benefit to society. An ongoing goal of theApplications program is to discover new applications for the mission and identifygaps in the communities engaged. The following table shows the Early Adoptersthat have proposed research supporting applications relating to inland water andatmosphere.
The full ICESat-2 Applications plan and strategy can be found on the ICESat-2applications website at http://icesat.gsfc.nasa.gov/icesat2/apps-ov.php.
Table 10 Vegetation application early adopters
Monitoring and planning for land management—vegetation
Early adopter PI(s) Organization
* Nancy F. Glenn Boise Center Aerospace Laboratory, Boise StateUniversity
* Lynn Abbott & Randy Wynne Virginia Polytechnic Institute and State University
* Wenge Ni-Meister Hunter College of The City University of New York
◊ G. Javier Fochesatto, FalkHuettmann
University of Alaska Fairbanks
* Early Adopters selected in 2013. ◊ Early Adopters selected from 2014 forward
Improving NASA’s Earth Observation Systems … 249

8 The Surface Water and OceanTopography (SWOT) Mission
NASA and the French space agency, CNES, with contributions from the CanadianSpace Agency (CSA) and United Kingdom Space Agency (UKSA) are developingnew wide swath altimetry technology that will measure the height of surface water(i.e., lakes, rivers, wetlands) and the global ocean with unprecedented spatialcoverage, temporal sampling, and spatial resolution compared to existing tech-nologies. The data and information products from the Surface Water and OceanTopography (SWOT) mission (Fig. 14), along with the airborne concept-validationproject, AirSWOT, will benefit society in two critical areas; freshwater on land, andthe oceans’ role in climate change. It will provide important observations of theamount and variability of water stored in global lakes, reservoirs, wetlands, andriver channels and will support derived estimates of river discharge. SWOT willalso provide critical information necessary for water management, particularly ininternational hydrological basins, and will be useful for monitoring the hydrologiccycle, flooding, and characterizing human impacts on a changing environment.The SWOT mission is in development and preparing for launch in 2020.
The applied science community is a key element in the success of the SWOTmission in demonstrating the high value of the science and information products foraddressing societal issues and needs. The SWOT applications framework includes anetwork of scientists, applications specialists, academics, and SWOT Projectmembers to promote applications research and engage a broad community ofpotential SWOT data users. A defined plan and a guide describing the SWOT EarlyAdopters program includes providing proxies for SWOT data, including sophisti-cated ocean and hydrology simulators, AirSWOT data sets, and other satellitedatasets as cornerstones for the program (Srinivasan et al. 2015).
Table 11 Inland water and atmosphere application early adopters
Hazard monitoring and forecasting—inland water and atmosphere
Early adopterPI(s)
Organization
* Lucia Mona Institute of Methodologies for Environmental Analysis of the NationalResearch Council of Italy
◊ BirgitPeterson
U.S. Geological Survey
◊ Charon Birkett Earth System Science Interdisciplinary Center, University of Maryland
◊ Guy J-P.Schumann
Joint Institute for Regional Earth System Science and Engineering,University of California
◊ Kuo-HsinTseng
Center for Space and Remote Sensing Research, National CentralUniversity, Taiwan
◊ Rodrigo C.D.Paiva
Hydraulic Research Institute at Federal University of Rio Grande do Sul,Brazil
* Early Adopters selected in 2013. ◊ Early Adopters selected from 2014 forward
250 V.M. Escobar et al.

The anticipated science and engineering advances that SWOT will provide maybe transformed into valuable services to decision-makers, operational users, andgoverning organizations focused on addressing global disaster risk reduction ini-tiatives and potential science-based mitigation activities for water resources chal-lenges of the future. A broad range of applications can inform inland and coastalmanagers and marine operators of terrestrial and oceanic phenomena relevant totheir operations.
SWOT will extend existing space-based altimetry, a mature remote sensingtechnique with over 23 years of continuous ocean observations from theJason-series of satellites and other international platforms. The suite of operatingaltimetry satellites provide highly accurate satellite-to-surface measurements,allowing for global and long-term monitoring of ocean circulation up to mesoscale(200 km and larger) processes. Many applications in scientific and operational areascan be realized. With continued altimetry observations, it has been possible toobserve phenomena occurring over long time periods; the rise in global mean sealevel and climatic events such as El Niño, La Niña, and the Pacific DecadalOscillation. Moreover, as data are made available within a few hours, the mea-surements can be used in ocean, meteorological, and climate forecast models.
The next section describes potential SWOT Early Adopters and the best-suitedEA application topics for SWOT data products.
Fig. 14 Artist rendition ofthe SWOT spacecraft Credit:NASA/JPL
Improving NASA’s Earth Observation Systems … 251

9 SWOT Early Adopters and Potential Applications
Satellite altimetry revolutionized the study of the global oceans over two decades.Altimetry measurements have also been applied to the study of river and lake waterlevels but are limited by the coarse resolution of the data. Key hydrologicalquestions on the storage of water on land and its discharge remain unanswered (Fuet al. 2009). The repeated high-resolution elevation measurements projected forSWOT would directly support science findings and operational uses by hydrolo-gists and oceanographers who are focused on applications in the areas of oceancirculation, coastal management, and water management (Fu et al. 2009). Asidefrom science investigators, applications users would include representatives fromthe U.S. National Oceanographic and Atmospheric Administration (NOAA), theNavy, the U.S. Geological Survey (USGS), and international weather/climateorganizations.
Similar to SMAP and ICESat-2, the primary goals of the SWOT applicationsprogram is to (1) promote the use of SWOT data products for the benefit of societyand (2) to educate the community of potential SWOT end users and decision-makers so that they understand the mission capabilities for their specific applica-tion. In order to achieve these objectives, NASA’s ASP, the mission internationalpartners, and the SWOT applications team will facilitate the development ofaccessible data and information products that may be used by end users, known asthe community of practice. From this community of users, SWOT Early Adoptersare identified. The SWOT Early Adopter Program is modeled after the successfulNASA SMAP program and aims to provide similar feedback mechanisms betweenthe mission scientists and the community. Once the mission is launched in 2020, theSWOT Early Adopters will contribute to the mission successes by demonstratingthe benefits of SWOT data to society (Srinivasan et al. 2012, 2014).
The SWOT science focus has traditionally divided the mission science objec-tives into the categories of hydrology and oceanography. The following are theprimary areas of application for the SWOT mission:
• Hydrology: developing world water problems, food security (flooding anddrought)
• Oceanography: coastal applications (circulation, impacts), marine operationssupport/open ocean issues
• Climate: regional capabilities, coastal and agricultural impacts
In addition to science focus areas, the operational applications and societalbenefits for the SWOT mission may include;
• Water management: reservoirs, floods, ecology,• International rivers: flood and drought management,• Insurance: hydrodynamics and flood risks,• Transportation: shipping, barges,• Agriculture: water management to support irrigation,• Energy: water availability in new regions,
252 V.M. Escobar et al.

• Spills and pollution: mapping of potential spill,• Ocean and coastal circulation models,• Climate studies: ocean circulation, heat content, regional sea level studies.
By the time of the SWOT launch in 2020, the applications team will haveengaged a core group of potential users capable of incorporating the measurementsand information products from SWOT in their operations. Methods for engagementand communication will be modeled after the predecessors, and then modified to fitthe specific needs of SWOT. Below are three potential activities that may becommon to SWOT application communities. Grouping these users into the activityareas identified can facilitate collaboration and the development of tools and modelsto better utilize potential SWOT data products (Srinivasan et al. 2013).
Forecasting applications may use improved models developed from potentialSWOT data to support forecasts of a quantity or system status, for example,reservoir storage next month or an ocean state in two weeks. These forecasts couldthen be used in decision-making contexts. Important considerations for this per-spective include; data latency, observations, and uncertainties used by other models.
• A potential Early Adopter for this application will be the U.S. National WeatherService (NWS) regional flood forecasting center. SWOT measurements will beused to update their system-wide storage and flow databases and to aid in opera-tions.Other applicationsmay include large-scale river basinmonitoring to facilitatesharing of water resources across international borders, and more accurate weatherand climate forecasting. Existing altimeter data can be assimilated into floodmodels for SWOT, and synergistic use of other satellite missions (Landsat, SMAP,SMOS, Sentinel satellites, other altimetry missions, etc.) can provide additionalvalue for water stage and flood extent (event-based) information.
Planning/Engineering applications would utilize the entire time series of SWOTobservations. Over the mission life, what range of quantities or system states (e.g.,minimum, maximum, and mean of given parameters) may be measured by SWOT.At a minimum, future systems should be designed to accommodate the observations.Can a model be developed or calibrated to reproduce the SWOT observations? If so,can it be used to simulate other potential scenarios or conditions? Other importantconsiderations for this perspective include; time series data, boundary conditions forother models, and new data for many locations around the globe.
• Applied uses in this activity area include improved flood modeling, potentiallyproviding regional and local planners, insurance organizations, and infrastruc-ture managers to mitigate hazards to life and property. FM Global and otherinsurance companies develop models to predict floods (e.g., 100-year floods)and will be among the first SWOT Early Adopters.
Improving NASA’s Earth Observation Systems … 253

Management applications are similar to forecasting in data latency but less focusedon modeling of future conditions and more on the current status of systems that willinfluence decision trees. Important considerations for this perspective include datalatency and observations that may be difficult to obtain from existing data.
• Applied uses in this area may include managing freshwater for urban, industrial,and agricultural consumption, reducing environmental risk, or contributing topublic policy decision-making processes. SWOT will provide water supplyservices and distribution companies and organizations requiring informationabout major reservoirs, rivers, and catchment areas, enabling better planning forfuture stocks. Water resources managers require constant updating of availablestorage, particularly when multiple reservoirs are involved. SWOT will be ableto facilitate the system integration of storage changes in these circumstances.Through existing relationships with the Water Management Bureaus inCalifornia, and other western U.S. states, SWOT will seek partnership fromwater managers to guide an early adopter effort.
The SWOT mission concept and data will provide completely new measure-ment, data management, and observational paradigms for the earth systems it willmeasure. In addition to the mission and applications objectives noted above, theSWOT data will be useful for a variety of other scientific and operational appli-cations as the mission science and data systems mature. Although it is impossible toforesee all the applications that could be made of the SWOT data, a number ofapplications are natural candidates for consideration
1. SWOT data can be complementary to the operational oceanographic altimetersto improve the understanding of global and regional sea level change.
2. SWOT data can potentially be used for mapping the thickness of floating sea iceby measuring sea ice freeboard to support marine operations and shipping.
3. SWOT can collect data over the tidally affected portions of rivers, and estuariesand wetlands, to help better understand the dynamics of freshwater/marineinteraction dynamics.
4. SWOT data can be used to improve Earth’s mean land/ice topography, itschanges and potential land-cover classifications.
5. SWOT could provide valuable information for modeling water circulation inlarge lakes such as the Caspian Sea, African lakes, Lake Baikal and LakeTiticaca, and the Great Lakes of North America.
These applications will bring synergistic value to the mission’s science(Rodriguez 2015). A SWOT survey to determine user needs (https://www.surveymonkey.com/r/SWOTusersurvey2015) has been designed to identify ways inwhich the proposed SWOT data and information products may be useful to
254 V.M. Escobar et al.

operational, private, institutional, and other individuals and organizations. Thesurvey helps identify the capabilities and areas of interest of potential SWOT datausers and guides the Early Adopter interests for the mission. The application pro-cess is described in the ‘SWOT Early Adopters Guide’ is accessible from swot.jpl.nasa.gov/applications. Applications will be accepted beginning in 2016.
10 Conclusion and Way Forward with Prospectsof the Early Adopter Program
The NASA Early Adopter program was started so the mission could learn moreabout their product applications. What evolved was a mechanism that providesfeedback and guidance to the utility and value of satellite data for all of NASA.NASA data have the potential to improve models, forecasts, and operationalactivities, and with the understanding and advocacy of Early Adopters, the sciencecan reach this potential faster and will less cost to the taxpayer. Applied researchactivities and the efforts from Early Adopters support NASA science designed toinform policy, climate, education, business, and decision-making activities thatimpact society. The Early Adopters provide a quantifiable impact to the uses ofsatellite data.
SMAP will complete its mission operations for Phase E in 2018 and provide aquantitative assessment of SMAP product value for weather, agriculture, flooding,drought, health, and national security. Additionally, the feedback from EarlyAdopters regarding the loss of the SMAP Radar will help inform the new decadalsurvey and provide quantitative examples of the long-standing need for new radarmission.
ICESat-2 continues to implement its Early Adopter Program and will soontransition into operations with approximately 20 early adopters working to inform avariety of applications. Quantitative research is lined up for operational sea iceforecasting for Arctic shipping, coastal deliveries, water resources management,monitoring of high water levels, weather hazards, sea level rise monitoring, fire fuelmapping, monitoring ecosystem, and biodiversity change over large regions (ArcticTundra, Boreal forest), and national defense environmental forecasting.
SWOT’s Early Adopter program begins in 2016. The Early Adopter targeted bySWOT will champion the first set of science application questions and beginexploring how SWOT data fit into the mission science objectives. Feedback fromthe Early Adopters will provide detailed accomplishments and challenges to the useof the products so the science team can help improve upon the development.
The Early Adopter program has spread across NASA missions and the 2017Decadal Survey includes a strong focus on applications. Formal and appropriately
Improving NASA’s Earth Observation Systems … 255

scaled EA programs will ultimately extend to future NASA EO programs impactingcapacity building programs like DEVELOP, SERVIR as well as smaller satellitemissions like the Earth Venture Initiatives (EVIs). EVIs, unlike decadal surveymissions (SMAP, ICESAT-2, and SWOT) operate under a shorter timeline forplanning the mission and launching into operation. EVI missions have two-yearprocess effort. EVIs like CYGNSS and ECOSTRESS are actively pursuing EarlyAdopter programs that selects two to three specific case studies scaled to leveragethe science objectives of the mission and demonstrate the impact of the sciencethrough a specific partner in a particular are of applications. Early Adopter pro-grams across all NASA will be modified to meet needs such as this and allowopportunity for user feedback for all NASA time lines. As NASA’s culture shifts tointegrate more applications into their mission life cycle, EVIs will also have thebenefit of integrating with stakeholders during the mission development.
Crosscutting themes between water, energy, food, and health requires there to bescientific and end user guidance. Integrating feedback on the utility of data productsproduces more streamlined and user-friendly products for science and stakeholders.The Early Adopter approach provides NASA insight on how science addresses thespecific needs of an ever changing society. Development of strategic partnershipswith industry or private sector entities should benefit both scientific and researchobjectives, as well as societal needs. Building upon the cooperative partneringdescribed in the few examples here, we are in a position to leverage the combinedobservational power of current and future Earth observing platforms and expand thesocietal applications of these assets. Already funded by the tax-paying public, theinnovations of new missions and maturing data and modeling systems can support arobust business model between scientific research communities and stakeholdersthat can support sustainable partnerships for moving into the next decade of sus-tained and experimental observations.
The Early Adopter Program demonstrates that there is a deep-rooted driveamong several communities to ensure that science touches lives. Early Adopterspresent science from a perspective we can all identify with and see the impacts ofsoil moisture, ice, and other data and information products in a context that makes itpersonal. Making science applications personal helps demonstrate that satellite dataprovide value to society (better health, efficiency, and cost savings). The clear valueof the Early Adopter program is further demonstrated by the decision to implementsimilar activities across other NASA missions (future missions as well as thosecurrently in operation).
Appendix 1
See Table 12.
256 V.M. Escobar et al.
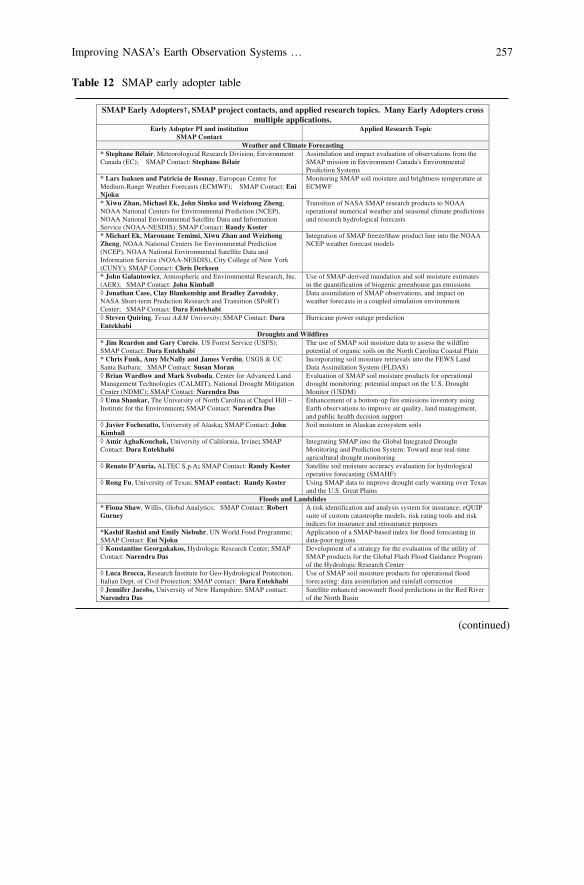
Table 12 SMAP early adopter table
SMAP Early Adopters†, SMAP project contacts, and applied research topics. Many Early Adopters crossmultiple applications.
Early Adopter PI and institutionSMAP Contact
Applied Research Topic
Weather and Climate Forecasting* Stephane Bélair, Meteorological Research Division, EnvironmentCanada (EC); SMAP Contact: Stephane Bélair
Assimilation and impact evaluation of observations from theSMAP mission in Environment Canada's EnvironmentalPrediction Systems
* Lars Isaksen and Patricia de Rosnay, European Centre forMedium-Range Weather Forecasts (ECMWF); SMAP Contact: EniNjoku
Monitoring SMAP soil moisture and brightness temperature atECMWF
* Xiwu Zhan, Michael Ek, John Simko and Weizhong Zheng,NOAA National Centers for Environmental Prediction (NCEP),NOAA National Environmental Satellite Data and InformationService (NOAA-NESDIS); SMAP Contact: Randy Koster
Transition of NASA SMAP research products to NOAAoperational numerical weather and seasonal climate predictionsand research hydrological forecasts
* Michael Ek, Marouane Temimi, Xiwu Zhan and WeizhongZheng, NOAA National Centers for Environmental Prediction(NCEP), NOAA National Environmental Satellite Data andInformation Service (NOAA-NESDIS), City College of New York(CUNY); SMAP Contact: Chris Derksen
Integration of SMAP freeze/thaw product line into the NOAANCEP weather forecast models
* John Galantowicz, Atmospheric and Environmental Research, Inc.(AER); SMAP Contact: John Kimball
Use of SMAP-derived inundation and soil moisture estimatesin the quantification of biogenic greenhouse gas emissions
◊ Jonathan Case, Clay Blankenship and Bradley Zavodsky,NASA Short-term Prediction Research and Transition (SPoRT)Center; SMAP Contact: Dara Entekhabi
Data assimilation of SMAP observations, and impact onweather forecasts in a coupled simulation environment
◊ Steven Quiring, Texas A&M University; SMAP Contact: DaraEntekhabi
Hurricane power outage prediction
Droughts and Wildfires* Jim Reardon and Gary Curcio, US Forest Service (USFS); SMAP Contact: Dara Entekhabi
The use of SMAP soil moisture data to assess the wildfirepotential of organic soils on the North Carolina Coastal Plain
* Chris Funk, Amy McNally and James Verdin, USGS & UCSanta Barbara; SMAP Contact: Susan Moran
Incorporating soil moisture retrievals into the FEWS LandData Assimilation System (FLDAS)
◊ Brian Wardlow and Mark Svoboda, Center for Advanced LandManagement Technologies (CALMIT), National Drought MitigationCenter (NDMC); SMAP Contact: Narendra Das
Evaluation of SMAP soil moisture products for operationaldrought monitoring: potential impact on the U.S. DroughtMonitor (USDM)
◊ Uma Shankar, The University of North Carolina at Chapel Hill –Institute for the Environment; SMAP Contact: Narendra Das
Enhancement of a bottom-up fire emissions inventory usingEarth observations to improve air quality, land management,and public health decision support
◊ Javier Fochesatto, University of Alaska; SMAP Contact: JohnKimball
Soil moisture in Alaskan ecosystem soils
◊ Amir AghaKouchak, University of California, Irvine; SMAPContact: Dara Entekhabi
Integrating SMAP into the Global Integrated DroughtMonitoring and Prediction System: Toward near real-timeagricultural drought monitoring
◊ Renato D’Auria, ALTEC S.p.A; SMAP Contact: Randy Koster Satellite soil moisture accuracy evaluation for hydrologicaloperative forecasting (SMAHF)
◊ Rong Fu, University of Texas; SMAP contact: Randy Koster Using SMAP data to improve drought early warning over Texasand the U.S. Great Plains
Floods and Landslides* Fiona Shaw, Willis, Global Analytics; SMAP Contact: RobertGurney
A risk identification and analysis system for insurance; eQUIPsuite of custom catastrophe models, risk rating tools and riskindices for insurance and reinsurance purposes
*Kashif Rashid and Emily Niebuhr, UN World Food Programme;SMAP Contact: Eni Njoku
Application of a SMAP-based index for flood forecasting indata-poor regions
◊ Konstantine Georgakakos, Hydrologic Research Center; SMAPContact: Narendra Das
Development of a strategy for the evaluation of the utility ofSMAP products for the Global Flash Flood Guidance Programof the Hydrologic Research Center
◊ Luca Brocca, Research Institute for Geo-Hydrological Protection,Italian Dept. of Civil Protection; SMAP contact: Dara Entekhabi
Use of SMAP soil moisture products for operational floodforecasting: data assimilation and rainfall correction
◊ Jennifer Jacobs, University of New Hampshire; SMAP contact:Narendra Das
Satellite enhanced snowmelt flood predictions in the Red Riverof the North Basin
(continued)
Improving NASA’s Earth Observation Systems … 257

◊ Huan Wu, Xiwu Zhan, and Robert F. Adler, University ofMaryland, NASA Jet Propulsion Laboratory (JPL), andNOAA/NESDIS/STAR; SMAP contact: Seungbum Kim
Improving the Global Flood Monitoring System (GFMS) withGPM precipitation, SMAP soil moisture and surface watermask information
◊ G. Robert Brakenridge, Dartmouth Flood Observatory, Universityof Colorado; SMAP contact: Seungbum Kim
Use of SMAP data for early detection of inland flooding
Agricultural Productivity* Catherine Champagne, Agriculture and Agri-Food Canada(AAFC);SMAP Contact: Stephane Bélair
Soil moisture monitoring in Canada
* Zhengwei Yang and Rick Mueller, USDA National AgriculturalStatistical Service (NASS); SMAP Contact: Wade Crow
US National cropland soil moisture monitoring using SMAP
* Amor Ines and Stephen Zebiak, International Research Institutefor Climate and Society (IRI) Columbia University; SMAP Contact:Narendra Das
SMAP for crop forecasting and food security early warningapplications
* Jingfeng Wang, Rafael Bras, Aris Georgakakos and Husayn ElSharif, Georgia Institute of Technology (GT); SMAP Contact: DaraEntekhabi
Application of SMAP observations in modelingenergy/water/carbon cycles and its impact on weather andclimatic predictions
* Curt Reynolds, USDA Foreign Agricultural Service (FAS); SMAP Contact: Wade Crow
Enhancing USDA’s global crop production monitoring systemusing SMAP soil moisture products
◊ Alejandro Flores, Boise State University; SMAP Contact: DaraEntekhabi
Data fusion and assimilation to improve applications ofpredictive ecohydrologic models in managed rangeland andforest ecosystems
◊ Barbara S. Minsker, University of Illinois and sponsored by JohnDeere Inc.; SMAP Contact: Wade Crow
Comprehensive, large-scale agriculture and hydrologic datasynthesis
◊ Lynn J. Torak, U.S. Geological Survey, Georgia Water ScienceCenter; SMAP contact: Dara Entekhabi and Vanessa Escobar
Downscaling SMAP soil-moisture data to improve cropproduction and efficient use of energy and water resources andto assess water availability in the Apalachicola-Chattahoochee-Flint River basin
◊ Kamal Labbassi, Faculty of Sciences, MARSE, El Jadida, Morocco;SMAP contact: Susan Moran
Hydrologic models and remote sensing data to assessindicators for irrigation performance monitoring in Morocco
◊ Shibendu Ray, Mahalanobis National Crop Forecast Centre, NewDelhi, India; SMAP contact: Narendra Das
Evaluation of SMAP soil moisture products for droughtassessment under National Agricultural Drought Assessmentand Monitoring System (NADAMS) of India
◊ Niladri Gupta, Tocklai Tea Research Institute; SMAP contact: Susan Moran
Crop management advisory service using SMAP in teagrowing regions of northeast India
Human Health* Hosni Ghedira, Masdar Institute, UAE; SMAP Contact: DaraEntekhabi
Estimating and mapping the extent of Saharan dust emissionsusing SMAP-derived soil moisture data.
* Kyle McDonald and Don Pierson, City College of New York(CUNY) and CREST Institute, New York City Dept. ofEnvironmental Protection; SMAP Contact: Erika Podest
Application of SMAP freeze/thaw and soil moisture productsfor supporting management of New York City's potable watersupply
◊ James Kitson, Andrew Walker and Cameron Hamilton,Yorkshire Water, UK; SMAP Contact: Robert Gurney
Using SMAP L-2 soil moisture data for added value to theunderstanding of land management practices and its impact onwater quality
◊ Luigi Renzullo, Commonwealth Scientific and Industrial ResearchOrganisation (CSIRO), Australia; SMAP Contact: Jeff Walker
Preparing the Australian Water Resources Assessment(AWRA) system for the assimilation of SMAP data
◊ David DuBois, New Mexico State University; SMAP Contact:Dara Entekhabi
Tracking and assessment of dust storm events in SouthwesternUS
National Security* John Eylander and Susan Frankenstein, U.S. Army EngineerResearch and Development Center (ERDC) Cold Regions Researchand Engineering Laboratory (CRREL); SMAP Contact: Steven Chan
U. S. Army ERDC SMAP adoption for USACE civil andmilitary tactical support
* Gary McWilliams, George Mason, Li Li, Andrew Jones andMaria Stevens, Army Research Laboratory (ARL); U.S. ArmyEngineer Research and Development Center (ERDC) Geotechnicaland Structures Laboratory (GSL); Naval Research Laboratory (NRL);and Colorado State University (CSU); SMAP Contact: Steven Chan
Exploitation of SMAP data for Army and Marine Corpsmobility assessment
◊ Kyle McDonald, City College of New York (CUNY); SMAPContact: Simon Yueh
Integration of SMAP datasets with the NRL environmentalmodel for operational characterization of cryosphere processesacross the north polar land-ocean domain
Table 12 (continued)
(continued)
258 V.M. Escobar et al.

Appendix 2
See Table 13.
◊ Geor g Heygster , Institute of Environmental Physics, University ofBremen, Germany; SMAP Contact: Simon Yueh
SMAP-Ice: Use of SMAP observations for sea ice remotesensing
◊ La r s Kaleschke, Institute of Oceanography, University ofHamburg; SMAP Contact: Simon Yueh
SMOS to SMAP migration for cryosphere and climateapplication
◊ Je r ry Wegiel, Headquarters Air Force Weather Agency; SMAPcontact: Peggy O’Neill
Optimization of NASA’s Land Information System (LIS) atHQ Air Force Weather Agency (AFWA)
◊ Matthew Arkett, Canadian Ice Service; SMAP contact: Simon Yueh
Pre-launch evaluation of SMAP L-band SAR data foroperational sea ice monitoring
◊ Derek Ward, Lockheed Martin Missiles and Fire Control; SMAPcontact: Steven Cha n
Manned and unmanned vehicle ground mobility predictionsand route selection
◊ David Keith, U.S. National Ice Center, Naval Research Laboratory;SMAP contact: Simon Yueh
NIC cryospheric investigations in support of NASA ROSESarctic sea ice applications of geodetic imaging
◊ Chr istopher Jackson and Fr ank Monaldo, NOAA NESDISCenter for Satellite Applications and Research (STAR); SMAPContact: Simon Yueh
Ocean surface wind and sea ice measurements derived fromSMAP SAR data
General◊ Sr ini Sunda ram, Agrisolum Limited, UK; SMAP Contact: Rober tGur ney
Application of SMAP data products in Agrisolum - A bigdatasocial agritech platform
* Ra fael Ameller, StormCenter Communications, Inc.; SMAPContact: Randy Koster
SMAP for enhanced decision making
◊ Joey Gr iebel, Exelis Visual Information Solutions; SMAPContact: Bar ry Weiss
Utilization of SMAP Products in ENVI, IDL and SARscape -Products L1 to L4
◊ Kimber ly Peng, Africa Soil Information Service (AfSIS) andCenter for International Earth Science Network (CIESIN); SMAPcontact: Er ic Wood
Input generator for digital soil mapping
◊ Tyler Er ickson and Rebecca Moore, Google Earth Engine, Google,Inc.; SMAP contact: Narendra Das and Amanda Leon
Making SMAP data products available in the Google EarthEngine Analysis Platform
◊ Je ff Mor isette, USGS and DOI North Central Climate ScienceCenter, the National Drought Mitigation Center; SMAP Contact:Joh n Kimball
Evaluation of SMAP data for incorporation into the USGS’sSoftware for Assisted Habitat Modeling
◊ Benjamin White, Integra, LLC; SMAP Contact: Joh n Kimball Application of SMAP L4_C and related products to REDD+monitoring reporting and validation (MRV)
NOTES:† Early Adopters are defined as those groups and individuals who have a direct or clearly defined need for SMAP-like soil moistureor freeze/thaw data, and who are planning to apply their own resources (funding, personnel, facilities, etc) to demonstrate the utilityof SMAP data for their particular system or model. The goal is to accelerate the use of SMAP products after launch by engaging inapplied research that would enable integration of SMAP data in applications. This research would promote understanding of howSMAP data products can be scaled and integrated into policy, business and management activities to improve decision- makingefforts.* Early Adopters selected in 2011-2012 agreed to engage in pre-launch research that will enable integration of SMAP data after launchin their application, complete the project with quantitative metrics prior to launch, and take a lead role in SMAP applications research,meetings, workshops, and related activities.◊ Early Adopters selected from 2013 forward agreed to engage in pre-launch research that will enable integration of SMAP data afterlaunch in their application, and to provide feedback to the SMAP project upon request concerning their experience in using the data.
Table 12 (continued)
Improving NASA’s Earth Observation Systems … 259

Tab
le13
ICESat-2earlyadop
tertable
Early
adop
ter
Science
them
eRegions
Early
adop
tertitle
End
user(s)
App
lications
PamelaG.Po
sey,
Naval
Research
Laboratory
SDT/Project
Office
Partner:Sinead
L.
Farrell
SeaIce
FullArctic
Region
Use
ofICESat-2data
asa
ValidationSo
urce
fortheU.S.
Navy’sIceFo
recastingMod
els
U.S.Navy,
POC:
Bruce
McK
enzie,
Naval
Oceanog
raph
icOffice
U.S.National/N
aval
IceCenter,PO
C:
LTJG
David
Keith
Navigation;
Arctic
shipping
Nancy
Glenn
,Boise
Center
Aerospace
Laboratory
(BCAL)
SDT/Project
Office
Partner:Amy
Neuenschw
ander
Vegetation
Semiaridregion
s;western
U.S.
Improv
edTerrestrial
Carbo
nEstim
ates
with
Semiarid
Ecosystem
Structure
USD
A(U
SFo
rest
Serviceand
AgriculturalResearch
Service,
POCDr.
StuartHardegree)
DOI(BLM,PO
C:
Ann
eHalford;
includ
ingtheGreat
Basin
Landscape
Con
servation
Coo
perativ
e(LCC),
andUSG
S,PO
C:Dr.
MattGermino)
DoD
(Charles
BaunIdaho
Arm
yNationalGuard)
Regionalpartners
(Great
Basin
Research
andManagem
ent
PartnershipandJoint
FireSciences
Prog
ram)
Lon
g-term
land
managem
ent.Use
estim
ates
ofabov
egroun
dbiom
ass
toqu
antifycarbon
,fuel
loads,andmon
itor
change
insemiarid
region
s
(con
tinued)
260 V.M. Escobar et al.

Tab
le13
(con
tinued)
Early
adop
ter
Science
them
eRegions
Early
adop
tertitle
End
user(s)
App
lications
Lucia
Mon
a,NationalResearch
Cou
ncilof
Italy—
Institu
teof
Metho
dologies
for
Env
iron
mental
Analysis
(CNR-IMAA)
SDT/Project
Office
Partner:Steve
Palm
Atm
osph
eric
Sciences
PolarRegion
APR
IL—
Aerosol
optical
Prop
ertiesin
polarRegions
with
ICESat-2Lidar
NASA
,po
licymakers
atlocal(Polar
region
s)andglob
al(clim
ate
change)scale
Examples:Aerocom
,WMO
Clim
ate;
Airqu
ality
(effectson
health
and
environm
ent);
VolcanicHazards
GregBabon
is,
SUNY
atBuffalo
SDT/Project
Office
Partner:Alex
Gardn
er
IceSh
eets;
Solid
Earth
Subg
lacial
volcanic
eventsin
areassuch
asAntarctica,
Iceland,
andin
southern
And
eanicefields
App
lications
ofICESat-2in
Volcanicand
Geohazards-relatedresearch
Volcano
Observatories,Vhu
buser
grou
p,UBGMFC
(Geoph
ysical
Mass
Flow
Group
)
Volcanichazard
mitigatio
n,mon
itoring
,andforecasting.
Lyn
nAbb
ott,
Virginia
Polytechnic
Institu
teandState
University
SDT/Project
Office
Partner:So
rin
Popescu
Vegetation
Not
specified
(global)
Detectio
nof
grou
ndandtopof
cano
pyusingsimulated
ICESat-2lid
ardata
American
Forest
Managem
ent,PO
C:
John
Welker;USD
AFo
restService,
POC:
John
Cou
lston
Mon
itorforest-related
harvestin
gandland
use
(con
tinued)
Improving NASA’s Earth Observation Systems … 261

Tab
le13
(con
tinued)
Early
adop
ter
Science
them
eRegions
Early
adop
tertitle
End
user(s)
App
lications
Sudh
agar
Nagarajan,Florida
Atlantic
University
SDT/Project
Office
Partner:Bea
Csatho
IceSh
eets
Not
specified
(global)
Incorporationof
simulated
ICESat-2(M
ABEL)data
toincrease
thetim
eseries
and
accuracy
ofGreenland
/AntarcticaIce
SheetD
DEM
(Dyn
amicDEM)
Centerfor
Env
iron
mental
Stud
ies,PO
C:Dr.
Leonard
Berry
(works
with
local,natio
nal,
andinternational
government
organizatio
nson
sea
levelrise)
Sealevelrise
mon
itoring
/forecastin
g
And
yMahon
ey,
Geoph
ysical
Institu
te,
University
ofAlaskaFairbank
sSD
T/Project
Office
Partner:Sinead
L.
Farrell,Ron
Kwok
SeaIce
Alaska’sNorthernCoastlin
e;Arctic
Coastal
System
Repeataltim
etry
ofcoastalsea
iceto
map
land
fastseaice
extent
forresearch
and
operationalseaiceanalysts
NOAA
National
Weather
ServiceIce
Desk,
POC(s):
James
Nelson,
Meteorologistin
Charge,
(jam
es.a.
nelson
@no
aa.gov
)Rebecca
Heim,
IceFo
recaster,
(Rebecca.
Heim@no
aa.gov
)
Operatio
nalice
charts/navigation;
coastaldeliv
eries;
mon
itoring
habitatof
marinewild
life;
offsho
reoilandgas
indu
stry
roads;
travel/transportatio
n;
CharonBirkett,
ESS
IC,University
ofMaryland
SDT/Project
Office
Partner:Mike
Jasinski
Hyd
rology
Global(requirement:
observations
oflakes/reservoirs
atleastdo
wn
to10
km2target
sizes)
The
App
licationof
Altimetry
DatafortheOperatio
nalW
ater
LevelMon
itoring
ofLakes
and
Reservo
irs
USD
A/FAS(POC:Dr.
CurtReyno
lds,Office
ofGlobalAnalysis)
Hyd
rologicaldrou
ght;
agricultu
raldrou
ght;
mon
itoring
ofhigh
water
(floo
d)levels;
mon
itoring
ofcrop
cond
ition
and
prod
uctio
n(con
tinued)
262 V.M. Escobar et al.

Tab
le13
(con
tinued)
Early
adop
ter
Science
them
eRegions
Early
adop
tertitle
End
user(s)
App
lications
Guy
Schu
mann,
JointInstitu
tefor
RegionalEarth
System
Science&
Eng
ineering
,University
ofCalifornia,
Los
Ang
eles
(UCLA)
SDT/Project
Office
Partner:Mike
Jasinski
Hyd
rology
CaliforniaBay
Delta;Niger
Inland
Delta
Assessing
thevalueof
the
ATL13
inland
water
level
prod
uctfortheGlobalFloo
dPartnership
GlobalFloo
dPartnership(G
FP)
(POCs:Dr.Florian
Papp
enberger;Global
Floo
dServiceand
Too
lbox
Pillar;Dr.
Guy
Schu
mann,
mem
berof
theGlobal
Floo
dPartnership)
Predictio
nand
managingof
flood
disaster
impactsand
glob
alfloo
drisk
Kuo
-HsinTseng
,SU
NY
atBuffalo
SDT/Project
Office
Partner:Mike
Jasinski
Hyd
rology
Ganges-Brahm
aputra-M
eghn
a(G
BM)riverbasincovering
India,
Nepal,China,Bhu
tan,
andBangladesh
Using
ICESat-2Groun
dand
Water
Level
Elevatio
nData
towards
Establishing
aSeason
alandFlashFloo
dEarly
Warning
System
inthe
lower
Ganges-Brahm
aputra-M
eghn
aRiver
Basin
Institu
teof
Water
Mod
ellin
g(POC:
Zahirul
Haque
Khan),
BangladeshWater
Develop
mentBoard
(POC:Eng
r.Zahirul
Islam),Bangladesh
Inland
WaterTranspo
rtAutho
rity
(POC:Md.
Mahbu
bAlam)
Water
resource
managem
ent;
observationof
freshw
ater
storage
change
And
rew
Rob
erts,
Naval
Postgraduate
Scho
olAlexand
raJahn
,University
ofColoradoat
Bou
lder
SeaIce
CentralArctic
analysisdo
main
AnICESat-2em
ulator
forthe
Los
Alamos
seaicemod
el(CICE)to
evaluate
DOE,
NCAR
andDOD
seaice
predictio
nsfortheArctic
U.S.Departm
entof
Energy(POC:
ElizabethHun
ke);
NationalCenterfor
Atm
osph
eric
Research
(POC:Marika
Holland
,Jenn
ifer
Kay)
Seaiceforecasting;
natio
naldefense
environm
ental
forecasting;
coordinateddisaster
respon
se:oilspill
mitigatio
n,field
(con
tinued)
Improving NASA’s Earth Observation Systems … 263

Tab
le13
(con
tinued)
Early
adop
ter
Science
them
eRegions
Early
adop
tertitle
End
user(s)
App
lications
AdrianTurner,Los
Alamos
National
Laboratory
SDT/Project
Office
Partner:Ron
Kwok
U.S.Departm
entof
Defense
(POC:
Wieslaw
Maslowski,
RuthPreller)
University
ofColorado
Bou
lder
(POC:John
Cassano
)
campaigns;im
prov
edclim
ateprojectio
nsat
alllatitud
es
StephenHow
ell,
Env
iron
ment
Canada
SDT/Project
Office
Partner:Ron
Kwok
SeaIce
CanadianArctic
Use
ofICESat-2Datafor
Env
iron
mentCanada
observationalapplications
and
predictio
nsystem
s
Clim
ateResearch
Division(POC:
How
ell)
Canadian
MeteorologicalCentre
(POC:Belair)
CanadianIceService
(POC:Arkett)
CanadianCentrefor
Clim
ateMod
ellin
gand
Analysis(POC:
Derksen)
Clim
atedata
records;
operationalseaice
forecastingforArctic
shipping
;seaiceinfo
formariners;weather
hazards;
preventio
n/mitigatio
nof
atmosph
eric
catastroph
es
Wenge
Ni-Meister,
Hun
terCollege,
The
City
University
ofNew
York,
SDT/Project
Office
Partner:So
rin
Popescu
Vegetation
Global
Mapping
Vegetationwith
On-Dem
andFu
sion
ofRem
ote
SensingDataforPo
tentialU
seof
U.S.Fo
restService
InventoriesandFire
Fuel
Estim
ates
U.S.Fo
restService
Forestinventoriesand
fire
fuel
mapping
(con
tinued)
264 V.M. Escobar et al.

Tab
le13
(con
tinued)
Early
adop
ter
Science
them
eRegions
Early
adop
tertitle
End
user(s)
App
lications
BirgitPeterson
,USG
SEarth
Resou
rces
Observatio
nand
ScienceCenter
SDT/Project
Office
Partner:Amy
Neuenschw
ander
Vegetation
UnitedStates
Evaluationof
ICESat-2
ATLASdataforwild
land
fuels
assessments
U.S.Fo
restService’s
Wild
land
Fire
Assessm
entSy
stem
(POCW.MattJolly
,mjolly
@fs.fe
d.us,
ProjectManager)
Wild
fire
decision
s;fire
behavior
mod
eling
variables
G.Javier
Fochesatto,
Geoph
ysical
Institu
teUniversity
ofAlaska
Fairbank
sFalk
Huettm
ann,
Institu
teof
Arctic
Biology
,University
ofAlaskaFairbank
sSD
T/Project
Office
Partner:Lori
Magruder
Vegetation
Arctic
Tun
draandBoreal
Forest;Interior
Alaska
Using
ICESat-2prelaunchdata
inhigh
latitud
eterrestrial
ecosystemsto
allow
for
continuo
usmon
itoring
ofbo
real
forestsandArctic
tund
ra
USD
AFo
rest
ServicePN
WResearchStation
(POC:Dr.Hans-Erik
And
ersen)
LandManagem
entand
mon
itoring
over
large
region
s(A
rctic
Tun
dra,
BorealFo
rest)
Improving NASA’s Earth Observation Systems … 265

References
Babonis, G., Ogburn, S., Calder, E., &Valentine, G. (2013). Applications of ICESat-2 in Volcanicand Geohazards-related Research. Proposal to the ICESat-2 Early Adopter program. SUNY atBuffalo, Buffalo, NY.
Bolten, J., Crow, W., Zhan, X., Reynolds, C., & Jackson, T. (2009). Assimilation of asatellite-based soil moisture product into a two-layer water balance model for a global cropproduction decision support system. In S. K. Park & L. Xu (Eds.), Data Assimilation forAtmospheric, Oceanic and Hydrologic Applications (pp. 449–464). Berlin: Springer.
Brown, M., & Escobar, V. (2014). Assessment of soil moisture data requirements by the potentialSMAP data user community: Review of SMAP mission user community. IEEE JournalSelected Topics in Applied Earth Observations and Remote Sensing, 7, 277–283. doi:10.1109/JSTARS.2013.2261473.
Brown, M., Moran, S., Escobar, V., & Entekhabi, D. (2012). Assessment of soil moisture datarequirements by the potential SMAP data user community: Review of SMAP mission usercommunity. IEEE Journal Selected Topics in Applied Earth Observations and Remote Sensing,7, 277–283. doi:10.1109/JSTARS.2013.2261473.
Escobar, V., & Arias, S. (2015). Early adopters prepare the way to use ICESat-2 data. The EarthObserver, 27, 31–35.
Fochesatto, G., & Huettmann, F. (2015). Using ICESat-2 prelaunch data in high latitude terrestrialecosystems to allow for continuous monitoring of boreal forests and Arctic tundra. [Proposal tothe ICESat-2 Early Adopter program]. University of Alaska Fairbanks, Fairbanks, AK.
Fu, L., Alsdorf, D., Rodriguez, E., Morrow, R., Mognard, N., Lambin, J., et al. (2009). The SWOT(Surface Water and Ocean Topography) Mission: Spaceborne Radar Interferometry forOceanographic and Hydrological Applications, White paper submitted to OceanObs’09Conference, March 2009.
Glenn, N., Shrestha, R., Spaete, L., Li, A., Mitchell, J. (2013). Improved Terrestrial CarbonEstimates with Semiarid Ecosystem Structure. [Proposal to the ICESat-2 Early Adopterprogram]. Boise State University, Boise, Idaho.
Howell, S., Derksen, C., Belair, S., Smith, G., Lemieux, J., Buehner, M., et al. (2014). Use ofICESat-2 Data for Environment Canada observational applications and prediction systems.Proposal to the ICESat-2 Early Adopter program. Environment Canada, Ontario, Canada.
Mahoney, A. (2014). Repeat Altimetry of coastal sea ice to map landfast sea ice extent for researchand operational sea ice analysts. [Proposal to the ICESat-2 Early Adopter program].Geophysical Institute, University of Alaska Fairbanks, Fairbanks, AK.
Moran, M., Doorn, B., Escobar, V., & Brown, M. (2014). Connecting NASA science andengineering with earth science applications. Journal of Hydrometeorology, 16, 473–483.
Moran, S., Doorn, B., Escobar, E., & Brown, M. (2015). Connecting NASA science andengineering with earth science applications. Journal of Hydrometeorology, 16, 473–483.doi:10.1175/JHM-D-14-0093.1.
Nagarajan, S., Csatho, B., & Schenk, T. (2013). Generation of Greenlad and Antarctic DynamicDEMs (DDEM). Proposal to the ICESat-2 Early Adopter program. Florida Atlantic University,Boca Raton, FL.
National Research Council. (2007). Earth Science and Applications from Space: NationalImperatives for the Next Decade and Beyond (456 pp). National Academies Press.
Ni-Meister, W. (2014). Mapping Vegetation with On-Demand Fusion of Remote Sensing Data forPotential Use of U.S. Forest Service Inventories and Fire Fuel Estimates. [Proposal to theICESat-2 Early Adopter program]. New York, NY.
Posey, P., Li L., Gaiser P., Allard R., Hebert, D., Wallcraft, A., et al. (2013). Use of ICESat-2 dataas a Validation Source for the U.S. Navy’s Ice Forecasting. Proposal to the ICESat-2 EarlyAdopter program. Naval Research Laboratory, Stennis Space Center, MS.
266 V.M. Escobar et al.

Roberts, A., Jahn, A., & Turner, A. (2014). An ICESat-2 emulator for the Los Alamos sea icemodel (CICE) to evaluate DOE, NCAR, and DOD sea ice predictions for the Arctic. [Proposalto the ICESat-2 Early Adopter program]. Naval Postgraduate School, Monterey, CA.
Rodriguez, E. (2015). SWOT Mission Science Requirements Document, JPL D-61923, http://swot.jpl.nasa.gov/files/swot/SRD_021215.pdf.
Srinivasan, M., Peterson, C., Andral, A., & Dejus, M. (2012). SWOT Early Adopters Guide, http://swot.jpl.nasa.gov/files/swot/SWOT%20Early%20Adopters%20Guide1.pdf.
Srinivasan, M., Peterson, C., & Callahan, P. (2013). Mission Applications Support at NASA:SWOT, Proceedings of the Symposium on 20 Years of Progress in Radar Altimetry, Venice,Italy, 24–29 Sep 2012. Noordwijk, The Netherlands, ESA Publications Division, EuropeanSpace Agency, Paper-2494283.
Srinivasan, M., Peterson, C., Andral, A., Dejus, M., Hossain, F., Cretaux, J.-F., et al. (2014).SWOT Applications Plan, JPL Document ID; D-79129, Ver. 1.0, Sept. 2014, http://swot.jpl.nasa.gov/files/swot/Final_SWOT%20Applications%20Plan_D79129.pdf.
Srinivasan,M., Andral, A.,Dejus,M.,Hossain, F., Peterson, C., Beighley, E., et al. (2015). Engagingthe Applications Community of the future Surface Water and Ocean Topography (SWOT)Mission. International Archives of the Photogrammetry, Remote Sensing and Spatial InformationSciences, XL-7/W3, 1497–1504. doi:10.5194/isprsarchives-XL-7-W3-1497-2015, http://www.int-arch-photogramm-remote-sens-spatial-inf-sci.net/XL-7-W3/1497/2015/isprsarchives-XL-7-W3-1497-2015.html.
Wynne, R., Thomas, V., Abbott, L., & Awadallah, M. (2013). Detection of ground and top ofcanopy using simulated ICESat-2 lidar data. [Proposal to the ICESat-2 Early Adopterprogram]. Virginia Polytechnic Institute and State University, Blacksburg, VA.
Improving NASA’s Earth Observation Systems … 267

Application of Satellite Radar AltimeterData in Operational Flood Forecastingof Bangladesh
Amirul Hossain and Md. Arifuzzaman Bhuiyan
Abstract This study demonstrates the applicability of satellite-based radaraltimeter flood forecasting in downstream flood prone areas of Bangladesh withoutthe use of data assimilation. The joint NASA-French satellite mission JASON-2provides water level elevation data over the Ganges-Brahmaputra-Meghna(GBM) basin at no cost to end users. A nearly linear relationship was establishedbetween these upstream water elevation observations with the downstream waterlevels in Bangladesh especially in the Ganges and Brahmaputra basins. Using thisremotely sensed data as boundary inflow in the current flood forecasting modeldeveloped by the Flood Forecasting and Warning Center (FFWC; see FFWC 2014)within the Bangladesh Water Development Board (BWDB), it is possible to gen-erate a 5 day or more flood forecast in some downstream locations with consid-erable accuracy. This approach was validated using remotely sensed JASON-2observations from 2014 and comparing the resulting flood forecast with recordedground measurements of river height. This study highlights the potential of usingJASON-2 data for flood forecasting on international rivers like in Bangladeshwhere upstream hydrologic observations are otherwise unavailable.
Keywords Altimeter � JASON-2 � Flood forecast
1 Introduction
Located on the downstream section of the GBM (Ganges-Brahmaputra-Meghna)basin, Bangladesh is vulnerable to floods due to intense rainfall during monsoonseason, improper land use practices, and poor national water policy. Limitedsharing of hydro-meteorological data from transboundary countries makes flood
A. Hossain (&) � Md. Arifuzzaman BhuiyanFlood Forecasting and Warning Center, Dhaka, Bangladeshe-mail: [email protected]
Md. Arifuzzaman Bhuiyane-mail: [email protected]
© Springer International Publishing Switzerland 2016F. Hossain (ed.), Earth Science Satellite Applications,Springer Remote Sensing/Photogrammetry, DOI 10.1007/978-3-319-33438-7_10
269

forecasting a complex process. Currently, model-based flood forecasts are gener-ated and circulated to the people nationally by the Flood Forecasting and WarningCenter (FFWC) of the Bangladesh Water Development Board (BWDB) under theMinistry of Water Resources (MoWR). The current model-based system has dif-ficulties increasing the forecast lead time while maintaining a high level of confi-dence. Recently, remote sensing technology has received widespread acceptabilityin flood management and forecasting, especially for countries where there aretransboundary issues like Bangladesh (Islam and Sado 2000; Kaku and Held 2013and Islam et al. 2009). Some recent studies on Bangladesh monsoon flood haveproved that a combination of satellite estimates of rainfall and modeling can sat-isfyingly forecast flooding downstream in Bangladesh (Hossain et al. 2014a; ADB2014; Siddique-E-Akbor et al. 2014) with reasonable low cost.
Radar altimetry satellites (JASON-1, JASON-2, ALTIKA) are the latest additionof NASA which are capable of measuring river flow discharge and water levelelevation of wide rivers with considerable accuracy. JASON-2 is a jointNASA-French Satellite mission that measures water levels and makes the datapublicly accessible within 24 h (Hossain et al. 2014a, b and NASA website). Nearreal-time data on JASON-2 is made available at a publicly accessible ftp site at ftp://avisoftp.cnes.fr/. Four JASON-2 virtual stations (192, 079, 014 and 155; seeTable 1 and Fig. 1) on the upstream (outside Bangladesh) region of the GangesRiver and three virtual stations (166, 053 and 242; see Table 1 and Fig. 1) on theupstream region of the Brahmaputra River have the potential to provide data fordownstream flow forecasting of Bangladesh. Here, ‘virtual stations’ are defined asthe specific location on the river that are overpassed by JASON-2 (see Fig. 1 forspecific location and numbering of virtual stations). Table 1 shows the locationsand distance of JASON-2 pass points from the border of Bangladesh.
On the Brahmaputra River, two virtual stations (VS 166 and VS 53) are locatednear Tejpur and one station (VS 242) lies near Guwahati. On the Ganges River, onestation (VS 155) is near the Farraka Barrage area and three stations (VS 192, 79 and14) are found near Varanasi, Patna, and Chappara. Depending on the proximity to
Table 1 JASON-2 pass locations and distance from Bangladesh border
JASON-2pass name
JASON-2 passlocation
Approximate distance from border ofBangladesh (KM)
Brahmaputra VS 166 Lat = 26.215;Lon = 91.026
130
VS 53 Lat = 26.764;Lon = 93.48
385
VS 242 Lat = 26.725;Lon = 93.618
395
Ganges VS 155 Lat = 25.289;Lon = 87.112
100
VS 14 Lat = 25.51;Lon = 85.689
250
270 A. Hossain and Md. Arifuzzaman Bhuiyan
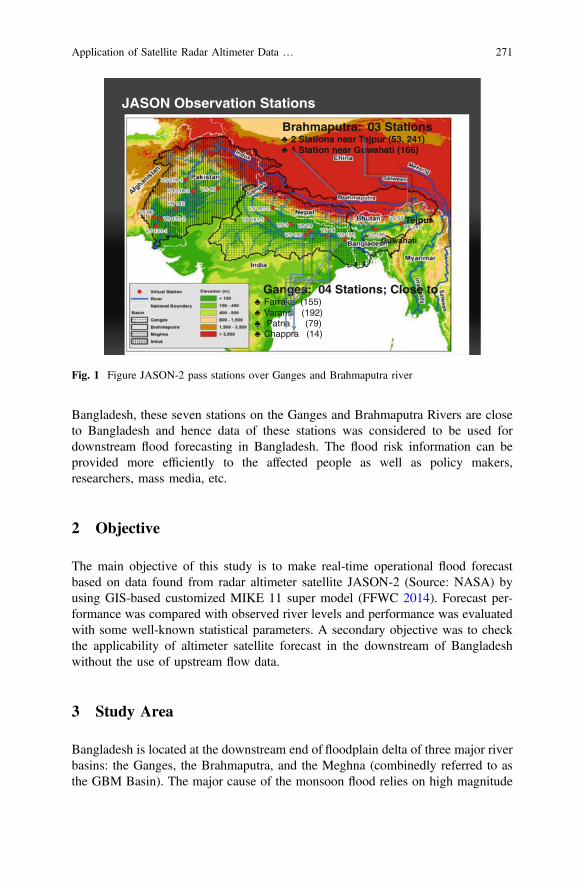
Bangladesh, these seven stations on the Ganges and Brahmaputra Rivers are closeto Bangladesh and hence data of these stations was considered to be used fordownstream flood forecasting in Bangladesh. The flood risk information can beprovided more efficiently to the affected people as well as policy makers,researchers, mass media, etc.
2 Objective
The main objective of this study is to make real-time operational flood forecastbased on data found from radar altimeter satellite JASON-2 (Source: NASA) byusing GIS-based customized MIKE 11 super model (FFWC 2014). Forecast per-formance was compared with observed river levels and performance was evaluatedwith some well-known statistical parameters. A secondary objective was to checkthe applicability of altimeter satellite forecast in the downstream of Bangladeshwithout the use of upstream flow data.
3 Study Area
Bangladesh is located at the downstream end of floodplain delta of three major riverbasins: the Ganges, the Brahmaputra, and the Meghna (combinedly referred to asthe GBM Basin). The major cause of the monsoon flood relies on high magnitude
Tejpur
Guwahati
Brahmaputra: 03 Stations2 Stations near Tejpur (53, 241)1 Station near Guwahati (166)
Ganges: 04 Stations; Close toFarraka (155)Varansi (192)Patna (79)
Chappra (14)
JASON Observation Stations
Fig. 1 Figure JASON-2 pass stations over Ganges and Brahmaputra river
Application of Satellite Radar Altimeter Data … 271

of the inflow from upper GBM catchment associated with the intense rainfall insidethe country during monsoon period, i.e., from June to October.
Based on the availability of JASON-2 data, a major part of monsoon flood pronearea of Bangladesh situated on the lower end of the Ganges and Brahmaputra basinwas chosen as a study area in this research. Simulation was done over the selectedarea and forecasted water levels at nine locations along the Brahmaputra–Jamuna,Ganges and Padma Rivers were found. Figure 2 shows the entire study area and
Fig. 2 Study area and locations of 9 flood forecast stations
272 A. Hossain and Md. Arifuzzaman Bhuiyan
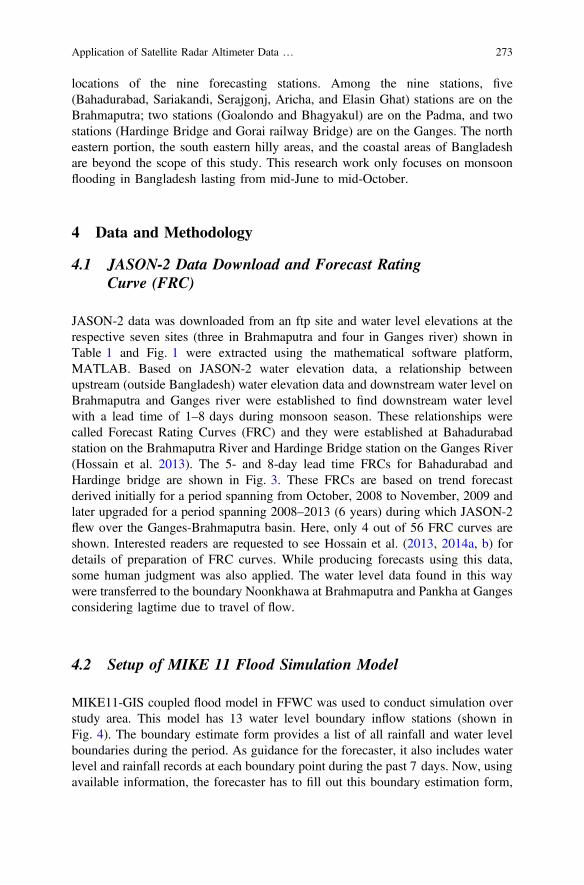
locations of the nine forecasting stations. Among the nine stations, five(Bahadurabad, Sariakandi, Serajgonj, Aricha, and Elasin Ghat) stations are on theBrahmaputra; two stations (Goalondo and Bhagyakul) are on the Padma, and twostations (Hardinge Bridge and Gorai railway Bridge) are on the Ganges. The northeastern portion, the south eastern hilly areas, and the coastal areas of Bangladeshare beyond the scope of this study. This research work only focuses on monsoonflooding in Bangladesh lasting from mid-June to mid-October.
4 Data and Methodology
4.1 JASON-2 Data Download and Forecast RatingCurve (FRC)
JASON-2 data was downloaded from an ftp site and water level elevations at therespective seven sites (three in Brahmaputra and four in Ganges river) shown inTable 1 and Fig. 1 were extracted using the mathematical software platform,MATLAB. Based on JASON-2 water elevation data, a relationship betweenupstream (outside Bangladesh) water elevation data and downstream water level onBrahmaputra and Ganges river were established to find downstream water levelwith a lead time of 1–8 days during monsoon season. These relationships werecalled Forecast Rating Curves (FRC) and they were established at Bahadurabadstation on the Brahmaputra River and Hardinge Bridge station on the Ganges River(Hossain et al. 2013). The 5- and 8-day lead time FRCs for Bahadurabad andHardinge bridge are shown in Fig. 3. These FRCs are based on trend forecastderived initially for a period spanning from October, 2008 to November, 2009 andlater upgraded for a period spanning 2008–2013 (6 years) during which JASON-2flew over the Ganges-Brahmaputra basin. Here, only 4 out of 56 FRC curves areshown. Interested readers are requested to see Hossain et al. (2013, 2014a, b) fordetails of preparation of FRC curves. While producing forecasts using this data,some human judgment was also applied. The water level data found in this waywere transferred to the boundary Noonkhawa at Brahmaputra and Pankha at Gangesconsidering lagtime due to travel of flow.
4.2 Setup of MIKE 11 Flood Simulation Model
MIKE11-GIS coupled flood model in FFWC was used to conduct simulation overstudy area. This model has 13 water level boundary inflow stations (shown inFig. 4). The boundary estimate form provides a list of all rainfall and water levelboundaries during the period. As guidance for the forecaster, it also includes waterlevel and rainfall records at each boundary point during the past 7 days. Now, usingavailable information, the forecaster has to fill out this boundary estimation form,
Application of Satellite Radar Altimeter Data … 273

y = 0.9467x - 20.222R² = 0.7999
y = 0.9176x - 18.947R² = 0.5134
12
14
16
18
20
22
34 36 38 40 42 44
Bah
adur
abad
WL
, mB
ahad
urab
ad W
L, m
JASON 2 VS 166
Bahadurabad Correlation Plot for JASON 2 VS 166 against Low(a)
(b)
(c)
(d)
and High Flow (9d)
Low Flow High FlowLow Flow Trend High Flow Trend
y = 0.9923x - 57.131R² = 0.7751
y = 0.7201x - 36.358R² = 0.5006
12
14
16
18
20
22
71 73 75 77 79
JASON 2 VS 242
Bahadurabad Correlation Plot for JASON 2 VS 242 againstLow and High Flow (12d)
Low Flow High Flow
Low Flow Trend High Flow Trend
y = 1.4867x - 68.484R² = 0.4789
y = 0.5909x - 19.954R² = 0.671
2
7
12
49 50 51 52 53 54 55 56 57 58JASON 2 VS 079
Hardinge Bridge Correlation Plot for JASON 2 VS 079 against Low and High Flow (9d)
Low Flow High FlowLow Flow Trend High Flow Trend
y = 0.655x - 10.271R² = 0.2456
y = 0.3731x + 0.3631R² = 0.3556
2
4
6
8
10
12
14
16
24 26 28 30 32 34 36
Har
ding
e B
ridg
e W
L, m
Har
ding
e B
ridg
e W
L, m
JASON 2 VS 155
Hardinge Bridge Correlation Plot for JASON 2 VS 155 against Lowand High Flow (12d)
Low Flow High FlowLow Flow Trend High Flow Trend
Fig. 3 Forecast Rating Curve (FRC) of Bahadurabad (a and b) and Hardinge Bridge Stations(c and d) for 2 particular days. a 5 day lead. b 8 day lead. c 5 day lead. d 8 day lead
274 A. Hossain and Md. Arifuzzaman Bhuiyan

i.e., he has to make rainfall and water level estimates during the forecast period(next desired hours). In this research, boundary estimates were provided usingJASON-2 data. About 90 % of flood flow into Bangladesh during monsoon comesthrough two mighty rivers—Brahmaputra and Ganges (Immerzeel et al. 2010).Hence, estimation of boundary inflow/discharge through these two rivers are ofgreat importance in simulation of flood flow and inundation for Bangladesh.Noonkhawa (8) and Pankha (13) are two most important boundary stations inMIKE11-GIS super model.
Estimation of boundary inflow of Noonkhawa and Pankha are already describedabove. Other 11 out of 13 boundary inflow were estimated based on the water leveltrend of Brahmaputra and Ganges found in Bahadurabad and Hardinge bridge fromFRC curve. The 13 boundary locations and station names are shown in Fig. 4. Aftersetting all boundary inflow, MIKE11 model simulation was performed. Dailysimulation was conducted from mid-July to mid-October and forecasted water levelof 8-day lead time at nine locations were found. In this research, only monsoonflood was focused.
4.3 Evaluation of Forecast
Forecasted water levels with 8-day lead time at nine locations were compared withobserved water level during the period of mid-July to mid-October. Root MeanSquare Error (RMSE) and Mean Absolute Error (MAE) were calculated for the ninespecific stations for the months of August and September only. RMSE and MAE
Fig. 4 Boundary locations of MIKE11 super model
Application of Satellite Radar Altimeter Data … 275

were also calculated for peak flood condition. It is to be mentioned here that in 2014monsoon, there were two major floods in Bangladesh; one in August and the otherin September. The performance of simulation results were checked for these twomonths as well as two peak flood conditions.
5 Results and Discussions On
5.1 Simplification in Forecasting Techniques
The present flood forecasting system is based on real time and forecastedhydrometeorlogical data (water level, rainfall, etc.) that need to be collected fromdifferent sources like BWDB hydrological network, Bangladesh MeteorologicalDepartment, Indian Meteorological Department, Central Water Commission India,etc., and feed to model after proper check. Here, boundary estimation depends onsome assumptions which are not always reliable. On the other hand, new method,i.e., JASON-2 data-based forecasting system simplifies the entire procedure byreducing data gathering from different sources. The only usable data is JASON-2water height data that can be freely downloaded from internet and after some simpleprocessing, it can be directly fed to the model. Also, this eliminates the uncertaintyin boundary estimation by using forecast rating curves (FRC) that were developedwith observed time series water level data collected from BWDB.
5.2 Comparison of Flood Hydrograph for 8-Day Lead Time
JASON-2 data-based monsoon flood forecasts using customized MIKE11-GISmodel results were compared with the observed value as a first basis of evaluation.The simulated water level results of 8-day lead time for nine stations were com-pared with the observed water levels and are shown in Fig. 5.
2014 experienced two major periods of flooding, one in August and one inSeptember. At the Bahadurabad, Aricha, Serajgonj and Sariakandi stations, duringAugust, forecasted water level trends that show good agreement with the observedexcept during the initial rising period. In September, during the second spell offlood, there was also a good match initially for those stations but during the risingphase, the forecasts overestimated the 1, 2, and 3 days lead time. For the Hardingebridge, Goalondo, and Bhagyakul stations, simulated hydrographs are similar toobserved hydrographs during August, but overestimation was observed for leadtimes of 1, 2, and 3 days during September.
276 A. Hossain and Md. Arifuzzaman Bhuiyan

0
20
40
60
80
100
120
140
16017.5
18
18.5
19
19.5
20
8/4 8/9 8/14 8/19 8/24 8/29
Wat
er L
evel
(mPW
D)
Date
Date
Date
Date
Comparision of Forecast Hydrograph at Bahadurabad for August
Comparision of Forecast Hydrograph at Bahadurabad for Sepetember
Comparision of Forecast Hydrograph at Aricha for Sepetember
RF
Obs_WL
Da y 1
Da y 2
Da y 3
Da y 4
Da y 5
Da y 6
Da y 7
Da y 8
0
20
40
60
80
100
120
140
160
18017
17.5
18
18.5
19
19.5
20
9/12 9/14 9/16 9/18 9/20 9/22 9/24 9/26 9/28 9/30
Wa
ter
Lev
el(m
PW
D)
RF
Obs_WL
Day 1
Day 2
Day 3
Day 4
Day 5
Day 6
Day 7
Day 8
0
10
20
30
40
50
60
706
6.5
7
7.5
8
8.5
9
9.5
10
10.5
8/4 8/9 8/14 8/19 8/24 8/29
Wa
ter
Lev
el(m
PW
D)
RF
Obs_WL
Da y 1
Da y 2
Da y 3
Da y 4
Da y 5
Da y 6
Da y 7
Da y 8
0
10
20
30
40
50
607.2
7.4
7.6
7.8
8
8.2
8.4
8.6
9/12 9/14 9/16 9/18 9/20 9/22 9/24 9/26 9/28 9/30
Wa
ter
Lev
el( m
PW
D)
RF
Obs_WL
Da y 1
Da y 2
Da y 3
Da y 4
Da y 5
Da y 6
Da y 7
Da y 8
Comparision of Forecast Hydrograph at Aricha for August
Fig. 5 Observed and simulated hydrographs for 1–8 day lead time
Application of Satellite Radar Altimeter Data … 277

4
4.5
5
5.5
6
6.5
7
8/4 8/9 8/14 8/19 8/24 8/29
Wat
er L
evel
(mPW
D)
Wat
er L
evel
(mPW
D)
Wat
er L
evel
(mPW
D)
Wat
er L
evel
(mPW
D)
Date
Forecast Hydrograph at Bhagyakul for AugustObs_WL
Da y 1
Da y 2
Da y 3
Da y 4
Da y 5
Da y 6
Da y 7
Da y 8
0510152025303540454
4.5
5
5.5
6
9/12 9/14 9/16 9/18 9/20 9/22 9/24 9/26 9/28 9/30
Date
Comparision of Forecast Hydrograph at Bhagyakul for September
RF
Obs_WL
Day 1
Day 2
Day 3
Day 4
Day 5
Day 6
Day 7
Day 8
0
10
20
30
40
50
60
706
6.5
7
7.5
8
8.5
9
9.5
8/4 8/9 8/14 8/19 8/24 8/29
Date
Comparision of Forecast Hydrograph at Goalondo for August
Comparision of Forecast Hydrograph at Goalondo for September
RF
Obs_WL
Day 1
Day 2
Day 3
Day 4
Day 5
Day 6
Day 7
Day 8
0
20
40
606.5
7
7.5
8
9/12 9/14 9/16 9/18 9/20 9/22 9/24 9/26 9/28 9/30
Da te
RF
Obs_WL
Day 1
Day 2
Day 3
Day 4
Day 5
Day 6
Day 7
Day 8
Fig. 5 (continued)
278 A. Hossain and Md. Arifuzzaman Bhuiyan

0
10
20
30
40
50
60
70
80
90
1006
7
8
9
10
11
12
13
8/4 8/9 8/14 8/19 8/24 8/29
Wat
er L
evel
(mPW
D)
Wat
er L
evel
(mPW
D)
Wat
er L
evel
(mPW
D)
Wat
er L
evel
(mPW
D)
Date
Date
Date
Date
Comparision of Forecast Hydrograph at Gorai-RB for August
Comparision of Forecast Hydrograph at Gorai-RB for September
Comparision of Forecast Hydrograph at hardinge Bridge for September
Comparision of Forecast Hydrograph at hardinge Bridge for August
RF
Obs_WL
Day 1
Day 2
Day 3
Day 4
Day 5
Day 6
Day 7
Day 8
RF
Obs_WL
Day 1
Day 2
Day 3
Day 4
Day 5
Day 6
Day 7
Day 8
0
10
20
30
40
50
60
70
80
90
1009
9.5
10
10.5
11
9/12 9/14 9/16 9/18 9/20 9/22 9/24 9/26 9/28 9/30
0
10
20
30
40
50
60
70
80
90
1009
9.5
10
10.5
11
11.5
12
12.5
13
13.5
14
14.5
8/4 8/9 8/14 8/19 8/24 8/29
0
10
20
30
40
50
60
70
80
90
1009
9.5
10
10.5
11
11.5
12
12.5
13
9/12 9/14 9/16 9/18 9/20 9/22 9/24 9/26 9/28 9/30
RF
Obs_WL
Day 1
Day 2
Day 3
Day 4
Day 5
Day 6
Day 7
Day 8
RF
Obs_WL
Day 1
Day 2
Day 3
Day 4
Day 5
Day 6
Day 7
Day 8
Fig. 5 (continued)
Application of Satellite Radar Altimeter Data … 279

0
10
20
30
40
50
6014
14.5
15
15.5
16
16.5
17
17.5
18
8/4 8/9 8/14 8/19 8/24 8/29
Wat
er L
evel
(mPW
D)
Wat
er L
evel
(mPW
D)
Wat
er L
evel
(mPW
D)
Wat
er L
evel
(mPW
D)
Da te
Comparision of Forecast Hydrograph at Sariakandi for August
Comparision of Forecast Hydrograph at Sariakandi for September
Comparision of Forecast Hydrograph at Sarajganj for August
Comparision of Forecast Hydrograph at Sarajganj for September
RF
Obs_WL
Day 1
Day 2
Day 3
Day 4
Day 5
Day 6
Day 7
Day 8
0
10
20
30
40
50
60
70
80
90
10014
14.5
15
15.5
16
16.5
17
9/12 9/14 9/16 9/18 9/20 9/22 9/24 9/26 9/28 9/30
Date
RF
Obs_WLDay 1
Day 2
Day 3
Day 4
Day 5
Day 6
0
20
40
60
80
100
120
140
160
180
20011.5
12
12.5
13
13.5
14
8/4 8/9 8/14 8/19 8/24 8/29Da te
Series10Obs_WLDay 1
Day 2
Day 3
Day 4
Day 5
Day 6
0
20
40
60
80
100
1209
9.5
10
10.5
11
11.5
12
12.5
13
13.5
9/12 9/14 9/16 9/18 9/20 9/22 9/24 9/26 9/28 9/30
Da te
RF
Obs_WL
Day 1
Day 2
Day 3
Day 4
Day 5
Day 6
Day 7
Day 8
Fig. 5 (continued)
280 A. Hossain and Md. Arifuzzaman Bhuiyan

5.3 Comparison of RMSE, Mean Value Error
The Root Mean Square Error (RMSE) and Mean Absolute Error (MAE) values forlead time 1–8 days were calculated for nine stations. This is shown in Fig. 6.
RMSE values for nine stations are shown in Table 2a. The values range from0.32–0.96 m. RMSE values are found higher for the stations along theBrahmaputra-Jamuna River (Bahadurabad, Sariakandi, Serajgonj, and Aricha sta-tions) and the Hardinge Bridgestation on the Ganges River. The lower RMSEvalues are found in Goalondo, Bhagyakul, and Elasinghat. Similarly, Mean
0.00
0.20
0.40
0.60
0.80
1.00
0 5 10
RMSE_9Stations_Monsoon2014
Ba hadurabad
Sa r iakandi
Sera jgonj
Ar icha
Ha rdinge Br
Gora i Rly Br
Goalondo
Bha gykul
0.00
0.10
0.20
0.30
0.40
0.50
0.60
0 5 10
MAE_9Stations_Monsoon2014
Ba hadurabad
Sa r iakandi
Sera jgonj
Ar icha
Ha rdinge Br
Goa londo
Bha gykul
E la singha t
0.00
0.10
0.20
0.30
0.40
0.50
0.60
0.70
0.80
0 5 10
MAE_August_Peak2014 Ba hadurabad
Sa r iakandi
Sera jgonj
Ar icha
Ha rdinge Br
Gora i Rly Br
Goalondo
Bha gyakul
E la sin Gha t0
0.1
0.2
0.3
0.4
0.5
0.6
0 5 10
MAE_September_Peak2014Bah adurabad
Sar iakandi
Sera jgonj
Ar icha
Hardinge Br
Gora i Rly Br
Goa londo
Bh agyakul
E la sin Gh a t
Fig. 6 RMSE and MAE values for nine stations (Top) for whole period (June–October/2014) and(Bottom) for Peak flood condition (August–September/2014) only
Table 2a RMSE of 9 forecast stations
Station Day 1 Day 2 Day 3 Day 4 Day 5 Day 6 Day 7 Day 8
Bahadurabad 0.50 0.52 0.54 0.63 0.73 0.81 0.88 0.96
Sariakandi 0.42 0.44 0.46 0.52 0.60 0.65 0.73 0.80
Serajganj 0.49 0.53 0.53 0.57 0.66 0.73 0.8 0.88
Aricha 0.52 0.52 0.53 0.52 0.57 0.6 0.64 0.72
Hardinge Br 0.77 0.69 0.61 0.55 0.51 0.51 0.53 0.57
Gorai Rly Bridge 0.86 0.81 0.76 0.71 0.66 0.63 0.65 0.67
Goalondo 0.45 0.46 0.44 0.42 0.38 0.45 0.47 0.53
Bhagyakul 0.32 0.33 0.33 0.32 0.34 0.35 0.36 0.4
Elashinghat 0.49 0.54 0.54 0.64 0.66 0.73 0.79 0.85
Application of Satellite Radar Altimeter Data … 281

Absolute Error (MAE) values range from 0.11 to 0.81 m and are shown inTable 2b. The RMSE and MAE values for peak flood condition during August andSeptember 2014 were also calculated and shown in Fig. 5.
The RMSE values for peak conditions in August range from 0.16 to 0.91 m andin September from 0 to 0.88 m. The stations on the Brahmaputra-Jamuna River andHardinge bridge in Ganges river show acceptable results whereas more downstreamstations, i.e., stations on the Padma (Goalondo, Bhagykul), Elasin Ghat, and GoraiRivers show higher values of RMSE and MAE.
6 Conclusion and Recommendations
Flood forecasting in Bangladesh using JASON-2 altimeter data has the advantageover conventional flood forecasting techniques that upstream water level data canbe easily obtained free of cost at any time 24 h after observation. This methodeliminates the necessity of using river information from upstream countries duringforecast calculation which was a big challenge. In 2014, FFWC used JASON-2 datain a customized MIKE 11 GIS coupled modeling environment for forecastingfloods with 8-days lead time during monsoon. Two major boundary inflows in twomajor rivers (at Noonkhawa on the Brahmaputra and at Pankha on the Ganges)were directly estimated using JASON-2 data and others were calculated based onthe trend water level of those two boundaries. The simulation was done from Juneto October. The overall model performance was found satisfactory during monsoon.The simulated water levels accurately followed the observed values except for someminor discrepancies. The stations on the Brahmaputra River (Bahadurabad,Serajgonj, Sariakandi, and Aricha) and on the Ganges River (Hardinge Bridge)8-day lead forecasted hydrographs have similar trend which is observed from 4th to8th day; a dissimilarity was found for lead time 1st–3rd day. The first major periodof flooding in 2014 was observed during the 3rd week of August followed by
Table 2b MAE of 9 forecast stations
Station Day 1 Day 2 Day 3 Day 4 Day 5 Day 6 Day 7 Day 8
Bahadurabad 0.18 0.20 0.24 0.33 0.45 0.57 0.69 0.81
Sariakandi 0.15 0.17 0.21 0.29 0.37 0.46 0.59 0.69
Serajganj 0.18 0.201 0.23 0.292 0.4 0.51 0.624 0.75
Aricha 0.182 0.211 0.234 0.268 0.34 0.41 0.49 0.6
Hardinge Br 0.28 0.21 0.13 0.12 0.164 0.191 0.21 0.24
Gorai Rly Bridge 0.281 0.261 0.2 0.174 0.21 0.25 0.28 0.32
Goalondo 0.16 0.16 0.14 0.143 0.141 0.253 0.33 0.414
Bhagyakul 0.11 0.1 0.079 0.075 0.102 0.143 0.21 0.29
Elashinghat 0.17 0.22 0.26 0.34 0.42 0.51 0.6 0.71
282 A. Hossain and Md. Arifuzzaman Bhuiyan

another major period of flooding during the 3rd week of September. The simulatedhydrographs were quite capable of capturing both of the peaks.
Among the RMSE and MAE values for nine forecasting stations for the wholesimulation period, upstream stations (Bahadurabad, Serajgonj, Sariakandi,Hardinge Bridge) on the Ganges and Brahmaputra Rivers showed acceptable valueswhereas more downstream stations showed higher errors due to tidal effects andinfluence of more river streams. Those parameters were also checked for the monthof August and September separately which provided reasonable values. Thismethodology of forecasting relieves the FFWC forecaster from accumulatingupstream flow measurements, which was a big challenge until now. Although 2 outof 13 boundary stations are directly found from JASON-2 data, with theimprovement of quality of satellite data, other boundaries can also be calculated. Inaddition, surrounding weather condition during the time of forecast need to beanalyzed to improve the quality of forecast. The flood forecast information usingJASON-2 data during 2014 monsoon was satisfactory. As experimental scheme, theresults were disseminated nationally to the government, private bodies, mass media,and other related stakeholders actively involved in flood disaster managementthrough FFWC website (www.ffwc.gov.bd/ForecastandWarning) and receivedenormous praise from both home and abroad. This is a unique example in floodmanagement of Bangladesh where satellite information has been made available forsocietal needs.
Given the first year of assessment, we observe some interesting possibilitiesmoving forward with a satellite-assisted flood forecasting system. On the one hand,if qualitative trends are the major concern (i.e., “will the river rise or fall?”), thenthe JASON-2 forecast (based on the two boundary points that explain 80 % ofMonsoon flow) can be relied on from days 4 to 8. However, if quantitativedecision-making is required (i.e., “How much will the river rise?”) the RMSE isquite high for the higher lead time days for such an exercise. On the other hand, thetrend of forecast (rising or receding) is not as consistent during the lead times of day1–4 even though the RMSE appears reasonably low. It may be possible to harnessJASON-2-based system in such a way that the use of the forecast is targeted for thenature of the forecast quality.
It should also be mentioned that the forecasting scheme could not cover the northeastern part of Bangladesh—a flash flood prone area because of narrow width of therivers like Meghna and Surma (compared to Ganges and Brahmaputra).Althoughthis JASON-2-based forecasting scheme was experimental and covered few floodvulnerable areas, it (along with other satellite altimeter data) has wide scope togenerate flood forecast information during both monsoon and flash flood with morearea coverage of places where application or introduction of flood forecastingsystem is still challenging like coastal and hilly areas. The frequency of data col-lection by satellite altimeters will need to be higher to prepare good forecasts withincreased lead time and more area coverage. JASON-2 is a sensor with a 10 dayrepeat which means that the virtual stations are not observed daily. Even whenconsidering as a collection of stations on a river, the most recent JASON-2 overpass
Application of Satellite Radar Altimeter Data … 283
can be as old as 3 days. Next generation satellite altimeter like (JASON-3, Altika—already flying, Sentinels 3A/3B) may be able to capture river height data at higherfrequency and even for smaller width rivers. We hope to investigate these oppor-tunities in our effort to continually improve the flood forecasting system fordownstream countries like Bangladesh.
References
ADB. (2014). A report on “Space Technology and Geographic Information Systems Applicationin ADB Projects”. Published by Asian Development Bank (ADB) in 2014.
FFWC. (2014). Annual Flood Report Bangladesh Water Development Board. http://www.ffwc.gov.bd/. Annual Flood Report.
Hossain, F., Siddique-E-Akbor, A. H., Mazumder, L. C., ShahNewaz, S. M., Biancamaria, S., Lee,H., et al. (2013). Proof of concept of an altimeter-based river forecasting system fortransboundary flow inside Bangladesh. IEEE Journal of Selected Topics in Applied EarthObservations and Remote Sensing, 7(2), 587–601 doi:10.1109/JSTARS.2013.2283402.
Hossain, F., Maswood, M., Siddique-E-Akbor, A. H.M., Yigzaw,W., Mazumder, L. C., Ahmed, T.,Hossain. M., et al. (2014a). A promising radar altimetry satellite system for operational floodforecasting in flood-prone Bangladesh. IEEE Magazine on Geosciences and Remote Sensing.doi:10.1109/MGRS.2014.2345414.
Hossain, F., Yigzaw, W., Siddique-E-Akbor, A. H. M., Shum, C. K, Turk, F. J., Biancamaria, S.,et al. (2014b). A guide for crossing the valley of death: Lessons 1 learned from making asatellite based flood forecasting system operational and independently owned by a stakeholderagency. Bulletin of American Meteorological Society (BAMS). doi:10.1175/BAMS-D-13-00176.1.
Immerzeel W. W., van Beek, L. P. H, & Bierkens, M. F. P. (2010). Climate change will affectAsian Water Towers. Science, 328.
Islam, M. M., & Sado, K. (2000). Development of flood hazard maps of Bangladesh usingNOAA-AVHRR images with GIS. Hydrological Sciences-Journal-des SciencesHydrologiques, 45(3).
Islam, A. S., Bala, S. K., & Haque, A. (2009) Flood Inundation Map of Bangladesh using surfacereflectance data. 2nd International Conference on Water and Flood Management(ICWFM-2009).
Kaku, K., & Held, A. (2013). Sentinel Asia: A space-based disaster Management support systemin the Asia-Pacific Region. International Journal of Disaster Risk Reduction, 6(2013), 1–17.
NASA Website. www.nasa.gov/missionpages/ostm/overview, ftp://avisoftp.cnes.fr//AVISO/pub/jason-2.
Siddique-E-Akbor, A. H. M., Hossain, F., Shum, C. K., Sikdar, S., Turk, F. J., Lee, H., et al.(2014). Satellite precipitation data driven hydrological modeling for water resourcesmanagement in the Ganges, Brahmaputra and Meghna Basins. Earth Interactions. doi:10.1175/EI-D-14-0017.1.
284 A. Hossain and Md. Arifuzzaman Bhuiyan