faculty/presenter disclosure faculty: harry jones program: 51 st annual scientific assembly...
TRANSCRIPT

Faculty/Presenter DisclosureFaculty/Presenter Disclosure
• Faculty: Harry Jones• Program: 51st Annual Scientific Assembly
• Relationships with commercial interests:– Grants/Research Support: No– Speakers Bureau/Honoraria: No.– Consulting Fees: I provide consulting services to physicians– Other: Employee of Clarence-Rockland FHT

Disclosure of Commercial Disclosure of Commercial SupportSupport
• No commercial support

Mitigating Potential BiasMitigating Potential Bias
• Presentation was reviewed by Dr. Lori Teeple, Dr. Steve Pelletier and Dr. Kendall Noel
Performance Measurement in Primary Care
“If you can't measure it, you can't manage it”
Harry Jones

There has to be a better way!

Now prove it

Presentation Outline
• Where are we?
• Why measure?
• What should you measure?
• Our experience
• Things to keep in mind

• Excellent Care for All Act
• Health Quality Ontario
• CIHI
• Preventative care bonuses
• www.rateyourmd.com
• Accountable Care Organization (US)
• etc. etc.
It’s already here

Why measure?
• Influence the agenda
3,000 Hospital Admissions
2,000 CT/MRI Scans50Hip and knee replacements
137,000General practitioner/family physician visits
12,000EmergencyDepartmentVisits
54,000Specialist visits
41,000X-rays taken
In 2010-11 46% of every program dollar went to healthcare. If the rate of growth is not slowed, it is projected to rise to 70% in 12 years.

Why measure?
• Set a baseline
• Support quality improvement initiatives
• Force change
• Shift corporate culture
• Enable comparisons

Operations
• Wait time on the phone < 3 minutes
• Time in the waiting room < 15 minutes
• Scanning in the EMR < 24 hours
• Consultations requested < 48 hours
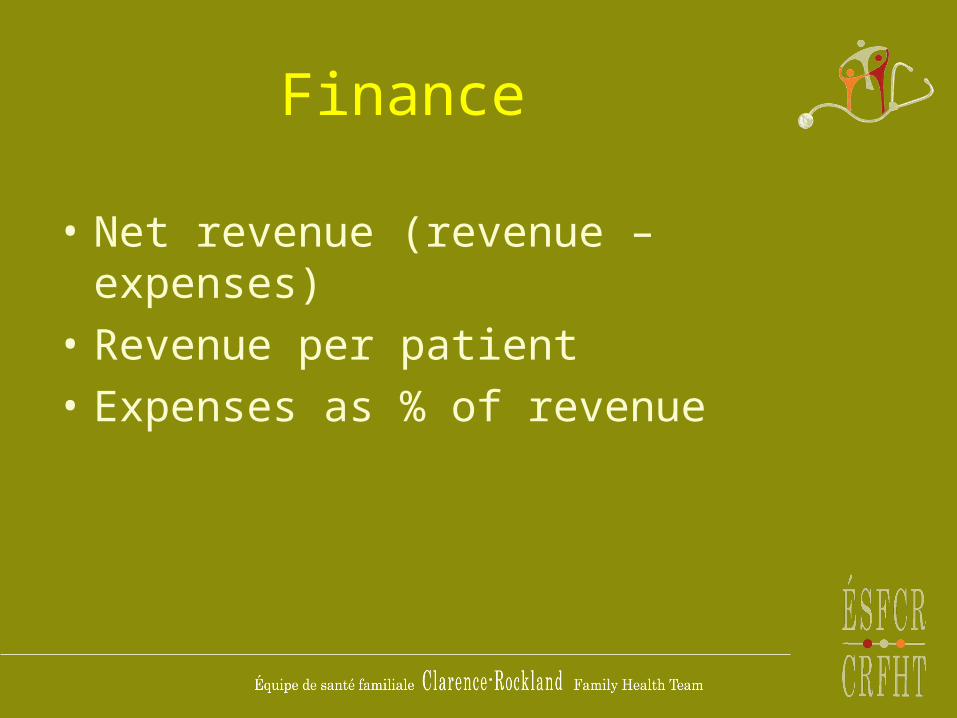
Finance
• Net revenue (revenue – expenses)
• Revenue per patient
• Expenses as % of revenue

Human resources
• FTE staff / FTE doctor
• Patients / staff
• Turnover
• Clinical vs. non-clinical staff

Access
• Time to get an appointment (i.e. 3rd next)
• Access bonus retention
• % of patients seeing their own physician
• % of visits diverted through a phone call by physician

Patient satisfaction
• Complaints
• Compliments
• Requests to change doctors
• Patient survey

Outcomes
• Hypertensive patient’s BP < 140/90
• Diabetic patient’s HbA1c < .07
• Preventative care bonuses
• # of patients who remain non-smoking after 6 months
• Survey after group session indicates patients have a better understanding

Our experience
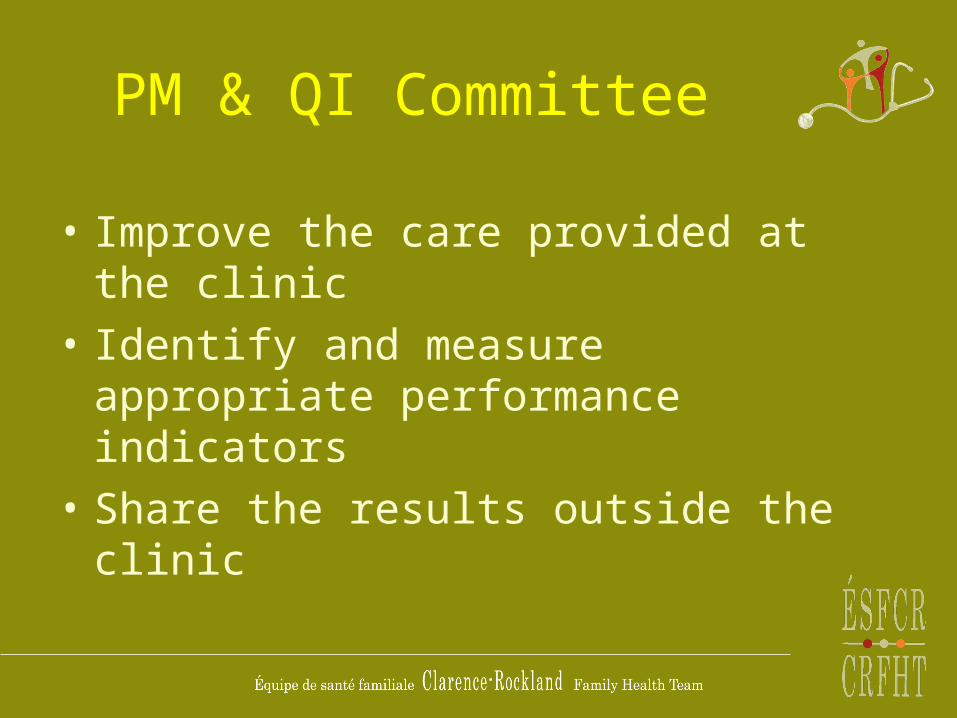
PM & QI Committee
• Improve the care provided at the clinic
• Identify and measure appropriate performance indicators
• Share the results outside the clinic

IHI model
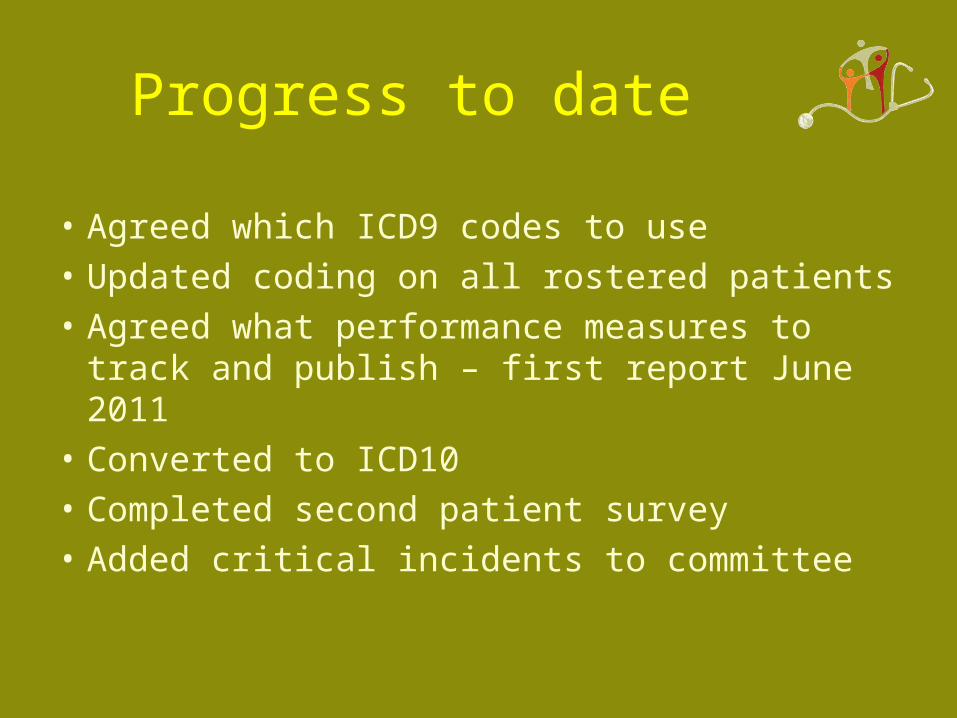
Progress to date
• Agreed which ICD9 codes to use
• Updated coding on all rostered patients
• Agreed what performance measures to track and publish – first report June 2011
• Converted to ICD10
• Completed second patient survey
• Added critical incidents to committee
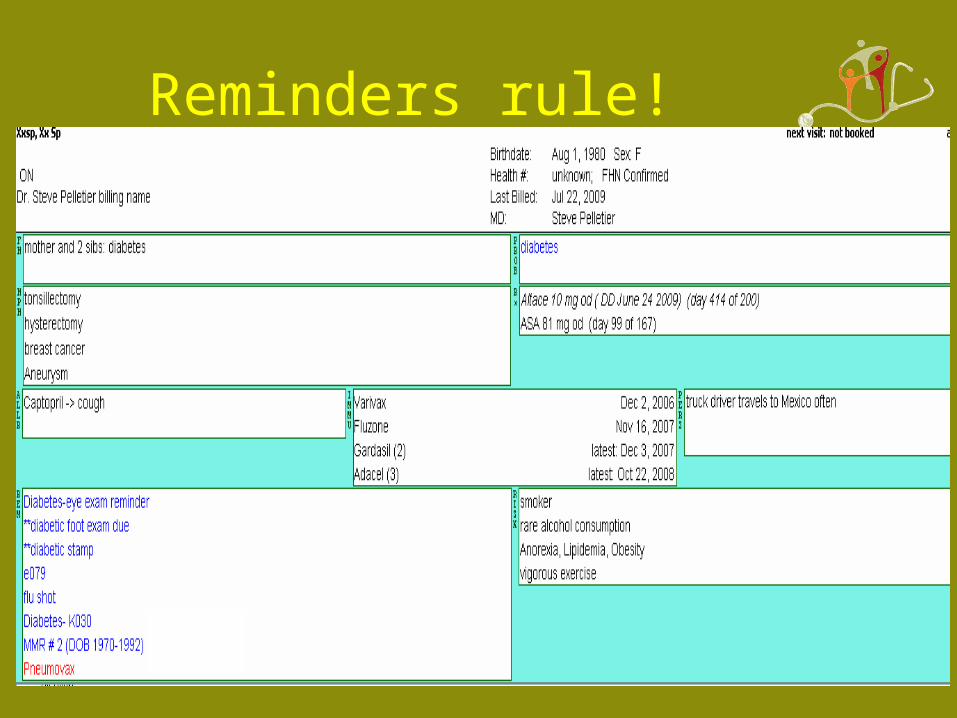
Reminders rule!

Challenges
• Nomenclature – 12+ written terms for diabetes (e.g. diabetes mellitus / DM / diabète)
• Agreeing on codes
• Finding comparators (e.g. actual 3rd next)

Lack of EMR functionality
• Coding
• Capturing structured data
• Reporting
Next steps
• Verify patient coding
• Identify additional useful measures
• Simplify the process to generate measures
• Continue using data to deal with issues (e.g. immunisation)

Things to keep in mind

IHI model
<- Start here
<- Not here
Don’t boil the ocean
• Is your measure useful?
• Is your measure practical / cost-effective?

Context is everything
• Would you prefer to pay 30% overhead or 40%?

Absolute vs. relative
• What will it cost to increase your access bonus from 80% to 90%?

Avoid duplicate data entry
• Derive administrative data from clinical workflow

Improved operations -> happy patients -> ↑ revenue

Measure what you can control
• Patient survey – “are the exam rooms large enough?”
• Clinical – HbA1c
• System – 30 day readmission rate

Final thought
• It’s not complicated
• It does take time and effort
BUT
• We can’t afford not to
