factors that potentially limit the populations of fall … factors that potentially limit the...
TRANSCRIPT

521521521521
Factors That Potentially Limit the Populations of Fall-Run Chinook Salmon in the San Joaquin River Tributaries
Abstract
Correlations were tested between recruitment, flow related variables,ocean conditions, and harvest between 1939 and 1995 to identifylikely environmental factors that limit fall-run chinook salmon (Onco-rhynchus tshawytscha) in the Stanislaus and Tuolumne rivers, whichare tributaries to the San Joaquin River, California. To test correla-tions, recruitment was estimated by first segregating escapement esti-mates into cohorts and then expanding cohort abundance to includeharvested fish. The segregation of fish into cohorts included length-frequency analysis to determine the percentage of two-year-old fishand the estimation of the percentage of three-, four- and five- year-old fish using age composition data from the 1947-49 and 1951 gill-net catches in the Sacramento-San Joaquin Estuary, marked fishreturning to Tehama-Colusa Fish Facility from 1973-1977, and coded-wire tag returns to the San Joaquin Basin from 1988 to 1996.
Recruitment to the Stanislaus River population from 1945 to 1995 andthe Tuolumne River population from 1939 to 1995 were strongly cor-related with springtime flows in the mainstem San Joaquin River andthe tributaries, the ratio of Delta exports at the State Water Projectand federal Central Valley Project to Vernalis flows and to a lesserdegree, the abundance of spawners (stock), ocean harvest, andanchovy landings. Correlations with herring landings, Novemberflows during spawning, water temperature at Vernalis, and ocean cli-mate conditions, which include the Pacific Interdecadal ClimateOscillation, North Pacific Index, and Pacific Fisheries EnvironmentalLaboratory Upwelling Index were nonsignicant.
The influence of flow and Delta exports is greatest in the Delta nearStockton as demonstrated by U.S. Fish and Wildlife Service (USFWS)smolt survival studies that used coded-wire-tagged juveniles rearedin hatcheries. These studies indicated that the survival of smoltsmigrating in the Delta downstream from Dos Reis to Jersey Point isstrongly correlated with flow and to a lesser degree water tempera-ture and Delta exports. However, even when Vernalis flows exceeded20,000 cfs and Delta exports were low at about 1,800 cfs, smolt sur-vival near Stockton did not exceed 33%. Juvenile salmon survival was

522522522522
much higher in the tributaries, the mainstem San Joaquin Riverupstream of Dos Reis, and in the Delta downstream from the Moke-lumne River. The source of mortality in the reach near Stockton,which is a dredged deepwater ship channel, is presumed to be preda-tion or entrainment at unscreened diversions because most of thejuvenile fish migrate through this reach in less than 5 days and otherstressors probably could not act rapidly enough to result in mortality.
The USFWS smolt survival studies also suggest that the impacts ofDelta exports primarily have an indirect effect as few tagged fishwere collected at the screens at the pumping facilities. Presumablyindirect effects of exports occur because flow and fish are divertedinto the Old River and Clifton Court Forebay where predator densi-ties are thought to be high and because exports reduce flows in themainstem river near Stockton. However, these presumed impactshave been ameliorated since 1992 by installing a barrier at the head ofthe Old River.
Ocean harvest affected recruitment by reducing the abundance offour-year-old fish and population fecundity. Reduced populationfecundity was a limiting factor for the Stanislaus and Tuolumne riverpopulations during about 40% of the years after 1950. It is also likelythat the large four-year-old fish help improve the permeability of rif-fle habitat by constructing very large redds.
The correlations between ocean conditions and recruitment to theTuolumne and Stanislaus rivers were weak probably due to the over-riding influence of streamflow. A decline in Tuolumne River recruit-ment during the mid 1940s was probably in response to the cessationof unusually high flows that persisted from 1935 to 1946; whereas a30-year cool, productive cycle began off the California Coast in 1947.There were relatively small declines in mean recruitment to both theTuolumne and Stanislaus rivers in response to a warm, nonproduc-tive cycle that began in 1977.
Other potential limiting factors discussed include (1) instream gravelmining; (2) sedimentation from the construction of new housingwhich is rapidly increasing along the Stanislaus River corridor; (3)encroachment of riparian vegetation on floodplains as a result of flat-tened hydrographs; (4) increased Delta exports during the fall whenadults are migrating through the Delta; (5) contaminants; and (6) dis-ease.
523523523523
Introduction
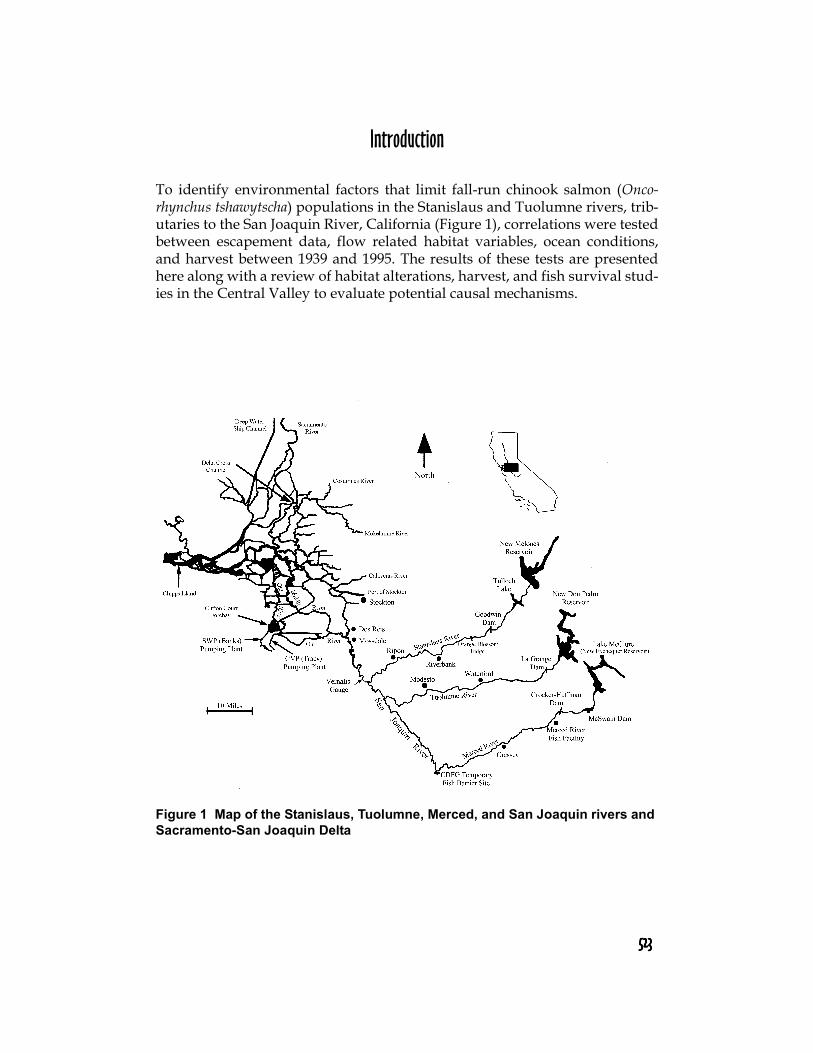
To identify environmental factors that limit fall-run chinook salmon (Onco-rhynchus tshawytscha) populations in the Stanislaus and Tuolumne rivers, trib-utaries to the San Joaquin River, California (Figure 1), correlations were testedbetween escapement data, flow related habitat variables, ocean conditions,and harvest between 1939 and 1995. The results of these tests are presentedhere along with a review of habitat alterations, harvest, and fish survival stud-ies in the Central Valley to evaluate potential causal mechanisms.
Figure 1 Map of the Stanislaus, Tuolumne, Merced, and San Joaquin rivers and Sacramento-San Joaquin Delta
524524524524
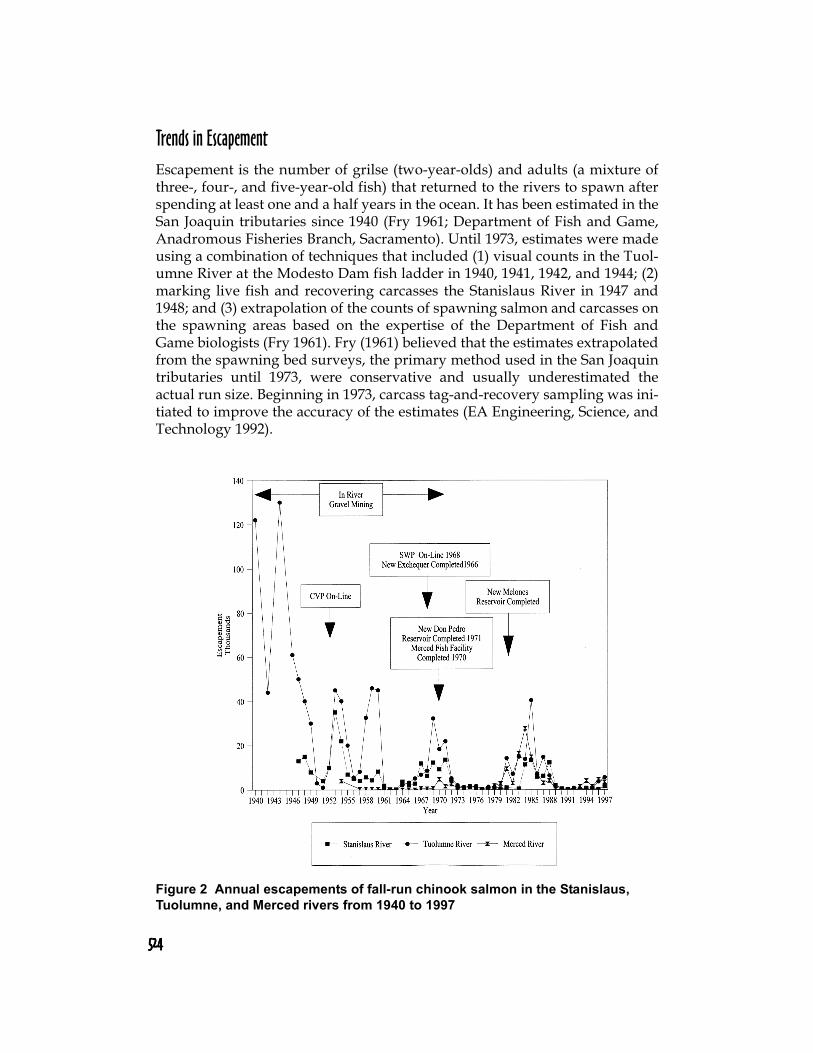
Trends in EscapementEscapement is the number of grilse (two-year-olds) and adults (a mixture ofthree-, four-, and five-year-old fish) that returned to the rivers to spawn afterspending at least one and a half years in the ocean. It has been estimated in theSan Joaquin tributaries since 1940 (Fry 1961; Department of Fish and Game,Anadromous Fisheries Branch, Sacramento). Until 1973, estimates were madeusing a combination of techniques that included (1) visual counts in the Tuol-umne River at the Modesto Dam fish ladder in 1940, 1941, 1942, and 1944; (2)marking live fish and recovering carcasses the Stanislaus River in 1947 and1948; and (3) extrapolation of the counts of spawning salmon and carcasses onthe spawning areas based on the expertise of the Department of Fish andGame biologists (Fry 1961). Fry (1961) believed that the estimates extrapolatedfrom the spawning bed surveys, the primary method used in the San Joaquintributaries until 1973, were conservative and usually underestimated theactual run size. Beginning in 1973, carcass tag-and-recovery sampling was ini-tiated to improve the accuracy of the estimates (EA Engineering, Science, andTechnology 1992).
Figure 2 Annual escapements of fall-run chinook salmon in the Stanislaus, Tuolumne, and Merced rivers from 1940 to 1997

525525525525
The trend in escapement from 1940 to 1997 for the San Joaquin tributaries(Figure 2) suggests while the salmon runs in the Stanislaus and Tuolumne riv-ers fluctuated greatly between years, they declined substantially between1940 and 1958. It is likely that these trends were real and not an artifact of thedifferent survey methods, because some of the highest pre-1960 estimateswere made using the most accurate methods. The two highest counts on theTuolumne River, 122,000 and 130,000 salmon, were made at the fish ladder atModesto Dam. Two moderately high estimates for the Stanislaus River, 13,000and 15,000 fish, were based on mark-recovery techniques used in 1947 and1948.
Another feature of the escapement trend analysis is that escapement was lowin all three tributaries, except after major flooding and extended high spring-time flows. Furthermore, the peaks in escapement were usually two yearsafter the floods and so flows were probably affecting escapement by control-ling the production and survival of juvenile salmon.
Correlation AnalysesTo investigate the effects of various habitat and harvest variables on adultescapement, statistical correlations were tested for the Stanislaus and Tuol-umne rivers. Correlation analyses were not made for the Merced Riverbecause after 1970, recruitment was affected by releases of juvenile salmonreared at the Merced River Fish Facility.
Variables tested include (1) streamflows during smolt emigration in the tribu-taries and mainstem San Joaquin River at Vernalis, (2) water temperature inthe mainstem San Joaquin at Vernalis, (3) the ratio of Delta export rates at theCentral Valley Project (CVP) and State Water Project (SWP) to flow rates inthe mainstem San Joaquin River at Vernalis during smolt emigration, (4) theCentral Valley index of ocean harvest rates (Reisenbichler 1986; PFMC 1998),(5) three ocean climate indices of sea surface temperatures and upwelling, and(6) the northern anchovy (Engraulis mordax) and herring (Clupea harengus pal-lasi) landings off the coast of California as indices of ocean prey abundance(California Bureau of Marine Fisheries 1970-1990).
Methods
Because there is a delay of one to two years between high spring flows and thereturn of high numbers of adults, it was necessary to segregate the escape-ment estimates into cohorts that reflect the abundance of juvenile fish that allhatched in a given year. To estimate the abundance of cohorts, it is necessaryto know the percentage of each age class in the escapement estimates. Cohortsfor a given period of juvenile emigration, for example the spring of 1950, are

526526526526
estimated by summing the abundance of two-year-old fish in fall 1951, three-year-old fish in fall 1952, four-year-old fish in fall 1953, and five-year-old fishin fall 1954. The California Department of Fish and Game (DFG) estimated thepercentage of two-year-old fish using a standard length criterion of fish withfork lengths less than 24 inches from 1951 to 1987 and a length-frequencyanalysis thereafter. DFG provided sex-specific length-frequency data collectedbetween 1985 and 1998 for the Stanislaus River and 1981 and 1998 for theTuolumne River that was used to independently estimate the percentage oftwo-year-old fish (T. Heyne, personal communication, see “Notes”). A corre-lation analysis indicated that the estimates based on the length-frequencyanalysis were 4.3% higher (adj-R2 = 0.34) for the Stanislaus River populationand 5.0% higher (adj-R2 = 0.99) for the Tuolumne River population comparedto the DFG estimates based on fork length measurements of fish less than 24inches. Assuming that the estimates based on the DFG standard length crite-rion were not as accurate as the estimates based on length-frequency data, theDF&G estimates of two-year-old fish were adjusted for this analysis using thefollowing equations developed with the correlation analyses:
Stanislaus River Age 2s = DFG Stanislaus River Age 2s * 0.966 + 0.0433
Tuolumne River Age 2s = DFG Tuolumne River Age 2s * 0.979 + 0.0495
DFG did not estimate the abundances of three-, four-, and five-year-old fishseparately but instead estimated their abundances as a group called “adults”.Therefore, it was necessary to estimate the percentages of the older age classesusing age composition data for fall-run fish from the 1947-49 and 1951 gill-netcatches in the Sacramento-San Joaquin Estuary (Reisenbichler 1986), markedfish returning to Tehama Colusa Fish Facility from 1973-1977 (Reisenbichler1986), and coded-wire tag returns to the San Joaquin Basin from 1988 to 1996(DFG 1991 to 1998). The percentages of the three-, four- and five-year-old fishin cohorts for the Stanislaus and Tuolumne river populations were then esti-mated by matching the ratios of the percentages of Age 4:Age 3 fish andAge 5:Age 4 fish in each cohort to the average ratios computed from the agecomposition data for the same period (Table 1). Ratios for age classes werealso estimated for the 1952-1960 and the 1961-1970 periods by assuming thatthe decline in the percentages of Age 4 and Age 5 fish relative to the percent-age of Age 3 fish from 1951 to 1973 was a result of increased ocean harvest(Table 1). These age class ratios were estimated using correlations with theCentral Valley Index of ocean harvest for each period. The percentages of Age2 fish prior to 1951 for both rivers were estimated using a ratio of 1.47 for thepercentages of Age 3 to Age 2 fish, which was the average of the 1951 to 1955estimates. The estimation procedure also required that the sum of all the ageclass percentages in each cohort equaled 100%.

527527527527
DFG was unable to estimate escapement during 1950, 1977, and 1982 for theStanislaus River and 1945 and 1950 for the Tuolumne River. Because eachescapement estimate provides abundance estimates for the two-, three-, four-,and five-year-old fish used to compute recruitment in four different years, itwas necessary to fabricate escapement estimates for these years to avoidunderestimating cohort abundance that required the missing estimates fortwo- and five-year-old fish. The missing estimates were fabricated such thatthey were similar to the estimates in the previous and following years. Therecruitment estimates derived from the fabricated estimates for three-andfour-year-old fish were usually not used for this analysis because those esti-mates comprised a large proportion of the recruitment estimate and those forsome of the two-year-old estimates were not used because they determinedyear class strength. The recruitment estimates omitted from the analysis dueto the absence of estimates for two-, three-, and four-year-old fish include1947, 1948 and 1949 for the Tuolumne River and 1947, 1948, 1974, 1975, 1979,1980, and 1981 for the Stanislaus River. Estimated cohort abundance in theescapement and percentage of each age of fish in each cohort is presented inTable 2.
Recruitment was tested in the correlation analysis that was the combinedabundance of the fish that returned to spawn (escapement) and those har-vested in the commercial and sport fishery. It was computed by dividingcohort abundance based on escapement by “1 - Central Valley Index of har-vest (CVI).” The CVI was weighted toward four-year-old fish from 1939 to1951 when four-year-olds were relatively abundant and toward three-year-old fish thereafter. The following equations were used for three periods thatcorrespond to the decline in four-year-old fish:
Table 1 Ratios of Age 4:Age 3 fish and Age 5:Age 4 fish and the Central Valley Index used to estimate the age class percentages for each period
Time period Age 4:Age 3 Age 5:Age 4 Central Valley Index
1945-1946 1.50 0.22 0.335
1947-1951a 1.42 0.20 0.368
1952-1960 0.68 0.10 0.554
1961-1970 0.57 0.08 0.580
1971-1972 0.60 0.09 0.570
1973-1977a 0.33 0.05 0.636
1978-1987 0.35 0.05 0.651
1988-1998a 0.39 0.00a/0.05b 0.728
a Based on age composition data.b Used in estimations.

528528528528
Recruitment = Escapement Cohort/(1 - (CVI Age 4 + CVI Age 4 + CVI Age 3/3)) from 1939-1951;
Recruitment = Escapement Cohort/(1 - (CVI Age 4 + CVI Age 3 + CVI Age 3/3)) from 1952-1969;
Recruitment = Escapement Cohort/(1 - CVI Age 3) from 1970-1995
Recruitment, which is presented in Table 3, is identified according to the yearwhen most of the fish emigrated to the ocean as smolts.
Correlations with Recruitment also considered the abundance of spawnersthat produced each cohort. The number of spawners, called “Stock” for thisanalysis, was computed as the equivalent number of three-year-old salmonthat returned to spawn during the year prior to the recruitment estimate usingthe following formula:
Stock = 0.25 * Age 2s + Age 3s + 1.25 * Age 4s + 1.5 * Age 5s
The age-specific escapement estimates were multiplied by an adjustment fac-tor to reflect the relative number of eggs deposited by females in the Stockestimate. For example, the escapement estimate for two-year-old fish (Age 2s)was multiplied by 0.25 because two-year-old fish are primarily males and thetwo-year-old females produce about half the number of eggs produced bythree-year-old females. DFG estimates that 74% of two-year-old fish weremales from 1988 to 1998 in the San Joaquin basin (T. Heyne, personal commu-nication, see “Notes”). Two-year-old females, which average 61 cm in forklength, would be expected to produce about 2,800 eggs, whereas three-year-old females, which average about 77 cm in fork length, would produce about6,000 eggs based on fecundity data presented in DFG (1990).
Correlation evaluations were conducted with the variables presented in Table3 and with other variables of ocean harvest and northern anchovy landingvariables not shown in the table. Table 3 presents the harvest estimates thatcorresponded to the cohorts when the fish were three-years-old and the north-ern anchovy landing estimates that corresponded to the cohorts when the fishwere two-years-old. The ocean harvest estimates were also tested for the yearwhen the cohorts were four-year-old fish and the anchovy estimates were alsotested for the years when the cohorts were three-years-old fish by shifting theestimates up or down in the table by the appropriate number of years. Forexample, the northern anchovy landing estimate for Age 2 fish in Table 3 forthe 1965 cohort (31,140) was also the same estimate for Age 3 fish for the 1964cohort.

529529529529
Table 2 DFG estimates of escapement, DFG estimates of percent two-year-olds in escapement (%Age 2), the estimates of percent two-, three-, four- and five-year-olds used in the analyses, cohort abundance (cohort) based on escapement for the spring juvenile emigration period, and stock for the Stanislaus and Tuolumne rivers from 1939 to 1998a
Year
DFG Estimates Estimates used in analysis
Escapement %Age2 %Age2 %Age3 %Age4 %Age5 Cohort Stock
Stanislaus River
1946 11,150 20,175
1947 13,000 14% 35% 43% 9% 3,950 15,131
1948 15,000 6% 25% 58% 11% 1,700 13,585
1949 8,000 5% 16% 60% 20% 2,187 17,325
1950 3,000 13% 14% 47% 26% 16,792 9,730
1951 4,000 46% 49% 20% 21% 10% 11,525
1952 10,000 12% 16% 74% 9% 1% 39,302 2,947
1953 35,000 57% 60% 20% 20% 0% 8,878 9,084
1954 22,000 20% 24% 62% 13% 2% 4,555 21,138
1955 7,000 20% 23% 19% 56% 2% 2,972 18,928
1956 5,000 6% 11% 29% 41% 19% 6,025 6,828
1957 4,090 31% 34% 29% 31% 6% 3,439 5,593
1958 5,700 14% 18% 58% 21% 4% 9,624 3,470
1959 4,300 50% 53% 21% 25% 2% 1,179 5,350
1960 8,300 5% 9% 70% 18% 3% 190 2,896
1961 1,900 2% 6% 16% 76% 2% 248 8,247
1962 315 15% 19% 11% 42% 28% 4,268 2,196
1963 200 38% 41% 35% 16% 8% 1,910 347
1964 3,700 11% 15% 82% 3% 0% 2,902 155
1965 2,231 12% 16% 37% 47% 0% 13,107 3,327
1966 2,872 33% 37% 44% 17% 3% 2,248 2,233
1967 11,885 3% 7% 82% 11% 1% 20,810 2,247
1968 6,385 57% 59% 10% 31% 1% 1,825 11,607
1969 12,327 3% 2% 88% 6% 3% 16,748 4,064
1970 9,297 28% 31% 8% 60% 1% 2,759 12,479
1971 13,621 7% 11% 80% 6% 4% 1,423 8,546
1972 4,298 10% 14% 18% 67% 1% 403 12,970
1973 1,234 4% 8% 44% 38% 10% 1,361 4,568
a Estimates in bold type were fabricated to fill in gaps in the DFG data.

530530530530
1974 750 33% 36% 27% 34% 4% 476 1,338
1975 1,200 14% 18% 72% 8% 1% 236 623
1976 600 23% 27% 37% 36% 1% 22 1,069
1977 100 0% 10% 49% 36% 5% 130 535
1978 50 33% 37% 12% 46% 5% 84
1979 100 6% 10% 82% 5% 3% 1,379 43
1980 100 17% 20% 52% 27% 0% 1,216 95
1981 1,000 0% 4% 93% 2% 0% 985 92
1982 2,000 0% 25% 54% 21% 0% 8,370 974
1983 500 0% 46% 37% 16% 1% 17,321
1984 11,439 39% 42% 55% 3% 0% 4,219 348
1985 13,322 9% 14% 73% 13% 0% 3,669 7,924
1986 5,888 17% 24% 30% 45% 1% 16,327 12,384
1987 6,292 36% 67% 22% 9% 2% 1,498 5,546
1988 12,344 4% 7% 85% 7% 0% 265 3,336
1989 1,968 3% 6% 18% 75% 1% 334 11,898
1990 492 39% 15% 19% 42% 24% 227 2,267
1991 321 16% 16% 59% 19% 6% 437 549
1992 254 54% 24% 48% 27% 1% 1,117 306
1993 410 21% 25% 62% 12% 1% 460 226
1994 1,079 17% 14% 74% 11% 0% 374 347
1995 629 26% 30% 36% 34% 1% 6,563 993
1996 160 59% 59% 27% 13% 1% 885 543
1997 5,583 7% 7% 91% 2% 1% 1,177 96
1998 3,147 37% 37% 17% 45% 1% 0 5,367
Average 5,915 21% 23% 43% 29% 5% 5,167 5,321
Tuolumne River
1939 65,135
1940 122,000 19% 30% 43% 9% 40,250
1941 60,000 19% 30% 43% 9% 116,810 122,534
Table 2 DFG estimates of escapement, DFG estimates of percent two-year-olds in escapement (%Age 2), the estimates of percent two-, three-, four- and five-year-olds used in the analyses, cohort abundance (cohort) based on escapement for the spring juvenile emigration period, and stock for the Stanislaus and Tuolumne rivers from 1939 to 1998a (Continued)
Year
DFG Estimates Estimates used in analysis
Escapement %Age2 %Age2 %Age3 %Age4 %Age5 Cohort Stock
a Estimates in bold type were fabricated to fill in gaps in the DFG data.

531531531531
1942 44,000 29% 20% 43% 9% 84,960 60,263
1943 60,000 20% 47% 25% 9% 92,080 40,975
1944 130,000 19% 25% 52% 4% 48,005 57,225
1945 75,000 12% 32% 45% 11% 38,605 130,975
1946 61,000 11% 21% 58% 11% 47,905 80,813
1947 50,000 16% 25% 43% 16% 20,175 68,396
1948 40,000 10% 37% 42% 12% 264 53,425
1949 30,000 0% 20% 69% 11% 965 43,550
1950 15,000 3% 1% 65% 32% 20,499 36,705
1951 3,000 77% 80% 4% 1% 15% 18,766
1952 10,000 4% 9% 88% 4% 0% 65,469 1,435
1953 45,000 50% 54% 26% 19% 0% 10,528 9,442
1954 40,000 10% 14% 70% 14% 2% 8,973 28,960
1955 20,000 20% 24% 14% 60% 2% 3,019 37,395
1956 5,500 5% 10% 38% 33% 20% 44,139 19,580
1957 8,170 59% 63% 14% 21% 2% 25,319 6,098
1958 32,500 12% 17% 78% 4% 1% 53,818 4,827
1959 45,900 48% 52% 22% 26% 0% 4,102 28,980
1960 45,000 4% 9% 66% 22% 4% 215 31,128
1961 500 31% 35% 7% 55% 2% 86 45,291
1962 250 9% 13% 4% 41% 43% 1,951 443
1963 100 20% 25% 17% 24% 35% 4,880 303
1964 2,100 32% 37% 61% 2% 0% 3,179 105
1965 3,200 1% 6% 75% 19% 0% 8,069 1,533
1966 5,100 29% 34% 35% 30% 1% 1,953 3,204
1967 6,800 5% 10% 71% 17% 2% 50,580 4,219
1968 8,600 76% 79% 6% 15% 0% 4,432 6,668
1969 32,200 2% 2% 95% 2% 1% 23,501 3,831
1970 18,400 17% 22% 10% 68% 0% 4,572 32,097
1971 21,885 7% 11% 77% 9% 3% 2,604 18,554
Table 2 DFG estimates of escapement, DFG estimates of percent two-year-olds in escapement (%Age 2), the estimates of percent two-, three-, four- and five-year-olds used in the analyses, cohort abundance (cohort) based on escapement for the spring juvenile emigration period, and stock for the Stanislaus and Tuolumne rivers from 1939 to 1998a (Continued)
Year
DFG Estimates Estimates used in analysis
Escapement %Age2 %Age2 %Age3 %Age4 %Age5 Cohort Stock
a Estimates in bold type were fabricated to fill in gaps in the DFG data.

532532532532
1972 5,100 17% 21% 28% 50% 1% 883 20,817
1973 1,989 5% 10% 50% 31% 9% 1,754 4,944
1974 1,150 9% 13% 41% 42% 4% 1,420 2,089
1975 1,600 9% 13% 72% 13% 2% 659 1,177
1976 1,700 10% 14% 59% 26% 1% 1,276 1,508
1977 450 0% 5% 51% 41% 3% 1,035 1,631
1978 1,300 7% 12% 73% 14% 2% 717 486
1979 1,183 10% 15% 59% 25% 1% 3,798 1,237
1980 559 10% 14% 56% 28% 2% 18,385 1,126
1981 14,253 32% 75% 23% 2% 0% 1,311 544
1982 7,126 5% 12% 82% 6% 0% 23,908 6,253
1983 14,836 82% 86% 2% 12% 0% 42,571 6,611
1984 13,802 52% 63% 36% 1% 1% 7,614 5,704
1985 40,322 4% 12% 73% 15% 0% 1,092 7,385
1986 7,288 7% 10% 29% 59% 2% 20,367 38,242
1987 14,751 93% 93% 2% 4% 1% 787 7,876
1988 6,349 5% 10% 88% 2% 1% 104 4,730
1989 1,274 4% 6% 9% 84% 0% 58 5,923
1990 96 22% 22% 11% 29% 39% 89 1,487
1991 77 15% 35% 35% 22% 9% 548 106
1992 132 62% 62% 31% 7% 1% 414 64
1993 435 30% 17% 79% 5% 0% 616 74
1994 513 25% 29% 48% 23% 0% 433 386
1995 743 38% 33% 53% 13% 1% 7,810 433
1996 160 68% 68% 20% 11% 1% 7,916 585
1997 5,583 6% 6% 90% 2% 1% 8,545 84
1998 3,147 35% 35% 19% 45% 1% 4,478 5,374
Average 20,121 25% 26% 40% 27% 6% 17,907 19,401
Table 2 DFG estimates of escapement, DFG estimates of percent two-year-olds in escapement (%Age 2), the estimates of percent two-, three-, four- and five-year-olds used in the analyses, cohort abundance (cohort) based on escapement for the spring juvenile emigration period, and stock for the Stanislaus and Tuolumne rivers from 1939 to 1998a (Continued)
Year
DFG Estimates Estimates used in analysis
Escapement %Age2 %Age2 %Age3 %Age4 %Age5 Cohort Stock
a Estimates in bold type were fabricated to fill in gaps in the DFG data.

533533533533
Four variables, StanMinSpr, StanMinFal, TuolMinSpr, and TuolMinFal, wereused to test a ratio of flow releases in the Stanislaus and Tuolumne rivers rela-tive to hypothetical minimum instream flow schedules based on the habitatcriteria developed by the U.S. Fish and Wildlife Service for the Stanislaus andTuolumne rivers. The flow schedules are based on the Physical Habitat Simu-lation Models (PHABSIM) for each river (USFWS 1993, 1994) and water tem-perature models for each river (EA 1993; USBR 1993). Flows were selected toprovide nearly optimum water depths and velocities and to maintain a 56 Ftemperature within the upper spawning reach during November and 66 F tothe mouth of the river during the spring juvenile rearing and emigrationperiod in April and May. The variable reflects the average of the ratio of flowreleases to the hypothetical flow schedule for each day of the spring and fallperiods. The development of the hypothetical release schedule, which is pre-sented in Table 4, is discussed further in Carl Mesick Consultants (1996).
Three indices of ocean climate conditions were tested. The means of theNovember to March values of both the North Pacific Index (NPI) and thePacific interdecadal Oscillation (PDO) and the mean of the May to July valuesof the Pacific Fisheries Environmental Laboratory coastal upwelling index(PFEL Upwelling Index) for the San Francisco area (interpolated values to alatitude of 38N) were used in this analysis. The NPI is the anomaly of the ofthe area-weighted sea level pressure of the Aleutian Low (region 30N-65N,160E-140W) for the 1925 to 1989 period (Trenberth and Hurrell 1994). Themean of the November to March values of the Pacific interdecadal Oscillation(PDO) is defined by Steven Hare as the leading principal component of NorthPacific monthly sea surface temperature variability (poleward of 20N for the1900-93 period). NPI and PDO are both correlated with sea surface tempera-
Table 3 Hypothetical minimum instream flow schedule for the Stanislaus and Tuolumne rivers for the spawning and spring emigration periods
Time period Streamflow release (cfs)
Nov 5 to Dec 29 150
Apr 1 to 3 150
Apr 4 to 13 200
Apr 14 to 23 250
Apr 24 to May 3 400
May 4 to 13 700
May 14 to 23 850
May 24 to 28 900
May 29 to Jun 2 950

534534534534
tures and the ocean harvest of salmon off the Alaska coast and the West coast(Mantua and others 1997). When sea surface temperatures are warm off theentire northeastern Pacific rim, PDO tends to be positive, NPI tends to be neg-ative, Alaska landings of sockeye and pink salmon are relatively high, andWest Coast landings of spring-run chinook and coho salmon are low (Mantuaand others 1997). The PFEL Upwelling Index is a measure of the intensity oflarge-scale, wind-induced coastal upwelling along the West Coast and isbased on estimates of offshore Ekman transport driven by geostrophic windstress (PFEL 2001).
The Statistix 7.0 software program (Analytical Software 1995) was used tovisually inspect scatter plots to assess whether the relationships were linearand to compare Pearson correlation coefficients (r), Mallows' Cp statistics,plots of standardized residuals relative to fitted values, and stepwise regres-sion analyses to determine the set of variables that maximized the adjustedcoefficient of determination (adj-R2). To inspect the various relationships inscatter plots, it was necessary to minimize the effects of the other test vari-ables. This was done by excluding data sets in the scatter plots in whichrecruitment was substantially affected by other variables. For example, whenevaluating the stock-recruitment relationships for the Tuolumne River, onlydata sets with Vernalis flows between 8,000 and 15,000 cfs were used in thescatter plots. Similarly when flow and exports were evaluated for TuolumneRiver recruitment, only data sets with stock greater than 6,000 spawners wereused in the scatter plots as recruitment was relatively unaffected by stock,when stock exceeded 6,000 spawners.
The visual inspections of scatter plots also determined that the relationshipswith stock and the Delta export ratio were nonlinear. A log transformation ofthe ratio of Delta exports to Vernalis flows and second degree polynomialterms (square, square root, log, and the inverse of the variables) for both thestock and flow variables were tested in the correlation analyses (page 404 inSnedecor and Cochran 1989).

55 55 33 33 55 55
Table 4 Estimates of recruitment, stock, the average streamflow (cfs) in the San Joaquin River at Vernalis from 15 April to 15 June (VerFloSpr), ratio of Delta exports at the SWP and CVP pumping facilities to Vernalis flows from 15 April to 15 June (ExFloSpr), the Central Valley Index of ocean harvest (CVI) corresponding to Age-3 chinook salmon, the North Pacific Index (NPI) corresponding to Age-1 chinook salmon, the mean Pacific Decadal Oscillation (PDO) from November through March corresponding to Age-1 chinook salmon, the PFEL Upwelling Index corresponding to Age-1 chinook salmon, northern anchovy landings (tons) and herring landings (tons) off the coast of California corresponding to Age-2 chinook salmon, the average streamflow (cfs) in the Stanislaus River at Ripon from 15 April to 15 June, the ratio of flows releases in the Stanislaus River to a hypothetical minimum flow release schedule based on PHABSIM and a water temperature model for 1 April to 31 May (StanMinSpr) and for 1-30 November (StanMinFal), the average flow (cfs) in the Tuolumne River at Modesto from 15 April to 15 June, the ratio of flow releases in the Tuolumne River to a hypothetical minimum flow release schedule based on PHABSIM and a water temperature model for 1 April to 31 May (TuolMinSpr) and for 1 to 30 November (TuolMinFal), and the average maximum water temperature (F) in the San Joaquin River at Vernalis for April.
YearStan Recruit
Stan Stock
Tuol Recruit
Tuol Stock
VerFlo-Spr
ExFlo-Spr
CVI Age 3
NPI Age1
PDO Age 1
Up- well
Anchovy Age 2
Herring Age 2
Ripon Flow Spring
Stan-Min-Spr
Stan- Min- Fall
Modesto Flow Spring
Tuol-Min-Spr
Tuol-Min-Fall
Max Vernalis Temp
1939 93,945 1,933 0.00 0.49 0.584 3,159 227
1940 58,333 13,773 0.00 -5.22 1.258 2,053 395
1941 170,941 122,534 20,552 0.00 -3.54 1.852 847 95
1942 126,178 60,263 18,413 0.00 -0.80 0.680 785 315
1943 138,814 40,975 15,785 0.00 0.33 3.43 -0.200 1,946 211
1944 72,735 57,225 3,739 0.00 0.34 -1.10 0.260 808 230
1945 59,698 130,975 11,212 0.00 0.34 -2.82 -0.038 961 241
1946 17,605 20,175 75,639 80,813 10,475 0.00 0.36 0.43 -0.864 139 9,470 827
1947 15,131 68,396 1,679 0.00 0.37 1.77 -0.458 109 5,418 4,000
1948 13,585 53,425 5,483 0.00 0.37 2.44 0.130 114 1,661 190
1949 3,770 17,325 1,664 43,550 2,890 0.00 0.40 2.02 -1.840 130 2,439 713
1950 29,808 9,730 36,389 36,705 5,904 0.00 0.43 1.49 -1.560 169 3,477 2,462
1951 22,163 3,450 36,089 19,457 4,848 0.01 0.44 3.00 -1.544 155 27,891 4,748

55 55 33 33 66 66
1952 2,947 140,290 1,435 26,123 0.00 0.50 2.20 -1.012 132 42,918 3,901
1953 25,128 9,084 29,796 9,442 3,047 0.82 0.60 -1.30 -0.496 127 21,205 456
1954 17,297 21,138 34,074 28,960 5,059 0.64 0.74 0.92 -0.682 143 22,346 973
1955 8,915 18,928 9,058 37,395 1,431 2.20 0.73 2.32 -0.472 275 28,460 868
1956 6,828 92,598 19,580 12,645 0.05 0.54 3.40 -2.722 208 20,274 594
1957 6,878 5,593 50,637 6,098 3,103 1.17 0.49 1.41 -1.172 172 5,801 1,200
1958 3,470 119,595 4,827 21,324 0.02 0.52 -1.07 0.050 129 3,587 864
1959 3,024 5,350 10,518 28,980 760 3.86 0.61 1.40 -0.002 253 2,529 900
1960 456 2,896 517 31,128 540 6.78 0.61 0.36 0.356 122 3,856 701 132 0.02 0.07 228 0.26 4.15
1961 535 8,247 186 45,291 297 12.96 0.53 -2.03 0.328 144 1,382 653 86 0.01 0.15 164 0.19 3.27
1962 10,081 2,196 4,610 443 2,793 1.26 0.55 1.79 -1.680 166 2,285 315 1,481 2.27 0.16 257 0.31 1.41
1963 5,258 347 13,430 303 8,992 0.30 0.63 -1.43 -0.472 173 2,488 175 3,657 7.30 0.41 2,505 2.62 5.80 63.9
1964 7,705 155 8,441 105 722 4.65 0.65 0.18 -0.846 215 2,866 258 135 0.01 4.41 223 0.27 14.34 64.7
1965 30,016 3,327 18,478 1,533 7,229 0.49 0.57 0.99 -0.936 245 31,140 121 2,907 6.25 0.25 1,817 1.38 8.29
1966 5,071 2,233 4,404 3,204 815 4.36 0.55 2.37 -0.534 214 34,805 136 164 0.02 0.14 245 0.29 13.17
Table 4 Estimates of recruitment, stock, the average streamflow (cfs) in the San Joaquin River at Vernalis from 15 April to 15 June (VerFloSpr), ratio of Delta exports at the SWP and CVP pumping facilities to Vernalis flows from 15 April to 15 June (ExFloSpr), the Central Valley Index of ocean harvest (CVI) corresponding to Age-3 chinook salmon, the North Pacific Index (NPI) corresponding to Age-1 chinook salmon, the mean Pacific Decadal Oscillation (PDO) from November through March corresponding to Age-1 chinook salmon, the PFEL Upwelling Index corresponding to Age-1 chinook salmon, northern anchovy landings (tons) and herring landings (tons) off the coast of California corresponding to Age-2 chinook salmon, the average streamflow (cfs) in the Stanislaus River at Ripon from 15 April to 15 June, the ratio of flows releases in the Stanislaus River to a hypothetical minimum flow release schedule based on PHABSIM and a water temperature model for 1 April to 31 May (StanMinSpr) and for 1-30 November (StanMinFal), the average flow (cfs) in the Tuolumne River at Modesto from 15 April to 15 June, the ratio of flow releases in the Tuolumne River to a hypothetical minimum flow release schedule based on PHABSIM and a water temperature model for 1 April to 31 May (TuolMinSpr) and for 1 to 30 November (TuolMinFal), and the average maximum water temperature (F) in the San Joaquin River at Vernalis for April.
YearStan Recruit
Stan Stock
Tuol Recruit
Tuol Stock
VerFlo-Spr
ExFlo-Spr
CVI Age 3
NPI Age1
PDO Age 1
Up- well
Anchovy Age 2
Herring Age 2
Ripon Flow Spring
Stan-Min-Spr
Stan- Min- Fall
Modesto Flow Spring
Tuol-Min-Spr
Tuol-Min-Fall
Max Vernalis Temp

55 55 33 33 77 77
1967 48,775 2,247 118,546 4,219 20,024 0.08 0.57 2.06 -0.610 233 15,538 179 4,616 8.50 0.20 4,251 4.57 4.12
1968 4,276 11,607 10,388 6,668 841 6.20 0.58 0.12 -0.422 228 67,639 85 162 0.01 0.69 229 0.27 12.47
1969 44,074 4,064 61,844 3,831 25,471 0.13 0.56 1.93 -0.884 221 96,243 158 5,010 7.83 0.15 6,273 8.01 2.99
1970 10,613 12,479 17,586 32,097 2,362 1.88 0.74 -3.16 0.780 191 44,852 120 1,027 0.33 3.46 568 0.74 12.00
1971 4,743 8,546 8,679 18,554 1,881 2.43 0.70 2.58 -1.418 200 69,101 63 631 0.29 0.49 326 0.35 2.28
1972 1,118 12,970 2,452 20,817 751 8.73 0.64 2.94 -1.806 207 132,636 1,410 137 0.01 1.41 230 0.25 3.47
1973 3,489 4,568 4,496 4,944 3,077 2.09 0.61 0.62 -0.266 292 82,717 2,630 1,844 2.41 0.96 299 0.35 4.67 70.8
1974 1338 3,464 2089 4403 1.63 0.59 0.16 -1.268 281 158,511 1,217 2,666 2.98 0.38 333 0.38 4.74 69.1
1975 623 1,831 1177 4505 1.38 0.64 1.13 -0.350 278 124,919 2,410 2,597 2.28 0.60 488 0.59 12.34 66.1
1976 72 1069 4,253 1508 955 5.41 0.70 1.19 -1.528 272 111,477 5,827 97 0.01 4.87 225 0.25 12.24 70.2
1977 382 535 3,044 1631 267 6.54 0.66 -2.95 1.190 254 12,629 4,930 38 0.01 0.00 132 0.16 2.37 75.4
1978 249 104 2,108 486 17559 0.30 0.66 -2.41 0.344 272 53,698 4,693 3,398 6.95 0.01 2,364 3.41 0.61 64.1
1979 43 10,549 1237 2582 2.73 0.64 1.65 -0.422 255 47,339 8,886 875 0.22 0.03 361 0.33 7.94 72.4
1980 95 65,660 1126 9036 0.60 0.72 -1.21 0.472 246 57,659 6,571 3,238 6.81 0.34 2,565 3.13 6.99 64.2
1981 92 3,543 544 2071 2.43 0.63 -4.46 0.662 300 46,462 11,689 766 1.83 0.54 294 0.32 10.96 75.0
Table 4 Estimates of recruitment, stock, the average streamflow (cfs) in the San Joaquin River at Vernalis from 15 April to 15 June (VerFloSpr), ratio of Delta exports at the SWP and CVP pumping facilities to Vernalis flows from 15 April to 15 June (ExFloSpr), the Central Valley Index of ocean harvest (CVI) corresponding to Age-3 chinook salmon, the North Pacific Index (NPI) corresponding to Age-1 chinook salmon, the mean Pacific Decadal Oscillation (PDO) from November through March corresponding to Age-1 chinook salmon, the PFEL Upwelling Index corresponding to Age-1 chinook salmon, northern anchovy landings (tons) and herring landings (tons) off the coast of California corresponding to Age-2 chinook salmon, the average streamflow (cfs) in the Stanislaus River at Ripon from 15 April to 15 June, the ratio of flows releases in the Stanislaus River to a hypothetical minimum flow release schedule based on PHABSIM and a water temperature model for 1 April to 31 May (StanMinSpr) and for 1-30 November (StanMinFal), the average flow (cfs) in the Tuolumne River at Modesto from 15 April to 15 June, the ratio of flow releases in the Tuolumne River to a hypothetical minimum flow release schedule based on PHABSIM and a water temperature model for 1 April to 31 May (TuolMinSpr) and for 1 to 30 November (TuolMinFal), and the average maximum water temperature (F) in the San Joaquin River at Vernalis for April.
YearStan Recruit
Stan Stock
Tuol Recruit
Tuol Stock
VerFlo-Spr
ExFlo-Spr
CVI Age 3
NPI Age1
PDO Age 1
Up- well
Anchovy Age 2
Herring Age 2
Ripon Flow Spring
Stan-Min-Spr
Stan- Min- Fall
Modesto Flow Spring
Tuol-Min-Spr
Tuol-Min-Fall
Max Vernalis Temp

55 55 33 33 88 88
1982 19,930 974 56,924 6253 18396 0.39 0.58 1.70 0.440 215 4,880 8,845 605 0.38 0.50 5,942 6.90 3.23 66.7
1983 34,643 1731 85,142 6611 31734 0.12 0.50 -5.44 0.764 207 3,184 4,241 4,186 9.47 7.17 9,345 11.59 13.27 67.0
1984 13,185 348 23,792 5704 3243 2.03 0.68 -2.62 1.438 257 1,792 8,801 806 1.23 8.12 573 0.66 13.31 72.7
1985 14,111 7924 4,200 7385 2197 2.94 0.74 1.11 0.862 171 1,692 8,442 693 1.14 3.24 366 0.43 7.60 73.5
1986 74,215 12384 92,577 38242 10371 0.66 0.78 -4.10 0.908 174 1,323 2.29 1.50 2,969 3.25 3.67 69.8
1987 5,992 5546 3,146 7876 2265 2.43 0.75 -2.93 1.854 180 835 1.51 2.92 473 0.48 7.87 73.8
1988 1,261 3336 495 4730 1889 3.60 0.79 -0.77 1.266 183 825 1.57 1.15 213 0.17 1.99 70.8
1989 1,152 11898 198 5923 1893 3.73 0.71 2.84 -0.650 227 972 1.76 2.82 246 0.21 1.06 76.8
1990 782 2267 306 1487 1283 3.74 0.71 2.01 -0.456 128 562 218
1991 1,561 549 1,959 106 922 3.50 0.72 2.34 -1.574 232 316 386
1992 4,295 306 1,590 64 892 2.10 0.74 -2.44 0.308 158 389 310
1993 2,089 226 2,801 74 3381 1.21 0.78 -0.15 0.492 163 1073 750
1994 1,039 347 1,204 386 1783 0.95 0.64 1.46 0.982 222
1995 19,302 993 22,970 433 19537 0.24 0.66 -0.33 -0.606 150
Table 4 Estimates of recruitment, stock, the average streamflow (cfs) in the San Joaquin River at Vernalis from 15 April to 15 June (VerFloSpr), ratio of Delta exports at the SWP and CVP pumping facilities to Vernalis flows from 15 April to 15 June (ExFloSpr), the Central Valley Index of ocean harvest (CVI) corresponding to Age-3 chinook salmon, the North Pacific Index (NPI) corresponding to Age-1 chinook salmon, the mean Pacific Decadal Oscillation (PDO) from November through March corresponding to Age-1 chinook salmon, the PFEL Upwelling Index corresponding to Age-1 chinook salmon, northern anchovy landings (tons) and herring landings (tons) off the coast of California corresponding to Age-2 chinook salmon, the average streamflow (cfs) in the Stanislaus River at Ripon from 15 April to 15 June, the ratio of flows releases in the Stanislaus River to a hypothetical minimum flow release schedule based on PHABSIM and a water temperature model for 1 April to 31 May (StanMinSpr) and for 1-30 November (StanMinFal), the average flow (cfs) in the Tuolumne River at Modesto from 15 April to 15 June, the ratio of flow releases in the Tuolumne River to a hypothetical minimum flow release schedule based on PHABSIM and a water temperature model for 1 April to 31 May (TuolMinSpr) and for 1 to 30 November (TuolMinFal), and the average maximum water temperature (F) in the San Joaquin River at Vernalis for April.
YearStan Recruit
Stan Stock
Tuol Recruit
Tuol Stock
VerFlo-Spr
ExFlo-Spr
CVI Age 3
NPI Age1
PDO Age 1
Up- well
Anchovy Age 2
Herring Age 2
Ripon Flow Spring
Stan-Min-Spr
Stan- Min- Fall
Modesto Flow Spring
Tuol-Min-Spr
Tuol-Min-Fall
Max Vernalis Temp

539539539539
Results
Before environmental variables and harvest variables could be evaluated, itwas necessary to determine the nature of the stock-recruitment relationship.The stock-recruitment relationship for the Tuolumne River population (Figure3) is similar to those described by Ricker (1975) whereas the relationship forthe Stanislaus River population (Figure 4) is relatively flat after stockexceeded about 2,500 spawners, which is intermediate to those described byRicker and Beverton-Holt (Ricker 1975).
To control the effects of stock, correlations between habitat variables, harvestvariables, and recruitment were tested in two ways. First to minimize theeffects of stock, analyses were conducted that excluded data when stock wasless than 2,500 spawners for the Stanislaus River and 6,000 spawners for theTuolumne River. Second, the analyses were conducted with all the data andthe stock estimate and the square root of stock were forced into a stepwiseregression analysis to account for the quadratic polynomial shape of the stock-recruitment relationship.
Based on the analysis that excluded low stock estimates, recruitment to boththe Stanislaus and Tuolumne rivers were significantly correlated with allspring streamflow variables, the ratio of SWP and CVP exports to Vernalisflows during smolt emigration (15 April to 15 June) and stock (Table 5). Thecorrelations with flow were strongest at Vernalis (Figures 5 and 6), particu-larly for the Stanislaus River, compared to flows in the tributaries. Modestoflows were highly correlated with Tuolumne River recruitment, but the effectwas probably a reflection of conditions at Vernalis as Modesto flows arehighly correlated with Vernalis flows (r = 0.998).
The correlations coefficients for Stanislaus River recruitment are higher withVernalis flows than with the ratio of Delta exports to Vernalis flows whendata are included from 1946 to 1959. However, this difference is suspectbecause the correlation coefficients for Tuolumne River recruitment withthese two variables are quite similar and the results for the Tuolumne Riverare probably more accurate because the data set was larger for TuolumneRiver prior to 1959.
Tuolumne River recruitment was also significantly correlated with the CentralValley Index of harvest that corresponded to Age-3 and to a lesser degreeAge-4 chinook salmon, and northern anchovy landings for both Age-2 andAge-3 fish (Table 5). Recruitment for either river was not correlated withocean climate conditions, fall streamflow in the tributaries or maximum watertemperatures at Vernalis (Table 5).

540540540540
Table 5 Pearson correlation coefficients (r), probability (p), and sample size (n) for correlations between Tuolumne River recruitment that excluded data sets with stock less than 6,000 spawners and Stanislaus River recruitment that excluded data sets with stock less than 2,500 spawners and the variables in Table 3
Tuolumne River Stanislaus River
Variable r p n r p n
VerFloSpr 0.766 0.000 23 0.769 0.000 26
ExFloSpr -0.790 0.000 23 -0.414 0.035 26
CVI Age 3 -0.629 0.001 23 -0.010 0.963 26
CVI Age 4 -0.548 0.007 23 0.171 0.403 26
NPI Age 1 -0.067 0.763 23 -0.252 0.214 26
NPI Age 3 -0.188 0.391 23 0.116 0.573 26
PDO Age 1 -0.020 0.927 23 0.019 0.926 26
PDO Age 3 0.305 0.158 23 0.156 0.448 26
Upwell Avg. -0.055 0.823 19 0.032 0.879 26
Upwell May -0.229 0.346 19 0.069 0.738 26
Upwell June 0.001 0.998 19 -0.219 0.283 26
Upwell July 0.177 0.468 19 0.196 0.338 26
Anchovy Age 2 -0.474 0.035 20 -0.014 0.955 20
Ln Anchovy Age 2 -0.517 0.020 20 0.173 0.465 20
Anchovy Age 3 -0.496 0.026 20 -0.012 0.960 20
Ln Anchovy Age 3 -0.577 0.008 20 0.330 0.155 20
Herring Age 2 0.067 0.778 20 0.001 0.998 20
VerFloSpr 0.838 0.001 11 0.780 0.000 17
ExFloSpr -0.871 0.001 11 -0.794 0.000 17
TuolMinFall 0.139 0.685 11 --- --- ---
TuolMinSpr 0.818 0.002 11 --- --- ---
Modesto Flow Spr 0.834 0.001 11 --- --- ---
Log Modesto Flow Spr 0.992 0.000 11 --- --- ---
StanMinFall --- --- --- -0.154 0.554 17
StanMinSpr --- --- --- 0.670 0.003 17
Ripon Flow Spr --- --- --- 0.657 0.004 17
Log Ripon Flow Spr --- --- --- 0.609 0.010 17
Max Vernalis Temp -0.804 0.101 5 -0.214 0.645 7

541541541541
The regression model for Tuolumne River recruitment developed from a step-wise analysis of the data set without low stock estimates included Vernalisflows (student's t-value = 3.7, p = 0.002) and the log of the ratio of exports toVernalis flows (student's t-value = -2.7, p = 0.016). The adj-R2 was 0.69.
Recruitment = 2.35 VerFloSpr - 12,515 Log(ExFloSpr) + 17,210
The regression model for the entire data set for Tuolumne River recruitmentincluded Vernalis flows (student's t-value = 5.4, p = 0.000), the log of the ratioof exports to Vernalis flows (student's t-value = -2.6, p = 0.013), and stock (stu-dent's t-value < 1.51 and p = 0.14 and 0.31 for the two variables required to fita quadratic polynomial regression). The adj-R2 was 0.71.
Recruitment = 2.89 VerFloSpr - 11,556 Log (ExFloSpr) - 0.668 Stock + 233.4 (Stock)1/2 - 4,170
The regression model for Stanislaus River recruitment developed from a step-wise analysis of the data set without low stock estimates included only Verna-lis flows (student's t-value = 5.9, p = 0.000). The adj-R2 was 0.57.
Recruitment = 2.35 VerFloSpr + 4,295
The regression model for the entire data set for Stanislaus River recruitmentincluded Vernalis flows (student's t-value = 5.4, p = 0.000) and stock (student'st-value < 1.11 and p = 0.10 and 0.27 for the two variables required to fit a qua-dratic polynomial regression). The adj-R2 was 0.45.
Recruitment = 1.46 VerFloSpr - 1.556 Stock + 348.7 (Stock)1/2 - 9,224
The correlations with Stanislaus River recruitment were relatively weak com-pared to those with Tuolumne River recruitment partially due to errors in thesegregation of escapement into cohorts. Recruitment abundance was deter-mined by escapement size and the percentage of two-year-old fish (%Age 2s)and error in the %Age 2s had a substantial influence on the correlation analy-sis when escapement was high. For example, recruitment to the StanislausRiver in 1986 appears to be abnormally high compared to earlier estimates inFigure 6, but the 1986 estimate is probably more accurate. The size of recruit-ment for the 1986 estimate is determined by the percentage of %Age 2s in the1987 escapement. The length-frequency analysis indicates that the %Age 2sfor 1987 was 67% whereas the %Age 2s for 1987 based on the standard lengthcriterion was only 36% (Table 2). This suggests that at least some of the high

542542542542
recruitment estimates for the Stanislaus River prior to 1985 were low, particu-larly those for 1956, 1958, and 1969, due to underestimation of the %Age 2sbased on the standard length criterion. This did not appear to be as great aproblem for the Tuolumne River correlations as the %Age 2s estimates weresimilar between the length-frequency estimates and the standard length crite-rion estimates for all the large cohorts in 1982, 1983, and 1986. Other sources oferror in the recruitment estimates includes errors in the escapement estimatesand the use of the age ratios in Table 1, which ignore interannual variability inocean mortality. On the other hand, it is also possible that the relatively weakcorrelations with Stanislaus River recruitment occurred because importantenvironmental factors that affected the Stanislaus River population were notincluded in the analysis.
Figure 3 The relationship between stock and recruitment for the Tuolumne River for 1939 to 1995. To minimize the effects of flow in the stock-recruitment relationships, only data sets with Vernalis flows between 8,000 and 15,000 cfs are shown. Recruitment is identified according to the year when the fish emigrated as juveniles.
0
20000
40000
60000
80000
100000
120000
Rec
ruitm
ent
0 20000 40000 60000 80000 100000 120000 140000 Stock
45
46
56
63
80
86

543543543543
Figure 4 The relationship between stock and recruitment for the Stanislaus River for 1945 to 1995. To minimize the effects of flow in the stock-recruitment relationships, only data sets with Vernalis flows between 3,000 and 10,000 cfs are shown. Recruitment is identified according to the year when the fish emigrated as juveniles.
Figure 5 The relationship between recruitment to the Tuolumne River and the average flow in the San Joaquin River at Vernalis between 15 April and 15 June from 1939 to 1995. To minimize the effects of low levels of stock in the flow relationships, only data sets with stock greater than 6,000 spawners are shown. Recruitment is identified according to the year when the fish emigrated as juveniles.
0
5000
10000
15000
20000
25000
30000
35000
Rec
ruitm
ent
0 2500 5000 7500 10000 12500 15000 Stock
50
51
53
63
65
84
93
0
50000
100000
150000
200000
Rec
ruitm
ent
0 5000 10000 15000 20000 25000 Vernalis Flows (cfs)
40
41
4243
4445
46
47
49
505153 54
55
56
596061
7071
72
86
87

544544544544
Figure 6 The relationship between recruitment to the Stanislaus River and the average streamflow in the San Joaquin River at Vernalis between 15 April and 15 June from 1946 to 1995. To minimize the effects of low levels of stock in the flow relationships, only data sets with stock greater than 2,500 spawners are shown. Recruitment is identified according to the year when the fish emigrated as juveniles.
Discussion
The correlation analyses suggest that flow in the San Joaquin River, sport andcommercial harvest of chinook salmon, and to a lesser extent the harvest ofnorthern anchovies have affected recruitment to the Tuolumne and Stanislausrivers. Although recruitment may be affected by Delta exports, the correlationanalysis cannot distinguish between the effects of exports and those of stream-flow. An inspection of the scatter plots between recruitment and Vernalisflows indicates that the populations responded to flow in the 1940s as they didin the 1980s, which suggests that the habitat has not changed substantiallyduring the period of study.
In addition to the variables included in the correlation analysis, the chinooksalmon populations may have been affected by other factors that includeinstream gravel mining, dredging and reclamation of the Delta, sedimentationof spawning and rearing habitat, freshwater predators, disease, contaminants,unscreened diversions, instream harvest of spawners, and hatchery manage-ment. The mechanisms by which these factors and the variables tested in thecorrelation analyses may have affected chinook salmon recruitment are dis-cussed below.
0
20000
40000
60000
80000
Rec
ruitm
ent
0 5000 10000 15000 20000 25000 30000 35000 Vernalis Flows (cfs)
5053
54
5556
57
58
5961
65
68
69
7071
72 73
85
86
878889

545545545545
Streamflow and Delta ExportsThe operation of Friant Dam, which began in 1947, blocked access to aboutone-third of the spawning habitat in the mainstem San Joaquin River, elimi-nated perennial flows below the dam, and coincided with the rapid decline inthe spring-run chinook population (Fry 1961, Yoshiyama and others 1998) andrecruitment of fall-run chinook salmon to the Tuolumne River. However, thedecline in Tuolumne River recruitment during the mid to late 1940s was prob-ably more of a response to a change from a wet climate to a dry climate thandue to the operations of the dam. During the ten years before the completionof Friant Dam (1937 to 1946), the San Joaquin Valley 60-20-20 Index (SJVI)averaged 3.791 maf1 and springtime Vernalis flows were relatively high(mean 14,439 cfs) whereas spring Vernalis flows and the SJVI were low duringthe previous 7-year-period (mean of 7,097 cfs and 2.544 maf, respectively from1930 to 1936) and the subsequent 10-year-period (mean of 6,911 cfs and 3.108maf, respectively from 1947 to 1956). The reduction in Vernalis flows duringspring due to the operation of Friant Dam was relatively minor compared tothe climate change as indicated by the ratio of Vernalis flows to the SJVI,which was 12.5% lower for the 1947 to 1956 period compared to the 1937 to1946 period.
The effect of constructing a large reservoir on each of the three tributariesbetween 1966 and 1981 also appears to be negligible. All three tributaries hadrelatively small reservoirs that blocked upstream migration of adult salmonsince of the construction of Wheaton Dam on the Tuolumne River in 1871;Tulloch Dam on the Stanislaus River in 1858; and Crocker-Huffman diversiondam on the Merced River in the 1920s. In 1966, New Exchequer Dam wascompleted on the Merced River; it provides 1.0 maf of storage, which is about100% of mean annual runoff. In 1971, New Don Pedro was completed on theTuolumne River; it provides 2.0 maf of storage, which is about 100% of meanannual runoff. In 1981, New Melones was approved for filling on the Stanis-laus River; it provides 2.4 maf of storage, which is about 240% of mean annualrunoff. Although, the large storage capacity of these reservoirs reduces thefrequency of winter flood flows, mean springtime flows have changed littlesince their construction. After all three large reservoirs had been constructed,the mean spring Vernalis flow and the SJVI was 6,791 cfs and 2.938 mafrespectively from 1981 to 1995. This is a slightly greater flow compared to the19-year-period prior to their construction from 1947 to 1965, when the meanVernalis flow was 6,046 cfs and the mean SJVI was similar at 2.986 maf.
The proportion of Vernalis flows exported by the CVP and SWP pumpingfacilities in the Delta is also strongly correlated with recruitment to the Stanis-laus and Tuolumne rivers. The export of water from the south Delta began in
1. Million acre-feet.

546546546546
1940 at Rock Slough by the Contra Costa Water District, which has a capacityof 350 cfs. Exports began in 1951 at the CVP’s Tracy Pumping Plant, which hasa capacity of 4,600 cfs. The Delta Cross Channel was completed in 1951 toallow Sacramento River flow to pass through Snodgrass Slough, the lowerMokelumne River, and the South Delta. The State Water Project (SWP), whichhas a capacity of 10,000 cfs, came on-line in 1967. The combined permittedexport capability of the CVP and SWP facilities is about 11,000 cfs. Since 1966,the combined exports at the SWP and CVP has gradually increased fromabout 500,000 acre-feet to about 3,500,000 acre-feet in the 1990s.
One effect of Delta pumping is that the percentage of San Joaquin River flowthat passes through the Old River increases from about 60% when there is nopumping to about 90% when the total exports are about four times the SanJoaquin River flow at Vernalis (DWR 1962). It is generally believed that theriver channels leading to the export facilities have high densities of black bassand striped bass, which prey on juvenile salmon. Particularly high predationrates at Clifton Court Forebay, which began operating in 1968 to control thehead at the SWP, are thought to cause higher mortality rates at the SWP com-pared to the CVP. DFG estimates that for smolts salvaged at the screens, mor-tality due to handling is 37% at the CVP facility and 39% at the SWP facility(EA 1992). To help minimize entrainment into the Old River, a rock barrierwas installed at the head of the Old River from 23 April to 2 June 1992, 23April to 18 May 1994, 11 to 16 May 1996, and 16 April to 15 May 1997 whentwo 48-inch culverts were installed. The rock barrier cannot be installed whenVernalis flows exceed about 5,000 cfs. In addition, the USFWS BiologicalOpinion on delta smelt assumes that the barrier increases entrainment of deltasmelt and juvenile winter-run chinook salmon from the Sacramento basin atthe SWP and CVP pumping facilities, and so the barrier cannot be installedprior to 15 April or later than 15 May (30 May in special circumstances).
Smolt Survival in the DeltaThe downstream migration of chinook salmon smolts in the San Joaquin basingenerally begins in early April, peaks between late April and mid May in dryyears (or in late May in normal and wet years), and then rapidly declines inJune as determined by trawling at Mossdale (DFG 1991 to 1998) and withscrew traps in the lower Stanislaus River (Demko and others 1999). Mostsmolts migrated when they reached a fork length of 65 to 100 mm.
Smolt survival has been studied by the U.S. Fish and Wildlife Service(USFWS) and DFG since 1982 by releasing groups of about 25,000 to 100,000hatchery reared juveniles with coded-wire-tags (CWT) at various locations inthe tributaries and Delta in April and May and recapturing them with a trawlat Mossdale and Chipps Island to investigate the effects of flows and exports.The results indicate that smolt survival is lowest in the Old River and in the

547547547547
mainstem between the Old River and the mouth of the Mokelumne River andthat survival in this mainstem reach is strongly correlated with flow, watertemperature, and to a lesser degree exports. In addition, the installing a bar-rier at the head of Old River (HORB) appears to ameliorate the impacts ofexports by preventing entrainment of smolts in the Old River and by increas-ing flow and reducing water temperatures in the mainstem below the OldRiver.
Evaluations of smolt survival in different reaches in the Delta were madeusing an estimate of absolute smolt survival, which was computed as a ratioof an index for an upstream release group (e.g., Dos Reis) divided by the indexfor a downstream release group (e.g., Jersey Point). Presumably the ratio esti-mate permits comparisons between years because the ratio factors out theinfluence of gear efficiency (GE) and fish behavior and health (FB&H) thatmight occur between tests made in different years. One assumption of thisratio-based estimate is that the trawl efficiency (TE) and the influence of fishbehavior and health are the same for both the upstream and downstreamrelease groups. For trawl efficiency to be the same for both groups, theupstream group would have to be released several days before the down-stream group was released so that both groups arrived at the recapture pointat the same time. For the fish behavior and health influences to be the same forboth groups, all test fish would have to be reared under the same conditions(namely, at the same hatchery, from the same parent stock, and released atsimilar sizes and health). The mathematical equation for the ratio estimate fora Dos Reis upper release group and a Jersey Point lower release group is asfollows:
where,
SSI(DR) = Smolt survival index for fish released at Dos Reis and recap-tured at Chipps Island.
SSI(JP) = Smolt survival index for fish released at Jersey Point andrecaptured at Chipps Island.
SS(DR–JP) = The percentage of fish that survive between Dos Reis andJersey Point.
SS(JP–CI) = The percentage of fish that survive between Jersey Pointand Chipps Island.
SSI DR( )SSI JP( )---------------------- SS DR JP–( ) SS JP CI–( )× GE× FB&H×
SS JP CI–( ) GE× FB&H×-------------------------------------------------------------------------------------------------------- SS DR JP–( )= =

548548548548
GE = The percentage of fish that survived to Chipps Island that werecaptured by the trawl.
FB&H = The percentage of fish that didn't arrive at Chipps Island dueto the behavior and/or health of the hatchery fish. (For example, oneyear's study fish might be relatively small, causing them to migrate atdifferent rates, suffer different predation rates, or be captured at differ-ent rates than study fish released in a different year.)
The result of computing this ratio is an absolute survival estimate for fishmigrating between the upper release site and the lower release site, SS(DR-JP).
The absolute survival estimates for juveniles migrating through the Delta inthe mainstem San Joaquin River were much lower between the head of OldRiver and the mouth of the Mokelumne River than in the reach between themouth of the Mokelumne and Jersey Point in spring 1991 (USFWS 1992).Absolute smolt survival for Feather River hatchery fish in mid-April was63.7% between Dos Reis and Stockton (Buckley Cove), and 15.7% betweenStockton and the Mokelumne River, 34.3% between Empire Tract and theMokelumne River, and 91.7% between the mouth of the Mokelumne Riverand Jersey Point. During this test, Vernalis flows averaged 1,150 cfs, totalDelta exports averaged 4,283 cfs, dissolved oxygen averaged 6.3 ppm atRough and Ready Island near Stockton, water temperature was about 60 Fnear Stockton, flows in the Delta Cross Channel and Georgiana Slough aver-aged about 4,000 cfs, and recoveries of CWT fish ranged from 17 for Dos Reisreleases and 94 for Jersey Point releases. It is likely that the relatively highflows from the Delta Cross Channel, Georgiana Slough, and the MokelumneRiver improved conditions for smolt survival in the Delta downstream of theMokelumne River compared to the reach near Stockton. Absolute smolt sur-vival during early May increased to 29.7% between Stockton and the mouth ofthe Mokelumne River but decreased to 37.7% between the mouth of the Moke-lumne and Jersey Point. During this test, Vernalis flows averaged 959 cfs, totalDelta exports averaged 2,613 cfs, dissolved oxygen averaged 5.4 ppm atRough and Ready Island near Stockton, water temperature was about 65 Fnear Stockton, flows in the Delta Cross Channel and Georgiana Slough aver-aged about 3,500 cfs, and recoveries of CWT fish ranged from 20 for BuckleyCove releases and 89 for Jersey Point releases. The lower smolt survival esti-mates between the Mokelumne River and Jersey Point that occurred in Maycompared to April was probably a response of the Feather River hatchery fishto increased temperatures, lower flows, lower dissolved oxygen concentra-tions, and perhaps increased predation.
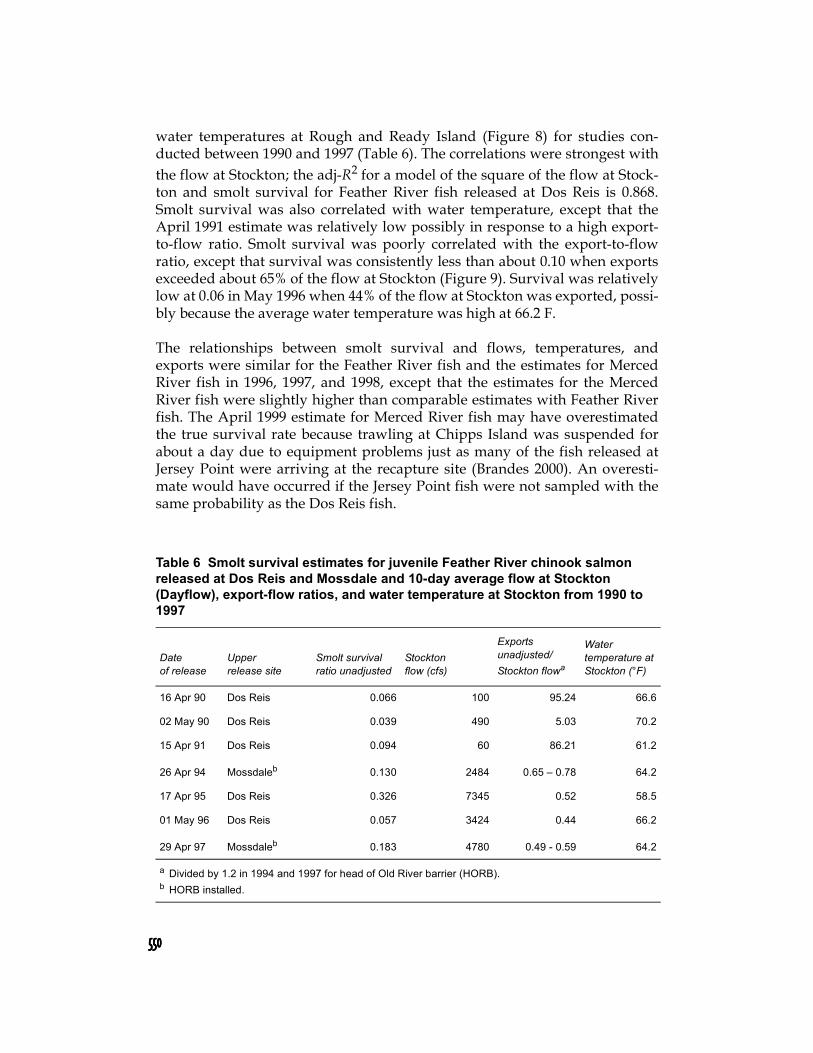
Other correlations were tested between the absolute survival estimates forjuveniles migrating in the mainstem river between Dos Reis and Jersey Pointfrom 1990 to 1997 and ten-day averages of (1) flow at Stockton (Brandes 1998),
549549549549
(2) water temperatures at Stockton (Interagency Ecological Program continu-ous monitoring station at Rough and Ready Island), and (3) the ratio of thecombined CWP and SWP pumping rates to flow at Stockton (Table 6). Stream-flow at Stockton was estimated by Brandes (1998) using three sets of equationsincorporating flows at Vernalis, Delta consumptive use, and Delta exportsthat are presented in DWR (1986). An arc-sine transformation was made to thesmolt survival variable to minimize bias that would otherwise result from thedistribution of the variance of the percentages being a function of their mean(Sokal and Rohlf 1995). When the head of Old River barrier was installed in1994 and 1997, it was assumed that it would increase CVP and SWP exportsby about 20% in the downstream channels compared to tests when the barrierwas not installed. This is based on the rough estimate that approximately 20%of the flow that is exported is conveyed through the Old River (R. Oltmann,personal communication, see “Notes”). To correct for this effect, the flow-to-export ratios for 1994 and 1997, when the test fish were released at Mossdaleand the barrier was installed, were divided by 1.2. All the smolt survival ratiosused for this analysis consisted of about 100,000 Feather River Hatchery fishreleases at Dos Reis and at Mossdale if the barrier was installed, and at least50,000 Feather River Hatchery fish at Jersey Point.
Paired studies with Feather River Hatchery fish and Merced River Hatcheryfish in May 1996 and April 1997 indicate that the absolute survival for theMerced River fish was about twice that of the Feather River fish for the sameenvironmental conditions (Figures 7, 8, and 9). Therefore, survival estimatesfor Merced River fish were not included in the correlation analysis.
Study results from spring 1989 were also not included in this analysis, becausethe average length of the fish for the release group at Jersey Point was muchsmaller than for the release group at Dos Reis, a condition that probably vio-lated the assumption of the survival equation that the fish in both the upperand lower release groups must behave similarly. The spring 1989 smolt sur-vival ratio was unusually high for the environmental conditions suggestingthat the relatively large fish released at Dos Reis survived at higher rates thandid the smaller fish in the control group released at Jersey Point.
Results from spring 1998 tests with Feather River fish were not includedbecause 30% to 40% of the Feather River fish had died at the hatchery from theviral disease Infectious Hematopoietic Necrosis and many of the test fishshowed symptoms of the disease. Further, survival estimates were unusuallylow (13%) considering Vernalis flows were about 20,000 cfs and exports wereabout 1,800 cfs.
Absolute survival estimates for Feather River juveniles migrating in the main-stem river between Dos Reis and Jersey Point were positively correlated withhigh flows at Stockton (Figure 7) and negatively correlated with average daily
550550550550
water temperatures at Rough and Ready Island (Figure 8) for studies con-ducted between 1990 and 1997 (Table 6). The correlations were strongest withthe flow at Stockton; the adj-R2 for a model of the square of the flow at Stock-ton and smolt survival for Feather River fish released at Dos Reis is 0.868.Smolt survival was also correlated with water temperature, except that theApril 1991 estimate was relatively low possibly in response to a high export-to-flow ratio. Smolt survival was poorly correlated with the export-to-flowratio, except that survival was consistently less than about 0.10 when exportsexceeded about 65% of the flow at Stockton (Figure 9). Survival was relativelylow at 0.06 in May 1996 when 44% of the flow at Stockton was exported, possi-bly because the average water temperature was high at 66.2 F.
The relationships between smolt survival and flows, temperatures, andexports were similar for the Feather River fish and the estimates for MercedRiver fish in 1996, 1997, and 1998, except that the estimates for the MercedRiver fish were slightly higher than comparable estimates with Feather Riverfish. The April 1999 estimate for Merced River fish may have overestimatedthe true survival rate because trawling at Chipps Island was suspended forabout a day due to equipment problems just as many of the fish released atJersey Point were arriving at the recapture site (Brandes 2000). An overesti-mate would have occurred if the Jersey Point fish were not sampled with thesame probability as the Dos Reis fish.
Table 6 Smolt survival estimates for juvenile Feather River chinook salmon released at Dos Reis and Mossdale and 10-day average flow at Stockton (Dayflow), export-flow ratios, and water temperature at Stockton from 1990 to 1997
Dateof release
Upperrelease site
Smolt survival ratio unadjusted
Stocktonflow (cfs)
Exports unadjusted/ Stockton flowa
Water temperature at Stockton (°F)
16 Apr 90 Dos Reis 0.066 100 95.24 66.6
02 May 90 Dos Reis 0.039 490 5.03 70.2
15 Apr 91 Dos Reis 0.094 60 86.21 61.2
26 Apr 94 Mossdaleb 0.130 2484 0.65 – 0.78 64.2
17 Apr 95 Dos Reis 0.326 7345 0.52 58.5
01 May 96 Dos Reis 0.057 3424 0.44 66.2
29 Apr 97 Mossdaleb 0.183 4780 0.49 - 0.59 64.2
a Divided by 1.2 in 1994 and 1997 for head of Old River barrier (HORB).b HORB installed.

551551551551
Figure 7 The relationship between streamflow at Stockton and the absolute smolt survival estimate for fish reared at the Feather River Hatchery (FRH) and Merced River Hatchery (MRH) and released at Dos Reis or at Mossdale with a barrier at the Head of the Old River, and subsequently recaptured at Chipps Island from 1990 to 1999. Data points are identified by the release date.
Figure 8 The relationship between average water temperature at Stockton and the absolute smolt survival estimate for fish reared at the Feather River Hatchery (FRH) and Merced River Hatchery (MRH) and released at Dos Reis or at Mossdale with a barrier at the Head of the Old River, and subsequently recaptured at Chipps Island from 1990 to 1999. Data points are identified by the release date. The low survival estimate for May 1991 was probably a result of a low Export-Flow ratio (see Figure 9).
0%
10%
20%
30%
40%
50%
60%
Abs
olut
e Sm
olt S
urvi
val
0 2000 4000 6000 8000 Streamflow (cfs) at Stockton
4/905/90
4/914/94
5/96
4/97
4/95
5/96
4/974/98
4/99
FRH MRH
0%
10%
20%
30%
40%
50%
60%
Abs
olut
e Sm
olt S
urvi
val
58 60 62 64 66 68 70 72 Water Temperature (F) near Stockton
4/905/90
4/914/94
5/96
4/97
4/95
5/96
4/974/98
4/99
FRH MRH

552552552552
Figure 9 The relationship between the adjusted ratio of Delta CVP and SWP exports to streamflow at Stockton and the absolute smolt survival estimate for fish reared at the Feather River Hatchery (FRH) and Merced River Hatchery (MRH) and released at Dos Reis or at Mossdale with a barrier at the Head of the Old River, and subsequently recaptured at Chipps Island from 1990 to 1999. Data points are identified by the release date. The relatively low May 1996 survival estimate was probably a result of high water temperatures (see Figure 8).
USFWS studies suggest smolt survival in the Delta is lower for fish that enterthe Old River than for those that remain in the mainstem although the effect offlow and exports on survival in the Old River are uncertain. When Vernalisflows were 1,900 cfs and exports were about 10,000 cfs in mid-April 1989, theratio of Chipps Island recoveries for Feather River fish released in the upperOld River to the recoveries of fish released at Dos Reis was 0.64. This suggeststhat survival rates for the fish migrating in the Old River were 64% of the sur-vival rates for the Dos Reis fish, although the accuracy of the estimate ishighly questionable because only a total of 13 fish was recovered from bothgroups. A comparison of studies conducted in 1995, 1998, and 1999 duringwhich fish were released upstream of Old River at Mossdale and downstreamof Old River at Dos Reis and no barrier was installed at the head of Old River(HORB) suggests that smolt survival in the Old River was similar to the sur-vival in the mainstem San Joaquin River when exports averaged 1,800 cfs butwere low when exports exceeded about 3,000 cfs. The relative survival in OldRiver averaged 0.73 for three tests with Feather River fish in April and May1995 (a total of 80 fish recovered), when Vernalis flows were between 18,400and 23,000 cfs and exports were between 3,300 and 3,700 cfs. Similarly the rel-
0%
10%
20%
30%
40%
50%
60%
Abs
olut
e Sm
olt S
urvi
val
0.1 1 10 100 Exports HORB Adjusted/Flow Stockton
4/905/90
4/914/94
5/96
4/97
4/95
5/96
4/974/98
4/99
FRH MRH
553553553553
ative survival in Old River averaged 0.65 with Merced River fish in April 1999(75 fish recovered), when Vernalis flows averaged 7,000 cfs and exports aver-aged 3,500 cfs. However, the relative survival in the Old River was 0.93 (181fish recovered) with Merced River fish in April 1998, when Vernalis flowswere about 22,000 cfs and exports were 1,800 cfs. It was apparent during the1998 studies that approximately 45% of the fish released at Mossdale enteredthe Old River while 55% remained in the main channel as indicated by the lowrecoveries of Mossdale fish at the Jersey Point trawl site compared to theMossdale recoveries at Chipps Island (USFWS unpublished data). The lowsurvival rates in Old River in 1995 compared to 1998 appear to have beencaused by unsuitable conditions in the Old River in 1995 because the absolutesurvival estimates for fish migrating through the mainstem San Joaquin Riverbetween Dos Reis and Jersey Point were 0.33 for 1995 and 0.32 for 1998. Multi-plying the absolute survival estimates in the mainstem by the relative survivalestimates for the Old River to the mainstem gives a result of an absolute sur-vival estimate in the Old River of 0.21 for 1995 and 0.30 for 1998. This suggeststhat the lower export rates of 1,800 cfs in April 1998 resulted in a 39% highersurvival estimate than the export rate of 3,300 to 3,700 cfs in April 1995. Incomparison, reducing the ratio of exports to Vernalis flows from 0.175 in 1995to 0.080 in 1998 would have increased recruitment to the Tuolumne River byabout 20% based on the regression model that included stock.
Installing a rock barrier at the head of the Old River has increased the survivalof juveniles migrating through the Delta in two ways. First, it prevents fishfrom being entrained in Old River where survival appears to be about 60 to70% of the survival rate of fish that remain in the main channel. Second, thebarrier more than doubles the flow in the mainstem San Joaquin between thehead of the Old River and the mouth of the Mokelumne River, a reach wheresurvival rates are usually low. Smolt survival studies conducted in spring1996 and 1997 provide a good test of a barrier, because
1. The barrier was installed with two unscreened 48-inch culverts that passed about 300 cfs in 1997 whereas there was no barrier in 1996 until the last few days of the test.
2. Vernalis flows were similar, about 6,500 cfs in 1996 and about 6,200 cfs in 1997.
3. Delta exports were similar, about 1,500 cfs in 1996 and about 2,000 cfs in 1997.
4. Separate tests were conducted with fish from the Feather River and Merced River hatcheries.

554554554554
The absolute smolt survival estimate for Feather River Hatchery fish releasedat Dos Reis on 29 April 1997 when the barrier was installed was 18% (10 fishrecovered) which was about triple the survival estimate of 6% (2 fish recov-ered) for Feather River fish released at Dos Reis on 1 May 1996 when the bar-rier had not been fully installed until 11 May. Paired releases with MercedRiver Hatchery fish indicated that smolt survival was 27% in 1997 (15 fishrecovered), about double the survival estimate of 13% for 1996 (10 fish recov-ered).
The total benefits of a head of Old River barrier that “leaked” no more thanabout 300 cfs could be to increase smolt survival by about 225%. Eliminatingentrainment into the Old River would increase absolute survival by about25% to 35% when exports are about 3,000 cfs or greater, and increasing flowsand reducing water temperatures in the mainstem near Stockton would gainanother 200% increase in survival based on the paired survival studies withMerced River and Feather River hatchery fish.
Juvenile Survival in the TributariesHistorically, flow releases for fishery needs were very low until 1987 for theStanislaus River and 1995 for the Tuolumne River when flow requirementswere increased based on IFIM and water temperature studies. Flow releasesin the Stanislaus River were less than 50% of minimal levels required to pro-vide suitable habitat based on the IFIM and water temperature studies in 12 of28 years (43%) during April and May and in 15 of 28 years (54%) duringNovember from 1960 to 1987 (StanMinSpr and StanMinFal in Table 3). In theTuolumne River, flow releases were less than 50% of minimal levels in 18 of 30years (60%) during April and May and in 1 of 30 years (3%) in November from1960 to 1989 (TuolMinSpr and TuolMinFal in Table 3). Since the flow require-ments were increased in the Stanislaus and Tuolumne rivers, base flows areexpected to be adequate in all but dry and critical years. However, theincrease in the minimum required flows between 1987 and 1997 has notincreased escapement.
Smolt survival studies were conducted intermittently with coded-wire-tagged(CWT) fish from the Merced River Hatchery in the Stanislaus, Tuolumne, andMerced rivers beginning in 1986 (DFG data). Absolute survival estimates inthe tributaries and upstream of the Old River are usually higher than the sur-vival estimates for fish migrating downstream of the Old River near Stockton.Low survival rates occurred during the drought of 1987 through 1990 whenflows were low and water temperatures were usually high. Survival in theStanislaus River was much higher in 1988, when the mean water temperatureduring the test was 60 F than in 1989 when the mean water temperature was64 F.

555555555555
Table 7 Absolute smolt survival based on Mossdale recoveries (Moss) and Chipps Island recoveries (Chipps), flow at the downstream boundary of study reach (lower release point), and the number of recoveries (n) for the upper and lower release sites for the Stanislaus River between Knights Ferry and Naco West, the Tuolumne River between the Old La Grange Bridge and Mapes, the Merced River between the fish hatchery and the mouth, and the mainstem San Joaquin River between the mouth of the Merced River and Dos Reis and between the mouth of the Merced River and the mouth of the Tuolumne River
Upper and lower release sites
Date of release at upper site
Absolute survival (Moss) recoveries (n)
Absolute survival (Chipps) recoveries
(n) River flow (cfs)Upper & LowerStanislaus River 28-Apr-1986 0.59, n = ? 0.61, n = 37 & 60 1,200Upper & LowerStanislaus River 26-Apr-1988 0.54, n = 278 & 828 0.78, n = 11 & 13 900Upper & LowerStanislaus River 20-Apr-1989 0.37, n = 471 & 1,033 0.28, n = 7 & 11 900Upper & LowerStanislaus River 18-May-2000 0.57, n = 217 & 250 ? 1,500Upper & LowerTuolumne River 14-Apr-1986 --- 1.48, n = 35 & 20 5,500Upper & LowerTuolumne River 16-Apr-1987 0.31, n = 128 & 317 0.28, n = 5 & 18 560Upper & LowerTuolumne River 30-Apr-1990 0.30, n = 63 & 169 1.00, n = 4 & 1 600Upper & LowerTuolumne River 23-Apr-1994 1.73, n = 207 & 72 0.75, n = 3 & 2 1,200Upper & LowerTuolumne River 04-May-1995 0.80, n = 58 & 46 1.14, n = 21 & 12 7,600Upper & LowerTuolumne River 26-Apr-1996 0.31, n = 64 & 156 0.57, n = 3 & 4 2,700Upper & LowerTuolumne River 22-Apr-1997 0.44, n = 32 & 56 0.23, n = 3 & 12 2,300Upper & LowerMerced River 22-Apr-1994 0.34, n = 147 & 354 3.00, n = 6 & 2 985Upper & LowerMerced River 03-May-1995 0.71, n = 82 & 105 0.75, n = 18 & 18 3,950Upper & LowerMerced River 25-Apr-1996 0.82, n = 112 & 102 1.00, n = 1 & 1 1,200Upper & LowerMerced River 20-Apr-1997 0.33, n = ? 0.29, n = 5 & 16 1,390San Joaquin RiverTuolumne-Dos Reis 14-Apr-1986 --- 0.79, n = 20 & 35 21,500 at VernalisSan Joaquin RiverTuolumne-Dos Reis 16-Apr-1987 --- 0.19, n = 16 & 80 2,790 at VernalisSan Joaquin River Merced-Tuolumne 03-May-1995 --- 0.91, n = 21 & 12 17,700 at VernalisSan Joaquin River Merced-Tuolumne 22-Apr-1997 --- 0.82, n = 16 & 12 5,800 at VernalisSan Joaquin RiverTuolumne-Dos Reis 17-Apr-1998 --- 0.66, n = 38 & 93 22,000 at Vernalis

556556556556
High flows trigger juvenile salmon, particularly the fry, to migrate from therivers into the San Joaquin River and Delta where survival rates are believedto be low compared to those in the tributaries. Studies by Erkkila and others(1950) indicate that many more chinook salmon fry (about 40 mm long) werecollected by trawling in the San Joaquin Delta in March 1949 when Vernalisflows ranged between 1,340 cfs and 4,100 cfs compared to the number of largejuveniles and smolts collected from April through June of the same year. Thissuggests many salmon migrate as fry into the Delta even during dry winters.Recent screw trapping studies indicate that the fry migrations coincided withthe onset of peak flows in February and March in the Stanislaus River in 1996and 1998 (Demko and Cramer 1997, Demko and others 1999, S.P. Cramer &Associates, Inc. 1997) and the Tuolumne River in 1998 (DFG Region 4, unpub-lished data). It is generally assumed that juvenile mortality rates are higher inthe Delta than in the tributaries due to the high densities of predators, such asblack bass and striped bass, large number of small unscreened diversions, rip-rapping and channelization of shallow water habitat, and direct mortality atthe State and federal pumping facilities in the Delta. However, studies havenot been conducted to test this assumption.
Delayed Adult MigrationHallock and others (1970) showed that radio-tagged adult chinook salmondelayed their migration at Stockton whenever dissolved oxygen (DO) levelswere less than 5 mg/l in October during the 1960s and there are concerns thatdelays may reduce egg viability and increase harvest of adults before spawn-ing occurs. Hallock reported that DO levels usually increased to suitable lev-els by November. DO levels near Stockton in October and November weregreater than 5 mg/l from 1983, when DWR began monitoring, to 1990, butwere substantially lower than 5 mg/l for most of October in 1991 and 1992.The Head of the Old River Barrier was installed in fall 1992, but it did not cor-rect the problem. In 1993, DO levels were low until about 10 October and it islikely that pulse flows that raised Vernalis flows to about 4,000 cfs on 7 Octo-ber were responsible for increasing DO levels at Stockton. Similarly in 1994,DO levels were low until 15 October when pulse flows raised Vernalis flowsto about 2,000 cfs. In 1995, DO levels were near 5 mg/l in mid to late Septem-ber until Vernalis flows increased from about 3,000 cfs to 6,000 cfs throughmid October. Low DO levels also occurred in 1996 until 12 October whenpulse flow releases increased Vernalis flows from 2,000 to about 3,000 cfs.
Low DO levels in the ship channel during summer and early fall months arepartly (if not primarily) a result of the decomposition of algal biomass that isproduced in the comparatively shallow, nutrient-rich water upstream ofMossdale and subsequently transported into the much deeper waters of theship channel (McCarty 1969; E. Van Nieuwenhuyse, personal communication,see “Notes”). The algae, mostly diatoms, are not adapted to deep water condi-
557557557557
tions and quickly settle out and decompose on the streambed. Simulationsperformed using the City of Stockton's DO model (Schanz and Chen 1993)indicate that increasing flow at Vernalis with the head of Old River barrierclosed generally improves DO conditions at Stockton during most months.But in October, warm temperatures and the DO demand exerted by ammoniafrom the Stockton wastewater plant, the rotting algal biomass, and otherorganic matter usually keep DO levels well below the 6 mg/l standard.
The chlorophyll levels at Vernalis are literally among the highest everrecorded for streams worldwide and much of this production may be fueledby feedlot operations in the catchment. On the other hand, it is possible thatthe nutrient loading responsible for the high algal production stems frommuch more diffuse processes, such as tile drainage from row crops ororchards. An EPA-style TMDL (total maximum daily load) analysis for nutri-ents (especially phosphorus) for the San Joaquin catchment would be the firststep toward resolving these issues (Lee and Jones-Lee 2001).
The Stockton DO model does not yet explicitly include algae, however, so itspredictions about the effects of increased flow should be viewed with healthyskepticism. It is conceivable that under some circumstances sending moreVernalis water to the ship channel could make matters worse by increasing itsorganic matter loading rate. Ideally, the continuous monitoring stationsupstream of the ship channel would be equipped with fluorometers calibratedto measure chlorophyll concentration (an indirect measure of algal biomass).Such a system would alert managers when algal biomass levels at Vernalis orfurther upstream are extremely high and give them time to take appropriateaction.
Under most circumstances, the loading of algal biomass produced naturally inthe San Joaquin river upstream is probably a much more serious problem forDO in the ship channel than organic matter loading from the Stockton waste-water treatment ponds. The loading of dissociated ammonium from thewastewater facility, however, may pose a potential toxicity problem. Whenalgae are abundant and DO upstream becomes supersaturated (due to photo-synthesis), pH levels also increase. High pH and high ammonium concentra-tion lead to higher levels of undissociated ammonia, which is toxic to fish andaquatic invertebrates. It is possible that the salmon are responding to this tox-icity rather than to low DO.
There is concern that pulse flow releases in mid October to attract adultsalmon may cause the fish to enter the rivers earlier than they would other-wise, which may expose them to high water temperatures when the pulseflows cease. The number of adults collected at the trap operated by DFG at theOrange Blossom Bridge (river mile 47) in 1965 and 1967, when there were suit-able DO levels near Stockton during migration, gradually increased from mid

558558558558
October to a high in mid November, when suitable temperatures typicallyoccur only in the upstream reaches (Hallock and others 1970). However, sur-veys conducted in the Stanislaus River in fall 1994 and 1995 suggest that fewadult salmon had entered the river before early November even when DOconcentrations were about 7 ppm and Vernalis flows ranged between 6,000and 7,000 cfs during the first half of October 1995 (Thomas R. Payne & Associ-ates 1997). Instead of flow, the appearance of salmon on the spawning rifflesin Stanislaus River has coincided with the first major storms (i.e., decliningbarometric pressure and air temperatures without flow changes), particularlyin 1997 when many fish arrived in mid October. Although the adults also tendto arrive at the spawning riffles in substantial numbers in late October or earlyNovember in the Tuolumne and Merced rivers, salmon were observedmigrating in the San Joaquin River at the Hills Ferry Barrier near Newman inlate September and early October 1995 (DFG 1997). These observations alongwith those of Hallock and others (1970) suggest adult salmon migrate throughthe Delta to the spawning riffles at a very slow rate, taking approximately twomonths to migrate from Antioch to the spawning riffles. If true, then migra-tory cues such as pulse flows or storm related influences (e.g., barometricpressure) could influence the salmon anywhere along their migration routeand their response may not be observed in the tributaries for several weeks.
Upstream migrating adult salmon that are delayed in the mainstem SanJoaquin River and Delta are subject to sport harvest, whereas adults thatmigrate into the tributaries are somewhat protected by regulations that pro-hibit angling from 15 October through 31 December.
Adult StrayingDelta export rates at the State Water Project and Central Valley Project wereincreased to near maximum (about 9,600 cfs) in fall 1996 and in subsequentyears to “make-up” for reduced pumping rates during the spring emigrationperiod to improve salmon smolt survival. The adult fall-run salmon aremigrating upstream through the Delta primarily in October typically whenSan Joaquin flows measured at Vernalis are low. It is likely that when exportsare high relative to San Joaquin flows, little if any San Joaquin River waterreaches the San Francisco Bay where it may be needed to help guide thesalmon back to their natal stream. An analysis of the recovered adult salmonwith coded-wire-tags (CWT) that had been reared at the Merced River FishFacility and released in one of the San Joaquin tributaries suggests strayingoccurred when the ratio of exports to flows was high (Mesick 2001a). Theanalysis, which included an adjustment to the estimated number of fish exam-ined for CWTs in some rivers (Mesick 2001a), indicates that during mid Octo-ber from 1987 through 1989 when export rates exceeded 300% of Vernalisflows, straying rates ranged between 11% and 17%. In contrast, straying rateswere estimated to be less than 5% when Delta export rates were less than
559559559559
about 300% of San Joaquin River flow at Vernalis during mid-October. Since1993, pulse flow releases from the San Joaquin tributaries for 8 to 10 days inmid-October appear to have kept straying rates below 2%.
Delta Migration BarriersIn the South Delta, rock barriers are installed to maintain hydraulic head forsmall pump diversions and these barriers are impassible for adult salmonids.Hallock and others (1970) found that when the head of Old River barrier wasinstalled in fall 1964, adult salmon migrated through the mainstem SanJoaquin River. However, when the barrier was not installed in fall 1965through 1967, some of the salmon migrated through the South Delta. Theirstudy suggests the rock barriers block the flow of water that attracted migrat-ing adults and so few, if any, adults would be expected to migrate into chan-nels where rock barriers have been installed.
Fluvial Geomorphic ProcessesThe large reservoirs in the San Joaquin tributaries have reduced the frequencyand magnitude of winter peak flows and peak flows may be needed to mobi-lize riffle substrate thereby sorting fines from spawning-sized gravel. NewMelones Reservoir has the capacity to impound about 240% of the annual run-off in the Stanislaus River basin, whereas the main reservoirs on the Tuol-umne and Merced rivers can impound about 100% of their annual runoff. Thehydrograph of the Stanislaus River is further altered by a maximum flow ofabout 1,800 cfs from spring to fall to protect the permanent crops in the flood-plain. These conditions have resulted in heavy encroachment of riparian vege-tation, particularly exotic species, along much of the Stanislaus River.
Many biologists and fluvial geomorphologists assume that the loss of peakflows results in the accumulation of fine sediments in spawning riffles. Thepotential benefits of peaking flows, namely the sorting of fines from spawningsized gravel, cannot occur unless there is (1) an adequate rate of gravel recruit-ment to replace the mobilized gravel; and (2) a functional floodplain wherefines are deposited as flows recede. DFG estimated that approximately 35% ofthe spawning gravel in the Stanislaus River had been lost or otherwise madeunavailable for spawning by vegetation encroachment, scouring flood flows,and gravel extraction operations between their 1961 survey and their 1972 sur-vey (DFG 1972). There is a need to evaluate the effectiveness of managingpeak flow releases to reduce the concentration of fine sediment in spawningriffles relative to the rate of gravel recruitment, the rate of fine sediment input,the influence of spawning salmon, and floodplain function (Kondolf and Wil-cock 1996).

560560560560
Water TemperatureHigh water temperatures can result from (1) low reservoir storage resulting insurface water releases into the spawning reach; (2) high air temperatures; and(3) low flows as occurred in the Stanislaus River in the early 1990s (Louder-milk 1996). The presence of Old Melones Dam within New Melones Reservoircauses the release of warm surface water from New Melones whenever stor-age levels fall below about one million acre-feet, a problem that occurred in1991 and 1992. Reregulation reservoirs, such as Tulloch Reservoir on theStanislaus River, can be warmer than 56 F through the end of Octoberalthough cold water releases are made from the main reservoirs upstream(DFG 1998). Water temperature models have either been completed or areplanned for the near future for most of the San Joaquin tributaries. Althoughthese models provide the means to manage flow releases and reservoir opera-tions to control water temperatures, they do not provide the ability to accu-rately evaluate the effect of restoring riparian forests on water temperatures.Although a narrow strip of riparian vegetation is known to have little detect-able effect on air and water temperatures, clear-cutting 41% of the riparianforests along Carnation Creek, a relatively small stream on Vancouver Island,substantially elevated water temperatures by increasing the exposure of thestream surface to incident solar radiation (Holtby 1988). The riparian forestsalong the San Joaquin tributaries are confined to narrow strips due to agricul-tural practices.
A model that predicts water temperature has been developed for the main-stem San Joaquin River between the head of the Old River to DisappointmentSlough (Schanz and Chen 1993, Chen and Tsai 1997); a proposal has been sub-mitted to extend the model upstream to Mud and Salt Sloughs. The relation-ship between streamflow at Vernalis and the daily range in water temperatureat Vernalis for periods in April, May, and early June in 1962, 1963, 1970, and1973 to 1994 are shown in Figures 10 to 12. These relationships suggest a flowof about 3,500 cfs from mid April (Figure 10) to mid May (Figure 11) are ade-quate to maintain maximum daily water temperatures below 65 F at Vernalis.Usually adequate water temperatures occurred in the San Joaquin Riverexcept during drought years (1977 and 1987 to 1992), and when high flowsentered the San Joaquin River from the James Bypass upstream of Newmanduring spring 1986. By the end of May, water temperatures exceeded 65 Feven at flows that exceeded 30,000 cfs; whereas flows greater than about 3,000cfs were sufficient to keep water temperatures between 65 F and 70 F (Figure12), which equates to an 80% survival rate for the juveniles (Baker and others1995).
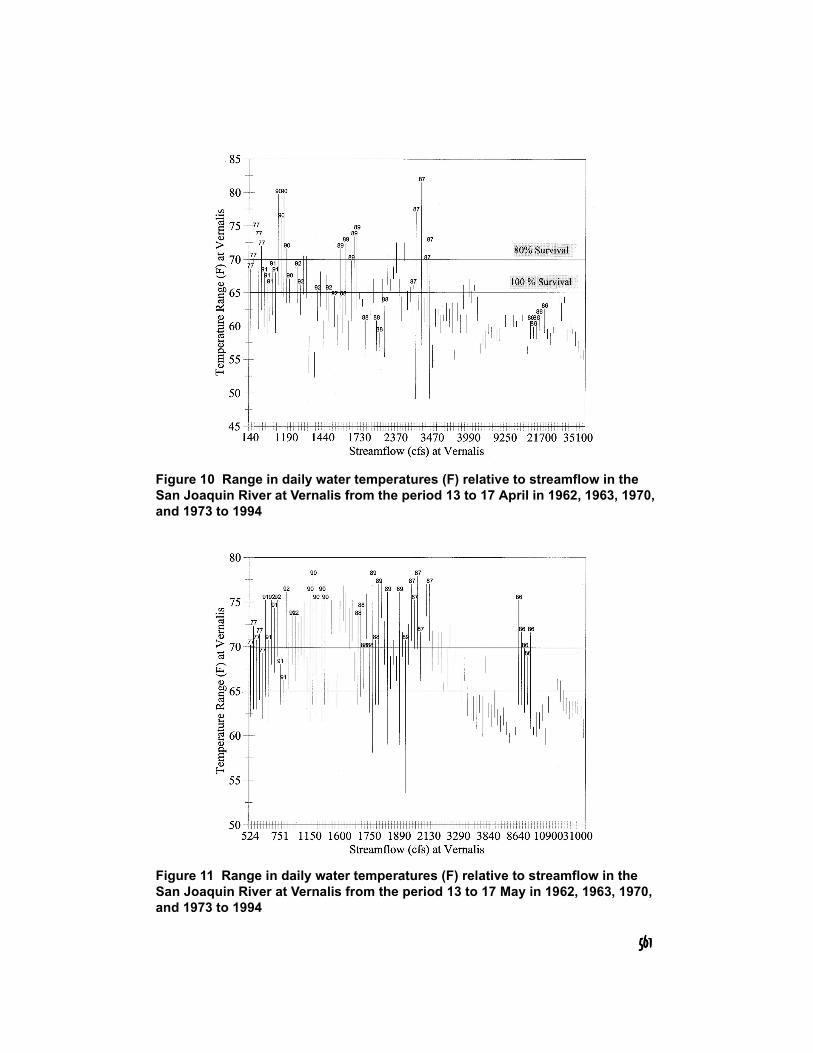
561561561561
Figure 10 Range in daily water temperatures (F) relative to streamflow in the San Joaquin River at Vernalis from the period 13 to 17 April in 1962, 1963, 1970, and 1973 to 1994
Figure 11 Range in daily water temperatures (F) relative to streamflow in the San Joaquin River at Vernalis from the period 13 to 17 May in 1962, 1963, 1970, and 1973 to 1994

562562562562
Figure 12 Range in daily water temperatures (F) relative to streamflow in the San Joaquin River at Vernalis from the period 28 May to 2 June in 1962, 1963, 1970, and 1973 to 1994
Spawning and Egg IncubationObservations in the Stanislaus, Tuolumne and Merced rivers indicate thatbefore mid to late November, adult salmon migrate to the upper reaches nearthe flow release point where water temperatures are usually suitable (<56 F)for spawning. Fall-run chinook eggs incubate for about 43 days at 52 Fwhereas cooler temperatures increase the incubation period. After hatching,the alevins remain in the gravel until most of their yolk sac has been absorbed,about 45 to 90 days after hatching (Alderdice and Velsen 1978). Based on thisinformation and the timing of spawning, incubation and alevin developmentoccurs from late October through March.
The mortality of chinook salmon eggs taken from the Sacramento River fishincreased significantly at water temperatures above 57 F (Healey 1979). Regu-latory agencies typically gauge temperatures below 50 F as optimum, temper-atures greater than 56 F as stressful, and temperatures that exceed 60 F aslethal for chinook salmon. Although water temperatures can exceed 56 Fthroughout much of the spawning reaches in October and early November, ifflow releases are low and air temperatures are high (USBR 1993; EA 1993),most salmon spawn in the upper reaches where cold water releases from thedams provide suitable water temperatures. By mid November, air tempera-tures usually decline substantially which causes water temperatures to drop

563563563563
below 56 F regardless of flow, and greater numbers of adult salmon beginspawning in the lower reaches.
The viability of chinook salmon eggs collected at the Merced River Hatcherywas relatively low when water temperatures were high during October andNovember, particularly for the early arriving fish collected during the 1977drought (DFG unpublished data). The effect of temperature on the viability ofunfertilized eggs is uncertain (Marine 1992) and it is possible that high tem-peratures affect sperm viability as well.
JuvenilesThe upper incipient lethal temperature for juvenile chinook salmon fromWashington is about 75 F under laboratory conditions (Brett 1952); whereasthe highest growth rates occur between 60 F and 65 F (Banks and others 1971).However, the San Joaquin basin has higher water temperatures than mostother rivers that support chinook salmon and studies conducted by ChrisMyrick at the University of California at Davis in the mid-1990s suggest Cen-tral Valley fish have evolved to grow well at temperatures higher than previ-ously reported. Myrick's studies were not completed and there is a need foradditional work.
Groundwater InflowHistorically, most rivers in the Central Valley increased in flow in a down-stream direction due to accretion from groundwater flow. Today, groundwa-ter pumping in the watershed has lowered the groundwater and reducedaccretion rates. In some rivers, such as the Cosumnes River, streamflowsdecline in a downstream direction. Groundwater inflow temperature is typi-cally between 55 and 60 F which may be lower than the river temperaturesafter early May. It is possible that the groundwater inflow helps to maintainsuitable water temperatures for juvenile salmon in the downstream reachesafter early May or at least provide small temperature refugia for emigrants.
Gravel Recruitment and In-River Gravel MiningThe amount of gravel available to maintain spawning and incubation habitathas been reduced by the blockage of gravel recruitment by upstream damsand by direct removal by gravel mining operations. Gravel recruitment hasbeen reduced by about 95% in Central Valley rivers with large upstream reser-voirs (Vick 1997). Major gravel mining operations from 1930 to the 1970s,which peaked during the 1930s and early 1940s, removed large amounts ofgravel directly from streambeds in San Joaquin County (Clark 1955; DFG1972; Jensen and Silva 1988) that left large in-river pits and long stretches ofdeep, flat streambed. Drag lines were used to dredge the gravel from theriverbed throughout much of the spawning reaches in the Stanislaus and

564564564564
Merced rivers, whereas large, boat-mounted dredgers were used in the Tuol-umne River (P. Frymire, personal communication, see “Notes”). Exposedpoint bars were also mined along much of the upper reaches, which requiredthe construction of dikes along the river margin. Dikes were also constructedwhen the dredge spoils were deposited in long rows along the river margins.DFG (1972) estimated that about 750 of 3,300 (23%) acres of riparian habitatand floodplains in the Stanislaus River were lost to expanding agriculturalpractices and to a lesser degree, gravel mining, between 1958 and 1965 andthat the losses had continued through 1972. Based on maps made in the 1960sby DFG (1972), approximately 55% of the channel in the primary spawningreach between Knights Ferry and the Orange Blossom Bridge was excavated.Usually a few riffles were left in the dredged areas to provide road crossingsfor heavy equipment. In the dredged areas, there was an average of three rif-fles per mile in the 1960s, whereas there was an average of about 12 riffles permile in the undredged reaches. Based on surveys conducted in 1995 and 1996(Carl Mesick Consultants and others 1996), many of the riffles identified asspawning habitat in the DFG maps in the 1960s have become armored andshortened. Gravel permeabilities at 24 natural riffles in the Stanislaus Riveraveraged 2,245 cm/hr (range <80 to 12,300 cm/hr) in August 1999 (CarlMesick Consultants 2000). Similar gravel permeabilities were observed in theTuolumne River in 1999 (D. Mierau, personal communication, see “Notes”).
Few adult salmon spawn in the dredged channels that have relatively flat,uniform streambeds, lacking diversity of water depths and velocities. In con-trast, complex streambed morphology increases the rate of downwelling ofsurface flow into the substrate, a cue thought to be used by adult salmon toselect spawning habitat (Vaux 1962, 1968; McNeil 1969). Adult salmon pre-ferred to spawn adjacent to large boulders placed on short steep berms ofnewly placed gravel (Merz 2000) and near large woody debris in unenhancedsites in the Mokelumne River (Merz 1998a).
The effects of gravel mining on juvenile rearing habitat have not been studied,but the impacts are probably important. In the Mokelumne River, fry begin todisperse within the upstream tributary river rearing areas and begin foragingon aquatic and terrestrial invertebrates after they reach 30 to 50 mm (Merz1998b). However, in the Stanislaus River in 1999, few juvenile salmon dis-persed from the primary spawning reach, a 2-mile long section betweenKnights Ferry Bridge and Willms Pond, to rear in the river downstream ofWillms Pond (Fisheries Foundation, unpublished data). In addition, juvenilescongregated at restoration riffles constructed upstream of Willms Pond insummer 1999, which suggests that the excavation of riffle habitat degradedthe rearing habitat.
The lack of gravel recruitment in the Stanislaus River is believed to be causingchannel widening (Schneider 1999). A comparison of channel surveys made in

565565565565
1996 and again in 1999 at five study sites indicated that the channel widenedfrom 2.3 to 13.4 feet (mean 7.6 feet) at all five sites. The loss of sediment creates“hungry water” which can cause lateral erosion of the banks as the riverattempts to regain part of its sediment load (Kondolf 1997). Over-widening ofthe river channel can modify bed shear stresses by changing pool and rifflesequences in the channel (Knighton 1984).
SedimentationHigh concentrations of fine sediments in spawning riffles reduce intragravelflow and egg survival and entombs embryos (Waters 1995). Unsuitably highconcentrations of fines have been documented at a substantial number ofspawning riffles in the Stanislaus (DWR 1994; Mesick 2000c) and Tuolumnerivers (EA 1992, Stillwater Sciences, unpublished data). Potential sources offine sediments include erosion within the lower watershed, the release ofaccumulated fine sediments from upstream reservoirs when storage levels arelow, and the gravel pits and mined channels in the spawning and rearingreaches that have stored thousands of tons of fines. The Stanislaus Riverbecomes quite turbid, 20 to 44 Nephelometric Turbidity Units in February1998, during heavy rainstorms (Demko and others 1999). Substantial erosionhas been recently observed along the Stanislaus River below the Orange Blos-som Bridge from residential construction and urban runoff, incorrectlydesigned and inadequately maintained roads and culverts, and to a smalldegree from streambank erosion. There are a few large and many small minepits that were dug to a depth of about 50 feet for gravel excavation between1930 and 1950. These pits are within the spawning and rearing reaches of theStanislaus River and almost all have filled with fines. Fines have also accumu-lated in the long stretches of deep, flat streambed that were mined during the1930s and 1940s. Riffles constructed with clean gravel in summer 1999 that areimmediately downstream of several of the small pits and long stretches ofmined channels have been completely filled with fines by the summer of 2000whereas restoration riffles immediately upstream of these mined areas hadrelatively few fines (Mesick, unpublished data). The porosity of the cleangravel added to the restoration sites ranged between 26% and 35% (Mesick,unpublished data) and filling of all the pore space with fines in the nine resto-ration riffles immediately downstream of the mine pits would have requiredat least 1,800 tons of fines. As no other substantial source of sedimentationwas observed in the area immediately downstream of the mined areas, themined areas were the most likely source of the fines.
Although spawning salmon reduce the concentration of fines in their redds,high rates of fine sediment intrusion occur after redd construction due tostorm runoff, transport of fines during high flows, construction activities fromother nearby salmon, and possibly from intragravel movement of fines(Mesick 2001b). The mean permeability was 33,070 cm/hr in 30- to 60-day-old

566566566566
chinook salmon redds in the Stanislaus River, which corresponds to an eggsurvival to emergence rate of 71%, whereas it was 3,700 cm/hr in adjacentundisturbed gravel (Mesick unpublished data). Emergence trap studies on theTuolumne River indicate that egg survival-to-emergence rates rangedbetween 0% and 68% (mean of 34%; EA Engineering, Science, and Technology1992). Studies in Mill Creek, a tributary to the Sacramento River, indicatedthat sedimentation from storm runoff substantially reduced streambed per-meability which resulted in nearly total mortality of eggs in artificial redds innatural riffles (Gangmark and Bakkala 1960).
Oxygen-poor Groundwater in the Intragravel EnvironmentStudies in the Stanislaus River indicate that intensive rain storms in January1996 were correlated with elevated intragravel water temperatures and low-ered intragravel dissolved oxygen (DO) concentrations; DO concentrationsdecreased by 25% to 75% of saturation levels at about 30% of the piezometersites in highly used spawning riffles (Mesick 2001b). The increased tempera-tures and reduced DO levels appear to have been temporary storm effectsbecause DO levels increased at two undisturbed piezometers resampled ninemonths later. Neither increased water temperatures nor lower DO concentra-tions were observed at riffles where the percentage of fines was low (Mesick2000c) and so it is likely that a high rate of fine sediment intrusion that formeda sealing layer in the substrate during intensive rain storms was necessary forgroundwater inflow to dominate the intragravel environment. Beschta andJackson (1979) reported that the upper layer of substrate trapped sand 0.5 mmin diameter and formed a thin barrier or seal against the further intrusion ofsand. It is likely that this layer of sand could become clogged with soils duringrainstorms.
PredationSeveral studies suggest that predation of juvenile salmon by (Micropterussalmoides) and smallmouth bass (M. dolomieui) is a major source of mortality inthe tributaries and probably the Delta as well. Radio tagging studies of smoltsin the Stanislaus River in spring 1998 suggest substantial mortality occurs incaptured gravel mine pits, probably from predation (SP Cramer & Associates1998). However, the overall mortality rates of radio tagged fish were higherthan observed for natural fish caught with screw traps and so the tagging pro-cedure or the tag's exterior antennae may have increased the fish's vulnerabil-ity to predators. DFG electrofishing surveys in early March during the late1980s indicate that there were largemouth bass and smallmouth bass in thelarge captured mine pit near river mile 49 in the Stanislaus River. Some hadjuvenile salmon in their stomachs. Studies in the Tuolumne River (EA 1992)suggest predation rates by black bass in mined riverbeds (called special run-pools by EA) substantially reduce the survival of hatchery juveniles migratingduring a 500 cfs pulse flow in spring 1990. Although several long-term Stanis-

567567567567
laus River residents report that black bass fishing was excellent in the cap-tured mine pits during the 1987 to 1992 drought when summer flows werelow, they also say that the bass fishery has been greatly diminished after thehigh flows of spring 1995.
There is a substantial run of striped bass (Morone saxatilis) in the San Joaquintributaries from March to early May. In 1999, stripers were collected in theStanislaus River that had radio tagged juvenile salmon in their stomachs (SPCramer & Associates, unpublished data). Whether the abundance of stripersor their predation rates are influenced by the instream gravel mining isunknown.
There are also large schools of Sacramento pikeminnow (Ptychocheilus grandis)in the long stretches of mined channel in the Stanislaus River and many oftheir stomachs are full of juvenile salmon and steelhead during winter andspring (S. Walser, personal communication, see “Notes”).
Densities of black bass and striped bass are about three times higher in thecentral Delta downstream from Rough and Ready Island near Stockton and inthe Mokelumne River (eastern Delta) than in the northern or southern areas ofthe Delta based on the DFG resident fish study conducted from 1980 to 1983(Table 8; DFG, unpublished data). DFG introduced Florida largemouth bassinto the Delta in the early 1980s and again in 1989 and catch rates of black basshave increased since 1993 (Lee 2000). Although predation of juvenile salmonin the Delta has not been well studied, it would account for the low survivalrates of juvenile salmon migrating between Dos Reis and Jersey Point and forSacramento River juveniles migrating into the Mokelumne River through theDelta Cross Channel.
Table 8 Number and mean fork length of largemouth bass, smallmouth bass, and striped bass per kilometer that were collected during DFG electrofishing surveys in the Sacramento-San Joaquin Delta, 1980 to 1983. The sampling sites in each region of the Delta are shown in Figure 1 of Schaffter (2000)
LocationLargemouth bass208 mm FL
Smallmouth bass225 mm FL
Striped bass140 mm FL
Central Delta 12.81 0.02 0.03
Eastern Delta 12.92 0.20 0.19
Southern Delta 4.42 0.36 0.03
Northern Delta 3.83 0.78 0.03
Western Delta 5.97 0.08 0.00

568568568568
Ocean HarvestCalifornia chinook salmon are harvested in both ocean and river fisheries. Thecommercial ocean troll fishery for California chinook salmon primarily occursfrom Monterey northward to Coos Bay, Oregon (Reisenbichler 1986). The trollfishery grew rapidly in the mid 1940s with an increase in the number and sizeof boats and use of power puller mechanisms for the lines, called gurdies (Cal-ifornia Bureau of Marine Fisheries 1949). The commercial salmon landings offthe California coast increased from a mean of 2,556 tons from 1932 to 1943 to5,254 tons from 1944 to 1949 probably in response to the increased fishingpressure and an increase in salmon production in the Sacramento River basin(California Bureau of Marine Fisheries 1949; Fry 1961). From 1950 to 1995, har-vest averaged about 3,500 tons of salmon.
There was a commercial drift gill net fishery in the Pittsburg-Martinez areathat increased from about 150 boats in the mid-1930s to 240 boats in 1947 (Cal-ifornia Bureau of Marine Fisheries 1949). The season was legally closed fromJune 16 to August 9 and again from September 27 to November 14 (CaliforniaBureau of Marine Fisheries 1949). The annual chinook salmon catch of the gill-net fishery averaged 1,141 tons from 1946 to 1952. The gill net fishery wascompletely closed in 1958.
The catch of the ocean sport fishery was about 20% of the total ocean catch(Reisenbichler 1986). Catch data are not available for the sport fishery prior to1947.
The Central Valley Index of ocean harvest (CVI), which includes the commer-cial and sport harvest for chinook salmon, was well correlated with recruit-ment to the Tuolumne River but not with Stanislaus River recruitment. Theprimary effect of ocean harvest was that the abundance of four-year-old fishdeclined from an average of 53% between 1947 and 1951 when about 37% ofthe population was harvested to about 20% of escapement from 1988 to 1998when about 73% of the population was harvested.
A substantial reduction in the number of four-year-old fish returning tospawn has several implications (D. Vogel, personal communication, see“Notes”). First, the loss of multiple-age populations causes the salmon runs tobe particularly vulnerable to natural disasters (e.g., floods and droughts) thatdevastate single-age spawning stocks. The combined loss of four-year-oldspawners due to ocean harvest and the loss of three-year-old spawners due tolow juvenile survival when spring flows were low substantially reduced pop-ulation fecundity. Second, the large four-year-old females tend to dig deeperredds that probably protect eggs from bed scour during high flows and helpsimprove the permeability of the spawning beds. Finally, four-year-old femalesproduce more eggs than do three-year-olds and the reduction in their num-

569569569569
bers has reduced the fecundity to the overall populations. Reduced fecunditywas a particular problem whenever environmental conditions reduced juve-nile survival to very low levels and consequently stock was reduced two andpossibly three years later. Stock was less than 1,500 spawners, which probablylimited recruitment, during 46% of the years in the Stanislaus River and 39%of the years in the Tuolumne River from 1958 to 1998.
Ocean PreyThe diet of two-year-old and older chinook salmon captured in the oceansport troll fishery off San Francisco in 1954 and 1955 primarily consisted ofnorthern anchovy (29.1%), various juvenile rockfishes (22.5%), euphausiids(14.9%), and herring (12.7%) as reported in Merkel (1957). Anchovies domi-nated the diet from August to November, rockfishes during June and July,herring in February and March, and invertebrate foods in April and May.Salmon caught in water shallower than 38 meters had fed primarily on ancho-vies (91% to 92%) whereas those caught in deeper water fed primarily onrockfishes (71% to 74%).
Northern anchovy landings during the year when the fish were three yearsold were negatively correlated with recruitment to the Tuolumne Riveralthough the correlation became nonsignificant when stock, Vernalis flowsand Delta exports were included in the model. Herring landings were not cor-related with recruitment to either river probably because they averaged lessthan 10% of the northern anchovy landings from 1939 to 1985. The effects ofocean prey abundance on the survival of adult salmon has not been studied,but it is likely that prey abundance primarily affects the growth rate of adultfish and not mortality.
Ocean ClimateLong-term records indicate that there are 15- to 25-year cycles of warm andcool periods in the northeastern Pacific Ocean that are strongly correlatedwith marine ecosystem productivity. Cool cycles prevailed from 1890-1924and again from 1947-1976 while warm cycles dominated from 1925-1946 andfrom 1977 through at least the mid-1990s (Mantua and others 1997). Duringthe mid 1970s, a major shift occurred from a colder to warmer-than averageregime in the California current (MacCall and others 1992, Francis and others1998). This shift was accompanied by a drop in zooplankton abundance by asmuch as 70%, vigorous recovery of the depleted sardine population off South-ern California (Hayward and others 1992, Francis and others 1998), anddecreases in the harvest of spring-run chinook and coho salmon off the coastof Washington, Oregon, and California (Mantua and others 1997). Salmonlandings off the California coast, which includes mostly chinook salmon andrelatively few coho, followed a similar pattern to the one reported by Mantuaand others (1997) for West Coast coho and spring-run salmon: California

570570570570
salmon landings were high during the cool cycles from 1916 to 1925 (mean5,062 tons) and from 1944 to 1982 (mean 4,100 tons) and low during the warmcycles from 1926 to 1943 (mean 2,632 tons) and from 1983 to 1997 (mean 2,865tons). The coastal warming that occurred in the mid 1970s is believed to havecaused increased stratification in the California Current, a sharper ther-mocline with less vertical displacement of nutrient rich water due to coastalupwelling, a reduction in the duration of upwelling conditions, and a reduc-tion in nutrients and/or zooplankton abundance carried by the CaliforniaCurrent (Francis and others 1998). Although most researchers report thatzooplankton abundance declines in the California Current during the warmregime, coastal euphausiids (Thysanoessa spinifera) declined while oceaniceuphausiids (T. pacifica) increased during the warm cycle (Francis and others1998). Such changes in ocean climate appear to affect salmon early in theirmarine life history (Hare and Francis 1995) and coastal invertebrate specieswould be important prey for ocean-type juveniles, such as fall-run chinooksalmon. Conversely, pelagic fish species such as sardines, which feed on oce-anic invertebrates, would be expected to decline during cool cycles asoccurred during the mid 1940s. The PDO index used in this study is stronglycorrelated with long-term cycles in sea-surface temperatures.
Short-term cycles in ocean currents and coastal upwelling are associated withEl Nino/Southern Oscillation (ENSO) events. The ENSO event during thewinter of 1982-1983, which was associated with a strengthening of the Aleu-tian Low, caused severe storms along the California coast. The result duringthe 1982-1983 winter was increased rainfall, increased vertical mixing, andincreased onshore Ekman transport, which typically increases upwelling andnutrient inputs to the surface layer (Hayward and others 1992). However, ElNino events are usually associated with decreased upwelling and reducednutrient input (Hayward and others 1992). The NPI index is correlated withshort-term cycles associated with El Niño/Southern Oscillation events. Themean PFEL Upwelling Index for May through July when juvenile chinooksalmon enter the ocean (MacFarlane 1999) provides a direct index ofupwelling and nutrient availability during a critical phase of ocean survivalfor chinook salmon. The PFEL upwelling index was low from 1946 to 1954,high from 1955 to 1981, and moderate and highly variable from 1982 to 1995(Table 3).
The correlations were weak between recruitment to the Tuolumne and Stanis-laus rivers and all three ocean climate indices tested here, although there wereinconsistent patterns. The transition from the non-productive warm-cycle to aproductive cool cycle in 1947 corresponded to a substantial decrease inrecruitment to the Tuolumne River. Mean recruitment to the Tuolumne Riverwas 117,642 fish from 1941 to 1946, which was the highest observed althoughit occurred during a non-productive warm cycle in the California Current. Itthen declined to 31,143 fish from 1947 to 1976, which was the productive cool

571571571571
cycle. It then declined further to 20,116 fish from 1977 to 1997 during a warmnon-productive cycle as expected. Mean recruitment to the Stanislaus Riverdeclined as expected from 13,768 fish for the productive 1946 to 1976 period to10,791 fish for the non-productive 1977 to 1997 period. The decline in Tuol-umne River recruitment during the mid 1940s was probably in response to theunusually high flows that persisted from 1935 to 1946; whereas the relativelysmall decline in recruitment to both the Tuolumne and Stanislaus rivers in1977 was probably in response to a decline in productivity in the coastal areas.
Negative correlations between NPI and recruitment were observed in someyears, particularly from 1970 to 1995. Recruitment to both the Tuolumne andStanislaus rivers were high in response to the strong ENSO event during the1982-1983 winter when the NPI value was very low. There were many inten-sive storms during the 1982-1983 winter that resulted in flooding. Consideringthe strong correlation between recruitment and streamflow and the lack ofcorrelation with the upwelling index, it is likely that recruitment respondedprimarily to increases in streamflow during the 1982-1983 winter rather thanto ocean conditions associated with the ENSO event.
Delta Reclamation and DredgingPrior to 1850, the Sacramento-San Joaquin Delta, an area of nearly 750,000acres, was mostly a tidal marsh that consisted of a network of sloughs andchannels during low flows and a large inland lake during flooding. The devel-opment of the Delta into farmland began in 1850 when the Swamp Land Actconveyed ownership of all swamp and marshes from the federal governmentto the State. Initial reclamation consisted of the construction of levees withpeat soils on Rough and Ready Island and Roberts Island. These initial leveesfailed and in the 1870s steam-powered dredges were used to excavate alluvialsoils to construct much larger levees. By the 1930s, reclamation was consid-ered complete and the number of operating dredges declined greatly. How-ever, due to continued subsidence of the peat soils, the Army Corps ofEngineers continually adds material to maintain the levees, many of whichrange between 15 and 25 feet high.
The Port of Stockton and the deepwater ship channel in the San Joaquin Deltawere completed in 1933. Activity at the Port of Stockton increased greatly in1942 with the construction of military ships, mine sweepers, and landing craft.Shortly thereafter, large passenger cruise ships began navigating through theDelta. Currently the river is dredged to a depth of 35 feet to allow passage ofdeep draft ships; whereas upstream of the ship channel, depths rangebetween 8 and 12 feet.
The unusually low survival of salmon smolts near Stockton and the beneficialeffect of flood flows on recruitment suggests that dredging the deepwater

572572572572
ship channel may have indirect effects related to increased predator habitat,low DO concentrations, and contaminants. It is also possible that increasedflows downstream of the Mokelumne River due to the diversion of Sacra-mento River water through the Delta Cross Channel since 1951 was partiallyresponsible for the relatively high smolt survival rate in the deepwater shipchannel downstream from the Mokelumne River during April 1991 comparedto survival rates upstream of the Mokelumne River.
Juvenile Food SupplyFood supply and growth rates of juvenile salmon have not been extensivelystudied in most of the tributaries. Stomach content analysis of juvenile chi-nook salmon in the lower American (Brown and others 1992; Merz and Van-icek 1994) and Mokelumne rivers (Merz 1998b) suggest zooplankton from theupstream reservoirs and terrestrial macroinvertebrates occasionally supply asmuch as 50% and 25% of the fishes' diet, respectively. Invertebrate surveyshave also been conducted in the Tuolumne River. Although the studies havenot resolved whether the food supply limits the growth and survival of juve-nile salmon in the San Joaquin tributaries, there are concerns that habitat deg-radation and contamination has reduced the supply of food frommacroinvertebrates in the benthos and drift, plankton from reservoirs, andterrestrial invertebrates.
High concentrations of fine sediments in the substrate may have shifted thebenthic invertebrate populations toward smaller species, which may be lessuseful as food for juveniles. It is also likely that channel incision, degradedriparian vegetation, and degraded streambed complexity have reduced thesupply of organic detritus that is required by many invertebrate species forfood (Allan 1995). The supply of zooplankton from reservoirs may be affectedby contaminants in runoff in the upper watershed and by reservoir manage-ment that affects plankton distribution relative to the location of the intake forfish flow releases. If zooplankton contribute substantially to the diet of juve-niles, then it may be necessary to balance the benefits of deep, cold waterreleases from reservoirs with those of mid- to upper level releases that maycontain high concentrations of zooplankton. The supply of terrestrial inverte-brates may be affected by the spraying of pesticides near the floodplain andby levees and channel incision that reduce flooding which allows juveniles tofeed in terrestrial zones and helps flush terrestrial invertebrates into the river.
DiseaseThe disease Ceratomyxa causes a high mortality rate of chinook smolts migrat-ing through the lower Willamette River, Oregon. Ceratomyxa is also present inthe Central Valley. Recent studies have established that this disease relies ontubifix worms for an intermediate host. These worms flourish in organic sedi-ments and they are likely to multiply in years when organic sediments are not

573573573573
flushed by high flows. There are indications that mortality of smolts due tothis disease increases in drought years and decreases in wet years. This dis-ease is a particular concern for the Stanislaus River because there is a tubifixworm farm near the Orange Blossom Bridge. It is also possible that organicsediments accumulate and produce tubifix worms in captured mine pits.
ContaminantsMud and Salt sloughs and many small agricultural return channels contributea variety of contaminants to the mainstem San Joaquin River and the tributar-ies, particularly during the winter when dormant sprays are applied to cropsand rain storms flush the contaminants into the rivers in a pulse. However,experimental studies have indicated that there were no detrimental effects ofagricultural return flow from the west side of the San Joaquin on the growthand survival of chinook salmon reared at the Merced Fish Facilities when thereturn flows were diluted by 50% or more with San Joaquin River water (Saikiand others 1992). Bioassays with fathead minnows with water samples fromthe San Joaquin, Merced, Tuolumne, and Stanislaus rivers showed little evi-dence of toxicity (Brown 1996). Low or no detectable concentrations of orga-nochlorine pesticides and polychlorinated biphenyls were detected in fishcollected from Don Pedro Reservoir on the Tuolumne River, San JoaquinRiver at Fremont Ford and Mossdale (Goodbred and others 1997). Althoughcontaminants in the San Joaquin basin may not have had direct effects, a studyconducted in Puget Sound, Washington, (Arkoosh and others 1998) indicatesthat emigrating juvenile chinook salmon exposed to contaminants, polycyclicaromatic hydrocarbons and polychlorinated biphenyls, suffered increasedsusceptibility to common marine pathogens (Vibrio anguillarium).
Unscreened DiversionsThere are 44, 36, and 68 small unscreened screened diversions on the Stanis-laus, Tuolumne, and Merced rivers, respectively. In addition, there are sixinadequately screened, medium-sized diversions on the Merced River. Theentrainment rates at these sites have not been studied. The radio taggingstudy in the Stanislaus River, which tagged 49 fish, did not detect any entrain-ment of tagged fish at several moderately sized unscreened pumps in thelower river (SP Cramer & Associates 1998). Studies in the Delta suggestentrainment rates increase exponentially with increases in diversion rate. Iftrue, a majority of entrainment would occur at the four large unscreeneddiversions in the mainstem San Joaquin River downstream from the conflu-ence with the Merced River. The El Soyo diversion, just downstream of themouth of the Tuolumne River, has a maximum capacity of 80 cfs. The Banta-Carbona diversion, downstream of the mouth of the Stanislaus River, and theWest Stanislaus diversion and Patterson diversions, both below the mouth ofthe Merced River, each have a maximum capacity of 240 cfs. Screens were

574574574574
installed in the late 1970s but were later abandoned due to maintenance prob-lems.
Prespawning MortalityPrespawning mortality has not been estimated for the Central Valley basin,but estimates in other streams, such as the Rogue River, indicate that this mor-tality can range from 5% to 75% annually (Cramer and others 1985). Commoncauses of this mortality are thermal stress, disease, and angler harvest.
Instream Harvest and Harassment of SpawnersAngler harvest of adult salmon before and during spawning reduces the num-ber of eggs deposited. The angling season is closed on the San Joaquin tribu-taries from 16 October through 31 December to protect spawners. Newregulations that require artificial lures and barbless hooks have just beenimplemented on the San Joaquin tributaries to protect steelhead and juvenilesalmon. The effectiveness of the fishing regulations to protect spawningsalmon in the San Joaquin tributaries is unknown.
Disturbance to riffle substrates during incubation from anglers, rafters, live-stock, jet boats and prop boats may reduce egg survival. This may be a partic-ular problem for the Stanislaus River in January when anglers begin fishingfor steelhead in Goodwin Canyon while chinook eggs are incubating. In theMokelumne River, dozens of cows have been observed walking on redds dur-ing the incubation season (J. Merz, personal communication, see “Notes”).Heavily rafted streams, such as the Stanislaus River, receive heavy foot trafficat some shallow riffles.
Altered Genetics Due to Hatchery FishThe percentage of hatchery reared salmon in the populations returning to theSan Joaquin tributaries has been high in recent years, and the effect of inter-breeding between the hatchery and naturally produced fish on the gene poolof the naturally produced fish is unknown. Since 1990, the percentage ofMerced River Hatchery salmon with coded-wire-tags that were recovered inthe escapement surveys as adults has ranged between 8% and 38% of the totalpopulation in the San Joaquin River tributaries (Mesick 2001a). Since not all ofthe hatchery fish were tagged, the percentage of hatchery fish may constitutea much higher portion of the population than estimated by CWT returns. Theeffect of interbreeding with hatchery fish is probably greatest when FeatherRiver Hatchery fish return to the San Joaquin River and eastside tributariesbecause the Feather River fish, and others from the Sacramento basin, haveevolved under different flow and water temperature regimes. Furthermore,although the hatchery environment may allow some fish to survive that

575575575575
would not survive under natural conditions, interbreeding with naturallyproduced fish may not adversely affect the survival of the offspring.
Conclusions
The correlations analyses of recruitment and smolt survival studies suggestthat low flows during dry years, degraded habitat particularly in the Deltanear Stockton, low spawner abundance caused by high harvest rates ofsalmon, and the indirect effects of Delta exports were responsible for thedecline in the fall-run chinook salmon populations observed in the Stanislausand Tuolumne rivers between 1940 and 1998.
Recruitment to the Stanislaus and Tuolumne rivers is strongly correlated withflow. The smolt survival studies conducted by the USFWS and DFG suggestthat juvenile mortality rates are highest in the Old River and the mainstemSan Joaquin River near Stockton between the head of the Old River and themouth of the Mokelumne River. These studies also indicate that juvenile sur-vival is strongly correlated with flow and water temperatures in the mainstembelow the Old River, although fewer than 33% of the hatchery-reared smoltssurvive even at high flows. The cause of mortality in the reach between theOld River and the Mokelumne River is most likely either predation by blackbass or striped bass or entrainment at unscreened diversions, because bothwould decline during high flows and both could impact juveniles during theirrelatively rapid migration through this reach. It is also possible that dredgingthe channel from a depth of 8-12 feet to a depth of about 35 feet to allow pas-sage of ocean cargo ships to the Port of Stockton has worsened the problem.
The impact of Delta exports at the CVP and SWP facilities is difficult to sepa-rate from the impact of low flows in the Delta with the existing data althoughrecruitment declined in the mid to late 1950s in apparent response to the com-mencement of exports. If exports do affect smolt survival, it must be primarilyan indirect effect because entrainment at the pumping facilities has been neg-ligible compared to the total number of juveniles migrating through the Delta.The percentage of CWT juveniles released at Mossdale, the lower StanislausRiver, or the lower Tuolumne River and recovered at the CVP and SWPpumping facilities in April and May ranged from 1.0% to 15% (mean 7.3%)between 1986 and 1992 when exports were high and flows were low (DFG,unpublished data) and presumably direct mortality rates would be less thanhalf of the total percentage of fish recovered. From 1993 to 1998, when exportswere low and flows were relatively high, indirect mortality at the CVP andSWP facilities averaged about 1% (range of 0 to 8%, DWR unpublished data).There are several mechanisms by which exports could indirectly result in themortality of smolts: (1) redirecting migrating juveniles into the Old River orClifton Court forebay where predation rates are probably high; (2) reducing

576576576576
flows in the main channel of the San Joaquin River between the Head of theOld River and the mouth of the Mokelumne River, and (3) increasing agricul-tural return flows, particularly from Mud and Salt Sloughs, to the San JoaquinRiver that contain pesticides, other contaminants, and raise water tempera-tures. The installation of a barrier at the head of the Old River substantiallyreduces the impacts of exports on juvenile salmon.
The reduction in the abundance of four-year-old fish that return to spawn dueto high rates of ocean harvest undoubtedly reduces recruitment in many yearsby reducing the fecundity of the spawning population and by reducing thecleansing action that the large fish have on the spawning beds. Althoughpoaching of adult fish prior to spawning occurs in all three San Joaquin tribu-taries, the rates must be inconsequential compared to legal harvest rates.
Mean recruitment to both the Stanislaus and Tuolumne rivers was slightlyhigher during cool, productive cycles of ocean conditions compared to warm,nonproductive cycles, as reflected by the PDO index. However, correlationswith PDO were weak because the influence of streamflow was an overridingfactor.
Instream gravel mining that primarily occurred during the 1930s and early1940s, degraded spawning and rearing habitat, decreased invertebrate pro-ductivity, and increased predator abundance. Although it is impossible toquantify these impacts because escapement surveys began after most of theinstream mining occurred, restoration of mined areas should improve recruit-ment. Restoring riffle habitat in the mined areas not only increases the amountof spawning and rearing habitat, but also reduces predation. Observations byfishing guides familiar with all three tributaries suggest that restoration of thelong stretches of 4-10 foot deep channel would provide the greatest reductionin predation compared to restoration of the large deep pits. The long stretchesof deep channel provide habitat for numerous Sacramento pikeminnowwhich feed on both fry and smolts of both chinook salmon and steelheadwhereas the large pits provide habitat for relatively few largemouth bass andstriped bass which primarily begin feeding after water temperatures increaseand smolts are migrating. On the other hand, restoration of the large deeppits, which are typically filled with fines that are mobilized during high flows,should help improve spawning habitat and increase invertebrate productiv-ity.
Other relatively recent factors that may be significant sources of mortality are(1) sedimentation from the construction of new housing which is rapidlyincreasing along the Stanislaus River corridor; (2) encroachment of riparianvegetation on floodplains as a result of flattened hydrographs; (3) exportsduring the fall when adults are migrating through the Delta; (4) contaminants;and (5) disease. The turbidity of storm runoff has increased substantially in

577577577577
the Stanislaus River probably in response to a rapid increase in new housingconstruction in recent years. Spawning habitat is severely degraded in theStanislaus and Tuolumne rivers and probably in the Merced River as well andsedimentation and the lack of high flows and functional floodplains to helpremove fines from spawning habitat are continuing to degrade the habitat.Furthermore, it is highly likely that food production is also limited by thehighly compacted nature of the mined streambeds. A future concern is thatthere are plans to increase the capacity of the Delta pumping facilities andhigh rates of pumping during the fall can cause adult chinook salmon to stray.Contaminants and disease may be limiting the salmon populations, but fur-ther research is needed.
Acknowledgements
I thank T. Heyne, P. Brandes, M. Pierce, E. Van Nieuwenhuyse, J. Merz, S.Cramer, D. Demko, and S. Hare for sharing data and providing suggestions toimprove the analysis. I also thank M. Kjelson, D. Vogel, and an anonymousreviewer for their comments. Funding for some of the data summaries wasprovided by the Stockton East Water District.
References
Analytical Software. 1995. Statistix 7, User’s Manual. Tallahassee, Florida. 359 p.
Allan JD. 1995. Stream ecology: structure and function of running waters. London: Chapman and Hall. 388 p.
Alderdice DF, Velsen FPJ. 1978. Relation between temperature and incubation time for eggs of chinook salmon (Oncorhynchus tshawytscha). J Fish Res Bd Canada 35:69-75.
Arkoosh MR, Casillas E, Huffman P, Clemons E, Evered J, Stein JE, Varanasi U. 1998. Increased susceptibility of juvenile chinook salmon from a contaminated estuary to Vibrio anguillarum. Trans Am Fish Soc 127:360-374.
Baker PF, Speed TP, Logon FK. 1995. Estimating the influence of temperature on the survival of chinook salmon smolts (Oncorhynchus tshawytscha) migrating through the Sacramento-San Joaquin River Delta of California. Can J Fish Aquat Sci 52:855-863.
Banks JL, Fowler LG, Elliott JW. 1971. Effects of rearing temperature on growth, body form, and hematology of fall chinook fingerlings. The Progressive Fish-Culturist 33(1):20-26.

578578578578
Beschta RL, Jackson WL. 1979. The intrusion of fine sediments into a stable gravel bed. J Fish Res Bd Canada 36:204-210.
Brandes P. 2000. 1999 South Delta salmon smolt survival studies. Unpublished report dated 26 May 2000. US Fish and Wildlife Service, Stockton, California.
Brett JR. 1952. Temperature tolerance in young pacific salmon, genus Oncorhynchus. J Fish Res Bd Canada 9(6):265-323.
Brown L. 1996. Aquatic biology of the San Joaquin-Tulare basins, California: analysis of available data through 1992. Report prepared in cooperation with the National Water-Quality Assessment Program by the U.S. Geological Survey. Water Supply Paper 2471.
Brown L, Moyle P, Vanicek D. 1992. American River studies: intensive fish surveys, March-June, 1991. Mimeo Report. Davis (CA): University of California.
California Bureau of Marine Fisheries. 1949. The Commercial Fish Catch of California for the year 1947 with an Historical Review 1916-47. California Division of Fish and Game, Fish Bulletin 74: 1-223.
[California Bureau of Marine Fisheries] Heimann RFG, Carlisle JG, Jr. 1970. The Cali-fornia marine fish catch for 1968 and historical review 1916-68. California Divi-sion of Fish and Game. Fish Bulletin 149:55.
[California Bureau of Marine Fisheries] Pinkas L. 1970. The California marine fish catch for 1969. California Division of Fish and Game. Fish Bulletin 153:14-15.
[California Bureau of Marine Fisheries] Bell RR. 1971. California marine fish landings for 1970. California Division of Fish and Game. Fish Bulletin 154:14-15.
[California Bureau of Marine Fisheries] Oliphant MS. 1973. California marine fish landings for 1971. California Division of Fish and Game. Fish Bulletin 159:14-15.
[California Bureau of Marine Fisheries] Pinkas L. 1974. California marine fish land-ings for 1972. California Division of Fish and Game. Fish Bulletin 161:14-15.
[California Bureau of Marine Fisheries] McAllister R. 1975. California marine fish landings for 1973. California Division of Fish and Game. Fish Bulletin 163:14-15.
[California Bureau of Marine Fisheries] McAllister R. 1976. California marine fish landings for 1974. California Division of Fish and Game. Fish Bulletin 166:14-15.
[California Bureau of Marine Fisheries] Pinkas L. 1977. California marine fish land-ings for 1975. California Division of Fish and Game. Fish Bulletin 168:16-17.
[California Bureau of Marine Fisheries] Oliphant MS. 1979. California marine fish landings for 1976. California Division of Fish and Game. Fish Bulletin 166:16-17.

579579579579
[California Bureau of Marine Fisheries] Oliphant MS, Gregory PA, Ingle BJ, Madrid R. 1990. California Marine Fish Landings for 1977-1986. California Division of Fish and Game. Fish Bulletin 173:12-51.
Carl Mesick Consultants. 1996. The effects of minimum instream flow requirements, release temperatures, Delta exports, and stock on fall-run chinook salmon pro-duction in the Stanislaus and Tuolumne rivers. Draft report prepared for Thomas R. Payne & Associates, Neumiller & Beardslee, and the Stockton East Water Dis-trict.
Carl Mesick Consultants. 2000. Task 3 pre-project evaluation report, Knights Ferry Gravel Replenishment Project, Work Authority #1469-8520, Project #97-N21. Report produced for the CALFED Bay Delta Program.
Chen C, Tsai W. 1997. Evaluation of alternatives to meet the dissolved oxygen objec-tives of the lower San Joaquin River. Report to California State Water Resources Control Board, Sacramento, California. Submitted on behalf of City of Stockton, California.
Clark WB. 1955. Mines and mineral resources in San Joaquin County, California. Cali-fornia Journal of Mines and Geology 51:60-69.
Cope OB, Slater DW. 1957. Role of Coleman Hatchery in maintaining a king salmon run. Research Report 47, US Fish and Wildlife Service. 22 p.
Cramer SP, Satterthwaite SD, Boyce RB, McPherson BP. 1985. Impacts of Lost Creek Dam on the biology of anadromous salmonids in the Rogue River. Lost Creek Dam Fisheries Evaluation Phase 1 completion report, volume 1. Oregon Depart-ment of Fish and Wildlife contract report submitted to U.S. Army Corps of Engi-neers. Contract DACW57-77-C-0027. Portland, Oregon.
Demko DB, Cramer SP. 1997. Outmigrant trapping of juvenile salmonids in the lower Stanislaus River Caswell State Park site 1996. Report prepared for the U.S. Fish and Wildlife Service, Anadromous Fish Restoration Program under contract with CH2M Hill. Sacramento, California.
Demko DB, Gemperle C, Cramer SP, Phillips A. 1999. Outmigrant trapping of juvenile salmonids in the lower Stanislaus River Caswell State Park site 1998. Report pre-pared for the U.S. Fish and Wildlife Service, Anadromous Fish Restoration Pro-gram under contract with CH2M Hill. Sacramento, California.
[DFG] California Department of Fish and Game. 1972. Report to the California State Water Resources Control Board on effects of the New Melones Project on fish and wildlife resources of the Stanislaus River and Sacramento-San Joaquin Delta. Pro-duced by Region 4, Anadromous Fisheries Branch, Bay-Delta Research Study, and Environmental Services Branch.
[DFG] California Department of Fish and Game. 1990. Annual report, fiscal year 1988-1989, San Joaquin River Chinook Salmon Enhancement Project. Sport Fish Resto-

580580580580
ration Act, Project F-51-R-1, Sub Project Number IX, Study Number 5, Jobs 1 through 7. Region 4, Fresno.
[DFG] California Department of Fish and Game. 1991–1998. Annual Reports, Fiscal Years 1987-1997, San Joaquin River Chinook Salmon Enhancement Project. Sport Fish Restoration Act, Project F-51-R-4, Sub Project Number IX, Study Number 5, Jobs 1 through 7. Region 4, Fresno.
[DFG] California Department of Fish and Game. 1997. Annual Report, Fiscal Year 1995-1996, San Joaquin River Chinook Salmon Enhancement Project. Sport Fish Restoration Act, Project F-51-R-6, Project Number 38, Jobs 1 through 7. Region 4, Fresno.
[DFG] California Department of Fish and Game. 1998. Annual Report, Fiscal Year 1996-1997, San Joaquin River Chinook Salmon Enhancement Project. Sport Fish Restoration Act, Project F-51-R-6, Project Number 38, Jobs 1 through 7. Region 4, Fresno.
[DWR] California Department of Water Resources. 1962. Salinity incursion and water resources. Draft Bulletin 76, Appendix D, Delta Water Facilities.
[DWR] California Department of Water Resources. 1986. Delta flow equations. Memo-randum to Richard Satkowski, State Water Resources Control Board, Division of Water Rights, Bay-Delta Program, Sacramento, California. December 22, 1986.
[DWR] California Department of Water Resources. 1994. San Joaquin River tributaries spawning gravel assessment: Stanislaus, Tuolumne, Merced rivers. Draft memo-randum prepared by the Department of Water Resources, Northern District, for the California Department of Fish and Game. Contract number DWR 165037.
[EA] EA Engineering, Science, and Technology. 1992. Report of Turlock Irrigation District and Modesto Irrigation District Pursuant to Article 39 of the License for the Don Pedro Project.
[EA] EA Engineering, Science, and Technology. 1993. Temperature and salmon habi-tat in the lower Tuolumne River. Prepared for the Turlock Irrigation District and the Modesto Irrigation District.
Erkkila LF, Moffett JW, Cope OB, Smith BR, Nielson RS. 1950. Sacramento-San Joaquin Delta Fishery Resources: Effects of Tracy Pumping Plant and Delta Cross Channel. US Fish and Wildlife Service Special Scientific Report Fisheries No. 56.
Francis RC, Hare SR, Hollowed AB, Wooster W.S. 1998. Effects of interdecadal climate variability on the oceanic ecosystems of the NE Pacific. Fish Oceanogr 7:1-21.
Fry DH, Jr. 1961. King salmon spawning stocks of the California Central Valley, 1940-1959. California Fish and Game 47 (1):55-71.

581581581581
Gangmark HA, Bakkala RG. 1960. A comparative study of unstable and stable (artifi-cial channel) spawning streams for incubating king salmon at Mill Creek. Califor-nia Fish and Game 46:151-164.
Goodbred SL, Gilliom RJ, Gross TS, Denslow NP, Bryant WL, Schoeb TR. 1997. Recon-naissance of 17B-estradiol, 11-ketotestosterone, vitellogenin, and gonad histopa-thology in common carp of United States streams: Potential for contaminant-induced endocrine disruption. Sacramento, California: U.S. Geological Survey Open-File Report 96-627.
Hallock RJ, Elwell RF, Fry DH, Jr. 1970. Migrations of adult king salmon Oncorhynchus tshawytscha in the San Joaquin Delta; as demonstrated by the use of sonic tags. California Department of Fish and Game. Fish Bulletin 151.
Hare SR, Francis RC. 1995. Climate change and salmon production in the northeast Pacific Ocean. In: Beamish RJ, editor. Climate change and northern fish popula-tions. Can Spec Publ Fish Aquat Sci 121. p 357-372.
Hare SR, Mantua NJ, Francis RC. 1999. Inverse production regimes: Alaska and West Coast Pacific salmon. Fisheries 24(1):6-14.
Hayward T, Smith R, Ainley D, Bernal P, Eakin M, Haney R, Hollowed A, Hsueh P, Pearcy W, Perry I, Sautter L, Schwing F, and Strub T. 1992. El Niño/southern oscillation (ENSO) effects within the California current system. Working Group Report in Global Ocean Ecosystems Dynamics and Climate Change (GLOBEC). Eastern Boundary Current Program Report on Climate Change and the California Current Ecosystem. Report Number 7. Workshop held 17-20 September 1992 at Bodega Marine Laboratory of the University of California.
Healey MC. 1991. Life history of chinook salmon (Oncorhynchus tshawytscha). In: Groot C, Margolis L, editors. Pacific salmon life histories. p 311-393.
Healey TP. 1979. The effect of high temperatures on the survival of Sacramento River chinook salmon eggs and fry. California Department of Fish and Game Anadro-mous Fish Administration Report 79-10.
Holtby LB. 1988. Effects of logging on stream temperatures in Carnation Creek, Brit-ish Columbia, and associated impacts on the coho salmon (Oncorhynchus kisutch). Can J Fish Aquat Sci 45:502-515.
Jensen LS, Silva MA. 1988. Mineral land classification of Portland cement concrete aggregate in the Stockton-Lodi Production-Consumption Region. Special Report 160. Sacramento, California: California Department of Conservation, Division of Mines and Geology.
Knighton DK. 1984. Fluvial forms and processes. London: Wiley and Sons, Inc.
Kondolf GM. 1997. Hungry water: effects of dams and gravel mining on river chan-nels. Environmental Management 21(4):553-551.

582582582582
Kondolf GM, Wilcock PR. 1996. The flushing flow problem: defining and evaluating objectives. Water Resources Research 32(8):2589-2599.
Lee D. 2000. The Sacramento-San Joaquin Delta largemouth bass fishery. IEP Newslet-ter 13(3):37-40. Interagency Ecological Program. Sacramento (CA): California Department of Water Resources.
Lee GF, Jones-Lee A. 2001. Synopsis of issues in developing the San Joaquin River deep water ship channel dissolved oxygen TMDL. IEP Newsletter 14(1):30-35. Interagency Ecological Program. Sacramento (CA): California Department of Water Resources.
Loudermilk WE. 1996. Fall-run chinook salmon egg deposition and exposure to lethal water temperatures in the designated salmon spawning area of the lower Stanis-laus River. DFG Exhibit 96-6 submitted to the State Water Resources Control Board by the Department of Fish and Game in January 1996 regarding water Right change petitions filed by Calaveras County Water District.
MacCall A, Kremer P, Graham W, Haney R, Hollowed A, Mackas D, Ohman M, Pow-ell T, Rau G, Rice J, Schumacher J, Shapiro L, Smith P, Welling L, and Woehler E. 1992. Major shifts in species composition and ecosystem structure. Working Group Report in Global Ocean Ecosystems Dynamics and Climate Change (GLOBEC). Eastern Boundary Current Program Report on Climate Change and the California Current Ecosystem. Report Number 7. Workshop held 17-20 Sep-tember 1992 at Bodega Marine Laboratory of the University of California.
MacFarlane B. 1999. Physiological ecology of juvenile chinook salmon in the San Fran-cisco Estuary and Gulf of the Farallones. Presentation at the Interagency Ecologi-cal Program Annual Workshop, 26 February 1999, Asilomar Conference Center, Pacific Grove, California.
Mantua NJ, SR Hare, Y Zhang, JM Wallace, and RC Francis. 1997. A Pacific interdec-adal climate oscillation with impacts on salmon production. Bulletin of the Amer-ican Meteorological Society 78:1069-1079.
Marine K. 1992. A background investigation and review of the effects of elevated water temperature on reproductive performance of adult chinook salmon (Onco-rhynchus tshawytscha). Report by Natural Resource Scientists for the East Bay Municipal Utility District.
McCarty PL. 1969. An evaluation of algal decomposition in the San Joaquin Estuary. Report prepared for the Federal Water Pollution Control Administration under Research Grant DI-16010 DL. Stanford (CA): Stanford University.
McNeil WJ. 1969. Survival of pink and chum salmon eggs and alevins. In: Northcote TG, editor. Symposium on salmon and trout in streams. Vancouver, Canada: Uni-versity of British Columbia, Institute of Fisheries. p 101-117.

583583583583
Merkel, T.J. 1957. Food habits of the king salmon, Oncorhynchus tshawytscha (Wal-baum), in the vicinity of San Francisco, California. California Fish Game 43:249-270.
Merz JE. 1998a. Association of fall chinook salmon redds and large organic debris in the lower Mokelumne River, California. Lodi (CA): East Bay Municipal Utility District.
Merz JE. 1998b. Feeding habits of juvenile chinook salmon in the lower Mokelumne River, California. Lodi (CA): East Bay Municipal Utility District.
Merz JE. 2000. Lower Mokelumne River gravel enhancement evaluation [memoran-dum]. Submitted to the East Bay Municipal Utility District, Lodi, California. 13 p.
Merz JE, Vanicek CD. 1994. Comparative feeding habits of juvenile chinook salmon, steelhead, and Sacramento squawfish in the lower American River, California. California Fish and Game 82(4):149-159.
Mesick CF. 2000. Spawning habitat restoration in the Stanislaus River. Presentation at CALFED Science Conference 2000, Sacramento, California, 3 October 2000.
Mesick CF. 2001a. The effects of San Joaquin River Flows and Delta export rates dur-ing October on the number of adult San Joaquin chinook salmon that stray. In: Brown RL, editor. Contributions to the biology of Central Valley salmonids. Fish Bulletin 179. Sacramento (CA): California Department of Fish and Game.
Mesick CF. 2001b. Studies of spawning habitat for fall-run chinook salmon in the Stanislaus River between Goodwin Dam and Riverbank from 1994 to 1997. In: Brown RL, editor. Contributions to the biology of Central Valley salmonids. Fish Bulletin 179. Sacramento (CA): California Department of Fish and Game.
[PFMC] Pacific Fisheries Management Council. 1998. Review of 1997 ocean salmon fisheries. Portland, Oregon.
Reisenbichler RR. 1986. Use of spawner-recruit relations to evaluate the effect of degraded environment and increasing fishing on the abundance of fall-run chi-nook salmon (Oncorhynchus tshawytscha) in several California streams [Ph.D. dis-sertation]. Seattle (WA): University of Washington. 175 p.
Ricker WE. 1975. Computation and Interpretation of Biological Statistics of Fish Popu-lations. Bulletin of the Fisheries Research Board of Canada, 191. Ottawa, Canada.
Saiki MK, Jennings MR, Wiedmeyer RH. 1992. Toxicity of agricultural subsurface drainwater from the San Joaquin Valley, California, to juvenile chinook salmon and striped bass. Trans Am Fish Soc 121:78-93.
Schaffter R. 2000. Mortality rates of largemouth bass in the Sacramento-San Joaquin Delta, 1980 through 1984. IEP Newsletter 13(4):54-60. Interagency Ecological Pro-gram. Sacramento (CA): California Department of Water Resources.

584584584584
Schanz R, Chen C. 1993. City of Stockton Water Quality Model, Volume I: Model development and calibration. Prepared by Philip Williams and Associates and Systech Engineering, Inc. for the City of Stockton.
Schneider K. 1999. Channel adjustments downstream of Goodwin Dam, Stanislaus River: an examination of river morphology and hydrology from 1996-1999. Report prepared for G. Mathias Kondolf, LA 227 Restoration of Rivers and Streams, University of California, Berkeley, Fall 1999.
Snedecor GW, Cochran WG. 1989. Statistical Methods. Ames (IA): Iowa State Univer-sity Press. 503 p.
Sokal RR, Rohlf FJ. 1995. Biometry: the principles and practice of statistics in biologi-cal research. New York (NY): W.H. Freeman and Company.
SP Cramer & Associates, Inc. 1997. Outmigrant trapping of juvenile salmonids in the lower Stanislaus River, Caswell State Park site, 1996. Final report submitted to the U.S. Fish and Wildlife Service under subcontract to CH2M Hill.
SP Cramer & Associates, Inc. 1998. Evaluation of juvenile chinook behavior, migration rate and location of mortality in the Stanislaus River through the use of radio tracking. Final report prepared for the Tri-dam Project.
Thomas R. Payne & Associates. 1997. Effects of the 1995 fall pulse flow on the timing of adult fall-run chinook salmon migration into the Stanislaus River and effects on the water quality in the lower Stanislaus and San Joaquin rivers. Report prepared for the Stockton East Water District.
Trenberth KE, Hurrell JW. 1994. Decadal atmospheric-ocean variations in the Pacific. Climate Dynamics 9:303-319.
[USBR] U.S. Bureau of Reclamation. 1993. Stanislaus River Basin Model. Draft report produced by J.H. Rowell, Mid-Pacific Region, Sacramento, California.
[USFWS] U.S. Fish and Wildlife Service. 1992. Abundance and survival of juvenile chinook salmon in the Sacramento-San Joaquin Estuary. 1991 Annual Progress Report, FY 91 Work Guidance, June 1992, Sacramento-San Joaquin Estuary Fish-ery Resource Office, U.S. Fish & Wildlife Service, Stockton, California, WRINT-USFWS-9.
[USFWS] U.S. Fish and Wildlife Service. 1993. The relationship between instream flow and physical habitat availability for chinook salmon in the Stanislaus River, Cali-fornia.
[USFWS] U.S. Fish and Wildlife Service. 1994. The relationship between instream flow and physical habitat availability for chinook salmon in the Tuolumne River, Cali-fornia.

585585585585
Vaux WG. 1962. Interchange of stream and intragravel water in a salmon spawning riffle. U.S. Fish and Wildlife Service Special Scientific Report-Fisheries No. 405. Contribution No. 82, College of Fisheries, University of Washington.
Vaux WG. 1968. Intragravel flow and interchange of water in a streambed. Fishery Bulletin 66(3):479-489.
Vick J. 1997. Presentation at the Joint CALFED/SJRMP San Joaquin River Fishery Technical Team Workshop, 15-16 January 1997 at Bass Lake, California.
Waters TF. 1995. Sediment in streams: sources, biological effects, and control. Bethesda (MD): American Fisheries Society Monograph 7. 251 p.
Yoshiyama RM, Fisher FW, Moyle PB. 1998. Historical abundance and decline of chi-nook salmon in the Central Valley region of California. N Am J Fish Manage 18:487-521.
Notes
Brandes P. U.S. Fish and Wildlife Service, fishery biologist, Stockton, California. Per-sonal communication with the author on 28 January 1998.
Frymire P. 2000. Long-term resident of the Stanislaus River corridor, Frymire Road, Knights Ferry, California. Personal communication with the author in March 2000.
Heyne T. California Department of Fish and Game, fishery biologist, La Grange, Cali-fornia. Personal communication with the author via email on 11 September 2000 and 22 October 2000.
Merz JE. East Bay Municipal Utility District, Fishery Biologist, Lodi, California. Per-sonal communication via email with the author on 28 August 1998.
Mierau D. 2000. McBain and Trush, fishery biologist, Arcata, California. Personal communication with the author in August 2000.
Oltmann R. 1998. U.S. Geological Survey, hydrologist, Sacramento, California. Per-sonal communication with the author on 30 January 1998.
Van Nieuwenhuyse E. 1998. U.S. Fish and Wildlife Service, Habitat Restoration Coor-dinator, Stockton California. Personal communication with the author in August 1998.
Vogel D. 2000. Natural Resource Scientists, fishery biologist and owner, Red Bluff, California. Personal communication with the author via email on 5 September 2000.

586586586586
Walser S. 2001. Sierra West Adventures, owner and fishing guide on the San Joaquin tributaries, Sonora, California. Personal communication with the author on 10 February 2001.