fa8721-05-c-002. the opinions, interpretations ... · scott hillis – clean room technician, group...
TRANSCRIPT

INVESTIGATION OF O-RING ADHESION IN SPACE MECHANISMS
A Major Qualifying Project Report
Submitted to the Faculty
of the
WORCESTER POLYTECHNIC INSTITUTE
In partial fulfillment of the requirements for the
Degree of Bachelor of Science
in Mechanical Engineering
By:
Tyler Albee
Katherine Mims
Date: 11 October 2012
Approved By:
Professor Nikolaos A. Gatsonis,Advisor
Mechanical Engineering Department, WPI
Jesse Mills, Affiliate Advisor
Carl Hart, Affiliate Advisor
Group 75, MIT Lincoln Laboratory
This work is sponsored by the Department of the Air Force under the United States Air Force contract number
FA8721-05-C-002. The opinions, interpretations, recommendations, and conclusions are those of the author(s)
and are not necessarily endorsed by the United States Government.

ii
Abstract
The project involves the investigation of adhesion in O-rings used in a space communications
mission designed by MIT Lincoln Laboratory. Experiments and testing were conducted with
sixteen types of O-rings and twelve different mating interfaces. Test results are presented for
adhesion force, thermal survival, adhesion at varying temperatures, outgassing, force vs.
deflection, optical metrology and surface roughness, and residue analysis. Free body diagram
analysis and finite element modeling are presented. The selection of an O-ring and interface that
fits the design parameters for the mission are presented. This investigation advances the
understanding of the adhesion process in O-rings used in deployable space mechanisms.

iii
Acknowledgements
The project team would like to thank the following people who were greatly involved in helping
us with this project:
WPI Staff:
Professor Gatsonis – Project Advisor
Professor Clancy – Site Coordinator
Professor Iannacchione –WPI Professor
MIT Lincoln Laboratory Staff:
Carl Hart – Supervisor, Group 71
Jesse Mills – Supervisor, Group 75
Todd Mower – Technical Staff, Group 75
Sharon Hardiman – Secretary, Group 75
Carol Mullinax – Secretary, Group 75
Peter Anderson – Technician, Group 72
Russ Goodman – Specialist, Group 81
Scott Hillis – Clean Room Technician, Group 72
Tasha Naylor – Clean Room Technician, Group 72
Glenn Matot – Clean Room Technician, Group 72

iv
Acronyms CVCM: Collected Volatile Condensable Materials
DMA: Dynamic Mechanical Analyzer
FBD: Free Body Diagram
FEA: Finite Element Analysis
FEM: Finite Element Modeling
FEP: Fluorinated Ethylene Propylene
HOPA: High Output Paraffin Actuator
LL: Lincoln Laboratory
MQP: Major Qualifying Project
ST: Space Terminal
THF: Tetrahydrofuran
TML: Total Mass Loss
VB: Vacuum Baked
WPI: Worcester Polytechnic Institute
Any O-Ring or Surface Related Acronyms can be found in Table 1 and Table 2.
Graph Color References
O-Rings:
O-Rings as Received - Green
FEP Encapsulated - Dark Blue
Vacuum Baked - Black
Any other treatment - Tan
Surfaces:
Aluminum - Light Blue
Invar - Red
HTR - Orange
N615 - Purple
1
Table of Contents Abstract ........................................................................................................................................... ii
Acknowledgements ........................................................................................................................ iii
Acronyms ....................................................................................................................................... iv
Graph Color References ................................................................................................................. iv
Table of Figures .......................................................................................................................... 3
Table of Tables ............................................................................................................................ 4
Chapter 1: Introduction ................................................................................................................... 5
1.1 Selecting O-Rings for the Space Terminal (ST) ................................................................... 7
1.2 Project Objectives and Approach ........................................................................................ 10
Chapter 2: Survival and Opening of the Launch Latch: Mechanical Analysis ............................. 13
2.1 Free Body Diagram Analysis .............................................................................................. 13
2.2 Finite Element Modeling of the Pawl Arm ......................................................................... 17
Chapter 3: O-Ring Test Standards ................................................................................................ 20
3.1 O-Ring and Interface Test Subjects .................................................................................... 20
3.2 O-Ring Sample Preparation ................................................................................................ 24
3.3 Dynamic Mechanical Analyzer Testing for Adhesion ........................................................ 27
3.4 Dynamic Mechanical Analyzer Testing at Hot and Cold Temperatures ............................ 31
3.5 Thermal Survival Testing .................................................................................................... 32
3.6 Stiffness Testing .................................................................................................................. 33
3.7 Durometer Testing ............................................................................................................... 33
3.8 Outgassing Testing .............................................................................................................. 34
3.9 Optical Metrology and Surface Roughness ......................................................................... 34
3.10 Residue/Squish Testing ..................................................................................................... 35
Chapter 4: O-Ring and Interface Data Analysis and Results ........................................................ 36
4.1 Adhesion Analysis............................................................................................................... 36
4.2 Thermal Survival Testing Analysis ..................................................................................... 39
4.3 Stiffness and Durometer Analysis ....................................................................................... 41
4.4 Outgassing Results .............................................................................................................. 44
4.5 Optical Metrology and Surface Roughness Results ............................................................ 45
4.6 Residue/Squish Test Results ............................................................................................... 49
2
4.7 DMA Temperature Testing Analysis .................................................................................. 50
4.8 Overall O-Ring Testing Results .......................................................................................... 51
Chapter 5: Launch Latch Final Analysis and Component Selection ............................................ 52
Chapter 6: Conclusions and Recommendations ........................................................................... 54
6.1 Factors in O-Ring Adhesion ................................................................................................ 54
6.2 Factors in Interface Adhesion ............................................................................................. 56
6.3 Possibilities for Future Research ......................................................................................... 57
Work Cited: ................................................................................................................................... 59
Appendix A: DMA Testing Standards .......................................................................................... 60
Appendix B: Outgassing Standards .............................................................................................. 65
Appendix C: HOPA Data Sheet .................................................................................................... 66
Appendix D: Surface Coating Specifications ............................................................................... 67
Appendix E: O-Ring Specification Sheets .................................................................................... 73
Appendix F: Vlier Spring Specifications ...................................................................................... 83
Appendix G: CD Files and References ......................................................................................... 84
3
Table of Figures Figure 1: Space Terminal with Launch Latch Annotated. .............................................................. 7
Figure 2: Latch Components Design Criteria to be Specified. ....................................................... 8
Figure 3: Latch Components to be Analyzed. ................................................................................ 9
Figure 4: Forces and Moments Applied to the Launch Latch ...................................................... 10
Figure 5: Free Body Diagram of Launch Latch Door ................................................................... 13
Figure 6: Free Body Diagram of the Hugging Arm Assembly ..................................................... 14
Figure 7: Free Body Diagram Calculation for HOPA Force and Frankenstein Bolt Force .......... 15
Figure 8: Forces Acting on the Latch Door during Opening ........................................................ 16
Figure 9: Adhesion Force vs. Forces Opening the Latch Door .................................................... 17
Figure 10: Pawl Arm Modeling of Applied and Fixed Forces. .................................................... 18
Figure 11: Stress Calculations Completed by SolidWorks SimulationXpress ............................. 20
Figure 12: O-Ring Testing Set-Up ................................................................................................ 25
Figure 13: O-Ring Bottom Plate with O-Rings and Washers ....................................................... 26
Figure 14: DMA Test as the Top Plate is Lifting ......................................................................... 28
Figure 15: TA Analysis Software for Performing DMA Tests ..................................................... 29
Figure 16: Adhesion Data Retrieval in Universal Analysis .......................................................... 30
Figure 17: O-Ring Adhesion Measurement Spreadsheet Example .............................................. 31
Figure 18: Adhesion of All O-Ring Types on Chemical film Aluminum .................................... 37
Figure 19: Adhesion of V0986 on All Interface Types ................................................................ 38
Figure 20: S0899 Adhesion for Different O-Ring Batches. ......................................................... 39
Figure 21: Thermal Survival Before and After Pictures of E1100 ............................................... 40
Figure 22: 3D Image of V0986 Before and After Thermal Testing ............................................. 41
Figure 23: Force vs. Deflection Data for RTV566 ....................................................................... 42
Figure 24: Force Required to Compress O-Rings ......................................................................... 43
Figure 25: O-Ring Stiffness vs. Durometer .................................................................................. 43
Figure 26: Surface Roughness and Optical Metrology for Aluminum Based Interfaces ............. 45
Figure 27: Surface Roughness and Optical Metrology of Invar Based Surfaces ......................... 46
Figure 28: Surface Roughness vs. Adhesion ................................................................................ 47
Figure 29: O-Ring Results when Tested with Both HTR and CFM ............................................. 48
Figure 30: O-Ring Results when Tested with Both N615 and CFM ............................................ 49
Figure 31: Squish Test Residue Results ........................................................................................ 49
Figure 32: Residue vs. Adhesion Results ..................................................................................... 50
Figure 33: Adhesion vs. Temperature Results for Selected O-Rings ........................................... 51
Figure 34: Overall Opening Force ................................................................................................ 52

4
Table of Tables Table 1: Table of O-Ring Types and their Identifying Information ............................................. 21
Table 2: Table of Interface Types and their Identifying Information ........................................... 23
Table 3: O-Ring Outgassing Results............................................................................................. 44

5
Chapter 1: Introduction
An O-ring is a torus, or doughnut shaped ring generally molded from an elastomer and are
commonly used as a seal to prevent the loss of fluid or gas between two interfaces. However,
O-ring seals can be used as the interface between mated components, as they form an effective
contamination seal for optical instruments while also providing some form of damping through
the viscoelastic property of the material. Most space flight optical systems for example feature
mechanisms utilizing O-rings for contamination control that are deployed once the payload is in
orbit. Some examples include motorized covers or doors for optical instruments along with
restraint latches which protect hardware during launch conditions. There are many aspects to the
selection of an O-ring and its mating interface, however one of the most important and least
understood parameters is parasitic adhesion.
O-Ring adhesion is the result of an unknown interaction that occurs between the surface the
O-ring presses against when forming a seal and the O-ring itself. The adhesion forces between
the O-ring and its mating interface “lock” the two surfaces together. Depending on the amount of
adhesion force, it can be difficult to separate the two surfaces. The magnitude of adhesion is not
easily calculated or predicted due to its variability with temperature, O-ring chemical
composition, mating surface material and finish, along with O-ring lubrication, if applicable, in
addition to the unknown source of adhesion. Adhesion, if left unchecked, could potentially lead
to the mechanism not separating once on orbit so great care must be taken in specifying an
O-ring and its mating interface in a deployable contamination seal design. To address this
concern of adhesion, O-rings can be coated with thin films of Teflon, lubricated, encapsulated in
thicker wall Teflon tubing, or vacuum baked depending on the requirements of their use.

6
The Massachusetts Institute of Technology’s Lincoln Laboratory (LL) had at one time
experienced O-ring adhesion complications in an optical sensor system during thermal vacuum
testing at cold conditions. After risk reduction testing and analysis, this particular program
decided to eliminate O-ring adhesion altogether by removing the O-ring and replacing it with
Vespel buttons. Currently, LL is preparing a new Optical Module (OM) including a Launch
Latch that utilizes both labyrinth passages and an O-ring for contamination mitigation. To
analytically show that the latch has appropriate margin against O-ring adhesion, measurements
of O-ring adhesion were required. This was one of the major motivations for this MQP project.
The functioning of O-rings, particularly adhesion to their interfacing surfaces, can determine the
success or failure of major projects, and predicting modes of failure can be difficult. Our
understanding about the causes of O-ring adhesion is limited which makes the design of
components or choice of O-rings to avoid adhesion somewhat arbitrary. Current published
information (e.g. NASA) focuses on only a few O-rings that have known low outgassing
properties and does not provide a complete dataset for designing to minimize adhesion between
O-rings and adhering surfaces. Preferably, a relation between the chemical composition of O-
rings, their interfacing materials and adhesion, or a guide to common O-rings and their adhesion
when interfaced with a material would be the ideal situation.
The main goal of this MQP will be to investigate the underlying fundamental physics and
mechanisms that cause and/or reduce adhesion between O-rings and their mating interfaces, to be
used by a space terminal mission. The MQP will attempt to identify parameters that can lead to
O-ring adhesion and determine from a fundamental perspective which of these parameters affect
adhesion to the greatest extent with a goal being on reducing this parasitic force or even finding a
zero adhesion solution.
7
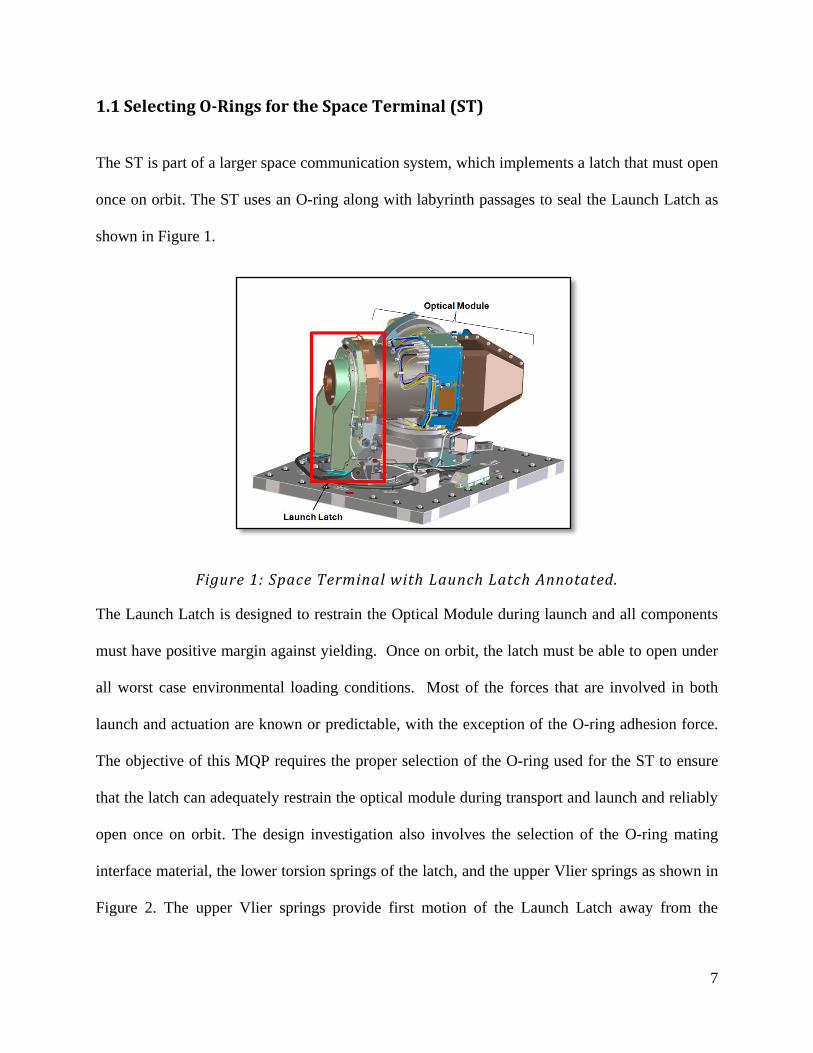
1.1 Selecting O-Rings for the Space Terminal (ST)
The ST is part of a larger space communication system, which implements a latch that must open
once on orbit. The ST uses an O-ring along with labyrinth passages to seal the Launch Latch as
shown in Figure 1.
Figure 1: Space Terminal with Launch Latch Annotated.
The Launch Latch is designed to restrain the Optical Module during launch and all components
must have positive margin against yielding. Once on orbit, the latch must be able to open under
all worst case environmental loading conditions. Most of the forces that are involved in both
launch and actuation are known or predictable, with the exception of the O-ring adhesion force.
The objective of this MQP requires the proper selection of the O-ring used for the ST to ensure
that the latch can adequately restrain the optical module during transport and launch and reliably
open once on orbit. The design investigation also involves the selection of the O-ring mating
interface material, the lower torsion springs of the latch, and the upper Vlier springs as shown in
Figure 2. The upper Vlier springs provide first motion of the Launch Latch away from the

8
mating O-ring interface and the potential energy stored in the lower torsion springs are
responsible for driving the Launch Latch away from the Optical Module.
Figure 2: Latch Components Design Criteria to be Specified.
The opening of the latch greatly depends upon the functionality of the HOPAs (High Output
Paraffin Actuators) and the Pawl Arm, as shown in Figure 3. The HOPAs act as a pin puller,
holding the Launch Latch closed until the door is to be opened, and then releasing the door when
required to. The HOPAs must not yield due to the force induced on them by holding the latch
door closed, by applying force to the Pawl Arm. The Pawl Arm also must not break due to the
applied forces acting on it during the survival and opening stages of the Launch Latch. The latch
pin will be accounted for, as well as the friction it applies when opening the latch.

9
There are several specific design requirements, aside from survival and opening of the latch,
which exist for the function of the latch and the ST telescope:
a.) The materials utilized, specifically the O-ring and its interfacing surface, must be low
outgassing materials.
b.) A safety factor of 1.25 must be applied when analyzing for yield stress of identified
components or O-ring adhesion.
c.) The load applied to the HOPAs by the Pawl Arm of the Launch Latch cannot exceed the
max allowable shear force.
d.) The Pawl Arm must not exceed the max allowable yield stress of 120 ksi which includes
a safety factor of 1.25.
Figure 3: Latch Components to be Analyzed.
10
The selection of the lower torsion springs and upper viler springs is critical to overcoming the
parasitic forces from the O-ring adhesion and latch pin friction to result in a successful opening
stage. The O-ring has the largest amount of uncertainty associated with its adhesion force, and
will be tested in various scenarios to decrease the amount of unpredictability associated with
O-ring adhesion. The components must be selected for the Launch Latch design to ensure the
survival of hardware and successful opening in orbit.
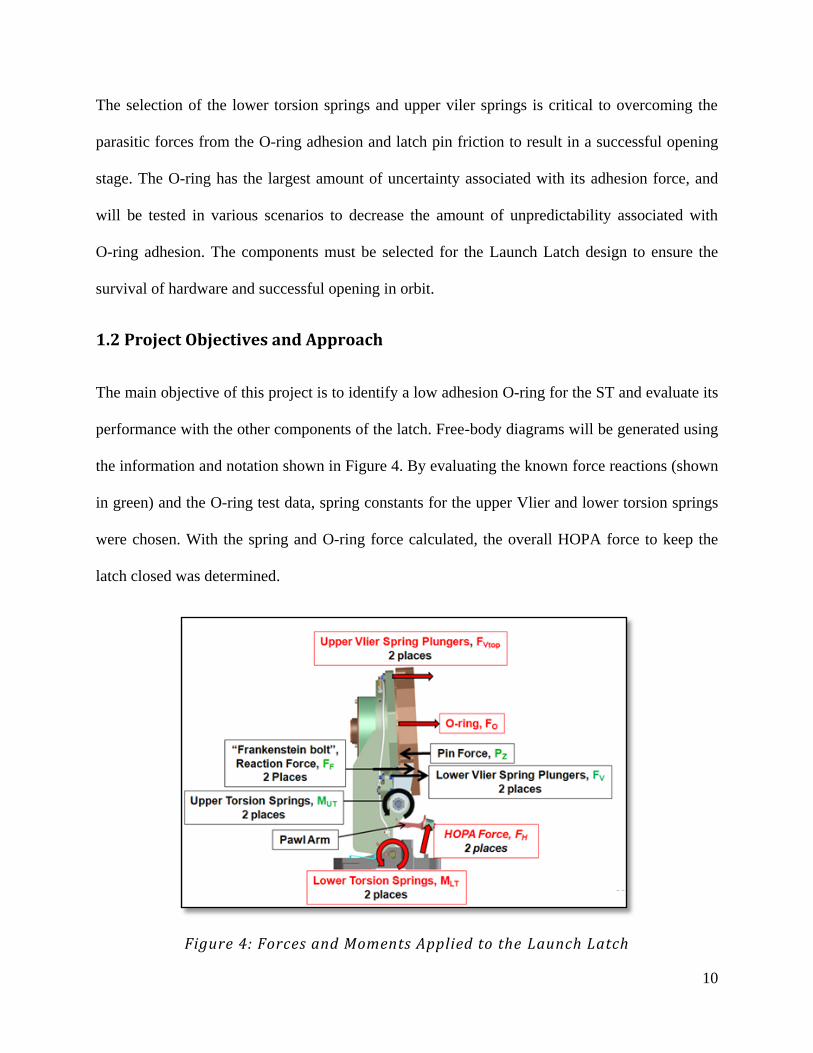
1.2 Project Objectives and Approach
The main objective of this project is to identify a low adhesion O-ring for the ST and evaluate its
performance with the other components of the latch. Free-body diagrams will be generated using
the information and notation shown in Figure 4. By evaluating the known force reactions (shown
in green) and the O-ring test data, spring constants for the upper Vlier and lower torsion springs
were chosen. With the spring and O-ring force calculated, the overall HOPA force to keep the
latch closed was determined.
Figure 4: Forces and Moments Applied to the Launch Latch

11
Analysis using finite element modeling (FEM) based off the calculated HOPA force allowed the
stress of the Pawl Arm to be computed. The yield point of the Pawl Arm and the maximum
HOPA force was determined to ensure that the Optical Module was successfully held shut
through the entry into space.
To investigate O-ring adhesion and fulfill the design requirements, several experimental
approaches were taken to analyze the functioning of the ST Launch Latch, which are
summarized below.
a) Perform Dynamic Mechanical Analyzer (DMA) testing to accurately measure the
adhesion force between O-rings and their paired interfaces. A minimum of five trials of
each of the 57 proposed sample types were conducted. During these tests, a number of
O-rings were evaluated against a common surface to compare their overall adhesion to a
common surface. Tests were conducted with particular O-rings with varying interfaces
and treatments, such as vacuum baking or thin-film coatings, and compared to their non-
treated counterparts.
b) Perform adhesion testing at various temperatures using the DMA furnace to develop an
understanding of O-ring adhesion at cold and hot temperatures.
c) Perform thermal survival testing to observe the effects of extreme cold on O-ring
survival.
d) Perform low outgassing testing through an outside vendor per ASTM 595-07 standards,
which is further explained in the outgassing section.
e) Perform stiffness testing to evaluate the amount of force required to compress O-rings a
particular distance. This data was then used to model the amount of force required to
close the Launch Latch and compress the O-ring 0.010 inches to create a seal.
12
f) Obtain optical metrology and surface roughness measurements to investigate the relation
between O-ring adhesion and the mating surfaces roughness.
g) Perform basic analyses involving free body diagrams to understand the force
interactions of the Launch Latch and the effect of O-ring adhesion on the Launch Latch.
The analytical and experimental results were used to select viler plunger, lower torsion springs,
an O-ring and its mating interface. The results of this MQP provide assurance for the successful
operation of the ST Launch Latch.
13
Chapter 2: Survival and Opening of the Launch Latch: Mechanical
Analysis
The Launch Latch was analyzed using free body diagrams to formulate equations that described
the relation of forces and moments within the system. The required HOPA force was calculated
and used to determine that the HOPA’s would not fail. Finite element modeling (FEM) was
completed for the Pawl Arm to ensure that it would not reach its yield stress during the survival
or opening stages. This chapter describes the process and physical analysis of the Launch Latch
and Pawl Arm in both the survival and opening stages.
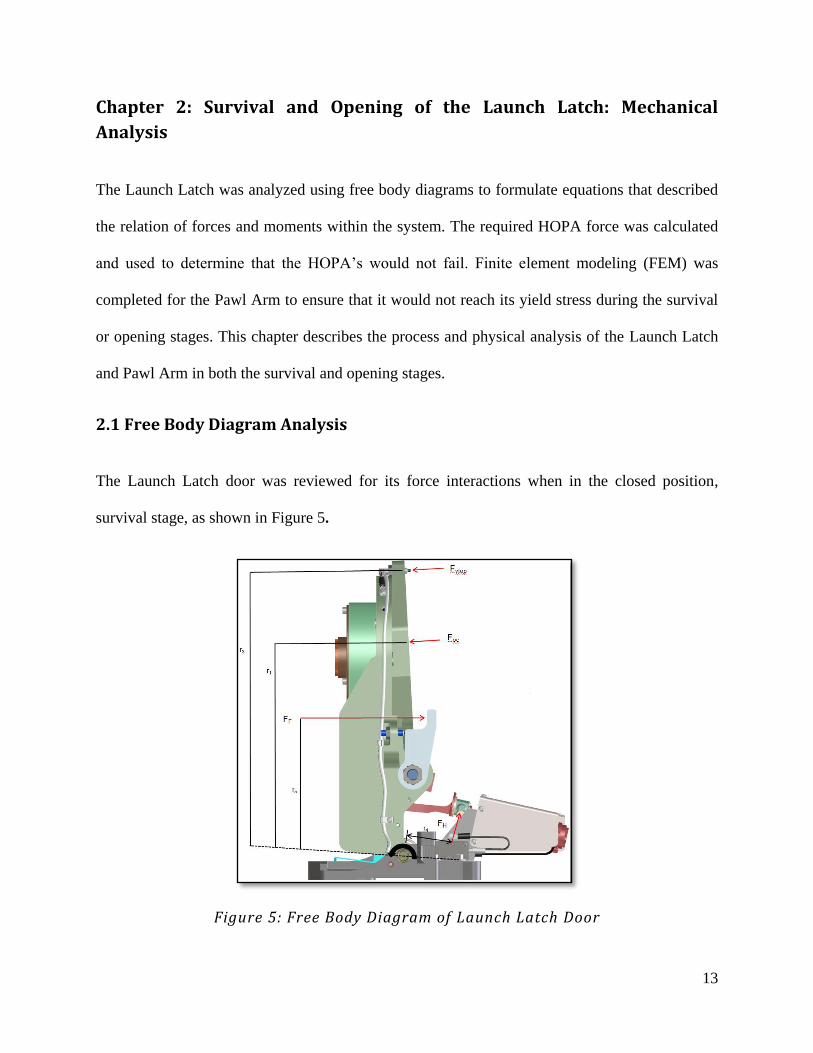
2.1 Free Body Diagram Analysis
The Launch Latch door was reviewed for its force interactions when in the closed position,
survival stage, as shown in Figure 5.
Figure 5: Free Body Diagram of Launch Latch Door

14
The main forces involved were; Fvtop: the force applied by the upper Vlier springs, Foc: the force
required to compress the O-ring, Fv: the force applied by the lower Vlier springs, FF: the force
applied by the Frankenstein bolt force (part of the Optical Module), FH: the HOPA force, and
MLT: the moment applied by the lower torsion springs. The slight angle of the Launch
Latch/Optical Module interface was 3°, and was found to be negligible regarding the magnitude
of forces being predicted. The angle of the HOPA force, acting perpendicular to the end of the
Pawl Arm, shown as theta, was 12.81°. The moment arms for the forces in all free body
diagrams were determined using the SolidWorks CAD model. The sum of the moments about
the lower axle resulted in two unknown forces, FH and FF. In order to solve for both forces, a
secondary force relation equation was required. To find this second equation, the hugging arm
assembly was reviewed and the moments about the hugging arm pin in the system calculated, as
shown in Figure 6.
Figure 6: Free Body Diagram of the Hugging Arm Assembly

15
The HOPA force was calculated in relation to the O-ring forces, the upper Vlier springs and
lower torsion springs. The lower Vlier springs were given as 2.3 lbf each and the upper torsion
springs as 3 lbf-in each. The numerical values and equations for both states were input into a
MathCAD file and evaluated to find the overall HOPA force and FF, the Frankenstein bolt force,
simultaneously, as shown in Figure 7. The HOPA force is the top result of inverse matrices
calculation, and the Frankenstein bolt force is the lower result.
Figure 7: Free Body Diagram Calculation for HOPA Force and Frankenstein Bolt
Force

16
To evaluate whether the chosen O-ring were reasonable, the forces acting on the door just at the
opening state were evaluated. The forces acting on the latch door just prior to opening are the
upper Vlier springs and lower torsion springs, as well as Fadhesion: the adhesion force from the O-
ring adhering to its mating surface and Pz: the force of the latch pin on the latch door as shown
in Figure 8.
Figure 8: Forces Acting on the Latch Door during Opening
The adhesion force, determined by measurement, was applied to the equation for the latch
opening with the upper Vlier and lower torsion springs to ensure the opening of the latch door.
The pin force Pz, was given as 5.6 lbf in the problem statement, which resulted from frication at
the pin/socket interface. As shown in Figure 9 below, if the forces of the lower torsion springs,
upper Vlier springs and latch pin are greater than the O-ring adhesion force the latch will open.

17
Figure 9: Adhesion Force vs. Forces Opening the Latch Door
The final O-ring and correlating HOPA force was then analyzed on an elemental level to make
sure the stress and displacement of the Pawl Arm was within a reasonable range.
2.2 Finite Element Modeling of the Pawl Arm
Finite element modeling was conducted for the Pawl Arm. The required HOPA force determined
by the free body diagram analysis results was then used to model the stress and displacement of
the Pawl Arm. The modeling was completed using SolidWorks SimulationXpress. The Pawl
Arm’s attachment point to the Launch Latch window was modeled as a fixed point, annotated by
the green arrows in Figure 10. The applied HOPA force required to hold the Launch Latch
closed is shown in purple. The applied force is applied perpendicular to the Pawl Arm shaft.

18
Figure 10: Pawl Arm Modeling of Applied and Fixed Forces.
The Pawl Arm is fabricated from beryllium copper (C17200, Alloy 25) HT temper certified per
AMS 4535. The material has an elastic modulus of 19x106 psi, a density of 0.302 lb/in
3, tensile
yield strength of 150 ksi and an ultimate tensile strength of 175 ksi. These properties were
entered into SolidWorks for the Pawl Arm component. The yield strength was divided by the
safety factor of 1.25 to provide the maximum allowable yield stress of 120 ksi.
The adhesion force for a full O-ring was calculated based on the adhesion force per inch
calculated for the final O-ring samples. The adhesion force was calculated on the upper bound of
a 95% confidence interval, to account for a worst case scenario, and then multiplied by the safety
factor of 1.25. The adhesion force for the full O-ring was then entered into the MathCAD
calculation, along with the O-ring compression force and chosen upper Vlier spring and lower
torsion spring values to calculate the HOPA force. In the problem statement provided, there are
three load cases of which induce stress to the Pawl Arm. The first load case is the amount of
force required to hold the Launch Latch window shut, which we are referring to in this report as
19
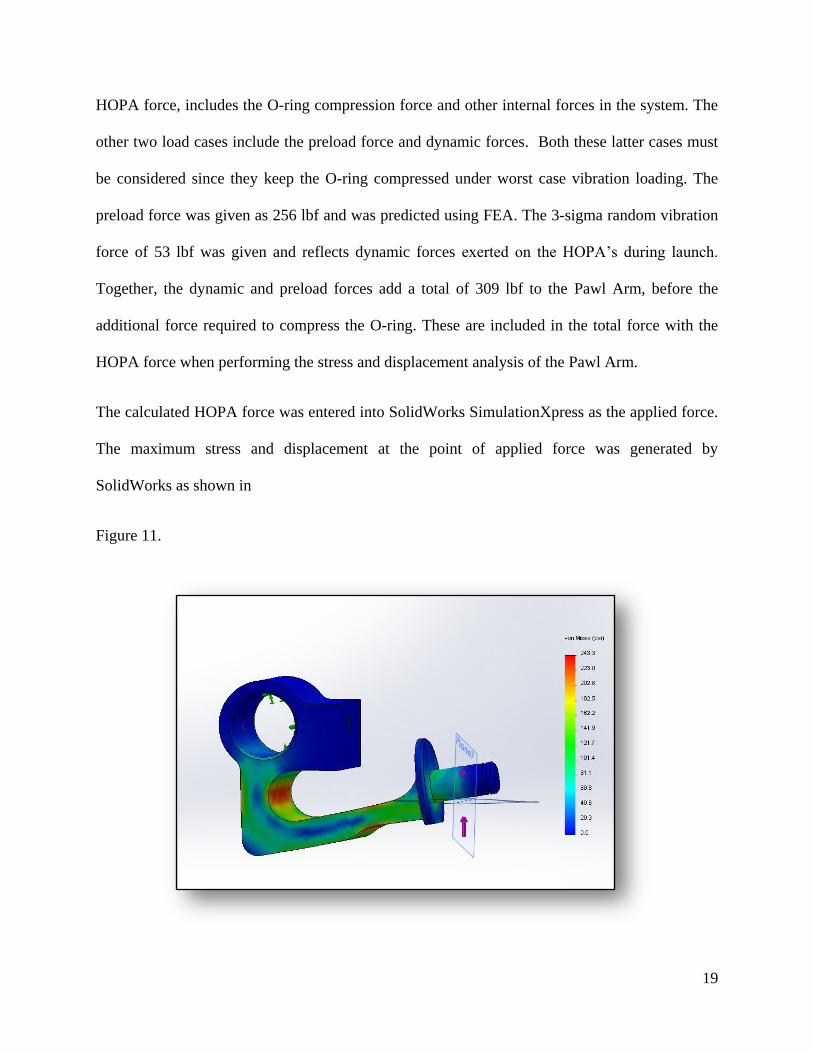
HOPA force, includes the O-ring compression force and other internal forces in the system. The
other two load cases include the preload force and dynamic forces. Both these latter cases must
be considered since they keep the O-ring compressed under worst case vibration loading. The
preload force was given as 256 lbf and was predicted using FEA. The 3-sigma random vibration
force of 53 lbf was given and reflects dynamic forces exerted on the HOPA’s during launch.
Together, the dynamic and preload forces add a total of 309 lbf to the Pawl Arm, before the
additional force required to compress the O-ring. These are included in the total force with the
HOPA force when performing the stress and displacement analysis of the Pawl Arm.
The calculated HOPA force was entered into SolidWorks SimulationXpress as the applied force.
The maximum stress and displacement at the point of applied force was generated by
SolidWorks as shown in
Figure 11.
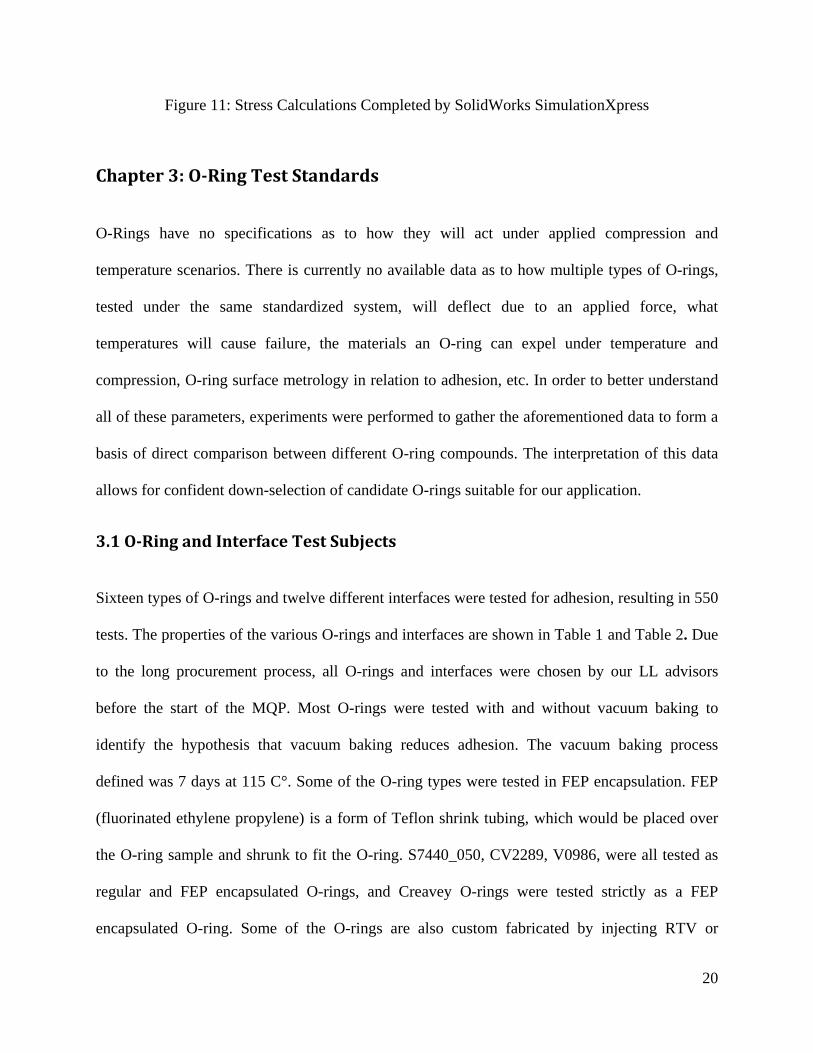
20
Figure 11: Stress Calculations Completed by SolidWorks SimulationXpress
Chapter 3: O-Ring Test Standards
O-Rings have no specifications as to how they will act under applied compression and
temperature scenarios. There is currently no available data as to how multiple types of O-rings,
tested under the same standardized system, will deflect due to an applied force, what
temperatures will cause failure, the materials an O-ring can expel under temperature and
compression, O-ring surface metrology in relation to adhesion, etc. In order to better understand
all of these parameters, experiments were performed to gather the aforementioned data to form a
basis of direct comparison between different O-ring compounds. The interpretation of this data
allows for confident down-selection of candidate O-rings suitable for our application.
3.1 O-Ring and Interface Test Subjects
Sixteen types of O-rings and twelve different interfaces were tested for adhesion, resulting in 550
tests. The properties of the various O-rings and interfaces are shown in Table 1 and Table 2. Due
to the long procurement process, all O-rings and interfaces were chosen by our LL advisors
before the start of the MQP. Most O-rings were tested with and without vacuum baking to
identify the hypothesis that vacuum baking reduces adhesion. The vacuum baking process
defined was 7 days at 115 C°. Some of the O-ring types were tested in FEP encapsulation. FEP
(fluorinated ethylene propylene) is a form of Teflon shrink tubing, which would be placed over
the O-ring sample and shrunk to fit the O-ring. S7440_050, CV2289, V0986, were all tested as
regular and FEP encapsulated O-rings, and Creavey O-rings were tested strictly as a FEP
encapsulated O-ring. Some of the O-rings are also custom fabricated by injecting RTV or

21
silicones into thick walled Teflon tubing with the appropriate inner diameter. All O-rings are
made of polymer based substances, and therefore are very vulnerable to chemical interactions
and inconsistencies within themselves. O-Ring composition can vary depending on the
temperature the O-ring is stored at, how long it cures for, the humidity and pressure at storage,
etc. The O-ring spec sheets can be found in Appendix E. All O-rings were tested against
chemical film machined aluminum interfaces to allow for consistent comparison.
Table 1: Table of O-Ring Types and their Identifying Information
O-Ring Name Manufacturer Description Durometer
V0986 (Viton) Parker Fluorocarbon based O-ring for
high vacuum and high
temperature situations
50
SCV2585
(Custom O-ring)
Nusil Silicone based O-ring for use in
applications requiring ultra-low
outgassing
40
S0899 Parker Silicone based O-ring for low
temperature applications
50
E1100 Parker EPDM based rubber O-ring 50
LM151 Parker Fluorosilicone based O-ring for
low temperature applications
50
S0469 Parker Silicone based O-ring for low
temperature applications
40
RTV566
(Custom O-ring)
Momentive
Performance
Silicone based O-ring for low
outgassing applications
60
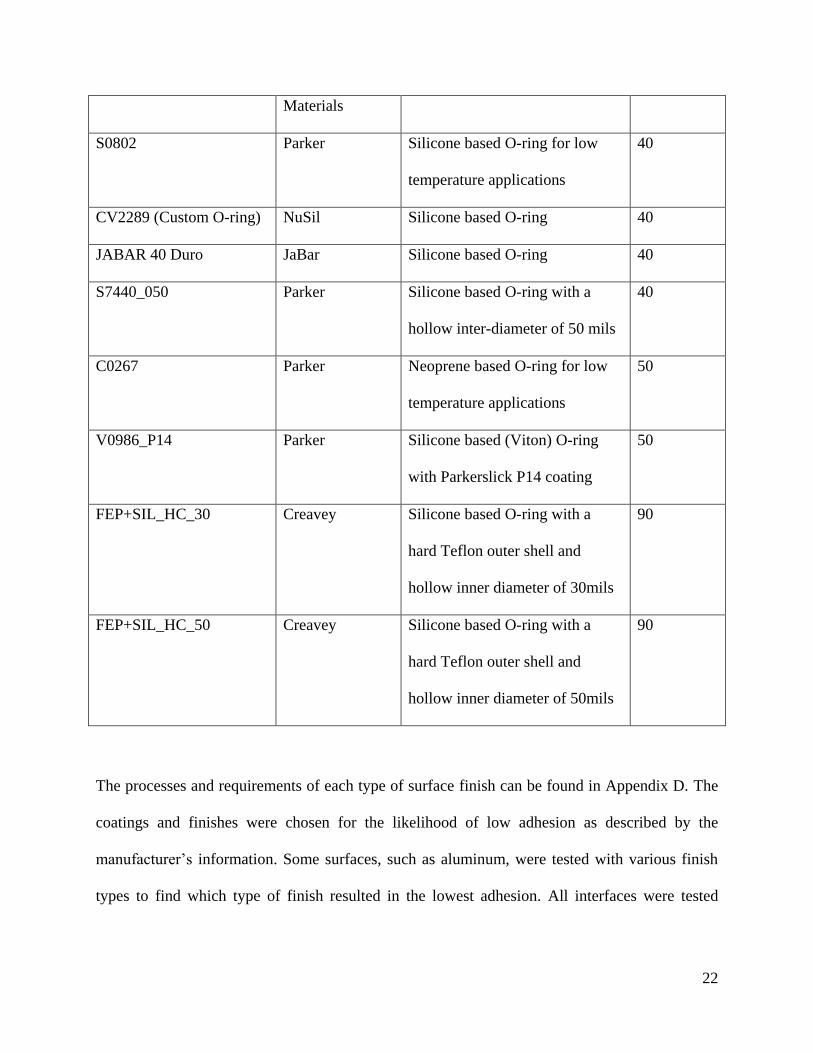
22
Materials
S0802 Parker Silicone based O-ring for low
temperature applications
40
CV2289 (Custom O-ring) NuSil Silicone based O-ring 40
JABAR 40 Duro JaBar Silicone based O-ring 40
S7440_050 Parker Silicone based O-ring with a
hollow inter-diameter of 50 mils
40
C0267 Parker Neoprene based O-ring for low
temperature applications
50
V0986_P14 Parker Silicone based (Viton) O-ring
with Parkerslick P14 coating
50
FEP+SIL_HC_30 Creavey Silicone based O-ring with a
hard Teflon outer shell and
hollow inner diameter of 30mils
90
FEP+SIL_HC_50 Creavey Silicone based O-ring with a
hard Teflon outer shell and
hollow inner diameter of 50mils
90
The processes and requirements of each type of surface finish can be found in Appendix D. The
coatings and finishes were chosen for the likelihood of low adhesion as described by the
manufacturer’s information. Some surfaces, such as aluminum, were tested with various finish
types to find which type of finish resulted in the lowest adhesion. All interfaces were tested
23
against V0986 O-rings to allow for consistent comparison. The best surface performers were
paired with the promising O-ring type.
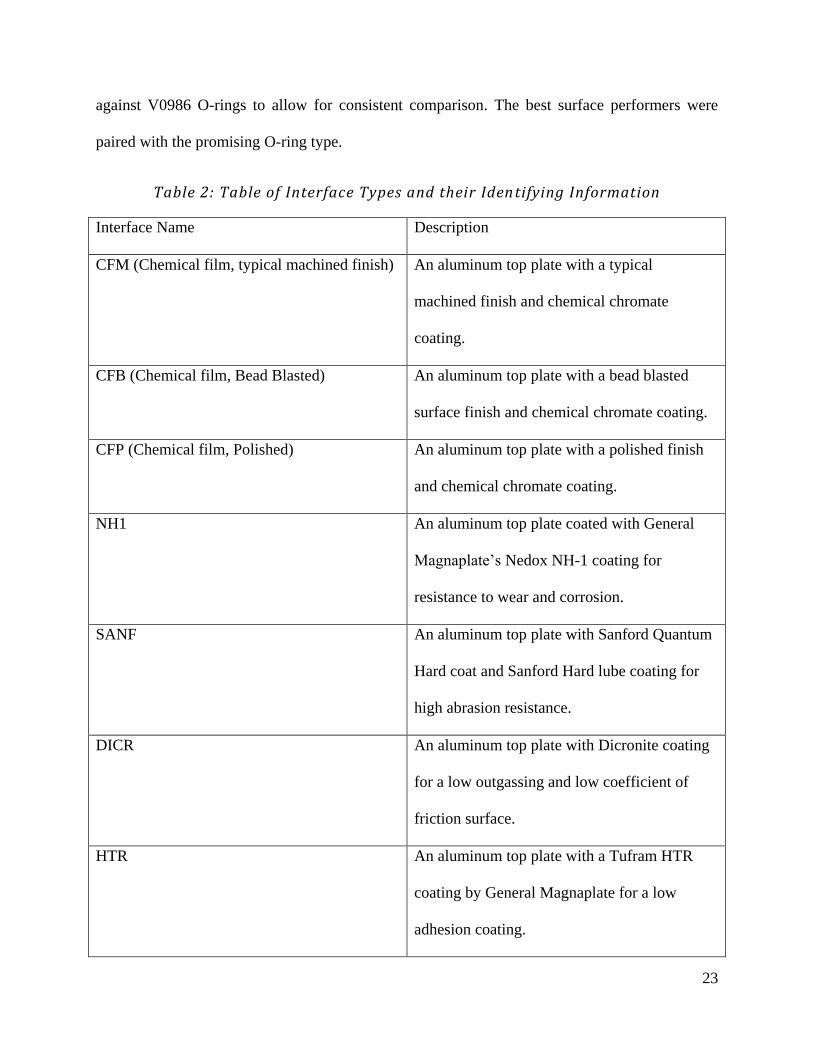
Table 2: Table of Interface Types and their Identifying Information
Interface Name Description
CFM (Chemical film, typical machined finish) An aluminum top plate with a typical
machined finish and chemical chromate
coating.
CFB (Chemical film, Bead Blasted) An aluminum top plate with a bead blasted
surface finish and chemical chromate coating.
CFP (Chemical film, Polished) An aluminum top plate with a polished finish
and chemical chromate coating.
NH1 An aluminum top plate coated with General
Magnaplate’s Nedox NH-1 coating for
resistance to wear and corrosion.
SANF An aluminum top plate with Sanford Quantum
Hard coat and Sanford Hard lube coating for
high abrasion resistance.
DICR An aluminum top plate with Dicronite coating
for a low outgassing and low coefficient of
friction surface.
HTR An aluminum top plate with a Tufram HTR
coating by General Magnaplate for a low
adhesion coating.

24
TAPE An aluminum top plate with Silver Teflon
Tape applied for a low adhesion, low solar
absorption surface.
INVAR An invar top plate with a typical machined
surface finish.
INVAR BLASTED An invar top plate with a bead blasted surface
finish.
SF-2 An invar top plate coated with General
Magnaplate’s Nedox SF-2 coating for hardness
with lubricity.
N615W An invar top plate coated with General
Magnaplate’s Nedox N615W coating for a low
adhering coating.
3.2 O-Ring Sample Preparation
Each O-ring test sample required proper preparation before testing. Prior to physically
assembling the O-ring sample any treatments or coatings, such as vacuum baking, were applied
to the samples. The test sample set-up was comprised of several components including the
O-ring, top plate, bottom plate, four socket head cap screws, and four 0.014” thick washers, as
shown in Figure 12. The socket head cap screws held the top and bottom plates against the
washers to establish constant 0.013” displacement of the O-ring. The O-ring rested in the
dovetail groves of the bottom plate, and touched the top plate. For DMA testing, thermal survival

25
testing, and thermal adhesion testing, the following procedure was performed. The samples were
assembled in a clean room environment to greatly reduce particulate contamination.
Figure 12: O-Ring Testing Set-Up
All materials brought into the clean room were cleaned with isopropyl alcohol or vacuumed for
particulates before entering. The washers and screws were subjected to a vapor degrease and
isopropyl ultrasonic bath for 5 minutes. The O-rings were cut into approximately 1.5” long
pieces and then wiped with isopropyl alcohol. After cleaning the O-rings, they were left to sit for
a minimum of 15 minutes, to allow any remaining isopropyl alcohol to evaporate. The O-rings
were then positioned into the dovetail groves in the bottom plate. The washers were placed on
the bottom plate around the screw holes, and the top plate placed on top of the O-rings as shown
in Figure 13.

26
Figure 13: O-Ring Bottom Plate with O-Rings and Washers
The screws were installed through the top plate and into threaded into the bottom plate and were
torqued to 2 ft-lb in a ‘X’ pattern to ensure that each sample had the same applied compression
force on the O-ring. A small alignment test fixture was used to center the top plate over the
O-rings while placing the top plate upon the O-rings. The O-ring test set-ups were then sealed in
bags and left in contact for 7 days at room temperature before testing.
After the samples were tested, the top plates were cleaned with tetrahydrofuran (THF) in a
solvent hood using clean room swabs. This was done to remove any O-ring residue deposited on
the top plates. The top plate samples were also cleaned in an ultrasonic isopropyl bath between 5
and 10 minutes, then dried with a nitrogen gun and left to air dry to evaporate any remaining
liquid. The O-rings were also re-cleaned by being wiped in isopropyl alcohol and left to dry for
15 minutes. O-Rings were only retested on the same interface it had been previously tested on to

27
avoid cross contamination. The samples were then fully reassembled in the clean room to be
retested.
3.3 Dynamic Mechanical Analyzer Testing for Adhesion
A Dynamic Mechanical Analyzer (DMA) was used to test the O-ring samples for adhesion using
a custom fixture, as shown in Figure 14. The DMA load shaft had a hemispherical interface that
would pilot on the hole within the top plate of the adhesion specimen. The load shaft would then
be secured to the top plate by hand tightening the nut. The O-ring sample was aligned to the
DMA load shaft to ensure the load shaft was perpendicular to the top plate of the sample. This
was verified by lifting upon the DMA load shaft to ensure the bottom of the adhesion specimen
baseplate lifted in a parallel motion from the DMA platen. After this check, the adhesion test
sample’s bottom plate was clamped to the DMA platen by screwing down the two side clamps.
The sample was held in place by one test operator, while the other screwed down the screws to
ensure the adhesion specimen didn’t move. The four socket head cap plate screws were carefully
removed in a cross-hatch pattern, while the top plate was compressed manually to ensure no
movement of the plate during screw removal. The DMA was prompted to start applying force
and collecting data via the test computer. The DMA load shaft, top plate, bottom plate and
O-rings can be seen in Figure 14 below, in which the top plate has just lifted off the O-rings
during the test.

28
Figure 14: DMA Test as the Top Plate is Lifting
The DMA was checked for accuracy at the start of each day’s testing to ensure consistency
between the tests by measuring the force of a top plate without any adhesion (i.e., no O-ring).
For testing O-ring adhesion, the DMA was programmed to apply ramp to 0.1 N of force at a rate
of 0.25 N/min in the negative y-direction of the DMA (upward lift of the top plate away from the
O-ring). After reaching 0.1 N (which is about half the nominal weight of an aluminum top plate),
the DMA would then ramp to 18 N of force at a rate of 5 N/minute (upwards). In all tests, the
top plate separated prior to reaching 18 N. Using TA Universal Analysis, the DMA reported the
applied force on the test sample, and stopped applying force when the sample yielded, as shown
in Figure 15.
29
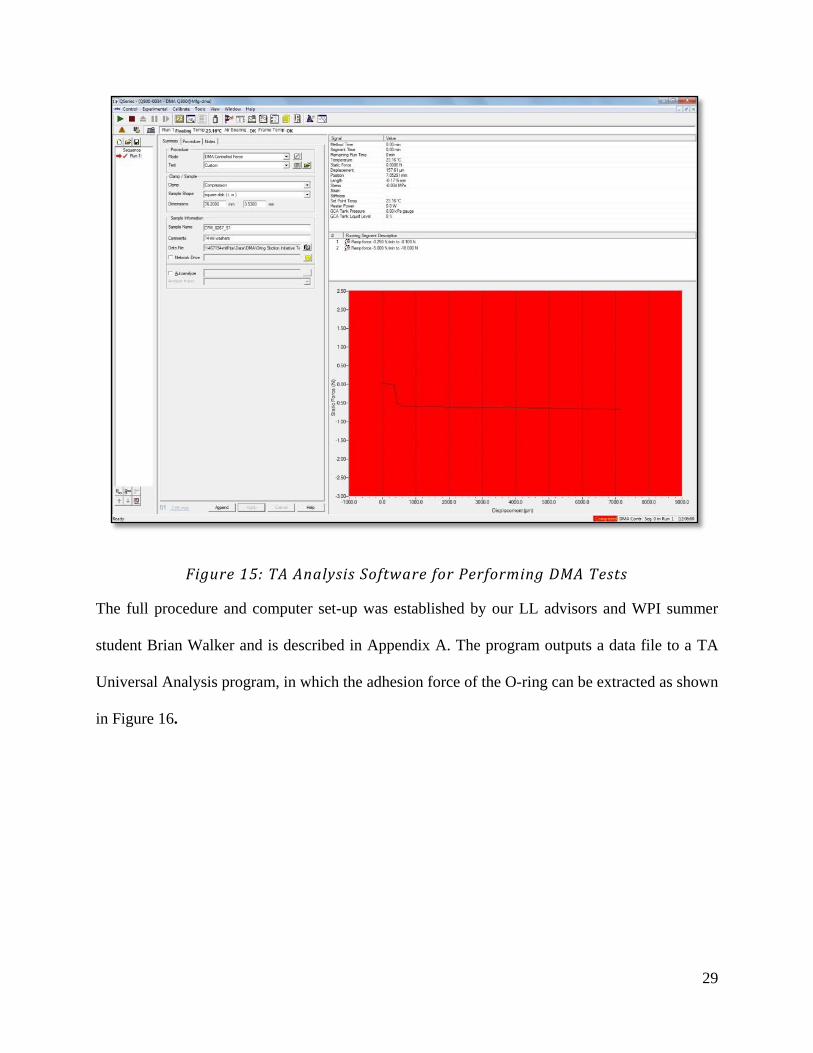
Figure 15: TA Analysis Software for Performing DMA Tests
The full procedure and computer set-up was established by our LL advisors and WPI summer
student Brian Walker and is described in Appendix A. The program outputs a data file to a TA
Universal Analysis program, in which the adhesion force of the O-ring can be extracted as shown
in Figure 16.
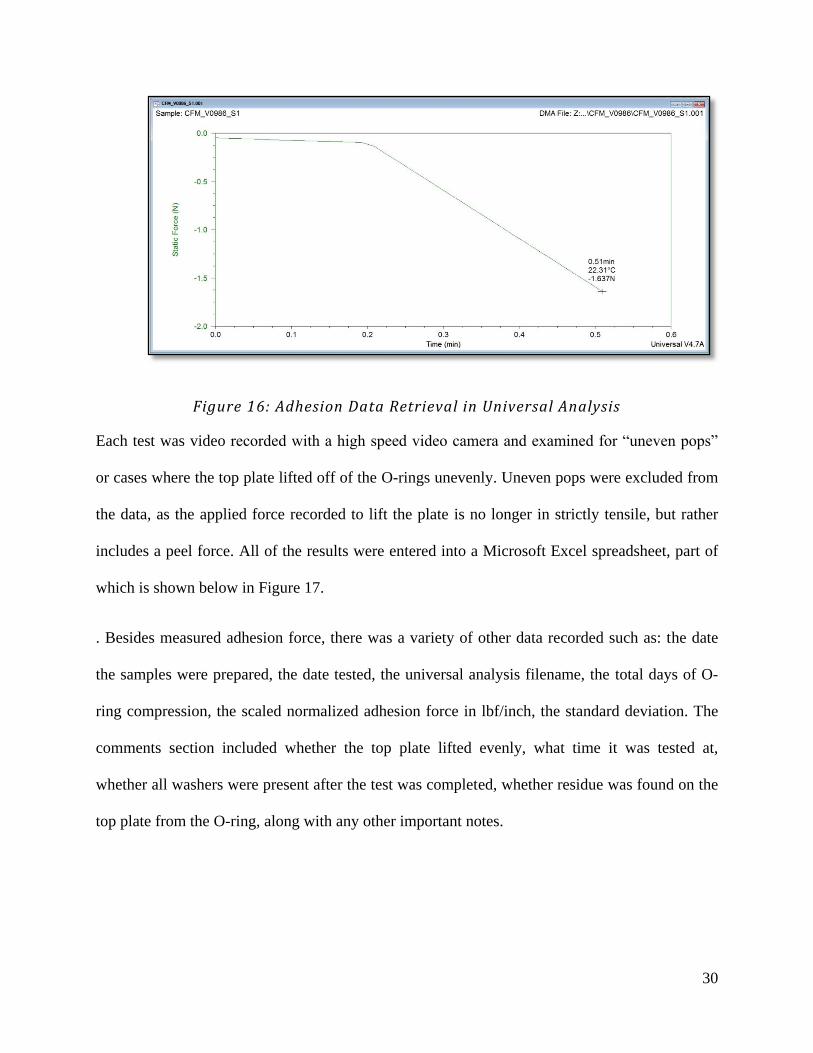
30
Figure 16: Adhesion Data Retrieval in Universal Analysis
Each test was video recorded with a high speed video camera and examined for “uneven pops”
or cases where the top plate lifted off of the O-rings unevenly. Uneven pops were excluded from
the data, as the applied force recorded to lift the plate is no longer in strictly tensile, but rather
includes a peel force. All of the results were entered into a Microsoft Excel spreadsheet, part of
which is shown below in Figure 17.
. Besides measured adhesion force, there was a variety of other data recorded such as: the date
the samples were prepared, the date tested, the universal analysis filename, the total days of O-
ring compression, the scaled normalized adhesion force in lbf/inch, the standard deviation. The
comments section included whether the top plate lifted evenly, what time it was tested at,
whether all washers were present after the test was completed, whether residue was found on the
top plate from the O-ring, along with any other important notes.
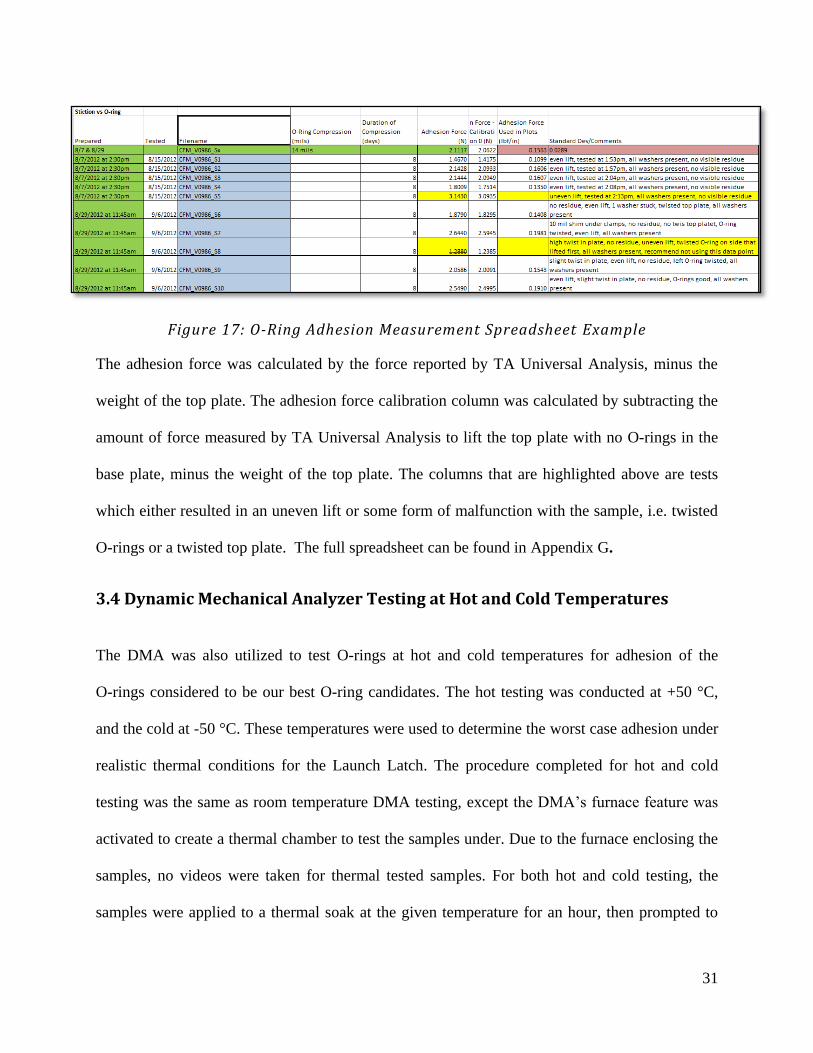
31
Figure 17: O-Ring Adhesion Measurement Spreadsheet Example
The adhesion force was calculated by the force reported by TA Universal Analysis, minus the
weight of the top plate. The adhesion force calibration column was calculated by subtracting the
amount of force measured by TA Universal Analysis to lift the top plate with no O-rings in the
base plate, minus the weight of the top plate. The columns that are highlighted above are tests
which either resulted in an uneven lift or some form of malfunction with the sample, i.e. twisted
O-rings or a twisted top plate. The full spreadsheet can be found in Appendix G.
3.4 Dynamic Mechanical Analyzer Testing at Hot and Cold Temperatures
The DMA was also utilized to test O-rings at hot and cold temperatures for adhesion of the
O-rings considered to be our best O-ring candidates. The hot testing was conducted at +50 °C,
and the cold at -50 °C. These temperatures were used to determine the worst case adhesion under
realistic thermal conditions for the Launch Latch. The procedure completed for hot and cold
testing was the same as room temperature DMA testing, except the DMA’s furnace feature was
activated to create a thermal chamber to test the samples under. Due to the furnace enclosing the
samples, no videos were taken for thermal tested samples. For both hot and cold testing, the
samples were applied to a thermal soak at the given temperature for an hour, then prompted to
32
separate the top plate from the O-rings, measuring how much force it took to cause the
separation. The test plan can be found in Appendix A. It was hypothesized that cold testing
would result in higher adhesion values, particularly for O-rings with large amounts of residue, as
this has been an observed trend in past O-ring adhesion scenarios.
3.5 Thermal Survival Testing
Thermal survival tests were conducted on the O-ring samples to evaluate performance under
extreme cold situations. An O-ring type was placed into one of the dovetail grooves of the test
sample, similar to DMA testing, and another O-ring type placed into the adjacent groove.
Washers are then placed on the bottom plate, and the top plate placed on top of the washers. Four
screws were then used to compress the top plate onto the O-rings. The screws were applied with
2.6 in-lbf of torque via a torque wrench. The samples were then placed in a thermal chamber
which soaked the samples to -70 °C for 120 hours. The samples post thermal soak were
examined at 50X magnification using a Keyence microscope, and photographed to record the
effects of thermal testing on the O-rings. For O-rings with questionable deformation, three-
dimensional photos were also taken with the Keyence for further examination. The Launch Latch
is required to open under a temperature warmer than -50 °C which makes this test very
conservative. It was hypothesized, based on the O-ring data sheets that V0986, C0267, E1100,
S0802, S0469, and JaBar40 would fail thermal survival testing. Each of those O-ring types was
reported in their data sheets to fail at temperatures above -50 °C.

33
3.6 Stiffness Testing
The stiffness testing was completed by Peter Anderson, a laboratory technician at LL. The
technician placed the sample in the Instron force measurement device and aligned the top piston
of the Instron with the top plate of the O-ring test sample. The technician then ensured that the
O-ring was in the dovetail groves of the bottom plate by applying a light amount of pressure to
the top plate. Once the O-rings were set, the Instron was backed off from the top plate. The
machine was then zeroed by manipulating the Instron such that the force on the top plate read by
the machine was 0.005 lbf. The Instron was then programmed to compress the top plate onto the
O-rings at a given rate of approximately 5 mils per minute, until the sample reached 30 mils of
deflection or the sample yields. The data collected by the machine was plotted as force (lbf)
versus the deflection (inches). Two or three tests were run per sample depending on the
linearization of the O-ring stiffness. It was expected that O-rings with higher stiffness would also
have higher durometer.
3.7 Durometer Testing
The Shore A durometer of each O-ring type was tested using an Intron E1000. The Instron
measured durometer using a pin-point measure of resistance within the O-ring. Three durometer
measurements were taken for each O-ring type and averaged. The durometer measurements were
then compared to adhesion, and stiffness data to explore any correlations between O-rings and
their durometer. Both the regular and the vacuum baked samples of O-rings were tested. It was
hypothesized that there would be little to no variation in durometer between the regular and
vacuum baked samples of the O-rings.
34
3.8 Outgassing Testing
Outgassing testing was performed on the O-rings by various outsourced testing sites. The
complete testing procedure used by Outgassing Services International to test the O-rings can be
found in Appendix B. The test procedures were conducted by the American Society for Testing
and Materials (ASTM) International standards for outgassing, E595-07. E595-07 is used to
describe the allowable parameters for total mass loss (TML) and collected volatile condensable
materials (CVCM) of a given material in space conditions near optics. As stated by the ASTM
International test designation, TML “is the total mass of a material outgassed from a specimen at
a specified constant temperature and operating pressure for a specified time. TML is calculated
from the mass of the specimen as measured before and after the test and is expressed as a
percentage of the initial specimen mass (“Standard Test Method”, 2007)”. The other parameter
measured, CVCM, is defined as “the quantity of outgassed matter from a test specimen that
condenses on a collector maintained at a specific constant temperature for a specified time.
CVCM is expressed as a percentage of the initial specimen mass and is calculated from the
condensate mass determined from the difference in mass of the collector plate before and after
the test (“Standard Test Method,” 2007)”. The test method required by E595 standards can be
found in Appendix B. The test requires at TML and CVCM report values less than or equal to
1.00% and 0.10% respectively in order to pass as a low outgassing material. Our recommended
O-ring selection is required to meet the same standard.
3.9 Optical Metrology and Surface Roughness
The interfaces were measured for surface roughness by using a Zygo NewView interferometer.
Average surface roughness, route mean squared roughness, skewness, kurtosis, and average

35
maximum height of the profile were extracted. Visual surface texture, average roughness and
adhesion values were compared and conclusions were made. It was hypothesized that the lower
the average surface roughness, the higher the adhesion. It was theorized that the O-ring residue
under compression cannot flow into the smaller areas of a rough surface, and therefore would
make contact with less of the surface than that of a less rough surface. It was also conceived that
the pores in a rough surface may be able to capture O-ring residue released by the O-ring while
under compression, and may make the effect of O-ring residue less pertinent on adhesion.
3.10 Residue/Squish Testing
O-Ring residue was examined as a possible warning sign for an increased source of adhesion.
Half-inch sections of O-ring samples were squish tested against a silicone plate, compressed to
that plate at a force of 40 lbf for twenty-four hours. Ellipsometry measurements of the residue
were taken to measure the residue thickness. The squish test residue samples were then air-baked
at 200 °C for 72 hours to see if this lessened or eliminated the residue thickness. Ellipsometry
measurements were performed again on the samples post-baking to measure the amount of
remaining residue. The samples were then baked at high vacuum at 200 °C for a week to remove
any further residue. It was hypothesized that baking or vacuum baking the O-rings may lessen
the amount of material that flows out of them which may reduce O-ring adhesion. If his were
true then the residue thickness collected on the silicon plates would decrease.

36
Chapter 4: O-Ring and Interface Data Analysis and Results
This chapter presents the data collected by the various tests that were conducted, and their
implications on O-ring adhesion. The analysis of adhesion in reference to all O-rings and
interfaces is examined, as well as outgassing, stiffness, O-ring residue, and thermal survival
testing. The analysis of the tests resulted in the narrowing of O-ring and interface combination in
order make a final recommendation for use with the ST.
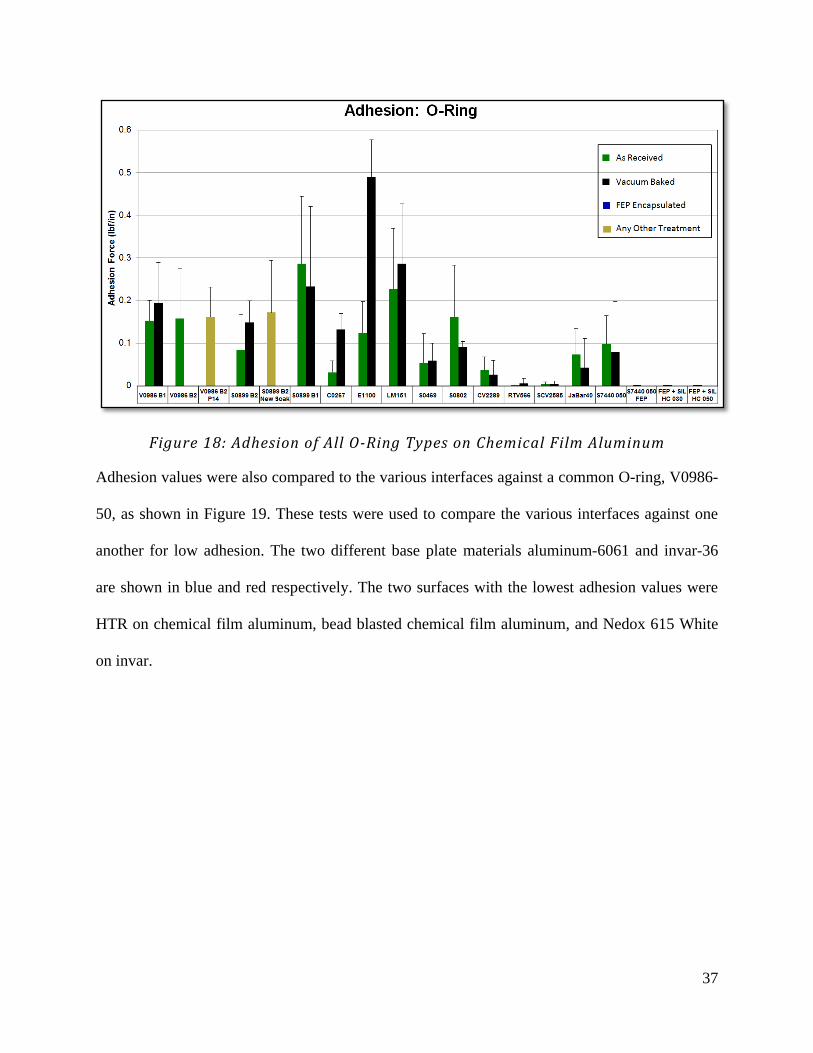
4.1 Adhesion Analysis
Adhesion data was collected for all O-ring samples on a common interface, chemical filmed
aluminum. Each O-ring type was tested in both its regular and (if available) vacuum baked
condition as shown in Figure 18. The O-rings were compared to determine which ones had the
least amount of adhesion. The vacuum baked O-rings results were the most applicable as space
payloads by LL standards, must use vacuum baked parts. In most cases, vacuum baking
decreased O-ring adhesion. However in some cases O-rings increased in adhesion, specifically
for E1100, LM151, V0986, and C0267. Notably, none of the O-rings that increased in adhesion
force were silicone based O-rings. For each set of data shown, error bars were applied with a
95% confidence level that the O-ring’s adhesion force would occur below that. The highest value
given by the 95% confidence interval was chosen to plan for the worst case scenario of O-ring
adhesion. The O-rings with the least amount of adhesion were all three FEP encapsulated
O-rings, along with RTV566, SCV2585, S0469, and CV2289.
37
Figure 18: Adhesion of All O-Ring Types on Chemical Film Aluminum
Adhesion values were also compared to the various interfaces against a common O-ring, V0986-
50, as shown in Figure 19. These tests were used to compare the various interfaces against one
another for low adhesion. The two different base plate materials aluminum-6061 and invar-36
are shown in blue and red respectively. The two surfaces with the lowest adhesion values were
HTR on chemical film aluminum, bead blasted chemical film aluminum, and Nedox 615 White
on invar.
As Received (AR) Vacuum Baked (VB)

38
Figure 19: Adhesion of V0986 on All Interface Types
It is important to note that adhesion could vary between batches of O-rings, shown in Figure 20.
An O-ring batch is a group of O-rings made at the same time from the same compounds and
mixture. When a secondary batch of O-rings is made, it can experience different forming of the
polymers within the O-ring, or worse contain different mixture percentages of compounds in the
mixing process. In the case of S0899, the average adhesion (lbf/inch) of batch two was less than
a third of the average adhesion of batch one, non-vacuum baked. The batches also did not react
similarly to vacuum baking in terms of average adhesion, batch 1 decreased and batch 2
increased. S0899 was also tested to measure the effect of isopropyl alcohol on O-ring adhesion.
Samples of S0899 were soaked in isopropyl alcohol for 24 hours and hung to dry for a minimum
of 2 days. The S0899 soaked samples had an average adhesion of more than twice the non-
soaked samples. The average value for S0899 soaked was based off of samples with even lift,
however if the isopropyl alcohol created inconsistencies in the continuity of adhesion on the

39
O-ring surface, causing the uneven lift, the average adhesion value for all data collected would
be 0.2101 lbs/inch, almost three times the original average adhesion.
Figure 20: S0899 Adhesion for Different O-Ring Batches.
The adhesion results were compared with other forms of data, including O-ring residue and
surface roughness, and can be found in those respective sections.
4.2 Thermal Survival Testing Analysis
Images were taken at 50x magnification of the O-ring surfaces before and after thermal survival
testing. For all O-rings examined (except Parkerslick and Creavey), E1100 and JaBar40 were
the only O-ring types which after being thermal tested, resulted in severe cracking, pitting, and
therefore failure of the O-ring. E1100 exhibited cracking and lines on the O-ring post testing as
demonstrated in Figure 21. The result caused us to rule out E1100 O-rings as a possible
recommendation for use in the Launch Latch. E1100 was the only EPDM based O-ring tested,
0
0.05
0.1
0.15
0.2
0.25
0.3
0.35
Batch 1 Batch 2 Batch 2, NewSoak
Batch 1, VB Batch 2, VB
Ad
he
sio
n F
orc
e (
lbf/
in)
S0899 Adhesion for Different O-Ring Batches

40
which may have contributed to the thermal survival results. JaBar40 also performed poorly
exhibiting pits in the material.
Figure 21: Thermal Survival Before and After Pictures of E1100
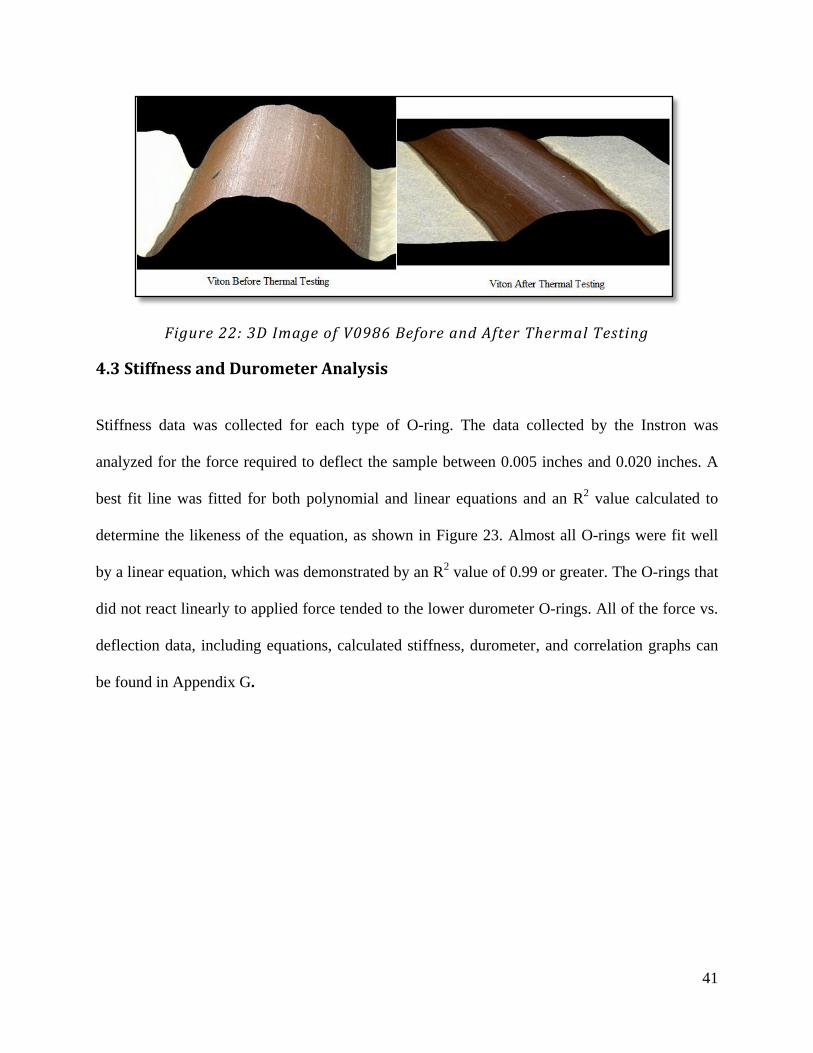
Some O-rings exhibited change in their form due to thermal testing, but none as drastic as E1100
or JaBar40. V0986 O-rings when analyzed by the Keyence microscope as a 3D shape produced
images that showed the O-ring as flattened post thermal testing shown in Figure 22. O-Ring
flattening was not seen as a failure point, but more so as a normal deformation of the O-ring due
to temperature and compression, the O-ring would still be expected to perform correctly. Though
the hypothesis stated that many more types of O-rings would fail, only E1100 and JaBar40
exhibited signs of severe failure. It is possible that the thermal testing which O-rings undergo for
their specification sheets and whatever safety margins are included are more rigorous than our
testing scenario. However, the thermal survival test we conducted was designed to specifically
address a realistic environment that these O-rings may be subjected to and is therefore a more
relevant result for our purposes.
41
Figure 22: 3D Image of V0986 Before and After Thermal Testing
4.3 Stiffness and Durometer Analysis
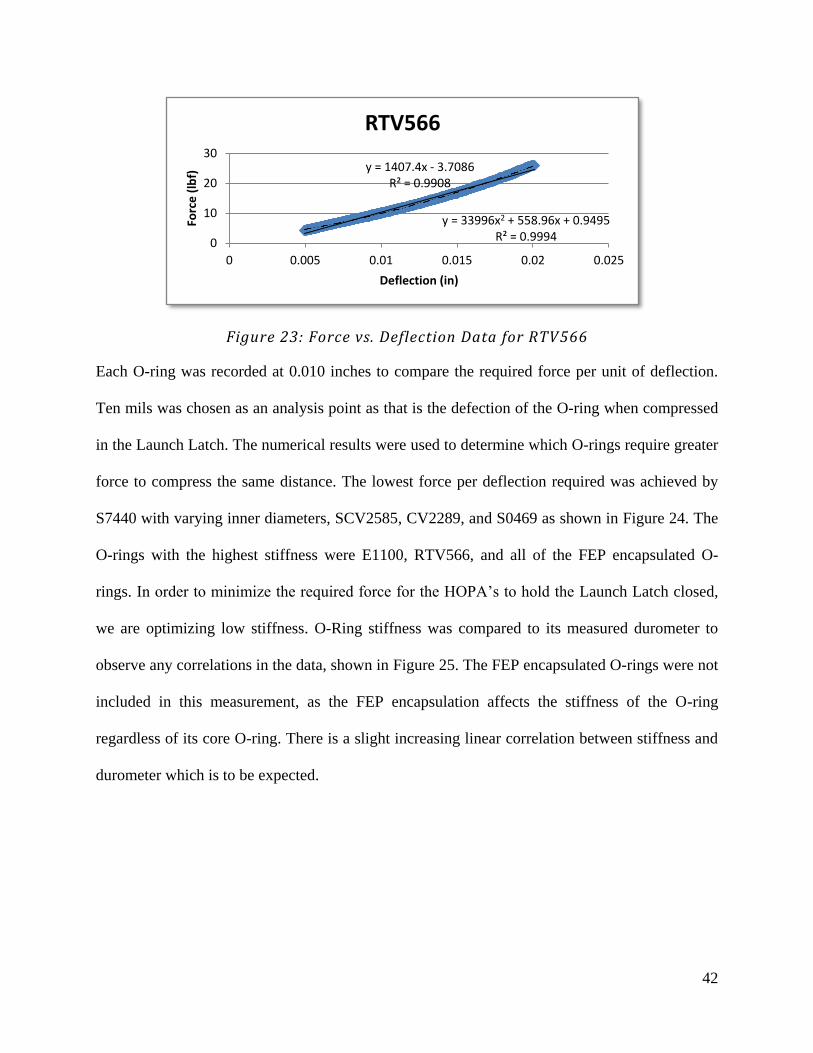
Stiffness data was collected for each type of O-ring. The data collected by the Instron was
analyzed for the force required to deflect the sample between 0.005 inches and 0.020 inches. A
best fit line was fitted for both polynomial and linear equations and an R2 value calculated to
determine the likeness of the equation, as shown in Figure 23. Almost all O-rings were fit well
by a linear equation, which was demonstrated by an R2 value of 0.99 or greater. The O-rings that
did not react linearly to applied force tended to the lower durometer O-rings. All of the force vs.
deflection data, including equations, calculated stiffness, durometer, and correlation graphs can
be found in Appendix G.
42
Figure 23: Force vs. Deflection Data for RTV566
Each O-ring was recorded at 0.010 inches to compare the required force per unit of deflection.
Ten mils was chosen as an analysis point as that is the defection of the O-ring when compressed
in the Launch Latch. The numerical results were used to determine which O-rings require greater
force to compress the same distance. The lowest force per deflection required was achieved by
S7440 with varying inner diameters, SCV2585, CV2289, and S0469 as shown in Figure 24. The
O-rings with the highest stiffness were E1100, RTV566, and all of the FEP encapsulated O-
rings. In order to minimize the required force for the HOPA’s to hold the Launch Latch closed,
we are optimizing low stiffness. O-Ring stiffness was compared to its measured durometer to
observe any correlations in the data, shown in Figure 25. The FEP encapsulated O-rings were not
included in this measurement, as the FEP encapsulation affects the stiffness of the O-ring
regardless of its core O-ring. There is a slight increasing linear correlation between stiffness and
durometer which is to be expected.
y = 1407.4x - 3.7086 R² = 0.9908
y = 33996x2 + 558.96x + 0.9495 R² = 0.9994 0
10
20
30
0 0.005 0.01 0.015 0.02 0.025
Forc
e (
lbf)
Deflection (in)
RTV566

43
Figure 24: Force Required to Compress O-Rings
Figure 25: O-Ring Stiffness vs. Durometer
V0986V0986B2 P14
S0899B2
S0899B2 VB
S0899B1
C0267 E1100 LM151 S0469 S0820CV
2289RTV566
SCV2585
SCV2585VB
JaBar40
S7440050
Creavy030
Creavy050
Non-Fep 245 232 279 238 208 258 358 207 167 209 157 469 142 185 254 127
FEP 317 426 338
0
100
200
300
400
500St
iffn
ess
(lb
f/in
2)
O-Ring Stiffness
0
50
100
150
200
250
300
350
400
450
500
35 40 45 50 55 60 65 70
No
rmal
ize
d S
tiff
ne
ss (
lbf/
in2)
Durometer (Shore A)
Stiffness vs. Durometer SCV2585
RTV566
S0820
V0986
S7440_050
E1100
JaBar40
LM151
CV2289
S0469
S0899 B1
C0267
V0986_P14
S0899 B2

44
4.4 Outgassing Results
The outgassing results are shown below in Table 3. All O-rings shown below were tested without
vacuum baking. The O-rings highlighted are those which passed the ASTM E595-07 standards.
The results for V0986, S0899, S0802, CV2289, and SCV2585 were all within the standards of
less than 1.00% TML and less than 0.10% CVCM. All other O-rings with the exception of
S0469, shown in green, were ruled out as possible candidates for use in the Launch Latch. S0469
resulted in relatively low outgassing values, such that it was theorized that after vacuum baking,
outgassing may be low enough to pass E595-07 standards. Vacuum baking has shown to “bake
out” low molecular weight materials from the O-rings, resulting in an initial loss of mass that
would normally be released during an outgassing test. All O-rings used in space payloads must
be vacuum baked pre-flight, therefore a vacuum baked S0469 could be used if chosen. Due to
S0469’s low stiffness and adhesion, we chose to use it in thermal testing.
Table 3: O-Ring Outgassing Results
O-Ring Material Number
O-Ring Type %TML, Outgassing Test per E595-07 as received
%CVCM, Outgassing Test per E595-07 as received
V0986-50 FLUOROCARBON (FKM, FPM) 0.22 0.02
S0899-50 SILICONE RUBBER (VMQ, PVMQ) 0.10 0.02
C0267-50 POLYCHLOROPRENE RUBBER (CR), "Neoprene"
8.33 3.35
E1100-50 ETHYLENE PROPYLENE RUBBER (EPM, EPR, EPDM)
8.82 4.34
LM151-50 FLUOROSILICONE (FVMQ) 1.7 0.4
S0469-40 SILICONE RUBBER (VMQ, PVMQ) 1.66 0.44
S0802-40 SILICONE RUBBER (VMQ, PVMQ) 0.06 0.01
CV2289-1 RTV 0.44 0.04
RTV566 RTV 0.1 0.01
SCV2585 RTV 0.08 0.007

45
Ja-Bar 40 Durometer
SILICONE RUBBER (VMQ, PVMQ) 0.6* 0.044*
S7440-50 SILICONE 0.050'' ID 0.31 0.11
S7440-50 SILICONE 0.050" ID, FEP Encapsulated
N/A N/A
* Data from the ASTM 1559 test.
4.5 Optical Metrology and Surface Roughness Results
The data collected by the Zygo microscope was reviewed quantitatively and qualitatively. The
surface finishes for aluminum and invar base plates were compared based on their surface
roughness and optical metrology. The surface roughness and optical metrology for CFM can be
found below in Figure 26. The two surfaces with the least amount of surface roughness were
chemical film polished aluminum and silver Teflon tape. The surface with the greatest surface
roughness was exhibited by chemical film bead blasted aluminum.
Figure 26: Surface Roughness and Optical Metrology for Aluminum Based
Interfaces

46
The invar surfaces were also compared for surface roughness. The lowest surface roughness was
exhibited by invar with no applied surface treatments, and the highest surface roughness was
exhibited by the surface coating Nedox SF-2, shown in Figure 27.
Figure 27: Surface Roughness and Optical Metrology of Invar Based Surfaces
The correlations between surface roughness and adhesion were explored, as shown in Figure 28.
No correlation was found between surface roughness and adhesion when adhesion testing was
performed on these surfaces with the common Viton O-ring (V0986-50). The two surface types,
invar and chemical film aluminum were explored separately (shown in red and blue
respectively), as well as O-ring base type (i.e. silicone, neoprene, etc.), and no correlation was
found. An example of the lack of correlation is best described by the points around 0.2 lbf/inch
on Figure 28. Two of each type of surface all had an adhesion force of about 0.2 lbf/inch, but
their surface roughness varied between 20 µm and 110 µm.

47
Figure 28: Surface Roughness vs. Adhesion
It is important to note that some surfaces behaved differently with different types of O-rings. We
tested SCV2585, RTV566, S0802, S0469 and V0986 on HTR, as HTR was determined to have
the lowest adhesion against V0986 versus the other interfaces. The O-rings tested against HTR
were determined to have some of the lowest adhesion against CFM. It was theorized that they
would perform promisingly against HTR. Although V0986 performed significantly better with
HTR than with CFM, S0802 was the only other O-ring whose performance improved on HTR, as
shown in Figure 29.
48
Figure 29: O-Ring Results when Tested with Both HTR and CFM
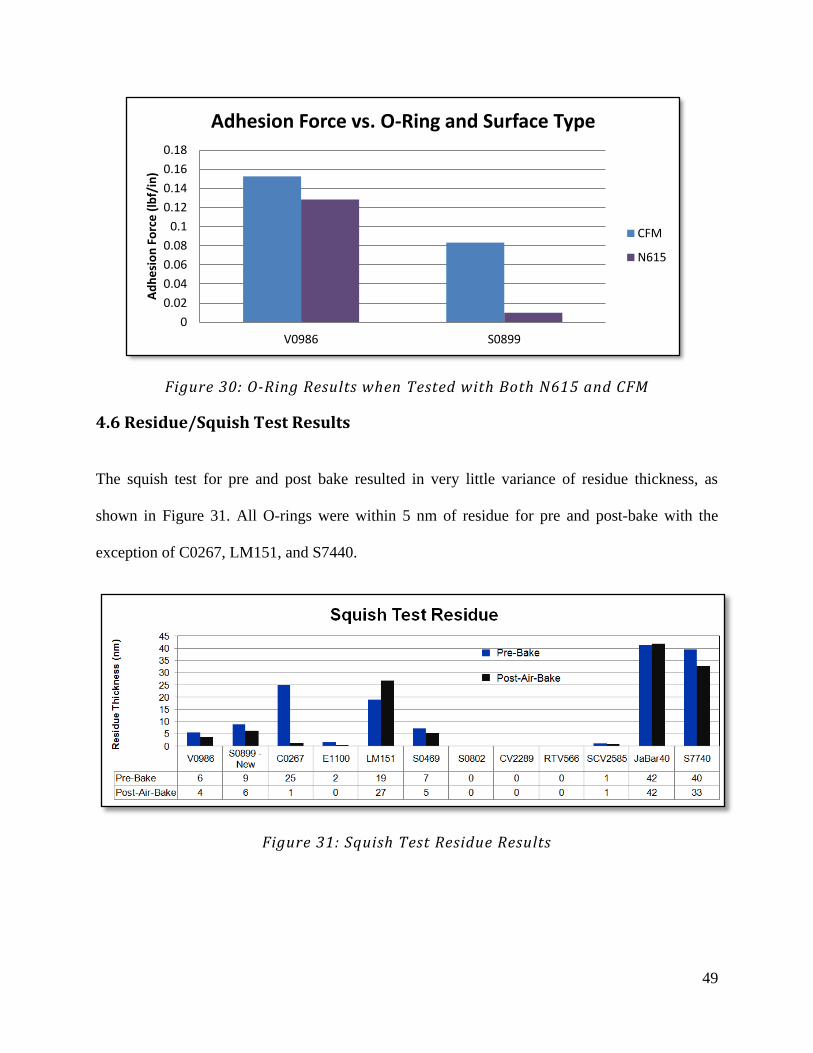
A similar situation occurred when testing S0899 on N615. This was tested as another program at
LL is using this combination for an O-ring and interface. Even though V0986’s adhesion force
decreased only 0.0245 lbf when applied to N615 versus CFM, S0899’s adhesion force decreased
by 0.0733 lbf and resulted in almost zero adhesion, as shown in Figure 30. These results suggest
that further investigation of O-rings and their adhering interfaces should be done to find low
adhesion combinations.
0
0.02
0.04
0.06
0.08
0.1
0.12
0.14
0.16
0.18
SCV2585 RTV566 S0802 S0469 V0986
Ad
he
sio
n F
orc
e (
lbf/
in)
Adhesion Force vs. O-Ring and Surface Type
HTR
CFM
49
Figure 30: O-Ring Results when Tested with Both N615 and CFM
4.6 Residue/Squish Test Results
The squish test for pre and post bake resulted in very little variance of residue thickness, as
shown in Figure 31. All O-rings were within 5 nm of residue for pre and post-bake with the
exception of C0267, LM151, and S7440.
Figure 31: Squish Test Residue Results
0
0.02
0.04
0.06
0.08
0.1
0.12
0.14
0.16
0.18
V0986 S0899
Ad
he
sio
n F
orc
e (
lbf/
in)
Adhesion Force vs. O-Ring and Surface Type
CFM
N615

50
The residue thickness was compared to adhesion, to see if the proposed theory that greater
residue correlates to greater adhesion. After plotting and review, no correlation was determined
between residue and adhesion, as shown in Figure 32.
Figure 32: Residue vs. Adhesion Results
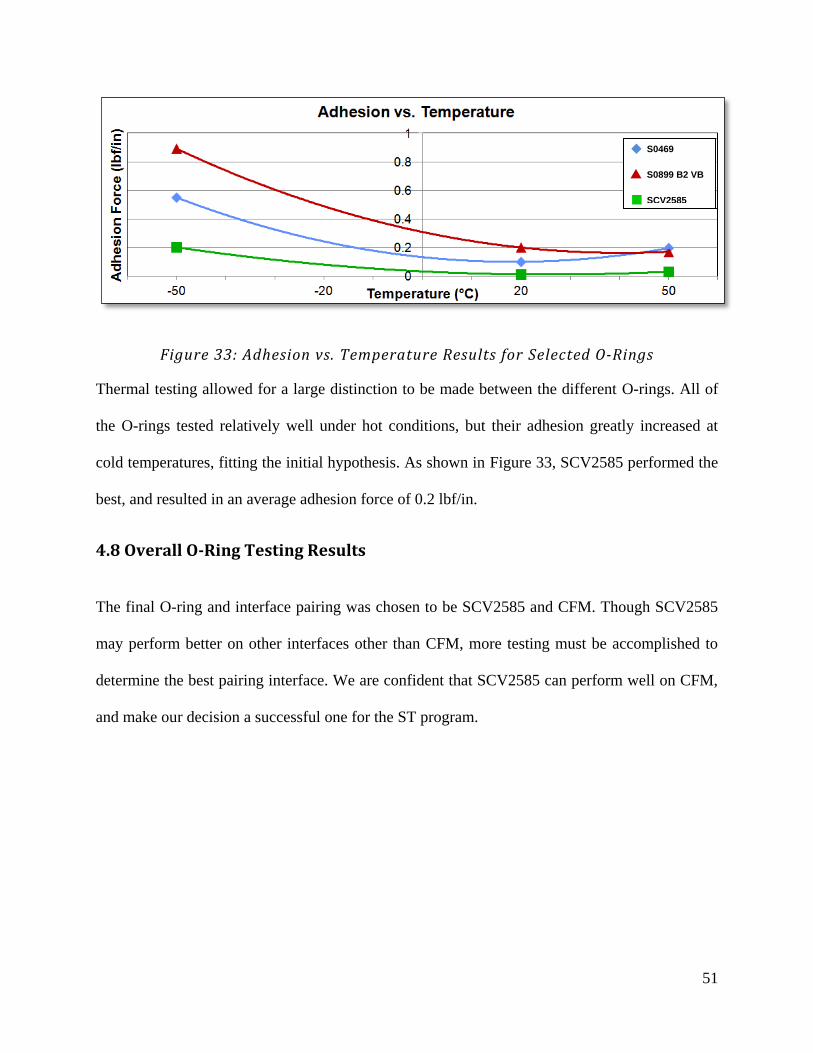
4.7 DMA Temperature Testing Analysis
DMA temperature testing was completed on only the final contesting O-rings, of which were
S0469, S0899 batch 2 vacuum baked, and SCV2585 vacuum baked. Each of these O-rings
yielded low adhesion and stiffness values, as well as passing outgassing standards (with the
exception of S0469, see outgassing results), and thermal testing.
0
10
20
30
40
50
0 0.05 0.1 0.15 0.2 0.25 0.3 0.35 0.4
Re
sid
ue
Th
ickn
ess
(n
m)
Adhesion Force (lbf/in)
Residue vs. Adhesion
51
Figure 33: Adhesion vs. Temperature Results for Selected O-Rings
Thermal testing allowed for a large distinction to be made between the different O-rings. All of
the O-rings tested relatively well under hot conditions, but their adhesion greatly increased at
cold temperatures, fitting the initial hypothesis. As shown in Figure 33, SCV2585 performed the
best, and resulted in an average adhesion force of 0.2 lbf/in.
4.8 Overall O-Ring Testing Results
The final O-ring and interface pairing was chosen to be SCV2585 and CFM. Though SCV2585
may perform better on other interfaces other than CFM, more testing must be accomplished to
determine the best pairing interface. We are confident that SCV2585 can perform well on CFM,
and make our decision a successful one for the ST program.
S0469
S0899 B2 VB
SCV2585
52
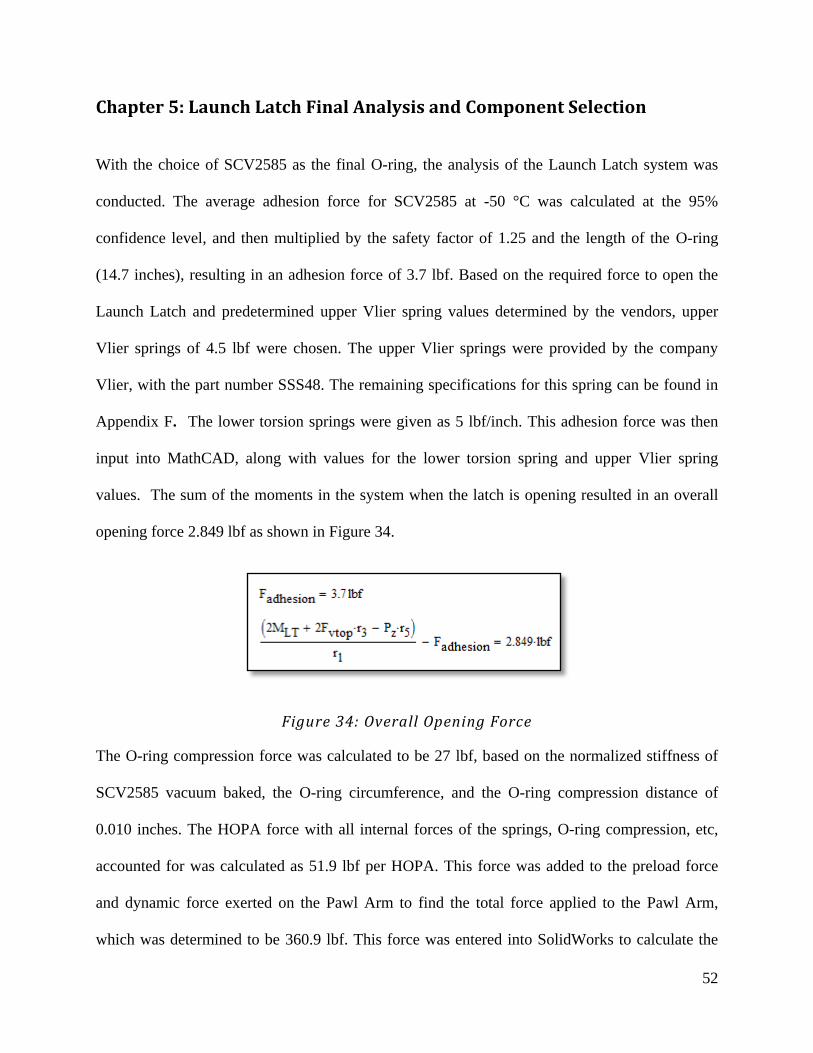
Chapter 5: Launch Latch Final Analysis and Component Selection
With the choice of SCV2585 as the final O-ring, the analysis of the Launch Latch system was
conducted. The average adhesion force for SCV2585 at -50 °C was calculated at the 95%
confidence level, and then multiplied by the safety factor of 1.25 and the length of the O-ring
(14.7 inches), resulting in an adhesion force of 3.7 lbf. Based on the required force to open the
Launch Latch and predetermined upper Vlier spring values determined by the vendors, upper
Vlier springs of 4.5 lbf were chosen. The upper Vlier springs were provided by the company
Vlier, with the part number SSS48. The remaining specifications for this spring can be found in
Appendix F. The lower torsion springs were given as 5 lbf/inch. This adhesion force was then
input into MathCAD, along with values for the lower torsion spring and upper Vlier spring
values. The sum of the moments in the system when the latch is opening resulted in an overall
opening force 2.849 lbf as shown in Figure 34.
Figure 34: Overall Opening Force
The O-ring compression force was calculated to be 27 lbf, based on the normalized stiffness of
SCV2585 vacuum baked, the O-ring circumference, and the O-ring compression distance of
0.010 inches. The HOPA force with all internal forces of the springs, O-ring compression, etc,
accounted for was calculated as 51.9 lbf per HOPA. This force was added to the preload force
and dynamic force exerted on the Pawl Arm to find the total force applied to the Pawl Arm,
which was determined to be 360.9 lbf. This force was entered into SolidWorks to calculate the

53
maximum stress on the system which was 87.8 ksi, well below the maximum allowable yield
stress of 120 ksi for the system.
The HOPAs were also examined to make sure the force exerted on the shafts would not exceed
allowable values. Given by the data sheet, which can be found in Appendix F, the HOPA shafts
can withstand 260 lbf of dynamic force and 350 lbf of static force per HOPA. The minimum
force the HOPAs can stand was then applied to the safety factor of 1.25, resulting in a maximum
shear force of 208 lbf. The total applied HOPA force of 360.9 lbf, when divided between the two
HOPAs, results in an applied shear force of 180.5 lbf per HOPA. This applied force is lower than
the maximum allowable shear force, making the result viable.

54
Chapter 6: Conclusions and Recommendations
In this chapter, the overall themes and results of the data are discussed, and recommendations for
further O-ring testing are made. O-Ring adhesion is examined, as well as interface adhesion
factors, and overall recommendations for further research.
6.1 Factors in O-Ring Adhesion
The main factors that affected O-ring adhesion were the chemical composition of the
O-ring/coating, whether the O-ring was vacuum baked or not, and the temperature at which the
O-ring was tested. The spread of O-ring adhesion values varied greatly, from a maximum
average value of almost 0.5 lbf/inch to a minimum of almost zero, or 0.001lbf/inch. This
variance may be explained by an inquiry into the chemical compositions of the O-ring types to
better understand their adhesion properties and to make informed choices on O-ring
treatments/pairings.
The complexities of O-ring adhesion were exemplified throughout the testing in this project.
O-Rings were found to vary greatly in their adhesion due to many factors, some which were
observable, and others which were from unknown sources. The unknown sources were theorized
to be chemically related, or related to the curing process of the O-ring. Our investigation
revealed a large data spread for each type of O-ring, which resulted in the need for further
testing. To further explore the complexities of O-rings, more O-rings of similar types (silicone,
fluorocarbon, EPDM, etc.) should be explored to see if trends in O-ring adhesion, residue or
other parameters exist.

55
When running the calibration of the DMA, it was identified that if the rate of force was reduced
from 5 N/min to 0.25 N/min the calculated force value to lift the top plate with no O-ring became
closer to the true value of the weight of the top plate. It is recommended that for further testing,
the ramp rate be slowed to collect more accurate data, and therefore fewer data points must be
collected.
Due to the data that was retrieved by the S0899 B2 Soak experiment, the use of isopropyl alcohol
to clean the O-rings should be limited, and specifically avoid all immersions. O-Rings are very
easily affected by secondary chemical use, and although most data sheets suggest that isopropyl
alcohol should have little to no effect on O-rings, it may have played a role in O-ring adhesion,
as exemplified by our test (“Parker O-Ring Handbook”, 1999). Other chemicals to treat the O-
rings or the use of no chemical at all should be explored. For O-rings with coatings, such as
Parkerslick, it is possible that isopropyl alcohol could have affected the outer coating and
therefore the effectiveness of Parkerslick. It is recommended that Parkerslick be tested with no
isopropyl wipe to ensure the coating is not affected.
It is also recommended that other plastic-based surface treatments other than FEP coatings are
tested on O-rings. Though Teflon is known for its non-stick properties, the FEP encapsulation
resulted in very high stiffness values, making them unusable for the Launch Latch. Possibly a
thinner film plastic may have little to no adhesion, and be more consistent than an O-ring with no
coating in terms of adhesion. Parker provided several other coatings other than Parkerslick,
trying other coatings provided by Parker may result in a low adhesion coating.
Due to O-ring vulnerability, for further testing it is recommended that a testing device which
does not alter the O-ring from its original shape, or O-rings large enough that sections could be
56
seen as almost nearly straight, be used. By straightening a curved O-ring, stresses are induced
into the O-ring, and the topographical/surface properties of the O-ring changed when compared
to its naturally curved shape.
It is also recommended that the O-rings complete life cycle, from formation and curing, to final
testing, is recorded when performing O-ring adhesion tests. The chemical properties and physical
attributes of O-rings change greatly depending on the way the O-ring is stored and how long it is
stored for. It is important to keep track of this information when understanding why various
O-rings may perform better or worse.
The simplest solution is to avoid O-rings all-together. If a proper replacement for O-rings can be
found that results in little force being applied to the Launch Latch, it would be a worthwhile area
to explore.
6.2 Factors in Interface Adhesion
The adhesion of O-rings to a specific interface was not consistent throughout the tests. It is
speculated that this is due to chemical interactions between the mating interfaces’ surface and the
O-ring. Developing a better understanding of the chemical relations between the interfaces and
the O-rings may result in better O-ring/interface parings and a better way of determining O-ring
pairs. There were times when cleaning residue that the marks appeared to be more like oxidation
than plasticizers left on the interface’s surface. Some O-rings are capable of releasing oxygen
when compressed, which would suggest oxidation as a possible byproduct. The surface treatment
of THF is also questionable, though most surfaces should not react with it; there was no
information as to its possible interaction with O-rings if any residue from THF remained on the
interfaces surface. This should be explored along with isopropyl’s effect on O-ring adhesion. The
57
outgassing of the interfaces should be explored as well to ensure that they cannot deposit any
form of residue on the Launch Latch lens.
It was also speculated that differences in O-ring adhesion to one interface may be due to varying
surface roughness or coating thickness between similar sample types. It is recommended that
surfaces with extreme thin-film coatings, such as a graphite carbon nanotube layer about one
molecule thick be applied to a surface. In this case, the O-ring would not be in direct contact with
the interface itself, but with the very thin film of graphite. If a type of material which produces
low to no adhesion, such as Teflon, was able to be applied to an interface such that O-rings could
not adhere to it, then the factor of adhesion itself and its uncertainty is miniscule.
6.3 Possibilities for Future Research
For further research, each type of O-ring should be tested with each interface in order to find the
best interface type per O-ring. As demonstrated by the data, not all O-rings perform best with the
same surface, therefore adhesion values for one particular type of O-ring versus all the surfaces
is not a reasonable comparison, as some surfaces react differently with different O-ring
compositions than others. Non-adhering surfaces should be further explored, as the choice of
O-ring becomes negligible if no item may adhere to the surface. Other types of O-rings made of
other polymer bases should be explored as well.
From our thermal adhesion testing, we concluded the adhesion force of O-rings will increase as
temperature decreases. Further testing is needed to confirm our results and look into how exactly
this adhesion force increases with temperature. Thermal testing at various temperatures such as
-20 °C, 0 °C and any values in-between would help to understand the trend an O-ring’s adhesion
58
has as temperature is decreased. In the end, an equation could possibly be formulated to calculate
an O-ring’s adhesion force at a given temperature after it has gone through preliminary tests.
What causes this enormous increase in adhesion as temperature decrease is also an important
aspect to look into. Perhaps investigate if residue or the plasticizers left behind by the O-rings
can freeze at the temperatures we are testing at and what the payload would expect. Although
there was no correlation between the amount of residue left behind and the adhesion force at
room temperature, this may change as temperature decreases and the plasticizers have a chance
to get to a level where they will go through a phase change into a solid. An O-ring with less
residue may not adhere nearly as much as temperature decreases, as an O-ring with a large
amount of residue left behind.
Overall, there is plenty of room to explore the root causes of O-ring adhesion and this project has
only scratched the surface of all the possible factors involved.

59
Work Cited: 1. Department of Defense, Space Simulation and Applications of Space Technology.
(2007). Standard test method for total mass loss and collected volatile condensable
materials from outgassing in a vacuum environment (E595-07). West Conshohocken,
PA: ASTM International.
2. Parker Seals. (1999). Parker O-Ring Handbook. Cleveland, OH: Parker Hannifin
Corporation.
60
Appendix A: DMA Testing Standards Brian Walker
DMA Adhesion Tests
I. Goal:
To be able to measure and then compare the adhesion force between a variety of O-Ring types
and various mating surfaces in order to determine the best combination of the two; as well as
potentially provide insight into what causes this phenomenon.
II. DMA Procedure for Stiction Testing – Hart Fixture
Go to DMA user interface on the computer
Option 1: Load stiction sequence
Filename: RT July11_2012
Option 2: Manual Configure
Enter the following information into the appropriate areas:
Mode: DMA controlled force
Test: Custom
Clamp: Compression
Sample Shape: square disk (t, w)
Dimensions: 76.2mm, 3.53mm

61
Under Procedure:
To change the segment description to match what is seen above, Click on ‘Editor…’ and
then double click on each segment to change the numbers
o Steps can be added from the column to the right of the segments and can also be
deleted if need be
Under Summary:
Sample Name: Components of test sample and date they were assembled
Ex: Chemfilmed Mach Al w Viton 6/27
Comments: Preparation of O-Ring
Ex: O-Rings as received but cleaned
Setup:
Install the lower fiber tension adapter by placing it onto central moving shaft
Remove cone-shaped cap from adapter and use Allen wrench to tighten adapter onto
shaft
Install the dovetailed, oval test base, making sure to insert the temperature sensor through
the clearance hole

62
Place 8-32 screws through the four support posts and tighten to secure test base (picture
available)
Slide one of the O-Ring base plates into test base (with no o-ring)
Preparing Central Shaft for Calibration:
Slide 2 reduced outer diameter ¼-20 washers onto bare adapter and then install aluminum
Hart Fixture clamp adapter.
Thread acorn nut onto aluminum clamp adapter
Loosely thread ¼-20 nut onto aluminum clamp adapter
Calibration:
Go to Calibrate->Clamp->make sure Clamp Type is ‘Compression’ and Calibration Type
is
‘All Calibrations’, then hit ‘Next’
Press ‘Calibrate’ for clamp mass. Ignore open furnace warning
After mass calibration, hit ‘Next’
Remove ¼-20 nut and install top plate by securing it into position with two 4-40 SHC
screws tightly so that there is metal to metal contact
Lift up on center shaft, so that base plate just lifts off of test base.
o Eye-ball setup and make sure that when the base plate lifts off, it is parallel to the
test base
After determining lift-off was parallel, with partner holding the fixture in place, tighten
the L-shaped brackets on either side of the base plate, MAKING SURE NOT TO
ALLOW FIXTURE TO SHIFT AT ALL. IF IT DOES SHIFT, LOOSEN
BRACKETS AND START AGAIN.
Install nut onto Hart fixture so that there is metal-to-metal contact between the top plate
and bottom of nut
Leave Gauge Block Length=zero
Hit ‘Calibrate’ for clamp zero
When clamp zero calibration is finished, hit ‘Next’
Hit ‘Calibrate’ for clamp compliance
Hit ‘Next’ to view calibration report
Hit ‘Finish’
You are now calibrated and ready to test.

63
Calibration Test:
Under Summary tab, change file name to ‘July11-2012_Calibration’ (use current date)
Create a new folder using the correct naming convention for whichever test sample you
are testing and put this file under this new folder
o Example Folder Name: CFM_V0986_Sx
With partner clamping down on top plate with hands, slowly and carefully back off each
corner screw, alternating to ensure even lift-off. Remove screws
Hit ‘Run’
o Right-click on red graph and click on ‘Signals’
o Change X-Axis ‘Signal Name’ to Time if need be
When system is tripped due to the “popping” of the top plate, you may hear the nitrogen
tanks start whistling and an alert will appear on the computer screen. Hit the red stop
button in the top-right corner of the screen
Analysis:
Open TA Universal Analysis on the desktop
Click File->Open. Find your newly created folder and open the calibration run.
o The folder sequence goes as follows:
C Drive->TA->Data->DMA->Oring Stiction Initiative Test Data-
>Corresponding Test folder
Click on ‘Signals’ and make sure Y1 is Static Force and all other Y’s are Not Used. and
X is Time
o Save these settings and then hit ‘OK’
Verify the Parameters match what you want and then click ‘OK’
Right-click on the very end of the plot and select ‘Label Point’
o Make sure it will be labeled with ‘Time’ and ‘Y-Axis’
Hit ‘OK’
Click on the button with an ‘A’ at the end of a pencil
In this text box, enter the weight of the top plate, the calculated stiction force, and visual
observations as they pertain to residue left behind (not necessary for calibration)
64
o For samples with visible residue, take at least one picture per sample-component
set and upload using Carl’s camera. Save under appropriate folder
o Verify that the stiction force for the test run is <.01 N or thereabout
Go to File->Export PDF. Make sure you are under the correct folder and save the file
Go to File->Save Session. Save the session under the correct folder with the same name
o Ex: CFM_JABAR40_Sx
Sample Tests:
Remove nut and O-Ring fixture, break down set up to test base
Load test sample into test base and repeat initial setup steps from the calibration test.
o (Make sure plate lifts off evenly when you lift up on central shaft, hold in place
and tighten L-brackets, prevent any shifting of setup)
Screw nut back onto aluminum shaft adapter, again until metal-to-metal contact
Under Summary tab, change file name to reflect current components ‘CFM_V0986_S1’
Hit ‘Run’
o Right-click on red graph and click on ‘Signals’
o Change X-Axis ‘Signal Name’ to Time if need be
When system is tripped due to the “popping” of the top plate, you may hear the nitrogen
tanks start whistling and an alert will appear on your computer screen. Hit the red stop
button in the top-right corner of the computer screen
Open TA Universal Analysis on the desktop and follow the Analysis instructions
Save collected data under Stiction folder using the naming convention
INTERFACE_ORINGTYPE_SAMPLE#
o Ex: Chemical-Filmed Machined Al on Viton, sample 3 would be
CFM_V0986_S3
Repeat ‘Sample Tests’ Procedure for all subsequent tests of the same O-Ring and
interface types. Make sure to change the Data File name each run to show the
correct sample number
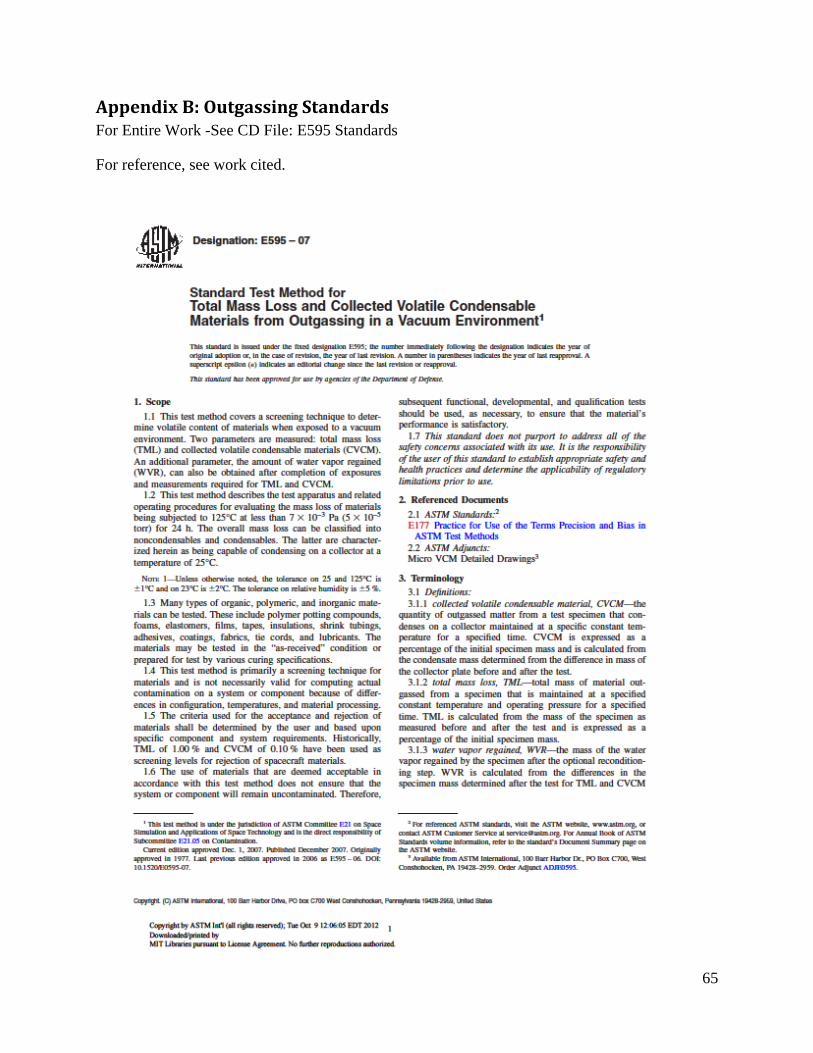
65
Appendix B: Outgassing Standards For Entire Work -See CD File: E595 Standards
For reference, see work cited.

66
Appendix C: HOPA Data Sheet
For full SP-5025 Pin Puller Specifications, see attached CD file: SP-5025 Data Sheet and SP-
5025 Specification
67
Appendix D: Surface Coating Specifications
All materials below were provided by LL Staff:
=====================================================================
SANFORD QUANTUM/HARDLUBE (ALUMINUM ONLY)
2. FINISH: PART TO BE TREATED WITH THE FOLLOWING SEQUENCE:
2.A CHEMICAL FILM ENTIRE PART PER MIL-DTL-5541.
2.B MASK ALL AREAS, INCLUDING ALL THREADED HOLES, THAT WILL
NOT RECEIVE THE SANFORD PROCESS TREATMENT.
2.C SANFORD QUANTUM HARDCOAT.
2.D NICKEL ACETATE SEAL.
2.E SANFORD HARDLUBE.
NOTE: TOTAL COATING TO BE .002 INCHES (.001 IN PENETRATION,
.001 IN BUILD UP). CURE TEMPERATURES SHALL NOT EXCEED +200 DEG C
(+392 DEG F) TO PREVENT ANNEALING OF THE BASE METAL.
BY SANFORD PROCESS CORPORATION
1 SHORR COURT
WOONSOCKET, RI, 02895
PHONE: 401-597-5000
=====================================================================
NEDOX NH-1 (ALUMINUM)

68
2. FINISH: PART TO BE TREATED WITH THE FOLLOWING SEQUENCE:
2.A MASK ALL AREAS, INCLUDING ALL THREADED HOLES, THAT WILL
NOT RECEIVE THE NH-1 PROCESS TREATMENT.
2.B NEDOX NH-1, COATING THICKNESS .0008-.0012 PER SURFACE.
CURE TEMPERATURES SHALL NOT EXCEED +200 DEG C (+392 DEG F)
TO PREVENT ANNEALING OF THE BASE METAL.
2.C MASK ALL NEDOX COATED AREAS.
2.D CHEMICAL FILM ENTIRE PART PER MIL-DTL-5541.
BY GENERAL MAGNAPLATE
1331 ROUTE 1
LINDEN, NJ 07036
PHONE: 908-862-6200
=====================================================================
DICRONITE (ALUM)
2. FINISH: PART TO BE TREATED WITH THE FOLLOWING SEQUENCE:
2.A CHEMICAL FILM ENTIRE PART PER MIL-DTL-5541
2.B MASK ALL AREAS, INCLUDING ALL THREADED HOLES,THAT WILL NOT
RECEIVE THE DICRONITE PROCESS TREATMENT.
2.C DICRONITE COAT. MAXIMUM COATING TO BE 20 MICRO-INCHES
(0.5 MICRONS). CURE TEMPERATURES SHALL NOT EXCEED +200 DEG C
(+392 DEG F) TO PREVENT ANNEALING OF THE BASE METAL.
69
BY DICRONITE
66 MAINLINE DRIVE
WESTFIELD, MA 01085
PHONE: 413-562-5019
=====================================================================
DICRONITE (INVAR 36)
2. FINISH: PART TO BE TREATED WITH THE FOLLOWING SEQUENCE:
2.A MASK ALL AREAS, INCLUDING ALL THREADED HOLES,THAT WILL NOT
RECEIVE THE DICRONITE PROCESS TREATMENT.
2.B DICRONITE COAT. MAXIMUM COATING TO BE 20 MICRO-INCHES
(0.5 MICRONS). CURE TEMPERATURES SHALL NOT EXCEED +200 DEG C
(+392 DEG F) TO PREVENT ANNEALING OF THE BASE METAL.
BY DICRONITE
66 MAINLINE DRIVE
WESTFIELD, MA 01085
PHONE: 413-562-5019
=====================================================================
TUFRAM L-4 (ALUM) HTR
4. DESIGNATED SURFACE TO BE TREATED WITH TUFRAM L-4.
COATING THICKNESS .001 PER SURFACE.
70
CURE TEMPERATURES SHALL NOT EXCEED +200 DEG C (+392 DEG F)
TO PREVENT ANNEALING OF THE BASE METAL.
BY GENERAL MAGNAPLATE
1331 ROUTE 1
LINDEN, NJ 07036
PHONE: 908-862-6200
=====================================================================
NEDOX SF-2 (INVAR ONLY)
4. FINISH: TBD
BY GENERAL MAGNAPLATE
1331 ROUTE 1
LINDEN, NJ 07036
PHONE: 908-862-6200
=====================================================================
NEDOX 615, WHITE (INVAR ONLY)
2. FINISH: PART TO BE TREATED WITH THE FOLLOWING SEQUENCE:
2.A MASK ALL AREAS, INCLUDING ALL THREADED HOLES,THAT WILL NOT
RECEIVE THE NEDOX PROCESS TREATMENT.
2.B DESIGNATED SURFACE TO BE TREATED WITH NEDOX 615, WHITE.
CURE TEMPERATURES SHALL NOT EXCEED +371 DEG C

71
(+700 DEG F) TO PREVENT DEGRADING INVAR PROPERTIES.
BY GENERAL MAGNAPLATE
1331 ROUTE 1
LINDEN, NJ 07036
PHONE: 908-862-6200
For Bead Blasted or Polished Finishes (work by Brian Walker)
Surface Roughness Experimentation Procedure:
In order to test the effects of surface roughness on stiction force, we will use three different
finishes on our standard aluminum top plates: as-received machine finish, polished, and sand-
blasted. All will be chemical-filmed and precision cleaned before the stiction tests are run.
To prepare the baseline, as-received machined plates, we will just use the top plates without any
special finish process. We would look at each individual top plate and select the side that would
come into contact with the O-Ring based on which side looked to be smoother and had less
noticeable machining grooves.
The sand-blasted top plates required a sand-blasting finish (obviously) which was performed by
Technician Roger Shields in the Polymer Lab. In an attempt to standardize our roughness levels,
all pieces were blasted using Number 8 grit with an operating pressure of 60 psi. To determine
which blasting procedure would work best, we sectioned off a 6” x 18” piece of aluminum stock
and varied the working distance and number of passes with the blaster. What we settled upon
was a working distance of 3-4” and 4 total passes for each surface. The pieces were rotated 90°
counterclockwise between each pass. The trajectory of the shot was approximately perpendicular
72
to the plate surface. Both sides were blasted to allow for twice as many tests. After all passes
were completed, each piece was carefully wiped down with isopropanol, dried, chemical-filmed,
and sent to be precision cleaned. Although blasting is a process that is almost impossible to
repeat perfectly, we will still be able to yield results that will show whether there is a correlation
between stiction force and surface roughness of the substrate.
The polished top plates were prepared by Mike Walsh in the polishing lab. The parts were first
lapped with 3 micron alumina grit on glass for about 2.5 hours. Next they were polished with 0.5
micron Hastilite Polytron. This polish is a solution containing 0.5 micron diamond. This
polishing step was performed on a SUBA 500 polishing pad and lasted about 4 hours.
This experiment will be completed using the V0896-50 Viton O-Ring sample and the plates will
be clamped down for 2 weeks. There will be a total of 15 samples being tested: 5 for each
roughness level. 15 mil shim stock will be placed in between the top and base plates for
standardized spacing. All preparations will be performed in clean-room I-209. Before any
samples are prepared, all top plates will be tested on the Zygo NV 5000 to catalogue their mean
surface roughness, surface roughness depth, and Rms roughness. Conclusions will be drawn
when samples are measured on the DMA. This equipment will ultimately tell us the force
required to separate the plates, thus the stiction force.
73
Appendix E: O-Ring Specification Sheets
74
75
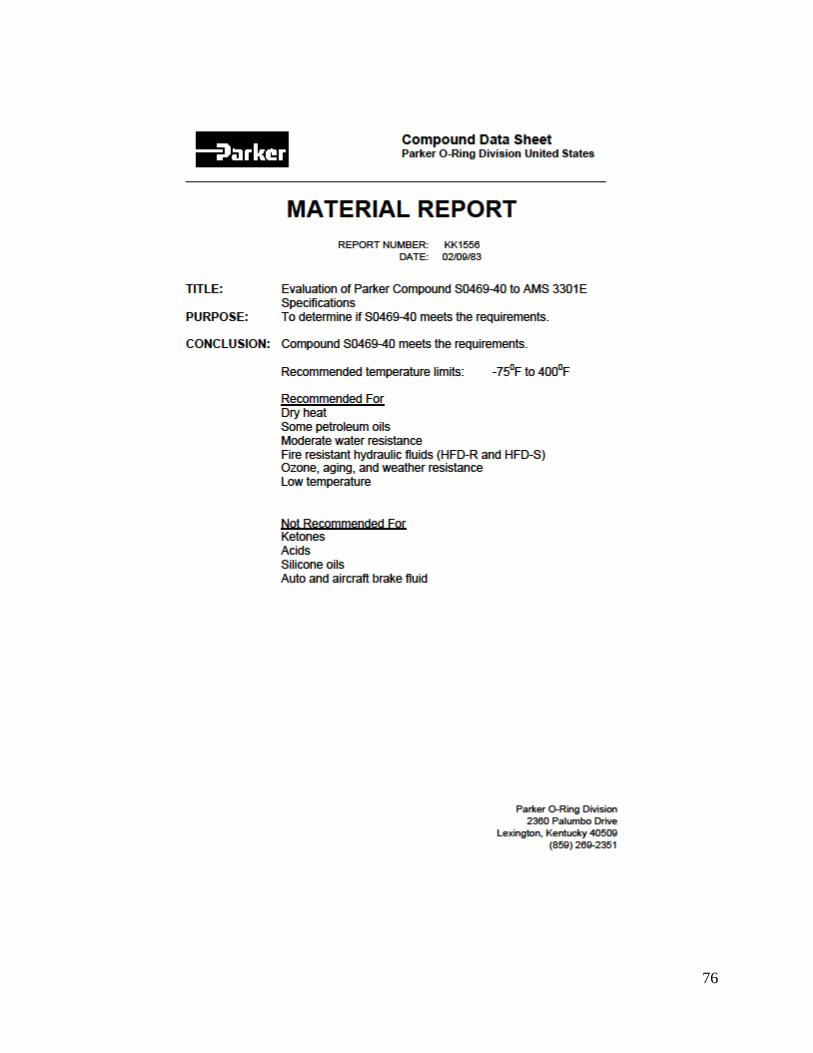
76
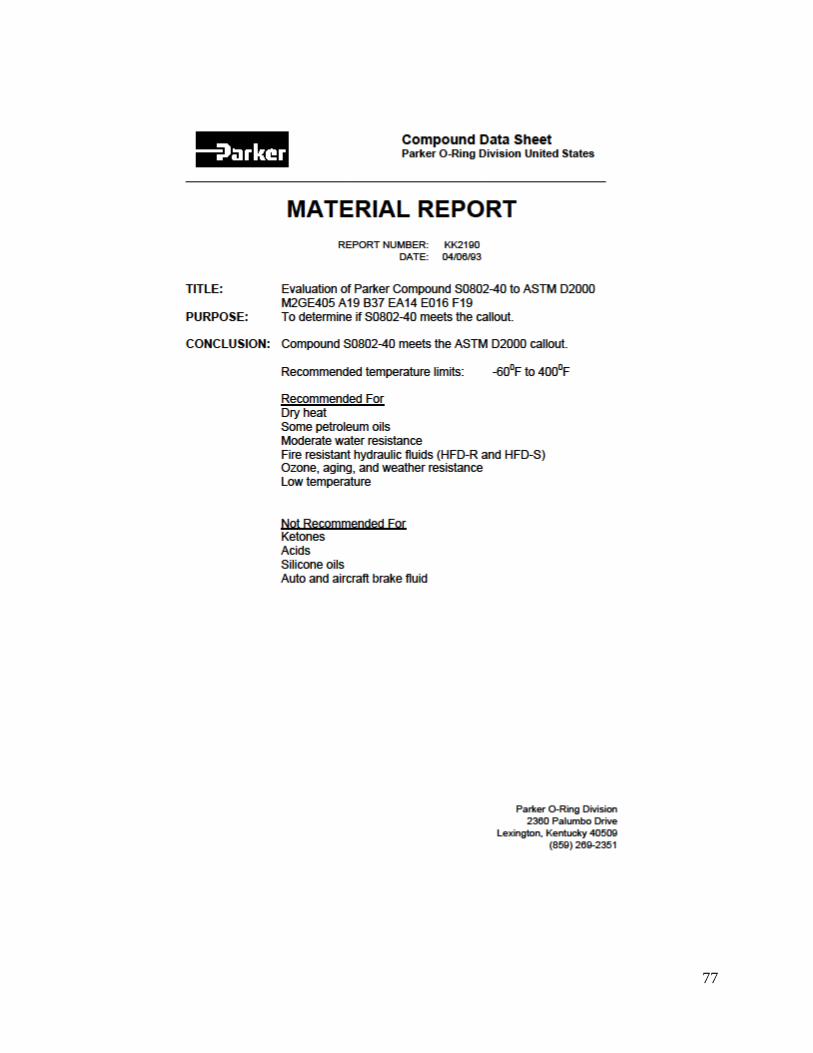
77

78

79

80

81

82

83
Appendix F: Vlier Spring Specifications

84
Appendix G: CD Files and References
For collected adhesion data, see CD file:Stiction Test Summary – Oct 9
For collected force vs. deflection data, see CD file: Force Vs. Deflection Data
For surface roughness measurements, see CD file: Roughness Measurements
For HOPA specifications, see CD file: SP-5025 Data Sheet & SP-5025 Specification
For MQP the overview/problem statement, see CD file: MQP Summary v4
For FEM SolidWorks file, see CD file: FEA Analysis Pawl Arm
For MathCAD file, see CD file: MQP Calculations FBD