f irn a ccum ula tion reco rd s for th e p a st 1000 yea
TRANSCRIPT

Firn accumulation records for the past 1000 years on thebasis of dielectric profiling of six cores from
Dronning Maud Land, Antarctica
CoenM. HOFSTEDE,1 Roderik S.W. van deWAL,1 Karsten A. KASPERS,1
MichielR. van den BROEKE,1 Lars KARLO« F,2 Jan-GunnarWINTHER,2
Elisabeth ISAKSSON,2 Gante LAPPEGARD,3 Robert MULVANEY,4
Hans OERTER,5 FrankWILHELMS51Institute for Marine and Atmospheric Research Utrecht, P.O. Box 80.005, Utrecht University, Princetonplein 5,
3584 CCUtrecht,The NetherlandsE-mail: [email protected]
2Norwegian Polar Institute, Polar Environmental Centre, N-9296 Troms!, Norway3Department of Geosciences, University of Oslo, P.O. Box 1042, Blindern, N-0316 Oslo, Norway
4British Antarctic Survey, Natural Environment Research Council, Madingley Road, Cambridge CB3 0ET, England5Alfred-Wegener-Institut fu« r Polar- undMeeresforschung, Columbusstrasse, D-27568 Bremerhaven, Germany
ABSTRACT. This paper presents an overview of firn accumulation in DronningMaud Land (DML), Antarctica, over the past 1000 years. It is based on a chronology es-tablishedwith dated volcanogenic horizons detected by dielectric profiling of six medium-length firn cores. In1998 the British Antarctic Survey retrieved amedium-length firn corefromwestern DML. During the Nordic EPICA (European Project for Ice Coring in Ant-arctica) traverse of 2000/01, a 160m long firn core was drilled in easternDML. Togetherwith previously published data from four other medium-length ice cores from the area,these cores yield 50 possible volcanogenic horizons. All six firn cores cover a mutual timerecord until the 29th eruption. This overlapping period represents a period of approxi-mately 1000 years, with mean values ranging between 43 and 71mmw.e. The coresrevealed no significant trend in snow accumulation. Running averages over 50 years,averaged over the six cores, indicate temporal variations of 5%. All cores display evidenceof a minimum in the mean annual firn accumulation rate around AD1500 and maximaaround AD1400 and1800.Themean increase over the early 20th century was the strongestincrease, but the absolute accumulation ratewas notmuch higher than around AD1400. Ineastern DML a13% increase is observed for the second half of the 20th century.
1. INTRODUCTION
The European Project for Ice Coring in Antarctica(EPICA) uses two drilling sites: in the Indian Pacific sectorat Dome Concordia (Dome C) and in the Atlantic sector inDronning Maud Land (DML) (Fig. 1). At each site, severalmedium-length firn cores have already been drilled in addi-tion to one deep core. In 1997/98, cores B31^B33 were re-trieved from DML by the Alfred-Wegener-Institut fu« r
Polar- und Meeresforschung (AWI), Bremerhaven (Oerterand others, 2000; Sommer and others, 2000a, b; Traufetterand others, in press). In 1998, cores CVand BAS were re-trieved at CampVictoria (Karlo« f and others, 2000) and thefuel depot of the British Antarctic Survey (BAS) respect-ively. During the Norwegian Antarctic Research Expedi-tion (NARE) 2000/01, a medium-length firn core, M150,was drilled at site M on the DML plateau (Winther andothers, 2002). See Figure 1andTable 1 for all core locations.
Journal of Glaciology,Vol. 50, No. 169, 2004
Table 1. Location, height and some physical properties of the six firn cores
Firn core Location Height Drill depth T10m Accumulation Month/year of drilling Source
ma.s.l. m ‡C mmw.e. a^1
M150 75‡000 S, 15‡000 E 3457 159.8 ^51.3 43 Jan. 2001 This paperB33 75‡100 S, 06‡300 E 3160 130.5 ^46.1 45 Jan.1998 Oerter and others (2000)B32 75‡000 S, 00‡000 E 2882 149.9 ^44.5 62 Dec.1997 Oerter and others (2000)B31 75‡350 S, 03‡260 W 2669 115.1 ^44.3 59 Dec.1997 Oerter and others (2000)CV 76‡000 S, 08‡030 W 2400 120.0 ^38.0 62 Jan.1998 Karlo« f and others (2000)
BAS-depot 77‡020 S, 10‡300 W 2176 121.7 ^37.7 71 Jan.1998 This paper
279

These six cores represent 1000 years of accumulationand can be used to obtain information on the spatial distri-bution of observed changes. In this paper, we present dielec-tric profiling (DEP) data for the M150 and BAS cores.Weuse our DEP data and the other four records (Karlo« f andothers, 2000; Oerter and others, 2000; Sommer and others,2000a, b;Traufetter and others, in press) to derive long-termvariations in accumulation rate for DML. This results in aspatial overview of the regional accumulation data, as threeof the six records (BAS, CVand B31) are from the westernpart of DML and the other three are located approximatelyon the ice divide running from Dome F westwards (Fig.1).
Section 2 covers the field conditions for M150 and BAS,while section 3 deals with the DEP analyses. Section 4 de-scribes how chronologies for the six cores were establishedby identifying specific volcanic horizons in the DEP data.Dating of the events in cores B31^B33 is largely based oncontinuous flow analysis (CFA) (Sommer and others,2000a) and non-sea-salt sulphate (nss) data (Traufetterand others, in press). Eruptions that are only radiocarbon-dated have been calibrated with the data of Stuiver andothers (1998a; see Appendix). Section 5 concerns the varia-bility of firn accumulation rates as derived from the DEPdata. Section 6 contains the discussion and conclusions.The Appendix contains more detailed information on thedating of volcanic horizons.
2. FIELD CONDITIONS
Here, we describe the field conditions only for theM150 andBAS cores, as the field conditions for the other four cores
have already been published (Karlo« f and others, 2000;Oerter and others, 2000; Sommer and others, 2000a, b;Traufetter and others, in press). Both cores were drilled witha conventional electromechanical ice-core drill (e.g.Mulva-ney and others, 2002b) in a dry borehole. Each drilling runproduced a core 0.5^2m long.
M150 core
A 500 km long traverse was undertaken, from the Nor-wegian baseTroll to site M on the Antarctic plateau, duringNARE 2000/01. The fieldwork is described in detail byWinther and others (2002).The total length of the core was160m. The core sections were stored in temporary outsidestorage and covered with snow to keep their temperature asstable as possible. To analyze the core sections, a 15m longunderground snow laboratory was built. This protected thecores as much as possible from temperature variations andsunlight. In the laboratory, the temperature of the cores var-ied between ^15‡ and ^25‡C. To make sure that the coreshad adapted to laboratory temperature, the core sectionswere stored in the laboratory at least half a day before meas-urements started.The core sectionswere then analyzedwitha DEP instrument. This was calibrated directly before thefirst section was measured and immediately after the lastsection was measured.
BAS core
A four-person team from the BAS retrieved a new medium-length ice core from western DML near to the BAS fueldepot (77‡020 S, 10‡300 W) in January 1998. The field team
Fig. 1. DronningMaud Land with the drilling locations of the six medium-length ice cores drilled in the period 1996^2001.
Hofstede and others: Firn accumulation records fromDML cores
280

and equipment were flown to the site byTwin Otter aircraft.The total length of the core was 121m. The core sectionswere logged, but no further analyses were carried out inthe field. The cores were cut to a maximum length of0.95m, then sealed in plastic, packed in cardboard tubes,stored in insulated boxes and buried in a snow pit (maxi-mum logged pit temperature was ^20‡C). Once drillingwas completed, the cores were lifted by Twin Otter andtransported to Halley station, where they were stored in an8m deep shaft (constant temperature was ^18.6‡C). Threeweeks later, they were transferred to a refrigerated contain-er aboard the BAS supply ship RRS Bransfield for return tothe U.K.; during shipment, the temperature was main-tained at ^22‡C. Once returned to the UK laboratory, thecores were measured for DEP in a cold laboratory at ^22‡C. Subsequently, the cores were sectioned for stable-iso-tope and other chemical analysis.
3. DEPMEASUREMENTS
For the M150 core, DEP analyses were carried out in thefield during the NARE 2000/01expedition.The DEP instru-ment used in these analyses was developed at Utrecht Uni-versity (Fig. 2), based on the concept described byWilhelms(1996) and Wilhelms and others (1998). The B31^B33 andCV cores were measured by the AWI’s DEP instrument.The main difference between the two versions is the trans-port mechanism for the ice cores. In the AWI version thecores are suspended in foil, whereas in the Utrecht instru-ment the cores are transported by a sledge with a hammockin which a core section is placed.The Utrecht version savestime in preparing the cores for measurement since suspend-ing the cores in foil is more labour-intensive. Electronically,the two devices are identical. The DEP signal was a250 kHz, 1V signal. The firn cores were measured every5mm with a 10mm measuring electrode. The BAS coreDEP profile is presented as the 50 kHz conductance, with aresolution of 1cm. In the BAS instrument, the cores are in
fixed position and themeasuring electrodes are transported.The BAS instrument is therefore neither mechanically norelectronically identical to the other two instruments.
Based on the DEP measurements, the bulk a.c. capaci-tance and conductance were determined (Moore andParen, 1987; Moore and others, 1992; Wilhelms, 2000). Per-mittivity and conductivity were derived from these quanti-ties (Wilhelms, 2000). Density was calculated by means of acomplex Looyenga mixing model (Looyenga 1965; Wil-helms, 2000).The Looyengamodel assumes firn to be amix-ture of ice and air spheres with each a characteristicpermittivity. To correct for the geometry of the measuringelectrode, the free-air reading was used.
Comparison of the Looyenga density profile with thatfrom the weighed firn core (bulk density) revealed a sys-tematic difference of 3.4%. This is probably chiefly causedby the error in bulk density determination. This is mainlyrelated to the inaccuracy of the measured length of a coresection and is estimated to be 2%. The bulk density willmostly be lower than or equal to the real density due to lossof material. Correcting the DEP-derived densities for thebulk density, including material loss, yields an unexplainedsystematic overestimation of 1.4% for the DEP results,which is less than the given standard error of 2%. However,the density error does not play a role in this study, in whichour main interest was to locate peaks representing datablevolcanic horizons. Nor does a systematic density error affectthe accumulation rate variability, which is the main con-cern of the paper. The permittivity and conductivity werefitted in terms of density and conductivity of the ice, thusfollowing local density changes in a core piece well.
To facilitate identification of peaks, the DEP signalcaused by the seasonal cycle needed to be separated fromlow-frequency components and temperature effects. TheDEP signal was corrected for variability in the temperatureof each core section by an empirically derived Arrheniusequation (Paren,1973; Glen and Paren,1975).The activationenergy used was found empirically by measuring one firncore at two different temperatures. Low-frequency noisecan be caused by climatic trends, density effects or biogenicacidity (Mayewski andothers,1993;Karlo« f andothers,2000).For this reason, the low-frequency components were re-moved by de-trending, wavelength high-pass filtering andsmoothing of the signal (Karlo« f and others, 2000).We used afirst order Savitsky^Golay filter (Press and others, 1992) inthe sample domain with samples every 250mm. Next, sub-tracting the mean and dividing by the standard deviationnormalized the remaining signal. Peaks in the signal were,rather arbitrarily, assumed to be related to volcanic eventswhenever their amplitude was >2! (Delmas and others,1992;Mayewski and others,1993; Zielinski and others,1994).
The depth of an event’s layer was considered to coincidewith the signal peak’s top. One could argue that the lowerflank (i.e. the oldest flank) of the signal peak should be usedto determine the depth of the related horizon because thissignifies when the contaminated precipitation started. How-ever, as it is subjective to determine where exactly the flankof a peak begins, we decided to take the top of the peak asthe actual position of the peak. The depth of the top of thepeak could then be determined accurately to within 1cm.
Figure 3 showsthe resultof the entireprocedureas a func-tion of depth (in metres water equivalent (mw.e.)) for theM150 and BAS cores. The depth scale of the BAS core isstretched so that peaks of the two records are more or less in
Fig. 2.The DEP instrument developed by Utrecht University.In this image, the transport sledge moves the ice core in stepsthrough a tube-shaped capacitor for measurements, while themeasuring electrode registers capacitance and conductance.The electrodes are tube-shaped so they can calculate the core’spermittivity and capacity precisely.
281
Hofstede and others: Firn accumulation records fromDML cores

line. Clearly, some but not all of the peaks show up in bothrecords. Our ‘‘2! criterion’’ resulted in the detection of 50event horizons in the six firn cores. Of these events, 39occurred in two or more cores and 11 were identified onlyonce but are probably present in the other cores as well, witha smaller amplitude (Table 2). Figure 4 shows the entire data-set.The records are lined up such that peak 24 is in the sameposition for each record.The lower part of the M150 core isnot shown, as it is the only one that covers this time-span.
4. DATING FIRNCORES
Annual-layer counting of the DEP data ofM150 was not fea-sible due to the low accumulation rate (Table 1). Instead, weused a chronology based on comparing the DEP recordswith each other. Overlapping peaks are primarily dated bythe chronology of CFA analyses (Sommer and others,2000b; Traufetter and others in press) and the Dome Cchronology (Schwander and others, 2001). Back to AD1171,volcanic layers in Antarctic cores are well documented andthere is little ambiguity about their age. Before AD1171, thedates of peaks are less clear. First, we discuss the dating ofthe four published records (CV, B31^B33).
The CV firn core was dated assuming a (within 15%)constant annual accumulation rate (Karlo« f and others,2000). An unidentified volcanic horizon in the firn corecould then be expected to be within a certain age interval,and a candidate volcano was identified using the chronol-ogy of eruptions by Simkin and Siebert (1994).
Cores B31^B33 have been primarily dated by annual-layer counting based on CFA data and subsequent identifi-cation of a few prominent volcanic horizons: the Tambora(Indonesia) eruption of 1815, the Kuwae (Vanuatu) erup-tion of 1452 and an unknown volcanic event of 1259 (Som-
mer and others, 2000a).The dating of B32 was revised laterby annual-layer counting down to the bottom of the core(Traufetter and others, in press).The accuracy of the revisedchronology is estimated to be !1year back to AD1815, in-creasing to !5 years at AD1259 and further back in time to!23 years at AD187 (Traufetter and others, in press).
The chronology of the DomeC core (not included in thispaper) was established with a simple flow model and sometie points. Back to AD1171, the chronology uses 14 well-documented volcanic eruptions and the accuracy is esti-mated to be !10 years (Schwander and others, 2001). Forthe period 7100 BP to AD1171, themodel was fitted to theVos-tok GT4 scale by using a depth-to-depth relation based on avolcanic match. The model parameters were calibratedusing 27 volcanic eruptions. The accuracy of the modelchronology is 200 years for this period.
As mean annual accumulation rates of six firn coresfrom DML were being compared, identical events in differ-ent cores should have identical dates.Themost accurate dat-ing was available for cores B32 and B33, which have a CFA-based chronology.This time-scale was therefore adopted forall six cores. The chronology does not depend on anyassumptions about an annual accumulation rate. For theperiod from the present back to AD1108, the chronology ofB32 was used (Sommer and others, 2000a; Traufetter andothers, in press). Core B32 provides few DEP data beforeAD1108, but the DEP data of B33 go back to AD 445. For thisreason, we adopted the chronology of B33 for the periodAD1108^445 (Sommer and others, 2000a). Peaks datingback to events before AD 445 were only present in the DEPdata of core M150. For AD 445 back to 452 BC, we used thechronology of Dome C. The use of several chronologiesleads to some inconsistencies at the tie points, but was pre-ferred over the Dome C chronology, which is available forthe entire period.TheDome C chronology has an estimated
Fig. 3. Comparison of the processed normalized DEP data of M150 and BAS. Peaks are defined as having an amplitude greaterthan the threshold value of 2!which is indicated by the dotted line. All 50 peaks found in the normalized DEP datasets of the sixfirn cores are incorporated in the normalized DEPgraph of both M150 and the BAS core. Black vertical lines indicate that thethreshold was passed for both cores. Grey vertical lines indicate that the threshold was only passed for the M150 core.
Hofstede and others: Firn accumulation records fromDML cores
282

Table 2. Overview of 50 volcanogenic peaks that pass the threshold value of 2! at least in one core.This is represented by a+ sign inthe columns.The number in the last column represents the numberof cores inwhich a peak is larger than the 2! threshold value.VEIis the volcanic explosivity or dust veil index, which is a measure for the strength of an eruption.The superscript symbols indicatewhich time-scale was used fordating, as explained in the text. Question marks signify that it is uncertain which volcano caused theenhanced DEP levels
PeakNo.
Volcano Eruption1 Deposition2 VEI M150depth
42! CV depth 42! BASdepth
42! B31depth
42! B32depth
42! B33depth
42! n
AD AD m m m m m m
0* DeceptionIsland
1970 4.71 + 1
1y Agung 1963 1964 4 4.69 + 6.40 ^ 5.48 + 5.92 ^ 4.34 ^ 22y unknown 1959 7.18 + 6.37 ^ 6.77 ^ 5.02 ^ 13y Ambrym? 1952 4+ 6.77 ^ 8.05 + 5.54 ^ 14y Krakatau 1883 1884 6 13.03 ^ 15.56 + 17.22 + 15.2 + 16.25 + 12.38 ^ 45y unknown 1862 14.98 ^ 17.91 + 19.96 + 17.57 ^ 18.83 ^ 14.30 ^ 26y Coseguina 1835 1835 5 17.22 ^ 23.20 ^ 20.65 + 21.75 + 16.49 ^ 27y unknown 1832 17.48 ^ 23.69 + 21.05 + 22.12 ^ 28y Tambora 1815 1816 7 18.84 + 22.87 + 25.62 + 22.64 + 23.87 + 18.05 + 69y unknown 1809 1809 19.36 + 23.60 + 26.43 + 23.44 + 24.51 + 18.64 + 610z Peteroa/Ma-
kian? Raoul?1762 1762 4/4 23.23 ^ 28.38 + 28.41 + 22.34 ^ 2
11y unknown 1695 28.42 + 34.60 + 39.19 + 35.44 + 35.9 + 27.28 + 612y Gamkonora 1673 1676 5 29.88 + 36.36 + 37.38 ^ 37.83 ^ 28.77 + 313y Awu/Deception
Isl/Long Island?1641 1641 5/6 32.26 + 39.20 + 44.50 ^ 40.71 + 40.73 + 31.02 + 5
14y unknown 1622 33.78 + 46.61 + 42.72 ^ 42.57 + 32.55 ^ 315y Huyanaputina 1600 1601 6 35.18 + 42.45 + 48.39 + 44.56 + 44.36 ^ 33.91 + 516y Ruiz/Raung? 1595 1596 4/5 35.52 + 42.98 + 49.03 ^ 45.1 + 44.83 + 34.23 + 517y Billy Mitchell? 1542 1542 6 39.57 ^ 47.14 50.06 37.91 + 118y Kuwae 1452 1453 6 45.04 + 53.80 + 61.78 + 57.89 + 56.84 + 43.35 + 619y El Chicho¤ n? 1343 1343 "4 52.59 + 62.80 + 71.25 + 67.53 + 66.02 + 50.51 + 620y unknown 1334 53.34 + 121y unknown 1286 1285 5 56.34 + 67.57 + 76.05 ^ 72.03 + 70.55 + 54.13 + 522y Tarawera? 1279 1278 56.92 + 68.37 + 76.77 + 72.78 + 71.26 + 54.62 + 623y Lolobau? 1269 1269 4 57.38 + 68.98 + 77.44 + 73.37 + 71.81 + 55.08 + 624y El Chicho¤ n 1259 1258 57.96 + 69.79 + 78.28 + 74.14 + 72.57 + 55.69 + 625y unknown 1231 1228 59.75 + 72.17 + 80.68 ^ 76.20 + 74.72 + 57.32 + 526y unknown 1190 1188 62.12 + 75.43 ^ 83.92 + 78.90 ^ 77.71 + 59.68 + 427y Billy Mitchell? 1171 1172 5+ 63.24 + 77.00 + 85.52 + 80.23 ^ 79.21 ^ 60.96 ^ 328y Guagua Pi-
chincha?1108 1108 "4 67.01 + + 83.55 ^ 2
29y Pelee?/Daka-taua?
965 961 " 4 75.62 ^ ^ 104.15 73.12 + 1
30z Rabaul? 687 685 6 91.12 + 111.38 + 105.36 ^ 113.35 ^ 88.22 + 331z unknown 578 578 96.80 + 118.68 + 120.59 ^ 93.77 + 332z unknown 543 542 98.61 + 122.91 + 95.57 + 333z Ilopango? 445 442 6 103.95 129.71 ^ 100.79 + 234yy ^ 108.64 + 135z unknown 311 110.72 + 136z Ambrym? 244 6+ 114.10 + 137z Taupo? 177 187 6 117.54 + 138yy ^ 117.96 + 139z unknown 132 119.69 + 140yy ^ 132.16 + 141** unknown ^114 134.39 + 142** unknown ^153 136.35 + 143** unknown ^188 138.21 + 144** unknown ^273 142.37 + 145** unknown ^331 145.44 + 146** unknown ^364 147.00 + 147yy ^ 149.52 + 148** unknown ^452 151.47 + 149yy ^ 154.36 + 1
1Date from Simkin and Siebert (1994).2Date fromTraufetter and others (in press).*Time-scale of CVcore drilled in 1997/98 (Karlo« f and others, 2000).yTime-scale of B32 (Sommer and others, 2000a).zTime-scale of B33 (Sommer and others, 2000a).**Time-scale of Dome C core drilled in 1998/99 (Schwander and others, 2001).yyOnly in M150; no date available.
283
Hofstede and others: Firn accumulation records fromDML cores
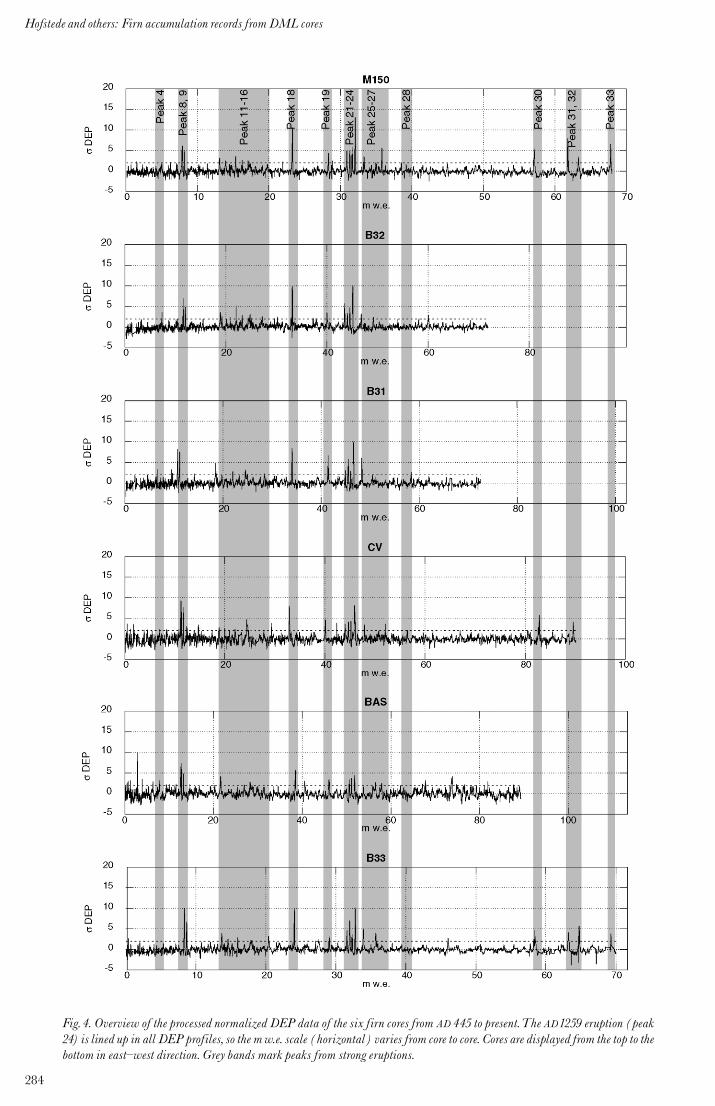
Fig. 4. Overview of the processed normalized DEP data of the six firn cores from AD 445 to present.The AD1259 eruption (peak24) is lined up in all DEP profiles, so the mw.e. scale (horizontal) varies from core to core. Cores are displayed from the top to thebottom in east^west direction. Grey bands mark peaks from strong eruptions.
Hofstede and others: Firn accumulation records fromDML cores
284
accuracy of 10 years (Schwander and others, 2001), not asgood as the CFA-based chronology of B32 and B33, whichhas a decreasing accuracy of 1^5 years for the last 800 years(Sommer and others, 2000a;Traufetter and others, in press).
As a by-product of the comparison of the DEP records of
the six cores, we attempted to identify the peaks observed inour dataset that had not yet been assigned to specific vol-canic eruptions.This procedure and its results are describedin Appendix A.
Results of this procedure indicated some new candidates
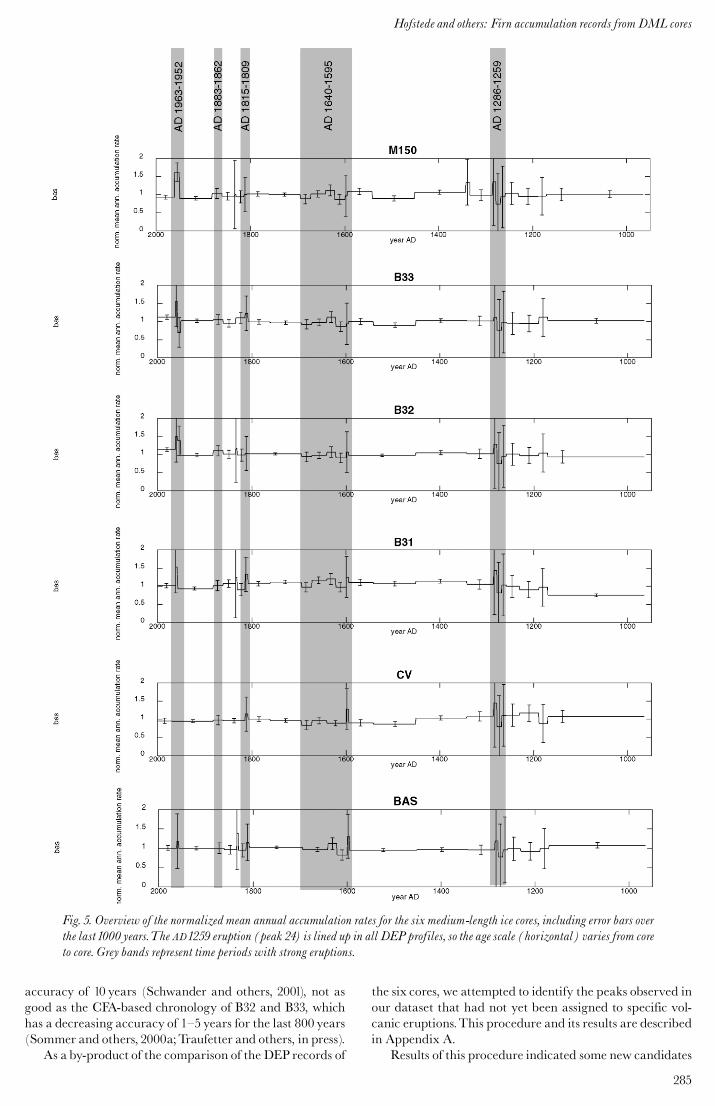
Fig. 5. Overview of the normalized mean annual accumulation rates for the six medium-length ice cores, including error bars overthe last 1000 years.The AD1259 eruption (peak 24) is lined up in all DEP profiles, so the age scale (horizontal) varies from coreto core. Grey bands represent time periods with strong eruptions.
285
Hofstede and others: Firn accumulation records fromDML cores

for volcanic horizons. As mentioned in the Appendix, iden-tification was performed purely on the strength of the erup-tion and the geographic location of the volcano. As nochemical analyses of particulates have been carried out onthese volcanic horizons, results should be interpreted withcare, as the volcanic explosivity index (VEI) is a measureof the strength of the outburst and not of the strength of a
DEP peak which is often dominated by the sulphate load.As newcandidates for unidentified eruptionswe summarize:
Billy Mitchell, Papua New Guinea, for the eruption ofAD1542 for which evidence was observed in three firncores; and El Chicho¤ n, Mexico, for the eruption inAD1343 which produced horizons in all firn cores.
Tarawera, New Zealand, and Lolobau, Papua NewGuinea, could have caused one of the horizons dated asAD1279,1269 and1259.
The AD1171 eruption, observed in the DEP data in threeof the six cores (and in the CFA data of the other threecores), could have been caused by an eruption of BillyMitchell.
Contrary to Karlo« f and others (2000), we suggest thatRabaul, Papua New Guinea, is a candidate for theAD 688 eruption but not for the AD 540 eruption.
The Ilopango (El Salvador) eruption could be thesource of the peak dated at around AD 445, which wasobserved in both cores that reach back that far in time(see Simkin and Siebert,1994).
A possible source for an eruption at AD177 isTaupo, NewZealand.
The clear volcanic horizon at 147m in core M150 anddated around 452 BC has not been identified. The eruptionmust have been strong, as it shows up clearly in the DEPdata of Dome C, which is some 2600 km away from site M.
5.VARIABILITYOFACCUMULATION RATES
Having dated the cores with one time-scale, we calculatedthe mean annual accumulation rate between the datedevents and compared the mean annual accumulation rateof the six cores as a function of time.The joint accumulationrecord of each of the six cores covers the period AD 965^1998. The mean annual accumulation rate simply followsfrom the datum stratum, with the mw.e. depth of the coresection above the dated horizon divided by the time-span(Karlo« f and others, 2000). The effect of layer thinning dueto strain was ignored, as the length of the cores never ex-ceeds 10% of the total ice thickness. The resulting accumu-lation rates were normalized by dividing by the averageaccumulation rate of a core over the period studied here(see Fig. 5).
As some volcanic horizons are present in a relativelysmall section (representing a short time-span), the meanannual accumulation rate might vary considerably overthese time-spans due to the high interannual variability ofaccumulation. As a result, the error in accumulation rate isgreatest in these short time intervals. The magnitude of theaccumulation error in Figure 5 is determined by the accu-racy of the dated event and of the determination of the bulkweight of the ice core (always 2%).The dating error is esti-mated to increase from !2 years, for the younger events forwhich the CFA time-scale was used, to 10 years for the year965. As a result, the accumulation-rate error is greater forshorter time intervals because the total error is then deter-mined by the dating uncertainty. For longer time-spans, theerror is dominated by the error in the density, which is rela-tively small.
In order to track and exclude errors in the dating of in-
Fig. 6. Cross-correlation coefficients as a function of time lagrelative to the M150 record.
Fig. 7. Mean annual accumulation rate of the six firn cores,averaged with a running mean with a period of 50 years.Thegrey shaded band indicates 1!uncertainty.
Hofstede and others: Firn accumulation records fromDML cores
286

dividual DEP records, we calculated the cross-correlationcoefficients between the six cores,15 cross-correlation coeffi-cients in total. Results for the cross-correlation coefficientsas a function of time lag are shown in Figure 6, where allother records are compared with the M150 record. Thehighest cross-correlation coefficients are found for a timelag of 0. This means that there are no severe dating errorsdue to missing layers, erosion or other causes.
Five periods with local maxima and minima canbe rec-ognized in all cores (indicated by grey bands in Fig. 5).Small differences are caused by events that were not presentin all cores. To eliminate these short-period variations, theaccumulation rates were averaged by calculating the run-ning mean over 50 year periods. Since the standard devia-tions of the records are comparable, no stacking orstandardization with the variance is needed, but simpleaveraging is sufficient. Figure 7a and b present the resultsfor the mean and for the individual records respectively.The variation on time-scales of 50 years is only about 5%.The six cores reveal only weak overall trends that are notstatistically significant. Linear correlation coefficients forthe 50 year running mean of the accumulation are also notsignificant. Figure 7 displays a local maximum in the firnaccumulation rate around AD1800, followed by a localminimum around AD1900 and an increase over the early20th century. There are also local maxima around AD1650and 1580. Most pronounced is the local minimum aroundAD1500, clearly present in all datasets, and the maximumat the end of the 14th century.
Cross-correlation coefficients are highest for coresM150,B33 and B32, indicating that these records show similarvariations throughout the time period considered, althoughthe amplitude of the variation inM150 is slightly larger thanin B33 and B32.These three cores are from the three highestlocations on the plateau, and apparently experienced
similar climatological conditions. Cores B31, CVand BASdo not fit this general picture. They are situated on thewestern ‘‘slope’’ of the ice sheet, with larger temporal andspatial fluctuations.The differences in accumulation rate ofthese cores are apparently more localized (Fig.5). In the CVcore, three main periods can be recognized, AD1100^1450,1450^1700 and 1700^present. The period AD1100^1450 rep-resents a maximum in average accumulation; for thisperiod, the values are higher than for any of the other cores.From AD1450 to 1700, there is a minimum in accumulationrate, and from AD1700 to present the accumulation rate isclose to average except for a maximum around AD1800,which was found for all cores.The BAS core shows no clearseparate periods from AD1100 to present. There has been agentle increase in accumulation rate over time, againwith alocal maximum around AD1800. The accumulation of coreB31 is different again. Here, a weak significant decrease inaccumulation is observed from around AD1300 to aroundAD1900. The local maximum around AD1800 is alsoobserved, and the minimum around AD1500 also found forseveral other cores. The low value for AD 965^1171, which isnot observed in any of the other cores, is probably due tolocal changes in topography and is discussed by Oerter andothers (in press).
Despite the limited temporal resolution, we consideredthe last two centuries in more detail.To obtain an overviewof the last 200 years we selected a few characteristic eventsfor all cores. We used the Tambora and Krakatau (Indo-nesia) eruptions to characterize the 19th-century accumu-lation.The early 20th century is characterized by using theKrakatau eruption and a DEP peak as early as possible inthe second half of the 20th century. The latter part of the20th century is finally characterized by this peak and thesurface level. Results of this subdivision in about 60 yearperiods are presented in Figure 8. It can be observed that
Fig. 8. (a)Mean annual accumulation rate of the six cores for the last 200 years.Markers are theTambora eruption andKrakatauin the 19th century and an eruption somewhere in the 20th century.The latter is not always the same for the different cores. (b)Mean accumulation rate over western (BAS, CV, B31) and eastern (B32, B33, M150) DML.
287
Hofstede and others: Firn accumulation records fromDML cores

the early 20th century is relatively dry whereas the secondhalf of the 20th century is wetter for some cores. Based onthe high cross-correlation coefficients presented in Figure 6,we divided the six cores into two groups, one representingwestern DML (BAS, CV and B31) and the other easternDML (B32, B33, M150). Results of this subdivision areshown in Figure 8b. It can be observed that eastern DML,in particular, experiences increased accumulation.
6. DISCUSSIONAND CONCLUSIONS
Our main objective was to achieve an overview of the meanannual accumulation record for DMLderived fromtheDEPdata of these cores. For this purpose, we adopted the sametime-scale for all cores, which was mainly based on the sub-annual resolved CFA analyses. The mean annual accumu-lation records show no significant trend, but coherent fluc-tuations can be observed. The lack of trend is in agreementwith earlier studies by Karlo« f and others (2000) and Sommerand others (2000a). Previous firn accumulation results basedon other techniques, for the same period at the South Pole,did not show climatically significant changes either (Van derVeen and others, 1999). Oerter and others (1999) and Grafand others (2002) presented temporal variations for the lasttwo centuries in central DML, based on DEP, tritium andstable-isotope measurements. Their results indicate adecrease in firn accumulation during the 19th century fol-lowed by an increase over the early 20th century and there-after, stabilization at a level similar to that of the early 19thcentury. The Berkner Island (West Antarctica) records pre-sented by Mulvaney and others (2002a) only show increasedaccumulation rates for the Northern Dome and nodecreased levels earlier in the 19th century. Stenni andothers (2002) published an 800 year record forTalos Dome,East Antarctica, with an opposite signal for the early 20thcentury and continued enhanced accumulation duringrecent decades. Karlo« f and others (2000) published a1500 year record from western DML indicating no overalltrend in firn accumulation rate, except a decrease of 8%between AD1452 and1641. Sommer and others (2000a) pre-sented results for the B31^B33 cores that also revealed nooverall trend for the period AD1100^1996.
In all six cores of the present study, covering a largerpart of DML than previous work by Graf and others(2002), there are local minima around AD1500 and 1680.The minimum around AD1500 is also observed by Stenniand others (2002) for Talos Dome. All cores also display alocal maximum around AD1800 followed by a minimumaround AD1900. The joint accumulation records of coresB32, B33 and M150 show the highest cross-correlation coef-ficients. This is most likely due to the similarity in theclimate conditions experienced on the high plateau ofcentral DML. Surprisingly little coherence is found for theaccumulation records of cores BAS, CVand B31, whichwereretrieved from the western slope of the ice sheet in DML.Apparently, the temporal and spatial variation in accumu-lation is larger on thewestern slope of the ice cap than on theeastern plateau. Although no general trend is found in thesix cores, the strongest increase in the mean annual firn ac-cumulation rate is observed in the early 20th century. Dueto the absence of distinct volcanic horizons in the late-20th-century sections, the present study can only be used withcare for the second half of the 20th century. Based on Figure8b we conclude that only in eastern DML is accumulation
significantly increased in the second half of the 20th centurywith respect to the long-term mean accumulation rate.
ACKNOWLEDGEMENTS
We acknowledge the logistic personnel involved in the expe-ditions.We thank all members of the NARE 2000/01expedi-tion, whose team spirit made this expedition successful.Weare also grateful to O. Jalving, M. Portanger, J. Brand andE.-J. de Jong, whose efforts resulted in the creation and up-grade of the Utrecht DEP instrument and drill, and to J.Kohler and A. van Dijk for constructive discussions.We aregrateful to E. Steig and J. Turner for their constructive re-views. This work is a contribution to the European Projectfor Ice Coring in Antarctica (EPICA), a joint EuropeanScience Foundation/European Commission scientific pro-gramme, funded by the European Commission under theEnvironment and Climate Programme and by nationalcontributions from Belgium, Denmark, France, Germany,Italy, The Netherlands, Norway, Sweden, Switzerland andthe United Kingdom. This is EPICA Publication No. 97.Additional funding was obtained from the NetherlandsAntarctic Programme of the Netherlands Organization forScientific Research (NWO).
REFERENCES
Delmas, R. J., M. Legrand, A. J. Aristarain and F. Zanolini. 1985.Volcanicdeposits in Antarctic snow and ice. J. Geophys. Res., 90(D7),12,901^12,920.
Delmas, R. J., S. Kirchner, J.M. Palais and J.-R. Petit. 1992. 1000 years ofexplosive volcanism recorded at the South Pole.Tellus B, 44(4), 335^350.
Dull, R. A., J. R. Southon and S. Payson. 2001.Volcanism, ecology and cul-ture: a reassessment of the volcano IlopangoTBJ eruption in the south-ern Maya realm. J. Lat. Amer. Antiq.,12(1), 25^44.
Glen, J.W. and J. G. Paren. 1975. The electrical properties of snow and ice.J. Glaciol., 15(73),15^38.
Graf, W. and 6 others. 2002. Stable-isotope records from Dronning MaudLand, Antarctica. Ann. Glaciol., 35,195^201.
Karlo« f, L. and13 others. 2000. A1500 year record of accumulation at Amund-senisen, western Dronning Maud Land, Antarctica, derived from elec-trical and radioactive measurements on a120m ice core. J. Geophys. Res.,105(D10),12,471^12,483.
Looyenga, H. 1965. Dielectric constant of heterogeneous mixtures. Physica,31(3), 401^406.
Mayewski, P. A. and 8 others.1993. Greenland ice core ‘‘signal’’characteris-tics: an expanded view of climate change. J. Geophys. Res., 98(D7),12,839^12,847
Moore, J. C. andJ. G. Paren.1987. A new technique for dielectric logging ofAntarctic ice cores. J. Phys. (Paris) 48, Colloq. C1,155^160. (Supple¤ mentau 3.)
Moore, J. C., E.W. Wolff, H. B. Clausen and C.U. Hammer. 1992. Thechemical basis for the electrical stratigraphy of ice. J. Geophys. Res.,97(B2),1887^1896.
Mulvaney, R. and 8 others. 2002a. 1000 year ice-core records from BerknerIsland, Antarctica. Ann. Glaciol., 35, 45^51.
Mulvaney, R., S. Bremner, A.Tait and N. Audley. 2002b. A medium-depthice core dri11. Nat. Inst. Polar Res. Mem., Special Issue, 56, 82^90. (IceDrillingTechnology 2000.)
Oerter, H.,W. Graf, F.Wilhelms, A. Minikin and H.Miller.1999. Accumu-lation studies on Amundsenisen, Dronning Maud Land, by means oftritium, dielectric profiling and stable-isotope measurements: first re-sults from the 1995^96 and1996^97 field seasons. Ann. Glaciol., 29,1^9.
Oerter, H. and 6 others. 2000. Accumulation rates in Dronning Maud Land,Antarctica, as revealed by dielectric-profiling measurements of shallowfirn cores. Ann. Glaciol., 30, 27^34.
Oerter, H.,W. Graf, H. Meyer and F.Wilhelms. In press. The EPICA icecore, Dronning Maud Land: first results from stable-isotope measure-ments. Ann. Glaciol.
Palais, J.M., S. Kirchner and R. J. Delmas. 1990. Identification of someglobal volcanic horizons by major element analysis of fine ash in Ant-arctic ice. Ann. Glaciol.,14, 216^220.
Paren, J. G. 1973. The electrical behavior of polar glaciers. InWhalley, E.,
Hofstede and others: Firn accumulation records fromDML cores
288
S. J. Jones and L.W. Gold, eds. Physics and chemistry of ice. Ottawa, Ont.,Royal Society of Canada, 262^267.
Press, W.H., S. A. Teukolsky, W.T. Vetterling and B. P. Flannery. 1992.Numerical recipes in C: the art of scientific computing. Second edition. Cam-bridge, Cambridge University Press.
Schwander, J., J. Jouzel, C.U. Hammer, J. R. Petit, R. Udisti and E.Wolff.2001. A tentative chronology for the EPICA Dome Concordia ice core.Geophys. Res. Lett., 28(22), 4243^4246.
Simkin,T. and L. Siebert.1994.Volcanoes of the world. Second edition.Tuc-son, AZ, Geoscience Press.
Sommer, S. and 9 others. 2000a. Glacio-chemical study spanning the past 2 kyron three ice cores from Dronning Maud Land, Antarctica. 1. Annuallyresolved accumulation rates. J. Geophys. Res., 105(D24), 29,411^29,421.
Sommer, S., D.Wagenbach, R. Mulvaney and H. Fischer. 2000b. Glacio-chemical study spanning the past 2 kyr on three ice cores from Dron-ning Maud Land, Antarctica. 2. Seasonally resolved chemical records.J. Geophys. Res.,105(D24), 29,423^29,433.
Stenni, B. and 6 others. 2002. Eight centuries of volcanic signal and climatechange at Talos Dome (East Antarctica). J. Geophys. Res., 107(D9).(10.1029/2000JD000317.)
Stuiver, M., P. J. Reimer andT. F. Braziunas. 1998a. High-precision radio-carbon age calibration for terrestrial and marine samples. Radiocarbon,40(3),1127^1151.
Stuiver, M. and 9 others.1998b. INTERCAL98 radiocarbon age calibration,24,000^0 cal BP. Radiocarbon, 40(3),1041^1083.
Traufetter, F., H. Oerter, H. Fischer, R.Weller and H. Miller. In press. Spa-tio-temporal variability in volcanic sulphate deposition over the past2 kyr in ice cores from Amundsenisen, Dronning Maud Land, Antarc-tica. J. Glaciol.
Van den Broeke, M.R. and 6 others.1999. Climate variables along a traverse linein Dronning Maud Land, East Antarctica. J. Glaciol., 45(150), 295^302.
Van der Veen, C. J., E. Mosley-Thompson, A. Gow and B.G. Mark. 1999.Accumulation at South Pole: comparison of two 900-year records.J. Geophys. Res.,104(D24), 31,067^31,076.
Wilhelms, F. 1996. Leitf€ahigkeits- und Dichtemessung an Eisbohrkernen[Measuring the conductivity and density of ice cores.]. Ber. Polarforsch.191. [In German with English abstract.]
Wilhelms, F. 2000. Messung dielektrischer Eigenschaften polarer Eiskerne[Measuring the dielectric properties of polar ice cores.]. Ber. Polarforsch./Rep. Pol. Res. 367,1^171. [In German.]
Wilhelms, F., J. Kipfstuhl, H. Miller, K. Heinloth and J. Firestone. 1998.Precise dielectric profiling of ice cores: a new device with improvedguarding and its theory. J. Glaciol., 44(146),171^174.
Winther, J.-G. and 10 others. 2002. European Project for Ice Coring in Ant-arctica (EPICA)!Nordic traverse in 2000/01. InWinther, J.-G., ed. Re-port of the Norwegian Antarctic Research Fxpedition 2000^2001. Oslo, NorskPolarinstitutt,18^29. (Rapportserie 120.)
Zielinski, G. A. and 8 others. 1994. Record of volcanism since 7000 B.C. fromthe GISP2 Greenland ice core and implications for the volcano^climatesystem. Science, 264(5161), 948^952.
APPENDIX
IDENTIFICATIONOF VOLCANIC HORIZONS
From the present back to AD1171, most volcanic eruptionsare historically well documented:
1815: the clear horizon of theTambora eruption
1809: unidentified event
1452: the strong signal of Kuwae
1259: a strong eruption signal identified by some as El Chi-cho¤ n (Palais and others, 1990; Delmas and others,1992). The event is the oldest in a short series of fourvolcanic eruptions, dated AD1286,1279,1269 and1259.The 1259 event is preceded by three strong events, inAD1231,1190 and1171.The1171event does not show upin theDEP data of cores B31^B33, but does show up inthe CFA data.
We used Simkin and Siebert’s (1994) chronology of erup-tions to assign volcanic events that have been dated but notyet identified.This chronology uses theVEIas ameasure for
the strength of the eruption on a logarithmic scale.Wemadethe identification purely on the strength of the eruption andthe latitude of the geographic location of the volcano (Del-mas and others,1985; Karlo« f and others, 2000). No geochem-ical analyses were carried out on these volcanic horizons,and our results should be interpreted with care as theVEIis not a measure of the strength of a DEP peak, which is of-ten dominated by the sulphate load.
We considered (1) eruptions withVEI"4 between 20‡Nand 20‡ S; (2) eruptions with VEI "4 south of 20‡ S; and(3) Antarctic and sub-Antarctic eruptions having only localimpact. It was not obvious to which volcanic eruption somepeaks were related, as indicated by question marks inTable 2. We used the database of Stuiver and others(1998a, b) to calibrate volcanic eruptions listed by Simkinand Siebert (1994) which had been dated with so-called un-corrected radiocarbon data.This revealed interesting possi-bilities for eruptions that have not yet been assigned to aspecific volcano in the literature, as far as we know. Thedates of the events, their sources, the radiocarbon datesand calibrated possible sources are listed inTable 3. In thefollowing paragraphs, we discuss important volcanic hori-zons of the eruptions as numbered in Figure 3.
For peaks 1^3 (Fig. 3), the first clearly visible eruption isAgung, Indonesia, in1963, detectable inM150 and B31as anevent. The peak is visible in B33 but does not meet our 2!criterion (see Table 2). Peaks 2 and 3 are unknown eventsin 1952 and 1959. A possible source for peak 3 is an eruptionof Ambrym,Vanuatu, in 1951. Note that the Pinatubo (Phil-ippines) eruption of 1991 does not show up in M150 andB31^B33, due to bad core quality at the top. However, forthe locations of B31^B33 it was identified in snow pits (Trau-fetter and others, in press).
Peaks 21^24 were dated at AD1286, 1279, 1269 and 1259.The oldest one, peak 24, has been suggested to represent avolcanic layer of El Chich"on, based on a geochemical studyof ash particles (Palais and others,1990). According to Del-mas and others (1992), the sources of peaks 22 and 23 areprobably restricted to the Southern Hemisphere. Peak 23 isdated at AD1269.The Lolobau eruption, radiocarbon-datedas 802 BP, is a possibility for peak 23. After calibration, the2! interval is AD1188 (1254) 1281 (Table 3). (The year in par-entheses is the most likely date; the other years are theasymmetrical 1! and 2! confidence intervals.) A possiblecandidate for peak 22 or 21, dated AD1279 or 1286, is theTarawera eruption, radiocarbon-dated at 724 BP. Calibra-tion of this radiocarbon date produced a 2! interval ofAD1267 (1283) 1297.
The year assigned to peak 27 is AD1171. A global eventhas been dated at around AD1177 by Schwander and others(Delmas and others,1992; Schwander and others, 2001) andis likely to be the same event as peak 27. It shows up in threeof the six DML cores. A possible source is the radiocarbon-dated eruption of Billy Mitchell at 870 BP. Calibrating thisdate yields a 2! interval AD1154 (1166,1188) 1236. This peakshows up in the nss-conductivity profile of cores B31^B33,but not in the DEP results (Sommer and others 2000a,table 2). It was recognized in the sulphate record of B32and B31 and dated by Traufetter and others (in press) atAD1172!6.
With peaks 30^33, the core chronologies of cores CV,B32, B33 start to deviate. Peak 30 is clearly recognizable incores CV, B33 and M150 as a double peak (see Fig. 4). CoresBAS, B31 and B32 do not contain DEP data for this period.
289
Hofstede and others: Firn accumulation records fromDML cores

Karlo« f and others (2000) dated this peak to an unknowneruption in AD 639. Oerter and others (2000) assigned thesame event to AD 687.The peak shows up in the nss-sulphaterecords of B32 and B31 and was dated by Traufetter andothers (in press) at AD 685!15. Peak 31was dated by Karlo« fand others (2000) at AD 540, where the eruption could bethe Rabaul eruption, radiocarbon-dated at 1346 BP in Sim-kin and Siebert (1994). Oerter and others (2000) assignedthis peak to AD 581.Traufetter and others (in press) assignedthe corresponding nss-sulphate peak in B32 and B31 toAD 587!16. Peak 32 is not present in the CV firn corebecause the core did not reach this horizon. Peak 32 is as-signed to AD 544 by Oerter and others (2000) and dated byTraufetter and others (in press) at AD 542!17. Peak 31,dated at AD 540, in core CV (Karlo« f and others, 2000) isnot related to the same event as peak 32, dated at AD 544,in core B33 by Oerter and others (2000). As we follow thechronology of Traufetter and others (in press) in this paper,
we assigned peaks 30 and 31 to AD 687 and 581 instead ofAD 642 and 540 as in Karlo« f and others (2000).The Rabauleruption was radiocarbon-dated at 1410 BP in Simkin andSiebert (1994). Calibration brings the eruption peak in the2! interval AD 536 (664) 893 where AD 664 is the calibrateddate. Contrary to Karlo« f and others’ (2000) suggestion ofRabaul as a candidate for peak 31 (in this paper dated asAD 581), we think it less likely (but still within the 2! confi-dence interval) that peaks 31 and 32 are related to an erup-tion of Rabaul. We propose Rabaul as a candidate for theAD 687 eruption event (peak 30). Peak 33 is dated toAD 445. In Simkin and Siebert’s (1994) chronology, a strongeruption (VEI 6) of Ilopango is radiocarbon-dated at1642 BP!100 years.This date is now estimated to have beenin the 2! interval AD134 (416) 638 (Dull and others, 2001),where the year AD 416 has highest probability, making it agood possibility for peak 33.
The remaining events, peaks 41^49, are compared with
Table 3. Dated eruptions in core M150 with radiocarbon-calibrated volcanic eruptions as a possible source*
Peak Date Volcano Radiocarbon-datedalternative
Simkin date* Calibrated radiocarbondates
2! confidence interval VEI
AD BP AD
20010 1970 Deception Isl.1 1963 Agung2 1959 unknown3 1952 Ambrym?4 1883 Krakatau5 1862 unknown6 1835 Coseguina7 1832 unknown8 1815 Tambora9 1809 unknown10 1762 Peteroa/Makian? Raoul 200 1668,1782,1795 1637^1950 411 1695 unknown12 1673 Gamkonora13 1641 Awu/Deception Isl. Long Island 258 1649 1638^63 614 1622 unknown15 1600 Huyanaputina16 1595 Ruiz/Raung?17 1542 unknown Billy Mitchell 336 1520,1588,1624 1478^1639 618 1452 Kuwae19 1343 unknown El Chicho¤ n 538 1331,1341,1397 1281^1444 "420 1334 unknown El Chicho¤ n 538 1331,1341,1397 "421 1286 unknown Tarawera 724 1283 522 1279 unknown Tarawera 724 1283 1267^97 523 1269 unknown Lolobau 802 1254 1188^1281 424 1259 El Chicho¤ n Lolobau 802 1254 425 1231 unknown26 1190 unknown Billy Mitchell 870 1165,1166,1188 1044^1236 5+27 1171 unknown Billy Mitchell 870 1165,1166,1188 1044^1236 5+28 1108 unknown Guagua Pichincha 1044,1090,1120,1139,
11551037^1159 "4
29 965 unknown Pelee/Dakataua? 1108 902, 917, 963/900, 919,958
890^990/779^1019 "4
30 687 unknown Rabaul 1346 664 536^893 631 578 unknown32 543 unknown33 445 unknown Ilopango 1642 416 134^638 634 not dated35 311 unknown36 244 unknown Ambrym 1822 221 39 BC^425 6+37 177 unknown Taupo 18038 not dated39 132 unknown40 not dated
*Radiocarbon-dated events from Simkin and Siebert (1994), calibrateded on the basis of Stuiver and others (1998a).
Hofstede and others: Firn accumulation records fromDML cores
290
the Dome C scale. This time-scale has an accuracy of 10^200 years in the period AD1177 to 10 kyr BP (Schwander andothers, 2001). For one event, peak 46, which has the largestamplitude, we present an estimate of the age based on aver-age annual accumulation. Peak 46 occurs at 147m(105.38mw.e.) depth in core M150. Based on the averageannual precipitation from present to AD 445, peak 46 wouldhave an age of 420 BC. Simkin and Siebert’s (1994) chronol-
ogy does not contain a suitable event around this date. Theevent has been detected as one of the tie points in the DEPdata of Dome C and theVostok ice core. As a tie point, theage of this event is estimated to be 390 BC. According to theflow model of Dome C, the event related to peak 46 tookplace in 364 BC. For consistency, we adopted the flow-modelage as we used the Dome C flow-model time-scale for moreeruptions.
MS received 13 November 2003 and accepted in revised form 9March 2004
291
Hofstede and others: Firn accumulation records fromDML cores