exploring changes in computer self-efficacy during
TRANSCRIPT

University of South CarolinaScholar Commons
Theses and Dissertations
6-30-2016
Exploring Changes In Computer Self-EfficacyDuring Graphics Skills AcquisitionMichele DamesUniversity of South Carolina
Follow this and additional works at: https://scholarcommons.sc.edu/etd
Part of the Curriculum and Instruction Commons
This Open Access Dissertation is brought to you by Scholar Commons. It has been accepted for inclusion in Theses and Dissertations by an authorizedadministrator of Scholar Commons. For more information, please contact [email protected].
Recommended CitationDames, M.(2016). Exploring Changes In Computer Self-Efficacy During Graphics Skills Acquisition. (Doctoral dissertation). Retrievedfrom https://scholarcommons.sc.edu/etd/3509

EXPLORING CHANGES IN COMPUTER SELF-EFFICACY DURING
GRAPHICS SKILLS ACQUISITION
By
Michele Dames
Bachelor of Arts
The College of New Jersey, 1995
Master of Arts
University of South Carolina, 2003
Submitted in Partial Fulfillment of the Requirements
For the Degree of Doctor of Education in
Curriculum and Instruction
College of Education
University of South Carolina
2016
Accepted by:
Susan Schramm-Pate, Major Professor
Suha Tamim, Committee Member
Michele Maher, Committee Member
Tena B. Crews, Committee Member
Lacy Ford, Senior Vice Provost and Dean of Graduate Studies

ii
© Copyright by Michele Dames, 2016
All Rights Reserved.

iii
ACKNOWLEDGEMENTS
Thank you to every teacher who helped me arrive at this place in my educational
journey. I am especially grateful to Dr. Schramm-Pate for her guidance, patience, and
encouragement. I am also thankful for the time and valuable feedback of my committee
members, Dr. Maher, Dr. Tamim, and Dr. Crews. Special thanks to Amber F. for your
knowledge and support.
My parents always valued education and I thank them for instilling that in me.
Thank you Mom and Dad for loving, guiding, supporting, and inspiring me. My mother is
the original Dr. Dames and I am proud to follow your lead. Thank you for showing me
what can be accomplished with hard work. I thank my father for always being my
biggest fan and encouraging me. May the buttons pop off of your shirt Dad!
Many thanks to my husband Kevin for all of your love and support. I love you
very much and am proud to be married to such a wonderful person.
A million thanks to my friends and support team: Melissa, Aunt Anne, Brandy,
Alicia, and Amber V. You always lend an ear and remind me I am stronger than
I think.
iv
ABSTRACT
The present action research study involved a participant-researcher and her
undergraduate students enrolled in the Course: Visual Arts Computing, at the University
of South Carolina from 2012 to 2013. This research examined six sections of the course
with an average of 20 students in each section, totaling 120 participants. The overarching
Research Question for the present study was: What factors from social cognitive theory
(cognitive, environmental, behavior) influenced students’ self-efficacy with computer
technology in an undergraduate graphic arts course? To answer this question the
participant-researcher administered a pretest and posttest of the computer self-efficacy
scale by Compeau and Higgins (1995b). The course focused on learning foundational art
and graphic design concepts through projects created with the graphics software, Adobe
Photoshop. “Graphic Skills Acquisition” (GSA) which is associated with improved
“computer self-efficacy,” was used in this action research study to increase students’
confidence levels with computers and enhance feelings of positivity when interacting
with technology in general. The research showed, based on the pretest and posttest scale,
GSA has the potential to influence academic student achievement, workplace
productivity, and personal computer self-efficiency outside of the course. The factors
identified from Bandura’s social cognitive theory were: independent learning
(environmental), new and unfamiliar tasks (cognitive), and behavior modeling (behavior).

v
TABLE OF CONTENTS
Acknowledgements ........................................................................................................ iii
Abstract .......................................................................................................................... iv
Chapter One: Introduction ............................................................................................... 1
Bandura’s Social Cognitive Theory ........................................................................ 2
Compeau and Higgins Scale ................................................................................... 4
Statement of the Problem ....................................................................................... 5
Justification for the Study ....................................................................................... 6
Action Research Methodology ............................................................................... 8
Research Question.................................................................................................. 9
Purposes of the Study ............................................................................................. 9
Additional Theory ................................................................................................ 10
Definitions of Terms ............................................................................................ 10
Researcher’s Positionality .................................................................................... 11
Limitations ........................................................................................................... 13
Scope ................................................................................................................... 14
Significance of the Study ..................................................................................... 14
Findings of the Present Study ............................................................................... 17
Summary.............................................................................................................. 17

vi
Chapter Two: Literature Review ................................................................................... 19
Problem Statement ................................................................................................ 19
Purpose Statement ................................................................................................ 20
Social Cognitive Theory ....................................................................................... 21
Self-Efficacy ........................................................................................................ 22
Computer Self-Efficacy ........................................................................................ 26
Computer Self-Efficacy Scale .............................................................................. 37
Graphics ............................................................................................................... 39
Conclusion ........................................................................................................... 45
Chapter Three: Methodology ........................................................................................ 46
Problem Statement ............................................................................................... 46
Purpose Statement ................................................................................................ 47
Magnitude ............................................................................................................ 47
Strength ............................................................................................................... 48
Action Research Design ....................................................................................... 48
Focus Stage: Developing an Area of Focus ......................................................... 48
Acting Stage: Data Collection ............................................................................. 49
Reflective Stage: Data Analysis .......................................................................... 50
Analysis Stage: Reflecting on the Data ................................................................ 51
Theoretical Framework ........................................................................................ 52
Participants .......................................................................................................... 53
Summary.............................................................................................................. 54

vii
Chapter Four: Research Findings .................................................................................. 55
Problem Statement ............................................................................................... 55
Purpose Statement ................................................................................................ 56
Findings ............................................................................................................... 57
Magnitude ............................................................................................................ 61
Strength ............................................................................................................... 62
Summary.............................................................................................................. 71
Chapter Five: Implications and Conclusions ................................................................. 72
Problem Statement ............................................................................................... 72
Purpose Statement ................................................................................................ 73
Overview of the Research Study and Methodology .............................................. 73
Findings ............................................................................................................... 75
Implications ......................................................................................................... 80
Independent Learning ........................................................................................... 80
Access to Support Materials ................................................................................. 81
Engaging in Unfamiliar Tasks .............................................................................. 82
Behavior Modeling .............................................................................................. 82
Summary.............................................................................................................. 83
Action Plan .......................................................................................................... 83
Recommendations for Graphic Arts Faculty ......................................................... 86
Recommendations for Future Research ................................................................ 87
Conclusions ......................................................................................................... 88
References ..................................................................................................................... 89

viii
Appendix A: Computer Self-Efficacy Scale ................................................................ 109
Appendix B: Institutional Review Board (IRB) Approval ............................................ 111

ix
LIST OF TABLES
Table 4.1 Computer Self-Efficacy Scale Questions ........................................................ 59
Table 4.2 Computer Self-Efficacy: Percent Change by Question .................................. 59
Table 4.3 Magnitude: Percent Change by Section ......................................................... 62
Table 4.4 Magnitude: Percent Change by Question ....................................................... 63
Table 4.5 Strength: Percent Change by Section ............................................................. 64
Table 4.6 Strength: Percent Change by Question .......................................................... 64
Table 4.7 Magnitude, Strength, Computer Self-Efficacy: Percent Change Comparison .. 66
Table 4.8 t-Test: Two Sample Assuming Unequal Variances, Section 1........................ 67
Table 4.9 t-Test: Two Sample Assuming Unequal Variances, Section 2........................ 67
Table 4.10 t-Test: Two Sample Assuming Unequal Variances, Section 3...................... 68
Table 4.11 t-Test: Two Sample Assuming Unequal Variances, Section 4...................... 69
Table 4.12 t-Test: Two Sample Assuming Unequal Variances, Section 5...................... 70
Table 4.13 t-Test: Two Sample Assuming Unequal Variances, Section 6...................... 71
Table 5.1 Action Research Plan ..................................................................................... 84

x
LIST OF FIGURES
Figure 2.1 Model of Reciprocal Determinism ................................................................ 21
Figure 4.1 Sample of Computer Self-Efficacy Measure ................................................. 58

1
CHAPTER ONE
INTRODUCTION
The purpose of Chapter One: Introduction is to provide an overview of the present
action research study, which aimed to address the following research question:
What factors from social cognitive theory (cognitive, environmental, behavior)
influenced students’ self-efficacy with computer technology in an undergraduate
graphic arts course?
The present action research study involved the ways in which developed or
developing societies and nations require citizens to integrate technology into everyday
life and rise to the challenge of actively participating in the global digital World Wide
Web. This integration involves electronic transactions across fields of communication,
finance, research, transportation, education, and government (Petrina, 2000). The volume
of information is increasing at an accelerating pace, adding to databases, search engines,
libraries, and other resources as technological innovations continually arrive at homes,
schools, and places of employment. However, do these citizens feel efficacious in
actually using and integrating technology within everyday lives and professions? To
answer this overarching question, the present action research study focused on and the
researcher-participant investigated undergraduate students at the University of South
Carolina who are involved in a visual arts computing course from 2012 to 2013.
2
In 2008, the Cooperative Institutional Research Program (CIRP) reported 40% of
incoming first-year university students nationwide self-reported abilities of above
average or in the highest 10% in computer skills. Madigan, Goodfellow, and Stone
(2007) surveyed first year students at a large university and reveal “students are actually
less skilled than they perceive” (p. 413). First year college students are presumed to be
technologically advanced and possess high computer self-efficacy, however in reality
introductory skills are weak (2007).
Technology elevates education by increasing control and access to support
individual potential. Through educational tools and software, learners can be tracked
through metrics and assessments customized from independent needs (Collins, 2009).
These educational technologies may be visual, oral, or computer-based, with portability
options through an array of devices. These advanced instruments collect rich data which
can inform decisions involving students, educators, administrators, professionals, and
business people.
Bandura’s Social Cognitive Theory
How efficacious do visual art students feel when it comes to utilizing and
integrating technology? The present study was based on the work of psychologist Albert
Bandura (1986; 1991; 1997) who asked questions regarding the human power to steer
personal choices in education and life. Bandura argued efficacy acts as the gatekeeper
for every individual educational journey and progress is moderately dependent on unique
conscious self-assessments. Skills are the acquisition of knowledge, facts, and processes
independent from self-efficacy, which is what an individual believes can be accomplished
with those skills.
3
Self-efficacy is rooted in social cognitive theory, a concept involving three major
classes of interactive determinants: cognitive and personal factors, behavior, and
environment. Cognitive and personal factors include beliefs, values, outlook, and lessons
learned from triumphs and failures. Behavior is built from continuous interactions and
reactions, individual experience, and noticing the behavior of others. The environmental
components include tangible habitats as well as what people, culture, and atmosphere
exist inside.
Cognition, behavior, and environment function “interactively as determinants of
each other” in a cycle of reciprocal determinism (Bandura, 1986, p. 23). Therefore,
thoughts and feelings lead to behaviors and attract people to specific locations; a student
interested in drawing may enroll in an art course. An efficacious student may enroll in a
particular course expecting success. Environment has the potential to shape behavior
when the efficacious student realizes personal shortcomings, struggles in the class, and
changes the level of effort. Finally, surroundings can alter behavior when the course is in
the evening hours and the student is a morning person.
It is evident movement in one part of the triad influences the other components
with returned effort, but not necessarily at the same time or with equal strength (Bandura,
1986). A person trying to lose weight fails with cognition alone because behavioral
changes, such as exercise and monitoring the environment are crucial pieces. Experience
in the form of unhealthy habits, may impact effort when a person with an eating disorder
attempts to lose weight with distinct environment, cognitive, and behavioral challenges.
The present study was based within the work of social cognitive theory (Bandura
1986; 1991; 1993) and argues learners who aim to think individually, understand, and
guide their own educational experience identify as more efficacious. This base and

4
framework contends traditional one-sided classroom environments do not engage learners
or allow independent thinking and therefore fail to maximize the educational experience.
Freire (1970) described this as the “banking concept of education,” where students are
empty accounts and simply receive what the teacher deposits (p. 72). Dewey (1933)
indicated collecting facts and data alone does not develop learning habits, a deeper thirst
for continued knowledge, or the motive to be an active participant in society (Dewey,
1933). Bandura (1986; 1991; 1993) discussed social cognitive theory and self-regulation,
the process of empowerment through concentrating attention on efforts and directing
efforts towards set goals.
The participant-researcher of the present study advocated democratic classroom
methods fostering the growth of self-efficacy and empowering the student during GSA.
Bandura (1991) stated experience as the most powerful influence on self-efficacy and the
course structure provides substantial time for interaction with the graphic software,
Adobe Photoshop. The course met for 2 hrs 45 min twice a week and the computer lab
classroom was available for extra time. Independent work time was encouraged and
students worked at various paces and made decisions about what projects to concentrate
on. The projects allowed the students a lot of creative freedom and expression. The
student voice was essential to individual progress and was treated with value and worth,
observing and encouraging self-examination, promotion, and self-efficacy.
Compeau and Higgins Scale
The present action research study was not only based on Bandura’s social
cognitive theory and self-efficacy, but also on a scale designed to measure computer self-
efficacy. Computer self-efficacy is defined as where self-efficacy, technology, and
education intersect and consider “a judgment of one’s capability to use a computer”

5
(Compeau & Higgins, 1995b, p. 192). In the present action research study, the
participant-researcher identified low computer self-efficacy in undergraduate students
during graphics skills acquisition (GSA). Evidence of low computer self-efficacy was
identified through observation and reflective entries, then the participant-researcher
explored options to potentially assist the students.
The Compeau and Higgins’s (1995b) Scale was used by the participant-researcher
to determine if GSA impacted the participants’ computer self-efficacy. The participant-
researcher chose this particular scale since previous research suggests a positive
relationship between GSA and computer self-efficacy in preservice teachers (Chu, 2003),
military trainees (Downey & Zeltmann, 2009), and non-traditional students (Hasan,
2003). These students were similar to the group of participants in the present study. In
particular, the present study examined 120 undergraduates enrolled in six sections of the
Visual Arts Computing Course at the University of South Carolina over the years 2012 -
2013.
Statement of the Problem
Karsten and Schmidt (2008) report college students have low computer self-
efficacy; the participant-researcher in the present study identified low computer self-
efficacy in her college students. This problem was identified through observation and
reflective writings of some undergraduate art students enrolled in the Course: Visual Arts
Computing at USC. This Course focused on learning foundational art and graphic design
concepts through projects created with the graphics software, Adobe Photoshop.
The participant-researcher of the present action research study identified the
problem through observation and journal entries where her students in her Visual Arts
Computing course at USC reported on progress and if any material was unclear. For

6
example, one student expressed concern with the pace of the instruction and memory,
stating difficulty with working quickly enough or remembering the steps to complete a
task. Another student shared feelings of confusion and struggle with the graphic software.
This feedback prompted the participant-researcher to explore options to
potentially assist the students. A lack of computer self-efficacy negatively impacts the
will to pursue difficult tasks and persist, both important to academic achievement
(Bandura, 1977, 1997; Torkzadeh & Van Dyke, 2002). Computer self-efficacy has been
shown to have a significant, positive relationship with academic self-efficacy (Jan, 2015).
Venkatesh and Davis (1996) discussed the need to design effective training in an
effort to improve user acceptance and computer self-efficacy. The research utilized the
Compeau and Higgins (1995b) computer self-efficacy scale at two different points in
time to determine if changes occurred in undergraduate students enrolled in an
introductory systems course. Following Venkatesh and Davis (1996), the participant-
researcher of the present action research study began using this scale at the beginning and
end of each semester from 2012-2013 to investigate the relationship between GSA and
computer self-efficacy in her students. The participant-researcher of the present action
research study examined six sections of the course with an average of 20 students in each
section, totaling 120 participants.
Justification for the Study
Individuals with higher computer self-efficacy have less anxiety, more
confidence, and increased positivity when interacting with technology (Conrad & Munro,
2008; Morris & Thrasher, 2009). These benefits can influence everything connected to
technology including academic student achievement, workplace productivity, personal
efficiency, and life occurrences in a gratifying way. This supports a need to develop and

7
raise computer self-efficacy to foster engaged, curious, independent, and confident digital
citizens.
Computer self-efficacy has the potential to be strengthened through experience
and training, (Cassidy & Eachus, 2002; Chu, 2003; Brinkerhoff, 2006; Beas & Salanova,
2006) especially if the participant sees the relevance and connects the new knowledge to
future success (Albion, 2001). Early research in this field is rooted in business,
originating from researchers in the 1970s noticing resistance to new machines and then
attempting to identify what components drive a person to adopt or reject technology
(Compeau & Higgins, 1995b). This background prompted focused research on business
applications and often suites of programs including graphics or presentation software.
Studies on these suites indicated a significant positive relationship between graphics and
presentation software and computer self-efficacy (Chu, 2003; Downey & Zeltmann,
2009; Hasan, 2003).
Individuals often have less experience with graphics software and Bandura (1986)
noted challenging and unfamiliar tasks have the strongest influence self-efficacy.
Productivity software is often taught first, such as word processing software so
individuals understand the basics before moving to more advanced software. The nature
of art and design is interdisciplinary and activates thinking skills in visual drawing,
planning and drafting, math, and computer science (Ettinger, 1988). Graphics have the
potential to form and increase computer self-efficacy and trainers and educators should
provide more opportunities for interactions with this area of study (Busch 1995; Hasan
2003). This earlier research found connections between graphics and computer self-
efficacy using standard graphic software, such as Microsoft PowerPoint. The present
study was concentrated the advanced graphics program, Adobe Photoshop, a

8
comprehensive and powerful graphics program considered the industry standard for
image manipulation (Clawson, 2015; Cookman, 2003).
Action Research Methodology
The present action research study is a systematic inquiry designed to gain
knowledge about a singular situation (Mertler, 2013). Undergraduate students enrolled in
the course, Visual Arts Computing at the University of South Carolina were studied.
Data from the Compeau and Higgins (1995b) computer self-efficacy scale were analyzed.
The participant-researcher of the present action research study was also the
instructor of the visual graphics computing courses at USC and the 120 undergraduate
students who were examined. Mertler (2013) states an action research approach is
commonly used in educational research and provides the opportunity to preserve the
actions of real events. The participant-researcher administered the Compeau and Higgins
(1995b) scale in 2012 after identifying low computer self-efficacy through observing and
reflective writings for two years.
The participant-researcher of the present action research study used the ten item
scale designed by Compeau and Higgins (1995b) based on social cognitive theory and
computer self-efficacy. The first part of each question asked respondents in the present
action research study to anticipate abilities on a computer task through a fictitious
scenario, reading “I could complete the job using the software package… […if I had…].”
The second part involved participants completing the sentence with options for support
such as the software manual, additional time, and human assistance. Participants
indicated personal level of confidence based on the varying degrees of support and what
would be more helpful (see Appendix A). The Scale is also designed to push the

9
participants to consider future behavior as opposed to prior past proficiencies (Bandura,
1986; Compeau & Higgins, 1995b).
The data for the present study collected from the Computer Self-Efficacy Scale
was examined using Microsoft Excel and the Statistical Package for the Social Sciences
(SPSS). The present action research study used a single group pretest posttest design.
Data was analyzed using a paired sample t-test conducted to compare the change between
pre-post scores of the computer self-efficacy scale. Six sections of the course were
analyzed to verify results and recognize trends within the local and particular student
population studied.
Research Question
What factors from social cognitive theory (cognitive, environmental, behavior)
influenced students’ self-efficacy with computer technology in an undergraduate
graphic arts course?
Purposes of the Study
The primary purpose of the present action research study was to investigate if the
use of graphics software impacts computer self-efficacy as previous research suggests
(Chu, 2003; Downey & Zeltmann, 2009; Hasan, 2003). Factors influencing computer
self-efficacy during graphic skills acquisition were identified by the participant-
researcher from Bandura’s Social Cognitive Theory (i.e., cognitive, environmental,
behavior factors).
The secondary purpose of the study was to recognize trends within the local and
particular student population studied since individuals with higher computer self-efficacy
have less anxiety, more confidence, and increased positivity when interacting with
technology (Conrad & Munro, 2008; Morris & Thrasher, 2009). The tertiary purpose of

10
the study was to report on the advanced graphics program, Adobe Photoshop. This
comprehensive program is considered the industry standard for image manipulation
(Clawson, 2015; Cookman, 2003). The final purpose is to report the results of the
Compeau and Higgins (1995b) computer self-efficacy scale used to determine the factors
which influenced computer self-efficacy with the 120 undergraduates.
Additional Theory
In previous research, Chu (2003) found frequent use of computer graphics and
presentation software to be a strong predictor of computer self-efficacy. Downey and
Zeltmann (2009) researched the relationship between six different software packages and
computer self-efficacy. Results showed a strong correlation with graphics presentation
software (Microsoft PowerPoint) and the high competency group, which also had higher
computer self-efficacy. Hasan (2003) investigated specific types of computer experience
and found a significant positive relationship between individuals with graphics
applications experience and computer self-efficacy beliefs.
These positive connections between graphics and computer self-efficacy support a
need to increase experience with graphics software to raise computer self-efficacy.
Research shows users report the least amount of experience with graphics software
compared to other applications (Hasan 2003; Wilfong 2006). Bandura (1986) stated new
and intriguing tasks are the most influential on self-efficacy. Focused inquiry on an
advanced graphics program, specifically Adobe Photoshop, has not been examined and
the present study intended to give attention to this under researched area.
Definitions of Terms
The following definitions are for the purposes of this study:

11
1. Art Studio: This is an area of study within the Art Department at the University
of South Carolina encompassing the making of art in a studio setting. Graphic
design, computer graphics, photography, ceramics, painting, and illustration are
included in art studio. Art studio classes typically meet for longer class period
because the intent is to have studio resources to work with in an extended time
frame. Additional areas of study in art may include art history, media arts, and art
education (Art Department, 2016).
2. Computer self-efficacy: “A judgment of one’s capability to use a computer”
(Compeau & Higgins, 1995b, p. 192).
3. Graphics: An image created or edited through using a computer. Graphics
software may refer to a generic program included with the computer, within an
application suite (Microsoft PowerPoint), or an independent application. The
present study researched an advance graphics program called Adobe Photoshop,
this may be installed as part of the Adobe suite.
4. Self-Efficacy: A psychological term referring to an individual’s belief in
personal abilities. “Expectations of personal efficacy determine whether coping
behavior will be initiated, how much effort will be expended, and how long it will
be sustained in the face of obstacles and aversive experiences” (Bandura, 1977, p.
191).
Researcher’s Positionality
The participant-researcher of the action research study was also the instructor in
the courses examined between 2012 -2013. As the participant-researcher, my underlying
assumption is individuals, educators, and trainers should enhance and improve computer
self-efficacy. This assumption implies people strive to be active and engaged in a
12
technological environment and as part of a global digital citizenry also known as the
World Wide Web. The participant-researcher assumes students are honest in answering
the questions on the Computer Self-Efficacy Scale developed by Compeau and Higgins
(1995b). The participant-researcher also assumes the majority of the 120 undergraduate
students who participated in the present action research study desire a democratic
classroom where students strive for ownership and yearn to be more than spectators in the
learning process while increasing self-efficacy in computer technology.
As the participant-researcher in the present action research study, I considered my
insider/outsider status in regards to position, power, and knowledge construction
(Merriam, et al., 2001). My insider access allowed me to reach my community of
graphic arts students and create a dialog about the subject matter; as a former graphic arts
student myself, this was very rewarding. I believe my own computer self-efficacy,
graphic arts, and Adobe Photoshop experience worked as positive modeling for the
students. I strived to create an open, safe, classroom environment where students were
encouraged to ask questions and experiment.
My outsider professor status clearly marked me as authoritative, non-peer, and
other. These undergraduate students often remarked about my vast knowledge of Adobe
Photoshop and often voiced frustration about never reaching my level of expertise. As an
outsider, I was considered the expert who everything comes easy to. The considerable
age difference between myself and these student participants also confirmed my outsider
status.
I was comfortable switching between insider and outsider positions because it
gave me great insight from within and perspective from afar. As the participant-
researcher, I often reflected on my position through the research process and remembered

13
the present action research represents only one local and particular situation in one local
and particular course. I aimed to report accurate data not altered or filtered through my
personal lens and to minimize participant-researcher bias.
The participant-researcher of the present action research study considered ethical
issues and the special needs of the population being studied. Individuals in the present
study were treated with respect and participation in class activities were encouraged. The
surveys were not required for the class and data collected was used for feedback, not for
any grading. This action research was reviewed by the USC Institutional Research Board
(IRB) and exempt from human subject research.
All research may be impacted by additional independent variables, potentially
altering the dependent variable (Johnson & Christensen, 2000). In the present action
research study, the 120 undergraduate student respondents engaged in other technology
interactions, which may have possibly altered computer self-efficacy. To maximize
validity all responses occur in a formal classroom instruction setting. The Compeau and
Higgins (1995b) computer self-efficacy scale was distributed, completed, and collected
immediately and then stored in a secure location.
Limitations
The present research study was limited to one course over six different sections of
the course in 2012 and 2013 in the Art Department at the University of South Carolina.
Undergraduate student participants were the research subjects and the participant-
researcher was the professor of record for the course in each section offered between
2012 and 2013. Therefore, a limitation of the present study involves this select group of
students who were aware of completing a task for an authority figure (the participant-
researcher) responsible for reporting the final grade in the course.

14
Participants enrolling in a graphics course may have a more positive attitude
about the subject matter and could have previous experience with photography,
journalism and school newspapers, altering individual perspective and computer self-
efficacy (Cookman, 2015). The course involved learning foundational art and graphic
design concepts through projects created with the graphics software, Adobe Photoshop.
Research on one software package is also a limitation of the present study. In addition,
all data is collected in evening courses and this may impact results if individual cognitive
resources are depleted late in the day.
Scope
The present action research study aimed to determine what factors originating
from social cognitive theory influence computer self-efficacy during graphics skills
acquisition by using the Compeau and Higgins (1995b) scale. Student-participants were
undergraduate students enrolled in a graphic arts course at the University of South
Carolina. Results found from the present action research study regarding the relationship
of the students’ skills development to computer self-efficacy can recognize trends within
the local and particular student population studied.
Significance of the Study
The present study describes a local and particular graphic arts course in higher
education and identifies what factors influenced the development of computer self-
efficacy in 120 student-participants. The present study examined computer self-efficacy
in undergraduate students enrolled in the course, Visual Arts Computing at the University
of South Carolina.
Previous studies showing connections between GSA and computer self-efficacy
researched standard graphic software, such as Microsoft PowerPoint (Downey &

15
Zeltmann, 2009; Hasan, 2003). The present study involved focused inquiry on an
advanced graphics program, Adobe Photoshop. This comprehensive program is
considered the industry standard for image manipulation (Clawson, 2015; Cookman,
2003). Identifying factors influencing the development of computer self-efficacy can help
recognize trends within the local and particular student population studied. Increased
computer self-efficacy equals less anxiety, more confidence, and higher positivity when
interacting with technology (Conrad & Munro, 2008; Morris & Thrasher, 2009).
Knowledge Generation. Improving GSA and computer self-efficacy fosters
technological literacy so students can gain the knowledge necessary to find credible
information and learn. This is especially essential with the growing amount of data on
the Internet students need to identify, navigate through, and evaluate for validity. Digital
skills are also crucial for daily employment tasks, registering for a class, financial
management, and communicating inside and outside of work.
Professional Application. Society and educational institutions often assume a direct
correlation to youth and technology, however sometimes students inflate internal
technological knowledge. First year college students are “assumed to possess a high
degree of technological sophistication” when in reality individual introductory skills are
weak (Madigan, Goodfellow, & Stone, 2007, p. 410). This contributes to teachers and
trainers making assumptions about starting knowledge, forming irrelevant curriculum,
and reporting inaccurate results about what has been gained and achieved in the
environment. In contrast, teachers and trainers who can discern what factors influence
computer self-efficacy can be more prepared to teach and develop positive attitudes and
confidence (Oliver & Shapiro, 1993).

16
Understanding changes in computer self-efficacy can help moderate and guide
curriculum, adjusting for students with low and high levels. Oliver and Shapiro (1993)
proposed advanced tasks for those who are prepared and need extra stimulation while
providing encouraging activities for students who need support and direction. This
customized curriculum aligns with Dewey (1900; 1902; 1910; 1922; 1934) and Friere
(1970) through forming a learner centered atmosphere where students are involved
participants.
Businesses who hire recent graduates and working adults with high computer
self-efficacy could potentially save time and money on training in addition to becoming
more efficient and profitable (Morris & Thrasher, 2009). Prior knowledge about
computer self-efficacy of employees can supply organizations with an estimate of current
skills and how much training may be needed, both vital for resource and project planning
(Kher, Downey, Monk, 2013). Organizations will be able to understand more about what
workers are technologically capable of and formulate personal growth plans for
professional development. Developing computer self-efficacy for current workers is
worthwhile because employees are valuable human resources, a productive and
experienced group in an ongoing use content (Deng, Doll, & Truong, 2004). Individuals
are more engaged when training is found to be personally relevant and Albion (2001)
stated the training content needs to emphasize the importance of computers to accomplish
future successes.
Social Change. When computer self-efficacy grows, it builds a foundation for
confidence with technology and future successes, leading to expanded adoption of
information technology throughout schools and businesses. A person is more inclined to
do something achievable; Potosky (2002) asked “who is likely to learn to use computers

17
and new software [?] People who think they can” (p. 242). Expanding computer self-
efficacy fuels education and economic success as technology infuses communication,
finance, health care, transportation, academics, and business.
Increased computer self-efficacy can also assist in closing the digital divide, the
space separating those who have technology to use and learn from, with those who have
limited to no access (Servon & Nelson, 2001). Those with less experience have lower
computer self-efficacy and higher levels of anxiety about technology. Servon and Nelson
(2001) promote education through community technology centers, a location where
novice users can learn basic skills and build computer self-efficacy.
Findings of the Present Study
Findings include factors identified from Bandura’s social cognitive theory
involving:
1. Environmental: Independent Learning
2. Cognition: New and Unfamiliar Tasks
3. Behavior: Behavior Modeling
4. Environmental: Access to Support Materials, No Time Constraints
Summary
This present study identified factors and provided information to assist in
developing methods to foster and grow computer self-efficacy in a graphics context. An
important factor in modern society, computer self-efficacy contributes to constructive use
of information systems in educational and professional environments (Stephens, 2006).
The Compeau and Higgins (1995b) computer self-efficacy scale from several semesters
of a graphic arts course provide data for analyzing. Action research methods were

18
administered to answer the research question and generate knowledge. The research
showed based on the pre-and posttest scale, GSA has the potential to influence academic
student achievement, workplace productivity, and personal computer self-efficiency
outside of the Course.
Chapter One presented theoretical background and terminology while introducing
the problem, purpose, and research question. Chapter Two contains a detailed literature
review on the history of computer self-efficacy, the sources, and findings in previous
studies. Chapter Three is the methodology and includes information about the Action
Research, theoretical framework, participants, and data analysis. Chapter Four reports
the detailed results of the research and Chapter Five provides a summary discussion and
suggests areas for future research.

19
CHAPTER TWO
LITERATURE REVIEW
The purpose of Chapter Two: Literature Review is to describe the literature
associated with computer self-efficacy which influenced the present study. Information
presented here is used to address the following research question:
What factors from social cognitive theory (cognitive, environmental, behavior)
influenced students’ self-efficacy with computer technology in an undergraduate
graphic arts course?
The present study explored graphic skills acquisition as related to computer self-
efficacy over the academic years 2012-2013 in a graphic arts course with undergraduate
students at the University of South Carolina. The students were exposed to the program
Adobe Photoshop in the course. The sources of efficacy, early computer studies,
physiological states and methods of measurement are discussed in this Chapter Two
which also provides the context of the methodology and establishes the need for further
exploration into graphics and computer self-efficacy.
Problem Statement
The participant-researcher of the present action research study identified low
computer self-efficacy as a problem in her classroom. This problem was identified
through observation and journal entries of undergraduate students enrolled in her
graphics arts course. This prompted the participant-researcher to explore options

20
through action research methods to better her teaching and increase students’ computer
self-efficacy.
Previous research showed computer self-efficacy can be strengthened through
experience as well as training (Cassidy & Eachus, 2002; Chu, 2003; Brinkerhoff, 2006;
Beas & Salanova, 2006). Additional studies indicated a significant positive relationship
between graphics and computer self-efficacy (Chu, 2003; Downey & Zeltmann, 2009;
Hasan, 2003). The participant-researcher began to administer the Compeau and Higgins
(1995b) computer self-efficacy scale to gain knowledge for developing an action plan to
incorporate change and improve her teaching practice.
Purpose Statement
The purpose of the present action research is to describe the undergraduate
students’ self-efficacy in a computer graphic arts course. The secondary purpose is to
administer a scale developed by Compeau and Higgins (1995b) to align with Bandura’s
(1977) social cognitive theory. This scale considers the various determinants of social
cognitive theory (cognitive, behavior, environment) and two of the dimensions of self-
efficacy, magnitude (level) and strength.
Chapter Two also focuses on “experience,” the most influential source of
computer self-efficacy and also the most frequently studied. The research presented in
Chapter Two certified the power of experience and specifically examined confidence,
environment, emotion, and the relationship with different types of experience, including
graphics. Evidence in this literature review demonstrated the need for dedicated research
in the area of graphics and computer self-efficacy. Studies including graphics, reporting
intriguing findings, or calling for further exploration in this area are also discussed.

21
Social Cognitive Theory
Social cognitive theory examines human development including thought,
motivation, and action to steer life choices (Bandura, 1986). This theory proposes
individual behavior is not a pure result of static thoughts, instinctive responses, or
pressure from outside influences. Bandura (1986) explains social cognitive theory drives
people through three major classes of interactive determinants: cognitive or personal
factors, behavior, and environment.
Social cognitive theory arranges cognition, behavior, and environment into a
trinity known as the model of triadic reciprocality (see Figure 2.1, Bandura, 1986, 1997).
Cognitive and personal factors include beliefs, values, outlook, and lessons learned from
triumphs and failures. Behavior is built through individual continuous interactions, the
results of those actions, personal observations, and reflection. The environmental
components include tangible habitats as well as items and people who exist inside the
area.

22
The triad of cognition, behavior, and environment function “interactively as
determinants of each other” in a cycle of reciprocal determinism (Bandura, 1986, p. 23).
Thoughts and feelings lead to behaviors and draw people to specific locations, thus a
smoker may frequent a restaurant where smoking is permitted on the outside patio.
Environment has the potential to shape behavior when a child learns what is acceptable or
not satisfactory through family and region. Also, environment can alter behavior when a
talkative person enters a library or a quieter person attends a boisterous sporting event.
Bandura (1986) states movement in one part of the triad influences the other
components with returned effort, but not at the same time or with equal strength. A
person attempting weight loss will likely fail with cognition alone because behavioral
changes, such as exercise and monitoring the environment are crucial pieces. Experience
in the form of unhealthy habits, may impact effort when a person with an eating disorder
attempts to lose weight with distinct environment, cognitive, and behavioral challenges.
The triad of reciprocity grows with the principles of self-regulation, a
motivational process of observing, guiding, and shaping efforts to promote advancement
to desired goals. This self-regulation cycle creates constant review with an internal pulse
and the ability to strategize when necessary. Bandura describes this as an “ongoing
exercise of self-influence” (Bandura, 1991, p. 248).
Self-Efficacy
Self-efficacy is a component of social cognitive theory involving, “people’s
judgments of their capabilities to organize and execute courses of action required to attain
desired types of performances” (Bandura, 1986, p. 391). Bandura (1986) expresses self-
efficacy is not individual actions or abilities but rather what a person believes can be

23
accomplished with those attributes. Efforts will be met with resistance and failures and
those with strong self-efficacy will persevere.
Personal assessment of task ability determines self-efficacy while belief about the
task result is regarded as outcome expectation (Bandura, 1986, 1997). Decisions
concerning what to engage in and how committed an individual will be are made in
conjunction with self-efficacy (Compeau & Higgins, 1995b). Individuals guide thoughts
into believing “a given course of action will cause a given outcome (outcome
expectation), yet question whether or not they can carry out the action (efficacy)” (Oliver
& Shapiro, 1992, p. 82). For example, a person who considers herself a bad speaker
imagines delivering an incoherent presentation. People are more compelled to attempt an
activity if the outcomes have clear and positive benefits; the potential gains from the
outcomes could be material, sensory, token, or social (Bandura, 1986, 1997).
Efficacy dimensions. These individual evaluations of self-efficacy fluctuate by
level, strength, and generality (Bandura, 1986, 1997). Magnitude or level relates to how
hard a task is and if a person believes it can be accomplished. For instance, an individual
may feel intimidated by an arduous task but comfortable and confident with an easy task.
Each potential task is evaluated and judged therefore every assessment will vary in
strength. These evaluations are substantiated by positive and negative feedback from
experiences. Self-efficacy generality is rooted in situations and circumstances therefore
perceptions may not be transferrable.
Sources. Bandura (1977, 1997) identifies four primary sources for self-efficacy:
enactive experience, vicarious experience, verbal persuasion, and physiological state.
Enactive experiences (referred to as performance accomplishments in earlier work) are

24
developed through practice, succeeding and failing, on the way to mastery. Vicarious
experience shows individuals difficult things are possible through modeling; observing
successes in someone similar helps the person believe in personal abilities and future
achievements. Verbal persuasion through positive oral feedback encourages and
motivates people. Physiological states (emotional arousal in earlier work) are the
influence of feelings such as anxiety on self-efficacy.
Various factors can contribute to each source of self-efficacy, such as behavior
modeling to vicarious experience, suggestion to verbal persuasion, and attribution to
physiological states. Bandura (1977) advises contributing factors are not exclusive. For
example, relaxation as a source most likely contributes to self-efficacy through
physiological state. However, a relaxed state may strongly influence an experience.
Enactive/Vicarious experience. Enactive experiences are any activities directly
involving individuals through participation and learning through doing. These activities
have the most powerful impact on self-efficacy, built during triumphs and reduced when
facing defeats. Multiple negative exchanges can deflate positive beliefs efficiently
however instant abundant achievement produces high expectations and a presumption
such trend will continue. When experiencing several successes, inevitable failures can
surprise and confuse individuals who will withdraw and surrender responsively. Self-
efficacy requires cultivation through positive and negative experiences and the
recognition these do not have to paralyze progress. Perseverance is imperative to improve
self-efficacy and enable individuals to discover what can be accomplished with
maintained drive (Bandura, 1977).

25
Vicarious experience is acquired through indirect learning experiences such as
reading, observation, or modeling. These build self-efficacy for individuals because it
provides the opportunity to stay protected while witnessing model behavior free from
potential harm. Observation instead of participation is less reliable in generating self-
efficacy, yet spectators can view from a safe area and gain valuable knowledge about the
task and standard expectations (Bandura, 1997). The chief benefit of modeling is people
gain new perspectives on personal capabilities which previously had no reference for
comparison (Bandura, 1997; Bandura & Jourden, 1991; Wood, 1989).
Verbal persuasion. Verbal persuasion from others is a popular method of
increasing self-efficacy. Although simple and convenient to deliver, this approach may
not always be accepted by the recipients with reservations about personal abilities.
Bandura (1997) states the strongest contributor to self-efficacy is the authentic self, but
when additional people express confidence in someone it can help quell personal doubts.
A conflict arises when the individual dismisses the message shared because it challenges
personal negative and low beliefs about abilities. Great success can arrive from
reasonable and rational suggestions the person finds attainable and therefore accepts
(Bandura, 1997).
Physiological states. Physiological and affective states are the final and least
powerful source of self-efficacy; often occurring when difficult situations trigger and
breed anxiety, impacting abilities and self-confidence (Bandura, 1997). These
uncomfortable feelings often begin early in anticipation of the upcoming situation and the
powerful emotions commonly grow to a degree which surpasses the prompt. For
example, a person with social anxiety may build strong concerns and obsess for weeks

26
about an upcoming event. This may be similar to an athlete experiencing heightened pain
before an extremely competitive game. This preliminary behavior is likely to create more
anxiety than the occasion itself would warrant. Bandura (1997) states some physiological
states, although individualized and highly unique, can be moderated through stress
reduction, healthy lifestyle, and connections to others.
Effects. Self-efficacy gains more recognition as researchers realize the impact it
has on various situations including learning, careers, academics, and health. Bandura and
Schunk (1981) examine self-motivation and goal setting to report student “persistency
increased the likelihood of success” and self-efficacy worked like an omen for
achievement (p. 596). Several studies establish substantial positive relationships between
academic areas and self-efficacy (Multon & Brown, 1991; Schunk & Ertmer, 1990;
Wood & Locke, 1987).
Additional work examines behaviors such as weight management and states self-
efficacy is “an important mediating mechanism” (Clark, Abrams, & Niaura, 1991, p.
739). Research also discovers women with low self-efficacy neglect personal talents and
choose to not pursue potential career choices (Hackett & Betz, 1981). These studies are a
small representation of early self-efficacy studies. At this point it is evident self-efficacy
has tremendous power to impact personal choices.
Computer Self-Efficacy
The self-efficacy research of Bandura and others begins to be applied to
computers. Bandura (1978) defines self-efficacy as a “judgment of one’s ability to
execute a certain behavior pattern” (p. 240). Computer self-efficacy is defined as “a
judgment of one’s capability to use a computer” (Compeau & Higgins, 1995b, p. 192).

27
Self-efficacy involves making personal estimates about performance pertaining to future
events (Compeau, 1992). These judgments go beyond smaller “component acts” such as
how to start or shift a car and consider overall behavior or “generative capabilities” like
navigating difficult traffic (Bandura, 1986, p. 397). Similarly, computer self-efficacy is
not pertaining to an individual’s computer skills, but rather the power to collectively
utilize those skills to accomplish a task (Compeau, 1992).
Personal assessments of self-efficacy will vary by level, strength, and generality
(Bandura, 1986, 1997). A person appraises self-efficacy level by thinking about how
hard a task is and if it seems possible to accomplish it. Challenging tasks may intimidate
while easier tasks appear to be within reach and more achievable. Strength is formed
when possible tasks are evaluated and judged; these are substantiated by positive or
negative feedback and past experiences. Self-efficacy generality is rooted in situations
and circumstances, therefore perceptions may not be transferrable.
Self-efficacy is rooted in social cognitive theory, where cognitive, behavioral, and
environment determinants exist in an ongoing reciprocal relationship. This theory
proposes decisions and actions are not merely based on individual factors such as
knowledge, skills, and motivation but rather in conjunction with self-efficacy acting as
gatekeeper. Bandura (1977) claims “choice behavior and effort expenditure are governed
in part by percepts of self-efficacy rather than by a drive condition” (p. 203).
History. Computer self-efficacy has a strong base in business and management
information science (MIS) disciplines. “Understanding the factors that influence an
individual's use of information technology has been a goal of MIS research since the mid-
1970s, when organizations and researchers began to find the adoption of new technology

28
was not living up to expectations” (Compeau & Higgins, 1995b, p. 189). Any
information learned about why individuals accept or reject technology had the potential
to streamline processes and conserve capital where substantial amounts of money can be
invested into systems the users refuse to use (Venkatesh & Davis, 1996). For example,
research is conducted on assembly line workers (Rozell & Gardner, 1999), business
executives, and employees (Burkardt & Brass, 1990). Early research from prominent
computer self-efficacy researchers Compeau and Higgins (1995b, 1999) gather data from
subscribers of a business periodical.
Computer self-efficacy research also occurs in higher education environments.
Torkzadeh and Koufteros (1994) found an increase in computer self-efficacy post
training in undergraduates enrolled in an introductory computer course. Employees at
several large state universities (Gist, Schwoerer, & Rosen, 1989; Harrison & Rainer,
1992, 1997) and undergraduates in computer courses have been investigated to learn how
to enhance computer self-efficacy (Ertmer, Evenbeck, Cennamo, & Lehman, 1994;
Karsten & Roth, 1998). Undergraduates in business, education, nursing (Kinzie,
Delcourt, & Powers, 1994), psychology (Mitchell, Hopper, Daniels, George-Falvey, &
James. 1994), and graduate business students (Davis, Bagozzi, & Warshaw, 1989) were
also used as subjects in computer self-efficacy research. Undergraduates in an art or
graphics context are underrepresented in the research and the present study aimed to
address this gap.
General and task specific. Computer self-efficacy research primarily studies
general computer self-efficacy however there are other perspectives; selected
contributions related to the present study will be identified here. Marakas, Yi, and
29
Johnson (1998) introduce a division of computer self-efficacy into two categories. The
category of general computer self-efficacy (GCSE) is defined as spanning many
applications and is gathered over time. Task specific computer self-efficacy (TSE)
broadly encompasses an application (specific) or a particular work activity (task).
Agarwal, Sambamurthy, and Stair (2000) propose software-specific self-efficacy
(SSE), defined as a person’s “feeling of self-efficacy relative to a specific software
package” (p. 422). This construct asks subjects to demonstrate proficient and successful
use of specific features of software packages. Downey and McMurtrey (2006) introduce
summative general computer self-efficacy (SGCSE), which is task based and combines
results from “specific self-efficacies of computer activities” (p. 385). Subjects are asked
to evaluate personal capabilities over six sub-domains by agreeing or disagreeing with
statements like, “I believe I have the ability to cut, copy, and paste in a word processing
document” (Downey and McMurtrey, 2006, p. 393.). The results from these questions
about specific computer self-efficacy and used to form summative general computer self-
efficacy (SGCSE).
These constructs all support expanded computer experiences, which naturally
supplements general computer self-efficacy. The specific method is debated to be
essential for measuring the degree of self-efficacy as it correlates to a detailed task or
application, whereas general measures are considered crucial for generality and static
results (Torkzadeh, Chang, & Demirhan, 2006). Specific (SCSE) produces fast,
immediate results and advancement, while general (GCSE) develops gradually as overall
computing knowledge increases (Agarwal, 2000; Marakas, Yi, & Johnson, 1998).

30
Guinea and Webster (2011) report task self-efficacy affects computer self-
efficacy more if one operation is familiar and one is new. Personal assessment on a
specific task may be higher if the general software context is familiar. Conversely, the
general computer self-efficacy could also be higher if a computer task is recognized. If a
task or software package are new to a person, the individual will spend more time
analyzing and preparing skills before moving forward (Gist & Mitchell, 1992). With this
discovery Guinea and Webster (2011) recognized computer self-efficacy modifications
“do not occur in a vacuum, but in the context of a task” (p. 978). The present study
involved the graphics program Adobe Photoshop and how it impacts general computer
self-efficacy as defined by Compeau (1992). Data from the Compeau and Higgins
(1995b) computer self-efficacy scale, a general construct, will be analyzed.
Experience. Bandura (1977, 1997) states experience is the strongest source of
self-efficacy and it is widely studied in relation to computer self-efficacy. One of the
earliest studies finds consenting, novice users with little computer experience as fearful
and intimidated because the unfamiliar brings discomfort (Hill, Smith, & Mann, 1987).
Despite good intentions and a motivation to learn, results found students with low self-
efficacy were less likely to enroll in computer courses. These individuals are discouraged
when sensing a lack of control and inability to regain it. The research concludes
experience alone will not impact future individual computer usage, but rather efficacy
must be altered (Hill, Smith, & Mann, 1987).
Vicarious Experience. The concept of computer self-efficacy is also explored
through vicarious experience as Gist, Rosen, and Schwoerer (1988) study various training
methods to assist users with learning to work with computers and the growing amount of

31
technology in the workplace. Modeling achieved the greatest results and allowed users to
expand trust in personal potential. Bandura (1977) reported subjects achieved higher
skill development through modeling than other techniques; modeling also benefitted
people who started with high self-efficacy. Training incorporating behavior modeling is
shown to influence computer self-efficacy more than traditional lecture methods (Moos
& Azevedo, 2009).
Types and time. The dynamic relationship between experience and self-efficacy is
affected by the type, time, and variety of exposure. An assortment of software
experiences produces a positive relationship with computer self-efficacy (Cassidy &
Eachus, 2002; Chu, 2003). Acquiring a high quality and wide variety of skills promotes
liking, and people who devote more time to computers identify as more knowledgeable
(Beckers & Schmidt, 2003). The nature of computer self-efficacy is alive and active,
requiring nourishment and reinforcement through technical participation.
One recommendation encourages a prescription of more than three computer
training courses, each covering a separate software application to increase computer self-
efficacy (Havelka, 2003). As expected, more computer courses also contributed to higher
computer self-efficacy, especially classes covering spreadsheets and databases (Albion,
2001). The work of Johnson (2005) agreed, it proved users with database software
experience have higher application specific computer self-efficacy. Students who
reported more hours per week of total computer use had higher computer self-efficacy
(Albion, 2001).
Salanova, Grau, and Llorens (2000) study workers at five different companies and
report a positive relationship between computer use times and computer self-efficacy.

32
The high efficacy group also exhibited low levels of burnout or disinterest in work; this
supports the connection between self-efficacy, confidence and perseverance. Havelka
(2003) researches the impact of years of usage, computer courses, and number of
software or packages or programming languages learned. Results suggest a positive
correlation between years and software self-efficacy with the largest positive correlation
in computer self-efficacy between participants reporting over five years of experience.
Kher, Downey, and Monk (2013) conduct a longitudinal investigation to determine
how long training needs to be in order to increase computer self-efficacy. This research
learned the ideal length of training is two and half months noting the nonlinear growth
process is slow to start with the biggest change occurring in the last half of the time
period. After about two months computer self-efficacy had improved and any additional
time beyond allowed for the benefits to be applied (Kher, Downey, & Monk, 2013).
Brinkerhoff (2006) attributes substantial growth to the longer format of a structured
technology academy where participation included instruction, projects, and exercises.
The surveys in the present study were given at the beginning and end of a semester
spanning approximately 15 weeks (3 months and a half months).
Karsten and Schmidt (2008) report over 80% of business students use a computer
daily, but increased usage did not translate into higher computer self-efficacy when
compared to previous years. This may be attributed to students using computers more
often and for greater purposes in the most recent years. Expanded use includes
communication through email, expanded online offerings in content, news, social media,
and services such as online banking and shopping. However this increased usage did not
produce higher levels of general computer self-efficacy, perhaps because those tasks are

33
not challenging and merely demand “repetitive use of a limited range of skills, primarily
entering text” (Karsten & Schmidt, 2008, p. 449). This supports a premise from Bandura
(1986) stating self-efficacy is significantly altered through challenging and unfamiliar
tasks, expanding user perspective.
Home possession. Hours of total computer use time is also influenced by home
possession, usage is likely to increase if computers are easily accessible and in close
proximity (Albion, 2001). Home access as part of a supportive family and educational
atmosphere has a strong connection to computer use (Hsu & Huange, 2006). Cassidy and
Eachus (2002) presented additional support for computer ownership and total software
programs acquainted with and both in positive alignment with computer self-efficacy.
Bauer (2003) substantiates the powerful associations between computer self-efficacy and
usage hours, reported ubiquitous experience, and the number of software programs used.
The present study involved significant computer use time, the class meets in the evenings
two times a week and each session is 2 hours and 45 minutes.
Environment. Users identify the most desirable environment as supportive,
casual, and subdued, with skilled assistance available (Beckers & Schmidt, 2003). A
positive, encouraging, “non-threatening” atmosphere fosters extended confidence in
computer self-efficacy and propels individuals to overcome obstacles (Bandura, 1986;
Ertmer, Evenbeck, & Cennamo, 1994, p. 58). Success breeds confidence, while defeat
creates perennial negativity, especially if the deficiency happens at the beginning of the
experience (Bandura, 1977). Additional research reveals self-efficacy derived from
computer experience is most influenced by pertinent encounters centered on “quality
rather than quantity” (Ertmer et. al, 1994, p. 58; Karsten, 1998).

34
Positive conditions and experiences connect and cycle to form a sustained
sequence of healthy, hopeful general computer instincts and beliefs. These broad
computer opinions anticipate understanding and comfort level of an application more
than the time spent working on the same software (Venkatesh, 2000). This occurs in part
because increased self-efficacy beliefs create relaxed, secure working conditions by
reducing anxiety and anger; a light, playful atmosphere fosters experimentation free from
harsh consequences (Potosky, 2002; Wilfong, 2006). Bandura (1977) concurs people are
prone to believe it is possible to achieve favorable outcomes when there are no feelings
of strain or anxiety. Therefore a steady, calm environment fosters a pleasant, assured
temperament, leads users to expand personal possibilities and potential.
Emotion. Agarwal and Karahanna (2000) call for a more holistic approach to
technology interactions to foster intrinsic motivation, richer participation, and encourage
an atmosphere of play. Potosky (2002) shows users who are playful during training
instruction demonstrated the greatest efficacy after the workshop was completed.
Compeau and Higgins (1995a) also mention the power of physiological states on
performance, for instance participants can see the tasks as enjoyable and associate those
tasks with play.
Additional research by Webster and Martocchio (1992) establishes a positive
relationship between computer self-efficacy and playfulness. Motivation can act as a
gatekeeper for self-efficacy, permitting only what the individual deems as enjoyable or
pertinent to the personal mission (Deng, Doll, & Truong, 2004). It is also possible
individuals enter into a certain state of mind or ‘flow,’ as a result of being fully immersed
in the work (Csikszentmihalyi, 1990). Agreeable interactions nurture acceptance and

35
can develop into a positive attitude towards computers, suggesting each individual point
of view about computers is actually a “self-fulfilling prophecy” (Rozell & Gardner,
1999). Computers can function as a Rorschach inkblot test, where deep rooted past ideas
and experiences surface and heavily impact the present (Turkle, 1980).
Psychological states can alter attitudes about technology, for example a positive
state of mind can evoke confidence, increase self-efficacy and decrease computer anxiety
(Beas & Salanova, 2006; Conrad & Munro, 2008). Individuals with high self-efficacy
were more frequent computer users, and experienced less anxiety Compeau & Higgins,
1995b). Personalities with negative tendencies may feel less in control and be quick to
blame others for failures but self-efficacy has the power to regulate anxiety and as
knowledge grows, anger and anxiety are reduced (Johnson, 2005; Kay, 2008; Saade &
Kira, 2009). Intrinsic motivation, curiosity, and positive attitude all positively impact
computer self-efficacy (Moos & Azevedo, 2009).
Rozell (2000) utilizes Seligman’s causal attribution studies to conclude optimists
envision success and are more apt to persevere when encountering technical issues.
Situations prompt positive or negative reactions based on self-efficacy and can generate
an inner conflict equal to the outer condition (Bessière, Newhagen, Robinson, &
Shneiderman, 2006). This can create a competition and fight for control between the
individual and the computer, similar to winning or losing a game.
State of mind and self-assessment of capabilities contain the power to either steer
a user toward a positive outcome or to sabotage it. Beckers and Schmidt (2001) express
“emotion influences beliefs” instead of the reverse, confirming actions are led by feelings
(p. 46). Humans are subjective, and maintaining a conscious awareness of attitude is

36
difficult to achieve. Deng, Doll, and Truong (2004) discover intrinsic motivation
indirectly connects computer self-efficacy and effective application use, working as a
catalyst for determination. Conviction collaborates with attention, prolonged attempts,
dedication, and action to create a platform to achievement. Efforts lead to achievements
and the outcome is celebrated, intensifying self-efficacy and intrinsic motivation.
Kim, H. Chan, and Y. Chan (2007) investigate how thoughts and feelings effect
decisions to continue, delay, or abandon technology usage. This research describes
technology users as active service customers and analyzes attitude, beliefs, and possible
and emotional gains of these users. The results report the largest influence on continued
use is pleasure, formed from responses including happy, pleased, and satisfied. Arousal
ranks second, linking to excitement and stimulation; usefulness places third, attached to
task completion and saving time.
Resource allocation. Experiences build familiarity and comfort while preparing
the brain to connect and construct advanced knowledge by shifting resource allocation.
The process of learning new information entails laborious, concentrated, beginning stages
where “few spare resources [exist during] skill acquisition,” however as experience and
ability grow, tasks become automated and use fewer cognitive resources (Hackbarth,
Grover, & Yi, 2003; Kanfer & Ackerman, 1989, p. 687). Technical, detailed steps
transform into instinctive, undemanding processes individuals promptly master creating
forward momentum and a confident environment for efficient learning at a faster, higher
level. Technology interactions allow individuals to develop abilities through usage and
practice until identifying technology structures is increasingly effortless (Hackbarth,
Grover, & Yi, 2003).

37
Changes over time. Bhattacherjee and Premkumar (2004) present user attitudes
and beliefs as dynamic results of current and past experiences, focusing on the under-
researched area of “temporal changes” occurring during the course of usage (p. 230).
Bhattacherjee (2001) suggests favorable outcomes are contingent upon “continued use
rather than first-time use” (p. 342). Technology resources have to extend beyond the
initial activities to provide value and established usage after adoption is essential is
essential to affirm mastery (Hackbarth, Grover, & Yi, 2003; Kim, H. Chan, & Y. Chan,
2007).
Survey data acquired one year apart shows the relationship between self-efficacy
and computers does not have an expiration date as the results continue to provide
valuable and accurate predictions (Compeau, Higgins, & Huff, 1999). Venkatesh and
Davis (1996) collect computer self-efficacy measures at different points in time and
confirm efficacy did not change. This is problematic as individuals are inclined to “form
and hold stronger computer self-efficacy beliefs, both positive and negative” (p. 473).
There is evidence to suggest adoption may stem from human or organizational pressure
but continued utilization is grounded exclusively in beliefs (Karahanna, Straub, &
Chervany, 1999).
Computer Self-Efficacy Scale
Methods to measure computer self-efficacy develop in the late 1980s and early
1990s. These first studies utilize questionnaires to inquire about individual levels of
comfort with software and tasks, working styles, the benefits of computer education, and
future plans to purchase or use computers (Gist, Rosen, and Schwoerer, 1988; Hill,
Smith, & Mann, 1987). Several researchers also work with computer instructors to

38
develop scales from the literature to target confidence (Davis, Bagozzi, & Warshaw,
1989; Murphy, Coover, & Owen, 1989).
Compeau (1992) examined how self-efficacy impacted computing, researched
these established scales, and started to formulate her own measure. Compeau critiqued
existing scales and noted her construct aims to stay authentic to Bandura’s social
cognitive theory. (1986, 1987). This is achieved through applying the three determinants
of social cognitive theory, cognition, behavior, and environment; as well two dimensions
of self-efficacy, magnitude (or level) and strength. The scale does not directly measure
generality, the third dimension of self-efficacy. The initial work on forming the scale is
part of Compeau’s (1992) dissertation with chief advisor, Dr. Chris Higgins.
The Compeau and Higgins (1995b) computer self-efficacy scale is published
several years later. The authors define self-efficacy as “the belief that one has the
capability to perform a particular behavior,” and determine computer self-efficacy
pertains to the “judgment of one’s capability to use a computer” (Compeau & Higgins,
1995b, p. 189, p. 192). The Compeau and Higgins (1995b) scale develops into a leading
measurement in computer self-efficacy research and is widely adopted in various forms
for numerous projects (Agarwal & Karahanna, 2000; Chu, 2003; Downey & Zeltmann,
2009; Hasan, 2003; Huffman, Whetten, & Huffman, 2013; Jan, 2015).
Social Cognitive Theory Determinants. The Compeau and Higgins (1995b) scale
applies social cognitive theory to computer self-efficacy. The questions asked relate to
the determinants, cognition, behavior, and environment. The instrument contains ten
items and the first part of each question asks respondents to anticipate abilities on a
computer task through a fictitious scenario. The first part is “I could complete the job

39
using the software package… […if I had…]” (Compeau & Higgins, 1995a, p. 140). The
second part completes the sentence with options for support such as the software manual,
additional time, and human assistance. Next the individual ranks the varying degrees of
support by what would be most helpful (see Appendix A). The scale is designed to push
the subjects to consider future behavior and efficacy as opposed to prior proficiencies
(Bandura, 1986; Compeau & Higgins, 1995b).
Self-Efficacy Dimensions. The Compeau and Higgins (1995b) scale incorporates
two dimensions of self-efficacy, magnitude (or level) and strength. Magnitude or level is
defined as “the level of task difficulty one believes is attainable” (p. 192). The scale
measured magnitude by counting the number of yes or no responses to the ten questions.
Bandura (1977) states magnitude becomes apparent when a person decides what is
personally achievable from a list of tasks. An individual with a higher magnitude of self-
efficacy can envision completing a challenging task while those with lower magnitude
may only picture success.
The second element of self-efficacy is strength, the “level of conviction about the
judgment” and is scored through the number rating for each question (Compeau &
Higgins, p. 192). The person with a low degree of strength lives on an unstable
foundation easy to diminish; higher strength creates a firm base and is more likely to
persist in challenging circumstances. Perceptions of strength are substantiated by
positive or negative feedback and experiences.
Graphics
Graphics include digital images created entirely within computer software or just
edited using computer software and tools. Images are widely used across many

40
disciplines and so are graphics, visuals are often produced to communicate messages in
business. Often these graphics are in the form of low to medium quality when a part of
presentation software. In news, marketing and advertising images are of higher quality
for mass production and high profile campaigns. Medical imaging is excellent quality
too as precision and measurement are paramount.
Early graphics included with computers were simple and now imaging is more
advanced with the Adobe Photoshop software. Image manipulation used to be limited to
shapes, objects, or color however Adobe Photoshop gives users the power to edit images
by individual pixels. This comprehensive program is considered the industry standard for
image manipulation (Clawson, 2015; Cookman, 2003). Additional software exist for
developing page layout, logo creation, and website design. There are some intersections
between those programs and Adobe Photoshop, but Photoshop is primarily for digital
imaging and creating graphics. The present study examined graphics and computer self-
efficacy through the discipline of art and management information science (MIS).
In the field of graphics arts, Nielsen, Fleming, and Kumarasuriyar (2010) attempt
to improve student self-efficacy in a digital communications course by restructuring it to
mandate additional technology and digital software tools. The instructor changed the
behavior of students by mandating these tools and the course outcomes showed
improvement in student satisfaction, course completion, and an increase in grades. These
positive outcomes signify the need to expand opportunities for graphics interactions,
especially in curriculum and training environments (Busch 1995; Hasan 2003).
One graphics instructor reports technology deficiencies in students “complicate
instruction” and hinder communication because many “concepts and terms are alien”

41
(Koning, 2012, p. 82). This instructor alters behavior through customized course
software, streamlining difficult technical processes for the students. This change releases
cognitive resources in the students and redirects it to the more creative aspects of the
project.
Additional studies related to art and graphics stress the positive environment and
peer support. Stokrocki (1986) reports prominent technical support issues but students
praised the playful moments and encouraging teacher. Freedman and Relan (1992)
research computer graphics and social processes to show how peer interaction is crucial
to aesthetic choices
In business environments, applications including word processing, spreadsheet,
and database software are frequently analyzed in connection to computer self-efficacy
(Busch 1995; Compeau & Higgins, 1995a; Kinzie, Delcourt, & Powers, 1994; Rozell &
Gardner, 1999). Computer self-efficacy and graphics are under researched. Torkzadeh
and Koufteros (1994) do mention graphics in a listing of other microcomputer
applications, plausibly referring to presentation software (Microsoft PowerPoint) part of
the suite.
Studies analyzing the impact of various computer applications on computer self-
efficacy have shown experience with graphics tasks and software to have powerful
effects. Hasan (2003) explores computer experience through eight types of specific
software. Results show standard applications such as word processing yielded negligible
change, but experience with graphics and programming generated the greatest
advancement in computer self-efficacy.

42
Graphics programs are frequently used less than other applications and are
considered advanced, demanding applications requiring users to stretch skills beyond
basic, typical usage. Participants report the least amount of experience with graphics yet
it is found to have significant impact on computer self-efficacy (Chu, 2003; Wilfong,
2006). This confirms while familiar operations are tedious and unchallenging,
unexplored, demanding actions inspire and heighten self-efficacy assessment (Bandura
1986).
Graphics programs in this business context are primarily defined as PowerPoint
presentation software and the participants rate personal computer self-efficacy,
competence, or frequency of use on a specific measure. This example from Downey and
McMurtrey (2007) asks the respondent to complete the sentence with a yes or no answer
and provides a scale to capture magnitude ranging from minimal to full confidence.
“Graphic Programs AS-CSE [Application-Specific Computer Self-Efficacy]
I believe I have the ability...
. . . to copy an individual slide from one graphic slide presentation to another.
. . . to import text from another application (e.g., word processor) to a slide.
. . . to use a graphic presentation program (e.g., Power-Point) to convey
information to others.
. . . to manipulate objects on a slide (align, tilt, rotate, etc.).
. . . to add color to words or objects on a slide.
. . . to copy or delete slides from a graphic slide presentation.
. . . to use a slide template to create a new graphic slide presentation”
(Downey & McMurtrey, 2007, p. 393).

43
Hasan (2003) explores different types of computer experiences to determine how
each impacts computer self-efficacy and concludes graphics have a powerful and
important effect. Students in a computer information system class use a survey to report
experiences with eight different application domains and computer self-efficacy is
collected using an adapted version of the Compeau and Higgins (1995b) scale. Outcomes
show individuals have the highest experience with word processing and computer games
and the lowest amount of experience with computer programming, database experience,
and graphics.
Multiple regression reveals computer programming and graphics applications
rank as the top two strong influencers on computer self-efficacy while more standard
applications like word processing had little effect. This demonstrates graphics are
beyond conventional computer knowledge and therefore strengthen self-efficacy in a
more substantial manner, precisely as Bandura (1986) stated new and demanding tasks
influence self-efficacy more than simple and effortless exercises (Hasan, 2003).
Wilfong (2006) concentrates on five of the eight application domains from Hasan
(2003) and produces similar support for graphics in the context of computer anxiety and
anger. The participants are students in an assortment of courses with the majority from
health and community service and the remaining from math, computer science, and
psychology. The highest experience applications are word processing and internet
browsing while the applications with the lowest experience are graphics and spreadsheet
programming. The low experience software is also the most challenging; it proves to
have strong connections to anxiousness and anger and graphics are found to have the
most significant impact on computer anxiety. This finding shows enhancing computer

44
self-efficacy through demanding applications such as graphics using social cognitive
theory and behavior modeling has the potential to provide comfort and confidence
(Bandura 1977, 1986; Wilfong 2006).
Downey and Zeltmann (2009) agree graphics programs may increase computer
self-efficacy; the research analyzed application domain competency levels to determine
how efficacy is shaped, asking as competence grows does computer self-efficacy grow in
equal proportion? The study collects computer competency through the scale designed
by Munro, Huff, Marcolin, and Compeau (1997) and computer self-efficacy utilizing the
Compeau and Higgins (1995b) measure. Results for six different programs are separated
into high or low competency groups and graphic programs place in the high zone, above
spreadsheets and databases.
The researched discovered the connection between competence and computer
self-efficacy is contingent upon the domain application used and graphics programs are
shown to have a strong relationship for the high competence group. Individuals in the
lower competence group less familiar with graphic programs have lower computer self-
efficacy, thus results suggest graphics may be a useful application domain for enhancing
computer self-efficacy.
Additional research on preservice teachers offers evidence affirming the value of
graphics and the possible contributions it can provide to computer self-efficacy. Chu
(2003) discusses results of a study to increase computer self-efficacy, “one unexpected
finding was the use frequency of computer graphic as the significant predictor of
computer self-efficacy” and calls for additional research (p. 139). The present action

45
research study explored changes in computer self-efficacy during a specific course
dedicated to one advanced graphics application, Adobe Photoshop.
Conclusion
Chapter Two: Literature Review presented the important aspects of previous work
in the field of computer self-efficacy, beginning with a history of self-efficacy and the
early connections to computing. Relevant research is synthesized and themes such as
sources, experience, emotion, and measurement are identified and explored. The
majority of the studies are within a business, information technology, MIS, or health
sciences context (Haffer & Raingruber, 1998; Nevalainen, Mantyranta, & Pitkala, 2010;
Saeed, Yang, & Sinnappan, 2009; Thorpe, 2004; Williams, 2004). However there are
indicators graphics have a significant influence on computer self-efficacy and there is a
need for further research in this area.

46
CHAPTER THREE
METHODOLOGY
The purpose of Chapter Three: Methodology is to describe the action research
methods used to address the following research question:
What factors from social cognitive theory (cognitive, environmental, behavior)
influenced students’ self-efficacy with computer technology in an undergraduate
graphic arts course?
Problem Statement
The participant-researcher of the present action research study identified low
computer self-efficacy as a problem in her classroom. This problem was identified
through observation and journal entries of undergraduate students enrolled in her graphic
arts course. This prompted the participant-researcher to explore options through action
research methods to better her teaching and increase students’ computer self-efficacy.
Previous research showed computer self-efficacy can be strengthened through
experience as well as training (Cassidy & Eachus, 2002; Chu, 2003; Brinkerhoff, 2006;
Beas & Salanova, 2006). Additional studies indicated a significant positive relationship
between graphics and computer self-efficacy (Chu, 2003; Downey & Zeltmann, 2009;
Hasan, 2003). The participant-researcher began to administer the Compeau and Higgins
(1995b) computer self-efficacy scale to gain knowledge for developing an action plan to
incorporate change and improve her teaching practice.

47
Purpose Statement
The purpose of the present action research is to describe the undergraduate
students’ self-efficacy in a computer graphic arts course. The secondary purpose is to
administer a scale developed by Compeau and Higgins (1995b) to align with Bandura’s
(1977) social cognitive theory. This scale considers the various determinants of social
cognitive theory (cognitive, behavior, environment) and two of the dimensions of self-
efficacy, magnitude (level) and strength.
The growth of technology calls for digitally developed users and creates a need to
raise computer self-efficacy, leading to less anxiety, more confidence, and increased
positivity when interacting with technology (Conrad & Munro, 2008; Morris & Thrasher,
2009). The present action research study took place over the 2012-2013 academic year at
the University of South Carolina with undergraduate students who enrolled in the course,
Visual Arts Computing. The scale developed by Compeau and Higgins (1995b) to align
with Bandura’s (1977) social cognitive theory was administered to the participants. This
instrument considers the determinants of social cognitive theory, cognition, behavior, and
environment. It also looks at the two dimensions of self-efficacy, magnitude (level) and
strength.
Magnitude
Compeau and Higgins (1995b) define magnitude as “the level of task difficulty
one believes is attainable” (p. 192). Bandura (1977) states magnitude becomes apparent
when individuals decide what is personally achievable from a list of tasks ranked in order
of difficulty. A person with a higher magnitude of self-efficacy can envision completing
a challenging task while those with lower magnitude may only picture success with the

48
easier tasks. In the present study, magnitude was scored from the scale through counting
the number of yes or no responses to the ten questions.
Strength
Strength refers to the “level of conviction about the judgment” (Compeau &
Higgins, p. 192). A low degree of strength lives on an unstable foundation and can be
easily diminished while higher strength creates a firm base and is more likely to persist in
challenging circumstances. In the present study the computer self-efficacy scale was
scored using the number rating to measure strength.
Action Research Design
The present study uses action research with a single group pretest posttest design
within six different sections of a single undergraduate graphic arts course at the
University of South Carolina. The participant-researcher conducted systematic inquiry in
the teaching and learning process and aimed to improve quality or effectiveness.
According to Mertler (2013), there are four steps to the action research process:
1. Focus Stage: Developing and Area of Focus
2. Acting Stage: Data Collection
3. Analysis Stage: Data Analysis
4. Action Plan Stage: Developing a Plan
Focus Stage: Developing an Area of Focus
The first step in the present action research study is a planning stage and the
development of an area of focus. In the present study an area of focus was identified
when the participant-researcher observed low computer self-efficacy in students during
graphics skills acquisition (GSA). The participant-researcher was also the instructor in

49
the courses examined (Cohen, Manion, & Morrison, 2011). This educational research
provided the participant-researcher the opportunity to preserve the actions of real events
in the graphics arts classroom while improving the utility and effectiveness of the
instructional process and students’ scholarly activity (Mertler, 2013).
Acting Stage: Data Collection
The second step in action research methods is the acting stage, including data
collection. Fraenkel and Warren (1993) discuss three types of data collection:
observation, interviews, and documents. In the present action research study observation
occurred in the classroom the participant-researcher noted and recorded student actions.
The participant-researcher in the present study observed low computer self-efficacy in
college students during graphic skills acquisition (GSA).
A second type of data collection used in action research methods are existing
documents. The students in the present study kept class journals to report progress and
any unclear information. One participant shared concerns with not being fast enough in
completing all steps to successfully achieve a workflow. Another student reported
feeling overwhelmed and confused.
The third type of data collection can happen through interviews or written
questions or forms through a survey, in the present study action research study this is
represented as a scale (Mertler, 2013). The Compeau and Higgins (1995b) computer
self-efficacy scale was distributed in a paper format once within the first two weeks of
the course and again during the last two weeks of end of the semester. The concept of
computer self-efficacy was discussed when the scale was distributed; students were told
the goal of the scale was to explore changes in computer self-efficacy after graphic skills
acquisition.

50
The Compeau and Higgins (1995b) computer self-efficacy scale consist of ten
questions which each have two parts (see Appendix A). The first part of each question
asks respondents to predict abilities on a computer task through a fictitious scenario, “I
could complete the job using the software package… […if I had…]” (Compeau &
Higgins, 1995a, p. 140). The user completes the sentence in the second part with options
for support such as the software manual, additional time, and human assistance. Last, the
individual ranks the varying degrees of support by what would be most helpful. The
scale is designed to push the subjects to consider future behavior and efficacy as opposed
to prior proficiencies (Bandura, 1986; Compeau & Higgins, 1995b).
The scales were collected from six different sections of the course, two sections
occurred in the spring semester of 2012, two in the fall semester of 2012, and two in the
spring semester of 2013. Each section was comprised of pre and post scales, though not
always in equal numbers, as class size changed from start to finish. Each set was coded
with a letter and number to indicate the semester, section, and whether it was from the
beginning or end of the semester.
Scales were identified as invalid if one or more parts were incomplete, this
situation occasionally happened with the first part when subjects missed the yes or no
question before the scale (see Appendix A). After eliminating invalid scales, the
remaining scale results were reported outload by the independent reader and then
recorded into a Microsoft Excel spreadsheet.
Reflective Stage: Data Analysis
The participant-researcher reflected on the data with her student-participants.
Through reflective writings for four years the participant-researcher worked with students
to improve the effectiveness of the graphic arts course. The scales examined by the

51
participant-researcher were collected from 2012-2013. Scales were identified as invalid
if one or more parts were incomplete, this occasionally happened with the first part when
subjects missed the yes or no question before the scale (see Appendix A). After
eliminating invalid scales, the remaining scale results were reported outload by the
independent reader and then recorded into a Microsoft Excel spreadsheet.
The total number of valid pretest scales collected at the beginning of the semester
was 120. The pretest was distributed and collected by the participant-researcher within
the classroom environment. The posttest was also distributed and collected by the
participant-researcher in the classroom at the end of the semester when class size is
smaller, due to students dropping the class. The total number of valid posttest scales
collected at the end of the semester was 88, this equals a response rate of 73%. The study
was reviewed by the Institutional Review Board (IRB) and approved, it was found to be
exempt from human research subject regulations.
Analysis Stage: Reflecting on the Data
The participant-researcher reviewed the Compeau and Higgins (1995b) scale
administered to the students, the ten-item scale applies social cognitive theory to
computer self-efficacy. The first part of each question asks respondents to anticipate
abilities on a computer task through a fictitious scenario, reading, “I could complete the
job using the software package… […if I had…]” (Compeau & Higgins, 1995a, p. 140).
The second part completes the sentence with options for support such as the software
manual, additional time, and human assistance.
The individual then ranked the varying degrees of support by what would be most
helpful (see Appendix A). The scale was designed to push the subjects to consider future
behavior as opposed to prior proficiencies (Bandura, 1986; Compeau & Higgins, 1995b).

52
The participant-researcher reviewed each item on the scale with the students in order to
develop an effective action plan to improve the students’ self-efficacy and thus the utility
and effectiveness of the course.
The third step in the action research methods process involves the developing
stage and analyzing the data. The data collected from the computer self-efficacy scale
was examined using Microsoft Excel and the Statistical Package for the Social Sciences
(SPSS). The answers from the participants were inspected for accuracy and then entered
into the software Microsoft Excel and later exported into Statistical Package for the
Social Sciences (SPSS) for additional analysis. Microsoft Excel was used to calculate
totals, averages, and percentages of scale responses and detailed results. Statistical
Package for the Social Sciences (SPSS) was used for the paired sample t-tests.
The present study used action research with a single group pretest posttest design.
Data was analyzed using a paired sample t-test conducted to compare the change between
pre-post scores of the computer self-efficacy scale. A t-test was selected for analysis
because it compares two means from the same groups. Six different sections of the
course were analyzed to verify results and recognize trends. The detailed findings will be
discussed in Chapter Four.
Theoretical Framework
The theoretical framework for this research was grounded in the work of Bandura
(1986, 1991, 1993), Dewey (1900; 1902; 1910; 1922; 1934), and Friere (1970). Bandura
and social cognitive theory show human conduct as a collection of individual cognitive
and personal factors, behavior, and environment, all constantly interacting. Dewey and
progressive educational theory support critical thinking, active change, and student
development in education. Friere discusses critical education theory and the importance

53
of student voice and a democratic educational experience. These theories encourage
students to be personal pedagogical leaders and engage in independent thought, rather
than simply receiving information from authority figures.
Participants
The participants included in this study were 120 undergraduate students enrolled
in an Art Studio course, Visual Arts Computing at the University of South Carolina in
Columbia, South Carolina during 2012 and 2013. This class was mandatory for most art
majors. However, it was also open to all students and served as a general arts
requirement depending on major. The class met twice a week in the evenings and each
session was 2 hrs 45 min, standard length for an Art Studio course. Classes designated as
Art Studio need specific equipment in the room, such as a pottery wheels for ceramics or
a darkroom for processing photographs. In the present study the course objectives
required expensive computer equipment and software, specifically the graphics software
Adobe Photoshop.
The students in the course were taught foundational art concepts through the
digital imaging graphics program, Adobe Photoshop. Each student in the course would
learn about tools and methods and be given the opportunity to apply the new knowledge
to various projects. For example, one project concentrates on creating depth through
different values, meaning the lightness or darkness of color. The participant-researcher
demonstrates various ways to achieve this through examples but each student has
different personal images to work. The students would customize methods in individual
projects.

54
Summary
Utilizing the Compeau and Higgins (1995b) computer self-efficacy scale, the
present study identified factors originating from social cognitive theory (cognitive,
environmental, behavior) influencing computer self-efficacy during graphic skills
acquisition. This study used a convenience non random sample of students enrolled in
Visual Arts Computing, a course open to all students and may serve as a general arts
requirement.
This present study utilized an action research method approach and there are four
steps involved in the process. First the area of focus was identified as low computer self-
efficacy in the participant-researcher’s class. Second data collection occurred in the form
of observation, surveys, and document data. For the third step, results were analyzed
using a paired sample t-test to compare the change between pre-post scores of the
computer self-efficacy scale. Six different sections of the course were analyzed to verify
results and recognize trends. The fourth step in action research design is developing an
action plan and this will be presented in Chapter Five.
This Chapter Three described the methodology used for the present study and
Chapter Four presents the results of the collected data.

55
CHAPTER FOUR
RESEARCH FINDINGS
The purpose of Chapter Four: Research Findings is to present the results of the
research findings used to address the following research question:
What factors from social cognitive theory (cognitive, environmental, behavior)
influenced students’ self-efficacy with computer technology in an undergraduate
graphic arts course?
Problem Statement
The participant-researcher of the present action research study identified low
computer self-efficacy as a problem in her classroom. This problem was identified
through observation and journal entries of undergraduate students enrolled in her graphic
arts course. This prompted the participant-researcher to explore options through action
research methods to better her teaching and increase students’ computer self-efficacy.
Previous research showed computer self-efficacy can be strengthened through
experience as well as training (Cassidy & Eachus, 2002; Chu, 2003; Brinkerhoff, 2006;
Beas & Salanova, 2006). Additional studies indicated a significant positive relationship
between graphics and computer self-efficacy (Chu, 2003; Downey & Zeltmann, 2009;
Hasan, 2003). The participant-researcher began to administer the Compeau and Higgins
(1995b) computer self-efficacy scale to gain knowledge for developing an action plan to
incorporate change and improve her teaching practice.

56
Purpose Statement
The purpose of the present action research is to describe the undergraduate
students’ self-efficacy in a computer graphic arts course. The secondary purpose is to
administer a scale developed by Compeau and Higgins (1995b) to align with Bandura’s
(1977) social cognitive theory. This scale considers the various determinants of social
cognitive theory (cognitive, behavior, environment) and two of the dimensions of self-
efficacy, magnitude (level) and strength.
Chapter One contained an overview of the research study, including theoretical
background, problem, purpose, and research question. Increased computer self-efficacy
has the potential to positively influence academic student achievement, workplace
productivity, and personal efficiency. Research has found college students have low
computer self-efficacy (Karsten & Schmidt, 2008). The participant-researcher in the
present study observed low computer self-efficacy in undergraduate students enrolled in
the course, Visual Arts Computing, at the University of South Carolina.
The present study investigated a course focused on teaching foundational art and
graphic design concepts through projects created with the graphics software, Adobe
Photoshop. There is evidence graphics can have a significant positive relationship with
computer self-efficacy (Chu, 2003; Downey & Zeltmann, 2009; Hasan, 2003). The
Compeau and Higgins (1995b) computer self-efficacy scale was administered to the
students enrolled in this graphics course, Visual Arts Computing. The present study
analyzed the results of the scale to identify factors influencing computer self-efficacy
during graphic skills acquisition.

57
The research question for this study is as follows:
What factors from social cognitive theory (cognitive, environmental, behavior)
influenced students’ self-efficacy with computer technology in an undergraduate
graphic arts course?
Chapter Two of this dissertation provides a detailed literature review
concentrating on the history of computer self-efficacy, the sources, and findings in
previous related studies. Computer self-efficacy is a specific type of self-efficacy and a
component of social cognitive theory. This theory examines human development,
including thoughts, motivations, and actions to steer life choices (Bandura, 1986). Self-
efficacy is a person’s judgment of personal capabilities to achieve something, it is not
their skills but rather what an individual believes can be accomplished with those skills
(Bandura, 1986).
Self-efficacy is researched in relation to numerous topics, including academic
achievement, weight loss, and motivation. Computer self-efficacy studies started within
business environments to gain more knowledge about why individuals accept or reject
technology. The impact of environment, emotion, computer experience, and graphics
experience on computer self-efficacy were addressed.
Findings
The Compeau and Higgins (1995b) computer self-efficacy scale begins with a
sample answer at the top to assist respondents (Figure 4.1). In the sample response the
individual reported yes to completing the job when provided with step by step
instructions and felt moderately confident (level of 5).

58
Table 4.1 displays the questions on the scale and Table 4.2 shows the percent
change for each question between pretest and posttest. The computer self-efficacy
composite score was derived from the levels of the questions where the respondent
answered yes. This procedure of totaling the positive responses was utilized by Lee and
Bobko (1994) in work on self-efficacy beliefs. This same process was employed
successfully by Downey and McMurtrey (2007) and Downey and Zeltmann (2009).
Table 4.2 displays the average of the total responses for each question and then
calculates the percent change across all six sections of the course. The most significant
increase (42%) is if the subject had never used a similar package before (Q-2). The
second largest increase (33%) reported subjects rated higher computer self-efficacy if no
one is around to assist (Q-1).
Social cognitive theory has three determinants: cognition, behavior, and
environment. Bandura (1986) connects the determinant of environment to tangible
habitats and human assistance. There are six questions on the Compeau and Higgins
(1995b) computer self-efficacy scale related to the determinant of environment. Three of
these questions link to human support, two questions involve software support resources,
and one relates to having no time constraints.

59
Table 4.1
Computer Self-Efficacy Scale Questions
Item
Question Text
I could complete the job using the software package…
Q-1 if there was no one around to tell me what to do as I go.
Q-2 if I had never used a package like it before.
Q-3 if I had only the software manuals for reference.
Q-4 if I had seen someone else using it before trying it myself.
Q-5 if I could call someone for help if I got stuck.
Q-6 if someone else helped me get started.
Q-7 if I had a lot of time to complete the job for which the software was
provided.
Q-8 if I had just the built in help facility for assistance.
Q-9 if someone showed me how to do it first.
Q-10 if I had used similar packages before this one to do the same job.
Table 4.2
Computer Self-Efficacy: Percent Change by Question
Item
Section
___________________________________________
Percent
Change 1 2 3 4 5 6
Q-1 19 31 9 34 44 59 32.67
Q-2 5 50 29 38 40 89 41.83
Q-3 4 18 -13 8 47 16 13.33
Q-4 -1 23 17 16 32 31 19.67
Q-5 -8 10 1 6 10 13 5.33
Q-6 -6 4 -1 11 22 13 7.17
Q-7 3 9 -1 12 16 22 10.17
Q-8 3 9 22 15 34 24 17.83
Q-9 -5 -2 0 7 11 1 2
Q-10 -3 -3 2 10 8 2 2.67
Average 1.1 14.9 6.5 15.7 26.4 27 15.27

60
The three questions aligned to environment through the availability of human
assistance ask if is there a person present to guide me (Q-1), to help me get started (Q-6),
or accessible through phone for assistance (Q-5). The participants in the present study
report higher computer self-efficacy when there is no person available to assist (32%), get
started (7%), or accessible by phone (5%).
Two questions are associated to environment in a support capacity, access to
software manuals (Q-3) and built-in help (Q-8). These questions show about a 15%
increase from pretest to posttest. The last item relating to environment is time and
proposes the subject has plenty of time to work on the software package (Q-7). This
question also showed an increase after graphic skills acquisition (10%).
Bandura (1986) states cognition calls for thought, recall, and comparison, this
relates to two questions in the Compeau and Higgins (1995b) scale. The questions
requiring thought, recall, and comparison asked the subject about previous experience
with similar packages to accomplish a comparable task. One question asked if there was
no previous similar experience (Q-2) and the other questions asked if there previous
experience with similar packages to accomplish a comparable task (Q-10). The
respondents reported a strong increase in computer self-efficacy (42%) if there was no
prior use with a package like it before. This supports research stating higher computer
self-efficacy equals more confidence and increased positivity when interacting with
technology, especially new and challenging tasks (Bandura, 1986; Conrad & Munro,
2008; Morris & Thrasher, 2009).
Questions connected to the social cognitive theory determinant of behavior align to
modeling from a guide rather than human assistance; vicarious experience is the second
strongest source of self-efficacy (Bandura, 1997). Observation instead of participation

61
allows participants to view from a safe area and gain valuable knowledge about the task
and standard expectations (Bandura, 1997). Individuals can gain new perspectives on
personal capabilities that previously had no reference for comparison (Bandura, 1997;
Bandura & Jourden, 1991; Wood, 1989).
Two questions related to behavior describe a successful person accomplishing the
task. The posttest reports a 20% increase in computer self-efficacy for the question about
the participant being able to complete the job if witnessing someone else doing it before
personally trying it (Q-4). The question about participants being shown how to do
something before attempting it (Q-9) increased 2%. These findings suggest participants
want to observe, experiment, and be independent thinkers who are provided support
through behavior modeling instead of being told how to do something systematically.
Magnitude
The present action research methods study identified factors from Bandura’s
social cognitive theory influencing computer self-efficacy. The instrument used
incorporated two dimensions of self-efficacy: magnitude (level) and strength (Bandura,
1977). Magnitude or level is defined as “the level of task difficulty one believes is
attainable” (Compeau & Higgins, 1995b, p. 192). In the present study, magnitude was
scored from the scale through counting the number of yes answers (Compeau & Higgins,
1995b).
Table 4.3 shows these results of magnitude across six different sections of the
course, it was strong in both pretest and posttest with a small increase in the majority of
sections. Sections 6 had the highest change and sections 2 and 4 showed no change, both
of these sections met for class on Tuesdays and Thursdays.

62
Table 4.3
Magnitude: Percent Change by Section
Section N Pretest Posttest Percent Change
1 26 .85 .92 .01
2 17 .95 .95 0
3 24 .95 .97 .02
4 17 .94 .94 0
5 14 .89 .92 .03
6 24 .91 .96 .06
Average 20 .91 .94 .02
Table 4.4 shows changes in magnitude by percent change per question, pretest to
posttest by question on the Compeau and Higgins (1995b) computer self-efficacy scale.
The average change over all the questions is very small (-.12%) and the question with the
highest change (-.18%) asked if the respondent had used a similar package (Q-10). The
question with the second highest change (-.17%) asked about if someone showed the
respondent how to do it first (Q-9). The question regarding previous use of similar
packages (Q-2) barely changed at all (-.03%). The question relating to the absence of
human assistance (Q-1) showed almost no change (-.08%). The question about access to
software manuals (Q-3) also displayed minimal change (-.06%).
Strength
The second dimension of self-efficacy is strength, referring to the “level of
conviction about the judgment” (Compeau & Higgins, 1995b, p. 192). Individual
thoughts mold and regulate strength, partially built through successes and reduced by
failures (Bandura, 1986). Strength was scored following the Compeau and Higgins
(1995b) method of summarizing the respondent’s answer on the confidence level

63
Table 4.4
Magnitude: Percent Change by Question
Item
Section
___________________________________________
Percent Change 1 2 3 4 5 6
Q-1 -.04 .33 -.81 -.13 .1 .06 -0.08
Q-2 -.15 .33 -.76 -.07 .33 .15 -0.03
Q-3 .15 .4 -.86 -.2 .09 .07 -0.06
Q-4 -.04 .23 -.81 -.06 -.21 -.1 -0.16
Q-5 -.08 .23 -.8 -.12 -.07 -.1 -0.16
Q-6 .08 .23 -.81 -.12 -.07 -.1 -0.13
Q-7 -.11 .23 -.81 -.12 -.07 -.1 -0.16
Q-8 -.04 .15 -.79 -.19 .2 0 -0.11
Q-9 -.08 .15 -.81 -.12 -.07 -.1 -0.17
Q-10 -.08 .15 -.81 -.18 -.07 -.1 -0.18
Average -0.04 0.24 -0.81 -0.13 0.02 -0.03 -0.12
scale, ranging from one to ten. This scoring method recommends counting a response of
no as a zero and the present study also follows this process.
Table 4.5 displays the percent change for strength across the six different sections
of the course by section. The average change in strength from pretest to posttest was
minimal (.14%) and the strongest increases were in section 5 (.24%) and 6 (.25%). These
two sections with the highest increase are both from the spring semester of 2013. The
lowest change was in section 1 (.01%) and section 3 (.07%), both from 2012.
Table 4.6 shows the percent change strength by question, an overall an increase of
19.77%. The question with the highest increase (73%) is when the respondent never used
a package like it before (Q-2). The question with the second most
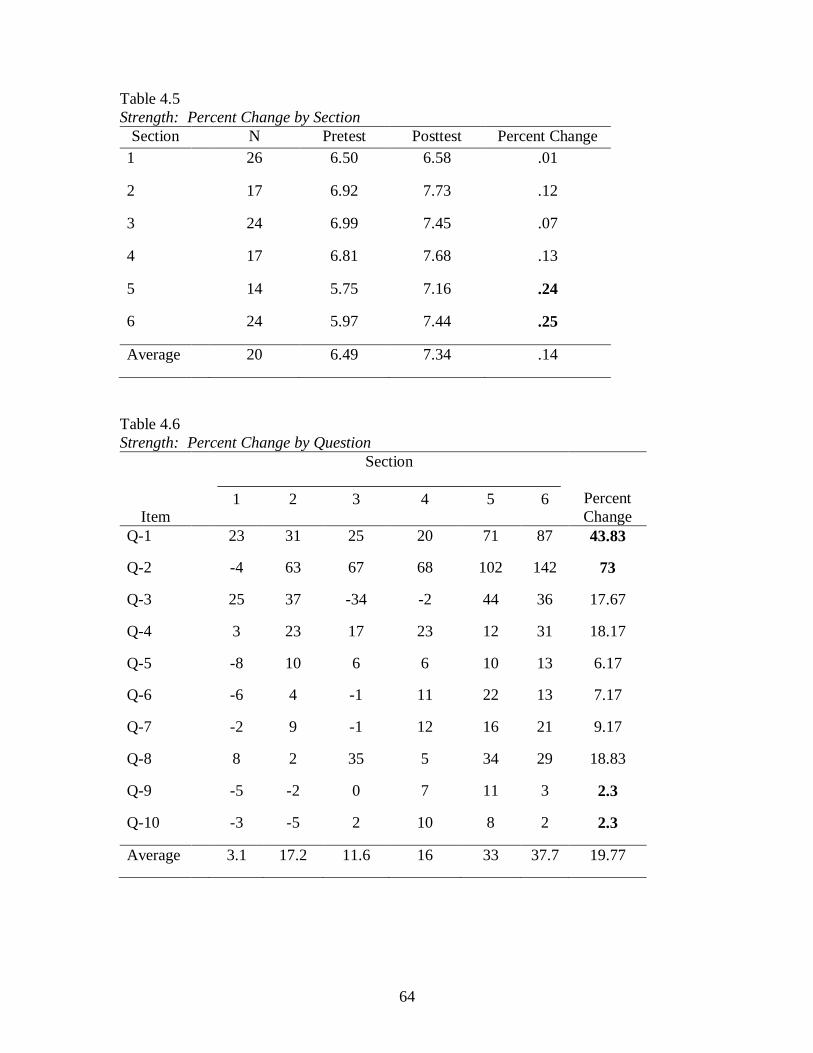
64
Table 4.5
Strength: Percent Change by Section
Section N Pretest Posttest Percent Change
1 26 6.50 6.58 .01
2 17 6.92 7.73 .12
3 24 6.99 7.45 .07
4 17 6.81 7.68 .13
5 14 5.75 7.16 .24
6 24 5.97 7.44 .25
Average 20 6.49 7.34 .14
Table 4.6
Strength: Percent Change by Question
Item
Section
___________________________________________
Percent
Change 1 2 3 4 5 6
Q-1 23 31 25 20 71 87 43.83
Q-2 -4 63 67 68 102 142 73
Q-3 25 37 -34 -2 44 36 17.67
Q-4 3 23 17 23 12 31 18.17
Q-5 -8 10 6 6 10 13 6.17
Q-6 -6 4 -1 11 22 13 7.17
Q-7 -2 9 -1 12 16 21 9.17
Q-8 8 2 35 5 34 29 18.83
Q-9 -5 -2 0 7 11 3 2.3
Q-10 -3 -5 2 10 8 2 2.3
Average 3.1 17.2 11.6 16 33 37.7 19.77

65
significant increase (44%) was (Q-1) if no one was around to tell respondent what to do
along the way. The third and fourth most significant increases involve if the participant
had seen someone else using it before trying it (Q-4) and if just the built-in help facility
was available for assistance (Q-8).
Computer self-efficacy magnitude displayed the least percent change (2%) in the
questions regarding if someone showed the subject how to do it first (Q-9), if there was
prior use with similar packages before (Q-10), and if someone could be called for
assistance when needed (Q-5).
Table 4.7 displays a percent change comparison of magnitude, strength, and
computer self-efficacy by question. The highest positive increase was in using new and
unfamiliar software (Q-2). Strength was raised 20%, higher than the computer self-
efficacy composite of 15%. The second highest positive increase was shown in the
question regarding no one around to tell the use what to do along the way (Q-2). The
question with the third highest positive increase addresses the use of built in help for
assistance (Q-8). Conversely, the questions with the lowest changes involve if someone
showed the individual how to do it first (Q-9) and if the user had used a similar software
before this one to do the same job (Q-10).
Table 4.8 shows the results of a paired samples t test, conducted to evaluate
whether students in Section 1 reported different confidence outcomes across pretest and
posttest outcomes. There was a significant difference in the scores for the posttest (M=
7.44, SD= 2.71) as compared to the pretest (M=5.88, SD=2.98) conditions; t(351)= -5.19,
p<0.05.

66
Table 4.7
Magnitude, Strength, Computer Self-Efficacy: Percent Change Comparison
Item Question Magnitude Strength Computer
Self-Efficacy
Q-1 …if there was no one around to
tell me what to do as I go
-0.08 43.83 32.67
Q-2 …if I had never used a software
like it before
-0.03 73 41.84
Q-3 …if I had only the book or
software manuals for reference
-0.06 17.67 13.167
Q-4 …if I had seen someone else
using it before trying it myself
-0.16 18.17 19.67
Q-5 …if I could call someone for
help if I got stuck
-0.16 6.17 5.34
Q-6 …if someone else had helped
me get started
-0.13 7.17 7.17
Q-7 …if I had a lot of time to
complete the job for which the
software was provided
-0.16 9.17 10.17
Q-8 …if I had just the built-in help
for assistance
-0.11 18.83 17.83
Q-8 …if someone showed me how
to do it first -0.17 2.3 2
Q-10 …if I had used a similar
software before this one to do
the same job
-0.18 2.3 2.67
Average -0.12 19.77 15.25
As required for the pair samples t-test, an equal number of responses were
compared (n this case, 178 cases) in the pretest and posttests. Section 1 represents a
course scheduled to meet twice a week, Mondays and Wednesdays during the spring
semester of 2012.
Table 4.9 displays a paired samples t test conducted to evaluate whether students
in Section 2 reported different confidence outcomes across pretest and posttest outcomes.
There was a significant difference in the scores for the posttest (M= 7.14, SD= 2.98) as
compared to the pretest (M=5.69, SD=2.98) conditions; t(253)= -4.01, p<0.05.

67
Table 4.8
t-Test: Two Sample Assuming Unequal Variances, Section 1
Pre Post
Mean 5.882022472 7.443820225
Variance 8.816511141 7.332984193
Observations 178 178
Hypothesized Mean Difference 0
df 351
t Stat -5.185078276
P (T<=t) one tail 1.82744E-07
t Critical one-tail 1.6492064
P (T<=t) two tail 3.65488E-07
t Critical two-tail 1.966745561
Table 4.9
t-Test: Two Sample Assuming Unequal Variances, Section 2
Pre Post
Mean 5.689922 7.139535
Variance 9.293726 7.558503
Observations 129 129
Hypothesized Mean Difference 0
df 253
t Stat -4.01068
P (T<=t) one tail 3.99E-05
t Critical one-tail 1.650899
P (T<=t) two tail 7.97E-05
t Critical two-tail 1.969385

68
As required for the pair samples t-test, an equal number of responses were
compared (in this case, 129 cases) in the pretest and posttests. Section 2 represents a
course scheduled to meet twice a week, on Tuesdays and Thursdays during the spring
semester of 2012.
A paired samples t test was conducted to evaluate whether students in Section 3
reported different confidence outcomes across pretest and posttest outcomes. Table 4.10
shows there was a significant difference in the scores for the posttest (M= 7.68, SD=
2.82) as compared to the pretest (M=6.70, SD=2.90) conditions; t(294)= -2.95, , p<0.05.
As required for the pair samples t-test, an equal number of responses were
compared (in this case, 148 cases) in the pre and post-tests. Section 3 represents a course
scheduled to meet twice a week, Monday and Wednesday during the fall semester of
2012.
Table 4.10
t-Test: Two Sample Assuming Unequal Variances, Section 3
Pre Post
Mean 6.695945946 7.675675676
Variance 8.403520868 7.934914506
Observations 148 148
Hypothesized Mean Difference 0
df 294
t Stat -2.948708979
P (T<=t) one tail 0.001723567
t Critical one-tail 1.650052985
P (T<=t) two tail 0.003447134
t Critical two-tail 1.968065689

69
Table 4.11 displays results of a paired samples t test was conducted to evaluate
whether students in Section 4 reported different confidence outcomes across pretest and
posttest outcomes. There was no significant difference in the scores for the posttest (M=
7.38, SD= 2.73) as compared to the pretest (M=7.46, SD=2.92) conditions; t(76)= 0.12,
p>0.05. It should be noted the pretest scores were higher than the posttest scores.
As required for the pair samples t-test, an equal number of responses were
compared (in this case, 39 cases) in the pre and post-tests. Section 4 represents a course
scheduled to meet twice a week, Tuesdays and Thursdays during the spring semester of
2012.
Table 4.11
t-Test: Two Sample Assuming Unequal Variances, Section 4
Pre Post
Mean 7.461538462 7.384615
Variance 8.728744939 7.453441
Observations 39 39
Hypothesized Mean Difference 0
df 76
t Stat 0.119418154
P (T<=t) one tail 0.452629593
t Critical one-tail 1.665151353
P (T<=t) two tail 0.905259185
t Critical two-tail 1.99167261
Table 4.12 contains data from a paired samples t test, conducted to evaluate
whether students in Section 5 reported different confidence outcomes across pretest and
posttest outcomes. There was a significant difference in the scores for the posttest (M=

70
7.68, SD= 2.70) as compared to the pretest (M=6.94, SD=2.76) conditions; t(250)= -2.17,
p<0.05.
As required for the pair samples t-test, an equal number of responses were
compared (in this case, 126 cases) in the pre and post-tests. Section 5 represents a course
scheduled to meet twice a week, on Mondays and Wednesdays during the spring semester
of 2013.
Table 4.12
t-Test: Two Sample Assuming Unequal Variances, Section 5
Pre Post
Mean
6.936508 7.68254
Variance 7.627937 7.322413
Observations 126 126
Hypothesized Mean Difference 0
df 250
t Stat -2.16579
P (T<=t) one tail 0.015636
t Critical one-tail 1.650971
P (T<=t) two tail 0.031273
t Critical two-tail 1.969498
Table 4.13 shows a paired samples t test, conducted to evaluate whether students
in Section 6 reported different confidence outcomes across pretest and posttest outcomes.
There was no significant difference in the scores for the posttest (M= 6.56, SD= 3.01) as
compared to the pretest (M=6.48, SD=2.72) conditions; t(467)= -0.30, p>0.05.
As required for the pair samples t-test, an equal number of responses were
compared (in this case, 237 cases) in the pre and post-tests. Section 6 represents a course
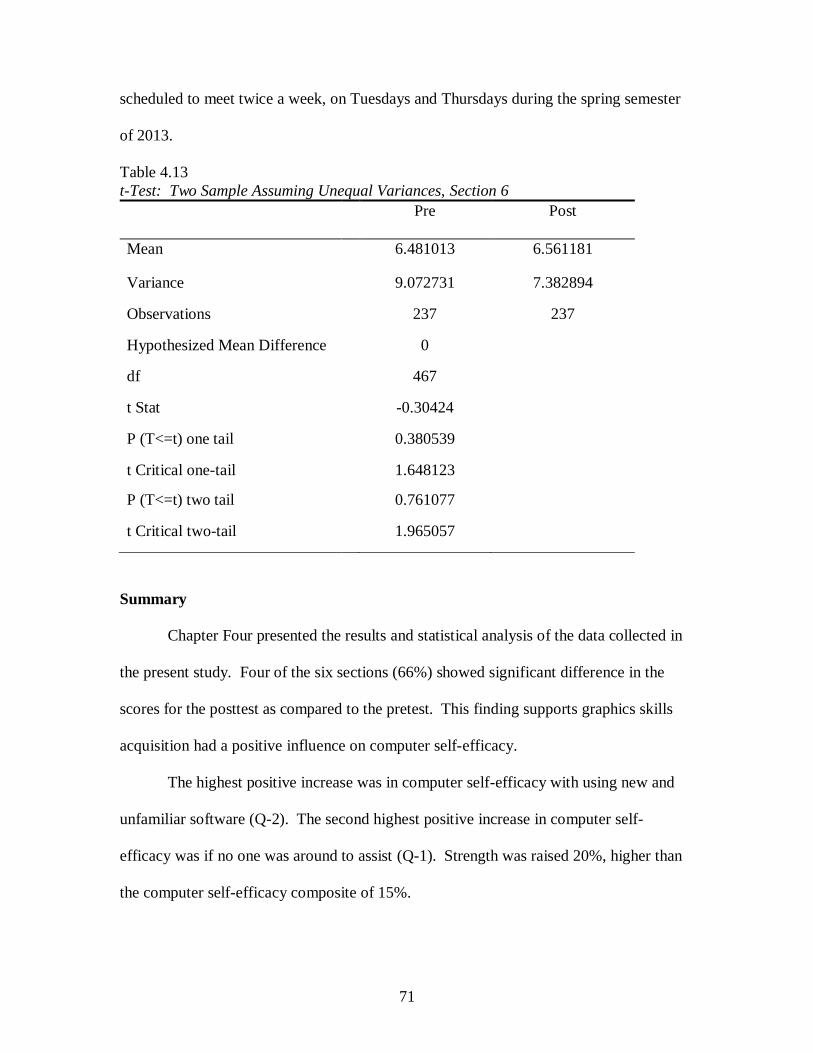
71
scheduled to meet twice a week, on Tuesdays and Thursdays during the spring semester
of 2013.
Table 4.13
t-Test: Two Sample Assuming Unequal Variances, Section 6
Pre Post
Mean
6.481013 6.561181
Variance 9.072731 7.382894
Observations 237 237
Hypothesized Mean Difference 0
df 467
t Stat -0.30424
P (T<=t) one tail 0.380539
t Critical one-tail 1.648123
P (T<=t) two tail 0.761077
t Critical two-tail 1.965057
Summary
Chapter Four presented the results and statistical analysis of the data collected in
the present study. Four of the six sections (66%) showed significant difference in the
scores for the posttest as compared to the pretest. This finding supports graphics skills
acquisition had a positive influence on computer self-efficacy.
The highest positive increase was in computer self-efficacy with using new and
unfamiliar software (Q-2). The second highest positive increase in computer self-
efficacy was if no one was around to assist (Q-1). Strength was raised 20%, higher than
the computer self-efficacy composite of 15%.

72
CHAPTER FIVE
IMPLICATIONS AND CONCLUSIONS
The purpose of Chapter Five: Implications and Conclusions is to summarize the
research study and the findings from the data collection, analysis, and reflection. An
Action Plan for graphics arts course improvement is also included in this Chapter.
Chapter Five begins with an overview of the action research study and methodology and
then transitions to discussion and implications about the Action Plan. Lastly, the Chapter
offer suggestions for future research.
The implications and conclusions presented here are used to address the following
research question:
What factors from social cognitive theory (cognitive, environmental, behavior)
influenced students’ self-efficacy with computer technology in an undergraduate
graphic arts course?
Problem Statement
The participant-researcher of the present action research study identified low
computer self-efficacy as a problem in her classroom. This problem was identified
through observation and journal entries of undergraduate students enrolled in her graphic
arts course. This prompted the participant-researcher to explore options through action
research methods to better her teaching and increase students’ computer self-efficacy.

73
Previous research showed computer self-efficacy can be strengthened through
experience as well as training (Cassidy & Eachus, 2002; Chu, 2003; Brinkerhoff, 2006;
Beas & Salanova, 2006). Additional studies indicated a significant positive relationship
between graphics and computer self-efficacy (Chu, 2003; Downey & Zeltmann, 2009;
Hasan, 2003). The participant-researcher began to administer the Compeau and Higgins
(1995b) computer self-efficacy scale to gain knowledge for developing an action plan to
incorporate change and improve her teaching practice.
Purpose Statement
This present action research has a purpose, to describe the undergraduate
students’ self-efficacy in a computer graphic arts course. A second purpose is to
administer the Compeau and Higgins (1995b) scale, developed by to align with
Bandura’s (1977) social cognitive theory. This scale considers the various determinants
of social cognitive theory (cognitive, behavior, environment) and two of the dimensions
of self-efficacy, magnitude (level) and strength.
Overview of Research Study and Methodology
Technology is expanding and calling for more digitally developed users to
interact, work, develop, and build projects with these new tools and systems. This
growth creates a need to raise computer self-efficacy, leading to less anxiety, more
confidence, and increased positivity when interacting with technology (Conrad & Munro,
2008; Morris & Thrasher, 2009). Research has discovered experience and training to
both have the potential to grow computer self-efficacy (Cassidy & Eachus, 2002; Chu,
2003; Brinkerhoff, 2006; Beas & Salanova, 2006). It is important to note the type and
variety of exposure is crucial; an assortment of different interactions can build computer
self-efficacy through active technical participation.

74
Various computer programs have been studied to test the individual program’s
impact on computer self-efficacy, including graphics. The Microsoft Office Suite, word
processing, spreadsheet, and database software were frequently analyzed in these studies
within the academic areas of business and management information science (MIS)
disciplines (Agarwal & Karahanna, 2000; Burkardt & Brass, 1990; Compeau & Higgins,
1995a; Rozell & Gardner, 1999). Graphics software was often included in these studies
as part of the Microsoft Office Suite, mostly in the form of Microsoft PowerPoint
presentation software. Several studies suggested a positive relationship between graphics
skills acquisition and computer self-efficacy in preservice teachers (Chu, 2003), military
trainees (Downey & Zeltmann, 2009), and non-traditional students (Hasan, 2003).
The present study examined computer self-efficacy in 120 undergraduate students
enrolled in graphics course, Visual Arts Computing at the University of South Carolina.
The course taught foundational art and graphic design concepts through projects created
with the graphics software, Adobe Photoshop. The participant-researcher administered
the Compeau and Higgins (1995b) scale in 2012 and 2013 to determine if graphic skills
acquisition impacted computer self-efficacy.
The Compeau and Higgins (1995b) computer self-efficacy scale applies the work
of Bandura’s (1986) social cognitive theory to computer self-efficacy. The instrument
consists of ten items and each question asks respondents to anticipate abilities on a
computer task through a fictitious scenario. The first part reads, “I could complete the
job using the software package… […if I had…]” (Compeau & Higgins, 1995a, p. 140).
Next, the second part asks the respondent to complete the sentence with options for
support including the software manual, additional time, and human assistance. Subjects
then rank personal level of confidence on the scale with each resource (see Appendix A).

75
This design is intended to push the subjects to consider future behavior as opposed to
prior proficiencies (Bandura, 1986; Compeau & Higgins, 1995b).
Personal evaluations of self-efficacy change based on magnitude (level) and
strength (Bandura, 1986, 1997). Magnitude relates to how hard a task is and if a person
believes it can be accomplished. In the present study, magnitude was scored from the
scale through counting the number of yes or no responses to the ten questions. Strength
refers to the “level of conviction about the judgment” (Compeau & Higgins, p. 192). The
present study scored strength through the number rating for level.
Action research methods with a single group pretest and posttest design were used
to gain knowledge about the students in the learning environment (Mertler, 2013). Data
from the Compeau and Higgins (1995b) computer self-efficacy scale was analyzed using
Microsoft Excel and the Statistical Package for the Social Sciences (SPSS). Data was
analyzed using a paired samples t-test conducted to compare the change between pre-post
scores of the computer self-efficacy scale.
Findings
To answer the research question for the present study factors from Bandura’s
social cognitive theory are identified. These factors influenced 120 art students’ self-
efficacy with computer technology during an undergraduate visual art course. Computer
self-efficacy increased in the majority of the sections were examined. Data analysis
revealed a significant difference in the scores from the scale for the posttest as compared
to the pretest in four out of six sections. The paired samples t test showed no significant
difference in section 4 or 6, both are classes scheduled to meet on Tuesday and Thursday
nights. However, since section 2 also met on those same days and did show a significant
change in computer self-efficacy, no conclusions can be drawn from this observation.

76
The factors identified from social cognitive theory influencing computer self-
efficacy have two dimensions: magnitude (level) and strength (Bandura, 1977).
Magnitude refers to task difficulty and whether an individual believes it can be personally
accomplished; higher magnitude is usually assigned to easier tasks and lower magnitude
to challenging ones. Magnitude was scored through counting the number of yes answers
indicated by the respondents (Compeau & Higgins, 1995b). The magnitude did increase
in four out of six of the different course sections. The two most recent sections in spring
of 2013 had the highest increases, section 5 (.063%) and section 6 (.06%). Section 2 and
4 had no change (0%), both of these sections were met on Tuesdays and Thursdays.
Strength is formed when a person evaluates individual confidence level with a
task and this was calculated using the number rating on the computer self-efficacy scale.
The present study shows an average increase in strength of 20% over all six sections.
Growth in sections 5 (33%) and 6 (38%) were significantly more than the other sections
with increases of 3% (section 1), 17% (section 2), 12% (section 3), and 16% (section 4).
This is an interesting finding since both sections 5 and 6 were in the same semester yet
there were no major changes to the course or content.
Computer self-efficacy as a composite score was calculated from the levels
indicated on all questions answered yes. The average growth over all six sections was
15%, this is less than the strength increase of 20%. Again, the highest increases are in
sections 5 (26%) and 6 (27%) and smaller changes are in section 1 (1.1%), section 2
(14.9%), section 3 (6.5%), and section 4 (15.7%).
Results of the present study reported a 15% increase in computer self-efficacy
composite and a 20% increase in strength. The first part of each scale question, where
students indicated yes or no for the self-efficacy dimension of magnitude barely changed

77
(-.12%). The second part of the question where the respondent selected a specific
strength rating to represent level of confidence increased more (20%) than the overall
composite increase (15%). This demonstrates the students still indicated yes (magnitude)
at the end of the semester posttest, but felt more strongly about the strength or “level of
conviction about the judgment” (Compeau & Higgins, 1995b, p. 192). This finding
provides evidence individual confidence developed more firmly throughout the semester
and increased during graphic skills acquisition.
Conversely, the research of Lee and Bobko (1994) found the opposite of the
present study, the self-efficacy composite increased more than the strength. The Lee and
Bobko (1994) study used a different computer self-efficacy measurement from the
present study. A higher increase in self-efficacy composite may be attributed to
respondents who are quick to say yes to the first part (magnitude) when personal
capabilities are in question regarding technology. This supports the high percentage of
students who self-report above average in computer skills, however are “less skilled than
they perceive” (Madigan, Goodfellow, & Stone, 2007, p. 413).
Magnitude, strength, and composite computer self-efficacy results also varied by
question on the scale. There are minimal changes to magnitude and two questions show
the highest amount of growth pretest to posttest. The questions with the largest increase
asked if the respondent has used a similar package before (Q-10) or if someone showed
the respondent how to do it first (Q-9). The question discussing previous use of similar
packages (Q-2) minimally changed (-.03).
These results are consistent with experience as the strongest source of self-
efficacy Bandura (1977; 1997). This also positively aligns with vicarious experience as
essentially the second strongest source of self-efficacy and the power of behavior

78
modeling. Bandura (1977) reported subjects achieved higher skill development through
modeling than other techniques. Gist, Rosen, and Schwoerer (1988) studied various
training methods to assist users with learning to work with computers in the workplace.
Modeling achieved the greatest results and allowed users to expand trust in personal
potential.
Computer self-efficacy strength grows 20% from pretest to posttest with
extremely high increases in two questions. The question with a 73% gain asks for a
confidence rating if the respondent never used a package like it before (Q-2). After
acquiring graphics instruction, the respondents are more confident with successfully
using new and unfamiliar software in the future. This suggests the recent work in
graphics raised computer self-efficacy and supports the work of Bandura (1986) stating
new and intriguing tasks are the most influential on self-efficacy.
Respondents have higher computer self-efficacy for future tasks with new and
unfamiliar software in part because of recent successes. Most of the students successfully
completed a course in graphic software, after not knowing graphics software well. Users
have low levels experience with graphics and the most knowledge about word
processing, Internet, and computer games (Hasan 2003; Wilfong 2006).
The computer self-efficacy strength score with the second most significant
increase 44% was (Q-1) if no one was around to tell respondent what to do along the
way. This finding directly connects to social cognitive theory, supporting learners who
aim to think individually, understand, and guide their educational experience (Bandura,
1986; 1991; 1993). This also relates to self-regulation, the process of empowerment
through concentrating attention on efforts and directing efforts towards set goals.

79
Developing independent learners challenges traditional one-sided classroom
environments and do not engage students or allow for unconventional thinking and
therefore fail to maximize the educational experience. Freire (1970) described this as the
“banking concept of education,” where students are empty accounts and simply receive
what the teacher deposits (p. 72). Dewey (1933) indicated collecting facts and data alone
does not develop learning habits, a deeper thirst for continued knowledge, or the motive
to be an active participant in society. This finding is due in part to the participant-
researcher advocating democratic classroom methods, fostering the growth of self-
efficacy and empowering the student during graphic skills acquisition.
One computer self-efficacy strength question with a minimal percent of change
(2%) asked if the subject had any prior experience with a similar package (Q-10). The
average answer for this scale question was high at 8 or 9 out of 10, on both the pretest
and posttest. Enactive experience is the primary source of self-efficacy and involves
people learning through participation and doing. The minimal change on the question
may be attributed to individuals already knowing experience strengthens belief in
yourself. People, especially students understand that experience and doing something
multiple times increases self-confidence in that activity. This applies to everything from
piano practice and math homework, to riding a bicycle.
The second computer self-efficacy strength question with a very small percent of
change (2%) inquired about if someone showed the subject how to do it first (Q-9). This
connects to behavior modeling or vicarious experience, the second strongest source of
self-efficacy. This scale question also had a high average answer at 8 or 9 out of 10, on
both the pretest and posttest. This finding regarding the strong power of vicarious
experience or modeling both before and after may be due to an individual’s long history

80
with the concept. “After infants discover that they can exercise some control over
aspects of their immediate environment, they draw on vicarious experiences to expand
and verify their sense of personal efficacy” (Bandura, 1997, p. 167).
Throughout life, many life tasks and actions have no firm guidelines to measure
success and people rely on comparisons to self-assess (Bandura, 1997). These personal
evaluations will vary depending on the comparison group chosen, people who observe
those who are more similar to themselves, see the ideal as more attractive and attainable
(Bandura 1997; Wood, 1989). Same-age peers are crucially important in behavior
modeling (Wood, 1989). The chief benefit of modeling is people gain new perspectives
on personal capabilities which previously had no reference for comparison (Bandura,
1997; Bandura & Jourden, 1991; Wood, 1989).
The composite computer self-efficacy increased an average of 15% and the most
significant increase (42%) is if the subject had never used a similar package before (Q-2).
The second largest increase (33%) noted subjects rated higher computer self-efficacy if
no one is around to assist (Q-1). These same two questions were also the most increased
in computer self-efficacy strength however reversed, the question about no one around to
assist (Q-1) had a stronger change than if the subject had never used a similar package
before (Q-2).
Implications
The results of this study suggest graphic skills acquisition had a significant
positive impact on the computer self-efficacy of the 120 student-participants.
Independent Learning
The data shows the most substantial factor from the environment was independent
learning (Q-1). Working independently empowers the user to feel in control and provides

81
a sense of ownership about future direction. Collins (2009) says it is essential to support
individual choice in how and what students learn. By enabling student-participants we
encourage creating an individual approach and allow students to decide where to begin
and what to give attention to, all based on individual and particular needs.
Individuals in my class sought activities to engage and empower; the students had
an inherent need to feel in control and claim educational ownership (Baggetun &
Wasson, 2006; Bandura 1986, 1991). Students shared the favorite projects were ones
with more flexibility and freedom. One example is the self-portrait where students were
encouraged to create personal images and connections. Students were excited to create
unique pieces of art, original and personal. One student asked if the class could be
allowed to do one project on anything selected with minimal direction. This is truly the
foundation of self-efficacy, the human desire to control life situations through minimizing
failure and constantly reaching for success, goals, and rewards (Bandura 1986; 1991;
1997).
Access to Support Materials
An important factor from the social cognitive theory determinant of environment
is access to support materials (Q-8). Learners in my class benefited from comprehensive
software assistance easily accessible from within the active and current program. Help
areas were created by the software manufacture and provided accurate and updated
information. The help was usually visible through a link or icon directly in the software,
and were searchable, and extremely convenient for references and inquiries.
It took the student-participants some time to find the correct answer to my
questions but patience and “persistency increase[s] the likelihood of success” (Bandura &
Schunk, 1981, p.596). When a student-participant did not feel pressured by time s/he

82
felt free to experiment, make multiple attempts, and pause for reflection and
modification (Dewey, 1933).
Engaging in Unfamiliar Tasks
Another strong factor from social cognitive theory contributing to increased
computer self-efficacy is cognition when engaging in new and unfamiliar tasks (Q-2).
These unprecedented actions called for additional thought, recall, and comparison to
previous and comparable computer activity from the student-participants. Then the
thought process transitioned to compositing knowledge to move the task forward. After
acquiring graphics instruction, the respondents were confident with successfully using
new and unfamiliar software in the future. This supports the work of Bandura (1986)
stating new and intriguing tasks are the most influential on self-efficacy.
Behavior Modeling
Factors from behavior include vicarious experience or behavior modeling (Q-4).
In this situation, student-participants had the opportunity to observe the participant-
researcher demonstrate various techniques with the tools in the software. The students
stayed protected through observation and did not have to prove their knowledge,
demonstrate proficiency, and risk failing while trying the technique in front of the
participant-researcher and other classmates. The students witnessed an ideal future
situation in a tangible way and visualized personal success through the model. Behavior
modeling greatly assisted people with phobias and anxieties in my class and some made
remarkable progress with the aid of confident and relatable guides (Bandura, Blanchard,
& Ritter, 1969). After overcoming a phobia, the student-participant displayed a reduction
in general anxiety about other aspects of their life as well.

83
Although my students felt more efficacious through behavior modeling and the
ability to see someone else using the software before trying it, my learners did not want
me walking through the process step by step or assisting to complete the job. My
learners shared a preference for support documents and time to approach the task in an
individual way at a preferred personal pace. The students want examples and resources
first followed by autonomy and time for independent learning. My data shows my
student-participants felt most confident in completing future computer tasks if there was
no prior use of a similar software and when I was not around to assist.
Summary
My findings of the present study show an interesting relationship between
independent learning and behavior modeling. Student-participants wanted to have a
visual confirmation or proof through behavior modeling to show the task was possible
and could be accomplished. The student-participants felt confident after witnessing me
or someone else showing the process and achieving the task.
Action Plan
The final step in the action research process is the reflection stage and the
development of an action plan where knowledge gained is used to resolve the area of
focus identified in step one. (Mertler, 2013). Once the plan is applied, it should be
monitored and adjusted as needed to adapt individual environments, students, and
teachers. Mertler (2013) states the plan may be a formal document or a set of guidelines
for carrying out the recommendations. Table 5.1 is an action planning table outlining the
results and future steps to action.

84
Table 5.1
Action Research Plan
Summary of
Research
Question and
Findings
Recommended
Actions
Who Will
Collect
Data?
Timeline Resources
Necessary
1. What factors
from social
cognitive theory
(cognitive,
environmental,
behavior)
influenced
students’
self-efficacy with
computer
technology in an
undergraduate
graphic arts
course?
The factors are
independent
learning
(environmental),
new and
unfamiliar tasks
(cognitive),
behavior
modeling
(behavior),
access to support
materials and no
time constraints
(environmental)
1. Students
are given
more time to
work alone
2. Increased
resources are
available to
students
3. Students
observe
processes
through
behavior
modeling and
witness
someone
successfully
completing a
task or
project
1. The
participant-
researcher
1. Over a
semester
long class
1. Additional
time in the
computer lab
for the class.
2. Quick
access to
support
documentation
already
professionally
created
(software
company
resource).
3. Resources to
create
additional
documentation
specific to the
class projects.
4. Resources to
conduct
demonstrations
, computer and
projector
The results of this study support graphic skills acquisition has the potential to
influence computer self-efficacy in a positive away. The factors identified from
Bandura’s social cognitive theory were:

85
1. Cognition: New and Unfamiliar Tasks
2. Environmental:
a. Independent Learning
b. Access to Support Materials
c. No Time Constraints
3. Behavior: Behavior Modeling
Based on the present study, I will increase independent learning in the classroom
and students will have more autonomous time to work with and to practice concepts.
Students are often driven by deadlines and the creative process has a different timeline
requiring space for some reflection and self-critique. I have often noticed when the class
is over more than half of the students stay to continue to work on projects independent.
While working, individuals get into a zone and can use this time to experiment.
Incorporating work time during the class can help achieve this.
In supporting independent learning I must consider the resources students will
need to be successful. Gaining access to support materials created by the publisher
would be very helpful so the students could find answers quickly and directly from the
source. This would minimize the time spent searching for an answer online through
numerous search results claiming to have the answer. Contextual help could also
streamline the process so students can get the help needed exactly where and when the
question is directly in the program. In additional to software resources, I need to grow
my resources specific to the course to provide more guidance for these independent
learners.

86
Cognitively, computer self-efficacy increased when the task was new and
unfamiliar, therefore I can incorporate many new techniques in the course. The student
may be aware of one use for a specific tool but I can share multiple uses. I can also build
lessons around the use of several tools coming together in creative ways to create a new
effect.
Another factor I can increase is behavior modeling, the students reported high
levels of feeling more efficacious when given the opportunity to see someone else using
it before trying it themselves. I use behavior modeling when I show various techniques
or processes in a live demonstration. This could also be created on a video so it could be
watched when needed at a certain part of the project. A video would also assist those
students who need different timing or perhaps have a language barrier. This active
research study was made possible through the support of the education and art
departments and the numerous participating students. This study increased my students’
computer self-efficacy and motivated me to improve my teaching in specific ways.
Recommendations for Graphic Arts Faculty
Based on the findings presented in this dissertation, the participant-researcher has
the following recommendations for graphic arts faculty
1. Allow students to work independently, make independent aesthetic decisions,
and develop a personalized path to completing the project objectives.
2. Challenge students with new and unfamiliar tasks by introducing advanced
techniques and methods for experimentation.
3. Provide support and resources through materials students can explore alone,
accessible both in and out of class.

87
4. Provide a lot of diverse examples, approach the material in various individual
ways, and allow the students to find the approach best suited
5. Use behavior modeling to share your expectations and what can potentially be
achieved in the project.
Recommendations for Future Research
The present study has several limitations and provides opportunities for future
research. First, participants were derived from a convenience sample of students enrolled
in Visual Arts Computing at the University of South Carolina. Secondly, the Compeau
and Higgins (1995b) computer self-efficacy scale was the only instrument used to collect
data. Third, due to the historical document data used, demographic information was not
included in the research design.
The participant-researcher suggests future research on graphic arts and Adobe
Photoshop classes at the same university with various instructors. This research could
also be conducted at different universities and community colleges, where students often
have less access to technology. An instrument to gain knowledge about technology
access and ownership could also inform educators and administrators in higher education.
Cassidy and Eachus (2002) present support for positive alignment between both
computer ownership and total software programs with computer self-efficacy.
Future research could include other items of measurement in addition to computer
self-efficacy and technology access. Measurements for computer attitudes and growth
mindset could be used to understand connections between several concepts and can work
together to improve computer self-efficacy. Demographic information on gender, race,

88
major, and age could provide additional information to help identify learners who need
more attention.
Conclusions
The data presented supports graphic skills acquisition as a method for increasing
computer self-efficacy in a graphics arts course. This increased self-efficacy helped
develop more independent and confident computer users; scale results showed students
were more efficacious when working on new programs with no assistance. Graphics
experience has the ability to substantially shape computer self-efficacy and this signifies
a need to expand opportunities for graphics interactions, especially in curriculum and
training environments (Busch 1995; Hasan 2003). Educators and trainers should consider
including graphics as a component of technology projects to help enhance computer self-
efficacy.
The evidence shows learners who received graphics instruction are more
efficacious about using new and unfamiliar software in the future. Original,
unprecedented actions call for individuals to engage in additional thought, recall, and
comparison to previous and comparable computer activity. Thoughts then transition to
composite knowledge and work to move the task forward. Cognition, behavior, and
environment function “interactively as determinants of each other” in a pattern of
reciprocal determinism (Bandura, 1986, p. 23). Positive conditions and experiences
connect and cycle to form a sustained sequence of healthy, hopeful general computer
instincts and beliefs.

89
REFERENCES
Abdullah, N., Abidin, M., Luan, W., Majid, O., Atan, H. (2006). The attitude and
motivation of English language teachers towards the use of computers. Malaysian
Online Journal of Instructional Technology, 3(1), 57-67.
Agarwal, R., & Karahanna, E. (2000). Time flies when you're having fun: Cognitive
absorption and beliefs about information technology usage. MIS Quarterly, 665-
694.
Albion, P. (2001). Some factors in the development of self-efficacy beliefs for computer
use among teacher education students. Journal of Technology and Teacher
Education, 9(3), 321
Ang, S., & Slaughter, S. (2000). The missing context of information technology
personnel: A review and future directions for research. In Ang, S., & Slaughter, S.
(Eds.), Framing the domains of IT management: Projecting the future through the
past, (305-327).
Bandura, A. (1977). Self-efficacy: Toward a unifying theory of behavioral change.
Psychological Review, 84(2), 191.
Bandura, A. (1978). Reflections on self-efficacy. Advances in Behaviour Research and
Therapy, 1(4), 237-269.
Bandura, A. (1986). Social foundations of thought and action: A social cognitive theory.
Englewood Cliffs, New Jersey: Prentice-Hall, Inc.
Bandura, A. (1989). Regulation of cognitive processes through perceived self-efficacy.
Developmental psychology, 25(5), 729.
Bandura, A. (1991). Social cognitive theory of self-regulation. Organizational Behavior
and human decision processes, 50(2), 248-287.
Bandura, A. (1993). Perceived self-efficacy in cognitive development and functioning.
Educational Psychologist, 28(2), 117-148.
Bandura, A. (1997). Self-efficacy: The exercise of control. New York, NY: Macmillan.
Bandura, A. (2005). The evolution of social cognitive theory. In K.G. Smith & M. A.
Hitt (Eds.) Great Minds in Management (9-35) Oxford: Oxford University Press.

90
Bandura, A. (2012). On the functional properties of perceived self-efficacy revisited.
Journal of Management, 38(1), 9-44.
Bandura, A., Blanchard, E., Ritter, B. (1969). Relative efficacy of desensitization and
modeling approaches for inducing behavioral, affective, and attitudinal changes.
Journal of Personality and Social Psychology, 13(3), 173.
Bandura, A., & Wood, R. (1989). Effect of perceived controllability and performance
standards on self-regulation of complex decision making. Journal of Personality
and Social Psychology, 56(5), 805.
Bandura, A., & Schunk, D. (1981). Cultivating competence, self-efficacy, and intrinsic
interest through proximal self-motivation. Journal of Personality and Social
Psychology, 41(3), 586.
Bandura, A., & Jourden, F. (1991). Self-regulatory mechanisms governing the impact of
social comparison on complex decision making. Journal of Personality and
Social Psychology, 60(6), 941.
Bauer, W. (2003). Gender differences and the computer self-efficacy of preservice music
teachers. Journal of Technology in Music Learning, 2(1), 9-15.
Beas, M., & Salanova, M. (2006). Self-efficacy beliefs, computer training and
psychological well-being among information and communication technology
workers. Computers in Human Behavior, 22(6), 1043-1058.
Beckers, J., & Schmidt, H. (2001). The structure of computer anxiety: A six-factor
model. Computers in Human Behavior, 17(1), 35-49.
Beckers, J., & Schmidt, H. (2003). Computer experience and computer anxiety.
Computers in Human Behavior, 19(6), 785-797.
Bejou, D. (2005). Treating students like customers. BizEd, 4(3), 44-47.
Berg, B. L., Lune, H., & Lune, H. (2004). Qualitative research methods for the social
sciences (Vol. 5). Boston, MA: Pearson.
Berg, C. (2005). Factors related to observed attitude change toward learning chemistry
among university students. Chemistry Education Research and Practice, 6(1), 1-
18.
Bessiere, K., Newhagen, J., Robinson, J., Shneiderman, B. (2006). A model for computer
frustration: The role of instrumental and dispositional factors on incident, session,
and post-session frustration and mood. Computers in Human Behavior, 22(6),
941-961.

91
Bhattacherjee, A. (2001a). An empirical analysis of the antecedents of electronic
commerce service continuance. Decision Support Systems, 32(2), 201-214.
Bhattacherjee, A. (2001b). Understanding information systems continuance: An
expectation-confirmation model. MIS Quarterly, 351-370.
Bhattacherjee, A., & Premkumar, G. (2004). Understanding changes in belief and attitude
toward information technology usage: A theoretical model and longitudinal test.
MIS Quarterly, 229-254.
Bhattacherjee, A., Perols, J., Sanford, C. (2008). Information technology continuance: A
theoretic extension and empirical test. The Journal of Computer Information
Systems, 49(1), 17.
Bhattacherjee, A., & Barfar, A. (2011). Information technology continuance research:
current state and future directions. Asia Pacific Journal of Information Systems,
21(2), 1-18.
Bozionelos, N. (2001). Computer anxiety: relationship with computer experience and
prevalence. Computers in Human Behavior, 17(2), 213-224.
Bozionelos, N. (2002). Computer interest: A case for expressive traits. Personality and
Individual Differences, 33(3), 427-444.
Bozionelos, N. (2004). Socio-economic background and computer use: the role of
computer anxiety and computer experience in their relationship. International
Journal of Human-Computer Studies, 61(5), 725-746.
Breault, R. (2003). Dewey, Freire, and a pedagogy for the oppressor. Multicultural
Education, 10(3), 2.
Brinkerhoff, J. (2006). Effects of a long-duration, professional development academy on
technology skills, computer self-efficacy, and technology integration beliefs and
practices. Journal of Research on Technology in Education, 39(1), 22-43.
Broos, A. (2005). Gender and information and communication technologies (ICT)
anxiety: Male self-assurance and female hesitation. CyberPsychology & Behavior,
8(1), 21-31.
Brown, S., Fuller, R., Vician, C. (2004). Who's afraid of the virtual world? Anxiety and
computer-mediated communication. Journal of the Association for Information
Systems, 5(2), 2.
Brown, S., Venkatesh, V., Goyal, S. (2012). Expectation confirmation in technology use.
Information Systems Research, 23(2), 474-487.

92
Burkett, W., Atlantic, P., Compton, D., Burkett, G. (2001). An examination of computer
attitudes, anxieties, and aversions among diverse college populations: issues
central to understanding information sciences in the new millennium. Age (M),
21(22.95), 27-79.
Burkhardt, M., & Brass, D. (1990). Changing patterns or patterns of change: The effects
of a change in technology on social network structure and power. Administrative
Science Quarterly, 104-127.
Busch, T. (1995). Gender differences in self-efficacy and attitudes toward computers.
Journal of Educational Computing Research, 12(2), 147-158.
Cabaroglu, N. (2014). Professional development through action research: Impact on self-
efficacy. System, 44, 79-88.
Carlson, R., & Grabowski, B. (1992). The effects of computer self-efficacy on direction
following behavior in computer assisted instruction. Journal of Computer-Based
Instruction, 19(1), 6-11.
Cassidy, S., & Eachus, P. (2002). Developing the computer user self-efficacy (CUSE)
scale: Investigating the relationship between computer self-efficacy, gender and
experience with computers. Journal of Educational Computing Research, 26(2),
133-153.
Caverly, D. C., Nicholson, S. A., Battle, J., & Atkins, C. E. (2008). Techtalk: Web 2.0,
blogs, and developmental education. Journal of Developmental Education, 32(1),
34.
Chang, S. (2005). Computer anxiety and perception of task complexity in learning
programming-related skills. Computers in Human Behavior, 21(5), 713-728.
Chen, C.S. (2002). Self-regulated learning strategies and achievement in an introduction
to information systems course. Information Technology, Learning and
Performance Journal, 20(01).
Chen, C., & Chalupa, M. (2003). The role of motivation and use of Learning Strategies in
computer courses: Early and late in the semester. Delta Pi Epsilon Journal, 45(2),
98-117.
Chickering, A., & Reisser, L. (1993). Education and Identity. The Jossey-Bass Higher
and Adult Education Series. Jossey-Bass Inc., San Francisco, CA.
Chu, L. (2003). The effects of web page design instruction on computer self-efficacy of
preservice teachers and correlates. Journal of Educational Computing Research,
28(2), 127-142.

93
Claggett, J., & Goodhue, D. (2011, January). Have IS researchers lost bandura's self-
efficacy concept? A discussion of the definition and measurement of computer
self-efficacy. In System Sciences (HICSS), 2011 44th Hawaii International
Conference on (pp. 1-10). IEEE.
Clark, M., Abrams, D., Niaura, R., Eaton, C., & Rossi, J. (1991). Self-efficacy in weight
management. Journal of Consulting and Clinical Psychology, 59(5), 739.
Clawson, M. (2015). The Digital Darkroom Is Born. In iPhoneography (pp. 2-13). New
York, NY: Apress
Cohen, L., Manion, L., & Morrison, K. (2013). Research methods in education. New
York, NY: Routledge.
Collins, A., & Halverson, R. (2009). Rethinking education in the age of technology: The
digital revolution and schooling in America. New York, NY: Teachers College
Press.
Cooperative Institutional Research Program (CIRP) (2008), University of South Carolina
Office of Institutional Research and Assessment. Retrieved from
http://www.ipr.sc.edu
Compeau, D. (1992). Individual reactions to computing technology: a social cognitive
theory perspective.
Compeau, D., & Higgins, C. (1995a). Application of social cognitive theory to training
for computer skills. Information Systems Research, 6 (2), 118-143.
Compeau, D., & Higgins, C. (1995b). Computer self-efficacy: Development of a measure
and initial test. MIS Quarterly, 189-211.
Compeau, D., Higgins, C., Huff, S. (1999). Social cognitive theory and individual
reactions to computing technology: A longitudinal study. MIS Quarterly, 145-
158.
Compeau, D., Marcolin, B., Kelley, H. (2001). Generalizability of technology
acceptance research using student subjects. In A. Ramirez (Ed.), Proceedings of
the Administrative Science Association of Canada, 22 (4), 35-47.
Compeau, D., Gravill, J., Haggerty, N., Kelley, H. (2006). Computer self-efficacy: A
review. Human-computer Interaction in Management Information Systems:
Foundations, 4, 225-261.
Conrad, A., & Munro, D. (2008). Relationships between computer self-efficacy,
technology, attitudes and anxiety: Development of the computer technology use
scale (CTUS). Journal of Educational Computing Research, 39(1), 51-73.

94
Cookman, C. (2003). The Evolving Status of Photojournalism Education. ERIC Digest.
Creswell, J. W. (2002). Educational Research: Planning, conducting, and evaluating
quantitative and qualitative research. Upper Saddle River, NJ: Merrill/Pearson.
Creswell, J. W. (2009). Research design: Qualitative, quantitative, and mixed methods
approaches. Los Angeles, CA: Sage.
Csikszentmihalyi, M., (1990). Flow: The psychology of optimal experience (Vol. 41).
New York, NY: Harper Perennial.
Csikszentmihalyi, M., & Csikszentmihalyi, I. S. (1992). Optimal experience:
Psychological studies of flow in consciousness. Cambridge, UK: Cambridge
University Press.
Davis, F., Bagozzi, R., Warshaw, P. (1989). User acceptance of computer technology: a
comparison of two theoretical models. Management Science, 35(8), 982-1003.
De Guinea, A., & Webster, J. (2011). Are we talking about the task or the computer? An
examination of the associated domains of task-specific and computer self-
efficacies. Computers in Human Behavior, 27(2), 978-987.
Deng, X., Doll, W., Truong, D. (2004). Computer self-efficacy in an ongoing use context.
Behaviour & Information Technology, 23(6), 395-412.
Dewey, J. (1900/1956). The school and society. (Vol. 151). Carbondale, IL: SIU Press.
Dewey, J. (1902/1956). The child and the curriculum. Chicago, IL: University of
Chicago Press.
Dewey, J. (1910). How we think. Mineola, NY: Courier Corporation.
Dewey, J. (1922). Democracy and education. Mineola, NY: Courier Corporation.
Dewey, J. (1934). Art as experience. City of Westminster, London: Penguin.
Dietz-Uhler, B., & Lanter, J. R. (2009). Using the four-questions technique to enhance
learning. Teaching of Psychology, 36(1), 38-41.
Ding, Y., Chai, K. H., & Ng, G. (2012, May). Continued use of information technology:
A synthesis and future directions. In Service Sciences (IJCSS), 2012 International
Joint Conference on (pp. 206-210). IEEE.
Downey, J. (2006). Refining the scope in computer self-efficacy relationships: an
empirical comparison of three instruments in predicting competence and attitudes.
In ECIS (pp. 13-25).
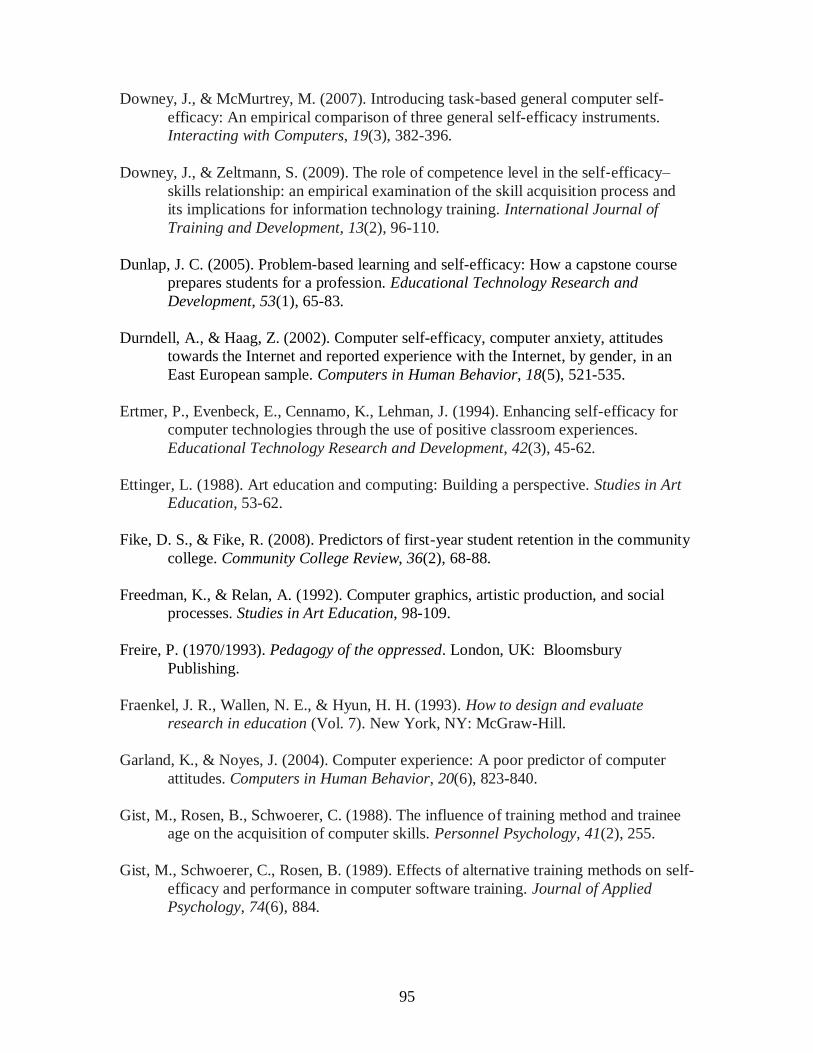
95
Downey, J., & McMurtrey, M. (2007). Introducing task-based general computer self-
efficacy: An empirical comparison of three general self-efficacy instruments.
Interacting with Computers, 19(3), 382-396.
Downey, J., & Zeltmann, S. (2009). The role of competence level in the self‐efficacy–
skills relationship: an empirical examination of the skill acquisition process and
its implications for information technology training. International Journal of
Training and Development, 13(2), 96-110.
Dunlap, J. C. (2005). Problem-based learning and self-efficacy: How a capstone course
prepares students for a profession. Educational Technology Research and
Development, 53(1), 65-83.
Durndell, A., & Haag, Z. (2002). Computer self-efficacy, computer anxiety, attitudes
towards the Internet and reported experience with the Internet, by gender, in an
East European sample. Computers in Human Behavior, 18(5), 521-535.
Ertmer, P., Evenbeck, E., Cennamo, K., Lehman, J. (1994). Enhancing self-efficacy for
computer technologies through the use of positive classroom experiences.
Educational Technology Research and Development, 42(3), 45-62.
Ettinger, L. (1988). Art education and computing: Building a perspective. Studies in Art
Education, 53-62.
Fike, D. S., & Fike, R. (2008). Predictors of first-year student retention in the community
college. Community College Review, 36(2), 68-88.
Freedman, K., & Relan, A. (1992). Computer graphics, artistic production, and social
processes. Studies in Art Education, 98-109.
Freire, P. (1970/1993). Pedagogy of the oppressed. London, UK: Bloomsbury
Publishing.
Fraenkel, J. R., Wallen, N. E., & Hyun, H. H. (1993). How to design and evaluate
research in education (Vol. 7). New York, NY: McGraw-Hill.
Garland, K., & Noyes, J. (2004). Computer experience: A poor predictor of computer
attitudes. Computers in Human Behavior, 20(6), 823-840.
Gist, M., Rosen, B., Schwoerer, C. (1988). The influence of training method and trainee
age on the acquisition of computer skills. Personnel Psychology, 41(2), 255.
Gist, M., Schwoerer, C., Rosen, B. (1989). Effects of alternative training methods on self-
efficacy and performance in computer software training. Journal of Applied
Psychology, 74(6), 884.

96
Gist, M., & Mitchell, T. (1992). Self-efficacy: A theoretical analysis of its determinants
and malleability. Academy of Management Review, 17(2), 183-211.
Grant, D., Malloy, A., Murphy, M. (2009). A comparison of student perceptions of their
computer skills to their actual abilities. Journal of Information Technology
Education: Research, 8(1), 141-160.
Gravill, J., Compeau, D., Marcolin, B. (2006). Experience effects on the accuracy of self-
assessed user competence. Information & Management, 43(3), 378-394.
Gravill, J., & Compeau, D. (2008). Self-regulated learning strategies and software
training. Information & Management, 45(5), 288-296.
Guy, R., & Lownes-Jackson, M. (2010). An examination of students’ self-efficacy beliefs
and demonstrated computer skills. Issues in Informing Science and Information
Technology, 7, 285-295.
Hackbarth, G., Grover, V., & Mun, Y. (2003). Computer playfulness and anxiety:
positive and negative mediators of the system experience effect on perceived ease
of use. Information & Management, 40(3), 221-232.
Hackett, G., & Betz, N. (1981). A self-efficacy approach to the career development of
women. Journal of Vocational Behavior, 18(3), 326-339.
Haffer, A., & Raingruber, B. (1998). Discovering confidence in clinical reasoning and
critical thinking development in baccalaureate nursing students. The Journal of
Nursing Education, 37(2), 61-70.
Hagevik, R., Aydeniz, M., & Rowell, C. G. (2012). Using action research in middle level
teacher education to evaluate and deepen reflective practice. Teaching and
Teacher Education, 28(5), 675-684.
Harrison, A., & Rainer Jr, R. (1992a). The influence of individual differences on skill in
end-user computing. Journal of Management Information Systems, 93-111.
Harrison, A., & Rainer, R. (1992b). An examination of the factor structures and
concurrent validities for the computer attitude scale, the computer anxiety rating
scale, and the computer self-efficacy scale. Educational and Psychological
Measurement, 52(3), 735-745.
Harrison, A., Rainer Jr, R., Hochwarter, W., Thompson, K. (1997). Testing the self-
efficacy—Performance Linkage of Social—Cognitive Theory. The Journal of
Social Psychology, 137(1), 79-87.
Hasan, B. (2003). The influence of specific computer experiences on computer self-
efficacy beliefs. Computers in Human Behavior, 19(4), 443-450.

97
Hasan, B. (2006). Delineating the effects of general and system-specific computer self-
efficacy beliefs on IS acceptance. Information & Management, 43(5), 565-571.
Hasan, B., & Ali, J. (2006). The impact of general and system-specific self-efficacy on
computer training learning and reactions. Academy of Information and
Management Sciences Journal, 9(1), 17.
Hasan, B., & Ahmed, M. (2010). A path analysis of the impact of application-specific
perceptions of computer self-efficacy and anxiety on technology acceptance. End-
User Computing, Development, and Software Engineering: New Challenges: New
Challenges, 354.
Hattie, J. (1990). The computer and control over learning. Education, 110(4), 414-417.
Havelka, D. (2003). Predicting software self-efficacy among business students: A
preliminary assessment. Journal of Information Systems Education, 14(2), 145-
152.
Havelka, D., Beasley, F., Broome, T. (2004). A study of computer anxiety among
business students. American Journal of Business, 19(1), 63-71.
Hayashi, A., Chen, C., Ryan, T., Wu, J. (2004). The role of social presence and
moderating role of computer self-efficacy in predicting the continuance usage of
e-learning systems. Journal of Information Systems Education, 15, 139-154.
He, J., & Freeman, L. (2009). Are men more technology-oriented than women? The role
of gender on the development of general computer self-efficacy of college
students. AMCIS 2009 Proceedings, 672.
He, J., & Freeman, L. (2010). Understanding the formation of general computer self-
efficacy. Communications of the Association for Information Systems, 26(1), 12.
Heinssen, R., Glass, C., Knight, L. (1987). Assessing computer anxiety: Development
and validation of the computer anxiety rating scale. Computers in Human
Behavior, 3(1), 49-59.
Henry, J., & Stone, R. (1995). Computer self-efficacy and outcome expectancy: the
effects on the end-user's job satisfaction. ACM SIGCPR Computer Personnel,
16(4), 15-34.
Henry, J., & Stone, R. (1997). The development and validation of computer self-efficacy
and outcome expectancy scales in a nonvolitional context. Behavior Research
Methods, Instruments, & Computers, 29(4), 519-527.
Hill, T., Smith, N., Mann, M. (1986). Communicating innovations: Convincing computer
phobics to adopt innovative technologies. Advances in Consumer Research, 13(1),
419-422.

98
Hill, T., Smith, N., Mann, M. (1987). Role of efficacy expectations in predicting the
decision to use advanced technologies: The case of computers. Journal of Applied
Psychology, 72(2), 307.
Hooks, B. (2014). Teaching to transgress. New York, NY: Routledge.
Hsu, W., & Huang, S. (2006). Determinants of computer self-efficacy—an examination
of learning motivations and learning environments. Journal of Educational
Computing Research, 35(3), 245-265.
Huffman, A., Whetten, J., Huffman, W. (2013). Using technology in higher education:
The influence of gender roles on technology self-efficacy. Computers in Human
Behavior, 29(4), 1779-1786.
Igbaria, M., & Iivari, J. (1995). The effects of self-efficacy on computer usage. Omega,
23(6), 587-605.
Jan, S. (2015). The relationships between academic self-efficacy, computer self-efficacy,
prior experience, and satisfaction with online learning. American Journal of
Distance Education, 29(1), 30-40.
Jasperson, J., Carter, P., Zmud, R. (2005). A comprehensive conceptualization of post-
adoptive behaviors associated with information technology enabled work systems.
MIS Quarterly, 29(3), 525-557.
Johnson, D., Bartholomew, K., Miller, D. (2006). Improving computer literacy of
business management majors: A case study. Journal of Information Technology
Education: Research, 5(1), 77-94.
Johnston, D. C. (1997). Computers clogged, IRS seeks to hire outside processors. New
York Times (Jan. 31).
Joinson, A. (2001). Self-disclosure in computer-mediated communication: The role of
self-awareness and visual anonymity. European /journal of Social Psychology,
31(2), 177-192.
Johnson, B., & Christensen, L. (2000). Educational research: Quantitative and qualitative
approaches. Boston, MA: Allyn & Bacon/Pearson.
Johnson, R. (2005). An empirical investigation of sources of application-specific
computer-self-efficacy and mediators of the efficacy—performance relationship.
International Journal of Human-Computer Studies, 62(6), 737-758.
Joo, Y., Bong, M., & Choi, H. (2000). Self-efficacy for self-regulated learning, academic
self-efficacy, and Internet self-efficacy in Web-based instruction. Educational
Technology Research and Development, 48(2), 5-17.

99
Jorde-Bloom, P. (1988). Self-efficacy expectations as a predictor of computer use: A look
at early childhood administrators. Computers in the Schools, 5(1-2), 45-64.
Jorde-Bloom, P., & Ford, M. (1988). Factors influencing early childhood administrators'
decisions regarding the adoption of computer technology. Journal of Educational
Computing Research, 4(1), 31-47.
Kanfer, R., & Ackerman, P. (1989). Motivation and cognitive abilities: An
integrative/aptitude-treatment interaction approach to skill acquisition. Journal of
Applied Psychology, 74(4), 657.
Kanfer, R., Ackerman, P., Murtha, T., Dugdale, B., Nelson, L. (1994). Goal setting,
conditions of practice, and task performance: A resource allocation perspective.
Journal of Applied Psychology, 79(6), 826.
Karahanna, E., Straub, D., Chervany, N. (1999). Information technology adoption across
time: a cross-sectional comparison of pre-adoption and post-adoption beliefs. MIS
Quarterly, 183-213.
Karsten, R., & Roth, R. (1998). The relationship of computer experience and computer
self-efficacy to performance in introductory computer literacy courses. Journal of
Research on Computing in Education, 31(1), 14-24.
Karsten, R., & Schmidt, D. (2008). Business student computer self-efficacy: Ten years
later. Journal of Information Systems Education, 19(4), 445.
Kay, R. (1992). The computer literacy potpourri: A review of the literature, or McLuhan
revisited. Journal of Research on Computing in Education, 24(4), 446-456.
Kay, R. (1996). The acquisition of computer knowledge: A formative analysis. Ottawa:
National Library of Canada = Bibliotheque nationale du Canada.
Kay, R. (2008a). Exploring the relationship between emotions and the acquisition of
computer knowledge. Computers & Education, 50(4), 1269-1283.
Kay, R., & Loverock, S. (2008). Assessing emotions related to learning new software:
The computer emotion scale. Computers in Human Behavior, 24(4), 1605-1623.
Kher, H., Downey, J., Monk, E. (2013). A longitudinal examination of computer self-
efficacy change trajectories during training. Computers in Human Behavior,
29(4), 1816-1824.
Kidd, T. T. (Ed.). (2008). Social Information Technology: Connecting Society and
Cultural Issues: Connecting Society and Cultural Issues. Hershey, PA: Igi
Global.

100
Kim, H., Chan, H. C., Chan, Y. P. (2007). A balanced thinking–feelings model of
information systems continuance. International Journal of Human-Computer
Studies, 65(6), 511-525.
King, J., Bond, T., & Blandford, S. (2002). An investigation of computer anxiety by
gender and grade. Computers in Human behavior, 18(1), 69-84.
Kinzie, M., Delcourt, M., Powers, S. (1994). Computer technologies: Attitudes and self-
efficacy across undergraduate disciplines. Research in Higher Education, 35(6),
745-768.
Kolb, D. (2014). Experiential learning: Experience as the source of learning and
development. Boston, MA: Pearson Education.
Lader, M. (1972). The nature of anxiety. The British Journal of Psychiatry, 121(564),
481-491.
Lee, C., & Bobko, P. (1994). Self-efficacy beliefs: Comparison of five measures. Journal
of Applied Psychology, 79(3), 364.
Lee, M. (2010). Explaining and predicting users’ continuance intention toward e-
learning: An extension of the expectation–confirmation model. Computers &
Education, 54(2), 506-516.
Levin, M. (2012). Academic integrity in action research. Action Research,
1476750312445034.
Limayem, M., Hirt, S., Cheung, C. (2007). How habit limits the predictive power of
intention: The case of information systems continuance. MIS Quarterly, 705-737.
Limayem, M., & Cheung, C. (2008). Understanding information systems continuance:
The case of Internet-based learning technologies. Information & Management,
45(4), 227-232.
Longstreet, P., Xiao, X., Sarker, S., Sprott, D. (2011). Predicting technology related
performance: Where self-prophecy and computer self-efficacy meet. In AMCIS.
Loyd, B., & Gressard, C. (1984) Reliability and factorial validity of computer attitude
scales. Educational and Psychological Measurement 44.2: 501-505.
Loyd, D. L., Kern, M. C., & Thompson, L. (2005). Classroom research: Bridging the
ivory divide. Academy of Management Learning & Education, 4(1), 8-21.
Madigan, E., Goodfellow, M., & Stone, J. (2007, March). Gender, perceptions, and
reality: Technological literacy among first-year students. In ACM SIGCSE
Bulletin (Vol. 39, No. 1, pp. 410-414). ACM.

101
Marakas, G., Yi, M., Johnson, R. (1996). The multilevel construct of computer self-
efficacy: an empirical investigation at the general and task-specific levels. ICIS
1996 Proceedings, 53.
Marakas, G., Yi, M., Johnson, R. (1998). The multilevel and multifaceted character of
computer self-efficacy: Toward clarification of the construct and an integrative
framework for research. Information Systems Research, 9(2), 126-163.
Marakas, G., Johnson, R., & Clay, P. F. (2007). The evolving nature of the computer
self-efficacy construct: an empirical investigation of measurement construction,
validity, reliability and stability over time. Journal of the Association for
Information Systems, 8(1), 2.
Martocchio, J. (1992). Microcomputer usage as an opportunity: The influence of context
in employee training. Personnel Psychology, 45(3), 529.
Martocchio, J., & Webster, J. (1992). Effects of feedback and cognitive playfulness on
Performance in microcomputer software training. Personnel Psychology, 45(3),
553-578.
Martocchio, J. (1994). Effects of conceptions of ability on anxiety, self-efficacy, and
learning in training. Journal of Applied Psychology, 79(6), 819.
Martocchio, J., & Dulebohn, J. (1994). Performance feedback effects in training: The role
of perceived controllability. Personnel Psychology, 47(2), 357.
McManus, T. (2000). Individualizing instruction in a Web-based hypermedia learning
environment: Nonlinearity, advance organizers, and self-regulated learners.
Journal of Interactive Learning Research, 11(2), 219-251.
Merriam, S. B., Johnson-Bailey, J., Lee, M. Y., Kee, Y., Ntseane, G., & Muhamad, M.
(2001). Power and positionality: Negotiating insider/outsider status within and
across cultures. International Journal of Lifelong Education, 20(5), 405-416.
Mertler, C. A. (2013). Action Research: Improving Schools and Empowering Educators:
Improving Schools and Empowering Educators. Sage Publications.
Mitchell, T., Hopper, H., Daniels, D., George-Falvy, J., James, L. (1994). Predicting self-
efficacy and performance during skill acquisition. Journal of Applied Psychology,
79(4), 506.
Miura, I. (1987). The relationship of computer self-efficacy expectations to computer
interest and course enrollment in college. Sex Roles, 16(5-6), 303-311.
Morgan, D. L., & Morgan, R. K. (2001). Single-participant research design: Bringing
science to managed care. American Psychologist, 56(2), 119.

102
Moores, T., & Chang, J. (2009). Self-efficacy, overconfidence, and the negative effect on
subsequent performance: A field study. Information & Management, 46(2), 69-
76.
Moos, D., & Azevedo, R. (2008a). Monitoring, planning, and self-efficacy during
learning with hypermedia: The impact of conceptual scaffolds. Computers in
Human Behavior, 24(4), 1686-1706.
Moos, D., & Azevedo, R. (2008b). Exploring the fluctuation of motivation and use of
self- regulatory processes during learning with hypermedia. Instructional Science,
36(3), 203-231.
Moos, D., & Azevedo, R. (2009). Learning with computer-based learning environments:
A literature review of computer self-efficacy. Review of Educational Research,
79(2), 576-600.
Morris, Jr., R. & Thrasher, E., "An empirical investigation of the relationships among
math confidence, computer confidence and computer self-efficacy: Implications
for technology education" (2008). AMCIS 2008 Proceedings. Paper 82.
Morris Jr, R., & Thrasher, E. (2009). Investigating the relationships among math
confidence, computer confidence, and computer self-efficacy and the implications
for technology education. Learning in Higher Education, 32(1), 4.
Multon, K., Brown, S., Lent, R. (1991). Relation of self-efficacy beliefs to academic
outcomes: A meta-analytic investigation. Journal of Counseling Psychology,
38(1), 30.
Mun, Y., & Hwang, Y. (2003). Predicting the use of web-based information systems:
self-efficacy, enjoyment, learning goal orientation, and the technology acceptance
model. International Journal of Human-Computer Studies, 59(4), 431-449.
Munro, M. C., Huff, S. L., Marcolin, B. L., & Compeau, D. R. (1997). Understanding
and measuring user competence. Information & Management, 33(1), 45-57.
Murphy, C., Coover, D., Owen, S. (1989). Development and validation of the computer
self-efficacy scale. Educational and Psychological measurement, 49(4), 893-899.
Nielsen, D., Fleming, M., Kumarasuriyar, A., Gard, S. (2010). Digital design
communication: Measuring learner technological prowess and self-efficacy in
problem resolution. In Proceedings of INTED 2010 International Technology,
Education and Development Conference (pp. 003595-003605). International
Association of Technology, Education and Development (IATED).
Ogletree, S., & Williams, S. (1990). Sex and sex-typing effects on computer attitudes and
aptitude. Sex Roles, 23(11-12), 703-712.

103
Oliver, R. L. (1977). Effect of expectation and disconfirmation on post exposure product
evaluations: An alternative interpretation. Journal of Applied Psychology, 62(4),
480.
Oliver, R. L. (1980). A cognitive model of the antecedents and consequences of
satisfaction decisions. Journal of Marketing Research, 460-469.
Olivier, T., & Shapiro, F. (1993). Self-Efficacy and Computers. Journal of Computer-
Based Instruction, 20(3), 81-85.
Pace, S. (2004). A grounded theory of the flow experiences of Web users. International
Journal of Human-Computer Studies, 60(3), 327-363.
Pajares, F. (2009), Information on self-efficacy, A community of scholars. Retrieved from
http://www.uky.edu/~eushe2/Pajares/self-efficacy.html
Palaigeorgiou, G., Siozos, P., Konstantakis, N., Tsoukalas, I. (2005). A computer attitude
scale for computer science freshmen and its educational implications. Journal of
Computer Assisted Learning, 21(5), 330-342.
Parthasarathy, M., & Bhattacherjee, A. (1998). Understanding post-adoption behavior in
the context of online services. Information Systems Research, 9(4), 362-379.
Petrina, S. (2000). The politics of technological literacy. International Journal of
Technology and Design Education, 10(2), 181-206.
Popovich, P., Hyde, K., Zakrajsek, T., Blumer, C. (1987). The development of the
attitudes toward computer usage scale. Educational and Psychological
Measurement, 47(1), 261-269.
Potosky, D., & Bobko, P. (2001). A model for predicting computer experience from
attitudes toward computers. Journal of Business and Psychology, 15(3), 391-404.
Potosky, D. (2002). A field study of computer efficacy beliefs as an outcome of training:
the role of computer playfulness, computer knowledge, and performance during
training. Computers in Human Behavior, 18(3), 241-255.
Prensky, M. (2001). Digital natives, digital immigrants part 1. On the horizon, 9(5), 1-6.
Rainer, R., & Harrison, A. (1993). Toward Development of the End User Computing
Construct in a University Setting. Decision Sciences, 24(6), 1187-1202.
Richardson, A., & Tan, R. (2005). Building a better" geekness" measure for the world of
tomorrow. ACIS 2005 Proceedings, 20.
Rozell, E., & Gardner III, W. (1999). Computer-related success and failure: a
longitudinal field study of the factors influencing computer-related performance.
Computers in Human Behavior, 15(1), 1-10.

104
Rozell, E., & Gardner III, W. (2000). Cognitive, motivation, and affective processes
associated with computer-related performance: a path analysis. Computers in
Human Behavior, 16(2), 199-222.
Russon, A., Josefowitz, N., Edmonds, C. (1994). Making computer instruction
accessible: Familiar analogies for female novices. Computers in Human
Behavior, 10(2), 175-187.
Saadé, R., & Kira, D. (2009). Computer anxiety in e-learning: The effect of computer
self-efficacy. Journal of Information Technology Education: Research, 8(1), 177-
191.
Saga, V., & Zmud, R. (1993, October). The nature and determinants of IT acceptance,
routinization, and infusion. In Proceedings of the IFIP TC8 working conference
on diffusion, transfer and implementation of information technology (pp. 67-86).
Elsevier Science.
Salanova, M., Grau, R., Cifre, E., Llorens, S. (2000). Computer training, frequency of
usage and burnout: the moderating role of computer self-efficacy. Computers in
Human Behavior, 16(6), 575-590.
Saleem, H., Beaudry, A., Croteau, A. (2011). Antecedents of computer self-efficacy: A
study of the role of personality traits and gender. Computers in Human Behavior,
27(5), 1922-1936.
Salmon, J. (2015). Using observational methods in nursing research. Nursing Standard,
29(45), 36-41.
Santoso, H., Lawanto, O., Becker, K., Fang, N., Reeve, E. (2014). High and low
computer self-efficacy groups and their learning behavior from self-regulated
learning perspective while engaged in interactive learning modules. Journal of
Pre-College Engineering Education Research (J-PEER), 4(2), 3.
Schunk, D., & Ertmer, P. (1999). Self-regulatory processes during computer skill
acquisition: Goal and self-evaluative influences. Journal of Educational
Psychology, 91(2), 251.
Scull, C. (1999). Computer anxiety at a graduate computer center: computer factors,
support, and situational pressures. Computers in Human Behavior, 15(2), 213-
226.
Serap Kurbanoglu, S. (2003). Self-efficacy: a concept closely linked to information
literacy and lifelong learning. Journal of Documentation, 59(6), 635-646.
Servon, L., & Nelson, M. (2001). Community technology centers and the urban
technology gap. International Journal of Urban and Regional Research, 25(2),
419-426.

105
Shih, H. (2006). Assessing the effects of self-efficacy and competence on individual
satisfaction with computer use: An IT student perspective. Computers in Human
Behavior, 22(6), 1012-1026.
Shin, N. (2006). Online learner’s ‘flow’ experience: An empirical study. British Journal
of Educational Technology, 37(5), 705-720.
Shumack, K. (2009). Learning as experience: a model for teaching the reflective exegesis
for communication design practice. Art, Design & Communication in Higher
Education, 7(2), 59-72.
Smith, J. (1994). The effects of education on computer self-efficacy. Journal of
Industrial Teacher Education, 31(3), 51-65.
Smith, S. (2001). The Four Sources of Influence on Computer Self-Efficacy. Delta Pi
Epsilon Journal, 43(1), 27-39.
Squires, W. (1983). Creative computers: Premises and promises. Art Education, 21-23.
Stephens, P. (2006). Validation of the business computer self-efficacy scale: Assessment
of the computer literacy of incoming business students. Journal of Educational
Computing Research, 34(1), 29-46.
Stokrocki, M. (1986). Qualitative interpretation of a microcomputer graphics course for
gifted and talented adolescents. Art Education, 39(1), 44-47.
Stritzke, W., Nguyen, A., & Durkin, K. (2004). Shyness and computer-mediated
communication: A self-presentational theory perspective. Media Psychology,
6(1), 1-22.
Talja, S. (2005). The social and discursive construction of computing skills. Journal of
the American Society for Information Science and Technology, 56(1), 13-22.
Thatcher, J., Perrewé, P. (2002). An empirical examination of individual traits as
antecedents to computer anxiety and computer self-efficacy. MIS Quarterly, 381-
396.
Thatcher, J., Zimmer, J., Gundlach, M., McKnight, D. (2008). Internal and external
dimensions of computer self-efficacy: An empirical examination. Engineering
Management, IEEE Transactions on, 55(4), 628-644.
Thong, J., Hong, S., Tam, K. (2006). The effects of post-adoption beliefs on the
expectation-confirmation model for information technology continuance.
International Journal of Human-Computer Studies, 64(9), 799-810.
Torkzadeh, G., & Koufteros, X. (1994). Factorial validity of a computer self-efficacy
scale and the impact of computer training. Educational and psychological
measurement, 54(3), 813-821.

106
Torkzadeh, G., Koufteros, X., Pflughoeft, K. (1996). Structural equation modeling for
confirming the self-efficacy instrument. In Proceedings of the 1996 Decision
Sciences Institute.
Torkzadeh, G., & Van Dyke, T. (2002). Effects of training on Internet self-efficacy and
computer user attitudes. Computers in Human Behavior, 18(5), 479-494.
Torkzadeh, G., Chang, J., Demirhan, D. (2006). A contingency model of computer and
Internet self-efficacy. Information & Management, 43(4), 541-550.
Tsai, H., Compeau, D., Haggerty, N. (2007). Of races to run and battles to be won:
Technical skill updating, stress, and coping of IT professionals. Human Resource
Management, 46(3), 395-409.
Turkle, S. (1980). Computer as roschach. Society, 17(2), 15-24.
Tzeng, J. (2009). The impact of general and specific performance and self-efficacy on
learning with computer-based concept mapping. Computers in Human Behavior,
25(4), 989-996.
Art Department (2016), University of South Carolina (USC). Retrieved from
http://artsandsciences.sc.edu/art/studio/studioarts
Van Braak, J. (2004). Domains and determinants of university students’ self-perceived
computer competence. Computers & Education, 43(3), 299-312.
Van Dinther, M., Dochy, F., Segers, M. (2011). Factors affecting students’ self-efficacy
in higher education. Educational Research Review, 6(2), 95-108.
Venkatesh, V. (1999). Creation of favorable user perceptions: exploring the role of
intrinsic motivation. MIS Quarterly, 239-260.
Venkatesh, V., & Davis, F. (1996). A model of the antecedents of perceived ease of use:
Development and test. Decision Sciences, 27(3), 451-481.
Venkatesh, V. (2000c). Determinants of perceived ease of use: Integrating control,
intrinsic motivation, and emotion into the technology acceptance model.
Information Systems Research, 11(4), 342-365.
Venkatesh, V., Morris, M., Ackerman, P. (2000a). A longitudinal field investigation of
gender differences in individual technology adoption decision-making processes.
Organizational Behavior and Human Decision Processes, 83(1), 33-60.
Venkatesh, V., & Davis, F. (2000b). A theoretical extension of the technology acceptance
model: Four longitudinal field studies. Management Science, 46(2), 186-204.

107
Venkatesh, V., & Morris, M. (2000d). Why don't men ever stop to ask for directions?
Gender, social influence, and their role in technology acceptance and usage
behavior. MIS Quarterly, 115-139.
Venkatesh, V., Speier, C., Morris, M. (2002). User acceptance enablers in individual
decision making about technology: Toward an integrated model. Decision
Sciences, 33(2), 297-316.
Venkatesh, V., Morris, M., Davis, G., Davis, F. (2003). User acceptance of information
technology: Toward a unified view. MIS Quarterly, 425-478.
Vygotsky, L. (1978). Mind in society: The development of higher psychological
processes. Cambridge, MA: Harvard University Press.
Wang, C., Harris, J., & Patterson, P. (2013). The roles of habit, self-efficacy, and
satisfaction in driving continued use of self-service technologies a longitudinal
study. Journal of Service Research, 16(3), 400-414.
Webster, J., & Martocchio, J. J. (1992). Microcomputer playfulness: Development of a
measure with workplace implications. MIS Quarterly, 201-226.
Webster, J., & Martocchio, J. (1993). Turning work into play: Implications for
microcomputer software training. Journal of Management, 19(1), 127-146.
Webster, J., & Martocchio, J. (1995). The differential effects of software training
previews on training outcomes. Journal of Management 21 (4), 757-787.
Wilfong, J. (2006). Computer anxiety and anger: The impact of computer use, computer
experience, and self-efficacy beliefs. Computers in Human Behavior, 22(6), 1001-
1011.
Wood, J. V. (1989). Theory and research concerning social comparisons of personal
attributes. Psychological Bulletin, 106(2), 231.
Wood, R., & Locke, E. (1987). The relation of self-efficacy and grade goals to academic
performance. Educational and psychological measurement, 47(4), 1013-1024.
Wood, R., & Bandura, A. (1989a). Impact of conceptions of ability on self-regulatory
mechanisms and complex decision making. Journal of Personality and Social
Psychology, 56(3), 407.
Wood, R., & Bandura, A. (1989b). Social cognitive theory of organizational
management. Academy of Management Review, 14(3), 361-384.
Woodrow, J. (1991). A comparison of four computer attitude scales. Journal of
Educational Computing Research, 7(2), 165-187.

108
Woszczynski, A., Roth, P., Segars, A. (2002). Exploring the theoretical foundations of
playfulness in computer interactions. Computers in Human Behavior, 18(4), 369-
388.
Yan, Z. (2006). Different experiences, different effects: A longitudinal study of learning
computer program in a network environment. Computers in Human Behavior,
22(3), 364-380.
Yin, R. K. (2013). Case study research: Design and methods. Los Angeles, CA: Sage.
Yang, H., & Yoo, Y. (2004). It's all about attitude: revisiting the technology acceptance
model. Decision Support Systems, 38(1), 19-31.

109
APPENDIX A
COMPUTER SELF-EFFICACY SCALE
DEVELOPED BY D. COMPEAU AND C. HIGGINS (1995B)

110

111
APPENDIX B
INSTITUTIONAL REVIEW BOARD (IRB) APPROVAL