the efficacy of using the therapeutic lifestyle changes
TRANSCRIPT

6
Wei
ght
Man
agem
ent
New
slet
ter
The efficacy of using the Therapeutic Lifestyle Changes diet forreducing comorbidities associated with overweight and obesity
Learning objectives After reading this article the reader willbe able to:
1. Explain the rationale for the use ofthe Therapeutic Lifestyle Changes(TLC) diet as an effective therapeuticstrategy for individuals at risk for type2 diabetes and/or coronary heart dis-ease (CHD).
2. Identify the difference(s) between theNational Colesterol EducationProgram (NCEP) Adult TreatmentPanel (ATP III) and TLC diets.
3. Explain the relationship between eachof the “maximal diet therapy” compo-nents targeted in the TLC diet andCHD risk.
4. Recognize the steps of the NutritionCare Process.
5. Understand how the Nutrition CareProcess and Evidence-Based NutritionPractice Guidelines relate to care forpatients with diabetes, CHD andoverweight/obesity.
The increasing prevalence of over-weight and obesity is of majorconcern in the United States.
According to National Health and
Nutrition Examination Survey(NHANES) 2003–2004 data, nearly two-thirds of U.S. adults are either over-weight or obese (1). This represents anapproximate 18% increase over the pastthree decades, with the prevalence ofobesity contributing most to thisincrease, roughly doubling from 15% to31% (2).
Obesity is recognized as an inde-pendent risk factor for numerous chron-ic disease conditions, including hyper-tension, dyslipidemia and type 2 dia-betes (3–6). Type 2 diabetes is three tosix times more prevalent in obese adults(body mass index [BMI] 30 and above)compared with normal-weight individu-als (BMI between 18.5 and 24.9) (7).Moreover, an overweight adult (BMIbetween 25 and 29.9) triples his/her riskof developing type 2 diabetes within 10years (8). In addition, individuals withdiabetes are at an increased risk ofdeveloping CHD (9). CHD comprisesmore than 50% of all cardiovascular dis-ease-related events in U.S. adults and isthe leading cause of diabetes-relateddeath (10).
Of concern is the tendency for type 2diabetes and CHD risk factors to co-occur, thus complicating treatmentoptions. An estimated 65% and 72% ofoverweight and obese Americans,respectively, have hypertension, dyslipi-demia or both (3). A study examiningover 1.9 million members of a largemanaged-care program found hyperten-sion, dyslipidemia and/or type 2 dia-betes to commonly co-occur in morethan 50% of affected individuals (11).Consequently, it is likely that health-carepractitioners will be required to treatoverweight or obese individuals withcomorbid conditions, including hyper-tension, dyslipidemia, and/or type 2 dia-betes. Fortunately, healthy eating pat-terns and moderate weight loss oftenimprove the risk factors associated withtype 2 diabetes and CHD.
Tools such as the American Dietetic
Association’s (ADA) Evidence-BasedNutrition Practice Guidelines forDisorders of Lipid Metabolism, AdultWeight Management, and Diabetes 1 and2 may be valuable resources for thenutrition care of patients and clientswith these diseases (12–14).Additionally, using ADA’s Nutrition CareProcess and Standardized Language canassist in prioritizing the nutrition prob-lems and determining the appropriateinterventions for care (15).
Medical nutrition therapy(MNT)Therapeutic lifestyle changes (TLC) havebeen shown to be an effective therapy inreducing CHD risk (16). TLC is thenonpharmacologic component of theThird Report of the NCEP and ATP III,which emphasizes diet, physical activity,behavior change and weight loss (ifindicated). The ATP III guidelinesspecifically target low-density lipopro-tein cholesterol (LDL) due to its strong,positive correlation with CHD risk (9).Although drug therapy may also beimplemented based on a person’sabsolute risk for CHD, ATP III places amajor emphasis on TLC as an essentialmodality for persons at risk for CHD(12). Registered dietitians (RDs) have avital role in delivering MNT thatinvolves each component of the TLC.Specifically, MNT by a RD over severalpatient/client encounters can lead to areduction in total cholesterol (T-Chol),LDL, and triglycerides; improved weightstatus; and may lead to reduction or dis-continuation in drug therapy (12).Further, increasing the number andduration of encounters with the RD maybenefit the higher-risk patient (12).
Although the TLC diet specifically tar-gets lowering LDL, it has also been shownto positively affect blood pressure (BP)and T-Chol (17). In addition, the TLCdiet positively influences serum triglyc-eride (TG) levels with little or no effect onhigh-density lipoprotein cholesterol
Michele Doucette,PhD, is currently apart-time instructorand researcher atGeorgia StateUniversity inAtlanta, Ga. She isalso a part-time fel-low in the Divisionof Nutrition andPhysical Activity atthe Centers forDisease Control andPrevention.
Kari Kren, MPH, RD,LD, is currentlyworking at ADA asmanager on theGovernance Team,where she workswith members onthe development ofevidence-basednutrition practiceguidelines andtoolkits for theEvidence AnalysisLibrary.

7
(HDL) levels (18–19). This is especiallyimportant for those individuals with type2 diabetes, the metabolic syndrome, andtheir associated dyslipidemias.
As previously mentioned, TLC is amultifaceted approach that includes spe-cific dietary recommendations, referredfrom herein as the “TLC diet.” The TLCdiet differs from previous NCEP dietguidelines (Step I and Step II diets) inthat it de-emphasizes “total fat” whilefocusing on “types” of fat. Specifically, theTLC diet emphasizes reducing dietarycholesterol (<200 mg./day), saturatedfatty acids (SFA) (<7% of total calories),and trans fatty acids (lower intake) whileallowing total fat to comprise 25%–35%of total calories, and limiting total carbo-hydrates to no more than 60% of totalcalories (Table 1). Daily sodium intakefollows the Dietary Guidelines forAmericans 2005 recommendation of lessthan 2,300 mg./day (20).
In addition, optional nutrient consid-erations for “maximal” LDL reductioninclude augmenting the diet with plantstanols/sterols (2 g./day) and viscous (sol-uble) fibers (5–10 g./day) (Table 2).Incorporating TLC will be most effectivewhen the RD works with the patientusing the four steps of the Nutrition CareProcess (assessment, diagnosis, interven-tion and monitoring and evaluation) inorder to focus each intervention and pro-mote the intended nutrition outcomes(21).
TLC dietary componentsThe TLC diet meets both the DietaryGuidelines for Americans 2005 and the2006 American Heart Association(AHA) Diet and LifestyleRecommendations (20,22). A prelimi-nary nutrient analysis of the TLC menuplan at various calorie levels indicatesthat it provides the recommended nutri-ent levels of specific dietary componentsknown to affect CHD risk (9). Overall,the TLC diet is low in SFA, dietary cho-lesterol and sodium, while providingadequate levels of monounsaturatedfatty acids (MUFA), polyunsaturatedfatty acids (PUFA), and potassium. Thismacro- and micronutrient distributionholds true at the reduced calorie levels,
making it a high-quality diet for weightreduction.
LipidsAlthough the exact mechanisms bywhich diet affects serum lipids have yetto be elucidated, the serum TG andHDL effects observed with the TLC dietmay in part be due to the diet’smacronutrient distribution. The TLCdiet is slightly higher in total fat andMUFA and lower in carbohydrates thanthe previous NCEP II diet (23). Highercarbohydrate diets (>60% total calories)tend to increase serum TG and reduceHDL levels, whereas diets that replace aportion of the dietary carbohydratewith MUFA or PUFA, often decreaseserum TG levels with little or nodecrease in HDL levels (18,24–25). Arecent study looking at the effect of var-ious macronutrient distributions onCHD risk found that partial substitu-tion of carbohydrate with either protein
(half from plant sources) or unsaturat-ed fat (primarily monounsaturated)improved BP, T-Chol, LDL, HDL andTG levels and reduced the risk of CHD(18). This is an important considerationfor those with insulin resistance or type2 diabetes with concomitant dyslipi-demia (elevated triglycerides and lowHDL levels) (9).
SodiumOf note, due to similar sodium, fruitand vegetable recommendations, thesodium and potassium content of theDietary Approaches to StopHypertension (DASH) and TLC dietsare comparable. It is well-establishedthat the DASH diet is an effective MNTfor the treatment of hypertension(26–28). The fact that the TLC dietalso has a low sodium/high potassiumnutrient profile likely accounts for its
See TLC Diet, page 8
Volume 4, N
umber 4, Spring 2007
Table 1. Nutrient composition of the TLC diet
Nutrient Recommended intake
Saturated fat* <7% of total calories
Polyunsaturated fat Up to 10% of total calories
Monounsaturated fat Up to 20% total calories
Total fat 25%–35% of total calories
Fiber 20–30 g./day
Protein Approximately 15% of total calories
Cholesterol <200 mg./day
Total calories‡ Balance energy intake and expenditureto maintain desirable body weight/prevent weight gain
* Trans fatty acids are another LDL cholesterol-raising fat that should be kept at alow intake.† Carbohydrates should be derived predominantly from foods rich in complex carbohydrates including grains, especially whole grains, fruits, and vegetables.‡ Daily energy expenditure should include at least moderate physical activity (contributing about 200 kcal./day).
Summary of the Therapeutic Lifestyle Change (TLC) diet based on NCEP ATP III guidelines.Adapted from (9).

blood pressure-lowering effects (17).
Weight lossAnother benefit of the TLC diet is that ithas been shown to promote weight loss infree-living conditions (17,19). In additionto dietary modifications, moderate weightloss often improves fasting blood glucose,BP and serum lipid levels (6,29–31).Weight loss is an effective therapeuticstrategy for reducing the risk of type 2diabetes. Moderate weight loss in middle-aged adults with impaired glucose toler-ance has been shown to reduce the risk ofdeveloping type 2 diabetes by more than50% over a four year period (32). Weightloss has a similar effect on hypertension.Analyses of a Framingham Study cohortcomposed of overweight, normotensivemiddle-aged adults found that a moder-ate weight loss of 6.8 kg. or more reducedthe long-term risk of hypertension by28% (33). Several organizations includingthe ADA, the North American Associationfor the Study of Obesity, The ObesityStudy (NAASO), the American Society forClinical Nutrition (ASCN), and the AHArecommend weight loss for individuals atrisk for type 2 diabetes and/or CHD byusing TLC dietary components (22,34–35).
Maximal dietary therapyThe primary goal of the TLC diet is to
achieve as much LDL lowering as possi-ble, as this can be achieved through“maximal dietary therapy” as describedin the ATP III Guidelines (16).Recommendations for this therapy arelisted in Table 2. The cumulative effectof these recommendations can reduceLDL by 25%, compared with a typicalU.S. diet (16,36). This level of LDLreduction is similar to what can beachieved through drug therapy (37–38).The maximal dietary therapy modifica-tions include SFA and cholesterol reduc-tion, increased plant stanols/sterols andsoluble fiber intake, and weight reduc-tion. Each patient or client will have dif-ferent nutrition adequacy, health status,and environmental/behavioral status,thus a systematic process for obtaining,verifying and interpreting data duringassessment is important (21).
Saturated fatty acids and trans fattyacidsThere is a robust scientific foundationsupporting SFA intake as the primaryLDL-raising dietary factor. It has beenestimated that for every 1% increase intotal kilocalories from SFA, there is aconcomitant 2% increase in LDL (16).Conversely, LDL is lowered by 2% forevery 1% decrease in total kilocaloriesfrom SFA. A recent weight loss study ofobese adults found that a TLC-like dietderiving less than 7% of total kilocalo-ries from SFA reduced LDL serum levels
an average of 8% (19).The TLC diet also recommends that
intakes of trans fatty acids be kept low.Trans fatty acids raise LDL and lowerHDL, which has a significant negativeimpact on the LDL-to-HDL ratio (39).Further, the ADA Disorders of LipidMetabolism Evidence-based NutritionPractice Guideline advises that transfatty acid consumption be as low as pos-sible and that a cardioprotective dietarypattern should contain less than 7% ofcalories from saturated fat and transfatty acids (12). In addition to theireffects on HDL and LDL, trans fattyacids are also believed to increase serumlipoprotein (a), TG, and endothelial dys-function (39–40). Trans fatty-acid intakecan be reduced by substituting liquidvegetable oils, soft margarine, and transfatty acid-free margarines for butter,stick margarine, and shortening.
MUFA and PUFAReplacing SFA (and trans fatty acids) witheither MUFA or PUFA has been shown tolower CHD risk. Data from the 20 YearsFollow-up of the Nurses’ Health Studyfound that a higher PUFA intake (approx-imately 7% of total kilocalories) inwomen is associated with a decreased riskof CHD (41). Although there are noknown controlled clinical trials compar-ing MUFA and SFA on CHD risk, substi-tuting MUFA with SFA has been shown
8
Wei
ght
Man
agem
ent
New
slet
ter
See TLC Diet, page 10
TLC Diet, from page 7
Table 2. Maximal dietary therapy for LDL-c reduction
Dietary modification Recommendation Approximate LDL-c reduction (%)
Saturated fat reduction Reduce saturated fat to <7% total calories 8–10
Cholesterol reduction Reduce dietary cholesterol to <200 mg./day 3–5
Dietary fiber Viscous (soluble) fiber 5–10 g./day 3–5
Weight reduction 10-pound weight loss 5–8
Total LDL-c lowering 25–30
Recommendations for Maximal Dietary Therapy for LDL-c Reduction. Adapted from (9).
9
Volume 4, N
umber 4, Spring 2007
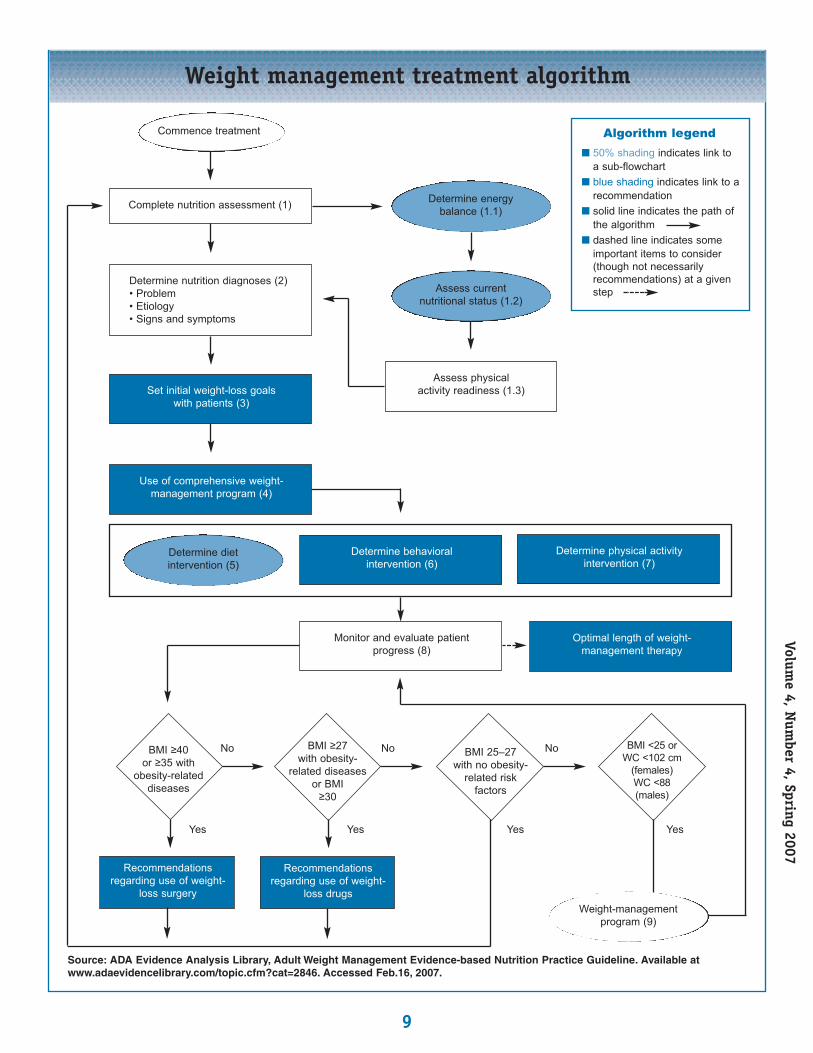
Weight management treatment algorithm
Source: ADA Evidence Analysis Library, Adult Weight Management Evidence-based Nutrition Practice Guideline. Available at www.adaevidencelibrary.com/topic.cfm?cat=2846. Accessed Feb.16, 2007.
Commence treatment
Complete nutrition assessment (1)
Assess physical activity readiness (1.3)Set initial weight-loss goals
with patients (3)
Use of comprehensive weight-management program (4)
Determine nutrition diagnoses (2)• Problem• Etiology• Signs and symptoms
Recommendationsregarding use of weight-
loss surgery
BMI ≥40 or ≥35 with
obesity-relateddiseases
Recommendationsregarding use of weight-
loss drugs
BMI ≥27 with obesity-
related diseasesor BMI
≥30
Determine energy balance (1.1)
Assess current nutritional status (1.2)
Determine diet intervention (5)
Weight-managementprogram (9)
Determine physical activity intervention (7)
Optimal length of weight-management therapy
Determine behavioral intervention (6)
Monitor and evaluate patientprogress (8)
BMI 25–27 with no obesity-
related risk factors
BMI <25 or WC <102 cm
(females)WC <88(males)
No No No
YesYesYesYes
n 50% shading indicates link toa sub-flowchart
n blue shading indicates link to arecommendation
n solid line indicates the path ofthe algorithm
n dashed line indicates some important items to consider(though not necessarily recommendations) at a givenstep
Algorithm legend

10
Wei
ght
Man
agem
ent
New
slet
ter
to decrease serum LDL. Moreover, partial-ly replacing carbohydrate with MUFA candecrease serum TG levels with little or nodecrease in HDL levels (18, 24–25).Therefore, the TLC diet recommendsMUFA and PUFA intakes of up to 20%and 10% of total kilocalories, respectively.
Dietary cholesterolAlthough dietary cholesterol has beenshown to cause a marked LDL increasein laboratory animals, this effect has notbeen shown to be as pronounced inhumans. However, while the rise inserum LDL varies from person to per-son, meta-analyses of studies performedin controlled settings confirm that highdietary cholesterol intakes do indeedraise LDL levels (16).
Interestingly, although egg consump-tion accounts for more than one-thirdof cholesterol consumption in theUnited States, prospective data from theNurses’ Health Study and the HealthProfessionals Study found no significantimpact on frequency of egg consump-tion on CHD risk, except among womenwith diabetes (42). Conversely, a morerecent meta-analysis found that dietarycholesterol raises the T-Chol to HDLcholesterol ratio, negatively affecting theserum lipid profile (43). Therefore, dueto the potential for dietary cholesterol toraise LDL, the TLC diet limits choles-terol to 200 mg./day.
Plant stanols/sterolsPlant sterols are derived from soybeanand tall pine-tree oils. Sterol esters aretypically produced by esterifying theplant sterols to unsaturated fatty acids,thus increasing lipid solubility.Hydrogenating the plant sterols producesplant stanols, which can also be esterifiedto produce stanol esters. Stanol/sterolesters are readily dissolved in oils ormargarine and are currently available ina wide variety of foods, drinks, mar-garines and soft gel capsules. Once con-sumed, the esters undergo hydrolysis,releasing free stanols and sterols in a bio-available form that blocks cholesterolabsorption (44). Maximum dietary
effects occur at plant stanol/sterol intakesof approximately 2 g./day (16). In orderto sustain LDL reductions, stanol/sterol-containing products must be consumedon a daily basis. In addition, adjustmentsto caloric intake need to be consideredwhen margarine and food products con-taining stanols/sterols are consumed.ADA’s Disorders of Lipid MetabolismEvidence-based Nutrition PracticeGuideline recommends, “If consistentwith patient preference and not con-traindicated by risks or harms, thenplant sterol and stanol ester-enrichedfoods consumed two or three times perday, for a total consumption of 2 or 3 g.per day, may be used in addition to acardioprotective diet to further lower T-Chol by 4%–11% and LDL by 7%–15%.For maximal effectiveness, foods con-taining plant sterols and stanols (spreads,juices, yogurts) should be eaten withother foods. To prevent weight gain,patients should isocalorically substitutestanol- and sterol-enriched foods forother foods. Plant stanols and sterols areeffective in people taking statin drugs(12).”
Soluble fiberSoluble forms of dietary fiber canreduce LDL, whereas insoluble fibershave not been shown to significantlyreduce LDL levels (16). A meta-analysisof trials related to soluble fibers foundconsuming 2–10 g./day produced asmall, yet significant reduction in LDL(45). Therefore, ATP III guidelines rec-ommend including soluble fiber-richfoods (oats, guar, pectin, and psyllium)totaling at least 5–10 g./day, which canreduce LDL by approximately 5%.
Weight reductionThe LDL-lowering effects of the TLCdiet’s “maximal dietary therapy” can befurther enhanced by weight reduction inoverweight individuals. A meta-analysisof 70 studies found weight loss to beassociated with a significant decrease inLDL (46). This study estimated that a10–pound weight loss is associated witha 4 mg./dL. decrease in LDL. In addi-tion, the Multiple Risk FactorIntervention Trial (MRFIT) study
showed that weight reduction enhancesthe LDL-lowering effects of a low SFAand cholesterol diet (47). A more recentweight-loss study of obese post-menopausal women found that a mod-est 2% (4-pound) weight loss over a 10-week period was associated with a 9mg./dL. decrease in LDL (48).
In addition to reducing LDL, weightloss is important for other CHD-relatedrisk factors such as elevated TG and lowHDL levels. Based on ATP III guidelines,the first three months of TLC therapyfocuses on LDL reduction utilizing max-imal dietary strategies (16). Thus,reduced intakes of SFA and cholesteroland other dietary options (plantsterols/stanols and increased viscousfiber) are introduced first. If the LDLgoal is not achieved in the first threemonths, attention then shifts to otherCHD risk factors, specifically elevatedTG, low HDL levels, and the metabolicsyndrome (NCEP-defined as includingthree of the following five conditions:increased waist circumference, hyper-triglyceridemia, low HDL cholesterol,hypertension, and a fasting glucose of110 mg./dL. or higher) (16).
Because overweight and obesity arehighly correlated with the metabolicsyndrome, weight reduction is a second-ary target of TLC (16). As noted previ-ously, the ADA, NAASO, and ASCN rec-ommend weight loss for those individu-als at risk for, or with type 2 diabetes(34). Based on NCEP criteria for themetabolic syndrome, an estimated 86%of adults with type 2 diabetes have themetabolic syndrome (49). Thus, weightreduction using a reduced kilocalorieTLC-based diet plan will likely be a con-sideration for those with CHD risk fac-tors and/or at risk for type 2 diabetes.
Applying TLC using theNutrition Care ProcessUsing the Nutrition Care Process toincorporate TLC involves a systematicmethod where RDs must think critically,evaluate data, and determine interven-tions that address the nutrition-relatedproblems of the patient (21). An example
TLC Diet, from page 8
See TLC Diet, page 24

24
Wei
ght
Man
agem
ent
New
slet
ter
of this flow of treatment is displayed inthe algorithm on page 9, which outlinesthe Nutrition Care Process related toadult weight management (13). Similarto the TLC approach for CHD, weightloss or maintenance therapy that includesthe combination of diet, physical activityand behavior therapy is more effectivethan using any one intervention alone(13).
Assessment data is used to focus theintervention and may come from a vari-ety of sources, including referral informa-tion, medical records, the patient inter-view, and administrative data (21).Specific tools or questionnaires may alsobe used to obtain this data, such as physi-cal activity readiness or nutrition qualityof life. During the assessment, informa-tion is gathered about signs, symptoms,and etiology and is used to identify thepertinent nutrition diagnosis(es).
The nutrition diagnosis, or problem,is separate from a medical diagnosis andis the issue(s) that RDs are responsiblefor treating independently (15). Thenutrition diagnosis can be determinedby identifying the signs, symptoms, andetiology (i.e., cause or contributing riskfactors) of the problem (15).Determining the nutrition diagnosisinvolves critical thinking in order to findpatterns and relationships among assess-ment data, making multidisciplinaryconnections, prioritizing the relativeimportance, and stating the problemclearly so that outcomes are measurable(21). While indicators such as saturatedfat or cholesterol intake may be straight-forward to measure, quantifying out-comes such as increased nutrition-relat-ed knowledge may not be as clear. Thus,the diagnosis documentation should bespecific enough so that changes fromone encounter to the next are apparent.
Signs and symptoms that characterizea nutrition diagnosis may include bio-chemical/anthropometric/physical exammeasurements or findings, food/nutritionhistory, and client history information(15). Examples of etiologies that causethe symptoms are food- and nutrition-related knowledge deficit, lack of social
support, lack of value for behaviorchange, loss of appetite awareness, andlack of food planning (15). Commonnutrition diagnoses for a patient withobesity, CHD or type 2 diabetes mayinclude “excessive fat intake” or “excessivecarbohydrate intake,” and interventionsmight focus on setting goals to decreasethis behavior. A diagnosis of “food- andnutrition-related knowledge deficit”would require a different approach,which might include nutrition educationas the intervention (15).
As the critical link from the assess-ment to the intervention, the nutritiondiagnosis must be clearly stated and willbe used to frame the intervention.Determining the intervention willinvolve matching the intervention withthe patient’s needs, diagnosis and values,as well as setting goals, prioritizing,defining the nutrition prescription, andspecifying time and frequency of care(21). Specifically, the interventionshould focus on the etiology of thenutrition diagnosis (15).
A nutrition intervention focusedaround incorporating the TLC diet variesfrom patient to patient. However, in anoutpatient setting, the intervention willmost often include comprehensive nutri-tion education, nutrition counseling,and/or coordination of care. A nutritioncounseling intervention involves workingwith the patient to “set priorities, estab-lish goals, and create individualizedaction plans” that promote self-care (15).It includes determining and document-ing the theory or approach (e.g.,Behavior Modification, TranstheoreticalModel, etc.), the strategy (e.g., goal-set-ting, motivational interviewing, self-monitoring, problem-solving, etc.) andthe phase (e.g., involving, exploring-edu-cation, resolving, and closing) for thecounseling intervention (15).
For example, if an assessment revealsthat a patient has a diagnosis of physicalinactivity related to a hectic daily rou-tine and lack of a plan for physical activ-ity, a counseling intervention for thisdiagnosis (aimed at the etiology) mightinclude behavior modification (theory)to incorporate goal-setting to increasephysical activity and self-monitoring
using activity logs (strategies) to helpresolve (phase) the problem.
Some attention should be made topatients who may not be ready forchange. A patient who is not ready forchange will not benefit from certaininterventions, such as nutrition educa-tion. Instead, an intervention using theTranstheoretical Model and focused onmoving the patient/client from a pre-contemplation to a contemplation stagemay be beneficial.
The final and often ongoing step ofthe Nutrition Care Process involvesmonitoring and evaluation, which canonly be done effectively if the first threesteps (assessment, diagnosis, interven-tion) have been done thoroughly.
The purpose of monitoring and evalu-ating is to determine if the patient isattaining the goals or desired outcomes(21). Nutrition care outcomes can bemonitored, measured and evaluatedwhen clear and measurable diagnoseshave been documented. Outcomes suchas biochemical or anthropometric levelsmay lend themselves to measurement;however, outcomes that involve change inknowledge or ability may require a moreindepth system or scale for viewing themin measurable terms. It is this step of theprocess that allows RDs to explain how anutrition intervention—planned aroundthe specific nutrition diagnosis—leads toimproved nutrition outcomes.
The use of the Nutrition Care Processprovides an effective process for care toimprove health, while the TLC diet andADA’s Evidence-based Nutrition PracticeGuidelines provide the content of carefor patients with CHD, diabetes, and/oroverweight/obesity.
SummaryDue to the high prevalence of over-weight/obesity and associated chronic dis-ease risk in the United States, it is likelythat health-care practitioners will berequired to treat overweight or obeseindividuals with comorbid conditions.The TLC diet is an effective MNT treatingboth dyslipidemia and hypertension.Because it is also promotes weight losswhile improving the CHD risk associatedwith the metabolic syndrome, the TLC
TLC Diet, from page 10

25
Volume 4, N
umber 4, Spring 2007
diet can also be an important therapeuticstrategy in the prevention of type 2 dia-betes. With the use of the Nutrition CareProcess and tools such as ADA’s Evidence-based Nutrition Practice Guidelines tofocus the nutrition intervention, thepatient has a better chance of reaching theexpected outcomes of the TLC diet.
The findings and conclusions in this arti-cle are those of the authors and do notnecessarily represent the views of CDC.
References1. Ogden CL, Carroll MD, Curtin LR, et al.
Prevalence of overweight and obesity in the
United States, 1999-2004. JAMA. 2006;295
(13):1,549–1,555.
2. Flegal KM. Epidemiologic aspects of over-
weight and obesity in the United States.
Physiol Behav. 2005;86(5):599–602.
3. Brown CD, Higgins M, Donato KA, et al.
Body mass index and the prevalence of
hypertension and dyslipidemia. Obes Res.
2000;8(9):605–619.
4. National Institutes of Health. Clinical
guidelines on the identification, evaluation,
and treatment of overweight and obesity in
adults—The Evidence Report. National
Institutes of Health. Obes Res. 1998;6(suppl
2):51S–209S.
5. Wilson PWF, D’Agostino RB, Sullivan L,
Parise H, Kannel WB. Overweight and obesi-
ty as determinants of cardiovascular risk:
The Framingham Experience. Arch Intern
Med. 2002;162(16):1,867–1,872.
6. Wannamethee SG, Shaper AG, Walker M.
Overweight and obesity and weight change
in middle aged men: impact on cardiovascu-
lar disease and diabetes. J Epidemiol
Community Health. 2005;59(2):134–139.
7. Mokdad AH, Ford ES, Bowman BA, et al.
Prevalence of obesity, diabetes, and obesity-
related health risk factors, 2001. JAMA.
2003;289(1):76–79.
8. Field AE, Coakley EH, Must A, et al.
Impact of overweight on the risk of
developing common chronic diseases
during a 10-year period. Arch Intern Med.
2001;161(13):1,581–1,586.
9. Expert Panel on Detection Evaluation, and
Treatment of High Blood Pressure in Adults.
Executive summary of the third report of the
National Cholesterol Education Program
(NCEP) Expert Panel on Detection,
Evaluation, and Treatment of High Blood
Cholesterol in Adults (Adult Treatment Panel
III). JAMA. 2001;285(19):2,486–2,497.
10. American Heart Association. Heart Disease
and Stroke Statistics - 2006 Update. Dallas,
Texas: American Heart Association; 2006.
11. Selby JV, Tiffany P, Karter AJ, et al. High
rates of co-occurrence of hypertension, ele-
vated low-density lipoprotein cholesterol,
and diabetes mellitus in a large managed care
population. Amer J Manag Care. 2004;10(pt
2):163–170.
12. American Dietetic Association. Evidence
Analysis Library. In disorders of lipid
metabolism evidence-based nutrition
practice guideline. Available at
www.adaevidencelibrary.com/topic.cfm?cat=
2651.Accessed Feb. 16, 2007.
13. American Dietetic Association. Evidence
Analysis Library. In adult weight management
evidence-based nutrition practice guideline.
Available at www.adaevidencelibrary.com/
topic.cfm?cat=2798. Accessed Feb. 16, 2007.14. American Dietetic Association. MedicalNutrition Therapy Evidence-Based Guidesfor Practice. Nutrition Practice Guidelines forType 1 and 2 Diabetes Mellitus. CD- ROM;2001.15. American Dietetic Association. NutritionDiagnosis and Intervention: StandardizedLanguage for the Nutrition Care Process.Chicago, Ill.: American Dietetic Association;2007.16. Third Report of the National CholesterolEducation Program (NCEP) Expert Panel onDetection, Evaluation, and Treatment ofHigh Blood Cholesterol in Adults (AdultTreatment Panel III) Final Report.Circulation. 2002;106(25):3,143–3,421.17. Nowson CA, Worsley A, Margerison C, etal. Blood pressure change with weight loss isaffected by diet type in men. Am J Clin Nutr.2005;81(5):983–989.18. Appel LJ, Sacks FM, Carey VJ, et al. Effectsof protein, monounsaturated fat, and carbohy-drate intake on blood pressure and serumlipids: results of the OmniHeart RandomizedTrial. JAMA. 2005;294(19): 2,455–2,464.19. Graffagnino CL, Falko JM, La Londe M,et al. Effect of a community-based weightmanagement program on weight loss andcardiovascular disease risk factors. Obesity.2006;14(2):280–288.20. U.S. Department of Health and HumanServices and U.S. Department of Agriculture.Dietary Guidelines for Americans, 2005.Available at www.healthierus.gov/dietaryguidelines/. Accessed Dec. 18, 2006.
21. Lacey K, Pritchett, E. Nutrition Care
Process and Model: ADA adopts road map to
quality care and outcomes management. J
Amer Diet Assoc. 2003;103(8):1,061–1,072.
22. Lichtenstein AH, Appel LJ, Brands M, et
al. Diet and lifestyle recommendations revi-
sion 2006: a scientific statement from the
American Heart Association Nutrition
Committee. Circulation. 2006;114(1):82–96.
23. Stone NJ, Van Horn L. Therapeutic
lifestyle change and Adult Treatment Panel
III: evidence then and now. Curr Atheroscler
Rep. 2002;4(6):433–443.24. Archer WR, Lamarche B, St-Pierre AC, et al. High carbohydrate and high monounsaturated fatty acid diets similarlyaffect LDL electrophoretic characteristics in men who are losing weight. J Nutr.2003;133(10):3,124–3,129.25. Luscombe-Marsh ND, Noakes M, WittertGA, et al. Carbohydrate-restricted diets highin either monounsaturated fat or protein areequally effective at promoting fat loss andimproving blood lipids. Am J Clin Nutr.2005;81(4):762-772.
26. Appel LJ, Moore TJ, Obarzanek E, et al.
A clinical trial of the effects of dietary
patterns on blood pressure. N Engl J Med.
1997;336(16):1,117–1,124.
27. Elmer PJ, Obarzanek E, Vollmer WM, et
al. Effects of comprehensive lifestyle modifi-
cation on diet, weight, physical fitness, and
blood pressure control: 18-month results
of a randomized trial. Ann Intern Med.
2006;144(7):485–495.28. Sacks FM, Svetkey LP, Vollmer WM, et al.Effects on blood pressure of reduced dietarysodium and the Dietary Approaches to StopHypertension (DASH) Diet. N Engl J Med.2001;344(1):3–10.29. Metz JA, Stern JS, Kris-Etherton P, et al.A randomized trial of improved weight losswith a prepared meal plan in overweight andobese patients: impact on cardiovascular riskreduction. Arch Intern Med. 2000;160(14):2150-2158.30. Stevens VJ, Obarzanek E, Cook NR, et al.Long-term weight loss and changes in bloodpressure: results of the trials of hypertension.Ann Intern Med. 2001;134(1):1–11.31. Williams KV, Kelley DE. Metabolic conse-quences of weight loss on glucose metabo-lism and insulin action in type 2 diabetes.Diabetes Obes Metab. 2000;2(3):121–129.32. Tuomilehto J, Lindstrom J, Eriksson JG,et al. Prevention of type 2 diabetes mellitusby changes in lifestyle among subjects withimpaired glucose tolerance. N Engl J Med.2001;344(18):1,343–1,350.
33. Moore LL, Visioni AJ, Qureshi MM, et al.
Weight loss in overweight adults and the
long-term risk of hypertension: The
Framingham Study. Arch Intern Med.
See TLC Diet, page 26

26
Wei
ght
Man
agem
ent
New
slet
ter
2005;165(11):1,298–1,303.
34. Klein S, Sheard NF, Pi-Sunyer X, et al.
Weight management through lifestyle modi-
fication for the prevention and management
of type 2 diabetes: rationale and strategies: a
statement of the American Diabetes
Association, the North American Association
for the Study of Obesity, and the American
Society for Clinical Nutrition. Diabetes Care.
2004;27(8):2,067–2,073.
35. Buse JB, Ginsberg HN, Bakris GL, et al.
Primary prevention of cardiovascular
diseases in people with diabetes mellitus:
a scientific statement from the American Heart
Association and the American Diabetes
Association. Circulation. 2007;115(1):114–126.
36. Jenkins DJA, Kendall CWC, Faulkner DA,
et al. Assessment of the longer-term effects of
a dietary portfolio of cholesterol-lowering
foods in hypercholesterolemia. Am J Clin
Nutr. 2006;83(3):582–591.
37. Jenkins DJA, Kendall CWC, Marchie A,
et al. Effects of a dietary portfolio of choles-
terol-lowering foods vs Lovastatin on serum
lipids and C-reactive protein. JAMA.
2003;290(4):502-510.
38. Jenkins DJA, Kendall CWC, Marchie A, et
al. Direct comparison of a dietary portfolio
of cholesterol-lowering foods with a statin in
hypercholesterolemic participants. Am J Clin
Nutr. 2005;81(2):380–387.
39. Willett WC. The Mediterranean diet:
science and practice. Public Health Nutr.
2006;9:105–110.
40. Hu FB, Willett WC. Optimal diets for
prevention of coronary heart disease. JAMA.
2002;288(20):2,569–2,578.
41. Oh K, Hu FB, Manson JE. Dietary Fat
Intake and risk of coronary heart disease
in women: 20 years of follow-up of the
Nurses’ Health Study. Am J Epidemiol.
2005;161(7):672-679.
42. Hu FB, Stampfer MJ, Rimm EB, et al. A
prospective study of egg consumption and
risk of cardiovascular disease in men and
women. JAMA. 1999;281(15):1387-1394.
43. Weggemans RM, Zock PL, Katan MB.
Dietary cholesterol from eggs increases thera-
tio of total cholesterol to high-density lipopro-
tein cholesterol in humans: a meta-analysis.
Am J Clin Nutr. 2001;73(5):885–891.
44. Grundy SM. Stanol esters as a compo-
nent of maximal dietary therapy in the
National Cholesterol Education Program
Adult Treatment Panel III Report. Amer J
Cardiol. 2005;96(Suppl 1):47–50.
45. Brown L, Rosner B, Willett WW, Sacks
FM. Cholesterol-lowering effects of dietary
fiber: a meta-analysis. Am J Clin Nutr.
1999;69(1):30–42.
46. Dattilo AM, Kris-Etherton PM. Effects
of weight reduction on blood lipids and
lipoproteins: a meta-analysis. Am J Clin Nutr.
1992;56(2):320–328.
47. Stamler J, Briefel RR, Milas C, et al.
Relation of changes in dietary lipids and
weight, trial years 1-6, to changes in blood
lipids in the special intervention and usual
care groups in the Multiple Risk Factor
Intervention Trial. Am J Clin Nutr.
1997;65(1):272S–288S.
48. Bunyard LB, Dennis KE, Nicklas BJ.
Dietary intake and changes in lipoprotein
lipids in obese, postmenopausal women placed
on an American Heart Association Step 1 diet.
J Am Diet Assoc. 2002;102(1): 52–57.
49. Alexander CM, Landsman PB, Teutsch
SM, Haffner SM. NCEP-defined metabolic
syndrome, diabetes, and prevalence of
coronary heart disease among NHANES III
participants age 50 years and older.
Diabetes. 2003;52(5):1,210–1,214.
TLC Diet, from page 25