expert systems with applications -...
TRANSCRIPT

Expert Systems with Applications 39 (2012) 11535–11547
Contents lists available at SciVerse ScienceDirect
Expert Systems with Applications
journal homepage: www.elsevier .com/locate /eswa
A model for the integration of e-financial services questionnaireswith SERVQUAL scales under fuzzy linguistic modeling
Ramón A. Carrasco a, Francisco Muñoz-Leiva b,⇑, Juan Sánchez-Fernández b,Francisco J. Liébana-Cabanillas b
a Department of Software Engineering, University of Granada, Fac. Business and Economics, Campus Universitario La Cartuja, s/n. 18071, Granada E-18071, Spainb Department of Marketing and Market Research, Fac. Business and Economics, Campus Universitario La Cartuja, s/n. 18071, Granada E-18071, Spain
a r t i c l e i n f o
Keywords:SERVQUAL scaleData summarizationFuzzy linguistic modelingOpinion aggregationHeterogeneous data integratione-Financial services
0957-4174/$ - see front matter � 2012 Elsevier Ltd. Ahttp://dx.doi.org/10.1016/j.eswa.2012.03.055
⇑ Corresponding author.E-mail addresses: [email protected] (R.A. Carrasco), fran
[email protected] (J. Sanchez-FernáNdez), franlieb@ugr
a b s t r a c t
Although it is habitual to measure human perceptions with quite accurate instruments, perceptions arecharacterized by uncertainty and fuzziness. Furthermore, variations in individual perceptions and per-sonality mean that the same words can indicate very different perceptions. In this context, the fuzzy lin-guistic approach seems to be an appropriate framework for modeling information.
In this paper we explore the problem of integrating semantically heterogeneous data (natural languageincluded) from various websites with opinions about e-financial services. We develop an extension of thefuzzy model based on semantic translation (FMST) under the perspective of the service quality (SERV-QUAL) stream of research.
The model permits us to obtain a more precise representation of the opinions using each type of cus-tomers. By integrating all customers into different subsets, a financial entity can easily analyze the SERV-QUAL characteristics over time or other dimensions owing to the easy linguistic interpretability and highprecision of the results of the model.
� 2012 Elsevier Ltd. All rights reserved.
1. Introduction
In today’s global conditions, firms and financial entities mustnow compete not only with internal organizations, but also withexternal firms (Büyüközkan & Çifçi, 2012). Furthermore, becauseof the significance and influence of service quality on serviceindustries, as well as the difficulty in measuring service quality,many researchers have devoted much time to developing moregeneric instruments which could be widely employed to measureservice quality and satisfaction across different service sectors. Inmany cases, companies use different survey methodologies anddevelop their own measurement scales to measure the same prob-lem (online and offline).
In addition to traditional face-to-face surveys (PAPI, CAPI, HAPI),telephone surveys (CATI, TDE, VR, ASR) and self-administered sur-veys via mail or fax, Web surveys (CAWI, ACASI) have becomeincreasingly common. The ease with which online questionnairescan be developed and administered, along with reduced costs forcompanies to collect data using these new tools, has flooded themarket with surveys designed to measure consumer satisfaction.
ll rights reserved.
[email protected] (F. Muñoz-Leiva),.es (F.J. Liébana-Cabanillas).
This wide variety of surveying methods, however, makes itextremely difficult to compare results within the same companyor between competing companies which operate in the same sec-tor. It is therefore necessary to develop a tool to standardize surveyresults obtained with different methodologies, design proposalsand measurement scales, and set time horizons. The objective ofsuch a tool is to improve the interpretation and comparison of sur-vey results and lend them far greater reliability when used bymanagers to support decision-making processes.
More concretely, these methods can be roughly categorized intotwo types: incident-based or attribute-based methods (Lin, 2010).Among the successive variants of the latter, the SERVQUAL instru-ment or service quality model (Parasuraman, Zeithaml, & Berry,1985, 1988, 1991, 1994), also called the PZB model, is the mostcommonly used (Lin, 2010). SERVQUAL is a multiple-item scalefor measuring five dimensions of service quality: tangibles, reliabil-ity, responsiveness, assurance, and empathy.
Several authors have adapted the SERVQUAL instrument to ana-lyze electronic financial services expectations and perceptionsabout service quality (e.g., González, Mueller, & Mack, 2008; Han& Baek, 2004), but none have adopted a fuzzy linguistic approach.Some authors (Saleh & Ryan, 1991) propose a modified SERVQUALwith a basic questionnaire which presents customers with a collec-tion of statements (questions) about the five above-mentioned

11536 R.A. Carrasco et al. / Expert Systems with Applications 39 (2012) 11535–11547
dimensions to ask them if they are agree or disagree on a five-pointLikert scale. This scale invention is attributed to Rensis Likert(Likert, 1931), who described this technique for the assessmentof attitudes. McIver (McIver & Carmines, 1981) describes the Likertscale as a set of items made up of approximately an equal numberof favorable and unfavorable statements concerning the attitudeobject, which is given to a group of subjects. They are asked torespond to each statement in terms of their own degree of agree-ment or disagreement. Typically, they are instructed to select oneof five responses (five-point Liker scale): ‘‘strongly agree’’, ‘‘agree’’,‘‘neutral’’, ‘‘disagree’’, or ‘‘strongly disagree’’.
In general, these human perceptions (expressed as natural lan-guage or a Likert scale) are characterized by uncertainty and fuzziness(Deng & Pei, 2009), that is, they are subjective and vague. Furthermore,variations in individual perceptions and personality mean that thesame words can indicate very different perceptions (Chiou, Tzeng, &Cheng, 2005). Thus, because of their various experiences and individ-ual preferences, customers normally have different opinions such aspessimistic, optimistic and neutral attitudes (Chin-Hung, 2008;Huynh, Nakamori, & Lawry, 2006). Consequently, the use of binarylogic and crisp numbers to describe these human perceptions orattitudes (e.g., ‘‘strongly agree’’ = 2, ‘‘agree’’ = 1, ‘‘neutral’’ = 0, ‘‘dis-agree’’ =�1, and ‘‘strongly disagree’’ =�2) fails to address fuzziness(Zadeh, 1975). In this case, a better approach should be based on theuse of linguistic assessments rather than numerical values.
The fuzzy linguistic approach was first introduced by Zadeh(1975). It is a tool intended to model qualitative information thathas been used successfully in many domains and problems (e.g.,Bordogna & Passi, 1993, 2001; Delgado, Verdegay, & Vila, 1992;Herrera-Viedma, 2001; Herrera-Viedma, López-Herrera, Luque, &Porcel, 2007; Yager, 1999). This approach is based on the conceptof linguistic variables. Briefly speaking, linguistic variables are vari-ables whose values are not numbers, but words or sentences in anatural or artificial language. Therefore, the fuzzy linguistic ap-proach seems to be an appropriate framework for modeling theinformation like the one in which these human perceptions areused. Among these models, the fuzzy model based on semantictranslation (FMST) introduced in Carrasco and Villar (2011) seemsto be an appropriate framework for our problem due to its uniquecharacteristics as described below:
� The management of heterogeneous data commonly included inthe questionnaires, i.e., Likert scales, textual opinions and miss-ing values described by trapezoidal membership functions. Sev-eral authors consider that these functions are good enough tocapture the vagueness of the linguistic terms (Delgado et al.,1992).� High precision and good interpretability of the results. Given an
ordered set of primary linguistic terms specified with trapezoidalmembership functions, the basic idea of the model consists indefining a semantic translation of such terms and then obtaininga more precise ordered set which includes the primary terms andthe semantic translations of the terms. If we are aggregating theage of customers, the result could be, for example, ‘‘teenager –2’’ with the linguistic interpretability ‘‘2 years to teenager’’.
In this paper we present a model for integrating heterogeneouse-financial services questionnaires based primarily on the FMST.The final goal is to determine the overall opinion of a communityon some e-financial services under the perspective of the SERV-QUAL instrument. The heterogeneous data (natural language in-cluded) was drawn from various web or online questionnaires.
The rest of the paper is structured as follows. Section 2 reviewsthe preliminary concepts including the FMST and the SERVQUALscale. Section 3 presents the new model, or linguistic integrationprocess, which is carried out in four steps. Section 4 presents a case
study on service quality and customer satisfaction with an e-bank-ing system of a Spanish savings bank. Finally, concluding remarksare made and future research lines are proposed.
2. Preliminaries
In this section we present the basic elements needed to under-stand our new proposal: the fuzzy linguistic approach, the FMST asa tool to obtain a linguistic summarization and the SERVQUALscale.
2.1. The fuzzy linguistic approach
Since the concept was introduced (Zadeh, 1975), linguistic vari-ables have been widely used. Briefly speaking, linguistic variablesare variables whose values are sentences in a natural or artificiallanguage. The values of linguistic variables are called linguistic la-bels. In more specific terms, a linguistic variable is characterizedby a quintuple hH,T(H),U,G,Mi in which:
� H is the name of the variable.� T(H) is the term-set of H or the collection of linguistic values
(labels).� U is the universe of discourse.� G is the syntactic rule, i.e., a context-free grammar which gener-
ates the terms in T(H).� M is the semantic rule which defines the meaning of each lin-
guistic label X, M(X), where M(X) denotes a fuzzy subset of U.
The fuzzy linguistic approach (Zadeh, 1975) is a tool used formodeling qualitative information in a problem. It is based onthe concept of linguistic variables and has been satisfactorily usedin some problems such as information retrieval (Bordogna & Pas-si, 1993, 2001; Herrera-Viedma, 2001; Herrera-Viedma et al.,2007), decision-making (Delgado et al., 1992; Yager, 1999) orthe complexity in the implementation of services via Internet(e.g., Lin, 2010 [regular chain supermarket]; Awasthi, Chauhan,Omrani, & Panahi, 2011 [transportation]; Chou, Liu, Huang, Yih,& Han, 2011 [airplane]; Büyüközkan & Çifçi, 2012 [healthcare]).We have to choose the appropriate linguistic descriptors for theterm set and their semantics. In order to accomplish this objec-tive, an important aspect to analyze is ‘‘granularity of uncer-tainty’’, that is, the level of discrimination among differentcounts of uncertainty. Typical values of cardinality used in thelinguistic models are odd ones, such as 5 or 7, where the midtermrepresents an assessment of ‘‘approximately 0.5’’, and with therest of the terms being placed symmetrically around it (Bonissone& Decker, 1986). Once the cardinality of the linguistic term sethas been established, the linguistic terms and its semantics mustbe provided as follows:
� Generation of the linguistic terms. There are primarily two waysto accomplish this task (Bonissone, 1982; Bordogna & Passi,1993; Yager, 1995). One of them involves directly supplyingthe term set by considering all the terms distributed on a scaleon which a total order is defined (Herrera, Herrera-Viedma, &Verdegay, 1995; Yager, 1995). The other, following Bordognaand Passi (1993), is to specify a context-free grammar G definedby the 4-tuple hVT,VN,P, Ii where:
1. VT is the set of the terminal symbols, also called thealphabet.
2. VN is the set of nonterminal symbols.3. P is the set of the production rules.4. I is the start symbol or axiom.

Fig. 1. Possibility operator definition e(A,B) = e.
Table 1Examples of definition of the operator r.
Possibility operator definition r Necessity operator definition r
¼ 1 if cA P dB
¼ dA�cBdB�cB�ðcA�dAÞ if cA < dB&dA > cB
¼ 0 otherwise
¼ 1 if aA P dB¼ bA�cB
dB�cB�ðaA�bAÞif cA < dB&bA > cB
¼ 0 otherwise
R.A. Carrasco et al. / Expert Systems with Applications 39 (2012) 11535–11547 11537
� Semantic of the linguistic terms. Often, the semantics of the termsare represented by fuzzy numbers defined in the interval [0,1]and described by membership functions. One way to character-ize a fuzzy number is to use a representation based on param-eters of its membership function (Bonissone & Decker, 1986).The linguistic assessments given by the users are only approxi-mate. Some authors consider that linear trapezoidal member-ship functions are good enough to capture the vagueness ofsuch linguistic assessments (Delgado et al., 1992). The paramet-ric representation is achieved by the 4-tuple [a,b,c,d] where band c indicate the interval in which the membership value is1, with a and d indicating the left and right limits of the defini-tion domain of the trapezoidal membership function (Bonissone& Decker, 1986).
In what follows we analyze Carrasco and Villar’s (2011) fuzzylinguistic model that is used in our system.
2.2. Linguistic summarization using the fuzzy model based on semantictranslation
We now proceed to explain the representation and computa-tional model of FMST (Carrasco & Villar, 2011). We then define anew linguistic aggregation operator based on the approximativecomputational model (Bonissone & Decker, 1986) that overcomesthe main drawback of this model, namely the loss of informationcaused by the need to express the results in the initial expressiondomain. With this new operator, FMST is proposed as a tool to ob-tain a linguistic summarization.
2.2.1. The fuzzy representation model based on semantic translationLet S = {si},i 2 {0, . . . ,g} be a linguistic term set, such that each
term si is associated to the semantic of the trapezoidal membershipfunction [ai,bi,ci,di]. Let the fuzzy operator be r:S � S ? [0,1] suchthat "si,sj 2 S, r(si,sj) represents fuzzy degree of superiority of si oversj. We demand that the operator r forms a total order relation on S,i.e., "si, sj 2 S if r(si,sj) > r(sj,si)() i > j. There are many possibleways to define the operator r over A = [aA,bA,cA,dA] andB = [aB,bB,cB,dB] (two trapezoidal possibility distributions, seeFig. 1): possibility and necessity theory (see Table 1) or even thesubjective criterion of some decision maker (Carrasco, Galindo, &Vila, 2001), among others.
Definition 1. We define these semantic translations of a term si 2 S,as si + di = [ai + di,bi + di,ci + di,di + di], with di 2 DSTi = {d: d 2 [�di,d��
i]}, where d��
i and di are, respectively, the maximum and minimumvalue of the translation of a term si based on an operator r and athreshold v defined as:
—di ¼
0; if i ¼ g
Supfd 2 U : rðsiþ1; si � 2� dÞ > vg;
otherwise
8>><>>:
di ¼
0; if i ¼ 0
Supfd 2 U : rðsi � 2� d; si�1ÞP vg;
otherwise
8>><>>:
We call di the value of translation of si and it represents the ‘‘seman-tic difference of information’’ between si + di and si.. From Definition 1,we have semantic consistence on S regarding the previous order rela-tion, i.e., we can conclude that "sj�1,sj,sj+1 2 S,j 2 {1, . . . ,g � 1} fulfils:r(sj � dj, sj�1 þ d
��j�1Þ > v and r(sj+1� dj, sj þ d
��j�1Þ > v.
Let h be a natural number in order to define a grammar thatgenerates a finite set of terms, we obtain a discrete set from DSTi.Thus, let DHSTi be the set of the h-higher semantic translations of a
term si defined as DHSTi ¼ f—d0ij : —d0ij ¼ j�—di=hg;8j 2 f1; . . . ;hg; andlet DLSTi be the set of the h-lower semantic translations of a term si
defined as DLSTi ¼ d0ij : d0ij ¼ ð�jþ hþ 1Þ � di=hn o
; 8j 2 f1; . . . ;hg.
Now we proceed to define the representation model as a set ofthe production rules defined in an extended Backus Naur Form inwhich the square brackets enclose optional elements, the symbol ⁄indicates the possible repetition of the elements which follow, andthe symbol j indicates alternative elements.
Definition 2. The representation of the model based on thesemantic translation is generated from the context-free grammarG where "i 2 {0, . . . ,g} and "j 2 {0, . . . ,h � 1}:
VT = siVN={<term>, <low comp term>, <hig comp term>, <translow>, <trans hig>}
P=<term>::¼ {<low comp term > j < primary term > j < higcomp term>}
< low comp term>::¼⁄[<primary term><trans low>]< trans low>::¼ <sign trans low>fd0ijjd0ijj � � � jd0ijg< hig comp term>::¼ ⁄[<primary term> <trans hig>]< trans hig>::¼ <sign trans hig> f—d0ijj—d
0ijj � � � j—d
0ijg
< primary term>::¼ si
< sign trans low>::¼ ‘‘–‘‘
< sign trans hig>::¼ ‘‘+‘‘
I = <term >
Therefore, each < primary term > has associated with it thesemantic of a trapezoidal membership function; and each < higcomp term > and < low comp term > have associated the seman-tic of the < primary term > with a difference of information of< trans hig> (higher) and < trans low> (lower), respectively.
2.2.2. The fuzzy computational model based on semantic translationThe grammar G has led to the definition of a new ordinal setbS ¼ s0; s0 þ—d001; . . . ; s0 þ—d00h; . . . ; sg � d0g1; . . . ; sg � d0gh; sg
n o. Given
that the primary terms have the semantic translation 0, we will
proceed to rename the set as bS ¼ fs0 þ 0; s0 þ—d001; . . . ;
s0 þ—d00h; . . . ; sg � d0g1; . . . ; sg � d0gh; sg þ 0g. Therefore, bS ¼ fsi þ dig; i2 f1; . . . ;mg and m = (2 � h + 1) � (g � 1); and if each term si + di
is renamed as si we have that bS ¼ fsig; i 2 f1; . . . ;mg. We can also
conclude that the operator r forms a total order relation on bS.

Table 2Examples of definition of the operator e.
Possibility operator definition e Necessity operator definition e
=supd2U min (A (d),B (d)) =infd2U max (1 � A (d),B (d))where U is the domain of A, B. where U is the domain of A, B.A(d) is the degree of the possibility ford 2 U in the distribution A (see Fig. 1)
A(d) is the degree of the possibilityfor d 2 U in the distribution A
11538 R.A. Carrasco et al. / Expert Systems with Applications 39 (2012) 11535–11547
We will define the computer model on this new set. This modelwill be more accurate as the number of semantic translations (h)is greater.
The comparison of terms is carried out according to the ordinarylexicographic order of bS, i.e., 8sk; sl 2 bS if k < l() sk < sl. Therefore,the maximization operator is maxðsk; slÞ ¼ sl () sk < sl; and theminimization operator is minðsk; slÞ ¼ sk () sk < sl.
The aggregation of information consists of obtaining a valuethat summarizes a set of values. Yager (1988) introduced the Or-dered Weighted Averaging (OWA) operator. A fundamental aspectof the OWA operator is the reordering of the arguments to beaggregated based upon the magnitude of their respective values:
Definition 3. An OWA operator of dimension n is a functionu : Rn ! R, which has a set of associated weighting vectors W = {wj},j 2 {1, . . . ,n}, wj 2 [0,1]. It is defined to aggregate a list of valuesP ¼ fpjg; j 2 f1; . . . ;ng; pj 2 R according to the following expression:uðp1; . . . ; pnÞ ¼
Pni¼1wiprðiÞ=
Pnj¼1wj where q:{1,. . . ,n} ? {1,. . . ,n} is a
permutation such that pq(i) P pq(i+1), "i = 1,. . . ,n� 1, i.e., pq(i) is the i-thhighest value in the set P.
In our problem, let A = {aj}, j 2 {1, . . . ,n}, and aj 2 S be a set of termsto aggregate described by trapezoidal membership functions whereai = [aaj,baj,caj,daj];W is their associated weights; and B is the associ-ated ordered term vector. Each element bi 2 B, defined as bi = [abi,b-i = [abi,bbi,cbi,dbi], is the ith largest term in the collection ordered vector{a1, . . . ,an}. Additionally, let the fuzzy operator e : S� S ? [0,1] be suchthat "si, sj 2 S, e(si,sj) represents the fuzzy degree of equality of si over sj.There are several possible ways to define the operator e over A and B(two trapezoidal possibility distributions): possibility and necessitytheory (see Table 2), the subjective criterion of some decision maker(Carrasco et al., 2001), among others.
Before defining the aggregation operators, we define the following:
Definition 4. We define the fuzzy degree of equality of s 2 bS over anordered set of terms B weighted by W based on an operator e:
H;OWA;ðs;B;WÞ ¼Pnj¼1
eðs; bjÞ �wj
Now we proceed to define the aggregation operator:
Definition 5. Let H;SupOWA;ðbS;B;WÞ ¼ SupfH;OWA;ðsi;B;WÞ; 8i 2 f1;. . . ;mgg. We define the average over an ordered set of terms Bweighted by W based on an operator e with respect to bS as follows:
H;LOWA;ðbS;B;WÞ¼s¼ sj; if 9sj; sk 2 bS; j;k2f1; . . . ;ng and j – k :
H;OWA;ðsj;B;WÞ¼H;OWA;ðsk;B;WÞ¼H;SupOWA;ðbS;B;WÞ andjdjj< jdkjs2 bS : H;OWA;ðs;B;WÞ ¼H;SupOWA;ðbS;B;WÞ; otherwise
8>>>><>>>>:
We call the degree of representativeness of H; LOWA;ðbS; B;WÞ operator to avalue in [0,1] defined as: H;RepOWA;ðbS;B;WÞ ¼ H; SupOWA;ðbS;B;WÞ=Pn
j¼1wj. Therefore, if the degree of representativeness is the same formore than one term, we choose the term with less semantic translation(in absolute values) in order to define the operator H,LOWA. This degreeshould be close to the value of 1 for an acceptable representativeness ofthe chosen term H;LOWA;ðbS;B;WÞ.
2.2.3. The fuzzy computational model based on semantic translationusing the approximative computational modelThe approximative computational model based on the Exten-sion Principle (Bonissone & Decker, 1986) uses fuzzy arithmeticbased on the Extension Principle to make computations over thelinguistic variables. A linguistic aggregation operator based on thismodel acts according to: Sn!I FðRRÞ !appð�Þ
, where Sn symbolizes the
n Cartesian product of S;I is an aggregation operator based on theextension principle, FðRÞ is the set of fuzzy sets over the set of realnumbers, and app1(�) is a linguistic approximation function thatreturns a label from the linguistic term set S whose meaning isthe closest to the unlabeled fuzzy number obtained. The maindrawback of this model is the loss of information caused by theneed to express the results in the initial expression domain. How-ever, we can obtain much more accurate results if we express theresults using the set bS instead of S. Based on this idea, we proceedto define the new aggregation operator:
Definition 6. Let J ¼ ½uðaa1; . . . ;aanÞ; uðba1; . . . ; banÞ; uðca1;
. . . ; canÞ;uðda1; . . . ; danÞ� be an aggregation operator based on theOWA operator (Definition 3); and let H;SupOWA;ðJ; bSÞ ¼SupfH;OWA;ðJ; sj; f1gÞ;8j 2 f1; . . . ;ngg. We define the average over
an ordered set of terms B weighted by W based on an operator ewith respect to bS as follows:
H;LOWA;ðbS;B;WÞ¼s¼ sj; if 9sj; sk 2 bS; j;k2f1; . . . ;ng and j – k :
H;OWA;ðJ; sj;f1gÞ¼H;OWA;ðJ; sk;f1gÞ¼H;SupOWA;
ðJ;bSÞ and jdjj< jdkj
s2 bS : H;OWA;ðJ; s;f1gÞ¼H;SupOWA;ðJ;bSÞ; otherwise
8>>>>>>>>><>>>>>>>>>:
We call the degree of representativeness of H; LOWA;ðbS;B;WÞ operator to avalue in [0,1] defined as: H;RepOWA;ðbS;B;WÞ ¼ H; OWA;ðs;B;WÞ=
Pnj¼1wj.
As in Definition 5, if the degree of representativeness is the same formore than one term, we choose the term with less semantic translation(in absolute values) in order to define the operator H,LOWA,. This degreeshould be close to the value of 1 for an acceptable representativeness ofthe chosen term.
2.2.4. Linguistic data summariesThe current growth of information technology has led to the
availability of a huge amount of data. Unfortunately, the greateravailability of data does not mean that the data are more usefulor productive. Data summarization attempts to reduce facts toknowledge to aid in decision making. The linguistic summary canbe viewed as a natural language-like sentence that subsumes thevery essence (from a certain point of view) of a set of data (Kacpr-zyk & Yager, 2001; Laurent, 2003; Yager, 1982, 1991). This set is as-sumed to be generally large and incomprehensible in its originalform by human beings. Often, the following context for linguisticsummaries mining is assumed:
� Y = {y1, . . . ,y#Y} is a set of objects (records) in a database, e.g., theset of a bank customers; where # Y P 1 is the cardinality of theset Y;� R = {r1, . . . ,r#R} is a set of attributes characterizing objects from
Y, e.g., ‘‘age’’, in a database, yi(rj),i 2 {1, . . . ,#Y},j 2 {1, . . . ,#R}denotes a value of attribute rj for object yi, and Y(rj) denotesthe set {yi(rj)}.
R.A. Carrasco et al. / Expert Systems with Applications 39 (2012) 11535–11547 11539
Yager (Yager, 1982; Yager, 1991; Kacprzyk & Yager, 2001) pro-posed that a linguistic summary of data set Y for an attributerj;SrY
j , can be made in terms of three values srYj ;QrY
j ; TrYj
D E:
� A summarizer srYj 2 Srj, i.e., an attribute together with a linguis-
tic value (fuzzy predicate) defined on the domain of attribute rj
(e.g., ‘‘young’’ for attribute rj = ‘‘age’’). The set Srj contains all thepossible linguistic terms defined for the attribute rj.� A quantity in agreement QrY
j , i.e., a linguistic quantifier. Linguis-tic quantifiers (Galindo, Carrasco, & Almagro, 2008) allow us toexpress fuzzy quantities or proportions in order to provide anapproximate idea of the number of elements of a subset fulfill-ing a certain condition or the proportion of this number in rela-tion to the total number of possible elements. Linguisticquantifiers can be absolute or relative. Some examples for abso-lute are ‘‘much more than 100’’, ‘‘close to 100’’, and for relative‘‘a great number of’’, ‘‘the majority’’ or ‘‘most’’, ‘‘the minority’’,etc. Therefore, QrY
j , is a proposed indication of the number ofpieces of Y(rj) that satisfy srj.� Truth (validity) TrY
j of the summary, i.e., a number from the inter-val [0, 1] assessing the truth (validity) of the summary (e.g., 0.7).Usually, only summaries with a high value of TrY
j are interesting.Thus, the linguistic summary may be exemplified by ‘‘ TrY
j (mostbank customers are young) = 0.7’’.
In order to obtain SrYj using the FMST, a procedure is proposed
in Carrasco and Villar (2011) with the primary aim of using themore precise set bS obtained from S.
2.3. The SERVQUAL scale
The SERVQUAL scale is a survey instrument which claims tomeasure service quality in any type of service organization. Thescale was originally proposed by Parasuraman et al. (1985). Theyconducted in-depth interviews with executives of service firmsand customer focus groups, and then defined service quality asthe gap between perceptions and expectations of customers, whichis referred to as the P–E gap. Initially, a multiple-item scale formeasuring ten dimensions of service quality was proposed. Thescale was later simplified to five dimensions in 1988 (Parasuraman,Zeithaml, & Berry, 1988). In memory of Parasuraman, Zeithaml,and Berry, the method was named the PZB model. Furtherimprovements to SERVQUAL were made in 1991 (Parasuraman,Zeithaml, & Berry, 1991) and 1994 (Parasuraman, Zeithaml, & Ber-ry, 1994).
Ladhari (2009) reviewed the different applications of the SERV-QUAL scale from 1988 to 2008, highlighting the increasing importanceof online services in society if it is true that there is still much literature.This scale was created to measure service quality in a traditional ser-vice context (offline). However, with the successive technologicalinnovations that have been developed in recent years, the applicabilityof this scale has also been considered in online environments. Severalauthors have incorporated changes to the original measurement scaleto develop new scales (Zeithaml, Parasuraman, & Malhotra, 2000, 2002[e-SERVQUAL]; Loiacono et al., 2000, Loiacono, Watson, & Goodhue,2007 [WEBQUAL]; Janda, Trocchia, & Gwinner, 2002 [IRSQ]; Parasur-aman, Zeithaml, & Malhotra, 2005 [ES-QUAL]; Cristobal, Flavian, &Guinaliu, 2007 [PESQ]; Lin, 2011 [SSTQUAL]).
The banking sector has also been the object of traditional ser-vice quality analyses (Bahia & Nantel, 2000; Bath, 2005; Fernán-dez-Barcala, 2000; Jayawardhena, 2004; Kumar, Kee, & Manshor,2009; Ladhari, Ladhari, & Morales, 2011; Rajesh, Ranjith, Sumana,& Charu, 2010; Saurina, 2002). Our research, however, will focuson e-banking or e-financial services. Concretely, we explain the fivedimensions proposed for the SERVQUAL instrument and their
adaptations to e-services perceptions (Ladhari, 2009; Parasuramanet al., 1985):
� Tangibles: The appearance of physical facilities or equipment (inour case the interface of the financial website), ease to operatethe services, and accessibility (Han & Baek, 2004; Wu, Tao, &Yang, 2010; Zhou, Zhang, & Ji, 2010) and agility of operations(Han & Baek, 2004; Wu et al., 2010).� Reliability: The ability to perform the promised service depend-
ably and accurately, i.e., the reliability of operations (Han &Baek, 2004; Jun & Cai, 2001; Khan & Mahapatra, 2009; Wuet al., 2010; Yang, Jun, & Peterson, 2004; Zhou et al., 2010).� Responsiveness: The willingness to help customers and provide
prompt service, i.e., customer attention (Han & Baek, 2004;Jun & Cai, 2001; Khan & Mahapatra, 2009; Wu et al., 2010; Yanget al., 2004; Zhou et al., 2010).� Assurance: The level of protection of confidential information,
the security of the operations (Brasil, Garcıa, & Antonialli,2006; Han & Baek, 2004; Khan & Mahapatra, 2009; Wu et al.,2010; Yang et al., 2004; Zhou et al., 2010) and their ability toinspire trust and confidence.� Empathy: The level of caring, usefulness, actualization of infor-
mation (Brasil et al., 2006) and suitability to the needs of usesof the system (Brasil et al., 2006; Han & Baek, 2004; Zhouet al., 2010).
Moreover, some of these authors (Saleh & Ryan, 1991) propose amodified version of SERVQUAL with a basic questionnaire that pre-sents customers with a series of statements (questions) about thefive above-mentioned scales to ask them if they agree or disagreeon a five-point Likert scale. In order to obtain a more simplifiedmodel in this paper, we will use this five-point Likert scale formtype based on customers’ perceptions.
Furthermore, e-financial services questionnaires often ask cus-tomers about the overall assessment of the service (Zhou et al.,2010). Since we consider such assessments to be very important,we propose that they be included as a new scale, similar to the oneproposed for other quality evaluations models such as the courseexperience questionnaire (McInnis, Griffin, James, & Coates, 2001):
� Overall Satisfaction Index (OSI): This index indicates customersoverall satisfaction level with respect to the e-service.
3. Linguistic integration of heterogeneous e-financial servicesquestionnaires
In this section, we show a model for aggregating heterogeneousquestionnaires based mainly on the FMST explained in Section 2.The final goal is to determine the overall opinion of a communityon some e-financial services under the perspective of the SERV-QUAL instrument, that is, the SERVQUAL quality evaluation valueof such services.
Although these opinions have been provided by different popu-lations in diverse websites, they have several common features(dimensions) such as time (month, year, etc.) and space (country,region, etc.), among others. The objective is to aggregate theseopinions into the five-point Likert SERVQUAL scale proposed inSection 2.2, which characterizes them according to their commonfeatures.
We have applied the following formal framework to the problemwe are attempting to solve: Let R = {R1, . . . ,R#R} be a collection of non-empty sets of questions on e-financial services, i.e., questionnaires tobe aggregated (input questionnaires), where #R P 1 is the cardinal-ity of the set R. Let each questionnaire Ra = {ra,1, . . . ,ra,#Ra},"a 2 {1, . . . ,#R},#Ra P 1 be a set of #Ra questions. LetPZB = {pzb1, . . . ,pzbn},n = 6 be a questionnaire based on the

11540 R.A. Carrasco et al. / Expert Systems with Applications 39 (2012) 11535–11547
SERVQUAL scale with five-point Likert type questions: pzb1 = Tangi-bles, pzb2 = Reliability, pzb3 = Responsiveness, pzb4 = Assurance, pzb5 =Empathy and pzb6 = Overall Satisfaction Index. Assuming that we haveseveral groups of customers (decision makers) Y = Y1 [ � � � [Y#R,Ya = {ya,1, . . . ,ya,#Ya},#Ya P 1, which have filled out the corre-sponding questionnaires Ra, we consider that Ya(ra,b) = {ya,c(ra,b)},"b 2 {1, . . . ,#Ra} and "c 2 {1, . . . ,#Ya} contain the opinions providedby the customers ya,c on subjective criteria represented by the ques-tion ra,b. The objective is to obtain a unique PZB type form, PZBo = {pz-bo,1, . . . ,pzbo,n},n = 6, with the integrated answers to the inputquestionnaires, i.e., Ya(ra,b), "a 2 {1, . . . ,#R}, "b 2 {1, . . . ,#Ra}. Withthis purpose, we propose a model that consists of the following steps(see Fig. 2).
We now proceed to explain each of these steps in more detail.
3.1. The choice of the initial linguistic domains
The choice of the linguistic term set with its semantics is thefirst goal to fulfill in any linguistic approach for solving a problem(Herrera & Herrera-Viedma, 2000). This consists of establishing thelinguistic variable (see Section 2.1) or linguistic expression domainwith a view to providing the linguistic performance values for theresponses in the questionnaires. This definition is given for each ofthe questions of the input and output questionnaires in order todescribe these human perceptions or attitudes as linguistic perfor-mance values. As universe of discourse U, we consider the com-monly used interval [0,10] and then specify the initial domains for:
� PZB questionnaire. As mentioned in Section 2.3, a five-point Lik-ert scale is used for the output questionnaire of our system. Thefive-point Likert scale is a set of items made up of an equalnumber of favorable and unfavorable statements concerningthe attitude object. It is provided to a group of subjects whoare instructed to select one of five possible responses: ‘‘stronglyagree’’, ‘‘agree’’, ‘‘neutral’’, ‘‘disagree’’, or ‘‘strongly disagree’’.We consider the possibility shown in Section 2.1, which definesthe linguistic expression domain by means of an ordered set oflinguistic terms. We then characterize the initial linguisticexpression domains as follows:� The granularity value is 5.� We consider a linguistic term set on which a total order is
defined and distributed with the midterm representing anassessment of ‘‘neutral’’, with the rest of the terms beingplaced symmetrically around it.
Fig. 2. Linguistic integration process input questionnaires into a SERVQUAL form.
� We define the semantics by considering that each linguisticterm for the pair (si,sg�i) (g + 1 is the cardinality, i.e., 5) isequally informative and by assigning trapezoidal member-ship functions to each linguistic term.
� Thus, we can use the set of five linguistic terms shown inFig. 3 for each domain: S = Spzb1 = � � � = Spzbn = {s0, . . . ,sg},g = 4: s0 = Strongly Disagree (SD), s1 = Disagree (D), s2 = Neutral(N), s3 = Agree (A), and s4 = Strongly Agree = (SA).
� Input questionnaires. Due to the heterogeneous information ofthe questionnaires, we have identified the following frequentlinguistic domains: Sra,b={sa,b,0, . . . ,sa,b,#Sra,b},#Sra,b P 1, for thequestions ra,b for which the FMST is directly usable since theycan be expressed with trapezoidal possibility distributions(Carrasco & Villar, 2011):� n-Likert scales with the above remarks for the five-point
scale. This can also be expressed as numerical terms withassociated linguistic labels, e.g., for an eleven-point scale:L00 = 0, L01 = 1, etc. Fig. 4 shows an option to define this ele-ven-point Likert scale.
� Missing and undefined values are specified as a trapezoidalfunction (see, for example, Umano & Fukami, 1994):Unknown = UNK, defined as [1,1,1,1], or Undefined = UND,defined as [0,0,0,0].
� Linguistic terms included in text opinions. Often a large por-tion of users do not provide feature ratings. In this case,the opinions expressed by these users of e-financial ser-vices in natural language are an important source of infor-mation. Therefore, we propose obtaining the value of theservice features from the customers’ textual opinions, andwe express it as a term of the set Sra,b previously definedby the data analysts. We propose obtaining the pair of fea-tures (ra,b) and ratings {ya,c(ra,b)} using a text miningschema. Oracle Text� (Dixon, 2001; Shea, 2008) is pro-posed as a tool for the text mining process to manage com-ments in English and Spanish language. In particular, weuse the contains operator (Shea, 2008) in combination withthe near operator (Shea, 2008) to return a score based onthe proximity of the two search terms (characteristic andrating). In order to search both terms, we use a specific the-saurus of terms that contains synonyms of Sra,b terms(including formal and informal terms and abbreviators);higher-level terms; and words that have the same root asthe specified term (using the stem operator; Shea, 2008).We also use a helpful operator to find more accurate resultswhen there are frequent misspellings in the opinion textincluding words that sound like the specified terms (soun-dex operator; Shea, 2008) and words that are spelled simi-larly to the specified terms (fuzzy operator; Shea, 2008).
3.2. The definition of the FMST
In this phase, we define the representation and computationalmodel for all the domains of our problem:
� Definition of the representation model of the FMST. We define theset bS ¼ fs0; s0 þ—d001; . . . ; s0 þ—d00h; . . . ; sg � d0g1; . . . ; sg � d0gh; sggfrom the set S (output domain), and the sets
bSra;b ¼ fsa;b;0; sa;b;0 þ—d0a;b;01; . . . ; sa;b;0 þ—d0a;b;0h; . . . ; sa;b;#Sra;b
� d0a;b;#Sra;b1; . . . ; sa;b;#Sra;b � d0a;b;#Sra;bh; sa;b;#Sra;bg
from the sets Sra,b (input domains), "a 2 {1, . . . ,#R}, and"b 2 {1, . . . ,#Ra}, correspondingly, using the context-free gram-mar G (Definition 2) by choosing an operator r, a threshold vand value of discretization h. We consider that these new setshave an easy linguistic interpretability (similar to the initial

Table 3Description of the questionnaire items.
Question ra,b Questionnaire Ra
R1 R2 R3 R4
Accessibility � � � �Ease of navigation � � � �Usefulness of the information � � � �Simplicity of information � � � �Customer attention � � � �Suitability to needs � � � �Ease of operations � � � �Reliability of operations � � � �Security of operations � � � �Agility of operations � � � �Overall satisfaction � � � �
Fig. 3. Linguistic terms defined for a five-point Likert scale.
Fig. 4. Linguistic terms defined for an eleven-point Likert scale.
R.A. Carrasco et al. / Expert Systems with Applications 39 (2012) 11535–11547 11541
sets) and a high precision (depending on the value h). In thisway, it is possible express the initial, intermediate and end lin-guistic performance without losing linguistic interpretability.� Definition of the computational model of the FMST. This model
mainly consists of establishing appropriate operators of linguis-tic information necessary for linguistic summary in order toaggregate and combine the linguistic performance values pro-vided by the customers. We define the operators H,OWA, andH,LOWA, choosing an operator e. In this paper, we have definedthese new operators (Definitions 6) based on the approximativecomputational model, but avoiding the major drawback of thismodel, i.e., the loss of precision. Therefore, we will use theseenhanced operators in our model.
3.3. Representation of the opinions of customers using the FMSTaccording to type of customer
Customers normally have different opinions such as pessimistic,optimistic and neutral attitudes because of their variousexperiences and individual preferences (Chin-Hung, 2008). Someauthors (Huynh et al., 2006) use several linguistic terms to repre-sent such attitudes. In this paper, we propose using the originalterm expressed by customers but with a negative, positive or zerosemantic translation of such initial terms, respectively, for pessi-
mistic, optimistic and neutral types of customers in order to obtaina more precise representation. Obviously, a previous process isneeded to obtain the type of customer. For this purpose a linguisticsummary is proposed. There are two steps in this phase:
� Identification of type of customer according to attitude. We proposeobtaining the customer’s overall pessimistic attitude by means ofa linguistic summary that may be exemplified by ‘‘T (most cus-tomer responses in the questionnaire are ‘strongly disagree’)Pf’’, where f 2 [0,1] must be close to 1. Our proposal for optimis-tic attitudes is analogous, but using ‘strongly agree’ responses.Otherwise, we consider neutral attitudes. Therefore, for each cus-tomer of each questionnaire, i.e., ya,c, "a 2 {1, . . . ,#R},"c 2 {1, . . . ,#Ya}, we calculate the linguistic summary SrYa;c
a ¼hsrYa;c
a ;Q ; TrYa;ca i based on the five-point Likert output question-
naire domain, S. We then we proceed to identify the type of cus-tomer according to the following procedure:
(1) Calculation of the label srYa;ca;b 2 bS, that best summarizes the set
of all opinions provided by the customer ya,c,{ya,c(ra,b)}, accord-ing to the specified FMST (Section 3.2). Since Q = ‘‘most’’ is arelative quantity, we choose W = {wb}, wb = 1/#Ra. Thus,we calculate the label that best summarizes the set as:
srYa;ca ¼ H;LOWA;ðbS; fya;cðra;bÞg;WÞ;8b 2 f1; . . . ;#Rag
(2) Calculation of the value qrYa;ca ; a relative indication of the num-
ber of pieces of data that satisfy the label srYa;ca :
qrYa;ca ¼ H;OWA;ðsrYa;c
a ; fya;cðra;bÞg;WÞ
(3) Calculation of the truth value TrYa;ca as the membership of
qrYa;ca in the proposed quantity in agreement:
TrYa;ca ¼ QðqrYa;c
a Þ
(4) Identification of the type of customer ta,c:
ta;c ¼Pessimistic; if srYa;c
a 2fs0;s0þd��001; . . . ;s0þd��00hg and TrYa;ca P f
Optimistic; if srYa;ca 2fsg�d0g1; . . . ;sg�d0gh;sgg and TrYa;c
a P f
Neutral; otherwise
8>><>>:
11542 R.A. Carrasco et al. / Expert Systems with Applications 39 (2012) 11535–11547
� Representation of the opinions of the customers using the FMST.We define the new set Za(ra,b) = {za,c(ra,b)} from the set Ya(ra,b)with maximum, minimum or zero semantic translation ofsuch initial terms, respectively, for pessimistic, optimisticand neutral customers. Assuming that ya,c(ra,b) = sa,b,d,d 2 {1, . . . ,#Sra,b}, we define the new representation values as:
za;cðra;bÞ ¼
sa;b;d þ d��0a;b;d; if ta;c ¼ Pessimistic
sa;b;d � d0a;b;d; if ta;c ¼ Optimistic
sa;b;d; otherwise
8>><>>:
3.4. Obtaining a SERVQUAL scale evaluation value of service qualitywith the answers integrated to the input opinions
In this phase, two steps are carried out to obtain a SERVQUALscale evaluation:
� A process guided by the information, and provided by a set of e-finan-cial experts. This set is comprised of e-financial professionals whoare selected for their professional knowledge and work experience,professors of business schools with research experience in thistopic, and others, who are asked to associate each attribute of theinput opinions to one of the n possible options (n = 6) of the SERV-QUAL scale. After this decision process, a vector is obtained,Ea = {ea,b}, "a 2 {1, . . . ,#R}, "b 2 {1, . . . ,#Ra}, ea,b 2 {1, . . . ,n}, indicat-ing that ra,b is assigned to the pzb ea,b scale. Hence, all the question-naires are divided into subsets, i.e., Ra = Ra,1 [ � � � [ Ra,n, with,Ra,i = {ra,b,i:ra,b,i = ra,b if ea,b = i}, "i 2 {1, . . . ,n}.� A process to obtain a SERVQUAL scale evaluation value of service
quality, PZBo, with the integrated input opinions of the custom-ers {za,c(ra,b,i)}. For this purpose, we use the linguistic summary
SpzbYi ¼ spzbY
i ;Q ; TpzbYi
D Ebased on the five-point Likert output
questionnaire domain, i.e., S. Therefore, we follow the followingprocedure to obtain each SERVQUAL scale value, pzbo,i,"i 2 {1, . . . ,n}:(1) Calculation of the label spzbY
i 2 bS, that best summarizes the setof all opinions provided by all customers assigned to the pzbi
scale, {za, c(ra,b,i)}, according to the specified FMST (Section3.2). We choose W = {wj}, "j 2 {1, . . . ,#Ra,i} as:
Fig. 5. Responses to ques
wj ¼1=#Ra;i; if Q is a relative quantity1; ifQ is an absolute quantity
�
We then calculate the label that best summarizes the set Y as:
pzbo;i ¼ spzbYi ¼ H;LOWA;ðbS; fza;cðra;b;iÞg;WÞ;
8a 2 f1; . . . ;#Rg;8b 2 f1; . . . ;#Rag;8c 2 f1; . . . ;#Yag
(2) Calculation of the value qrYa;ca ; a relative indication of the num-
ber of pieces of data that satisfy the label srYa;ca :
qpzbYi ¼ H;OWA;ðspzbY
i ; fza;cðra;b;iÞg;WÞ
(3) Calculation of the truth value T pzbYi as the membership of
qpzbYi in the proposed quantity in agreement:
TpzbYi ¼ QðqpzbY
i Þ
4. Example of an application
Several web questionnaires containing different questions andusing various scales were administered at different times to surveycustomer satisfaction with e-financial services of a Spanish savingsbank. The opinions expressed by the users of e-financial services innatural language form are an important source of information forthe entity. Thus, the entity encourages users to express opinionson e-financial services through textual reviews on the e-bankingwebsite. The new model proposed in this paper was applied to inte-grate this heterogeneous information. The objective is to aggregatethese questionnaires and textual reviews into a five-point Likertscale SERVQUAL form that characterizes according to their commonfeatures (including date of fulfillment, gender, etc.).
Let R = {R1, . . . ,R#R}, #R = 4 be the set of input questionnaires withthe items shown in Table 3 and the following characteristics: R1
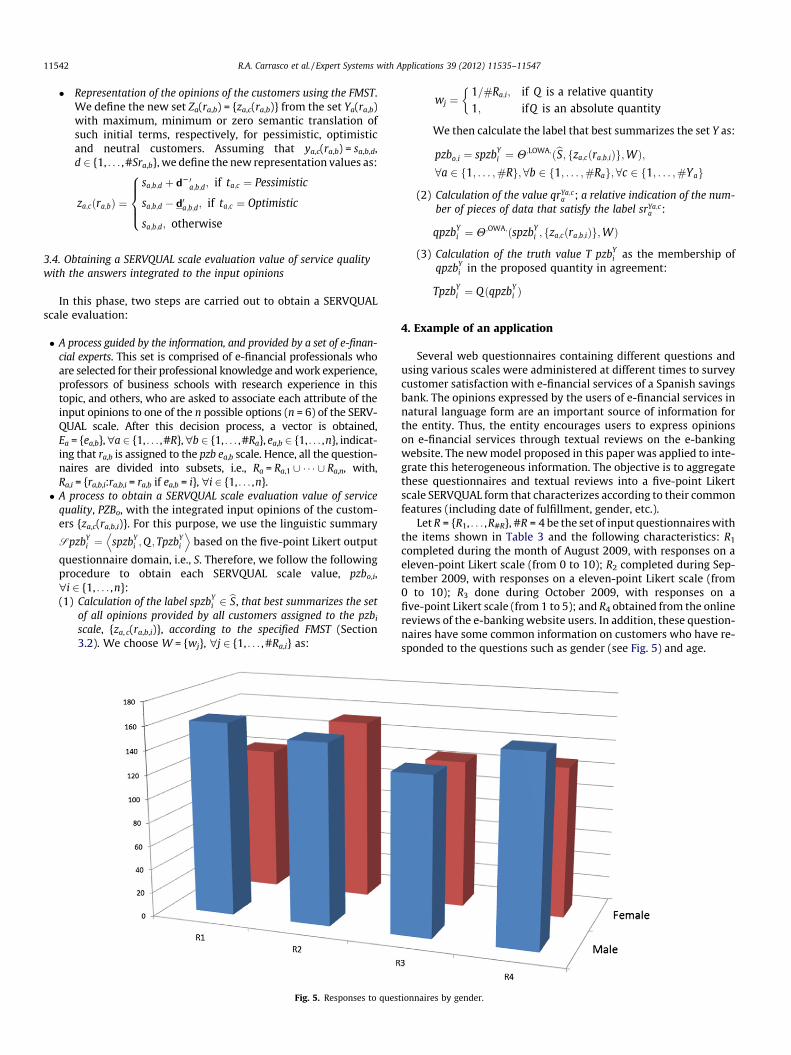
completed during the month of August 2009, with responses on aeleven-point Likert scale (from 0 to 10); R2 completed during Sep-tember 2009, with responses on a eleven-point Likert scale (from0 to 10); R3 done during October 2009, with responses on afive-point Likert scale (from 1 to 5); and R4 obtained from the onlinereviews of the e-banking website users. In addition, these question-naires have some common information on customers who have re-sponded to the questions such as gender (see Fig. 5) and age.
tionnaires by gender.

Fig. 6. Linguistic quantifier ‘‘most’’: Q(r) = r1/2.
Table 4Examples of identification of customer type ta,c.
ya,c srYa;ca TrYa;c
ata,c Ya(ra,b)
ra,1 ra,2 ra,3 ra,4 ra,5 ra,6 ra,7 ra,8 ra,9 ra,10 ra,11
y2,101 SD+0.221 0.8160 Pessimistic L01 L00 L01 L00 L01 L01 L00 L01 L01 L00 L01y3,85 SD+0.166 0.7069 Pessimistic SD SD SD SD SD SD SD SD SD D SDy1,1 SA-0.455 0.9044 Optimistic L09 L10 L10 L10 L10 L09 L07 L10 L10 L10 L10y2,179 SA-0.854 0.8516 Optimistic L10 L10 L09 L10 UNK L10 L10 L09 L09 L10 L09y3,8 SA-0.748 0.7068 Optimistic SA SA A A UNK SA SA SA SA A SAy3,121 SA-0.680 0.7068 Optimistic SA SA SA SA SA N SA SA SA SA Ay1,2 A+0.136 0.9045 Neutral L10 L06 L08 L07 L05 L08 L08 L09 L09 L06 L08y1,52 N+0.638 0.9042 Neutral L04 L00 L08 L08 L09 L05 L04 L09 L09 L00 L06y2,97 N-0.272 0.9204 Neutral L10 L05 L01 L05 UNK L01 L05 L07 L07 L05 L05y3,169 D+0.595 0.7315 Neutral D D N N A N D SD SD D SDy4,284 A-0.854 0.6332 Neutral N A UNK UNK UNK UNK UNK UNK UNK UNK UNK
Table 5Examples of representations of opinions according to customer type ta,c.
ya,c ta,c Za(ra,b)
ra,1 ra,2 ra,3 ra,4 ra,5 ra,6 ra,7 ra,8 ra,9 ra,10 ra,11
y2,101 Pessimistic L01+0.348 L00+0.348 L01+0.348 L00+0.348 L01+0.348 L01+0.348 L00+0.348 L01+0.348 L01+0.348 L00+0.348 L01+0.348y3,85 Pessimistic SD+0.846 SD+0.846 SD+0.846 SD+0.846 SD+0.846 SD+0.846 SD+0.846 SD+0.846 SD+0.846 D+0.846 SD+0.846y1,1 Optimistic L09–0.352 L10–0.352 L10–0.352 L10–0.352 L10–0.352 L09–0.352 L07–0.352 L10–0.352 L10–0.352 L10–0.352 L10–0.352y2,179 Optimistic L10–0.352 L10–0.352 L09–0.352 L10–0.352 UNK L10–0.352 L10–0.352 L09–0.352 L09–0.352 L10–0.352 L09–0.352y3,8 Optimistic SA-0.854 SA-0.854 A-0.854 A-0.854 UNK SA-0.854 SA-0.854 SA-0.854 SA-0.854 A-0.854 SA-0.854y3,121 Optimistic SA-0.854 SA-0.854 SA-0.854 SA-0.854 SA-0.854 N-0.854 SA-0.854 SA-0.854 SA-0.854 SA-0.854 A-0.854y1,2 Neutral L10 L06 L08 L07 L05 L08 L08 L09 L09 L06 L08y1,52 Neutral L04 L00 L08 L08 L09 L05 L04 L09 L09 L00 L06y2,97 Neutral L10 L05 L01 L05 UNK L01 L05 L07 L07 L05 L05y3,169 Neutral D D N N A N D SD SD D SDy4,284 Neutral N A UNK UNK UNK UNK UNK UNK UNK UNK UNK
R.A. Carrasco et al. / Expert Systems with Applications 39 (2012) 11535–11547 11543
As mentioned in Section 3, four steps are needed to solve thisintegration problem. In what follows, we explain these steps andthen provide examples of analyses that a business analyst can per-form using the integrated information that is obtained.
4.1. The choice of initial linguistic domains
The initial linguistic terms for all the questions of Ra, i.e., Sra,b,"a 2 {1,2}, "b 2 {1, . . . ,#Ra} are defined using the eleven-pointLikert scale semantic shown in Fig. 4, and matching the label L00with the value 0 of the responses, L01 with 1, etc. For the rest of
the questionnaires, we choose the same five-point Likert scaleinitial domain, S, that we have defined for the PZB questionnaire(see Fig. 3), i.e., Sra,b = S, "a 2 {3, 4}, "b 2 {1, . . . ,#Ra}. For the ques-tionnaire R3, we match the label SD with 0, D with 1, etc. For R4, weuse the text mining schema explained in Section 3.1 to obtain thepair of features (r4,b) and ratings (y4,c(r4,b)) to evaluate such ratings(see Table 3, e.g., ease of navigation, overall satisfaction, etc.) withthe terms of the five-point Likert scale taking account the syn-onyms, abbreviators, etc. of such ratings and terms (e.g., ‘‘unac-ceptable’’ for SD, ‘‘poor’’ for D, ‘‘average’’ for N, ‘‘good’’ for A,‘‘excellent’’ for SA, etc.).

Table 6Vector Ea indicating the matching of the input questions to the PZB scale.
Question ra,b PZB scale
pzb1 pzb2 pzb3 pzb4 pzb5 pzb6
Accessibility �Ease of navigation �Usefulness of the information �Simplicity of information �Customer attention �Suitability to needs �Ease of operations �Reliability of operations �Security of operations �Agility of operations �Overall satisfaction �
11544 R.A. Carrasco et al. / Expert Systems with Applications 39 (2012) 11535–11547
On the other hand, we consider that all input domains have in-cluded the value Unknown (UNK) to represent possible non-re-sponses (defined in Section 3.1). The UNK values are frequent inthe R4 questionnaire since customers’ textual opinions normallyonly contain a few items of the questionnaire.
4.2. Definition of the FMST
We proceed to define the representation and computationalmodel for all the domains of our problem as specified in Section3.2.
� Definition of the computational model of the FMST. We obtainmore precise domains for the input and output question-naires, bS and bSra;b, by choosing the possibly operator shownin Table 1 for r, the threshold v = 0.7, and the value of dis-cretization h= 200, i.e., 100-lower and 100-higher semantictranslations of each term of each domain.
� Definition of the computational model of the FMST. We definethe operators H,OWA, and H,LOWA, by choosing the necessityoperator defined in Table 2 for e.
4.3. Representation of customer opinions using the FMST depending ontype of customer
We follow the steps explained in Section 3.3:
� Identification of type of customer according to attitude. We calcu-late the linguistic summary SrYa;c
a ¼ srYa;ca ;Q ; TrYa;c
a
D Efor each
customer, ya,c, which is guided by the fuzzy linguistic quantifierQ = ‘‘most’’ representing the concept of fuzzy majority (Kacpr-zyk, 1986). Yager (1996) considers the parameterized familyof quantifiers Q(r) = qj,j = P 0 to represent this linguistic quan-tifier. Therefore, we propose using the linguistic quantifier‘‘most’’, which is defined as Q(r) = r1/2, r 2 [0,1] (see Fig. 6). After
Fig. 7. Representation of the term N for optim
calculating SrYa;ca , we compute the value ta,c using as threshold
f = 0.7. Some examples of this identification process are shownin Table 4.� Representation of customer opinions using the FMST. The two domains
used in our problem, the five and eleven-point Likert scales, aredefined symmetrically (see Figs. 3 and 4). Therefore, the minimumvalues of the semantic translation for each term are always the samewithin each domain. The same occurs for the maximum values.Therefore, according to the FMST parameters chosen in Section4.2 we have: d0a;b ¼ 0:352 and —d0a;b ¼ 0:348;8a 2 f1;2g; andd0a;b ¼ 0:854 and —d0a;b ¼ 0:846;8a 2 f3;4g (see Fig. 7 for an exam-ple). Some examples of the new set Za(ra,b) obtained for the custom-ers in Table 4 are shown in Table 5.
This model allows us to obtain a more precise representation ofthe opinions according to type of customer.
4.4. Obtaining a SERVQUAL scale evaluation value of service qualitywith the answers integrated to the input opinions
The two steps completed in the fourth phase (see Section 3.4)are described below:
� A process guided by the information, and provided by a set ofe-financial experts. The following four experts collaborated inthe process: two assistant professors from the MarketingDepartment of the University of Granada (Spain) with morethan 10 years of experience in researching and the rating of e-services, and two bank employees belonging to the on-linebanking department. The decision of the experts, i.e., the vectorEa, is shown in Table 6.� A process to obtain a SERVQUAL scale evaluation value of service
quality. In this process we calculate SYpzbi¼ s pzbY
i ;Q ; T pzbYi
D Efor each SERVQUAL scale in order to obtain the values of theoutput questionnaire, pzbo,i. We decided to undertake this inte-gration process according to most customers, thus we use therelative quantifier Q = ‘‘most’’ (defined in Fig. 6). We obtain theresults shown in Table 7 by integrating all the opinions of allthe customers. The table shows that all the scales have beenproperly evaluated with an acceptable truth value level. Notethat Responsiveness (pzbo,3) and Assurance (pzbo,4) obtain thehighest assessment, while Empathy (pzbo,5), which is slightlybelow Agree, obtains the worst.
We can apply this process of integration successively at differ-ent subsets of the total customer pool. Thus, a user can analyzethe temporal evolution of the SERVQUAL characteristics, that is,if these features have improved or worsened over a period oftime. To do so, we consider Ya(ra,b) to be the set of responses ina specific month and then perform the integration process. The
istic, neutral and pessimistic customers.

Table 7Result of the process to integrate the opinions of all customers.
pzbo,1 Tpzb1 pzbo,2 Tpzb2 pzbo,3 Tpzb3 pzbo,4 Tpzb4 pzbo,5 Tpzb5 pzbo,6 Tpzb6 #Ya
A+0.493 0.7073 A+0.132 0.708 A+0.697 0.7982 A+0.676 0.7982 A-0.123 0.7943 A+0.421 0.7983 1129
Table 8Result of the processes to integrate customer opinions each month.
Y pzbo.1 Tpzb1 pzbo.2 Tpzb2 pzbo.3 Tpzb3 pzbo.4 Tpzb4 pzbo.5 Tpzb5 pzbo.6 Tpzb6 #Y
Ag-09 A+0.310 0.708 A+0.043 0.708 A+0.557 0.709 A+0.519 0.709 A-0.408 0.713 A+0.230 0.709 336Se-09 A+0.591 0.707 A+0.145 0.708 A+0.714 0.852 A+0.731 0.852 A-0.021 0.850 A+0.523 0.852 391Oc-09 A+0.553 0.707 A+0.191 0.708 A+0.803 0.835 A+0.748 0.836 A+0.030 0.829 A+0.480 0.836 402
Table 9Result of the processes to integrate customer opinions by gender.
Y pzbo.1 Tpzb1 pzbo.2 Tpzb2 pzbo.3 Tpzb3 pzbo.4 Tpzb4 pzbo.5 Tpzb5 pzbo.6 Tpzb6 #Y
M A+0.204 0.708 A-0.221 0.709 A+0.429 0.799 A+0.434 0.798 A-0.468 0.797 A+0.017 0.799 604F A+0.829 0.707 A+0.536 0.708 A+0.846 0.767 A+0.846 0.779 A+0.306 0.791 A+0.846 0.790 525
R.A. Carrasco et al. / Expert Systems with Applications 39 (2012) 11535–11547 11545
results with the three different months are shown in Table 8. Ascan be seem, almost all the SERVQUAL characteristics improvedover time with the exception of Tangibles (pzbo,1) and OSI (pzbo,6),which show little change over the September–October period. Itis interesting to note that the most poorly evaluated feature,i.e., Empathy (pzbo,5), improved in the last month to reach a posi-tive value of Agree. All these conclusions have a tolerable truthvalue level.
Finally, Table 9 shows the results of the two integration pro-cesses considering Ya(ra,b) first for men and then for women. Wecan conclude (with a good truth value level) that women evaluateall the features significantly better than men.
5. Conclusions and future research
Firms and financial entities are competing not only with inter-nal and external organizations in today’s global conditions. In thiscontext, it is also important to achieve a congruent, desirable, andqualified service because quality is achieved when the desires andexpectations of the consumers are met. By the relevance, the qual-ity of the services and satisfaction should be measured (Büyüköz-kan & Çifçi, 2012).
In recent decades, marketing professionals have reached con-sensus that measuring customer satisfaction is key to developingcustomer-oriented strategies (Kohli & Jaworski, 1990; Narver &Slater, 1990) with a view to improving relationship marketing(Grönroos, 1996). However, there has been less agreement regard-ing the development of uniform methodologies and scales to mea-sure service quality. While it is true that the SERVQUAL scale hasmet with greater success than other initiatives in this field, the var-ious adaptations and changes made to the measurement scales of-ten make it difficult to compare results over time; a key aspect thatcompanies must take into account when implementing their mar-ket-oriented strategies. Even when the time horizons are the same,it is often impossible to aggregate the results if different types ofsurveys and measurement scales are used; a practice which is, atthe same time, customary. Moreover, the wide range of data collec-tion methodologies and measurement scales used by differentcompanies in the same market prevents comparing the results ofsurveys to evaluate service quality.
Although it is habitual to measure human perceptions with quiteaccurate instruments, such perceptions are characterized by uncer-tainty and fuzziness. Furthermore, variations in individual percep-
tions and personality mean that the same words can indicate verydifferent perceptions. In this context, the fuzzy linguistic approachseems to be an appropriate framework for modeling the information.
Given this heterogeneous context, we have developed a method-ology for aggregating different scales to achieve greater homogeneity.This methodology can be used for making comparisons over time orbetween companies with a view to undertaking more precise deci-sion making processes. Concretely, we have presented the problemof integrating semantically heterogeneous data (natural language in-cluded) from various web questionnaires with opinions about e-financial services. As a solution to this problem, we develop a modelbased on the fuzzy model based on semantic translation (FMST) un-der the perspective of the SERVQUAL instrument.
Several authors have adapted the SERVQUAL instrument to ana-lyze e-financial services expectations and perceptions about ser-vice quality (González et al., 2008; Han & Baek, 2004), but nonehave adopted the fuzzy linguistic approach.
Concisely, our methodological proposal to develop a modelbased on the FMST under the perspective of the SERVQUAL instru-ment proceeds in this way:
1. We first define the initial linguistic domains for each of thequestions of the input and output questionnaires in order todescribe human perceptions or attitudes as linguistic perfor-mance values.
2. We then define the representation and computational model ofthe FMST for all the domains of our problem.
3. Customer opinions are then represented using the FMSTdepending on type of customer. This phase is carried out intwo steps:
� Identification of the type of customer according to attitude.� Representation of the opinions of the customers using the
FMST.
4. The SERVQUAL scale evaluation value of service quality isobtained using the answers integrated to the input opinions.This phase is carried out in two steps:
� The first step is led by the information provided by e-finan-cial experts, in order to associate each attribute of the inputopinions with a SERVQUAL scale of the output questionnairetype.

11546 R.A. Carrasco et al. / Expert Systems with Applications 39 (2012) 11535–11547
� The second step is guided by the information provided bythe customers in order to obtain a SERVQUAL scale evalua-tion value of service quality with the integrated answers ofthe input opinions by means of linguistic summary.
The model proposed in this paper has been applied to integrateheterogeneous information drawn from four web questionnaires(from 0 to 10, from 1 to 5 and online reviews) containing variousquestions using several scales regarding the SERVQUAL instrumentand satisfaction of customers of a Spanish savings bank.
To identify the type of customer, we calculate a linguistic sum-mary for each customer which is guided by the quantifier ‘‘most’’included in the family of quantifiers, Q(r) = qj as proposed in Yager(1996) to verify if most customer responses are strongly disagree/agree. In this case, we consider that the customer is pessimistic/optimistic, respectively, using the threshold: v = 0.7. Otherwise,we categorize the customer as neutral. According to the FMSTparameters chosen in Section 4.2, we represent customer re-sponses by means of a maximum, minimum or zero semantictranslation of the initial terms of the responses for pessimistic,optimistic and neutral customers, respectively.
Finally, future research should focus on comparing the resultsobtained by dividing the sample according to other variables inter-nal to the entity such as degree of linking o dependence with theproducts, date of registration in the electronic services system, cus-tomer’s age, or others. Moreover, it would be interesting to bench-mark different entities in the sector by applying this linguisticintegration process.
References
Awasthi, A., Chauhan, S. S., Omrani, H., & Panahi, A. (2011). A hybrid approach basedon SERVQUAL and fuzzy TOPSIS for evaluating transportation service quality.Computers & Industrial Engineering, 61, 637–646.
Bahia, K., & Nantel, J. (2000). A reliable and valid measurement scale for theperceived service quality of banks. International Journal of Bank Marketing, 18(2).84-81.
Bath, M. A. (2005). Correlates of service quality in banks: An empirical investigation.Journal of Services Research, 5(1), 77–99.
Bonissone, P. P. (1982). A fuzzy sets based linguistic approach: Theory andapplications. In M. M. Gupta & E. Sanchez (Eds.), Approximate reasoning indecision analysis (pp. 329–339). Berlin: Springer.
Bonissone, P. P., & Decker, K. S. (1986). Selecting uncertainty calculi and granularity:An experiment in trading-off precision and complexity. In J. F. Lemmer & L. H.Kanal (Eds.), Uncertainty in Artificial Intelligence (pp. 217–247). North-Holland:Amsterdam.
Bordogna, G., & Passi, G. (1993). A fuzzy linguistic approach generalizing booleaninformation retrieval: A model and its evaluation. Journal of American Society forInformation Science, 44, 70–82.
Bordogna, G., & Passi, G. (2001). An ordinal information retrieval model.International Journal of Uncertainty, Fuzziness Knowledge Based Systems, 9, 63–76.
Brasil, R. M. N., Garcıa, F. C., & Antonialli, L. M. (2006). Qualidade percebida emserviços: o caso dos clientes de correspondentes bancários da Caixa EconômicaFederal. Brasil: Anais ENAMPAD.
Büyüközkan, G., & Çifçi, G. (2012). A combined fuzzy AHP and fuzzy TOPSIS basedstrategic analysis of electronic service quality in healthcare industry. ExpertSystem with Applications, 39, 2341–2354.
Carrasco, R. A., Galindo, J., & Vila, M. A. (2001). Using artificial neural network todefine fuzzy comparators in FSQL with the criterion of some decision-maker.Lecture Notes in Computer Science, 2085, 587–594.
Carrasco, R. A., & Villar, P. (2011). A new model for linguistic summarization ofheterogeneous data: An application to tourism web data sources. SoftComputing, 16(1), 135–151.
Chin-Hung, L. (2008). A group decision-making framework with various ratingattitudes using fuzzy set theory to prioritize design requirements in qualityfunction deployment. International Journal of Industrial Engineering, 15(3),294–303.
Chiou, H. K., Tzeng, G. H., & Cheng, D. C. (2005). Evaluating sustainable fishingdevelopment strategies using fuzzy MCDM approach. Omega, 33, 223–234.
Chou, C. C., Liu, L. J., Huang, S. F., Yih, J. M., & Han, T. C. (2011). An evaluation ofairline service quality using the fuzzy weighted SERVQUAL method. Applied SoftComputing, 11, 2117–2128.
Cristobal, E., Flavian, C., & Guinaliu, M. (2007). Perceived e-service quality (PeSQ):Measurement validation and effects on consumer satisfaction and web siteloyalty. Managing Service Quality, 17(3), 317–340.
Delgado, M., Verdegay, J. L., & Vila, M. A. (1992). Linguistic decision making models.International Journal of Intelligent Systems, 7, 479–492.
Deng, W., & Pei, W. (2009). Fuzzy neural based importance-performance analysisfor determining critical service attributes. Expert Systems with Applications,36(2), 3774–3784.
Dixon, P. (2001). Basics of Oracle text retrieval. IEEE Data Engineering Bulletin, 24(4),11–14.
Fernández-Barcala, M. (2000). Validación de SERVQUAL como instrumento demedida de la calidad de servicio bancario. Revista Europea de Dirección yEconomıa de la Empresa, 9(1), 57–70.
Galindo, J., Carrasco, R. A., & Almagro, A. M. (2008). Fuzzy Quantifiers with andwithout arguments for databases: Definition, implementation and applicationto fuzzy dependencies. In Proceedings 12th international conference informationprocessing and management of uncertainty.
González, M. E., Mueller, R. F., & Mack, R. W. (2008). An alternative approach inservice quality: An e-banking case study. The Quality Management Journal, 15(1),41–59.
Grönroos, C. (1996). Relationship marketing: Strategic and tactical implications.Management Decisions, 34(3), 5–14.
Han, S. L., & Baek, S. (2004). Antecedents and consequences of service quality inonline banking: An application of the SERVQUAL instrument. Advances inConsumer Research, 31, 208–214.
Herrera, F., & Herrera-Viedma, E. (2000). Linguistic decision analysis: Steps forsolving decision problems under linguistic information. Fuzzy Sets and Systems,115(10), 67–82.
Herrera, F., Herrera-Viedma, E., & Verdegay, J. L. (1995). A sequential selectionprocess in group decision making with linguistic assessment. InformationSciences, 85, 223–239.
Herrera-Viedma, E. (2001). An information retrieval system with ordinal linguisticweighted queries based on two weighting elements. International Journal ofUncertainty, Fuzziness Knowledge Based Systems, 9, 77–88.
Herrera-Viedma, E., López-Herrera, A. G., Luque, M., & Porcel, C. (2007). A fuzzylinguistic IRS model based on a 2-tuple fuzzy linguistic approach. InternationalJournal of Uncertainty, Fuzziness Knowledge Based Systems,15, 225–250.
Huynh,V.N., Nakamori, Y., & Lawry, J. (2006). Ranking fuzzy numbers using targets,in Proc. Inf. Process. Manag. Uncertain. Knowl.-Based Syst. (pp. 140–147), Paris,France.
Janda, S., Trocchia, P. J., & Gwinner, K. P. (2002). Consumer perceptions of Internetretail service quality. International Journal of Service Industry Management, 13(5),412–431.
Jayawardhena, C. (2004). Measurement of service quality in internet banking: Thedevelopment of an instrument. Journal of Marketing Management, 20, 185–207.
Jun, M., & Cai, S. (2001). The key determinants of Internet banking service quality: Acontent analysis. The International Journal of Bank Marketing, 19(7), 276–291.
Kacprzyk, J. (1986). Group decision making with a fuzzy linguistic majority. FuzzySets Systems, 18, 105–118.
Kacprzyk, J., & Yager, R. R. (2001). Linguistic summaries of data using fuzzy logic.International Journal of General Systems, 30, 33–154.
Khan, M. S., & Mahapatra, S. S. (2009). Service quality evaluation in internetbanking: An empirical study in India. International Journal of Indian Culture andBusiness Management, 2(1), 30–46.
Kohli, A. K., & Jaworski, B. J. (1990). Market orientation: The construct, researchpropositions and managerial implications. Journal of Marketing, 54, 1–18.
Kumar, M., Kee, F. T., & Manshor, A. T. (2009). Determining the relative importanceof critical factors in delivering service quality of banks. An application ofdominance analysis in SERVQUAL model. Managing Service Quality, 19(2),211–228.
Ladhari, R. (2009). A review of twenty years of SERVQUAL research. InternationalJournal of Quality and Service Sciences, 1(2), 172–198.
Ladhari, R., Ladhari, I., & Morales, M. (2011). Bank service quality: ComparingCanadian and Tunisian customer perceptions. International Journal of BankMarketing, 29(3), 224–246.
Laurent, A. (2003). A new approach for the generation of fuzzy summaries based onfuzzy multidimensional databases. Intelligent Data Analysis, 7(2), 155–177.
Likert, R. (1931). A technique for the measurement of attitudes. Archives of Psychology.New York: Columbia University Press.
Lin, H. T. (2010). Fuzzy application in service quality analysis: An empirical study.Expert Systems with Applications, 37(1), 517–526.
Lin, J. S. C. (2011). Assessing the self-service technology encounters: Developmentand validation of SSTQUAL scale. Journal of Retailing, 87(2), 194–206.
Loiacono, E. T., Watson. R. T. & Goodhue, D. L. (2000). Webqual: A Website QualityInstrument.Working Paper 2000-126-0, University of Georgia.
Loiacono, E. T., Watson, R. T., & Goodhue, D. L. (2007). WebQual: An instrument forconsumer evaluation of web sites. International Journal of Electronic Commerce,11(3), 51–87.
McInnis, C., Griffin, P., James, R., & Coates, H. (2001). Development of the courseexperience. Canberra: DETYA.
McIver, J. P., & Carmines, E. G. (1981). Unidimensional scaling. Newbury Park, CA:Sage.
Narver, J. C., & Slater, S. F. (1990). The effect of a market orientation on businessprofitability. Journal of Marketing, 54, 20–35.
Parasuraman, A., Zeithaml, V. A., & Berry, L. L. (1985). A conceptual model of servicequality and its implications for future research. Journal of Marketing, 49, 41–50.
Parasuraman, A., Zeithaml, V. A., & Berry, L. L. (1988). SERVQUAL: A multiple-itemscale for measuring consumer perceptions of service quality. Journal of Retailing,64, 12–40.

R.A. Carrasco et al. / Expert Systems with Applications 39 (2012) 11535–11547 11547
Parasuraman, A., Zeithaml, V. A., & Berry, L. L. (1991). Refinement and reassessmentof the SERVQUAL scale. Journal of Retailing, 67, 420–450.
Parasuraman, A., Zeithaml, V. A., & Berry, L. L. (1994). Reassessment of expectationsas a comparison standard in measuring service quality: Implications for furtherresearch. Journal of Marketing, 58, 111–124.
Parasuraman, A., Zeithaml, V. A., & Malhotra, A. (2005). E-S-QUAL: A multiple-itemscale for assessing electronic service quality. Journal of Service Research, 7(3),213–233.
Rajesh, N., Ranjith, P. V., Sumana, B., & Charu, S. (2010). A study of service quality onbanks with servqual model. Journal of Management, 7(1), 35–45.
Saleh, F., & Ryan, C. (1991). Analysing service quality in the hospitality industryusing the SERVQUAL model. The Service Industries Journal, 11(3), 324–345.
Saurina, C. (2002). Medida de la calidad: Adaptación de la escala SERVQUAL alÁmbito Financiero. Revista Española de Financiación y Contabilidad, 31(113),803–831.
Shea, C. (2008). Oracle Text Reference, 11g Release 1 (11.1), Part Number B28304-03.
Umano, M., & Fukami, S. (1994). Fuzzy relational algebra for possibility-distribution-fuzzy-relational model of fuzzy data. Journal of IntelligentInformation Systems, 3, 7–28.
Wu, Y. L., Tao, Y. H., & Yang, P. C. (2010). Learning from the past and present:Measuring Internet banking service quality. The Service Industries Journal, iFirstArticle, 1–21.
Yager, R. R. (1982). A new approach to the summarization of data. InformationSciences, 28, 69–86.
Yager, R. R. (1988). On ordered weighted averaging aggregation operators inmulticriteria decision making. IEEE Transactions on Systems Man Cybernetics,18(1), 183–190.
Yager, R. R. (1991). On linguistic summaries of data. In W. Frawley & G. Pietsky-Shapiro (Eds.), Knowledge Discovery in Databases (pp. 347–363). Cambridge:AAAI/MIT Press.
Yager, R. R. (1995). An approach to ordinal decision making. International Journal ofApproximate Reasoning, 12(3-4), 237–261.
Yager, R. R. (1996). Quantifier guided aggregation using OWA operators.International Journal of Intelligent System, 11(1), 49–73.
Yager, R. R. (1999). Decision making under uncertainty with ordinal information.International Journal of Uncertainty, Fuzziness Knowledge Based Systems, 7,483–500.
Yang, Z., Jun, M., & Peterson, R. (2004). Measuring customer perceived online servicequality Scale development and managerial implications. International Journal ofOperations & Production Management, 24(11), 1149–1174.
Zadeh, L. A. (1975). The concept of a linguistic variable and its applications toapproximate reasoning, Pt I, Information Sciences, 8,199-249, Pt II, InformationSciences, 8, 301–357, Pt III, Information Sciences, 9, 43–80.
Zeithaml, V.A., Parasuraman, A., & Malhotra, A. (2000). e-Service Quality: Definition,Dimensions and Conceptual Model. Working Paper. Marketing Science Institute,Cambridge, MA.
Zeithaml, V. A., Parasuraman, A., & Malhotra, A. (2002). Service quality deliverythrough web sites: A critical review of extant knowledge. Journal of the Academyof Marketing Science, 30(4), 362–375.
Zhou, T., Zhang, S. & Ji, B. (2010). Exploring the Effect of Online Banking ServiceQuality on Users’ Continuance Usage. e-Business and Information SystemSecurity (EBISS), 2010 2nd International Conference on (pp.1–4), 22–23 May2010.