expert system to detect incipient faults in rotating ...ijcte.org/papers/628-s0074.pdf · rotary...
TRANSCRIPT

Abstract—This paper refers to the design of an expert system
that captures a waveform through the use of an accelerometer,
processes the signal and converts it to the frequency domain
using a Fast Fourier Transformer to then, using artificial
intelligence techniques, specifically Fuzzy Reasoning, it
determines if there is any failure present in the underlying
mode of the equipment, such as imbalance, misalignment or
bearing defects.
Index Terms— Expert systems, fault diagnosis, fuzzy logic,
rotary machine, virtual instrumentation.
I. INTRODUCTION
About half of all operating costs in the majority of
processing and manufacturing plants refer to maintenance
costs [1]. That is the main reason for studies to be conducted
on activities that can potentially reduce the operating costs.
Monitoring the condition of the equipment to diagnose
failures or defects is one of the activities that can be referred
to as the field of activity in which the parameters, associated
to the operation of the equipment, are recorded with the
purpose of determining their integrity [2], [3]. Once the
integrity can be estimated this information can be for various
purposes; for example, planning maintenance stops reducing
drastically the risk of unforeseen breakages and the use of
corrective maintenance [4].
II. METHODOLOGY
This study was conducted in the development environment
of virtual instrumentation LabView. The initial step was to
define the best equipment for data retrieval best suited for the
job – the data collector KOSCAK VK500 E/B with a
capacity to collect the samples at intervals of 200ms at a
sampling rate of 5kHz. Through a graphical interface (Fig. 1)
the user has various information available; such as: the entry
signal acquired, sampling time, tolerance for frequency
search of the rotation basis, the rotary system, gains at entry,
direction of the entry signal rotations (radial or axial) and
potency of the equipment analysed.
The captured acceleration signal then goes through an
initial processing, where it is conditioned, integrated and
transformed to a frequency domain through a Fast Fourier
Transform (FFT) or a Discrete Fourier transform (DFT), in
case the number of entry samples is different from a power of
Manuscript received August 3, 2012; revised October 3, 2012.
The authors are with the São Paulo State University – UNESP, Sorocaba
campus, Brazil (e-mail: [email protected], {galdenoro, marilza,
marciomq, luizrosa}@sorocaba.unesp.br).
two (automatically chosen by the LabView System), with the
use of a Hanning window signal thus avoiding the “aliasing
“effect.
Fig. 1. Graphical interface - front painel
Therefore it uses Mathscript coding to determine the
deviation from the fundamental rotational frequency of the
equipment supplied by the user. Sometimes the data supplied
and entered by the user does not always correspond to the real
exact moment the signal was captured, so the rotational
system can be, for example, under a heavier load, having
impact in its working rotation. The information contained in
the velocity spectrum in the frequency domain are processed
by an inference system based in fuzzy rules for the
determination of the linguistic condition of each identifiable
frequency in the spectrum, in accordance to table 1, which
indicates the severity of the vibrations according to ISO 2372
[5]. According to the table I, it has the following classes of
equipments:
TABLE I: SEVERITY OF THE VIBRATIONS FOR THE CLASSES OF MACHINERY
1) Class I: Individual parts of motors and machines
completely connected to the complete machine in its
normal working condition (Production electrical motors
Expert System to Detect Incipient Faults in Rotating
Machines Using Fuzzy Logic and Virtual Instrumentation
Renato K. Vanni, Galdenoro Botura Jr, Marilza A. Lemos, Marcio A. Marques, and Luiz C. Rosa
International Journal of Computer Theory and Engineering, Vol. 4, No. 6, December 2012
1011

of up to 15kW are prime examples of motors in this
category).
2) Class II: Machines of medium capacity (typical
electrical motors with throughput of between 15kW to
75kW) with no special foundation, engines with rigid
mounting or machines of up to 300kW on special
foundation.
3) Class III: Big machines with spinning masses mounted
on heavy and rigid foundation, that relatively firm and
steady on the direction of the vibration measurements.
4) Class IV: Big machinery with spinning masses mounted
on foundations that are relatively flexible on the
direction of the vibration measurements (for example
turbo-generators, especially those with light
substructures).
And for the severity:
1) New equipment, initial operation condition, or
equipments in optimum conditions.
2) Equipment in good working condition.
3) In permissible working conditions, as long as not for
long periods of time.
4) Inadmissible working condition, as the vibration level
will cause damage to the equipment.
This controller has the throughput of the machine and the
vibration spectrum as its input variables. After processing, a
new spectrum is taken as a new exit, but this time with
linguistic condition for each of the frequency band. The
membership functions used is presented in Fig. 2-5.
Fig. 2. Levels of vibration
Fig. 3. Power classes
Fig. 4. Final condition
Fig. 5. Vibration level.
The Table of Fuzzy Inference containing the data on the
severity of the vibration is described in Tables II-V.
TABLE II: F. UZZY INFERENCE
1st_harm 2nd_harm 3rd_harm output
Alert Good Good Present
Critical Good Good Critical
Critical Good Alert Critical
Critical Alert Good Critical
Critical Alert Alert Critical
TABLE III: RULES FOR BEARING LOOSENESS
sub_harm Output
Good Not_present
Alert Present
Critical Critical
TABLE IV: RULES FOR THE UNBALANCING
Class I Class II Class III Class IV
Up to 1,8 Good Good Good Good
1,8-2,8 Alert Good Good Good
2,8-4,5 Alert Alert Good Good
4,5-7,1 Critical Alert Alert Good
7,1-1,2 Critical Critical Alert Alert
11,2-18 Critical Critical Critical Alert
Over 18 Critical Critical Critical Critical
TABLE V: RULES FOR THE MISALIGNMENT
Good Critical Critical
Alert Good present
Alert Alert present
Alert Critical Critical
Critical Good Critical
Critical Alert Critical
Critical Critical Critical
Alert Alert Present
Alert Critical Critical
Critical Good Critical
Critical Alert Critical
Critical Critical Critical
III. RESULTS
An example of input signals with their respective results is
displayed in the Fig. 3. In this test was used the follow
configuration: induction motor; cement mill drive system;
International Journal of Computer Theory and Engineering, Vol. 4, No. 6, December 2012
1012
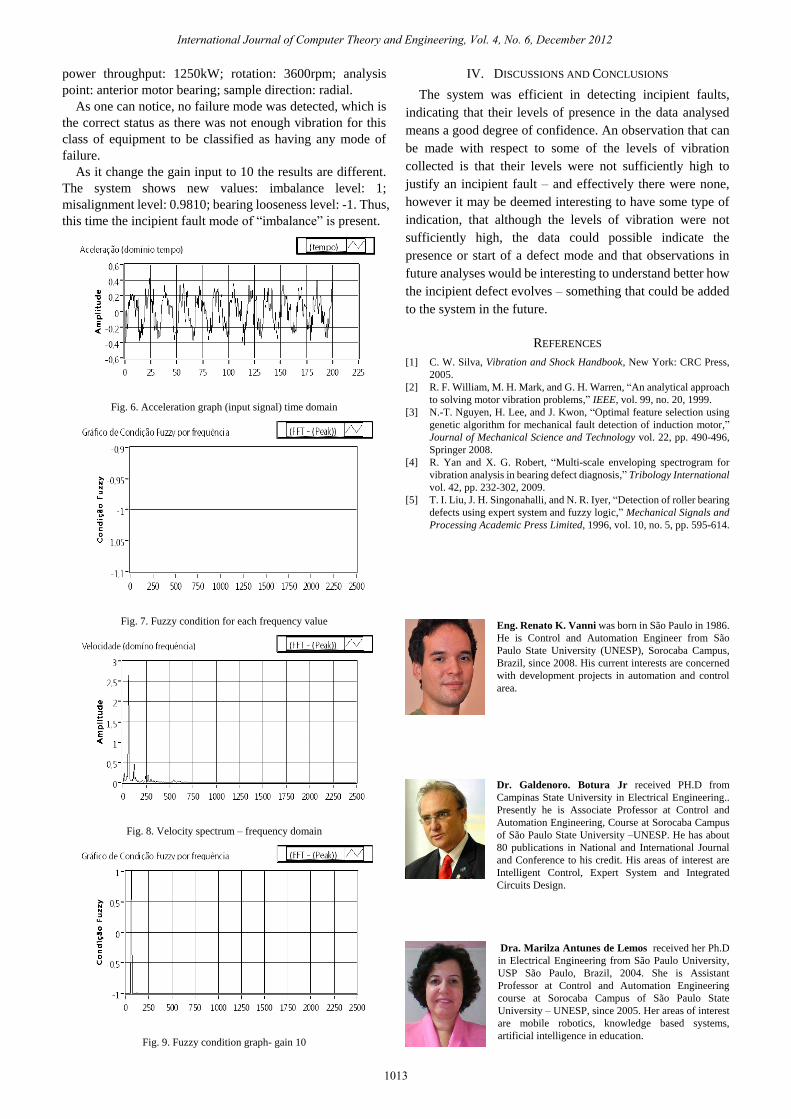
power throughput: 1250kW; rotation: 3600rpm; analysis
point: anterior motor bearing; sample direction: radial.
As one can notice, no failure mode was detected, which is
the correct status as there was not enough vibration for this
class of equipment to be classified as having any mode of
failure.
As it change the gain input to 10 the results are different.
The system shows new values: imbalance level: 1;
misalignment level: 0.9810; bearing looseness level: -1. Thus,
this time the incipient fault mode of “imbalance” is present.
Fig. 6. Acceleration graph (input signal) time domain
Fig. 7. Fuzzy condition for each frequency value
Fig. 8. Velocity spectrum – frequency domain
Fig. 9. Fuzzy condition graph- gain 10
IV. DISCUSSIONS AND CONCLUSIONS
The system was efficient in detecting incipient faults,
indicating that their levels of presence in the data analysed
means a good degree of confidence. An observation that can
be made with respect to some of the levels of vibration
collected is that their levels were not sufficiently high to
justify an incipient fault – and effectively there were none,
however it may be deemed interesting to have some type of
indication, that although the levels of vibration were not
sufficiently high, the data could possible indicate the
presence or start of a defect mode and that observations in
future analyses would be interesting to understand better how
the incipient defect evolves – something that could be added
to the system in the future.
REFERENCES
[1] C. W. Silva, Vibration and Shock Handbook, New York: CRC Press,
2005.
[2] R. F. William, M. H. Mark, and G. H. Warren, “An analytical approach
to solving motor vibration problems,” IEEE, vol. 99, no. 20, 1999.
[3] N.-T. Nguyen, H. Lee, and J. Kwon, “Optimal feature selection using
genetic algorithm for mechanical fault detection of induction motor,”
Journal of Mechanical Science and Technology vol. 22, pp. 490-496,
Springer 2008.
[4] R. Yan and X. G. Robert, “Multi-scale enveloping spectrogram for
vibration analysis in bearing defect diagnosis,” Tribology International
vol. 42, pp. 232-302, 2009.
[5] T. I. Liu, J. H. Singonahalli, and N. R. Iyer, “Detection of roller bearing
defects using expert system and fuzzy logic,” Mechanical Signals and
Processing Academic Press Limited, 1996, vol. 10, no. 5, pp. 595-614.
Eng. Renato K. Vanni was born in São Paulo in 1986.
He is Control and Automation Engineer from São
Paulo State University (UNESP), Sorocaba Campus,
Brazil, since 2008. His current interests are concerned
with development projects in automation and control
area.
Dr. Galdenoro. Botura Jr received PH.D from
Campinas State University in Electrical Engineering..
Presently he is Associate Professor at Control and
Automation Engineering, Course at Sorocaba Campus
of São Paulo State University –UNESP. He has about
80 publications in National and International Journal
and Conference to his credit. His areas of interest are
Intelligent Control, Expert System and Integrated
Circuits Design.
Dra. Marilza Antunes de Lemos received her Ph.D
in Electrical Engineering from São Paulo University,
USP São Paulo, Brazil, 2004. She is Assistant
Professor at Control and Automation Engineering
course at Sorocaba Campus of São Paulo State
University – UNESP, since 2005. Her areas of interest
are mobile robotics, knowledge based systems,
artificial intelligence in education.
International Journal of Computer Theory and Engineering, Vol. 4, No. 6, December 2012
1013

International Journal of Computer Theory and Engineering, Vol. 4, No. 6, December 2012
1014
Dr. Márcio Alexandre Marques, received his Ph.D.
at Physics from São Paulo University - USP/São
Carlos/Brazil, 1998. Graduate at Physics from São
Paulo University - USP/São Carlos/Brazil, 1989. He is
Assistant Professor at Control and Automation
Engineering course at the Sorocaba Campus of São
Paulo State University - UNESP. Has experience in
Biomedical Engineering, acting on the following
subjects: medical image processing and computer-aided diagnosis. Prof.
Marques won award: 1st place I Simpósio Internacional de Meio Ambiente e
Desenvolvimento Sustentável da Unesp - PROEX/UNESP (“Análise da
Incorporação de Resíduo de Pás Eólicas em Cimento Portland Através de
Imagens de Raios X”).
Dr. Luiz Carlos Rosa is Mechanical Engineer
Graduate on Campinas State University. Engineer
Ph.D from Polytechnic School of Sao Paulo
University. He is Plen Professor in Technology
Faculty at Sorocaba, since 1980 and Assistant
Professor in Control and Automation Engineering
course at Sorocaba Campus of São Paulo State
University – UNESP, since 2004. From 1975 to
1991 worked in Crushing Machine Fabrication
Industry as Industrial Manager. His areas of interest
are Manufacturing Engineering and Automation Systems.