experimental studies of lightning - aerospacelab · pdf fileissue 5 - december 2012 -...
TRANSCRIPT

Issue 5 - December 2012 - Experimental Studies of Lightning Strikes to Aircraft AL05-06 1
Lightning Hazards to Aircraft and Launchers
Experimental Studies of Lightning Strikes to Aircraft
P. Laroche, P. Blanchet, A. Delannoy †, F. Issac (Onera)
E-mail: [email protected]
Civil aviation transpor tation has been growing since the early for ties and has become today a massive and unique transpor t system for people across
continents and large countries. First age propeller airliners flew at low altitude and were often subjected to dangerous atmospheric and cloud hazards. Low visibility, heavy precipitation, severe turbulence, wind shear, icing and lightning are common weather hazards that are a challenge for flight safety. Among those weather hazards, lightning was the most unrecognized and misunderstood. Damages to aircraft due to lightning strike were frequently noticed; they range from arc spots on metal to centimeter-size holes in the fuselage, and dielectric radome and antenna destruction. Some cases of catastrophic events are directly attributed to lightning [1], [2]. Experimental in-situ studies were initiated no later than the early sixties [3], but the main in-flight research effor ts were under taken at the beginning of the eighties, when the perspective of a massive use of composite material in aviation was identified for a near future. Three major in-flight test programs were initiated in the USA and Europe by NASA, the Air Force, the FAA and the French Civil and Military Aviation Authorities, associated with Research Organizations. This paper is a review of the in-flight lightning strike experiments performed during that period. Information on aircraft missions, performances and instrumentation is given. Available results and proposed interpretations are presented. The main outcomes of those experiments are emphasized and knowledge gaps and missing information are mentioned.
Lightning strike to civil and military aircraft
Despite the fact that civil and military aircraft avoid flying in thunderstorms because of the severity of the weather hazards encountered, such as hail, heavy precipitation, turbulence and wind shear, noticeable, serious or catastrophic accidents are reported to be due to lightning strike as a primary cause [4], [1]. For civilian aircraft, a catastrophic accident in the USA on a Pan Am Boeing 707 in 1963 was reported by the civil aviation investigation board to be due to induced electromagnetic effects in the fuel tank [2], [http://en.wikipedia.org/wiki/Pan_Am_Flight_214].
In 1976, an Iran Air Boeing 747 crashed before landing in Madrid, just after being struck by lightning. The investigation board concluded that the probable primary cause of the catastrophe was arcing in the fuel tank, induced by a direct lightning strike [1]. A report on an accident ending with the loss of an F4 air fighter clearly established a problem of a fuel tank explosion due to a lightning strike.
Detailed data on lightning strikes to military and civil aircraft are based on crew and maintenance team reports. Data for the 1950-1974 period has been reported for the USA [5] and Japan [6], [7] where winter storms bring peculiar lightning configurations [8], and for South Africa [9]. Combining propeller and jet airliner data, a mean rate of one event per year, or per 3000 h of flight, is reported. Similar data analyses were done for the UK, France and Germany, for military and civil aircraft [10].
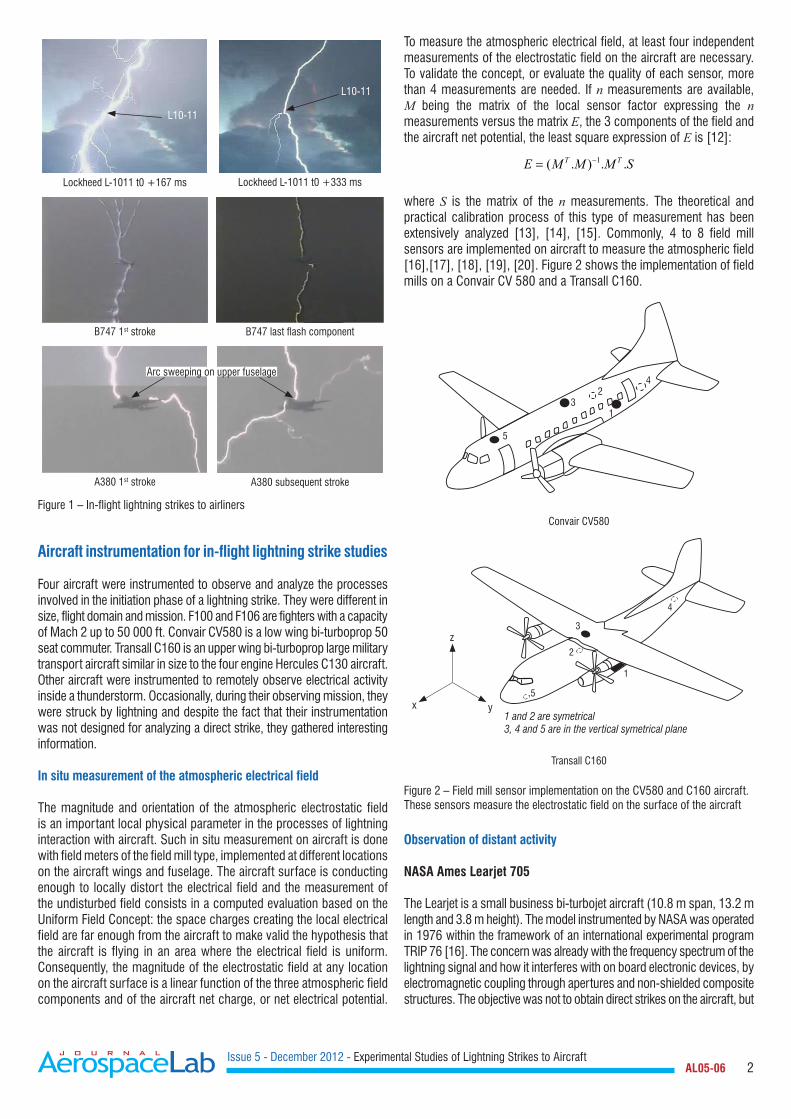
In any case, lightning strike to airliners is common enough to be observed and documented when it happens near an airport [11]. Figure 1 shows 3 cases of lightning strike on different airliners flying at low altitude. It must be noticed that, for the 3 cases, the aircraft is at the center of the lightning flash and pictures show evidence of upward and downward branching of the lightning channel from the aircraft.
Issue 5 - December 2012 - Experimental Studies of Lightning Strikes to Aircraft AL05-06 2
Lockheed L-1011 t0 +167 ms Lockheed L-1011 t0 +333 ms
B747 1st stroke B747 last flash component
A380 1st stroke A380 subsequent stroke
L10-11
L10-11
Arc sweeping on upper fuselage
Figure 1 – In-flight lightning strikes to airliners
Aircraft instrumentation for in-flight lightning strike studies
Four aircraft were instrumented to observe and analyze the processes involved in the initiation phase of a lightning strike. They were different in size, flight domain and mission. F100 and F106 are fighters with a capacity of Mach 2 up to 50 000 ft. Convair CV580 is a low wing bi-turboprop 50 seat commuter. Transall C160 is an upper wing bi-turboprop large military transport aircraft similar in size to the four engine Hercules C130 aircraft. Other aircraft were instrumented to remotely observe electrical activity inside a thunderstorm. Occasionally, during their observing mission, they were struck by lightning and despite the fact that their instrumentation was not designed for analyzing a direct strike, they gathered interesting information.
In situ measurement of the atmospheric electrical field
The magnitude and orientation of the atmospheric electrostatic field is an important local physical parameter in the processes of lightning interaction with aircraft. Such in situ measurement on aircraft is done with field meters of the field mill type, implemented at different locations on the aircraft wings and fuselage. The aircraft surface is conducting enough to locally distort the electrical field and the measurement of the undisturbed field consists in a computed evaluation based on the Uniform Field Concept: the space charges creating the local electrical field are far enough from the aircraft to make valid the hypothesis that the aircraft is flying in an area where the electrical field is uniform. Consequently, the magnitude of the electrostatic field at any location on the aircraft surface is a linear function of the three atmospheric field components and of the aircraft net charge, or net electrical potential.
To measure the atmospheric electrical field, at least four independent measurements of the electrostatic field on the aircraft are necessary. To validate the concept, or evaluate the quality of each sensor, more than 4 measurements are needed. If n measurements are available, M being the matrix of the local sensor factor expressing the n measurements versus the matrix E, the 3 components of the field and the aircraft net potential, the least square expression of E is [12]:
1( . ) . .T TE M M M S−=
where S is the matrix of the n measurements. The theoretical and practical calibration process of this type of measurement has been extensively analyzed [13], [14], [15]. Commonly, 4 to 8 field mill sensors are implemented on aircraft to measure the atmospheric field [16],[17], [18], [19], [20]. Figure 2 shows the implementation of field mills on a Convair CV 580 and a Transall C160.
42
3
5
1
Convair CV580
4
2
5
1
3z
yx1 and 2 are symetrical3, 4 and 5 are in the vertical symetrical plane
Transall C160
Figure 2 – Field mill sensor implementation on the CV580 and C160 aircraft.These sensors measure the electrostatic field on the surface of the aircraft
Observation of distant activity
NASA Ames Learjet 705
The Learjet is a small business bi-turbojet aircraft (10.8 m span, 13.2 m length and 3.8 m height). The model instrumented by NASA was operated in 1976 within the framework of an international experimental program TRIP 76 [16]. The concern was already with the frequency spectrum of the lightning signal and how it interferes with on board electronic devices, by electromagnetic coupling through apertures and non-shielded composite structures. The objective was not to obtain direct strikes on the aircraft, but

Issue 5 - December 2012 - Experimental Studies of Lightning Strikes to Aircraft AL05-06 3
rather to measure the electromagnetic effect of nearby lightning flashes. The aircraft was instrumented to measure the electric atmospheric field near thunderstorms and to record the HF transient signal produced on test equipment inside and outside the aircraft. Narrow band measurements were made on 5 frequencies: 10 kHz, 1 MHz, 3 MHz, 10 MHz and 30 MHz. This rather low frequency coverage includes most of the spectrum of a return stroke component, of a Cloud-to-Ground flash.
Hercules C130 aircraft
In 1981, a C130 Aircraft, instrumented by NOAA, was flown in the vicinity of thunderstorms, in order to gather measurements on the electromagnetic effects of distant flashes on an aircraft. This aircraft had been directly struck by lightning twice [21]. The Hercules C130 is a four engine turboprop Military transport aircraft with a 40.4 m span, 29.8 m length and 11.6 m height; its speed is 150 m/s and its service ceiling is 33 000 ft. The NOAA aircraft was equipped with dE/dt, dH/dt and dI/dt sensors with ranges set for a large lightning flash at a distance of 35 km. The environment of the aircraft was surveyed with a digital onboard weather radar and an onboard lightning detector.
Aircraft instrumentation for direct lightning strike studies
Four aircraft have been instrumented specifically for direct lightning strike studies.
F-100F aircraft
The North American Super Sabre F-100F aircraft was a two seat military trainer single engine jet fighter (14 m length + 2.8 m pitot, 11.8 m span, 4.95 m height). From 1964 to 1966, an aircraft of this type was instrumented with electric current measuring boom, electrostatic field measurements and video camera to obtain data on direct lightning strikes [3]. For the experiment conducted by the Air Force Cambridge Research Laboratory, the aircraft was flown in thunderstorms over Florida, USA, and was struck by lightning 33 times during the 1965 experiment. Simultaneously, atmospheric electric field measurements were preformed around and above the storms by a C130 and U2 instrumented aircraft. Data acquisitions were performed with the 60’s state of the art recording devices and quantitative information on direct lightning current is not available in the literature.
F-106B Delta Dart aircraft
The Convair F-106 B is a two seat military jet fighter aircraft, operated by NASA Langley Research Center (figure 3) between 1980 and 1986. It is longer than the F100F aircraft, but much smaller than the two instrumented transport aircraft described below: wing span 11.7 m, length 21.6 m and height 6.2 m. It had a service ceiling of 17 km (52 700 ft). The aircraft was modified for the purpose of the lightning experiment. One significant modification was the replacement of the composite nose radome by a metallic radome. The maximum speed of the F-106 is Mach 2.3. During the lightning experiment it was flown at a subsonic speed; cloud penetration was performed at 300 kt (about 150 to 170 m/s from 14 000 ft to 20 000 ft). Air speed is a significant parameter to interpret the timing of the interaction of the aircraft with a lightning flash. The F106 was equipped with optical sensors (video camera and light detector). Electromagnetic instrumentation consisted in B-dot, D-dot sensors and current measurement with resistive shunt. Data acquisition was performed with the 1980’s state of the art digital waveform recorders: 10 ns sample interval and 6 bit
resolution, allowing a continuous record of 1.3 ms. Permanent record of the entire duration of a lightning event was provided, with analogue tape recorder, on which the time derivative of the current between the nose boom and fuselage, and the time derivative of magnetic and electric flux measured in six different place on the aircraft (see figure 4 from [22]) were recorded. The measuring range of the sensors was adapted to the signal observed during the flight research program, from 1980 up to 1986.
Figure 3 – NASA F-106 B research aircraft. [Photo NASA]. The aircraft was devoted to the NASA Langley Research Center from 1979 to 1991. Modified for in flight lightning experiments in 1979, it was used by NASA for in-flight lightning experiments from 1980 to 1986
D•
D•
D•I
•
D•
B•
B•
Dt∂
=∂
(ELECTRIC FLUX DENSITY)
Bt∂
=∂
(MAGNETIC FLUX DENSITY)
It∂
=∂
(TOTAL CURRENT)
Figure 4 – Electromagnetic sensors on the F-106 B aircraft (from [22]). A boom is connected to the aircraft nose, with a dI/dt sensor. dE/dt and dB/dt sensors are mounted on the aircraft fuselage
Convair CV-580 aircraft
The CV 580 aircraft is a two engine turboprop 50 seat commuter that was extensively used for medium hauls by several US airliners between the 60 s and the 80 s. The Federal Aviation Administration operated such an aircraft in 1984 and 1987 to conduct a lightning research program with Air Force Wright Aeronautical Laboratories [23], [24]. The aircraft length and span were, respectively, 24.8 m and 32.1 m. The standard speed for the experiment was between 80 m/s and 140 m/s.
The aircraft, identified as N49, was instrumented to measure the electrical parameters of the interaction between the lightning flash and the aircraft. Direct current flowing through the wings and the tail of the

Issue 5 - December 2012 - Experimental Studies of Lightning Strikes to Aircraft AL05-06 4
aircraft is measured by 4 resistive shunts (5 mΩ). The time derivative of the current flowing through the aircraft fuselage is measured at 5 different locations. The time derivative of the displacement current is delivered by 5 flush sensors, providing the electric field variations at each measuring site. All of these measurements are organized to make possible the description of the phenomenology of a lightning strike and to produce a quantitative evaluation of the threat.
The general objective of the experiment was to gather data on the high frequency variation of the electromagnetic fields produced by direct lighting strikes to aircraft and to compare those values with the magnitude applied by standard procedures in aircraft certification processes. The CV580 was flown in 1984 and 1985 close by and inside Florida thunderstorms with a particular effort to undergo lightning strike at a low level (between 2 000 and 4 000 ft AMSL), with the purpose of having the aircraft involved in a Cloud-to-Ground lightning flash, which are the type known to provide the largest current threat. The aircraft was not modified for the experiment, but extensive inspection and ground lightning tests were conducted, for safety purposes. A less volatile fuel, the JP-5, was used for the flight to minimize the risk of fire and explosion.
Determination of the electrostatic configuration of aircraft lightning strikes was possible, with the installation of a DC field meter of the field mill type. 4 sensors were installed by NRL and 5 by Onera.
Transall C160 aircraft
A Transall C160 aircraft was instrumented in the early 1980s to observe and analyze direct lightning strikes. The C160 is a bi-turboprop military carrier, with a typical airspeed of 140 m/s and an effective operating ceiling of 26 000 ft . The overall dimension of the standard aircraft is 40 m span, 32.4 m length and 11.78 m height. The actual length of the Transall, equipped with nose and tail current measuring boom, was 42.4 m. Two major field experiments were conducted in 1984 and 1988, for which measurements were available to characterize the lightning parameter and the storm environment. 32 direct lightning strikes were observed during the two campaigns.
Instrumentation for lightning characterization
Direct current measurements were performed with two 5 m booms connected to the fuselage by a 5 mΩ resistive shunt. Two 1.5 m length booms were installed on the left and right wing tips, and connected to the structure with a 5 mΩ shunt. The measuring range was ± 100 kA (bandwidth 10 MHz). Current derivative sensors were installed in the middle of the nose and tail boom; the measuring signal was transmitted with a fiber optic link; the measuring range was 109 to 1011 A/s.
Fast electric and magnetic field variations produced by a direct lightning strike were measured at 7 locations on the aircraft (figure 5), in order to obtain a comprehensive interpretation of the current flow and field variation on the surface of the aircraft. The electric field variation was delivered by an FPD sensor (Flush Plate Dipole) whose signal was recorded in 3 separate ranges: E from 103 to 105 V/m and dE/dt from 1010 to 1012 V/m.s (frequency range 200 MHz) and EBF from 104 to 106 V/m (frequency range 5 Hz - 5 MHz).
7 video cameras running at 200 fps provided the general visual aspect of the lightning channels attached to the aircraft.
EH5
camera
camera
composite door
fast camera
EH7
EH6
EH4I
I
EH2EH3
EH11
dIIdt
=
1dIIdt
=
Figure 5 – General instrumentation of the C160 aircraft. EH1-EH7 are fast capacitive antennas, I and dI/dt are the shunt and current derivative sensor installed on current measuring booms (from figure 1 of [39])
Electrical environment of a direct lightning strike.
Onboard electrical measurements provided information on the electrical conditions in which the aircraft had been struck by lightning. The aircraft potential and atmospheric electric field were derived from a DC field meter of the “field mill” type, installed flush at 5 different locations on the fuselage (figure 2); the measuring range of each sensor was +/- 1 MV/m and the rise time of the sensor was 15 ms.
The triboelectrical current was evaluated with an electrode deposited on the leading edge of a pod installed under the wing, carrying various particle measuring devices. The effective surface of the probe was 0.24 m² and the measuring range was +/- 100 µA (figure 6).
Triboelectric current sensor
Air conductivity Guerdien sensor
Reverse-flow
Rosemount
Rosemount
1D-P
Cloud precipitation
Electrical charge sensor
2D-P
Figure 6 – Cloud parameter measuring pod installed under the C160 aircraft wing
The electrical ionic conductivity of the air was provided by a Guerdien type sensor. The electrical charge of water drops and ice particles was measured by an electrical induction cylinder [25], [26]. Particle Measuring Sensors provided data on the size and shape of cloud particles. With these measurements, it is possible to determine whether the aircraft was flying in cloudy or clear air.

Issue 5 - December 2012 - Experimental Studies of Lightning Strikes to Aircraft AL05-06 5
Several passive dischargers were instrumented to measure the corona current emitted by these devices in storm cloud conditions.
General results
Distant and close lightning observations
The NASA Learjet performed 29 flights, during which 300 passes were made near thunderstorm cells. During one flight, the aircraft was struck by lightning. The magnitude of the ambient electric field was 68 kV/m just prior to the lightning strike [16]. The altitude was 11.2 km, the top of the cells was 13.1 km and the authors assumed that the field magnitude was large enough in relation to the aircraft dimension for it to trigger a lightning flash (1 MV of potential drop along the aircraft dimension).
The C130 was struck by lightning twice. The two events were obtained at the -0.7 °C and -5 °C level over Florida, USA. Instrumentation provided information on a low level signal for the initiation phase and during the entire duration of the event. The authors claimed to have indications of leader emission from the aircraft, triggering a cloud-to-aircraft lightning flash.
Direct lightning strike observations
Between 1980 and 1986. NASA conducted extensive in-flight lightning strike experiments with an instrumented F106 aircraft. This aircraft penetrated thunderstorms about 1500 times and was struck by 714 lightning flashes [27],[21].
During the two year campaign of 1986 and 1987 [23], [24], [28] [29], the CV580 aircraft was struck by lightning 52 times. Five lightning strikes occurred at low altitude, below 4 000 ft. The other events were observed above 14 000 ft. The trajectory of the aircraft was chosen to approach thunderstorm cells at a given altitude, staying outside of a precipitation echo larger than 40 dBz, as indicated by the onboard weather radar. 47 events were observed between 14 000 ft and 19 000 ft, with the local temperature depending on the situation and varying from +5 °C to – 9 °C. The results of this lightning strike chasing are illustrated in Table 1 below, from [24]. No lightning strike was obtained between 6 000 ft and 14 000 ft; events below 4 000 feet were difficult to obtain.
Altitude (ft) Flying time (h) N° of events
17 000 and above 12.0 1615 000 – 17 000 7.0 713 000 – 15 000 18.0 2411 000 – 13 000 2.4 09 000 – 11 000 2.3 07 000 – 9 000 2.3 05 000 – 7 000 12.0 03 000 – 5 000 5.0 2BELOW 3 000 17.0 3
Table 1 – CV580 lightning campaign: Number of strikes versus hours flown at a given altitude (From TABLE 4 of [24])
Direct lighting strike observations on the C160 Transall aircraft were obtained during the 1984 and 1988 campaigns [30], [31]. The flight pattern followed by the aircraft to be struck by lightning consisted
in successive level explorations, from 10 000 ft to 20 000 ft. The aircraft flew out of the 40 dBz echo to avoid hail and heavy turbulence. The first campaign was held in the South West of France and was associated to the LANDES 84 experiment, which contributed the support of ground atmospheric measurements from a Doppler weather radar. 18 lightning strikes were observed during 7 different storms in June 1984, between 0 °C and - 8 °C. The mean duration of the flashes was 300 ms (maximum 800 ms, minimum 80 ms). The electromagnetic signals measured consist in bursts of pulses with a duration of a few ms and a repetition rate of a few hundred µs, and of isolated pulses with a rise time of about 100 ns and a typical rate of a few ms.
The experiment was reproduced in 1988 without the ground weather radar support. 17 lightning strikes were obtained between 10 000 ft and 20 000 ft. Table 2 below shows the number of events versus the altitude and the local temperature.
N° of flashes Temperature Altitude
1 -4°C 10 000 ft5 -5°C 14 000 ft4 -10°C 14 000 ft3 0°C 15 000 ft1 -10°C 19 000 ft3 -12 °C 20 000 ft
Table 2 – C160 aircraft 1988 campaign. Number of flashes versus altitude and temperature
Phenomenology of lightning strikes to aircraft
Initiation of a lightning strike
The description of the physical processes involved in the first phase of the initiation of a lightning strike is an important step in the understanding of the phenomenology of the event. The design of the instrumentation of the experimental aircraft was oriented toward the observation of large magnitude electromagnetic signals and bright optical phenomena. Low currents associated with the onset of discharge were not easily detected. Also, the faint luminosity of the streamer and leader approaching to, or merging from the aircraft cannot be detected by the video camera installed onboard. The most sensitive parameter available for the observation of the initiation of a lighting strike is the electric field variation (or its time derivative), measured over the aircraft surface.
The fast electric field variation on the surface is produced either by the fast charging of the aircraft, or by displacement of conductive elements from, or close to the aircraft, in the ambient atmospheric electrical field. A similarity was observed between the signals measured on the CV580, C160 and F106B. The interpretation of these measurements in terms of lightning phenomenology referred to lightning flashes “triggered” by the aircraft or “interception” by the aircraft of a natural lightning flash channel.
Atmospheric field and aircraft net charge prior to the initiation of the flash
Analyses of the DC field measurements are presented in documents [20] for the campaigns performed on the C160 and CV580. The atmospheric field is obtained before and after the lightning strike, because the

Issue 5 - December 2012 - Experimental Studies of Lightning Strikes to Aircraft AL05-06 6
uniform field concept is not valid when the aircraft is connected to lightning channels. It is shown that the transversal, longitudinal or vertical components of the atmospheric field may or may not be permanently affected by the lightning strike, depending on the position of the aircraft versus the electric structure of the charged cloud inside which the lightning flash propagates. When an aircraft is submitted to a high electrostatic field, its net charge is determined by the value and orientation of the field and by the shape of the aircraft surface, from which corona discharges are emitted. This behavior is evidenced in [20], by considering the variation of the aircraft net potential produced by the large permanent field variation due to a nearby natural lightning flash. The aircraft net charge is found to be negative prior to lightning ignition. The mean net charge before a lightning strike was respectively -0.64 mC and -1.2 mC on the CV580 and C160. This is consistent with a scenario of initial positive corona or leader emission. This observed negative net charge is not necessarily an obstacle to the ignition of positive discharge from the aircraft. It can be interpreted as an initial process of the positive corona emission, which may be followed by the full development of a positive leader. It is not clear whether this net charge can facilitate the lightning strike occurrence or not, but it is worth considering that the electrical energy made available by the net charge is small, 276 J and 720 J respectively, on the CV580 and C160, keeping in mind that 500 J is the electrostatic energy of a 50 m3 area where a 30 kV/m uniform atmospheric field is applied. Table 3 from [32] shows the mean electrostatic configuration before a lightning strike.
CV580
Average Standard deviation min max
Q (mC) -0.66 ± 0.25 -1.11 -0.23Es (kV/m) 51 ± 19 25 87
Es/p (kV/m/bar) 92 ± 39 32 172C160
Average Standard deviation min max
Q (mC) -1.2 ± 0.75 -1.94 -0.84Es (kV/m) 59 ± 11 44 75
Es/p (kV/m/bar) 104 ± 19 77 131Table 3 – Ambient field and aircraft net charge just before a lightning strike to an aircraft - from [30]
The average mean field magnitude is similar for the two aircraft. Es/p is the ratio of the Atmospheric field over the local pressure. This parameter determines the behavior of the discharge propagating from an aircraft [32], [33], [34]. The reduced field in the aircraft vicinity at the onset of the lightning strike is close to 100 kV/m/bar; this corresponds to an atmospheric field of 100 kV/m close to the ground and close to 48 kV/m at an altitude of 6 000 m ( ~20 000 ft). The atmospheric field magnitude close to, or exceeding, 50 kV/m is commonly observed in the vicinity of, or inside, mature storm clouds [35], [36],[37], [38].
The aircraft triggering process
As mentioned above, the ignition processes are identified by the signature of the first fast E field signals measured on the aircraft. Two classes of signature have been observed. The first one consists in a fast and continuous decrease of the electric field at the aircraft surface, lasting a few milliseconds. In [39] [40], such a signature was reported as the first signals observed during a lightning flash ignition on the C160 aircraft. In figure 7a from [39], similar field excursions are recorded
at five different locations on the aircraft. The magnitude of the field increases during about 2.5ms, before a sharper decrease and inversion. In figure 7b from [39], the detailed evolution of a field variation of the same event compared to the current collected at the C160 nose boom shows that the decrease in the field excursion starts simultaneously with the onset of the first pulses of current. An inversion of the electric field excursion occurs when the stepping current is no longer visible and a continuous current of a few hundred amps in magnitude is established.
a)
0
0
0
0
0
E1
E3
E4
E5
E6
ELEC
TRIC
FIE
LD C
HANG
E
TIME
160 kV/m 2.5 ms
b)
400
A
B
C
D200
0
-200
-400
3
2
1
0
-2 -1 0 1 2 3 4 5 6 7ms
CURR
ENT
(103 A
)EL
ECTR
IC F
IELD
CHA
NGE
(kV
m-1)
Correlated electric field change and current records on the C-160 airplane: (1) electric field change at the forward upper fuselage sensor and (2) current at the nose boom shunt.
(1)
(2)
Figure 7 – Lightning initiation - Typical 1st large E field signal on the C160 aircraft -from [39]

Issue 5 - December 2012 - Experimental Studies of Lightning Strikes to Aircraft AL05-06 7
Similar surface E field variations are observed on the CV580 aircraft during the initiation phase of a lightning strike. The electric field waveforms observed on the Convair aircraft are presented and described in [29] and [24]. Figure 8 from [29] shows such a field variation. If we compare this signal with the signals recorded on the Transall aircraft (figure 7), it appears that not only the waveforms are similar but both the duration to peak and magnitude are comparable (3 to 5 ms and few hundred kV/m). For the F106 Aircraft. which is quite a different type of aircraft, similarity with the initial E field variation are pointed out in [40]. In figure 9 from [40], it is explained that an initial positive variation of the field would be due to the onset of a negative corona, which would be faint enough to produce low current pulses not detectable by the measuring shunt or the I dot sensor. This first signal is followed by a negative variation of the field, lasting about 0.5 ms. The signal on the F106B is, since this phase, similar to the first E field variation recorded for the CV580 (figure 8) and for the C160 (figure 7). The third step of this initiation phase is also similar for the 3 aircraft and corresponds to the occurrence of current pulses in bright channels. According to [40] the few hundred amp pulses are emitted by a negative stepped leader merging from a high negative field area of the aircraft; this negative current produces a continuous positive variation of the electric field on the aircraft, which is explained by the author as corresponding to a variation of the potential (modification of the net charge of the aircraft).
C/m²1 x 10-6
-2
-1,5
-1,0
-0,5
0,5
0
0 4 8 12 16 201E-3 SEC
Figure 8 – Lightning initiation. Typical 1st large E field signal on the CV580 aircraft - from [29]
Interpretation of measurements on the three instrumented aircraft lead to the same description of the phenomenology of lightning strike ignition. When the atmospheric electric field is large enough, a positive leader merges from the aircraft. A negative charge is induced on the aircraft, so that the entire system – the aircraft and the positive leader – remains electrically neutral. Increasing the aircraft negative charge makes possible the onset from the aircraft of a negative stepped leader, propagating from the aircraft in the opposite direction. The observations are consistent with the physical differences in the behavior of the positive leader and negative leader [33], [34]. Positive leader propagation initiates at a
speed of a few 104 m/s and involves a typical current of few amps; the propagation is continuous and becomes pulsed when the leader accelerates to a speed of a few 105 m/s. The negative leader is highly stepped and exhibits isolated pulses of a few hundred amps at an initial rate of a few hundred µs. This scenario, which corresponds to about 90 % of the observations made on the CV580 and C160, is illustrated in figure 10. It consists in the development of a bileader discharge, propagating freely from the aircraft in an area where a high electrical atmospheric field is present, inside or outside of a storm cloud.
E-FIELD-4.0
-2.0
-2.0
687 688 689
2.0
2.0
4.0
1.0
1.0
0.0
0.0
0.0
0.0
CURRENT PULSES (NOSE BOOM)
CURRENT PULSES (TAIL FIN)
LUMINOSITY PULSES
RELA
TIVE
UNI
TS
LD
IT HF
IN HF
E L4
3
21
TIME (ms)Figure 9 – Initial lightning strike signal on the F106B - Fast field mill measurement - from figure 7 of [40]

Issue 5 - December 2012 - Experimental Studies of Lightning Strikes to Aircraft AL05-06 8
E0
E0
104 - 105 m/s
104 - 105 m/s
3.105 m/sE0
Figure 10 – Lightning triggering scenario. E0 is the ambient atmospheric electric field. A positive leader merges from the front part of the aircraft and propagates in the direction of the atmospheric field. It induces a negative charge on the aircraft, increasing the local field on the rear part of the aircraft, from which a negative leader starts its propagation. The total charge of the positive leader, the negative leader and the aircraft is neutral.
This scenario, assuming an early emission of a positive leader from the aircraft, had been successfully confirmed by a numerical simulation applied to the data of an actual lightning strike to the Transall aircraft [41]. Computation performed on a 3D mesh of the aircraft and of the lightning channel showed a good correspondence between the E field measurement at 8 locations on the aircraft and the simulation results (figure 11).
E1 field (left nose) E3 field (on top fuselage)800.0 800.0
400.0 400.0
0.0 0.0
0.0 0.05.0 5.010.0 10.015.0 15.0
-400.0 -400.0
-800.0 -800.0
Time (ms) Time (ms)
(kV/
m)
(kV/
m)
E4 field (left wing) E5 field (right wing)
E7 field (rear left fuselage) E6 field (rear right fuselage)
800.0 800.0
800.0 800.0
400.0 400.0
400.0 400.0
0.0 0.0
0.0 0.0
0.0 0.0
0.0 0.0
5.0 5.0
5.0 5.0
10.0 10.0
10.0 10.0
15.0 15.0
15.0 15.0
-400.0 -400.0
-400.0 -400.0
-800.0 -800.0
-800.0 -800.0
Time (ms) Time (ms)
Time (ms) Time (ms)
(kV/
m)
(kV/
m)
(kV/
m)
(kV/
m)
MeasurementComputation
Figure 11 – Lightning initiation on the Transall aircraft: comparison between computation and measurement for the electric field variation at each measuring site on the C160 aircraft. The measurement is shown in black and the computation is in red. E1 to E6 refer to the measuring sites (see figure 5) - from [41]
The lightning channel connection process
The second type of waveform signature of the first large field variation on an aircraft struck by lightning observed on the C160 and CV580 was reported in [24] and [39]. These waveforms are commonly referred to as the “lightning interception” signature. In figure 12 from [24], an example is given of four categories of this type of waveform observed on the forward part of the CV580 fuselage. Differences with the first type of waveform discussed in the preceding chapter are evidenced in the very first part of the four signals, by the continuous increase of the field on the aircraft, which may be attributed to the approach of a negatively charged channel. The continuous evolutions are interrupted by a sharp field variation, which may be produced by a connecting breakdown discharge. The magnitude of the three signals is similar. By a detailed analysis of the available signal, the authors of Article [24] were able to convincingly describe the phenomenology as corresponding with the interception of an approaching negative leader. Similar waveforms were observed on the C160 aircraft. In figure 13 from [39], which shows two fast electric field variations measured on the forward and rear part of the Transall fuselage, it appears even more clearly that the field variation on the aircraft corresponds to an electrical polarization produced by an approaching lightning channel. The scenario is illustrated in figure 14; it involves a bileader propagation from the aircraft, triggered by an approaching lightning channel that becomes connected to the aircraft at the end of this initial process.
0.9 10-6 C/m²
25 ms
A15,000 ft
B
0.9 10-6 C/m²
25 ms
14,400 ft
A
B
0.9 10-6 C/m²
25 ms
4,000 ft
A
B
1.5 10-6 C/m²
25 ms
1,500 ft
A
B
Figure 12 – Electric induction signal (proportional to the electric field) measured on the front part of the CV580 fuselage for the 4 observed categories of lightning interception by aircraft (from figure 13 of [24])

Issue 5 - December 2012 - Experimental Studies of Lightning Strikes to Aircraft AL05-06 9
800
400
0
A
B
C
E-FI
ELD
(kV
m-1)
Aircraft electrical polarization signature
TIME (ms)3.5 7.0 10.5 14
−
800
400
03.5 7 10.5 14
TIME (ms)
A
B
C
E-FI
ELD
(kV
m-1)
Aircraft electrical polarization signature
+
Figure 13 – Interception of a lightning flash channel by the C160 aircraft (from figure 13 of [39])
E0(t)
E0(t)
E0(t)
E0(t)
Figure 14 – Scenario of the “interception” of a lightning positive leader by the aircraft
Development of the lightning flash
After the initiation phase, the development of the entire lightning flash continues. The aircraft is connected to a kilometer long lightning channel, as illustrated in the actual airliner lightning strike of figure 1. It is highly probable that the behavior of the lightning flash is no longer influenced by the aircraft itself, but is rather determined by the storm cloud characteristics. Either “triggered” or “intercepted”, the flash behaves as a natural flash. Two main phases can be observed on the aircraft.
The sweeping process consists in the displacement of the root of a lightning channel over the aircraft surface, produced by a combined effect of the aerodynamic forces due to the aircraft displacement and the electrodynamic behavior of the lightning channel. Figure 15 shows the sweeping of the lightning channel from the nose boom to the rear boom of the Transall aircraft. It has been observed that the mean speed of the sweeping process is close to the aircraft airspeed but the sweeping process is not always continuous; depending on the nature of the material and the state of the surface, the arc channel stays attached and propagates by step as a result of the combined effect of the aerodynamics and of the occurrence of the electrical breakdown between the arc and the aircraft surfaces. This dwelling effect is indicated by the traces left on the aircraft surface, the spatial period of the stepping on the aircraft being of a few tens of centimeters. The sweeping process occurs during the continuous current process of the lightning flash; it consists in the flow of a continuous current of few hundred amps in the lightning channel connected to the aircraft. An analysis of the C160 and CV 580 direct lightning strike data give a mean continuous current of 330A (σ 285 A, min 100 A, max 1.2 kA) for a mean duration of 188ms (σ 156 ms, min 34 ms, max 510 ms) [32]. The magnitude and duration of this continuous current phase is similar to that observed for natural lightning.T = 30 ms T = 50 ms
T = 130 ms
T = 160 msT = 300 ms
Figure 15 – Lightning channel sweeping from nose to tail on the C160 aircraft. Relative light intensity is color coded
Recoil processes occur during the continuous current process and may continue after the continuous current cutoff. They consist of a fast recoil process (a few 107 m/s) propagating within the traces of the lightning flash leaders and connecting directly to the aircraft or, more commonly, connecting to the continuous current channel and propagating through

Issue 5 - December 2012 - Experimental Studies of Lightning Strikes to Aircraft AL05-06 10
this highly conductive arc channel toward the aircraft. Referred to the general phenomenology of a natural lightning flash, these recoil processes are subsequent or first return stroke propagating down to the ground, dart leader, recoil streamer or M change process (connection to an active lightning channel) [43]. When the connection is established, a large current pulse is injected into the aircraft. The place of the impact depends on the progression of the sweeping process. Consequently, direct measurement of this current pulse on the instrumented aircraft is often not possible because it occurs when the lightning arc has already swept away from the measuring boom. In any case, the evaluation of the magnitude of the pulse is possible through the magnetic field variation produced at the various measuring sites on the fuselage.
Several lightning strikes on the CV580 aircraft were produced by lightning flashes observed with a ground measuring network [24]. It was therefore possible to identify which flash component produced what current pulse on the aircraft. In figure 16 from [24] two current pulses produced by a first return stroke of a negative cloud-to-ground flash are shown. The rise time is few hundred ns and the wave shape and the decay time is typical of a 1st return stroke, but the magnitude measured at the tail boom was only 3 kA. In figure 17 from [24], current pulses attributed to the dart leader and subsequent return stroke during the same event are shown. The rise time of the subsequent stroke is of a few µs, much longer than the typical initial rise time for such an event. Apparently, the fastest current signal recorded on the aircraft may be produced by a local breakdown process and not by a propagating current wave. In [32], analyses of 43 events on the CV580 and C160 indicate that the mean number of high current pulses per event was 15 and the maximum directly measured current is 20 kA. The time interval between pulses ranges from 10 ms to 300 ms. These values are typical of the interstroke interval for natural lightning.
3.2
2.5
1.8
1.1
0.4
-0.30
1E 3 A CURRENT - LEFT WING
1E-6 S80 120 160 20040
3.0
2.3
1.6
1.0
0.2
-0.40
1E 3 A CURRENT - TAIL BOOM
1E-6 S40 80 120 160 200
Figure 16 – 1st return stroke connection on the CV580 from [24]. The current signal on the left wing sensor is saturated
CURRENT - LEFT WING
(B)
(A)
1E 3 A0
0
-0.5
-1.0
-1.5
-2.0
-2.50.2 0.4 0.6 0.8
1E-3 S
(A)CURRENT - LEFT WING
0.20
-0.15
-0.50
-0.85
-1.20
-1.550 8 16 24 32 40
1E 3 A
1E-6 S
(B)
CURRENT - LEFT WING0
-0.5
-1.0
-1.5
-2.0
-2.50 40 80 120 160 200
1E 3 A
1E-6 S
Figure 17 – Dart leader (A) and subsequent stroke (B) connection on the CV580 aircraft (from [24])
Typical profile of a lightning strike to aircraft
The data collected during the experiments conducted with the three instrumented aircraft make possible the definition of an “identikit picture” of the lightning threat to aircraft (figure 18 from [32]). The typical sequence is the following:
• a continuous current of about 1 A lasting a few ms, produced by a merging positive leader;

Issue 5 - December 2012 - Experimental Studies of Lightning Strikes to Aircraft AL05-06 11
• a train of 10 pulses lasting 3 ms at a repetition rate of 250 µs and with a peak amplitude of 850 A, produced by a merging negative stepped leader;
• a continuous current sequence lasting 200 ms and with 330 A magnitude;
• a train of 15 large current pulses occurring during or after the continuous current, with a repetition rate of a few tens of ms.
The greatest threat to aircraft comes from the continuous current sequence and from a large current pulse train. Because of the limited amount of data available, a statistically representative distribution of the magnitude of large current pulses cannot be derived from the in-flight direct lightning experiment.
Summary
Three major in-flight lightning strike experiments were conducted during the same period (1980-1986) in the USA and Europe with three different aircraft. These campaigns engaged important efforts in logistics and state of the art instrumentation. Significant ground measurements were gathered to support and document the data collected on board. The motivation for these experiments was similar. It was mainly with the concern of using new technologies, such as the extensive use of composite material on aircraft fuselage and wings and the setting up of “fly by wire” technologies. The justification of the high level of threat imposed by the Standard and Certification process was also a concern. A database of actual in-flight lightning strike parameters was also needed. In particular, the effort in the CV580 campaign was to obtain information on the interaction between the aircraft and the largest component of a Cloud-to-Ground Flash. However, despite many attempts to be struck at low level, at or below 4 000 ft AMSL, no direct interaction with a large Return Stroke process was obtained. The largest recorded current was 24 kA for a lightning event that occurred above 14 000 ft. The electromagnetic threat imposed by the lightning flash was in the limited frequency range of the lightning phenomena, from a
few kHz up to a few tens of MHz. No high level very high frequency threat was encountered during the in-flight experiment. The important outcome of these lightning flight experiments is a detailed and comprehensive demonstration of the process of initiation of a lightning flash on an aircraft. In a large majority of the events observed on the instrumented aircraft, the aircraft itself triggers the lightning flash when flying in a high atmospheric electrostatic field area (50 kV/m and above) by initiating the propagation of a bi-directional positive and negative discharge (about 90 % of the cases).
Current
Time
?
850 A330 A
1 A
250 µs200 ms
20 ms
3 ms10 pulses
15 pulses
Figure 18 – Typical average current waveform deduced from the in-flight experiments conducted on the CV580 and C160 aircraft - from figure 1 of [32]
Large current threats were not observed in flight. In any case, real life experiences have shown that aircraft can be struck by large first return stroke current pulses when taxiing, or during takeoff and landing [42].
In-flight lightning experiments were performed close to 30 years ago, on vintage turboprop aircraft. Modern jet airliners are extensively made of Carbon Fiber Composite material and their electrical design is totally different. Certification rules again lightning threats are basically identical to those applied in the 1980s. Experiments on modern jet airliners would certainly contribute new information on the effect of high current return stroke and recoil leader processes on composite aircraft n

Issue 5 - December 2012 - Experimental Studies of Lightning Strikes to Aircraft AL05-06 12
References
[1] Wing Failure of Boeing 747-131 Near Madrid Spain May 9, 1976. Report n° NTSB-AAR-78-12.[2] Aircraft Accident Report, Boeing 707-12, N709PA Pan American World Airways, Inc, Near Elkton, Maryland, Dec. 8, 1963. Civil Aeronautic Board File n° 1-0015, http://en.wikipedia.org/wiki/Pan_Am_Flight_214, 1965.[3] D. R. FITZGERALD – Probable Aircraft “Triggering” of Lightning in Certain Thunderstorms. Monthly Weather Review, vol. 95, n° 12, pp. 935-842, 1967.[4] D.W. CLIFFORD – Aircraft Mishap Experience from Atmospheric Electricity Hazards. In NATO AGARD Lecture Series, n°110, paper n°2, 1980.[5] F. A. FISHER, A. PLUMER and R. PERALA – Lightning Protection of Aircraft. Lightning Technologies Inc. Second Printing, 1999.[6] Y. MUROOKA – A Survey of Lighting Interaction with Aircraft in Japan. Res Lett Atmos Electricity, 1992.[7] K. MICHIMOTO – Statistics of Lightning Strikes to Aircraft in Winter around Komatsu Airbase, Japan. Journal of Atmospheric Electricity, vol. 13, pp.47-58, 1993.[8] T. SUZUKI, Y. MATSUDO, T. ASANO, M. HAYAKAWA and K. MICHIMOTO – Meteorological and Electrical Aspects of Several Winter Thunderstorms with Sprites in the Hokuriku Area of Japan. JGR, vol. 116, 2011.[9] R. ANDERSON and H. KRONINGER – Lightning Phenomena in the Aerospace Environment .Part II: Lightning Strikes to Aircraft. Transaction of South Africa Institute of Electrical Engineering, n° 66, pp. 166-175, 1975.[10] M. R. VILE and C. C. R. JONES – Fulmen Analysis of Experimental Data and Models for Upgraded Lightning Protection Requirements: Lightning Ground Strikes, in-Service Strikes to Aircraft and Induced Pulse Threats Databases. Report AI-95-SC.204/RE-101-BAe European Transport R&T DGVII, 1997.[11] K. FUMIAKI, S. TAKATSUGU and M. KAZUTOSHI – Aircraft Triggered Lightning Caused by Winter Thunderclouds in the Hokuriku Coast, Japan – A case Study of a Lightning Strike to Aircraft below the Cloud Base. SOLA, vol. 3, pp. 109-112, 2007.[12] P. LAROCHE – Airborne Measurements of Electrical Atmospheric Field Produced by Convective Clouds. Revue de Physique Appliquée, n° 21, pp. 809-815, 1986.[13] D. M. MACH and W. J.K OSHAK – General Matrix Inversion Technique for the Calibration of Electric Field Sensor Arrays on Aircraft Platforms. J. of Atmospheric and Oceanic Technology, vol. 24, pp. 1576-1587, 2007.[14] W. J. KOSHAK – Retrieving Storm Electric Fields from Aircraft Field Mill Data. Part I:Theory. J. of Atmospheric and Oceanic Technology, vol. 23, pp. 1289-1302, 2006.[15] W. J. KOSHAK, D. M. MACH, H. J.CHRISTIAN, M. F. STEWART and M. G. BATEMAN – Retrieving Storm Electric Fields from Aircraft Field Mill Data. Part II: Applications. J. of Atmospheric and Oceanic Technology, vol. 23, pp. 1303-1322, 2006.[16] J. E. NANEVICZ, R. C. ADAMO and R. T. BLY Jr. – Airborne Measurement of Electromagnetic Environment near Thunderstorm Cells (TRIP 76). SRI Report, 1977.[17] R. V. ANDERSON and J. C.BAILEY – Vector Electric Fields Measured in a Lightning Environment. NRL Memorandum Report 5899, 1987.[18] J. E. DYE, M. G. BATEMAN, H. J. CHRISTIAN, E. DEFER, C. A. GRAINGER, W. D. HALL, E. P. KRIDER, S. A. LEWIS, D. M. MACH, F. J. MERCERET, J. C. WILLETT and P. T. WILLIS – Electric Fields, Cloud Microphysics, and Reflectivity in Anvils of Florida Thunderstorms. JGR, vol. 112, D11215, 2007.[19] K. L.GIORI and J. E. NANEVICZ – Airborne Observations of Electric Fields Around Growing and Decaying Cumulus Clouds. ICOLSE NASA Conf Pub 3106, vol. 1, pp. 19-1,19-10, 1991.[20] P. LAROCHE, A. DELANNOY and H. LE COURT DE BERU – Electrostatic Field Conditions on an Aircraft Striken by Lightning. Int Conf On Lightning and Static electricity, Onera TP n° 1989-148, 1989.[21] F. L. PITTS, G. B. FINELLI, R. A. PERALA and T. H.RUDOLPH – F-106 Data Summary and Model Results Relative to Threat Criteria and Protection Design Analysis, ICOLSE, pp. 5-1,5-20, 1986.[22] F. L. PITTS – Electromagnetic Measurement of Lightning Strikes to Aircraft. J. Aircraft, vol. 19, n° 3, 1981.[23] P. L. RUSTAN Jr. – The Lightning Threat to Aerospace Vehicles. J. Aircraft, vol. 23, n°1, pp. 62-67, 1986.[24] H. D. BURKET, L. C. WALKO, J. REAZER, A. SERRANO – In-Flight Lightning Characterization Program on a CV-580 Aircraft. AFWAL-TR-88-3024, 1988.[25] P. GONDOT, A. DELANNOY and P. BLANCHET – In-Flight Conductivity Measurements in Convective Clouds Onera. ICOLSE TP n° 1988-63, 1988.[26] P. GONDOT – Definition et exploitation de capteurs adaptés à la mesure de la conductivité électrique dans les nuages d’orage. Thesis Paris 6 University, 1985.[27] V. MAZUR, B. D. FISHER and J. C. GERLACH – Lightning Strikes to a NASA Airplane Penetrating Thunderstorms at Low Altitudes. J. Aircraft, vol. 23, n° 6 pp. 499-505, 1986.[28] P. L. RUSTAN, B. KUHLMAN, J. SHOVALTER and J. REAZER – Electromagnetic Measurements of Lightning Attachment to Aircraft. ICOLSE DOT/FAA/CT-83/25, pp. 45-1, 45-8, 1983.[29] J. S. REAZER, A. V. SERRANO, L. C. WALKO and H. D. BURKET – Analysis of Correlated Electromagnetic Fields and Current Pulses During Airborne Lightning Attachments. Electromagnetics, n° 7, pp. 209-539, 1987.[30] P. LAROCHE, M. DILL, J. F. GAYET and M. FRIEDLANDER – In Flight Thunderstorm Environmental Measurement during the LANDES 84 Campaign. 10th ICOLSE, pp 59-66, 1985.[31] J. P. MOREAU and J. C. ALLIOT – E and H Field Measurement on the Transall C160 Aircraft during Lightning Flashes. 10th ICOLSE, pp 281-287, 1985.[32] P. LALANDE, A. BONDIOU-CLERGERIE and P. LAROCHE – Analysis of Available In-Flight Measurements of Lightning Strikes To Aircraft. ICOLSE Toulouse, 1999.[33] P. LALANDE and V. MAZUR – A Physical Model of Branching in Upward Leader. Aerospace Lab Issue 5, December 2012.[34] P. LALANDE, A. BONDIOU-CLERGERIE, G. BACCHIEGA and I. GALLIMBERTI – Observations and Modelling of Lightning Leaders. CR Physique, vol. 3, n° 10, pp. 1375-1392, 2002.[35] W. P. WINN and C. B. MOORE – Electric Field Measurements in Thunderclouds Using Instrumented Rockets. JGR, vol. 76, n° D21, pp. 5003-5017, 1971.[36] M. STOLZENBURG and T. MARSHALL – Serial Soundings of Electric Field Through a Mesoscale Convective System. JGR, vol. 106, n° D12, pp. 12371-12380, 2001.[37] T. MARSHALL and M. STOLZENBURG – Voltages inside and just above Thunderstorms. JGR, vol. 106, n° D5, pp. 4757-4768, 2001.[38] R. GUNN – Electric Field Intensity Inside of Natural Clouds. Journal of Applied Physics, vol. 19, pp. 481-484, 1948.[39] J. P. MOREAU, J. C. ALLIOT and V. MAZUR – Aircraft Lightning Initiation and Interception from in situ Electric Measurements and Fast Video Observations. JGR, vol. 97, n° D14, pp. 15903-15912, 1992.[40] V. MAZUR – A physical Model of Lightning Initiation on Aircraft in thunderstorms. JGR, vol. 94, n° D3, pp. 3326-3340, 1989.[41] A. BONDIOU-CLERGERIE et P. LALANDE – Modélisation de l’initiation d’un éclair sur un avion en vol. SEE, 1997.[42] B. VONNEGUT – Effects of a Lightning Discharge on an Aeroplane. Weather Review, vol. 21, pp. 277-279, 1966.[43] V. A. RAKOV, R. THOTTAPPILLIL, M. A. UMAN and P. P. BARKER – Mechanism of the Lightning M Component. JGR, vol. 100, n° D12, pp. 25701-25710, 1995.

Issue 5 - December 2012 - Experimental Studies of Lightning Strikes to Aircraft AL05-06 13
Acronyms
Air Force (US Air Force, USA)AMSL (Above Mean Sea Level)DC (Direct Current)FAA (Federal Aviation Administration, USA)HF (High Frequency)NASA (National Aeronautics and Space Administration, USA)NOAA (National Oceanic and Atmospheric Administration, USA)NRL (Naval Research Laboratory)TRIP 76 (Thunderstorm Research International Program)UK (United Kingdom)
Pierre Laroche received his engineering degree from the Institut Polytechnique de Grenoble in 1971. He joined The French Aerospace Lab the same year and became involved in triggered lightning experiments in France and the United States of America. His background is in the physics of lightning and atmospheric electricity. He is the author or co-
author of more than 100 papers and one book, and has served as co-editor for 2 journals. He was the President of the International Commission on Atmospheric Electricity (IUGG/IAMAS) from 1999 to 2007.
Patrice Blanchet graduated in Physics instrumentation and sensing in 1984. He participates in experimental studies of lightning strike to aircraft, large field experiments with lightning mapper, radar… and experiments to measure the atmospheric electric field with an instrumented rocket. He is also involved in the development of electrostatic sensor for
rockets, development of lightning mapper of the electrical activity of the storms based on the detection and the location of the VHF-UHF emission radiated by flashes. Recently a large part of his activity has been the development of electric field sensors of field mill type to instrument an aircraft.
Alain Delannoy † (1951 - 2012) received a PhD in Atmospheric Physic from University PARIS 6 in 1979. He joined Onera in 1980 and was engaged in research on Atmospheric Electricity, Cloud microphysic and Physic of Lightning. His interest focused on in situ electrical measurements in cloud for what he setup specific
instrumentations. He was engaged in lightning strike experiment on aircraft. Alain Delannoy was author and co-author of numerous articles and reports on Atmospheric Electricity and Lightning.
François Issac obtained his Technical University Degree (DUT) in physics measurement in 1982, in Montpellier, France. He began working at Ecopol from 1983 to 1986 on lightning effects and he joined the Office National d’Etudes et de Recherches Aérospatiales (Onera) where he became involved in numerous large scale EMC experiments (in-flight
lightning tests on a Transall aircraft in 1987-1990; EMPTAC tests on EM Topology, 1993-1996; joint cooperation on mode stirred chambers with DERA, 1999-2000). Nowadays, his field of interest covers a large area, from low frequency to high frequency, mainly from an experimental point of view. He is co-author of numerous papers dealing with EM measurement validations carried out at Onera.
AUTHORS