experimental researches of a suspen-dome · pdf file16 experimental researches of a...
TRANSCRIPT

Advanced Steel Construction Vol. 11, No. 1, pp. 15-38 (2015) 15
EXPERIMENTAL RESEARCHES OF A SUSPEN-DOME STRUCTURE WITH ROLLING CABLE-STRUT JOINTS
Chen Zhihua1,2, Yan Renzhang2, Wang Xiaodun2, Liu Hongbo1,2* and Xiao Xiao2
1 State Key Laboratory of Hydraulic Engineering Simulation and Safety (Tianjin University), Tianjin 300072, China
2 School of Civil Engineering, Tianjin University, Tianjin 300072, China *(Corresponding author: E-mail: [email protected])
Received: 28 April 2013; Revised: 13 October 2013; Accepted: 23 January 2014
ABSTRACT: Rolling cable-strut joints are applied in the suspen-dome structure to diminish the friction loss in the process of tensioning the cable and to guarantee the global stability of the structure. A 1:10 scaled-down model of the suspen-dome structure, which is adopted in Chiping Stadium, was built. Firstly, the prestressing optimization mathematical model of the suspen-dome structure was derived based on the principle of optimization of the finite element analysis software ANSYS, and the prestressing optimal design value of the 7 circles of cables were calculated using ANSYS. Secondly, tension test was conducted on the scaled-down model. Cable force values of each circle during the tension process were tested using the new cable force measurement device invented by the research group, namely the cable force measurement device based on clip anchorage connection. Then, full-span loading test and half-span loading test were conducted respectively on the suspen-dome structure exerting prestressing, and the displacement of the key nodes during the loading process were monitored using the new intelligent laser tracker, the measurement accuracy of which is 0.01mm. At last, A comparative analysis of the static performance of the suspen-dome structure and the single-layer reticulated shell without the tensegrity system was described in the paper. The static performance of the suspen-dome structure with rolling cable-strut joints was studied systematically. Experimental results indicate that the pretension of the outer circle of cable has the greatest influence on the suspen-dome structure, and pretensions of lower circles of cables influence each other, which, however, differs in terms of the influence degree according to relative locations of cables; the stress distribution of members in the upper part of the suspen-dome structure is similar to that of the single-layer reticulated shell under full span loads, which mainly shows compression in diagonal bars and circumferential bars near the inner ring and tension in bars near the outer ring. However, the maximum compressive stress and the maximum tensile stress of circumferential bars and the maximum defection of the suspen-dome structure were reduced by 15.0%, 43.7% and 51.5% respectively when compared with those of the single-layer reticulated shell. Therefore, due to the introduction of the tensegrity system in the supen-dome structure, the static performance of the suspen-dome structure is superior to that of the single-layer reticulated shell obviously.
Keywords: Rolling cable-strut joint, Suspen-dome, Tension test, Static test, Single-layer reticulated shell, Performance comparison
1. INTRODUCTION The suspen-dome system is a new hybrid space structure, firstly proposed by Kawaguchi, et al. [1] of Hosei University in Japan in 1993, Kawaguchi. The suspen-dome structure is a self-balancing system that combines the single-layer reticulated shell and the tensegrity system together, thus solving problems of great horizontal thrust on supports and poor stability existing in the single-layer reticulated shell and difficulties in construction of the tensegrity system effectively. So far, experts and scholars have conducted a series of researches on several aspects of the suspen-dome system, including shape finding theory, optimization design, static and dynamic properties and construction control theory, Chen, et al. [2-3]. The advantage of the suspen-dome system is owing to the introduction of pretension in the lower part of the structure. Three methods are usually adopted in prestressing cables: stretching radial cables, jacking struts and stretching hoop cables. For the fact that there are much more radial cables and struts in the suspen-dome structure, more tensioning and jacking equipments would be needed when methods of stretching radial cables or jacking struts are adopted, and it is difficult to
16 Experimental Researches of a Suspen-Dome Structure with Rolling Cable-Strut Joints
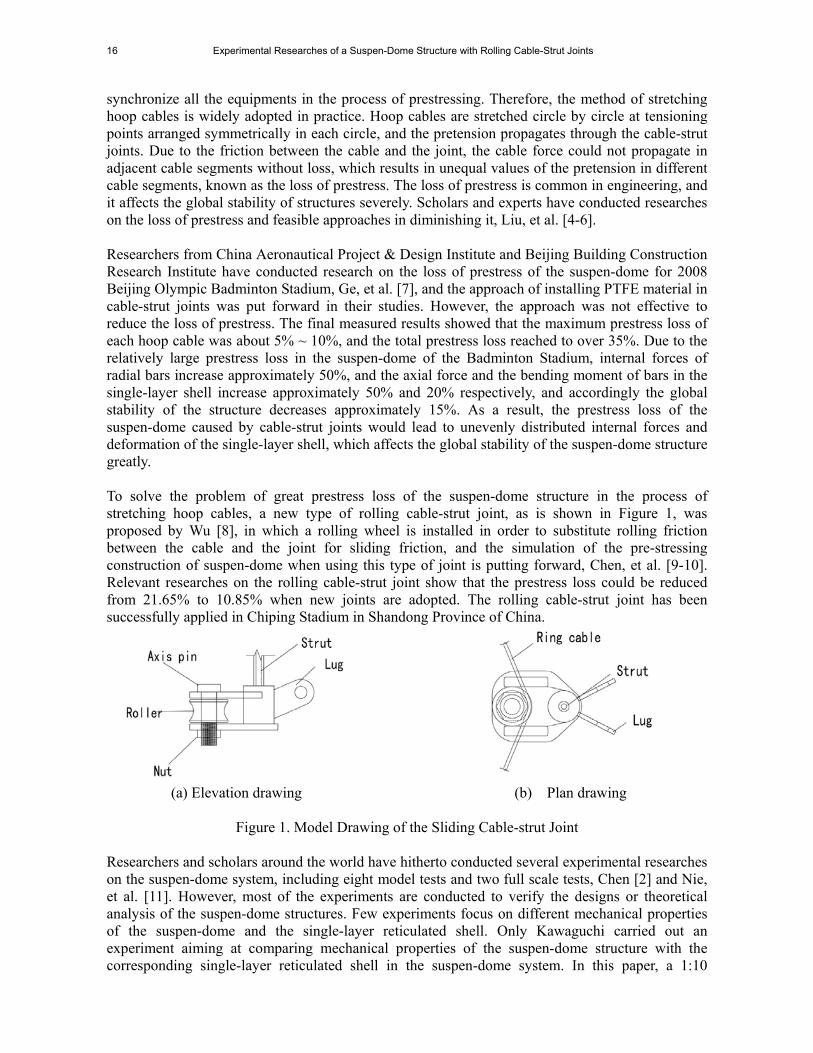
synchronize all the equipments in the process of prestressing. Therefore, the method of stretching hoop cables is widely adopted in practice. Hoop cables are stretched circle by circle at tensioning points arranged symmetrically in each circle, and the pretension propagates through the cable-strut joints. Due to the friction between the cable and the joint, the cable force could not propagate in adjacent cable segments without loss, which results in unequal values of the pretension in different cable segments, known as the loss of prestress. The loss of prestress is common in engineering, and it affects the global stability of structures severely. Scholars and experts have conducted researches on the loss of prestress and feasible approaches in diminishing it, Liu, et al. [4-6]. Researchers from China Aeronautical Project & Design Institute and Beijing Building Construction Research Institute have conducted research on the loss of prestress of the suspen-dome for 2008 Beijing Olympic Badminton Stadium, Ge, et al. [7], and the approach of installing PTFE material in cable-strut joints was put forward in their studies. However, the approach was not effective to reduce the loss of prestress. The final measured results showed that the maximum prestress loss of each hoop cable was about 5% ~ 10%, and the total prestress loss reached to over 35%. Due to the relatively large prestress loss in the suspen-dome of the Badminton Stadium, internal forces of radial bars increase approximately 50%, and the axial force and the bending moment of bars in the single-layer shell increase approximately 50% and 20% respectively, and accordingly the global stability of the structure decreases approximately 15%. As a result, the prestress loss of the suspen-dome caused by cable-strut joints would lead to unevenly distributed internal forces and deformation of the single-layer shell, which affects the global stability of the suspen-dome structure greatly. To solve the problem of great prestress loss of the suspen-dome structure in the process of stretching hoop cables, a new type of rolling cable-strut joint, as is shown in Figure 1, was proposed by Wu [8], in which a rolling wheel is installed in order to substitute rolling friction between the cable and the joint for sliding friction, and the simulation of the pre-stressing construction of suspen-dome when using this type of joint is putting forward, Chen, et al. [9-10]. Relevant researches on the rolling cable-strut joint show that the prestress loss could be reduced from 21.65% to 10.85% when new joints are adopted. The rolling cable-strut joint has been successfully applied in Chiping Stadium in Shandong Province of China.
(a) Elevation drawing
(b) Plan drawing
Figure 1. Model Drawing of the Sliding Cable-strut Joint
Researchers and scholars around the world have hitherto conducted several experimental researches on the suspen-dome system, including eight model tests and two full scale tests, Chen [2] and Nie, et al. [11]. However, most of the experiments are conducted to verify the designs or theoretical analysis of the suspen-dome structures. Few experiments focus on different mechanical properties of the suspen-dome and the single-layer reticulated shell. Only Kawaguchi carried out an experiment aiming at comparing mechanical properties of the suspen-dome structure with the corresponding single-layer reticulated shell in the suspen-dome system. In this paper, a 1:10

Chen Zhihua, Yan Renzhang, Wang Xiaodun, Liu Hongbo and Xiao Xiao 17
scaled-down model of the suspen-dome with rolling cable-strut joints applied in Chiping Stadium was used to study mechanical properties of the suspen-dome structure. A series of experiments, including the tension test, the full-span loading test and the half-span loading test, have conducted on the suspen-dome and the upper single-layer reticulated shell. 2. THE TEST MODEL The suspen-dome system with an arch structure is adopted in the roof of Chiping Stadium, of which the span is 108m and the rise is 25.5m, as shown in Figure 2. The lamella single-layer reticulated shell is adopted in the upper part of the suspen-dome, and beneath the shell is the tensegrity system with seven circles of cables. Due to the fact that members of the suspen-dome are subjected to axial forces mainly, the test model was designed according to the consistency principle of axial stress, and the selected member specifications are listed in Table 1. Geometrical, physical and process similarities were taken into account in the design of the model, Yao and Liu [12]. The suspen-dome model was supported on two circles of platforms both consisting of an H-section ring beam and 12 columns, as shown in Figure 3. Columns of the inner ring and the outer ring are 1.45m and 2.3m high respectively. The rolling cable-strut joint adopted in the suspen-dome is shown in Figure 4.
Figure 2. Photo of Chiping Stadium
(a) Photo of the test model
(b) 3D plot of the test model
Figure 3. Photo of the Experimental Model

18 Experimental Researches of a Suspen-Dome Structure with Rolling Cable-Strut Joints
Figure 4. Real Photo of the Sliding Cable-strut Joint
Table 1. Member Specifications of the 1:10 Scaled-down Model
Items section of
the prototype
section area
(cm2) section of the model
section area (actual size/theoretical size)
(cm2)
single-layer reticulated shell
P203×6 37.130 P12×2.5 0.746 / 0.7426 P219×7 46.620 P13×3 0.942 / 0.9324 P245×7 52.340 P16×2.5 1.06 / 1.0468 P273×8 66.600 P17×3 1.319 / 1.332 P299×8 73.140 P19×3 1.508 / 1.463
the 6th and 7th hoop cables
Φ7×73 28.090 steel wire rope (Φ12) 0.5688 / 0.5618
1st to 5th hoop cables Φ7×121 46.570 steel strand (1×7/Φ12.7)
0.987 / 0.9314
strut P219×7 46.620 P13×3 0.942 / 0.9324 radial cable Φ80 50.240 Φ11.5 1.039 / 1.0048
3. PRESTRESS OPTIMIZATION An inappropriate value of prestress would not play a role in reducing the displacement of the upper shell or the thrust on supports and even have an adverse impact on the whole structure. Therefore, the designer should ensure a lower value of the prestress which satisfies all the requirements of the structure, Wang [13] and Zhang, et al. [14]. In this paper, the prestress optimization of the seven hoop cables in the tensegrity system is conducted by applying the OPT module of Ansys, with the optimization objective of minimizing the largest stress of bars in the upper shell. Three optimization variables namely design variable, state variable and objective function are used in the optimization module to describe the optimization process in ANSYS. The optimization method in ANSYS are mainly the zero-order method and the first-order method. The zero-order method is also called the direct method, the essence of which is to use the least square method to calculate the function sheets that fits the solution space and then calculate the extreme value of the function sheets. The first-order method is to use the state variable and the first-order partial derivative of the objective function to turn constraint problems into unconstraint problems through adding penalty functions to the objective function, and then searches the design space using objective function and the derivative of the optimization variable penalty function. In the optimization process, the cable force of the 7 circles of cables [Fi](i=1,2,…,7) at lower part are set to be the design variables, and the maximum vertical displacement of the structure uz,max is set to be the state variable, and the maximum stress of the bar on upper latticed shell σmax is set to be the objective function. Since the objective function and state variable must be a function of the design variable, next, the Geometric

Chen Zhihua, Yan Renzhang, Wang Xiaodun, Liu Hongbo and Xiao Xiao 19
Nonlinear Theory of the suspen-dome structure will be introduced to derive the functional relations between the objective function and state variable or design variable. Due to the introduction of the cable, which is a flexible member, the suspen-dome structure will have nonlinear problems. Thus, the effect on internal force caused by structural deformation should be considered in the finite element analysis of the structure, and the balance equation of the structure is established on the basis of subsequent deformation. Suspen-dome structure consists of upper single-layer reticulated shell and lower cable supported system. In the finite element analysis, beam elements are used to imitate the bars on the upper single-layer reticulated shell and truss elements are used to imitate the bars on the lower cable supported system. The element stiffness matrix of beam elements and truss elements are different from the traditional element elastic stiffness matrix because of the considering of geometric nonlinear effects. The following part will introduce the stiffness matrix of beam element and truss element in detail, and derived the relationship between design variable and state variable or objective function during the optimization of the prestressing. 3.1 Element Stiffness Matrix Considering the Geometric Nonlinearity Define a local coordinate system, and the direction of its x axis is the same with the direction of the axis of the beam element. If a tiny displacement u(x), v(x), w(x) occurs on any point of the element, then the length of the micro ds is expressed as Eq. 1, and the axial strain εx of the point on neutral axis of the beam element is expressed as Eq. 2.
2 2 2 2 21 1( ) ( ) ( ) [1 ( ) ( ) ]
2 2
du dv dwds dx du dv dw dx
dx dx dx (1)
2 21 11 ( ) ( )
2 2x
ds dx ds du dv dw
dx dx dx dx dx
(2)
As Eq. 2 shows, the axial strain of the point on neutral axis consists of two parts, that is the strain
along the x axis caused by axial deformation expressed as 1x
du
dx and the additional strain on
the neutral axis caused by the deflection of the beam element expressed as 2 2 21 1( ) ( )
2 2x
dv dw
dx dx .
Additionally, bending strain will be caused on outer section of the neutral axis of the beam because of the lateral deflection of the beam along the y- direction and z-direction namely v(x) and w(x), and
it can be expressed as2 2
32 2x
d w d vz y
dx dx .Therefore, the strain of any point on the beam element
consists of three parts, that are axial strain, additional strain and bending strain, and is expressed as Eq. 3. Without considering the effects of the beam torsion, the displacement vector composed by the displacements of both ends of the beam element node i and j can be expressed as
, , , ,[ , , , , , , , , ]e Ti j i i y i i z j j y j j zu u v w v w . Assume the axial displacement, deflexion and rotation
are mutual independence at the same time, and then the shape function can be defined as Eq. 4
2 21 2 3 2 2
2 2
1 1( ) ( )
2 2x x x
du dv dw d w d vz y
dx dx dx dx dx
(3)
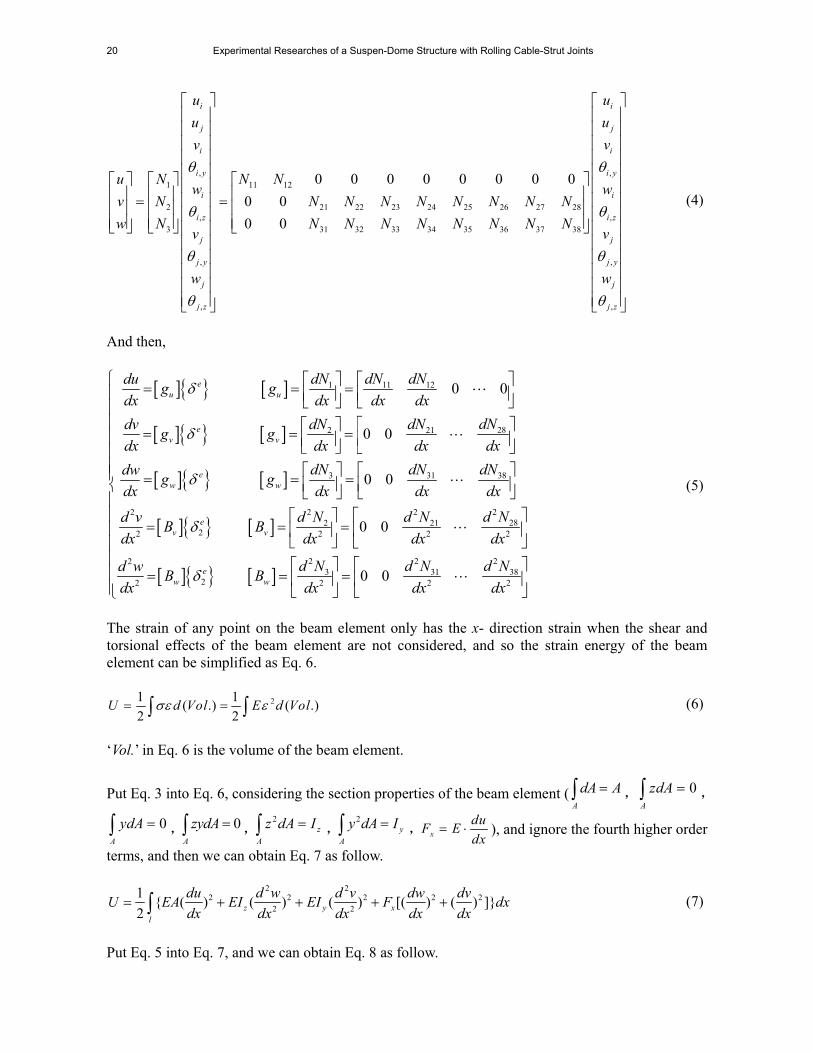
20 Experimental Researches of a Suspen-Dome Structure with Rolling Cable-Strut Joints
, ,
1 11 12
2 21 22 23 24 25 26 27 28, ,
3 31 32 33 34 35 36 37 38
, ,
, ,
0 0 0 0 0 0 0 0
0 0
0 0
i i
j j
i i
i y i y
i i
i z i z
j j
j y j y
j j
j z j z
u u
u u
v v
u N N Nw w
v N N N N N N N N N
w N N N N N N N N Nv v
w w
(4)
And then,
1 11 12
282 21
3 31 38
22 22282 21
22 2 2 2
2
0 0
0 0
0 0
0 0
eu u
ev v
ew w
ev v
dN dN dNdug g
dx dx dx dx
dNdN dNdvg g
dx dx dx dx
dN dN dNdwg g
dx dx dx dx
d Nd N d Nd vB B
dx dx dx dx
d w
dx
2 2 2
3 31 3822 2 2 2
0 0ew w
d N d N d NB B
dx dx dx
(5)
The strain of any point on the beam element only has the x- direction strain when the shear and torsional effects of the beam element are not considered, and so the strain energy of the beam element can be simplified as Eq. 6.
21 1( .) ( .)
2 2U d Vol E d Vol (6)
‘Vol.’ in Eq. 6 is the volume of the beam element.
Put Eq. 3 into Eq. 6, considering the section properties of the beam element (A
dA A , 0A
zdA ,
0A
ydA , 0A
zydA ,2
z
A
z dA I ,2
y
A
y dA I , x
duF E
dx ), and ignore the fourth higher order
terms, and then we can obtain Eq. 7 as follow.
2 22 2 2 2 2
2 2
1{ ( ) ( ) ( ) [( ) ( ) ]}
2 z y x
l
du d w d v dw dvU EA EI EI F dx
dx dx dx dx dx (7)
Put Eq. 5 into Eq. 7, and we can obtain Eq. 8 as follow.

Chen Zhihua, Yan Renzhang, Wang Xiaodun, Liu Hongbo and Xiao Xiao 21
1{ } ( [ ] [ ] [ ] [ ] [ ] [ ] [ ] [ ]) { }
2e T T T T T e
u u z w W y v v x v w v w
A
U EA g g EI B B EI B B F g g g g dx (8)
The principle of virtual displacements can be expressed as follow.
* *{( ) } { }e TU P (9) Where U* is the virtual strain energy. Put Eq. 8 into Eq. 9, and we can obtain Eq. 10 as follow.
*1{ } ( [ ] [ ] [ ] [ ] [ ] [ ] [ ] [ ]) { } {( ) } { }
2e T T T T T e e T
u u z w W y v v x v w v w
A
EA g g EI B B EI B B F g g g g dx P (10) So the force P can be expressed as
1( [ ] [ ] [ ] [ ] [ ] [ ] [ ] [ ]) { }
2T T T T e
u u z w W y v v v w x v w
A
P EA g g EI B B EI B B g g F g g dx (11)
Eq. 11 can be simplified as
( ) eL BP K K K (12)
Where KL, KB and Kσ are the axial stiffness, flexural stiffness and additional stress of the beam element, respectively, and they are defined as
1[ ] [ ]
2
1([ ] [ ] [ ] [ ])
2
1[ ] [ ]
2
TL u u
l
T TB w z w v y v
l
Tv w x v w
l
K g EA g dx
K B EI B B EI B dx
K g g F g g dx
(13)
It can be seen from Eq. 13 that Kσ and Fx are related, that is to say, Kσ is a function of Fx as follow.
( )xK f F (14)
Where Fx is the initial axial internal force. Then the element stiffness matrix of the beam element can be described as
( ) ( )eL B x B xK K K f F g F (15)
In a similar way, element stiffness of the spatial truss element considering geometric nonlinearity can be obtained when the bending stiffness of the beam element is ignored, and it can be described as

22 Experimental Researches of a Suspen-Dome Structure with Rolling Cable-Strut Joints
( ) ( )eL x L xK K f F g F (16)
3.2 Structural Assembly Analysis Suspen-dome structure is formed by a series of beam elements and truss elements. The global stiffness matrix of the structure is formed by element stiffness matrixs of each element. The spatial position of each elements and geometry and topology relations between them should be considered when assembling the global stiffness matrix. Deformation compatibility conditions and equilibrium conditions of the internal and external forces on the node should also be taken into consideration. It can be seen from Eq. 15 and Eq. 16 that an initial stress stiffness matrix Kσ that forming the element stiffness matrix is related to the initial internal force of the bars. So, the global stiffness matrix assembled by element stiffness matrixs is definitely the function of the internal force {Fx,i} of each bar. And that is to say, when any of the internal forces of the bars in the structure change, the global stiffness matrix of the structure will change. For the overall structure, {P} can be described as
,{ } [ ]{ } [ ({ })] { }L x iP K K K F (17)
Where [KL] and [Kσ] are elastic stiffness matrix of the structure and initial stress stiffness matrix (geometric stiffness matrix) of the structure, respectively, and Kσ({Fx,i}) indicate that the initial stress stiffness matrix changes along with the change of axial force of each bar in the structure. The overall displacement vector {δ} of each node in the structure can be derived based on Eq. 17, and it can be described as
1,{ } [ ({ })] { }L x iK K F P (18)
The stress vector of each bar can be derived based on the displacement vector of the structure, and it can be described as
{ } { }S (19) Where S is the stress stiffness matrix of the structure. Put Eq. 18 into Eq. 19, and we can obtain Eq. 20 as follow
1,{ } [ ({ })] { }L x iS K K F P (20)
3.3 Optimization Mathematical Model (1) Design variable In the process of tension test of the suspen-dome structure, prestressing was exerted by screwing the bolts at the tensioning device which can shorten the effective length of the cable. In the process of calculating by ANSYS, prestressing is exerted by imposing on the cables with initial strain. In order to ensure the cable not to be slack or destroyed in the tensioning process, the limit of the
cables’ internal forces are set for 7 circles of cables, that is , ,0 100c x iF kN (i=1,2,…,7).

Chen Zhihua, Yan Renzhang, Wang Xiaodun, Liu Hongbo and Xiao Xiao 23
(2) State variable According to the Tianjin technical specification for spatial grid structures, the maximum displacement of the single-layer latticed shell is span/400. Therefore, the maximum vertical nodal displacement of the upper shell is set as the state variable in this study. Pick up the vertical
displacement component { }zu of each node from the nodal displacement vector of the structural
computation. It can be seen that
, , , , , ,{ } { }Tx i x i y i y i z i z iu u u (21)
And
{ } [ ]{ }zu Z (22)
Where
0 0
0 0[ ]
0 0
z
zZ
z
(23)
Where [0, 0, 0, 0,1, 0]z
,max max{ }z zu u (24)
Put Eq. 18, Eq. 22 and Eq. 23 into Eq. 24, and then state variable can be expressed as Eq. 25.
1,max ,max([ ][ ({ })] { })z L x iu Z K K F P
(25)
(3) Objective function The minimum value of the maximum stress of the bars on upper shell is made as the objective function as follow
max max{ } (26)
Put Eq. 20 into Eq. 26, and we can obtain Eq. 27 as follow
1max ,max( [ ({ })] { })L x iS K K F P (27)
It can be seen from Eq. 25 and Eq. 27 that state variable and objective function are both the function of internal force vector of each bar in the structure. In the suspen-dome structure, internal forces of some members are changed when prestressing is exerted on the 7 circles of cables, that is to say, internal force vector of the 7 circles of cables is the sub-array of the internal force vector of the bars in the structure and it can be expressed as
, , . 1,2,...,7 ,{ } { }c x i i x iF F (28)
And the optimization mathematical model of the suspen-dome structure can be expressed as follow.

24 Experimental Researches of a Suspen-Dome Structure with Rolling Cable-Strut Joints
1, max ,
, , ,1 , ,2 , ,7
, ,
,max
min ( ) max( [ ({ })] { })
{ }
. .0 100 , 1,2, ,7
/ 400 27
c x L c x
c x c x c x c x
c x i
z
f F S K K F P
F F F F
s t F kN i
u span mm
(29)
3.4 Optimization Results of the Cable Forces The optimization methods in Ansys mainly include the zero-order method and the first-order method, which could be combined to obtain a reasonable solution for the prestress optimization, Huang [15] and Liu, et al [16]. In this paper, two groups of initial optimal prestress were obtained with the zero-method and the random search method respectively, and then the first-order method was applied further in estimating more optimal values of both the two groups of prestress. The final results turned out to be approximately the same, verifying the reliability of the optimal result. Detailed data obtained by the two methods is listed in Table 2.
Table 2. Optimal Results for the Test Model
method Zero-order
method Zero-order +
first-order Random method
Radom + first-order
Load case Gravity and Full-span loading (100kg/point) F7(N) 532.35 212.65 1397 300 F6(N) 1086.9 498.64 4129.3 1772.68 F5(N) 1059.0 958.85 6672.3 1603.8 F4(N) 2946.2 1723.2 7079.4 1998.2 F3(N) 10109 2396.0 12763 2472.7 F2(N) 5482.3 3434.9 10443 5041.4 F1(N) 19750 14230 8832.1 11511
Uz,max(mm) 3.8617 2.0223 3.321 1.5215 σmax(MPa) 80.795 43.630 93.482 44.778
The data in Table 2 shows that the result obtained by the zero-order method satisfies the requirements of the engineering well, which is not improved obviously by further optimization with the first-order method. In addition, there exists large difference between the result obtained by the random search method and the final optimal result, indicating that it is necessary to conduct a further optimization with the first-order method based on the result obtained by the random search method. The optimal prestress obtained by the random search method combined with the first-order method was adopted in the tests. 4. TEST MEASUREMENT 4.1 Stress Measurement In order to make a contrast of the static properties of the suspen-dome and the corresponding single-layer reticulated shell, both the full-span loading and the half-span loading tests of the upper single-layer reticulated shell had been carried out before the tension test and the static test of the suspen-dome. A total number of 80 measuring points were arranged in the shell, as shown in Figure 5.

Chen Zhihua, Yan Renzhang, Wang Xiaodun, Liu Hongbo and Xiao Xiao 25
Figure 5. Arrangement of Measuring points
on the upper shell
Figure 9. Arrangement of
Displacement Measuring Points 4.2 Cable Force Measurement Measuring points of the tensegrity system were arranged as is shown in Figure 6 and Figure 7, including 49 measuring points on radial tension bars, 22 on struts and 60 on hoop cables. The strain foils on radial tension bars and struts were arranged in the same way with those on the upper shell. Each radial bar or strut, where measuring points were arranged, had two strain foils which were arranged symmetrically along the axis of the member and connected to the strain gauge with the full-bridge method. Due to the fact that hoop cables were comprised of wire strands or wire ropes and hence strain foils could not attached on the surface of the cable directly, a new type of device connecting cables, firstly proposed by the author’s group, was adopted in the test to measure the cable force, Chen, et al. [17], as shown in Figure 8. When the cable was stretched, the cable would be anchored by the two clamps in the device. The cable force could be obtained by calculation with the strain values measured by the strain foils arranged on the two sides of the device.
Figure 6. Arrangement of Measuring Points
on the Radial Tension Bars
Figure 7. Arrangement of Measuring Points and
Tension Points on the Hoop Cables

26 Experimental Researches of a Suspen-Dome Structure with Rolling Cable-Strut Joints
Figure 8. Device for Measuring Cable Force
4.3 Displacement Measurement A total number of 15 displacement measuring points were arranged in the test, as shown in Figure 9. A laser tracker, comprised of a total station with a tracking detector, a computer and a target ball, was applied in tests to obtain the displacements of measuring points which were slight values. The laser beam emitted by the tracking detector together with the rotating mirror and the rotation axis formed the three axes in the spherical coordinate system. The displacements of measuring points at adjacent time point could be obtained by converting from space coordinates of each point measured by the laser tracker. The measurement precision of the laser tracker reaches to 0.01mm, satisfying the requirement of tests well. Figure 12 shows the scene of displacement measurement with the laser tracker.
Figure 10.
Tracking Detector
Figure 11. Target Ball
Figure 12. The Scene of Displacement Measurement with the Laser Tracker
5. TENSION TEST 5.1 Test Preparation Hoop cables were stretched from the outer ring to the inner ring in two steps. From the 1st circle to the 4th circle of the cable, four tensioning points were arranged respectively, and two tensioning points for the 5th circle and one for the 6th and the 7th circle of the cable respectively. The arrangement of tensioning points is shown in Figure 7, and the control values of each circle are listed in Table 3. Tensioning devices, comprised of a pair of channels and bolt bars shown in Figure 13, were installed at tensioning points considering that the maximum designed prestress in the model was only 11.1 kN. The hoop cable was fixed with anchors in the device, and the prestress was applied by tightening the bolts on the two sides of the device. The value of prestress was

Chen Zhihua, Yan Renzhang, Wang Xiaodun, Liu Hongbo and Xiao Xiao 27
controlled by internal forces in the adjacent cable segments on the two sides of the device. The prestress of each tensioning point was applied at the same time, and the speed of screwing the bolts of each tensioning device should be as identical as possible to ensure the synchronization of applying the prestress. The cable force at each tensioning point was read and recorded by computer every five threads screwed with an interval of 2 minutes. Figure 14 shows the scene of the tension test, and control values of prestress in each step are listed in Table 3.
Table 3. Prestressing Level of Hoop Cables level 1st circle 2nd circle 3rd circle 4th circle 5th circle 6th circle 7th circle
1st level (N) 4950 2220 1270 945 495 370 100 2nd level (N) 11500 5040 2470 2000 1600 1770 300
Figure 13. Tensioning Device
(a) Scene1 (b) Scene 2
Figure 14. The Scene of the Tension Test
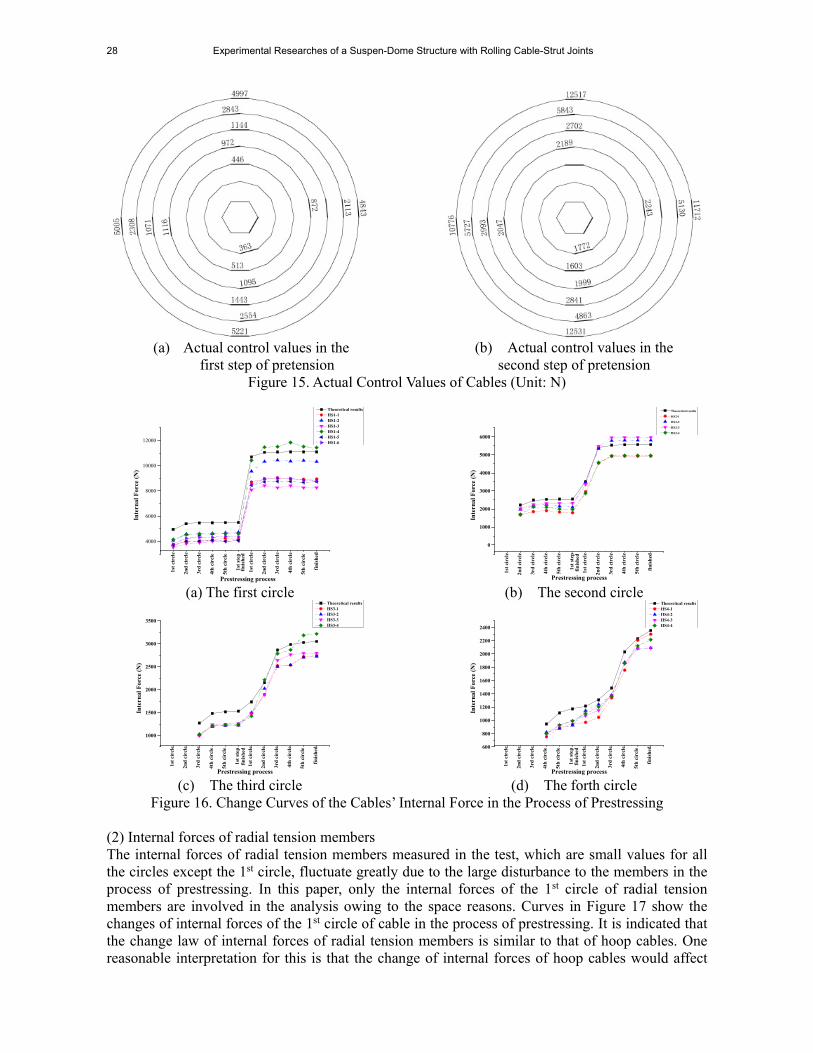
5.2 Results of the Tension Test (1) Internal forces of hoop cables The mean of internal forces of cable segments on the two sides of the tensioning point was taken as the value of pretension at the point, considering the difference between the measured cable force at the tensioning point and the designed control value due to inevitable disturbance to cables during tensioning process. The actual value of each point is shown in Figure 15. The pretension in a circle of cable would have a great influence on the internal force of the next circle of cable. The curves in Figure 16 show the changes of internal forces of the 1st, 2nd, 3rd and 4th circle of the cable in the process of prestressing respectively. Though the internal forces at different tensioning points in the cable differ due to the friction existing between the cable and joints, the change trends of internal forces are the same, that is, internal forces of the cable would increase due to the pretension of subsequent circles of cables, and the pretension of the adjacent circles of cables would have the greatest influence on each other. For example, the internal forces of the 1st circle of cable would increase more when stretching the 2nd circle of cable, while the pretension of the 3rd ~ 7th circles of cables would have a slight influence on the internal forces of the 1st circle of cable. In the first step of pretension, the increase of internal forces of the 1st circle of cable ranges from 7.2% to 12.16% with the largest increase appearing at the point HS1-6 in the process of stretching the 2nd circle of cable; internal forces of the 2nd circle of cable increase approximately 10% with the maximum increase of 11.75% in the process of stretching the 3rd circle of cable. In the second step of pretension, the pretension of the 1st circle of cable would have a significant influence on internal forces of subsequence circles of cables. When the pretension of the 1st circle of cable reaches to the designed value, internal forces of the 2nd , 3rd and 4th circles of cables increase 44.51%~65.32%, 14.46%~22.02% and 2.86%~10.97% respectively, and a significant increase of internal forces also occurs in other circles of cables. Hence, the outmost circle (i.e. the 1st circle) of hoop cable would have the most significant influence on mechanical properties of the suspen-dome.
28 Experimental Researches of a Suspen-Dome Structure with Rolling Cable-Strut Joints
(a) Actual control values in the
first step of pretension
(b) Actual control values in the
second step of pretension Figure 15. Actual Control Values of Cables (Unit: N)
1st
circ
le
2nd
cir
cle
3rd
cir
cle
4th
cir
cle
5th
cir
cle
1st
step
1st
circ
le
2nd
cir
cle
3rd
cir
cle
4th
cir
cle
5th
cir
cle
fin
ishe
d
4000
6000
8000
10000
12000
fin
ish
ed
Inte
rnal
For
ce (
N)
Prestressing process
Theoretical results HS1-1 HS1-2 HS1-3 HS1-4 HS1-5 HS1-6
(a) The first circle
1st
circ
le
2nd
circ
le
3rd
circ
le
4th
circ
le
5th
circ
le
1st
step
1st
circ
le
2nd
circ
le
3rd
circ
le
4th
circ
le
5th
circ
le
fini
shed
0
1000
2000
3000
4000
5000
6000
fin
ish
ed
Inte
rnal
For
ce (
N)
Prestressing process
Theoretical results
HS2-1
HS2-2
HS2-3
HS2-4
(b) The second circle
1st
circ
le
2nd
cir
cle
3rd
cir
cle
4th
cir
cle
5th
cir
cle
1st
step
1st
circ
le
2nd
cir
cle
3rd
cir
cle
4th
circ
le
5th
cir
cle
fini
shed
1000
1500
2000
2500
3000
3500
fin
ish
ed
Inte
rnal
For
ce (
N)
Prestressing process
Theoretical results HS3-1 HS3-2 HS3-3 HS3-4
(c) The third circle
1st
circ
le
2nd
cir
cle
3rd
cir
cle
4th
cir
cle
5th
cir
cle
1st
step
1st
circ
le
2nd
cir
cle
3rd
cir
cle
4th
circ
le
5th
cir
cle
fini
shed
600
800
1000
1200
1400
1600
1800
2000
2200
2400
fin
ish
ed
Inte
rnal
For
ce (
N)
Prestressing process
Theoretical results HS4-1 HS4-2 HS4-3 HS4-4
(d) The forth circle
Figure 16. Change Curves of the Cables’ Internal Force in the Process of Prestressing (2) Internal forces of radial tension members The internal forces of radial tension members measured in the test, which are small values for all the circles except the 1st circle, fluctuate greatly due to the large disturbance to the members in the process of prestressing. In this paper, only the internal forces of the 1st circle of radial tension members are involved in the analysis owing to the space reasons. Curves in Figure 17 show the changes of internal forces of the 1st circle of cable in the process of prestressing. It is indicated that the change law of internal forces of radial tension members is similar to that of hoop cables. One reasonable interpretation for this is that the change of internal forces of hoop cables would affect

Chen Zhihua, Yan Renzhang, Wang Xiaodun, Liu Hongbo and Xiao Xiao 29
internal forces of radial members directly, because internal forces of radial tension members are generated due to the pretension in hoop cables. In addition, internal forces of radial tension members fluctuate in the process of prestressing due to the influence of pretension of subsequent circles of cables.
1st
circ
le
2nd
cir
cle
3rd
cir
cle
4th
circ
le
5th
circ
le
1st
step
1st
circ
le
2nd
cir
cle
3rd
cir
cle
4th
cir
cle
5th
circ
le
fin
ish
ed
200
400
600
800
1000
1200
1400
1600
fin
ish
ed
Inte
rnal
For
ce (
N)
Prestressing process
XS1-4 XS1-5 XS1--6 XS1-7 XS1-8 XS1-9 XS1-13 XS1-14 XS1-15
Figure 17. Change Curves of Internal Forces of Radial Tension Bars in the Process of Prestressing
(3) Stresses of bars in the upper shell Axial stresses of bars in the upper shell are small in the process of prestressing, most of which are less than 10 MPa. Curves in Figure 18 show the changes of axial stresses of circumferential members HB1-1 and HB1-7 in the tensioning process. It is indicated in Figure 18 that the pretension of the 1st circle of hoop cable affects internal forces of bars in the upper shell significantly, while the pretension of the 2nd circle of cable results in a slight increase of internal forces of bars in the shell above the 1st circle of hoop cable and the influence of pretension of other circles of cables could be neglected. In addition, internal forces of the bar HB1-1 and HB1-7 in the suspen-dome were compressive with the pretension of the 1st circle of hoop cable, which, however, turns out to be tensile in the corresponding single-layer reticulated shell when hoop cables were removed in the structure. It indicates that the structural responses of the suspendome under the loads on the shell could be counterbalanced by the pretension in cables. (4) Mid-span vertical displacement Curves in Figure 19 show the changes of the vertical displacement of the mid-span of the upper shell and the largest displacement in the tensioning process. It is obvious from Figure 19 that the mid-span vertical displacement remains relatively small in the tensioning process due to the arching effect caused by the pretension of cables.
1st
circ
le
2nd
cir
cle
3rd
cir
cle
4th
circ
le
5th
circ
le
1st
step
1st
circ
le
2nd
cir
cle
3rd
cir
cle
4th
cir
cle
5th
circ
le
fin
ish
ed-120
-100
-80
-60
-40
-20
0
fin
ish
ed
Axi
al s
tres
s (M
pa)
Prestressing process
HB1-1 HB1-7
befo
re t
ensi
on
1st,
2nd
cir
cle
3rd
circ
le
4th
circ
le
1st
step
2nd
step
-0.5
0.0
0.5
1.0
1.5
2.0
2.5
3.0
3.5
ten
sion
ed
ten
sion
ed
ten
sion
ed
fin
ish
ed
fin
ish
ed
Ver
tica
l dis
pla
cem
ent
(mm
)
Prestressing process
W0 (mid-span) WB
Figure 18. Change Curves of Stresses of Part of Members in the Tensioning Process
Figure 19. Change Curves of the Vertical Displacement in the Tensioning Process

30 Experimental Researches of a Suspen-Dome Structure with Rolling Cable-Strut Joints
6. STATIC LOADING TEST OF THE SUSPEN-DOME Both the full-span loading test and the half-span loading test were carried out to investigate the static performance of the suspen-dome, Guo, et al. [18]. In order to avoid the cable sliding after the tensioning process, Liu, et al. [19], a pair of U-Shaped locks shown in Figure 20 was installed on the two sides of the rolling cable-strut joint to tighten up the cable with the bottom plate of the joint. With the purpose of making a contrast with the results of the single-layer shell, the loading scheme of the test was the same with that of the single-layer shell, Yan, et al. [20]: 80 loading points were selected in the upper shell; the loading process was divided into five steps with 0.2kN per point in each step; the unloading process was divided into three steps with 0.4kN per point in step 1 and 2 and 0.2kN per point in step3. The arrangements of loading points in the full-span loading test and the half-span loading test are shown in Figure 21. A pre-loading test was conducted in three steps before the loading test. Figure 22 shows the scene of the loading test.
Figure 20. U-shaped Locks to avoid Cable Sliding through the Joint
(a) Loading points in the full-span loading test
(b) Loading Points in the Half-span Loading Test
Figure 21. Arrangement of Loading Points
Figure 22. The Scene of Loading

Chen Zhihua, Yan Renzhang, Wang Xiaodun, Liu Hongbo and Xiao Xiao 31
6.1 The Full-span Loading Test (1) Internal forces of hoop cables Curves in Figure 23 show the changes of internal forces of hoop cables in the prestressing process. It is indicated in Figure 23 that internal forces of hoop cables increase linearly with the increase of loads; the internal force of the 1st circle of cable, which is 10023 N when the prestressing process is completed, increases 5103 N with an approximately increase of 50.9%; the internal force of the 5th circle of cable, which is 1591 N when the prestressing process is completed, decreases 784.5 N with an reduction of 49.3%; the changes of internal forces of the 2nd ~ 4th circles of cables are small. A reasonable interpretation for this result is that the force distribution ratio in hoop cables in outer rings would be greater due to the possible slackness of cables in inner rings caused by the deformation of the suspen-dome under the loading. (2) Internal forces of radial tension bars Internal forces of radial tension bars, which are generated directly due to the pretension of hoop cables, would be affected by the changes of internal forces of hoop cables. The change law of internal forces of radial members is the same with that of hoop cables. Internal forces of the outmost circle (i.e. the 1st circle) of radial members change largely, while the amplitude of variation of internal forces of those close to the inner ring decreases gradually. Curves in Figure 24 show the changes of internal forces of some typical radial tension bars. It is indicated from Figure 24 that the internal force of the 1st circle of radial tension bars, which is 1027 N when the prestressing process is completed, increases 865.3 N with an increase of 84%; while the internal force of radial tension bars close to the inner ring, which is 114 N when the prestressing process is completed, decreases 103.4 N. The relationship of internal forces of radial tension bars and the applied loads is linear, similar to that of hoop cables. Internal forces of the tensegrity system close to the outer ring increase significantly, while internal forces of the system close to the inner ring turn out to be a reduction and even slackness of cables.
1st level 2nd level 3rd level 4th level 5th level-1000
0
1000
2000
3000
4000
5000
Inte
rnal
for
ce v
aria
tion
s (N
)
Loading process
HS1-1 HS2-2 HS3-4 HS4-1 HS5-2
1st level 2nd level 3rd level 4th level 5th level-200
0
200
400
600
800
1000
Inte
rnal
for
ce v
aria
tion
s (N
)
Loading process
XS1-3 XS1-6 XS2-3 XS3-8 XS4-6 XS5-4
Figure 23. Change Curves of the Hoop Cables’ Internal Force Variations in the Process of
Loading
Figure 24. Change Curves of the Radial Bars’ Internal Force Variations in the Process of
Loading (3) Stresses of bars in the upper shell Diagonal bars in the upper shell are mainly subjected to compression under the full-span loading. The largest stress of diagonal bars occurs at XB14-1 near the mid-span, reaching to -61 MPa; relative large stresses of diagonal bars also occur in the 3rd ~ 5th and the 10th circle. For the reason that bars of the upper shell are in tension basically in the prestressing process, the actual stress values of diagonal bars in the upper shell would be less than the values obtained in the loading test. Change curves of stresses of diagonal bars are shown in Figure 25 (a) ~ (b), and the stress distribution of diagonal bars in the fifth step loading is shown in Figure 26.

32 Experimental Researches of a Suspen-Dome Structure with Rolling Cable-Strut Joints
Under the full-span loading, circumferential bars close to the inner ring are mainly subjected to compression, while those near the outer ring are mainly in tension. The stress distribution of circumferential bars is shown in Figure 27. It is indicated in Figure 27 that the tensile stresses of circumferential bars near the supports are relatively high, with the maximum stress of 40.3 MPa in the bar HB1-5; while circumferential bars near the 12th circle of cable are subjected to relatively high compression, with the maximum compressive stress of -38.4 MPa. Change curves of stresses of some circumferential bars in the loading process are shown in Figure 25 (e) ~ (f). Though the change trend of stresses obtained in the test is similar to that obtained by FEM analysis, experimental values are greater than theoretical values. The main reason for this is that sectional areas of rusted bars are decreased due to the fact that the model was placed in outdoors and no corrosion protection was adopted previous. In addition, inevitable installation errors would result in greater experimental results.
1st level 2nd level 3rd level 4th level 5th level 1st level 2nd level 3rd level-35
-30
-25
-20
-15
-10
-5
0
(loading) (loading) (loading) (loading)(unloading)(unloading)(unloading)(loading)
Str
ess
vari
atio
n (
MP
a)
Loading process
XB3-1(experimental results)
XB3-1(theoretical results)
(a) diagonal bar XB3-1
1st level 2nd level 3rd level 4th level 5th level 1st level 2nd level 3rd level-60
-50
-40
-30
-20
-10
0
10
Str
ess
vari
atio
n (
MP
a)Loading process
XB5-1(experimental results)
XB5-1(theoretical)
(loading) (loading) (loading) (loading)(unloading)(unloading)(unloading)(loading)
(b) diagonal bar XB5-1
1st level 2nd level 3rd level 4th level 5th level 1st level 2nd level 3rd level-50
-40
-30
-20
-10
0
Str
ess
vari
atio
n (
MP
a)
Loading process
XB10-1(experimental results) XB10-1(theoretical results)
(loading) (loading) (loading) (loading)(unloading)(unloading)(unloading)(loading)
(c) diagonal bar XB10-1
1st level 2nd level 3rd level 4th level 5th level 1st level 2nd level 3rd level-70
-60
-50
-40
-30
-20
-10
0
Str
ess
vari
atio
n (
MP
a)
Loading process
XB14-1(experimental results) XB14-1(theoretical results)
(loading) (loading) (loading) (loading)(unloading)(unloading)(unloading)(loading)
(d) diagonal bar XB14-1
1st level 2nd level 3rd level 4th level 5th level 1st level 2nd level 3rd level
0
10
20
30
40
Str
ess
vari
atio
n (
MP
a)
Loading process
HB1-5(experimental results) HB1-5(theoretical results)
(loading) (loading) (loading) (loading)(unloading)(unloading)(unloading)(loading)
(e) circumferential bar HB1-5
1st level 2nd level 3rd level 4th level 5th level 1st level 2nd level 3rd level
-40
-35
-30
-25
-20
-15
-10
-5
0
Str
ess
vari
atio
n (
MP
a)
Loading process
HB12-2(experimental results) HB12-2(theoretical results)
(loading) (loading) (loading) (loading)(unloading)(unloading)(unloading)(loading)
(f) circumferential bar HB12-2
Figure 25. Change Curves of Stresses of Some Typical Bars of the Upper Shell
in the Prestressing Process

Chen Zhihua, Yan Renzhang, Wang Xiaodun, Liu Hongbo and Xiao Xiao 33
XB
1-1
XB
1-4
XB
1-5
XB
2-1
XB
3-1
XB
3-2
XB
5-1
XB
5-2
XB
6-1
XB
7-1
XB
7-2
XB
8-1
XB
8-2
XB
10-1
XB
10-2
XB
12-1
XB
13-1
XB
14-1
XB
16-1
XN
16-1
XN
13-2
XN
13-1
XN
11-1
XN
10-1
XN
8-2
XN
8-1
XN
7-2
XN
2-1
XN
1-1-70
-60
-50
-40
-30
-20
-10
0
10
Str
ess
vari
atio
n (
MP
a)
Bar number
experimental results theoretical results
North area South area
HB
1-1
HB
1-3
HB
1-5
HB
1-7
HB
1-8
HB
2-1
HB
2-2
HB
4-1
HB
4-2
HB
6-1
HB
6-2
HB
7-1
HB
8-1
HB
8-2
HB
12-1
HB
12-2
HB
13-1
HB
14-1
HB
16-1
HN
16-1
HN
14-1
HN
11-1
HN
8-1
HN
5-1
HN
4-1
HN
3-1
HN
1-2
HN
1-1
-60
-40
-20
0
20
40
60
Str
ess
vari
atio
n (
MP
a)
Bar number
experimental results theoretical results
South areaNorth area
Figure 26. Stress Distribution of Diagonal Bars Figure 27. Stress Distribution of Circumferential Bars
(4) Vertical displacement of joints The vertical deformation of the suspen-dome under the full-span loading is less than 2mm, with the maximum deflection at the point WN2 near the mid-span. Figure 28(a) shows the changes of vertical displacement of WN2 in the prestressing process. Vertical displacements of the point W0 at the mid-span and some other typical points are shown in Figure 28. Figure 29 shows the vertical displacement distribution of the upper shell in the fifth step of the loading. It can be seen in Figure 28 that the change trend obtained in the test is similar to that obtained by theoretical analysis. The displacement distribution of the suspen-dome in Figure 29 can be concluded that the vertical displacement near the mid-span is greater and the value decreases gradually outwards from the mid-span, which indicates the relatively large stiffness of the suspen-dome.
1st level 2nd level 3rd level 4th level 5th level 1st level 2nd level 3rd level-2.0
-1.8
-1.6
-1.4
-1.2
-1.0
-0.8
-0.6
-0.4
-0.2
0.0
0.2
0.4
Ver
tica
l dis
pla
cem
ent
(mm
)
Loading process
WN2(experimental results)
WN2(theoretical results)
(loading) (loading) (loading) (loading)(unloading)(unloading)(unloading)(loading)
(a) measuring point WN2
1st level 2nd level 3rd level 4th level 5th level 1st level 2nd level 3rd level-1.8
-1.6
-1.4
-1.2
-1.0
-0.8
-0.6
-0.4
-0.2
0.0
0.2
Ver
tica
l dis
pla
cem
ent
(mm
)
Loading process
WB1(experimental results)
WB1(theoretical results)
(loading) (loading) (loading) (loading)(unloading)(unloading)(unloading)(loading)
(b) measuring point WB1
1st level 2nd level 3rd level 4th level 5th level 1st level 2nd level 3rd level-1.8
-1.6
-1.4
-1.2
-1.0
-0.8
-0.6
-0.4
-0.2
0.0
0.2
Ver
tica
l dis
pla
cem
ent
(mm
)
Loading process
W0(experimental results)
W0(theoretical results)
(loading) (loading) (loading) (loading)(unloading)(unloading)(unloading)(loading)
(c) point W0 in the mid-span
Figure 28. Change Curves of Vertical Displacement of
Some Measuring Points in the Process of Loading

34 Experimental Researches of a Suspen-Dome Structure with Rolling Cable-Strut Joints
WB5 WB2 WB3 WB6 WB4 WB1 W0 WN2 WN3 WN4 WN1 WN5-2.0
-1.8
-1.6
-1.4
-1.2
-1.0
-0.8
-0.6
Ver
tica
l dis
pla
cem
ent
(mm
)
Measuring point
experimental results
theoretical results
Figure 29. Structure’s Deflection Distribution Map
6.2 The Half-span Loading Test In this paper, the mechanical properties of the suspen-dome under the half-span loading were investigated in the test. Figure 30 shows the stress distribution of bars of the upper shell after the fifth step of the half-span loading. The stresses of bars of the upper shell, which are not subjected to the loading directly, are slight and almost 0 in value, while those subjected to the loading directly are mainly in compression with the maximum compressive stress reaches to -37.9 MPa at XB14-1 near the mid-span. However, the actual axial stress of the bar XB14-1 is less than -37.9 MPa, due to the fact that the bar is in tension when the prestressing process is completed. In Figure 30 (b), the axial stresses of circumferential bars are tensile near the outer ring and compressive near the inner ring. The maximum tensile stress is 30.4 MPa at the bar HB1-8, and the maximum compressive stress reaches to -21.9 MPa at the bar HB12-2. For the bar HB1-7, of which the stress increases 21.4 MPa, the axial stress is -109.1 MPa when the prestressing process is completed, hence the actual axial stress of the bar in the test is -87.7 MPa, which is different from the stress in the single-layer shell without the tensegrity system. Under the half-span loading, the uneven stress distribution of the upper shell would result in the large difference of internal forces among cable segments of the same circle of cable in the tensegrity system. Experimental results and theoretical results of the 1st circle of the hoop cable are listed in Table 4. It is indicated that internal forces of the tensegrity system would be influenced significantly due to the uneven loading. Internal forces of hoop cables in the area where the loading is applied directly increase significantly, for example, the internal force of the cable HS1-1 increases 50.5% in the test when compared with the value of 8943 N after the prestressing process is completed. However, the increase of internal forces of those in the other area is slight, for example, the internal force of the cable HS1-5 increases only 1.2% when compared with the value of 8734 N after the prestressing process is completed. Hence, the stress distribution of cable segments in one circle of cable is related to the loading distribution. In addition, the stress distributions of hoop cables near the inner ring are similar to those in the full-span loading test, and the slackness of hoop cables near the inner ring may also occur due to negative increase of internal forces in those cables. The deformation of the whole structure is slight under the half-span loading, with the maximum vertical displacement reaching to 1.31mm at W0 of the mid-span. The vertical displacement of the suspen-dome under the half-span loading is shown in Figure 31. In Figure 31, the vertical displacements of the area where the loading is applied directly are greater obviously than those in the other area.

Chen Zhihua, Yan Renzhang, Wang Xiaodun, Liu Hongbo and Xiao Xiao 35
XB
1-1
XB
1-4
XB
1-5
XB
2-1
XB
3-1
XB
3-2
XB
5-1
XB
5-2
XB
6-1
XB
7-1
XB
7-2
XB
8-2
XB
10-1
XB
10-2
XB
12-1
XB
13-1
XB
14-1
XB
16-1
XN
16-1
XN
13-2
XN
13-1
XN
11-1
XN
10-1
XN
8-1
XN
7-2
XN
2-1
XN
1-1
-50
-40
-30
-20
-10
0
10
Str
ess
vari
atio
n (
MP
a)
Bar number
experimental results theoretical results
South areaNorth area
(a) Stress distribution of diagonal bars
HB
1-1
HB
1-3
HB
1-5
HB
1-7
HB
1-8
HB
2-1
HB
2-2
HB
4-1
HB
4-2
HB
6-1
HB
6-2
HB
7-1
HB
8-1
HB
8-2
HB
12-1
HB
12-2
HB
13-1
HB
14-1
HB
16-1
HN
16-1
HN
14-1
HN
11-1
HN
10-1
HN
8-1
HN
5-1
HN
4-1
HN
3-1
HN
1-2
HN
1-1-40
-30
-20
-10
0
10
20
30
Str
ess
vari
atio
n (
MP
a)
Bar number
experimental results
theoretical results
South areaNorth area
(b) Stress distribution of circumferential bars
Figure 30. Stress Distribution of Bars in the Upper Shell
WB5 WB2 WB3 WB6 WB4 WB1 W0 WN2 WN3 WN4 WN1 WN5-1.8
-1.6
-1.4
-1.2
-1.0
-0.8
-0.6
-0.4
-0.2
0.0
0.2
Ver
tica
l dis
pla
cem
ent
(mm
)
Measuring point
experimental results theoretical results
Figure 31. Vertical Displacement Distribution of the Suspen-dome
Table 4. Internal Forces of the 1st Circle of Hoop Cable in the Half-span Loading
7. COMPARISON OF STATIC PROPERTIES OF THE SUSPEN-DOME AND THE
SINGLE-LAYER RETICULATED SHELL The full-span loading test and the half-span loading test had been carried out on the upper single-layer reticulated shell without the tensegrity system below before the tests on the suspen-dome in order to study the static properties of the single-layer shell, and the corresponding test schemes are the same with those of the suspen-dome. The difference of static properties of the single-layer reticulated shell and the suspen-dome could be obtained by comparing experimental results of these two structures, owing to the fact that these two structures share the same single-layer shell structure. 1) Under the full-span loading, the stress distribution of diagonal bars of the single-layer shell is similar to that of the supen-dome and the bars of both structures are mainly subjected to compression, when initial stresses of bars in the suspen-dome caused by the pretension in the tensegrity system is not taken into account. In addition, the stress distribution of circumferential
Item HS1-1 HS1-2 HS1-3 HS1-4 HS1-5 HS1-6
Increment of internal forces
(N)
experimental results
4514 3923 3411 1867 108 2054
theoretical results
4931 3672 3265 2202 475 2242
relative error (%) -8.46 6.84 4.47 -15.21 -77.26 -8.39

36 Experimental Researches of a Suspen-Dome Structure with Rolling Cable-Strut Joints
bars of the single-layer shell is also similar to that of the suspen-dome, with bars close to the inner ring in compression and those close to the outer ring in tension. However, the stress values of circumferential bars of these two structures differ greatly. For the single-layer reticulated shell, the maximum compressive stress of circumferential bars of the inner ring is -45.2 MPa, and the maximum tensile stress of circumferential bars of the outer ring is 71.6 MPa; while the corresponding maximum compressive stress and maximum tensile stress of circumferential bars in the suspen-dome are -38.4 MPa and 40.3 MPa, which decrease 15% and 43.7% respectively when compared with the results of the single-layer reticulated shell. It is indicated that the stresses of bars in the upper shell decrease in the suspen-dome due to the pretension in the tensegrity system of the suspen-dome. 2) Under the half-span loading, the axial stress distribution of bars in the single-layer reticulated shell is similar to that in the suspen-dome, when initial stresses of bars in the suspen-dome caused by the pretension in the tensegrity system is not considered. For diagonal bars in the upper shell, though the maximum stress of bars in both structures occurs near the mid-span, the maximum stress value of the suspen-dome is less than -37.9 MPa, which decreases 52.9% when compared with the maximum value of -80.4 MPa in the single-layer shell. The stress distribution of circumferential bars shows that bars close to the outer ring mainly subjected to tension and the tensile stress decreases gradually outside in and finally turns into compression. However, circumferential bars close to the outer ring in the suspen-dome are actually subjected to compression due to the initial compressive stresses caused by the pretension of the tensegrity system in the suspen-dome. 3) The deformation of the two structures under the full-span loading is larger than that under the half-span loading. The maximum vertical displacement of the supen-dome is only 1.89 mm, which decreases 51.5% when compared with the maximum vertical displacement of the single-layer reticulated shell with a value of 3.90 mm. The struts in the suspen-dome are supported on hoop cables which could be regarded as supports with elastic stiffness in the normal direction of the prestress caused by the pretension in cables. Due to the fact that the upper shell is supported on the struts and circumferential supports, the deflection of the upper shell is counterbalanced by the arching effect caused by the struts. Therefore, the global deformation of the suspen-dome decreases when compared with that of the single-layer reticulated shell. The vertical loading applied on the single-layer reticulated shell is transferred into in-plane forces in the shell, Yin et al. [21], which propagate in diagonal bars towards circumferential supports and are finally divided into the radial and the circumferential components. However, the stress distribution of the upper shell is changed due to the application of the tensegrity system in the suspen-dome. The in-plane forces in the shell would propagate in both diagonal bars of the shell and struts of the tensegrity system, which could achieve the same result of reducing the span of the upper shell. Hence, the stresses of the upper shell of the suspen-dome are decreased significantly when compared with that of the single-layer reticulated shell. 8. CONCLUSION The rolling cable-strut joints are adopted in the suspen-dome of Chiping Stadium in Shandong Province to reduce the prestress loss in the prestressing process. A 1:10 scaled-down model of Chiping Stadium was used in the tension test and the loading tests to study the mechanical properties of the suspen-dome with rolling cable-strut joints installed. In addition, a comparative experiment on static properties of the suspen-dome and the single-layer reticulated shell is conducted for the first time in China, and some significant results are obtained in the paper. More detailed conclusions can be drawn in the following.

Chen Zhihua, Yan Renzhang, Wang Xiaodun, Liu Hongbo and Xiao Xiao 37
1) It is recommended to adopt the zero-order method combined with the first-order method in the prestress optimization design of the suspen-dome when the optimization objective is to minimize the largest stress of the upper shell. The prestress optimization result obtained with the first-order method only already satisfies the engineering in application well. 2) Test devices and surrounding environment should be taken into account in the design of the test model. For relatively large test models like the model used in paper, a laser tracker could be applied in the test when the deflection of the shell is difficult to measure with traditional measuring devices. 3) The pretension of the outmost circle (i.e. the 1st circle) of the hoop cable has the most significant influence on the suspen-dome. When the second step of stretching the 1st circle of the hoop cable is completed, internal forces of the 2nd, the 3rd and the 4th circles of hoop cables increase 44.51% ~ 65.32%, 14.46% ~ 22.02% and 2.86% ~ 10.97% respectively. In addition, internal forces of the hoop cables of which the prestressing process has already finished would increase due to the pretension of subsequent hoop cables, and the pretension of adjacent circles of cables would have the greatest influence on each other. 4) The trend of changes of internal forces of radial tension members is similar to that of hoop cables, due to the fact that internal forces of radial tension bars are generated due to the pretension of hoop cables. However, the stress distribution of radial tension bars is uneven due to the friction loss between hoop cables and joints 5) Stresses of bars in the upper shell are slight in the prestressing process. When compared with the structural response of the single-layer reticulated shell under the uniform loading, internal forces of some bars in the suspen-dome would be counterbalanced by the arching effect due to the pretension in the tensegrity system. The area over the 1st circle of hoop cables shows the most obvious arching effect. 6) The variation of structural responses of the suspen-dome under the full-span loading and the half-span loading obtained in tests is similar to that obtained by the FEM analysis. 7) Both the stresses of members and global deformation of the structure are slight under the full-span loading and the half-span loading, indicating that the strength and the stiffness of the suspen-dome are sufficient. 8) When compared with the single-layer reticulated shell, the stress distribution of the suspen-dome is optimized, and stresses of bars in the upper shell and the vertical displacement of the structure are decreased significantly under the loading, which verifies the advantages of the suspen-dome. ACKNOWLEDGMENTS The authors gratefully acknowledge the support of Independent Innovation Foundation of Tianjin University (Approval No.1304).The authors would also like to thank Shandong Zhongtong Steel Structure Engineering Co., Ltd and Tianjin Cable Space Structure Technology and Engineering Co., Ltd for providing the test model, thank Yu Jinghai who is of Tianjin University Research Institute of Architectural Design and Urban Planning for his constructive suggestions, thanks to the students in the steel research group of Tianjin University for their assistance with the laboratory work.

38 Experimental Researches of a Suspen-Dome Structure with Rolling Cable-Strut Joints
REFERENCES [1] Kawaguchi, M., Abe, M. and Tatemichi, I., “Design, Test and Realization of Suspen-dome
System”, Journal of IASS, 1999, Vol. 40, No. 131, pp. 179-192. [2] Chen, Z.H., “Research Progress and Engineering Practice on Suspen-dome Structure”,
Progress in Steel Building Structures, 2011, Vol. 13, No. 5, pp. 11-20. [3] Kang, W.J., Chen, Z.H., Lam, H.F., et al., “Analysis and Design of the General and
Outmost-ring Stiffened Suspen-domes Structures”, 2003, Engineering Structures, Vol. 25, No. 13, pp. 1685-1695.
[4] Liu, H.B., Chen, Z.H. and Zhou, T., “Prestress Loss Induced by Friction in Suspendome Construction”, Journal of Tianjin University, 2009, Vol. 42, No. 12, pp. 1055-1060.
[5] Liu, H.B., “Research on Prestress Loss Induced by Friction in Suspen-dome Structure”, Proceedings, the 8th National Symposium on Modern Structural Engineering, 2008.
[6] Wang, S., Zhang, G.J. and Ge, J.Q., “Influence of Prestress Loss on Structural Behavior of the Badminton Gymnasium for 2008 Olympic Games”, Journal of Building Structures, 2007, Vol. 28, No. 6, pp. 45-51.
[7] Ge, J.Q., Zhang, G.J. and Wang, S., “The Overall Stability Analysis of the Suspen-dome Structure System of the Badminton Gymnasium for 2008 Olympic Games”, Journal of Building Structures, 2007, Vol. 28, No. 6, pp. 22-30.
[8] Wu, Y.J., “Analysis of Sliding Cable Element and Node”, PhD Thesis, Tianjin University, Tianjin, China, 2010.
[9] Chen, Z.H., Wu, Y.J., Yin, Y. and Shan, C., “Formulation and Application of Multi-node Sliding Cable Element for the Analysis of Suspen-Dome Structures”, Finite Elements In Analysis and Design, 2010, Vol. 46, No. 9, pp. 743-750.
[10] Liu, H.B., Chen, Z.H. and Wang, X.D., “Simulation of Pre-stressing Construction of Suspen-dome Considering Sliding Friction Based Little Curvature Assumption”, Advanced Science Letters, 2011, Vol. 4, No. 8-10, pp. 2713-2718.
[11] Nie, G.B., Zhi, X.D. and Fan F., “Study of the Tension Formation and Static Test of a Suspendome for Dalian Gymnasium”, China Civil Engineering Journal, 2012, Vol. 45, No. 2, pp. 1-10.
[12] Yao, Z.G. and Liu, Z.H., Building Structure Experiments, Tongji University Press, Shanghai, China, 2004.
[13] Wang, X.M., Building Structure Experiments, Tsinghua University Press, Beijing, China, 1998.
[14] Zhang, M.S., Bao, H.Z. and Zhang, Z.H., “Optimal Prestress Design of Suspen-domes”, Spatial Structures, 2004, Vol. 10, No. 3, pp. 26-30.
[15] Huang, D.M., “Optimum Design and Experiment Study on the Construction Total Process of Suspendome”, PhD Thesis, Beijing University of Technology, Beijing, China, 2007.
[16] Chen, Z.H., Liu, H.B. and Zhou, T., “APDL Parametric Calculation and Analysis of Space Steel Structures”, China Water & Power Press, Beijing, China, 2009.
[17] Chen, Z.H., Yan R.Z., Liu H.B. and Bu Y.D., “Study of a Cable Force Determination Method in Prestressed Steel Structures”, International Journal of Space Structures, 2013, Vol. 28, No. 2, pp. 59-73.
[18] Guo, J.M., Dong, S.L. and Yuan, X.F., “Model Designing and Experimental Research of Suspen-dome Structure”, Engineering Mechanics, 2011, Vol. 28, No. 7, pp. 157-164.
[19] Liu, H.B. and Chen, Z.H., “Joint Design of Suspen-dome Structure”, Proceedings, the 9th National Symposium on Modern Structural Engineering, 2009.
[20] Yan R.Z., Chen Z.H., Wang X.D., Xiao X. and Yang Y., “Calculation Theory and Experimental Study of the K6 Single-layer Reticulated Shell”, International Journal of Steel Structures, 2014, Vol. 14, No. 2, pp. 195-212.
[21] Yin, D.Y., Liu, S.W. and Qian, R.J., “Design of Latticed Shell”, China Architecture & Building Press, Beijing, China, 1996.