experimental and numerical study on fretting wear and
TRANSCRIPT

Experimental and numerical study on fretting wear and fatigueof full-scale railway axles
Lang Zou1 • Dongfang Zeng1 • Yabo Li2 • Kai Yang2 • Liantao Lu1 •
Caiqin Yuan1
Received: 7 August 2020 / Revised: 21 October 2020 / Accepted: 21 October 2020 / Published online: 12 November 2020
� The Author(s) 2020
Abstract This study investigated the fretting wear and
fatigue of full-scale railway axles. Fatigue tests were
conducted on full-scale railway axles, and the fretting wear
and fretting fatigue in the fretted zone of the railway axles
were analysed. Three-dimensional finite element models
were established based on the experimental results. Then,
multi-axial fatigue parameters and a linear elastic fracture
mechanics-based approach were used to investigate the
fretting fatigue crack initiation and propagation, respec-
tively, in which the role of the fretting wear was taken into
account. The experimental and simulated results showed
that the fretted zone could be divided into zones I–III
according to the surface damage morphologies. Fretting
wear alleviated the stress concentration near the wheel seat
edge and resulted in a new stress concentration near the
worn/unworn boundary in zone II, which greatly promoted
the fretting crack initiation at the inner side of the fretted
zone. Meanwhile, the stress concentration also increased
the equivalent stress intensity factor range DKeq below the
mating surface, and thus promoted the propagation of
fretting fatigue crack. Based on these findings, the effect of
the stress redistribution resulting from fretting wear is
suggested to be taken into account when evaluating the
fretting fatigue in railway axles.
Keywords Railway axle � Fretting wear � Fretting fatigue �Crack initiation � Crack propagation � Finite element
1 Introduction
The axle is a highly critical component of a railway vehicle
[1–4]. Because it is connected to the wheels via press-
fitting, the fretting wear and fretting fatigue usually appear
within the region near the wheel seat edge [5–7]. When a
crack reaches a critical size, the axle may break with a high
risk of derailment. The design standards for railway axles
estimate the nominal bending stresses in each section using
the classical beam theory and prescribe axles to have an
infinite life [8–12]. Nonetheless, the premature failure of a
railway axle as a result of fretting fatigue still occasionally
occurs. In 2016, fretting fatigue cracks were detected at the
wheel seat of a certain type of locomotive axle used in
China, leading to the replacement of more than 600 axles
[13]. Obviously, the current design cannot fully ensure the
safety of railway axles, and the fretting fatigue in railway
axles should be further studied.
Because of the enclosed structure of a press-fitted axle,
some fretting variables that influence the fretting charac-
teristics, such as the local contact pressure and shear stress
[14, 15], are hardly measured in fatigue tests. A numerical
study is an alternative method for investigating the fretting
fatigue in press-fitted axles. In the last few decades, elastic-
fatigue and elastoplastic-fatigue methodologies have been
employed, in which elastic and elastoplastic material
behaviours have been taken into account in the fatigue
analysis, respectively [16, 17]. However, neither of these
two methodologies can reasonably explain some phenom-
ena observed in failed axles, such as the crack initiation site
being several to dozens of millimetres away from the wheel
seat edge. Recently, the authors carried on fatigue tests
using 13 mm diameter press-fitted axles, and found the
profile evolution occurring at the press-fitted region as a
result of fretting wear, from which fretting fatigue cracks
& Dongfang Zeng
1 State Key Laboratory of Traction Power, Southwest Jiaotong
University, Chengdu 610031, China
2 CRRC Qingdao Sifang Co., Ltd, Qingdao 266111, China
123
Rail. Eng. Science (2020) 28(4):365–381
https://doi.org/10.1007/s40534-020-00224-9

initiated [18]. Based on the experimental observations, a
wear-fatigue methodology was proposed to evaluate the
fretting fatigue crack initiation in press-fitted axles, in
which the effect of fretting wear was taken into account
[19, 20]. Nonetheless, the complex structure of a full-scale
railway axle, such as the overhang of the wheel hub,
transition fillet, and stress relief groove, cannot be con-
sidered for 13 mm diameter press-fitted axles. Further-
more, the nominal bending stress applied in a 13 mm
diameter press-fitted axle was far greater than the actual
stress on a railway axle. Both factors could influence the
fretting fatigue crack initiation. Therefore, for full-scale
railway axles, it is still necessary to investigate the fretting
wear and its role in crack initiation.
In addition to the crack initiation, it is also important to
gain knowledge about the fretting fatigue crack propaga-
tion in railway axles, which can then be used to determine
the inspection intervals. Fracture mechanics methods have
been used to analyse the fretting fatigue crack propagation
in railway axles [3, 21–25]. Recently, Martınez et al. [22]
and Erena et al. [25] used the extended finite element
method (XFEM) to simulate crack propagation in press-
fitted axles. Based on the Nasgro equation and concept of
the cyclic R-curve, Pourheidar et al. [3] proposed a model
to estimate the fretting fatigue crack propagation in full-
scale railway axles with artificial micro-notches. Because
of the fretting wear, the stress and strain states beneath the
press-fitted region change with the evolution of the wear
profile. It is expected that the crack propagation may also
be influenced. However, the role of fretting wear in the
fretting fatigue crack propagation in railway axles has not
yet been studied.
In this study, experimental investigations were per-
formed on a rotating bending test bench using full–scale
railway axles. The damage in the fretted zone was observed
and analysed, and the wear profiles were measured. Then,
three-dimensional finite element (FE) models were estab-
lished based on the obtained wear profiles. Subsequently,
multi-axial fatigue parameters and a linear elastic fracture
mechanics-based approach were employed to investigate
the effects of the fretting wear on the fretting fatigue crack
initiation and propagation in full-scale railway axles,
respectively.
2 Experimental procedure
2.1 Specimens and materials
Figure 1 shows the geometrical configuration of the test
axles. The detailed dimensions of the wheel seat and
transition fillet are shown in Fig. 1b and c, respectively.
The wheel seat and transition fillet were finished to provide
them with a surface roughness of Ra = 0.8 lm, and the
other areas were finished to have a surface roughness of
Ra = 1.6 lm. Based on EN 13260 [26], the grip diameter
2D between the wheel and axle was set to 0.243 mm.
The axle and wheel were made of EA4T and ER8 steels,
respectively, which are widely used in high-speed railway
wheelsets. The axle was first forged to a rough shape, and
then heat treatments were conducted, including quenching
and tempering. Thereafter, the axle was machined to the
final shape as shown in Fig. 1. The mechanical properties
of the axle and wheel materials are listed in Table 1.
2.2 Fatigue tests
The full-scale fatigue tests were performed on a Minden
type test rig [27]. As shown in Fig. 2, the test rig was a
cantilever resonant machine. The test axle was constrained
using a clamp on one side, and an electric motor with a
rotating imbalanced exciter was fixed on the opposite side.
The test frequency was set as 17.5 Hz.
Recent experimental studies found that the fatigue limit
of a quench-tempered axle corresponding to a magnetic
particle inspection (MPI) flaw detected at the wheel seat
was approximately 70 MPa [28]. Furthermore, the fatigue
limit at the wheel seat of an EA4T hollow axle is 132 MPa
according to EN 13103 [8]. To simulate such stress levels,
two axles were tested, and the nominal bending stresses at
the wheel seat edge were set as 70 and 130 MPa, respec-
tively. For simplicity, the axles with these nominal bending
stresses of 70 and 130 MPa were called Axles A and B,
respectively.
EN 13103 [8] provides a method to determine the stress
applied in the fatigue tests of full-scale railway axles. As
shown in Fig. 3, two strain gauges were, respectively,
applied in two measurement planes which were called
Planes A and B, and then the corresponding nominal
bending stress at the wheel seat edge could be calculated by
extrapolation from the values measured by these strain
gauges. During the fatigue tests, an ultrasonic inspection
was performed every 107 cycles, and the failure criterion
was the appearance of a significant signal (2–10 mm crack)
during the ultrasonic inspection. If no fretting fatigue crack
was detected, the test was then restarted. The fatigue test
was repeated until cracks were detected or the number of
cycles reached 5 9 107 cycles. After the fatigue test, the
axle was disassembled from the wheel, and an MPI was
performed to further detect the fretting fatigue cracks.
After the MPI, specimens for detailed observations were
cut out using a wire electrical discharge machine, and then
ultrasonically cleaned with acetone for 20 min. A stereo
microscope (OLYMPUS–DSX100), scanning electron
microscope (SEM, JSM–6610LV) and confocal laser
scanning microscope (CLSM, OLYMPUS OLS4100) were
366 L. Zou et al.
123 Rail. Eng. Science (2020) 28(4):365–381

used to observe the fretted damage surface. The chemical
composition of the surface damage was analysed using
energy dispersive X-ray spectroscopy (EDS, Oxford X–
MAX50 INCA–250). Furthermore, the wear profiles of
both the axle and wheel were measured using the CLSM.
3 Results and discussion
3.1 Fretting wear
3.1.1 Morphology of fretted zone
For Axle A, the fatigue test was stopped when the number
of loading cycles reached 5 9 107, and no fretting fatigue
cracks were detected after the test. For Axle B, the fatigue
test was stopped after 4 9 107 loading cycles because
circumferential fretting fatigue cracks were detected.
Figure 4 shows the macroscopic morphology of the
fretted zone after the test. As can be seen from Fig. 4a, two
annular fretting damage strips were observed at the wheel
seat of Axle A. The fretting damage strip near the transition
fillet side was wider than that on the opposite side. This
phenomenon was similar to that observed in failed axles
[6, 15]. Figures 4b and c show macroscopic views of the
fretting damage strips near the transition fillet sides of
Axles A and B, respectively. The strip width for Axle A
was approximately 20 mm, whilst that for Axle B was
approximately 39 mm. Stereo microscope images of the
regions indicated by the rectangles in Fig. 4b and c are
shown in Fig. 4d and e, respectively. Three characteristic
damage zones, called zones I–III, were identified on the
fretted surfaces of both axles. Each zone was distributed in
a band shape along the axial direction. Zone I was narrow
and clean, and was located near the wheel seat edge, where
little wear debris was observed. Zone II was located deeper
Fig. 1 Geometrical configuration of test axles: a overall geometry, b details of wheel seat, and c transition fillet (unit: mm)
Table 1 Mechanical properties of materials
Materials Elastic modulus (GPa) Poisson’s ratio Yield strength (MPa) Tensile strength (MPa) Microhardness, HV0.1
Axle 210 0.28 552 689 252
Wheel 212 0.28 584 903 286
Experimental and numerical study on fretting wear and fatigue of full-scale railway axles 367
123Rail. Eng. Science (2020) 28(4):365–381

into the fretted zone. It was black and reddish-brown in
colour and severe surface damage could be observed.
Because of the limitation of the stereo microscope, only
part of zone III could be seen. The visible circumferential
stripes observed on zone III were formed during the
machining process for the axle, whilst the diagonal stripes
were formed during the process of assembling and disas-
sembling the axle. The left borders of zone III were located
at the black dotted lines shown in Figs. 4b and c. A small
amount of black debris was scattered in zone III, indicating
that only slight fretting damage occurred. The widths of the
damage zones were measured and listed in Table 2.
The detailed morphology of the fretted zone was anal-
ysed using the SEM equipped with EDS, as shown in
Fig. 5. The analysis focused on Axle B because more
severe fretting damage appeared on this axle. As shown in
Fig. 5a, the rough surface of zone I indicates the occur-
rence of severe abrasive wear. The detected O signal was
introduced by the internal oxidative debris. As depicted in
Fig. 5b, some metallic flakes and material spalling were
found in zone II, which was the characteristic of delami-
nation. In addition to the black and reddish-brown wear
debris observed in zone II (as seen in Fig. 4e), a remark-
able O peak was also detected, indicating the occurrence of
oxidative wear. Therefore, the main wear mechanisms in
Fig. 2 Fatigue test rig: a Minden type test rig and b its principle sketch
Fig. 3 Strain gauges and their positions on test axles (unit: mm)
368 L. Zou et al.
123 Rail. Eng. Science (2020) 28(4):365–381

zone II were delamination and oxidative wear. Compared
with zone II, a smaller number of metallic flakes and lower
O peak were observed in zone III, as shown in Fig. 5d. This
suggests that only slight delamination and oxidative wear
occurred in zone III.
3.1.2 Wear profiles
Take Axle B as an example; Fig. 6 shows the process for
measuring the wear profile of the fretted zone using CLSM.
The 3D morphology of the damaged surface was observed,
as shown in Fig. 6a. And then the 2D wear profile of the
axle along the axial direction could be measured, as shown
in Fig. 6b. 2D wear profiles were obtained at 24 sections
for each test axle and wheel, and the mean value of these
measured profiles was defined as the final wear profile, as
shown in Fig. 7. The axle and wheel had similar wear
profiles because they comprised a friction couple. The wear
depth reached its maximum at the wheel seat edge, and
then gradually decreased towards the inner side of the
fretted zone. A comparison of the wear profiles of Axles A
and B showed that the fretting wear that occurred in Axle B
was more severe, even though it was subjected to fewer
loading cycles. This phenomenon suggested that the load-
ing stress level greatly affected the fretting wear. Further-
more, the worn/unworn boundaries of the two test axles
were located within zone II.
3.2 Fretting fatigue
Fretting fatigue cracks were found in Axle B after 4 9 107
cycles, as shown in Fig. 8. A fretting fatigue crack was
initiated approximately 4.1 mm away from the wheel seat
edge, and the initiation site was located near the worn/
unworn boundary shown in Fig. 7b. It can be seen from
Fig. 8b that this crack initiated with an inclination of
approximately 33� relative to the depth direction of the
axle, and the inclination angle gradually decreased with the
propagation of the crack. A similar phenomenon has also
been observed in failed railway axles [3, 7, 15].
Fig. 4 Macroscopic morphology of fretted zone after fatigue test: a wheel seat of Axle A, macroscopic views of fretting damage strips observed
on b Axle A and c Axle B, and stereo microscope images of fretted zones observed on d Axle A and e Axle B
Table 2 Width of each damage zone (mm)
Axle Zone I Zone II Zone III Total width
A 0.8 2.8 16.4 20
B 1.3 3.4 34.3 39
Experimental and numerical study on fretting wear and fatigue of full-scale railway axles 369
123Rail. Eng. Science (2020) 28(4):365–381

4 Fretting fatigue evaluation
4.1 FE model
Based on the geometrical configuration of the test axle
shown in Fig. 1, the four FE models listed in Table 3 were
established to investigate the effect of fretting wear on the
fretting fatigue of full-scale railway axles. The FE pre-
processor HYPERMESH was employed to create a starting
2D solid mesh of the test axle without considering fretting
wear (models 1 and 3), as shown in Fig. 9a. A highly
refined mesh size of 0.05 mm was selected in the areas of
interest, including the regions near the wheel seat edge and
transition fillet. Based on the measured wear profile shown
in Fig. 7, a 2D solid mesh that considered the fretting wear
(models 2 and 4) was then built by modifying the mesh
node coordinates within the fretted zone, as shown in
Fig. 9b. A 3D solid mesh was created by rotating the 2D
solid mesh around the symmetry axis.
The 3D solid mesh was imported into the FE code
ABAQUS, and the corresponding 3D FE model shown in
Fig. 10 was obtained. The FE model was composed of
three-dimensional eight-node linear brick elements
(C3D8). The mating surface interaction between the axle
and wheel was modelled via the master–slave contact
algorithm, in which the wheel’s inner surface was defined
as the master surface whilst the wheel seat surface of the
axle was the slave. The tangential behaviour was described
using the basic Coulomb frictional model, and the coeffi-
cient of friction (CoF) was set as 0.75. The frictional
constraints were modelled using the penalty algorithm, and
the maximum elastic slip tolerance was set as 0.0001. The
optimisations of the mesh size, CoF and maximum elastic
slip tolerance are described in Sect. 4.2.
In this study, the linear kinematic hardening model
within ABAQUS [29] was used to consider the plastic
deformation of the test axle resulting from contact. The
yield stress ry and hardening modulus of the EA4T steel
were taken as 552 MPa and 5.4 GPa, respectively, whilst
they were taken as 584 MPa and 8.0 GPa for ER8 wheel
steel, respectively.
The loading and boundary conditions imposed on the FE
model corresponded to those for the test axle during the
fatigue test. As shown in Fig. 10, the x-axis displacements
(c)
(a)
50 μm
Metallic flak
50 μ
m
ke
μm
(b)
M
0.0
10.0k
20.0k
0.0
10.0k
20.0k
0.0
10.0k
20.0k
Inte
nsity
(arb
. uni
ts)
(d)
Metallic flake
0 20
k
k
0
k
k
0
k
k
FeC
Si
Si
Fe
O
Fe
O
C
SiOC
Spallie
4Energy (keV
50 μ
ing
6Cr
V)
F
F
Fe
Fe
F
Fe
Cr
Z
Cr
Z
μm
8
Zone I
Fe
Fe
Fe
Zone II
Zone III
Fig. 5 SEM morphology and EDS analysis of fretted zone: a zone I, b zone II, c zone III and d EDS analysis
370 L. Zou et al.
123 Rail. Eng. Science (2020) 28(4):365–381

were restricted on the left surface of the wheel rim, and the
external surface of the wheel was fixed. In step 1, an
interference fit was introduced with a grip diameter of
2D = 0.243 mm, which equals to the interference used in
the tested axle-wheel. In step 2, a concentrated force along
the y-axis (Fy = F0) was applied at reference point F.
During the later steps, two computational time-varying
concentrated forces, Fy = F0cos(2pt) and Fz = F0sin(2pt),were applied at reference point F along the y and z axes,
respectively. In this manner, a rotating bending stress was
applied to the axle during the FE simulation.
z (μm)
420
210 2
-6000 -5000 -4000 -3000 -2000 -1000 0-90
-60
-30
0
30
Wea
r dep
th (μ
m)
Position along axial direction (μm)
(a)
(b)
Fig. 6 Measurement process for profile of fretted zone using CLSM: a observation of damaged surface of Axle B and b wear profile indicated by
green plane in (a)
-10 -8 -6 -4 -2 0 2-90
-60
-30
0
30
60
Wheel
Zone IZone II
Wea
r dep
th( μ
m)
Position along axial direction x (mm)
Wheel seat edge
Original surface
Zone III
Axle
-10 -8 -6 -4 -2 0 2-90
-60
-30
0
30
60
Wheel
Zone IZone II
Original surface
Wea
r dep
th ( μ
m)
Position along axial direction x (mm)
Wheel seat edge
Zone III
Axle
(b)(a)
Fig. 7 Wear profiles of test axles: a Axle A and b Axle B
Experimental and numerical study on fretting wear and fatigue of full-scale railway axles 371
123Rail. Eng. Science (2020) 28(4):365–381

4.2 Optimisation of parameters
4.2.1 Mesh size near the wheel seat edge
Figure 11 shows the effect of mesh size on the distribution
of contact pressure near the wheel seat edge. It can be seen
that the smaller mesh size can capture the more compli-
cated variations in contact pressure near the wheel seat
edge. When the mesh size is less than 0.05 mm, the contact
pressure almost remained unchanged, whilst the computa-
tional time increased rapidly. Therefore, the mesh size was
set as 0.05 mm in this study.
4.2.2 Coefficient of friction
The CoF of the test axle could not be measured via the
fatigue test described in Sect. 2.2. Furthermore, it was
unclear whether the CoF measured using the material
fretting configurations, such as the ball-to-flat configuration
[30], could be used for the FE simulation. In this study, the
method described by Bertini and Santus [31] was used, in
which the CoF value l was determined by comparing the
experimental result with the FE simulation result. The
experimental slip lengths measured from the fretted zone of
Axles A and B were 20 and 39 mm, respectively. The slip
lengths could also be acquired using the FE models that
considered the fretting wear, as stated in Sect. 4.1. The
relationships between the CoF values and simulated slip
lengths are listed in Table 4. It can be seen that the sim-
ulated slip lengths were almost equal to the experimental
slip lengths when the CoF value was set as l = 0.75.
4.2.3 Maximum elastic slip tolerance
Different contact algorithms within ABAQUS can be used
to describe the stick–slip behaviour at the mating surface of
Fig. 8 Fretting fatigue cracks observed in Axle B: a mating surface and b cross–section
Fig. 9 FE mesh modelling: a 2D solid mesh without considering fretting wear and b 2D solid mesh considering fretting wear
Table 3 FE models of test axles
Model Wear profiles Nominal bending stress (MPa)
1 Unworn 70
2 Worn 70
3 Unworn 130
4 Worn 130
372 L. Zou et al.
123 Rail. Eng. Science (2020) 28(4):365–381

a press-fitted axle. Rajasekaran et al. [32] found that the
penalty approach with an appropriate maximum elastic slip
tolerance could provide a result that was as good as that of
the Lagrange multipliers approach, whilst avoiding the
contact convergence problem. This study employed the
penalty approach, and the distribution of the axial slip
range with different slip tolerances is shown in Fig. 12. It
can be seen that a smaller slip tolerance could provide a
better description of the stick–slip, and the axial slip range
gradually reached a stable state for a slip tolerance smaller
than 0.0001. Because a smaller slip tolerance required a
larger number of iterations, a value of 0.0001 was selected.
4.2.4 Loading cycle
Since the elastoplastic material model was used to consider
the plastic deformation of the test axle resulting from
contact, the stresses and strains used for crack initiation
Fig. 10 FE model of test axle
-5 -4 -3 -2 -1 0 1
0
50
100
150
200
Position along axial direction x (mm)
Con
tact
pre
ssur
e (M
Pa)
0.025 mm 0.05 mm
0.1 mm 0.2 mm 0.4 mm
Wheel seat edge
Fig. 11 Effect of mesh size on the distribution of contact pressure
near the wheel seat edge
Table 4 Relationships between CoF values and simulated slip
lengths
CoF 0.6 0.65 0.7 0.75 0.8 0.85
Axle A 26.8 24.6 22.4 20.6 19.0 17.5
Axle B 46.6 45.0 41.8 39.5 38.4 37.6
-80 -60 -40 -20 0 20-5
0
5
10
15
20
25
30
0.005
0.001
0.0005
0.00005
Slip zoneStick zone
Axi
al sl
ip ra
nge s(
μm)
Position along axial direction x (mm)
Wheel seat edge0.0001
Fig. 12 Evolution of axial slip range s of Axle B with maximum
elastic slip tolerance
Experimental and numerical study on fretting wear and fatigue of full-scale railway axles 373
123Rail. Eng. Science (2020) 28(4):365–381
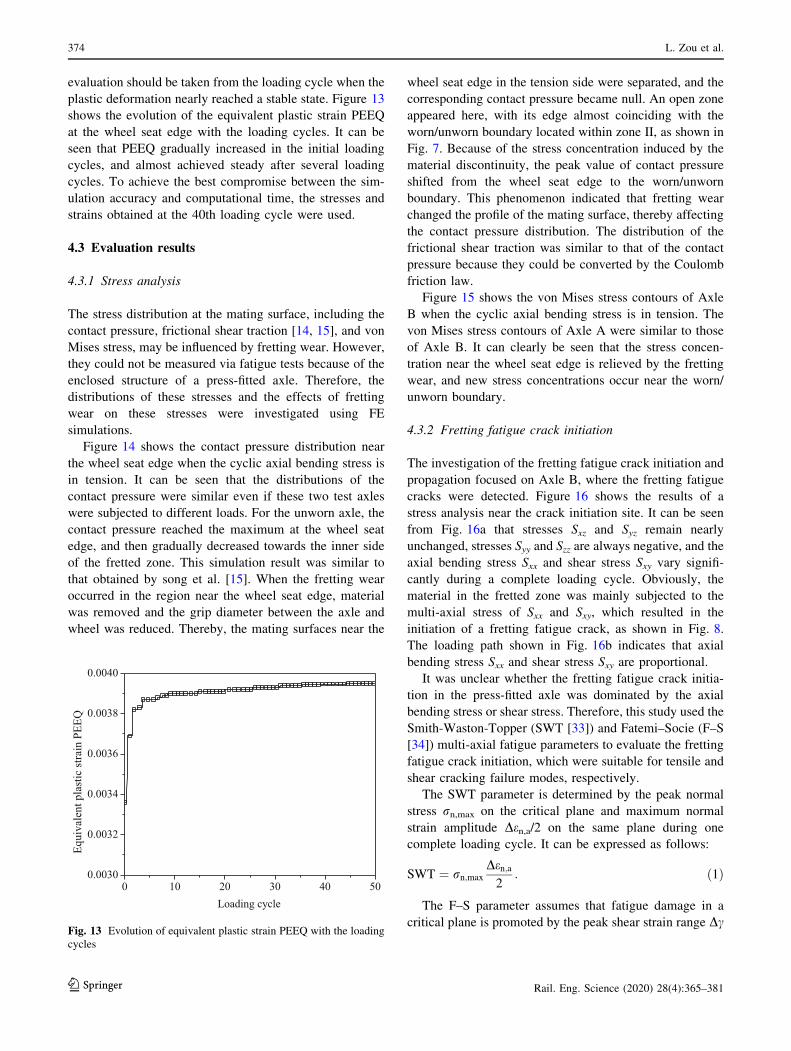
evaluation should be taken from the loading cycle when the
plastic deformation nearly reached a stable state. Figure 13
shows the evolution of the equivalent plastic strain PEEQ
at the wheel seat edge with the loading cycles. It can be
seen that PEEQ gradually increased in the initial loading
cycles, and almost achieved steady after several loading
cycles. To achieve the best compromise between the sim-
ulation accuracy and computational time, the stresses and
strains obtained at the 40th loading cycle were used.
4.3 Evaluation results
4.3.1 Stress analysis
The stress distribution at the mating surface, including the
contact pressure, frictional shear traction [14, 15], and von
Mises stress, may be influenced by fretting wear. However,
they could not be measured via fatigue tests because of the
enclosed structure of a press-fitted axle. Therefore, the
distributions of these stresses and the effects of fretting
wear on these stresses were investigated using FE
simulations.
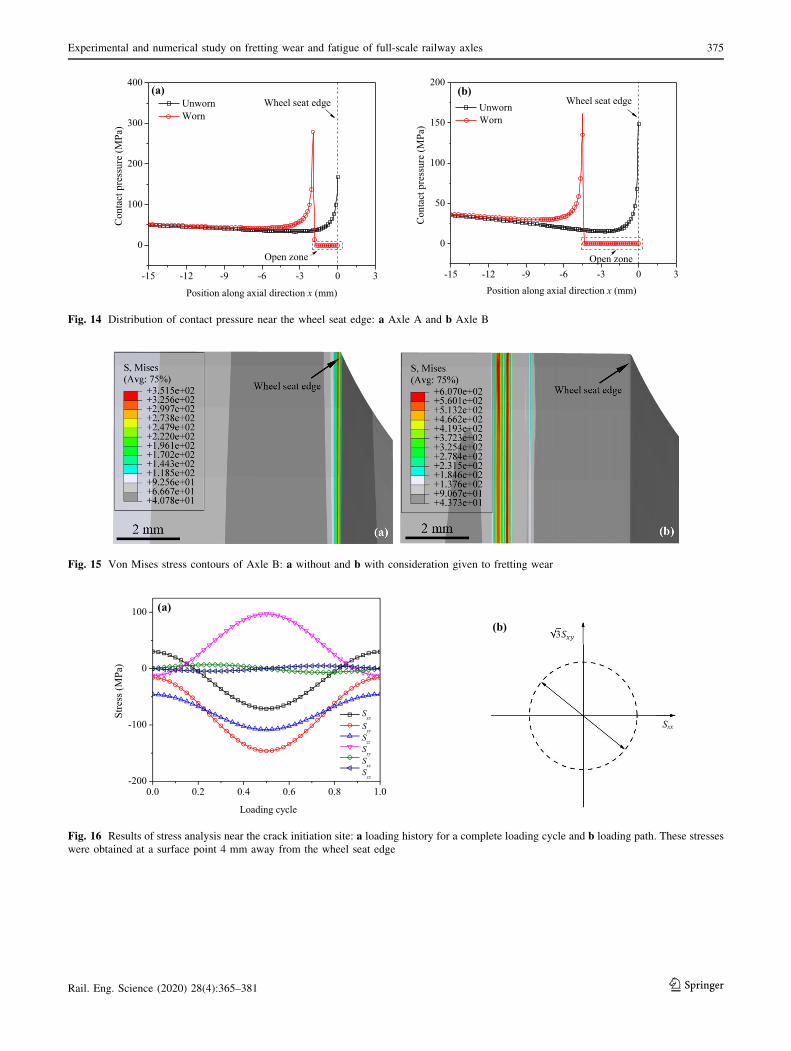
Figure 14 shows the contact pressure distribution near
the wheel seat edge when the cyclic axial bending stress is
in tension. It can be seen that the distributions of the
contact pressure were similar even if these two test axles
were subjected to different loads. For the unworn axle, the
contact pressure reached the maximum at the wheel seat
edge, and then gradually decreased towards the inner side
of the fretted zone. This simulation result was similar to
that obtained by song et al. [15]. When the fretting wear
occurred in the region near the wheel seat edge, material
was removed and the grip diameter between the axle and
wheel was reduced. Thereby, the mating surfaces near the
wheel seat edge in the tension side were separated, and the
corresponding contact pressure became null. An open zone
appeared here, with its edge almost coinciding with the
worn/unworn boundary located within zone II, as shown in
Fig. 7. Because of the stress concentration induced by the
material discontinuity, the peak value of contact pressure
shifted from the wheel seat edge to the worn/unworn
boundary. This phenomenon indicated that fretting wear
changed the profile of the mating surface, thereby affecting
the contact pressure distribution. The distribution of the
frictional shear traction was similar to that of the contact
pressure because they could be converted by the Coulomb
friction law.
Figure 15 shows the von Mises stress contours of Axle
B when the cyclic axial bending stress is in tension. The
von Mises stress contours of Axle A were similar to those
of Axle B. It can clearly be seen that the stress concen-
tration near the wheel seat edge is relieved by the fretting
wear, and new stress concentrations occur near the worn/
unworn boundary.
4.3.2 Fretting fatigue crack initiation
The investigation of the fretting fatigue crack initiation and
propagation focused on Axle B, where the fretting fatigue
cracks were detected. Figure 16 shows the results of a
stress analysis near the crack initiation site. It can be seen
from Fig. 16a that stresses Sxz and Syz remain nearly
unchanged, stresses Syy and Szz are always negative, and the
axial bending stress Sxx and shear stress Sxy vary signifi-
cantly during a complete loading cycle. Obviously, the
material in the fretted zone was mainly subjected to the
multi-axial stress of Sxx and Sxy, which resulted in the
initiation of a fretting fatigue crack, as shown in Fig. 8.
The loading path shown in Fig. 16b indicates that axial
bending stress Sxx and shear stress Sxy are proportional.
It was unclear whether the fretting fatigue crack initia-
tion in the press-fitted axle was dominated by the axial
bending stress or shear stress. Therefore, this study used the
Smith-Waston-Topper (SWT [33]) and Fatemi–Socie (F–S
[34]) multi-axial fatigue parameters to evaluate the fretting
fatigue crack initiation, which were suitable for tensile and
shear cracking failure modes, respectively.
The SWT parameter is determined by the peak normal
stress rn,max on the critical plane and maximum normal
strain amplitude Den,a/2 on the same plane during one
complete loading cycle. It can be expressed as follows:
SWT ¼ rn;max
Den;a2
: ð1Þ
The F–S parameter assumes that fatigue damage in a
critical plane is promoted by the peak shear strain range Dc
0 10 20 30 40 500.0030
0.0032
0.0034
0.0036
0.0038
0.0040
Loading cycle
Equi
vale
nt p
last
ic st
rain
PEE
Q
Fig. 13 Evolution of equivalent plastic strain PEEQ with the loading
cycles
374 L. Zou et al.
123 Rail. Eng. Science (2020) 28(4):365–381
-15 -12 -9 -6 -3 0 3
0
100
200
300
400
Open zone
Position along axial direction x (mm)
Con
tact
pre
ssur
e (M
Pa)
UnwornWorn
Wheel seat edge
-15 -12 -9 -6 -3 0 3
0
50
100
150
200
Open zone
Position along axial direction x (mm)
Con
tact
pre
ssur
e (M
Pa)
UnwornWorn
Wheel seat edge(a) (b)
Fig. 14 Distribution of contact pressure near the wheel seat edge: a Axle A and b Axle B
Fig. 15 Von Mises stress contours of Axle B: a without and b with consideration given to fretting wear
Sxx
0.0 0.2 0.4 0.6 0.8 1.0-200
-100
0
100
Syy
Loading cycle
Stre
ss (M
Pa)
Sxx
SzzSxySxzSyz
(a)
(b)3
Fig. 16 Results of stress analysis near the crack initiation site: a loading history for a complete loading cycle and b loading path. These stresses
were obtained at a surface point 4 mm away from the wheel seat edge
Experimental and numerical study on fretting wear and fatigue of full-scale railway axles 375
123Rail. Eng. Science (2020) 28(4):365–381

and related maximum normal stress rn,max. It can be
expressed as follows:
F-S ¼ Dc2ð1þ j
rn;max
ryÞ; ð2Þ
where j is a material parameter that is determined by the
interaction between the tensile and shear cracking failure
modes, and is given a value of 0.3 for EA4T steel [35].
The SWT and F-S parameters were applied along with
the critical plane approach [36], in which the multi-axial
fatigue parameters were calculated for each candidate
plane at various material points, and the maximum value of
the parameter represented the damage at the evaluated
material point.
Figure 17 shows the distributions of the SWT and F-S
parameters near the wheel seat edge. It can be seen that, for
the unworn axle, the maximum values of both the SWT and
F–S parameters appear at the wheel seat edge, which
implies that a fretting fatigue crack is most likely to be
initiated here. This does not agree with the experimental
result that a fretting fatigue crack was initiated approxi-
mately 4.1 mm away from the wheel seat edge. For the
worn axle, the wear profiles of the axle and wheel were
measured using CLSM, and the obtained wear profiles
were not smooth, which caused three new stress concen-
trations in the fretted zone, as shown in Fig. 15b. Thereby,
three peak values of the SWT and F-S parameters occurred
in the inner side of the fretted zone, and the maximum
value was approximately 4.4 mm away from the wheel seat
edge. It can be found that when considering fretting wear,
the locations of the maximum fatigue parameters are in
good agreement with the observed crack initiation site.
In short, fretting wear near the wheel seat edge removed
material and alleviated the stress concentration there.
Meanwhile, it resulted in a new stress concentration
occurring near the worn/unworn boundary. Under the
action of continuous fretting wear, fretting fatigue cracks
were eventually initiated at the inner side of the fretted
zone.
4.3.3 Fretting fatigue crack propagation
As previously described, the fretting fatigue crack initiation
was strongly influenced by the stress redistribution induced
by fretting wear, and this stress redistribution could also
influence the fretting fatigue crack propagation. Therefore,
the stress intensity factors (SIFs) of fretting fatigue cracks
with different depths shown in Fig. 8 were calculated with/
without considering the fretting wear, and then the effect of
fretting wear on the crack propagation was evaluated.
The FE models 3 and 4 listed in Table 3 were employed
in this section, and the SIFs at the crack tips were calcu-
lated by the use of the contour integrals. The material
behaviours were idealised as being linear elastic, and the
elastic modulus and Poisson’s ratio values of the axle and
wheel materials are listed in Table 1. During the simulation
of fretting fatigue crack propagation in the press-fitted
region, a crack is often simplified as a ring-shaped crack
[3, 37]. Considering the fact that the circumferential fret-
ting fatigue crack observed in Axle B almost entirely
encircled the axle, a ring-shaped crack was also used in the
FE models. The pre-defined cracks with different depths
shown in Fig. 18a were modelled as shown in Fig. 18b.
The number of contours along the crack front was set as 15,
and the maximum tangential stress (MTS) criterion was
adopted. In this manner, the SIFs at the crack tips could be
obtained at each increment during one complete loading
cycle. Furthermore, the crack surfaces could contact due to
the rotating bending stress. In such a case, the surface
interaction between the crack surfaces was modelled via
the self-contact algorithm, and both tangential and normal
behaviours of the crack surfaces were guaranteed. The CoF
-15 -12 -9 -6 -3 0 3
0.0
0.5
1.0
1.5
2.0
2.5
Position along axial direction x (mm)
SWT
para
met
er (M
Pa)
UnwornWorn
Wheel seat edge
-15 -12 -9 -6 -3 0 3
0.0000
0.0005
0.0010
0.0015
0.0020
0.0025
Position along axial direction x (mm)
F-S
para
met
er
UnwornWorn
Wheel seat edge(a) (b)
Fig. 17 Distributions of a SWT and b F–S parameters near wheel seat edge
376 L. Zou et al.
123 Rail. Eng. Science (2020) 28(4):365–381

between the crack surfaces was set as 0.60 [38], whilst a
hard contact algorithm was used to describe the normal
behaviour. Therefore, the compressive pressure could be
effectively transferred through the crack surfaces, by which
the crack closure can be well simulated.
Figure 19 shows the SIF calculation process for the
evaluation. The von Mises stress contours around a crack
tip are shown in Fig. 19a, and the evolution of the SIFs
with the number of contours is shown in Fig. 19b. The SIFs
oscillate slightly in the first contour, after which they
converge. Therefore, the average SIFs obtained from con-
tours 2–15 were used to evaluate the crack propagation.
Figure 20 shows the evolution of the SIFs for the crack
shown in Fig. 19 during a complete loading cycle. Since
the negative KI resulting from the negative bending stress
has little influence on the crack propagation, it was not
taken into account in this study according to the data
processing method adopted by Mai et al. [39]. It can be
seen that the minimum value of KI is null, KII varies a little
within a complete loading cycle, and KIII remains almost
unchanged. The experimental crack propagation path
shown in Fig. 8 indicates that the crack propagates in a I–II
mixed mode. Therefore, an equivalent SIF range DKeq was
introduced to simultaneously consider the effects of the
axial bending and shear driving forces (DKI and DKII) on
the fretting fatigue crack propagation. DKeq can be
expressed as follows:
DKeq ¼ f ðDKI; DKIIÞ; ð3Þ
where DKI = KI,max– KI,min and DKII = KII,max– KII,min.
Various DKeq models have been proposed to investigate
the fatigue crack propagation in a I–II mixed model
[40–44]. Previous studies have shown that these DKeq
models give similar prediction results [45, 46]. Here,
Richard’s model [42, 43] was employed, which can be
expressed as follows:
Axle
Wheel
Ring-shaped crack
(b)
12m
m 10m
m8
mm
6m
m 4m
m 2m
m
0.25 mm, 0.5 mm, 1 mm
(a) Wheel seat edge
Fig. 18 Crack configuration: a fatigue crack propagation path and b crack with a depth of 2 mm modelled in the FE model
(a)
-5.0
-2.5
0.0
2.5
5.0
7.5
10.0
0 30
5
0
5
0
5
0
KII
KII
KI(b)
6 9
II
I
Number of con12
ntours15
Fig. 19 SIF calculation process for evaluation: a von Mises stress contours around crack tip and b evolution of SIFs with number of contours
Experimental and numerical study on fretting wear and fatigue of full-scale railway axles 377
123Rail. Eng. Science (2020) 28(4):365–381

DKeq ¼DKI
2þ 1
2
ffiffiffiffiffiffiffiffiffiffiffiffiffiffiffiffiffiffiffiffiffiffiffiffiffiffiffiffiffiffiffiffiffiffi
DK2I þ 4ðbDKIIÞ2
4
q
; ð4Þ
where b = 1.155 is a constant [47].
Figure 21 shows the evolution of the SIF ranges DKI and
DKII with the crack depth. It can be seen that, for the worn/
unworn axles, the DKI value increases with an increase in
the crack depth, whilst the DKII value remains nearly
unchanged. These simulation results indicate that the crack
propagation in mode I plays a more critical role as the
crack propagates, which can be used to explain the
observed phenomenon shown in Fig. 8 that the crack
propagation angle gradually decreases with an increase in
the crack depth. As shown in Fig. 21a, for a crack depth of
0–2 mm, the DKI value calculated for the worn axle is
greater than that for the unworn axle. The DKI values
calculated for the worn/unworn axles are almost identical
when the crack depth exceeds 2 mm. As depicted in
Fig. 21b, the DKII value calculated for the worn axle is
always slightly less than that for the unworn axle.
In this study, DKI is mainly determined by the maximum
axial bending stress Sxx,max and crack depth. The distribu-
tions of Sxx,max along the depth direction were calculated,
as shown in Fig. 22. For the unworn axle, the effect of
press-fitting decreases with an increase in depth, resulting
in an increase in Sxx,max. For the worn axle, the material
discontinuity resulting from the fretting wear introduces a
stress concentration near the worn/unworn boundary, and
the effect of the stress concentration decreases with an
increase in depth. The combined effect of press-fitting and
stress concentration causes Sxx,max to decrease near the
mating surface, and then increase with an increase in depth.
The value of Sxx,max calculated for the worn axle within the
region of 0–2 mm is greater than that for the unworn axle,
which results in a difference between the calculated DKI
values of the worn and unworn axles. When the crack depth
exceeds 2 mm, the small difference in Sxx,max has little
influence on the DKI values calculated for the worn/unworn
axles. Since DKII is strongly affected by the frictional
contact between the crack surfaces, it is difficult to explain
the evolution trend of DKII shown in Fig. 21b using a
simple stress distribution.
The evolution of both the equivalent SIF range DKeq and
the relative error d with the crack depth is shown in
Fig. 23. The relative error d between the calculated
equivalent SIF range DKeq for the worn and unworn axles
is defined as
d¼DKeq;worn � DKeq;unworn
DKeq;worn� 100%: ð5Þ
It can be seen that, for a crack depth of 0–2 mm, the
value of DKeq calculated for the worn axle is greater than
0.0 0.2 0.4 0.6 0.8 1.0-5.0
-2.5
0.0
2.5
5.0
7.5
10.0
KIII
KII
KI
Loading cycle
Val
ue o
f SIF
(MPa
. m0.
5 )
Fig. 20 Evolution of SIFs for crack with a depth of 2 mm during a
complete loading cycle
0 2 4 6 8 10 120
5
10
15
20
25
30
0 1 2 30
3
6
9
Crack depth (mm)
SIF
rang
e ΔK I (M
Pam
0.5 )
UnwornWorn
0 2 4 6 8 10 120
1
2
3
4
5
Crack depth (mm)
SIF
rang
e ΔK
II (MPa
m0.
5 )
UnwornWorn
(a) (b)
Fig. 21 Evolution of the SIF ranges with crack depth: a DKI and b DKII
378 L. Zou et al.
123 Rail. Eng. Science (2020) 28(4):365–381

that for the unworn axle. When the crack depth is greater
than 2 mm, the difference between the values of DKeq
calculated for the worn/unworn axles is negligible.
Furthermore, the relative error d decreases with an
increase in the crack depth, and d is over 5% when the
crack depth is less than 2 mm. This indicates that fretting
wear affects the crack propagation when the crack depth is
within the region of 0–2 mm, and that without considering
the fretting wear, a fretting fatigue crack propagation
prediction in the press-fitted region would overestimate the
residual life time.
Based on the previous analysis and discussion, it can be
concluded that the stress redistribution resulting from
fretting wear greatly promotes fretting fatigue crack initi-
ation within the fretted zone, and simultaneously produces
a stress field that facilitates fretting fatigue crack
propagation. Under in-service conditions, fretting wear is
inevitable for a railway axle, and fretting fatigue occa-
sionally occurs. Therefore, the effect of the stress redis-
tribution resulting from fretting wear is suggested to be
taken into account when evaluating the fretting fatigue in
railway axles.
5 Conclusions
In this study, fatigue tests were conducted on full-scale
railway axles, and then the fretting wear and fretting fati-
gue in the fretted zone of axles were analysed. Based on the
experimental results, 3D FE models were established to
investigate the effect of fretting wear on the fretting fatigue
in full-scale railway axles. The following main conclusions
can be drawn:
(1) The fretted zone could be divided into zones I–III
according to the surface damage morphologies. The
fretting wear mechanisms for the fretted zone
included abrasive wear, oxidative wear, and delam-
ination. Fretting wear alleviated the stress concentra-
tion near the wheel seat edge and resulted in a new
stress concentration near the worn/unworn boundary
in zone II, which greatly promoted fretting fatigue
crack initiation.
(2) The stress concentration resulting from fretting wear
increased the equivalent SIF range DKeq, and thus
promoted the propagation of fretting fatigue crack
within a region of 0–2 mm below the mating surface.
(3) The orientation of the initial fretting fatigue crack was
approximately 33� with respect to the depth direction
of the test axle, suggesting that the crack propagated
in a I–II mixed mode. Because DKI increased with an
increase in the crack depth whilst DKII remained
nearly unchanged, mode I played a more critical role
as the crack propagated, which resulted in a decrease
in the inclined angle.
(4) The effect of the stress redistribution resulting from
fretting wear is suggested to be taken into account
when evaluating the fretting fatigue in railway axles.
Acknowledgements This work was supported by the Independent
Research Project of the State Key Laboratory of Traction Power
(No. 2018TPL_Z01), the National Natural Science Foundation of
China (No. 51375406) and the Fundamental Research Funds for the
Central Universities (No. 2682018CX68).
Open Access This article is licensed under a Creative Commons
Attribution 4.0 International License, which permits use, sharing,
adaptation, distribution and reproduction in any medium or format, as
long as you give appropriate credit to the original author(s) and the
source, provide a link to the Creative Commons licence, and indicate
if changes were made. The images or other third party material in this
Fig. 22 Distributions of the maximum axial bending stress Sxx,max.
These stresses were obtained from Models 3 and 4 listed in Table 3
Fig. 23 Evolution of the equivalent SIF range DKeq and the relative
error d with crack depth
Experimental and numerical study on fretting wear and fatigue of full-scale railway axles 379
123Rail. Eng. Science (2020) 28(4):365–381

article are included in the article’s Creative Commons licence, unless
indicated otherwise in a credit line to the material. If material is not
included in the article’s Creative Commons licence and your intended
use is not permitted by statutory regulation or exceeds the permitted
use, you will need to obtain permission directly from the copyright
holder. To view a copy of this licence, visit http://creativecommons.
org/licenses/by/4.0/.
References
1. Maedler K, Geburtig T, Ullrich D (2016) An experimental
approach to determining the residual lifetimes of wheelset axles
on a full-scale wheel-rail roller test rig. Int J Fatigue 86:58–63
2. Zerbst U, Beretta S, Kohler G, Lawton A, Vormwald M, Beier
HT, Klinger C, Cerny I, Rudlin J, Heckel T (2013) Safe life and
damage tolerance aspects of railway axles—a review. Eng Fract
Mech 98(1):214–271
3. Pourheidar A, Regazzi D, Cervello S, Foletti S, Beretta S (2020)
Fretting fatigue analysis of full-scale railway axles in presence of
artificial micro-notches. Tribol Int 150:106383
4. Zhai W, Han Z, Chen Z, Ling L, Zhu S (2019) Train-track-bridge
dynamic interaction: a state-of-the-art review. Veh Syst Dyn
57(7):984–1027
5. Foletti S, Beretta S, Gurer G (2016) Defect acceptability under
full-scale fretting fatigue tests for railway axles. Int J Fatigue
86:34–43
6. Zhu C, He J, Peng J, Ren Y, Lin X, Zhu M (2019) Failure
mechanism analysis on railway wheel shaft of power locomotive.
Eng Fail Anal 104:25–38
7. Gurer G, Gur CH (2017) Failure analysis of fretting fatigue ini-
tiation and growth on railway axle press-fits. Eng. Failure Anal
84:151–166
8. BS EN 13103 (2017) Railway applications–wheelsets and
bogies–design method for axles with external journals. BSI,
London
9. BS EN 13104–2009 ? A2–2012 Railway applications–wheelsets
and bogies–powered axles–design method, BSI, London
10. JIS E4501-1995 Railway rolling stock – design methods for
strength of axles, JSA, Tokyo
11. Hirakawa K, Toyama K, Kubota M (1998) The analysis and
prevention of failure in railway axles. Int J Fatigue
20(2):135–144
12. Smith RA, Hillmansen S (2004) A brief historical overview of the
fatigue of railway axles. Proc Inst Mech Eng Part F: J Rail Rapid
Transit 218(4):267–277
13. Zeng D, Zhang Y, Lu L, Zou L, Zhu S (2019) Fretting wear and
fatigue in press-fitted railway axle: a simulation study of the
influence of stress relief groove. Int J Fatigue 118:225–236
14. Iyer K (2001) Peak contact pressure, cyclic stress amplitudes,
contact semi-width and slip amplitude: relative effects on fretting
fatigue life. Int J Fatigue 23(3):193–206
15. Song C, Shen MX, Lin XF, Liu DW, Zhu MH (2013) An
investigation on rotatory bending fretting fatigue damage of
railway axles. Fatigue Fract Eng Mater Struct 37(1):72–84
16. Hattori T, Kawai S, Okamoto N, Sonobe T (1981) Torsional
fatigue strength of a shrink fitted shaft. Bull. JSME
24(197):1893–1900
17. Zou L, Zeng D, Wang J, Lu L, Li Y, Zhang Y (2020) Effect of
plastic deformation and fretting wear on the fretting fatigue of
scaled railway axles. Int J Fatigue 132:105371
18. Zhang Y, Lu L, Gong Y, Zhang J, Zeng D (2017) Fretting wear-
induced evolution of surface damage in press–fitted shaft. Wear
384:131–141
19. Zhang Y, Lu L, Gong Y, Zeng D, Zhang J (2017) Finite element
modeling and experimental validation of fretting wear scars in
press-fitted shaft with open zone. Tribol Trans 61(4):585–595
20. Zhang YB, Lu LT, Zou L, Zeng DF, Zhang JW (2018) Finite
element simulation of the influence of fretting wear on fretting
crack initiation in press-fitted shaft under rotating bending. Wear
400–401:177–183
21. Ishiduka H, Kubota M, Sakae C, Kondo Y, Sato Y, Makino K
(2006) Evaluation of fatigue crack propagation property on the
wheelseat of normalized axles for narrow gauge line vehicles.
J Soc Mater Sci Jpn 55(6):550–557
22. Martınez JC, Useche LVV, Wahab MA (2017) Numerical pre-
diction of fretting fatigue crack trajectory in a railway axle using
XFEM. Int J Fatigue 100:32–49
23. Gutkin R, Alfredsson B (2008) Growth of fretting fatigue cracks
in a shrink-fitted joint subjected to rotating bending. Eng Fail
Anal 15(5):582–596
24. Ekberg A (2004) Fretting fatigue of railway axles—a review of
predictive methods and an outline of a finite element model. Proc
Inst Mech Eng Part F: J Rail Rapid Transit 218(4):299–316
25. Erena D, Vazquez J, Navarro C, Talemi R (2020) Numerical
study on the influence of artificial internal stress relief groove on
fretting fatigue in a shrink-fitted assembly. Tribol Int 151:106443
26. BS EN 13260–2009 Railway applications—wheelsets and
bogies—wheelsets—product requirements, BSI, London
27. Cervello S (2016) Fatigue properties of railway axles: new results
of full-scale specimens from Euraxles project. Int J Fatigue
86:2–12
28. Makino T, Sakai H, Kozuka C, Yamazaki Y, Yamamoto M,
Minoshima K (2020) Overview of fatigue damage evaluation rule
for railway axles in Japan and fatigue property of railway axle
made of medium carbon steel. Int J Fatigue 132:105361
29. Abaqus User Manual (2014). Abaqus Theory Guide. Version
6.14. USA: Dassault Systemes Simulia Corp
30. Zheng JF, Luo JL, Peng JF, Jin XS (2010) Fretting wear
behaviors of a railway axle steel. Tribol Int 43(5):906–911
31. Bertini L, Santus C (2015) Fretting fatigue tests on shrink-fit
specimens and investigations into the strength enhancement
induced by deep rolling. Int J Fatigue 81:179–190
32. Rajasekaran R, Nowell D (2005) On the finite element analysis of
contacting bodies using submodelling. J Strain Anal Eng Des
40(2):95–106
33. Smith KN, Watson P, Topper TH (1970) A stress-strain function
for the fatigue of metals. J Mater 5(4):767–778
34. Fatemi A, Socie DF (1988) A critical plane approach to multi-
axial fatigue damage including out-of-phase loading. Fatigue
Fract Eng Mater Struct 11(3):149–165
35. Luke M, Burdack M, Moroz S, Varfolomeev I (2016) Experi-
mental and numerical study on crack initiation under fretting
fatigue loading. Int J Fatigue 86:24–33
36. Sum WS, Williams EJ, Leen SB (2005) Finite element, critical-
plane, fatigue life prediction of simple and complex contact
configurations. Int J Fatigue 27(4):403–416
37. Makino T, Kato T, Hirakawa K (2011) Review of the fatigue
damage tolerance of high-speed railway axles in Japan. Eng Fract
Mech 78(5):810–825
38. Wu SC, Xu ZW, Liu YX, Kang GZ, Zhang ZX (2018) On the
residual life assessment of high-speed railway axles due to
induction hardening. Int J Rail Transp 6(4):218–232
39. Mai SH, Gravouil A, Nguyen-Tajan ML, Trolle B (2017)
Numerical simulation of rolling contact fatigue crack growth in
rails with the rail bending and the frictional contact. Eng Fract
Mech 174:196–206
40. Irwin GR (1958) Fracture mechanics, in the book of structural
mechanics. Springer, New York
380 L. Zou et al.
123 Rail. Eng. Science (2020) 28(4):365–381

41. Keisuke T (1974) Fatigue crack propagation from a crack
inclined to the cyclic tensile axis. Eng Fract Mech 6:493–507
42. Richard HA, Buchholz FG, Kullmer G, Schollmann M (2003)
2D- and 3D- mixed mode fracture criteria. Key Eng Mater
251–252:251–260
43. Richard HA, Schramm B, Schirmeisen NH (2014) Cracks on
mixed mode loading—theories, experiments, simulations. Int J
Fatigue 62:93–103
44. Erdogan F, Sih G (1963) On the crack extension in plates under
plane loading and transverse shear. J Basic Eng 85(4):519–525
45. Sajith S, Murthy KSRK, Robi PS (2020) Experimental and
numerical investigation of mixed mode fatigue crack growth
models in aluminum 6061–T6. Int J Fatigue 130:105285
46. Alshoaibi AM, Fageehi YA (2020) 2D finite element simulation
of mixed mode fatigue crack propagation for CTS specimen.
J Mater Res Technol 9(4):7850–7861
47. Richard H, Fulland M, Sander M (2005) Theoretical crack path
prediction. Fatigue Fract Eng Mater Struct 28(1–2):3–12
Experimental and numerical study on fretting wear and fatigue of full-scale railway axles 381
123Rail. Eng. Science (2020) 28(4):365–381