expectations & perceptions on big bazaar
TRANSCRIPT
International Research Journal of Management Sociology & Humanities
ISSN 2277 – 9809 (online) ISSN 2348 - 9359 (Print)
A REFEREED JOURNAL OF
Shri Param Hans Education & Research Foundation Trust
www.IRJMSH.com www.SPHERT.org
Published by iSaRa
IRJMSH Vol 6 Issue 11 [Year 2015] ISSN 2277 – 9809 (0nline) 2348–9359 (Print)
Customer Expectation and Satisfaction: A Case Study of Big Bazaar Retail
Store in Baroda
Mr. Dignesh S. Panchasara Research Scholar,
Department of Commerce and Business Management,
Faculty of Commerce,
The Maharaja Sayajirao University of Baroda.
Abstract
Dr. Umesh R. Dangarwala Head of the Department,
Department of Commerce and Business Management,
Faculty of Commerce,
The Maharaja Sayajirao University of Baroda.
Customer satisfaction always helps to enhance the market share. In consumer
goods industry various parameters are available to judge the satisfaction of
customer towards the product, but in the case of service industry only quality of the
service derives the level of satisfaction. This study attempt to identify the
expectations and satisfactions towards the Big Bazaar store at Baroda with the help
of service quality dimensions. For the purpose of study 100 samples are considered
to pool up the opinions by structured questionnaire. The study results that the
satisfaction level towards Big Bazaar is positive but the expectation level is greater
than as compared to satisfaction level.
Keywords: Service quality dimensions, customer expectation, customer satisfaction, Big Bazaar.
1.1 INTRODUCTION Retail industry provides immense opportunities to entrepreneurs and workforce as sales
people and clerks, the industry also has opportunities for people interested in determining
what goods will be sold, getting these goods to the right place at the right time, and
managing the operations, finances, and administrations of retails companies. Retailing is
such a common part of our everyday lives that we often just take it for granted. Retail
managers make complex decisions in selecting their target markets and retail locations;
determining what merchandise and services to offers; negotiating with suppliers;
distributing merchandise to stores; training and motivating sales associates; and deciding
how to price, promote, and present merchandise. Considerable skill and knowledge are
required to make these decisions effectively. Working in this highly competitive, rapidly
changing environment is both challenging and exciting, and it offers significant financial
rewards. The distribution of finished products begins with the producer and ends at the
ultimate consumer. Between the two of them there is a middle person – the Retailer.
Retailing is defined as a set activities or sell a products or a service to consumers for
their personal or family use. It is responsible for matching individual demands of the
consumer with supplies of all the manufacturers. The word “RETAIL” is derived from
the French word Retaillier, meaning “ to cut a piece of ” or “ to break bulk. ” of t en
International Research Journal of Management Sociology & Humanity ( IRJMSH ) Page 162
www.irjmsh.com

IRJMSH Vol 6 Issue 11 [Year 2015] ISSN 2277 – 9809 (0nline) 2348–9359 (Print)
International Research Journal of Management Sociology & Humanity ( IRJMSH ) www.irjmsh.com
Page 163
people think of retailing only as the sale of products in the stores, but retailing also
involves the sale of services such as overnight loading in a motel, a haircut, a DVD
rental, or a home-delivered pizza. Not all retailing is done in stores. Examples of non-
store retailing in products sales are Flipkart.com, Amazon.com, Snapdeal.com, etc. and
for services Bookmyshow.com, Redbus.com, Justdeal.com, cartrade.com etc.
The world over retail business is dominated by small family-run chains and regionally
targeted store. Gradually more and more markets in the western world are being taken
over by billion-dollar multinational conglomerates, such as Wal-Mart, Sears,
McDonald’s, marks and Spencer, etc. The larger retailer have set up huge
supply/distribution chain, inventory, management systems, financing pacts, and wide-
scale marketing plans which allowed them to provide better services at competitive
prices by achieving economies of scale. In an era of globalization, liberalization, and a
highly aware customer, a retailer is required to make a conscious effort to positon himself
distinctively to face the competition. This is determined to a great extent by the retail mix
strategy followed by a company to sell its products.
1.2 Retail Industry in India: In India, the retail sector is the second largest employer after agriculture. It is highly
fragmented and consists predominantly of small, independent, and owned- managed
shops. Besides, the country is also dotted with low-cost kiosks and pushcarts. There are
some 12 million retail outlets of which nearly 5 million sell food and related products.
Valued at US$511 billion according to leading commercial real estate advisor, C.B.
Richard Ellis’ finding in 2008, the Indian retail market is the fifth largest retail
destination globally. More and more players are venturing into the retail business with
new and attractive formats, such as malls, supermarkets, discount stores, departmental
stores, transforming altogether the traditional bookstores, chemist shops, and furnishing
stores. According to industry estimates, the Indian retail market is estimated to grow from
US$330 billion in 2007 to US$ 427 billion by 2010 and US$637 billion in 2015.
Simultaneously, organized retail which at present accounts for 4 percent of the total
market is likely to increase its share to 22 percent by 2015. The 30 million sq. ft. of
available mall space in India at present is expected to increase to 100 million sq. ft. by
2010, estimates that the number of operational malls will more than double to over 412
with 205 million sq. ft. by 2013, and further 715 malls by 2015 on the back of major
retail developments ever in tier II and tier III cities. At presents 40 percent of malls are
concentrated in the smaller cities.
1.3 The SERVQUAL Model: A customer will be satisfied only when his/her expectations will be met, so in the year
1988 Parasuraman’s et al developed a model to measure the expectation towards any
service, which is named as a SERVQUAL model. In the context of retail service the
model is based on following five dimensions:-
1. Reliability dimension is concerned with the store’s ability to perform the service accurately and dependably.
2. Responsiveness dimension is related with the employees’ willingness to help customers
and provide prompt services.

IRJMSH Vol 6 Issue 11 [Year 2015] ISSN 2277 – 9809 (0nline) 2348–9359 (Print)
International Research Journal of Management Sociology & Humanity ( IRJMSH ) www.irjmsh.com
Page 164
3. Assurance dimension includes Employees’ knowledge, courtesy and their ab ility to inspire trust and confidence.
4. Empathy dimension is related with Caring, individualized attention given to customers or
the ease of access, approachability and effort taken to understand customers’
requirements.
5. Tangibles dimension is all about the appearance of the physical facilities and material relayed at retail outlet.
The difference between the customer’s expectation & satisfactions helps retailer to improve the service which enhances the customers’ satisfaction.
1.4 Big Bazaar:
Big Bazaar is the largest hypermarket chain in India. Mr. Kishore Biyani as its group
CEO and MD, headquartered in Mumbai. Big Bazaar was launched in September, 2001.
With opening of its first four stores in Kolkata, Indore, Bangalore, and Hyderabad.
Currently, there are 214 stores across 90 cities and town in India covering around 16
million sq. ft. of retail space. Big bazaar was launched mainly as a fashion format selling
apparel, cosmetics, accessories and general merchandise. Over the years, the retail chain
has included in its portfolio a wide range of products and services, ranging from grocery
to electronics. In Bangalore city alone, there are 12 branches. Moreover, the customer
friendly ambience and the organized retailing of products also make Big Bazaar one of
the successful retail companies in India. It offers all time discounts and promotional
avenues to its customers.
2.0 REVIEW OF LITERATURES
Dr. Jay Prakash Verma (Jan-2015) found that in Consumer Behaviour for Organized
Retail: A Case Study of Big Bazaar, rise in income of the consumers along with the effect
of modern culture the purchasing power of the people has increased. Shopping has
become more and entertainment than a utility aspect for people. It also reflects that
occupation and income of the consumers has greater impact on the frequent visit of them
to organized retail outlets like big bazaar. Apart from store ambience features like
service, cost and availability of products drag the interest of the consumers that induce
the preference to shop at big bazaar.
Dharmesh Motwani (2014) conclude that (in An Empirical Study of Customer
Expectation and Perception in Organized Retail sector) Service quality is an important
aspect for retailers to know about customers’ satisfaction & SERVQUAL model is the
root way to measure the effectiveness of service quality. In this paper gap has been
identified between expectation & perception of customers towards the organized retail
outlets of Udaipur, which revealed dissatisfaction among customers.
Prof Vineeta Gangal (April 2013) conclude that (in Big Bazaar: A Study of Consumer
Behaviour towards Organized Retail) Big Bazaar is preferred by its patrons for its pricing
strategies followed by variety. One of the major reasons for this is the high proportion of
students and youngsters who are dependent on their parents for their incomes. Big Bazaar
and their close competitors would be maintain status quo on pricing and increase variety
of products, especially in the clothing and food & grocery department, because that is
where the highest amount of sales are happening.”

IRJMSH Vol 6 Issue 11 [Year 2015] ISSN 2277 – 9809 (0nline) 2348–9359 (Print)
International Research Journal of Management Sociology & Humanity ( IRJMSH ) www.irjmsh.com
Page 165
U. Dineshkumar, P.Vikkraman (2012) found in their study that “organized retail outlets
provide better quality of service, product range as compared to the unorganized retail
outlets. Most of the customers are satisfied with the quality of service provided by the
organized retail outlets.”
Kumar.R & Barani (2012) said that “service quality has long been accepted as the most
basic marketing tool for retailers to differentia te their retail offers, create competitive
advantage and to enhance the customers’ shopping experience. Nonetheless, maintaining
excellent service quality within the stores is no simple task”
Azhagan & Nagarajan (2011) analysed that “most of the customers prefer Organized
Retail sector because of more Tangibles and Empathy towards its customers. In order to
retain and attract new customers, the organized retail sector should improve customer’s
service level and should provide assurance towards its customer.”
3.1 RESEARCH METHODOLOGY
3.2 Objectives of the Research Study: i. To study the consumer expectations and satisfactions of Big Bazaar Store in Baroda.
ii. To learn and understand the important factors of the satisfying consumers.
iii. To check the significance of difference between customer’s expectations and
satisfactions.
iv. To suggest measures for improving the quality and efficiency of Big Bazaar Store.
3.3 Sources of Information: The research was made by use of both Primary Data as well as Secondary Data. The
primary data was collected from the customers of the Big Bazaar. The secondary data
was collected from publishing by search engine, newspapers, books, magazines, journals,
websites and other relevant information.
3.4 Scope of the Research Study: This research study provides suggestions on improving the standard, services and quality
of the Big Bazaar Store. This research study helps to understand the Consumers
expectations and satisfactions towards Big Bazaar services. The study aims on buying
decisions selected respondents from the consumer of Big Bazaar in Selected city called
Baroda.
3.5 Sample Size & Research Design:
The data is obtained from the customer survey. The survey is carried out in Big Bazaar store located at Baroda and a sample size of this study was 100 respondents from the population selected randomly.
4.0 DATA ANALYSIS
4.1 Demographic Profile of Respondents Table-1
Particulars Classifications Frequency Percentage
Gender
Male 54 54
Female 46 46
15-25 37 37

IRJMSH Vol 6 Issue 11 [Year 2015] ISSN 2277 – 9809 (0nline) 2348–9359 (Print)
International Research Journal of Management Sociology & Humanity ( IRJMSH ) www.irjmsh.com
Page 166
Age Group
26-35 18 18
36-45 28 28
46-55 13 13
56 & Above 4 4
Marital Status
Married 59 59
Unmarried 41 41
Types of
Family
Nuclear Family 57 57
Joint Family 43 43
Occupations
Student 33 33
Housewife 19 19
Self-employed 25 25
Salaried 23 23
Others 0 0
Number of
Earning Person
in Family
One 43 43
Two 29 29
Three 16 16
Four 7 7
Five & More 5 5
Avg. Annual
Income
Up to 1lac 10 10
1 Lac to 2 Lac 21 21
2 Lac to 3 Lac 24 24
3 Lac to 4 Lac 15 15
4 Lac & above 30 30
(Source: Primary Data) Interpretation:
As per shown in above table demographic profile of respondents were classified
according to their gender, age group, marital status, types of the family, occupations,
number of earning person in family and average annual income. Out of total 100
respondents 54% are male and rests are female. As categorised by age group 28% are
comes from 36-45 age group. Majority of respondents are married (59%) and 57%
respondents belongs to nuclear family. The table shows that the 33% of the respondents
are students, 19% of the respondents are the housewives, 25% are the self-employed and
rest of the 23% respondents are salaried. Most of the families had only one earning
person, its 43% of the total respondents. 24% of the total respondents earn yearly 2 Lac to
3 Lac.
4.2 Buying Behaviour of Respondents
Table-2 Particulars Classifications Frequency Percentage
Influence of
Buying
Decision
Yourself 49 49
Spouse 14 14
Children 13 13
Parents 24 24
Others 0 0
Visiting Time
Once 21 21
Twice 13 13
Three 3 3
IRJMSH Vol 6 Issue 11 [Year 2015] ISSN 2277 – 9809 (0nline) 2348–9359 (Print)
International Research Journal of Management Sociology & Humanity ( IRJMSH ) www.irjmsh.com
Page 167
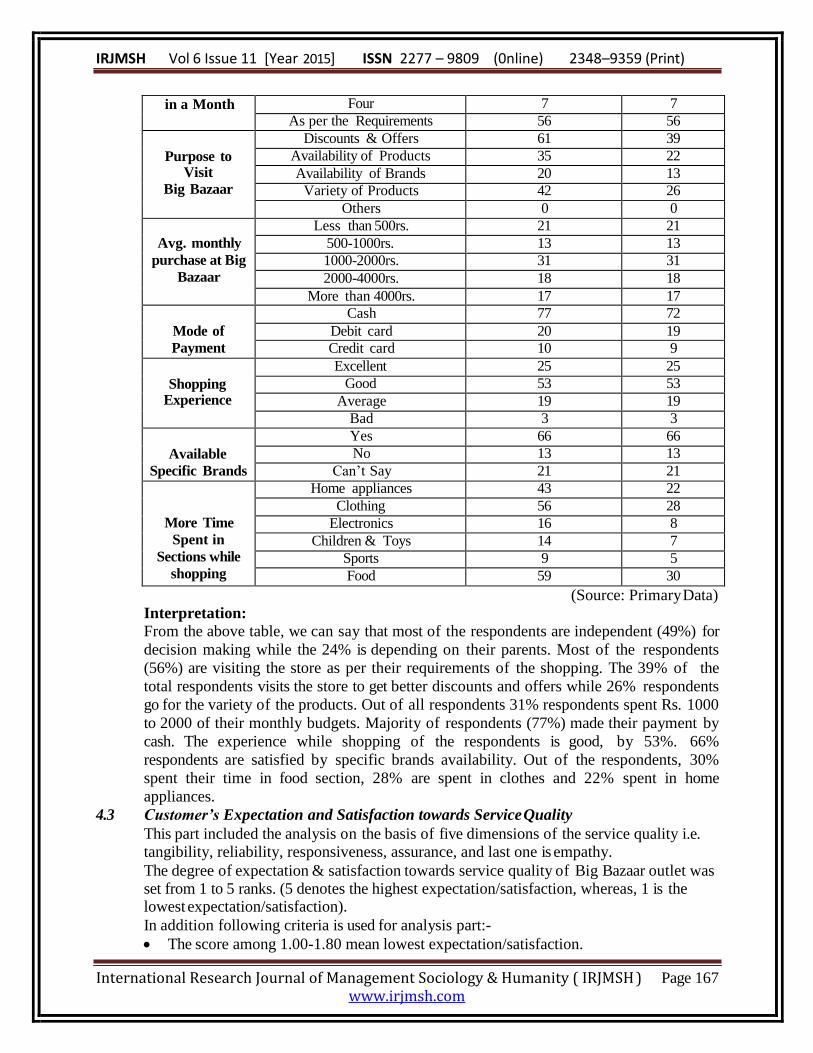
in a Month Four 7 7
As per the Requirements 56 56
Purpose to
Visit
Big Bazaar
Discounts & Offers 61 39
Availability of Products 35 22
Availability of Brands 20 13
Variety of Products 42 26
Others 0 0
Avg. monthly
purchase at Big
Bazaar
Less than 500rs. 21 21
500-1000rs. 13 13
1000-2000rs. 31 31
2000-4000rs. 18 18
More than 4000rs. 17 17
Mode of
Payment
Cash 77 72
Debit card 20 19
Credit card 10 9
Shopping
Experience
Excellent 25 25
Good 53 53
Average 19 19
Bad 3 3
Available
Specific Brands
Yes 66 66
No 13 13
Can’t Say 21 21
More Time
Spent in
Sections while
shopping
Home appliances 43 22
Clothing 56 28
Electronics 16 8
Children & Toys 14 7
Sports 9 5
Food 59 30
(Source: Primary Data) Interpretation: From the above table, we can say that most of the respondents are independent (49%) for
decision making while the 24% is depending on their parents. Most of the respondents
(56%) are visiting the store as per their requirements of the shopping. The 39% of the
total respondents visits the store to get better discounts and offers while 26% respondents
go for the variety of the products. Out of all respondents 31% respondents spent Rs. 1000
to 2000 of their monthly budgets. Majority of respondents (77%) made their payment by
cash. The experience while shopping of the respondents is good, by 53%. 66%
respondents are satisfied by specific brands availability. Out of the respondents, 30%
spent their time in food section, 28% are spent in clothes and 22% spent in home
appliances.
4.3 Customer’s Expectation and Satisfaction towards Service Quality
This part included the analysis on the basis of five dimensions of the service quality i.e. tangibility, reliability, responsiveness, assurance, and last one is empathy.
The degree of expectation & satisfaction towards service quality of Big Bazaar outlet was set from 1 to 5 ranks. (5 denotes the highest expectation/satisfaction, whereas, 1 is the lowest expectation/satisfaction).
In addition following criteria is used for analysis part:-
The score among 1.00-1.80 mean lowest expectation/satisfaction.
IRJMSH Vol 6 Issue 11 [Year 2015] ISSN 2277 – 9809 (0nline) 2348–9359 (Print)
International Research Journal of Management Sociology & Humanity ( IRJMSH ) www.irjmsh.com
Page 168
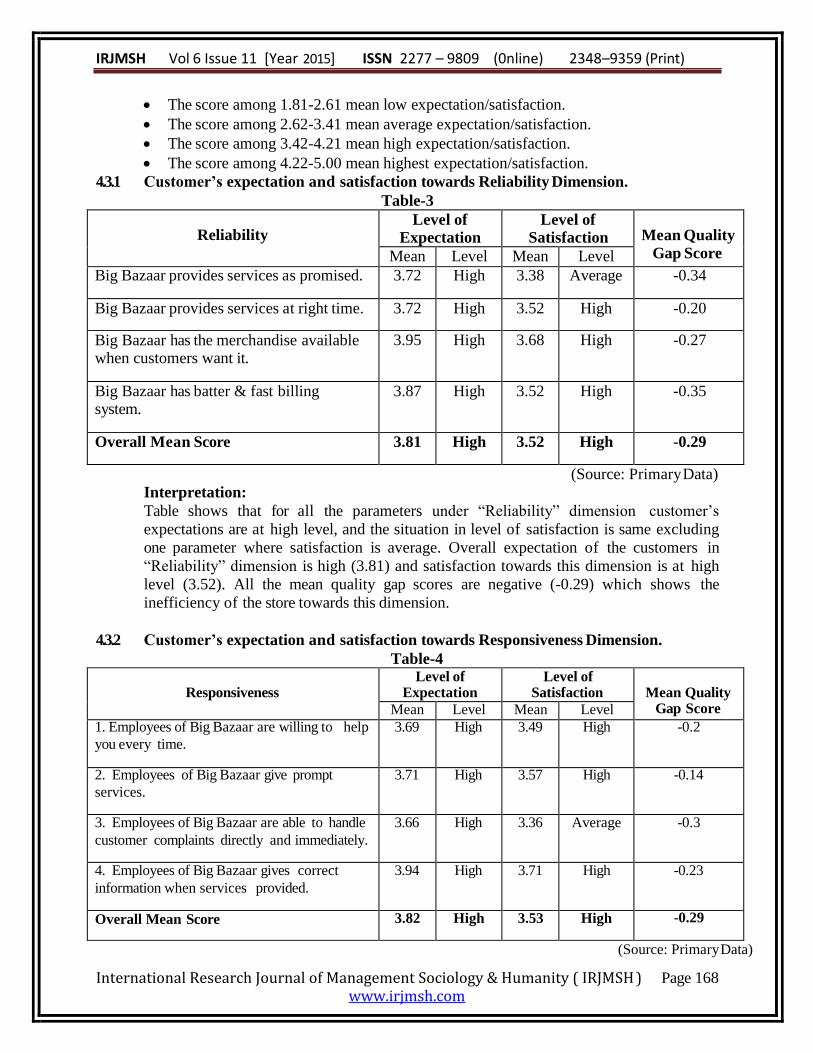
The score among 1.81-2.61 mean low expectation/satisfaction.
The score among 2.62-3.41 mean average expectation/satisfaction.
The score among 3.42-4.21 mean high expectation/satisfaction.
The score among 4.22-5.00 mean highest expectation/satisfaction.
4.3.1 Customer’s expectation and satisfaction towards Reliability Dimension.
Table-3
Reliability Level of
Expectation Level of
Satisfaction
Mean Quality
Gap Score Mean Level Mean Level
Big Bazaar provides services as promised. 3.72 High 3.38 Average -0.34
Big Bazaar provides services at right time. 3.72 High 3.52 High -0.20
Big Bazaar has the merchandise available when customers want it.
3.95 High 3.68 High -0.27
Big Bazaar has batter & fast billing system.
3.87 High 3.52 High -0.35
Overall Mean Score 3.81 High 3.52 High -0.29
(Source: Primary Data)
Interpretation:
Table shows that for all the parameters under “Reliability” dimension customer’s
expectations are at high level, and the situation in level of satisfaction is same excluding
one parameter where satisfaction is average. Overall expectation of the customers in
“Reliability” dimension is high (3.81) and satisfaction towards this dimension is at high
level (3.52). All the mean quality gap scores are negative (-0.29) which shows the
inefficiency of the store towards this dimension.
4.3.2 Customer’s expectation and satisfaction towards Responsiveness Dimension.
Table-4
Responsiveness Level of
Expectation Level of
Satisfaction
Mean Quality Gap Score Mean Level Mean Level
1. Employees of Big Bazaar are willing to help
you every time.
3.69 High 3.49 High -0.2
2. Employees of Big Bazaar give prompt
services.
3.71 High 3.57 High -0.14
3. Employees of Big Bazaar are able to handle
customer complaints directly and immediately.
3.66 High 3.36 Average -0.3
4. Employees of Big Bazaar gives correct
information when services provided.
3.94 High 3.71 High -0.23
Overall Mean Score 3.82 High 3.53 High -0.29
(Source: Primary Data)
IRJMSH Vol 6 Issue 11 [Year 2015] ISSN 2277 – 9809 (0nline) 2348–9359 (Print)
International Research Journal of Management Sociology & Humanity ( IRJMSH ) www.irjmsh.com
Page 169
Interpretation:
From the above table it is clear for all parameters under “Responsiveness” dimension
customers expectations are at high level and the satisfaction level is also at high level
excluding only one parameter. Overall the customers’ expectation and satisfaction is at
high level i.e. 3.82 and 3.53 respectively. The overall mean quality gap score is -0.29, and
all the parameters under this dimension are negative. It shows that the overall expectation
is high as compare to satisfaction level.
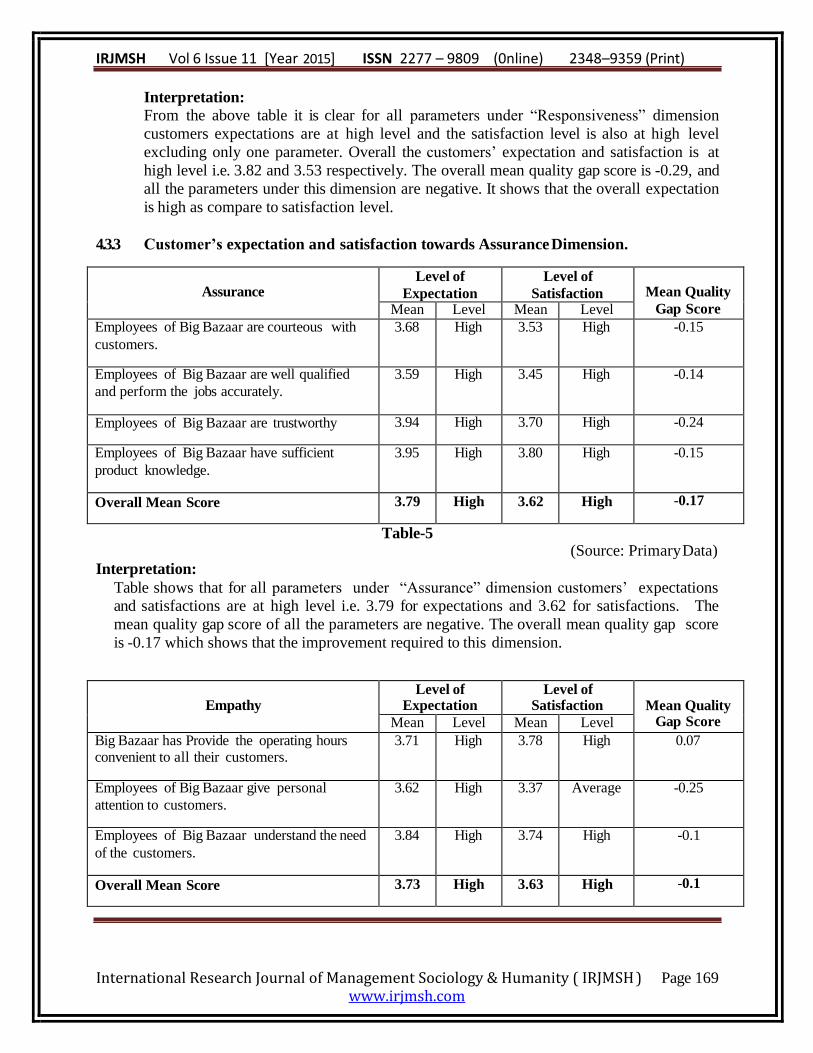
4.3.3 Customer’s expectation and satisfaction towards Assurance Dimension.
Assurance Level of
Expectation
Level of
Satisfaction
Mean Quality
Gap Score Mean Level Mean Level
Employees of Big Bazaar are courteous with
customers.
3.68 High 3.53 High -0.15
Employees of Big Bazaar are well qualified
and perform the jobs accurately.
3.59 High 3.45 High -0.14
Employees of Big Bazaar are trustworthy 3.94 High 3.70 High -0.24
Employees of Big Bazaar have sufficient
product knowledge.
3.95 High 3.80 High -0.15
Overall Mean Score 3.79 High 3.62 High -0.17
Interpretation:
Table-5
(Source: Primary Data)
Table shows that for all parameters under “Assurance” dimension customers’ expectations
and satisfactions are at high level i.e. 3.79 for expectations and 3.62 for satisfactions. The
mean quality gap score of all the parameters are negative. The overall mean quality gap score
is -0.17 which shows that the improvement required to this dimension.
Empathy Level of
Expectation Level of
Satisfaction
Mean Quality Gap Score Mean Level Mean Level
Big Bazaar has Provide the operating hours convenient to all their customers.
3.71 High 3.78 High 0.07
Employees of Big Bazaar give personal
attention to customers.
3.62 High 3.37 Average -0.25
Employees of Big Bazaar understand the need
of the customers.
3.84 High 3.74 High -0.1
Overall Mean Score 3.73 High 3.63 High -0.1
IRJMSH Vol 6 Issue 11 [Year 2015] ISSN 2277 – 9809 (0nline) 2348–9359 (Print)
International Research Journal of Management Sociology & Humanity ( IRJMSH ) www.irjmsh.com
Page 170
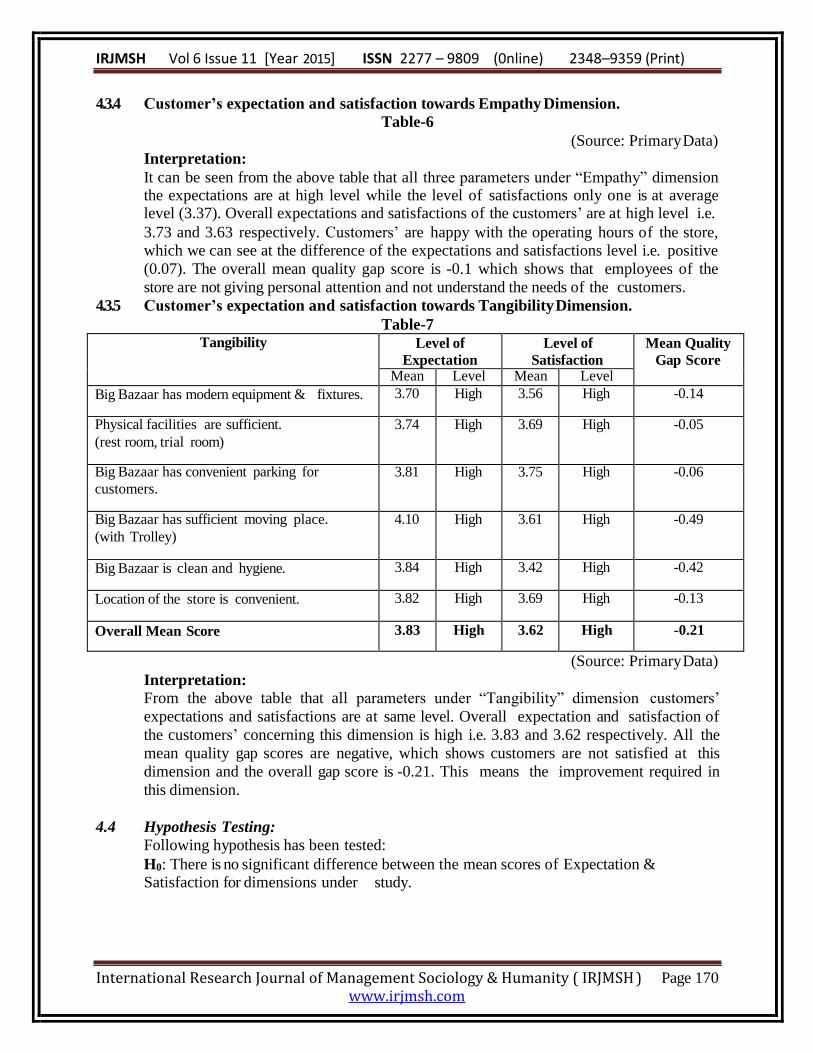
4.3.4 Customer’s expectation and satisfaction towards Empathy Dimension.
Table-6
(Source: Primary Data) Interpretation:
It can be seen from the above table that all three parameters under “Empathy” dimension the expectations are at high level while the level of satisfactions only one is at average level (3.37). Overall expectations and satisfactions of the customers’ are at high level i.e.
3.73 and 3.63 respectively. Customers’ are happy with the operating hours of the store,
which we can see at the difference of the expectations and satisfactions level i.e. positive
(0.07). The overall mean quality gap score is -0.1 which shows that employees of the
store are not giving personal attention and not understand the needs of the customers.
4.3.5 Customer’s expectation and satisfaction towards Tangibility Dimension.
Table-7 Tangibility Level of
Expectation
Level of
Satisfaction
Mean Quality
Gap Score Mean Level Mean Level
Big Bazaar has modern equipment & fixtures. 3.70 High 3.56 High -0.14
Physical facilities are sufficient.
(rest room, trial room)
3.74 High 3.69 High -0.05
Big Bazaar has convenient parking for
customers.
3.81 High 3.75 High -0.06
Big Bazaar has sufficient moving place.
(with Trolley)
4.10 High 3.61 High -0.49
Big Bazaar is clean and hygiene. 3.84 High 3.42 High -0.42
Location of the store is convenient. 3.82 High 3.69 High -0.13
Overall Mean Score 3.83 High 3.62 High -0.21
(Source: Primary Data)
Interpretation: From the above table that all parameters under “Tangibility” dimension customers’
expectations and satisfactions are at same level. Overall expectation and satisfaction of
the customers’ concerning this dimension is high i.e. 3.83 and 3.62 respectively. All the
mean quality gap scores are negative, which shows customers are not satisfied at this
dimension and the overall gap score is -0.21. This means the improvement required in
this dimension.
4.4 Hypothesis Testing:
Following hypothesis has been tested:
H0: There is no significant difference between the mean scores of Expectation & Satisfaction for dimensions under study.

IRJMSH Vol 6 Issue 11 [Year 2015] ISSN 2277 – 9809 (0nline) 2348–9359 (Print)
International Research Journal of Management Sociology & Humanity ( IRJMSH ) www.irjmsh.com
Page 171
Table-8
Attributes Mean X2
Value Table Value
Reliability
Expectation 3.81
0.992
32.0
Satisfaction 3.52
Responsiveness
Expectation 3.82
Satisfaction 3.53
Assurance
Expectation 3.79
Satisfaction 3.62
Empathy Expectation 3.73
Satisfaction 3.63
Tangibility Expectation 3.83
Satisfaction 3.62
(Level of significance is 5%) (Source: Primary Data)
Table shows that calculated value of chi-square test is less than the tabulated value, hence null hypothesis is accepted, which proves that there is no significant difference between the mean score of the Expectation & Satisfaction for dimensions under study.
5.0 SUGGESTIONS
The Big Bazaar store of Baroda can take following actions to improve the Satisfaction
level of the customers.
Employees are not willing to help customers, and courtesy to provide promised services,
it is advised to train them to make them positive in their attitude towards customers.
Employees of the store should try to give personal attention to customers.
Availability of physical facilities should be improved.
Big Bazaar store should provide large parking space for its customers so that they can
easily park their vehicles. The parking place nowadays is most attractive element.
6.0 CONCLUSION Customer satisfaction is secret code for the success in business, therefore in this study the
researcher analyses satisfaction level of each dimension. Thus, though customer
satisfaction does not guarantee repurchase on the part of the customers but still it plays a
very important part in ensuring customer loyalty and retention. Therefore, organizations
should always strive to ensure that their customers are very satisfied. And this study it is
founded that the customers are not satisfied as customers expected. In this paper the gap
has been identified between expectation and satisfaction towards Big Bazaar store. The
gap can be easily removed by improving the service quality.
------------
References:
1. Dr. Jay Prakash Verma. (2015), consumer behaviour for organized retail: a case study of big bazaar,
International Journal of Interdisciplinary Research (ISSN: 2348 -6775) Vol. 2 Issue 1. Jan 2015 pp 29-
33.
2. Dharmesh Motwani. (2014), an empirical study of customer expectation and perception in organised
retail sector, National monthly journal of research in commerce and management (ISSN: 2277-1166)
Vol. 2 Issue 3. Jan 2013 pp 144-153.

IRJMSH Vol 6 Issue 11 [Year 2015] ISSN 2277 – 9809 (0nline) 2348–9359 (Print)
International Research Journal of Management Sociology & Humanity ( IRJMSH ) www.irjmsh.com
Page 172
3. Prof Vinita Gangal, Dr A kumar (2013), Big Bazaar: A Study of Consumer Behaviour towards Organized
Retail, Indian Journal of Applied Research (ISSN: 2249-555X) Vol. 3 Issue 4, April 2013 pp 336-338
4. Kumar. R & Dr. G. Barani (2012), Examination of Organized Retailing Service Quality In Attire
Specialty Stores In Bangalore City, India. International Journal of Computing and Business Research
(ISSN: 2229-6166) Vol. 3 Issue 1. Jan 2012 pp 1-15.
5. U. Dineshkumar, P.Vikkraman (2012), Customers’ Satisfaction towards Organized Retail Outlets in
Erode City. IOSR Journal of Business and Management (ISSN: 2278-487X) Volume 3, Issue 4. Oct.
2012, pp 34-40
6. Thirumal Azhagan & Dr. P. S. Nagarajan (2011), Analytical Study On Retail Service Quality Of
Organized Retail Sector In Trichy. Amet Journal of Management, July – Dec 2011, pp 75-83 nd
7. Chetan Bajaj, Rajnish Tuli and Nidhi Ve rma Srivastava (2010); 2
University Press; New Delhi. Websites:
1. www.wikipedia.com
2. www.google.com
3. www.futuregroup.com
4. www.bigbazaar.co m
Edition, Retail Management; Oxford
