quantitative inflation perceptions and expectations … 1 introduction and overview1 since february...
TRANSCRIPT

ISTITUTO DI STUDI E ANALISI ECONOMICA
Quantitative inflation perceptions and expectations of Italian Consumers
by
Marco Malgarini ISAE, piazza dell’Indipendenza, 4, 00185 Roma, Italia
e-mail: [email protected]
Working paper n. 90 January 2008

The Series “Documenti di Lavoro” of the Istituto di Studi e Analisi Economica – Institute for Studies and Economic Analyses (ISAE) hosts the preliminary results of the research projects carried out within ISAE. The diffusion of the papers is subject to the favourable opinion of an anonymous referee, whom we would like to thank. The opinions expressed are merely the Authors’ own and in no way involve the ISAE responsability.
The series is meant for experts and policy-makers with the aim of submitting proposals and raising suggestions and criticism.
La serie “Documenti di Lavoro” dell’Istituto di Studi e Analisi Economica
ospita i risultati preliminari di ricerche predisposte all’interno dell’ISAE: La diffusione delle ricerche è autorizzata previo il parere favorevole di un anonimo esperto della materia che qui si ringrazia. Le opinioni espresse nei “Documenti di Lavoro” riflettono esclusivamente il pensiero degli autori e non impegnano la responsabilità dell’Ente.
La serie è destinata agli esperti e agli operatori di politica economica, al fine di formulare proposte e suscitare suggerimenti o critiche.
Stampato presso la sede dell’Istituto
ISAE - Piazza dell’Indipendenza, 4 – 00185 Roma. Tel. +39-06444821; www.isae.it

ABSTRACT
Since February 2003 ISAE collects quantitative inflation opinions, within its monthly survey on Italian consumers. Data confirms the severe overestimation of inflation already emerged in previous studies. Quantitative replies are in line with more traditional qualitative evaluations, indicating that overestimation is not a sort of random outcome derived from casual answers. A first explanation calls for inadequate knowledge of inflation statistics: however, scarce information does not explain per se overestimation. Indeed, overestimation varies across personal characteristics and it is strongly correlated with assessments on economic conditions, with those being more optimistic generally showing lower inflation opinions. It is possible that given a scarce statistical knowledge consumers attribute to high inflation an “economic distress” mainly determined by slow growth of disposable income and psychological factors linked to socio-economic conditions.
Keywords: inflation expectations, survey data.
JEL codes: D12, D8, E31.
CONTENTS
1 INTRODUCTION AND OVERVIEW ....................................................................... 5
2 THE ISAE CONSUMERS SURVEY ....................................................................... 6
2.1 Survey Design .................................................................................................................... 6
2.2 Qualitative price questions ................................................................................... 7
3 QUANTITATIVE INFLATION PERCEPTIONS ........................................... 9
3.1 Aggregate evaluations ............................................................................................... 9
3.2 Distribution of replies and outliers ............................................................ 10
3.3 Robustness analysis ................................................................................................ 13
4 POSSIBLE EXPLANATIONS OF INFLATION OVERESTIMATION: DESCRIPTIVE EVIDENCE .............................. 17
4.1 Knowledge of official statistics ...................................................................... 17
4.2. Inflation opinions and socio-demographic characteristics of the respondents ........................................................... 19
4.3 Inflation opinions and confidence climate ........................................ 22
5 ECONOMETRIC EVIDENCE ..................................................................................... 24
6 CONCLUSIONS ........................................................................................................................ 28
REFERENCES ..................................................................................................................................... 30

5
1 INTRODUCTION AND OVERVIEW1
Since February 2003 ISAE collects quantitative inflation perceptions and expectations of Italian consumers. The questions are included in the monthly consumer opinion survey and are EU-harmonized by the European Commission-DG ECFIN2. As agreed in various DG-ECFIN meetings, quantitative price questions should obviously not be intended as a proper measure of inflation, alternative to official statistics; they have rather been introduced to convey information about consumers opinions, complementary to those derived from the more usual qualitative measures contained in the EU harmonized survey. The analysis of the results may help to shed more light on the causes of the great gap between actual and perceived inflation, emerging in the aftermath of the euro change over and persisting in some countries (including Italy) for years after the event (see Linden, 2006 and Del Giovane-Sabbatini, 2006). In the following, section 2 provides a methodological introduction to the survey, presenting the aggregate dataset of qualitative inflation assessments and expectations. Section 3 introduces quantitative data and test for their robustness both with respect to possible outliers and to qualitative information. Section 4 looks for possible explanations of inflation misperceptions, checking first for the adequateness of consumers’ knowledge of the true inflation process, as measured by official statistics. However, a scarce knowledge does not explain per se inflation overestimation: we then check for possible linkages between inflation opinions, respondents’ socio-demographic characteristic and their perceptions on the economic situation. Section 5 provides further evidence trying to estimate a descriptive model of individual inflation opinions; section 6 concludes.
1 I wish to thank Paolo Del Giovane, Silvia Fabiani and Roberto Sabbatini at the Bank of Italy for very
fruitful discussion on a preliminary version of the paper. For the section on the probing of the survey question, I am indebted to Heinz-Christian Deinde of the ECB. I am also grateful to Staffan Linden of the European Commission-DG ECFIN and to all the colleagues that participated in the EU Task Force on “Quantitative Inflation Opinions: Effects of probing and alternative question formulation”. I would also like to thank Flora Fullone at ISAE for excellent research assistance throughout the study. All the opinion expressed in the paper, and the remaining errors, are obviously mine.
2 See the DG ECFIN website at: http://europe.eu.int/economy_finance/indicators/business_consumers_surveys/userguide _en.pdf.
See also Malgarini-Margani (2007) for a description of the ISAE survey.

6
2 THE ISAE CONSUMERS SURVEY
2.1 Survey Design
Since 1973 ISAE realize a survey on consumer’s opinion, in the framework of an EU-wide project harmonized by the European Commission. The survey consists of qualitative questions on the economic and personal situation of the consumers. Questions generally allow five possible answers, ranging from strongly positive to strongly negative; results are usually expressed as weighted balances of positive and negative replies. The survey method is via telephone, combined with Computer Assisted Telephone Interviewing (CATI) system; it is based on a monthly sample of 2.000 Italian consumers, changing each month, for a total of 24.000 persons interviewed per year. The sample is extracted from the public telephone book registers and selected on the basis of a two-stage technique: in the first step, it is stratified according to the zone of residence and the size of municipalities (see table 1); the second stage is based on the selection of a specific consumer within the household selected in the first step. This selection is based on quota sampling according to gender (48,5% males, 51,5% females)3.
Tab. 1 The ISAE sample
Size of municipalities Geographic zone <5000 5000-
10000 10001-20000
20001-50000
50001-100000
100001-500000 >=500000
TOTAL
North West 57 23 22 35 19 4 53 214 Center-North 76 59 53 53 25 15 45 325 North-East 70 73 76 46 28 90 0 384 Center 44 41 51 76 49 42 88 391 South 78 59 76 96 82 41 32 465 Islands 35 29 28 51 25 32 22 222 Total 360 285 308 356 228 223 240 2 000
Source: ISAE.
Individual replies are aggregated with a double-weighting system based on
probability and post-stratification weights (see Fullone-Martelli, 2006).
3 Quota sampling ensures that sample size is always equal to the target, thank to the substitution of non
response with other consumers extracted within the same sample selection scheme; according to Fullone-Martelli (2006), the response rate for the survey – calculated as the ratio of total respondents on total contacts - is equal to 66%.
7
Probability weights – i.e., the inverse of the selection probability - are used to
correct for possible selection bias associated with the nature of the reference
list and the size of the family selected; post stratification weights correct for
possible representativity problems stemming, for instance, from the fact that
women are easier to contact then man, or unemployed and retired people than
employee or self-employed.
2.2 Qualitative price questions
The survey contains two specific qualitative questions related to consumers’ perceptions on overall inflation. The first refers to consumers’ assessments on past price developments, the second to consumers’ expectations for the next 12 months:
Q5 How do you think that consumer prices have developed over the last 12
months? They have: + + 1 risen a lot + 2 risen moderately = 3 risen slightly − 4 stayed about the same − − 5 fallen N 9 don't know.
Q6 By comparison with the past 12 months, how do you expect that
consumer prices will develop in the next 12 months? They will: + + 1 increase more rapidly + 2 increase at the same rate = 3 increase at a slower rate − 4 stay about the same − − 5 fall N 9 don't know.
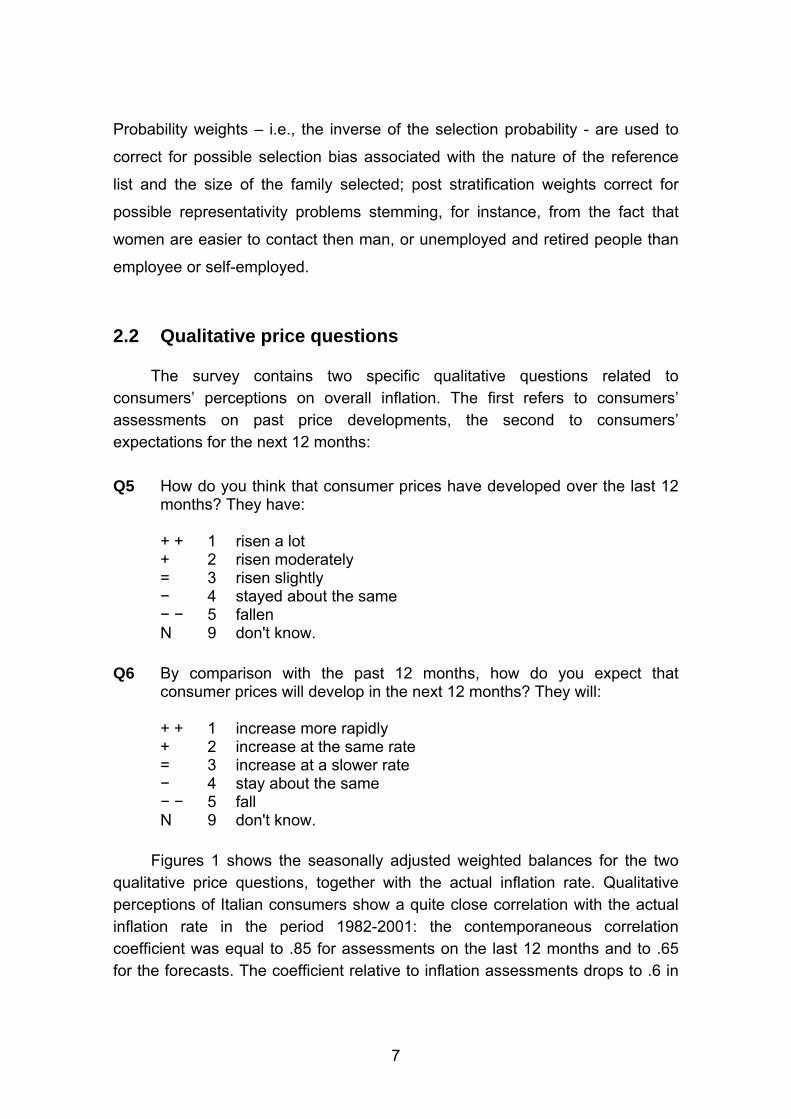
Figures 1 shows the seasonally adjusted weighted balances for the two
qualitative price questions, together with the actual inflation rate. Qualitative perceptions of Italian consumers show a quite close correlation with the actual inflation rate in the period 1982-2001: the contemporaneous correlation coefficient was equal to .85 for assessments on the last 12 months and to .65 for the forecasts. The coefficient relative to inflation assessments drops to .6 in
8
-45
5
55
105
155
205
1983 1984 1986 1987 1989 1990 1992 1993 1995 1996 1998 1999 2001 2002 2004 2005 2007 2008 1
3
5
7
9
11
13
15
17
19
Price trends over the next 12 months Price trends over the last 12 months Inflation rate (rh scale)
the period January 2002-July 2007, whilst that on inflation expectations actually increases to .75 after the introduction of the euro. However, since 2002 both perceptions and expectations are much higher than true outcomes, eventually returning towards pre-change over levels only towards the end of the sample. A persistent gap between actual inflation and consumers opinions may negatively influence real outcomes: high inflation opinions may depress consumption and, on the other hand, stimulate wage and inflation pressures; credibility of monetary policy – and therefore of the ECB - may also be adversely affected, with a possible impact on the perception regarding the introduction of the Euro and more generally the European integration process.
Fig. 1 Price trends over the last and the next 12 months and the actual inflation rate
(weighted balances, seasonally adjusted)
In this sense, a thorough understanding of the reason behind inflation overestimation is not of mere academic interest, representing also a relevant policy concern, especially for monetary authorities. For these reasons, since 2003 the European Commission has stimulated national Institutes participating the Business and Consumers Survey Harmonized Project to include in the traditional consumers opinion survey two new quantitative questions on inflation assessments and expectations.
9
3 QUANTITATIVE INFLATION PERCEPTIONS
3.1 Aggregate evaluations
In February 2003 ISAE introduced two questions asking about the rate of change of consumer prices in the last and the next twelve months: Q51 By how many per cent do you think that consumer prices have gone up/down over
the past 12 months? (Please give a single figure estimate).
Consumer prices have increased by , % / decreased by , %. Q61 By how many per cent do you expect consumer prices to go up/down change in the
next 12 months? (Please give a single figure estimate).
Consumer prices will increase by , % / decreased by , %.
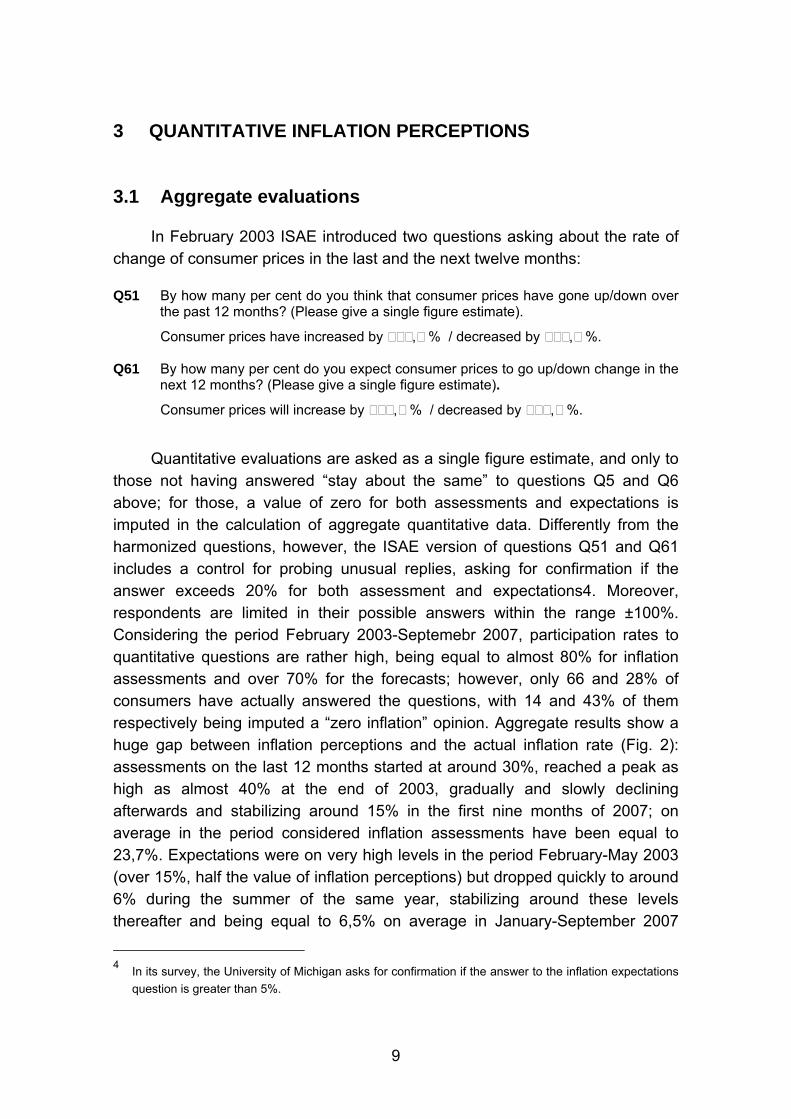
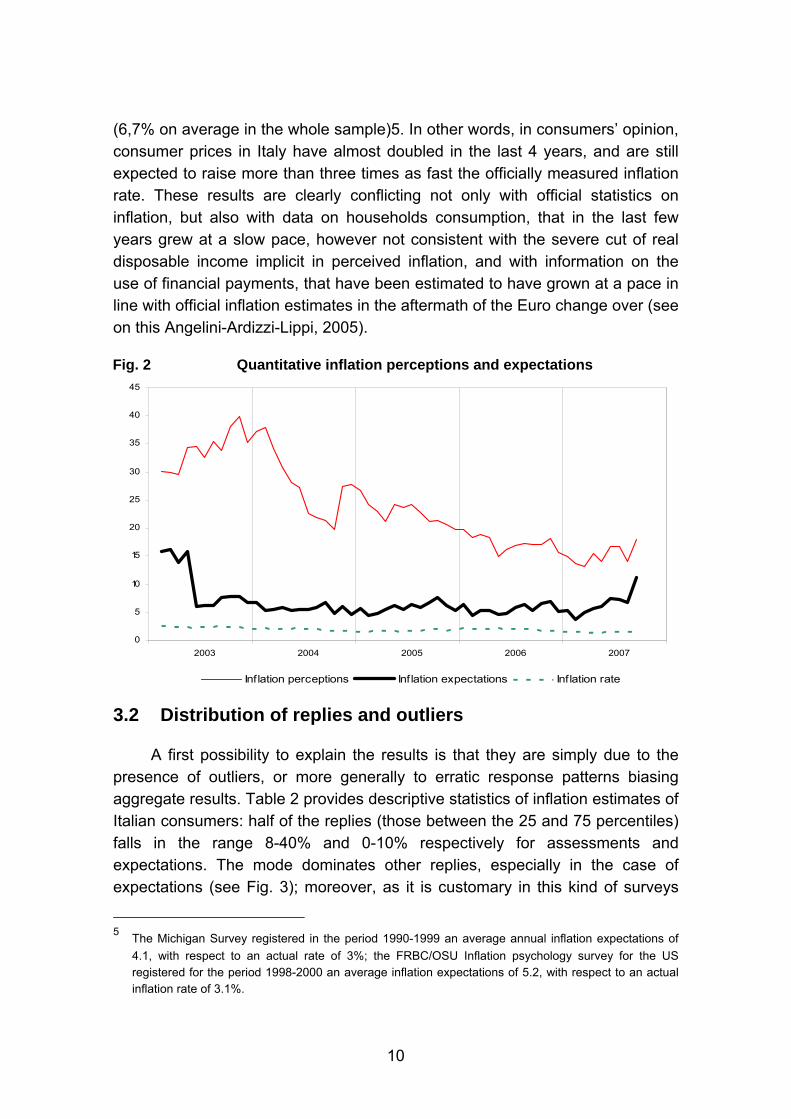
Quantitative evaluations are asked as a single figure estimate, and only to those not having answered “stay about the same” to questions Q5 and Q6 above; for those, a value of zero for both assessments and expectations is imputed in the calculation of aggregate quantitative data. Differently from the harmonized questions, however, the ISAE version of questions Q51 and Q61 includes a control for probing unusual replies, asking for confirmation if the answer exceeds 20% for both assessment and expectations4. Moreover, respondents are limited in their possible answers within the range ±100%. Considering the period February 2003-Septemebr 2007, participation rates to quantitative questions are rather high, being equal to almost 80% for inflation assessments and over 70% for the forecasts; however, only 66 and 28% of consumers have actually answered the questions, with 14 and 43% of them respectively being imputed a “zero inflation” opinion. Aggregate results show a huge gap between inflation perceptions and the actual inflation rate (Fig. 2): assessments on the last 12 months started at around 30%, reached a peak as high as almost 40% at the end of 2003, gradually and slowly declining afterwards and stabilizing around 15% in the first nine months of 2007; on average in the period considered inflation assessments have been equal to 23,7%. Expectations were on very high levels in the period February-May 2003 (over 15%, half the value of inflation perceptions) but dropped quickly to around 6% during the summer of the same year, stabilizing around these levels thereafter and being equal to 6,5% on average in January-September 2007
4 In its survey, the University of Michigan asks for confirmation if the answer to the inflation expectations
question is greater than 5%.
10
0
5
10
15
20
25
30
35
40
45
2003 2004 2005 2006 2007
Inflation perceptions Inflation expectations Inflation rate
(6,7% on average in the whole sample)5. In other words, in consumers’ opinion, consumer prices in Italy have almost doubled in the last 4 years, and are still expected to raise more than three times as fast the officially measured inflation rate. These results are clearly conflicting not only with official statistics on inflation, but also with data on households consumption, that in the last few years grew at a slow pace, however not consistent with the severe cut of real disposable income implicit in perceived inflation, and with information on the use of financial payments, that have been estimated to have grown at a pace in line with official inflation estimates in the aftermath of the Euro change over (see on this Angelini-Ardizzi-Lippi, 2005).
Fig. 2 Quantitative inflation perceptions and expectations
3.2 Distribution of replies and outliers
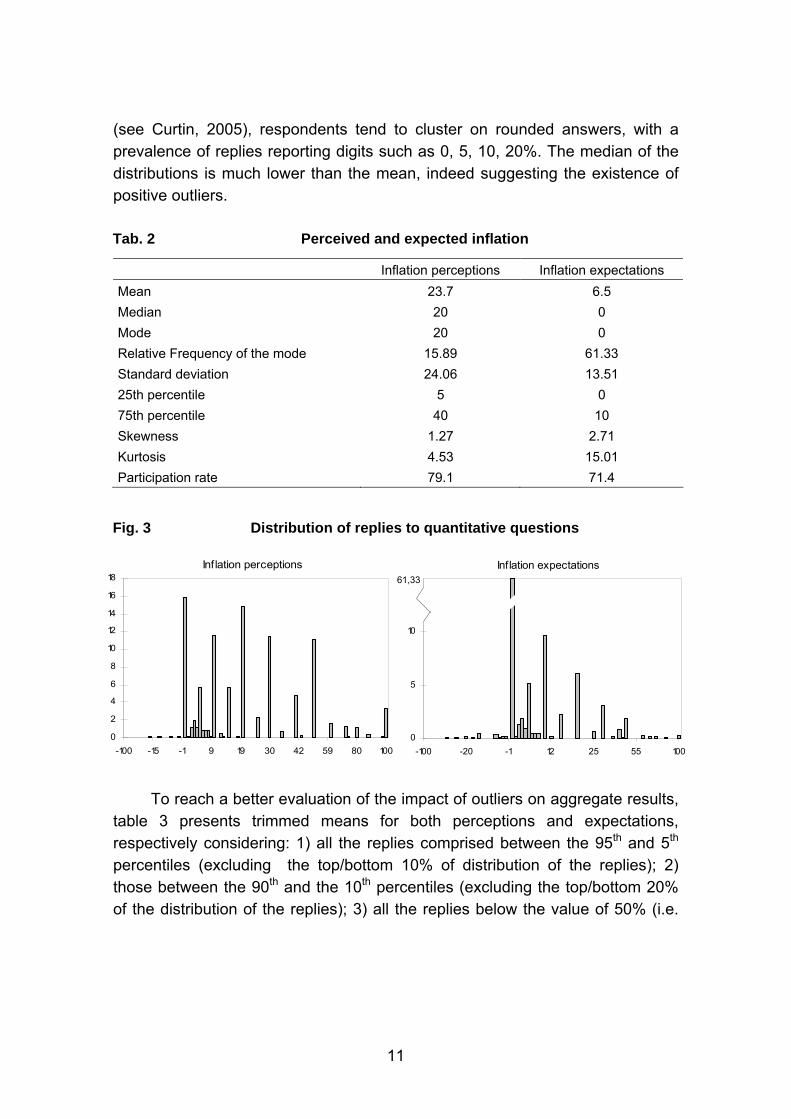
A first possibility to explain the results is that they are simply due to the presence of outliers, or more generally to erratic response patterns biasing aggregate results. Table 2 provides descriptive statistics of inflation estimates of Italian consumers: half of the replies (those between the 25 and 75 percentiles) falls in the range 8-40% and 0-10% respectively for assessments and expectations. The mode dominates other replies, especially in the case of expectations (see Fig. 3); moreover, as it is customary in this kind of surveys
5 The Michigan Survey registered in the period 1990-1999 an average annual inflation expectations of
4.1, with respect to an actual rate of 3%; the FRBC/OSU Inflation psychology survey for the US registered for the period 1998-2000 an average inflation expectations of 5.2, with respect to an actual inflation rate of 3.1%.
11
Inflation expectations
0
5
10
-100 -20 -1 12 25 55 100
Inflation perceptions
0
2
4
6
8
10
12
14
16
18
-100 -15 -1 9 19 30 42 59 80 100
(see Curtin, 2005), respondents tend to cluster on rounded answers, with a prevalence of replies reporting digits such as 0, 5, 10, 20%. The median of the distributions is much lower than the mean, indeed suggesting the existence of positive outliers.
Tab. 2 Perceived and expected inflation
Inflation perceptions Inflation expectations Mean 23.7 6.5 Median 20 0 Mode 20 0 Relative Frequency of the mode 15.89 61.33 Standard deviation 24.06 13.51 25th percentile 5 0 75th percentile 40 10 Skewness 1.27 2.71 Kurtosis 4.53 15.01 Participation rate 79.1 71.4
Fig. 3 Distribution of replies to quantitative questions
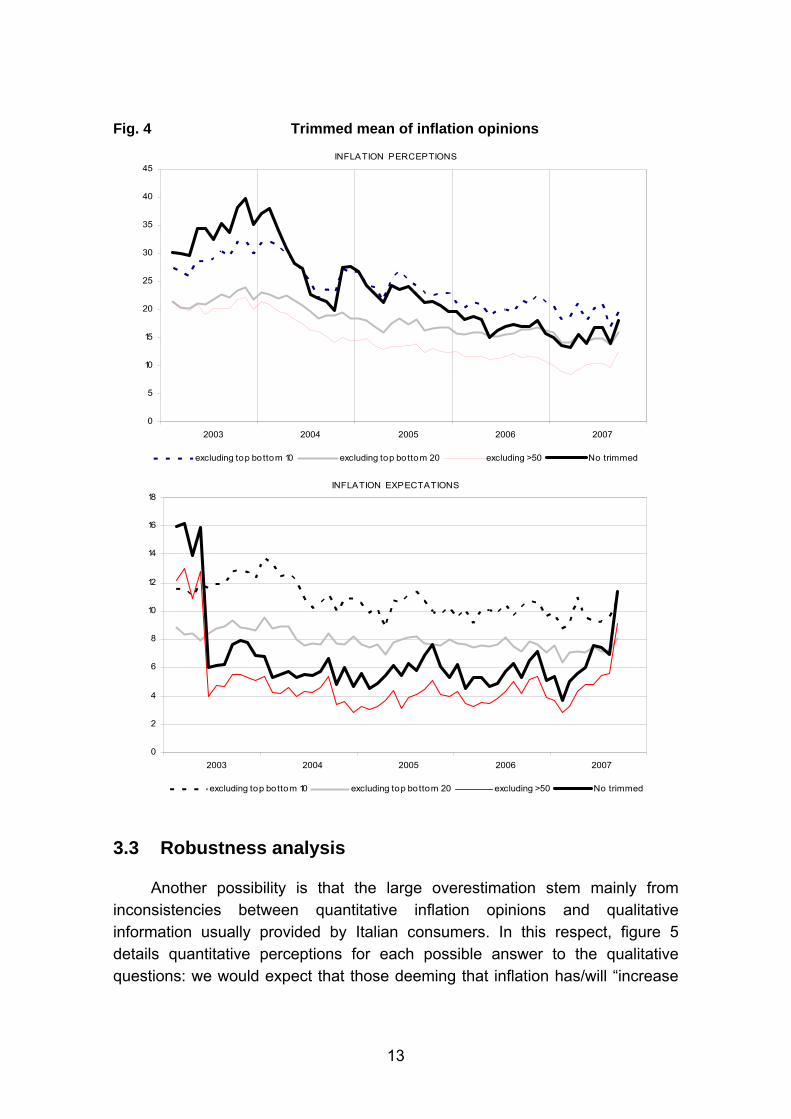
To reach a better evaluation of the impact of outliers on aggregate results, table 3 presents trimmed means for both perceptions and expectations, respectively considering: 1) all the replies comprised between the 95th and 5th percentiles (excluding the top/bottom 10% of distribution of the replies); 2) those between the 90th and the 10th percentiles (excluding the top/bottom 20% of the distribution of the replies); 3) all the replies below the value of 50% (i.e.
61,33

12
excluding inflation perceptions exceeding 50%)6. Trimmed means of inflation opinions are substantially lower only in the first part of the sample (see Fig. 4), however remaining on very high levels, still well above 10% also in the case of removing all the answers exceeding 50% (i.e., asymmetrically removing only the right tail of the distribution).
Tab. 3 Effect of different trimming methods on mean and standard deviation
Inflation perceptions Inflation expectations Trimming method
Mean Std Number of observations Mean Std Number of
observations
Exclude top/bottom 10% of the distribution of replies 25.56 16.93 61,528 10.93 6.27 20,466
Exclude top/bottom 25% of the distribution of replies 18.88 10.79 50,149 8.00 3.75 15,724
Exclude values >50% 15.44 12.38 61,544 4.54 9.25 66,902
Memo: No trimming 24,1 24.27 76,823 6.6 13.61 68,956
Moreover, since 2004 the mean obtained cutting the top/bottom 10% of
replies is even higher than the simple mean (because it is cutting 0 replies), while cutting top/bottom 20% of replies only marginally reduces it. Interestingly, for inflation expectations two-tails symmetric cuts actually increase the sample mean, while excluding the 3% of very extreme answers results in a drop of the results.
6 In the first case, trimmed means for assessments and expectations respectively imply the rejection of
20% and 70% of available observations, while in the second case only the 65 and 23% of observation are retained. When excluding only the right tail of the distribution (i.e. the replies exceeding the value of 50%), 80% of observations are retained for inflation perceptions and 97% for expectations.
13
INFLATION PERCEPTIONS
0
5
10
15
20
25
30
35
40
45
2003 2004 2005 2006 2007
excluding top bottom 10 excluding top bottom 20 excluding >50 No trimmed
INFLATION EXPECTATIONS
0
2
4
6
8
10
12
14
16
18
2003 2004 2005 2006 2007
excluding top bottom 10 excluding top bottom 20 excluding >50 No trimmed
Fig. 4 Trimmed mean of inflation opinions
3.3 Robustness analysis
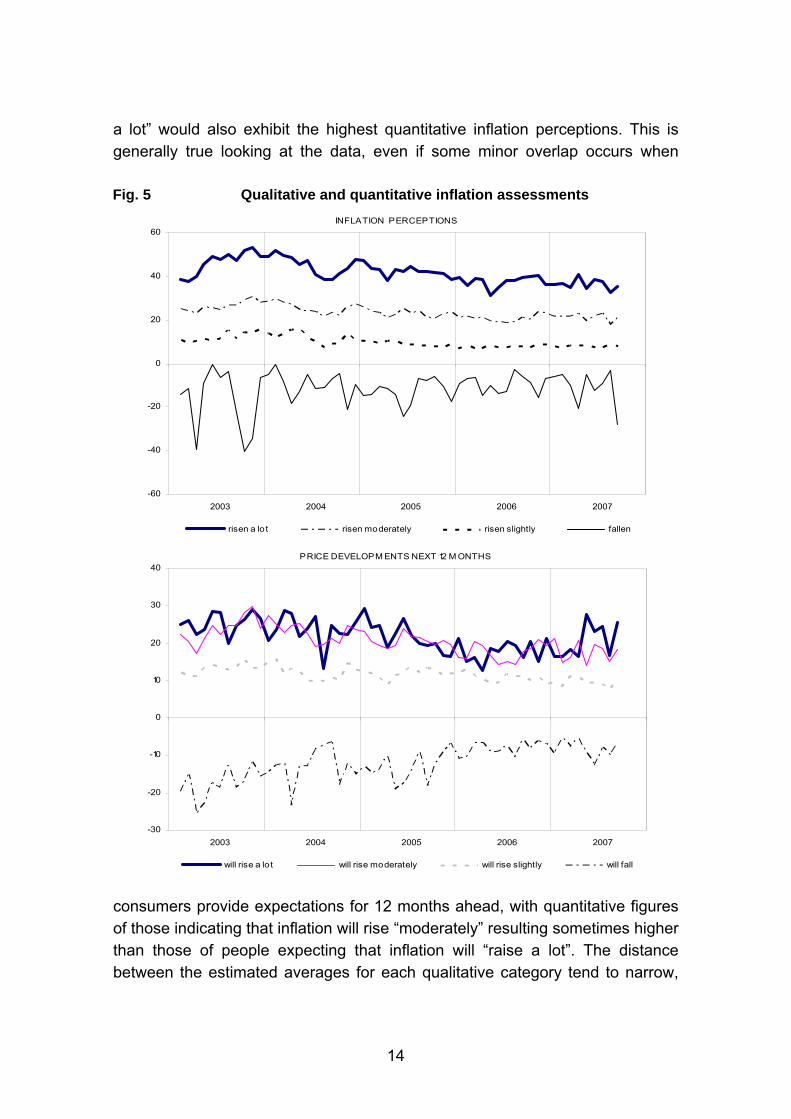
Another possibility is that the large overestimation stem mainly from inconsistencies between quantitative inflation opinions and qualitative information usually provided by Italian consumers. In this respect, figure 5 details quantitative perceptions for each possible answer to the qualitative questions: we would expect that those deeming that inflation has/will “increase
14
INFLATION PERCEPTIONS
-60
-40
-20
0
20
40
60
2003 2004 2005 2006 2007
risen a lo t risen moderately risen slightly fallen
PRICE DEVELOPM ENTS NEXT 12 M ONTHS
-30
-20
-10
0
10
20
30
40
2003 2004 2005 2006 2007
will rise a lot will rise moderately will rise slightly will fall
a lot” would also exhibit the highest quantitative inflation perceptions. This is generally true looking at the data, even if some minor overlap occurs when Fig. 5 Qualitative and quantitative inflation assessments
consumers provide expectations for 12 months ahead, with quantitative figures of those indicating that inflation will rise “moderately” resulting sometimes higher than those of people expecting that inflation will “raise a lot”. The distance between the estimated averages for each qualitative category tend to narrow,
15
with those perceiving/forecasting a high or moderate increase in prices gradually reducing their quantitative estimation comparatively more than those reporting that inflation is or will rise slightly; similarly, those perceiving/expecting a price reduction gradually cut the measure of their estimation of price fall.
These results may be interpreted as evidence that consumers have progressively “learned” to assess inflation development more properly, even if overestimation persists also at the end of the sample. Figure 6 shows also the distribution of quantitative replies for each possible qualitative answer: starting from inflation assessments, the distributions for those thinking that inflation has risen a lot, moderately or slightly are right skewed, with the mean generally greater than the median; similarly, when people replies that inflation will “fall”, they also report on average a decrease of the price level of 13%, lower than the median (equal to -10%, i.e. the distribution is left skewed). Moreover, looking at the interquartile difference (that may be considered as a proxy of the variance), it emerges that people seem to be quite uncertain about their quantitative inflation estimation when they report that the prices have increased a lot or moderately, or decreased, while they show greater convergence when they think that they have risen “slightly”. That their measure of a “slight” increase is on average equal to almost 10% is however quite striking and do confirm the large overestimation of inflation by Italian consumers in the period considered. Similar results are found for the forecasts.
In summary, we conclude that the large overestimation of the inflation rate is not related to few outliers in the distribution of replies: overestimation is in other words a widespread perception of Italian consumers; moreover, quantitative results are broadly consistent with qualitative data. Overall, quantitative questions seem therefore to provide a quite correct representation of consumers’ opinions about inflation developments.

16
(a) Price level=risen a lo t
0
5
10
15
20
25
30
1 5 9 13 17 22 27 33 39 48 58 66 75 88 95 100
(c) Price level = risen slightly
0
5
10
15
20
25
30
35
1 5 9 13 17 25 45 60 100
(d) Price level = fallen
0
5
10
15
20
25
-100 -45 -23 -10 -5 -1
(b) Price level= will increase at the same rate
0
5
10
15
20
25
1 6 11 17 23 40 60 85 100
(b) Price level=risen moderately
0
5
10
15
20
25
30
1 5 9 13 17 22 27 32 37 48 55 70 85 100
(a) Price level= will increase more rapidly
0
5
10
15
20
25
1 4 7 10 13 17 21 32 37 50 60 75 90 100
(c) Price level= will increase at a slower rate
0
5
10
15
20
25
1 5 9 13 18 23 35 51 70 89 100
(d) Price level= will fall
0
5
10
15
20
25
30
-100 -90 -70 -55 -40 -30 -23 -18 -12 -9 -7 -5 -3 -1
Fig. 6 Distribution of replies conditioned on the correspondent qualitative answers
Perceptions
Expectations
17
4 POSSIBLE EXPLANATIONS OF INFLATION OVERESTIMATION: DESCRIPTIVE EVIDENCE
Quantitative data are a correct representation of consumers’ opinions and may therefore be carefully studied to reach a better inside into the opinion formation process7. In the following, I will concentrate on three possible explanations of inflation overestimation, respectively associated with a less than adequate knowledge of inflation statistics, psychological motives possibly linked to socio-demographic characteristics and economic and financial conditions of the respondents.
4.1 Knowledge
Inflation overestimation may be first of all linked to an inadequate knowledge of official data. Consumers may be simply unaware of official statistics provided by ISTAT, or they may have problems in correcting remembering past prices8, or ignore the exact meaning of the “consumer price” concept as measured by official statistical agencies. Moreover, it is even possible that they may experience problems with the basic statistical concept of “inflation”, intended as the percentage variation of the price of some basket of goods with respect to 12 months before. In order to reach a deeper understanding of these issues, ISAE has run three extra questions, respectively asking the consumers the current level of the official inflation rate and their interpretation of the concepts of “consumer prices” and “price stability”. The three questions are the following:
1. On the basis of ISTAT recent calculation, what is today the annual inflation rate in Italy?
2. In your evaluation of consumers prices in the last and for the next 12 months, you have considered the prices of:
a. Only the products of daily use, such as food, transportation, leisure expenditures, house bills
7 In the US quantitative data have been used to study inflation opinions by Bryan-Venkatu (2001a,
2001b); recently quantitative data have been used to study inflation opinions also in Europe, see Linden (2006) and Del Giovane-Fabiani-Sabbatini (2007).
8 See Gaiotti-Lippi (2004) with reference to price of restaurants and Del Giovane-Rossi Arnaud (2007) for the memory of cinema prices before the change over.
18
b. Also the products acquired on a seasonal basis (clothes, travel) c. Also the products acquired on a irregular basis, such as cars,
durables 3. (Only to those having answered that inflation “has been/will be stable”, i.e.
answers 5.4 and 6.4 above) So, in your opinion consumer prices have (will) in the last (next) 12 months:
d. Been (will be) on the same level as now e. Risen (will rise) at the same pace as now
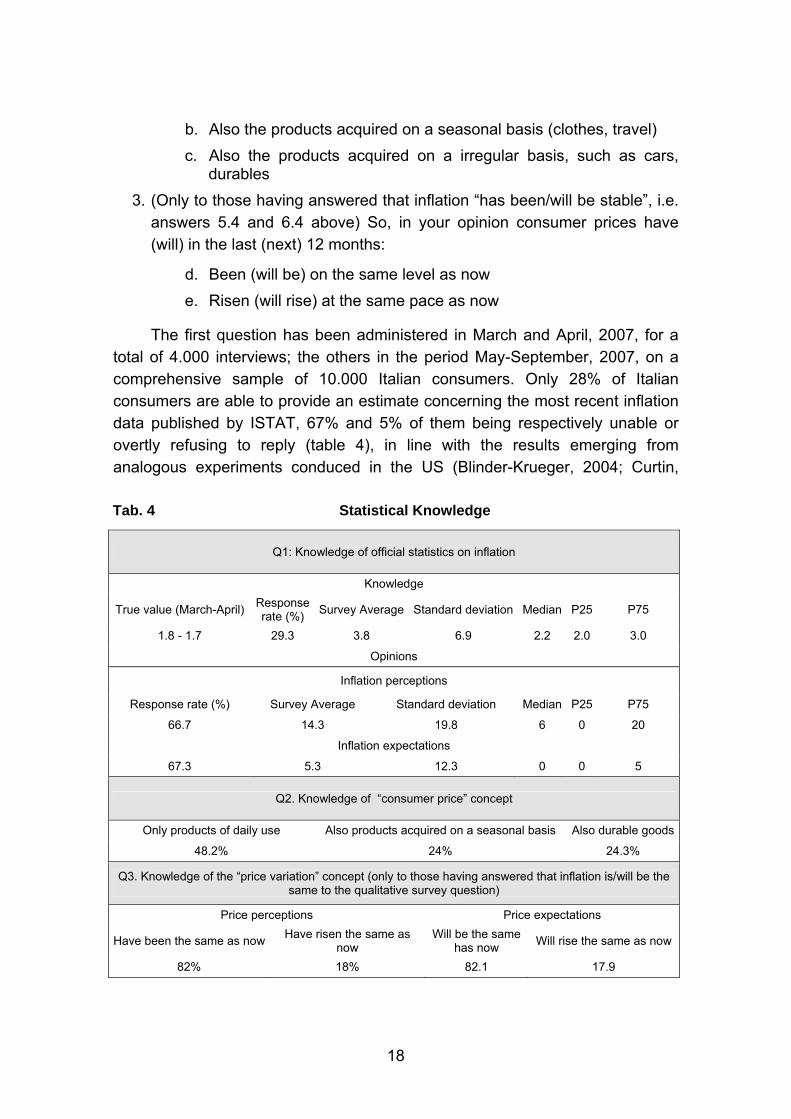
The first question has been administered in March and April, 2007, for a total of 4.000 interviews; the others in the period May-September, 2007, on a comprehensive sample of 10.000 Italian consumers. Only 28% of Italian consumers are able to provide an estimate concerning the most recent inflation data published by ISTAT, 67% and 5% of them being respectively unable or overtly refusing to reply (table 4), in line with the results emerging from analogous experiments conduced in the US (Blinder-Krueger, 2004; Curtin, Tab. 4 Statistical Knowledge
Q1: Knowledge of official statistics on inflation
Knowledge
True value (March-April) Response rate (%) Survey Average Standard deviation Median P25 P75
1.8 - 1.7 29.3 3.8 6.9 2.2 2.0 3.0
Opinions
Inflation perceptions
Response rate (%) Survey Average Standard deviation Median P25 P75
66.7 14.3 19.8 6 0 20
Inflation expectations
67.3 5.3 12.3 0 0 5
Q2. Knowledge of “consumer price” concept
Only products of daily use Also products acquired on a seasonal basis Also durable goods
48.2% 24% 24.3%
Q3. Knowledge of the “price variation” concept (only to those having answered that inflation is/will be the same to the qualitative survey question)
Price perceptions Price expectations
Have been the same as now Have risen the same as now
Will be the same has now Will rise the same as now
82% 18% 82.1 17.9
19
2007) and in the EU (Papacostas, 2007)9. Those able to reply are capable of providing a reasonably good estimation of official data, with a median estimation of the inflation rate equal to 2.2%; the mean of the distribution is higher (3.8%), confirming that the median is a better estimator due to a left-Skewness of answers distribution. In the same months the median inflation perception (both retrospective and in terms of forecasts) is much higher than the official data. Italian consumers also appear to be not fully aware of the exact definition of inflation: almost ¾ of them think that the basket of goods considered for the calculation does not include durables, and another 24% does not even consider “seasonal” purchases, basing their opinions solely on the evolution of prices for goods acquired on a daily basis (a residual 3.5% of the population is not able to provide an answer to that question). Finally, consumers also show a degree of basic statistical illiteracy, with almost 20% of those having answered that prices “stay (or will stay) about the same” actually considering that they “have risen (or will rise) at the same pace as now”, i.e. considering a concept of inflation stability rather than of price stability.
These results seem to suggest some form of irrationality of consumers that would be incapable of using information available on the market at a low cost in order to form their own opinion about inflation. Alternatively, Curtin (2007) has recently interpreted existing evidence of an inadequate knowledge of economic data as a form of “rational inattention”: according to Curtin, aggregate inflation statistics have both low cost and low returns in terms of information content, basically because they provide a far too aggregate representation of economic reality. In this sense it would be rational for consumers to be “inattentive” of official statistics, provided they do not supply information sufficiently close to their own specific situation. However, a less than adequate knowledge of official data does not imply per se inflation overestimation: it would be well possible that, without knowing official statistics, consumers would eventually converge towards an opinion close to the true inflation rate, or even lower than that.
4.2 Inflation opinions and socio-demographic characteristics
Del Giovane-Sabbatini (2006) have shown that in the period of the changeover a large number of prices have indeed changed, going in both directions, up and down: if for some reason some group of consumers has perceived an increase in the price level but not its decrease, this may contribute
9 See Fullone- Gamba-Giovannini-Malgarini (2007) for a full description of the ISAE survey on statistical
knowledge.
20
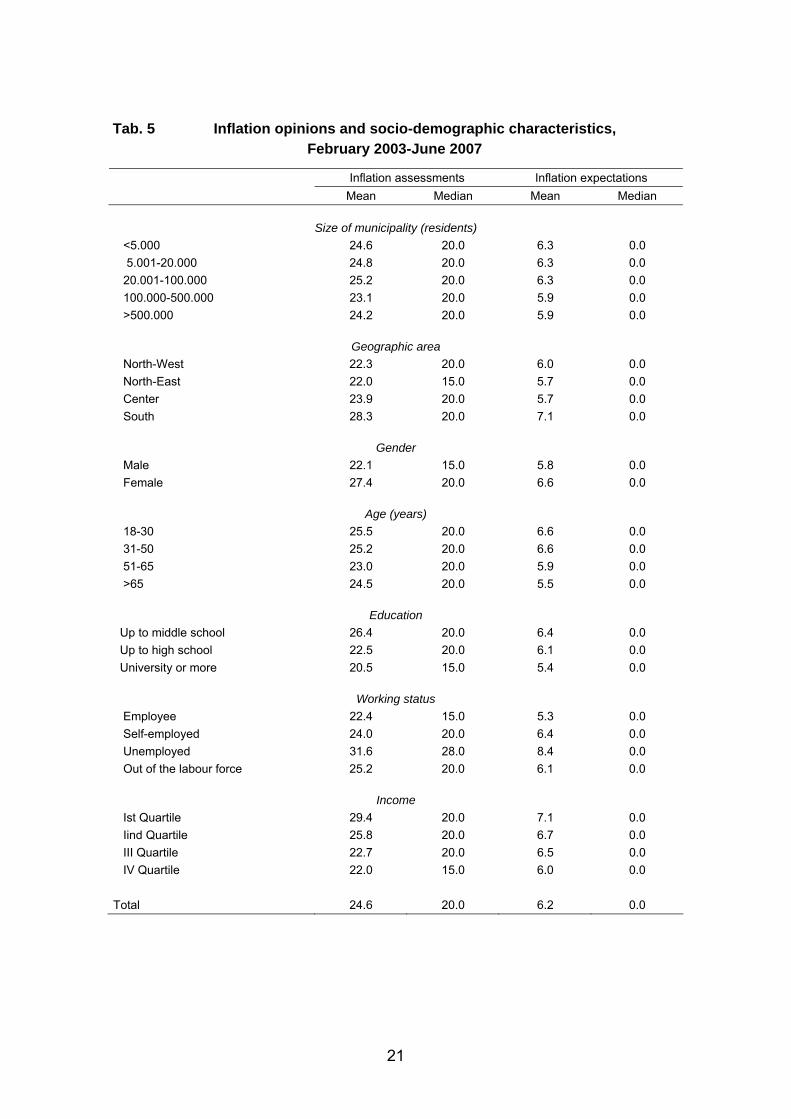
to explain the observed gap. Perceptions may indeed differ across demographic groups, being influenced by socio demographic characteristics of the households: Bryan-Venkatu (2001a and 2001b) have shown that people with lower education and income, together with women and the youngest part of the population, report higher inflation perceptions. Similar results emerge from ISAE data (table 5), according to which inflation opinions of Italian consumers are on average higher for:
• People leaving in the South
• Women
• Youngest consumers
• Less educated people
• People unemployed
• People with lower income
No particular effects of the size of the municipality of residence do emerge for inflation perceptions, whilst expectations are higher for those living in small residential areas; also Del Giovane-Fabiani-Sabbatini (2007) have recently found very similar results in an analysis based on a different sample and referred only to inflation perceptions.
The relationship between socio-demographic characteristics and inflation opinions seems indeed a quite robust feature, emerging from different surveys and for different countries worldwide. Apart from generic psychological considerations, a possible explanation of the finding is that inflation calculated by official statistical agencies is indeed based on expenditure-weighted CPI, which possibly does not correctly represent the effective price rise experienced by specific groups of the population. However, available data for the US prove that population-weighted CPI inflation is fairly close to that calculated on the basis of expenditure weights, showing that the cost of living is quite similar across different demographic groups. Moreover, in the case of Italy the gap between inflation opinions and real outcome remains large regardless of consumers’ demographic characteristics, confirming a systematic overestimation of price development on behalf of Italian consumers: in this sense, the gap between perceptions and realizations can not be attributed solely to group specific psychological factors such as the ones outlined above, even if they seem to have played a significant role in the recent “inflation scare” episode.
21
Tab. 5 Inflation opinions and socio-demographic characteristics, February 2003-June 2007
Inflation assessments Inflation expectations Mean Median Mean Median
Size of municipality (residents)
<5.000 24.6 20.0 6.3 0.0 5.001-20.000 24.8 20.0 6.3 0.0 20.001-100.000 25.2 20.0 6.3 0.0 100.000-500.000 23.1 20.0 5.9 0.0 >500.000 24.2 20.0 5.9 0.0
Geographic area
North-West 22.3 20.0 6.0 0.0 North-East 22.0 15.0 5.7 0.0 Center 23.9 20.0 5.7 0.0 South 28.3 20.0 7.1 0.0
Gender
Male 22.1 15.0 5.8 0.0 Female 27.4 20.0 6.6 0.0
Age (years)
18-30 25.5 20.0 6.6 0.0 31-50 25.2 20.0 6.6 0.0 51-65 23.0 20.0 5.9 0.0 >65 24.5 20.0 5.5 0.0
Education
Up to middle school 26.4 20.0 6.4 0.0 Up to high school 22.5 20.0 6.1 0.0 University or more 20.5 15.0 5.4 0.0
Working status
Employee 22.4 15.0 5.3 0.0 Self-employed 24.0 20.0 6.4 0.0 Unemployed 31.6 28.0 8.4 0.0 Out of the labour force 25.2 20.0 6.1 0.0
Income
Ist Quartile 29.4 20.0 7.1 0.0 Iind Quartile 25.8 20.0 6.7 0.0 III Quartile 22.7 20.0 6.5 0.0 IV Quartile 22.0 15.0 6.0 0.0 Total 24.6 20.0 6.2 0.0

22
4.3 Inflation opinions and confidence climate
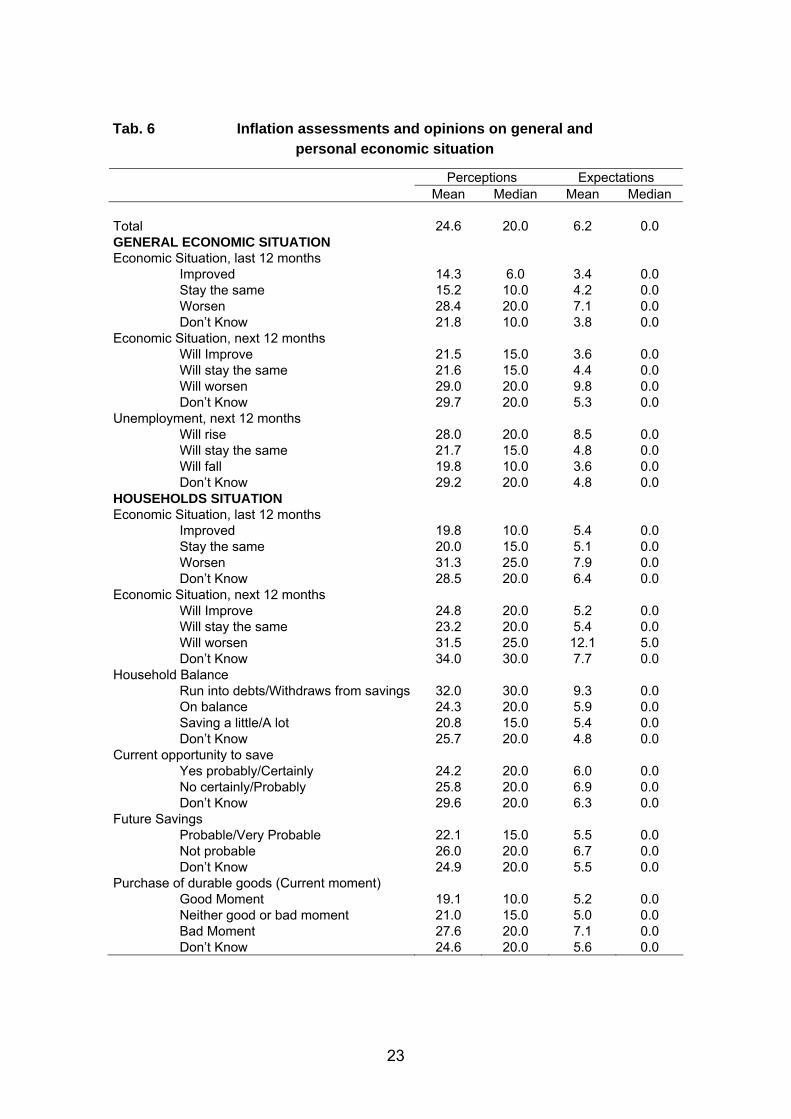
Del Giovane-Fabiani-Sabbatini (2007) have also considered the effect on inflation assessments of economic conditions of the respondents: with a scarce knowledge of the true inflation process and, on the other hand, a widespread media debate on the inflationary effects of the change over10, it is possible that a deterioration of purchasing power mainly linked to a moderate growth of disposable income has been wrongly interpreted as caused by a steep rise in consumers prices, giving rise to the “inflation scare” documented by ISAE data. In order to test this hypothesis, we use information provided in the same survey about consumers opinions on the household’ and the country economic situation. More specifically, the survey comprises, among others, 9 qualitative questions regarding the general economic situation of the country, unemployment prospects, the economic and financial situation of the family, opportunity and possibility to save and to buy durable goods. ISAE monthly elaborates an index of consumers’ climate (available at www.isae.it) as a simple arithmetic average of the balances of these 9 questions. Each question has 5 possible answers, arranged on a Linkert scale ranging from extremely positive to extremely negative. Table 6 reports inflation opinions disaggregated according to the answers given to the above questions, aggregating the replies in 3 modalities (positive, neutral, negative). Generally speaking, those showing negative opinions on both personal and general economic conditions are also providing higher quantitative inflation expectations. Differences are particularly strong for assessments on the economic situation of the country and on the households’ balance: those considering the general economic situation to be “worsen” are reporting inflation opinions twice as large as those perceiving that the situation has improved; similarly, those running into debt or withdrawing on their own savings perceive and expect an inflation rate much higher than that of those that are able to save (a little or a lot).
10 As an example, the Financial Times in 2002 published a number of articles on the “inflation scare” of
European consumers in the aftermath of the Euro change-over; many articles on these issues appeared also on the Italian press at the time.
23
Tab. 6 Inflation assessments and opinions on general and personal economic situation
Perceptions Expectations Mean Median Mean Median Total 24.6 20.0 6.2 0.0 GENERAL ECONOMIC SITUATION Economic Situation, last 12 months
Improved 14.3 6.0 3.4 0.0 Stay the same 15.2 10.0 4.2 0.0 Worsen 28.4 20.0 7.1 0.0 Don’t Know 21.8 10.0 3.8 0.0
Economic Situation, next 12 months Will Improve 21.5 15.0 3.6 0.0 Will stay the same 21.6 15.0 4.4 0.0 Will worsen 29.0 20.0 9.8 0.0 Don’t Know 29.7 20.0 5.3 0.0
Unemployment, next 12 months Will rise 28.0 20.0 8.5 0.0 Will stay the same 21.7 15.0 4.8 0.0 Will fall 19.8 10.0 3.6 0.0 Don’t Know 29.2 20.0 4.8 0.0
HOUSEHOLDS SITUATION Economic Situation, last 12 months
Improved 19.8 10.0 5.4 0.0 Stay the same 20.0 15.0 5.1 0.0 Worsen 31.3 25.0 7.9 0.0 Don’t Know 28.5 20.0 6.4 0.0
Economic Situation, next 12 months Will Improve 24.8 20.0 5.2 0.0 Will stay the same 23.2 20.0 5.4 0.0 Will worsen 31.5 25.0 12.1 5.0 Don’t Know 34.0 30.0 7.7 0.0
Household Balance Run into debts/Withdraws from savings 32.0 30.0 9.3 0.0 On balance 24.3 20.0 5.9 0.0 Saving a little/A lot 20.8 15.0 5.4 0.0 Don’t Know 25.7 20.0 4.8 0.0
Current opportunity to save Yes probably/Certainly 24.2 20.0 6.0 0.0 No certainly/Probably 25.8 20.0 6.9 0.0 Don’t Know 29.6 20.0 6.3 0.0
Future Savings Probable/Very Probable 22.1 15.0 5.5 0.0 Not probable 26.0 20.0 6.7 0.0 Don’t Know 24.9 20.0 5.5 0.0
Purchase of durable goods (Current moment) Good Moment 19.1 10.0 5.2 0.0 Neither good or bad moment 21.0 15.0 5.0 0.0 Bad Moment 27.6 20.0 7.1 0.0 Don’t Know 24.6 20.0 5.6 0.0
24
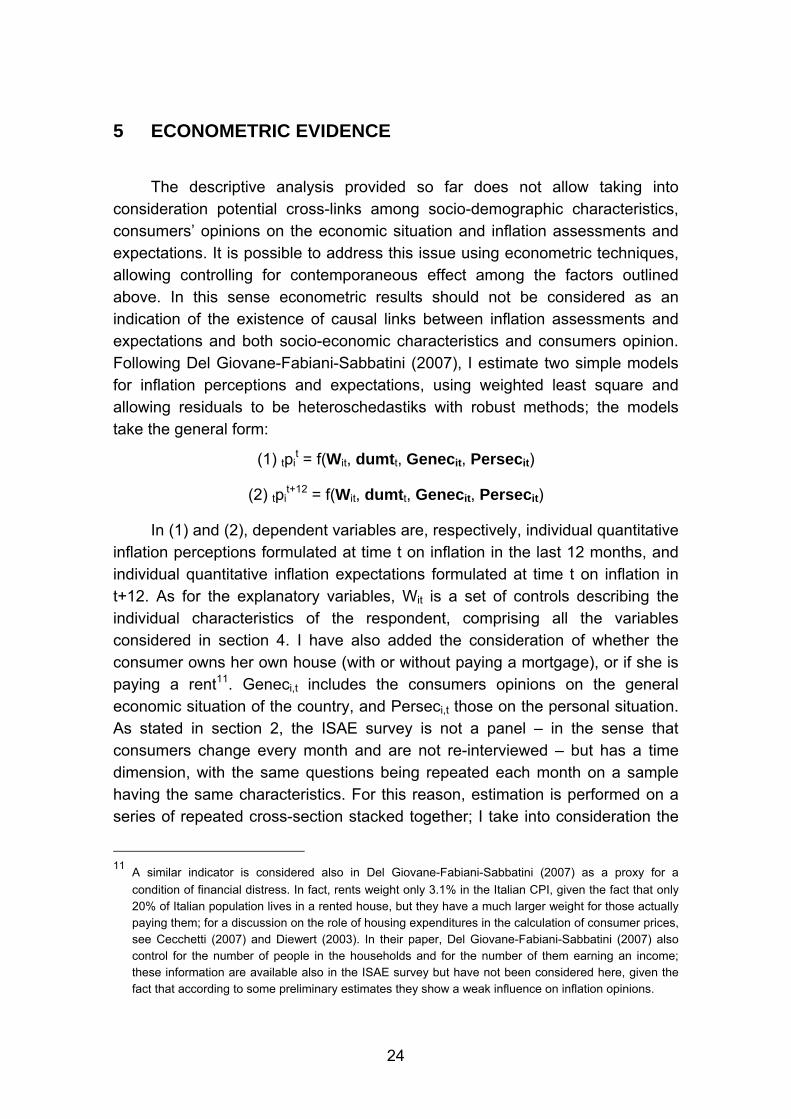
5 ECONOMETRIC EVIDENCE
The descriptive analysis provided so far does not allow taking into consideration potential cross-links among socio-demographic characteristics, consumers’ opinions on the economic situation and inflation assessments and expectations. It is possible to address this issue using econometric techniques, allowing controlling for contemporaneous effect among the factors outlined above. In this sense econometric results should not be considered as an indication of the existence of causal links between inflation assessments and expectations and both socio-economic characteristics and consumers opinion. Following Del Giovane-Fabiani-Sabbatini (2007), I estimate two simple models for inflation perceptions and expectations, using weighted least square and allowing residuals to be heteroschedastiks with robust methods; the models take the general form:
(1) tpit = f(Wit, dumtt, Genecit, Persecit)
(2) tpit+12 = f(Wit, dumtt, Genecit, Persecit)
In (1) and (2), dependent variables are, respectively, individual quantitative inflation perceptions formulated at time t on inflation in the last 12 months, and individual quantitative inflation expectations formulated at time t on inflation in t+12. As for the explanatory variables, Wit is a set of controls describing the individual characteristics of the respondent, comprising all the variables considered in section 4. I have also added the consideration of whether the consumer owns her own house (with or without paying a mortgage), or if she is paying a rent11. Geneci,t includes the consumers opinions on the general economic situation of the country, and Perseci,t those on the personal situation. As stated in section 2, the ISAE survey is not a panel – in the sense that consumers change every month and are not re-interviewed – but has a time dimension, with the same questions being repeated each month on a sample having the same characteristics. For this reason, estimation is performed on a series of repeated cross-section stacked together; I take into consideration the
11 A similar indicator is considered also in Del Giovane-Fabiani-Sabbatini (2007) as a proxy for a
condition of financial distress. In fact, rents weight only 3.1% in the Italian CPI, given the fact that only 20% of Italian population lives in a rented house, but they have a much larger weight for those actually paying them; for a discussion on the role of housing expenditures in the calculation of consumer prices, see Cecchetti (2007) and Diewert (2003). In their paper, Del Giovane-Fabiani-Sabbatini (2007) also control for the number of people in the households and for the number of them earning an income; these information are available also in the ISAE survey but have not been considered here, given the fact that according to some preliminary estimates they show a weak influence on inflation opinions.
25
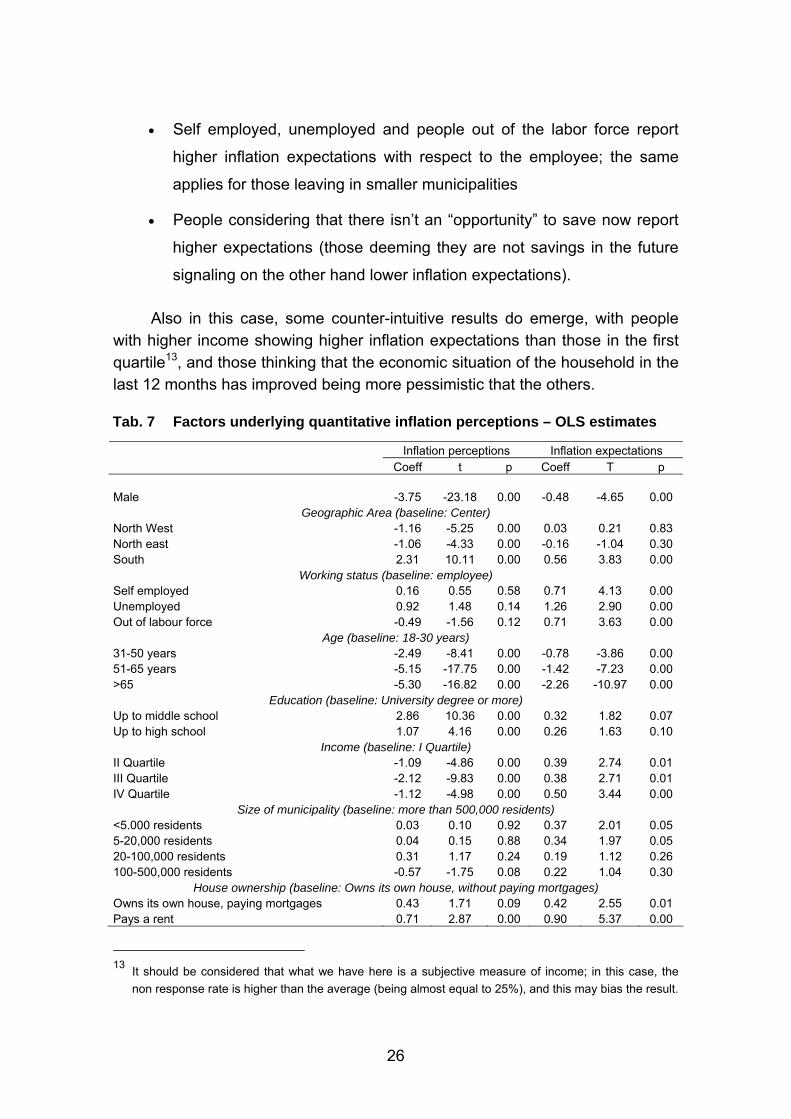
time dimension inserting a vector of temporal dummies (dumt) for each month considered in the analysis. The period considered for estimation goes from February 2003 to June 2007. The models are able to account for respectively .22 and .10 of total variability of inflation assessments and expectations. All the groups of dummies considered in the analysis are strongly statistically significant. Results are broadly in line with those obtained by Del Giovane-Fabiani-Sabbatini (2007) and with the descriptive evidence provided in the previous sections. However, some difference emerges between assessments and expectations; more specifically, inflation assessments are significantly higher for:
• People leaving in the Center-South, those aged 18-35, women, those
not having a University degree, those living in largest municipalities
(500,000 residents and more), those paying a mortgage or a rent and
the poorest quarter of the population
• People thinking that the economic situation of the country and that of
the labor market is or will worsen/strongly worsen People thinking that
their own economic situation has deteriorated in the recent past, or will
deteriorate in the future; those running into debt or withdrawing on their
own savings; people thinking that this is a “bad moment” to buy durable
goods.
No significant effects of working status is found in the analysis; some counter-intuitive results emerge regarding the questions on current and future savings, with people indicating that they do not see an “opportunity to save now” and that are not foreseeing to save in the future reporting lower inflation than the others12. Results are broadly similar for inflation expectations, with some exception:
12 In this case, it is possible that there is some misunderstanding on the “opportunity to save” concept,
that may be interpreted as a precautionary motive in bad times (i.e. consumers may answer that they want to save when things are going badly); similar considerations may also apply for the intention to save in the future. It should be noticed also that in this case the Italian formulation of the questionnaire is slightly different from the EU-harmonised one; in the past, ISAE tested a change of wording for this specific question, resulting in a severe discontinuity in the time series. Considering the fact that the series are used for the calculation of the Confidence Climate, ISAE decided to stick to the old formulation in order to guarantee continuity of results.
26
• Self employed, unemployed and people out of the labor force report
higher inflation expectations with respect to the employee; the same
applies for those leaving in smaller municipalities
• People considering that there isn’t an “opportunity” to save now report
higher expectations (those deeming they are not savings in the future
signaling on the other hand lower inflation expectations).
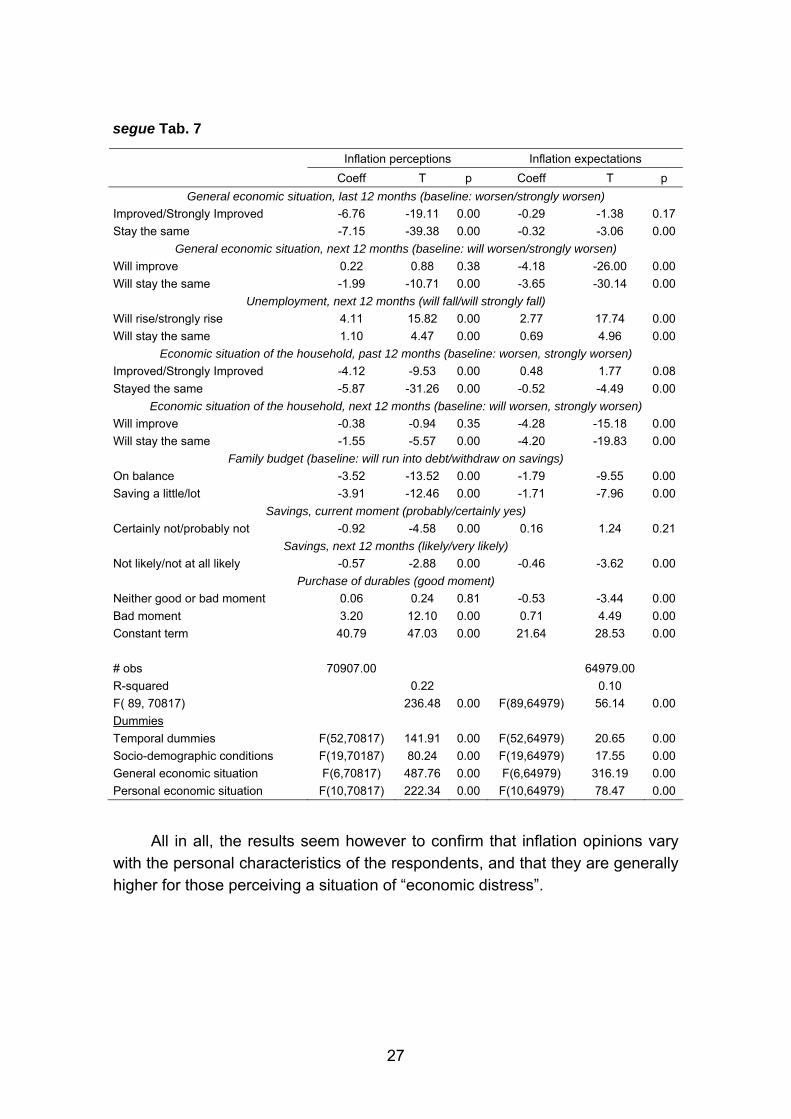
Also in this case, some counter-intuitive results do emerge, with people with higher income showing higher inflation expectations than those in the first quartile13, and those thinking that the economic situation of the household in the last 12 months has improved being more pessimistic that the others.
Tab. 7 Factors underlying quantitative inflation perceptions – OLS estimates
Inflation perceptions Inflation expectations Coeff t p Coeff T p
Male -3.75 -23.18 0.00 -0.48 -4.65 0.00
Geographic Area (baseline: Center) North West -1.16 -5.25 0.00 0.03 0.21 0.83 North east -1.06 -4.33 0.00 -0.16 -1.04 0.30 South 2.31 10.11 0.00 0.56 3.83 0.00
Working status (baseline: employee) Self employed 0.16 0.55 0.58 0.71 4.13 0.00 Unemployed 0.92 1.48 0.14 1.26 2.90 0.00 Out of labour force -0.49 -1.56 0.12 0.71 3.63 0.00
Age (baseline: 18-30 years) 31-50 years -2.49 -8.41 0.00 -0.78 -3.86 0.00 51-65 years -5.15 -17.75 0.00 -1.42 -7.23 0.00 >65 -5.30 -16.82 0.00 -2.26 -10.97 0.00
Education (baseline: University degree or more) Up to middle school 2.86 10.36 0.00 0.32 1.82 0.07 Up to high school 1.07 4.16 0.00 0.26 1.63 0.10
Income (baseline: I Quartile) II Quartile -1.09 -4.86 0.00 0.39 2.74 0.01 III Quartile -2.12 -9.83 0.00 0.38 2.71 0.01 IV Quartile -1.12 -4.98 0.00 0.50 3.44 0.00
Size of municipality (baseline: more than 500,000 residents) <5.000 residents 0.03 0.10 0.92 0.37 2.01 0.05 5-20,000 residents 0.04 0.15 0.88 0.34 1.97 0.05 20-100,000 residents 0.31 1.17 0.24 0.19 1.12 0.26 100-500,000 residents -0.57 -1.75 0.08 0.22 1.04 0.30
House ownership (baseline: Owns its own house, without paying mortgages) Owns its own house, paying mortgages 0.43 1.71 0.09 0.42 2.55 0.01 Pays a rent 0.71 2.87 0.00 0.90 5.37 0.00
13 It should be considered that what we have here is a subjective measure of income; in this case, the
non response rate is higher than the average (being almost equal to 25%), and this may bias the result.
27
segue Tab. 7
Inflation perceptions Inflation expectations Coeff T p Coeff T p
General economic situation, last 12 months (baseline: worsen/strongly worsen) Improved/Strongly Improved -6.76 -19.11 0.00 -0.29 -1.38 0.17 Stay the same -7.15 -39.38 0.00 -0.32 -3.06 0.00
General economic situation, next 12 months (baseline: will worsen/strongly worsen) Will improve 0.22 0.88 0.38 -4.18 -26.00 0.00 Will stay the same -1.99 -10.71 0.00 -3.65 -30.14 0.00
Unemployment, next 12 months (will fall/will strongly fall) Will rise/strongly rise 4.11 15.82 0.00 2.77 17.74 0.00 Will stay the same 1.10 4.47 0.00 0.69 4.96 0.00
Economic situation of the household, past 12 months (baseline: worsen, strongly worsen) Improved/Strongly Improved -4.12 -9.53 0.00 0.48 1.77 0.08 Stayed the same -5.87 -31.26 0.00 -0.52 -4.49 0.00
Economic situation of the household, next 12 months (baseline: will worsen, strongly worsen) Will improve -0.38 -0.94 0.35 -4.28 -15.18 0.00 Will stay the same -1.55 -5.57 0.00 -4.20 -19.83 0.00
Family budget (baseline: will run into debt/withdraw on savings) On balance -3.52 -13.52 0.00 -1.79 -9.55 0.00 Saving a little/lot -3.91 -12.46 0.00 -1.71 -7.96 0.00
Savings, current moment (probably/certainly yes) Certainly not/probably not -0.92 -4.58 0.00 0.16 1.24 0.21
Savings, next 12 months (likely/very likely) Not likely/not at all likely -0.57 -2.88 0.00 -0.46 -3.62 0.00
Purchase of durables (good moment) Neither good or bad moment 0.06 0.24 0.81 -0.53 -3.44 0.00 Bad moment 3.20 12.10 0.00 0.71 4.49 0.00 Constant term 40.79 47.03 0.00 21.64 28.53 0.00 # obs 70907.00 64979.00 R-squared 0.22 0.10 F( 89, 70817) 236.48 0.00 F(89,64979) 56.14 0.00 Dummies Temporal dummies F(52,70817) 141.91 0.00 F(52,64979) 20.65 0.00 Socio-demographic conditions F(19,70187) 80.24 0.00 F(19,64979) 17.55 0.00 General economic situation F(6,70817) 487.76 0.00 F(6,64979) 316.19 0.00 Personal economic situation F(10,70817) 222.34 0.00 F(10,64979) 78.47 0.00
All in all, the results seem however to confirm that inflation opinions vary with the personal characteristics of the respondents, and that they are generally higher for those perceiving a situation of “economic distress”.
28
6 CONCLUSIONS
The analysis of the new quantitative data on inflation opinions has confirmed that Italian consumers have largely overestimated inflation developments even years after the introduction of the common currency. The gap between actual and perceived inflation has remained large – albeit gradually reducing in size - throughout the whole sample and it is robust to different trimming methods. Quantitative replies have also proven to be broadly consistent with more traditional qualitative information, confirming that overestimation is a proper feature of consumers’ perception and not some “random” outcome derived from casual replies. We have then analyzed in more detail the process of opinion formation of Italian households, first of all controlling for their knowledge of inflation data and of the way they are calculated by official statistical agencies. Our finding is that Italian households have indeed a less-than-adequate knowledge of basic statistical concepts related to inflation, a vast majority of them failing to indicate the latest data released by ISTAT and not knowing the exact composition of the index on which inflation is calculated; basic difficulties in understanding concepts like those of “price” or “inflation” stability also emerge from the analysis. Given a low knowledge of statistical data, we have found that inflation opinions are strongly influenced by both socio-demographic characteristics and assessments and expectations on the own economic situation and that of the country. In particular, more “pessimistic” people tend generally to overestimate inflation more than those perceiving that economic condition are (rather) good.
On the basis of these results, we may first of all conclude that quantitative information derived from consumers’ surveys should be considered with care and are indeed useful to reach a better understanding of the process behind the formation of consumers’ opinions. The fact that consumers do not show an adequate knowledge of basic statistical data – whether attributable to some form of “irrationality” or “rational inattention” – seems also to point in the direction of some inadequacy of aggregate traditional statistics, probably to be considered in relation with the growing complexity and heterogeneity of modern advanced economies14.
More broadly, relaxing the assumption of consumers’ rationality regarding inflation opinions may have also important consequences for monetary authorities: for instance, Orphanides and Williams (2003) argue that central banks should consider, in their conduct of monetary policy, the possibility that
14 See on this H. van Tuinen (2007).

29
private expectations are not perfectly rational but governed by a perpetual learning technology – allowing for endogenous “inflation scares” episodes possibly similar to the one described in this paper. Similarly, Eusepi and Preston (2007) have recently argued that in the implementation of monetary policies central banks should adapt their communication strategies to the consideration of possible irrationality of expectations formation. In this sense, this paper represents a first assessment on the process of formation of inflation expectations of Italian consumers, lacking any formal representation of the process itself. Further studies in this field are advisable for the future, possibly exploiting further the information content of quantitative ISAE data on households’ inflation opinions.
30
REFERENCES
ANGELINI P. - ARDIZZI G. - LIPPI F. (2005), “Changover e inflazione: indicazioni dagli strumenti di pagamento in Italia e nell’area dell’Euro”, in L’Euro e l’Inflazione, ed. by P. DEL GIOVANE, F. LIPPI, R. Sabbatini, Il Mulino, Bologna
BLINDER A.S. - KRUEGER A.B. (2004), “What does the people Know About Economic Policy, and How Does It Know It”, NBER Working Paper n. 10787, September
BRYAN M.R. - VENKATU G. (2001a), “The Demographic of Inflation Opinion Surveys”, Economic Commentary, Federal Reserve Bank of Cleveland
BRYAN M.R. - VENKATU G. (2001b), “The Curiously Different Inflation Perspectives of Men and Women”, Economic Commentary, Federal Reserve Bank of Cleveland
CECCHETTI S. (2007), “Housing in Inflation Measurement”, www.voxeu.org, June 13
CESTARI V. – DEL GIOVANE P., ROSSI ARNAUD C. (2007), “Memory for Prices and the Euro Cash Changeover: an Analysis for Cinema Prices in Italy”, , Temi di Discussione n. 619, Banca d’Italia, Rome, February
CURTIN R. (2005), “Inflation Expectations: theoretical models and empirical tests” paper presented at the National Bank of Poland Workshop on “The role of Inflation Expectations in modelling and monetary policy making”, 9-10 February 2006
CURTIN R. (2007), “What US Consumers Know About Economic Conditions”, paper presented at the second OECD Workshop on “Measuring and Fostering the Progress of Societies, Istanbul, June 27
DEL GIOVANE P. - FABIANI S. - SABBATINI R. (2007), “What’s behind “inflation perceptions”? A survey-based analysis of Italian consumers”, Temi di Discussione n. 655, Banca d’Italia, Rome, December.
DEL GIOVANE P., SABBATINI, R. (2006), “Perceived and measured inflation after the launch of the Euro: explaining the gap in Italy”, Giornale degli Economisti e Annali di Economia, 2006, Vol. 65 (2), 155-192
DIEWERT E. (2003) "The Treatment of Owner Occupied Housing and Other Durables in a Consumer Price Index", Department of Economics, University of British Columbia, Discussion Paper No. 03-08, November
31
EUSEPI S. - PRESTON B., (2007), “Central Bank Communication and Expectations Stabilisation”, NBER Working Paper n. 13259, July
FULLONE F. - GAMBA M. - GIOVANNINI E. - MALGARINI M. (2007), “What do People Know about Statistics? The Results of an OECD/ ISAE Survey on Italian Consumers”, paper presented at the second OECD Workshop on “Measuring and Fostering the Progress of Societies, Istanbul, June 27
FULLONE F. - MARTELLI M. (2006), “Re-Thinking the ISAE Consumer Survey Processing”, paper presented at the 28th CIRET Conference, Rome, September
GAIOTTI E. - LIPPI F. (2004), “Pricing Behaviour and the Introduction of the Euro: evidence from a Panel of Restaurants”, Giornale degli Economisti e Annali di Economia, 63, 491-526;
LINDEN S. (2006), “400.000 Observations on Inflation Perceptions and Expectations in the EU: What Will They Tell Us?”, mimeo, European Commission, DG ECFIN
MALGARINI M. - MARGANI P. (2007), “Psychology, Consumer Sentiment and Household Expenditures: A Disaggregated Analysis”, Applied Economics, Vol. 39 (13)
ORPHANIDES A. - WILLIAMS J. C. (2005), "Inflation scares and forecast-based monetary policy", Review of Economic Dynamics, 2005, 8(2), 498-527
PAPACOSTAS A. (2007), “What People Know About Progress”, paper presented at the second OECD Workshop on “Measuring and Fostering the Progress of Societies, Istanbul, June 27
VAN TUINEN H. (2007), “Innovative Statistics to Improve our Notion of Reality”, background paper for the session “Statistical Offices: Information Brokers or Knowledge Buliders”, second OECD Workshop on “Measuring and Fostering the Progress of Societies, Istanbul, June 27
Working Papers available:
n. 31/03 S. DE NARDIS C. VICARELLI
The Impact of Euro on Trade: the (Early) Effect Is not So Large
n. 32/03 S. LEPROUX L'inchiesta ISAE-UE presso le imprese del commercio al minuto tradizionale e della grande distribuzione: la revisione dell'impianto metodologico
n. 33/03 G. BRUNO C. LUPI
Forecasting Euro-area Industrial Production Using (Mostly)\ Business Surveys Data
n. 34/03 C. DE LUCIA Wage Setters, Central Bank Conservatism and Economic Performance
n. 35/03 E. D'ELIA B. M. MARTELLI
Estimation of Households Income from Bracketed Income Survey Data
n. 36/03 G. PRINCIPE Soglie dimensionali e regolazione del rapporto di lavoro in Italia
n. 37/03 M. BOVI A Nonparametric Analysis of the International Business Cycles
n. 38/03 S. DE NARDIS M. MANCINI C. PAPPALARDO
Regolazione del mercato del lavoro e crescita dimensionale delle imprese: una verifica sull'effetto soglia dei 15 dipendenti
n. 39/03 C. MILANA ALESSANDRO ZELI
Productivity Slowdown and the Role of the Ict in Italy: a Firm-level Analysis
n. 40/04 R. BASILE S. DE NARDIS
Non linearità e dinamica della dimensione d'impresa in Italia
n. 41/04 G. BRUNO E. OTRANTO
Dating the Italian Business Cycle: a Comparison of Procedures
n. 42/04 C. PAPPALARDO G. PIRAS
Vector-auto-regression Approach to Forecast Italian Imports
n. 43/04 R. DE SANTIS Has Trade Structure Any Importance in the Transmission of Currency Shocks? An Empirical Application for Central and Eastern European Acceding Countries to EU
n. 44/04 L. DE BENEDICTIS C. VICARELLI
Trade Potentials in Gravity Panel Data Models
Working Papers available:
n. 47/05 M. MALGARINI P. MARGANI B.M. MARTELLI
Re-engineering the ISAE manufacturing survey
n. 48/05 R. BASILE A. GIUNTA
Things change. Foreign market penetration and firms’ behaviour in industrial districts: an empirical analysis
n. 49/05 C. CICCONI Building smooth indicators nearly free of end-of-sample revisions
n. 50/05 T. CESARONI M. MALGARINI G. ROCCHETTI
L’inchiesta ISAE sugli investimenti delle imprese manifatturiere ed estrattive: aspetti metodologici e risultati
n. 51/05 G. ARBIA G. PIRAS
Convergence in per-capita GDP across European regions using panel data models extended to spatial autocorrelation effects
n. 52/05 L. DE BENEDICTIS R. DE SANTIS C. VICARELLI
Hub-and-Spoke or else? Free trade agreements in the “enlarged” European Union
n. 53/05 R. BASILE M. COSTANTINI S. DESTEFANIS
Unit root and cointegration tests for cross-sectionally correlated panels. Estimating regional production functions
n. 54/05 C. DE LUCIA M. MEACCI
Does job security matter for consumption? An analysis on Italian microdata
n. 55/05 G. ARBIA R. BASILE G. PIRAS
Using Spatial Panel Data in Modelling Regional Growth and Convergence
n. 56/05 E. D’ELIA Using the results of qualitative surveys in quantitative analysis
n. 57/05 D. ANTONUCCI A. GIRARDI
Structural changes and deviations from the PPP within the Euro Area
n. 58/05 M. MALGARINI P. MARGANI
Psychology, consumer sentiment and household expenditures: a disaggregated analysis

Working Papers available:
n. 59/05 P. MARGANI R. RICCIUTI
Equivalenza Ricardiana in economia aperta: un’analisi dinamica su dati panel
n. 60/05 M. BOSCHI A. GIRARDI
Euro Area inflation: long-run determinants and short-run dynamics
n. 61/05 M. BOVI Book-Tax Gap. An Income Horse Race
n. 62/06 M. BOVI The Cyclical Behavior of Shadow and Regular Employment
n. 63/06 G. BRUNO C. LUPI C. PAPPALARDO G. PIRAS
The cross-country effects of EU holidays on domestic GDP’s
n. 64/06 M. COZZOLINO F. DI NICOLA M. RAITANO
Il futuro dei fondi pensione: opportunità e scelte sulla destinazione del TFR
n. 65/06 S. LEPROUX M. MALGARINI
Clima di fiducia e spesa delle famiglie in Italia: un’analisi disaggregata secondo il reddito degli intervistati
n. 66/06 M. BOVI Consumers Sentiment and Cognitive Macroeconometrics Paradoxes and Explanations
n. 67/06 G. ROCCHETTI Modelli di business nel mercato del software e partecipazione delle imprese italiane al fenomeno open source
n. 68/06 L. CROSILLA La stagionalità delle inchieste ISAE su imprese e consumatori: aspetti metodologici ed evidenza empirica
n. 69/06 C. OLDANI Money demand & futures
n. 70/06 R. BASILE S. DE NARDIS A. GIRARDI
Pricing to market of italian exporting firms
n. 71/06 B.M. MARTELLI G. ROCCHETTII
The ISAE Market Services Survey: Methodological Upgrading, Survey Reliability
n. 72/06 M. FIORAMANTI Predicting sovereign debt crises using artificial neural networks: a comparative approach
Working Papers available:
n. 73/06 S. ZECCHINI M. VENTURA
Public Credit Guarantees and SME Finance
n. 74/06 G. FERRI M. VENTURA
Macchinari del made in Italy e dinamiche dei distretti industriali
n. 75/07 R. BASILE Intra-distribution dynamics of regional per-capita income in Europe: evidence from alternative conditional density estimators
n. 76/07 M. BOVI National Accounts, Fiscal Rules and Fiscal Policy Mind the Hidden Gaps
n. 77/07 L. CROSILLA S. LEPROUX
Leading indicators on construction and retail trade sectors based on ISAE survey data
n. 78/07 R. CERQUETI M. COSTANTINI
Non parametric Fractional Cointegration Analysis
n. 79/07 R. DE SANTIS C. VICARELLI
The “deeper” and the “wider” EU strategies of trade integration
n. 80/07 S. de NARDIS R. DE SANTIS C. VICARELLI
The Euro’s Effects on Trade in a Dynamic Setting
n. 81/07 M. BOVI R. DELL’ANNO
The Changing Nature of the OECD Shadow Economy
n. 82/07 C. DE LUCIA Did the FED Inflate a Housing Price Bubble? A Cointegration Analysis between the 1980s and the 1990s
n. 83/07 T. CESARONI Inspecting the cyclical properties of the Italian Manufacturing Business survey data
n. 84/07 M. MALGARINI Inventories and business cycle volatility: an analysis based on ISAE survey data
n. 85/07 D. MARCHESI The Rule Incentives that Rule Civil Justice
n. 86/07 M. COSTANTINI S. de NARDIS
Estimates of Structural Changes in the Wage Equation: Some Evidence for Italy
n. 87/07 R. BASILE M. MANTUANO
La concentrazione geografica dell’industria in Italia: 1971-2001

Working Papers available:
n. 88/07 S. de NARDIS R. DE SANTIS C. VICARELLI
The single currency’s effects on Eurozone sectoral trade: winners and losers?
n. 89/07 B.M. MARTELLI G. ROCCHETTII
Cyclical features of the ISAE business services series