exhibit i (cbre goodman property appraisal)
TRANSCRIPT

EXHIBIT I (CBRE Goodman Property Appraisal)
APPRAISAL REPORT USA TANK 5897 State Highway 59 Goodman, McDonald County, Missouri 64843 CBRE, Inc. File No. 15-361HO-0303-1 Client Reference No. 10-09-1309D
Daniel Berenschot, MAI Managing Director THE PRIVATEBANK CORPORATION 120 South LaSalle Street Chicago, Illinois 60603
www.cbre.com/valuation
© 2015 CBRE, Inc.
VALUATION & ADVISORY SERVICES
4520 Main Street, Suite 600 Kansas City, MO 64111
T 816-756-3535 F 816-968-5890
www.cbre.com
March 17, 2015 Daniel Berenschot, MAI Managing Director THE PRIVATEBANK CORPORATION 120 South LaSalle Street Chicago, Illinois 60603 RE: Appraisal of USA Tank 5897 State Highway 59 Goodman, McDonald County, Missouri CBRE, Inc. File No. 15-361HO-0303-1 Client Reference No. 10-09-1309D
Dear Mr. Berenschot:
At your request and authorization, CBRE, Inc. has prepared an appraisal of the market value of the referenced property. Our analysis is presented in the following Appraisal Report.
The subject is a 99,200-square foot industrial (manufacturing) facility located at 5897 State Hwy 59 between Goodman and Anderson, Missouri. The improvements were constructed in 1980, renovated in 2011 and are situated on a 19.90-acre site. The clear height of the improvements varies from 25 to 34 feet and the office finish approximates 14.5%.
Based on the analysis contained in the following report, the market value of the subject is concluded as follows:
MARKET VALUE CONCLUSION
Appraisal Premise Interest Appraised Date of Value Value Conclusion
As Is Fee Simple Estate March 10, 2015 $1,700,000
Compiled by CBRE
The report, in its entirety, including all assumptions and limiting conditions, is an integral part of, and inseparable from, this letter.
The following appraisal sets forth the most pertinent data gathered, the techniques employed, and the reasoning leading to the opinion of value. The analyses, opinions and conclusions were developed based on, and this report has been prepared in conformance with, the guidelines and recommendations set forth in the Uniform Standards of Professional Appraisal Practice (USPAP), the requirements of the Code of Professional Ethics and Standards of Professional Appraisal
© 2015 CBRE, Inc.

Daniel Berenschot, MAI March 17, 2015 Page 2
Practice of the Appraisal Institute. It also conforms to Title XI Regulations and the Financial Institutions Reform, Recovery, and Enforcement Act of 1989 (FIRREA) updated in 1994 and further updated by the Interagency Appraisal and Evaluation Guidelines promulgated in 2010.
The intended use and user of our report are specifically identified in our report as agreed upon in our contract for services and/or reliance language found in the report. No other use or user of the report is permitted by any other party for any other purpose. Dissemination of this report by any party to non-client, non-intended users does not extend reliance to any other party and CBRE will not be responsible for unauthorized use of the report, its conclusions or contents used partially or in its entirety.
It has been a pleasure to assist you in this assignment. If you have any questions concerning the analysis, or if CBRE can be of further service, please contact us.
Respectfully submitted, CBRE - VALUATION & ADVISORY SERVICES
P. Scott Ryan Chris Williams, MAI Senior Appraiser Managing Director Missouri Certificate 2004000519 Missouri Certificate 2004030518 www.cbre.com/P_Scott_Ryan www.cbre.com/Christopher_Williams Phone: 816-968-5831 Phone: 816-968-5818 Fax: 816-968-5890 Fax: 816-968-5890 Email: [email protected] Email: [email protected]
© 2015 CBRE, Inc.
Certification
i
Certification
We certify to the best of our knowledge and belief:
1. The statements of fact contained in this report are true and correct. 2. The reported analyses, opinions, and conclusions are limited only by the reported
assumptions and limiting conditions and are our personal, impartial and unbiased professional analyses, opinions, and conclusions.
3. We have no present or prospective interest in or bias with respect to the property that is the subject of this report and have no personal interest in or bias with respect to the parties involved with this assignment.
4. Our engagement in this assignment was not contingent upon developing or reporting predetermined results.
5. Our compensation for completing this assignment is not contingent upon the development or reporting of a predetermined value or direction in value that favors the cause of the client, the amount of the value opinion, the attainment of a stipulated result, or the occurrence of a subsequent event directly related to the intended use of this appraisal.
6. This appraisal assignment was not based upon a requested minimum valuation, a specific valuation, or the approval of a loan.
7. Our analyses, opinions, and conclusions were developed, and this report has been prepared, in conformity with the Uniform Standards of Professional Appraisal Practice, as well as the requirements of the State of Missouri.
8. The reported analyses, opinions, and conclusions were developed, and this report has been prepared, in conformity with the requirements of the Code of Professional Ethics and Standards of Professional Appraisal Practice of the Appraisal Institute.
9. The use of this report is subject to the requirements of the Appraisal Institute relating to review by its duly authorized representatives.
10. As of the date of this report, Chris Williams, MAI has completed the continuing education program for Designated Members of the Appraisal Institute.
11. As of the date of this report, P. Scott Ryan has completed the Standards and Ethics Education Requirements for Candidates/Practicing Affiliates of the Appraisal Institute.
12. P. Scott Ryan has and Chris Williams, MAI has not made a personal inspection of the property that is the subject of this report.
13. No one provided significant real property appraisal assistance to the persons signing this report.
14. Valuation & Advisory Services operates as an independent economic entity within CBRE, Inc. Although employees of other CBRE, Inc. divisions may be contacted as a part of our routine market research investigations, absolute client confidentiality and privacy were maintained at all times with regard to this assignment without conflict of interest.
15. P. Scott Ryan and Chris Williams, MAI have provided services, as an appraiser, regarding the property that is the subject of this report within the three-year period immediately preceding acceptance of this assignment.
P. Scott Ryan Chris Williams, MAI Missouri Certificate 2004000519 Missouri Certificate 2004030518
© 2015 CBRE, Inc.
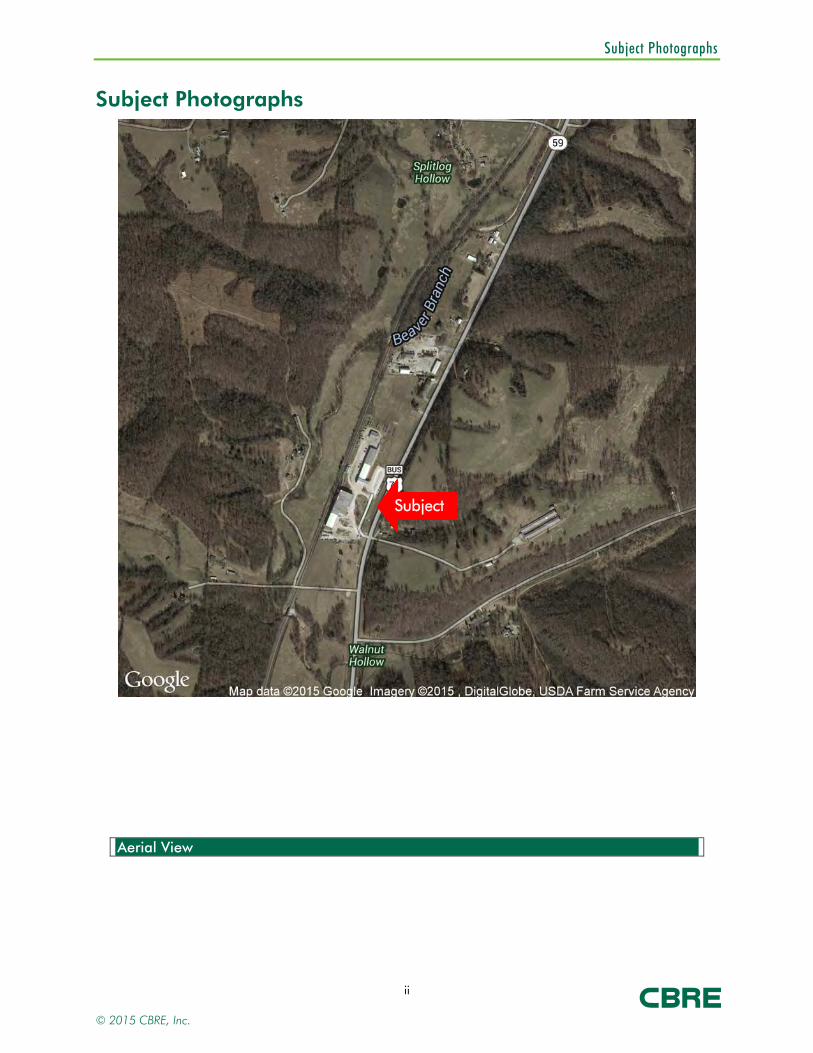
Subject Photographs
ii
Subject Photographs
Aerial View
Subject
© 2015 CBRE, Inc.
Subject Photographs
iii
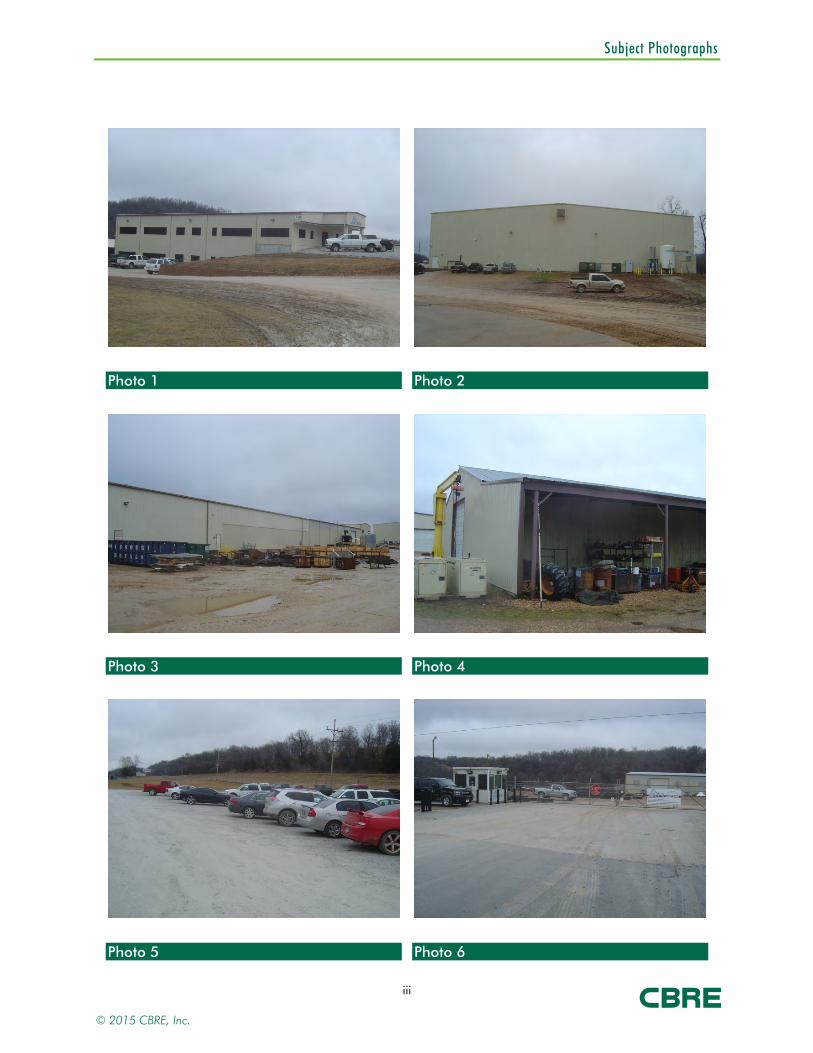
Photo 1 Photo 2
Photo 3 Photo 4
Photo 5 Photo 6
© 2015 CBRE, Inc.
Subject Photographs
iv
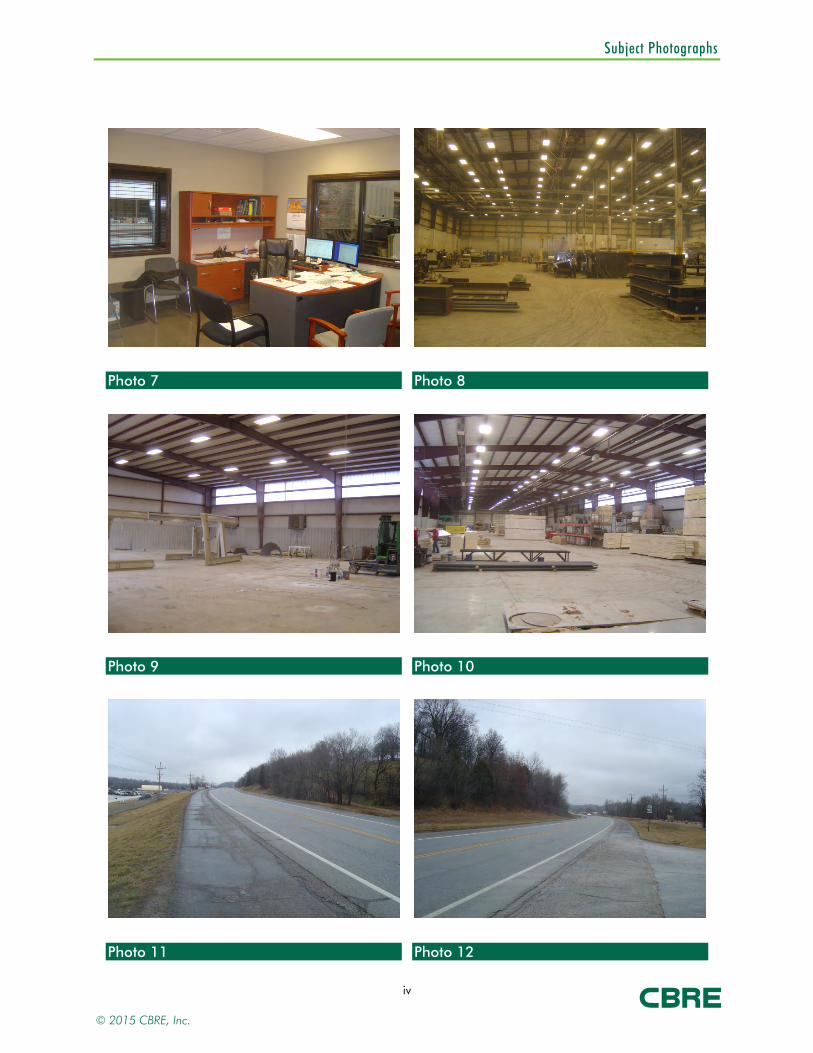
Photo 7 Photo 8
Photo 9 Photo 10
Photo 11 Photo 12
© 2015 CBRE, Inc.
Executive Summary
v
Executive Summary
Property Name
Location
Client Reference Number
Highest and Best Use
As If Vacant
As Improved
Property Rights Appraised
Date of Report
Date of Inspection
Estimated Exposure Time
Estimated Marketing Time
Land Area 19.90 AC 866,844 SF
Improvements
Property Type Industrial
Number of Buildings
Number of Stories
Gross Building Area
Clear Height
Percent Office
Year Built 1980 Renovated: 2011
Condition
Major Tenants
USA Tank
Buyer Profile
3
99,200 SF
March 17, 2015
12 Months
12 Months
99,200 SF
USA Tank
March 10, 2015
Fee Simple Estate
Industrial
Hold for future development
10-09-1309D
5897 State Highway 59, Goodman, McDonald County, Missouri 64843
(Manufacturing)
34 Ft.
14.5%
Investor-Local
Average
1
VALUATION Total Per SF
Land Value $230,000 $0.27
Cost Approach $1,700,000 $17.14
Sales Comparison Approach $1,700,000 $17.14
CONCLUDED MARKET VALUE
Appraisal Premise Interest Appraised Value
As Is Fee Simple Estate $1,700,000
Compiled by CBRE
Date of Value
March 10, 2015
© 2015 CBRE, Inc.
Executive Summary
vi
STRENGTHS, WEAKNESSES, OPPORTUNITIES AND THREATS (SWOT)
Strengths/ Opportunities
The subject is 100% owner-occupied. The subject was significantly renovated in 2011 and has no significant deferred maintenance
evident.
Weaknesses/ Threats
The subject is located in a small town in rural Missouri which is not typically preferred by investors.
Exposure & visibility to the subject are somewhat limited due to the location of the improvements in a rural area outside of the town of Goodman.
EXTRAORDINARY ASSUMPTIONS
An extraordinary assumption is defined as “an assumption directly related to a specific
assignment, as of the effective date of the assignment results, which if found to be false, could
alter the appraiser’s opinions or conclusions.” 1
The appraisers have reconciled the improvement sizes utilized in our analysis with documents provided by the property contact, the subject tax records and building measurements conducted as part of our site inspection. CBRE does not represent that our measurements are precise but represent this to be our best estimate. We are not qualified surveyors or engineers and recommend that a qualified engineer be retained by the client to ascertain a definitive measurement. Should an engineering or similar report indicate a different building size conclusion, we reserve the right to amend this report.
HYPOTHETICAL CONDITIONS
A hypothetical condition is defined as “a condition, directly related to a specific assignment,
which is contrary to what is known by the appraiser to exist on the effective date of the
assignment results, but is used for the purposes of analysis.” 2
None noted.
1 The Appraisal Foundation, USPAP, 2014-2015 ed., U-3.
2 The Appraisal Foundation, USPAP, 2014-2015 ed., U-3.
© 2015 CBRE, Inc.

Table of Contents
vii
Table of Contents
Certification ......................................................................................................................... i
Subject Photographs ............................................................................................................ ii
Executive Summary .............................................................................................................. v
Table of Contents ............................................................................................................... vii
Introduction ........................................................................................................................ 1
Area Analysis ...................................................................................................................... 4
Neighborhood Analysis ....................................................................................................... 8
Site Analysis ...................................................................................................................... 11
Improvements Analysis ...................................................................................................... 13
Zoning .............................................................................................................................. 15
Tax Assessment Data ......................................................................................................... 16
Market Analysis ................................................................................................................. 17
Highest and Best Use ........................................................................................................ 19
Appraisal Methodology ..................................................................................................... 20
Land Value ........................................................................................................................ 21
Cost Approach .................................................................................................................. 24
Sales Comparison Approach ............................................................................................. 28
Reconciliation of Value ...................................................................................................... 35
Assumptions and Limiting Conditions ................................................................................ 36
ADDENDA A Land Sale Data Sheets B Improved Sale Data Sheets C Précis METRO Report - Economy.com, Inc. D Client Contract Information E Qualifications
© 2015 CBRE, Inc.
Introduction
1
Introduction
OWNERSHIP AND PROPERTY HISTORY
Title to the property is currently vested in the name of Bell Ventures, who acquired title to the
property in November 2007, as improved for an undisclosed amount, as recorded in
Instrument 2007-00004631 of the McDonald County Deed Records.
To the best of our knowledge, there has been no ownership transfer of the property during the
previous three years nor is the property listed for sale.
INTENDED USE OF REPORT
This appraisal is to be used for internal decision making purposes, and no other use is permitted.
INTENDED USER OF REPORT
This appraisal is to be used by The PrivateBank Corporation, and no other user may rely on our
report unless as specifically indicated in the report.
Intended Users - the intended user is the person (or entity) who the appraiser intends will use the results of the appraisal. The client may provide the appraiser with information about other potential users of the appraisal, but the appraiser ultimately determines who the appropriate users are given the appraisal problem to be solved. Identifying the intended users is necessary so that the appraiser can report the opinions and conclusions developed in the appraisal in a manner that is clear and understandable to the intended users. Parties who receive or might receive a copy of the appraisal are not necessarily intended users. The appraiser’s responsibility is to the intended users identified in the report, not to all readers of the appraisal report. 3
PURPOSE OF THE APPRAISAL
The purpose of this appraisal is to estimate the market value of the subject property.
DEFINITION OF VALUE
The current economic definition of market value agreed upon by agencies that regulate federal
financial institutions in the U.S. (and used herein) is as follows:
The most probable price which a property should bring in a competitive and open market under
all conditions requisite to a fair sale, the buyer and seller each acting prudently and
knowledgeably, and assuming the price is not affected by undue stimulus. Implicit in this
definition is the consummation of a sale as of a specified date and the passing of title from seller
to buyer under conditions whereby:
1. buyer and seller are typically motivated;
3 Appraisal Institute, The Appraisal of Real Estate, 14th ed. (Chicago: Appraisal Institute, 2013), 50.
© 2015 CBRE, Inc.
Introduction
2
2. both parties are well informed or well advised, and acting in what they consider their own best interests;
3. a reasonable time is allowed for exposure in the open market; 4. payment is made in terms of cash in U.S. dollars or in terms of financial arrangements
comparable thereto; and 5. the price represents the normal consideration for the property sold unaffected by special
or creative financing or sales concessions granted by anyone associated with the sale. 4
INTEREST APPRAISED
The value estimated represents fee simple estate and defined as follows:
Fee Simple Estate - Absolute ownership unencumbered by any other interest or estate, subject only to the limitations imposed by the governmental powers of taxation, eminent domain, police power and escheat. 5
SCOPE OF WORK
This Appraisal Report is intended to comply with the reporting requirements set forth under
Standards Rule 2 of USPAP. The scope of the assignment relates to the extent and manner in
which research is conducted, data is gathered and analysis is applied. CBRE, Inc. completed the
following steps for this assignment:
Extent to Which the Property is Identified
The property is identified through the following sources:
postal address assessor’s records
Extent to Which the Property is Inspected
The extent of the inspection included the following: internal and external areas of all buildings
and walking around the site.
Type and Extent of the Data Researched
CBRE reviewed the following:
applicable tax data zoning requirements flood zone status demographics comparable data
4 Interagency Appraisal and Evaluation Guidelines; December 10, 2010, Federal Register, Volume 75 Number 237,
Page 77472.
5 Dictionary of Real Estate Appraisal, 78.
© 2015 CBRE, Inc.
Introduction
3
Type and Extent of Analysis Applied
CBRE, Inc. analyzed the data gathered through the use of appropriate and accepted appraisal
methodology to arrive at a probable value indication via each applicable approach to value. The
steps required to complete each approach are discussed in the methodology section.
Data Resources Utilized in the Analysis
DATA SOURCES
Item: Source(s):
Site DataSize McDonald County records
Improved DataBuilding Area McDonald County recordsArea Breakdown/Use Information from previous property contact, David ArnoldNo. Bldgs. Physical inspectionClear Height Information from previous property contact, David ArnoldYear Built/Developed McDonald County records
OtherTaxes McDonald County records
Compiled by CBRE
© 2015 CBRE, Inc.

Area Analysis
4
Area Analysis
The subject is located in a rural area between Goodman and Anderson, 30 miles south of Joplin,
Missouri. As the property is located in a rural area, Joplin Regional analysis is included.
Moody’s Economy.com provides the following Joplin, MO metro area economic summary as of
October 2014. The full Moody’s Economy.com report is presented in the Addenda.
JOPLIN, MO - ECONOMIC INDICATORSIndicators 2008 2009 2010 2011 2012 2013 2014 2015 2016 2017 2018 2019
Gross Metro Product (C$B) 7.4 7.7 7.6 7.4 7.5 7.6 7.6 7.8 8.0 8.2 8.3 8.5
% Change -0.8 4.0 -1.4 -2.5 2.1 0.3 0.0 3.5 2.7 1.8 1.8 2.0
Total Employment (Ths) 80.6 79.0 78.6 79.2 80.4 81.3 82.0 83.2 84.4 84.9 84.9 84.8
% Change 1.0 -2.0 -0.5 0.7 1.6 1.0 0.9 1.4 1.5 0.5 0.0 -0.1
Unemployment Rate (%) 5.2 8.2 8.3 7.7 6.1 5.7 5.3 4.8 4.7 4.5 4.4 4.4
Personal Income Growth (%) 5.2 0.2 1.9 4.3 5.2 0.1 1.9 5.5 5.6 4.6 3.9 3.1
Median Household Income ($ Ths) 39.6 38.5 37.9 39.0 39.2 39.3 39.0 40.6 42.1 43.7 45.2 46.4
Population (Ths) 172.7 174.4 175.9 176.7 174.5 175.2 175.5 175.9 176.4 176.8 177.4 177.9
% Change 0.9 1.0 0.9 0.5 -1.3 0.4 0.2 0.2 0.2 0.3 0.3 0.3
Net Migration (000) 0.5 0.7 0.7 -0.1 -3.0 0.1 -0.4 -0.3 -0.2 -0.2 -0.1 -0.1
Single-Family Permits 212.0 153.0 144.0 189.0 176.0 463.0 400.1 414.9 525.4 536.5 503.0 465.4
Multifamily Permits 55.0 65.0 58.0 121.0 103.0 105.0 109.8 157.4 162.3 144.4 136.9 134.6
Existing-Home Price ($ Ths) 85.4 82.2 82.1 82.7 87.3 92.8 96.7 99.9 101.7 103.7 106.3 110.1
Source: Moody's Economy.com
RECENT PERFORMANCE
Joplin's expansion has slowed, with modest job growth so far this year. Private services have
backpedaled, but in the goods-producing arena gains in construction have more than offset
losses in manufacturing. Not surprisingly, factory output is growing more slowly than that of the
state and the nation. Stronger growth in average weekly earnings has yet to manifest in more
© 2015 CBRE, Inc.
Area Analysis
5
home sales, and consequently an uptick in homebuilding has led to additional supply that has
kept house price growth muted.
INDUSTRY
The easing of regulations to attract businesses following the 2011 tornado is having a discernible
effect on the metro area and will benefit the economy in coming quarters. Heartland Pet Foods
has taken advantage of favorable tax incentives, adding 150 jobs to a new facility in August, and
Turbo Supply, an engine turbocharger manufacturer, is expanding its operations and making 70
permanent hires. Also, EaglePicher Technologies is building a new facility that will increase its
capacity to produce lithium-ion batteries for the Department of Defense and swell its workforce to
130 employees. The arrival of new manufacturers has encouraged Hertz to open a new facility to
serve as a hub for industrial equipment rentals in the country's midsection, leading to more jobs
in wholesale trade. Transportation and warehousing are other important drivers, with top
employers Conway and Tri State Motor expanding in response to rising truck tonnage. Industry
employment is at a multiyear high and will grow at an above-average rate next year.
FOOD PROCESSING
Despite the high-profile additions in manufacturing, food and dairy processing are what drives
Joplin's outsize factory sector, which will once again struggle to expand employment in 2015.
Demand from abroad has waned as a stronger U.S. dollar has made American products more
expensive to overseas buyers. Dairy processors in Joplin have suffered, though most of what is
produced in the metro area stays inside the country's borders. Higher cattle prices are squeezing
the profit margins of some producers-the Federal Reserve's latest Beige Book noted weaker
activity in the Kansas City Fed district, though lower prices for some agricultural commodities are
benefiting other food processors. However, with productivity enhancements limiting the need for
additional labor, the forecast anticipates a slight reduction in industry payrolls even as production
rises in the coming year.
BUSINESS SERVICES
Some new investment next year will be of the low-value-added variety. The metro area has a
relatively unskilled workforce, with educational attainment below average. Just one-fifth of the
adult population has a bachelor's degree or higher, the second lowest in the state. However,
ample, cheap labor is attracting business service providers, and call centers have been popping
up with more than 1,000 net new additions in recent years. The trend is expected to persist, with
APAC planning to add 150 positions in the coming months. These jobs are not high-paying, but
they will nonetheless boost wage income and consumer spending in Joplin.
EMPLOYMENT
The following is a summary of the largest employers in the Joplin area.
© 2015 CBRE, Inc.

Area Analysis
6
Source: Economy.comUtilities
ManufacturingRetailConstructionCollections
Emprie District Electric Co.
MAJOR EMPLOYERS (over 600 Employees)
Company Business
Freeman Hospitals & Health SystemCon-way Inc.Mercy Hosptial Joplin
HealthCareLogisticsHealthCare
Downstream Casino ResortEagle Picher Industries
TelecommManufacturing
Wal-Mart Stores Inc.Crossland ConstructionNCO/Systems & Services TechnologiesAT&TTamko Roofing Products Inc.
Gaming
STRENGTHS AND WEAKNESSES
Strengths
Low housing costs in relation to local income and national median price.
Favorable location on major trade route.
Exposure to farm commodities.
Weaknesses
The need for tornado-proof structures, which will hinder business investment.
Depressed income growth due to low-value-added service jobs.
Dependence on declining manufacturing.
FORECAST RISKS
Upside
Transportation and warehousing becomes more cost-efficient.
National recovery boosts manufacturing exports and freight trucking more than expected.
Downside
Rebuilding from the tornado is slower than an anticipated, holding back in-migration.
Housing does not contribute meaningfully to the recovery.
© 2015 CBRE, Inc.
Area Analysis
7
CONCLUSION
Joplin's economy will soon strengthen, but the metro area will struggle to close its performance
gap with the rest of the state in 2015. Joplin will not get much help from manufacturing, but
logistics will be a pillar of strength and back-office gains will help services and commercial real
estate. Weak population growth creates downside risk for housing and other consumer-related
industries.
© 2015 CBRE, Inc.
Neighborhood Analysis
8
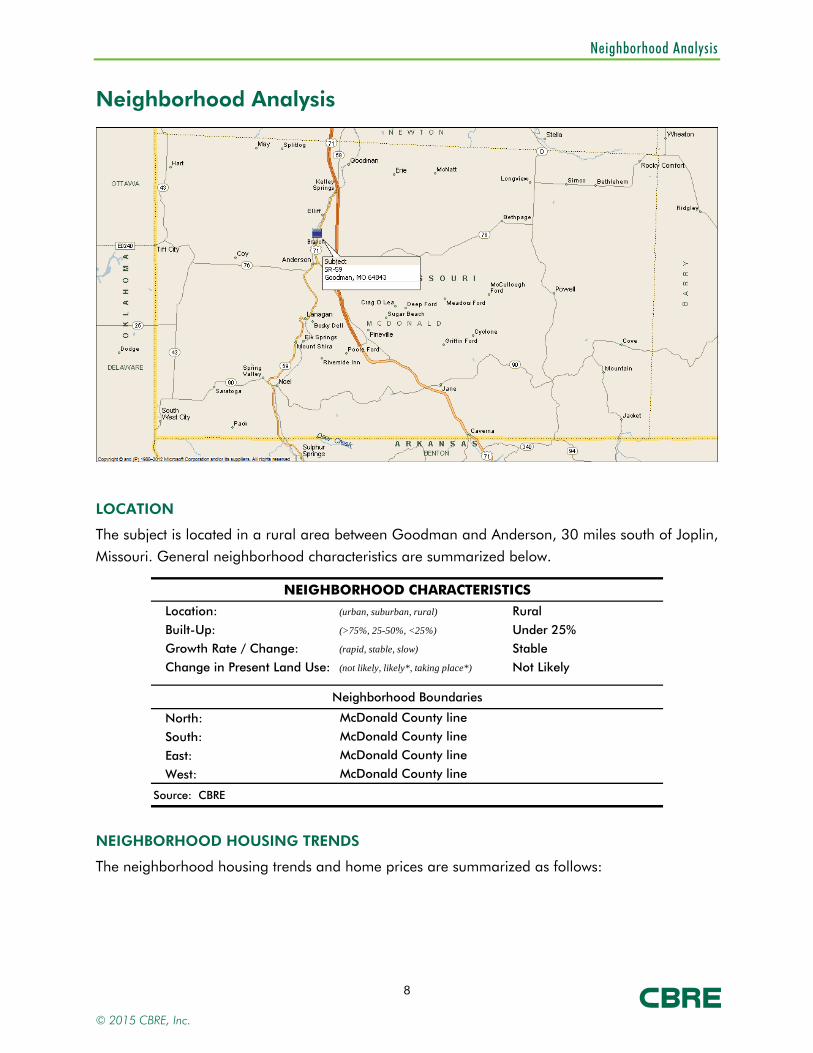
Neighborhood Analysis
LOCATION
The subject is located in a rural area between Goodman and Anderson, 30 miles south of Joplin,
Missouri. General neighborhood characteristics are summarized below.
NEIGHBORHOOD CHARACTERISTICS
Location: (urban, suburban, rural) Rural
Built-Up: (>75%, 25-50%, <25%) Under 25%
Growth Rate / Change: (rapid, stable, slow) Stable
Change in Present Land Use: (not likely, likely*, taking place*) Not Likely
Neighborhood Boundaries
North:
South:
East:
West:
Source: CBRE
McDonald County line
McDonald County line
McDonald County line
McDonald County line
NEIGHBORHOOD HOUSING TRENDS
The neighborhood housing trends and home prices are summarized as follows:
© 2015 CBRE, Inc.

Neighborhood Analysis
9
NEIGHBORHOOD HOUSING TRENDS
Property Values: (increasing, stable, declining) Stable
Demand/Supply: (shortage, in balance, oversupply) In Balance
Marketing Time: (< 3 months, 3-6 months, > 6 months) 3 - 6 Months
Low High Predominant
Price ($000's): $100 $250 $200
Age (yrs.): 5 25 10
Source: CBRE
LAND USE
Growth in McDonald County has been limited. Commercial thoroughfares like Highway 76,
Highway 71, Highway 59, and Highway 43 are typical of smaller rural counties in Missouri.
There has been no visible recent development activity in McDonald County. The local land use
patterns are summarized as follows.
NEIGHBORHOOD LAND USE
Present Land Use %
Single Unit Residential: 10% Industrial: 10%
Multi-Housing: 5% Agricultural: 60%
Commercial: 10% Other: 5%
Commercial Land Use Patterns
Primary Commercial Thoroughfares:
Major Commercial Developments:
Source: CBRE
None
Highway 59
DEMOGRAPHICS
Selected neighborhood demographics in 5-, 10-, and 20-mile radii from the subject are shown in
the following table:
© 2015 CBRE, Inc.
Neighborhood Analysis
10
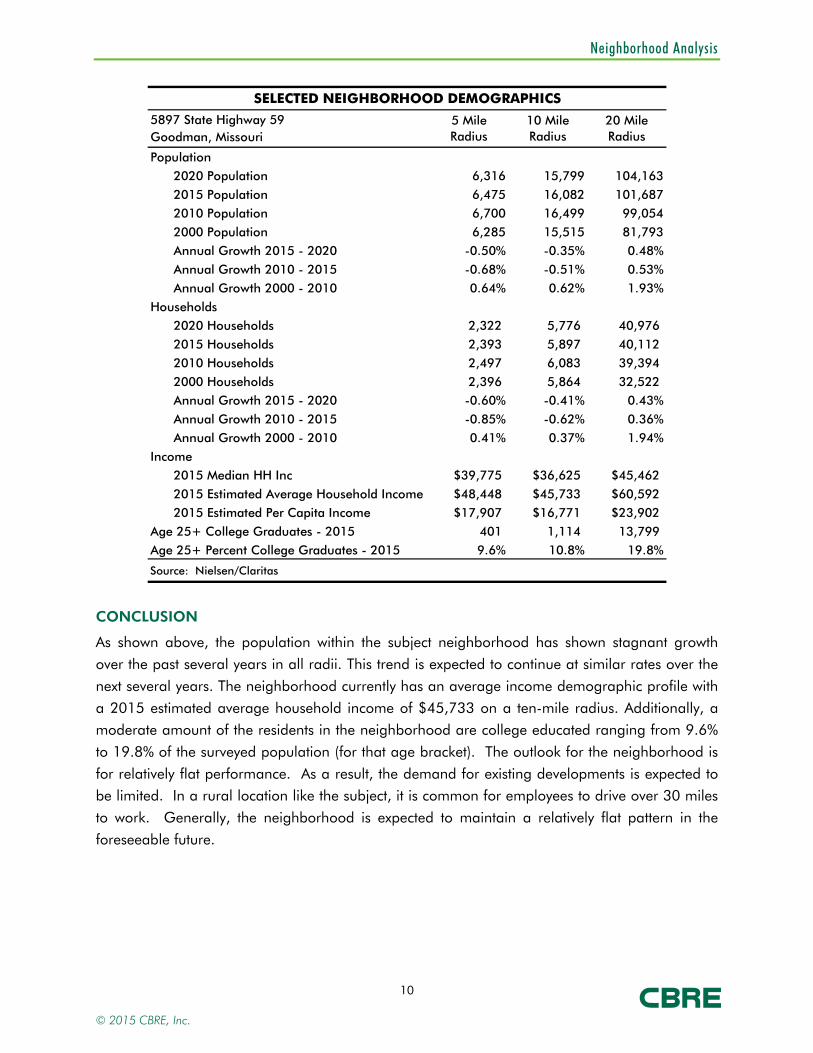
SELECTED NEIGHBORHOOD DEMOGRAPHICS
5897 State Highway 59Goodman, Missouri
Population
2020 Population 6,316 15,799 104,163
2015 Population 6,475 16,082 101,687
2010 Population 6,700 16,499 99,054
2000 Population 6,285 15,515 81,793
Annual Growth 2015 - 2020 -0.50% -0.35% 0.48%
Annual Growth 2010 - 2015 -0.68% -0.51% 0.53%
Annual Growth 2000 - 2010 0.64% 0.62% 1.93%
Households
2020 Households 2,322 5,776 40,976
2015 Households 2,393 5,897 40,112
2010 Households 2,497 6,083 39,394
2000 Households 2,396 5,864 32,522
Annual Growth 2015 - 2020 -0.60% -0.41% 0.43%
Annual Growth 2010 - 2015 -0.85% -0.62% 0.36%
Annual Growth 2000 - 2010 0.41% 0.37% 1.94%
Income
2015 Median HH Inc $39,775 $36,625 $45,462
2015 Estimated Average Household Income $48,448 $45,733 $60,592
2015 Estimated Per Capita Income $17,907 $16,771 $23,902
Age 25+ College Graduates - 2015 401 1,114 13,799
Age 25+ Percent College Graduates - 2015 9.6% 10.8% 19.8%
Source: Nielsen/Claritas
5 Mile Radius
10 Mile Radius
20 Mile Radius
CONCLUSION
As shown above, the population within the subject neighborhood has shown stagnant growth
over the past several years in all radii. This trend is expected to continue at similar rates over the
next several years. The neighborhood currently has an average income demographic profile with
a 2015 estimated average household income of $45,733 on a ten-mile radius. Additionally, a
moderate amount of the residents in the neighborhood are college educated ranging from 9.6%
to 19.8% of the surveyed population (for that age bracket). The outlook for the neighborhood is
for relatively flat performance. As a result, the demand for existing developments is expected to
be limited. In a rural location like the subject, it is common for employees to drive over 30 miles
to work. Generally, the neighborhood is expected to maintain a relatively flat pattern in the
foreseeable future.
© 2015 CBRE, Inc.

Site Analysis
11
Site Analysis
The following chart summarizes the salient characteristics of the subject site.
SITE SUMMARY AND ANALYSIS
Physical DescriptionGross Site Area 19.90 Acres 866,844 Sq. Ft.
Net Site Area 19.90 Acres 866,844 Sq. Ft.
Primary Road Frontage Highway 59Excess Land Area None n/a
Surplus Land Area None n/a
Shape
Topography
Zoning District
Flood Map Panel No. & Date 29119C0137D 3-May-10Flood Zone Zone XAdjacent Land Uses
Earthquake Zone
Comparative AnalysisVisibility
Functional Utility
Traffic Volume
Adequacy of Utilities
Landscaping
Drainage
Utilities AdequacyWater YesSewer YesNatural Gas YesElectricity YesTelephone Yes
Other Yes No UnknownDetrimental Easements XEncroachments XDeed Restrictions XReciprocal Parking Rights X
Source: Various sources compiled by CBRE
Assumed adequate
Average
Provider2 water wells located on the proper
Assumed adequate
City of Anderson
Missouri Gas Energy
Empire Electric
Various providers
RatingAverage
Assumed adequate
Average
Irregular
Level
None
N/A
Agricultural, rural residential, and industrial uses
CONCLUSION
The site is adequately located and afforded good access and visibility from roadway frontage.
The site has water provided from two water wells on the property. The size of the site is typical for
the area and use, and there are no known detrimental uses in the immediate vicinity. Overall,
there are no known factors, which are considered to prevent the site from development to its
highest and best use, as if vacant, or adverse to the existing use of the site.
© 2015 CBRE, Inc.

Site Analysis
12
FLOOD PLAIN MAP
Subject
© 2015 CBRE, Inc.
Improvements Analysis
13
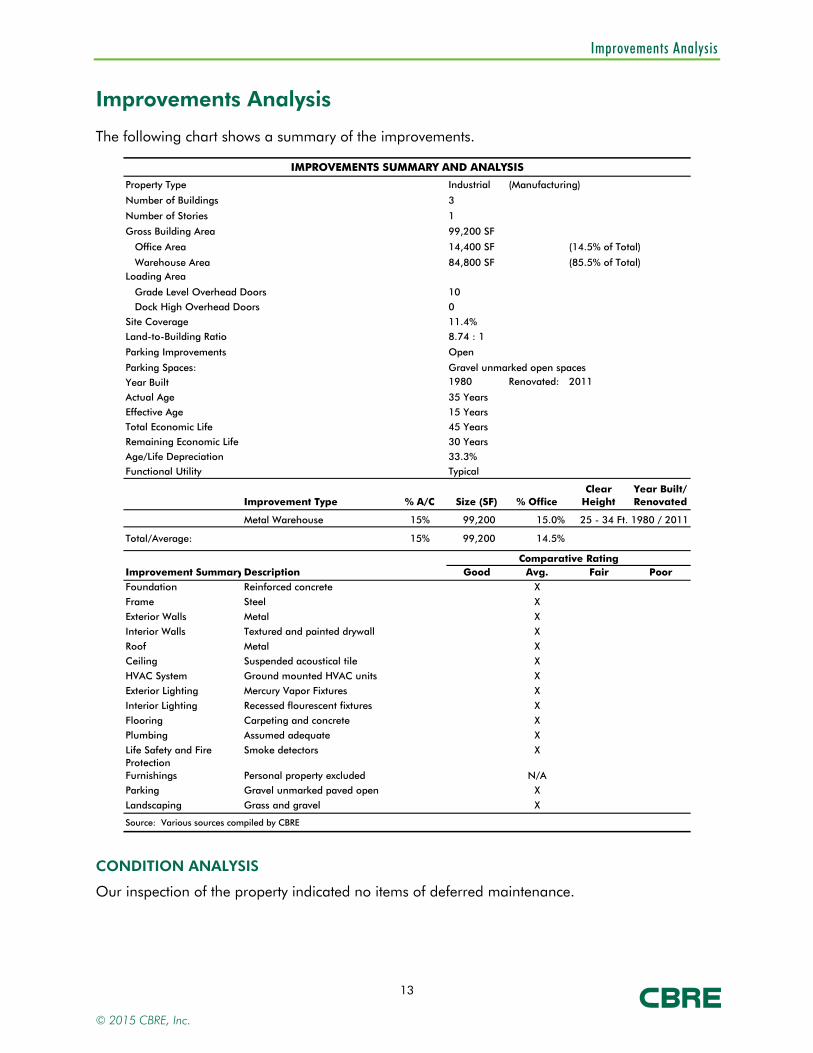
Improvements Analysis
The following chart shows a summary of the improvements.
IMPROVEMENTS SUMMARY AND ANALYSIS
Industrial
Loading Area
1980 Renovated: 2011
Improvement Type % A/C Size (SF) % OfficeClear
HeightYear Built/ Renovated
Metal Warehouse 15% 99,200 15.0% 25 - 34 Ft. 1980 / 2011
Total/Average: 15% 99,200 14.5%
Comparative RatingImprovement SummaryDescription Good Avg. Fair PoorFoundation Reinforced concrete X
Frame Steel X
Exterior Walls Metal X
Interior Walls Textured and painted drywall X
Roof Metal XCeiling Suspended acoustical tile X
HVAC System Ground mounted HVAC units X
Exterior Lighting Mercury Vapor Fixtures X
Interior Lighting Recessed flourescent fixtures X
Flooring Carpeting and concrete XPlumbing Assumed adequate X
Life Safety and Fire Protection
Smoke detectors X
Furnishings Personal property excluded N/AParking Gravel unmarked paved open X
Landscaping Grass and gravel X
Source: Various sources compiled by CBRE
Parking Improvements
45 Years
Year Built35 Years
Typical
Open
Site Coverage
Dock High Overhead Doors
Grade Level Overhead Doors
Total Economic Life
Parking Spaces:
Functional Utility
Remaining Economic Life
Actual Age
Age/Life Depreciation
Effective Age
Gravel unmarked open spaces
30 Years
33.3%
15 Years
8.74 : 1
10
0
11.4%
Land-to-Building Ratio
3
99,200 SF
1
Office Area
Warehouse Area
Number of Buildings
Number of Stories
Gross Building Area
(85.5% of Total)84,800 SF
14,400 SF
(Manufacturing)
(14.5% of Total)
Property Type
CONDITION ANALYSIS
Our inspection of the property indicated no items of deferred maintenance.
© 2015 CBRE, Inc.

Improvements Analysis
14
CONCLUSION
The improvements are considered to be in average overall condition and are considered to be
typical for the age and location in regard to improvement design and layout, as well as interior
and exterior amenities. Overall, there are no known factors that could be considered to
adversely impact the marketability of the improvements.
© 2015 CBRE, Inc.
Zoning
15
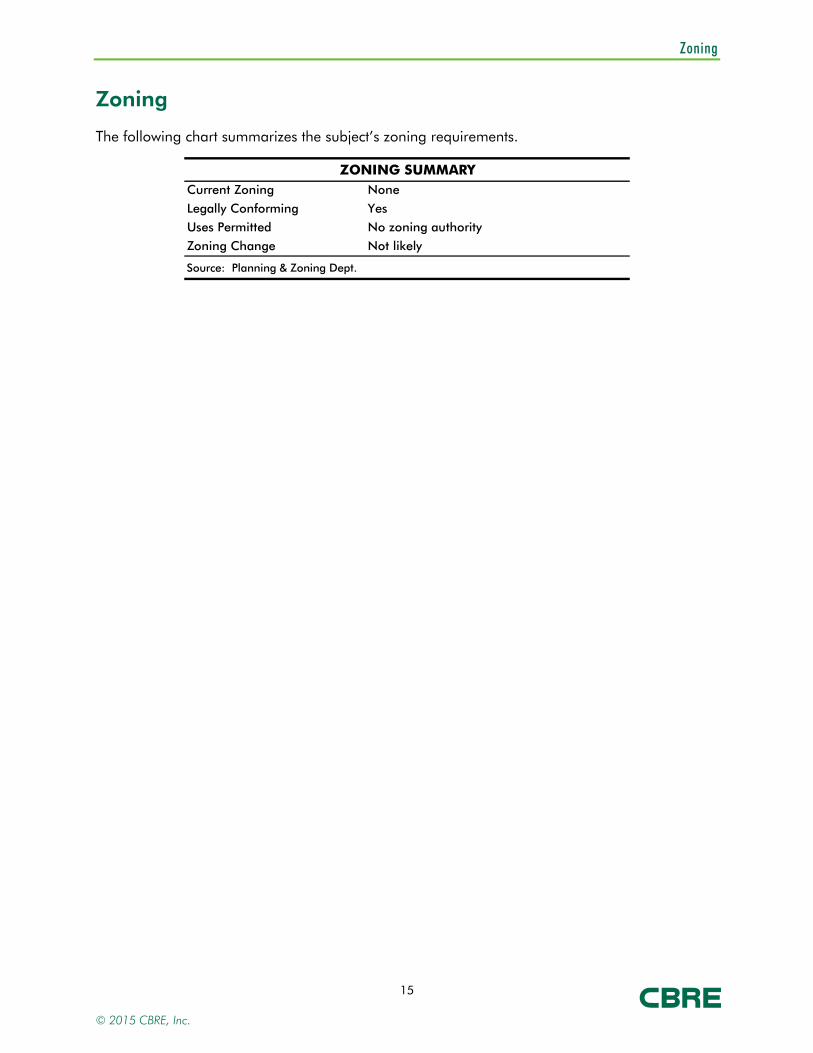
Zoning
The following chart summarizes the subject’s zoning requirements.
ZONING SUMMARYCurrent Zoning None
Legally Conforming Yes
Uses Permitted No zoning authority
Zoning Change Not likely
Source: Planning & Zoning Dept.
© 2015 CBRE, Inc.
Tax Assessment Data
16
Tax Assessment Data
The following summarizes the local assessor’s estimate of the subject’s market value, assessed
value, and taxes, and does not include any furniture, fixtures or equipment. The CBRE estimated
tax obligation is also shown.
AD VALOREM TAX INFORMATION
Assessor's Market Value Parcel Description 2013 2014 Pro Forma
'5-7.0-36-0-0-11.000 $2,255,770 $2,255,770
Subtotal $2,255,770 $2,255,770 $2,255,770
Assessed Value @ 32% 32% 32%
$721,846 $721,846 $721,846
General Tax Rate (per $100 A.V.) 4.179722 4.179722 4.179722
Total Taxes $30,171 $30,171 $30,171
Source: Assessor's Office
Based on the foregoing, the total taxes for the subject have been estimated as $30,171 for the
base year of our analysis, based upon an assessed value of $721,846 or $7 per square foot.
This is in line with the current and historical assessment.
For purposes of this analysis, CBRE, Inc. assumes that all taxes are current.
© 2015 CBRE, Inc.

Market Analysis
17
Market Analysis
The market analysis forms a basis for assessing market area boundaries, supply and demand
factors, and indications of financial feasibility.
There is not an industrial report that surveys the area’s industrial inventory, occupancies or rental
rates. The subject will be briefly addressed in this section of the report as it relates to the region.
The subject is currently 100% occupied by an owner-user, USA Tank.
The subject is located in a rural area between Goodman and Anderson and is considered a Class
C manufacturing facility.
MARKET OVERVIEW
The following discussion illustrates some general observations in the surrounding industrial
market.
The subject is 100% owner occupied by USA Tank. It is a custom tank manufacturing company.
The following history is taken from the USA Tank website at www.usatanksales.com.
USA Tank Storage Systems has been engineering and constructing customized storage systems
for over 30 years. We design and erect storage tanks for potable water, fire protection,
wastewater, and petroleum industries.
Our knowledgeable staff has designed and erected more than 5,000 tanks in 25 countries. We
have over 400 years of leadership in the tank containment industry.
Barriers to Entry
There is minimal amount of new industrial construction in the McDonald County area. Any of the
new industrial construction is build-to-suit properties. There is no speculative construction in the
subject’s area that would pose any substantial competition for the subject.
There are no deed restrictions that would prevent development in the subject’s immediate vicinity.
Additionally, there are no geographical or infrastructure limitations that would preclude
development.
In view of the above, there are few barriers to entry other than demand.
Demand Generators
Demand generators for the subject area primarily consist of its low labor cost as well as its
regional access.
Goodman is located in southwestern Missouri with good regional access. Tulsa is 95-miles
southwest, Joplin 30-miles north, Wichita 175 miles northwest, and Fayetteville, Arkansas 45-
miles south.
© 2015 CBRE, Inc.
Market Analysis
18
Demand for industrial facilities is driven by good highway access; affordable land and affordable
labor. McDonald County provides all these attributes. Most of the distribution/manufacturing
facilities in the area ship their goods all over the state and region. Consequently, the remote
location to a major metro area is balanced out by the low labor cost and business overhead.
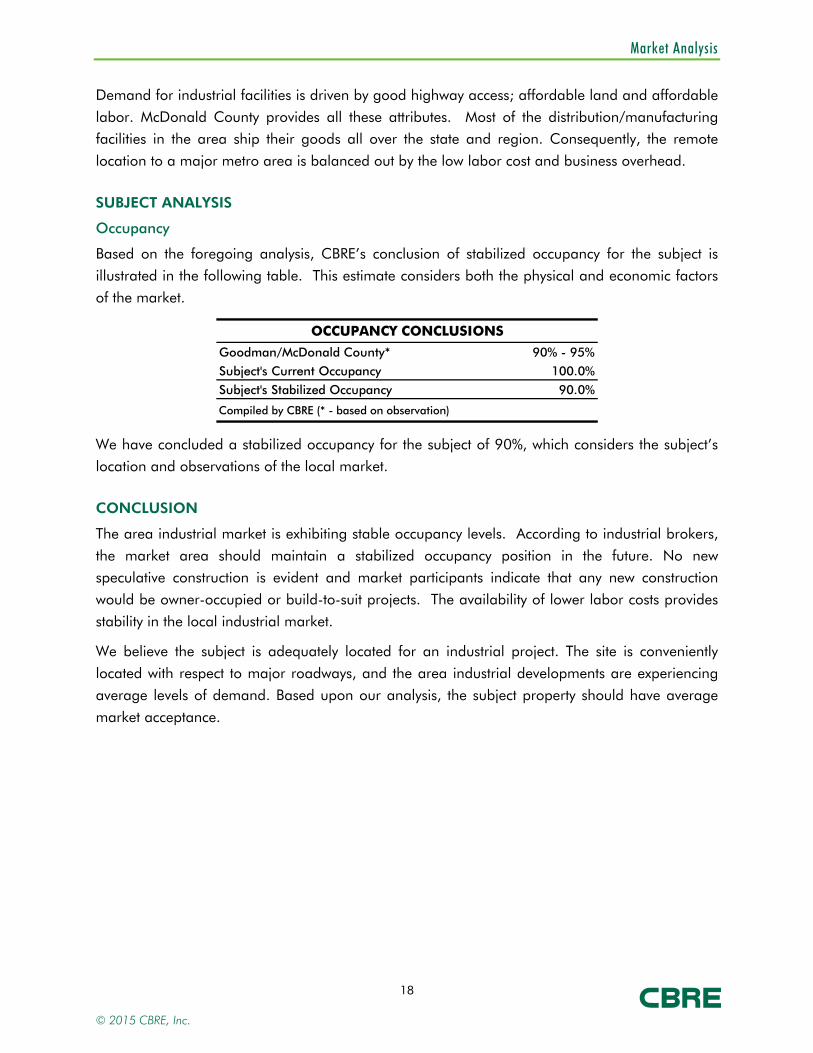
SUBJECT ANALYSIS
Occupancy
Based on the foregoing analysis, CBRE’s conclusion of stabilized occupancy for the subject is
illustrated in the following table. This estimate considers both the physical and economic factors
of the market.
OCCUPANCY CONCLUSIONS
Goodman/McDonald County* 90% - 95%
Subject's Current Occupancy 100.0%
Subject's Stabilized Occupancy 90.0%
Compiled by CBRE (* - based on observation)
We have concluded a stabilized occupancy for the subject of 90%, which considers the subject’s
location and observations of the local market.
CONCLUSION
The area industrial market is exhibiting stable occupancy levels. According to industrial brokers,
the market area should maintain a stabilized occupancy position in the future. No new
speculative construction is evident and market participants indicate that any new construction
would be owner-occupied or build-to-suit projects. The availability of lower labor costs provides
stability in the local industrial market.
We believe the subject is adequately located for an industrial project. The site is conveniently
located with respect to major roadways, and the area industrial developments are experiencing
average levels of demand. Based upon our analysis, the subject property should have average
market acceptance.
© 2015 CBRE, Inc.
Highest and Best Use
19
Highest and Best Use
In appraisal practice, the concept of highest and best use represents the premise upon which
value is based. The four criteria the highest and best use must meet are:
legally permissible; physically possible; financially feasible; and maximally productive.
The highest and best use analysis of the subject is discussed below.
AS VACANT
The property is zoned for industrial use and is of sufficient size to accommodate various types of
development. The immediate area includes various industrial land uses. Considering the
surrounding land uses, location attributes, legal restrictions and other factors, it is our opinion
that an industrial oriented use would be reasonable and appropriate. Overall, there is significant
risk in the market and most investors would not move forward with new construction at this time
without significant pre-leasing, tax incentives, or special financing. Therefore, the highest and
best use of the site, as vacant, would be to hold for future industrial development when economic
conditions improve with the likely user being an owner/user.
AS IMPROVED
As improved, the subject involves an industrial-oriented facility. The current use is legally
permissible and physically possible. The improvements continue to contribute value to the
property and based on our analysis, the existing use is financially feasible. Therefore, it is our
opinion that the highest and best use of the subject, as improved, is for continued industrial
related use.
© 2015 CBRE, Inc.

Appraisal Methodology
20
Appraisal Methodology
In appraisal practice, an approach to value is included or omitted based on its applicability to the
property type being valued and the quality and quantity of information available.
COST APPROACH
The cost approach is based on the proposition that the informed purchaser would pay no more
for the subject than the cost to produce a substitute property with equivalent utility. This approach
is particularly applicable when the property being appraised involves relatively new improvements
that represent the highest and best use of the land, or when it is improved with relatively unique
or specialized improvements for which there exist few sales or leases of comparable properties.
SALES COMPARISON APPROACH
The sales comparison approach utilizes sales of comparable properties, adjusted for differences,
to indicate a value for the subject. Valuation is typically accomplished using physical units of
comparison such as price per square foot, price per unit, price per floor, etc., or economic units
of comparison such as gross rent multiplier. Adjustments are applied to the physical units of
comparison derived from the comparable sale. The unit of comparison chosen for the subject is
then used to yield a total value. Economic units of comparison are not adjusted, but rather
analyzed as to relevant differences, with the final estimate derived based on the general
comparisons.
INCOME CAPITALIZATION APPROACH
The income capitalization approach reflects the subject’s income-producing capabilities. This
approach is based on the assumption that value is created by the expectation of benefits to be
derived in the future. Specifically estimated is the amount an investor would be willing to pay to
receive an income stream plus reversion value from a property over a period of time. The two
common valuation techniques associated with the income capitalization approach are direct
capitalization and the discounted cash flow (DCF) analysis.
METHODOLOGY APPLICABLE TO THE SUBJECT
In valuing the subject, only the cost and sales comparison approaches are applicable and have
been used. The income approach is not applicable in the estimation of market value because
most manufacturing facilities like the subject are owner-occupied and rarely leased.
© 2015 CBRE, Inc.
Land Value
21
Land Value
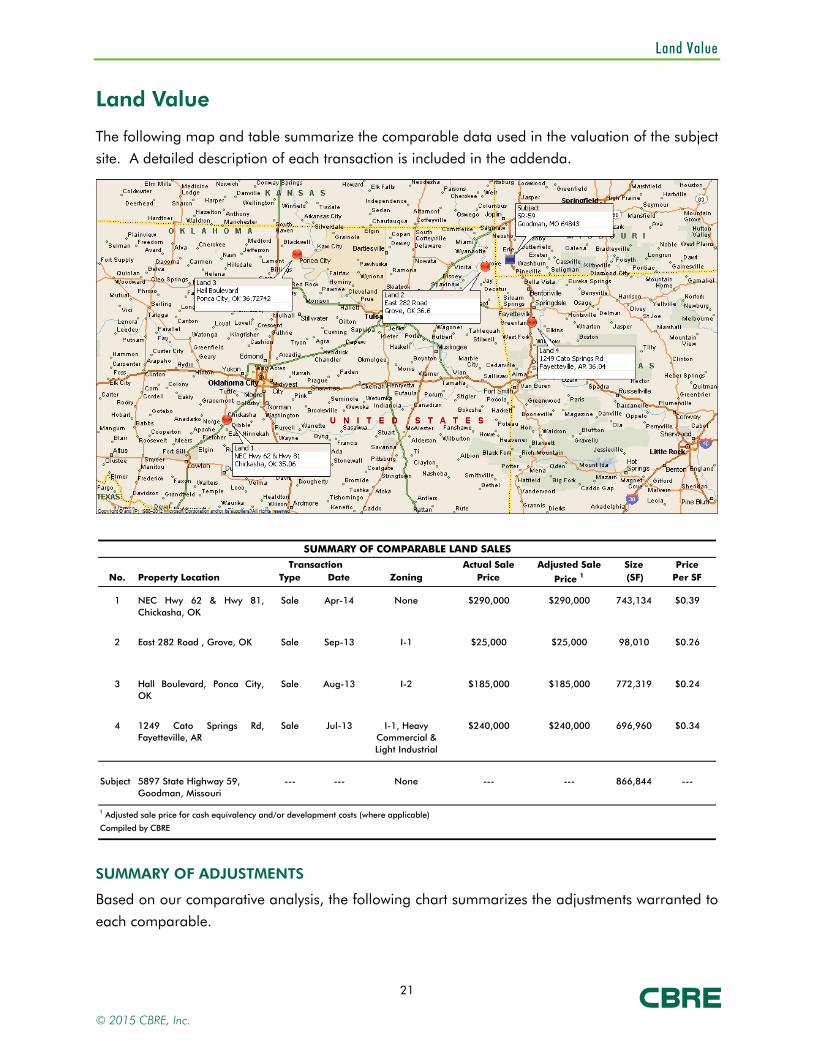
The following map and table summarize the comparable data used in the valuation of the subject
site. A detailed description of each transaction is included in the addenda.
SUMMARY OF COMPARABLE LAND SALES
Actual Sale Adjusted Sale Size PriceNo. Property Location Type Date Zoning Price Price 1 (SF) Per SF
1 NEC Hwy 62 & Hwy 81,Chickasha, OK
Sale Apr-14 None $290,000 $290,000 743,134 $0.39
2 East 282 Road , Grove, OK Sale Sep-13 I-1 $25,000 $25,000 98,010 $0.26
3 Hall Boulevard, Ponca City,OK
Sale Aug-13 I-2 $185,000 $185,000 772,319 $0.24
4 1249 Cato Springs Rd,Fayetteville, AR
Sale Jul-13 I-1, Heavy Commercial & Light Industrial
$240,000 $240,000 696,960 $0.34
Subject 5897 State Highway 59,Goodman, Missouri
--- --- None --- --- 866,844 ---
1 Adjusted sale price for cash equivalency and/or development costs (where applicable)
Compiled by CBRE
Transaction
SUMMARY OF ADJUSTMENTS
Based on our comparative analysis, the following chart summarizes the adjustments warranted to
each comparable.
© 2015 CBRE, Inc.

Land Value
22
LAND SALES ADJUSTMENT GRID
Comparable Number 1 2 3 4 Subject
Transaction Type Sale Sale Sale Sale ---
Transaction Date Apr-14 Sep-13 Aug-13 Jul-13 ---Zoning None I-1 I-2 I-1, Heavy
Commercial & None
Actual Sale Price $290,000 $25,000 $185,000 $240,000 ---
Adjusted Sale Price 1 $290,000 $25,000 $185,000 $240,000 ---
Size (Acres) 17.06 2.25 17.73 16.00 19.90Size (SF) 743,134 98,010 772,319 696,960 866,844
Price Per SF $0.39 $0.26 $0.24 $0.34 ---
Price ($ PSF) $0.39 $0.26 $0.24 $0.34Property Rights Conveyed 0% 0% 0% 0%Financing Terms 1
0% 0% 0% 0%
Conditions of Sale 0% 0% 0% 0%
Market Conditions (Time) 0% 0% 0% 0%Subtotal $0.39 $0.26 $0.24 $0.34Size 0% -5% 0% 0%Shape 0% 0% 0% 0%Corner 0% 0% 0% 0%Frontage -10% 0% 0% 0%Topography 0% 0% 0% 0%Location 0% 0% 0% 0%Zoning/Density 0% 0% 0% 0%Utilities -10% -10% -10% -10%Highest & Best Use 0% 0% 0% 0%Total Other Adjustments -20% -15% -10% -10%
Value Indication for Subject $0.31 $0.22 $0.22 $0.31
Absolute Adjustment 20% 15% 10% 10%1 Adjusted sale price for cash equivalency and/or development costs (where applicable)
Compiled by CBRE
MARKET PARTICIPANTS
Broker Name/Company Range Jack Forrest / Forrest Realty $0.20 - $0.35 / SF
CONCLUSION
Based on the preceding analysis, the four comparables were give equal consideration. In
conclusion, a price per square foot indication towards the middle of the range was most
appropriate for the subject. The following table presents the valuation conclusion:
© 2015 CBRE, Inc.

Land Value
23
CONCLUDED LAND VALUE
$ PSF Subject SF Total
$0.22 x 866,844 = $186,878$0.31 x 866,844 = $270,621
Indicated Value: $230,000(Rounded $ PSF) $0.27
Compiled by CBRE
The value equates to approximately $0.27 per square foot. This falls within the range of $0.22
to $0.31 indicated by the comparable sales, thereby lending support to our value conclusion.
© 2015 CBRE, Inc.
Cost Approach
24
Cost Approach
REPLACEMENT COST NEW
To estimate the replacement cost new for the subject, the comparative unit method has been
employed. Direct and indirect building costs, and entrepreneurial profit are estimated based on
Marshall Valuation Service (MVS) cost data, the subject’s actual construction cost, and/or actual
construction cost data for a comparable properties. Based on the quantity and quality of the
available cost data, the subject’s estimated replacement cost new is based primarily on MVS.
© 2015 CBRE, Inc.
Cost Approach
25
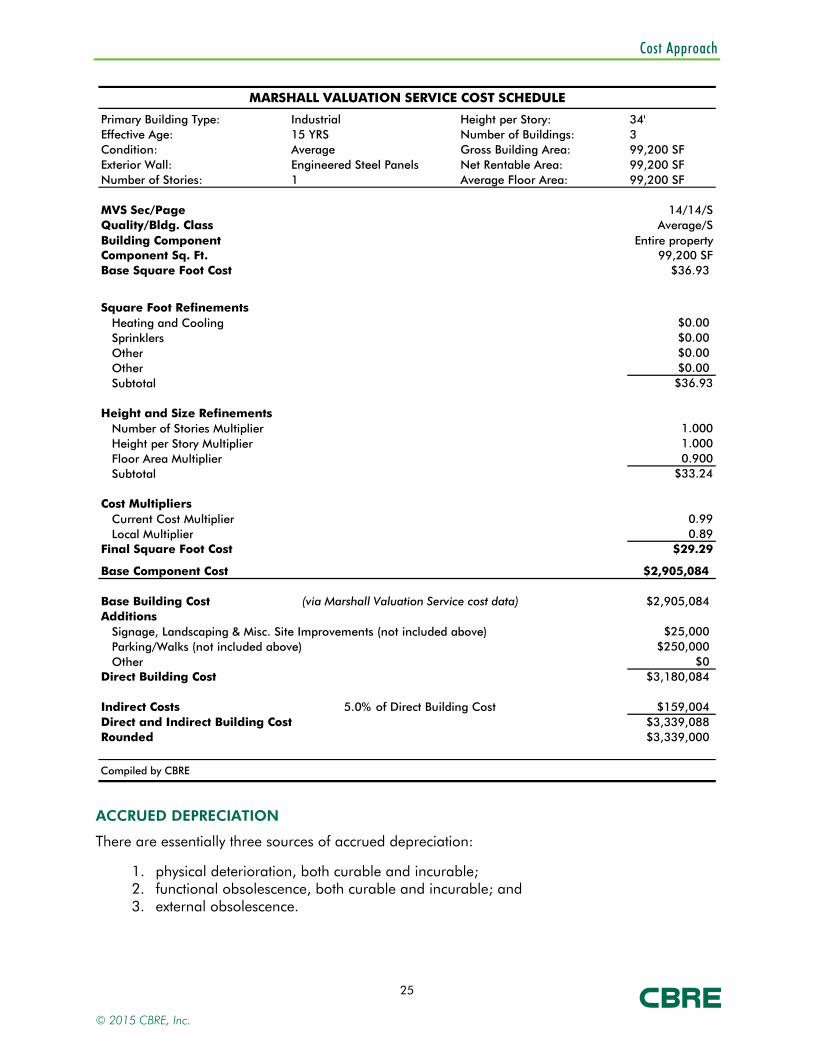
MARSHALL VALUATION SERVICE COST SCHEDULE
Primary Building Type: Height per Story: 34'Effective Age: Number of Buildings: 3Condition: Gross Building Area: 99,200 SFExterior Wall: Net Rentable Area: 99,200 SFNumber of Stories: Average Floor Area: 99,200 SF
MVS Sec/Page 14/14/SQuality/Bldg. Class Average/SBuilding Component Entire propertyComponent Sq. Ft. 99,200 SFBase Square Foot Cost $36.93
Square Foot RefinementsHeating and Cooling $0.00Sprinklers $0.00Other $0.00Other $0.00Subtotal $36.93
Height and Size RefinementsNumber of Stories Multiplier 1.000Height per Story Multiplier 1.000Floor Area Multiplier 0.900Subtotal $33.24
Cost MultipliersCurrent Cost Multiplier 0.99Local Multiplier 0.89
Final Square Foot Cost $29.29
Base Component Cost $2,905,084
Base Building Cost (via Marshall Valuation Service cost data) $2,905,084Additions
Signage, Landscaping & Misc. Site Improvements (not included above) $25,000Parking/Walks (not included above) $250,000Other $0
Direct Building Cost $3,180,084
Indirect Costs 5.0% of Direct Building Cost $159,004Direct and Indirect Building Cost $3,339,088Rounded $3,339,000
Compiled by CBRE
1
Industrial15 YRSAverageEngineered Steel Panels
ACCRUED DEPRECIATION
There are essentially three sources of accrued depreciation:
1. physical deterioration, both curable and incurable; 2. functional obsolescence, both curable and incurable; and 3. external obsolescence.
© 2015 CBRE, Inc.
Cost Approach
26
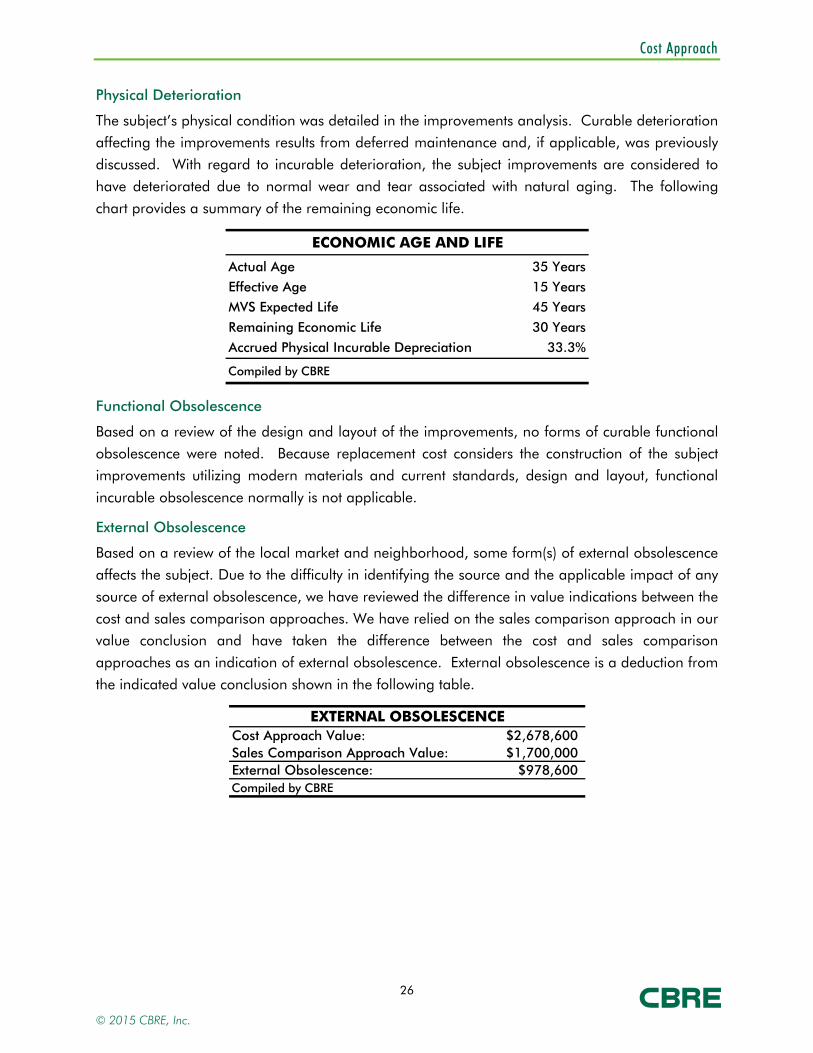
Physical Deterioration
The subject’s physical condition was detailed in the improvements analysis. Curable deterioration
affecting the improvements results from deferred maintenance and, if applicable, was previously
discussed. With regard to incurable deterioration, the subject improvements are considered to
have deteriorated due to normal wear and tear associated with natural aging. The following
chart provides a summary of the remaining economic life.
ECONOMIC AGE AND LIFE
Actual Age 35 Years
Effective Age 15 YearsMVS Expected Life 45 Years
Remaining Economic Life 30 Years
Accrued Physical Incurable Depreciation 33.3%
Compiled by CBRE
Functional Obsolescence
Based on a review of the design and layout of the improvements, no forms of curable functional
obsolescence were noted. Because replacement cost considers the construction of the subject
improvements utilizing modern materials and current standards, design and layout, functional
incurable obsolescence normally is not applicable.
External Obsolescence
Based on a review of the local market and neighborhood, some form(s) of external obsolescence
affects the subject. Due to the difficulty in identifying the source and the applicable impact of any
source of external obsolescence, we have reviewed the difference in value indications between the
cost and sales comparison approaches. We have relied on the sales comparison approach in our
value conclusion and have taken the difference between the cost and sales comparison
approaches as an indication of external obsolescence. External obsolescence is a deduction from
the indicated value conclusion shown in the following table.
EXTERNAL OBSOLESCENCECost Approach Value: $2,678,600Sales Comparison Approach Value: $1,700,000External Obsolescence: $978,600Compiled by CBRE
© 2015 CBRE, Inc.

Cost Approach
27
COST APPROACH CONCLUSION
The value estimate is calculated as follows.
COST APPROACH CONCLUSION
Primary Building Type: Height per Story: 34'Effective Age: Number of Buildings: 3Condition: Gross Building Area: 99,200 SFExterior Wall: Net Rentable Area: 99,200 SFNumber of Stories: Average Floor Area: 99,200 SF
Direct and Indirect Building Cost $3,339,000
Entrepreneurial Profit 10.0% of Total Building Cost $333,900
Replacement Cost New $3,672,900
Accrued DepreciationUnfinished Shell Space $0Incurable Physical Deterioration 33.3% ($1,224,300)
Functional Obsolescence $0External Obsolescence ($978,600)
Total Accrued Depreciation 60.0% of Replacement Cost New ($2,202,900)
Contributory Value of FF&E $0
Depreciated Replacement Cost $1,470,000
Land Value $230,000Indicated Stabilized Value $1,700,000Rounded $1,700,000
Curable Physical Deterioration $0Lease-Up Discount $0
Indicated As Is Value $1,700,000Rounded $1,700,000Value Per SF $17.14
Compiled by CBRE
of Replacement Cost New less Curable Physical Deterioration
1
Industrial15 YRS
Engineered Steel PanelsAverage
© 2015 CBRE, Inc.

Sales Comparison Approach
28
Sales Comparison Approach
The following map and table summarize the comparable data used in the valuation of the
subject. A detailed description of each transaction is included in the addenda.
SUMMARY OF COMPARABLE INDUSTRIAL SALES
Year GBA Percent Percent Clear Land to Actual Sale Adjusted Sale PriceNo. Name Type Date Built (SF) Office Air Cond. Height Bldg. Ratio Price Price 1 Per SF 1
1 Warehouse Property,W. Sunchase Court,Fayetteville, AR
Sale Jul-14 1998 76,096 1.0% 1.0% 16 4.71 : 1 $1,375,000 $1,375,000 $18.07
2 Former - Guardian Glass,1412 South 1st Street,Rogers, AR
Sale Mar-14 1980 51,538 2.9% 2.9% 8 6.66 : 1 $650,000 $650,000 $12.61
3 Union Manurfacturing Building,1 Trans Tech Drive,Union, MO
Sale May-13 1994 55,200 4.5% 100.0% 18 6.67 : 1 $1,300,000 $1,300,000 $23.55
4 Office Warehouse,2435 Cooper Drive,Ardmore, OK
Sale Apr-13 1995 40,435 34.9% 100.0% 24 7.7 : 1 $1,200,000 $1,200,000 $29.68
5 K & M Tire, Inc.,1120 East State Highway 152,Mustang, OK
Sale Mar-13 1996 48,000 0.0% 0.0% 20 11.12 : 1 $1,000,000 $1,000,000 $20.83
Subj.Pro
Forma
USA Tank,5897 State Highway 59,Goodman, Missouri
--- --- 1980 99,200 14.5% 15.0% 34 Ft. 8.74 : 1 --- --- ---
1 Adjusted sale price for cash equivalency, lease-up and/or deferred maintenance (where applicable)
Compiled by CBRE
Transaction
The sales utilized represent the best data available for comparison with the subject. They were
selected from our research of comparable improved sales on a regional basis. These sales were
chosen based upon age, recency, use, location in rural areas, and proximity.
© 2015 CBRE, Inc.

Sales Comparison Approach
29
DISCUSSION/ANALYSIS OF IMPROVED SALES
Improved Sale One
This comparable represents a 76,096-square-foot industrial facility and is situated on an 8.21-
acre parcel at W. Sunchase Court, Fayetteville, AR. The improvements were originally
constructed in 1998 and were considered in average condition at the time of sale. The exterior
walls depict metal construction components and the land-to-building ratio was indicated as 4.71
to 1. The property's clear height was indicated as 16 feet while the percentage of air conditioning
and office space was indicated as 1.0% and 1.0%, respectively. The property sold in July 2014
for $1,375,000, or $18.07 per square foot.
In terms of age/condition, this comparable was judged superior due to its newer effective age
and received a downward adjustment for this characteristic. An adjustment for clear height was
considered appropriate for this comparable given its shorter clear height. Because of this inferior
trait, an upward adjustment was considered appropriate. The adjustment for % office finish was
warranted due to its significantly lower percentage of office finish. Therefore, an upward
adjustment was judged proper for this comparable. The downward adjustment for water source
was considered reasonable due to its municipal water supply. Overall, this comparable was
deemed superior in comparison to the subject and a downward net adjustment was warranted to
the sales price indicator.
Improved Sale Two
This comparable represents a 51,538-square-foot industrial facility and is situated on a 7.88-
acre parcel at 1412 South 1st Street, Rogers, AR. The improvements were originally constructed
in 1980 and were considered in average condition at the time of sale. The exterior walls depict
metal construction components and the land-to-building ratio was indicated as 6.66 to 1. The
property's clear height was indicated as 8 - 20 feet while the percentage of air conditioning and
office space was indicated as 2.9% and 2.9%, respectively. The property sold in March 2014 for
$650,000, or $12.61 per square foot.
An adjustment for clear height was considered appropriate for this comparable given its shorter
clear height. Because of this inferior trait, an upward adjustment was considered appropriate.
The adjustment for % office finish was warranted due to its significantly lower percentage of office
finish. Therefore, an upward adjustment was judged proper for this comparable. The downward
adjustment for water source was considered reasonable due to its municipal water supply.
Overall, the adjustments applied to this comparable resulted in a net adjustment of zero, whereby
the property was deemed similar in comparison to the subject.
Improved Sale Three
This comparable represents a 55,200-square-foot industrial facility and is situated on an 8.45-
acre parcel at 1 Trans Tech Drive, Union, MO. The improvements were originally constructed in
1994 and were considered in average condition at the time of sale. The exterior walls depict
© 2015 CBRE, Inc.

Sales Comparison Approach
30
metal construction components and the land-to-building ratio was indicated as 6.67 to 1. The
property's clear height was indicated as 18 feet while the percentage of air conditioning and
office space was indicated as 100.0% and 4.5%, respectively. The property sold in May 2013 for
$1,300,000, or $23.55 per square foot.
In terms of age/condition, this comparable was judged superior due to its newer effective age
and received a downward adjustment for this characteristic. An adjustment for clear height was
considered appropriate for this comparable given its shorter clear height. Because of this inferior
trait, an upward adjustment was considered appropriate. The downward adjustment for water
source was considered reasonable due to its municipal water supply. Overall, this comparable
was deemed superior in comparison to the subject and a downward net adjustment was
warranted to the sales price indicator.
Improved Sale Four
This comparable represents a 40,435-square-foot industrial facility and is situated on a 7.15-
acre parcel at 2435 Cooper Drive, Ardmore, OK. The improvements were originally constructed
in 1995 and were considered in average condition at the time of sale. The exterior walls depict
tilt up concrete construction components and the land-to-building ratio was indicated as 7.7 to 1.
The property's clear height was indicated as 24 feet while the percentage of air conditioning and
office space was indicated as 100.0% and 34.9%, respectively. The property sold in April 2013
for $1,200,000, or $29.68 per square foot.
In terms of age/condition, this comparable was judged superior due to its newer effective age
and received a downward adjustment for this characteristic. A downward adjustment was
applied to this comparable for its superior quality of construction attribute when compared to the
subject, based upon its masonry consturction components. An adjustment for clear height was
considered appropriate for this comparable given its shorter clear height. Because of this inferior
trait, an upward adjustment was considered appropriate. The downward adjustment for water
source was considered reasonable due to its municipal water supply. Overall, this comparable
was deemed superior in comparison to the subject and a downward net adjustment was
warranted to the sales price indicator.
Improved Sale Five
This comparable represents a 48,000-square-foot industrial facility and is situated on a 12.25-
acre parcel at 1120 East State Highway 152, Mustang, OK. The improvements were originally
constructed in 1996 and were considered in average condition at the time of sale. The exterior
walls depict metal construction components and the land-to-building ratio was indicated as
11.12 to 1. The property's clear height was indicated as 20 feet while the percentage of air
conditioning and office space was indicated as 0% and 0%, respectively. The property sold in
March 2013 for $1,000,000, or $20.83 per square foot.
© 2015 CBRE, Inc.
Sales Comparison Approach
31
In terms of age/condition, this comparable was judged superior due to its newer effective age
and received a downward adjustment for this characteristic. An adjustment for clear height was
considered appropriate for this comparable given its shorter clear height. Because of this inferior
trait, an upward adjustment was considered appropriate. The adjustment for % office finish was
warranted due to its significantly lower percentage of office finish. Therefore, an upward
adjustment was judged proper for this comparable. The downward adjustment for water source
was considered reasonable due to its municipal water supply. Overall, this comparable was
deemed superior in comparison to the subject and a downward net adjustment was warranted to
the sales price indicator.
SUMMARY OF ADJUSTMENTS
Based on our comparative analysis, the following chart summarizes the adjustments warranted to
each comparable.
© 2015 CBRE, Inc.
Sales Comparison Approach
32
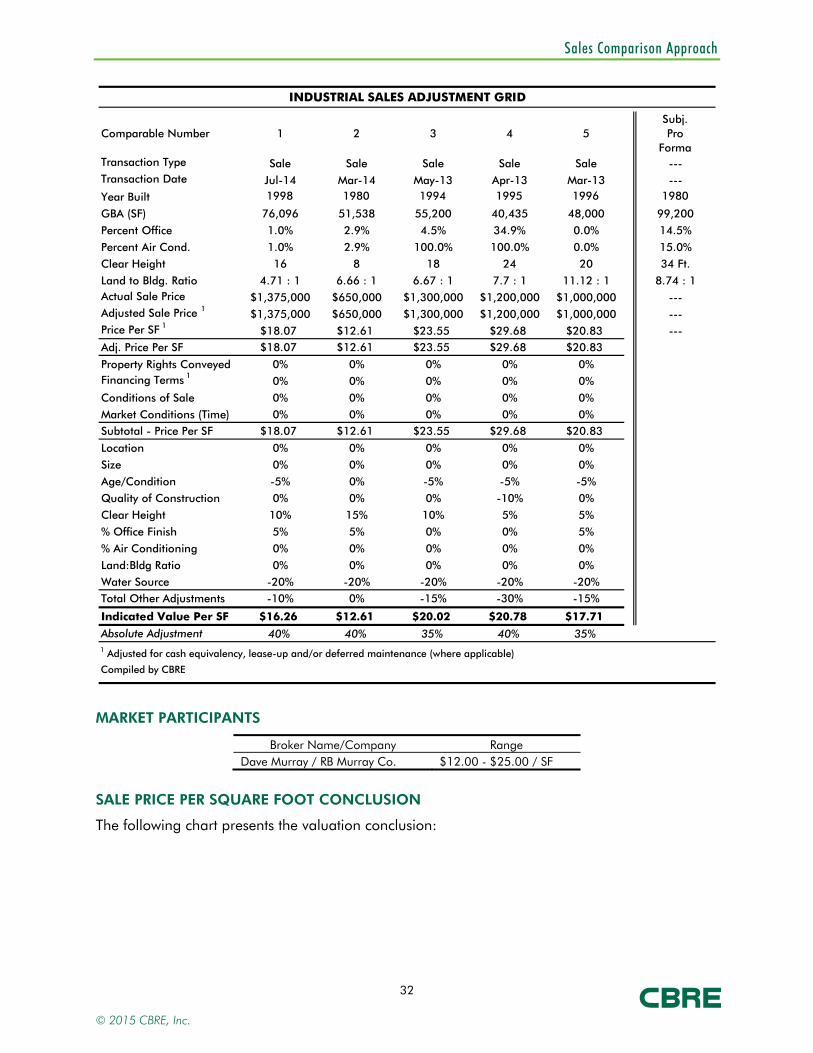
INDUSTRIAL SALES ADJUSTMENT GRID
Comparable Number 1 2 3 4 5Subj.Pro
FormaTransaction Type Sale Sale Sale Sale Sale ---Transaction Date Jul-14 Mar-14 May-13 Apr-13 Mar-13 ---Year Built 1998 1980 1994 1995 1996 1980
GBA (SF) 76,096 51,538 55,200 40,435 48,000 99,200
Percent Office 1.0% 2.9% 4.5% 34.9% 0.0% 14.5%
Percent Air Cond. 1.0% 2.9% 100.0% 100.0% 0.0% 15.0%Clear Height 16 8 18 24 20 34 Ft.
Land to Bldg. Ratio 4.71 : 1 6.66 : 1 6.67 : 1 7.7 : 1 11.12 : 1 8.74 : 1Actual Sale Price $1,375,000 $650,000 $1,300,000 $1,200,000 $1,000,000 ---Adjusted Sale Price 1 $1,375,000 $650,000 $1,300,000 $1,200,000 $1,000,000 ---Price Per SF 1
$18.07 $12.61 $23.55 $29.68 $20.83 ---Adj. Price Per SF $18.07 $12.61 $23.55 $29.68 $20.83
Property Rights Conveyed 0% 0% 0% 0% 0%Financing Terms 1
0% 0% 0% 0% 0%
Conditions of Sale 0% 0% 0% 0% 0%Market Conditions (Time) 0% 0% 0% 0% 0%Subtotal - Price Per SF $18.07 $12.61 $23.55 $29.68 $20.83
Location 0% 0% 0% 0% 0%
Size 0% 0% 0% 0% 0%
Age/Condition -5% 0% -5% -5% -5%Quality of Construction 0% 0% 0% -10% 0%
Clear Height 10% 15% 10% 5% 5%
% Office Finish 5% 5% 0% 0% 5%
% Air Conditioning 0% 0% 0% 0% 0%
Land:Bldg Ratio 0% 0% 0% 0% 0%Water Source -20% -20% -20% -20% -20%Total Other Adjustments -10% 0% -15% -30% -15%
Indicated Value Per SF $16.26 $12.61 $20.02 $20.78 $17.71
Absolute Adjustment 40% 40% 35% 40% 35%1 Adjusted for cash equivalency, lease-up and/or deferred maintenance (where applicable)
Compiled by CBRE
MARKET PARTICIPANTS
Broker Name/Company Range Dave Murray / RB Murray Co. $12.00 - $25.00 / SF
SALE PRICE PER SQUARE FOOT CONCLUSION
The following chart presents the valuation conclusion:
© 2015 CBRE, Inc.

Sales Comparison Approach
33
SALES COMPARISON APPROACH
GBA (SF) X Value Per SF = Value
99,200 X $12.61 = $1,250,912
99,200 X $20.78 = $2,060,979
VALUE CONCLUSION
Indicated Stabilized Value $1,700,000
Deferred Maintenance $0
Lease-Up Discount $0
Indicated As Is Value $1,700,000
Rounded $1,700,000
Value Per SF $17.14
Compiled by CBRE
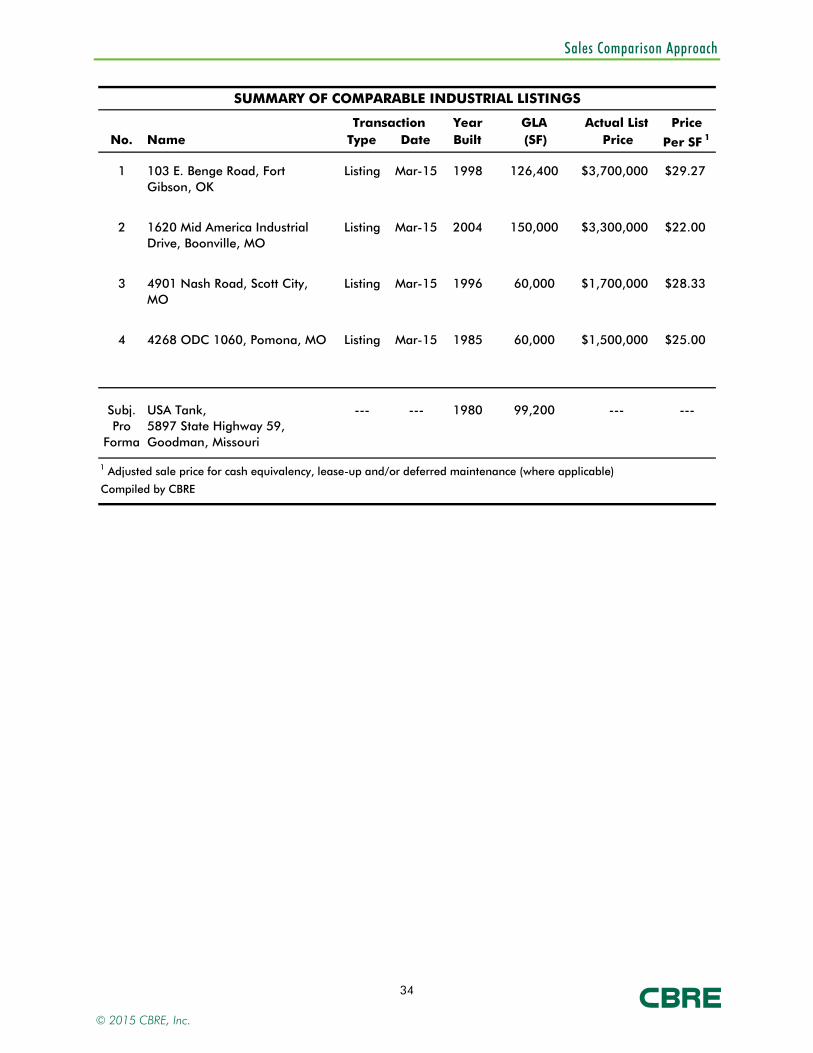
LISTINGS
As further support we have researched regional listings of improved industrial properties as
shown in the table below. After a 15% - 40% discount from the average listing price of $26.15/sf
is considered, the resulting price range of $15.69/sf - $22.23/sf is in line with our value
conclusion.
© 2015 CBRE, Inc.
Sales Comparison Approach
34
SUMMARY OF COMPARABLE INDUSTRIAL LISTINGS
Year GLA Actual List PriceNo. Name Type Date Built (SF) Price Per SF 1
1 103 E. Benge Road, Fort Gibson, OK
Listing Mar-15 1998 126,400 $3,700,000 $29.27
2 1620 Mid America Industrial Drive, Boonville, MO
Listing Mar-15 2004 150,000 $3,300,000 $22.00
3 4901 Nash Road, Scott City, MO
Listing Mar-15 1996 60,000 $1,700,000 $28.33
4 4268 ODC 1060, Pomona, MO Listing Mar-15 1985 60,000 $1,500,000 $25.00
Subj.Pro
Forma
USA Tank,5897 State Highway 59,Goodman, Missouri
--- --- 1980 99,200 --- ---
1 Adjusted sale price for cash equivalency, lease-up and/or deferred maintenance (where applicable)
Compiled by CBRE
Transaction
© 2015 CBRE, Inc.
Reconciliation of Value
35
Reconciliation of Value
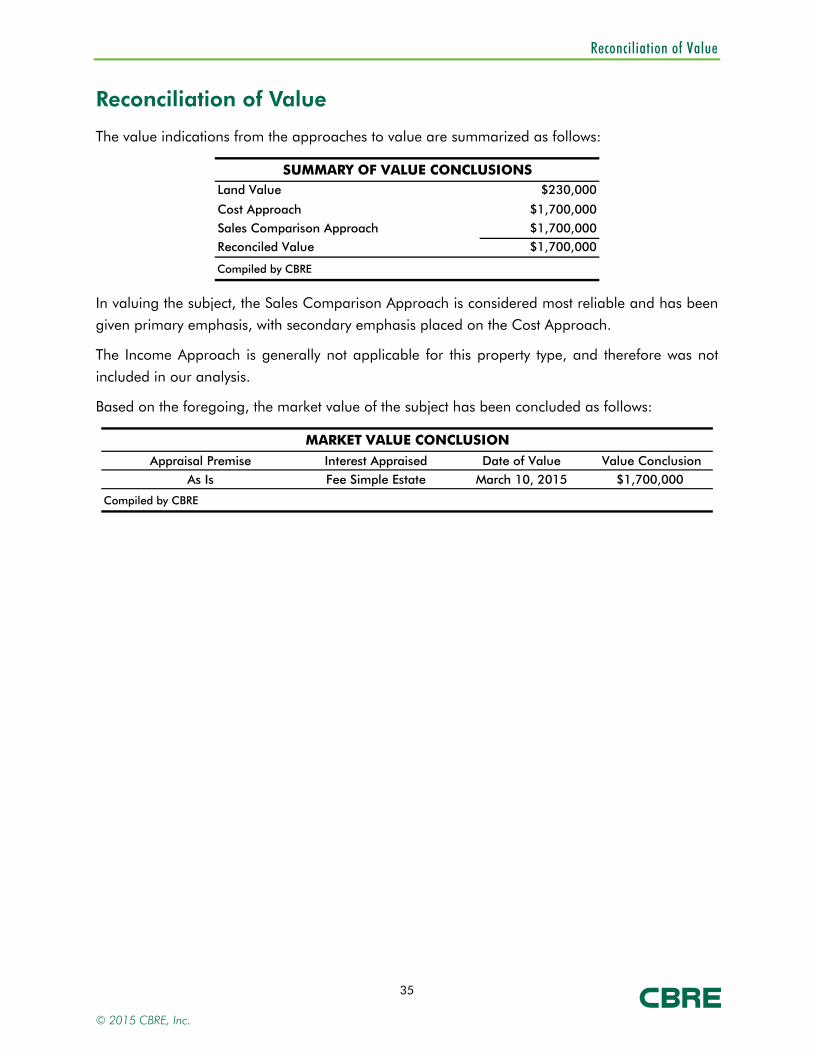
The value indications from the approaches to value are summarized as follows:
SUMMARY OF VALUE CONCLUSIONSLand Value $230,000
Cost Approach $1,700,000
Sales Comparison Approach $1,700,000 Reconciled Value $1,700,000
Compiled by CBRE
In valuing the subject, the Sales Comparison Approach is considered most reliable and has been
given primary emphasis, with secondary emphasis placed on the Cost Approach.
The Income Approach is generally not applicable for this property type, and therefore was not
included in our analysis.
Based on the foregoing, the market value of the subject has been concluded as follows:
MARKET VALUE CONCLUSION
Appraisal Premise Interest Appraised Date of Value Value Conclusion
As Is Fee Simple Estate March 10, 2015 $1,700,000
Compiled by CBRE
© 2015 CBRE, Inc.

Assumptions and Limiting Conditions
36
Assumptions and Limiting Conditions
1. Unless otherwise specifically noted in the body of the report, it is assumed that title to the property or properties appraised is clear and marketable and that there are no recorded or unrecorded matters or exceptions to title that would adversely affect marketability or value. CBRE, Inc. is not aware of any title defects nor has it been advised of any unless such is specifically noted in the report. CBRE, Inc., however, has not examined title and makes no representations relative to the condition thereof. Documents dealing with liens, encumbrances, easements, deed restrictions, clouds and other conditions that may affect the quality of title have not been reviewed. Insurance against financial loss resulting in claims that may arise out of defects in the subject’s title should be sought from a qualified title company that issues or insures title to real property.
2. Unless otherwise specifically noted in the body of this report, it is assumed: that the existing improvements on the property or properties being appraised are structurally sound, seismically safe and code conforming; that all building systems (mechanical/electrical, HVAC, elevator, plumbing, etc.) are in good working order with no major deferred maintenance or repair required; that the roof and exterior are in good condition and free from intrusion by the elements; that the property or properties have been engineered in such a manner that the improvements, as currently constituted, conform to all applicable local, state, and federal building codes and ordinances. CBRE, Inc. professionals are not engineers and are not competent to judge matters of an engineering nature. CBRE, Inc. has not retained independent structural, mechanical, electrical, or civil engineers in connection with this appraisal and, therefore, makes no representations relative to the condition of improvements. Unless otherwise specifically noted in the body of the report: no problems were brought to the attention of CBRE, Inc. by ownership or management; CBRE, Inc. inspected less than 100% of the entire interior and exterior portions of the improvements; and CBRE, Inc. was not furnished any engineering studies by the owners or by the party requesting this appraisal. If questions in these areas are critical to the decision process of the reader, the advice of competent engineering consultants should be obtained and relied upon. It is specifically assumed that any knowledgeable and prudent purchaser would, as a precondition to closing a sale, obtain a satisfactory engineering report relative to the structural integrity of the property and the integrity of building systems. Structural problems and/or building system problems may not be visually detectable. If engineering consultants retained should report negative factors of a material nature, or if such are later discovered, relative to the condition of improvements, such information could have a substantial negative impact on the conclusions reported in this appraisal. Accordingly, if negative findings are reported by engineering consultants, CBRE, Inc. reserves the right to amend the appraisal conclusions reported herein.
3. Unless otherwise stated in this report, the existence of hazardous material, which may or may not be present on the property was not observed by the appraisers. CBRE, Inc. has no knowledge of the existence of such materials on or in the property. CBRE, Inc., however, is not qualified to detect such substances. The presence of substances such as asbestos, urea formaldehyde foam insulation, contaminated groundwater or other potentially hazardous materials may affect the value of the property. The value estimate is predicated on the assumption that there is no such material on or in the property that would cause a loss in value. No responsibility is assumed for any such conditions, or for any expertise or engineering knowledge required to discover them. The client is urged to retain an expert in this field, if desired.
We have inspected, as thoroughly as possible by observation, the land; however, it was impossible to personally inspect conditions beneath the soil. Therefore, no representation is made as to these matters unless specifically considered in the appraisal.
4. All furnishings, equipment and business operations, except as specifically stated and typically considered as part of real property, have been disregarded with only real property being considered in the report unless otherwise stated. Any existing or proposed improvements, on or off-site, as well as any alterations or repairs considered, are assumed to be completed in a workmanlike manner according to standard practices based upon the information submitted to CBRE, Inc. This report may be subject to amendment upon re-inspection of the subject subsequent to repairs, modifications, alterations and completed new construction. Any estimate of Market Value is as of the date indicated; based upon the information, conditions and projected levels of operation.
5. It is assumed that all factual data furnished by the client, property owner, owner’s representative, or persons designated by the client or owner to supply said data are accurate and correct unless otherwise specifically noted in the appraisal report. Unless otherwise specifically noted in the appraisal report, CBRE, Inc. has no reason to believe that any of the data furnished contain any material error. Information and data referred to in this paragraph include, without being limited to, numerical street addresses, lot and block numbers, Assessor’s Parcel Numbers, land dimensions, square footage area of the land, dimensions of the improvements, gross building areas, net rentable areas, usable areas, unit count, room count, rent schedules, income data, historical operating expenses, budgets, and related data. Any material error in any of the above data could have a substantial impact
© 2015 CBRE, Inc.
Assumptions and Limiting Conditions
37
on the conclusions reported. Thus, CBRE, Inc. reserves the right to amend conclusions reported if made aware of any such error. Accordingly, the client-addressee should carefully review all assumptions, data, relevant calculations, and conclusions within 30 days after the date of delivery of this report and should immediately notify CBRE, Inc. of any questions or errors.
6. The date of value to which any of the conclusions and opinions expressed in this report apply, is set forth in the Letter of Transmittal. Further, that the dollar amount of any value opinion herein rendered is based upon the purchasing power of the American Dollar on that date. This appraisal is based on market conditions existing as of the date of this appraisal. Under the terms of the engagement, we will have no obligation to revise this report to reflect events or conditions which occur subsequent to the date of the appraisal. However, CBRE, Inc. will be available to discuss the necessity for revision resulting from changes in economic or market factors affecting the subject.
7. CBRE, Inc. assumes no private deed restrictions, limiting the use of the subject in any way.
8. Unless otherwise noted in the body of the report, it is assumed that there are no mineral deposit or subsurface rights of value involved in this appraisal, whether they be gas, liquid, or solid. Nor are the rights associated with extraction or exploration of such elements considered unless otherwise stated in this appraisal report. Unless otherwise stated it is also assumed that there are no air or development rights of value that may be transferred.
9. CBRE, Inc. is not aware of any contemplated public initiatives, governmental development controls, or rent controls that would significantly affect the value of the subject.
10. The estimate of Market Value, which may be defined within the body of this report, is subject to change with market fluctuations over time. Market value is highly related to exposure, time promotion effort, terms, motivation, and conclusions surrounding the offering. The value estimate(s) consider the productivity and relative attractiveness of the property, both physically and economically, on the open market.
11. Any cash flows included in the analysis are forecasts of estimated future operating characteristics are predicated on the information and assumptions contained within the report. Any projections of income, expenses and economic conditions utilized in this report are not predictions of the future. Rather, they are estimates of current market expectations of future income and expenses. The achievement of the financial projections will be affected by fluctuating economic conditions and is dependent upon other future occurrences that cannot be assured. Actual results may vary from the projections considered herein. CBRE, Inc. does not warrant these forecasts will occur. Projections may be affected by circumstances beyond the current realm of knowledge or control of CBRE, Inc.
12. Unless specifically set forth in the body of the report, nothing contained herein shall be construed to represent any direct or indirect recommendation of CBRE, Inc. to buy, sell, or hold the properties at the value stated. Such decisions involve substantial investment strategy questions and must be specifically addressed in consultation form.
13. Also, unless otherwise noted in the body of this report, it is assumed that no changes in the present zoning ordinances or regulations governing use, density, or shape are being considered. The property is appraised assuming that all required licenses, certificates of occupancy, consents, or other legislative or administrative authority from any local, state, nor national government or private entity or organization have been or can be obtained or renewed for any use on which the value estimates contained in this report is based, unless otherwise stated.
14. This study may not be duplicated in whole or in part without the specific written consent of CBRE, Inc. nor may this report or copies hereof be transmitted to third parties without said consent, which consent CBRE, Inc. reserves the right to deny. Exempt from this restriction is duplication for the internal use of the client-addressee and/or transmission to attorneys, accountants, or advisors of the client-addressee. Also exempt from this restriction is transmission of the report to any court, governmental authority, or regulatory agency having jurisdiction over the party/parties for whom this appraisal was prepared, provided that this report and/or its contents shall not be published, in whole or in part, in any public document without the express written consent of CBRE, Inc. which consent CBRE, Inc. reserves the right to deny. Finally, this report shall not be advertised to the public or otherwise used to induce a third party to purchase the property or to make a “sale” or “offer for sale” of any “security”, as such terms are defined and used in the Securities Act of 1933, as amended. Any third party, not covered by the exemptions herein, who may possess this report, is advised that they should rely on their own independently secured advice for any decision in connection with this property. CBRE, Inc. shall have no accountability or responsibility to any such third party.
15. Any value estimate provided in the report applies to the entire property, and any pro ration or division of the title into fractional interests will invalidate the value estimate, unless such pro ration or division of interests has been set forth in the report.
© 2015 CBRE, Inc.
Assumptions and Limiting Conditions
38
16. The distribution of the total valuation in this report between land and improvements applies only under the existing program of utilization. Component values for land and/or buildings are not intended to be used in conjunction with any other property or appraisal and are invalid if so used.
17. The maps, plats, sketches, graphs, photographs and exhibits included in this report are for illustration purposes only and are to be utilized only to assist in visualizing matters discussed within this report. Except as specifically stated, data relative to size or area of the subject and comparable properties has been obtained from sources deemed accurate and reliable. None of the exhibits are to be removed, reproduced, or used apart from this report.
18. No opinion is intended to be expressed on matters which may require legal expertise or specialized investigation or knowledge beyond that customarily employed by real estate appraisers. Values and opinions expressed presume that environmental and other governmental restrictions/conditions by applicable agencies have been met, including but not limited to seismic hazards, flight patterns, decibel levels/noise envelopes, fire hazards, hillside ordinances, density, allowable uses, building codes, permits, licenses, etc. No survey, engineering study or architectural analysis has been made known to CBRE, Inc. unless otherwise stated within the body of this report. If the Consultant has not been supplied with a termite inspection, survey or occupancy permit, no responsibility or representation is assumed or made for any costs associated with obtaining same or for any deficiencies discovered before or after they are obtained. No representation or warranty is made concerning obtaining these items. CBRE, Inc. assumes no responsibility for any costs or consequences arising due to the need, or the lack of need, for flood hazard insurance. An agent for the Federal Flood Insurance Program should be contacted to determine the actual need for Flood Hazard Insurance.
19. Acceptance and/or use of this report constitutes full acceptance of the Contingent and Limiting Conditions and special assumptions set forth in this report. It is the responsibility of the Client, or client’s designees, to read in full, comprehend and thus become aware of the aforementioned contingencies and limiting conditions. Neither the Appraiser nor CBRE, Inc. assumes responsibility for any situation arising out of the Client’s failure to become familiar with and understand the same. The Client is advised to retain experts in areas that fall outside the scope of the real estate appraisal/consulting profession if so desired.
20. CBRE, Inc. assumes that the subject analyzed herein will be under prudent and competent management and ownership; neither inefficient or super-efficient.
21. It is assumed that there is full compliance with all applicable federal, state, and local environmental regulations and laws unless noncompliance is stated, defined and considered in the appraisal report.
22. No survey of the boundaries of the property was undertaken. All areas and dimensions furnished are presumed to be correct. It is further assumed that no encroachments to the realty exist.
23. The Americans with Disabilities Act (ADA) became effective January 26, 1992. Notwithstanding any discussion of possible readily achievable barrier removal construction items in this report, CBRE, Inc. has not made a specific compliance survey and analysis of this property to determine whether it is in conformance with the various detailed requirements of the ADA. It is possible that a compliance survey of the property together with a detailed analysis of the requirements of the ADA could reveal that the property is not in compliance with one or more of the requirements of the ADA. If so, this fact could have a negative effect on the value estimated herein. Since CBRE, Inc. has no specific information relating to this issue, nor is CBRE, Inc. qualified to make such an assessment, the effect of any possible non-compliance with the requirements of the ADA was not considered in estimating the value of the subject.
24. Client shall not indemnify Appraiser or hold Appraiser harmless unless and only to the extent that the Client misrepresents, distorts, or provides incomplete or inaccurate appraisal results to others, which acts of the Client approximately result in damage to Appraiser. Notwithstanding the foregoing, Appraiser shall have no obligation under this Section with respect to any loss that is caused solely by the active negligence or willful misconduct of a Client and is not contributed to by any act or omission (including any failure to perform any duty imposed by law) by Appraiser. Client shall indemnify and hold Appraiser harmless from any claims, expenses, judgments or other items or costs arising as a result of the Client's failure or the failure of any of the Client's agents to provide a complete copy of the appraisal report to any third party. In the event of any litigation between the parties, the prevailing party to such litigation shall be entitled to recover, from the other, reasonable attorney fees and costs.
© 2015 CBRE, Inc.

Addenda
ADDENDA
© 2015 CBRE, Inc.
Addenda
Addendum A
LAND SALE DATA SHEETS
© 2015 CBRE, Inc.
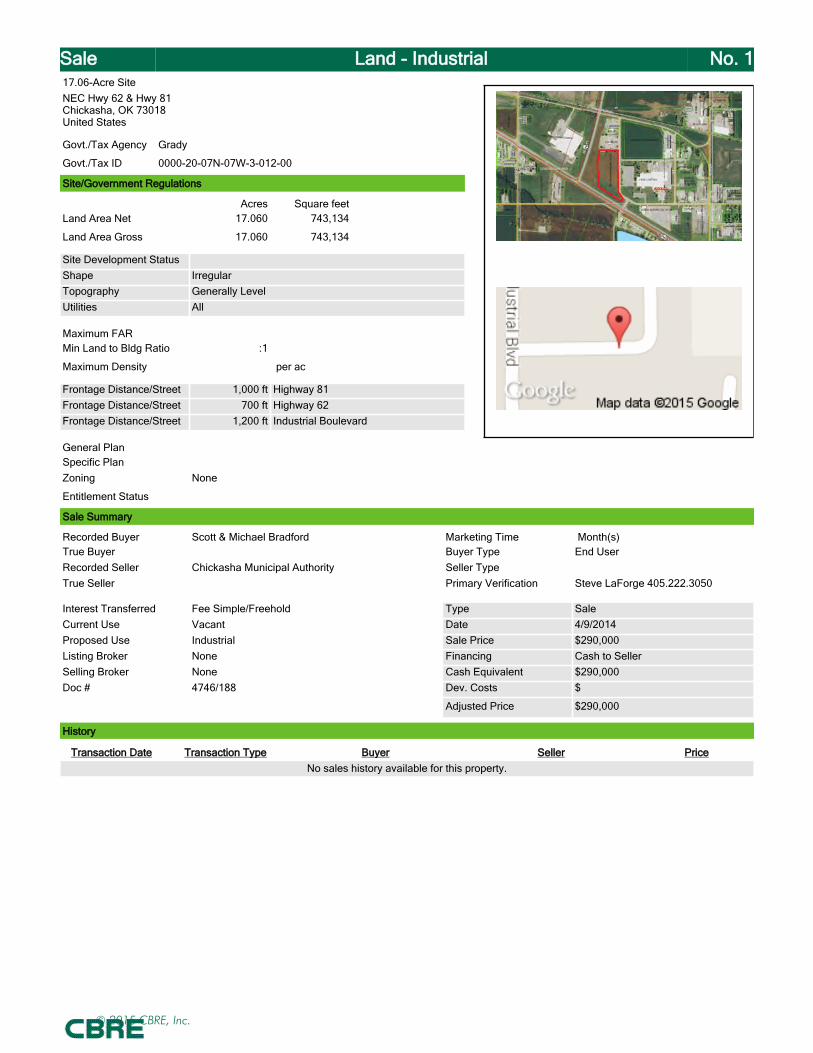
Sale Land - Industrial No. 1
NEC Hwy 62 & Hwy 81Chickasha, OK 73018United States
Govt./Tax Agency
Govt./Tax ID
Grady
0000-20-07N-07W-3-012-00
17.06-Acre Site
Site/Government Regulations
Acres Square feetLand Area Net 17.060 743,134
Land Area Gross 17.060 743,134
Site Development StatusShape IrregularTopography Generally LevelUtilities All
Maximum FARMin Land to Bldg Ratio :1
Maximum Density per ac
Frontage Distance/Street 1,000 ft Highway 81Frontage Distance/Street 700 ft Highway 62Frontage Distance/Street 1,200 ft Industrial Boulevard
General PlanSpecific PlanZoning None
Entitlement Status
Sale Summary
Recorded Buyer Scott & Michael Bradford Marketing Time Month(s)True Buyer Buyer Type End UserRecorded Seller Chickasha Municipal Authority Seller TypeTrue Seller Primary Verification Steve LaForge 405.222.3050
Interest Transferred Fee Simple/Freehold Type SaleCurrent Use Vacant Date 4/9/2014Proposed Use Industrial Sale Price $290,000Listing Broker None Financing Cash to SellerSelling Broker None Cash Equivalent $290,000Doc # 4746/188 Dev. Costs $
Adjusted Price $290,000
History
Transaction Date Transaction Type Buyer Seller PriceNo sales history available for this property.
© 2015 CBRE, Inc.

Sale Land - Industrial No. 1Units of Comparison
$0.39 / sf $ / Unit
$16,999.00 / ac $ / Building Area
Financial
Revenue TypePeriod EndingSourcePricePotential Gross IncomeEconomic OccupancyEconomic LossEffective Gross IncomeExpensesNet Operating IncomeNOI / sfNOI / UnitNet Initial Yield/Cap. RateEGIMOER
Comments
This is the April 2014 sale of a 17.06-acre tract of land on the northeast corner of Highway 62 and Highway 81 near the northwest edge of the Chickasha city limits. It has extensive frontage on two highways and one street. All utilities are available to the site and it is zoned I-2. The site was vacant at the time of sale and the buyer plans an industrial development. The land sold for $290,000, or $17,000 per acre.
© 2015 CBRE, Inc.
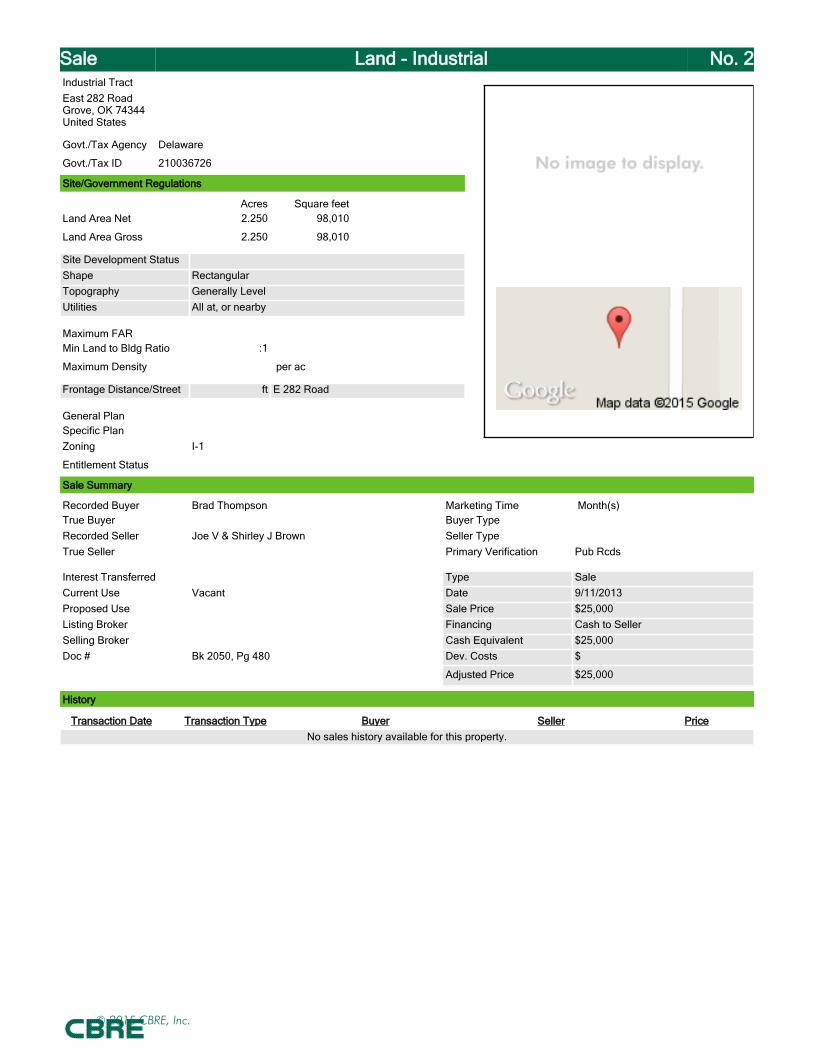
Sale Land - Industrial No. 2
East 282 Road Grove, OK 74344United States
Govt./Tax Agency
Govt./Tax ID
Delaware
210036726
Industrial Tract
Site/Government Regulations
Acres Square feetLand Area Net 2.250 98,010
Land Area Gross 2.250 98,010
Site Development StatusShape RectangularTopography Generally LevelUtilities All at, or nearby
Maximum FARMin Land to Bldg Ratio :1
Maximum Density per ac
Frontage Distance/Street ft E 282 Road
General PlanSpecific PlanZoning I-1
Entitlement Status
Sale Summary
Recorded Buyer Brad Thompson Marketing Time Month(s)True Buyer Buyer TypeRecorded Seller Joe V & Shirley J Brown Seller TypeTrue Seller Primary Verification Pub Rcds
Interest Transferred Type SaleCurrent Use Vacant Date 9/11/2013Proposed Use Sale Price $25,000Listing Broker Financing Cash to SellerSelling Broker Cash Equivalent $25,000Doc # Bk 2050, Pg 480 Dev. Costs $
Adjusted Price $25,000
History
Transaction Date Transaction Type Buyer Seller PriceNo sales history available for this property.
© 2015 CBRE, Inc.
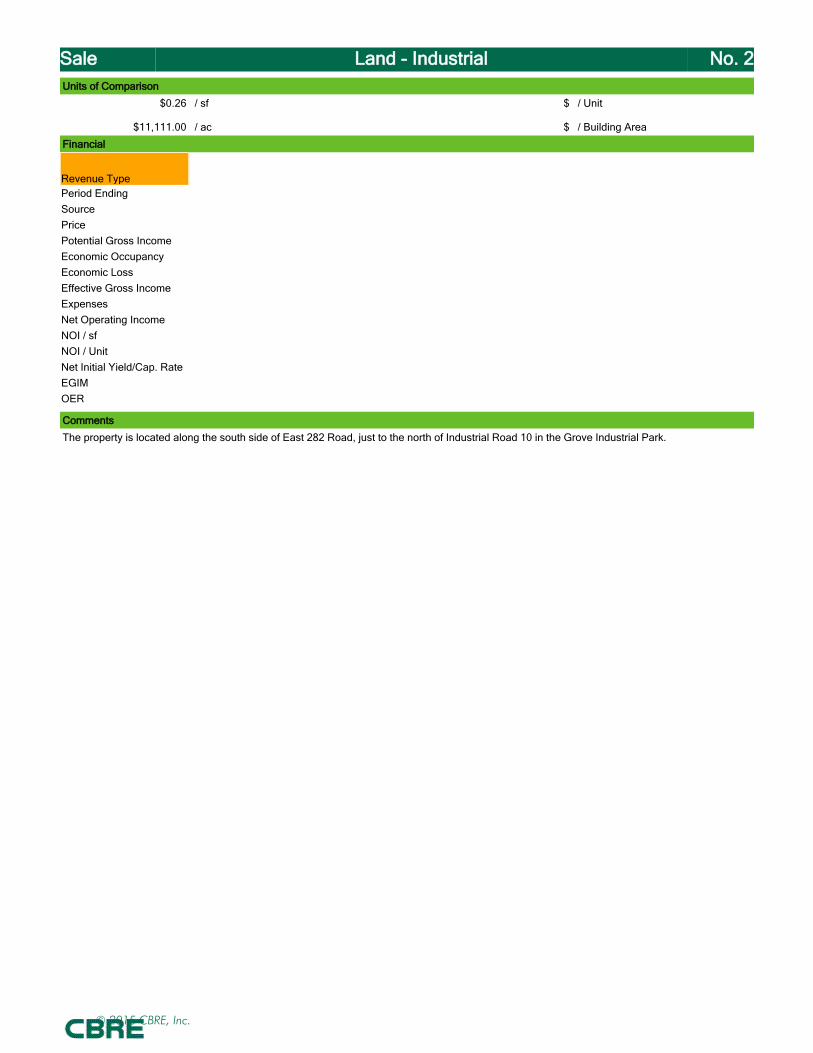
Sale Land - Industrial No. 2Units of Comparison
$0.26 / sf $ / Unit
$11,111.00 / ac $ / Building Area
Financial
Revenue TypePeriod EndingSourcePricePotential Gross IncomeEconomic OccupancyEconomic LossEffective Gross IncomeExpensesNet Operating IncomeNOI / sfNOI / UnitNet Initial Yield/Cap. RateEGIMOER
Comments
The property is located along the south side of East 282 Road, just to the north of Industrial Road 10 in the Grove Industrial Park.
© 2015 CBRE, Inc.

Sale Land - Industrial No. 3
Hall BoulevardPonca City, OK 74601United States
Govt./Tax Agency
Govt./Tax ID
Kay
1990-17-026-02E-4-004-02
Industrial Tract
Site/Government Regulations
Acres Square feetLand Area Net 17.730 772,319
Land Area Gross 17.730 772,319
Site Development StatusShape RectangularTopography Level, At Street GradeUtilities All
Maximum FARMin Land to Bldg Ratio :1
Maximum Density per ac
Frontage Distance/Street ft Hall Boulevard
General PlanSpecific PlanZoning I-2
Entitlement Status
Sale Summary
Recorded Buyer MJ&H Fabrication Marketing Time Month(s)True Buyer Buyer Type End UserRecorded Seller Ponca City Development
AuthoritySeller Type
True Seller Primary Verification David Myers & Pub Rcds
Interest Transferred Type SaleCurrent Use Vacant Date 8/13/2013Proposed Use Manufacturing Facility Sale Price $185,000Listing Broker Financing Cash to SellerSelling Broker Cash Equivalent $185,000Doc # Bk, 1618, Pg. 385 Dev. Costs $
Adjusted Price $185,000
History
Transaction Date Transaction Type Buyer Seller PriceNo sales history available for this property.
© 2015 CBRE, Inc.
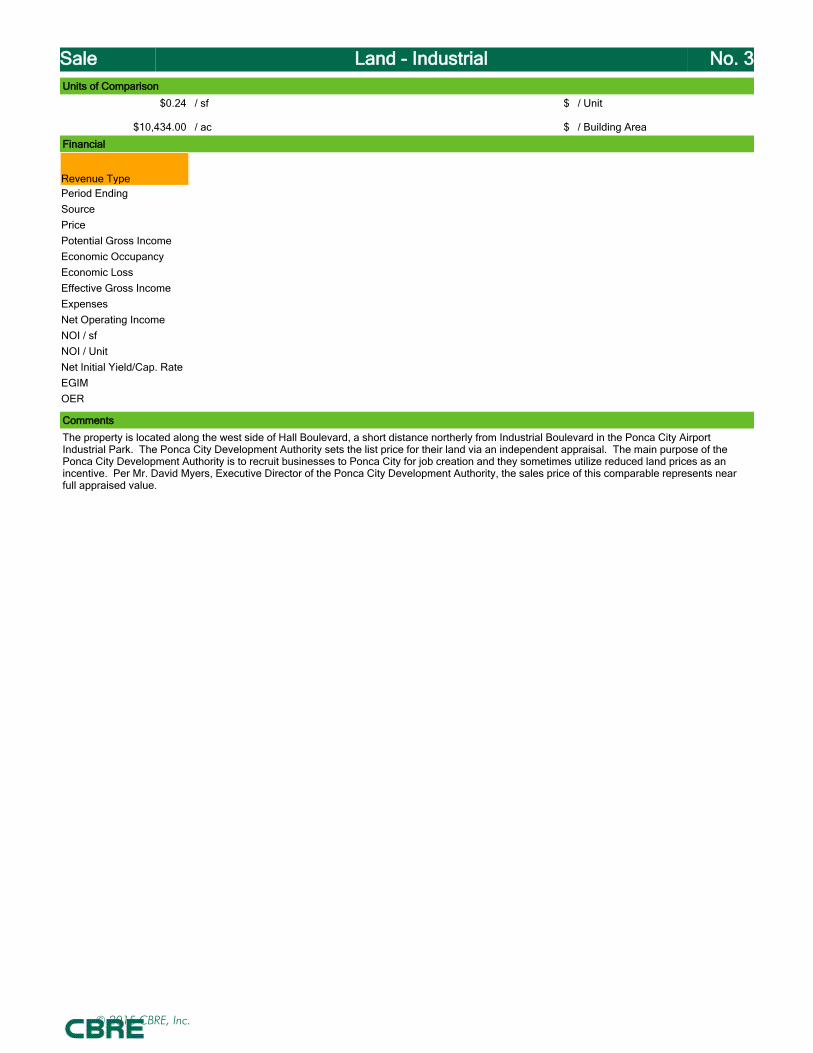
Sale Land - Industrial No. 3Units of Comparison
$0.24 / sf $ / Unit
$10,434.00 / ac $ / Building Area
Financial
Revenue TypePeriod EndingSourcePricePotential Gross IncomeEconomic OccupancyEconomic LossEffective Gross IncomeExpensesNet Operating IncomeNOI / sfNOI / UnitNet Initial Yield/Cap. RateEGIMOER
Comments
The property is located along the west side of Hall Boulevard, a short distance northerly from Industrial Boulevard in the Ponca City Airport Industrial Park. The Ponca City Development Authority sets the list price for their land via an independent appraisal. The main purpose of the Ponca City Development Authority is to recruit businesses to Ponca City for job creation and they sometimes utilize reduced land prices as an incentive. Per Mr. David Myers, Executive Director of the Ponca City Development Authority, the sales price of this comparable represents near full appraised value.
© 2015 CBRE, Inc.

Sale Land - Industrial No. 4
1249 Cato Springs RdFayetteville, AR 72701United States
Govt./Tax Agency
Govt./Tax ID
Washington
765-03013-000; 765-03015-000
Fayetteville Industrial Land
Site/Government Regulations
Acres Square feetLand Area Net 16.000 696,960
Land Area Gross 16.000 696,960
Site Development StatusShape IrregularTopography RollingUtilities Typical City
Maximum FARMin Land to Bldg Ratio :1
Maximum Density per ac
Frontage Distance/Street 390 ft Cato Springs Rd
General PlanSpecific PlanZoning I-1, Heavy Commercial & Light Industrial
Entitlement Status
Sale Summary
Recorded Buyer Moon Distributors, Inc Marketing Time 11 Month(s)True Buyer Buyer TypeRecorded Seller David & Judy Stevens Seller TypeTrue Seller Primary Verification MLS #659186, Deed Records
Interest Transferred Fee Simple/Freehold Type SaleCurrent Use Vacant Land Date 7/22/2013Proposed Use Industrial Sale Price $240,000Listing Broker Tim Davis - Griffin Co.
CommercialFinancing Cash to Seller
Selling Broker Hunter Thomason - Flake & Kelley
Cash Equivalent $240,000
Doc # 2013-24870 Dev. Costs $
Adjusted Price $240,000
History
Transaction Date Transaction Type Buyer Seller PriceNo sales history available for this property.
© 2015 CBRE, Inc.

Sale Land - Industrial No. 4Units of Comparison
$0.34 / sf $ / Unit
$15,000.00 / ac $ / Building Area
Financial
Revenue TypePeriod EndingSourcePricePotential Gross IncomeEconomic OccupancyEconomic LossEffective Gross IncomeExpensesNet Operating IncomeNOI / sfNOI / UnitNet Initial Yield/Cap. RateEGIMOER
Comments
The represents the sale of a 16± acre industrial tract of land located along the southern right-of-way of Cato Springs Rd, just east of the Cato Springs Rd/Razorback Rd intersection, in the southern part of the incorporated areas of Fayetteville, AR. The sale included some older improvements that were in disrepair and offered no contributory value to the land.
© 2015 CBRE, Inc.
Addenda
Addendum B
IMPROVED SALE DATA SHEETS
© 2015 CBRE, Inc.
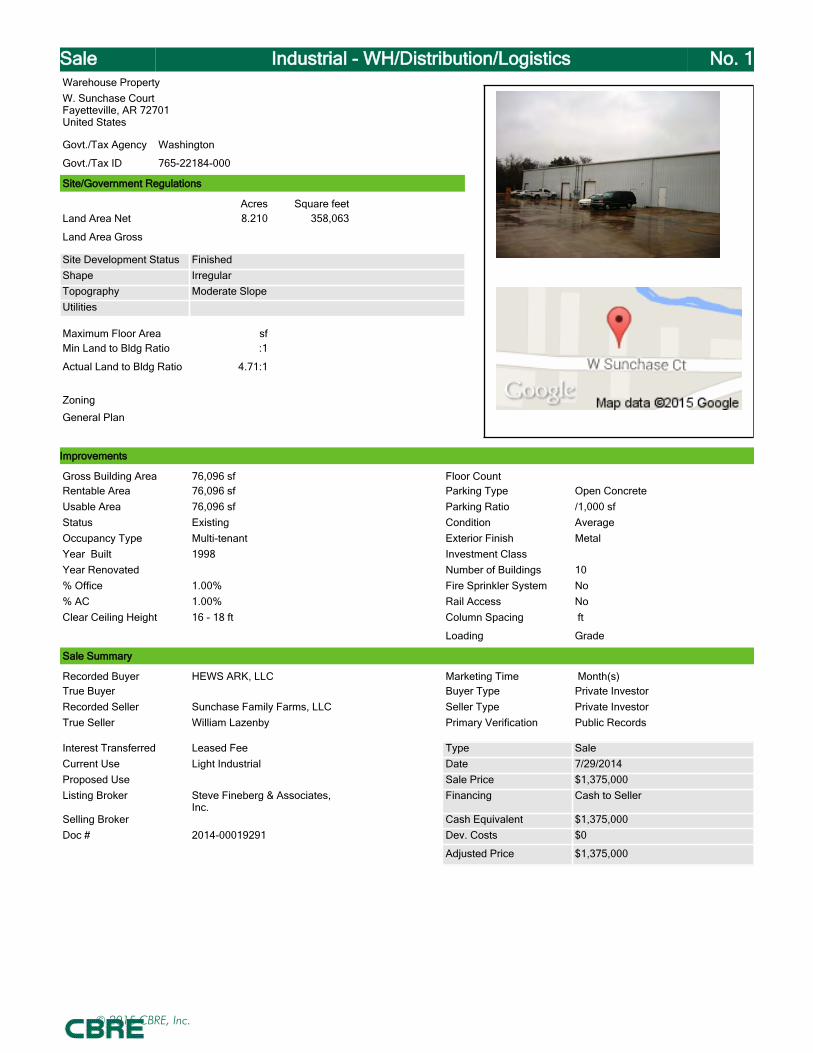
Sale Industrial - WH/Distribution/Logistics No. 1
W. Sunchase CourtFayetteville, AR 72701United States
Govt./Tax Agency
Govt./Tax ID
Washington
765-22184-000
Warehouse Property
Improvements
Gross Building Area 76,096 sf Floor CountRentable Area 76,096 sf Parking Type Open ConcreteUsable Area 76,096 sf Parking Ratio /1,000 sfStatus Existing Condition AverageOccupancy Type Multi-tenant Exterior Finish MetalYear Built 1998 Investment ClassYear Renovated Number of Buildings 10% Office 1.00% Fire Sprinkler System No% AC 1.00% Rail Access NoClear Ceiling Height 16 - 18 ft Column Spacing ft
Loading Grade
Site/Government Regulations
Acres Square feetLand Area Net 8.210 358,063
Land Area Gross
Site Development Status FinishedShape IrregularTopography Moderate SlopeUtilities
Maximum Floor Area sfMin Land to Bldg Ratio :1
Actual Land to Bldg Ratio 4.71:1
Zoning
General Plan
Sale Summary
Recorded Buyer HEWS ARK, LLC Marketing Time Month(s)True Buyer Buyer Type Private InvestorRecorded Seller Sunchase Family Farms, LLC Seller Type Private InvestorTrue Seller William Lazenby Primary Verification Public Records
Interest Transferred Leased Fee Type SaleCurrent Use Light Industrial Date 7/29/2014Proposed Use Sale Price $1,375,000Listing Broker Steve Fineberg & Associates,
Inc.Financing Cash to Seller
Selling Broker Cash Equivalent $1,375,000Doc # 2014-00019291 Dev. Costs $0
Adjusted Price $1,375,000
© 2015 CBRE, Inc.
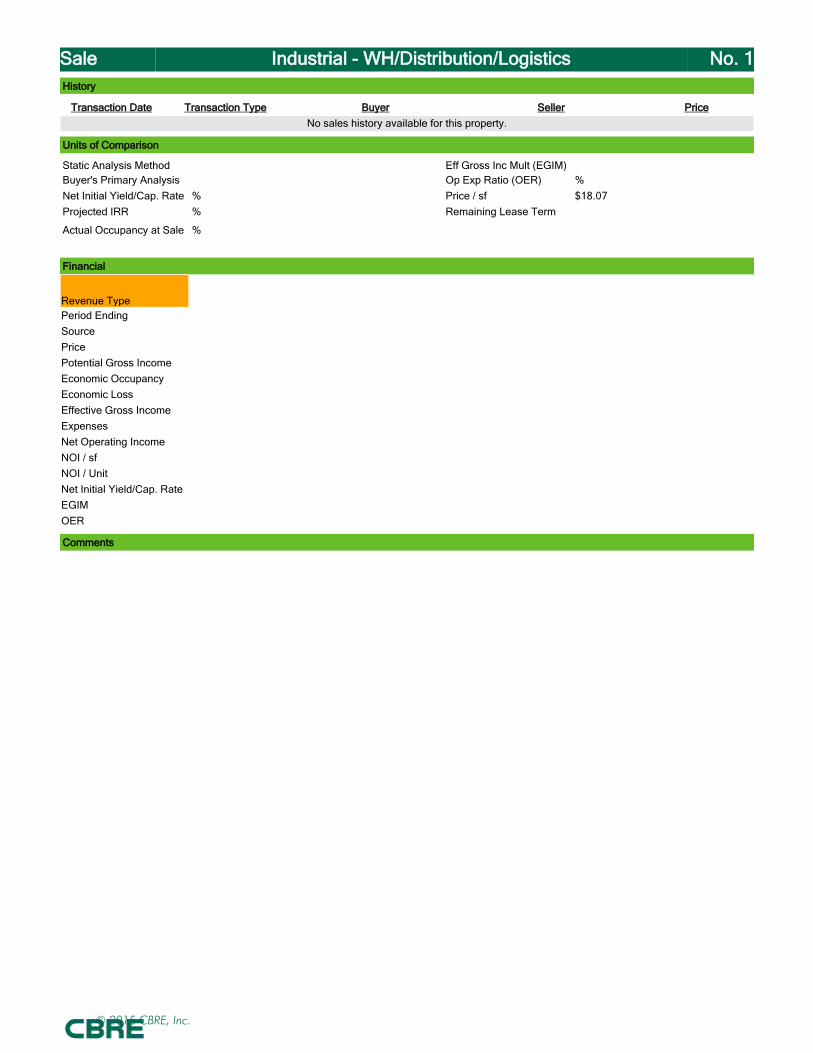
Sale Industrial - WH/Distribution/Logistics No. 1History
Transaction Date Transaction Type Buyer Seller PriceNo sales history available for this property.
Units of Comparison
Static Analysis Method Eff Gross Inc Mult (EGIM)Buyer's Primary Analysis Op Exp Ratio (OER) %Net Initial Yield/Cap. Rate % Price / sf $18.07Projected IRR % Remaining Lease Term
Actual Occupancy at Sale %
Financial
Revenue TypePeriod EndingSourcePricePotential Gross IncomeEconomic OccupancyEconomic LossEffective Gross IncomeExpensesNet Operating IncomeNOI / sfNOI / UnitNet Initial Yield/Cap. RateEGIMOER
Comments
© 2015 CBRE, Inc.
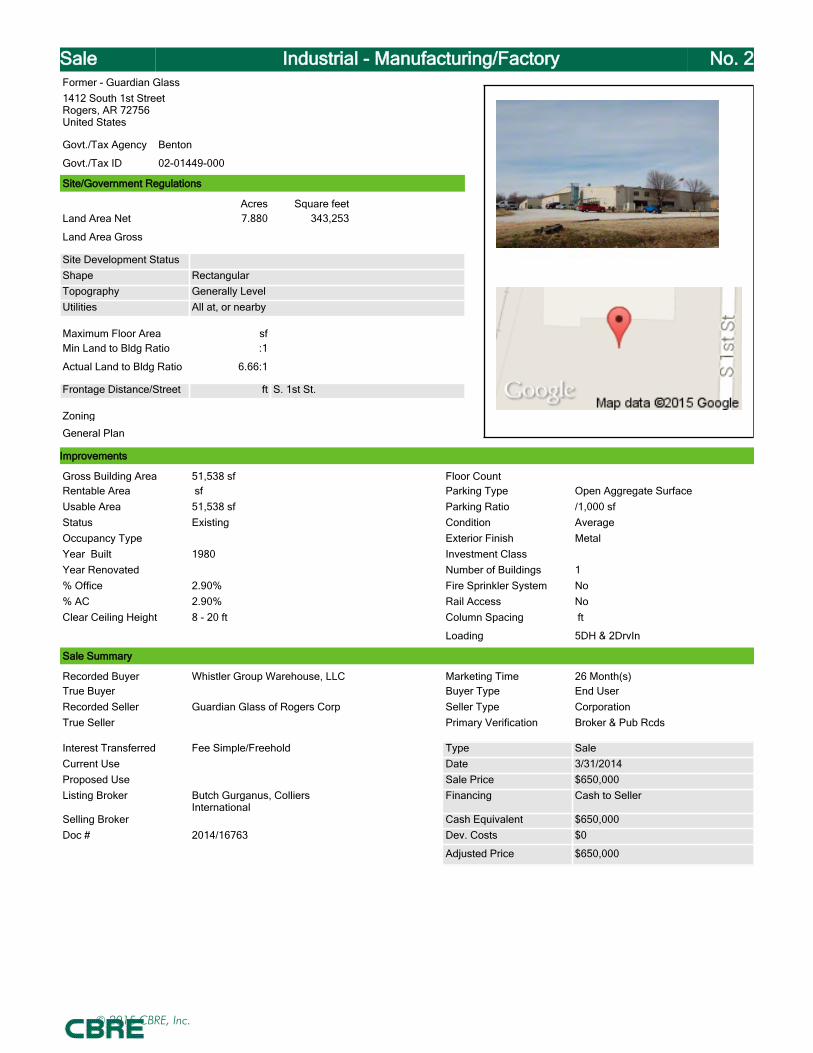
Sale Industrial - Manufacturing/Factory No. 2
1412 South 1st StreetRogers, AR 72756United States
Govt./Tax Agency
Govt./Tax ID
Benton
02-01449-000
Former - Guardian Glass
Improvements
Gross Building Area 51,538 sf Floor CountRentable Area sf Parking Type Open Aggregate SurfaceUsable Area 51,538 sf Parking Ratio /1,000 sfStatus Existing Condition AverageOccupancy Type Exterior Finish MetalYear Built 1980 Investment ClassYear Renovated Number of Buildings 1% Office 2.90% Fire Sprinkler System No% AC 2.90% Rail Access NoClear Ceiling Height 8 - 20 ft Column Spacing ft
Loading 5DH & 2DrvIn
Site/Government Regulations
Acres Square feetLand Area Net 7.880 343,253
Land Area Gross
Site Development StatusShape RectangularTopography Generally LevelUtilities All at, or nearby
Maximum Floor Area sfMin Land to Bldg Ratio :1
Actual Land to Bldg Ratio 6.66:1
Frontage Distance/Street ft S. 1st St.
Zoning
General Plan
Sale Summary
Recorded Buyer Whistler Group Warehouse, LLC Marketing Time 26 Month(s)True Buyer Buyer Type End UserRecorded Seller Guardian Glass of Rogers Corp Seller Type CorporationTrue Seller Primary Verification Broker & Pub Rcds
Interest Transferred Fee Simple/Freehold Type SaleCurrent Use Date 3/31/2014Proposed Use Sale Price $650,000Listing Broker Butch Gurganus, Colliers
InternationalFinancing Cash to Seller
Selling Broker Cash Equivalent $650,000Doc # 2014/16763 Dev. Costs $0
Adjusted Price $650,000
© 2015 CBRE, Inc.

Sale Industrial - Manufacturing/Factory No. 2History
Transaction Date Transaction Type Buyer Seller Price05/2013 Available/Listing $
Units of Comparison
Static Analysis Method Eff Gross Inc Mult (EGIM)Buyer's Primary Analysis Owner/Occupier Op Exp Ratio (OER) %Net Initial Yield/Cap. Rate % Price / sf $12.61Projected IRR 0.00% Remaining Lease Term
Actual Occupancy at Sale 0%
Comments
The property is located along the west side of South 1st Street, a short distance northerly from West Olrich Street in Rogers. This comparable represents a 51,538-square-foot industrial facility and is situated on a 7.88-acre parcel. The improvements were originally constructed in 1980 and were considered in average condition at the time of sale. The exterior walls depict metal construction components and the land-to-building ratio was indicated as 6.66 to 1. The property's clear height ranged from 8’ to 20’ while the percentage of air conditioning and office space was indicated as 2.9% and 2.9%, respectively. A 1,304 SF dwelling with minimal contributory value was included in the sale. The property was purchased for owner occupancy.
© 2015 CBRE, Inc.
Sale Industrial - Manufacturing/Factory No. 3
1 Trans Tech DriveUnion, MO 63084United States
Govt./Tax Agency
Govt./Tax ID
Franklin
17-5-220-0-015-053600
Union Manurfacturing Building
Improvements
Gross Building Area 55,200 sf Floor CountRentable Area 55,200 sf Parking Type SurfaceUsable Area sf Parking Ratio /1,000 sfStatus Existing Condition AverageOccupancy Type Exterior Finish MetalYear Built 1994 Investment ClassYear Renovated Number of Buildings 1% Office 4.50% Fire Sprinkler System yes% AC 100.00% Rail AccessClear Ceiling Height 18 - 20 ft Column Spacing ft
Loading 3 dock high, 1 drive in
Site/Government Regulations
Acres Square feetLand Area Net 8.450 368,082
Land Area Gross
Site Development StatusShapeTopographyUtilities
Maximum Floor Area sfMin Land to Bldg Ratio :1
Actual Land to Bldg Ratio 6.67:1
Zoning
General Plan
Sale Summary
Recorded Buyer Black Creek Management Marketing Time 7 Month(s)True Buyer Buyer Type End UserRecorded Seller Coinco Seller TypeTrue Seller Primary Verification Broker
Interest Transferred Type SaleCurrent Use Date 5/22/2013Proposed Use Sale Price $1,300,000Listing Broker CBRE Ben Haas - 314.655.6054 Financing Market Rate FinancingSelling Broker Cash Equivalent $1,300,000Doc # '000000008965 Dev. Costs $
Adjusted Price $1,300,000
© 2015 CBRE, Inc.
Sale Industrial - Manufacturing/Factory No. 3History
Transaction Date Transaction Type Buyer Seller PriceNo sales history available for this property.
Units of Comparison
Static Analysis Method Eff Gross Inc Mult (EGIM)Buyer's Primary Analysis Op Exp Ratio (OER) %Net Initial Yield/Cap. Rate % Price / sf $23.55Projected IRR % Remaining Lease Term
Actual Occupancy at Sale %
Financial
Revenue TypePeriod EndingSourcePricePotential Gross IncomeEconomic OccupancyEconomic LossEffective Gross IncomeExpensesNet Operating IncomeNOI / sfNOI / UnitNet Initial Yield/Cap. RateEGIMOER
Comments
This represents the May 2013 transfer of a 55,200 square foot single-tenant industrial building in Union, Franklin County, Missouri. The comparable was constructed in in 1994, was renovated in 1996, and reflected average overall condition at the time of sale. The property is situated in the North Loop Industrial Park; and has an 8.45 acre site, indicating a land-to-building ratio of 6.67 to 1. The property featured three loading docks and one overhead door, with an 18' - 20' clear ceiling height. The comparable was purchased for owner-occupancy by Coinco in May of 2013 for $1.3 Million or $23.55 per square foot.
© 2015 CBRE, Inc.
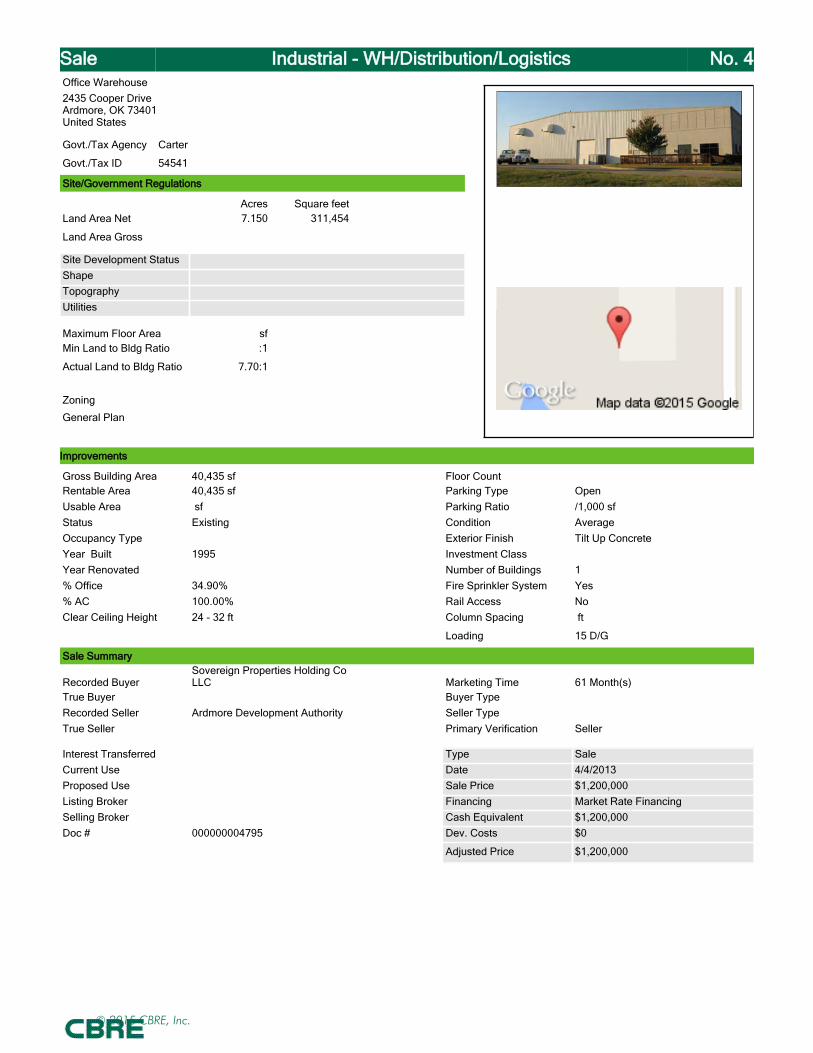
Sale Industrial - WH/Distribution/Logistics No. 4
2435 Cooper DriveArdmore, OK 73401United States
Govt./Tax Agency
Govt./Tax ID
Carter
54541
Office Warehouse
Improvements
Gross Building Area 40,435 sf Floor CountRentable Area 40,435 sf Parking Type OpenUsable Area sf Parking Ratio /1,000 sfStatus Existing Condition AverageOccupancy Type Exterior Finish Tilt Up ConcreteYear Built 1995 Investment ClassYear Renovated Number of Buildings 1% Office 34.90% Fire Sprinkler System Yes% AC 100.00% Rail Access NoClear Ceiling Height 24 - 32 ft Column Spacing ft
Loading 15 D/G
Site/Government Regulations
Acres Square feetLand Area Net 7.150 311,454
Land Area Gross
Site Development StatusShapeTopographyUtilities
Maximum Floor Area sfMin Land to Bldg Ratio :1
Actual Land to Bldg Ratio 7.70:1
Zoning
General Plan
Sale Summary
Recorded BuyerSovereign Properties Holding Co LLC Marketing Time 61 Month(s)
True Buyer Buyer TypeRecorded Seller Ardmore Development Authority Seller TypeTrue Seller Primary Verification Seller
Interest Transferred Type SaleCurrent Use Date 4/4/2013Proposed Use Sale Price $1,200,000Listing Broker Financing Market Rate FinancingSelling Broker Cash Equivalent $1,200,000Doc # 000000004795 Dev. Costs $0
Adjusted Price $1,200,000
© 2015 CBRE, Inc.
Sale Industrial - WH/Distribution/Logistics No. 4History
Transaction Date Transaction Type Buyer Seller PriceNo sales history available for this property.
Units of Comparison
Static Analysis Method Other (see comments) Eff Gross Inc Mult (EGIM) 6.01Buyer's Primary Analysis Other Op Exp Ratio (OER) 45.57%Net Initial Yield/Cap. Rate 9.06% Price / sf $29.68Projected IRR 0.00% Remaining Lease Term
Actual Occupancy at Sale 0%
Financial
Revenue TypeOther See Comments
Period Ending N/ASource AppraiserPrice $1,200,000Potential Gross Income $221,828Economic Occupancy 10%Economic Loss $199,645Effective Gross Income $199,645Expenses $90,979Net Operating Income $108,666NOI / sf $3NOI / Unit N/ANet Initial Yield/Cap. Rate 9.06%EGIM 6.01%OER 45.57%
Comments
This 40,435 square foot industrial property sold on April 4th, 2013 for $1,200,000 or $29.68 psf. The property was vacant at the time of the sale and will be owner occupied. The cap rate was drived from the market
© 2015 CBRE, Inc.
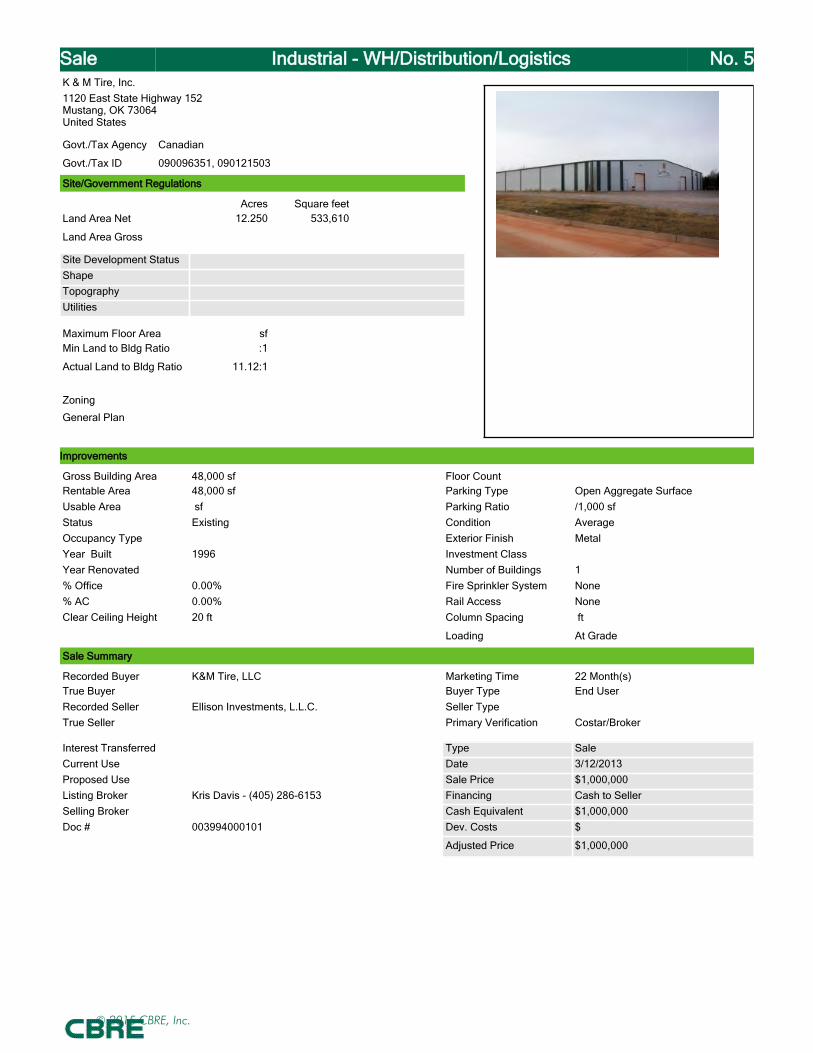
Sale Industrial - WH/Distribution/Logistics No. 5
1120 East State Highway 152Mustang, OK 73064United States
Govt./Tax Agency
Govt./Tax ID
Canadian
090096351, 090121503
K & M Tire, Inc.
Improvements
Gross Building Area 48,000 sf Floor CountRentable Area 48,000 sf Parking Type Open Aggregate SurfaceUsable Area sf Parking Ratio /1,000 sfStatus Existing Condition AverageOccupancy Type Exterior Finish MetalYear Built 1996 Investment ClassYear Renovated Number of Buildings 1% Office 0.00% Fire Sprinkler System None% AC 0.00% Rail Access NoneClear Ceiling Height 20 ft Column Spacing ft
Loading At Grade
Site/Government Regulations
Acres Square feetLand Area Net 12.250 533,610
Land Area Gross
Site Development StatusShapeTopographyUtilities
Maximum Floor Area sfMin Land to Bldg Ratio :1
Actual Land to Bldg Ratio 11.12:1
Zoning
General Plan
Sale Summary
Recorded Buyer K&M Tire, LLC Marketing Time 22 Month(s)True Buyer Buyer Type End UserRecorded Seller Ellison Investments, L.L.C. Seller TypeTrue Seller Primary Verification Costar/Broker
Interest Transferred Type SaleCurrent Use Date 3/12/2013Proposed Use Sale Price $1,000,000Listing Broker Kris Davis - (405) 286-6153 Financing Cash to SellerSelling Broker Cash Equivalent $1,000,000Doc # 003994000101 Dev. Costs $
Adjusted Price $1,000,000
© 2015 CBRE, Inc.
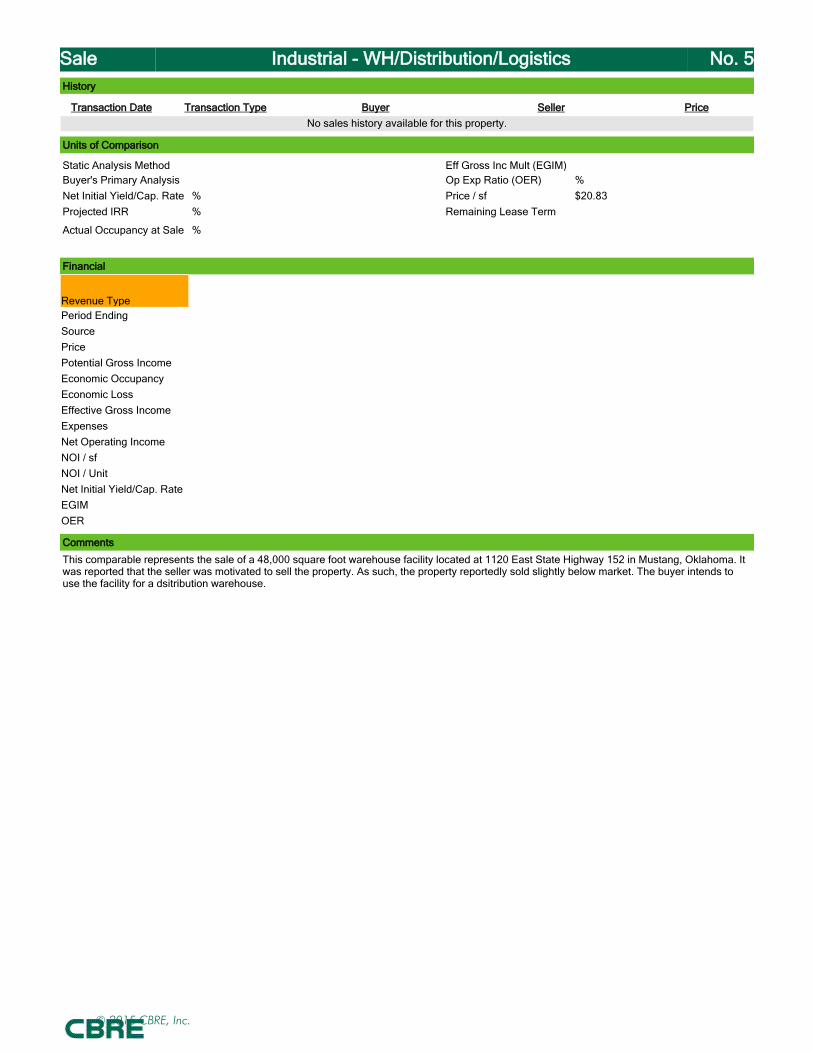
Sale Industrial - WH/Distribution/Logistics No. 5History
Transaction Date Transaction Type Buyer Seller PriceNo sales history available for this property.
Units of Comparison
Static Analysis Method Eff Gross Inc Mult (EGIM)Buyer's Primary Analysis Op Exp Ratio (OER) %Net Initial Yield/Cap. Rate % Price / sf $20.83Projected IRR % Remaining Lease Term
Actual Occupancy at Sale %
Financial
Revenue TypePeriod EndingSourcePricePotential Gross IncomeEconomic OccupancyEconomic LossEffective Gross IncomeExpensesNet Operating IncomeNOI / sfNOI / UnitNet Initial Yield/Cap. RateEGIMOER
Comments
This comparable represents the sale of a 48,000 square foot warehouse facility located at 1120 East State Highway 152 in Mustang, Oklahoma. It was reported that the seller was motivated to sell the property. As such, the property reportedly sold slightly below market. The buyer intends to use the facility for a dsitribution warehouse.
© 2015 CBRE, Inc.

Addenda
Addendum C
PRÉCIS METRO REPORT - ECONOMY.COM, INC.
© 2015 CBRE, Inc.
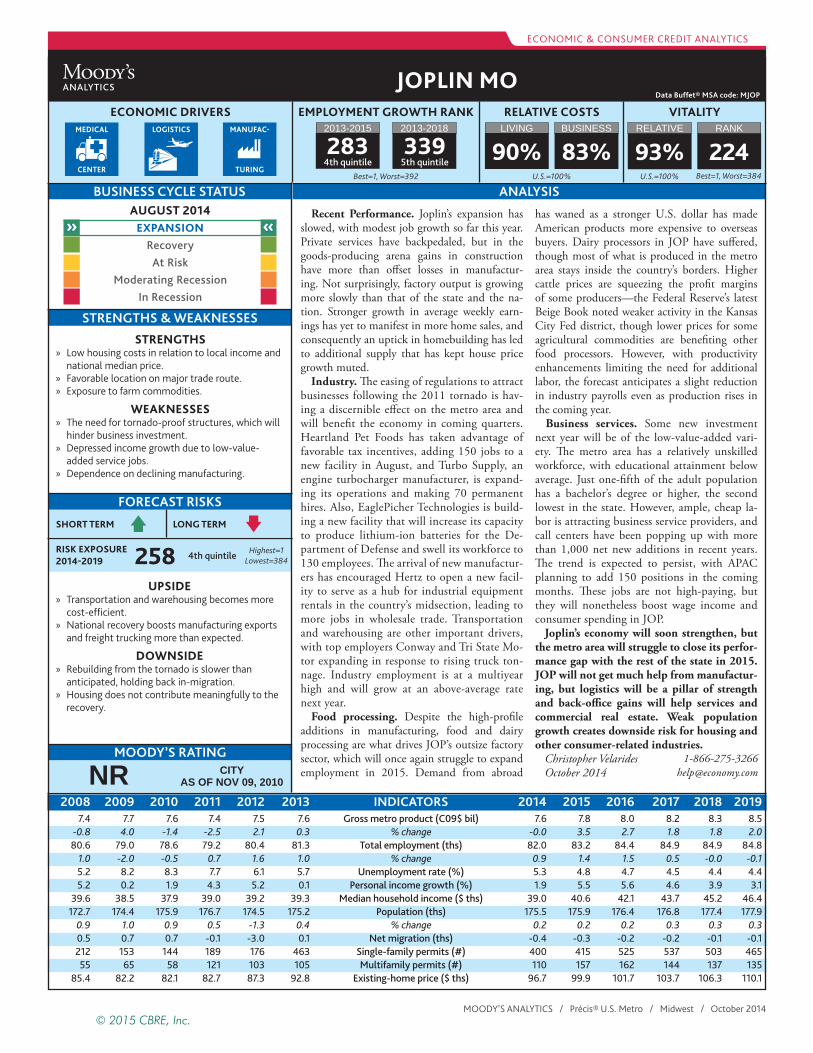
ANALYSIS
EMPLOYMENT GROWTH RANK VITALITY2013-2015
RELATIVE COSTSLIVING BUSINESS2013-2018 RELATIVE RANK
Best=1, Worst=384Best=1, Worst=392 U.S.=100%
STRENGTHS & WEAKNESSES
U.S.=100%
SHORT TERM
FORECAST RISKS
LONG TERM
RISK EXPOSURE 2014-2019
BUSINESS CYCLE STATUS
MOODY’S RATING
ECONOMIC DRIVERS
Highest=1 Lowest=384
ECONOMIC & CONSUMER CREDIT ANALYTICS
MOODY’S ANALYTICS / Précis® U.S. Metro / Midwest / October 2014
MEDICAL
CENTER
LOGISTICS
MANUFAC
TURING
CITYAS OF NOV 09, 2010 NR
JOPLIN MO Data Buffet® MSA code: MJOP
2008 2009 2010 2011 2012 2013 INDICATORS 2014 2015 2016 2017 2018 2019 7.4 7.7 7.6 7.4 7.5 7.6 Gross metro product (C09$ bil) 7.6 7.8 8.0 8.2 8.3 8.5 -0.8 4.0 -1.4 -2.5 2.1 0.3 % change -0.0 3.5 2.7 1.8 1.8 2.0 80.6 79.0 78.6 79.2 80.4 81.3 Total employment (ths) 82.0 83.2 84.4 84.9 84.9 84.8 1.0 -2.0 -0.5 0.7 1.6 1.0 % change 0.9 1.4 1.5 0.5 -0.0 -0.1 5.2 8.2 8.3 7.7 6.1 5.7 Unemployment rate (%) 5.3 4.8 4.7 4.5 4.4 4.4 5.2 0.2 1.9 4.3 5.2 0.1 Personal income growth (%) 1.9 5.5 5.6 4.6 3.9 3.1 39.6 38.5 37.9 39.0 39.2 39.3 Median household income ($ ths) 39.0 40.6 42.1 43.7 45.2 46.4 172.7 174.4 175.9 176.7 174.5 175.2 Population (ths) 175.5 175.9 176.4 176.8 177.4 177.9 0.9 1.0 0.9 0.5 -1.3 0.4 % change 0.2 0.2 0.2 0.3 0.3 0.3 0.5 0.7 0.7 -0.1 -3.0 0.1 Net migration (ths) -0.4 -0.3 -0.2 -0.2 -0.1 -0.1 212 153 144 189 176 463 Single-family permits (#) 400 415 525 537 503 465 55 65 58 121 103 105 Multifamily permits (#) 110 157 162 144 137 135 85.4 82.2 82.1 82.7 87.3 92.8 Existing-home price ($ ths) 96.7 99.9 101.7 103.7 106.3 110.1
Recent Performance. Joplin’s expansion has slowed, with modest job growth so far this year. Private services have backpedaled, but in the goods-producing arena gains in construction have more than offset losses in manufactur-ing. Not surprisingly, factory output is growing more slowly than that of the state and the na-tion. Stronger growth in average weekly earn-ings has yet to manifest in more home sales, and consequently an uptick in homebuilding has led to additional supply that has kept house price growth muted.
Industry. The easing of regulations to attract businesses following the 2011 tornado is hav-ing a discernible effect on the metro area and will benefit the economy in coming quarters. Heartland Pet Foods has taken advantage of favorable tax incentives, adding 150 jobs to a new facility in August, and Turbo Supply, an engine turbocharger manufacturer, is expand-ing its operations and making 70 permanent hires. Also, EaglePicher Technologies is build-ing a new facility that will increase its capacity to produce lithium-ion batteries for the De-partment of Defense and swell its workforce to 130 employees. The arrival of new manufactur-ers has encouraged Hertz to open a new facil-ity to serve as a hub for industrial equipment rentals in the country’s midsection, leading to more jobs in wholesale trade. Transportation and warehousing are other important drivers, with top employers Conway and Tri State Mo-tor expanding in response to rising truck ton-nage. Industry employment is at a multiyear high and will grow at an above-average rate next year.
Food processing. Despite the high-profile additions in manufacturing, food and dairy processing are what drives JOP’s outsize factory sector, which will once again struggle to expand employment in 2015. Demand from abroad
has waned as a stronger U.S. dollar has made American products more expensive to overseas buyers. Dairy processors in JOP have suffered, though most of what is produced in the metro area stays inside the country’s borders. Higher cattle prices are squeezing the profit margins of some producers—the Federal Reserve’s latest Beige Book noted weaker activity in the Kansas City Fed district, though lower prices for some agricultural commodities are benefiting other food processors. However, with productivity enhancements limiting the need for additional labor, the forecast anticipates a slight reduction in industry payrolls even as production rises in the coming year.
Business services. Some new investment next year will be of the low-value-added vari-ety. The metro area has a relatively unskilled workforce, with educational attainment below average. Just one-fifth of the adult population has a bachelor’s degree or higher, the second lowest in the state. However, ample, cheap la-bor is attracting business service providers, and call centers have been popping up with more than 1,000 net new additions in recent years. The trend is expected to persist, with APAC planning to add 150 positions in the coming months. These jobs are not high-paying, but they will nonetheless boost wage income and consumer spending in JOP.
Joplin’s economy will soon strengthen, but the metro area will struggle to close its perfor-mance gap with the rest of the state in 2015. JOP will not get much help from manufactur-ing, but logistics will be a pillar of strength and back-office gains will help services and commercial real estate. Weak population growth creates downside risk for housing and other consumer-related industries.
Christopher VelaridesOctober 2014
283 4th quintile 90% 83%339
5th quintile 93% 224
258 4th quintile
AUGUST 2014 » EXPANSION « Recovery At Risk Moderating Recession In Recession
STRENGTHS » Low housing costs in relation to local income and
national median price. » Favorable location on major trade route. » Exposure to farm commodities.
WEAKNESSES » The need for tornado-proof structures, which will
hinder business investment. » Depressed income growth due to low-value-
added service jobs. » Dependence on declining manufacturing.
UPSIDE » Transportation and warehousing becomes more
cost-efficient. » National recovery boosts manufacturing exports
and freight trucking more than expected.
DOWNSIDE » Rebuilding from the tornado is slower than
anticipated, holding back in-migration. » Housing does not contribute meaningfully to the
recovery.
X W
© 2015 CBRE, Inc.

ECONOMIC HEALTH CHECK BUSINESS CYCLE INDEX
RELATIVE EMPLOYMENT PERFORMANCE
CURRENT EMPLOYMENT TRENDS HOUSE PRICE
HOUSING AFFORDABILITY INDEX
Sources: NAR, Moody’s Analytics
Source: Moody’s Analytics
Sources: FHFA, Moody’s Analytics
EMPLOYMENT OUTLOOK
Sources: BLS, Moody’s AnalyticsSources: BLS, Moody’s Analytics
Sources: BLS, Moody’s Analytics
EDUCATIONAL ATTAINMENT POPULATION BY AGE, %BUSINESS COSTS
Sources: Census Bureau, Moody’s AnalyticsSources: Census Bureau, Moody’s AnalyticsSource: Moody’s Analytics
JAN 2002=100
% CHANGE YR AGO
U.S.
Total
Unit labor
Energy
State and local taxes
Office rent
20122007
% OF ADULTS 25 AND OLDER, 2012U.S.=100 ≥7570-7465-69 60-64 55-59 50-5445-49 40-4435-3930-3425-2920-2415-1910-145-90-4< High school High school
Some college CollegeGraduate school
JAN 2004=100
Government Goods producing Private services
13
28
29
1811
100%
80%
60%
40%
20%
0%
1996Q1=100, NSA
GREATER THAN 100=MORE AFFORDABLE
MOODY’S ANALYTICS / Précis® U.S. Metro / Midwest / October 2014
Better than prior 3-mo MA Unchanged from prior 3-mo MA Worse than prior 3-mo MASources: BLS, Census Bureau, Moody’s Analytics
3-MO MA
JOP MO U.S.
95
100
105
110
115
120
125
04 05 06 07 08 09 10 11 12 13 14F 15F 16F 17F 18F 19F 20F 21F 22F 23F
JOP
JOP MO U.S.
80
100
120
140
160
180
200
220
96 99 02 05 08 11 14
JOP MO U.S.
9698
100102104106108110112114116118
05 08 11 14
0 20 40 60 80 100 1200 1 2 3 4 5 6 7
11
32
30
1710
14
36
29
138
JOP MO U.S.
100
150
200
250
300
350
97 01 05 09 13
Apr 14 May 14 Jun 14 Jul 14 Aug 14 Sep 14Employment, change, ths -0.0 -0.1 0.0 0.0 0.1 0.1Unemployment rate, % 5.6 5.6 5.5 5.4 5.3 5.3Labor force participation rate, % 64.2 64.1 64.0 63.9 63.9 64.0Employment-to-population ratio, % 60.6 60.5 60.4 60.5 60.5 60.6Average weekly hours, # 36.7 37.2 37.7 38.0 37.7 37.3Industrial production, 2007=100 100.4 100.7 100.8 100.8 100.8 101.0Residential permits, single-family, # 418 425 460 593 579 691Residential permits, multifamily, # 173 48 51 20 21 22
% CHANGE YR AGO, 3-MO MA
Jan 14 May 14 Sep 14Total 2.0 1.1 0.7Construction 0.4 12.1 10.5Manufacturing 0.7 -0.7 -1.3Trade -0.8 -1.2 -2.0Trans/Utilities 0.9 0.2 2.1Information 13.8 11.8 0.1Financial Activities 0.9 -1.9 -1.2Prof & Business Svcs. 4.5 0.6 -1.0Edu & Health Svcs. 1.9 1.9 1.5Leisure & Hospitality 3.6 0.7 0.5Other Services 1.1 -3.3 -4.9Government 4.3 4.2 5.0
-12-10
-8-6-4-202468
10 11 12 13 14
PRÉCIS® U.S. METRO MIDWEST ❯❯ Joplin MO
JOP MO U.S.
© 2015 CBRE, Inc.
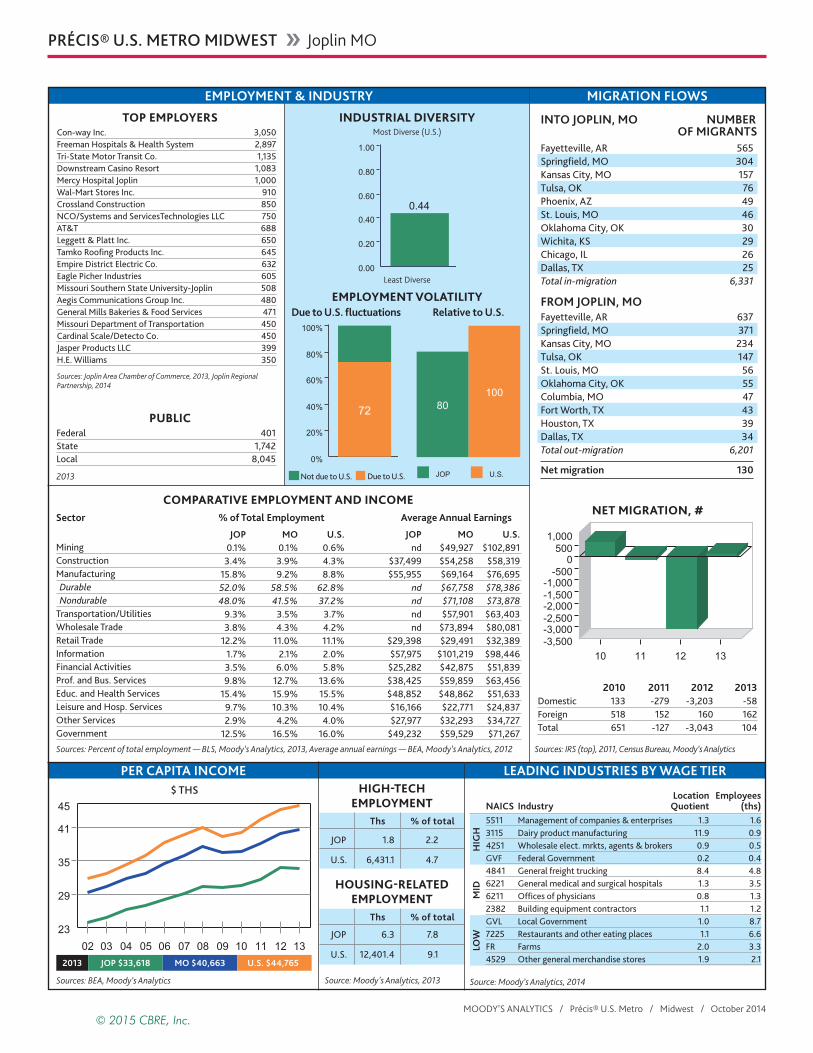
Sources: IRS (top), 2011, Census Bureau, Moody’s AnalyticsSources: Percent of total employment — BLS, Moody’s Analytics, 2013, Average annual earnings — BEA, Moody’s Analytics, 2012
EMPLOYMENT & INDUSTRY MIGRATION FLOWS
COMPARATIVE EMPLOYMENT AND INCOME
PER CAPITA INCOME
Due to U.S. fluctuations Relative to U.S.
TOP EMPLOYERS
PUBLIC
INDUSTRIAL DIVERSITY
EMPLOYMENT VOLATILITY
Sector % of Total Employment Average Annual Earnings
Due to U.S.
Most Diverse (U.S.)
Least Diverse
MiningConstructionManufacturing Durable NondurableTransportation/UtilitiesWholesale TradeRetail TradeInformationFinancial ActivitiesProf. and Bus. ServicesEduc. and Health ServicesLeisure and Hosp. ServicesOther ServicesGovernment
Not due to U.S.
Sources: BEA, Moody’s Analytics
MID
LOW
HIG
H
NET MIGRATION, #
$ THS
LEADING INDUSTRIES BY WAGE TIER
Ths % of total
Ths % of total
HIGH-TECH EMPLOYMENT
HOUSING-RELATED EMPLOYMENT
MOODY’S ANALYTICS / Précis® U.S. Metro / Midwest / October 2014
Source: Moody's Analytics, 2013
0%
20%
40%
60%
80%
100%
72
JOP U.S.
10080
0.00
0.20
0.40
0.60
0.80
1.00
0.44
INTO JOPLIN, MO NUMBEROF MIGRANTS
Fayetteville, AR 565Springfield, MO 304Kansas City, MO 157Tulsa, OK 76Phoenix, AZ 49St. Louis, MO 46Oklahoma City, OK 30Wichita, KS 29Chicago, IL 26Dallas, TX 25Total in-migration 6,331
FROM JOPLIN, MOFayetteville, AR 637Springfield, MO 371Kansas City, MO 234Tulsa, OK 147St. Louis, MO 56Oklahoma City, OK 55Columbia, MO 47Fort Worth, TX 43Houston, TX 39Dallas, TX 34Total out-migration 6,201
Net migration 130
Location Employees NAICS Industry Quotient (ths)
5511 Management of companies & enterprises 1.3 1.63115 Dairy product manufacturing 11.9 0.94251 Wholesale elect. mrkts, agents & brokers 0.9 0.5GVF Federal Government 0.2 0.44841 General freight trucking 8.4 4.86221 General medical and surgical hospitals 1.3 3.56211 Offices of physicians 0.8 1.32382 Building equipment contractors 1.1 1.2GVL Local Government 1.0 8.77225 Restaurants and other eating places 1.1 6.6FR Farms 2.0 3.34529 Other general merchandise stores 1.9 2.1
Source: Moody’s Analytics, 2014
2010 2011 2012 2013Domestic 133 -279 -3,203 -58Foreign 518 152 160 162Total 651 -127 -3,043 104
Federal 401State 1,742Local 8,045
2013
JOP MO U.S. 0.1% 0.1% 0.6% 3.4% 3.9% 4.3% 15.8% 9.2% 8.8% 52.0% 58.5% 62.8% 48.0% 41.5% 37.2% 9.3% 3.5% 3.7% 3.8% 4.3% 4.2% 12.2% 11.0% 11.1% 1.7% 2.1% 2.0% 3.5% 6.0% 5.8% 9.8% 12.7% 13.6% 15.4% 15.9% 15.5% 9.7% 10.3% 10.4% 2.9% 4.2% 4.0% 12.5% 16.5% 16.0%
JOP MO U.S. nd $49,927 $102,891 $37,499 $54,258 $58,319 $55,955 $69,164 $76,695 nd $67,758 $78,386 nd $71,108 $73,878 nd $57,901 $63,403 nd $73,894 $80,081 $29,398 $29,491 $32,389 $57,975 $101,219 $98,446 $25,282 $42,875 $51,839 $38,425 $59,859 $63,456 $48,852 $48,862 $51,633 $16,166 $22,771 $24,837 $27,977 $32,293 $34,727 $49,232 $59,529 $71,267
0500
1,000
-500-1,000-1,500-2,000-2,500-3,000-3,500
10 11 12 13
23
29
35
41
45
02 03 04 05 06 07 08 09 10 11 12 13
2013 JOP $33,618 MO $40,663 U.S. $44,765
JOP 6.3 7.8
U.S. 12,401.4 9.1
JOP 1.8 2.2
U.S. 6,431.1 4.7
PRÉCIS® U.S. METRO MIDWEST ❯❯ Joplin MO
Con-way Inc. 3,050Freeman Hospitals & Health System 2,897Tri-State Motor Transit Co. 1,135Downstream Casino Resort 1,083Mercy Hospital Joplin 1,000Wal-Mart Stores Inc. 910Crossland Construction 850NCO/Systems and ServicesTechnologies LLC 750AT&T 688Leggett & Platt Inc. 650Tamko Roofing Products Inc. 645Empire District Electric Co. 632Eagle Picher Industries 605Missouri Southern State University-Joplin 508Aegis Communications Group Inc. 480General Mills Bakeries & Food Services 471Missouri Department of Transportation 450Cardinal Scale/Detecto Co. 450Jasper Products LLC 399H.E. Williams 350
Sources: Joplin Area Chamber of Commerce, 2013, Joplin Regional Partnership, 2014
© 2015 CBRE, Inc.
© 2014, Moody’s Analytics, Inc. and/or its licensors and affi liates (together, “Moody’s”). All rights reserved. ALL INFORMATION CONTAINED HEREIN IS PROTECTED BY COPYRIGHT LAW AND NONE OF SUCH INFORMATION MAY BE COPIED OR OTHERWISE REPRODUCED, REPACKAGED, FURTHER TRANSMITTED, TRANSFERRED, DISSEMINATED, REDISTRIBUTED OR RESOLD, OR STORED FOR SUBSEQUENT USE FOR ANY PURPOSE, IN WHOLE OR IN PART, IN ANY FORM OR MANNER OR BY ANY MEANS WHATSOEVER, BY ANY PERSON WITHOUT MOODY’S PRIOR WRITTEN CONSENT. All information contained herein is obtained by Moody’s from sources believed by it to be accurate and reliable. Because of the possibility of human and mechanical error as well as other factors, however, all information contained herein is provided “AS IS” without warranty of any kind. Under no circumstances shall Moody’s have any liability to any person or entity for (a) any loss or damage in whole or in part caused by, resulting from, or relating to, any error (negligent or otherwise) or other circumstance or contingency within or outside the control of Moody’s or any of its directors, offi cers, employees or agents in connection with the procurement, collection, compilation, analysis, interpretation, communication, publication or delivery of any such information, or (b) any direct, indirect, special, consequential, compensatory or incidental damages whatsoever (including without limitation, lost profi ts), even if Moody’s is advised in advance of the possibility of such damages, resulting from the use of or inability to use, any such information. The fi nancial reporting, analysis, projections, observations, and other information contained herein are, and must be construed solely as, statements of opinion and not statements of fact or recommendations to purchase, sell, or hold any securities. NO WARRANTY, EXPRESS OR IMPLIED, AS TO THE ACCURACY, TIMELINESS, COMPLETENESS, MERCHANTABILITY OR FITNESS FOR ANY PARTICULAR PURPOSE OF ANY SUCH OPINION OR INFORMATION IS GIVEN OR MADE BY MOODY’S IN ANY FORM OR MANNER WHATSOEVER. Each opinion must be weighed solely as one factor in any investment decision made by or on behalf of any user of the information contained herein, and each such user must accordingly make its own study and evaluation prior to investing.
About Moody’s AnalyticsEconomic & Consumer Credit Analytics
Moody’s Analytics helps capital markets and credit risk management professionals worldwide respond to an evolving marketplace with confi dence. Through its team of economists, Moody’s Analytics is a leading independent provider of data, analysis, modeling and forecasts on national and regional economies, fi nancial markets, and credit risk.
Moody’s Analytics tracks and analyzes trends in consumer credit and spending, output and income, mortgage activity, population, central bank behavior, and prices. Our customized models, concise and timely reports, and one of the largest assembled fi nancial, economic and demographic databases support fi rms and policymakers in strategic planning, product and sales forecasting, credit risk and sensitivity management, and investment research. Our customers include multinational corporations, governments at all levels, central banks and fi nancial regulators, retailers, mutual funds, fi nancial institutions, utilities, residential and commercial real estate fi rms, insurance companies, and professional investors.
Our web periodicals and special publications cover every U.S. state and metropolitan area; countries throughout Europe, Asia and the Americas; the world’s major cities; and the U.S. housing market and other industries. From our offi ces in the U.S., the United Kingdom, the Czech Republic and Australia, we provide up-to-the-minute reporting and analysis on the world’s major economies.
Moody’s Analytics added Economy.com to its portfolio in 2005. Now called Economic & Consumer Credit Analytics, this arm is based in West Chester PA, a suburb of Philadelphia, with offi ces in London, Prague and Sydney. More information is available at www.economy.com.
© 2015 CBRE, Inc.

Addenda
Addendum D
CLIENT CONTRACT INFORMATION
© 2015 CBRE, Inc.
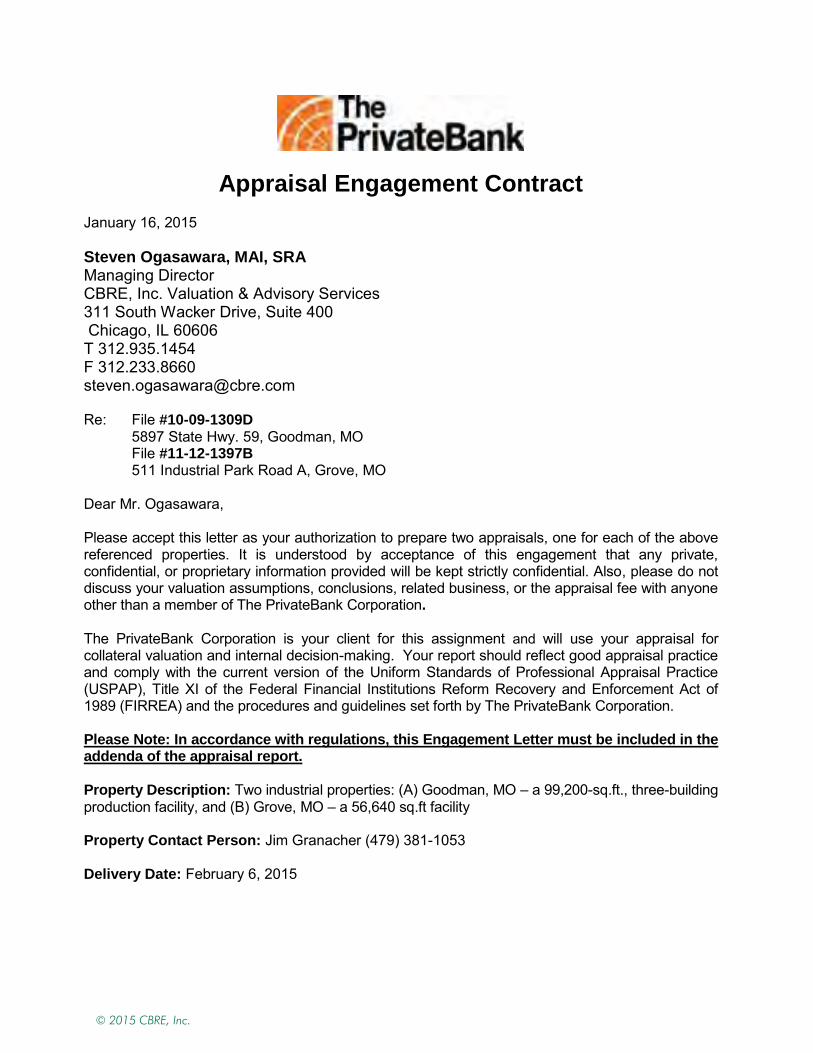
Appraisal Engagement Contract January 16, 2015
Steven Ogasawara, MAI, SRA Managing Director CBRE, Inc. Valuation & Advisory Services 311 South Wacker Drive, Suite 400 Chicago, IL 60606 T 312.935.1454 F 312.233.8660 [email protected] Re: File #10-09-1309D 5897 State Hwy. 59, Goodman, MO File #11-12-1397B 511 Industrial Park Road A, Grove, MO Dear Mr. Ogasawara, Please accept this letter as your authorization to prepare two appraisals, one for each of the above referenced properties. It is understood by acceptance of this engagement that any private, confidential, or proprietary information provided will be kept strictly confidential. Also, please do not discuss your valuation assumptions, conclusions, related business, or the appraisal fee with anyone other than a member of The PrivateBank Corporation. The PrivateBank Corporation is your client for this assignment and will use your appraisal for collateral valuation and internal decision-making. Your report should reflect good appraisal practice and comply with the current version of the Uniform Standards of Professional Appraisal Practice (USPAP), Title XI of the Federal Financial Institutions Reform Recovery and Enforcement Act of 1989 (FIRREA) and the procedures and guidelines set forth by The PrivateBank Corporation. Please Note: In accordance with regulations, this Engagement Letter must be included in the addenda of the appraisal report. Property Description: Two industrial properties: (A) Goodman, MO – a 99,200-sq.ft., three-building production facility, and (B) Grove, MO – a 56,640 sq.ft facility Property Contact Person: Jim Granacher (479) 381-1053 Delivery Date: February 6, 2015
© 2015 CBRE, Inc.
Property Contact Requirements: Within 3 days of receipt of this contract, submit any requests for information to the property contact listed above and arrange for a property inspection. If you have not received all required information within 5 days of the contract date, or if any time you believe the report may be delayed, contact Doug Jirka via email at [email protected].
Delivery Requirements: Please send an electronic copy of your appraisal report and invoice (separate file) via email as an Adobe PDF file to [email protected] no later than the delivery date. (Failure to send the electronic invoice with the appraisal will result in delayed payment). When sending your report, please do not apply any restrictions or other security features to the PDF file. We will password secure the appraisal subsequent to our internal review. The PrivateBank limits the size of incoming emails to 7MB. Hard copies of the appraisal are not required. Please include the job number of the assignment on the cover of the appraisal as well as the invoice.
If a discounted cash flow analysis is required, please use Argus Real Estate software. Please include all of the program reports, i.e., rent roll, input assumptions, supplemental schedules, etc. in the addenda of the report. Also, please e-mail the Argus data files with the reports. Please address your electronic appraisal report and Invoice as follows.
Mr. Daniel R. Berenschot, MAI
Managing Director Appraisal Risk Management
The PrivateBank 120 South LaSalle Street Chicago, Illinois 60603
Your appraisal report will be reviewed considering the above requirements, procedures and guidelines and the bank’s review policy. The Bank’s reviewer may call you for questions or clarifications after the report has been reviewed. Any changes or corrections to your report required because of non-compliance with FIRREA, with good appraisal policy or with the above Requirements, Procedures and Guidelines will be made in a timely manner without additional cost to the Bank. Appraisal Fee: It is my understanding that the fee for this assignment is $7,000 ($3,500 per appraisal) inclusive of all costs necessary to complete the reports. Any additional costs in excess of this fee must be approved in advance by Doug Jirka at (312) 564-6845.
© 2015 CBRE, Inc.

Scope of Work Interest Appraised: Fee Simple Appraisal Premise: Market Value Value Requested: As-Is. Report Type: Summary Appraisal Report Please include your state license/certification number under your signature in the appraisal report. In addition, you are required to prominently report any apparent or known environmental contamination and to identify the subject’s location on the applicable FEMA map. When estimating a Leased Fee Value, if it is determined that a positive or negative leasehold exists, a fee simple value is required. Conversely, please include verbiage indicating that contract rent is representative of market rent and that no positive or negative leasehold interest exists. Please return a signed copy by email and include a copy of this contract in the addenda of your report. Sincerely, Accepted and Agreed:
Mr. Doug Jirka Appraisal Officer Appraisal Risk Management Dated: The PrivateBank 120 South LaSalle Street Chicago, Illinois 60603 Phone: 312-564-6845 [email protected]
1/16/2015
© 2015 CBRE, Inc.

Addenda
Addendum E
QUALIFICATIONS
© 2015 CBRE, Inc.

QUALIFICATIONS OF
P. SCOTT RYAN Senior Appraiser
CBRE, INC.
VALUATION & ADVISORY SERVICES 4520 Main Street, Suite 600 Kansas City, Missouri 64111 (816) 968-5831 Direct Line
(816) 968-5890 Fax [email protected]
FORMAL EDUCATION
Baker University – M.B.A., 1996 Kansas State University – B.A. (Finance), 1988
PROFESSIONAL EDUCATION
All current requirements have been completed for each of the state’s certifications.
PROFESSIONAL AFFILIATIONS & DESIGNATIONS ATTAINED General Certified Real Property Appraiser State of Kansas (KS-G-644) General Certified Real Estate Appraiser State of Missouri (MO-2004000519) State Certified General Appraiser Certified General Real Estate Appraiser
State of Louisiana (G3897) State of Oklahoma (13054CGA)
EMPLOYMENT EXPERIENCE Senior Appraiser with over 10 years experience in commercial real estate valuation. December 1989 – November 2003
Frontier Farm Credit Ottawa, Kansas
Agricultural Real Estate Valuation
November 2003 – July 2007 Integra Realty Resources Westwood, Kansas Commercial Real Estate
Valuation
July 2007 – Present CBRE, Inc. Kansas City, Missouri Valuation & Advisory Services
© 2015 CBRE, Inc.

© 2015 CBRE, Inc.
QUALIFICATIONS OF
Chris M. Williams, MAI Managing Director
CBRE, INC.
VALUATION & ADVISORY SERVICES 4717 Grand Avenue, Suite 500
Kansas City, Missouri 64112 (816) 968-5818 Direct Line
(816) 968-5878 Fax [email protected]
FORMAL EDUCATION
University of Missouri, Kansas City – M.B.A., 1997 University of Kansas – B.S. (Business Administration), 1995
PROFESSIONAL EDUCATION
All current requirements have been completed for each of the state’s certifications.
PROFESSIONAL AFFILIATIONS & DESIGNATIONS ATTAINED Designated Member (MAI) Appraisal Institute (12721) Licensed Real Estate Agent State of Kansas (SP00054357) General Certified Real Estate Appraiser State of Missouri (MO-2004030518) General Certified Real Estate Appraiser State of Kansas (KS-G-2100) General Certified Real Estate Appraiser State of Oklahoma (OK-12867CGA) General Certified Real Estate Appraiser State of Texas (TX-1338787-G)
EMPLOYMENT EXPERIENCE October 1997 – February 2003
Hughes & Company Leawood, Kansas
Commercial Real Estate Valuation, specializing in Golf Courses.
March 2003 – July 2007 Integra Realty Resources Westwood, Kansas Commercial Real Estate
Valuation
July 2007 – Present CBRE, Inc. Kansas City, Missouri Valuation & Advisory Services
© 2015 CBRE, Inc.

CHRIS M WILLIAMS 6352 NORESTON SHAWNEE KS 66218 USA
© 2015 CBRE, Inc.