exhibit 13.1 financial section - bny mellon
TRANSCRIPT
Exhibit 13.1
FINANCIAL SECTION
THE BANK OF NEW YORK MELLON CORPORATION2020 Annual ReportTable of Contents
PageFinancial Summary 2
Management’s Discussion and Analysis of Financial Condition and Results of Operations:Results of Operations:
General 3Overview 3Human capital 3Key 2020 events 5Summary of financial highlights 5Impact of coronavirus pandemic on our business 6Fee and other revenue 8Net interest revenue 11Noninterest expense 14Income taxes 14Review of businesses 15International operations 22Critical accounting estimates 24Consolidated balance sheet review 29Liquidity and dividends 41Capital 45Trading activities and risk management 50Asset/liability management 53
Risk Management 55Supervision and Regulation 62Other Matters 80Risk Factors 81Supplemental Information (unaudited):
Explanation of GAAP and Non-GAAP financial measures (unaudited) 110
Rate/volume analysis (unaudited) 112Forward-looking Statements 113Glossary 115
Report of Management on Internal Control Over Financial Reporting 116
Report of Independent Registered Public Accounting Firm 117
PageFinancial Statements:
Consolidated Income Statement 119Consolidated Comprehensive Income Statement 121Consolidated Balance Sheet 122Consolidated Statement of Cash Flows 123Consolidated Statement of Changes in Equity 124
Notes to Consolidated Financial Statements:Note 1 – Summary of significant accounting and
reporting policies 127Note 2 – Accounting changes and new accounting
guidance 139Note 3 – Acquisitions and dispositions 140Note 4 – Securities 140Note 5 – Loans and asset quality 145Note 6 – Leasing 150Note 7 – Goodwill and intangible assets 151Note 8 – Other assets 152Note 9 – Deposits 154Note 10 – Contract revenue 154Note 11 – Net interest revenue 156Note 12 – Income taxes 156Note 13 – Long-term debt 158Note 14 – Variable interest entities and
securitization 158Note 15 – Shareholders’ equity 159Note 16 – Other comprehensive income (loss) 163Note 17 – Stock-based compensation 164Note 18 – Employee benefit plans 165Note 19 – Company financial information (Parent
Corporation) 172Note 20 – Fair value measurement 175Note 21 – Fair value option 184Note 22 – Commitments and contingent liabilities 185Note 23 – Derivative instruments 189Note 24 – Lines of business 196Note 25 – International operations 200Note 26 – Supplemental information to the
Consolidated Statement of Cash Flows 201
Report of Independent Registered Public Accounting Firm 202
Directors, Executive Committee and Other Executive Officers 206
Performance Graph 207Corporate Information Inside back cover
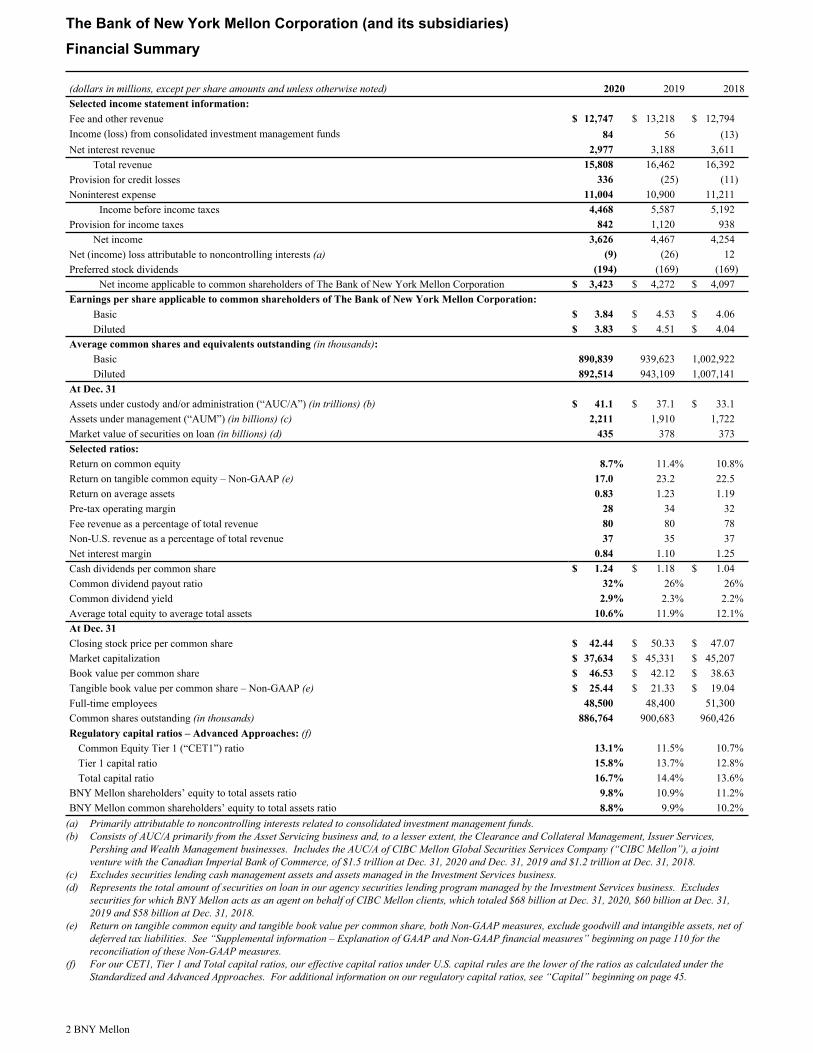
(dollars in millions, except per share amounts and unless otherwise noted) 2020 2019 2018Selected income statement information: Fee and other revenue $ 12,747 $ 13,218 $ 12,794 Income (loss) from consolidated investment management funds 84 56 (13) Net interest revenue 2,977 3,188 3,611
Total revenue 15,808 16,462 16,392 Provision for credit losses 336 (25) (11) Noninterest expense 11,004 10,900 11,211
Income before income taxes 4,468 5,587 5,192 Provision for income taxes 842 1,120 938
Net income 3,626 4,467 4,254 Net (income) loss attributable to noncontrolling interests (a) (9) (26) 12 Preferred stock dividends (194) (169) (169)
Net income applicable to common shareholders of The Bank of New York Mellon Corporation $ 3,423 $ 4,272 $ 4,097 Earnings per share applicable to common shareholders of The Bank of New York Mellon Corporation:
Basic $ 3.84 $ 4.53 $ 4.06 Diluted $ 3.83 $ 4.51 $ 4.04
Average common shares and equivalents outstanding (in thousands):Basic 890,839 939,623 1,002,922 Diluted 892,514 943,109 1,007,141
At Dec. 31Assets under custody and/or administration (“AUC/A”) (in trillions) (b) $ 41.1 $ 37.1 $ 33.1 Assets under management (“AUM”) (in billions) (c) 2,211 1,910 1,722 Market value of securities on loan (in billions) (d) 435 378 373 Selected ratios:Return on common equity 8.7% 11.4% 10.8% Return on tangible common equity – Non-GAAP (e) 17.0 23.2 22.5 Return on average assets 0.83 1.23 1.19 Pre-tax operating margin 28 34 32 Fee revenue as a percentage of total revenue 80 80 78 Non-U.S. revenue as a percentage of total revenue 37 35 37 Net interest margin 0.84 1.10 1.25 Cash dividends per common share $ 1.24 $ 1.18 $ 1.04 Common dividend payout ratio 32% 26% 26% Common dividend yield 2.9% 2.3% 2.2% Average total equity to average total assets 10.6% 11.9% 12.1% At Dec. 31Closing stock price per common share $ 42.44 $ 50.33 $ 47.07 Market capitalization $ 37,634 $ 45,331 $ 45,207 Book value per common share $ 46.53 $ 42.12 $ 38.63 Tangible book value per common share – Non-GAAP (e) $ 25.44 $ 21.33 $ 19.04 Full-time employees 48,500 48,400 51,300 Common shares outstanding (in thousands) 886,764 900,683 960,426 Regulatory capital ratios – Advanced Approaches: (f)
Common Equity Tier 1 (“CET1”) ratio 13.1% 11.5% 10.7% Tier 1 capital ratio 15.8% 13.7% 12.8% Total capital ratio 16.7% 14.4% 13.6%
BNY Mellon shareholders’ equity to total assets ratio 9.8% 10.9% 11.2% BNY Mellon common shareholders’ equity to total assets ratio 8.8% 9.9% 10.2%
(a) Primarily attributable to noncontrolling interests related to consolidated investment management funds. (b) Consists of AUC/A primarily from the Asset Servicing business and, to a lesser extent, the Clearance and Collateral Management, Issuer Services,
Pershing and Wealth Management businesses. Includes the AUC/A of CIBC Mellon Global Securities Services Company (“CIBC Mellon”), a joint venture with the Canadian Imperial Bank of Commerce, of $1.5 trillion at Dec. 31, 2020 and Dec. 31, 2019 and $1.2 trillion at Dec. 31, 2018.
(c) Excludes securities lending cash management assets and assets managed in the Investment Services business.(d) Represents the total amount of securities on loan in our agency securities lending program managed by the Investment Services business. Excludes
securities for which BNY Mellon acts as an agent on behalf of CIBC Mellon clients, which totaled $68 billion at Dec. 31, 2020, $60 billion at Dec. 31, 2019 and $58 billion at Dec. 31, 2018.
(e) Return on tangible common equity and tangible book value per common share, both Non-GAAP measures, exclude goodwill and intangible assets, net of deferred tax liabilities. See “Supplemental information – Explanation of GAAP and Non-GAAP financial measures” beginning on page 110 for the reconciliation of these Non-GAAP measures.
(f) For our CET1, Tier 1 and Total capital ratios, our effective capital ratios under U.S. capital rules are the lower of the ratios as calculated under the Standardized and Advanced Approaches. For additional information on our regulatory capital ratios, see “Capital” beginning on page 45.
The Bank of New York Mellon Corporation (and its subsidiaries)
Financial Summary
2 BNY Mellon
General
In this Annual Report, references to “our,” “we,” “us,” “BNY Mellon,” the “Company” and similar terms refer to The Bank of New York Mellon Corporation and its consolidated subsidiaries. The term “Parent” refers to The Bank of New York Mellon Corporation but not its subsidiaries.
The following should be read in conjunction with the Consolidated Financial Statements included in this report. BNY Mellon’s actual results of future operations may differ from those estimated or anticipated in certain forward-looking statements contained herein due to the factors described under the headings “Forward-looking Statements” and “Risk Factors,” both of which investors should read.
Certain business terms used in this Annual Report are defined in the Glossary section.
This Annual Report generally discusses 2020 and 2019 items and comparisons between 2020 and 2019. Discussions of 2018 items and comparisons between 2019 and 2018 that are not included in this Annual Report can be found in our 2019 Annual Report, which was filed as an exhibit to our Form 10-K for the year ended Dec. 31, 2019.
Overview
Established in 1784 by Alexander Hamilton, we were the first company listed on the New York Stock Exchange (NYSE: BK). With a history of more than 235 years, BNY Mellon is a global company that manages and services assets for financial institutions, corporations and individual investors in 35 countries.
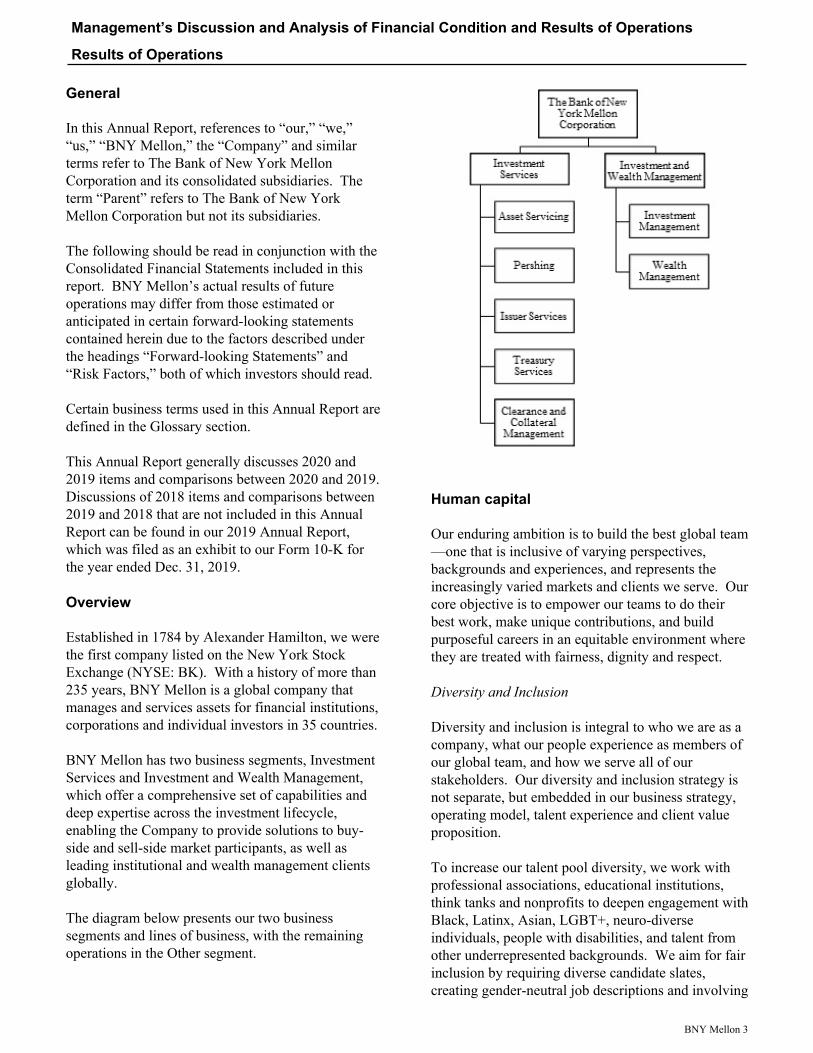
BNY Mellon has two business segments, Investment Services and Investment and Wealth Management, which offer a comprehensive set of capabilities and deep expertise across the investment lifecycle, enabling the Company to provide solutions to buy-side and sell-side market participants, as well as leading institutional and wealth management clients globally.
The diagram below presents our two business segments and lines of business, with the remaining operations in the Other segment.
Human capital
Our enduring ambition is to build the best global team—one that is inclusive of varying perspectives, backgrounds and experiences, and represents the increasingly varied markets and clients we serve. Our core objective is to empower our teams to do their best work, make unique contributions, and build purposeful careers in an equitable environment where they are treated with fairness, dignity and respect.
Diversity and Inclusion
Diversity and inclusion is integral to who we are as a company, what our people experience as members of our global team, and how we serve all of our stakeholders. Our diversity and inclusion strategy is not separate, but embedded in our business strategy, operating model, talent experience and client value proposition.
To increase our talent pool diversity, we work with professional associations, educational institutions, think tanks and nonprofits to deepen engagement with Black, Latinx, Asian, LGBT+, neuro-diverse individuals, people with disabilities, and talent from other underrepresented backgrounds. We aim for fair inclusion by requiring diverse candidate slates, creating gender-neutral job descriptions and involving
Management’s Discussion and Analysis of Financial Condition and Results of Operations
Results of Operations
BNY Mellon 3

diverse interview panels. We embed diversity and inclusion in our talent review processes, succession plans and development objectives to improve promotion readiness and advance and retain talent from all backgrounds.
At the most senior level, our Executive Committee sets diversity and inclusion goals with specific targets to improve senior leader diversity and to increase female representation globally and diverse ethnic and/or racial representation in the United States. Executive Committee members’ variable compensation is directly tied to performance against these goals.
At the end of 2020, women were 41% of BNY Mellon’s global workforce and 44% of BNY Mellon’s U.S. workforce. Further, 35% of BNY Mellon’s U.S. workforce were from underrepresented ethnic and/or racial backgrounds.
At the end of 2020, 29% of BNY Mellon’s Executive Committee were women and 20% of BNY Mellon’s Executive Committee were from underrepresented ethnic and/or racial backgrounds.
Our Board of Directors is committed to fostering and maintaining its diversity. At the end of 2020, 27% of our Board of Directors were women and 36% of our Board of Directors was composed of individuals from underrepresented ethnic and/or racial backgrounds. In addition, four of BNY Mellon’s six standing committees of its Board of Directors are chaired by a diverse director based on race or gender.
Retention, Training and Development
We seek to attract and retain employees by providing a rewarding employee experience. We recognize that employees seek a supportive, safe and inclusive workplace, and we continually evaluate our employee engagement and wellbeing programs in an effort to meet those expectations. We offer a 401(k) plan for U.S. employees, and other defined contribution retirement plans worldwide, where consistent with market practice. We also maintain frozen defined benefit plans for certain current and former employees. At Dec. 31, 2020, we had approximately 43,100 participants in our 401(k) plan, including former employees. In addition, our frozen U.S. defined benefit pension plan covered approximately 9,800 U.S. participants and our non-U.S. defined
benefit plans (some frozen) covered approximately 13,900 non-U.S. participants.
At key career transition points, from internship to executive management, we offer programs and development opportunities to help employees advance their careers and progress within our organization. Our extensive training and development opportunities are designed to enable employees to grow professionally and advance within our organization.
We engage with employees to encourage innovation, show appreciation for their contributions, and gather feedback on how we can build a more rewarding, inclusive workplace. For example, we regularly gather feedback through an all-employee survey.
Employee Wellbeing, Health and Safety
BNY Mellon’s holistic approach to employee wellbeing is designed to create a healthy, resilient and vibrant workforce. Our programs are designed to provide employees easy access to resources to help improve their physical health, emotional resilience, financial wellbeing and social connections. Further, we work to ensure the safety of our employees and clients in all of our facilities. During the coronavirus pandemic, we were early to initiate our business continuity plans and to restrict activities such as travel and in-person participation in events and large meetings. We quickly transitioned the vast majority of our employees, including our senior management and key personnel, to working from home, which opened up space for us to create social distancing for the small number of essential in-office staff. These essential in-office staff are primarily performing roles that cannot be done remotely. Since March 2020, the vast majority of our global employees have worked from home. We are taking a conservative and measured approach in assessing how, and when, we will return employees to our offices when the COVID-19 pandemic subsides. This phased, enterprise-wide approach is principles-based and will be centrally coordinated and localized based on the situation. Our guiding principles are adherence to government/jurisdictional guidelines, facility preparedness, business function prioritization, and staff safety and wellbeing.
We assembled a comprehensive Supporting You Now COVID-19 framework that communicated the array of measures to support our employees in the moment.
Results of Operations (continued)
4 BNY Mellon
This included expanded employee assistance program benefits, telehealth coverage, increased back-up dependent care benefits, virtual babysitting services and toolkits for managers and employees to conduct supportive conversations around life balance needs.
Employees and International Operations
Globally, at Dec. 31, 2020, BNY Mellon and its subsidiaries had approximately 48,500 full-time employees.
We pride ourselves on providing dedicated service through our multilingual sales, marketing and client service teams. At Dec. 31, 2020, approximately 49% of our total employees (full-time and part-time employees) were based outside the U.S., with approximately 9,400 employees in Europe, the Middle East and Africa (“EMEA), approximately 14,000 employees in the Asia-Pacific region (“APAC”) and approximately 700 employees in other global locations, primarily Brazil.
Key 2020 events
Todd Gibbons named Chief Executive Officer
In March 2020, Todd Gibbons was appointed Chief Executive Officer (“CEO”) and continued as a member of the Board of Directors. During Todd’s career at BNY Mellon, he has held leadership roles across risk, finance, client management and many of our businesses.
Emily Portney named Chief Financial Officer
In July 2020, Emily Portney was appointed Chief Financial Officer and joined the Company’s Executive Committee. Ms. Portney previously led the client management, sales and services teams for the Asset Servicing business globally and oversaw the Americas region for the Asset Servicing business. She has also previously held senior financial roles.
CCAR and common stock repurchases
In March 2020, we and the other members of the Financial Services Forum announced the temporary suspension of share repurchases until the end of the second quarter of 2020 to preserve capital and liquidity in order to further the objective of using capital and liquidity to support clients and customers.
In June 2020, the Board of Governors of the Federal Reserve System (the “Federal Reserve”) announced that it required participating Comprehensive Capital Analysis and Review (“CCAR”) firms, including us, to update and resubmit their capital plans and that, as a result, unless otherwise approved by the Federal Reserve, participating firms were not permitted to conduct open market common stock repurchases in the third quarter of 2020.
In August 2020, the Federal Reserve announced that BNY Mellon’s stress capital buffer (“SCB”) requirement would be 2.5%, which equals the regulatory minimum, effective on Oct. 1, 2020.
In September 2020, the Federal Reserve extended the limitation on open market common stock repurchases through the fourth quarter of 2020.
In December 2020, the Federal Reserve released the results of the second round of CCAR stress tests during 2020 and extended the restriction on common stock dividends and open market common share repurchases applicable to participating CCAR firms, including us, to the first quarter of 2021, with certain modifications. Under the modified restrictions, we are authorized to conduct open market common share repurchases in an amount up to approximately $625 million under the Federal Reserve’s modified distribution limitation in the first quarter of 2021. See “Supervision and Regulation – Capital Planning and Stress Testing – Payment of Dividends, Stock Repurchases and Other Capital Distributions” for additional information related to the 2020 CCAR.
Summary of financial highlights
We reported net income applicable to common shareholders of BNY Mellon of $3.4 billion, or $3.83 per diluted common share, in 2020, including the negative impact of $159 million, or $0.18 per diluted common share, related to litigation expense, severance, losses on business sales and real estate charges in the fourth quarter of 2020. In 2019, net income applicable to common shareholders of BNY Mellon was $4.3 billion, or $4.51 per diluted common share, including a net benefit of $467 million, or $0.49 per diluted common share, related to the gain on the sale of an equity investment and a net reduction of reserves for a tax-related exposure of certain investment management funds, partially offset by severance, a lease-related impairment, net securities losses and litigation expense.
Results of Operations (continued)
BNY Mellon 5
Highlights of 2020 results
• AUC/A totaled $41.1 trillion at Dec. 31, 2020 compared with $37.1 trillion at Dec. 31, 2019. The 11% increase primarily reflects higher market values and client inflows, the favorable impact of a weaker U.S. dollar and net new business. (See “Investment Services business” beginning on page 16.)
• AUM totaled $2.2 trillion at Dec. 31, 2020 compared with $1.9 trillion at Dec. 31, 2019. The 16% increase primarily reflects higher market values, net inflows and the favorable impact of a weaker U.S. dollar (principally versus the British pound). (See “Investment and Wealth Management business” beginning on page 18.)
• Investment services fees totaled $8.0 billion in 2020 compared with $7.9 billion in 2019, an increase of 2%. The increase primarily reflects higher balances and clearing revenue, growth in collateral management and lower compensating balance credits, partially offset by money market fee waivers. (See “Investment Services business” beginning on page 16.)
• Investment management and performance fees totaled $3.37 billion in 2020 compared with $3.39 billion in 2019, a decrease of 1%. The decrease primarily reflects higher money market fee waivers and an unfavorable change in the mix of AUM, partially offset by higher market values and performance fees. (See “Investment and Wealth Management business” beginning on page 18.)
• Foreign exchange and other trading revenue totaled $789 million in 2020, compared with $654 million in 2019. Foreign exchange revenue totaled $776 million in 2020, an increase of 34%, compared with $577 million in 2019, primarily reflecting higher volatility and volumes. (See “Fee and other revenue” beginning on page 8.)
• Net interest revenue totaled $3.0 billion in 2020, compared with $3.2 billion in 2019, a decrease of 7%. The decrease was primarily driven by lower interest rates on interest-earnings assets, partially offset by the benefit of lower deposit and funding rates, higher deposit balances and a larger securities portfolio. Net interest margin was 0.84% in 2020, compared with 1.10% in 2019. (See “Net interest revenue” beginning on page 11.)
• The provision for credit losses was $336 million in 2020 and a credit of $25 million in 2019. The increase in the provision primarily reflects additional reserves in the commercial real estate portfolio and as a result of the challenging macroeconomic outlook due to the coronavirus pandemic. (See “Asset quality and allowance for credit losses” beginning on page 37.)
• Noninterest expense totaled $11.0 billion in 2020 compared with $10.9 billion in 2019. The 1% increase primarily reflects continued investments in technology, the 2019 reserve reduction for a tax-related exposure of certain investment management funds and higher professional, legal and other purchased services expense. The increase was partially offset by lower staff (severance) and business development (travel and marketing) expenses. See “Noninterest expense” beginning on page 14.)
• The provision for income taxes was $842 million (18.8% effective tax rate) in 2020. (See “Income taxes” on page 14.)
• The net unrealized pre-tax gain on the securities portfolio, including the impact of related hedges, was $3.2 billion at Dec. 31, 2020, compared with $796 million at Dec. 31, 2019. The increase was primarily driven by lower market interest rates. (See “Securities” beginning on page 30.)
• Our CET1 ratio calculated under the Advanced Approaches was 13.1% at Dec. 31, 2020 and 11.5% at Dec. 31, 2019. The increase primarily reflects capital generated through earnings, unrealized gain on assets available-for-sale and foreign currency translation, partially offset by capital deployed through dividend payments and higher risk-weighted assets (“RWAs”). (See “Capital” beginning on page 45.)
Impact of coronavirus pandemic on our business
The coronavirus pandemic has had a significant effect on the global macroeconomic environment. The following discusses the areas of our business that have been impacted and could continue to be impacted by the current environment.
Since March 2020, the vast majority of our employees have worked from home. They have been fully operational with minimal disruption to servicing our clients. However, our continued reliance on
Results of Operations (continued)
6 BNY Mellon
work-from-home arrangements may result in increased operational risks.
Market volatility associated with the performance of global equity and fixed income markets and lower interest rates has had, and may continue to have, a considerable impact on all of our businesses. Our lower-risk diversified fee-based business model benefits from heightened volatility and a flight-to-quality on a relative basis compared with other credit-focused financial institutions.
Our Investment Services businesses were favorably impacted by higher client volumes in 2020 compared with the prior year. The significant increases in market volatility also resulted in increased client activity in foreign exchange, and higher asset servicing, clearing services in Pershing, as well as clearance and collateral management fee revenue. However, the heightened volumes and volatility experienced in the first quarter of 2020 declined over the remainder of 2020.
This volatility, coupled with the interest rate environment, also led to an increase in deposit levels from the prior year as our clients increased the levels of cash placed with us. This favorably impacted net interest revenue. However, the low interest rate environment has more than offset that benefit and is expected to continue to reduce our net interest revenue and margin.
Given the decrease in short-term interest rates, there was a significant increase in money market mutual fund fees that were waived, which reduced fee revenue for both our Investment Services and Investment and Wealth Management businesses in 2020 and is expected to continue. See further discussion of money market fee waivers in “Fee and other revenue.”
We and the other CCAR firms suspended open market common stock repurchases for most of 2020 however, we continued our current quarterly common stock dividend of $0.31 per share. See “Supervision and Regulation – Capital Planning and Stress Testing – Payment of Dividends, Stock Repurchases and Other Capital Distributions” for additional information related to the 2020 CCAR.
The significant changes in market values during 2020 initially negatively impacted revenue related to seed capital investments (net of hedges) in our Investment
and Wealth Management business. However, revenue related to seed capital investments (net of hedges) improved as the markets rebounded after the first quarter of 2020.
During the first quarter of 2020, we purchased $2.2 billion of commercial paper and certificates of deposit (“CDs”) from affiliated money market mutual funds in order to provide liquidity support to the funds. At Dec. 31, 2020, commercial paper and CDs totaled approximately $250 million. We also purchased $650 million in the first quarter of 2020 and $1.1 billion in the second quarter of 2020 of commercial paper and CDs from third-party money market mutual funds and funded this purchase through the Federal Reserve Bank of Boston’s Money Market Mutual Fund Liquidity Facility (“MMLF”) program. The commercial paper and CDs purchased from third parties matured prior to Dec. 31, 2020. See “Supervision and Regulation – Pandemic-Related Measures – Money Market Mutual Fund Liquidity Facility” for additional information on the MMLF.
The deterioration in the macroeconomic outlook as a result of the pandemic has resulted in and may continue to result in heightened levels of credit loss provisioning. Although we did not experience net charge-offs in 2020, the continuing effects of the pandemic could result in increased credit losses and charge-offs.
In addition, a prolonged economic downturn may result in other asset write-downs and impairments, including, but not limited to, equity investments, goodwill and intangibles.
It is difficult to forecast the impact of the coronavirus, together with related public health measures, on our results with certainty because so much depends on how the health crisis evolves, its impact on the global economy as well as actions taken by central banks and governments to support the economy and the availability, use and effectiveness of vaccines.
The current macroeconomic environment has also resulted in responses by governmental and regulatory bodies. See “Supervision and Regulation – Pandemic-Related measures” for additional information on legislative and regulatory developments in response to the coronavirus pandemic.
Results of Operations (continued)
BNY Mellon 7
For further discussion of the current and potential impact of the coronavirus pandemic see “Risk Factors – The coronavirus pandemic is adversely affecting us and creates significant risks and uncertainties for our
business, and the ultimate impact of the pandemic on us will depend on future developments, which are highly uncertain and cannot be predicted.”
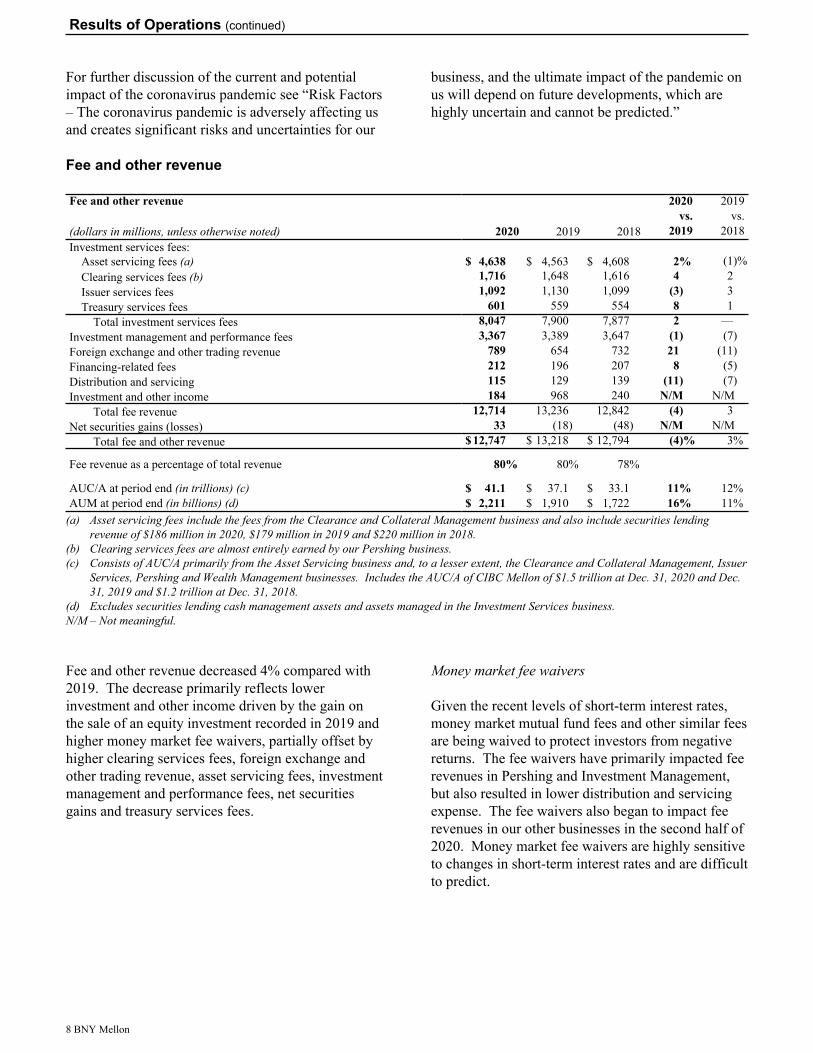
Fee and other revenue
Fee and other revenue 2020 2019 vs. vs.
(dollars in millions, unless otherwise noted) 2020 2019 2018 2019 2018Investment services fees:
Asset servicing fees (a) $ 4,638 $ 4,563 $ 4,608 2% (1) %Clearing services fees (b) 1,716 1,648 1,616 4 2 Issuer services fees 1,092 1,130 1,099 (3) 3 Treasury services fees 601 559 554 8 1
Total investment services fees 8,047 7,900 7,877 2 — Investment management and performance fees 3,367 3,389 3,647 (1) (7) Foreign exchange and other trading revenue 789 654 732 21 (11) Financing-related fees 212 196 207 8 (5) Distribution and servicing 115 129 139 (11) (7) Investment and other income 184 968 240 N/M N/M
Total fee revenue 12,714 13,236 12,842 (4) 3 Net securities gains (losses) 33 (18) (48) N/M N/M
Total fee and other revenue $ 12,747 $ 13,218 $ 12,794 (4) % 3%
Fee revenue as a percentage of total revenue 80% 80% 78%
AUC/A at period end (in trillions) (c) $ 41.1 $ 37.1 $ 33.1 11% 12% AUM at period end (in billions) (d) $ 2,211 $ 1,910 $ 1,722 16% 11%
(a) Asset servicing fees include the fees from the Clearance and Collateral Management business and also include securities lending revenue of $186 million in 2020, $179 million in 2019 and $220 million in 2018.
(b) Clearing services fees are almost entirely earned by our Pershing business.(c) Consists of AUC/A primarily from the Asset Servicing business and, to a lesser extent, the Clearance and Collateral Management, Issuer
Services, Pershing and Wealth Management businesses. Includes the AUC/A of CIBC Mellon of $1.5 trillion at Dec. 31, 2020 and Dec. 31, 2019 and $1.2 trillion at Dec. 31, 2018.
(d) Excludes securities lending cash management assets and assets managed in the Investment Services business. N/M – Not meaningful.
Fee and other revenue decreased 4% compared with 2019. The decrease primarily reflects lower investment and other income driven by the gain on the sale of an equity investment recorded in 2019 and higher money market fee waivers, partially offset by higher clearing services fees, foreign exchange and other trading revenue, asset servicing fees, investment management and performance fees, net securities gains and treasury services fees.
Money market fee waivers
Given the recent levels of short-term interest rates, money market mutual fund fees and other similar fees are being waived to protect investors from negative returns. The fee waivers have primarily impacted fee revenues in Pershing and Investment Management, but also resulted in lower distribution and servicing expense. The fee waivers also began to impact fee revenues in our other businesses in the second half of 2020. Money market fee waivers are highly sensitive to changes in short-term interest rates and are difficult to predict.
Results of Operations (continued)
8 BNY Mellon
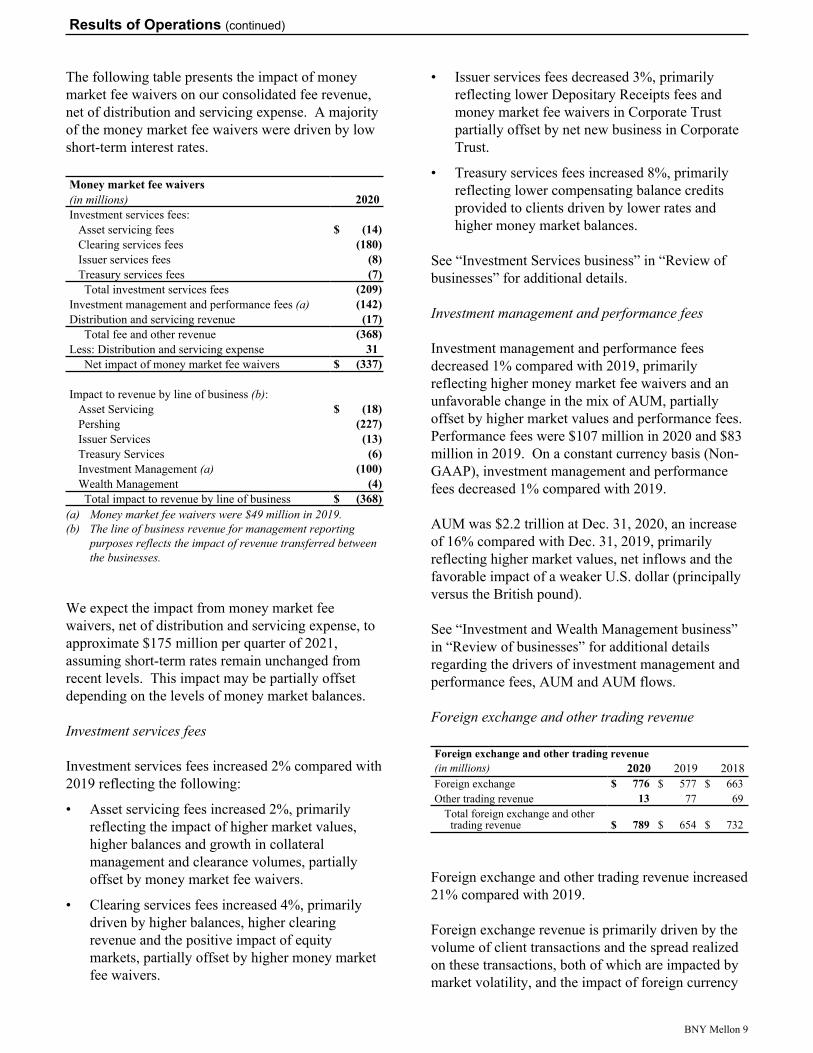
The following table presents the impact of money market fee waivers on our consolidated fee revenue, net of distribution and servicing expense. A majority of the money market fee waivers were driven by low short-term interest rates.
Money market fee waivers(in millions) 2020Investment services fees:
Asset servicing fees $ (14) Clearing services fees (180) Issuer services fees (8) Treasury services fees (7) Total investment services fees (209)
Investment management and performance fees (a) (142) Distribution and servicing revenue (17)
Total fee and other revenue (368) Less: Distribution and servicing expense 31
Net impact of money market fee waivers $ (337)
Impact to revenue by line of business (b):Asset Servicing $ (18) Pershing (227) Issuer Services (13) Treasury Services (6) Investment Management (a) (100) Wealth Management (4) Total impact to revenue by line of business $ (368)
(a) Money market fee waivers were $49 million in 2019.(b) The line of business revenue for management reporting
purposes reflects the impact of revenue transferred between the businesses.
We expect the impact from money market fee waivers, net of distribution and servicing expense, to approximate $175 million per quarter of 2021, assuming short-term rates remain unchanged from recent levels. This impact may be partially offset depending on the levels of money market balances.
Investment services fees
Investment services fees increased 2% compared with 2019 reflecting the following:
• Asset servicing fees increased 2%, primarily reflecting the impact of higher market values, higher balances and growth in collateral management and clearance volumes, partially offset by money market fee waivers.
• Clearing services fees increased 4%, primarily driven by higher balances, higher clearing revenue and the positive impact of equity markets, partially offset by higher money market fee waivers.
• Issuer services fees decreased 3%, primarily reflecting lower Depositary Receipts fees and money market fee waivers in Corporate Trust partially offset by net new business in Corporate Trust.
• Treasury services fees increased 8%, primarily reflecting lower compensating balance credits provided to clients driven by lower rates and higher money market balances.
See “Investment Services business” in “Review of businesses” for additional details.
Investment management and performance fees
Investment management and performance fees decreased 1% compared with 2019, primarily reflecting higher money market fee waivers and an unfavorable change in the mix of AUM, partially offset by higher market values and performance fees. Performance fees were $107 million in 2020 and $83 million in 2019. On a constant currency basis (Non-GAAP), investment management and performance fees decreased 1% compared with 2019.
AUM was $2.2 trillion at Dec. 31, 2020, an increase of 16% compared with Dec. 31, 2019, primarily reflecting higher market values, net inflows and the favorable impact of a weaker U.S. dollar (principally versus the British pound).
See “Investment and Wealth Management business” in “Review of businesses” for additional details regarding the drivers of investment management and performance fees, AUM and AUM flows.
Foreign exchange and other trading revenue
Foreign exchange and other trading revenue(in millions) 2020 2019 2018Foreign exchange $ 776 $ 577 $ 663 Other trading revenue 13 77 69
Total foreign exchange and other trading revenue $ 789 $ 654 $ 732
Foreign exchange and other trading revenue increased 21% compared with 2019.
Foreign exchange revenue is primarily driven by the volume of client transactions and the spread realized on these transactions, both of which are impacted by market volatility, and the impact of foreign currency
Results of Operations (continued)
BNY Mellon 9
hedging activities. In 2020, foreign exchange revenue totaled $776 million, an increase of 34% compared with 2019, primarily reflecting higher volatility and volumes and the positive impact of foreign currency hedging. Foreign exchange revenue is primarily reported in the Investment Services business and, to a lesser extent, the Investment and Wealth Management business and the Other segment.
Other trading revenue totaled $13 million in 2020 compared with $77 million in 2019. The decrease primarily reflects higher losses on seed capital hedging, which is partially offset by increased gains on seed capital reflected in operations of consolidated investment management funds and investment and other income. Other trading revenue is reported in all three business segments.
Financing-related fees
Financing-related fees, which are primarily reported in the Investment Services business, include capital market fees, loan commitment fees and credit-related fees. Financing-related fees totaled $212 million in 2020 compared with $196 million in 2019, primarily reflecting higher underwriting fees.
Distribution and servicing fees
Distribution and servicing fees earned from mutual funds are primarily based on average assets in the funds and the sales of funds that we manage or administer and are primarily reported in the Investment Management business. These fees, which include 12b-1 fees, fluctuate with the overall level of net sales, the relative mix of sales between share classes, the funds’ market values and money market fee waivers.
Distribution and servicing fees were $115 million in 2020 compared with $129 million in 2019. The decrease primarily reflects higher money market fee waivers. The impact of distribution and servicing fees on income in any one period is partially offset by distribution and servicing expense paid to other financial intermediaries to cover their costs for
distribution and servicing of mutual funds. Distribution and servicing expense is recorded as noninterest expense on the income statement.
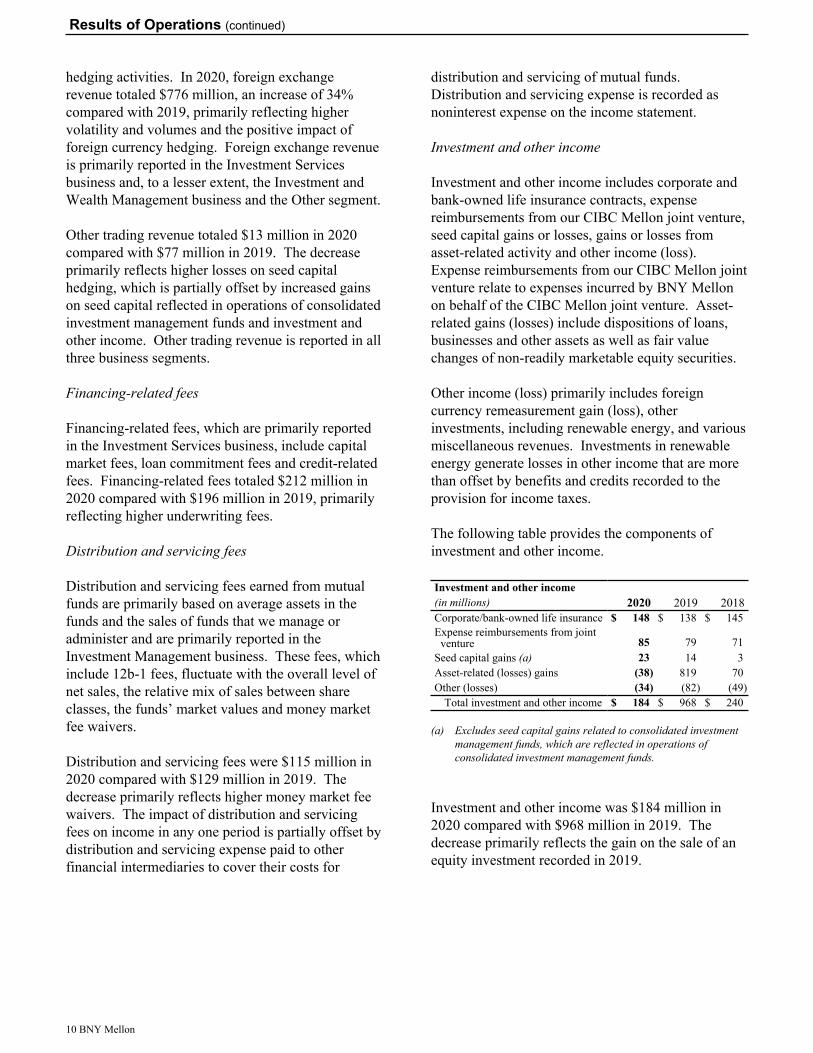
Investment and other income
Investment and other income includes corporate and bank-owned life insurance contracts, expense reimbursements from our CIBC Mellon joint venture, seed capital gains or losses, gains or losses from asset-related activity and other income (loss). Expense reimbursements from our CIBC Mellon joint venture relate to expenses incurred by BNY Mellon on behalf of the CIBC Mellon joint venture. Asset-related gains (losses) include dispositions of loans, businesses and other assets as well as fair value changes of non-readily marketable equity securities.
Other income (loss) primarily includes foreign currency remeasurement gain (loss), other investments, including renewable energy, and various miscellaneous revenues. Investments in renewable energy generate losses in other income that are more than offset by benefits and credits recorded to the provision for income taxes.
The following table provides the components of investment and other income.
Investment and other income (in millions) 2020 2019 2018Corporate/bank-owned life insurance $ 148 $ 138 $ 145 Expense reimbursements from joint
venture 85 79 71 Seed capital gains (a) 23 14 3 Asset-related (losses) gains (38) 819 70 Other (losses) (34) (82) (49)
Total investment and other income $ 184 $ 968 $ 240
(a) Excludes seed capital gains related to consolidated investment management funds, which are reflected in operations of consolidated investment management funds.
Investment and other income was $184 million in 2020 compared with $968 million in 2019. The decrease primarily reflects the gain on the sale of an equity investment recorded in 2019.
Results of Operations (continued)
10 BNY Mellon
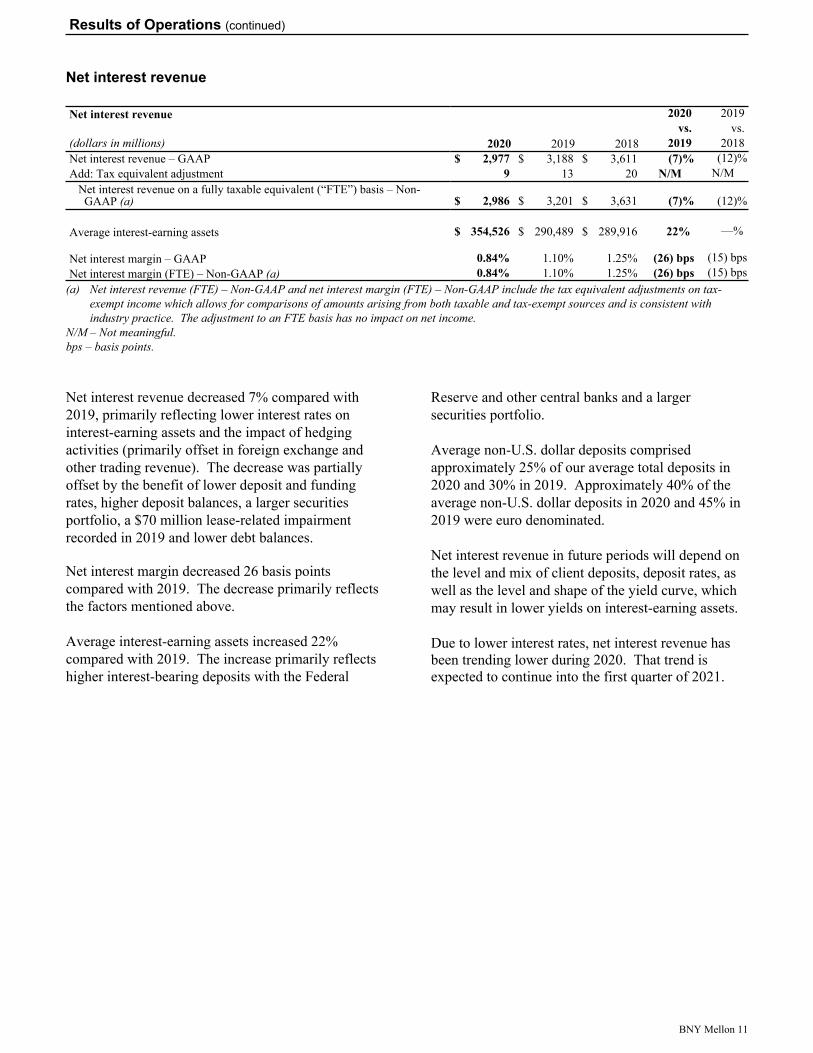
Net interest revenue
Net interest revenue 2020 2019 vs. vs.
(dollars in millions) 2020 2019 2018 2019 2018Net interest revenue – GAAP $ 2,977 $ 3,188 $ 3,611 (7) % (12) %Add: Tax equivalent adjustment 9 13 20 N/M N/M
Net interest revenue on a fully taxable equivalent (“FTE”) basis – Non-GAAP (a) $ 2,986 $ 3,201 $ 3,631 (7) % (12) %
Average interest-earning assets $ 354,526 $ 290,489 $ 289,916 22% —%
Net interest margin – GAAP 0.84% 1.10% 1.25% (26) bps (15) bpsNet interest margin (FTE) – Non-GAAP (a) 0.84% 1.10% 1.25% (26) bps (15) bps
(a) Net interest revenue (FTE) – Non-GAAP and net interest margin (FTE) – Non-GAAP include the tax equivalent adjustments on tax-exempt income which allows for comparisons of amounts arising from both taxable and tax-exempt sources and is consistent with industry practice. The adjustment to an FTE basis has no impact on net income.
N/M – Not meaningful.bps – basis points.
Net interest revenue decreased 7% compared with 2019, primarily reflecting lower interest rates on interest-earning assets and the impact of hedging activities (primarily offset in foreign exchange and other trading revenue). The decrease was partially offset by the benefit of lower deposit and funding rates, higher deposit balances, a larger securities portfolio, a $70 million lease-related impairment recorded in 2019 and lower debt balances.
Net interest margin decreased 26 basis points compared with 2019. The decrease primarily reflects the factors mentioned above.
Average interest-earning assets increased 22% compared with 2019. The increase primarily reflects higher interest-bearing deposits with the Federal
Reserve and other central banks and a larger securities portfolio.
Average non-U.S. dollar deposits comprised approximately 25% of our average total deposits in 2020 and 30% in 2019. Approximately 40% of the average non-U.S. dollar deposits in 2020 and 45% in 2019 were euro denominated.
Net interest revenue in future periods will depend on the level and mix of client deposits, deposit rates, as well as the level and shape of the yield curve, which may result in lower yields on interest-earning assets.
Due to lower interest rates, net interest revenue has been trending lower during 2020. That trend is expected to continue into the first quarter of 2021.
Results of Operations (continued)
BNY Mellon 11
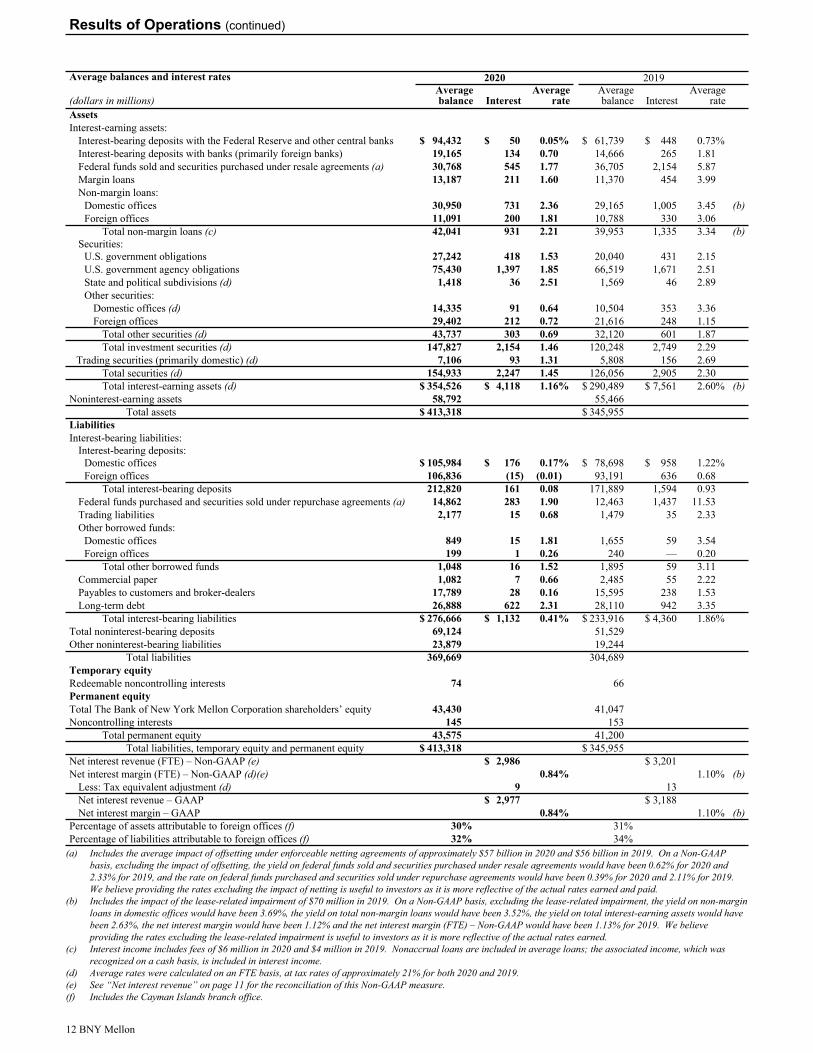
Average balances and interest rates 2020 2019
(dollars in millions)Average balance Interest
Average rate
Average balance Interest
Average rate
AssetsInterest-earning assets:
Interest-bearing deposits with the Federal Reserve and other central banks $ 94,432 $ 50 0.05% $ 61,739 $ 448 0.73% Interest-bearing deposits with banks (primarily foreign banks) 19,165 134 0.70 14,666 265 1.81 Federal funds sold and securities purchased under resale agreements (a) 30,768 545 1.77 36,705 2,154 5.87 Margin loans 13,187 211 1.60 11,370 454 3.99 Non-margin loans:
Domestic offices 30,950 731 2.36 29,165 1,005 3.45 (b)Foreign offices 11,091 200 1.81 10,788 330 3.06
Total non-margin loans (c) 42,041 931 2.21 39,953 1,335 3.34 (b)Securities:
U.S. government obligations 27,242 418 1.53 20,040 431 2.15 U.S. government agency obligations 75,430 1,397 1.85 66,519 1,671 2.51 State and political subdivisions (d) 1,418 36 2.51 1,569 46 2.89 Other securities:
Domestic offices (d) 14,335 91 0.64 10,504 353 3.36 Foreign offices 29,402 212 0.72 21,616 248 1.15
Total other securities (d) 43,737 303 0.69 32,120 601 1.87 Total investment securities (d) 147,827 2,154 1.46 120,248 2,749 2.29
Trading securities (primarily domestic) (d) 7,106 93 1.31 5,808 156 2.69 Total securities (d) 154,933 2,247 1.45 126,056 2,905 2.30 Total interest-earning assets (d) $ 354,526 $ 4,118 1.16% $ 290,489 $ 7,561 2.60% (b)
Noninterest-earning assets 58,792 55,466 Total assets $ 413,318 $ 345,955
LiabilitiesInterest-bearing liabilities:
Interest-bearing deposits:Domestic offices $ 105,984 $ 176 0.17% $ 78,698 $ 958 1.22% Foreign offices 106,836 (15) (0.01) 93,191 636 0.68
Total interest-bearing deposits 212,820 161 0.08 171,889 1,594 0.93 Federal funds purchased and securities sold under repurchase agreements (a) 14,862 283 1.90 12,463 1,437 11.53 Trading liabilities 2,177 15 0.68 1,479 35 2.33 Other borrowed funds:
Domestic offices 849 15 1.81 1,655 59 3.54 Foreign offices 199 1 0.26 240 — 0.20
Total other borrowed funds 1,048 16 1.52 1,895 59 3.11 Commercial paper 1,082 7 0.66 2,485 55 2.22 Payables to customers and broker-dealers 17,789 28 0.16 15,595 238 1.53 Long-term debt 26,888 622 2.31 28,110 942 3.35
Total interest-bearing liabilities $ 276,666 $ 1,132 0.41% $ 233,916 $ 4,360 1.86% Total noninterest-bearing deposits 69,124 51,529 Other noninterest-bearing liabilities 23,879 19,244
Total liabilities 369,669 304,689 Temporary equityRedeemable noncontrolling interests 74 66 Permanent equityTotal The Bank of New York Mellon Corporation shareholders’ equity 43,430 41,047 Noncontrolling interests 145 153
Total permanent equity 43,575 41,200 Total liabilities, temporary equity and permanent equity $ 413,318 $ 345,955
Net interest revenue (FTE) – Non-GAAP (e) $ 2,986 $ 3,201 Net interest margin (FTE) – Non-GAAP (d)(e) 0.84% 1.10% (b)
Less: Tax equivalent adjustment (d) 9 13 Net interest revenue – GAAP $ 2,977 $ 3,188 Net interest margin – GAAP 0.84% 1.10% (b)
Percentage of assets attributable to foreign offices (f) 30% 31% Percentage of liabilities attributable to foreign offices (f) 32% 34%
(a) Includes the average impact of offsetting under enforceable netting agreements of approximately $57 billion in 2020 and $56 billion in 2019. On a Non-GAAP basis, excluding the impact of offsetting, the yield on federal funds sold and securities purchased under resale agreements would have been 0.62% for 2020 and 2.33% for 2019, and the rate on federal funds purchased and securities sold under repurchase agreements would have been 0.39% for 2020 and 2.11% for 2019. We believe providing the rates excluding the impact of netting is useful to investors as it is more reflective of the actual rates earned and paid.
(b) Includes the impact of the lease-related impairment of $70 million in 2019. On a Non-GAAP basis, excluding the lease-related impairment, the yield on non-margin loans in domestic offices would have been 3.69%, the yield on total non-margin loans would have been 3.52%, the yield on total interest-earning assets would have been 2.63%, the net interest margin would have been 1.12% and the net interest margin (FTE) – Non-GAAP would have been 1.13% for 2019. We believe providing the rates excluding the lease-related impairment is useful to investors as it is more reflective of the actual rates earned.
(c) Interest income includes fees of $6 million in 2020 and $4 million in 2019. Nonaccrual loans are included in average loans; the associated income, which was recognized on a cash basis, is included in interest income.
(d) Average rates were calculated on an FTE basis, at tax rates of approximately 21% for both 2020 and 2019.(e) See “Net interest revenue” on page 11 for the reconciliation of this Non-GAAP measure.(f) Includes the Cayman Islands branch office.
Results of Operations (continued)
12 BNY Mellon
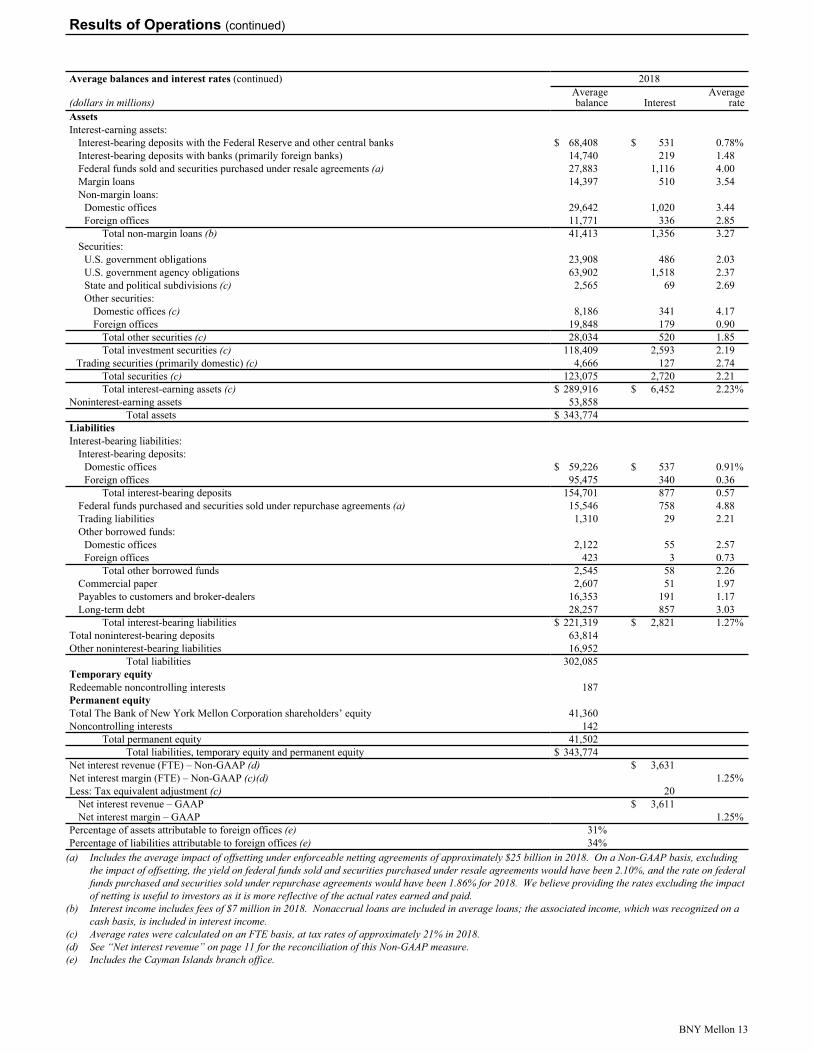
Average balances and interest rates (continued) 2018
(dollars in millions)Average balance Interest
Average rate
AssetsInterest-earning assets:
Interest-bearing deposits with the Federal Reserve and other central banks $ 68,408 $ 531 0.78% Interest-bearing deposits with banks (primarily foreign banks) 14,740 219 1.48 Federal funds sold and securities purchased under resale agreements (a) 27,883 1,116 4.00 Margin loans 14,397 510 3.54 Non-margin loans:
Domestic offices 29,642 1,020 3.44 Foreign offices 11,771 336 2.85
Total non-margin loans (b) 41,413 1,356 3.27 Securities:
U.S. government obligations 23,908 486 2.03 U.S. government agency obligations 63,902 1,518 2.37 State and political subdivisions (c) 2,565 69 2.69 Other securities:
Domestic offices (c) 8,186 341 4.17 Foreign offices 19,848 179 0.90
Total other securities (c) 28,034 520 1.85 Total investment securities (c) 118,409 2,593 2.19
Trading securities (primarily domestic) (c) 4,666 127 2.74 Total securities (c) 123,075 2,720 2.21 Total interest-earning assets (c) $ 289,916 $ 6,452 2.23%
Noninterest-earning assets 53,858 Total assets $ 343,774
LiabilitiesInterest-bearing liabilities:
Interest-bearing deposits:Domestic offices $ 59,226 $ 537 0.91% Foreign offices 95,475 340 0.36
Total interest-bearing deposits 154,701 877 0.57 Federal funds purchased and securities sold under repurchase agreements (a) 15,546 758 4.88 Trading liabilities 1,310 29 2.21 Other borrowed funds:
Domestic offices 2,122 55 2.57 Foreign offices 423 3 0.73
Total other borrowed funds 2,545 58 2.26 Commercial paper 2,607 51 1.97 Payables to customers and broker-dealers 16,353 191 1.17 Long-term debt 28,257 857 3.03
Total interest-bearing liabilities $ 221,319 $ 2,821 1.27% Total noninterest-bearing deposits 63,814 Other noninterest-bearing liabilities 16,952
Total liabilities 302,085 Temporary equityRedeemable noncontrolling interests 187 Permanent equityTotal The Bank of New York Mellon Corporation shareholders’ equity 41,360 Noncontrolling interests 142
Total permanent equity 41,502 Total liabilities, temporary equity and permanent equity $ 343,774
Net interest revenue (FTE) – Non-GAAP (d) $ 3,631 Net interest margin (FTE) – Non-GAAP (c)(d) 1.25% Less: Tax equivalent adjustment (c) 20
Net interest revenue – GAAP $ 3,611 Net interest margin – GAAP 1.25%
Percentage of assets attributable to foreign offices (e) 31% Percentage of liabilities attributable to foreign offices (e) 34%
(a) Includes the average impact of offsetting under enforceable netting agreements of approximately $25 billion in 2018. On a Non-GAAP basis, excluding the impact of offsetting, the yield on federal funds sold and securities purchased under resale agreements would have been 2.10%, and the rate on federal funds purchased and securities sold under repurchase agreements would have been 1.86% for 2018. We believe providing the rates excluding the impact of netting is useful to investors as it is more reflective of the actual rates earned and paid.
(b) Interest income includes fees of $7 million in 2018. Nonaccrual loans are included in average loans; the associated income, which was recognized on a cash basis, is included in interest income.
(c) Average rates were calculated on an FTE basis, at tax rates of approximately 21% in 2018.(d) See “Net interest revenue” on page 11 for the reconciliation of this Non-GAAP measure.(e) Includes the Cayman Islands branch office.
Results of Operations (continued)
BNY Mellon 13
Noninterest expense
Noninterest expense 2020 2019 vs. vs.
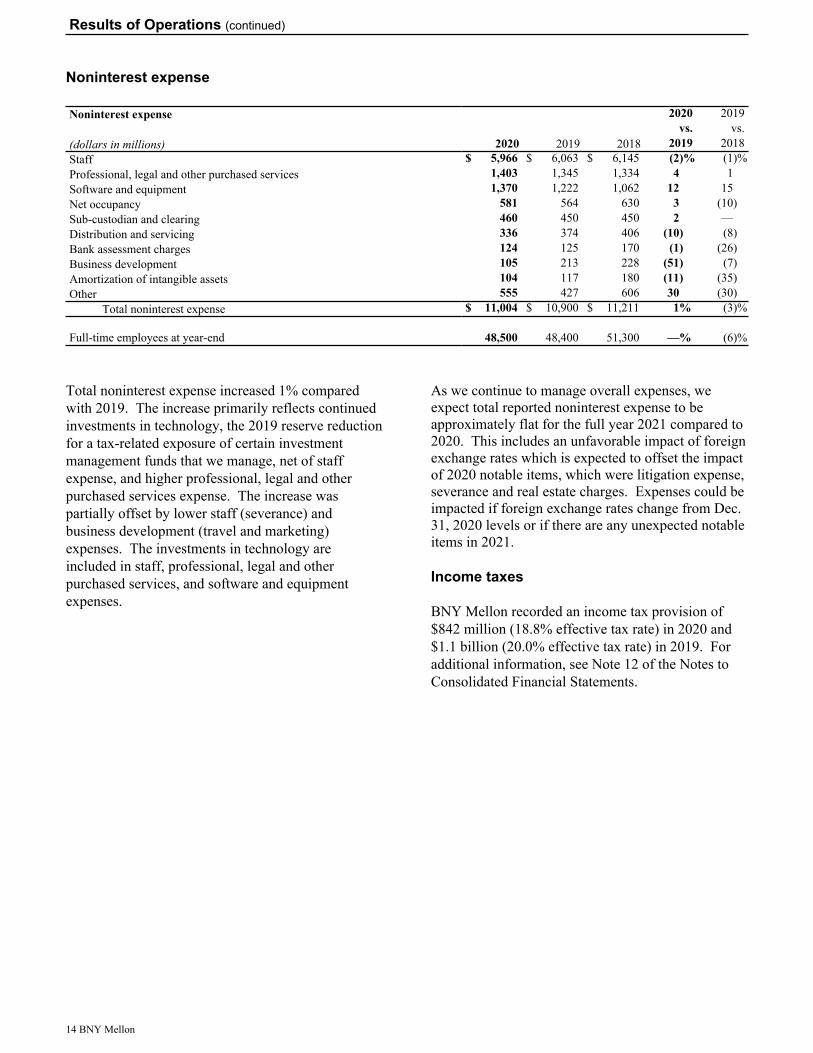
(dollars in millions) 2020 2019 2018 2019 2018Staff $ 5,966 $ 6,063 $ 6,145 (2) % (1) %Professional, legal and other purchased services 1,403 1,345 1,334 4 1 Software and equipment 1,370 1,222 1,062 12 15 Net occupancy 581 564 630 3 (10) Sub-custodian and clearing 460 450 450 2 — Distribution and servicing 336 374 406 (10) (8) Bank assessment charges 124 125 170 (1) (26) Business development 105 213 228 (51) (7) Amortization of intangible assets 104 117 180 (11) (35) Other 555 427 606 30 (30)
Total noninterest expense $ 11,004 $ 10,900 $ 11,211 1% (3) %
Full-time employees at year-end 48,500 48,400 51,300 —% (6) %
Total noninterest expense increased 1% compared with 2019. The increase primarily reflects continued investments in technology, the 2019 reserve reduction for a tax-related exposure of certain investment management funds that we manage, net of staff expense, and higher professional, legal and other purchased services expense. The increase was partially offset by lower staff (severance) and business development (travel and marketing) expenses. The investments in technology are included in staff, professional, legal and other purchased services, and software and equipment expenses.
As we continue to manage overall expenses, we expect total reported noninterest expense to be approximately flat for the full year 2021 compared to 2020. This includes an unfavorable impact of foreign exchange rates which is expected to offset the impact of 2020 notable items, which were litigation expense, severance and real estate charges. Expenses could be impacted if foreign exchange rates change from Dec. 31, 2020 levels or if there are any unexpected notable items in 2021.
Income taxes
BNY Mellon recorded an income tax provision of $842 million (18.8% effective tax rate) in 2020 and $1.1 billion (20.0% effective tax rate) in 2019. For additional information, see Note 12 of the Notes to Consolidated Financial Statements.
Results of Operations (continued)
14 BNY Mellon
Review of businesses
We have an internal information system that produces performance data along product and service lines for our two principal businesses, Investment Services and Investment and Wealth Management, and the Other segment.
Business accounting principles
Our business data has been determined on an internal management basis of accounting, rather than the generally accepted accounting principles (“GAAP”) used for consolidated financial reporting. These measurement principles are designed so that reported results of the businesses will track their economic performance.
For information on the accounting principles of our businesses, the primary products and services in each line of business, the primary types of revenue by business and how our businesses are presented and analyzed, see Note 24 of the Notes to Consolidated Financial Statements.
Business results are subject to reclassification when organizational changes are made, or for refinements in revenue and expense allocation methodologies. Refinements are typically reflected on a prospective basis. In 2020, we reclassified the results of certain services provided between the segments from noninterest expense to fee and other revenue. The intersegment activity is eliminated in the Other segment and relates to services that are also provided to third parties and provides consistency with the reporting of the revenues. This adjustment had no impact on income before taxes of the businesses. Also in 2020, we reclassified the results related to certain lending activities from the Wealth Management business to the Pershing business. These loans were originated by the Wealth Management business as a service to Pershing clients. This resulted in an increase in total revenue, noninterest expense and income before taxes in the Pershing business and a corresponding decrease in the Wealth Management business. Prior periods were restated for both reclassifications.
The results of our businesses may be influenced by client and other activities that vary by quarter. In the
first quarter, staff expense typically increases reflecting the vesting of long-term stock awards for retirement-eligible employees. In the third quarter, Depositary Receipts revenue is typically higher due to an increased level of client dividend payments. Also in the third quarter, volume-related fees may decline due to reduced client activity, and staff expense typically increases reflecting the annual employee merit increase. In the fourth quarter, we typically incur higher business development and marketing expenses; however, 2020 was an exception given the impact of the coronavirus pandemic. In our Investment and Wealth Management business, performance fees are typically higher in the fourth and first quarters, as those quarters represent the end of the measurement period for many of the performance fee-eligible relationships.
The results of our businesses may also be impacted by the translation of financial results denominated in foreign currencies to the U.S. dollar. We are primarily impacted by activities denominated in the British pound and the euro. On a consolidated basis and in our Investment Services business, we typically have more foreign currency-denominated expenses than revenues. However, our Investment and Wealth Management business typically has more foreign currency-denominated revenues than expenses. Overall, currency fluctuations impact the year-over-year growth rate in the Investment and Wealth Management business more than the Investment Services business. However, currency fluctuations, in isolation, are not expected to significantly impact net income on a consolidated basis.
Fee revenue in Investment and Wealth Management, and to a lesser extent in Investment Services, is impacted by the value of market indices. At Dec. 31, 2020, we estimated that a 5% change in global equity markets, spread evenly throughout the year, would impact fee revenue by less than 1% and diluted earnings per common share by $0.03 to $0.06.
See Note 24 of the Notes to Consolidated Financial Statements for the consolidating schedules which show the contribution of our businesses to our overall profitability.
Results of Operations (continued)
BNY Mellon 15
Investment Services business
2020 2019
(dollars in millions, unless otherwise noted) vs. vs.
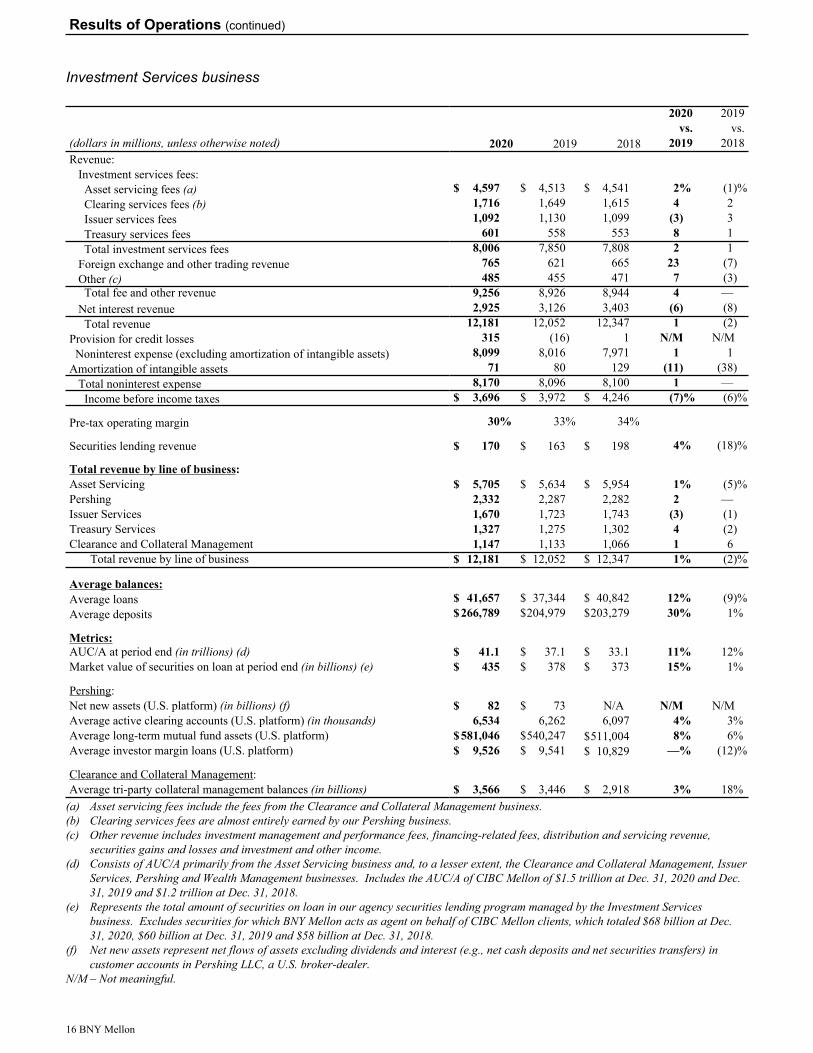
2020 2019 2018 2019 2018Revenue:
Investment services fees:Asset servicing fees (a) $ 4,597 $ 4,513 $ 4,541 2% (1) %Clearing services fees (b) 1,716 1,649 1,615 4 2 Issuer services fees 1,092 1,130 1,099 (3) 3 Treasury services fees 601 558 553 8 1 Total investment services fees 8,006 7,850 7,808 2 1
Foreign exchange and other trading revenue 765 621 665 23 (7) Other (c) 485 455 471 7 (3) Total fee and other revenue 9,256 8,926 8,944 4 —
Net interest revenue 2,925 3,126 3,403 (6) (8) Total revenue 12,181 12,052 12,347 1 (2)
Provision for credit losses 315 (16) 1 N/M N/MNoninterest expense (excluding amortization of intangible assets) 8,099 8,016 7,971 1 1
Amortization of intangible assets 71 80 129 (11) (38) Total noninterest expense 8,170 8,096 8,100 1 — Income before income taxes $ 3,696 $ 3,972 $ 4,246 (7) % (6) %
Pre-tax operating margin 30% 33% 34%
Securities lending revenue $ 170 $ 163 $ 198 4% (18) %
Total revenue by line of business:Asset Servicing $ 5,705 $ 5,634 $ 5,954 1% (5) %Pershing 2,332 2,287 2,282 2 — Issuer Services 1,670 1,723 1,743 (3) (1) Treasury Services 1,327 1,275 1,302 4 (2) Clearance and Collateral Management 1,147 1,133 1,066 1 6
Total revenue by line of business $ 12,181 $ 12,052 $ 12,347 1% (2) %
Average balances:Average loans $ 41,657 $ 37,344 $ 40,842 12% (9) %Average deposits $ 266,789 $ 204,979 $ 203,279 30% 1%
Metrics:AUC/A at period end (in trillions) (d) $ 41.1 $ 37.1 $ 33.1 11% 12% Market value of securities on loan at period end (in billions) (e) $ 435 $ 378 $ 373 15% 1%
Pershing:Net new assets (U.S. platform) (in billions) (f) $ 82 $ 73 N/A N/M N/MAverage active clearing accounts (U.S. platform) (in thousands) 6,534 6,262 6,097 4% 3% Average long-term mutual fund assets (U.S. platform) $ 581,046 $ 540,247 $ 511,004 8% 6% Average investor margin loans (U.S. platform) $ 9,526 $ 9,541 $ 10,829 —% (12) %
Clearance and Collateral Management:Average tri-party collateral management balances (in billions) $ 3,566 $ 3,446 $ 2,918 3% 18%
(a) Asset servicing fees include the fees from the Clearance and Collateral Management business. (b) Clearing services fees are almost entirely earned by our Pershing business. (c) Other revenue includes investment management and performance fees, financing-related fees, distribution and servicing revenue,
securities gains and losses and investment and other income. (d) Consists of AUC/A primarily from the Asset Servicing business and, to a lesser extent, the Clearance and Collateral Management, Issuer
Services, Pershing and Wealth Management businesses. Includes the AUC/A of CIBC Mellon of $1.5 trillion at Dec. 31, 2020 and Dec. 31, 2019 and $1.2 trillion at Dec. 31, 2018.
(e) Represents the total amount of securities on loan in our agency securities lending program managed by the Investment Services business. Excludes securities for which BNY Mellon acts as agent on behalf of CIBC Mellon clients, which totaled $68 billion at Dec. 31, 2020, $60 billion at Dec. 31, 2019 and $58 billion at Dec. 31, 2018.
(f) Net new assets represent net flows of assets excluding dividends and interest (e.g., net cash deposits and net securities transfers) in customer accounts in Pershing LLC, a U.S. broker-dealer.
N/M – Not meaningful.
Results of Operations (continued)
16 BNY Mellon
Business description
BNY Mellon Investment Services provides business services and technology solutions to entities including financial institutions, corporations, foundations and endowments, public funds and government agencies. Our lines of business include: Asset Servicing, Pershing, Issuer Services, Treasury Services and Clearance and Collateral Management. For information on the drivers of the Investment Services fee revenue, see Note 10 of the Notes to Consolidated Financial Statements.
We are one of the leading global investment services providers with $41.1 trillion of AUC/A at Dec. 31, 2020.
The Asset Servicing business provides a comprehensive suite of solutions. As one of the largest global custody and fund accounting providers and a trusted partner, we offer services for the safekeeping of assets in capital markets globally as well as alternative investment and structured product strategies. We provide custody and foreign exchange services, support exchange-traded funds and unit investment trusts and provide our clients outsourcing capabilities. Our robust digital and data offerings enable us to provide fully integrated technology solutions for our clients. We deliver securities lending and financing solutions on both an agency and principal basis. Our agency securities lending program is one of the largest lenders of U.S. and non-U.S. securities, servicing a lendable asset pool of approximately $4.7 trillion in 34 separate markets. Our market-leading liquidity services portal enables cash investments for institutional clients and includes fund research and analytics.
Pershing provides execution, clearing, custody, business and technology solutions, delivering dependable operational support to broker-dealers, wealth managers and registered investment advisors (“RIAs”) globally.
The Issuer Services business includes Corporate Trust and Depositary Receipts. Our Corporate Trust business delivers a full range of issuer and related investor services, including trustee, paying agency, fiduciary, escrow and other financial services. We are a leading provider to the debt capital markets, providing customized and market-driven solutions to investors, bondholders and lenders. Our Depositary Receipts business drives
global investing by providing servicing and value-added solutions that enable, facilitate and enhance cross-border trading, clearing, settlement and ownership. We are one of the largest providers of depositary receipts services in the world, partnering with leading companies from more than 50 countries.
Our Treasury Services business provides global payments, liquidity management and trade finance services for financial institutions, corporations and the public sector.
Our Clearance and Collateral Management business clears and settles equity and fixed-income transactions globally and serves as custodian for tri-party repo collateral worldwide. We are the primary provider of U.S. government securities clearance and a provider of non-U.S. government securities clearance. Our collateral services include collateral management, administration and segregation. We offer innovative solutions and industry expertise which help financial institutions and institutional investors with their liquidity, financing, risk and balance sheet challenges. We are a leading provider of tri-party collateral management services with an average of $3.6 trillion serviced globally including approximately $2.6 trillion of the U.S. tri-party repo market at Dec. 31, 2020.
Review of financial results
AUC/A of $41.1 trillion increased 11% compared with Dec. 31, 2019, primarily reflecting higher market values and client inflows, the favorable impact of a weaker U.S. dollar and net new business. AUC/A consisted of 36% equity securities and 64% fixed-income securities at Dec. 31, 2020 and 35% equity securities and 65% fixed-income securities at Dec. 31, 2019.
Total revenue of $12.2 billion increased 1% compared with 2019. The drivers of total revenue by line of business are indicated below.
Asset Servicing revenue of $5.7 billion increased 1% compared with 2019. The increase primarily reflects higher foreign exchange volatility and volumes, higher market values and higher balances, partially offset by lower net interest revenue.
Results of Operations (continued)
BNY Mellon 17
Pershing revenue of $2.3 billion increased 2% compared with 2019. The increase primarily reflects higher balances, higher clearing revenue and the positive impact of equity markets, partially offset by higher money market fee waivers.
Issuer Services revenue of $1.7 billion decreased 3% compared with 2019. The decrease primarily reflects lower Depositary Receipts revenue and lower net interest revenue in Corporate Trust.
Treasury Services revenue of $1.3 billion increased 4% compared with 2019. The increase primarily reflects higher deposit and money market balances.
Clearance and Collateral Management revenue of $1.1 billion increased 1% compared with 2019. The increase primarily reflects growth in collateral management and clearance volumes and higher net
interest revenue, partially offset by lower investment income due to the 2019 sale of an equity investment.
Market and regulatory trends are driving investable assets toward lower fee asset management products at reduced margins for our clients. These dynamics are also negatively impacting our investment services fees. However, at the same time, these trends are providing additional outsourcing opportunities as clients and other market participants seek to comply with regulations and reduce their operating costs.
Noninterest expense of $8.2 billion increased 1% compared with 2019. The increase primarily reflects continued investments in technology, higher software and equipment and litigation expenses, partially offset by lower severance and business development (travel and marketing) expenses.
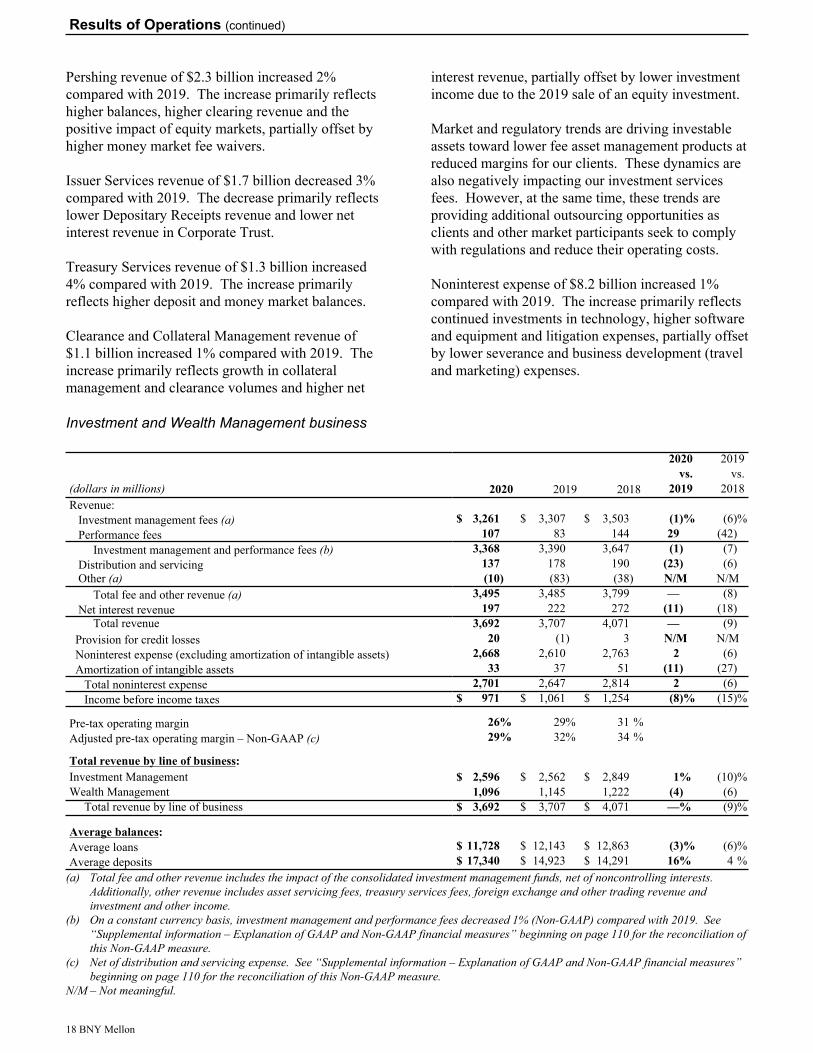
Investment and Wealth Management business
2020 2019 vs. vs.
(dollars in millions) 2020 2019 2018 2019 2018Revenue:
Investment management fees (a) $ 3,261 $ 3,307 $ 3,503 (1) % (6) %Performance fees 107 83 144 29 (42)
Investment management and performance fees (b) 3,368 3,390 3,647 (1) (7) Distribution and servicing 137 178 190 (23) (6) Other (a) (10) (83) (38) N/M N/M
Total fee and other revenue (a) 3,495 3,485 3,799 — (8) Net interest revenue 197 222 272 (11) (18)
Total revenue 3,692 3,707 4,071 — (9) Provision for credit losses 20 (1) 3 N/M N/MNoninterest expense (excluding amortization of intangible assets) 2,668 2,610 2,763 2 (6) Amortization of intangible assets 33 37 51 (11) (27)
Total noninterest expense 2,701 2,647 2,814 2 (6) Income before income taxes $ 971 $ 1,061 $ 1,254 (8) % (15) %
Pre-tax operating margin 26% 29% 31 %Adjusted pre-tax operating margin – Non-GAAP (c) 29% 32% 34 %
Total revenue by line of business:Investment Management $ 2,596 $ 2,562 $ 2,849 1% (10) %Wealth Management 1,096 1,145 1,222 (4) (6)
Total revenue by line of business $ 3,692 $ 3,707 $ 4,071 —% (9) %
Average balances:Average loans $ 11,728 $ 12,143 $ 12,863 (3) % (6) %Average deposits $ 17,340 $ 14,923 $ 14,291 16% 4 %
(a) Total fee and other revenue includes the impact of the consolidated investment management funds, net of noncontrolling interests. Additionally, other revenue includes asset servicing fees, treasury services fees, foreign exchange and other trading revenue and investment and other income.
(b) On a constant currency basis, investment management and performance fees decreased 1% (Non-GAAP) compared with 2019. See “Supplemental information – Explanation of GAAP and Non-GAAP financial measures” beginning on page 110 for the reconciliation of this Non-GAAP measure.
(c) Net of distribution and servicing expense. See “Supplemental information – Explanation of GAAP and Non-GAAP financial measures” beginning on page 110 for the reconciliation of this Non-GAAP measure.
N/M – Not meaningful.
Results of Operations (continued)
18 BNY Mellon
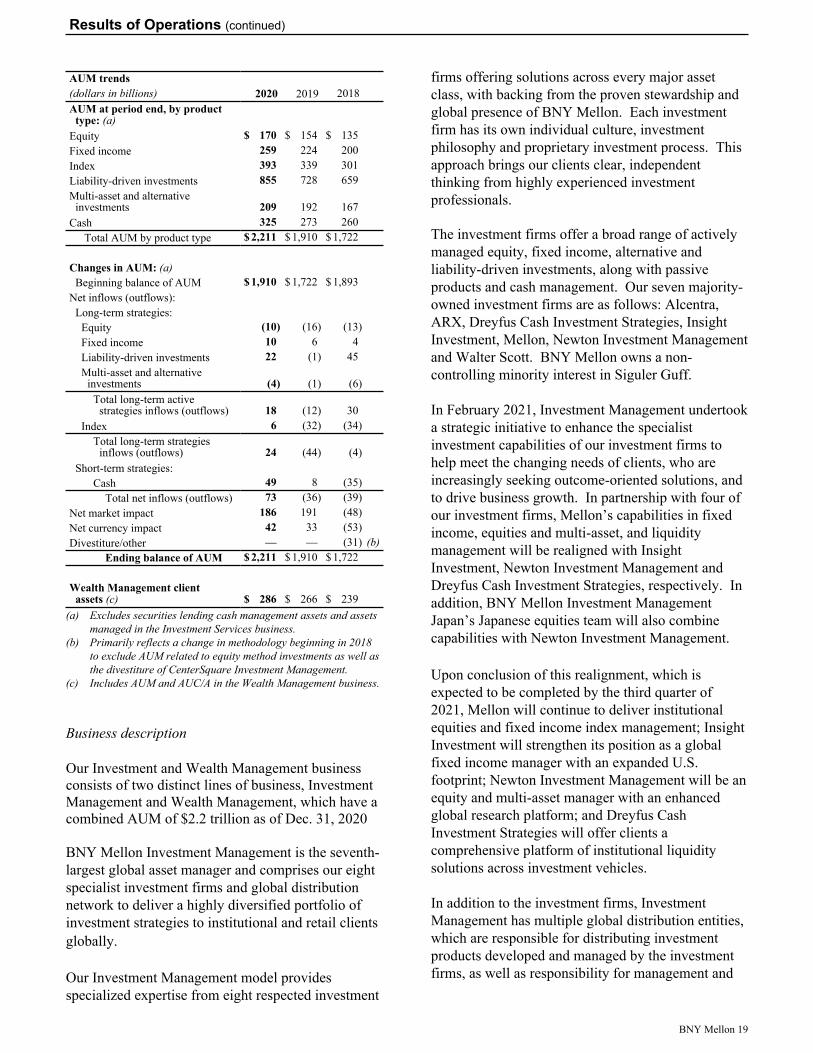
AUM trends(dollars in billions) 2020 2019 2018AUM at period end, by product
type: (a)Equity $ 170 $ 154 $ 135 Fixed income 259 224 200 Index 393 339 301 Liability-driven investments 855 728 659 Multi-asset and alternative
investments 209 192 167 Cash 325 273 260
Total AUM by product type $ 2,211 $ 1,910 $ 1,722
Changes in AUM: (a)Beginning balance of AUM $ 1,910 $ 1,722 $ 1,893
Net inflows (outflows):Long-term strategies:
Equity (10) (16) (13) Fixed income 10 6 4 Liability-driven investments 22 (1) 45 Multi-asset and alternative
investments (4) (1) (6) Total long-term active
strategies inflows (outflows) 18 (12) 30 Index 6 (32) (34)
Total long-term strategies inflows (outflows) 24 (44) (4)
Short-term strategies:Cash 49 8 (35)
Total net inflows (outflows) 73 (36) (39) Net market impact 186 191 (48) Net currency impact 42 33 (53) Divestiture/other — — (31) (b)
Ending balance of AUM $ 2,211 $ 1,910 $ 1,722
Wealth Management client assets (c) $ 286 $ 266 $ 239
(a) Excludes securities lending cash management assets and assets managed in the Investment Services business.
(b) Primarily reflects a change in methodology beginning in 2018 to exclude AUM related to equity method investments as well as the divestiture of CenterSquare Investment Management.
(c) Includes AUM and AUC/A in the Wealth Management business.
Business description
Our Investment and Wealth Management business consists of two distinct lines of business, Investment Management and Wealth Management, which have a combined AUM of $2.2 trillion as of Dec. 31, 2020
BNY Mellon Investment Management is the seventh-largest global asset manager and comprises our eight specialist investment firms and global distribution network to deliver a highly diversified portfolio of investment strategies to institutional and retail clients globally.
Our Investment Management model provides specialized expertise from eight respected investment
firms offering solutions across every major asset class, with backing from the proven stewardship and global presence of BNY Mellon. Each investment firm has its own individual culture, investment philosophy and proprietary investment process. This approach brings our clients clear, independent thinking from highly experienced investment professionals.
The investment firms offer a broad range of actively managed equity, fixed income, alternative and liability-driven investments, along with passive products and cash management. Our seven majority-owned investment firms are as follows: Alcentra, ARX, Dreyfus Cash Investment Strategies, Insight Investment, Mellon, Newton Investment Management and Walter Scott. BNY Mellon owns a non-controlling minority interest in Siguler Guff.
In February 2021, Investment Management undertook a strategic initiative to enhance the specialist investment capabilities of our investment firms to help meet the changing needs of clients, who are increasingly seeking outcome-oriented solutions, and to drive business growth. In partnership with four of our investment firms, Mellon’s capabilities in fixed income, equities and multi-asset, and liquidity management will be realigned with Insight Investment, Newton Investment Management and Dreyfus Cash Investment Strategies, respectively. In addition, BNY Mellon Investment Management Japan’s Japanese equities team will also combine capabilities with Newton Investment Management.
Upon conclusion of this realignment, which is expected to be completed by the third quarter of 2021, Mellon will continue to deliver institutional equities and fixed income index management; Insight Investment will strengthen its position as a global fixed income manager with an expanded U.S. footprint; Newton Investment Management will be an equity and multi-asset manager with an enhanced global research platform; and Dreyfus Cash Investment Strategies will offer clients a comprehensive platform of institutional liquidity solutions across investment vehicles.
In addition to the investment firms, Investment Management has multiple global distribution entities, which are responsible for distributing investment products developed and managed by the investment firms, as well as responsibility for management and
Results of Operations (continued)
BNY Mellon 19
distribution of our U.S. mutual funds and certain offshore money market funds.
BNY Mellon Wealth Management provides investment management, custody, wealth and estate planning, private banking services, investment servicing and information management. BNY Mellon Wealth Management has $286 billion in client assets as of Dec. 31, 2020, and 35 offices in the U.S. and internationally.
Wealth Management clients include individuals, families and institutions. Institutions include family offices, charitable gift programs and endowments and foundations. We work with clients to build, manage and sustain wealth across generations and market cycles.
The wealth business differentiates itself with a holistic wealth management framework that seeks to empower clients to build and sustain long-term wealth.
The results of the Investment and Wealth Management business are driven by a blend of daily, monthly and quarterly averages of AUM by product type. The overall level of AUM for a given period is determined by:
• the beginning level of AUM;
• the net flows of new assets during the period resulting from new business wins and existing client enrichments, reduced by the loss of clients and withdrawals; and
• the impact of market price appreciation or depreciation, foreign exchange rates and investment firm acquisitions or divestitures.
The mix of AUM is a result of the historical growth rates of equity and fixed income markets and the cumulative net flows of our investment firms as a result of client asset allocation decisions. Actively managed equity, multi-asset and alternative assets typically generate higher percentage fees than fixed-income and liability-driven investments and cash. Also, actively managed assets typically generate higher management fees than indexed or passively managed assets of the same type. Market and regulatory trends have resulted in increased demand for lower fee asset management products and for performance-based fees.
Investment management fees are dependent on the overall level and mix of AUM and the management fees expressed in basis points (one-hundredth of one percent) charged for managing those assets. Management fees are typically subject to fee schedules based on the overall level of assets managed for a single client or by individual asset class and style. This is most common for institutional clients where we typically manage substantial assets for individual accounts.
Performance fees are generally calculated as a percentage of a portfolio’s performance in excess of a benchmark index or a peer group’s performance.
A key driver of organic growth in investment management and performance fees is the amount of net new AUM flows. Overall market conditions are also key drivers, with a significant long-term economic driver being growth of global financial assets.
Net interest revenue is determined by loan and deposit volumes and the interest rate spread between customer rates and internal funds transfer rates on loans and deposits. Expenses in the Investment and Wealth Management business are mainly driven by staff and distribution and servicing expenses.
Review of financial results
AUM of $2.2 trillion increased 16% compared with Dec. 31, 2019 primarily reflecting higher market values, net inflows and the favorable impact of a weaker U.S. dollar (principally versus the British pound).
Net long-term strategy inflows were $24 billion in 2020, driven by liability-driven investment funds. Short-term strategy inflows were $49 billion in 2020.
Total revenue of $3.7 billion decreased slightly compared with 2019.
Investment Management revenue of $2.6 billion increased 1% compared with 2019. The increase primarily reflects higher market values and performance fees, partially offset by money market fee waivers and an unfavorable change in the mix of AUM.
Wealth Management revenue of $1.1 billion decreased 4% compared with 2019. The decrease
Results of Operations (continued)
20 BNY Mellon
reflects lower net interest revenue and a shift to lower fee investment products, partially offset by higher market values.
Revenue generated in the Investment and Wealth Management business included 41% from non-U.S. sources in 2020, compared with 40% in 2019.
Noninterest expense of $2.7 billion increased 2% compared with 2019. The increase primarily reflects the 2019 reserve reduction for a tax-related exposure of certain investment management funds, partially offset by lower business development (travel and marketing) expense.
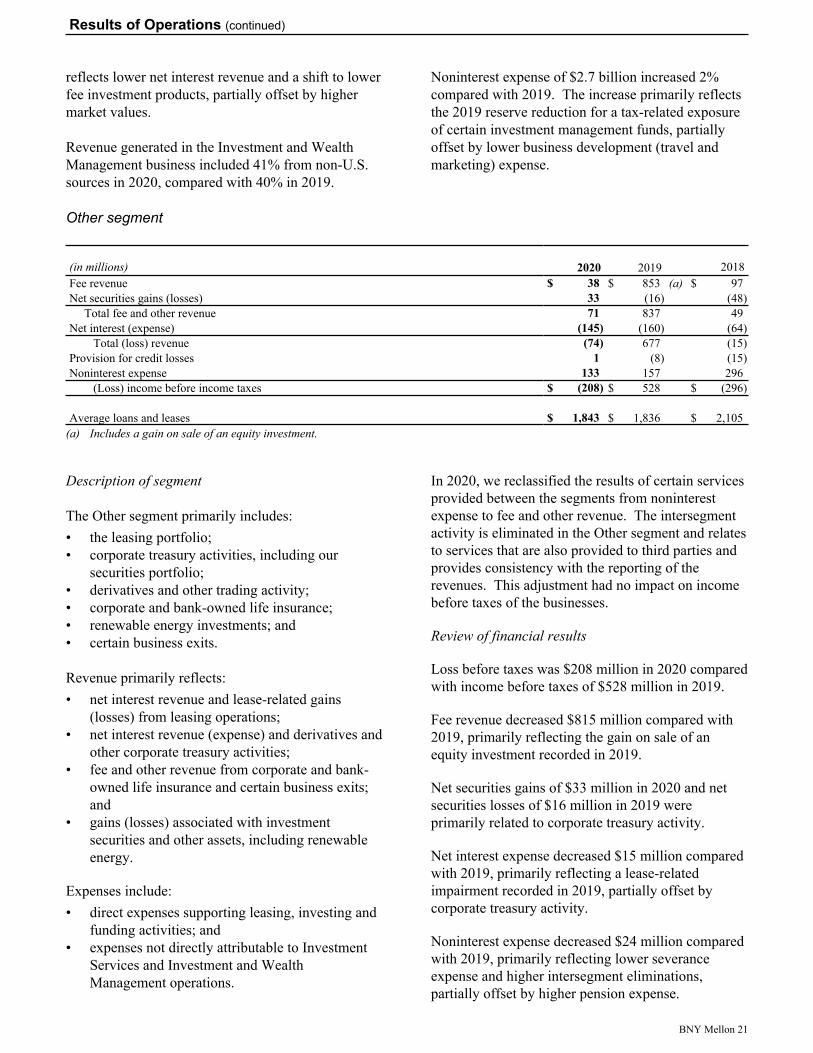
Other segment
(in millions) 2020 2019 2018Fee revenue $ 38 $ 853 (a) $ 97 Net securities gains (losses) 33 (16) (48)
Total fee and other revenue 71 837 49 Net interest (expense) (145) (160) (64)
Total (loss) revenue (74) 677 (15) Provision for credit losses 1 (8) (15) Noninterest expense 133 157 296
(Loss) income before income taxes $ (208) $ 528 $ (296)
Average loans and leases $ 1,843 $ 1,836 $ 2,105 (a) Includes a gain on sale of an equity investment.
Description of segment
The Other segment primarily includes:• the leasing portfolio;• corporate treasury activities, including our
securities portfolio;• derivatives and other trading activity;• corporate and bank-owned life insurance;• renewable energy investments; and• certain business exits.
Revenue primarily reflects:• net interest revenue and lease-related gains
(losses) from leasing operations;• net interest revenue (expense) and derivatives and
other corporate treasury activities;• fee and other revenue from corporate and bank-
owned life insurance and certain business exits; and
• gains (losses) associated with investment securities and other assets, including renewable energy.
Expenses include:• direct expenses supporting leasing, investing and
funding activities; and• expenses not directly attributable to Investment
Services and Investment and Wealth Management operations.
In 2020, we reclassified the results of certain services provided between the segments from noninterest expense to fee and other revenue. The intersegment activity is eliminated in the Other segment and relates to services that are also provided to third parties and provides consistency with the reporting of the revenues. This adjustment had no impact on income before taxes of the businesses.
Review of financial results
Loss before taxes was $208 million in 2020 compared with income before taxes of $528 million in 2019.
Fee revenue decreased $815 million compared with 2019, primarily reflecting the gain on sale of an equity investment recorded in 2019.
Net securities gains of $33 million in 2020 and net securities losses of $16 million in 2019 were primarily related to corporate treasury activity.
Net interest expense decreased $15 million compared with 2019, primarily reflecting a lease-related impairment recorded in 2019, partially offset by corporate treasury activity.
Noninterest expense decreased $24 million compared with 2019, primarily reflecting lower severance expense and higher intersegment eliminations, partially offset by higher pension expense.
Results of Operations (continued)
BNY Mellon 21
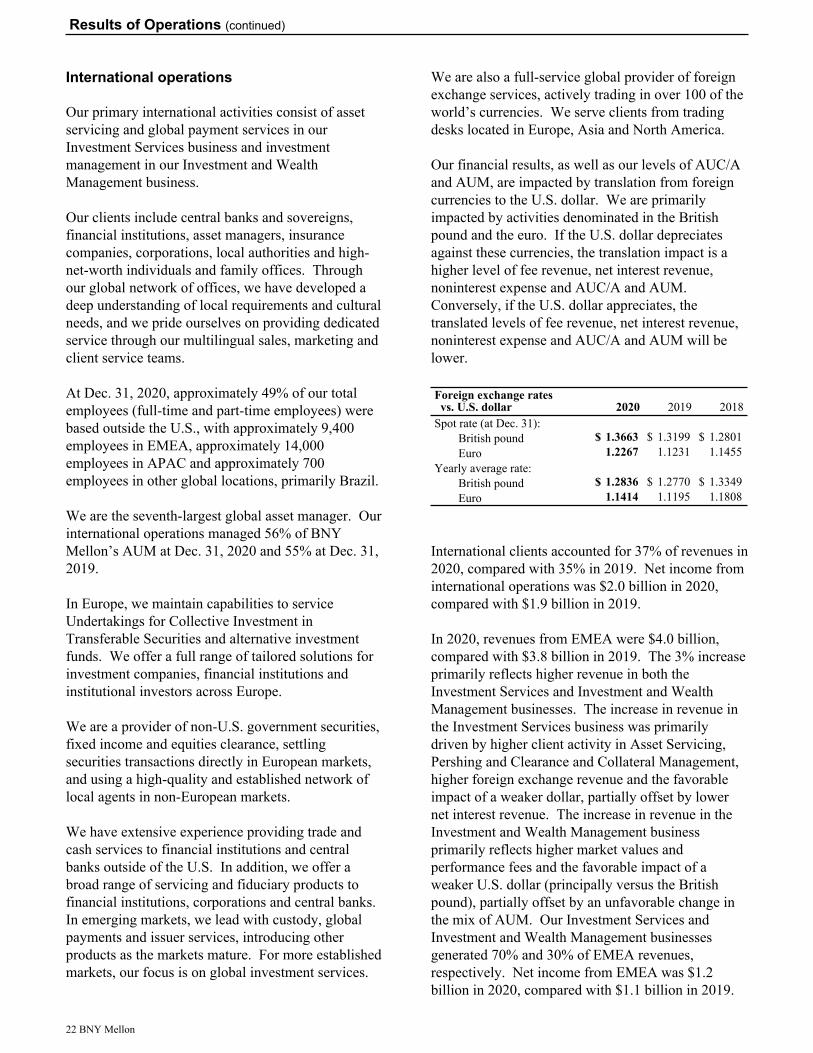
International operations
Our primary international activities consist of asset servicing and global payment services in our Investment Services business and investment management in our Investment and Wealth Management business.
Our clients include central banks and sovereigns, financial institutions, asset managers, insurance companies, corporations, local authorities and high-net-worth individuals and family offices. Through our global network of offices, we have developed a deep understanding of local requirements and cultural needs, and we pride ourselves on providing dedicated service through our multilingual sales, marketing and client service teams.
At Dec. 31, 2020, approximately 49% of our total employees (full-time and part-time employees) were based outside the U.S., with approximately 9,400 employees in EMEA, approximately 14,000 employees in APAC and approximately 700 employees in other global locations, primarily Brazil.
We are the seventh-largest global asset manager. Our international operations managed 56% of BNY Mellon’s AUM at Dec. 31, 2020 and 55% at Dec. 31, 2019.
In Europe, we maintain capabilities to service Undertakings for Collective Investment in Transferable Securities and alternative investment funds. We offer a full range of tailored solutions for investment companies, financial institutions and institutional investors across Europe.
We are a provider of non-U.S. government securities, fixed income and equities clearance, settling securities transactions directly in European markets, and using a high-quality and established network of local agents in non-European markets.
We have extensive experience providing trade and cash services to financial institutions and central banks outside of the U.S. In addition, we offer a broad range of servicing and fiduciary products to financial institutions, corporations and central banks. In emerging markets, we lead with custody, global payments and issuer services, introducing other products as the markets mature. For more established markets, our focus is on global investment services.
We are also a full-service global provider of foreign exchange services, actively trading in over 100 of the world’s currencies. We serve clients from trading desks located in Europe, Asia and North America.
Our financial results, as well as our levels of AUC/A and AUM, are impacted by translation from foreign currencies to the U.S. dollar. We are primarily impacted by activities denominated in the British pound and the euro. If the U.S. dollar depreciates against these currencies, the translation impact is a higher level of fee revenue, net interest revenue, noninterest expense and AUC/A and AUM. Conversely, if the U.S. dollar appreciates, the translated levels of fee revenue, net interest revenue, noninterest expense and AUC/A and AUM will be lower.
Foreign exchange ratesvs. U.S. dollar 2020 2019 2018
Spot rate (at Dec. 31):British pound $ 1.3663 $ 1.3199 $ 1.2801 Euro 1.2267 1.1231 1.1455
Yearly average rate:British pound $ 1.2836 $ 1.2770 $ 1.3349 Euro 1.1414 1.1195 1.1808
International clients accounted for 37% of revenues in 2020, compared with 35% in 2019. Net income from international operations was $2.0 billion in 2020, compared with $1.9 billion in 2019.
In 2020, revenues from EMEA were $4.0 billion, compared with $3.8 billion in 2019. The 3% increase primarily reflects higher revenue in both the Investment Services and Investment and Wealth Management businesses. The increase in revenue in the Investment Services business was primarily driven by higher client activity in Asset Servicing, Pershing and Clearance and Collateral Management, higher foreign exchange revenue and the favorable impact of a weaker dollar, partially offset by lower net interest revenue. The increase in revenue in the Investment and Wealth Management business primarily reflects higher market values and performance fees and the favorable impact of a weaker U.S. dollar (principally versus the British pound), partially offset by an unfavorable change in the mix of AUM. Our Investment Services and Investment and Wealth Management businesses generated 70% and 30% of EMEA revenues, respectively. Net income from EMEA was $1.2 billion in 2020, compared with $1.1 billion in 2019.
Results of Operations (continued)
22 BNY Mellon
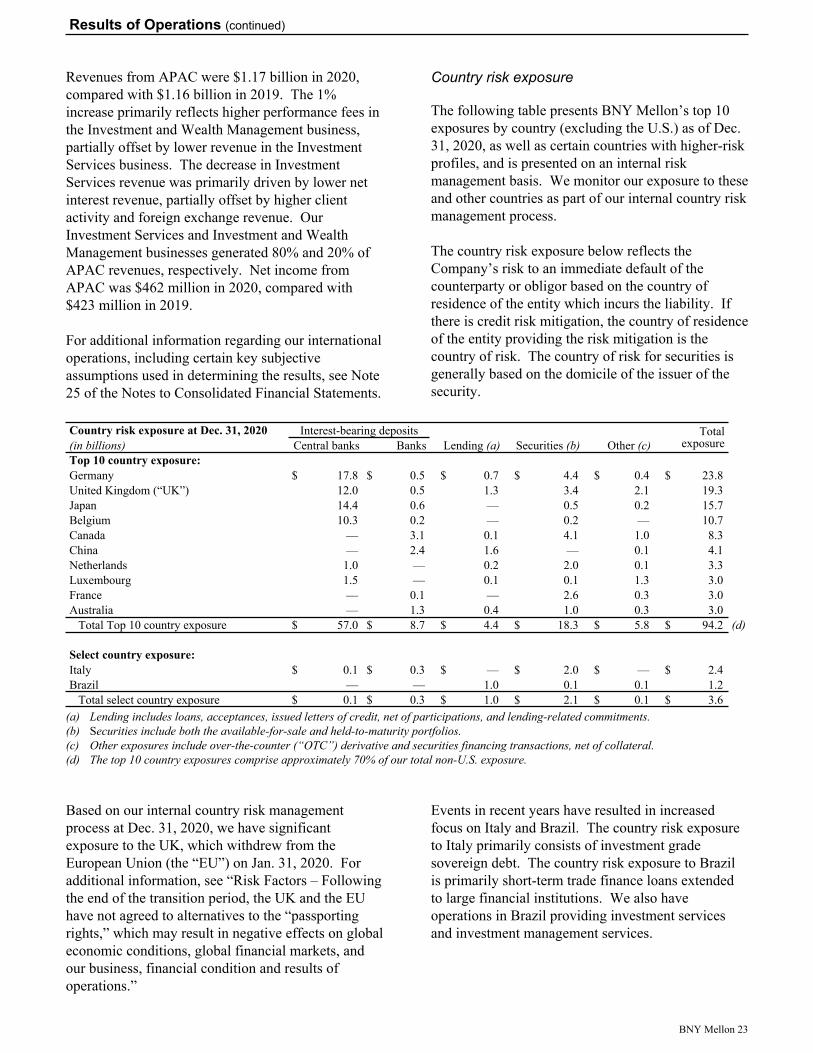
Revenues from APAC were $1.17 billion in 2020, compared with $1.16 billion in 2019. The 1% increase primarily reflects higher performance fees in the Investment and Wealth Management business, partially offset by lower revenue in the Investment Services business. The decrease in Investment Services revenue was primarily driven by lower net interest revenue, partially offset by higher client activity and foreign exchange revenue. Our Investment Services and Investment and Wealth Management businesses generated 80% and 20% of APAC revenues, respectively. Net income from APAC was $462 million in 2020, compared with $423 million in 2019.
For additional information regarding our international operations, including certain key subjective assumptions used in determining the results, see Note 25 of the Notes to Consolidated Financial Statements.
Country risk exposure
The following table presents BNY Mellon’s top 10 exposures by country (excluding the U.S.) as of Dec. 31, 2020, as well as certain countries with higher-risk profiles, and is presented on an internal risk management basis. We monitor our exposure to these and other countries as part of our internal country risk management process.
The country risk exposure below reflects the Company’s risk to an immediate default of the counterparty or obligor based on the country of residence of the entity which incurs the liability. If there is credit risk mitigation, the country of residence of the entity providing the risk mitigation is the country of risk. The country of risk for securities is generally based on the domicile of the issuer of the security.
Country risk exposure at Dec. 31, 2020 Interest-bearing deposits Total exposure(in billions) Central banks Banks Lending (a) Securities (b) Other (c)
Top 10 country exposure:Germany $ 17.8 $ 0.5 $ 0.7 $ 4.4 $ 0.4 $ 23.8 United Kingdom (“UK”) 12.0 0.5 1.3 3.4 2.1 19.3 Japan 14.4 0.6 — 0.5 0.2 15.7 Belgium 10.3 0.2 — 0.2 — 10.7 Canada — 3.1 0.1 4.1 1.0 8.3 China — 2.4 1.6 — 0.1 4.1 Netherlands 1.0 — 0.2 2.0 0.1 3.3 Luxembourg 1.5 — 0.1 0.1 1.3 3.0 France — 0.1 — 2.6 0.3 3.0 Australia — 1.3 0.4 1.0 0.3 3.0
Total Top 10 country exposure $ 57.0 $ 8.7 $ 4.4 $ 18.3 $ 5.8 $ 94.2 (d)
Select country exposure:Italy $ 0.1 $ 0.3 $ — $ 2.0 $ — $ 2.4 Brazil — — 1.0 0.1 0.1 1.2
Total select country exposure $ 0.1 $ 0.3 $ 1.0 $ 2.1 $ 0.1 $ 3.6 (a) Lending includes loans, acceptances, issued letters of credit, net of participations, and lending-related commitments. (b) Securities include both the available-for-sale and held-to-maturity portfolios.(c) Other exposures include over-the-counter (“OTC”) derivative and securities financing transactions, net of collateral.(d) The top 10 country exposures comprise approximately 70% of our total non-U.S. exposure.
Based on our internal country risk management process at Dec. 31, 2020, we have significant exposure to the UK, which withdrew from the European Union (the “EU”) on Jan. 31, 2020. For additional information, see “Risk Factors – Following the end of the transition period, the UK and the EU have not agreed to alternatives to the “passporting rights,” which may result in negative effects on global economic conditions, global financial markets, and our business, financial condition and results of operations.”
Events in recent years have resulted in increased focus on Italy and Brazil. The country risk exposure to Italy primarily consists of investment grade sovereign debt. The country risk exposure to Brazil is primarily short-term trade finance loans extended to large financial institutions. We also have operations in Brazil providing investment services and investment management services.
Results of Operations (continued)
BNY Mellon 23
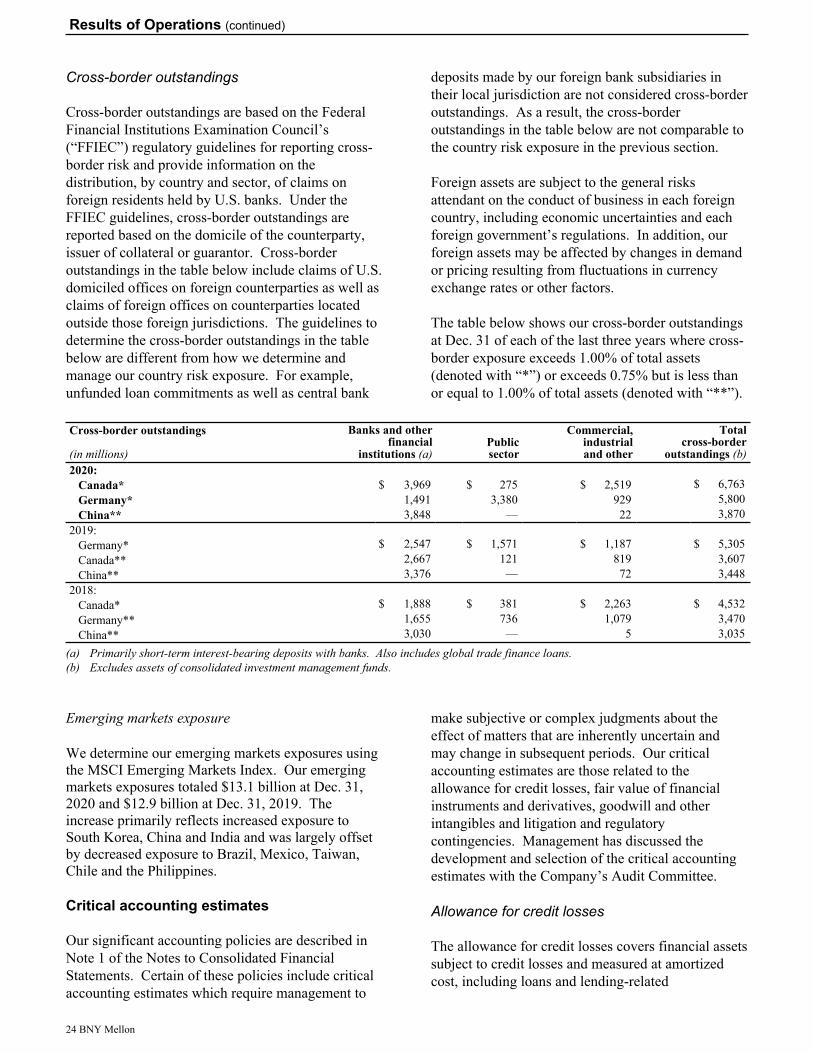
Cross-border outstandings
Cross-border outstandings are based on the Federal Financial Institutions Examination Council’s (“FFIEC”) regulatory guidelines for reporting cross-border risk and provide information on the distribution, by country and sector, of claims on foreign residents held by U.S. banks. Under the FFIEC guidelines, cross-border outstandings are reported based on the domicile of the counterparty, issuer of collateral or guarantor. Cross-border outstandings in the table below include claims of U.S. domiciled offices on foreign counterparties as well as claims of foreign offices on counterparties located outside those foreign jurisdictions. The guidelines to determine the cross-border outstandings in the table below are different from how we determine and manage our country risk exposure. For example, unfunded loan commitments as well as central bank
deposits made by our foreign bank subsidiaries in their local jurisdiction are not considered cross-border outstandings. As a result, the cross-border outstandings in the table below are not comparable to the country risk exposure in the previous section.
Foreign assets are subject to the general risks attendant on the conduct of business in each foreign country, including economic uncertainties and each foreign government’s regulations. In addition, our foreign assets may be affected by changes in demand or pricing resulting from fluctuations in currency exchange rates or other factors.
The table below shows our cross-border outstandings at Dec. 31 of each of the last three years where cross-border exposure exceeds 1.00% of total assets (denoted with “*”) or exceeds 0.75% but is less than or equal to 1.00% of total assets (denoted with “**”).
Cross-border outstandings Banks and other financial
institutions (a)Public sector
Commercial, industrial and other
Total cross-border
outstandings (b)(in millions)2020:
Canada* $ 3,969 $ 275 $ 2,519 $ 6,763 Germany* 1,491 3,380 929 5,800 China** 3,848 — 22 3,870
2019:Germany* $ 2,547 $ 1,571 $ 1,187 $ 5,305 Canada** 2,667 121 819 3,607 China** 3,376 — 72 3,448
2018:Canada* $ 1,888 $ 381 $ 2,263 $ 4,532 Germany** 1,655 736 1,079 3,470 China** 3,030 — 5 3,035
(a) Primarily short-term interest-bearing deposits with banks. Also includes global trade finance loans.(b) Excludes assets of consolidated investment management funds.
Emerging markets exposure
We determine our emerging markets exposures using the MSCI Emerging Markets Index. Our emerging markets exposures totaled $13.1 billion at Dec. 31, 2020 and $12.9 billion at Dec. 31, 2019. The increase primarily reflects increased exposure to South Korea, China and India and was largely offset by decreased exposure to Brazil, Mexico, Taiwan, Chile and the Philippines.
Critical accounting estimates
Our significant accounting policies are described in Note 1 of the Notes to Consolidated Financial Statements. Certain of these policies include critical accounting estimates which require management to
make subjective or complex judgments about the effect of matters that are inherently uncertain and may change in subsequent periods. Our critical accounting estimates are those related to the allowance for credit losses, fair value of financial instruments and derivatives, goodwill and other intangibles and litigation and regulatory contingencies. Management has discussed the development and selection of the critical accounting estimates with the Company’s Audit Committee.
Allowance for credit losses
The allowance for credit losses covers financial assets subject to credit losses and measured at amortized cost, including loans and lending-related
Results of Operations (continued)
24 BNY Mellon
commitments, held-to-maturity securities, certain securities financing transactions and deposits with banks. The allowance for credit losses is intended to adjust the carrying value of these assets by an estimated amount of credit losses that we expect to incur over the life of the asset. Similarly, the allowance for credit losses on lending-related commitments and other off-balance sheet financial instruments is meant to capture the credit losses that we expect to recognize in these portfolios as of the balance sheet date.
A quantitative methodology and qualitative framework is used to estimate the allowance for credit losses.
The quantitative component of our estimate uses models and methodologies that categorize financial assets based on product type, collateral type, and other credit trends and risk characteristics, including relevant information about past events, current conditions and reasonable and supportable forecasts of future economic conditions that affect the collectability of the recorded amounts. For the quantitative component, we segment portfolios into various major components including commercial loans and lease financing, commercial real estate, financial institutions, residential mortgages, and other. The segmentation of our debt securities portfolios is by major asset class and is influenced by whether the security is structured or non-structured (i.e., direct obligation), as well as the issuer type. The components of the credit loss calculation for each major portfolio or asset class include a probability of default, loss given default and exposure at default, as applicable, and their values depend on the forecast behavior of variables in the macroeconomic environment. We utilize a multi-scenario macroeconomic forecast which includes a weighting of three scenarios: a baseline and upside and downside scenarios and allows us to develop our estimate using a wide span of economic variables. Our baseline scenario reflects a view on likely performance of each global region and the other two scenarios are designed relative to the baseline scenario. This approach incorporates a reasonable and supportable forecast period spanning the life of the asset, and this period includes both an initial estimated economic outlook component as well as a reversion component for each economic input variable. The length of each of the two components depends on the underlying financial instrument, scenario, and underlying economic input variable. In
general, the initial economic outlook period for each economic input variable under each scenario ranges between several months and two years. The speed at which the scenario specific forecasts revert to long-term historical mean is based on observed historical patterns of mean reversion at the economic variable input level that are reflected in our model parameter estimates. Certain macroeconomic variables such as unemployment or home prices take longer to revert after a contraction, though specific recovery times are scenario-specific. Reversion will usually take longer the further away the scenario specific forecast is from the historical mean. On a quarterly basis, and within a developed governance structure, we update these scenarios for current economic conditions and may adjust the scenario weighting based on our economic outlook. The Company uses its best judgment to assess these economic conditions and loss data in estimating the allowance for credit losses and these estimates are subject to periodic refinement based on changes to underlying external or Company-specific historical data.
In the quantitative component of our estimate, we measure expected credit losses using an individual evaluation method if the risk characteristics of the asset is no longer consistent with the portfolio or class of asset. For these assets we do not employ the macroeconomic model calculation but consider factors such as payment status, collateral value, the obligor’s financial condition, guarantor support, the probability of collecting scheduled principal and interest payments when due, and recovery expectations if they can be reasonably estimated. For loans, we measure the expected credit loss as the difference between the amortized cost basis in the loan and the present value of the expected future cash flows from the borrower which is generally discounted at the loan’s effective interest rate, or the fair value of the collateral, if the loan is collateral dependent. We generally consider nonperforming loans as well as loans that have been or are anticipated to be modified under a troubled debt restructuring for individual evaluation given the risk characteristics of such loans.
Available-for-sale debt securities are recorded at fair value. When an available-for-sale debt security is in an unrealized loss position, we employ a methodology to identify and estimate the credit loss portion of the unrealized loss position. The measurement of expected credit losses is performed at the security level and is based on our best single
Results of Operations (continued)
BNY Mellon 25
estimate of cash flows, on a discounted basis; however, we do not specifically employ the macroeconomic forecasting models and scenarios summarized above.
The qualitative component of our estimate for the allowance for credit losses is intended to capture expected losses that may not have been fully captured in the quantitative component. Through an established governance structure, management determines the qualitative allowance each period based on an evaluation of various internal and environmental factors which include: scenario weighting and sensitivity risk, credit concentration risk, economic conditions and other considerations. We have made and may continue to make adjustments for idiosyncratic risks.
To the extent actual results differ from forecasts or management’s judgment, the allowance for credit losses may be greater or less than future charge-offs and recoveries.
Our allowance for credit losses is sensitive to a number of inputs, most notably the credit ratings assigned to each borrower as well as macroeconomic forecast assumptions that are incorporated in our estimate of credit losses through the expected life of the loan portfolio. Thus, as the macroeconomic environment and related forecasts change, the allowance for credit losses may change materially. The following sensitivity analyses do not represent management’s expectations of the deterioration of our portfolios or the economic environment, but are provided as hypothetical scenarios to assess the sensitivity of the allowance for credit losses to changes in key inputs. If each credit were rated one grade better, the quantitative allowance would have decreased by $137 million, and if each credit were rated one grade worse, the quantitative allowance would have increased by $184 million. Our multi-scenario based macroeconomic forecast used in determining the Dec. 31, 2020 allowance for credit losses consisted of three scenarios. The baseline scenario reflects moderate and flat GDP growth and unemployment recovery but with declining commercial real estate prices that begin to recover in early 2022. The upside scenario reflects faster GDP growth and unemployment recovery and less severe commercial real estate declines than the baseline. The downside scenario contemplates negative GDP growth and increasing unemployment throughout 2021 and steeper declines in commercial real estate
prices than the baseline. Consistent with the third quarter of 2020, we placed the most weight on our baseline scenario, with the remaining weighting resulting in slightly more weight placed on the downside scenario than the upside scenario. From a sensitivity perspective, at Dec. 31, 2020, if we had applied 100% weighting to the downside scenario, the quantitative allowance for credit losses would have been approximately $325 million higher.
Fair value of financial instruments and derivatives
The guidance included in Accounting Standards Codification (“ASC”) 820, Fair Value Measurement, defines fair value, establishes a framework for measuring fair value, and requires certain disclosures about assets and liabilities measured at fair value. The standard also established a three-level hierarchy for fair value measurements based upon the transparency of inputs to the valuation of an asset or liability as of the measurement date.
Fair value – Securities
Level 1 – Securities: Securities where valuations are based on recent quoted prices for identical securities in actively traded markets.
Level 2 – Securities: For securities where quotes from recent transactions are not available for identical securities, we determine fair value primarily based on pricing sources with reasonable levels of price transparency. The pricing sources employ financial models or obtain comparisons to similar instruments to arrive at “consensus” prices.
Specifically, the pricing sources obtain recent transactions for similar types of securities (e.g., vintage or position in the securitization structure) and ascertain variables such as discount rate and speed of prepayment for the type of transaction and apply such variables to similar types of bonds. We view these as observable transactions in the current marketplace and classify such securities as Level 2.
In addition, we have significant investments in more actively traded agency residential mortgage-backed securities (“RMBS”) and other types of securities such as sovereign debt. The pricing sources derive the prices for these securities largely from quotes they obtain from major inter-dealer brokers and electronic communication networks. The pricing sources
Results of Operations (continued)
26 BNY Mellon

receive their daily-observed trade price and other information feeds from the inter-dealer brokers.
We obtain prices for our Level 1 and Level 2 securities from multiple pricing sources. We have designed controls to develop an understanding of the pricing sources’ securities pricing methodologies and have implemented specific internal controls over the valuation of securities.
As appropriate, we review the quality control procedures and pricing methodologies used by the pricing sources, including the process for obtaining prices provided by the pricing sources, their valuation methodology and controls for each class of security.
Prices received from pricing sources are subject to validation checks that help determine the completeness and accuracy of the prices. These validation checks are reviewed by management and, based on the results, may be subject to additional review and investigation. We also review securities with no price changes (stale prices) and securities with zero values.
We have a surveillance process in place to monitor the reasonableness of prices provided by the pricing sources. We utilize a hierarchy that compares security prices obtained from multiple pricing sources against established thresholds. Discrepancies that fall outside of these thresholds are challenged with the pricing services and adjusted if necessary.
If further research is required, we review and validate these prices with the pricing sources. We also validate prices from pricing sources by comparing prices received to actual observed prices from actions such as purchases and sales, when possible.
At Dec. 31, 2020, approximately 99% of our securities were valued by pricing sources with reasonable levels of price transparency. The remaining securities were generally valued using observable inputs.
Level 3 – Securities: Where we use our own cash flow models, which includes a significant input into the model that is deemed unobservable, to estimate the value of securities, we classify them as Level 3. At both Dec. 31, 2020 and Dec. 31, 2019, we have no securities included in Level 3 of the fair value hierarchy.
For details of our securities by level of the valuation hierarchy, see Note 20 of the Notes to Consolidated Financial Statements.
Fair value – Derivative financial instruments
Level 1 – Derivative financial instruments: Includes derivative financial instruments that are actively traded on exchanges, principally listed equity options.
Level 2 – Derivative financial instruments: Includes OTC derivative financial instruments. Derivatives classified as Level 2 are valued utilizing discounted cash flow analysis and financial models for which the valuation inputs are observable or can be corroborated, directly or indirectly, for substantially the full term of the instrument. Valuation inputs include interest rate yield curves, foreign exchange rates, equity prices, credit curves, option volatilities and other factors.
Where appropriate, valuation adjustments are made to account for various factors such as creditworthiness of the counterparty, creditworthiness of the Company and model and liquidity risks.
Level 3 – Derivative financial instruments: Level 3 derivatives include derivatives for which valuations are based on inputs that are unobservable and significant to the overall fair value measurement, and may include certain long-dated or highly structured contracts. At both Dec. 31, 2020 and Dec. 31, 2019, we have no derivatives included in Level 3 of the fair value hierarchy.
For details of our derivative financial instruments by level of the valuation hierarchy, see Note 20 of the Notes to Consolidated Financial Statements.
Fair value option
ASC 825, Financial Instruments, provides the option to elect fair value as an alternative measurement basis for selected financial assets and financial liabilities which are not subject to fair value under other accounting standards. The changes in fair value are recognized in income. See Note 21 of the Notes to Consolidated Financial Statements for additional disclosure regarding the fair value option.
Results of Operations (continued)
BNY Mellon 27
Fair value – Judgments
In times of illiquid markets and financial stress, actual prices and valuations may significantly diverge from results predicted by models. In addition, other factors can affect our estimate of fair value, including market dislocations and unexpected correlations. The use of different methodologies or different assumptions to value certain financial instruments could result in a different estimate of fair value. See Note 1 of the Notes to Consolidated Financial Statements.
Goodwill and other intangibles
We initially record all assets and liabilities acquired in purchase acquisitions, including goodwill, indefinite-lived intangibles and other intangibles, in accordance with ASC 805, Business Combinations. Goodwill, indefinite-lived intangibles and other intangibles are subsequently accounted for in accordance with ASC 350, Intangibles – Goodwill and Other. The initial measurement of goodwill and intangibles requires judgment concerning estimates of the fair value of the acquired assets and liabilities. Goodwill ($17.5 billion at Dec. 31, 2020) and indefinite-lived intangible assets ($2.6 billion at Dec. 31, 2020) are not amortized but are subject to tests for impairment annually or more often if events or circumstances indicate it is more likely than not they may be impaired. Other intangible assets are amortized over their estimated useful lives and are subject to impairment if events or circumstances indicate a possible inability to realize the carrying value.
BNY Mellon’s three business segments include six reporting units for which annual goodwill impairment testing is performed in accordance with ASC 350, Intangibles – Goodwill and Other. The Investment Services segment is comprised of four reporting units and the Investment and Wealth Management segment is comprised of two reporting units.
The goodwill impairment test compares the estimated fair value of the reporting unit with its carrying amount, including goodwill. If the estimated fair value of the reporting unit exceeds its carrying amount, goodwill of the reporting unit is considered not impaired. However, if the carrying amount of the reporting unit were to exceed its estimated fair value, an impairment loss would be recorded. A substantial goodwill impairment charge would not have a significant impact on our financial condition or our
regulatory capital ratios, but could have an adverse impact on our results of operations. In addition, due to regulatory restrictions, the Company’s subsidiary banks could be restricted from distributing available cash to the Parent, resulting in the Parent needing to issue additional long-term debt. Capital distributions could also be impacted if current limitations, which are based on the average quarterly net income over the prior four quarters, continue, or if similar limitations apply in the future.
In the second quarter of 2020, we performed our annual goodwill impairment test on all six reporting units using an income approach to estimate the fair values of each reporting unit. Estimated cash flows used in the income approach were based on management’s projections as of March 31, 2020. The discount rate applied to these cash flows was 10% and incorporated a 7% market equity risk premium. Estimated cash flows extend far into the future, and, by their nature, are difficult to estimate over such an extended time frame.
As a result of the annual goodwill impairment test of the six reporting units, no goodwill impairment was recognized. The fair values of five of the Company’s reporting units were substantially in excess of the respective reporting units’ carrying value. The Investment Management reporting unit, with $7.2 billion of allocated goodwill, which is one of the two reporting units in the Investment and Wealth Management segment, exceeded its carrying value by approximately 5%. Since the annual impairment test, we estimate that the Investment Management reporting unit’s fair value in excess of its carrying value has increased. For the Investment Management reporting unit, in the future, small changes in the assumptions, such as the discount rate, changes in the level or mix of AUM and operating margin, could produce a non-cash goodwill impairment. We also evaluate the aggregate fair values of our reporting units in comparison to our market capitalization. In this analysis, we factor in an estimated control premium that is adjusted for certain estimated risks and other factors.
Key judgments in accounting for intangibles include useful life and classification between goodwill and indefinite-lived intangibles or other intangibles requiring amortization.
Indefinite-lived intangible assets are evaluated for impairment at least annually by comparing their fair
Results of Operations (continued)
28 BNY Mellon
values, estimated using discounted cash flow analyses, to their carrying values. Other amortizing intangible assets ($421 million at Dec. 31, 2020) are evaluated for impairment if events and circumstances indicate a possible impairment. Such evaluation of other intangible assets would be initially based on undiscounted cash flow projections.
See Notes 1 and 7 of the Notes to Consolidated Financial Statements for additional information regarding goodwill, intangible assets and the annual and interim impairment testing.
Litigation and regulatory contingencies
Significant estimates and judgments are required in establishing an accrued liability for litigation and regulatory contingencies. For additional information on our policy, see “Legal proceedings” in Note 22 of the Notes to Consolidated Financial Statements.
Consolidated balance sheet review
One of our key risk management objectives is to maintain a balance sheet that remains strong throughout market cycles to meet the expectations of our major stakeholders, including our shareholders, clients, creditors and regulators.
We also seek to undertake overall liquidity risk, including intraday liquidity risk, that stays within our risk appetite. The objective of our balance sheet management strategy is to maintain a balance sheet that is characterized by strong liquidity and asset quality, ready access to external funding sources at competitive rates and a strong capital structure that supports our risk-taking activities and is adequate to absorb potential losses. In managing the balance sheet, appropriate consideration is given to balancing the competing needs of maintaining sufficient levels of liquidity and complying with applicable regulations and supervisory expectations while optimizing profitability.
At Dec. 31, 2020, total assets were $470 billion, compared with $382 billion at Dec. 31, 2019. The increase in total assets was primarily driven by higher interest-bearing deposits with the Federal Reserve and other central banks and securities, resulting from significant deposit inflows. Deposits totaled $342 billion at Dec. 31, 2020, compared with $259 billion at Dec. 31, 2019. The increase reflects the current macroeconomic environment. Total interest-bearing
deposits as a percentage of total interest-earning assets were 63% at Dec. 31, 2020 and 62% at Dec. 31, 2019.
At Dec. 31, 2020, available funds totaled $196 billion which include cash and due from banks, interest-bearing deposits with the Federal Reserve and other central banks, interest-bearing deposits with banks and federal funds sold and securities purchased under resale agreements. This compares with available funds of $145 billion at Dec. 31, 2019. Total available funds as a percentage of total assets were 42% at Dec. 31, 2020 and 38% at Dec. 31, 2019. For additional information on our available funds, see “Liquidity and dividends.”
Securities were $156 billion, or 33% of total assets, at Dec. 31, 2020, compared with $123 billion, or 32% of total assets, at Dec. 31, 2019. The increase primarily reflects investments in U.S. Treasury, agency RMBS, U.S.government agency and supranational securities, as well as nearly all other security types and an increase in unrealized pre-tax gain. For additional information on our securities portfolio, see “Securities” and Note 4 of the Notes to Consolidated Financial Statements.
Loans were $56.5 billion, or 12% of total assets, at Dec. 31, 2020, compared with $55.0 billion, or 14% of total assets, at Dec. 31, 2019. The increase was primarily driven by higher margin and other loans, partially offset by lower loans to financial institutions. For additional information on our loan portfolio, see “Loans” and Note 5 of the Notes to Consolidated Financial Statements.
Long-term debt totaled $26.0 billion at Dec. 31, 2020 and $27.5 billion at Dec. 31, 2019. Redemptions and maturities were partially offset by issuances and an increase in the fair value of hedged long-term debt. For additional information on long-term debt, see “Liquidity and dividends” and Note 13 of the Notes to Consolidated Financial Statements.
The Bank of New York Mellon Corporation total shareholders’ equity increased to $45.8 billion at Dec. 31, 2020 from $41.5 billion at Dec. 31, 2019. For additional information, see “Capital” and Note 15 of the Notes to Consolidated Financial Statements.
Results of Operations (continued)
BNY Mellon 29
Securities
In the discussion of our securities portfolio, we have included certain credit ratings information because the information can indicate the degree of credit risk to which we are exposed. Significant changes in
ratings classifications for our securities portfolio could indicate increased credit risk for us and could be accompanied by an increase in the allowance for credit losses and/or a reduction in the fair value of our securities portfolio.
The following table shows the distribution of our total securities portfolio.
Securities portfolio Dec. 31, 2019 2020
change inunrealizedgain (loss)
Dec. 31, 2020 Fair value as a % of
amortizedcost (a)
Unrealizedgain (loss)
% Floatingrate (b)
Ratings (c)
BBB+/BBB-
BB+and
lower
A1+/A2 & SP-1(dollars in millions)
Fairvalue
Amortizedcost (a)
Fairvalue
AAA/AA-
A+/A-
Notrated
Agency RMBS $ 54,646 $ 1,199 $ 60,274 $ 61,740 102% $ 1,466 15% 100% —% —% —% —% —% U.S. Treasury 18,865 395 26,495 26,958 102 463 52 100 — — — — — Sovereign debt/sovereign
guaranteed (d) 13,404 100 13,252 13,452 102 200 11 65 6 28 1 — — Agency commercial
mortgage-backed securities (“MBS”) 10,613 365 11,264 11,685 104 421 31 100 — — — — —
Supranational 3,734 57 7,141 7,208 101 67 51 100 — — — — — Foreign covered bonds (e) 4,276 59 6,658 6,725 101 67 32 100 — — — — — U.S. government agencies 2,933 61 6,496 6,577 101 81 26 100 — — — — — Collateralized loan
obligations (“CLOs”) 4,063 12 4,706 4,703 100 (3) 100 99 — — — — 1 Foreign government
agencies (f) 2,641 43 4,086 4,132 101 46 23 95 5 — — — — Other asset-backed
securities (“ABS”) 2,143 27 3,135 3,164 101 29 21 100 — — — — — Non-agency commercial
MBS 2,165 97 2,864 2,992 104 128 22 99 1 — — — — Non-agency RMBS (g) 1,316 (47) 2,236 2,387 107 151 54 68 4 1 16 — 11 State and political
subdivisions 1,061 12 2,285 2,324 102 39 1 69 9 — — 21 1 Corporate bonds 853 28 1,945 1,994 102 49 — 17 68 15 — — — Commercial paper/CDs — — 249 249 100 — 100 21 — — — 79 — Other 1 — 1 1 100 — — — — — — — 100
Total securities $ 122,714 (h) $ 2,408 $ 153,087 $ 156,291 (h) 102% $ 3,204 (h)(i) 28% 95% 2% 3% —% —% —% (a) Amortized cost reflects historical impairments, and is net of the allowance for credit losses.(b) Includes the impact of hedges.(c) Represents ratings by Standard & Poor’s (“S&P”) or the equivalent.(d) Primarily consists of exposure to Germany, France, Italy, Spain, UK and Singapore.(e) Primarily consists of exposure to Canada, UK, Australia and Norway.(f) Primarily consists of exposure to Germany, the Netherlands and Canada.(g) Includes RMBS that were included in the former Grantor Trust of $640 million at Dec. 31, 2019 and $487 million at Dec. 31, 2020. (h) Includes net unrealized losses on derivatives hedging securities available-for-sale (including terminated hedges) of $641 million at Dec. 31, 2019 and $1,428
million at Dec. 31, 2020.(i) Includes unrealized gains of $1,926 million at Dec. 31, 2020 related to available-for-sale securities, net of hedges, and $1,278 related to held-to-maturity securities.
The fair value of our securities portfolio, including related hedges, was $156.3 billion at Dec. 31, 2020, compared with $122.7 billion at Dec. 31, 2019. The increase primarily reflects investments in U.S. Treasury, agency RMBS, U.S.government agency and supranational securities, as well as nearly all other security types and an increase in unrealized pre-tax gain.
Included in the securities portfolio at Dec. 31, 2020 were $52 million of commercial paper and $197 million of CDs purchased from affiliated money market mutual funds in order to provide liquidity support to the funds.
At Dec. 31, 2020, the securities portfolio had a net unrealized gain, including the impact of related hedges, of $3.2 billion, compared with $796 million at Dec. 31, 2019. The increase in the net unrealized gain was primarily driven by lower market interest rates.
The fair value of the available-for-sale securities totaled $107.1 billion at Dec. 31, 2020, net of hedges, or 69% of the securities portfolio, net of hedges. The fair value of the held-to-maturity securities totaled $49.2 billion at Dec. 31, 2020, or 31% of the securities portfolio, net of hedges.
Results of Operations (continued)
30 BNY Mellon

The unrealized gain (after-tax) on our available-for-sale securities portfolio, net of hedges, included in accumulated other comprehensive income was $1.5 billion at Dec. 31, 2020, compared with $361 million at Dec. 31, 2019. The increase in the unrealized gain, net of tax, was primarily driven by lower market interest rates.
At Dec. 31, 2020, 95% of the securities in our portfolio were rated AAA/AA-, unchanged compared with Dec. 31, 2019.
See Note 4 of the Notes to Consolidated Financial Statements for the pre-tax net securities gains (losses) by security type. See Note 20 of the Notes to Consolidated Financial Statements for securities by level in the fair value hierarchy.
The following table presents the amortizable purchase premium (net of discount) related to the securities portfolio and accretable discount related to the 2009 restructuring of the securities portfolio.
Net premium amortization and discount accretion of securities (a)(dollars in millions) 2020 2019 2018Amortizable purchase premium (net of discount) relating to securities:
Balance at year-end $ 2,283 $ 1,319 $ 1,429 Estimated average life remaining at year-end (in years) 3.9 4.3 5.0 Amortization $ 568 $ 364 $ 437
Accretable discount related to the prior restructuring of the securities portfolio:Balance at year-end $ 130 $ 163 $ 207 Estimated average life remaining at year-end (in years) 5.6 6.3 6.3 Accretion $ 38 $ 54 $ 86
(a) Amortization of purchase premium decreases net interest revenue while accretion of discount increases net interest revenue. Both were recorded on a level yield basis.
The following table presents the total securities portfolio at fair value. The fair values do not include the impact of related hedges.
Securities at fair value Dec. 31,(in millions) 2020 2019 2018Agency RMBS $ 61,743 $ 54,646 $ 50,215 U.S. Treasury 27,922 19,274 24,729 Sovereign debt/sovereign
guaranteed 13,483 13,433 11,609 Agency commercial MBS 11,990 10,761 10,860 Supranational 7,215 3,736 3,011 Foreign covered bonds 6,725 4,276 2,959 U.S. government agencies 6,667 2,971 3,144 CLOs 4,703 4,063 3,364 Foreign government agencies 4,135 2,643 1,161 Other ABS 3,164 2,143 1,773 Non-agency commercial MBS 3,017 2,178 1,464 Non-agency RMBS 2,387 1,316 1,427 State and political
subdivisions 2,324 1,061 2,264 Corporate bonds 1,994 853 1,054 Commercial paper/CDs 249 — — Other 1 1 77
Total securities $ 157,719 $ 123,355 $ 119,111
Equity investments
We have several equity investments recorded in other assets. These include equity method investments, including renewable energy, and investments in qualified affordable housing projects, Federal Reserve Bank stock, seed capital, private equity and other investments. The following table presents the carrying values at Dec. 31, 2020 and Dec. 31, 2019.
Equity investments Dec. 31,(in millions) 2020 2019Renewable energy investments $ 1,206 $ 1,144 Equity in a joint venture and other investments:CIBC Mellon 698 626 Siguler Guff 223 233 Other equity investments 338 243 Total equity in a joint venture and other investments $ 1,259 $ 1,102
Qualified affordable housing project investments 1,145 1,024
Federal Reserve Bank stock 479 466 Seed capital 215 184 Federal Home Loan Bank stock 7 22 Private equity investments (a) 102 89
Total equity investments $ 4,413 $ 4,031 (a) Represents investments in small business investment
companies (“SBICs”), which are compliant with the Volcker Rule.
Results of Operations (continued)
BNY Mellon 31
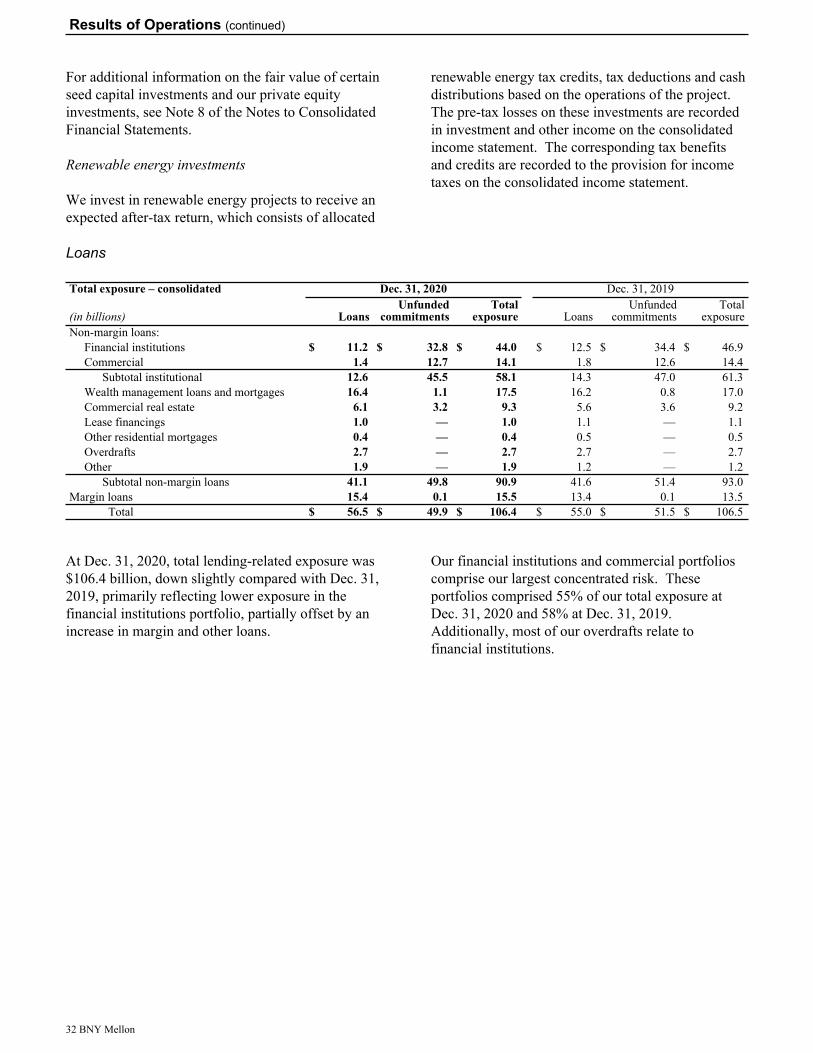
For additional information on the fair value of certain seed capital investments and our private equity investments, see Note 8 of the Notes to Consolidated Financial Statements.
Renewable energy investments
We invest in renewable energy projects to receive an expected after-tax return, which consists of allocated
renewable energy tax credits, tax deductions and cash distributions based on the operations of the project. The pre-tax losses on these investments are recorded in investment and other income on the consolidated income statement. The corresponding tax benefits and credits are recorded to the provision for income taxes on the consolidated income statement.
Loans
Total exposure – consolidated Dec. 31, 2020 Dec. 31, 2019
(in billions) LoansUnfunded
commitmentsTotal
exposure LoansUnfunded
commitmentsTotal
exposureNon-margin loans:
Financial institutions $ 11.2 $ 32.8 $ 44.0 $ 12.5 $ 34.4 $ 46.9 Commercial 1.4 12.7 14.1 1.8 12.6 14.4
Subtotal institutional 12.6 45.5 58.1 14.3 47.0 61.3 Wealth management loans and mortgages 16.4 1.1 17.5 16.2 0.8 17.0 Commercial real estate 6.1 3.2 9.3 5.6 3.6 9.2 Lease financings 1.0 — 1.0 1.1 — 1.1 Other residential mortgages 0.4 — 0.4 0.5 — 0.5 Overdrafts 2.7 — 2.7 2.7 — 2.7 Other 1.9 — 1.9 1.2 — 1.2
Subtotal non-margin loans 41.1 49.8 90.9 41.6 51.4 93.0 Margin loans 15.4 0.1 15.5 13.4 0.1 13.5
Total $ 56.5 $ 49.9 $ 106.4 $ 55.0 $ 51.5 $ 106.5
At Dec. 31, 2020, total lending-related exposure was $106.4 billion, down slightly compared with Dec. 31, 2019, primarily reflecting lower exposure in the financial institutions portfolio, partially offset by an increase in margin and other loans.
Our financial institutions and commercial portfolios comprise our largest concentrated risk. These portfolios comprised 55% of our total exposure at Dec. 31, 2020 and 58% at Dec. 31, 2019. Additionally, most of our overdrafts relate to financial institutions.
Results of Operations (continued)
32 BNY Mellon
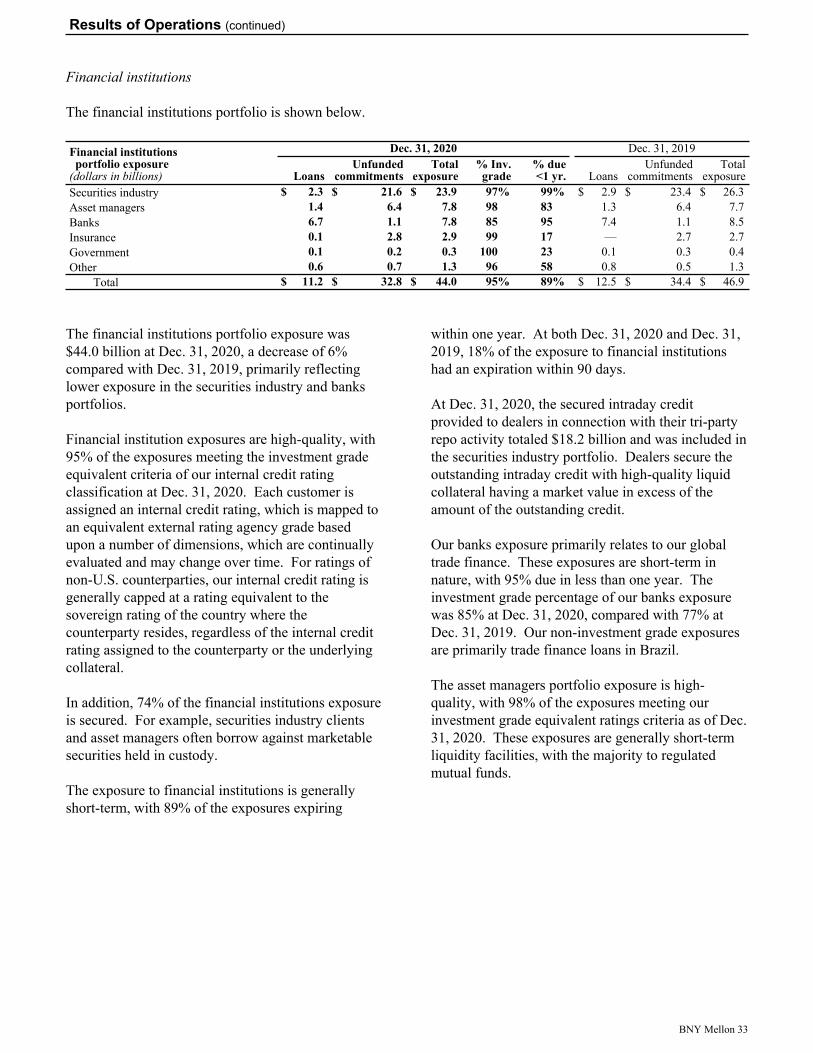
Financial institutions
The financial institutions portfolio is shown below.
Financial institutionsportfolio exposure
(dollars in billions)
Dec. 31, 2020 Dec. 31, 2019
LoansUnfunded
commitmentsTotal
exposure% Inv.
grade% due<1 yr. Loans
Unfundedcommitments
Totalexposure
Securities industry $ 2.3 $ 21.6 $ 23.9 97% 99% $ 2.9 $ 23.4 $ 26.3 Asset managers 1.4 6.4 7.8 98 83 1.3 6.4 7.7 Banks 6.7 1.1 7.8 85 95 7.4 1.1 8.5 Insurance 0.1 2.8 2.9 99 17 — 2.7 2.7 Government 0.1 0.2 0.3 100 23 0.1 0.3 0.4 Other 0.6 0.7 1.3 96 58 0.8 0.5 1.3
Total $ 11.2 $ 32.8 $ 44.0 95% 89% $ 12.5 $ 34.4 $ 46.9
The financial institutions portfolio exposure was $44.0 billion at Dec. 31, 2020, a decrease of 6% compared with Dec. 31, 2019, primarily reflecting lower exposure in the securities industry and banks portfolios.
Financial institution exposures are high-quality, with 95% of the exposures meeting the investment grade equivalent criteria of our internal credit rating classification at Dec. 31, 2020. Each customer is assigned an internal credit rating, which is mapped to an equivalent external rating agency grade based upon a number of dimensions, which are continually evaluated and may change over time. For ratings of non-U.S. counterparties, our internal credit rating is generally capped at a rating equivalent to the sovereign rating of the country where the counterparty resides, regardless of the internal credit rating assigned to the counterparty or the underlying collateral.
In addition, 74% of the financial institutions exposure is secured. For example, securities industry clients and asset managers often borrow against marketable securities held in custody.
The exposure to financial institutions is generally short-term, with 89% of the exposures expiring
within one year. At both Dec. 31, 2020 and Dec. 31, 2019, 18% of the exposure to financial institutions had an expiration within 90 days.
At Dec. 31, 2020, the secured intraday credit provided to dealers in connection with their tri-party repo activity totaled $18.2 billion and was included in the securities industry portfolio. Dealers secure the outstanding intraday credit with high-quality liquid collateral having a market value in excess of the amount of the outstanding credit.
Our banks exposure primarily relates to our global trade finance. These exposures are short-term in nature, with 95% due in less than one year. The investment grade percentage of our banks exposure was 85% at Dec. 31, 2020, compared with 77% at Dec. 31, 2019. Our non-investment grade exposures are primarily trade finance loans in Brazil.
The asset managers portfolio exposure is high-quality, with 98% of the exposures meeting our investment grade equivalent ratings criteria as of Dec. 31, 2020. These exposures are generally short-term liquidity facilities, with the majority to regulated mutual funds.
Results of Operations (continued)
BNY Mellon 33
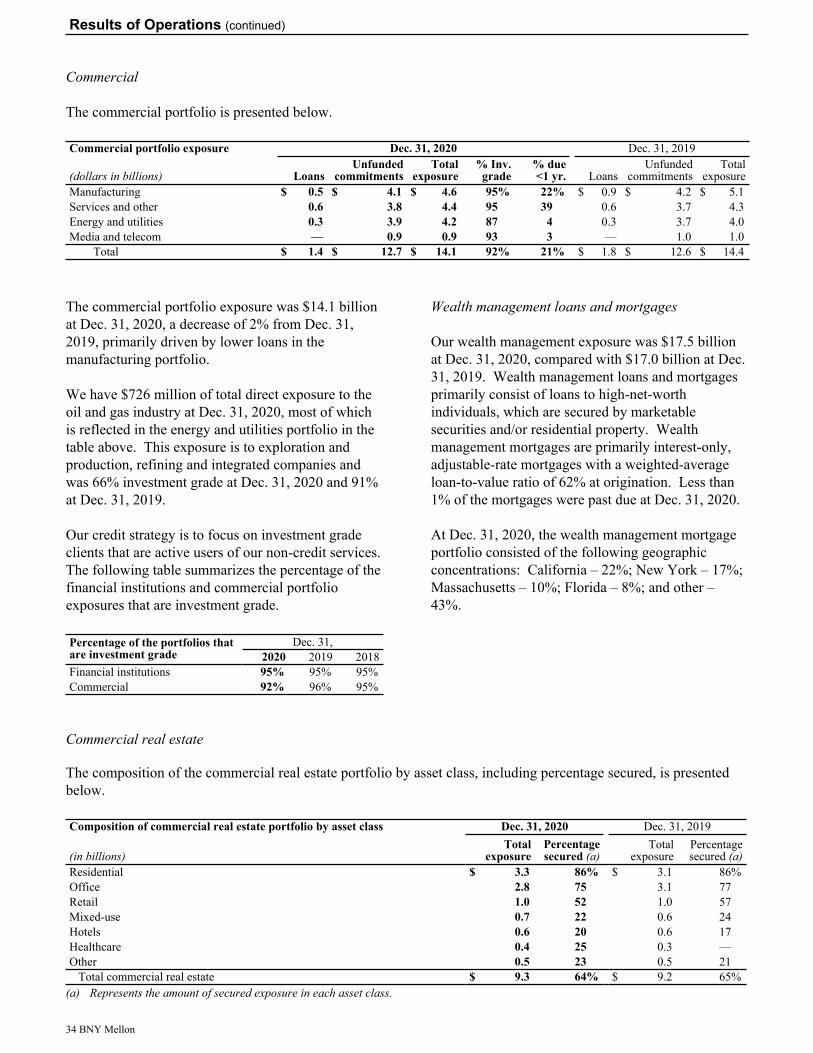
Commercial
The commercial portfolio is presented below.
Commercial portfolio exposure Dec. 31, 2020 Dec. 31, 2019
(dollars in billions) LoansUnfunded
commitmentsTotal
exposure% Inv.
grade% due<1 yr. Loans
Unfundedcommitments
Totalexposure
Manufacturing $ 0.5 $ 4.1 $ 4.6 95% 22% $ 0.9 $ 4.2 $ 5.1 Services and other 0.6 3.8 4.4 95 39 0.6 3.7 4.3 Energy and utilities 0.3 3.9 4.2 87 4 0.3 3.7 4.0 Media and telecom — 0.9 0.9 93 3 — 1.0 1.0
Total $ 1.4 $ 12.7 $ 14.1 92% 21% $ 1.8 $ 12.6 $ 14.4
The commercial portfolio exposure was $14.1 billion at Dec. 31, 2020, a decrease of 2% from Dec. 31, 2019, primarily driven by lower loans in the manufacturing portfolio.
We have $726 million of total direct exposure to the oil and gas industry at Dec. 31, 2020, most of which is reflected in the energy and utilities portfolio in the table above. This exposure is to exploration and production, refining and integrated companies and was 66% investment grade at Dec. 31, 2020 and 91% at Dec. 31, 2019.
Our credit strategy is to focus on investment grade clients that are active users of our non-credit services. The following table summarizes the percentage of the financial institutions and commercial portfolio exposures that are investment grade.
Percentage of the portfolios that are investment grade
Dec. 31,2020 2019 2018
Financial institutions 95% 95% 95% Commercial 92% 96% 95%
Wealth management loans and mortgages
Our wealth management exposure was $17.5 billion at Dec. 31, 2020, compared with $17.0 billion at Dec. 31, 2019. Wealth management loans and mortgages primarily consist of loans to high-net-worth individuals, which are secured by marketable securities and/or residential property. Wealth management mortgages are primarily interest-only, adjustable-rate mortgages with a weighted-average loan-to-value ratio of 62% at origination. Less than 1% of the mortgages were past due at Dec. 31, 2020.
At Dec. 31, 2020, the wealth management mortgage portfolio consisted of the following geographic concentrations: California – 22%; New York – 17%; Massachusetts – 10%; Florida – 8%; and other – 43%.
Commercial real estate
The composition of the commercial real estate portfolio by asset class, including percentage secured, is presented below.
Composition of commercial real estate portfolio by asset class Dec. 31, 2020 Dec. 31, 2019Total
exposurePercentagesecured (a)
Totalexposure
Percentagesecured (a)(in billions)
Residential $ 3.3 86% $ 3.1 86% Office 2.8 75 3.1 77 Retail 1.0 52 1.0 57 Mixed-use 0.7 22 0.6 24 Hotels 0.6 20 0.6 17 Healthcare 0.4 25 0.3 — Other 0.5 23 0.5 21
Total commercial real estate $ 9.3 64% $ 9.2 65% (a) Represents the amount of secured exposure in each asset class.
Results of Operations (continued)
34 BNY Mellon

Our commercial real estate exposure totaled $9.3 billion at Dec. 31, 2020 and $9.2 billion at Dec. 31, 2019. Our income-producing commercial real estate facilities are focused on experienced owners and are structured with moderate leverage based on existing cash flows. Our commercial real estate lending activities also include construction and renovation facilities. Our client base consists of experienced developers and long-term holders of real estate assets. Loans are approved on the basis of existing or projected cash flows and supported by appraisals and knowledge of local market conditions. Development loans are structured with moderate leverage, and in many instances, involve some level of recourse to the developer.
At Dec. 31, 2020, the unsecured portfolio consisted of real estate investment trusts (“REITs”) and real estate operating companies, which are both primarily investment grade.
At Dec. 31, 2020, our commercial real estate portfolio consisted of the following concentrations: New York metro – 39%; REITs and real estate operating companies – 36%; and other – 25%.
Lease financings
The lease financings portfolio exposure totaled $1.0 billion at Dec. 31, 2020 and $1.1 billion at Dec. 31, 2019. At Dec. 31, 2020, approximately 98% of leasing exposure was investment grade, or investment grade equivalent and consisted of exposures backed by well-diversified assets, primarily large-ticket transportation equipment and real estate. The largest component of our lease residual value exposure is freight-related rail cars. Assets are both domestic and foreign-based, with primary concentrations in the U.S. and Germany.
Approximately 62% of the portfolio is additionally secured by highly rated securities and/or secured by
letters of credit from investment grade issuers. Counterparty rating equivalents at Dec. 31, 2020, were as follows:
• 52 % were A or better, or equivalent;• 46 % were BBB; and • 2 % were non-investment grade.
Other residential mortgages
The other residential mortgages portfolio primarily consists of 1-4 family residential mortgage loans and totaled $389 million at Dec. 31, 2020 and $494 million at Dec. 31, 2019. Included in this portfolio at Dec. 31, 2020 were $68 million of mortgage loans purchased in 2005, 2006 and the first quarter of 2007, of which 19% of the serviced loan balance was at least 60 days delinquent.
Overdrafts
Overdrafts primarily relate to custody and securities clearance clients and are generally repaid within two business days.
Other loans
Other loans primarily include loans to consumers that are fully collateralized with equities, mutual funds and fixed-income securities.
Margin loans
Margin loan exposure of $15.5 billion at Dec. 31, 2020 and $13.5 billion at Dec. 31, 2019 was collateralized with marketable securities. Borrowers are required to maintain a daily collateral margin in excess of 100% of the value of the loan. Margin loans included $4.6 billion at Dec. 31, 2020 and $3.6 billion at Dec. 31, 2019 related to a term loan program that offers fully collateralized loans to broker-dealers.
Results of Operations (continued)
BNY Mellon 35
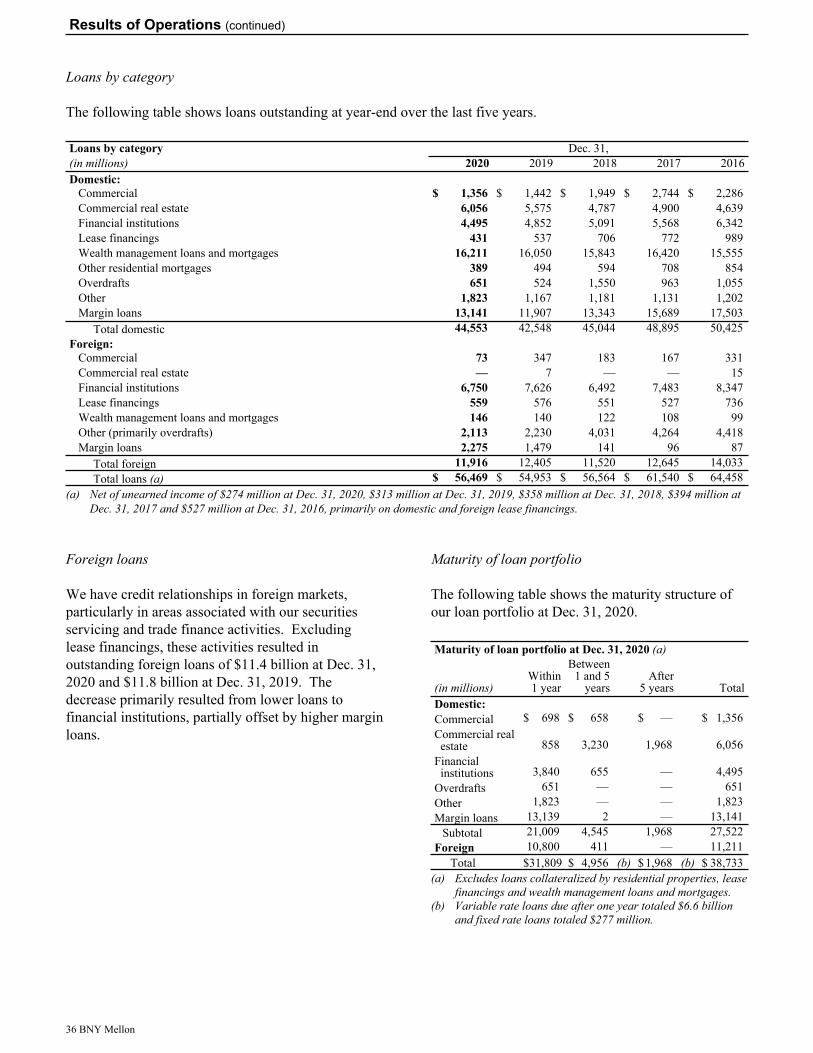
Loans by category
The following table shows loans outstanding at year-end over the last five years.
Loans by category Dec. 31,(in millions) 2020 2019 2018 2017 2016Domestic:
Commercial $ 1,356 $ 1,442 $ 1,949 $ 2,744 $ 2,286 Commercial real estate 6,056 5,575 4,787 4,900 4,639 Financial institutions 4,495 4,852 5,091 5,568 6,342 Lease financings 431 537 706 772 989 Wealth management loans and mortgages 16,211 16,050 15,843 16,420 15,555 Other residential mortgages 389 494 594 708 854 Overdrafts 651 524 1,550 963 1,055 Other 1,823 1,167 1,181 1,131 1,202 Margin loans 13,141 11,907 13,343 15,689 17,503
Total domestic 44,553 42,548 45,044 48,895 50,425 Foreign:
Commercial 73 347 183 167 331 Commercial real estate — 7 — — 15 Financial institutions 6,750 7,626 6,492 7,483 8,347 Lease financings 559 576 551 527 736 Wealth management loans and mortgages 146 140 122 108 99 Other (primarily overdrafts) 2,113 2,230 4,031 4,264 4,418 Margin loans 2,275 1,479 141 96 87
Total foreign 11,916 12,405 11,520 12,645 14,033 Total loans (a) $ 56,469 $ 54,953 $ 56,564 $ 61,540 $ 64,458
(a) Net of unearned income of $274 million at Dec. 31, 2020, $313 million at Dec. 31, 2019, $358 million at Dec. 31, 2018, $394 million at Dec. 31, 2017 and $527 million at Dec. 31, 2016, primarily on domestic and foreign lease financings.
Foreign loans
We have credit relationships in foreign markets, particularly in areas associated with our securities servicing and trade finance activities. Excluding lease financings, these activities resulted in outstanding foreign loans of $11.4 billion at Dec. 31, 2020 and $11.8 billion at Dec. 31, 2019. The decrease primarily resulted from lower loans to financial institutions, partially offset by higher margin loans.
Maturity of loan portfolio
The following table shows the maturity structure of our loan portfolio at Dec. 31, 2020.
Maturity of loan portfolio at Dec. 31, 2020 (a)
(in millions)Within1 year
Between1 and 5
years After
5 years TotalDomestic:Commercial $ 698 $ 658 $ — $ 1,356 Commercial real estate 858 3,230 1,968 6,056
Financial institutions 3,840 655 — 4,495
Overdrafts 651 — — 651 Other 1,823 — — 1,823 Margin loans 13,139 2 — 13,141
Subtotal 21,009 4,545 1,968 27,522 Foreign 10,800 411 — 11,211
Total $ 31,809 $ 4,956 (b) $ 1,968 (b) $ 38,733 (a) Excludes loans collateralized by residential properties, lease
financings and wealth management loans and mortgages.(b) Variable rate loans due after one year totaled $6.6 billion
and fixed rate loans totaled $277 million.
Results of Operations (continued)
36 BNY Mellon
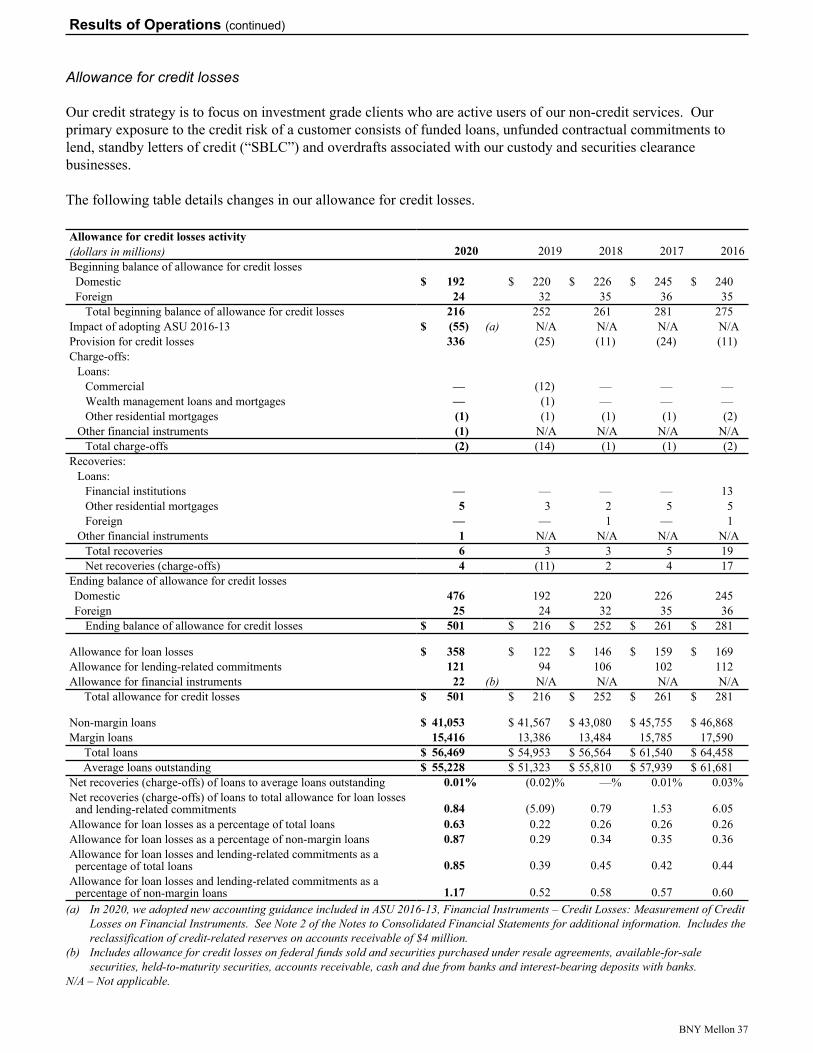
Allowance for credit losses
Our credit strategy is to focus on investment grade clients who are active users of our non-credit services. Our primary exposure to the credit risk of a customer consists of funded loans, unfunded contractual commitments to lend, standby letters of credit (“SBLC”) and overdrafts associated with our custody and securities clearance businesses.
The following table details changes in our allowance for credit losses.
Allowance for credit losses activity2020 2019 2018 2017 2016(dollars in millions)
Beginning balance of allowance for credit lossesDomestic $ 192 $ 220 $ 226 $ 245 $ 240 Foreign 24 32 35 36 35
Total beginning balance of allowance for credit losses 216 252 261 281 275 Impact of adopting ASU 2016-13 $ (55) (a) N/A N/A N/A N/AProvision for credit losses 336 (25) (11) (24) (11) Charge-offs:
Loans:Commercial — (12) — — — Wealth management loans and mortgages — (1) — — — Other residential mortgages (1) (1) (1) (1) (2)
Other financial instruments (1) N/A N/A N/A N/ATotal charge-offs (2) (14) (1) (1) (2)
Recoveries:Loans:
Financial institutions — — — — 13 Other residential mortgages 5 3 2 5 5 Foreign — — 1 — 1
Other financial instruments 1 N/A N/A N/A N/ATotal recoveries 6 3 3 5 19 Net recoveries (charge-offs) 4 (11) 2 4 17
Ending balance of allowance for credit lossesDomestic 476 192 220 226 245 Foreign 25 24 32 35 36
Ending balance of allowance for credit losses $ 501 $ 216 $ 252 $ 261 $ 281
Allowance for loan losses $ 358 $ 122 $ 146 $ 159 $ 169 Allowance for lending-related commitments 121 94 106 102 112 Allowance for financial instruments 22 (b) N/A N/A N/A N/A
Total allowance for credit losses $ 501 $ 216 $ 252 $ 261 $ 281
Non-margin loans $ 41,053 $ 41,567 $ 43,080 $ 45,755 $ 46,868 Margin loans 15,416 13,386 13,484 15,785 17,590
Total loans $ 56,469 $ 54,953 $ 56,564 $ 61,540 $ 64,458 Average loans outstanding $ 55,228 $ 51,323 $ 55,810 $ 57,939 $ 61,681
Net recoveries (charge-offs) of loans to average loans outstanding 0.01% (0.02) % —% 0.01% 0.03% Net recoveries (charge-offs) of loans to total allowance for loan losses and lending-related commitments 0.84 (5.09) 0.79 1.53 6.05
Allowance for loan losses as a percentage of total loans 0.63 0.22 0.26 0.26 0.26 Allowance for loan losses as a percentage of non-margin loans 0.87 0.29 0.34 0.35 0.36 Allowance for loan losses and lending-related commitments as a percentage of total loans 0.85 0.39 0.45 0.42 0.44
Allowance for loan losses and lending-related commitments as a percentage of non-margin loans 1.17 0.52 0.58 0.57 0.60
(a) In 2020, we adopted new accounting guidance included in ASU 2016-13, Financial Instruments – Credit Losses: Measurement of Credit Losses on Financial Instruments. See Note 2 of the Notes to Consolidated Financial Statements for additional information. Includes the reclassification of credit-related reserves on accounts receivable of $4 million.
(b) Includes allowance for credit losses on federal funds sold and securities purchased under resale agreements, available-for-sale securities, held-to-maturity securities, accounts receivable, cash and due from banks and interest-bearing deposits with banks.
N/A – Not applicable.
Results of Operations (continued)
BNY Mellon 37
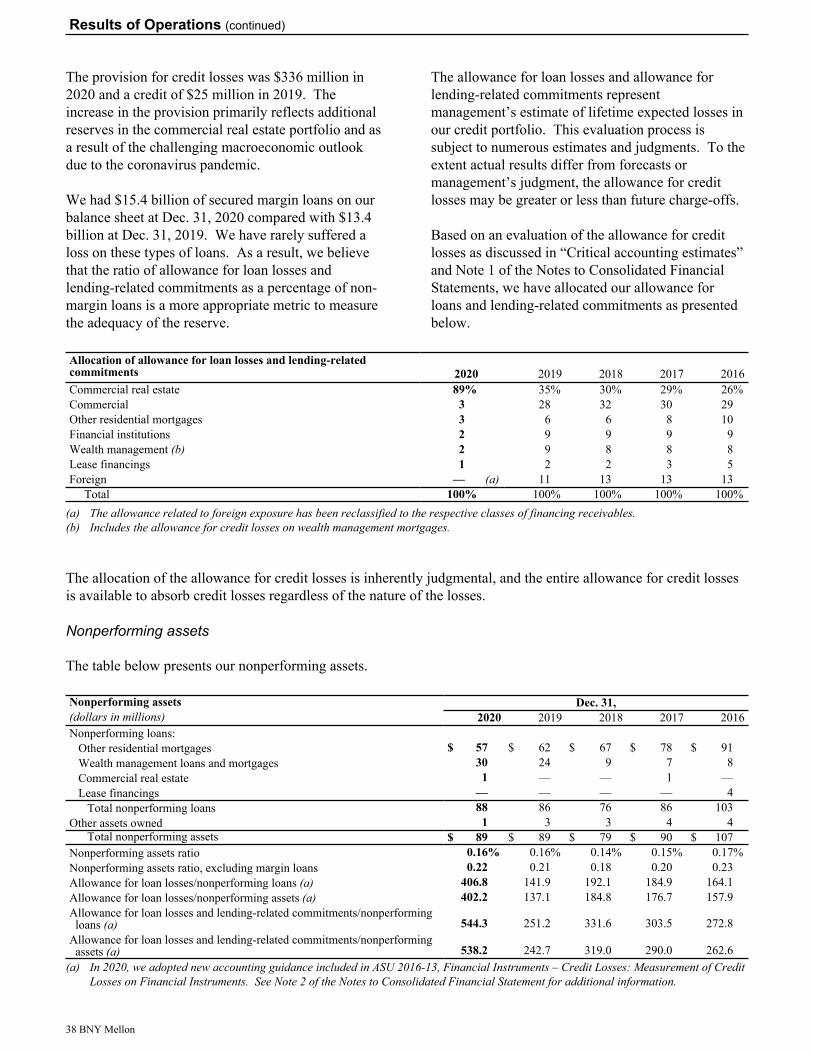
The provision for credit losses was $336 million in 2020 and a credit of $25 million in 2019. The increase in the provision primarily reflects additional reserves in the commercial real estate portfolio and as a result of the challenging macroeconomic outlook due to the coronavirus pandemic.
We had $15.4 billion of secured margin loans on our balance sheet at Dec. 31, 2020 compared with $13.4 billion at Dec. 31, 2019. We have rarely suffered a loss on these types of loans. As a result, we believe that the ratio of allowance for loan losses and lending-related commitments as a percentage of non-margin loans is a more appropriate metric to measure the adequacy of the reserve.
The allowance for loan losses and allowance for lending-related commitments represent management’s estimate of lifetime expected losses in our credit portfolio. This evaluation process is subject to numerous estimates and judgments. To the extent actual results differ from forecasts or management’s judgment, the allowance for credit losses may be greater or less than future charge-offs.
Based on an evaluation of the allowance for credit losses as discussed in “Critical accounting estimates” and Note 1 of the Notes to Consolidated Financial Statements, we have allocated our allowance for loans and lending-related commitments as presented below.
Allocation of allowance for loan losses and lending-related commitments 2020 2019 2018 2017 2016Commercial real estate 89% 35% 30% 29% 26% Commercial 3 28 32 30 29 Other residential mortgages 3 6 6 8 10 Financial institutions 2 9 9 9 9 Wealth management (b) 2 9 8 8 8 Lease financings 1 2 2 3 5 Foreign — (a) 11 13 13 13
Total 100% 100% 100% 100% 100% (a) The allowance related to foreign exposure has been reclassified to the respective classes of financing receivables.(b) Includes the allowance for credit losses on wealth management mortgages.
The allocation of the allowance for credit losses is inherently judgmental, and the entire allowance for credit losses is available to absorb credit losses regardless of the nature of the losses.
Nonperforming assets
The table below presents our nonperforming assets.
Nonperforming assets Dec. 31,(dollars in millions) 2020 2019 2018 2017 2016Nonperforming loans:
Other residential mortgages $ 57 $ 62 $ 67 $ 78 $ 91 Wealth management loans and mortgages 30 24 9 7 8 Commercial real estate 1 — — 1 — Lease financings — — — — 4
Total nonperforming loans 88 86 76 86 103 Other assets owned 1 3 3 4 4
Total nonperforming assets $ 89 $ 89 $ 79 $ 90 $ 107 Nonperforming assets ratio 0.16% 0.16% 0.14% 0.15% 0.17% Nonperforming assets ratio, excluding margin loans 0.22 0.21 0.18 0.20 0.23 Allowance for loan losses/nonperforming loans (a) 406.8 141.9 192.1 184.9 164.1 Allowance for loan losses/nonperforming assets (a) 402.2 137.1 184.8 176.7 157.9 Allowance for loan losses and lending-related commitments/nonperforming loans (a) 544.3 251.2 331.6 303.5 272.8
Allowance for loan losses and lending-related commitments/nonperforming assets (a) 538.2 242.7 319.0 290.0 262.6
(a) In 2020, we adopted new accounting guidance included in ASU 2016-13, Financial Instruments – Credit Losses: Measurement of Credit Losses on Financial Instruments. See Note 2 of the Notes to Consolidated Financial Statement for additional information.
Results of Operations (continued)
38 BNY Mellon
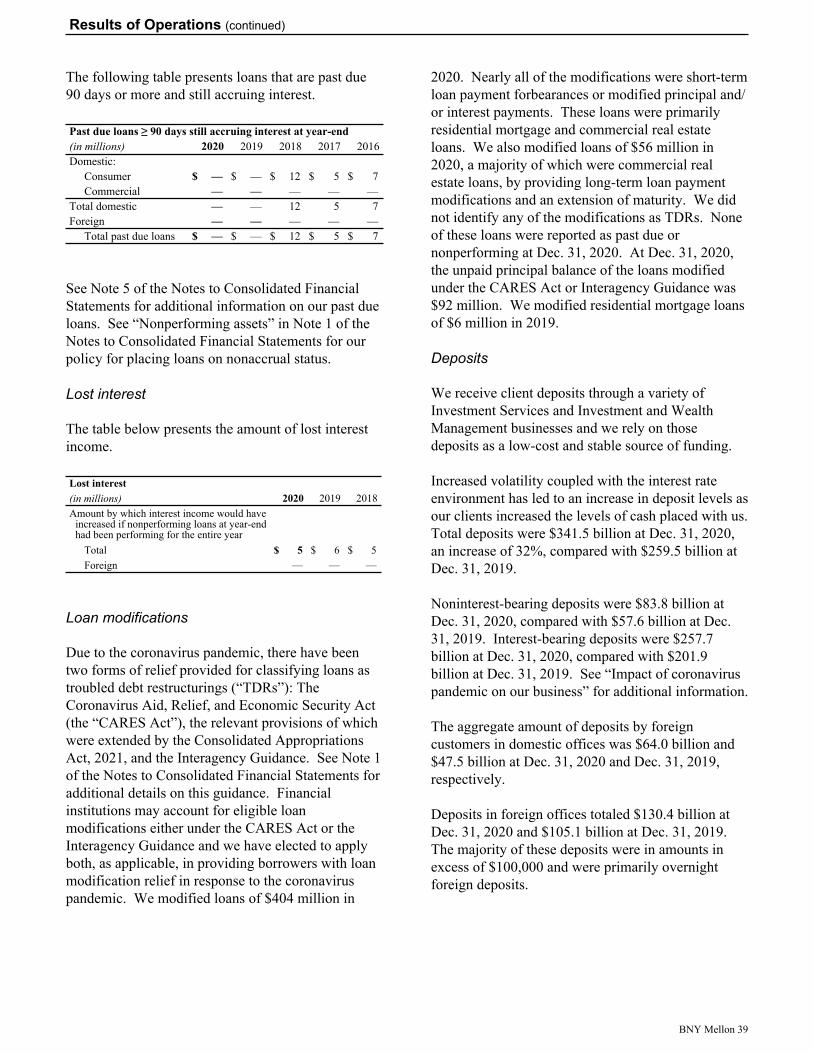
The following table presents loans that are past due 90 days or more and still accruing interest.
Past due loans ≥ 90 days still accruing interest at year-end(in millions) 2020 2019 2018 2017 2016Domestic:
Consumer $ — $ — $ 12 $ 5 $ 7 Commercial — — — — —
Total domestic — — 12 5 7 Foreign — — — — —
Total past due loans $ — $ — $ 12 $ 5 $ 7
See Note 5 of the Notes to Consolidated Financial Statements for additional information on our past due loans. See “Nonperforming assets” in Note 1 of the Notes to Consolidated Financial Statements for our policy for placing loans on nonaccrual status.
Lost interest
The table below presents the amount of lost interest income.
Lost interest(in millions) 2020 2019 2018Amount by which interest income would have
increased if nonperforming loans at year-end had been performing for the entire year
Total $ 5 $ 6 $ 5 Foreign — — —
Loan modifications
Due to the coronavirus pandemic, there have been two forms of relief provided for classifying loans as troubled debt restructurings (“TDRs”): The Coronavirus Aid, Relief, and Economic Security Act (the “CARES Act”), the relevant provisions of which were extended by the Consolidated Appropriations Act, 2021, and the Interagency Guidance. See Note 1 of the Notes to Consolidated Financial Statements for additional details on this guidance. Financial institutions may account for eligible loan modifications either under the CARES Act or the Interagency Guidance and we have elected to apply both, as applicable, in providing borrowers with loan modification relief in response to the coronavirus pandemic. We modified loans of $404 million in
2020. Nearly all of the modifications were short-term loan payment forbearances or modified principal and/or interest payments. These loans were primarily residential mortgage and commercial real estate loans. We also modified loans of $56 million in 2020, a majority of which were commercial real estate loans, by providing long-term loan payment modifications and an extension of maturity. We did not identify any of the modifications as TDRs. None of these loans were reported as past due or nonperforming at Dec. 31, 2020. At Dec. 31, 2020, the unpaid principal balance of the loans modified under the CARES Act or Interagency Guidance was $92 million. We modified residential mortgage loans of $6 million in 2019.
Deposits
We receive client deposits through a variety of Investment Services and Investment and Wealth Management businesses and we rely on those deposits as a low-cost and stable source of funding.
Increased volatility coupled with the interest rate environment has led to an increase in deposit levels as our clients increased the levels of cash placed with us. Total deposits were $341.5 billion at Dec. 31, 2020, an increase of 32%, compared with $259.5 billion at Dec. 31, 2019.
Noninterest-bearing deposits were $83.8 billion at Dec. 31, 2020, compared with $57.6 billion at Dec. 31, 2019. Interest-bearing deposits were $257.7 billion at Dec. 31, 2020, compared with $201.9 billion at Dec. 31, 2019. See “Impact of coronavirus pandemic on our business” for additional information.
The aggregate amount of deposits by foreign customers in domestic offices was $64.0 billion and $47.5 billion at Dec. 31, 2020 and Dec. 31, 2019, respectively.
Deposits in foreign offices totaled $130.4 billion at Dec. 31, 2020 and $105.1 billion at Dec. 31, 2019. The majority of these deposits were in amounts in excess of $100,000 and were primarily overnight foreign deposits.
Results of Operations (continued)
BNY Mellon 39
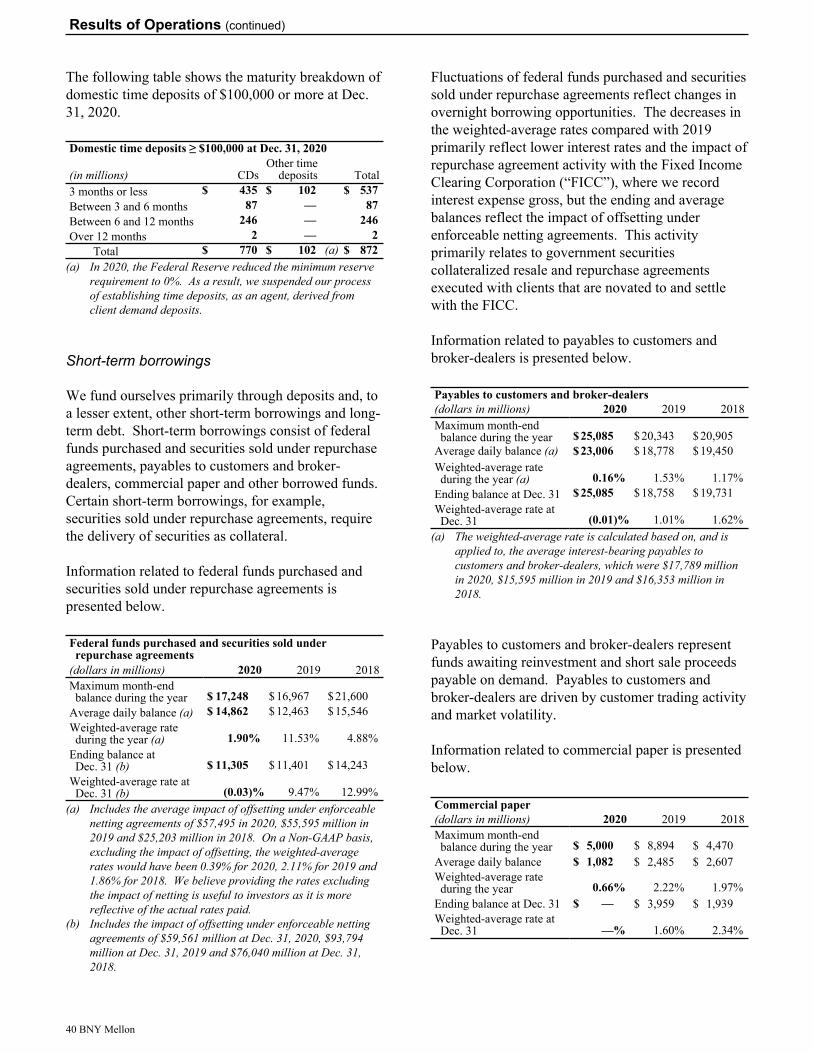
The following table shows the maturity breakdown of domestic time deposits of $100,000 or more at Dec. 31, 2020.
Domestic time deposits ≥ $100,000 at Dec. 31, 2020
(in millions) CDsOther time
deposits Total3 months or less $ 435 $ 102 $ 537 Between 3 and 6 months 87 — 87 Between 6 and 12 months 246 — 246 Over 12 months 2 — 2
Total $ 770 $ 102 (a) $ 872 (a) In 2020, the Federal Reserve reduced the minimum reserve
requirement to 0%. As a result, we suspended our process of establishing time deposits, as an agent, derived from client demand deposits.
Short-term borrowings
We fund ourselves primarily through deposits and, to a lesser extent, other short-term borrowings and long-term debt. Short-term borrowings consist of federal funds purchased and securities sold under repurchase agreements, payables to customers and broker-dealers, commercial paper and other borrowed funds. Certain short-term borrowings, for example, securities sold under repurchase agreements, require the delivery of securities as collateral.
Information related to federal funds purchased and securities sold under repurchase agreements is presented below.
Federal funds purchased and securities sold underrepurchase agreements
(dollars in millions) 2020 2019 2018Maximum month-end balance during the year $ 17,248 $ 16,967 $ 21,600
Average daily balance (a) $ 14,862 $ 12,463 $ 15,546 Weighted-average rate during the year (a) 1.90% 11.53% 4.88%
Ending balance at Dec. 31 (b) $ 11,305 $ 11,401 $ 14,243
Weighted-average rate at Dec. 31 (b) (0.03) % 9.47% 12.99%
(a) Includes the average impact of offsetting under enforceable netting agreements of $57,495 in 2020, $55,595 million in 2019 and $25,203 million in 2018. On a Non-GAAP basis, excluding the impact of offsetting, the weighted-average rates would have been 0.39% for 2020, 2.11% for 2019 and 1.86% for 2018. We believe providing the rates excluding the impact of netting is useful to investors as it is more reflective of the actual rates paid.
(b) Includes the impact of offsetting under enforceable netting agreements of $59,561 million at Dec. 31, 2020, $93,794 million at Dec. 31, 2019 and $76,040 million at Dec. 31, 2018.
Fluctuations of federal funds purchased and securities sold under repurchase agreements reflect changes in overnight borrowing opportunities. The decreases in the weighted-average rates compared with 2019 primarily reflect lower interest rates and the impact of repurchase agreement activity with the Fixed Income Clearing Corporation (“FICC”), where we record interest expense gross, but the ending and average balances reflect the impact of offsetting under enforceable netting agreements. This activity primarily relates to government securities collateralized resale and repurchase agreements executed with clients that are novated to and settle with the FICC.
Information related to payables to customers and broker-dealers is presented below.
Payables to customers and broker-dealers (dollars in millions) 2020 2019 2018Maximum month-end balance during the year $ 25,085 $ 20,343 $ 20,905
Average daily balance (a) $ 23,006 $ 18,778 $ 19,450 Weighted-average rate during the year (a) 0.16% 1.53% 1.17%
Ending balance at Dec. 31 $ 25,085 $ 18,758 $ 19,731 Weighted-average rate at Dec. 31 (0.01) % 1.01% 1.62%
(a) The weighted-average rate is calculated based on, and is applied to, the average interest-bearing payables to customers and broker-dealers, which were $17,789 million in 2020, $15,595 million in 2019 and $16,353 million in 2018.
Payables to customers and broker-dealers represent funds awaiting reinvestment and short sale proceeds payable on demand. Payables to customers and broker-dealers are driven by customer trading activity and market volatility.
Information related to commercial paper is presented below.
Commercial paper(dollars in millions) 2020 2019 2018Maximum month-end balance during the year $ 5,000 $ 8,894 $ 4,470
Average daily balance $ 1,082 $ 2,485 $ 2,607 Weighted-average rate during the year 0.66% 2.22% 1.97%
Ending balance at Dec. 31 $ — $ 3,959 $ 1,939 Weighted-average rate at Dec. 31 —% 1.60% 2.34%
Results of Operations (continued)
40 BNY Mellon
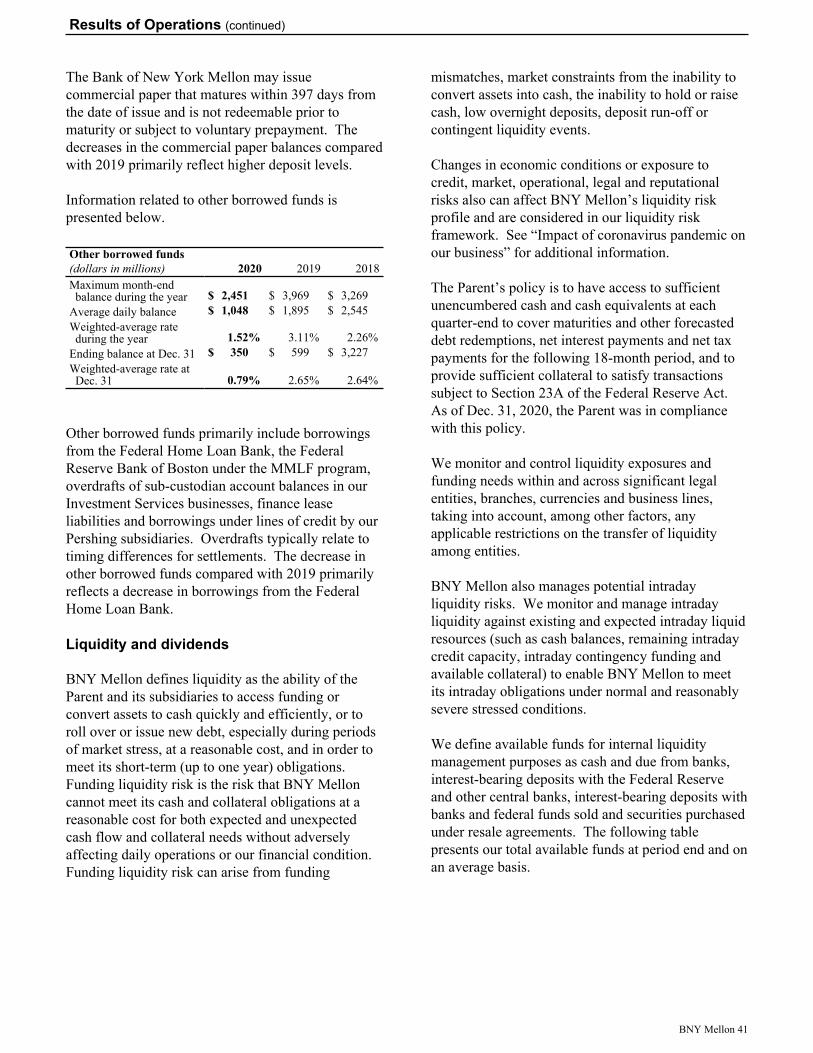
The Bank of New York Mellon may issue commercial paper that matures within 397 days from the date of issue and is not redeemable prior to maturity or subject to voluntary prepayment. The decreases in the commercial paper balances compared with 2019 primarily reflect higher deposit levels.
Information related to other borrowed funds is presented below.
Other borrowed funds(dollars in millions) 2020 2019 2018Maximum month-end balance during the year $ 2,451 $ 3,969 $ 3,269
Average daily balance $ 1,048 $ 1,895 $ 2,545 Weighted-average rate during the year 1.52% 3.11% 2.26%
Ending balance at Dec. 31 $ 350 $ 599 $ 3,227 Weighted-average rate at Dec. 31 0.79% 2.65% 2.64%
Other borrowed funds primarily include borrowings from the Federal Home Loan Bank, the Federal Reserve Bank of Boston under the MMLF program, overdrafts of sub-custodian account balances in our Investment Services businesses, finance lease liabilities and borrowings under lines of credit by our Pershing subsidiaries. Overdrafts typically relate to timing differences for settlements. The decrease in other borrowed funds compared with 2019 primarily reflects a decrease in borrowings from the Federal Home Loan Bank.
Liquidity and dividends
BNY Mellon defines liquidity as the ability of the Parent and its subsidiaries to access funding or convert assets to cash quickly and efficiently, or to roll over or issue new debt, especially during periods of market stress, at a reasonable cost, and in order to meet its short-term (up to one year) obligations. Funding liquidity risk is the risk that BNY Mellon cannot meet its cash and collateral obligations at a reasonable cost for both expected and unexpected cash flow and collateral needs without adversely affecting daily operations or our financial condition. Funding liquidity risk can arise from funding
mismatches, market constraints from the inability to convert assets into cash, the inability to hold or raise cash, low overnight deposits, deposit run-off or contingent liquidity events.
Changes in economic conditions or exposure to credit, market, operational, legal and reputational risks also can affect BNY Mellon’s liquidity risk profile and are considered in our liquidity risk framework. See “Impact of coronavirus pandemic on our business” for additional information.
The Parent’s policy is to have access to sufficient unencumbered cash and cash equivalents at each quarter-end to cover maturities and other forecasted debt redemptions, net interest payments and net tax payments for the following 18-month period, and to provide sufficient collateral to satisfy transactions subject to Section 23A of the Federal Reserve Act. As of Dec. 31, 2020, the Parent was in compliance with this policy.
We monitor and control liquidity exposures and funding needs within and across significant legal entities, branches, currencies and business lines, taking into account, among other factors, any applicable restrictions on the transfer of liquidity among entities.
BNY Mellon also manages potential intraday liquidity risks. We monitor and manage intraday liquidity against existing and expected intraday liquid resources (such as cash balances, remaining intraday credit capacity, intraday contingency funding and available collateral) to enable BNY Mellon to meet its intraday obligations under normal and reasonably severe stressed conditions.
We define available funds for internal liquidity management purposes as cash and due from banks, interest-bearing deposits with the Federal Reserve and other central banks, interest-bearing deposits with banks and federal funds sold and securities purchased under resale agreements. The following table presents our total available funds at period end and on an average basis.
Results of Operations (continued)
BNY Mellon 41
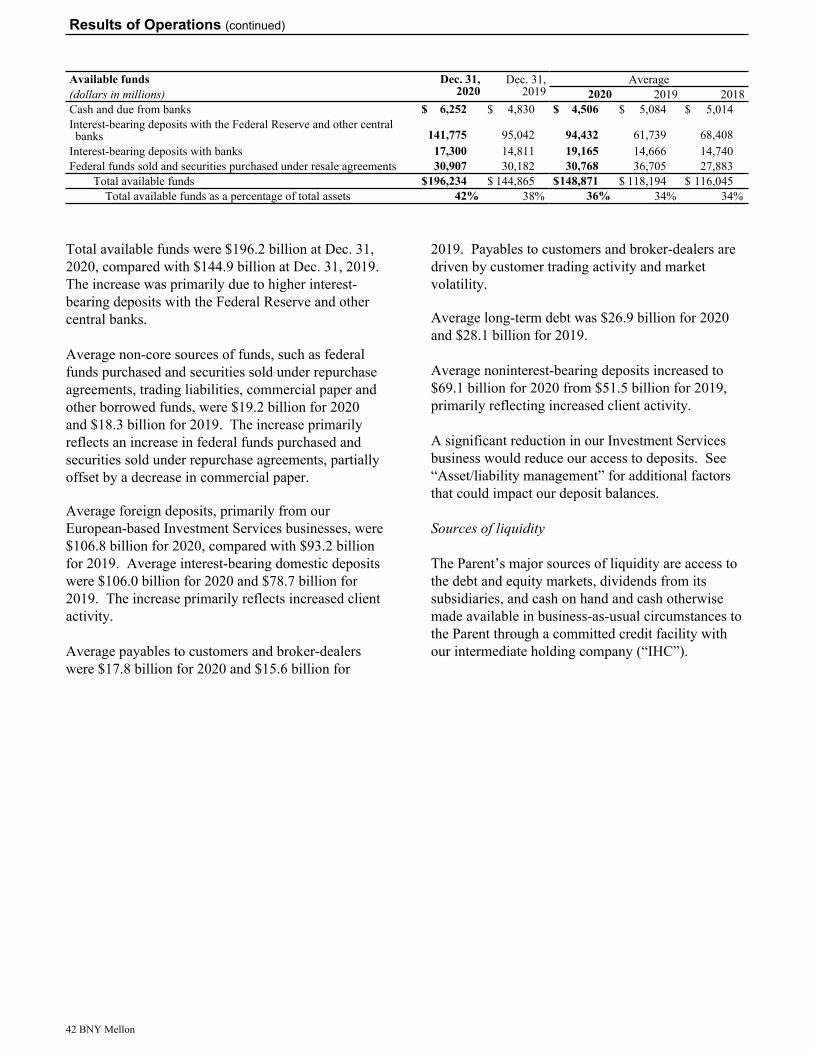
Available funds Dec. 31, 2020
Dec. 31, 2019
Average(dollars in millions) 2020 2019 2018Cash and due from banks $ 6,252 $ 4,830 $ 4,506 $ 5,084 $ 5,014 Interest-bearing deposits with the Federal Reserve and other central banks 141,775 95,042 94,432 61,739 68,408
Interest-bearing deposits with banks 17,300 14,811 19,165 14,666 14,740 Federal funds sold and securities purchased under resale agreements 30,907 30,182 30,768 36,705 27,883
Total available funds $ 196,234 $ 144,865 $ 148,871 $ 118,194 $ 116,045 Total available funds as a percentage of total assets 42% 38% 36% 34% 34%
Total available funds were $196.2 billion at Dec. 31, 2020, compared with $144.9 billion at Dec. 31, 2019. The increase was primarily due to higher interest-bearing deposits with the Federal Reserve and other central banks.
Average non-core sources of funds, such as federal funds purchased and securities sold under repurchase agreements, trading liabilities, commercial paper and other borrowed funds, were $19.2 billion for 2020 and $18.3 billion for 2019. The increase primarily reflects an increase in federal funds purchased and securities sold under repurchase agreements, partially offset by a decrease in commercial paper.
Average foreign deposits, primarily from our European-based Investment Services businesses, were $106.8 billion for 2020, compared with $93.2 billion for 2019. Average interest-bearing domestic deposits were $106.0 billion for 2020 and $78.7 billion for 2019. The increase primarily reflects increased client activity.
Average payables to customers and broker-dealers were $17.8 billion for 2020 and $15.6 billion for
2019. Payables to customers and broker-dealers are driven by customer trading activity and market volatility.
Average long-term debt was $26.9 billion for 2020 and $28.1 billion for 2019.
Average noninterest-bearing deposits increased to $69.1 billion for 2020 from $51.5 billion for 2019, primarily reflecting increased client activity.
A significant reduction in our Investment Services business would reduce our access to deposits. See “Asset/liability management” for additional factors that could impact our deposit balances.
Sources of liquidity
The Parent’s major sources of liquidity are access to the debt and equity markets, dividends from its subsidiaries, and cash on hand and cash otherwise made available in business-as-usual circumstances to the Parent through a committed credit facility with our intermediate holding company (“IHC”).
Results of Operations (continued)
42 BNY Mellon
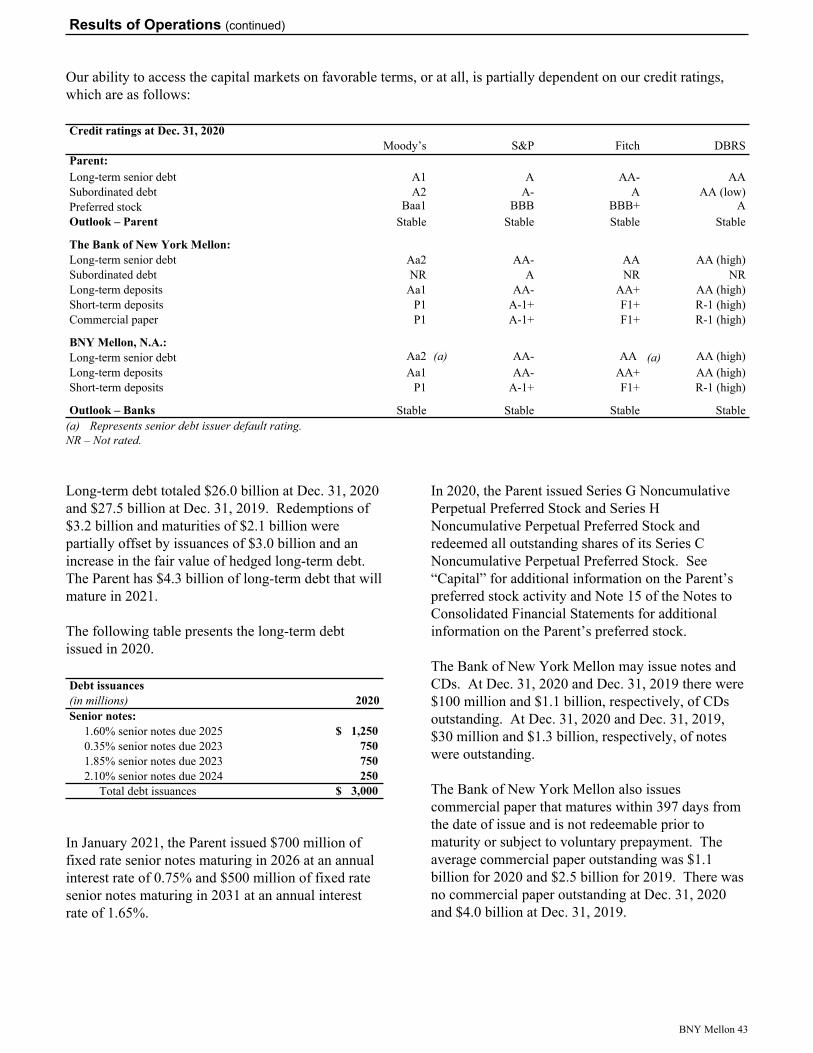
Our ability to access the capital markets on favorable terms, or at all, is partially dependent on our credit ratings, which are as follows:
Credit ratings at Dec. 31, 2020 Moody’s S&P Fitch DBRSParent: Long-term senior debt A1 A AA- AASubordinated debt A2 A- A AA (low)Preferred stock Baa1 BBB BBB+ A Outlook – Parent Stable Stable Stable Stable
The Bank of New York Mellon:Long-term senior debt Aa2 AA- AA AA (high)Subordinated debt NR A NR NRLong-term deposits Aa1 AA- AA+ AA (high)Short-term deposits P1 A-1+ F1+ R-1 (high)Commercial paper P1 A-1+ F1+ R-1 (high)
BNY Mellon, N.A.:Long-term senior debt Aa2 (a) AA- AA (a) AA (high)Long-term deposits Aa1 AA- AA+ AA (high)Short-term deposits P1 A-1+ F1+ R-1 (high)
Outlook – Banks Stable Stable Stable Stable(a) Represents senior debt issuer default rating.NR – Not rated.
Long-term debt totaled $26.0 billion at Dec. 31, 2020 and $27.5 billion at Dec. 31, 2019. Redemptions of $3.2 billion and maturities of $2.1 billion were partially offset by issuances of $3.0 billion and an increase in the fair value of hedged long-term debt. The Parent has $4.3 billion of long-term debt that will mature in 2021.
The following table presents the long-term debt issued in 2020.
Debt issuances(in millions) 2020Senior notes:
1.60% senior notes due 2025 $ 1,250 0.35% senior notes due 2023 750 1.85% senior notes due 2023 750 2.10% senior notes due 2024 250
Total debt issuances $ 3,000
In January 2021, the Parent issued $700 million of fixed rate senior notes maturing in 2026 at an annual interest rate of 0.75% and $500 million of fixed rate senior notes maturing in 2031 at an annual interest rate of 1.65%.
In 2020, the Parent issued Series G Noncumulative Perpetual Preferred Stock and Series H Noncumulative Perpetual Preferred Stock and redeemed all outstanding shares of its Series C Noncumulative Perpetual Preferred Stock. See “Capital” for additional information on the Parent’s preferred stock activity and Note 15 of the Notes to Consolidated Financial Statements for additional information on the Parent’s preferred stock.
The Bank of New York Mellon may issue notes and CDs. At Dec. 31, 2020 and Dec. 31, 2019 there were $100 million and $1.1 billion, respectively, of CDs outstanding. At Dec. 31, 2020 and Dec. 31, 2019, $30 million and $1.3 billion, respectively, of notes were outstanding.
The Bank of New York Mellon also issues commercial paper that matures within 397 days from the date of issue and is not redeemable prior to maturity or subject to voluntary prepayment. The average commercial paper outstanding was $1.1 billion for 2020 and $2.5 billion for 2019. There was no commercial paper outstanding at Dec. 31, 2020 and $4.0 billion at Dec. 31, 2019.
Results of Operations (continued)
BNY Mellon 43
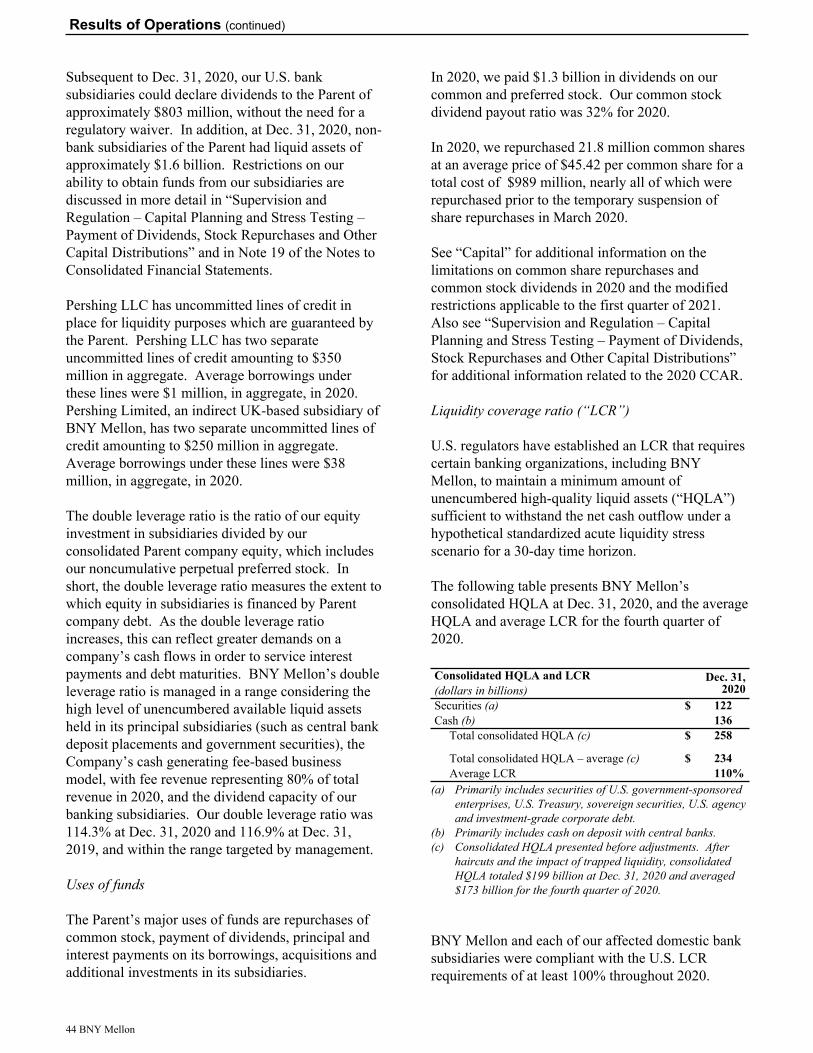
Subsequent to Dec. 31, 2020, our U.S. bank subsidiaries could declare dividends to the Parent of approximately $803 million, without the need for a regulatory waiver. In addition, at Dec. 31, 2020, non-bank subsidiaries of the Parent had liquid assets of approximately $1.6 billion. Restrictions on our ability to obtain funds from our subsidiaries are discussed in more detail in “Supervision and Regulation – Capital Planning and Stress Testing – Payment of Dividends, Stock Repurchases and Other Capital Distributions” and in Note 19 of the Notes to Consolidated Financial Statements.
Pershing LLC has uncommitted lines of credit in place for liquidity purposes which are guaranteed by the Parent. Pershing LLC has two separate uncommitted lines of credit amounting to $350 million in aggregate. Average borrowings under these lines were $1 million, in aggregate, in 2020. Pershing Limited, an indirect UK-based subsidiary of BNY Mellon, has two separate uncommitted lines of credit amounting to $250 million in aggregate. Average borrowings under these lines were $38 million, in aggregate, in 2020.
The double leverage ratio is the ratio of our equity investment in subsidiaries divided by our consolidated Parent company equity, which includes our noncumulative perpetual preferred stock. In short, the double leverage ratio measures the extent to which equity in subsidiaries is financed by Parent company debt. As the double leverage ratio increases, this can reflect greater demands on a company’s cash flows in order to service interest payments and debt maturities. BNY Mellon’s double leverage ratio is managed in a range considering the high level of unencumbered available liquid assets held in its principal subsidiaries (such as central bank deposit placements and government securities), the Company’s cash generating fee-based business model, with fee revenue representing 80% of total revenue in 2020, and the dividend capacity of our banking subsidiaries. Our double leverage ratio was 114.3% at Dec. 31, 2020 and 116.9% at Dec. 31, 2019, and within the range targeted by management.
Uses of funds
The Parent’s major uses of funds are repurchases of common stock, payment of dividends, principal and interest payments on its borrowings, acquisitions and additional investments in its subsidiaries.
In 2020, we paid $1.3 billion in dividends on our common and preferred stock. Our common stock dividend payout ratio was 32% for 2020.
In 2020, we repurchased 21.8 million common shares at an average price of $45.42 per common share for a total cost of $989 million, nearly all of which were repurchased prior to the temporary suspension of share repurchases in March 2020.
See “Capital” for additional information on the limitations on common share repurchases and common stock dividends in 2020 and the modified restrictions applicable to the first quarter of 2021. Also see “Supervision and Regulation – Capital Planning and Stress Testing – Payment of Dividends, Stock Repurchases and Other Capital Distributions” for additional information related to the 2020 CCAR.
Liquidity coverage ratio (“LCR”)
U.S. regulators have established an LCR that requires certain banking organizations, including BNY Mellon, to maintain a minimum amount of unencumbered high-quality liquid assets (“HQLA”) sufficient to withstand the net cash outflow under a hypothetical standardized acute liquidity stress scenario for a 30-day time horizon.
The following table presents BNY Mellon’s consolidated HQLA at Dec. 31, 2020, and the average HQLA and average LCR for the fourth quarter of 2020.
Consolidated HQLA and LCR Dec. 31, 2020(dollars in billions)
Securities (a) $ 122 Cash (b) 136
Total consolidated HQLA (c) $ 258
Total consolidated HQLA – average (c) $ 234 Average LCR 110%
(a) Primarily includes securities of U.S. government-sponsored enterprises, U.S. Treasury, sovereign securities, U.S. agency and investment-grade corporate debt.
(b) Primarily includes cash on deposit with central banks.(c) Consolidated HQLA presented before adjustments. After
haircuts and the impact of trapped liquidity, consolidated HQLA totaled $199 billion at Dec. 31, 2020 and averaged $173 billion for the fourth quarter of 2020.
BNY Mellon and each of our affected domestic bank subsidiaries were compliant with the U.S. LCR requirements of at least 100% throughout 2020.
Results of Operations (continued)
44 BNY Mellon
Statement of cash flows
The following summarizes the activity reflected on the consolidated statement of cash flows. While this information may be helpful to highlight certain macro trends and business strategies, the cash flow analysis may not be as relevant when analyzing changes in our net earnings and net assets. We believe that in addition to the traditional cash flow analysis, the discussion related to liquidity and dividends and asset/liability management herein may provide more useful context in evaluating our liquidity position and related activity.
Net cash provided by operating activities was $5.0 billion in 2020, compared with $96 million in 2019. In 2020, cash flows provided by operations primarily resulted from earnings. In 2019, cash flows provided by operations primarily resulted from earnings, partially offset by changes in trading assets and liabilities.
Net cash used for investing activities was $78.5 billion in 2020, compared with $10.5 billion in 2019. In 2020, net cash used for investing activities primarily reflects changes in interest-bearing deposits with the Federal Reserve and other central banks and net increases in the available-for-sale and held-to-maturity securities portfolios. In 2019, net cash used for investing activities primarily reflects changes in interest-bearing deposits with the Federal Reserve and other central banks, partially offset by changes in federal funds sold and securities purchased under resale agreements.
Net cash provided by financing activities was $75.5 billion in 2020, compared with $9.5 billion in 2019. In 2020, net cash provided by financing activity reflects changes in deposits. In 2019, net cash provided by financing activities primarily reflects changes in deposits, partially offset by repayments of long-term debt, common stock repurchases and changes in federal funds purchased and securities sold under repurchase agreements.
Capital
Capital data(dollars in millions, except per share amounts; common shares in thousands) 2020 2019At Dec. 31:BNY Mellon shareholders’ equity to total assets ratio 9.8% 10.9% BNY Mellon common shareholders’ equity to total assets ratio 8.8% 9.9% Total BNY Mellon shareholders’ equity $ 45,801 $ 41,483 Total BNY Mellon common shareholders’ equity $ 41,260 $ 37,941 BNY Mellon tangible common shareholders’ equity – Non-GAAP (a) $ 22,563 $ 19,216 Book value per common share $ 46.53 $ 42.12 Tangible book value per common share – Non-GAAP (a) $ 25.44 $ 21.33 Closing stock price per common share $ 42.44 $ 50.33 Market capitalization $ 37,634 $ 45,331 Common shares outstanding 886,764 900,683
Full-year:Average common equity to average assets 9.5% 10.8% Cash dividends per common share $ 1.24 $ 1.18 Common dividend payout ratio 32% 26% Common dividend yield 2.9% 2.3%
(a) See “Supplemental information – Explanation of GAAP and Non-GAAP financial measures” beginning on page 110 for a reconciliation of GAAP to Non-GAAP.
The Bank of New York Mellon Corporation total shareholders’ equity increased to $45.8 billion at Dec. 31, 2020 from $41.5 billion at Dec. 31, 2019. The increase primarily reflects earnings, the issuance of preferred stock, the unrealized gain on assets available-for-sale and foreign currency translation, partially offset by dividend payments, common stock repurchases and the redemption of preferred stock.
In 2020, the Parent issued 1,000,000 depositary shares, each representing a 1/100th interest in a share of the Parent’s Series G Noncumulative Perpetual Preferred Stock and 582,500 depositary shares, each representing a 1/100th interest in a share of the Parent’s Series H Noncumulative Perpetual Preferred Stock. The Parent used the net proceeds of approximately $575 million from the sale of the
Results of Operations (continued)
BNY Mellon 45
depositary shares representing the Series H Noncumulative Perpetual Preferred Stock to redeem all outstanding shares of its Series C Noncumulative Perpetual Preferred Stock. See Note 15 of the Notes to Consolidated Financial Statements for additional information on the Parent’s preferred stock.
The unrealized gain (after-tax) on our available-for-sale securities portfolio, net of hedges, included in accumulated other comprehensive income was $1.5 billion at Dec. 31, 2020, compared with $361 million at Dec. 31, 2019. The increase in the unrealized gain, net of tax, was primarily driven by lower market interest rates.
We repurchased 21.8 million common shares at an average price of $45.42 per common share for a total of $989 million in 2020, nearly all of which were repurchased prior to the temporary suspension of share repurchases in March 2020.
In June 2020, the Federal Reserve announced that it would require participating CCAR firms, including us, to update and resubmit their capital plans and that, as a result, unless otherwise approved by the Federal Reserve, participating CCAR firms were not permitted, during the third quarter of 2020, to conduct open market common stock repurchases, to increase their common stock dividends or to pay common stock dividends that exceed average net income for the preceding four quarters. On Sept. 30, 2020, the Federal Reserve extended these limitations through the fourth quarter of 2020.
In December 2020, the Federal Reserve released the results of the second round of CCAR stress tests during 2020 and extended the restriction on common stock dividends and open market common share repurchases applicable to participating CCAR firms, including us, to the first quarter of 2021, with certain modifications. Under the modified restrictions, we
are authorized to conduct open market common share repurchases in an amount up to approximately $625 million in the first quarter of 2021. See “Supervision and Regulation – Capital Planning and Stress Testing – Payment of Dividends, Stock Repurchases and Other Capital Distributions” for additional information related to the 2020 CCAR.
Capital adequacy
Regulators establish certain levels of capital for bank holding companies (“BHCs”) and banks, including BNY Mellon and our bank subsidiaries, in accordance with established quantitative measurements. For the Parent to maintain its status as a financial holding company (“FHC”), our U.S. bank subsidiaries and BNY Mellon must, among other things, qualify as “well capitalized.” As of Dec. 31, 2020 and Dec. 31, 2019, BNY Mellon and our U.S. bank subsidiaries were “well capitalized.”
Failure to satisfy regulatory standards, including “well capitalized” status or capital adequacy rules more generally, could result in limitations on our activities and adversely affect our financial condition. See the discussion of these matters in “Supervision and Regulation – Regulated Entities of BNY Mellon and Ancillary Regulatory Requirements” and “Risk Factors – Operational Risk – Failure to satisfy regulatory standards, including “well capitalized” and “well managed” status or capital adequacy and liquidity rules more generally, could result in limitations on our activities and adversely affect our business and financial condition.”
The U.S. banking agencies’ capital rules are based on the framework adopted by the Basel Committee on Banking Supervision (“BCBS”), as amended from time to time. For additional information on these capital requirements, see “Supervision and Regulation.”
Results of Operations (continued)
46 BNY Mellon
The table below presents our consolidated and largest bank subsidiary regulatory capital ratios.
Consolidated and largest bank subsidiary regulatory capital ratiosDec. 31, 2020
Dec. 31, 2019
Well capitalized
Minimum required
Capitalratios
Capitalratios(a)
Consolidated regulatory capital ratios: (b)Advanced Approaches:
CET1 ratio N/A (c) 8.5% 13.1% 11.5% Tier 1 capital ratio 6% 10 15.8 13.7 Total capital ratio 10 12 16.7 14.4
Standardized Approach:CET1 ratio N/A (c) 8.5% 13.4% 12.5% Tier 1 capital ratio 6% 10 16.1 14.8 Total capital ratio 10 12 17.1 15.8
Tier 1 leverage ratio N/A (c) 4 6.3 6.6 Supplementary leverage ratio (“SLR”) (d)(e) N/A (c) 5 8.6 6.1
The Bank of New York Mellon regulatory capital ratios: (b)Advanced Approaches:
CET1 ratio 6.5% 7% 17.1% 15.1% Tier 1 capital ratio 8 8.5 17.1 15.1 Total capital ratio 10 10.5 17.3 15.2
Tier 1 leverage ratio 5 4 6.4 6.9 SLR (d) 6 3 8.5 6.4
(a) Minimum requirements for Dec. 31, 2020 include minimum thresholds plus currently applicable buffers. The U.S. global systemically important banks (“G-SIB”) surcharge of 1.5% is subject to change. The countercyclical capital buffer is currently set to 0%. Effective Oct. 1, 2020, the SCB requirement is 2.5%, equal to the regulatory minimum, and replaces the current 2.5% capital conservation buffer for Standardized Approach capital ratios.
(b) For our CET1, Tier 1 capital and Total capital ratios, our effective capital ratios under U.S. capital rules are the lower of the ratios as calculated under the Standardized and Advanced Approaches. The Tier 1 leverage ratio is based on Tier 1 capital and quarterly average total assets.
(c) The Federal Reserve’s regulations do not establish well capitalized thresholds for these measures for BHCs. (d) The SLR is based on Tier 1 capital and total leverage exposure, which includes certain off-balance sheet exposures. The SLR at Dec. 31,
2020 reflects the exclusion of certain central bank placements from total leverage exposure. (e) The consolidated SLR at Dec. 31, 2020 reflects the temporary exclusion of U.S. Treasury securities from total leverage exposure which
increased our consolidated SLR by 72 basis points.
Our CET1 ratio determined under the Advanced Approaches was 13.1% at Dec. 31, 2020 and 11.5% at Dec. 31, 2019. The increase primarily reflects capital generated through earnings, unrealized gains on assets available-for-sale and foreign currency translation, partially offset by capital deployed through dividend payments and common stock repurchased, prior to the temporary suspension of share repurchases that began in March 2020, and higher RWAs.
Our operational loss risk model is informed by external losses, including fines and penalties levied against institutions in the financial services industry, particularly those that relate to businesses in which
we operate, and as a result external losses have impacted and could in the future impact the amount of capital that we are required to hold.
Our capital ratios are necessarily subject to, among other things, anticipated compliance with all necessary enhancements to model calibration, approval by regulators of certain models used as part of RWA calculations, other refinements, further implementation guidance from regulators, market practices and standards and any changes BNY Mellon may make to its businesses. As a consequence of these factors, our capital ratios may materially change, and may be volatile over time and from period to period.
Results of Operations (continued)
BNY Mellon 47
The following table presents our capital components and RWAs.
Capital components and risk-weighted assets Dec. 31,
(in millions) 2020 2019CET1:Common shareholders’ equity $ 41,260 $ 37,941
Adjustments for:Goodwill and intangible assets (a) (18,697) (18,725) Net pension fund assets (319) (272) Equity method investments (306) (311) Deferred tax assets (54) (46) Other (9) (47)
Total CET1 21,875 18,540 Other Tier 1 capital:
Preferred stock 4,541 3,542 Other (106) (86)
Total Tier 1 capital $ 26,310 $ 21,996 Tier 2 capital:
Subordinated debt $ 1,248 $ 1,248 Allowance for credit losses 490 216 Other (10) (11)
Total Tier 2 capital – Standardized Approach 1,728 1,453
Excess of expected credit losses 247 — Less: Allowance for credit losses 490 216
Total Tier 2 capital – Advanced Approaches $ 1,485 $ 1,237
Total capital:Standardized Approach $ 28,038 $ 23,449 Advanced Approaches $ 27,795 $ 23,233
Risk-weighted assets:Standardized Approach $ 163,848 $ 148,695 Advanced Approaches:Credit Risk $ 98,262 $ 95,490 Market Risk 4,226 4,020 Operational Risk 63,938 61,388
Total Advanced Approaches $ 166,426 $ 160,898
Average assets for Tier 1 leverage ratio $ 417,982 $ 334,869
Total leverage exposure for SLR $ 304,823 $ 362,452 (a) Reduced by deferred tax liabilities associated with
intangible assets and tax-deductible goodwill.
The table below presents the factors that impacted CET1 capital.
CET1 generation2020(in millions)
CET1 – Beginning of period $ 18,540 Net income applicable to common shareholders of The Bank of New York Mellon Corporation 3,423
Goodwill and intangible assets, net of related deferred tax liabilities 28
Gross CET1 generated 3,451 Capital deployed:
Common stock dividend payments (1,117) Common stock repurchases (989) Total capital deployed (2,106)
Other comprehensive income:Unrealized gain on assets available-for-sale 1,177 Foreign currency translation 506 Unrealized gain on cash flow hedges 5 Defined benefit plans (30) Other (5)
Total other comprehensive income 1,653 Additional paid-in capital (a) 308 Other additions (deductions):
Net pension fund assets (47) Embedded goodwill 5 Deferred tax assets (8) Other 79 Total other additions 29 Net CET1 generated 3,335 CET1 – End of period $ 21,875
(a) Primarily related to stock awards, the exercise of stock options and stock issued for employee benefit plans.
The following table shows the impact on the consolidated capital ratios at Dec. 31, 2020 of a $100 million increase or decrease in common equity, or a $1 billion increase or decrease in RWAs, quarterly average assets or total leverage exposure.
Sensitivity of consolidated capital ratios at Dec. 31, 2020 Increase or decrease of
(in basis points)
$100 millionin common
equity
$1 billion in RWA, quarterly average
assets or total leverage exposure
CET1:Standardized Approach 6 bps 8 bpsAdvanced Approaches 6 8
Tier 1 capital:Standardized Approach 6 10Advanced Approaches 6 10
Total capital:Standardized Approach 6 11Advanced Approaches 6 10
Tier 1 leverage 2 2
SLR 3 3
Results of Operations (continued)
48 BNY Mellon
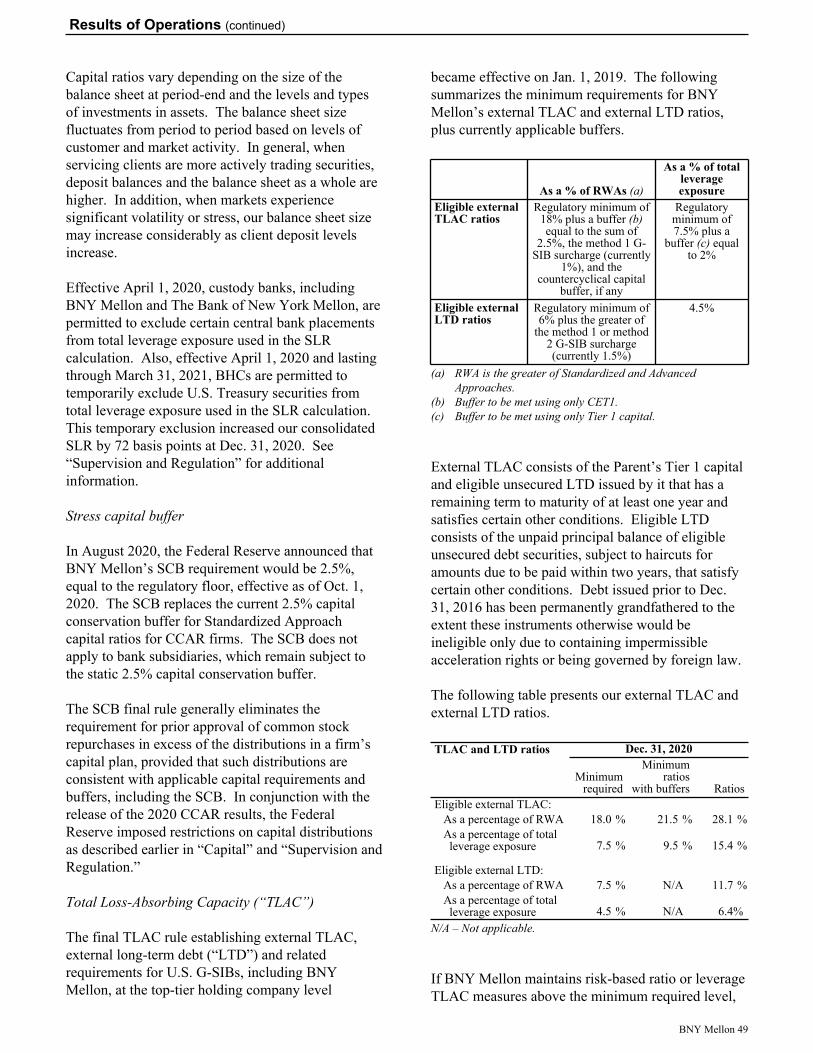
Capital ratios vary depending on the size of the balance sheet at period-end and the levels and types of investments in assets. The balance sheet size fluctuates from period to period based on levels of customer and market activity. In general, when servicing clients are more actively trading securities, deposit balances and the balance sheet as a whole are higher. In addition, when markets experience significant volatility or stress, our balance sheet size may increase considerably as client deposit levels increase.
Effective April 1, 2020, custody banks, including BNY Mellon and The Bank of New York Mellon, are permitted to exclude certain central bank placements from total leverage exposure used in the SLR calculation. Also, effective April 1, 2020 and lasting through March 31, 2021, BHCs are permitted to temporarily exclude U.S. Treasury securities from total leverage exposure used in the SLR calculation. This temporary exclusion increased our consolidated SLR by 72 basis points at Dec. 31, 2020. See “Supervision and Regulation” for additional information.
Stress capital buffer
In August 2020, the Federal Reserve announced that BNY Mellon’s SCB requirement would be 2.5%, equal to the regulatory floor, effective as of Oct. 1, 2020. The SCB replaces the current 2.5% capital conservation buffer for Standardized Approach capital ratios for CCAR firms. The SCB does not apply to bank subsidiaries, which remain subject to the static 2.5% capital conservation buffer.
The SCB final rule generally eliminates the requirement for prior approval of common stock repurchases in excess of the distributions in a firm’s capital plan, provided that such distributions are consistent with applicable capital requirements and buffers, including the SCB. In conjunction with the release of the 2020 CCAR results, the Federal Reserve imposed restrictions on capital distributions as described earlier in “Capital” and “Supervision and Regulation.”
Total Loss-Absorbing Capacity (“TLAC”)
The final TLAC rule establishing external TLAC, external long-term debt (“LTD”) and related requirements for U.S. G-SIBs, including BNY Mellon, at the top-tier holding company level
became effective on Jan. 1, 2019. The following summarizes the minimum requirements for BNY Mellon’s external TLAC and external LTD ratios, plus currently applicable buffers.
As a % of RWAs (a)
As a % of total leverage exposure
Eligible external TLAC ratios
Regulatory minimum of 18% plus a buffer (b) equal to the sum of
2.5%, the method 1 G-SIB surcharge (currently
1%), and the countercyclical capital
buffer, if any
Regulatory minimum of 7.5% plus a
buffer (c) equal to 2%
Eligible external LTD ratios
Regulatory minimum of 6% plus the greater of
the method 1 or method 2 G-SIB surcharge (currently 1.5%)
4.5%
(a) RWA is the greater of Standardized and Advanced Approaches.
(b) Buffer to be met using only CET1. (c) Buffer to be met using only Tier 1 capital.
External TLAC consists of the Parent’s Tier 1 capital and eligible unsecured LTD issued by it that has a remaining term to maturity of at least one year and satisfies certain other conditions. Eligible LTD consists of the unpaid principal balance of eligible unsecured debt securities, subject to haircuts for amounts due to be paid within two years, that satisfy certain other conditions. Debt issued prior to Dec. 31, 2016 has been permanently grandfathered to the extent these instruments otherwise would be ineligible only due to containing impermissible acceleration rights or being governed by foreign law.
The following table presents our external TLAC and external LTD ratios.
TLAC and LTD ratios Dec. 31, 2020
Minimumrequired
Minimum ratios
with buffers RatiosEligible external TLAC:
As a percentage of RWA 18.0 % 21.5 % 28.1 %As a percentage of total leverage exposure 7.5 % 9.5 % 15.4 %
Eligible external LTD:As a percentage of RWA 7.5 % N/A 11.7 %As a percentage of total leverage exposure 4.5 % N/A 6.4%
N/A – Not applicable.
If BNY Mellon maintains risk-based ratio or leverage TLAC measures above the minimum required level,
Results of Operations (continued)
BNY Mellon 49
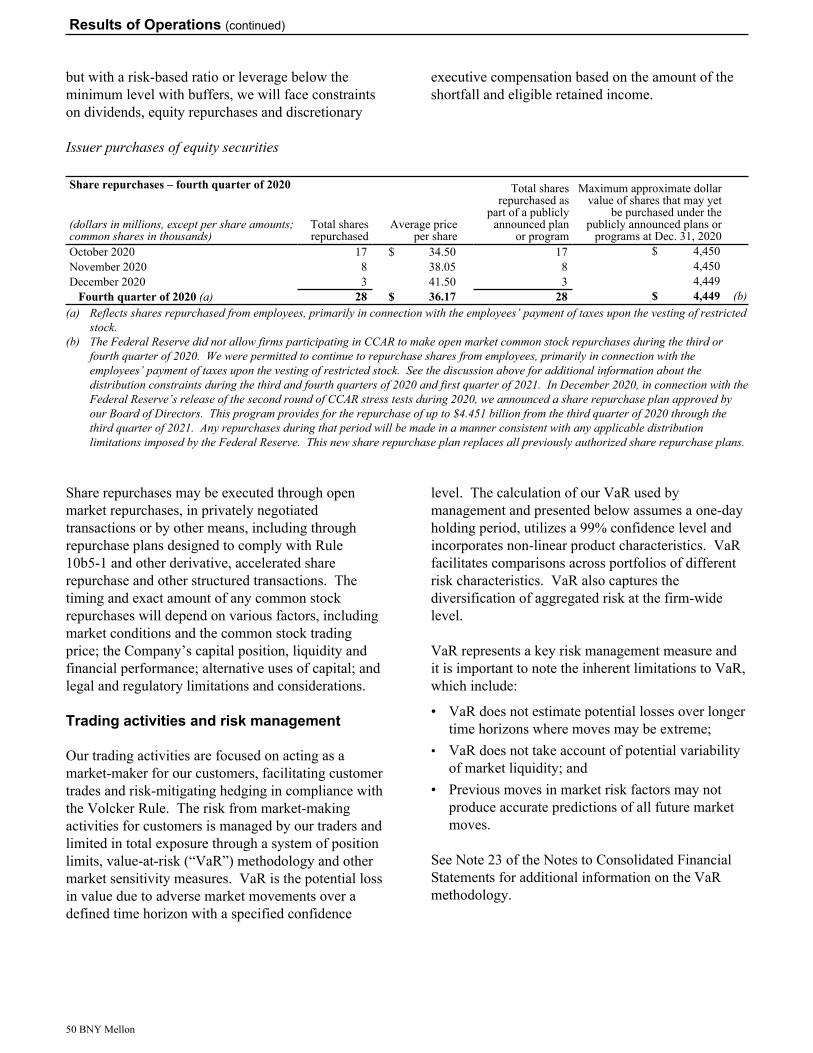
but with a risk-based ratio or leverage below the minimum level with buffers, we will face constraints on dividends, equity repurchases and discretionary
executive compensation based on the amount of the shortfall and eligible retained income.
Issuer purchases of equity securities
Share repurchases – fourth quarter of 2020 Total shares repurchased as
part of a publicly announced plan
or program
Maximum approximate dollar value of shares that may yet
be purchased under the publicly announced plans or
programs at Dec. 31, 2020(dollars in millions, except per share amounts; common shares in thousands)
Total sharesrepurchased
Average priceper share
October 2020 17 $ 34.50 17 $ 4,450 November 2020 8 38.05 8 4,450 December 2020 3 41.50 3 4,449
Fourth quarter of 2020 (a) 28 $ 36.17 28 $ 4,449 (b)(a) Reflects shares repurchased from employees, primarily in connection with the employees’ payment of taxes upon the vesting of restricted
stock. (b) The Federal Reserve did not allow firms participating in CCAR to make open market common stock repurchases during the third or
fourth quarter of 2020. We were permitted to continue to repurchase shares from employees, primarily in connection with the employees’ payment of taxes upon the vesting of restricted stock. See the discussion above for additional information about the distribution constraints during the third and fourth quarters of 2020 and first quarter of 2021. In December 2020, in connection with the Federal Reserve’s release of the second round of CCAR stress tests during 2020, we announced a share repurchase plan approved by our Board of Directors. This program provides for the repurchase of up to $4.451 billion from the third quarter of 2020 through the third quarter of 2021. Any repurchases during that period will be made in a manner consistent with any applicable distribution limitations imposed by the Federal Reserve. This new share repurchase plan replaces all previously authorized share repurchase plans.
Share repurchases may be executed through open market repurchases, in privately negotiated transactions or by other means, including through repurchase plans designed to comply with Rule 10b5-1 and other derivative, accelerated share repurchase and other structured transactions. The timing and exact amount of any common stock repurchases will depend on various factors, including market conditions and the common stock trading price; the Company’s capital position, liquidity and financial performance; alternative uses of capital; and legal and regulatory limitations and considerations.
Trading activities and risk management
Our trading activities are focused on acting as a market-maker for our customers, facilitating customer trades and risk-mitigating hedging in compliance with the Volcker Rule. The risk from market-making activities for customers is managed by our traders and limited in total exposure through a system of position limits, value-at-risk (“VaR”) methodology and other market sensitivity measures. VaR is the potential loss in value due to adverse market movements over a defined time horizon with a specified confidence
level. The calculation of our VaR used by management and presented below assumes a one-day holding period, utilizes a 99% confidence level and incorporates non-linear product characteristics. VaR facilitates comparisons across portfolios of different risk characteristics. VaR also captures the diversification of aggregated risk at the firm-wide level.
VaR represents a key risk management measure and it is important to note the inherent limitations to VaR, which include:
• VaR does not estimate potential losses over longer time horizons where moves may be extreme;
• VaR does not take account of potential variability of market liquidity; and
• Previous moves in market risk factors may not produce accurate predictions of all future market moves.
See Note 23 of the Notes to Consolidated Financial Statements for additional information on the VaR methodology.
Results of Operations (continued)
50 BNY Mellon
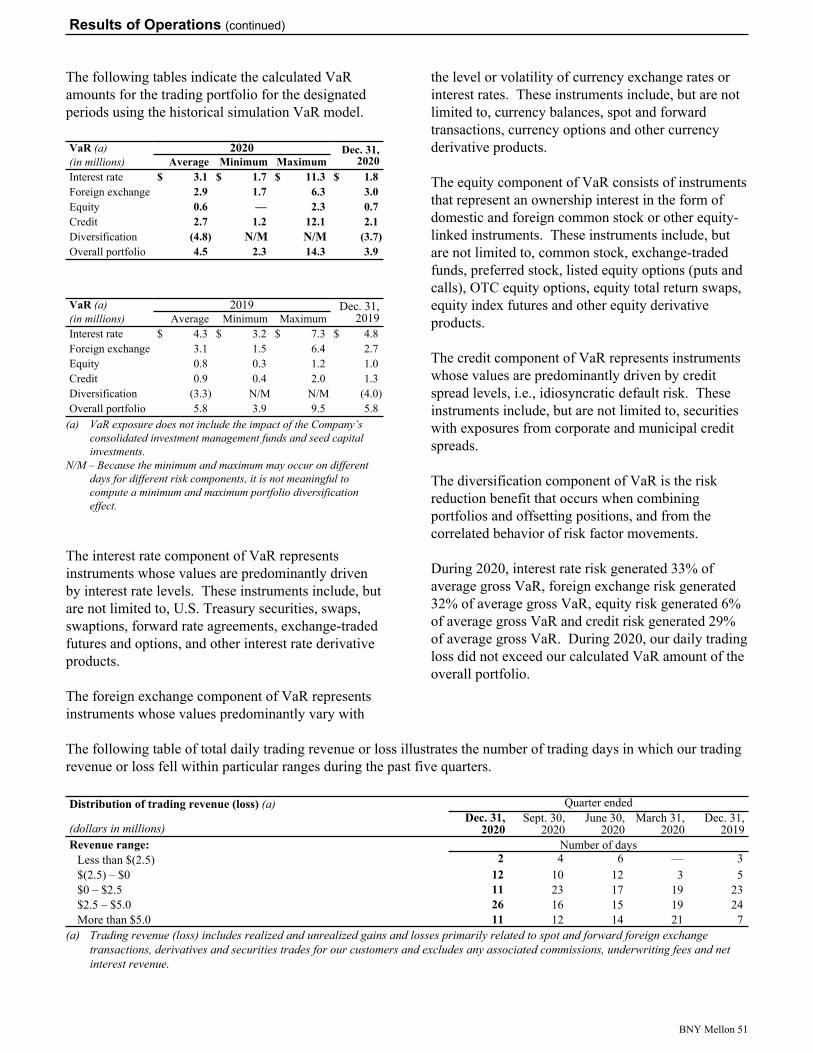
The following tables indicate the calculated VaR amounts for the trading portfolio for the designated periods using the historical simulation VaR model.
VaR (a) 2020 Dec. 31, 2020(in millions) Average Minimum Maximum
Interest rate $ 3.1 $ 1.7 $ 11.3 $ 1.8 Foreign exchange 2.9 1.7 6.3 3.0 Equity 0.6 — 2.3 0.7 Credit 2.7 1.2 12.1 2.1 Diversification (4.8) N/M N/M (3.7) Overall portfolio 4.5 2.3 14.3 3.9
VaR (a) 2019 Dec. 31, 2019(in millions) Average Minimum Maximum
Interest rate $ 4.3 $ 3.2 $ 7.3 $ 4.8 Foreign exchange 3.1 1.5 6.4 2.7 Equity 0.8 0.3 1.2 1.0 Credit 0.9 0.4 2.0 1.3 Diversification (3.3) N/M N/M (4.0) Overall portfolio 5.8 3.9 9.5 5.8
(a) VaR exposure does not include the impact of the Company’s consolidated investment management funds and seed capital investments.
N/M – Because the minimum and maximum may occur on different days for different risk components, it is not meaningful to compute a minimum and maximum portfolio diversification effect.
The interest rate component of VaR represents instruments whose values are predominantly driven by interest rate levels. These instruments include, but are not limited to, U.S. Treasury securities, swaps, swaptions, forward rate agreements, exchange-traded futures and options, and other interest rate derivative products.
The foreign exchange component of VaR represents instruments whose values predominantly vary with
the level or volatility of currency exchange rates or interest rates. These instruments include, but are not limited to, currency balances, spot and forward transactions, currency options and other currency derivative products.
The equity component of VaR consists of instruments that represent an ownership interest in the form of domestic and foreign common stock or other equity-linked instruments. These instruments include, but are not limited to, common stock, exchange-traded funds, preferred stock, listed equity options (puts and calls), OTC equity options, equity total return swaps, equity index futures and other equity derivative products.
The credit component of VaR represents instruments whose values are predominantly driven by credit spread levels, i.e., idiosyncratic default risk. These instruments include, but are not limited to, securities with exposures from corporate and municipal credit spreads.
The diversification component of VaR is the risk reduction benefit that occurs when combining portfolios and offsetting positions, and from the correlated behavior of risk factor movements.
During 2020, interest rate risk generated 33% of average gross VaR, foreign exchange risk generated 32% of average gross VaR, equity risk generated 6% of average gross VaR and credit risk generated 29% of average gross VaR. During 2020, our daily trading loss did not exceed our calculated VaR amount of the overall portfolio.
The following table of total daily trading revenue or loss illustrates the number of trading days in which our trading revenue or loss fell within particular ranges during the past five quarters.
Distribution of trading revenue (loss) (a) Quarter ended
(dollars in millions)Dec. 31,
2020Sept. 30,
2020June 30,
2020March 31,
2020Dec. 31,
2019Revenue range: Number of days
Less than $(2.5) 2 4 6 — 3 $(2.5) – $0 12 10 12 3 5 $0 – $2.5 11 23 17 19 23 $2.5 – $5.0 26 16 15 19 24 More than $5.0 11 12 14 21 7
(a) Trading revenue (loss) includes realized and unrealized gains and losses primarily related to spot and forward foreign exchange transactions, derivatives and securities trades for our customers and excludes any associated commissions, underwriting fees and net interest revenue.
Results of Operations (continued)
BNY Mellon 51
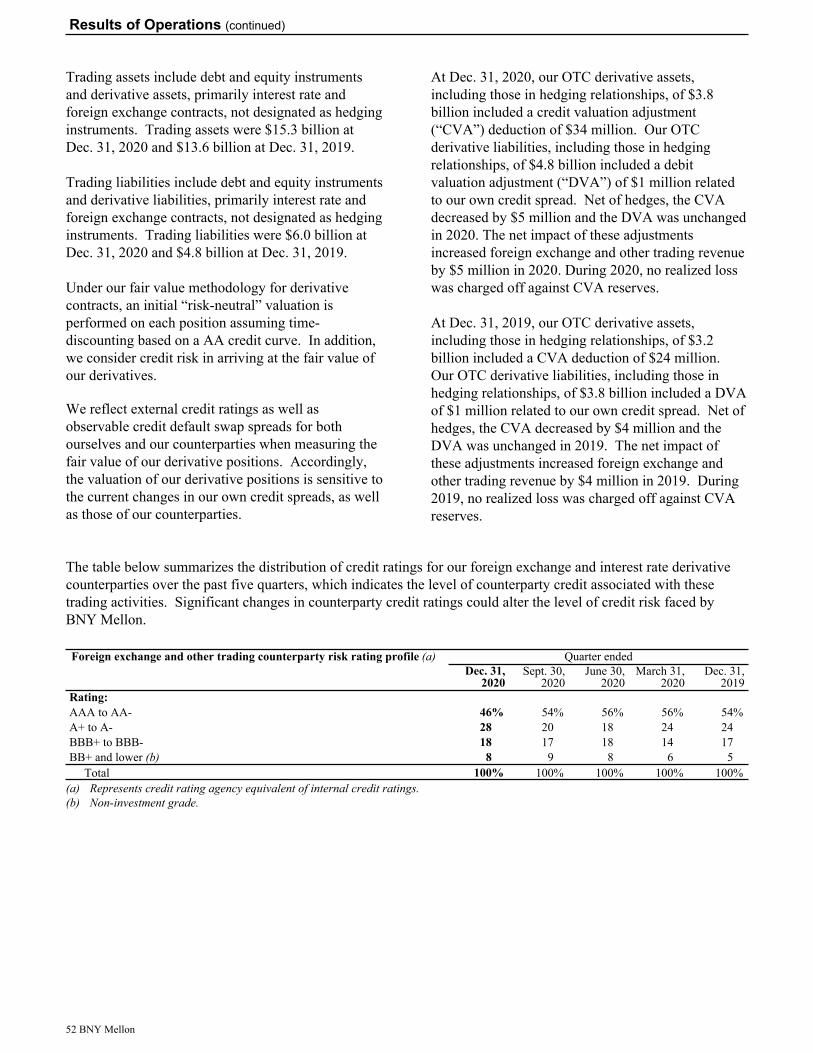
Trading assets include debt and equity instruments and derivative assets, primarily interest rate and foreign exchange contracts, not designated as hedging instruments. Trading assets were $15.3 billion at Dec. 31, 2020 and $13.6 billion at Dec. 31, 2019.
Trading liabilities include debt and equity instruments and derivative liabilities, primarily interest rate and foreign exchange contracts, not designated as hedging instruments. Trading liabilities were $6.0 billion at Dec. 31, 2020 and $4.8 billion at Dec. 31, 2019.
Under our fair value methodology for derivative contracts, an initial “risk-neutral” valuation is performed on each position assuming time-discounting based on a AA credit curve. In addition, we consider credit risk in arriving at the fair value of our derivatives.
We reflect external credit ratings as well as observable credit default swap spreads for both ourselves and our counterparties when measuring the fair value of our derivative positions. Accordingly, the valuation of our derivative positions is sensitive to the current changes in our own credit spreads, as well as those of our counterparties.
At Dec. 31, 2020, our OTC derivative assets, including those in hedging relationships, of $3.8 billion included a credit valuation adjustment (“CVA”) deduction of $34 million. Our OTC derivative liabilities, including those in hedging relationships, of $4.8 billion included a debit valuation adjustment (“DVA”) of $1 million related to our own credit spread. Net of hedges, the CVA decreased by $5 million and the DVA was unchanged in 2020. The net impact of these adjustments increased foreign exchange and other trading revenue by $5 million in 2020. During 2020, no realized loss was charged off against CVA reserves.
At Dec. 31, 2019, our OTC derivative assets, including those in hedging relationships, of $3.2 billion included a CVA deduction of $24 million. Our OTC derivative liabilities, including those in hedging relationships, of $3.8 billion included a DVA of $1 million related to our own credit spread. Net of hedges, the CVA decreased by $4 million and the DVA was unchanged in 2019. The net impact of these adjustments increased foreign exchange and other trading revenue by $4 million in 2019. During 2019, no realized loss was charged off against CVA reserves.
The table below summarizes the distribution of credit ratings for our foreign exchange and interest rate derivative counterparties over the past five quarters, which indicates the level of counterparty credit associated with these trading activities. Significant changes in counterparty credit ratings could alter the level of credit risk faced by BNY Mellon.
Foreign exchange and other trading counterparty risk rating profile (a) Quarter endedDec. 31,
2020Sept. 30,
2020June 30,
2020March 31,
2020Dec. 31,
2019Rating:AAA to AA- 46% 54% 56% 56% 54% A+ to A- 28 20 18 24 24 BBB+ to BBB- 18 17 18 14 17 BB+ and lower (b) 8 9 8 6 5
Total 100% 100% 100% 100% 100% (a) Represents credit rating agency equivalent of internal credit ratings.(b) Non-investment grade.
Results of Operations (continued)
52 BNY Mellon
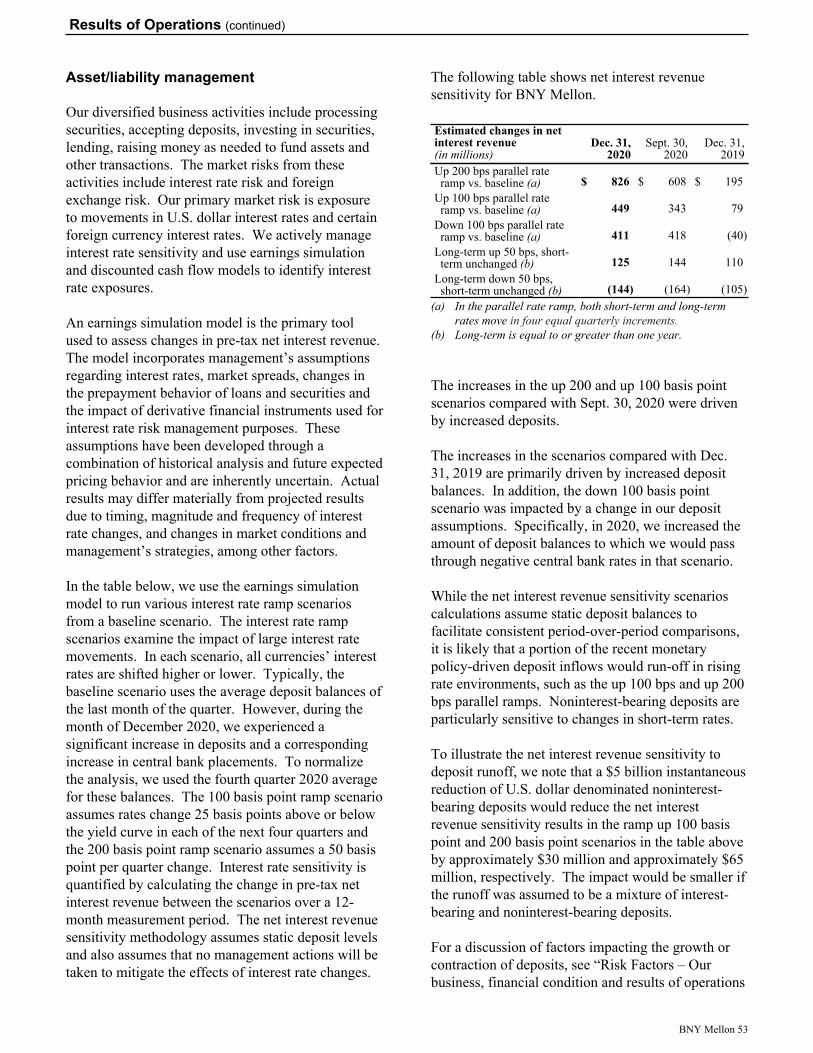
Asset/liability management
Our diversified business activities include processing securities, accepting deposits, investing in securities, lending, raising money as needed to fund assets and other transactions. The market risks from these activities include interest rate risk and foreign exchange risk. Our primary market risk is exposure to movements in U.S. dollar interest rates and certain foreign currency interest rates. We actively manage interest rate sensitivity and use earnings simulation and discounted cash flow models to identify interest rate exposures.
An earnings simulation model is the primary tool used to assess changes in pre-tax net interest revenue. The model incorporates management’s assumptions regarding interest rates, market spreads, changes in the prepayment behavior of loans and securities and the impact of derivative financial instruments used for interest rate risk management purposes. These assumptions have been developed through a combination of historical analysis and future expected pricing behavior and are inherently uncertain. Actual results may differ materially from projected results due to timing, magnitude and frequency of interest rate changes, and changes in market conditions and management’s strategies, among other factors.
In the table below, we use the earnings simulation model to run various interest rate ramp scenarios from a baseline scenario. The interest rate ramp scenarios examine the impact of large interest rate movements. In each scenario, all currencies’ interest rates are shifted higher or lower. Typically, the baseline scenario uses the average deposit balances of the last month of the quarter. However, during the month of December 2020, we experienced a significant increase in deposits and a corresponding increase in central bank placements. To normalize the analysis, we used the fourth quarter 2020 average for these balances. The 100 basis point ramp scenario assumes rates change 25 basis points above or below the yield curve in each of the next four quarters and the 200 basis point ramp scenario assumes a 50 basis point per quarter change. Interest rate sensitivity is quantified by calculating the change in pre-tax net interest revenue between the scenarios over a 12-month measurement period. The net interest revenue sensitivity methodology assumes static deposit levels and also assumes that no management actions will be taken to mitigate the effects of interest rate changes.
The following table shows net interest revenue sensitivity for BNY Mellon.
Estimated changes in net interest revenue (in millions)
Dec. 31, 2020
Sept. 30, 2020
Dec. 31, 2019
Up 200 bps parallel rate ramp vs. baseline (a) $ 826 $ 608 $ 195
Up 100 bps parallel rate ramp vs. baseline (a) 449 343 79
Down 100 bps parallel rate ramp vs. baseline (a) 411 418 (40)
Long-term up 50 bps, short-term unchanged (b) 125 144 110
Long-term down 50 bps, short-term unchanged (b) (144) (164) (105)
(a) In the parallel rate ramp, both short-term and long-term rates move in four equal quarterly increments.
(b) Long-term is equal to or greater than one year.
The increases in the up 200 and up 100 basis point scenarios compared with Sept. 30, 2020 were driven by increased deposits.
The increases in the scenarios compared with Dec. 31, 2019 are primarily driven by increased deposit balances. In addition, the down 100 basis point scenario was impacted by a change in our deposit assumptions. Specifically, in 2020, we increased the amount of deposit balances to which we would pass through negative central bank rates in that scenario.
While the net interest revenue sensitivity scenarios calculations assume static deposit balances to facilitate consistent period-over-period comparisons, it is likely that a portion of the recent monetary policy-driven deposit inflows would run-off in rising rate environments, such as the up 100 bps and up 200 bps parallel ramps. Noninterest-bearing deposits are particularly sensitive to changes in short-term rates.
To illustrate the net interest revenue sensitivity to deposit runoff, we note that a $5 billion instantaneous reduction of U.S. dollar denominated noninterest-bearing deposits would reduce the net interest revenue sensitivity results in the ramp up 100 basis point and 200 basis point scenarios in the table above by approximately $30 million and approximately $65 million, respectively. The impact would be smaller if the runoff was assumed to be a mixture of interest-bearing and noninterest-bearing deposits.
For a discussion of factors impacting the growth or contraction of deposits, see “Risk Factors – Our business, financial condition and results of operations
Results of Operations (continued)
BNY Mellon 53
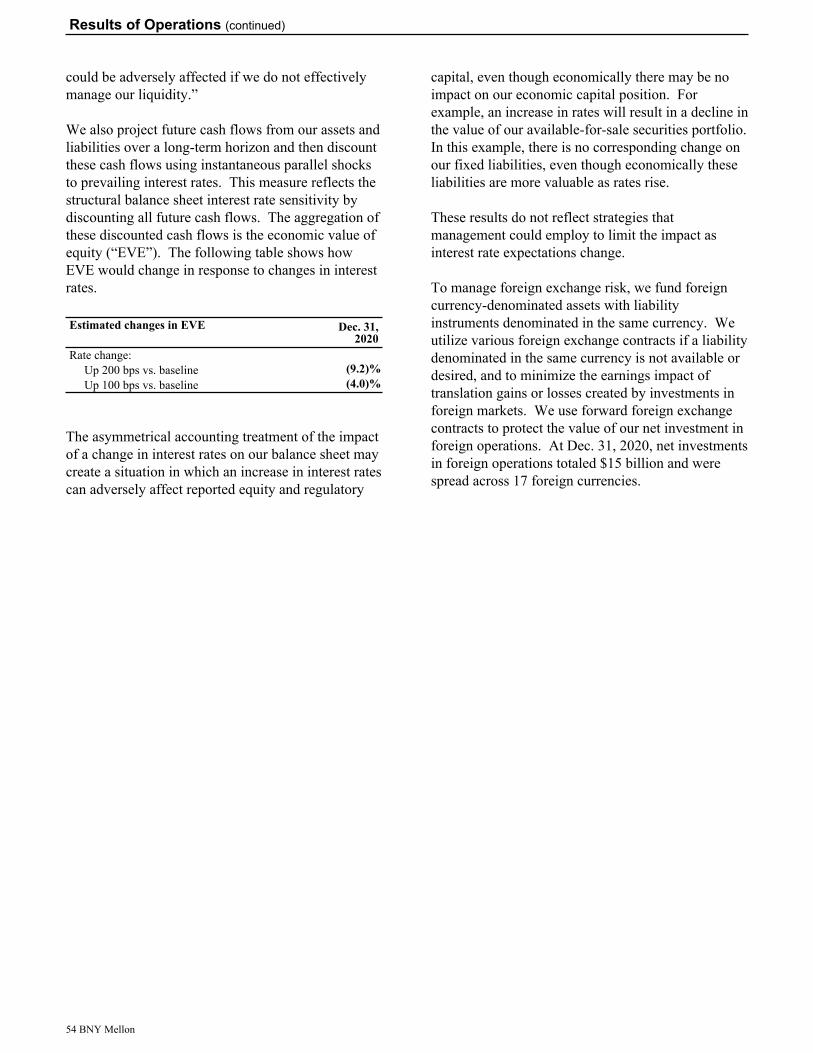
could be adversely affected if we do not effectively manage our liquidity.”
We also project future cash flows from our assets and liabilities over a long-term horizon and then discount these cash flows using instantaneous parallel shocks to prevailing interest rates. This measure reflects the structural balance sheet interest rate sensitivity by discounting all future cash flows. The aggregation of these discounted cash flows is the economic value of equity (“EVE”). The following table shows how EVE would change in response to changes in interest rates.
Estimated changes in EVE Dec. 31, 2020
Rate change:Up 200 bps vs. baseline (9.2) %Up 100 bps vs. baseline (4.0) %
The asymmetrical accounting treatment of the impact of a change in interest rates on our balance sheet may create a situation in which an increase in interest rates can adversely affect reported equity and regulatory
capital, even though economically there may be no impact on our economic capital position. For example, an increase in rates will result in a decline in the value of our available-for-sale securities portfolio. In this example, there is no corresponding change on our fixed liabilities, even though economically these liabilities are more valuable as rates rise.
These results do not reflect strategies that management could employ to limit the impact as interest rate expectations change.
To manage foreign exchange risk, we fund foreign currency-denominated assets with liability instruments denominated in the same currency. We utilize various foreign exchange contracts if a liability denominated in the same currency is not available or desired, and to minimize the earnings impact of translation gains or losses created by investments in foreign markets. We use forward foreign exchange contracts to protect the value of our net investment in foreign operations. At Dec. 31, 2020, net investments in foreign operations totaled $15 billion and were spread across 17 foreign currencies.
Results of Operations (continued)
54 BNY Mellon
Overview
BNY Mellon plays a vital role in the global financial markets, and effective risk management is critical to our success. Risk management begins with a strong risk culture, and we reinforce our culture through policies and the Code of Conduct, which are grounded in our core values of passion for excellence, integrity, strength in diversity and courage to lead.
These values are critical to our success. They not only explain what we stand for and our shared culture, but also help us to think and act globally. They serve as a representation of the promises we have made to our clients, communities, shareholders and each other.
BNY Mellon’s Risk Identification process is the foundation for understanding and managing risk across our six primary risk categories: Operational Risk, Market Risk, Credit Risk, Liquidity Risk, Model Risk and Strategic Risk. Each business and corporate staff area is responsible for the identification of risks. Quarterly, the Company’s risks are aggregated, reviewed and evaluated to determine the set of risks most material to BNY Mellon. Outputs from the Risk Identification process inform elements of our risk framework such as our Risk Appetite, Enterprise-wide Stress Testing and Capital Planning.
BNY Mellon’s Risk Appetite expresses the aggregate level of risk we are willing to assume to meet our objectives in a manner that balances risk and reward while considering our risk capacity and maintaining a balance sheet that remains resilient throughout market cycles. This guides BNY Mellon’s risk-taking activities and informs key decision-making processes, including the manner by which we pursue our business strategy and the methods by which we manage risk. The Risk Appetite Statement and associated key risk metrics to monitor our risk profile are updated and approved by the Risk Committee of the Board at least annually.
BNY Mellon conducts Enterprise-wide Stress Testing as part of its Internal Capital Adequacy Assessment Process in accordance with CCAR, and as required by the enhanced prudential standards issued pursuant to the Dodd-Frank Wall Street Reform and Consumer Protection Act (the “Dodd-Frank Act”). Enterprise-wide Stress Testing considers the Company’s lines of business, products, geographic areas and risk types incorporating the results from underlying models and
projections for a range of stress scenarios. Additional details on Capital Planning and Stress Testing are included in “Supervision and Regulation.”
Three Lines of Defense
BNY Mellon’s Three Lines of Defense model is a critical component of our risk management framework to clarify roles and responsibilities across the organization.
BNY Mellon’s first line of defense includes senior management and business and corporate staff, excluding management and employees in Risk Management, Compliance and Internal Audit. Senior management in the first line is responsible for maintaining and implementing an effective risk management framework and ensuring BNY Mellon appropriately manages risk consistent with its strategy and risk tolerance, including establishing clear responsibilities and accountability for the identification, measurement, management and control of risk.
Risk & Compliance is the independent second line of defense. It is responsible for establishing a framework that outlines expectations and provides guidance for the effective management of risk at BNY Mellon while also independently testing, reviewing and challenging the first line. Risk & Compliance provides independent oversight of risk management and compliance across three views – lines of business; regions and legal entities; and enterprise-wide risk or compliance disciplines which apply consistent standards for each risk or compliance type or topic across the firm.
The Chief Risk Officer has reporting lines to both the Chief Executive Officer and the Risk Committee of the Company’s Board of Directors.
Internal Audit is BNY Mellon’s third line of defense and serves as an independent, objective assurance function that reports directly to the Audit Committee of the Company’s Board of Directors. It assists the Company in accomplishing its objectives by bringing a systematic, disciplined, risk-based approach to evaluate and improve the effectiveness of the Company’s risk management, control and governance processes. The scope of Internal Audit’s work includes the review and evaluation of the adequacy, effectiveness and sustainability of risk management procedures, internal control systems, information systems and governance processes.
Risk Management
BNY Mellon 55
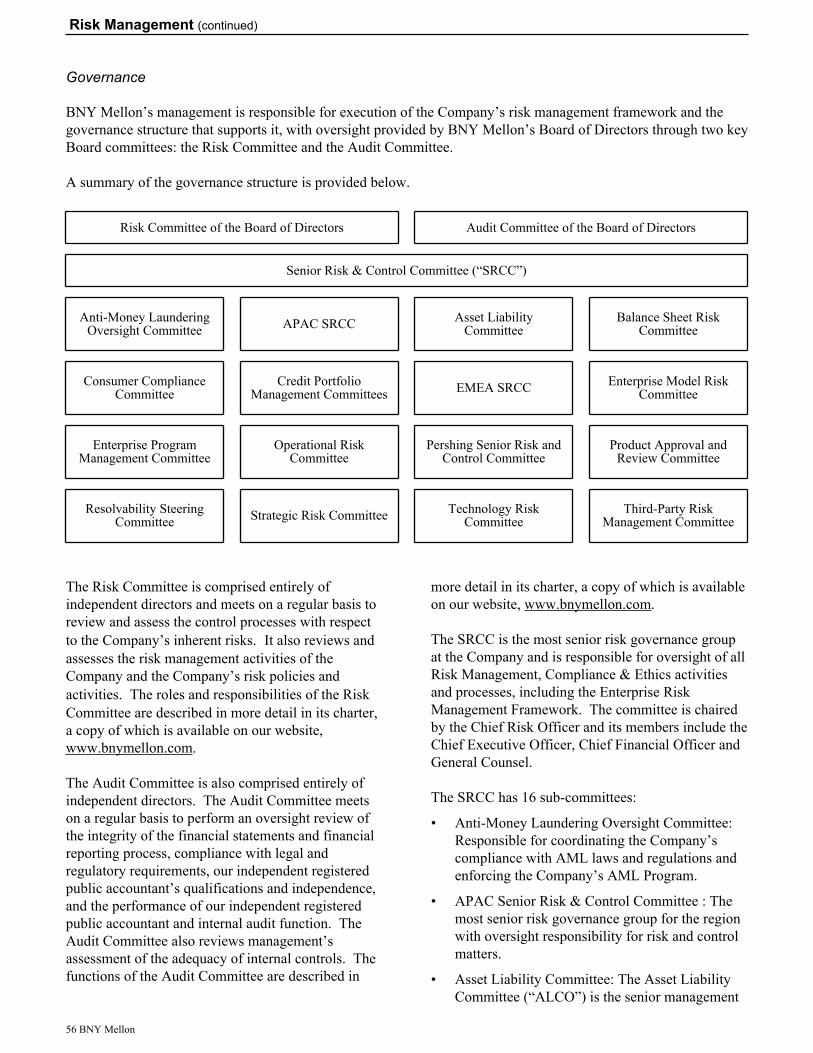
Governance
BNY Mellon’s management is responsible for execution of the Company’s risk management framework and the governance structure that supports it, with oversight provided by BNY Mellon’s Board of Directors through two key Board committees: the Risk Committee and the Audit Committee.
A summary of the governance structure is provided below.
Risk Committee of the Board of Directors Audit Committee of the Board of Directors
Senior Risk & Control Committee (“SRCC”)
Anti-Money Laundering Oversight Committee APAC SRCC Asset Liability
CommitteeBalance Sheet Risk
Committee
Consumer Compliance Committee
Credit Portfolio Management Committees EMEA SRCC Enterprise Model Risk
Committee
Enterprise Program Management Committee
Operational Risk Committee
Pershing Senior Risk and Control Committee
Product Approval and Review Committee
Resolvability Steering Committee Strategic Risk Committee Technology Risk
CommitteeThird-Party Risk
Management Committee
The Risk Committee is comprised entirely of independent directors and meets on a regular basis to review and assess the control processes with respect to the Company’s inherent risks. It also reviews and assesses the risk management activities of the Company and the Company’s risk policies and activities. The roles and responsibilities of the Risk Committee are described in more detail in its charter, a copy of which is available on our website, www.bnymellon.com.
The Audit Committee is also comprised entirely of independent directors. The Audit Committee meets on a regular basis to perform an oversight review of the integrity of the financial statements and financial reporting process, compliance with legal and regulatory requirements, our independent registered public accountant’s qualifications and independence, and the performance of our independent registered public accountant and internal audit function. The Audit Committee also reviews management’s assessment of the adequacy of internal controls. The functions of the Audit Committee are described in
more detail in its charter, a copy of which is available on our website, www.bnymellon.com.
The SRCC is the most senior risk governance group at the Company and is responsible for oversight of all Risk Management, Compliance & Ethics activities and processes, including the Enterprise Risk Management Framework. The committee is chaired by the Chief Risk Officer and its members include the Chief Executive Officer, Chief Financial Officer and General Counsel.
The SRCC has 16 sub-committees:
• Anti-Money Laundering Oversight Committee: Responsible for coordinating the Company’s compliance with AML laws and regulations and enforcing the Company’s AML Program.
• APAC Senior Risk & Control Committee : The most senior risk governance group for the region with oversight responsibility for risk and control matters.
• Asset Liability Committee: The Asset Liability Committee (“ALCO”) is the senior management
Risk Management (continued)
56 BNY Mellon
committee responsible for balance sheet oversight, including capital, liquidity and interest rate risk management.
• Balance Sheet Risk Committee (the “BSRC”): Reviews and enforces balance sheet risk management frameworks associated with the assets, liabilities and capital of the Company. The BSRC reviews the adequacy of associated controls and processes, monitors risk management in the context of risk appetite, and approves related policy documents.
• Consumer Compliance Committee: Provides oversight for the BNY Mellon Consumer Compliance Management Program and confirms that businesses maintain appropriate processes to comply with applicable laws, regulations and company policies.
• Credit Portfolio Management Committees: Six Portfolio Management Committees, governed by the same charter and rules, manage, monitor and review one of Credit Risk’s primary portfolio segments, including underwriting criteria, portfolio limits and composition, concentration, credit strategy, quality and exposure.
• EMEA Senior Risk & Control Committee: The most senior risk governance group for the region with oversight responsibility for risk and control matters.
• Enterprise Model Risk Committee: Communicates an aggregate view of model risk to the SRCC and the Board. Establishes policy and serves as an escalation point for key decisions on models.
• Enterprise Program Management Committee: Primary corporate governance and oversight body for regulatory, business risk and control programs that are not otherwise reviewed at the Technology Oversight Committee meetings.
• Operational Risk Committee: Oversees the operational risk framework and policies, reviews
and monitors program outputs and metrics, monitors resolution of significant operational risk matters, including changes to the risk and control environment, and escalates concerns to the SRCC.
• Pershing Senior Risk and Control Committee: The most senior risk governance group for Pershing with oversight responsibility for risk and control matters.
• Product Approval and Review Committee: Responsible for reviewing and approving proposals to introduce new and modify or retire existing products.
• Resolvability Steering Committee: Oversees recovery and resolution planning, including but not limited to the project governance and oversight framework for all recovery and resolution planning requirements in relevant jurisdictions where BNY Mellon operates.
• Strategic Risk Committee: Considers for approval proposals for major strategic initiatives significantly impacting the risk profile of the Company, including but not limited to acquisitions, material changes to existing products, material new products, significant business process changes and complex transactions.
• Technology Risk Committee: Oversees the review and assessment of technology risk and control issues observed from existing business practices or activities, or arising from new business practices or activities in our various lines of business and supporting operations so as to assist business management and corporate staff in managing and monitoring technology risk and control issues.
• Third-Party Risk Management Committee: Oversees the identification and management of third-party risk exposures across the enterprise, driving business ownership and accountability of third-party risk exposures and challenging risk management strategies.
Risk Management (continued)
BNY Mellon 57
Risk Types Overview
The understanding, identification, measurement and mitigation of risk are essential elements for the successful management of BNY Mellon. Our primary risk categories are:
Type of risk DescriptionOperational The risk of loss resulting from inadequate
or failed internal processes, people and systems or from external events. Operational risk includes compliance and technology risks.
Market The risk of financial loss, including losses to earnings and the erosion of capital, resulting from movements in market risk factors. Market risk factors include, but are not limited to, interest rates, credit spreads, foreign exchange rates, commodity and equity prices, market liquidity and mortgage pre-payment speeds.
Credit The risk of loss if any of our borrowers or other counterparties were to default on their obligations to us. Credit risk is resident in the majority of our assets, but primarily concentrated in the loan and securities books, as well as off-balance sheet exposures such as lending commitments, letters of credit and securities lending indemnifications.
Liquidity The risk that BNY Mellon cannot meet its cash and collateral obligations at a reasonable cost for both expected and unexpected cash flows, without adversely affecting daily operations or financial conditions. Liquidity risk can arise from cash flow mismatches, market constraints from the inability to convert assets to cash, the inability to raise cash in the markets, deposit run-off or contingent liquidity events.
Model The potential loss arising from incorrectly designing / applying an estimation approach or inaccuracies caused by market, credit or liquidity stress.
Strategic The risk arising from adverse business decisions, poor implementation of business decisions or lack of responsiveness to changes in the financial industry and operating environment. Strategic and/or business risks may also arise from the acceptance of new businesses, the introduction or modification of products, strategic finance and risk management decisions, business process changes, complex transactions, acquisitions/divestitures/joint ventures and major capital expenditures/investments.
Operational Risk
In providing a comprehensive array of products and services, we are exposed to operational risk. Operational risk may result from, but is not limited to, errors related to transaction processing, breaches of internal control systems and compliance requirements, fraud by employees or persons outside BNY Mellon or business interruption due to system failures or other events. Operational risk may also include breaches of our technology and information systems resulting from unauthorized access to confidential information or from internal or external threats, such as cyberattacks. Operational risk also includes potential legal or regulatory actions that could arise. In the case of an operational event, we could suffer financial losses as well as reputational damage.
To address these risks, we maintain comprehensive policies and procedures and an internal control framework designed to provide a sound operational environment. These controls have been designed to manage operational risk at appropriate levels given our financial strength, the business environment and markets in which we operate, and the nature of our businesses, and considering factors such as competition and regulation.
The organizational framework for operational risk is based upon a strong risk culture that incorporates both governance and risk management activities comprising:
• Accountability of Businesses – Business managers are responsible for maintaining an effective system of internal controls commensurate with their risk profiles and in accordance with BNY Mellon policies and procedures.
• Corporate Operational Risk Management is the independent second line function responsible for developing risk management policies and tools for assessing, measuring, monitoring and managing operational risk for BNY Mellon. The primary objectives of the Operational Risk Management Framework are to promote effective risk management, identify emerging risks and drive continuous improvement in controls and to optimize capital.
• Technology risk is a subset of operational risk. Technology Risk Management is the independent
Risk Management (continued)
58 BNY Mellon
operational risk management function that drives the development of global technology policies, controls and methods for assessing, measuring and monitoring information and technology risk for BNY Mellon. Technology Risk Management partners with the businesses to drive better understanding and a more accurate assessment of operational risks that can occur from technology operations.
• Operational resiliency is a top priority for the Company. Foundational to our enterprise resiliency strategy is the Business Services Framework, governed by the Enterprise Resiliency Office, with second line oversight from Resiliency Risk Management. Business management is accountable for maintaining effective resiliency capabilities under this framework, while Technology and Operations are responsible for successful execution in coordination with the business. Elements of the resiliency strategy include the Business Services Framework, IT Asset Management, Application transformation and Mainframe modernization, as well as Disaster Recovery Testing and Business Continuity capabilities. We are also focused on the resiliency capabilities of our most important service providers. These capabilities are intended to enable the Company to deliver services to our clients, to prevent, respond to and recover from business disruptions and threats, and embed governance and management in order to prioritize delivery of critical assets and mitigate financial, operational, business, cyber and technological risks.
We have also established procedures that are designed to ensure compliance with generally accepted conduct, ethics and business practices, which are defined in our corporate policies. These include training programs, such as for our “Code of Conduct” and “Know Your Customer” programs, and compliance training programs, such as those regarding information protection and suspicious activity reporting.
Market Risk
Our business activity tends to minimize outright our direct exposure to market risk, with such risk primarily limited to market volatility from trading activity in support of clients. More significant direct market risk is assumed in the form of interest rate and
credit spread risk within the investment portfolio both as a means for forward asset/liability management and net interest revenue generation, and also through the interest rate risk associated with BNY Mellon’s balance sheet position which is sensitive to adverse movements in interest rates.
The Company has indirect market risk exposure associated with the change in the value of financial collateral underlying securities financing and derivatives positions. The Collateral Margin Review Committee reviews and approves the standards for collateral received or paid in respect of collateralized derivative agreements and securities financing transactions.
Oversight of market risk is performed by the SRCC and the BSRC and through executive review meetings. Stress tests results for the trading portfolio are reviewed during the Markets Weekly Risk meeting, which is attended by senior managers from Risk Management, Finance and Sales and Trading. Oversight of the risk management framework associated with the Corporate Treasury and Portfolio Management functions is performed by the BSRC. Detailed aspects of this oversight are conducted by the Treasury Risk Committee, a subcommittee of the BSRC.
The Business Risk Committee for the Markets business reviews key risk and control issues and related initiatives facing all Markets lines of business. Also addressed during the Business Risk Committee meetings are trading VaR and trading stressed VaR exposures against limits.
Finally, the Risk Quantification Review Group reviews back-testing results for the Company’s VaR model.
Credit Risk
We extend direct credit in order to foster client relationships and as a method by which to generate interest income from the deposits that result from business activity. We extend and incur intraday credit exposure in order to facilitate our various processing activities.
To balance the value of our activities with the credit risk incurred in pursuing them, we set and monitor internal credit limits for activities that entail credit risk, most often on the size of the exposure and the
Risk Management (continued)
BNY Mellon 59
quality of the counterparty. For credit exposures driven by changing market rates and prices, exposure measures include an add-on for such potential changes.
We manage credit risk exposure at a counterparty, industry, country and portfolio level. Credit risk at the counterparty exposure level is managed through our credit approval system and involves four approval levels up to and including the Chief Risk Officer of the Company. The requisite approvals are based upon the size and relative risk of the aggregate exposure under consideration. The Credit Risk Group is responsible for approving the size, terms and maturity of all credit exposures, as well as the ongoing monitoring of the creditworthiness of the counterparty. In addition, it is responsible for assigning and maintaining the internal risk ratings on each exposure.
The calculation of a fundamental credit measure is based on a projection of a statistically probable credit loss, used to help determine the appropriate loan loss reserve and to measure customer profitability. Credit loss considers three basic components: the estimated size of the exposure whenever default might occur, the probability of default before maturity and the severity of the loss we would incur, commonly called “loss given default.” For institutional lending, where most of our credit risk is created, unfunded commitments are assigned a usage given default percentage. Borrowers/counterparties are assigned ratings by Credit Portfolio Managers on an 18-grade scale, which translate to a scaled probability of default. Additionally, transactions are assigned loss given default ratings (on a 5-grade scale) that reflect the transactions’ structures, including the effects of guarantees, collateral and relative seniority of position.
The Risk and Compliance Modeling and Analytics Group is responsible for the calculation methodologies and the estimates of the inputs used in those methodologies for the determination of expected loss. These methodologies and input estimates are regularly evaluated to ensure their appropriateness and accuracy. As new techniques and data become available, the Risk and Compliance Modeling and Analytics Group attempts to incorporate, where appropriate, those techniques or data.
BNY Mellon seeks to limit both on- and off-balance sheet credit risk through prudent underwriting and the use of capital only where risk-adjusted returns warrant. We seek to manage risk and improve our portfolio diversification through syndications, asset sales, credit enhancements and active collateralization and netting agreements. In addition, we have a separate Credit Risk Review Group, which is an independent group within Internal Audit, made up of experienced loan review officers who perform timely reviews of the loan files and credit ratings assigned to the loans.
Liquidity Risk
Adequate liquidity is vital to BNY Mellon’s ability to process payments as well as settle and clear transactions on behalf of clients. The Company’s liquidity position can be affected by multiple factors, including funding mismatches, market conditions that impact our ability to convert our investment portfolio to cash, inability to issue debt or roll over funding, run-off of core deposits, and contingent liquidity events such as additional collateral posting requirements. Additionally, a downgrade in our credit rating can not only lead to deposit outflows, which is a major source of our funding, but also increase our margin requirements on secured transactions and have a broader adverse impact on our overall brand that may further impair our ability to refinance maturing liabilities. Changes in economic conditions or exposure to other risks can also affect our liquidity.
ALCO is responsible for appropriately executing Board-approved strategies, policies and procedures for managing liquidity. Senior management is responsible for regularly reporting the liquidity position of the Company to the Board of Directors. The Board of Directors approves liquidity risk tolerance and is responsible for oversight of liquidity risk management of the Company. The BSRC provides governance over independent Risk oversight of liquidity risks associated with assets and liabilities, and establishes related control frameworks. The Treasury Risk Committee, which is chaired by independent risk management, validates and approves internal stress testing methodologies and assumptions, and an independent Liquidity Risk function is responsible for providing ongoing review and oversight of liquidity risk management.
Risk Management (continued)
60 BNY Mellon
BNY Mellon actively manages and monitors its cash position, quality of the investment portfolio, intraday liquidity positions and potential liquidity needs in order to support the timely payment and settlement of obligations under both normal and stressed conditions. The Company adheres to a range of stress testing measures to maintain sufficient liquidity relative to risk appetite, including the Liquidity Coverage Ratio and Internal Liquidity Stress Testing.
Model Risk
Models create the infrastructure for managing risk. Among their multiple functions, models help us value securities, rate the credit quality of obligors, establish capital needs and monitor liquidity trends. Model risk incidents could result from faulty design, misuse, or environmental conditions that invalidate our assumptions or otherwise make the model unfit for purpose. When this happens, the Company could be exposed to losses and other adverse consequences resulting from operational, market, credit and liquidity risk, as well as reputational harm. We aim to maintain a low-risk environment.
BNY Mellon’s processes are designed to identify the conditions under which model risk incidents will occur and to establish controls that are designed to minimize or prevent loss in the event of a model risk incident. These processes include enforcement of standards for developing models, a process to validate new models and review the changes to existing models, as well as monitoring of performance throughout a model’s life.
The Enterprise Model Risk Committee, which is chaired by independent risk management, is responsible for executing Board-approved strategies, policies, and procedures for managing models. Senior management is responsible for regularly reporting on the Company’s modeling infrastructure to the Risk Committee of the Board of Directors. The Board of Directors approves risk tolerances and is responsible for oversight.
When monitoring model risk, we evaluate multiple dimensions including the quality of design, the robustness of controls, and indications of underperformance. Based on these measures, we create an overall metric that is intended to measure the health of the Company’s modeling environment and set thresholds around it. This allows us to manage model risk, not only at the level of the individual model, but also in aggregate, across all the Company’s businesses.
Strategic Risk
Our strategy includes, but is not limited to, improving organic growth across our businesses, driving quality solutions and operating efficiencies, and expanding technology-enabled solutions. Successful realization of our strategy requires that we provide expertise and insight through market-leading solutions that drive economies of scale and attract, develop and retain highly talented people capable of executing our strategy, while protecting our sound and stable financial profile. We must understand and meet market and client expectations with suitable products and offerings that are financially viable and scalable and that integrate into our business model. Failure to do so could impact both our growth strategy and our ability to service our existing clients, resulting in potential financial loss or litigation.
Changes in the markets in which we and our clients operate can evolve quickly. The introduction of new or disruptive technologies, geopolitical events and slowing economies are examples of events that can produce market uncertainty. Failure to either anticipate or participate in transformational change within a given market or appropriately and promptly react to market conditions or client preferences could result in poor strategic positioning and potential negative financial impact. While it is essential that we continue to innovate and respond to changing markets and client demand, we must do so in a manner that does not affect our financial position or jeopardize our fundamental business strategy.
Risk Management (continued)
BNY Mellon 61
Evolving Regulatory Environment
BNY Mellon engages in banking, investment advisory and other financial activities in the U.S. and 34 other countries, and is subject to extensive regulation in the jurisdictions in which it operates. Global supervisory authorities generally are charged with ensuring the safety and soundness of financial institutions, protecting the interests of customers, including depositors in banking entities and investors in mutual funds and other pooled vehicles, safeguarding the integrity of securities and other financial markets and promoting systemic resiliency and financial stability in the relevant country. They are not, however, generally charged with protecting the interests of our shareholders or non-depositor creditors. This discussion outlines the material elements of selected laws and regulations applicable to us. The impact of certain other laws and regulations, such as tax law, is discussed elsewhere in this Annual Report. Changes in these standards, or in their application, cannot be predicted, but may have a material effect on our businesses and results of operations.
The financial services industry has been the subject of enhanced regulatory oversight in the past decade globally, and this enhanced oversight environment is likely to continue in the future. Our businesses have been subject to a significant number of global reform measures.
Political developments have resulted and may continue to result in legislative and regulatory changes to key aspects of the Dodd-Frank Act and its implementing regulations.
Pandemic-Related Measures
The Coronavirus Aid, Relief, and Economic Security Act (the “CARES Act”)
On March 27, 2020, the CARES Act was enacted. The CARES Act provides economic stimulus and emergency relief to address the effects of the coronavirus pandemic. The CARES Act permits financial institutions, subject to certain conditions, to elect to temporarily suspend (i) U.S. GAAP requirements with respect to loan modifications related to the coronavirus pandemic that would otherwise be treated as troubled debt restructurings (“TDRs”) and (ii) any determination that a loan modified as a result of the coronavirus pandemic is a
TDR. These relief measures were extended until the earlier of 60 days after the national emergency termination date or Jan. 1, 2022. For more information regarding how the Company elected to apply these relief measures see “Note 1 of the Notes to Consolidated Financial Statements – Troubled debt restructurings/loan modifications.”
Money Market Mutual Fund Liquidity Facility
On March 18, 2020, the Federal Reserve announced the establishment of the MMLF, which is designed to provide indirect liquidity to money market mutual funds (“MMMFs”) so that such MMMFs can meet the demands for redemptions by households and businesses. Under the terms of the MMLF, the Federal Reserve Bank of Boston may make loans to U.S. depository institutions, BHCs and their U.S. broker-dealer subsidiaries and other eligible financial institutions (“borrowers”) subject to certain terms and conditions. Among other terms and conditions, such loans must be secured by certain high-quality short-dated debt instruments purchased by the borrowers from qualifying MMMFs promptly before the loans are extended. The MMLF’s termination date has been extended until March 31, 2021.
Capital, Liquidity and Total Loss-Absorbing Capacity Relief
During the course of 2020, the banking regulators took a series of regulatory actions to encourage banks to deploy capital and liquidity to support businesses and individuals affected by the pandemic. In March, the Federal Reserve issued a statement encouraging banking organizations to use their capital and liquidity buffers to support lending to individuals and businesses affected by the coronavirus pandemic. To facilitate banking organizations’ use of the buffers, the Federal Reserve, the Federal Deposit Insurance Corporation (“FDIC”) and the Office of the Comptroller of the Currency (“OCC”) (together the “Agencies”) issued an interim final rule revising the definition of “eligible retained income” which was finalized in August 2020. To the extent a banking organization’s capital buffer is less than 100%, its distributions and discretionary bonus payments are constrained by the amount of the shortfall and its eligible retained income. The definition of eligible retained income, as previously defined, created the potential for sudden and severe limitations on capital distributions. Under the final rule, eligible retained income is defined as the greater of (i) a banking
Supervision and Regulation
62 BNY Mellon
organization’s net income for the four preceding calendar quarters, net of any distributions and associated tax effects not already reflected in net income, and (ii) the average of a banking organization’s net income over the preceding four quarters. The Federal Reserve made corresponding changes to the definition of “eligible retained income” in the TLAC buffer requirements.
In March 2020, the Agencies issued an interim final rule to exclude non-recourse exposures acquired as part of the MMLF from a banking organization’s total leverage exposure, average total consolidated assets, Advanced Approaches total RWAs and Standardized total RWAs. The rule was finalized in September 2020. The relief applies to assets purchased beginning on March 19, 2020, including assets purchased by BNY Mellon and pledged as eligible collateral in connection with BNY Mellon’s participation in the MMLF. In addition, in May 2020, the Agencies issued an interim final rule to neutralize the LCR effects of the advances made by the MMLF and the exposures securing MMLF advances, which was finalized in September.
Also in March 2020, the Agencies issued an interim final rule permitting banking organizations to temporarily delay the estimated effects of the Current Expected Credit Loss (“CECL”) accounting standard on regulatory capital until Jan. 1, 2022 and then to phase-in those effects through Jan. 1, 2025. The rule was finalized in August 2020. Under the final rule, during 2020 and 2021, the adjustment to CET1 capital reflects the change in retained earnings upon adoption of CECL at Jan. 1, 2020 plus 25% of the increase in the allowance for credit losses since Jan. 1, 2020. BNY Mellon did not elect to apply this rule. See Notes 2 and 5 of the Notes to Consolidated Financial Statements for additional information on the impact of the adoption of CECL and the change in the allowance for credit losses during 2020.
On April 1, 2020, the Federal Reserve issued an interim final rule to temporarily exclude from the calculation of the SLR of BHCs, such as the Parent, on-balance sheet amounts of U.S. Treasury securities and deposits at Federal Reserve Banks beginning with the second quarter of 2020. The interim final rule will remain in effect through March 31, 2021. See “Capital” for additional information.
Enhanced Prudential Standards
The Federal Reserve has adopted rules (“SIFI Rules”) to implement liquidity requirements, capital stress testing and overall risk management requirements affecting U.S. systemically important financial institutions (“SIFIs”). BNY Mellon must comply with enhanced liquidity and overall risk management standards, which include maintenance of a buffer of highly liquid assets based on projected funding needs for 30 days. The liquidity buffer is in addition to the rules regarding the LCR and net stable funding ratio (“NSFR”), discussed below, and is described by the Federal Reserve as being “complementary” to these liquidity standards.
Single Counterparty Credit Limits
On June 14, 2018, the Federal Reserve approved a final rule imposing single-counterparty credit limits (“SCCLs”) on, among other organizations, domestic BHCs, including BNY Mellon, that are G-SIBs. The SCCLs apply to the credit exposure of a covered firm and all of its subsidiaries to a single counterparty and all of its affiliates and connected entities. The rule became applicable to BNY Mellon on Jan. 1, 2020.
The final rule established two primary credit exposure limits: (i) a covered domestic BHC may not have aggregate net credit exposure to any unaffiliated counterparty in excess of 25% of its Tier 1 capital; and (ii) a U.S. G-SIB is further prohibited from having aggregate net credit exposure in excess of 15% of its Tier 1 capital to any “major counterparty” (defined as a G-SIB or a nonbank SIFI).
BNY Mellon has been in compliance with the two primary exposure limits since the Jan. 1, 2020 effective date based on the daily monitoring process we have established. The final rule provides a cure period of 90 days (or, with prior notice from the Federal Reserve, a longer or shorter period) for breaches of the SCCL rule. During the cure period, a company may not engage in additional credit transactions with the particular counterparty unless the company has obtained a temporary credit exposure limit increase from the Federal Reserve.
Supervision and Regulation (continued)
BNY Mellon 63
Capital Planning and Stress Testing
Payment of Dividends, Stock Repurchases and Other Capital Distributions
The Parent is a legal entity separate and distinct from its banks and other subsidiaries. Therefore, the Parent primarily relies on dividends, interest, distributions and other payments from its subsidiaries, including extensions of credit from the IHC, to meet its obligations, including its obligations with respect to its securities, and to provide funds for share repurchases and payment of common and preferred dividends to its stockholders, to the extent declared by the Board of Directors. Various federal and state laws and regulations limit the amount of dividends that may be paid to the Parent by our U.S. bank subsidiaries without regulatory consent. If, in the opinion of the applicable federal regulatory agency, a depository institution under its jurisdiction is engaged in or is about to engage in an unsafe or unsound practice (which, depending on the financial condition of the bank, could include the payment of dividends), the regulator may require, after notice and hearing, that the bank cease and desist from such practice. The Agencies have indicated that the payment of dividends would constitute an unsafe and unsound practice if the payment would reduce a depository institution’s capital to an inadequate level. Moreover, under the Federal Deposit Insurance Act, as amended (the “FDI Act”), an insured depository institution (“IDI”) may not pay any dividends if the institution is undercapitalized or if the payment of the dividend would cause the institution to become undercapitalized. In addition, the Agencies have issued policy statements which provide that FDIC-insured depository institutions and their holding companies should generally pay dividends only out of their current operating earnings.
In general, the amount of dividends that may be paid by our U.S. banking subsidiaries, including to the Parent, is limited to the lesser of the amounts calculated under a “recent earnings” test and an “undivided profits” test. Under the recent earnings test, a dividend may not be paid if the total of all dividends declared and paid by the entity in any calendar year exceeds the current year’s net income combined with the retained net income of the two preceding years, unless the entity obtains prior regulatory approval. Under the undivided profits test, a dividend may not be paid in excess of the entity’s “undivided profits” (generally, accumulated net
profits that have not been paid out as dividends or transferred to surplus). The ability of our bank subsidiaries to pay dividends to the Parent may also be affected by the capital adequacy standards applicable to those subsidiaries, which include minimum requirements and buffers.
There are also limitations specific to the IHC’s ability to make distributions or extend credit to the Parent. The IHC is not permitted to pay dividends to the Parent if certain key capital, liquidity and operational risk indicators are breached. Additionally, if our projected financial resources deteriorate so severely that resolution of the Parent becomes imminent, the committed lines of credit provided by the IHC to the Parent will automatically terminate, with all outstanding amounts becoming due.
BNY Mellon’s capital distributions are subject to Federal Reserve oversight. The major component of that oversight is the Federal Reserve’s CCAR, implementing its capital plan rule. That rule requires BNY Mellon to submit annually a capital plan to the Federal Reserve. We are also required to collect and report certain related data on a quarterly basis to allow the Federal Reserve to monitor progress against the annual capital plan. Generally, BNY Mellon and other affected BHCs pay dividends, repurchase stock and make other capital distributions in accordance with a capital plan that has been reviewed by the Federal Reserve.
On March 4, 2020, the Federal Reserve finalized an SCB rule, which made changes to the capital plan rule. The SCB rule eliminated the quantitative grounds for objection to a firm’s CCAR capital plan and introduced an SCB that became part of quarterly capital requirements of CCAR firms on Oct. 1, 2020. The final rule replaced the 2.5% capital conservation buffer with an SCB requirement for capital ratios under the U.S. capital rules’ standardized approach risk-weightings framework (“Standardized Approach”) that is based on the largest projected decrease in a firm’s CET1 ratio in the nine-quarter CCAR supervisory severely adverse scenario plus four quarters of planned common stock dividends as percentage of RWAs. The SCB is subject to a 2.5% floor. Each CCAR firm, including BNY Mellon, will be notified of its SCB by June 30, and the SCB will become effective on October 1 of the applicable calendar year. In August 2020, the Federal Reserve announced BNY Mellon’s SCB requirement of 2.5%, which equals the regulatory floor. The SCB rule
Supervision and Regulation (continued)
64 BNY Mellon
requires that firms reduce their planned capital actions if those distributions would cause the firm to fall below applicable buffer requirements based on the firm’s own baseline scenario projections and allows firms to increase certain planned capital distributions if they are forecasted to be above capital buffer constraints. The SCB rule also eliminates the requirement for prior approval of capital distributions in excess of the distributions in a firm’s capital plan, provided that such distributions do not cause a breach of the firm’s capital ratios, including applicable buffers. In addition, the SCB rule provides that a firm must receive prior approval for any dividend, stock repurchase or other capital distribution, other than a capital distribution on a newly issued capital instrument, if a firm is required to resubmit its capital plan. See “Capital” for information about our 2020 capital plan.
In light of the changes in the financial markets and the economy as a result of the pandemic, the Federal Reserve required that all banking institutions subject to CCAR, including BNY Mellon, resubmit their capital plans by Nov. 2, 2020. The Federal Reserve has stated that it expects to conclude the review of the resubmitted capital plans in early 2021.
In addition, for the third and fourth quarters of 2020, the Federal Reserve permitted all CCAR firms, including BNY Mellon, only to repurchase stock in connection with employee benefit plans; pay common stock dividends that did not exceed an amount equal to the average of the Company’s net income for the four preceding calendar quarters, provided that the common stock dividend was not increased; and make scheduled payments on additional Tier 1 and Tier 2 capital instruments. For the first quarter of 2021, the Federal Reserve has generally authorized CCAR firms, including BNY Mellon, to repurchase stock in connection with employee benefit plans; pay common stock dividends that do not exceed the amount paid in the second quarter of 2020; pay dividends and make share repurchases that, in the aggregate, do not exceed an amount equal to the firm’s average net income for the four preceding quarters; and redeem and make scheduled payments on additional Tier 1 and Tier 2 capital instruments.
Regulatory Stress-Testing Requirements
In addition to the CCAR stress testing requirements, Federal Reserve regulations also include complementary Dodd-Frank Act Stress Tests
(“DFAST”). The CCAR and DFAST requirements substantially overlap, and the Federal Reserve implements them at the BHC level on a coordinated basis. Under these DFAST regulations, as revised in 2019 pursuant to the Economic Growth, Regulatory Relief, and Consumer Protection Act (the “Reform Act”), we are required to undergo an annual regulatory stress test conducted by the Federal Reserve. We are also required to conduct an annual company-run stress test. In addition, The Bank of New York Mellon is required to conduct an annual company-run stress test (although the bank is permitted to combine certain reporting and disclosure of its stress test results with the results of BNY Mellon). Results from our annual company-run stress tests are reported to the appropriate regulators and published.
In connection with the 2020 annual stress test exercise, the Federal Reserve conducted sensitivity analyses to assess additional risks posed by the pandemic and conducted a second stress test exercise in the fourth quarter of 2020. The Federal Reserve published the results of its initial 2020 stress test, including the additional sensitivity analyses, on June 25, 2020 and published the results of the fourth-quarter stress test on Dec. 18, 2020. We published the results of our most recent annual company-run stress test on June 25, 2020.
Capital Requirements – Generally
As a BHC, we are subject to U.S. capital rules, administered by the Federal Reserve. Our bank subsidiaries are subject to similar capital requirements administered by the Federal Reserve in the case of The Bank of New York Mellon and by the OCC, in the case of our national bank subsidiaries, BNY Mellon, N.A. and The Bank of New York Mellon Trust Company, National Association. These requirements are intended to ensure that banking organizations have adequate capital given the risk levels of their assets and off-balance sheet exposures.
Notwithstanding the detailed U.S. capital rules, the federal banking agencies retain significant discretion to set higher capital requirements for categories of BHCs or banks or for an individual BHC or bank as situations warrant.
Supervision and Regulation (continued)
BNY Mellon 65
U.S. Capital Rules – Minimum Risk-Based Capital Ratios and Capital Buffers
The U.S. capital rules require banking organizations subject to the advanced approaches risk-weighting framework (the “Advanced Approaches”), such as BNY Mellon, to satisfy minimum risk-based capital ratios using both the Standardized Approach and the Advanced Approaches. See “Capital” for details on these requirements. In addition, for CCAR firms, these minimum ratios are supplemented by (i) the SCB (which, for BNY Mellon, is 2.5%, as noted), in the case of a firm’s Standardized Approach capital ratios, and (ii) a capital conservation buffer of 2.5%, in the case of a firm’s Advanced Approaches capital ratios. The capital conservation buffer can only be satisfied with CET1 capital.
When systemic vulnerabilities are meaningfully above normal, the SCB and capital conservation buffer may be expanded up to an additional 2.5% through the imposition of a countercyclical capital buffer. For internationally active banks such as BNY Mellon, the countercyclical capital buffer required threshold is a weighted average of the countercyclical capital buffers deployed in each of the jurisdictions in which the bank has private sector credit exposures. The Federal Reserve, in consultation with the OCC and FDIC, has affirmed the current countercyclical capital buffer level for U.S. exposures of 0% and noted that any future modifications to the buffer would generally be subject to a 12-month phase-in period. Any countercyclical capital buffer required threshold arising from exposures outside the United States will also generally be subject to a 12-month phase-in period.
For G-SIBs, like BNY Mellon, the U.S. capital rules’ buffers are also supplemented by a G-SIB risk-based capital surcharge, which is the higher of the surcharges calculated under two methods (referred to as “method 1” and “method 2”). The first method is based on the Basel Committee on Banking Supervision (“BCBS”) framework and considers a G-SIB’s size, interconnectedness, cross-jurisdictional activity, substitutability and complexity. The second method uses similar inputs, but is calibrated to result in significantly higher surcharges and replaces substitutability with a measure of reliance on short-term wholesale funding. The G-SIB surcharge applicable to BNY Mellon for 2020 was 1.5%.
U.S. Capital Rules – Deductions from and Adjustments to Capital Elements
The U.S. capital rules provide for a number of deductions from and adjustments to CET1 capital. These include, for example, providing that unrealized gains and losses on all available-for-sale debt securities may not be filtered out for regulatory capital purposes, and the requirement that deferred tax assets dependent upon future taxable income and significant investments in non-consolidated financial entities be deducted from CET1 to the extent that any one such category exceeds 10% of CET1 or all such categories in the aggregate exceed 15% of CET1.
In addition, in October 2020, the Agencies finalized a rule that generally requires certain Advanced Approaches banking organizations, including BNY Mellon, to deduct from Tier 2 capital, subject to certain exceptions, direct, indirect and synthetic exposures to covered debt instruments, including TLAC instruments. The rule is effective on April 1, 2021. The impact of the final rule is not expected to be material to BNY Mellon.
U.S. Capital Rules – Advanced Approaches Risk-Based Capital Rules
Under the U.S. capital rules’ Advanced Approaches framework, credit risk risk-weightings are generally based on risk-sensitive approaches that largely rely on the use of internal credit models and parameters, whereas under the Standardized Approach credit risk risk-weightings are generally based on supervisory risk-weightings which vary primarily by counterparty type and asset class. BNY Mellon is required to comply with Advanced Approaches reporting and public disclosures. For purposes of determining whether we meet minimum risk-based capital requirements under the U.S. capital rules, our CET1 ratio, Tier 1 capital ratio, and total capital ratio is the lower of each ratio as calculated under the Standardized Approach and under the Advanced Approaches framework.
U.S. Capital Rules – Standardized Approach
The Standardized Approach calculates risk-weighted assets in the denominator of capital ratios using a broad array of risk-weighting categories that are intended to be risk sensitive. The risk-weights for the Standardized Approach generally range from 0% to 1,250%. Higher risk-weights under the Standardized
Supervision and Regulation (continued)
66 BNY Mellon
Approach apply to a variety of exposures, including certain securitization exposures, equity exposures, claims on securities firms and exposures to counterparties on OTC derivatives.
Securities finance transactions, including transactions in which we serve as agent and provide securities replacement indemnification to a securities lender, are treated as repo-style transactions under the U.S. capital rules. The rules do not permit a banking organization to use a simple VaR approach to calculate exposure amounts for repo-style transactions or to use internal models to calculate the exposure amount for the counterparty credit exposure for repo-style transactions under the Standardized Approach (although these methodologies are allowed in the Advanced Approaches). Under the Standardized Approach, a banking organization may use a collateral haircut approach to recognize the credit risk mitigation benefits of financial collateral that secures a repo-style transaction, including an agented securities lending transaction, among other transactions. To apply the collateral haircut approach, a banking organization must determine the exposure amount and the relevant risk weight for the counterparty and collateral posted.
Leverage Ratios
The U.S. capital rules require a minimum 4% leverage ratio for all banking organizations, as well as a 3% Basel III-based SLR for Advanced Approaches banking organizations, including BNY Mellon. Unlike the Tier 1 leverage ratio, the SLR includes certain off-balance sheet exposures in the denominator, including the potential future credit exposure of derivative contracts and 10% of the notional amount of unconditionally cancelable commitments.
The U.S. G-SIBs (including BNY Mellon) are subject to an enhanced SLR, which requires us to maintain an SLR of greater than 5% (composed of the current minimum requirement of 3% plus a greater than 2% buffer) and requires bank subsidiaries of those BHCs to maintain at least a 6% SLR in order to qualify as “well capitalized” under the prompt corrective action regulations discussed below. At Dec. 31, 2020, our SLR was 8.6% and the SLR for our primary banking subsidiary, The Bank of New York Mellon, was 8.5%.
Pursuant to the Reform Act, on Nov.19, 2019, the Agencies finalized a rule to exclude certain central bank deposits from the total leverage exposure, the SLR denominator, and related TLAC and LTD measures of custody banks, including BNY Mellon and The Bank of New York Mellon. Under the final rule, qualifying central banks include a Federal Reserve Bank, the European Central Bank or a central bank of a member country of the Organisation for Economic Co-operation and Development (“OECD”), provided that an exposure to the OECD member country receives a zero percent risk-weighting and the sovereign debt of such country is not, and has not been, in default in the past five years. The central bank deposit exclusion from the SLR denominator equals the average daily balance over the applicable quarter of all deposits placed with a qualifying central bank up to an amount equal to the on-balance sheet deposit liabilities that are linked to fiduciary or custodial and safekeeping accounts. The rule came into effect on April 1, 2020. See “Capital, Liquidity and TLAC relief” above for a discussion of temporary amendments to the SLR as part of the Federal Reserve pandemic-related actions.
On April 11, 2018, the Federal Reserve and the OCC issued a joint notice of proposed rule-making that would recalibrate the enhanced SLR standards that apply to U.S. G-SIBs and certain of their IDI subsidiaries. The proposed rule would replace the 2% SLR buffer that currently applies to all U.S. G-SIBs with a buffer equal to 50% of the firm’s risk-based G-SIB surcharge.
For IDI subsidiaries of U.S. G-SIBs regulated by the Federal Reserve or the OCC, the proposal would replace the current 6% SLR threshold requirement for those institutions to be considered “well capitalized” under the prompt corrective action framework with an SLR of at least 3% plus 50% of the G-SIB surcharge applicable to their top-tier holding companies. The proposed rule would also make corresponding changes to the TLAC SLR buffer and LTD requirements for U.S. G-SIBs. The Federal Reserve and OCC have not yet issued a final rule.
BCBS Revisions to Components of Basel III
In December 2017, the BCBS released revisions to Basel III intended to reduce variability of RWA and improve the comparability of banks’ risk-based capital ratios. Among other measures, the final revisions: (i) establish a revised Standardized
Supervision and Regulation (continued)
BNY Mellon 67
Approach for credit risk that enhances the Standardized Approach’s granularity and risk sensitivity; (ii) adjust the internal ratings-based approaches for credit risk by removing the use of the advanced internal ratings-based approach for certain asset classes and establishing input floors for the calculation of RWA; (iii) replace the advanced measurement approach for operational risk with a revised Standardized Approach for operational risk based on measures of a bank’s income and historical losses; (iv) revise the leverage ratio exposure measure, establish a “leverage ratio buffer” for G-SIBs, set at 50% of a G-SIB’s risk-based capital surcharge, and allow national discretion to exclude central bank placements in limited circumstances (see “Leverage Ratios” above); and (v) introduce a new 72.5% output floor based on the Standardized Approach.
In January 2019, the BCBS released revised minimum capital requirements for market risk. While the U.S. regulators have implemented or issued proposals to implement certain aspects of these revised Basel standards, there is continuing uncertainty regarding the extent to which and manner in which the U.S. regulators will implement them.
Standardized Approach for Measuring Counterparty Credit Risk Exposures
On Nov. 19, 2019, the Agencies jointly issued a final rule, which amends the U.S. capital rules to implement a new approach for calculating the exposure amount for derivative contracts, which is called the Standardized Approach for Counterparty Credit Risk (“SA-CCR”). The final rule also incorporates SA-CCR into the determination of exposure amount of derivatives for total leverage exposure under the SLR and the cleared transaction framework under the U.S. capital rules. The mandatory compliance date of the SA-CCR rule for the Advanced Approaches firms is Jan. 1, 2022.
Total Loss-Absorbing Capacity
The Federal Reserve imposes external TLAC and related requirements for U.S. G-SIBs, including BNY Mellon, at the top-tier holding company.
U.S. G-SIBs are required to maintain a minimum eligible external TLAC equal to the greater of (i) 18% of RWAs plus a buffer (to be met using only CET1) equal to the sum of 2.5% of RWAs, the G-SIB
surcharge calculated under method 1 and any applicable countercyclical buffer; and (ii) 7.5% of their total leverage exposure (the denominator of the SLR) plus a buffer (to be met using only Tier 1 Capital) equal to 2%.
U.S. G-SIBs are also required to maintain minimum external eligible LTD equal to the greater of (i) 6% of RWAs plus the G-SIB surcharge (calculated using the greater of method 1 and method 2), and (ii) 4.5% of total leverage exposure. In order to be deemed eligible LTD, debt instruments must, among other requirements, be unsecured, not be structured notes, and have a maturity of at least one year from the date of issuance. In addition, LTD issued on or after Dec. 31, 2016 must (i) not have acceleration rights, other than in the event of non-payment or the bankruptcy or insolvency of the issuer and (ii) be governed by U.S. law. However, debt issued by a U.S. G-SIB prior to Dec. 31, 2016 is permanently grandfathered to the extent these securities would be ineligible only due to containing impermissible acceleration rights or being governed by foreign law.
Further, the top-tier holding companies of U.S. G-SIBs are not permitted to issue certain guarantees of subsidiary liabilities, incur liabilities guaranteed by subsidiaries, issue short-term debt to third parties, or enter into derivatives and certain other financial contracts with external counterparties. Certain liabilities are capped at 5% of the value of the U.S. G-SIB’s eligible external TLAC instruments. The Federal Reserve considered requiring internal TLAC at domestic subsidiaries of U.S. G-SIBs, but has not proposed rules regarding these instruments.
Foreign jurisdictions may impose internal TLAC requirements on the foreign subsidiaries of U.S. G-SIBs. The European Union’s Capital Requirements Regulation 2 (“CRR2”) requires EU material subsidiaries of non-EU G-SIBs (including BNY Mellon) to maintain a minimum level of internal loss absorbing capacity. The Bank of New York Mellon SA/NV (“BNY Mellon SA/NV”) is considered an EU material subsidiary for purposes of this regulation and has an internal TLAC requirement.
Prompt Corrective Action
The FDI Act, as amended by the Federal Deposit Insurance Corporation Improvement Act of 1991 (“FDICIA”), requires the Agencies to take “prompt corrective action” in respect of depository institutions
Supervision and Regulation (continued)
68 BNY Mellon
that do not meet specified capital requirements. FDICIA establishes five capital categories for FDIC-insured banks: “well capitalized,” “adequately capitalized,” “undercapitalized,” “significantly undercapitalized,” and “critically undercapitalized.” The FDI Act imposes progressively more restrictive constraints on operations, management and capital distributions the less capital the institution holds. While these regulations apply only to banks, such as The Bank of New York Mellon and BNY Mellon, N.A., the Federal Reserve is authorized to take appropriate action against the parent BHC, such as the Parent, based on the under-capitalized status of any banking subsidiary. In certain circumstances, the Parent would be required to guarantee the performance of the capital restoration plan if one of our banking subsidiaries were undercapitalized.
The federal banking agencies’ prompt corrective action framework (“PCA rules”) contain “well capitalized” thresholds for IDIs. Under these rules, an IDI must have the capital ratios as detailed in the “Capital” disclosure in order to satisfy the quantitative ratio requirements to be deemed “well capitalized.”
Liquidity Standards – Basel III and U.S. Rules
BNY Mellon is subject to the U.S. LCR Rule, which is designed to ensure that BNY Mellon and certain domestic bank subsidiaries maintain an adequate level of unencumbered HQLA equal to their expected net cash outflow for a 30-day time horizon under an acute liquidity stress scenario. As of Dec. 31, 2020, the Parent and its domestic bank subsidiaries were in compliance with applicable LCR requirements.
On Oct. 20, 2020, the Agencies issued a final NSFR rule that implements a quantitative long-term liquidity requirement applicable to large and internationally active banking organizations, including BNY Mellon. Under the final rule, BNY Mellon’s NSFR will be expressed as a ratio of its available stable funding to its required stable funding amount, and BNY Mellon will be required to maintain an NSFR of 1.0. The effective date of the final NSFR rule is July 1, 2021, with the exception of certain disclosure requirements, which will begin to apply in 2023. BNY Mellon expects to be in compliance with the NSFR rule by the effective date.
Separately, as noted above, the SIFI Rules impose additional liquidity requirements for BHCs with $100
billion or more in total assets, including BNY Mellon, including an independent review of liquidity risk management; establishment of cash flow projections; a contingency funding plan, and liquidity risk limits; liquidity stress testing under multiple stress scenarios and time horizons tailored to the specific products and profile of the company; and maintenance of a liquidity buffer of unencumbered highly liquid assets sufficient to meet projected net cash outflows over 30 days under a range of stress scenarios.
Volcker Rule
The provisions of the Dodd-Frank Act commonly referred to as the “Volcker Rule” prohibit “banking entities,” including BNY Mellon, from engaging in proprietary trading and limit our sponsorship of, and investments in, private equity and hedge funds (“covered funds”), including our ability to own or provide seed capital to covered funds. In addition, the Volcker Rule restricts us from engaging in certain transactions with covered funds (including, without limitation, certain U.S. funds for which BNY Mellon acts as both sponsor/manager and custodian). These restrictions are subject to certain exceptions.
The restrictions concerning proprietary trading contain limited exceptions for, among other things, bona fide liquidity risk management and risk-mitigating hedging activities, as well as certain classes of exempted instruments, including government securities. Ownership interests in covered funds are generally limited to 3% of the total number or value of the outstanding ownership interests of any individual fund at any time more than one year after the date of its establishment. The aggregate value of all such ownership interests in covered funds is limited to 3% of the banking organization’s Tier 1 capital, and such interests are subject to a deduction from its Tier 1 capital. The 2019 amendments to the Volcker Rule (discussed below) remove the requirements that ownership interests in third-party covered funds held under the underwriting and market-making exemptions be subject to the aggregate limit and capital deduction, but preserve these requirements for ownership interests in covered funds sponsored or organized by BNY Mellon.
The Volcker Rule regulations also require us to develop and maintain a compliance program.
Supervision and Regulation (continued)
BNY Mellon 69
In 2019, the Agencies, the Commodity Futures Trading Commission (“CFTC”) and the Securities and Exchange Commission (the “SEC”) modified the regulations implementing the Volcker Rule. The most impactful aspects of the revisions with respect to BNY Mellon concern the compliance requirements applicable to institutions with moderate exposure to trading assets and trading liabilities, which are institutions with less than $20 billion and more than $1 billion of trading assets and trading liabilities. Specifically, among other revisions, such “moderate trading” banks are no longer required to file an annual CEO attestation and quantitative metrics. Furthermore, the comprehensive six-pillar compliance program associated with the Volcker Rule will no longer apply to “moderate trading” banks; rather, such banks are permitted to tailor their compliance programs to the size and nature of their activities. BNY Mellon is treated as a “moderate trading” bank under the revised Volcker Rule. The final revisions also clarified and amended certain definitions, requirements and exemptions. The mandatory compliance date of the final rule was Jan. 1, 2021.
On June 25, 2020, a second set of amendments to the Volcker Rule was released, which is principally focused on the restrictions on banking entities’ investments in, sponsorship of, and other relationships with covered funds. Generally, the changes establish new exclusions from the covered fund definition for certain types of investment vehicles, modify the eligibility criteria for certain existing exclusions, and clarify and modify other provisions with respect to investment in, sponsoring of and transactions with covered funds. The amendments became effective on Oct. 1, 2020.
Derivatives
Title VII of the Dodd-Frank Act imposes a comprehensive regulatory structure on the OTC derivatives markets in which BNY Mellon operates, including requirements relating to the business conduct of dealers, trade reporting, margin and recordkeeping. Title VII also requires persons acting as swap dealers, including The Bank of New York Mellon, to register with the CFTC and become subject to the CFTC’s supervisory, examination and enforcement powers.
In addition, because BNY Mellon is subject to supervision by the Federal Reserve, we must comply
with the U.S. prudential margin rules for variation and initial margin with respect to its OTC swap transactions. Furthermore, various BNY Mellon subsidiaries are also subject to OTC derivatives regulation by local authorities in Europe and Asia.
SEC Rules on Mutual Funds
SEC regulations impose requirements on mutual funds, exchange-traded funds and other registered investment companies. Among other things, these rules require mutual funds (other than money market funds) to provide portfolio-wide and position-level holdings data to the SEC on a monthly basis.
The regulations also impose liquidity risk management requirements that are intended to reduce the risk that funds will not be able to meet shareholder redemptions and to minimize the impact of redemptions on remaining shareholders.
Recovery and Resolution Planning
As required by the Dodd-Frank Act, large financial institutions such as BNY Mellon are required to submit periodically to the Federal Reserve and the FDIC a plan – referred to as the 165(d) resolution plan – for its rapid and orderly resolution in the event of material financial distress or failure. In addition, certain large IDIs, such as The Bank of New York Mellon are required to submit periodically to the FDIC a separate plan for resolution in the event of the institution’s failure. The public portions of these resolution plans are available on the Federal Reserve’s and FDIC’s websites. BNY Mellon also maintains a comprehensive recovery plan, which describes actions it could take to avoid failure if faced with financial stress.
In October 2019, the Federal Reserve and FDIC issued a final rule modifying certain requirements for the 165(d) resolution plan. The final rule requires U.S. G-SIBs, such as BNY Mellon, to file alternating full and more limited, targeted resolution plans every two years. BNY Mellon’s next targeted resolution plan is due on July 1, 2021, followed by a full resolution plan submission due on July 1, 2023. The final rule does not materially modify the components or informational requirements of full resolution plans.
If the Federal Reserve and FDIC jointly determine that our 165(d) resolution plan is not credible and we fail to address the deficiencies in a timely manner, the
Supervision and Regulation (continued)
70 BNY Mellon
FDIC and the Federal Reserve may jointly impose more stringent capital, leverage or liquidity requirements or restrictions on our growth, activities or operations. If we continue to fail to adequately remedy any deficiencies, we could be required to divest assets or operations that the regulators determine necessary to facilitate our orderly resolution.
The resolution strategy set out in our 165(d) resolution plan is a single point of entry strategy, whereby certain key operating subsidiaries would be provided with sufficient capital and liquidity to operate in the event of material financial stress or failure and only our parent holding company would file for bankruptcy. In connection with our single point of entry resolution strategy, we have established the IHC to facilitate the provision of capital and liquidity resources to certain key subsidiaries in the event of material financial distress or failure. In addition, we have a binding support agreement in place that requires the IHC to provide that support. The support agreement required the Parent to transfer its intercompany loans and most of its cash to the IHC, and requires the Parent to continue to transfer cash and other liquid financial assets to the IHC on an ongoing basis.
BNY Mellon and the other U.S. G-SIBs are also subject to heightened supervisory expectations for recovery and resolution preparedness under Federal Reserve rules and guidance. The Federal Reserve incorporates reviews of our capabilities in respect of recovery and resolution preparedness as part of its ongoing supervision of BNY Mellon.
In the European Economic Area (“EEA”), the European Union Bank Recovery and Resolution Directive (“BRRD”) provides the legal framework for recovery and resolution planning, including a set of harmonized powers to resolve or implement recovery of in-scope institutions, such as EEA subsidiaries of non-EEA banks. BRRD gives relevant EEA regulators various powers, including (i) powers to intervene pre-resolution to require an institution to take remedial steps to avoid the need for resolution; (ii) resolution tools and powers to facilitate the resolution of failing entities, such as the power to “bail-in” the debt of an institution (including certain deposit obligations); (iii) the power to require a firm to change its structure to remove impediments to resolvability; and (iv) powers to require in-scope institutions to prepare recovery plans. Under the
BRRD, resolution authorities (rather than the institutions themselves) are responsible for drawing up resolution plans based on information provided by relevant institutions.
Under BRRD, in-scope institutions are required to maintain a minimum requirement for own funds, (defined as regulatory capital), and eligible liabilities (“MREL”) that can be written down or bailed-in to absorb losses. MREL is set on a case-by-case basis for each institution subject to BRRD. MREL applies to all EU-domiciled credit institutions and certain other firms subject to BRRD.
The Bank Resolution and Recovery Directive 2 (“BRRD2”) entered into force on June 27, 2019 and is being implemented in various phases between 2019 and 2024. Effective as of Dec. 28, 2020, BRRD2 amended BRRD moratorium tools and introduced an EU-wide requirement for contractual recognition of resolution stay powers.
Some jurisdictions, including the UK, already had a requirement for contractual recognition of resolution stay powers. While the UK was a member of the EU (and during the subsequent Brexit transition period, which ended on Dec. 31, 2020 (“Brexit Transition Period”)), the UK transposed most requirements of BRRD and BRRD2 in local legislation and regulation. Although we expect the UK’s recovery and resolution regime to remain broadly aligned with the EU regime in the short-term, it is now possible for the respective regimes to diverge over time.
Rules on Resolution Stays for Qualified Financial Contracts
The Agencies’ regulations require U.S. G-SIBs (and their subsidiaries and controlled entities) and the U.S. operations of foreign G-SIBs to amend their covered qualified financial contracts (“QFCs”), thereby facilitating the application of U.S. special resolution regimes as necessary.
The regulations allow these G-SIBs to comply by amending covered QFCs (with the consent of relevant counterparties) using the International Swaps and Derivatives Association (“ISDA”) 2018 U.S. Resolution Stay Protocol (the “Protocol”), ISDA 2015 Universal Stay Protocol or by executing appropriate bilateral amendments to the covered QFCs. BNY Mellon entities which have been confirmed to engage in covered QFC activities have
Supervision and Regulation (continued)
BNY Mellon 71
adhered to the Protocol and, where necessary, have executed bilateral amendments to cover QFCs.
Cybersecurity Regulation
The New York State Department of Financial Services (“NYSDFS”) requires financial institutions regulated by NYSDFS, including BNY Mellon, to establish a cybersecurity program, adopt a written cybersecurity policy, designate a chief information security officer, and have policies and procedures in place to ensure the security of information systems and non-public information accessible to, or held by, third parties. The NYSDFS rule also includes a variety of other requirements to protect the confidentiality, integrity and availability of information systems, as well as the annual delivery of a certificate of compliance.
In December 2020, the Agencies released a proposed rule regarding notification requirements for banking organizations related to significant computer security incidents. Under the proposal, a BHC, state member bank or national bank, including BNY Mellon, The Bank of New York Mellon and BNY Mellon, N.A., would be required to notify the Federal Reserve or OCC, as applicable, within 36 hours of incidents that could result in the banking organization’s inability to deliver services to a material portion of its customer base, jeopardize the viability of key operations of the banking organization, or impact the stability of the financial sector.
Insolvency of an Insured Depository Institution or a Bank Holding Company; Orderly Liquidation Authority
If the FDIC is appointed as conservator or receiver for an IDI such as The Bank of New York Mellon or BNY Mellon, N.A., upon its insolvency or in certain other circumstances, the FDIC has the power to:
• Transfer any of the depository institution’s assets and liabilities to a new obligor, including a newly formed “bridge” bank without the approval of the depository institution’s creditors;
• Enforce the terms of the depository institution’s contracts pursuant to their terms without regard to any provisions triggered by the appointment of the FDIC in that capacity; or
• Repudiate or disaffirm any contract or lease to which the depository institution is a party, the
performance of which is determined by the FDIC to be burdensome and the disaffirmance or repudiation of which is determined by the FDIC to promote the orderly administration of the depository institution.
In addition, under federal law, the claims of holders of domestic deposit liabilities and certain claims for administrative expenses against an IDI would be afforded a priority over other general unsecured claims against such an institution, including claims of debt holders of the institution, in the “liquidation or other resolution” of such an institution by any receiver. As a result, whether or not the FDIC ever sought to repudiate any debt obligations of The Bank of New York Mellon or BNY Mellon, N.A., the debt holders would be treated differently from, and could receive, if anything, substantially less than, the depositors of the bank.
The Dodd-Frank Act created a resolution regime (known as the “orderly liquidation authority”) for systemically important financial companies, including BHCs and their affiliates. Under the orderly liquidation authority, the FDIC may be appointed as receiver for the systemically important institution, and its failed nonbank subsidiaries, for purposes of liquidating the entity if, among other conditions, it is determined that the institution is in default or in danger of default and the failure poses a risk to the stability of the U.S. financial system.
If the FDIC is appointed as receiver under the orderly liquidation authority, then the powers of the receiver, and the rights and obligations of creditors and other parties who have dealt with the institution, would be determined under the Dodd-Frank Act’s orderly liquidation authority provisions, and not under the insolvency law that would otherwise apply. The powers of the receiver under the orderly liquidation authority were based on the powers of the FDIC as receiver for depository institutions under the FDI Act. However, the provisions governing the rights of creditors under the orderly liquidation authority were modified in certain respects to reduce disparities with the treatment of creditors’ claims under the U.S. Bankruptcy Code as compared to the treatment of those claims under the new authority. Nonetheless, substantial differences in the rights of creditors exist between these two regimes, including the right of the FDIC to disregard the strict priority of creditor claims in some circumstances, the use of an administrative claims procedure to determine creditors’ claims (as
Supervision and Regulation (continued)
72 BNY Mellon
opposed to the judicial procedure utilized in bankruptcy proceedings), and the right of the FDIC to transfer assets or liabilities of the institution to a third party or a “bridge” entity.
Depositor Preference
Under U.S. federal law, claims of a receiver of an IDI for administrative expenses and claims of holders of U.S. deposit liabilities (including foreign deposits that are payable in the U.S. as well as in a foreign branch of the depository institution) are afforded priority over claims of other unsecured creditors of the institution, including depositors in non-U.S. branches. As a result, such depositors could receive, if anything, substantially less than the depositors in U.S. offices of the depository institution.
Transactions with Affiliates
Transactions between BNY Mellon’s banking subsidiaries, on the one hand, and the Parent and its nonbank subsidiaries and affiliates, on the other, are subject to certain restrictions, limitations and requirements, which include limits on the types and amounts of transactions (including extensions of credit and asset purchases by our banking subsidiaries) that may take place and generally require those transactions to be on arm’s-length terms. In general, extensions of credit by a BNY Mellon banking subsidiary to any nonbank affiliate, including the Parent, must be secured by designated amounts of specified collateral and are limited in the aggregate to 10% of the relevant bank’s capital and surplus for transactions with a single affiliate and to 20% of the relevant bank’s capital and surplus for transactions with all affiliates. There are also limitations on affiliate credit exposures arising from derivative transactions and securities lending and borrowing transactions.
Deposit Insurance
Our U.S. banking subsidiaries, including The Bank of New York Mellon and BNY Mellon, N.A., accept deposits, and those deposits have the benefit of FDIC insurance up to the applicable limit. The current limit for FDIC insurance for deposit accounts is $250,000 per depositor at each insured bank. Under the FDI Act, insurance of deposits may be terminated by the FDIC upon a finding that the IDI has engaged in unsafe and unsound practices, is in an unsafe or unsound condition to continue operations or has
violated any applicable law, regulation, rule, order or condition imposed by a bank’s federal regulatory agency.
The FDIC’s Deposit Insurance Fund (the “DIF”) is funded by assessments on IDIs. The FDIC assesses DIF premiums based on a bank’s average consolidated total assets, less the average tangible equity of the IDI during the assessment period. For larger institutions, such as The Bank of New York Mellon and BNY Mellon, N.A., assessments are determined based on CAMELS ratings and forward-looking financial measures to calculate the assessment rate, which is subject to adjustments by the FDIC, and the assessment base.
Under the FDIC’s regulations, a custody bank, including The Bank of New York Mellon and BNY Mellon, N.A., may deduct from its assessment base 100% of cash and balances due from depository institutions, securities, federal funds sold, and securities purchased under agreement to resell with a Standardized Approach risk-weight of 0% and may deduct 50% of such asset types with a Standardized Approach risk-weight of greater than 0% and up to and including 20%. This assessment base deduction may not exceed the average value of deposits that are classified as transaction accounts and are identified by the bank as being directly linked to a fiduciary or custodial and safekeeping account.
Source of Strength and Liability of Commonly Controlled Depository Institutions
BHCs are required by law to act as a source of strength to their bank subsidiaries. Such support may be required by the Federal Reserve at times when we might otherwise determine not to provide it. In addition, any loans by BNY Mellon to its bank subsidiaries would be subordinate in right of payment to depositors and to certain other indebtedness of its banks. In the event of a BHC’s bankruptcy, any commitment by the BHC to a federal bank regulator to maintain the capital of a subsidiary bank will be assumed by the bankruptcy trustee and entitled to a priority of payment. In addition, in certain circumstances, BNY Mellon’s IDI subsidiaries could be held liable for losses incurred by another BNY Mellon IDI subsidiary. In the event of impairment of the capital stock of one of BNY Mellon’s national bank subsidiaries or The Bank of New York Mellon, BNY Mellon, as the banks’ stockholder, could be required to pay such deficiency.
Supervision and Regulation (continued)
BNY Mellon 73
Incentive Compensation Arrangements Proposal
Section 956 of the Dodd-Frank Act requires federal regulators to prescribe regulations or guidelines regarding incentive-based compensation practices at certain financial institutions, including BNY Mellon. In April 2016, a joint proposed rule was released, replacing a previous 2011 proposal, which each of six agencies must separately approve. The timeframe for final implementation, if any, is currently unknown.
Anti-Money Laundering (“AML”) and the USA PATRIOT Act
A major focus of governmental policy on financial institutions has been aimed at combating money laundering and terrorist financing. The USA PATRIOT Act of 2001 contains numerous AML requirements for financial institutions that are applicable to BNY Mellon’s bank, broker-dealer and investment adviser subsidiaries and mutual funds and private investment companies advised or sponsored by our subsidiaries. Those regulations impose obligations on financial institutions to maintain a broad AML program that includes internal controls, independent testing, compliance management personnel, training, and customer due diligence processes, as well as appropriate policies, procedures and controls to detect, prevent and report money laundering, terrorist financing and other suspicious activity, and to verify the identity of their customers. Certain of those regulations impose specific due diligence requirements on financial institutions that maintain correspondent or private banking relationships with non-U.S. financial institutions or persons.
In January 2021, the Anti-Money Laundering Act of 2020 (“AMLA”), which amends the Bank Secrecy Act (“BSA”), was enacted. The AMLA is intended to comprehensively reform and modernize U.S. AML laws. Among other things, the AMLA codifies a risk-based approach to AML compliance for financial institutions; requires the development of standards by the U.S. Department of the Treasury for evaluating technology and internal processes for BSA compliance; and expands enforcement- and investigation-related authority, including a significant expansion in the available sanctions for certain BSA violations and instituting BSA whistleblower incentives and protections. Many of the statutory provisions in the AMLA will require additional rulemakings, reports and other measures, and the
impact of the AMLA will depend on, among other things, rulemaking and implementation guidance.
Financial Crimes Enforcement Network (“FinCEN”)
FinCEN has issued rules under the BSA that apply to covered financial institutions, including The Bank of New York Mellon and BNY Mellon, N.A., setting forth five pillars of an effective AML program: development of internal policies, procedures and related controls; designation of a compliance officer; a thorough and ongoing training program; independent review for compliance; and customer due diligence (“CDD”). CDD requires a covered financial institution to implement and maintain risk-based procedures for conducting CDD that include the identification and verification of any beneficial owner(s) of each legal entity customer at the time a new account is opened on or after May 11, 2018.
NYSDFS Anti-Money Laundering and Anti-Terrorism Regulations
The NYSDFS has also issued regulations requiring regulated institutions, including The Bank of New York Mellon, to maintain a transaction monitoring program to monitor transactions for potential BSA and AML violations and suspicious activity reporting, and a watch list filtering program to interdict transactions prohibited by applicable sanctions programs.
The regulations require a regulated institution to maintain programs to monitor and filter transactions for potential BSA and AML violations and prevent transactions with sanctioned entities. The regulations also require institutions to submit annually a Board resolution or senior officer compliance finding confirming steps taken to ascertain compliance with the regulation.
Privacy and Data Protection
The privacy provisions of the Gramm-Leach-Bliley Act generally prohibit financial institutions, including BNY Mellon, from disclosing nonpublic personal financial information of consumer customers to third parties for certain purposes (primarily marketing) unless customers have the opportunity to “opt out” of the disclosure. The Fair Credit Reporting Act restricts information sharing among affiliates for marketing purposes.
Supervision and Regulation (continued)
74 BNY Mellon
In the EU, privacy law is primarily regulated by the General Data Protection Regulation (“GDPR”), which has been directly binding and applicable for each EU member state since May 25, 2018. The GDPR contains enhanced compliance obligations and increased penalties for non-compliance compared to prior EU data protection legislation.
Acquisitions/Transactions
Federal and state laws impose notice and approval requirements for mergers and acquisitions involving depository institutions or BHCs. The Bank Holding Company Act of 1956, as amended by the Gramm-Leach-Bliley Act and by the Dodd-Frank Act (the “BHC Act”), requires the prior approval of the Federal Reserve for the direct or indirect acquisition by a BHC of more than 5% of any class of the voting shares or all or substantially all of the assets of a commercial bank, savings and loan association or BHC. In reviewing bank acquisition and merger applications, the bank regulatory authorities will consider, among other things, the competitive effect of the transaction, financial and managerial resources, including the capital position of the combined organization, convenience and needs of the community factors, including the applicant’s record under the Community Reinvestment Act of 1977 (the “CRA”), the effectiveness of the subject organizations in combating money laundering activities and the risk to the stability of the U.S. banking or financial system. In addition, prior Federal Reserve approval would be required for BNY Mellon to acquire direct or indirect ownership or control of any voting shares of a company with assets of $10 billion or more that is engaged in activities that are “financial in nature.”
Rating System for the Supervision of Large Financial Institutions
The Federal Reserve’s rating system for the supervision of large financial institutions (“LFIs”) applies to, among other entities, all BHCs with total consolidated assets of $100 billion or more, including BNY Mellon.
The LFI rating system includes a four-level rating scale and three component ratings. The four levels are: Broadly Meets Expectations; Conditionally Meets Expectations; Deficient-1; and Deficient-2. The component ratings are assigned for: Capital Planning and Positions; Liquidity Risk Management
and Positions; and Governance and Controls. A firm must be rated “Broadly Meets Expectations” or “Conditionally Meets Expectations” for each of its component ratings to be considered “well managed” in accordance with various statutes and regulations that permit additional activities, prescribe expedited procedures or provide other benefits for “well managed” firms.
Regulated Entities of BNY Mellon and Ancillary Regulatory Requirements
BNY Mellon is registered as an FHC under the BHC Act. We are subject to supervision by the Federal Reserve. In general, the BHC Act limits an FHC’s business activities to banking, managing or controlling banks, performing certain servicing activities for subsidiaries, engaging in activities incidental to banking, and engaging in any activity, or acquiring and retaining the shares of any company engaged in any activity, that is either financial in nature or complementary to a financial activity and does not pose a substantial risk to the safety and soundness of depository institutions or the financial system generally.
A BHC’s ability to maintain FHC status is dependent on: (i) its U.S. depository institution subsidiaries qualifying on an ongoing basis as “well capitalized” and “well managed” under the prompt corrective action regulations of the appropriate regulatory agency (discussed above under “Prompt Corrective Action”); (ii) the BHC itself qualifying on an ongoing basis as “well capitalized” and “well managed” under applicable Federal Reserve regulations; and (iii) its U.S. depository institution subsidiaries continuing to maintain at least a “satisfactory” rating under the CRA.
An FHC that does not continue to meet all the requirements for FHC status will, depending on which requirements it fails to meet, lose the ability to undertake new activities, or make acquisitions, that are not generally permissible for BHCs without FHC status. As of Dec. 31, 2020, BNY Mellon and our U.S. bank subsidiaries were “well capitalized” based on the ratios and rules applicable to them.
The Bank of New York Mellon, BNY Mellon’s largest banking subsidiary, is a New York state-chartered bank, and a member of the Federal Reserve System and is subject to regulation, supervision and examination by the Federal Reserve, the FDIC and
Supervision and Regulation (continued)
BNY Mellon 75
the NYSDFS. BNY Mellon’s national bank subsidiaries, BNY Mellon, N.A. and The Bank of New York Mellon Trust Company, National Association, are chartered as national banking associations subject to primary regulation, supervision and examination by the OCC.
We operate a number of broker-dealers that engage in securities underwriting and other broker-dealer activities in the United States. These companies are SEC-registered broker-dealers and members of Financial Industry Regulatory Authority, Inc. (“FINRA”), a securities industry self-regulatory organization. BNY Mellon’s nonbank subsidiaries engaged in securities-related activities are regulated by supervisory agencies in the countries in which they conduct business.
Certain of BNY Mellon’s public finance and advisory activities are regulated by the Municipal Securities Rulemaking Board and are required under the SEC’s Municipal Advisors Rule to register with the SEC if they provide advice to municipal entities or certain other persons on the issuance of municipal securities, or about certain investment strategies or municipal derivatives.
Certain of BNY Mellon’s subsidiaries are registered with the CFTC as commodity pool operators, introducing brokers and/or commodity trading advisors and, as such, are subject to CFTC regulation. The Bank of New York Mellon is provisionally registered as a swap dealer (as defined in the Dodd-Frank Act) with the CFTC, and is a member of the National Futures Association (“NFA”) in that same capacity. As a swap dealer, The Bank of New York Mellon is subject to regulation, supervision and examination by the CFTC and NFA.
Certain of our subsidiaries are registered investment advisors under the Investment Advisers Act of 1940, as amended, and as such are supervised by the SEC. They are also subject to various U.S. federal and state laws and regulations and to the laws and regulations of any countries in which they conduct business. Our subsidiaries advise both public investment companies which are registered with the SEC under the Investment Company Act of 1940, as amended (the “‘40 Act”), including the BNY Mellon Family of Funds and BNY Mellon ETF Funds, and private investment companies which are not registered under the ‘40 Act.
Certain of our investment management, trust and custody operations provide services to employee benefit plans that are subject to the Employee Retirement Income Security Act of 1974, as amended (“ERISA”), administered by the U.S. Department of Labor (“DOL”). ERISA imposes certain statutory duties, liabilities, disclosure obligations and restrictions on fiduciaries, as applicable, related to the services being performed and fees being paid.
SEC Regulation Best Interest
On June 5, 2019, the SEC adopted Regulation Best Interest (“Reg BI”) and the Form CRS Relationship Summary (“Form CRS”). Reg BI, which had a June 30, 2020 compliance date, requires a broker-dealer to act in the “best interest” of a retail customer when making a recommendation of any securities transaction or investment strategy to any such customer. Form CRS, which also had a June 30, 2020 compliance date, requires registered investment advisers and broker-dealers to provide retail investors with a brief summary about the nature of their relationship with their investment professional, and supplements other more detailed disclosures. The impacted broker-dealer and investment adviser subsidiaries of BNY Mellon updated their policies and procedures to comply with Reg BI and/or Form CRS.
Exchange-Traded Funds Rule
On Sept. 26, 2019, the SEC announced that it had adopted Rule 6c-11 (the “ETF Rule”) under the ‘40 Act, which permits exchange-traded funds (“ETFs”) that satisfy certain conditions to organize and operate without first obtaining an exemptive order from the SEC and requires an ETF to make certain disclosures, including historical data on an ETF’s premiums, discounts and bid-ask spread information, as well as the ETF’s daily portfolio holdings. The ETF Rule became effective on Dec. 23, 2019. All existing exemptive orders for ETFs that are permitted to operate in reliance on the ETF Rule were rescinded. The ETF Rule also requires ETFs using custom baskets to put written policies and procedures in place establishing that the custom baskets are in the best interests of the ETF and its shareholders. BNY Mellon launched eight ETFs under the ETF Rule in April 2020.
Supervision and Regulation (continued)
76 BNY Mellon
Effects of “Brexit” on UK Regulatory Framework
The UK left the EU on Jan. 31, 2020, and the transition period ended on Dec. 31, 2020 (“Brexit Transition Period”). Existing EU regulations that were in force and applicable in the UK on Dec. 31, 2020, were “on-shored” into the UK regulatory framework (and adapted as appropriate for the UK situation) as “retained EU law.” However, the UK and EU regulatory frameworks may start to diverge after the conclusion of the Brexit Transition Period. EU rules and regulations that come into effect on or after Jan. 1, 2021, will not apply to financial activities within the UK.
In October 2020, the Financial Services Bill 2020 was published by the UK Government and is expected to be passed by the UK Parliament during 2021. The Financial Services Bill 2020 makes several changes to the UK financial services regulatory framework and implements the elements of EU CRR2 that do not already form part of EU retained law in the UK. The Financial Services Bill 2020 also implements the EU Investment Firms Directive / Regulation (“IFD/IFR”) in the UK (modified for the UK environment as “UK IFPR”). For more information regarding the IFD/IFR and the UK IFPR, see “Investment Firms Directive and Investment Firms Regulation” below.
The Financial Services Bill 2020 grants rulemaking powers to the Prudential Regulatory Authority (“PRA”) with respect to UK capital requirements directive/regulation matters, and the Financial Conduct Authority (“FCA”), with respect to UK IFPR matters. The Financial Services Bill also enables Her Majesty’s Treasury to set commencement dates for various UK CRR2/UK IFPR provisions. For more information regarding the CRR2, see “Operations and Regulations Outside the United States” below.
The EU-UK Trade and Cooperation Agreement (“EU-UK Agreement”) entered into force and became provisionally effective on Jan. 1, 2021. The EU-UK Agreement is subject to ratification by the European Parliament before becoming fully effective. Under the EU-UK Agreement, the EU and UK have agreed to make their best endeavors to ensure that internationally agreed standards in the financial services sector for regulation and supervision are implemented and applied in their territory and establish a framework for structured regulatory cooperation on financial services. After Dec. 31,
2020, UK financial services firms can no longer “passport” the provision of financial services into the EU, and vice versa.
Our plan for Brexit has always assumed that UK financial services firms will no longer benefit from “passporting” rights at the point of withdrawal.
We maintain a presence in the UK through the London branch of The Bank of New York Mellon, The Bank of New York Mellon (International) Limited, a credit institution incorporated and authorized in the UK, and a number of our investment management subsidiaries. We maintain a presence in the EU through BNY Mellon SA/NV, which is headquartered in Belgium and has a branch network in a number of other EU countries, and through certain of our investment management subsidiaries. BNY Mellon SA/NV has a general banking license for the provision of banking and investment services. We have undertaken adjustments to the operations of BNY Mellon SA/NV so that we may provide a wider range of services to clients domiciled in the EU. For a discussion of the risks regarding Brexit, see “Risk Factors – Following the end of the transition period, the UK and the EU have not agreed to alternatives to the “passporting rights,” which may result in negative effects on global economic conditions, global financial markets, and our business, financial condition and results of operations.”
Operations and Regulations Outside the United States
In Europe, branches of The Bank of New York Mellon are subject to regulation in the countries in which they are established, in addition to being subject to oversight by the U.S. regulators referred to above. BNY Mellon SA/NV is a public limited liability company incorporated under the laws of Belgium, holds a banking license issued by the National Bank of Belgium and is authorized to carry out all banking and savings activities as a credit institution. The European Central Bank (the “ECB”) has responsibility for the direct supervision of significant banks and banking groups in the euro area, including BNY Mellon SA/NV. The ECB’s supervision is carried out in conjunction with the relevant national prudential regulator (the National Bank of Belgium in BNY Mellon SA/NV’s case), as part of the Single Supervisory Mechanism. BNY Mellon SA/NV conducts its activities in Belgium as well as through its branch offices in Denmark,
Supervision and Regulation (continued)
BNY Mellon 77
France, Germany, Ireland, Italy, Luxembourg, the Netherlands and Spain.
Certain of our financial services operations in the UK are subject to regulation and supervision by the FCA and the PRA. The PRA is responsible for the authorization and prudential regulation of firms that carry on PRA-regulated activities, including banks. PRA-authorized firms are also subject to regulation by the FCA for conduct purposes. In contrast, FCA-authorized firms (such as investment management firms) have the FCA as their sole regulator for both prudential and conduct purposes. As a result, FCA-authorized firms must comply with FCA prudential and conduct rules and the FCA’s Principles for Businesses, while dual-regulated firms must comply with the FCA conduct rules and FCA Principles, as well as the applicable PRA prudential rules and the PRA’s Principles for Businesses.
The PRA regulates The Bank of New York Mellon (International) Limited, our UK-incorporated bank, as well as the London branch of The Bank of New York Mellon. Certain of BNY Mellon’s UK-incorporated subsidiaries are authorized to conduct investment business in the UK. Their investment management advisory activities and their sale and marketing of retail investment products are regulated by the FCA. Certain UK investment funds, including investment funds of BNY Mellon, are registered with the FCA and are offered for sale to retail investors in the UK.
The types of activities in which the foreign branches of our banking subsidiaries and our international subsidiaries may engage are subject to various restrictions imposed by the Federal Reserve. Those foreign branches and international subsidiaries are also subject to the laws and regulatory authorities of the countries in which they operate and, in the case of banking subsidiaries, may be subject to regulatory capital requirements in the jurisdictions in which they operate.
In the EU, aspects of the Banking Union have entered into force in most jurisdictions, including Belgium. The key components of the Banking Union include the single supervisory mechanism and the single resolution mechanism. The single resolution mechanism implements BRRD in a consistent manner in the Banking Union, including the establishment of the Single Resolution Board and the Single Resolution Fund.
The primary prudential framework in the EU is provided by the Capital Requirements Directive IV (“CRD4”) and the Capital Requirements Regulation (“CRR”), both of which implement many elements of the Basel III framework, and which were revised by the Capital Requirements Directive V (“CRD5”) and the CRR2, respectively. CRD5 and CRR2 entered into force in 2019 and are being implemented in various phases between 2019 and 2024.
Among other things, CRD5 includes a requirement for certain non-EU banking groups to have up to two “EU intermediate parent undertakings” (“EU IPUs”). All EU credit institutions and certain EU investment firms in such non-EU banking groups would need to fall within a corporate structure headed by one of the EU IPUs. As relevant BNY Mellon entities had more than €40 billion of assets on June 27, 2019, BNY Mellon will have until Dec. 30, 2023, to meet the EU IPU requirement. BNY Mellon continues to evaluate the impact of the EU IPU requirement and potential solutions for complying with the requirement.
CRR2 includes provisions relating to the leverage ratio, NSFR, MREL (including closer alignment to the final FSB TLAC standard), a revised Basel market risk framework, counterparty credit risk, exposures to central counterparties, exposures to collective investment undertakings, large exposures and reporting/disclosure requirements. Some elements of CRR2 already apply and many of the elements of CRR2 become applicable on June 28, 2021.
Our Investment Services and Investment and Wealth Management businesses are subject to significant regulation in numerous jurisdictions around the world relating to, among other things, the safeguarding, administration and management of client assets and client funds.
Various revised and/or proposed EU directives and regulations have or will have a significant impact on our provision of many of our products and services, including the Markets in Financial Instruments Directive II and Markets in Financial Instruments Regulation (collectively, “MiFID II”), the Alternative Investment Fund Managers Directive (“AIFMD”), the Directive on Undertakings for Collective Investment in Transferable Securities (“UCITS V”), the Central Securities Depositories Regulation, the regulation on OTC derivatives, central counterparties and trade repositories (commonly known as “EMIR”), the
Supervision and Regulation (continued)
78 BNY Mellon
Payment Services Directive II and the Benchmarks Regulation. These EU directives and regulations may impact our operations and risk profile but may also provide new opportunities for the provision of BNY Mellon products and services. Some of these EU directives and regulations are subject to review or finalization by the legislative authorities and/or substantial secondary legislation. This creates uncertainty as to business impact.
Investment Firms Directive and Investment Firms Regulation
In the EU, IFD/IFR, previously referred to as the “new prudential regime for investment firms,” is a more tailored, proportionate prudential regime for investment firms. IFD/IFR entered into force on Dec. 25, 2019 and will generally apply from June 26, 2021.
Under IFD/IFR, most EU investment firms will move from the current CRD4/CRR regime to the IFD/IFR regime on June 26, 2021. Accordingly, such firms, including Pershing Securities International Limited, will not need to implement CRD5/CRR2. BNY Mellon has several UK-domiciled investment firms that will be subject to UK IFPR.
The main change under both IFD/IFR and UK IFPR is that capital requirements for most investment firms will no longer be based on Basel standards for banks such as credit risk, market risk or operational risk. Instead, the capital requirements will be based on factors that are more tailored to the risks that investment firms face.
European Deposit Insurance Scheme
In November 2015, the European Commission proposed a European Deposit Insurance Scheme (“EDIS”) for euro area Member States. Under the EDIS proposal, existing national euro area deposit guarantee schemes would transition over a number of years to a mutualized or EU-reinsurance-based deposit guarantee scheme applicable in the euro area.
EDIS has not been substantially advanced since 2015 due to opposition by some Member States and its adoption remains uncertain.
European Financial Markets and Market Infrastructure
The EU continues to develop proposals and regulations in relation to financial markets and market infrastructures. MiFID II applies to financial institutions conducting business in the EEA and has required significant changes to comply with relevant regulatory requirements, including extensive transaction reporting and market transparency obligations and a heightened focus on how financial institutions conduct business with and disclose information to their clients. The EU has agreed a set of revisions to MiFID II which will come into force in late 2021, including changes to cost and charges disclosures and small and medium enterprise research unbundling rules. Since the UK has left the EU and the Brexit Transition Period has concluded, these changes do not automatically apply to UK firms.
Funds Regulation in Europe
The AIFMD has a direct effect on our alternative fund manager clients and our depository business and other products offered across Europe as well as upon our Investment Management business. AIFMD imposes heightened obligations upon depositories, which have operational effects.
Our businesses servicing regulated funds in Europe and our Investment Management businesses in Europe are also affected by the revised directive governing UCITS V.
Under the regulations for depositary safekeeping duties under AIFMD and UCITS V that became effective in 2020, the Commission recognizes the use of omnibus account structures when accounting for assets in a chain of custody, but requires that depositaries and trustees, such as BNY Mellon, maintain their own books and records.
Supervision and Regulation (continued)
BNY Mellon 79

Replacement of Interbank Offered Rates (“IBORs”), including LIBOR
In 2017, the UK Financial Conduct Authority (the “FCA”) stated its intention that it would no longer be necessary for the FCA to persuade, or compel, contributing banks to submit rates for the calculation of LIBOR after 2021. However, the administrator for LIBOR has announced a proposal to extend the publication of the most commonly used U.S. dollar LIBOR settings to June 30, 2023 and to cease publishing other LIBOR settings on Dec. 31, 2021. In addition, the U.S. bank regulators have issued guidance strongly encouraging banking organizations to cease using U.S. dollar LIBOR as a reference rate in new contracts as soon as practicable and in any event by Dec. 31, 2021. Accordingly, although there may be a period of time after 2021 during which IBORs for certain tenors or currencies may continue to be published, globally, financial market participants have begun to transition away from LIBOR and other IBORs to alternative reference rates in anticipation of the expected discontinuance of LIBOR and other IBORs by the end of 2021. This transition will impact assets and liabilities on our balance sheet that reference IBORs, investments that we manage linked to IBORs in our Investment Management business and the operational servicing of products that reference IBORs in our Investment Services business.
We are working to facilitate an orderly transition from IBORs to alternative reference rates for us and our clients. Accordingly, we have created a global transition program with senior management oversight that focuses on, among other things, evaluating and monitoring the impacts of the discontinuance of reference IBORs and the transition to replacement benchmarks on our business operations and financial condition; identifying and evaluating the scope of impacted financial instruments and contracts and the attendant risks; and implementing technology systems, models and analytics to support the transition. In addition, we continue to actively engage with our regulators and clients and participate in central bank and sector working groups.
Despite the proximity of the IBOR cessation date, there remain, however, a number of unknown factors regarding the transition from the IBORs and/or interest rate benchmark reforms that could impact our business. For a further discussion of the various risks, see “Risk Factors – Transitions away from and the replacement of LIBOR and other IBORs could adversely impact our business, financial condition and results of operations.”
Other Matters
80 BNY Mellon
Making or continuing an investment in securities issued by us involves certain risks that you should carefully consider. The following discussion sets forth the most material risk factors that could affect our business, financial condition or results of operations. Some of these risks are interrelated and the occurrence of one may exacerbate the effect of others. However, factors other than those discussed below or in other of our reports filed with or furnished to the SEC also could adversely affect our business, financial condition or results of operations. We cannot assure you that the risk factors described below or elsewhere in our reports address all potential risks that we may face. These risk factors also serve to describe factors which may cause our results to differ materially from those described in forward-looking statements included herein or in other documents or statements that make reference to this Annual Report. See “Forward-looking Statements.”
Summary
Operational Risk
Our business, financial condition and results of operations may be materially adversely affected by operational risk, including as a result of the following: • Operational and transaction processing and
associated errors and delays.• Our risk management framework, models and
processes may not be effective in mitigating risk and reducing the potential for losses.
• The coronavirus pandemic, which is adversely affecting us and creating significant risks and uncertainties for our business, and the ultimate impact of the pandemic on us will depend on future developments, which are highly uncertain and cannot be predicted.
• A communications or technology disruption or failure within our infrastructure or the infrastructure of third parties that results in a loss of information, delays our ability to access information or impacts our ability to provide services to our clients.
• A cybersecurity incident, or a failure to protect our computer systems, networks and information and our clients’ information against cybersecurity threats, which could result in the theft, loss, unauthorized access to, disclosure, use or alteration of information, system or network failures, or loss of access to information.
• We are subject to extensive government rulemaking, policies, regulation and supervision that impact our operations. Changes to and introduction of new rules and regulations have, and in the future may, compel us to change how we manage our businesses.
• Regulatory or enforcement actions or litigation.• Failure to satisfy regulatory standards, including
“well capitalized” and “well managed” status or capital adequacy and liquidity rules more generally.
• A failure or circumvention of our controls and procedures.
Market Risk
Our business, financial condition and results of operations may be materially adversely affected by market risk, including as a result of the following:• We are dependent on fee-based business for a
substantial majority of our revenue and our fee-based revenues could be adversely affected by slowing in market activity, weak financial markets, underperformance and/or negative trends in savings rates or in investment preferences.
• Weakness and volatility in financial markets and the economy generally.
• Changes in interest rates and yield curves have had, and may in the future continue to have, a material adverse effect on our profitability.
• We may experience losses on securities related to volatile and illiquid market conditions, reducing our earnings.
• Transitions away from and the replacement of LIBOR and other IBORs.
• Following the end of the transition period, the UK and the EU have not agreed to alternatives to the “passporting rights,” which may result in negative effects on global economic conditions and global financial markets.
Credit Risk
Our business, financial condition and results of operations may be materially adversely affected by credit risk, including as a result of the following:• The failure or perceived weakness of any of our
significant clients or counterparties, many of whom are major financial institutions or
Risk Factors
BNY Mellon 81

sovereign entities, and our assumption of credit and counterparty risk, could expose us to loss.
• We could incur losses if our allowance for credit losses, including loan and lending-related commitment reserves, is inadequate or if our expectations of future economic conditions deteriorate.
Capital and Liquidity Risk
Our business, financial condition and results of operations may be materially adversely affected by capital and liquidity risk, including as a result of the following:• If we do not effectively manage our liquidity.• The Parent is a non-operating holding company,
and as a result, is dependent on dividends from its subsidiaries and extensions of credit from its IHC to meet its obligations, including with respect to its securities, and to provide funds for share repurchases and payment of dividends to its stockholders.
• Our ability to return capital to shareholders is subject to the discretion of our Board of Directors and may be limited by U.S. banking laws and regulations, including those governing capital and capital planning, applicable provisions of Delaware law and our failure to pay full and timely dividends on our preferred stock.
• Any material reduction in our credit ratings or the credit ratings of our principal bank subsidiaries, The Bank of New York Mellon or BNY Mellon, N.A., could increase the cost of funding and borrowing to us and our rated subsidiaries.
• The application of our Title I preferred resolution strategy or resolution under the Title II orderly liquidation authority could adversely affect the Parent’s liquidity and financial condition and the Parent’s security holders.
Strategic Risk
Our business, financial condition and results of operations may be materially adversely affected by strategic risk, including as a result of the following:• New lines of business, new products and services
or transformational or strategic project initiatives may subject us to additional risks, and the failure to implement these initiatives.
• We are subject to competition in all aspects of our business, which could negatively affect our ability to maintain or increase our profitability.
• If we are unable to attract, retain and motivate employees.
• Our strategic transactions present risks and uncertainties.
Additional Risks
Our business, financial condition and results of operations may be materially adversely affected by other, additional and emerging risks, including as a result of the following:• Adverse events, publicity, government scrutiny or
other reputational harm.• Climate change concerns could adversely affect
our business, affect client activity levels and damage our reputation.
• Impacts from natural disasters, climate change, acts of terrorism, pandemics, global conflicts and other geopolitical events.
• Tax law changes or challenges to our tax positions with respect to historical transactions may adversely affect our net income and effective tax rate.
• Changes in accounting standards governing the preparation of our financial statements and future events could have a material impact on our reported financial condition, results of operations, cash flows and other financial data.
Operational Risk
Errors or delays in our operational and transaction processing may materially adversely affect our business, financial condition, results of operations and reputation.
We are required to accurately process large numbers of transactions each day on a timely basis. The transactions we process or execute are operationally complex and can involve numerous parties, jurisdictions, regulations and systems, and as such, are subject to execution and processing errors and failures. The risk of execution and processing errors and failures may be heightened by our use of manual processes, which are inherently more prone to error than automated processes. As our businesses evolve to even more complex and voluminous transactions, at ever increasing speeds, we must also evolve our
Risk Factors (continued)
82 BNY Mellon

processes, controls, workforce and technology to accurately and timely execute those transactions, which may result in an increased risk of error or significant operational delay. When errors or delays do occur, they may be difficult to detect and remediate in a timely manner.
As a result, operational errors or significant operational delays could materially negatively impact our ability to conduct our business or service our clients, which could adversely affect our results of operations due to potentially higher expenses and lower revenues, could lower our capital ratios, create liability for us or our clients or negatively impact our reputation. An operational error impacting a large number of transactions could have unfavorable ripple effects in the financial markets.
Affiliates or third parties with which we do business or that facilitate our business activities could also be sources of execution and processing errors, failures or significant operational delays. In certain jurisdictions, we may be deemed to be statutorily or criminally liable for operational errors, fraud, breakdowns or delays by these affiliates or third parties. Additionally, as a result of regulations, including the Alternative Investment Fund Managers Directive and the Undertakings for Collective Investment in Transferable Securities V, where, in the European Economic Area we act as depositary, the Company could be exposed to restitution risk for, among other things, errors or fraud perpetrated by a sub-custodian resulting in a loss or delay in return of client’s securities. Where we are not acting as a European Economic Area depositary, but where we provide custody services to a European Economic Area depositary, we may accept similar liabilities to that of a depositary as a matter of contract.
Our risk management framework, models and processes may not be effective in mitigating risk and reducing the potential for losses.
Our risk management framework seeks to mitigate risk and loss to us. We have established comprehensive policies and procedures and an internal control framework designed to provide a sound operational environment for the types of risk to which we are subject, including operational risk, credit risk, market risk, liquidity risk, model risk and strategic risk. We have also established frameworks to mitigate risk and loss to us as a result of the actions of affiliates or third parties with which we do
business or that facilitate our business activities. However, as with any risk management framework, there are inherent limitations to our current and future risk management strategies, including risks that we may not have appropriately anticipated or identified.
Our regulators remain focused on ensuring that financial institutions build and maintain robust risk management policies. Regulators’ views of the quality of our risk models and framework affect our regulators’ evaluations of us, and we are exposed to the risk of adverse regulatory and supervisory developments, including enforcement actions, and increased costs in connection with remediation efforts if our regulators view our risk models and framework to be insufficient or if remediation is not completed in a timely manner. Accurate and timely enterprise-wide risk information is necessary to enhance management’s decision-making in times of crisis. If our risk management framework proves ineffective or if our enterprise-wide management information is incomplete or inaccurate, we could suffer unexpected losses, which could materially adversely affect our results of operations or financial condition.
In certain instances, we rely on models to measure, monitor and predict risks. However, these models are inherently limited because they involve techniques, including the use of historical data, trends, assumptions and judgments that cannot anticipate every economic and financial outcome in the markets in which we operate, nor can they anticipate the specifics and timing of such outcomes, especially during severe market downturns or stress events. These models may not appropriately capture all relevant risks or accurately predict future events or exposures. The risk of the unsuccessful development or implementation of our models, systems or processes cannot be completely eliminated. The models that we use to assess and control our market risk exposures also reflect assumptions about the degree of correlation among prices of various asset classes or other market indicators. The 2008 financial crisis and resulting regulatory reform highlighted both the importance and some of the limitations of managing unanticipated risks. In times of market stress or other unforeseen circumstances, previously uncorrelated indicators may become correlated, or previously correlated indicators may move in different directions. These types of market movements have at times limited the effectiveness of our hedging strategies and have caused us to incur significant losses, and they may do so in the future.
Risk Factors (continued)
BNY Mellon 83
In addition, our businesses and the markets in which we operate are continuously evolving. We may fail to fully understand the implications of changes in our businesses or the financial markets or fail to adequately or timely enhance our risk framework to address those changes. If our risk framework is ineffective because it fails to keep pace with changes in the financial markets, regulatory requirements, our businesses, our counterparties, clients or service providers or for other reasons, we could incur losses, suffer reputational damage, face significant remediation expenses or find ourselves out of compliance with applicable regulatory or contractual mandates or supervisory expectations.
An important aspect of our risk management framework is creating a risk culture that is sustainable and appropriate to our role as a major financial institution in which all employees fully understand that there is risk in every aspect of our business and the importance of managing risk as it relates to their job functions. If we fail to create the appropriate environment that sensitizes all of our employees to managing risk, our business could be adversely impacted. For more information on how we monitor and manage our risk management framework, see “Risk Management – Overview.”
The coronavirus pandemic is adversely affecting us and creates significant risks and uncertainties for our business, and the ultimate impact of the pandemic on us will depend on future developments, which are highly uncertain and cannot be predicted.
The coronavirus pandemic has negatively affected the global economy, decreased liquidity in fixed income markets, created significant volatility and disruption in financial and equity markets, increased unemployment levels and disrupted businesses in many industries. This has resulted in increased demand on our transaction processing and clearance capabilities in many of our Investment Services businesses and volatility in the levels and mix of the assets under management of our Investment and Wealth Management business. Moreover, governmental actions in response to the pandemic are meaningfully influencing the interest rate environment, which has reduced, and is expected to continue to reduce, our net interest margin. As a result, we have granted and expect to continue to grant money market fee waivers. The effects of the pandemic have resulted, and could continue to result, in higher and more volatile provisions for credit
losses. The continuing effects of the pandemic could also result in increased credit losses and charge-offs, particularly if our credit exposures increase and as more clients and customers experience credit deterioration, as well as increased risk of other asset write-downs and impairments, including, but not limited to, equity investments, goodwill and intangibles. Any of these events could potentially result in a material adverse impact on our business, financial condition and results of operations.
In addition, reliance on work-from-home capabilities by us, our clients and other industry participants, as well as the potential inability to maintain critical staff in operational facilities due to stay-at-home orders or operational precautions across jurisdictions, illness and quarantines present heightened cybersecurity, information security and operational risks. Any disruption to our ability to deliver services to our clients and customers could result in potential liability to our clients and customers, regulatory fines, penalties or other sanctions, increased operational costs or harm to our reputation.
The pandemic has resulted in an increase in our balance sheet and volatility in risk-weighted assets, as we experience elevated deposit levels. Moreover, on March 15, 2020, we, along with the other member banks of the Financial Services Forum, announced that we would temporarily suspend share repurchases through the second quarter of 2020 to preserve capital and liquidity in order to further our objective of using our capital and liquidity to support our clients and customers. Further, in June 2020, the Federal Reserve announced that it required participating CCAR firms, including us, to update and resubmit their capital plans and that, as a result, unless otherwise approved by the Federal Reserve, participating firms would not be permitted, during the third quarter of 2020, to conduct open market common stock repurchases, to increase their common stock dividends or to pay common stock dividends that exceed average net income for the preceding four quarters. The Federal Reserve extended these limitations to the fourth quarter of 2020 and, with certain modifications permitting limited share repurchases, to the first quarter of 2021. The Federal Reserve may further extend these limitations in subsequent quarters. Our ability to resume our common stock repurchase program and maintain our common stock dividend depends on factors such as prevailing market conditions, our outlook for the economic environment, the performance of our
Risk Factors (continued)
84 BNY Mellon

business, and whether the Federal Reserve keeps the limitations for the first quarter of 2021 in place for subsequent quarters.
The extent to which the pandemic impacts our business, financial condition, results of operations and liquidity, as well as our regulatory capital, will depend on future developments, which are highly uncertain and cannot be predicted, including the scope and duration of the pandemic, the timing and availability of effective medical treatments and vaccines, the effectiveness of our work-from-home arrangements, actions taken by governmental authorities and other third parties in response to the pandemic, as well as the direct and indirect impact on us, our clients and customers, and third parties. As the pandemic adversely affects the United States or the global economy, or our business, financial condition, liquidity or results of operations, it may also have the effect of heightening many of the other risks described herein.
A communications or technology disruption or failure within our infrastructure or the infrastructure of third parties that results in a loss of information, delays our ability to access information or impacts our ability to provide services to our clients may materially adversely affect our business, financial condition and results of operations.
We use communications and information systems to conduct our business. Our businesses are highly dependent on our ability to process large volumes of data that require global capabilities and scale from our technology platforms. If our technology or communications fail, or those of industry utilities or our service providers fail, we have in the past experienced, and could in the future experience, production and system outages or failures, or other significant operational delays. Any such outage, failure or delay could adversely affect our ability to effect transactions or service our clients, which could expose us to liability for damages, result in the loss of business, damage our reputation, subject us to regulatory scrutiny or sanctions or expose us to litigation, any of which could have a material adverse effect on our business, financial condition and results of operations. We are exposed to similar risks if the technology and communications systems our employees use while working from home fail. Security or technology disruptions, failures or delays that impact our communications or information
systems could also adversely affect our ability to manage our exposure to risk or expand our business. These incidents are unpredictable and can arise from numerous sources, not all of which are in our control, including, among others, human error, malfeasance and other misconduct.
Upgrading our computer systems, software and networks subjects us to the risk of disruptions, failures or delays due to the complexity and interconnectedness of our computer systems, software and networks. For instance, we and third parties have begun to incorporate cloud technologies and as our reliance on this technology grows, it may become critical to the operation of our systems and platforms. As a result, we are becoming subject to heightened risks relating to the use of cloud technologies. The failure to properly upgrade or maintain these computer systems, software and networks could result in greater susceptibility to attacks, unauthorized access and misuse, and could also prevent us from achieving our business continuity and resiliency objectives. There can be no assurance that any such disruptions, failures or delays will not occur or, if they do occur, that they will be adequately addressed.
Third parties with which we do business or that facilitate our business activities, including exchanges, clearing houses, financial intermediaries or vendors that provide services or security solutions for our operations, could also be sources of technology risk to us, including from breakdowns, capacity constraints, failures or delays of their own systems or other services that impair our ability to process transactions and communicate with customers and counterparties. In addition, we are exposed to the risk that a technology disruption or other information security event at a vendor common to our third-party service providers could impede their ability to provide products or services to us. We may not be able to effectively monitor or mitigate operational risks relating to the use of common vendors by third-party service providers, which could result in potential liability to clients and customers, regulatory fines, penalties or other sanctions, increased operational costs or harm to our reputation.
As our business areas evolve, whether due to the introduction of technology, new service offering requirements for our clients, or changes in regulation relative to these service offerings, unforeseen risks materially impacting our business operations could arise. The technology used could become
Risk Factors (continued)
BNY Mellon 85

increasingly complex and rely on the continued effectiveness of the programming code and integrity of the inputted data. Rapid technological changes and competitive pressures require us to make significant and ongoing investments in technology not only to develop competitive new products and services or adopt new technologies, but to sustain our current businesses. Our financial performance depends in part on our ability to develop and market these new products and services in a timely manner at a competitive price and adopt or develop new technologies that differentiate our products or provide cost efficiencies. The failure to conduct adequate review and consideration of critical business changes prior to and during introduction and deployment of key technological systems or the failure to adequately align operational capabilities with evolving client commitments and expectations, subjects us to the risk of an adverse impact on our ability to service and retain customers and on our operations. The costs we incur in enhancing our technology could be substantial and may not ultimately improve our competitiveness or profitability.
We continue to evaluate and strengthen our business continuity and operational resiliency capabilities and have increased our investments in technology to steadily enhance those capabilities, including our ability to resume and sustain our operations. There can be no guarantee, however, that a technology outage will not occur or that our business continuity and operational resiliency capabilities will enable us to maintain our operations and appropriately respond to events. For a discussion of operational risk, see “Risk Management – Operational Risk.”
As a result of financial entities, central agents, clearing agents and houses, exchanges and technology systems across the globe becoming more interdependent and complex, a technology failure that significantly degrades, deletes or compromises the systems or data of one or more financial entities or suppliers could have a material impact on counterparties or other market participants, including us. A disruptive event or, failure or delay experienced by one institution could disrupt the functioning of the overall financial system.
A cybersecurity incident, or a failure to protect our computer systems, networks and information and our clients’ information against cybersecurity threats, could result in the theft, loss, unauthorized access to, disclosure, use or alteration of
information, system or network failures, or loss of access to information. Any such incident or failure could adversely impact our ability to conduct our businesses, damage our reputation and cause losses.
We have been, and we expect to continue to be, the target of attempted cyber-attacks, computer viruses or other malicious software, denial of service efforts, phishing attacks and other information security threats, including unauthorized access attempts. The global shift to working remotely has increased and is expected to continue to increase cybersecurity risks. As a result of greater reliance on remote work arrangements, we may face an increasing number of attempted cyber-attacks as we expand our usage of mobile and cloud technologies and our employees adapt to such technologies. Although we deploy a broad range of sophisticated defenses, we could suffer a material adverse impact or disruption as a result of a cybersecurity incident.
Cybersecurity incidents may occur through intentional or unintentional acts by individuals or groups having authorized or unauthorized access to our systems or our clients’ or counterparties’ information, which may include confidential or proprietary information. These individuals or groups may include employees, vendors and customers, as well as others with malicious intent. Malicious actors may also attempt to place individuals within BNY Mellon or fraudulently induce employees, vendors, customers or other users of our systems to disclose sensitive information in order to gain access to our data or that of our clients. A cybersecurity incident that results in the theft, loss, unauthorized access to, disclosure, use or alteration of information, system or network failures, or loss of access to information, may require us to reconstruct lost data (which may not be possible), reimburse clients for data and credit monitoring services, or result in loss of customer business or damage to our computers or systems and those of our customers and counterparties. These impacts could be costly and time-consuming and could materially adversely affect our business, financial condition and results of operations.
While we seek to mitigate these risks to ensure the integrity of our systems and information and continuously evolve our cybersecurity capabilities, it is possible that we may not anticipate or implement effective preventive measures against all cybersecurity threats, or detect all such threats, especially because the techniques used change
Risk Factors (continued)
86 BNY Mellon

frequently or are not recognized until after they are launched. Moreover, attacks can originate from a wide variety of sources, including malicious actors who are involved with organized crime or who may be linked to terrorist organizations or hostile foreign governments, or from cross-contamination of legitimate parties (including vendors, clients, financial market utilities, and other financial institutions).
The failure to maintain an adequate technology infrastructure and applications with effective cybersecurity controls relative to the type, size and complexity of operations, markets and products traded, access to trading venues and our market interconnectedness could impact operations and impede our productivity and growth, which could cause our earnings to decline or could impact our ability to comply with regulatory obligations leading to regulatory fines and sanctions. We may be required to expend significant additional resources to modify, investigate or remediate vulnerabilities or other exposures arising from cybersecurity threats. A successful cyberattack could occur and persist for an extended period of time before being detected. In addition, because any investigation of a cybersecurity incident would be inherently unpredictable, the extent of a particular cybersecurity incident and the path of investigating the incident may not be immediately clear. It may take a significant amount of time before such an investigation can be completed and reliable information about the incident is known. While such an investigation is ongoing, we may not necessarily know the extent of the harm or how best to remediate it, certain errors or actions could be repeated or compounded before they are discovered and remediated, and communication to the public, regulators, clients and other stakeholders may be inaccurate, any or all of which could further increase the costs and consequences of a cybersecurity incident.
In addition, we rely on a variety of measures to protect our intellectual property and proprietary information, including copyrights, trademarks, patents and controls on access and distribution. These measures may not prevent misappropriation or infringement of our intellectual property or proprietary information and a resulting loss of competitive advantage. Furthermore, if a third party were to assert a claim of infringement or misappropriation of its proprietary rights, obtained through patents or otherwise, against us, we could be
required to spend a significant amount of resources to defend such claims, develop alternative methods of operations, pay substantial money damages, obtain a license from the third party or possibly stop providing one or more products or services. In addition, we conduct business in various jurisdictions that may not have comparable levels of protection for intellectual property and proprietary information as the U.S. The protection afforded in those jurisdictions may be less established and/or predictable. As a result, there may also be heightened risks associated with the potential theft of data, proprietary information, technology and intellectual property in those jurisdictions by domestic or foreign actors, including private parties and those affiliated with or controlled by state actors. Any theft of data, proprietary information, technology or intellectual property may negatively impact our operations and reputation, including disrupting our business activities in those jurisdictions.
We are also subject to laws and regulations relating to the privacy of the information of clients, employees and others, and any failure to comply with these laws and regulations could expose us to liability and/or reputational damage.
We are subject to extensive government rulemaking, policies, regulation and supervision that impact our operations. Changes to and introduction of new rules and regulations have, and in the future may, compel us to change how we manage our businesses, which could have a material adverse effect on our business, financial condition and results of operations.
As a large, internationally active financial services company, we operate in a highly regulated environment, and are subject to a comprehensive statutory and regulatory regime affecting all aspects of our business and operations, including oversight by governmental agencies both inside and outside the U.S. Regulations and related regulatory guidance and supervisory oversight impact how we analyze certain business opportunities, our regulatory capital and liquidity requirements, the revenue profile of certain of our core activities, the products and services we provide, how we monitor and manage operational risk and how we promote a sound governance and control environment. Any changes to the regulatory frameworks and environment in which we operate and the significant management attention and resources necessary to address those changes could materially adversely affect our business, financial
Risk Factors (continued)
BNY Mellon 87
condition and results of operations and have other negative consequences.
The evolving regulatory environment and uncertainty about the timing and scope of future regulations may contribute to decisions we may make to suspend, reduce or withdraw from existing businesses, activities or initiatives, which may result in potential lost revenue or significant restructuring or related costs or exposures. We also face the risk of becoming subject to new or more stringent requirements in connection with the introduction of new regulations or modification of existing regulations, which could require us to hold more capital or liquidity or have other adverse effects on our businesses or profitability. In addition, regulatory responses in connection with severe market downturns or unforeseen stress events may alter or disrupt our planned future strategies and actions.
The monetary, tax and other policies of various governments, agencies and regulatory authorities both in the U.S. and globally have a significant impact on interest rates, currencies, commodity pricing (including oil), the imposition of tariffs or other limitations on international trade and travel, and overall financial market performance, which can impact our business and results of operations. Changes in these policies are beyond our control and can be difficult to predict and we cannot determine the ultimate effect that any such changes would have upon our business, financial condition or results of operations.
The regulatory and supervisory focus of U.S. banking agencies is primarily intended to protect the safety and soundness of the banking system and federally insured deposits, and not to protect investors in our securities. Regulatory and supervisory standards and expectations across jurisdictions may be divergent and otherwise may not conform and/or may be applied in a manner that is not harmonized within a jurisdiction (in relation to national versus non-national financial services providers) and/or across jurisdictions. Additionally, banking regulators have wide supervisory discretion in the ongoing examination and enforcement of applicable banking statutes, regulations, and guidelines, and may restrict our ability to engage in certain activities or acquisitions or may require us to maintain more capital or highly liquid assets.
The U.S. capital rules subject us and our U.S. banking subsidiaries to stringent capital requirements, which could restrict growth, activities or operations, trigger divestiture of assets or operations or limit our ability to return capital to shareholders. See “—Our ability to return capital to shareholders is subject to the discretion of our Board of Directors and may be limited by U.S. banking laws and regulations, including those governing capital and capital planning, applicable provisions of Delaware law and our failure to pay full and timely dividends on our preferred stock.”
The LCR requires us to maintain significant holdings of high-quality and generally lower-yielding liquid assets. In calculating the LCR, we must also determine which deposits should be considered stable deposits. Stable deposits must meet a series of requirements and typically receive favorable outflow treatment under the LCR. BNY Mellon uses qualitative and quantitative analysis to identify core stable deposits. It is possible that our LCR could fall below 100% as a consequence of the inherent uncertainties associated with this analysis (including as a result of regulatory changes or additional guidance from our regulators). In addition to facing potential regulatory consequences (which could be significant), we may be required to remedy this shortfall by liquidating assets in our investment portfolio or raising additional debt, each of which could materially negatively impact our net interest revenue.
The recently finalized NSFR could also require BNY Mellon to further increase its holdings of high-quality, and generally lower-yielding, liquid assets, and to reevaluate the composition of its liabilities structure to include more longer-dated debt.
We develop and submit plans for our rapid and orderly resolution in the event of material financial distress or failure to the Federal Reserve and the FDIC. If the agencies determine that our future submissions are not credible or would not facilitate an orderly resolution under the U.S. Bankruptcy Code, and we fail to address any such deficiencies in a timely manner, we may be subject to more stringent capital or liquidity requirements or restrictions on our growth, activities or operations.
Our global activities are also subject to extensive regulation by various non-U.S. regulators, including governments, securities exchanges, central banks and
Risk Factors (continued)
88 BNY Mellon

other regulatory bodies in the jurisdictions in which we operate, relating to, among other things, the safeguarding, administration and management of client assets and client funds.
Various new, revised and proposed directives and regulations globally have an impact on our provision of many of our products and services. Implementation of, and revisions to, these directives and regulations have affected our operations and risk profile, including the Capital Requirements Directive/Regulation, the Investment Firms Directive/Regulation, the Bank Recovery and Resolution Directive, the Deposit Guarantee Scheme Directive, MiFID II/MiFIR, Market Abuse Regulation, AIFMD, UCITS V, Payment Services Directive II, Securities Financing Transactions Regulation, Central Securities Depositories Regulation, European Market Infrastructure Regulation, EU Benchmark Regulation and Shareholder Rights Directive.
In addition, we are subject in our global operations to rules and regulations relating to corrupt and illegal payments and money laundering, economic sanctions and embargo programs administered by the U.S. Office of Foreign Assets Control and similar bodies and governmental agencies worldwide, and laws relating to doing business with certain individuals, groups and countries, such as the U.S. Foreign Corrupt Practices Act, the USA PATRIOT Act, the Iran Threat Reduction and Syria Human Rights Act of 2012 and the UK Bribery Act. While we have invested and continue to invest significant resources in training and in compliance monitoring, the geographical diversity of our operations, employees, clients and customers, as well as the vendors and other third parties that we deal with, presents the risk that we may be found in violation of such rules, regulations or laws and any such violation could subject us to significant penalties or adversely affect our reputation. In addition, such rules could impact our ability to engage in business with certain individuals, entities, groups and countries, which could materially adversely affect certain of our businesses and results of operations.
As a result of the recent implementation of new privacy-related laws and regulations, including the EU GDPR, the California Consumer Privacy Act of 2018 and the New York Department of Financial Services’ cybersecurity regulation, we have needed to allocate additional time and resources to comply with such laws and regulations, and our potential liability
for non-compliance and reporting obligations in the case of data breaches has significantly increased. In addition, our businesses are increasingly subject to laws and regulations relating to privacy, surveillance, encryption and data localization in the jurisdictions in which we operate. Compliance with these laws and regulations may require us to change our policies, procedures and technology for information security and segregation of data, which could, among other things, make us more vulnerable to operational failures, and to monetary penalties for breach of such laws and regulations.
Failure to comply with laws, regulations or policies, or meet supervisory expectations, applicable to us and our businesses could result in sanctions or enforcement proceedings by regulatory or governmental authorities, civil money penalties and reputational damage, which could have a material adverse effect on our business, financial condition and results of operations. If violations of legal or regulatory requirements do occur, they could damage our reputation, increase our legal and compliance costs, and ultimately adversely impact our results of operations. Laws, regulations or policies currently affecting us and our subsidiaries, supervisory expectations, or regulatory and governmental authorities’ interpretation of statutes and regulations may change at any time, which may adversely impact our business and results of operations.
See “Supervision and Regulation” for additional information regarding the potential impact of the regulatory environment on our business.
Regulatory or enforcement actions or litigation could materially adversely affect our results of operations or harm our businesses or reputation.
Like many major financial institutions, we and our affiliates are the subject of inquiries, investigations, lawsuits and proceedings by counterparties, clients, other third parties, tax authorities and regulatory and other governmental agencies in the U.S. and abroad, as well as the Department of Justice (the “DOJ”) and state attorneys general. See “Legal proceedings” in Note 22 of the Notes to Consolidated Financial Statements for a discussion of material legal and regulatory proceedings in which we are involved. The number of these investigations and proceedings, as well as the amount of penalties and fines sought, has remained elevated for many firms in the financial services industry, including us. We may become
Risk Factors (continued)
BNY Mellon 89
subject to heightened regulatory scrutiny, inquiries or investigations, and potentially client-related inquiries or claims, relating to broad, industry-wide concerns that could lead to increased expenses or reputational damage. The current trend of large settlements by financial institutions with governmental entities may adversely affect the outcomes for other financial institutions in similar actions, especially where governmental officials have announced that the large settlements will be used as the basis or a template for other settlements. Separately, policymakers globally continue to focus on protection of client assets, as well as tax avoidance and evasion.
The complexity of the federal and state regulatory and enforcement regimes in the U.S., coupled with the global scope of our operations and the increased aggressiveness of the tax and regulatory environment worldwide, also means that a single event may give rise to a large number of overlapping investigations and regulatory proceedings, either by multiple federal and state agencies in the U.S. or by multiple regulators and other governmental entities or tax authorities in different jurisdictions. Responding to inquiries, investigations, lawsuits and proceedings, regardless of the ultimate outcome of the matter, is time-consuming and expensive and can divert the attention of our senior management from our business. The outcome of such proceedings may be difficult to predict or estimate until late in the proceedings, which may last a number of years.
Certain of our subsidiaries are subject to periodic examination, special inquiries and potential proceedings by regulatory authorities. If compliance failures or other violations are found during an examination, inquiry or proceeding, a regulatory agency could initiate actions and impose sanctions for violations, including, for example, regulatory agreements, cease and desist orders, civil monetary penalties or termination of a license and could lead to litigation by investors or clients, any of which could cause our earnings to decline.
Our businesses involve the risk that clients or others may sue us, claiming that we or third parties for whom they say we are responsible have failed to perform under a contract or otherwise failed to carry out a duty perceived to be owed to them, including perceived fiduciary or contractual duties. This risk may be heightened during periods when credit, equity or other financial markets are deteriorating in value or are particularly volatile, or when clients or investors
are experiencing losses. As a publicly held company, we are also subject to the risk of claims under the federal securities laws. Volatility in our stock price increases this risk.
Increasingly, regulators, tax authorities and courts have sought to hold financial institutions liable for the misconduct of their clients where such regulators and courts have determined that the financial institution should have detected that the client was engaged in wrongdoing, even though the financial institution had no direct knowledge of the wrongdoing.
Actions brought against us may result in lawsuits, enforcement actions, injunctions, settlements, damages, fines or penalties, which could have a material adverse effect on our financial condition or results of operations or require changes to our business. Claims for significant monetary damages are asserted in many of these legal actions, while claims for disgorgement, penalties and/or other remedial sanctions may be sought in regulatory matters. Although we establish accruals for our litigation and regulatory matters in accordance with applicable accounting guidance, our exposure to such litigation and regulatory matters can be unpredictable, and when those matters proceed to a stage where they present loss contingencies that are both probable and reasonably estimable, there may be a material exposure to loss in excess of any amounts accrued, or in excess of any loss contingencies disclosed as reasonably possible. Such loss contingencies may not be probable and reasonably estimable until the proceedings have progressed significantly, which could take several years and occur close to resolution of the matter.
Each of the risks outlined above could result in increased regulatory supervision and affect our ability to attract and retain customers or maintain access to the capital markets.
Failure to satisfy regulatory standards, including “well capitalized” and “well managed” status or capital adequacy and liquidity rules more generally, could result in limitations on our activities and adversely affect our business and financial condition.
Under U.S. and international regulatory capital adequacy rules and other regulatory requirements, BNY Mellon and our subsidiary banks must meet thresholds that include quantitative measures of
Risk Factors (continued)
90 BNY Mellon
assets, liabilities, and certain off-balance sheet items, subject to qualitative judgments by regulators about components, risk weightings and other factors. As discussed in “Supervision and Regulation,” BNY Mellon is registered with the Federal Reserve as a BHC and an FHC. An FHC’s ability to maintain its status as an FHC is dependent upon a number of factors, including its U.S. bank subsidiaries qualifying on an ongoing basis as “well capitalized” and “well managed” under the banking agencies’ prompt corrective action regulations as well as applicable Federal Reserve regulations. Failure by an FHC or one of its U.S. bank subsidiaries to qualify as “well capitalized” and “well managed,” if unremedied over a period, would cause it to lose its status as an FHC and could affect the confidence of clients in it, compromising its competitive position. Additionally, an FHC that does not continue to meet all the requirements for FHC status could lose the ability to undertake new activities or make acquisitions that are not generally permissible without FHC status or to continue such activities.
The failure by one of our bank subsidiaries to maintain its status as “well capitalized” could lead to, among other things, higher FDIC assessments and could have reputational and associated business consequences.
If we or our subsidiary banks fail to meet U.S. and international minimum capital rules and other regulatory requirements, we may not be able to deploy capital in the operation of our business or distribute capital to stockholders, which may adversely affect our business.
Failure to meet any current or future capital or liquidity requirements, including those imposed by the U.S. capital rules, the LCR, the NSFR, or by regulators in implementing other portions of the Basel III framework, could materially adversely affect our financial condition. Compliance with U.S. and international regulatory capital and liquidity requirements may impact our ability to return capital to shareholders and may impact our operations by requiring us to liquidate assets, increase borrowings, issue additional equity or other securities, or cease or alter certain operations, which may adversely affect our results of operations.
Finally, our regulatory capital ratios, liquidity metrics, and related components are based on our current interpretation, expectations, and
understanding of the applicable rules and are subject to, among other things, ongoing regulatory review, regulatory approval of certain statistical models, additional refinements, modifications or enhancements (whether required or otherwise) to our models, and further implementation guidance. Any modifications resulting from these ongoing reviews or the continued implementation of the U.S. capital rules, the LCR, the NSFR, the resolution planning process, and related amendments could result in changes in our risk-weighted assets, capital components, liquidity inflows and outflows, HQLA, or other elements involved in the calculation of these measures, which could impact these ratios. Further, because operational risk is currently measured based not only upon our historical operational loss experience but also upon ongoing events in the banking industry generally, our level of operational risk-weighted assets could significantly increase or otherwise remain elevated and may potentially be subject to significant volatility, negatively impacting our capital and liquidity ratios. The uncertainty caused by these factors could ultimately impact our ability to meet our goals, supervisory requirements, and regulatory standards.
A failure or circumvention of our controls and procedures could have a material adverse effect on our business, financial condition, results of operations and reputation.
Management regularly reviews and updates our internal controls, disclosure controls and procedures, and corporate governance policies and procedures. Any system of controls, however well designed and operated, is based in part on certain assumptions and can provide only reasonable, not absolute, assurances that the objectives of the system will be met. Any failure or circumvention of our controls and procedures or failure to comply with regulations related to controls and procedures could have a material adverse effect on our business, reputation, results of operations and financial condition. If we identify material weaknesses in our internal control over financial reporting or are otherwise required to restate our financial statements, we could be required to implement expensive and time-consuming remedial measures and could lose investor confidence in the accuracy and completeness of our financial reports. In addition, there are risks that individuals, either employees or contractors, may circumvent established control mechanisms in order to, for
Risk Factors (continued)
BNY Mellon 91

example, exceed exposure, liquidity, trading or investment management limitations, or commit fraud.
Market Risk
We are dependent on fee-based business for a substantial majority of our revenue and our fee-based revenues could be adversely affected by slowing in market activity, weak financial markets, underperformance and/or negative trends in savings rates or in investment preferences.
Our principal operational focus is on fee-based business, which is distinct from commercial banking institutions that earn most of their revenues from loans and other traditional interest-generating products and services. In 2020, 80% of our total revenue was fee-based. Our fee-based businesses include investment and wealth management, custody, corporate trust, depositary receipts, clearing, collateral management and treasury services, which are highly competitive businesses.
Fees for many of our products and services are based on the volume of transactions processed, the market value of assets managed and/or administered, securities lending volume and spreads, and fees for other services rendered. Corporate actions, cross-border investing, global mergers and acquisitions activity, new debt and equity issuances, and secondary trading volumes, among other things, all affect the level of our fee revenue. If the volume of these activities decreases due to low client activity, weak financial markets or otherwise, our fee-based revenues will also decrease, which would negatively impact our results of operations.
If our Investment and Wealth Management business experiences poor investment returns due to weak market conditions or underperformance (relative to competitors or benchmarks), the market values of the portfolios that we manage will be lower (on a relative basis) and our ability to retain existing assets and/or attract new client assets may be impacted. Market and regulatory trends have also resulted in increased demand for lower fee investment and wealth management products and services, and lower performance-fee structures, both of which have impacted and may continue to impact our fee revenue. Some of these dynamics have also negatively impacted our Investment Services business fees and any of these dynamics may also occur in the future. Significant declines in the volume of capital
markets activity would reduce the number of transactions we process and the amount of securities we lend and therefore would also have an adverse effect on our results of operations. Our business generally benefits when individuals invest their savings in mutual funds and other collective funds, unit investment trusts or exchange-traded funds, or contribute more to defined contribution plans.
When our investment management revenues decline, we may have, and in the past have had, declines in the fair value in our Investment Management reporting unit, one of the two reporting units in our Investment and Wealth Management segment. If the fair value of the Investment Management reporting unit declines below its carrying value, we would be required to take an impairment charge.
Weakness and volatility in financial markets and the economy generally may materially adversely affect our business, financial condition and results of operations.
As a financial institution, our Investment Management, Wealth Management, Pershing, Depositary Receipts and Markets, including Securities Lending, businesses, are particularly sensitive to economic and market conditions, including in the capital and credit markets. When these markets are volatile or disruptive, we could experience a decline in our marked-to-market assets, including in our securities portfolio and seed capital, as well as a market value reduction in the portfolios that we manage that generate investment and wealth management fees. Our results of operations, including investment and wealth management fees, may be materially affected by conditions in the financial markets and the economy generally, both in the U.S. and elsewhere around the world.
Foreign exchange trading that we execute for clients generates revenues which are primarily driven by the volume of client transactions and the spread realized on these transactions, both of which are impacted by market volatility and the impact of foreign exchange hedging activities. Our clients’ cross-border investing activity could decrease in reaction to economic and political uncertainties, including changes in laws or regulations governing cross-border transactions, such as currency controls or tariffs. Volumes and/or spreads in some of our products tend to benefit from currency volatility and are likely to decrease during times of lower currency volatility.
Risk Factors (continued)
92 BNY Mellon
Such revenues also depend on our ability to manage the risk associated with the currency transactions we execute and program pricing.
A variety of factors impact global economies and financial markets, including interest rates and their associated yield curves, commodity pricing, market and political instabilities, volatile debt and equity market values, the strength of the U.S. dollar, the imposition of tariffs or other limitations on international trade or travel, high unemployment and governmental budget deficits (including, in the U.S., at the federal, state and municipal levels), contagion risk from possible default by other countries on sovereign debt, declining business and consumer confidence, and the risk of increased inflation. Any resulting economic pressure on consumers and lack of confidence in the financial markets may adversely affect our business, financial condition and results of operations. Additionally, global economies and financial markets may be adversely affected by widespread health emergencies or pandemics, natural disasters or other geopolitical events (or concerns over the possibility of such events). In particular, we face the following risks in connection with these factors, some of which are discussed at greater length in separate risk factors:
• Geopolitical tension and economic instability in countries around the world can at times increase the demand for low-risk investments, particularly in U.S. Treasuries and the dollar. A “flight to safety” has historically increased BNY Mellon’s balance sheet, which has negatively impacted, and could continue to negatively impact, our leverage-based regulatory capital measures. A sustained “flight to safety” has historically triggered a decline in trading, capital markets and cross-border activity which would likely decrease our revenue, negatively impacting our results of operations, financial condition and, if sustained in the long term, our business.
• The fees earned by our Investment Management and Wealth Management businesses are higher as assets under management and/or investment performance increase. Those fees are also impacted by the composition of the assets under management, with higher fees for some asset categories as compared to others. Uncertain and volatile capital markets, particularly declines, could result in movements from higher to lower fee products and/or reductions in our assets under management because of investors’ decisions to
withdraw assets or from simple declines in the value of assets under management as markets decline. At Dec. 31, 2020, we estimated that a 5% change in global equity markets, spread evenly throughout the year, would impact fee revenue by less than 1% and diluted earnings per common share by $0.03 to $0.06.
• Market conditions resulting in lower transaction volumes could have an adverse effect on the revenues and profitability of certain of our businesses such as clearing, settlement, payments and trading.
• Uncertain and volatile capital markets, particularly declines, could reduce the value of our investments in securities, including pension and other post-retirement plan assets and produce downward pressure on our stock price and credit availability without regard to our underlying financial strength.
• Derivative instruments we hold for our own account to hedge and manage our exposure to market risks, including interest rate risk, equity price risk, foreign currency risk and credit risk associated with our products and businesses might not perform as intended or expected, resulting in higher realized losses and unforeseen stresses on liquidity. Our derivatives-based hedging strategies also rely on the performance of counterparties to such derivatives. These counterparties may fail to perform for various reasons resulting in losses on under-collateralized positions.
• A decline in oil prices may negatively impact capital markets and the ability of certain of our clients, including oil and gas exploration and production companies and sovereign funds in oil-exporting countries, to continue using our services. Increased defaults among oil and gas exploration and production companies may also negatively impact the high-yield market and our high-yield funds.
• The process we use to estimate our projected credit losses and to ascertain the fair value of securities held by us is subject to uncertainty in that it requires use of statistical models and difficult, subjective and complex judgments, including forecasts of economic conditions and how these conditions might impair the ability of our borrowers and others to meet their obligations. In uncertain and volatile capital markets, our ability to estimate our projected
Risk Factors (continued)
BNY Mellon 93

credit losses may be impaired, which could adversely affect our overall profitability and results of operations. For a discussion of our management of market risk, see “Risk Management – Market Risk.”
Changes in interest rates and yield curves have had, and may in the future continue to have, a material adverse effect on our profitability.
We earn revenue, known as “net interest revenue,” on the difference between the interest income earned on our interest-earning assets, such as the loans we make and the securities we hold in our investment securities portfolio, and the interest expense incurred on our interest-bearing liabilities, such as deposits and borrowed money. Additionally, we may earn net interest revenue on certain interest-earning assets and interest-bearing liabilities, such as reverse repurchase agreements and repurchase agreements, respectively. Our net interest margin, which is the result of dividing net interest revenue by average interest-earning assets, is sensitive to changes in the spread between short-term and long-term interest rates (the “yield curve”). Our net interest revenue tends to increase when the yield curve steepens and decrease when the yield curve flattens or inverts. A flattening of the yield curve, on its own or together with the current low interest rate environment, may continue to adversely impact our revenue and results of operations by compressing our net interest spreads, particularly if we are unable to replace our higher-yielding maturing assets with assets of comparable yields, which will constrain our ability to grow net interest revenue.
The decrease in rates in the past year, and any further future rate decreases toward 0% will likely adversely impact our net interest revenue and results of operations due to:
• continued compression of our net interest spreads, depending on our balance sheet position;
• constraints on our ability to achieve net interest revenue consistent with historical averages;
• sustained weakness of our spread-based revenues, resulting in continued voluntary waiving of particular fees on certain money market mutual funds and related distribution fees in order to prevent the yields on such funds from becoming uneconomic; or
• adverse impacts on the value of fixed-rate mortgage-backed securities we hold if there are increases in mortgage prepayment speeds, which can be caused by refinancing activity.
A rise in rates could trigger one or more of the following, which could adversely impact our business, financial condition and results of operations, including:
• less liquidity in bonds and fixed-income funds in the case of a sharp rise in interest rates resulting in lower performance, yield and fees;
• increased number of delinquencies, bankruptcies or defaults and more nonperforming assets and net charge-offs, as borrowers may have more difficulty making higher interest payments;
• higher redemptions from our fixed-income funds or separate accounts, as clients move funds into investments with higher rates of return;
• decreases in deposit levels, which may reduce our LCR and NSFR;
• reduction in accumulated other comprehensive income in our shareholders’ equity and therefore our tangible common equity due to the impact of rising long-term rates on our available-for-sale securities in our investment portfolio, which could negatively impact our risk-based and leverage based regulatory capital ratios; or
• higher funding costs.
A more detailed discussion of the interest rate and market risks we face is contained in “Risk Management.”
We may experience losses on securities related to volatile and illiquid market conditions, reducing our earnings and impacting our financial condition.
We maintain an investment securities portfolio of various holdings, types and maturities. At Dec. 31, 2020, approximately 69% of these securities were classified as available-for-sale, which are recorded on our balance sheet at fair value with unrealized gains or losses reported as a component of accumulated other comprehensive income, net of tax. The securities in our held-to-maturity portfolio, recorded on our balance sheet at amortized cost, were approximately 31% of our securities portfolio at Dec. 31, 2020. Our available-for-sale securities portfolio, to the extent unhedged, may have more volatility than
Risk Factors (continued)
94 BNY Mellon
a portfolio comprised exclusively of U.S. Treasury securities or a more traditional loan portfolio.
Our investment securities portfolio represents a greater proportion of our consolidated total assets (approximately 33% at Dec. 31, 2020), in comparison to many other major U.S. financial institutions due to our custody and trust bank business model. As such, our capital levels and results of operations and financial condition are materially exposed to the risks associated with our investment securities portfolio.
We reserve for current expected credit losses with respect to our available-for-sale and held-to-maturity securities. Credit losses in excess of our allowance for credit losses would impact our results of operations. Many of these securities experienced significant liquidity, valuation and credit quality deterioration during the 2008 financial crisis and could experience similar deteriorations in the future.
Under the U.S. capital rules, after-tax changes in the fair value of available-for-sale investment securities are included in CET1 capital. Since held-to-maturity securities are not subject to fair-value accounting, changes in the fair value of these instruments (other than expected credit losses) are not similarly included in the determination of CET1 capital. As a result, we may experience increased variability in our CET1 capital relative to those major financial institutions who maintain a lower proportion of their consolidated total assets in an available-for-sale accounting classification.
Generally, the fair value of available-for-sale securities is determined based on market prices available from third-party sources. During periods of market disruption, it may be difficult to value certain of our investment securities if trading becomes less frequent and/or market data becomes less observable. As a result, valuations may include inputs and assumptions that are less observable or require greater estimation and judgment as well as valuation methods which are more complex. These values may not be ultimately realizable in a market transaction, and such values may change very rapidly as market conditions change and valuation assumptions are modified. Decreases in value may have a material adverse effect on our results of operations or financial condition. The decision on whether to record a credit loss is determined in part by management’s assessment of the financial condition and prospects of a particular issuer, projections of future cash flows and
recoverability of the particular security. Management’s conclusions on such assessments are highly judgmental and include assumptions and projections of future cash flows which may ultimately prove to be incorrect as assumptions, facts and circumstances change. On the other hand, we are limited in the actions we can take related to our held-to-maturity securities absent a significant deterioration in the issuer’s creditworthiness. Therefore, we may be constrained in our ability to liquidate a held-to-maturity security that is deteriorating in value, which would negatively impact the fair value of our securities portfolio. If our determinations change about our intention or ability to not sell available-for-sale securities that have experienced a reduction in fair value below their amortized cost, we could be required to recognize a loss in earnings for the entire difference between fair value and amortized cost.
For information regarding our investment securities portfolio, refer to “Consolidated balance sheet review – Securities” and for information regarding the sensitivity of and risks associated with the market value of portfolio investments and interest rates, refer to “Critical accounting estimates – Fair value – Securities.”
Transitions away from and the replacement of LIBOR and other IBORs could adversely impact our business, financial condition and results of operations.
In 2017, the UK Financial Conduct Authority (the “FCA”) stated its intention that it would no longer be necessary for the FCA to persuade, or compel, contributing banks to submit rates for the calculation of LIBOR after 2021. However, the administrator for LIBOR has announced a proposal to extend the publication of the most commonly used U.S. dollar LIBOR settings to June 30, 2023 and to cease publishing other LIBOR settings on December 31, 2021. In addition, the U.S. bank regulators have issued guidance strongly encouraging banking organizations to cease using U.S. dollar LIBOR as a reference rate in new contracts as soon as practicable and in any event by December 31, 2021. Accordingly, although there may be a period of time after 2021 during which IBORs for certain tenors or currencies may continue to be published, globally, financial market participants have begun to transition away from IBORs. This transition is further supported by the requirements of the EU Benchmarks
Risk Factors (continued)
BNY Mellon 95
Regulation, which no longer permits IBORs that rely on quotes or estimates submitted by contributing banks that are not anchored in transaction-based data.
Various regulators, industry bodies and other market participants in the United States and other countries are engaged in initiatives to develop, introduce and encourage the use of alternative rates to replace certain benchmarks. However, the introduction of, and adoption of, successor rates has been slow. In the United States, the Secured Overnight Financing Rate (“SOFR”) has been identified by the Alternate Reference Rates Committee convened by the Federal Reserve as the alternative benchmark rate to U.S. dollar LIBOR. However, there is no assurance that SOFR or other alternative benchmark rates will be accepted or widely used by market participants. The characteristics of these new rates may not be identical to, or produce the exact economic equivalent of, the benchmarks they seek to replace. During the recent coronavirus pandemic period, there has been more volatility in relation to SOFR as compared to LIBOR. The SOFR markets, including the swap market, have not yet developed into robust markets, which may present continuing risks as the IBOR cessation date approaches.
If a particular benchmark were to be discontinued and an alternative rate had not yet been successfully introduced to replace that benchmark, this could result in widespread dislocation in the financial markets, engendering volatility in the pricing of securities, derivatives and other instruments, and suppressing capital markets activities, all of which could have adverse effects on our results of operations. Transitions to SOFR and other alternative rates or benchmarks may cause LIBOR (in the case of LIBOR-linked instruments that have not yet transitioned) or the applicable alternative benchmark rates to perform differently, or have other consequences which cannot be predicted. In the event any such benchmark or other referenced financial metric is significantly changed or discontinued (for example, when LIBOR and other IBORs cease to be published), or are no longer recognized as an acceptable benchmark, there may be uncertainty as to the calculation of the applicable interest rate or payment amount for certain financial instruments or contracts, depending on the terms of the governing instrument. In addition, even if the method of calculation of a fallback rate is clear, the resulting interest rate or payment amount may be
different than the interest rate or payment amount that would have applied based on the original benchmark.
We may be adversely impacted by the changes involving LIBOR and other benchmark rates as a result of our business activities and our underlying operations. We utilize benchmark rates in a variety of agreements and instruments and are responsible for the use of benchmark rates in a variety of capacities, as well as in our operational functions. We could be subject to claims from customers, counterparties, investors or regulators alleging that, notwithstanding any uncertainty around the rate environment, we did not correctly discharge our responsibilities. We could also face claims in connection with the interpretation and implementation of fallback provisions. LIBOR transition presents various challenges related to contractual mechanics of existing floating rate financial instruments and contracts that reference LIBOR and mature after the applicable setting is expected to cease to be published. Certain of these instruments and contracts do not provide for alternative benchmark rates, which makes it unclear what the future benchmark rates would be after LIBOR’s cessation. Moreover, particular contracts may require fallback rates that are different from the most widely used alternative to LIBOR.
Fluctuations in interest rates triggered by the transition away from LIBOR and other IBORs could adversely affect the availability or cost of floating-rate funding. We could experience losses on a product or have to pay more or receive less on securities that we own or have issued. We may also not be able to successfully amend or renegotiate IBOR-based agreements and instruments, which could have an adverse impact including, in some cases, resulting in those agreements and instruments bearing interest at a fixed rate (rather than a floating rate) based on the last IBOR rate that was able to be determined under the document. A variety of factors may affect the transition from existing IBOR-based rates to alternative benchmark rates, including, for example, whether transactions that serve as the basis for alternative benchmark rates and IBOR-based rates are similarly secured (or unsecured) transactions, or are of a similar tenor.
Divergences between existing IBOR-based and alternative benchmark rates (or rates fixed at the last determined IBOR rate) may result in our hedges being ineffective. In addition, uncertainty relating to LIBOR or another benchmark could result in, and in
Risk Factors (continued)
96 BNY Mellon
some cases have resulted in, pricing volatility, increased capital requirements, loss of market share in certain products, adverse tax or accounting consequences, higher compliance, legal and operational costs, increased difficulty in estimating our net interest revenue, and risks associated with client disclosures, discretionary actions taken or negotiation of fallback provisions, and disruption of business continuity, systems and models, all of which may adversely impact our business and results of operations. Use of alternative benchmark rates may also, in some cases, be limited or prohibited by contract, law or regulation.
There can be no assurance that we, other market participants, clients and vendors will be adequately prepared for an actual discontinuation of IBORs, that existing assets and liabilities based on or linked to IBORs will transition successfully to alternative benchmark rates or that appropriate systems and analytics would be developed for one or more alternative benchmark rates, any of which could adversely impact our business, financial condition and results of operations.
Following the end of the transition period, the UK and the EU have not agreed to alternatives to the “passporting rights,” which may result in negative effects on global economic conditions, global financial markets, and our business, financial condition and results of operations.
The UK exit from the EU transition period ended on Dec. 31, 2020. The EU-UK Agreement entered into force and became provisionally effective on Dec. 31, 2020. The EU-UK Agreement is subject to ratification by the European Parliament before becoming fully effective. Under the EU-UK Agreement, the EU and UK have, amongst other things, agreed to make their best endeavors to establish a framework for structured regulatory cooperation on financial services. There is no agreement between the EU and UK to continue “passporting rights.”
As the EU-UK Agreement does not include in-depth arrangements for the provision of financial services, there is some uncertainty with regard to the extent of divergent regulatory standards going forward, which may affect operational capabilities and could lead to increased operational, regulatory and compliance costs. The effects of the UK’s exit from the EU, including those described above, could adversely
affect our business, financial condition and results of operations.
We have executed plans that have adjusted our business and operations so we may continue providing our products and services to our UK and EU clients after the UK’s withdrawal from the EU and the end of the transition period. However, given the potential negative disruption to regional and global financial markets, our results of operations and business prospects could be negatively affected. For additional information regarding Brexit, see “Supervision and Regulation – Effects of “Brexit” on UK Regulatory Framework.”
Credit Risk
The failure or perceived weakness of any of our significant clients or counterparties, many of whom are major financial institutions or sovereign entities, and our assumption of credit and counterparty risk, could expose us to loss and adversely affect our business.
We have exposure to clients and counterparties in many different industries, particularly financial institutions, as a result of trading, clearing and financing, providing custody services, securities lending services or other relationships. We routinely execute transactions with global clients and counterparties in the financial industry as well as sovereigns and other governmental or quasi-governmental entities. Our direct exposure consists of extensions of secured and unsecured credit to clients and use of our balance sheet. In addition to traditional credit activities, we also extend intraday credit in order to facilitate our various processing, settlement and intermediation activities. Our ability to engage in funding or other transactions could be adversely affected by the actions and commercial soundness of other financial institutions or sovereign entities, as defaults or non-performance (or even uncertainty concerning such default or non-performance) by one or more financial institutions, or the financial services industry generally, have in the past led to market-wide liquidity problems and could lead to losses or defaults by us or by other institutions (including our counterparties and/or clients) in the future. The consolidation and failures of financial institutions during the 2008 financial crisis increased the concentration of our client and counterparty risk.
Risk Factors (continued)
BNY Mellon 97
As a result of our membership in several industry clearing or settlement exchanges and central counterparty clearinghouses, we may be required to guarantee obligations and liabilities or provide financial support in the event that other members do not honor their obligations or default. These obligations may be limited to members that dealt with the defaulting member or to the amount (or a multiple of the amount) of our contribution to a clearing or settlement exchange guarantee fund, or, in a few cases, the obligation may be unlimited.
The degree of client demand for short-term credit tends to increase during periods of market turbulence. For example, investors in mutual funds for which we act as custodian may engage in significant redemption activity due to adverse market or economic conditions. We may then extend intraday credit to our fund clients in order to facilitate their ability to pay such redemptions. In addition, during periods of market turbulence, draws under committed revolving credit facilities that we provide to our institutional clients may increase substantially. Such client demand may negatively impact our leverage-based capital ratios, and in times of sustained market volatility, may result in significant leverage-based ratio declines.
When we provide credit to clients in connection with providing cash management, clearing, custodial and other services, we are exposed to potential loss if the client experiences credit difficulties. We are also generally not able to net exposures across affiliated clients or counterparties and may not be able to net exposures to the same legal entity across multiple products. In addition, we may incur a loss in relation to one entity or product even though our exposure to one of the entities’ affiliates is over-collateralized. Moreover, not all of our client or counterparty exposure is secured.
In our agency securities lending program, we act as agent on behalf of our clients, the lenders of securities, in securities lending transactions with our clients’ counterparties (including broker-dealers), acting as borrowers, wherein securities are lent by our clients and the securities loans are collateralized by cash or securities posted by such counterparties. Typically, in the case of cash collateral, our clients authorize us as their agent to invest the cash collateral in approved investments pursuant to each client’s investment guidelines and instructions. Such approved investments may include reverse repurchase
transactions with repo counterparties. In many cases, in the securities loans we enter into on behalf of our clients, we agree to replace the client’s loaned securities that the borrower fails to return due to certain defaults by the borrower, mainly the borrower’s insolvency. Therefore, in situations where the market value of the loaned securities that the borrower fails to return to a client (which loaned securities we are obligated to replace and return to the client) exceeds the amount of proceeds resulting from the liquidation of the client’s approved investments and cash and non-cash collateral of such client, we may be responsible for the shortfall amount necessary to purchase any replacement securities. In addition, in certain cases, we may also assume the risk of loss related to approved investments that are reverse repurchase transactions as described above. In these two scenarios, we, rather than our clients, are exposed to the risks of the defaulting counterparty in the securities lending transactions and, where applicable, in the reverse repurchase transactions. For further discussion on our securities lending indemnifications, see “Commitments and contingent liabilities – Off-balance sheet arrangements” in Note 22 of the Notes to Consolidated Financial Statements.
From time to time, we assume concentrated credit risk at the individual obligor, counterparty or group level, potentially exposing us to a single market or political event or a correlated set of events. For example, we may be exposed to defaults by companies located in countries with deteriorating economic conditions or by companies in certain industries. Such concentrations may be material. Our material counterparty exposures change daily, and the counterparties or groups of related counterparties to which our risk exposure is material also vary during any reported period; however, our largest exposures tend to be to other financial institutions, clearing organizations, and governmental entities, both inside and outside the U.S. Concentration of counterparty exposure presents significant risks to us and to our clients because the failure or perceived weakness of our counterparties (or in some cases of our clients’ counterparties) has the potential to expose us to risk of financial loss. Changes in market perception of the financial strength of particular financial institutions or sovereign issuers can occur rapidly, are often based on a variety of factors and are difficult to predict.
Although our overall business is subject to these interdependencies, several of our businesses are
Risk Factors (continued)
98 BNY Mellon

particularly sensitive to them, including our currency and other trading activities, our securities lending and securities finance businesses and our investment management business. If we experience any of the losses described above, it may materially and adversely affect our results of operations.
We are also subject to the risk that our rights against third parties may not be enforceable in all circumstances. In addition, deterioration in the credit quality of third parties whose securities or obligations we hold, including a deterioration in the value of collateral posted by third parties to secure their obligations to us under derivatives contracts and other agreements, could result in losses and/or adversely affect our ability to rehypothecate or otherwise use those securities or obligations for liquidity purposes. Disputes with clients and counterparties as to the valuation of collateral can significantly increase in times of market stress and illiquidity. In addition, disruptions in the liquidity or transparency of the financial markets may result in our inability to sell, syndicate or realize the value of our positions, thereby leading to increased concentrations. An inability to reduce our positions may not only increase the market and credit risks associated with such positions, but may also increase the level of RWA on our balance sheet, thereby increasing our capital requirements and funding costs, all of which could adversely affect the operations and profitability of our businesses.
Under U.S. regulatory restrictions on credit exposure, which include a broadening of the measure of credit exposure, we are required to limit our exposures to specific obligors or groups, including financial institutions. These regulatory credit exposure restrictions may adversely affect our businesses and may require us to modify our operating models or the policies and practices we use.
We could incur losses if our allowance for credit losses, including loan and lending-related commitment reserves, is inadequate or if our expectations of future economic conditions deteriorate.
When we loan money, commit to loan money or provide credit or enter into another contract with a counterparty, we incur credit risk, or the risk of loss if our borrowers do not repay their loans or our counterparties fail to perform according to the terms of their agreements. Our revenues and profitability are adversely affected when our borrowers default, in
whole or in part, on their loan obligations to us or when there is a significant deterioration in the credit quality of our loan portfolio. We reserve for potential future credit losses by recording a provision for credit losses through earnings. The allowance for loan losses and allowance for lending-related commitments represents management’s estimate of current expected credit losses over the lifetime of the related credit exposure taking into account relevant information about past events, current conditions and reasonable and supportable forecasts of future economic conditions that affect the collectability of our loans and lending commitments. We use a quantitative methodology and qualitative framework for determining the allowance for loan losses and the allowance for lending-related commitments. Within this qualitative framework, management applies judgment when assessing internal risk factors and environmental factors to compute an additional allowance for each component of the loan portfolio. As is the case with any such judgments, we could fail to identify these factors or accurately estimate their impact. We cannot provide any assurance as to whether charge-offs related to our credit exposure may occur in the future. Current and future market and economic developments may increase default and delinquency rates and negatively impact the quality of our credit portfolio, which may impact our charge-offs. Although our estimates contemplate current conditions and how we expect them to change over the life of the portfolio, it is reasonably possible that actual conditions could be worse than anticipated in those estimates, which could materially affect our results of operations and financial condition. See “Critical accounting estimates.”
Capital and Liquidity Risk
Our business, financial condition and results of operations could be adversely affected if we do not effectively manage our liquidity.
BNY Mellon’s operating model and overall strategy rely heavily on our access to financial market utilities and global capital markets. Without such access, it would be difficult to process payments and settle and clear transactions on behalf of our clients. Deterioration in our liquidity position, whether actual or perceived, can impact our market access by affecting participants’ willingness to transact with us. Changes to our liquidity can be caused by various factors, such as funding mismatches, market constraints disabling asset to cash conversion,
Risk Factors (continued)
BNY Mellon 99
inability to issue debt, run-offs of core deposits, and contingent liquidity events such as additional collateral posting. Changes in economic conditions or exposure to credit, market, operational, legal and reputational risks can also affect our liquidity.
Our business is dependent in part on our ability to meet our cash and collateral obligations at a reasonable cost for both expected and unexpected cash flows. We also must manage liquidity risks on an intraday basis, in a manner designed to ensure that we can access required funds during the business day to make payments or settle immediate obligations, often in real time. We receive client deposits through a variety of investment management and investment servicing businesses and we rely on those deposits as a low-cost and stable source of funding. Our ability to continue to receive those deposits, and other short-term funding sources, is subject to variability based on a number of factors, including volume and volatility in the global securities markets, the relative interest rates that we are prepared to pay for those deposits, and the perception of the safety of those deposits or other short-term obligations relative to alternative short-term investments available to our clients. We could lose deposits if we suffer a significant decline in the level of our business activity, our credit ratings are materially downgraded, interest rates rise, or we are subject to significant negative press or significant regulatory action or litigation, among other reasons. Our liquidity could also be adversely affected by customers’ withdrawal of deposits in response to volatility and disruptions in the financial market or a stress event. If we were to lose a significant amount of deposits we may need to replace such funding with more expensive funding and/or reduce assets, which would reduce our net interest revenue.
In addition, our access to the debt capital markets is a significant source of liquidity. Events or circumstances often outside of our control, such as market disruptions, government fiscal and monetary policies, or loss of confidence by securities purchasers or counterparties in us or in the funds markets, could limit our access to capital markets, increase our cost of borrowing, adversely affect our liquidity, or impair our ability to execute our business plan. In addition, clearing organizations, regulators, clients and financial institutions with which we interact may exercise the right to require additional collateral based on market perceptions or market conditions, which could further impair our access to
and cost of funding. Market perception of sovereign default risks can also lead to inefficient money markets and capital markets, which could further impact BNY Mellon’s funding availability and cost. Conversely, excess liquidity inflows could increase interest expense, limit our financial flexibility, and increase the size of our total assets in a manner that could have a negative impact on our capital ratios.
Under the U.S. capital rules, the size of the capital surcharge that applies to U.S. G-SIBs is based in part on its reliance on short-term wholesale funding, including certain types of deposit funding, which may increase the cost of such funding. Furthermore, certain non-U.S. authorities require large banks to incorporate a separate subsidiary in countries in which they operate, and to maintain independent capital and liquidity at foreign subsidiaries. These requirements could hinder our ability to efficiently manage our funding and liquidity in a centralized manner, requiring us to hold more capital and liquidity overall.
In addition, our cost of funding could be affected by actions that we may take in order to satisfy applicable LCR and NSFR requirements, to lower our G-SIB surcharge, to satisfy the amount of eligible long-term debt outstanding under the TLAC rule, to address obligations under our resolution plan or to satisfy regulatory requirements in non-U.S. jurisdictions relating to the pre-positioning of liquidity in certain subsidiaries.
If we are unable to raise funds using the methods described above, we would likely need to finance or liquidate unencumbered assets, such as our central bank deposits and bank placements, or securities in our investment portfolio to meet funding needs. We may be unable to sell some of our assets, or we may have to sell assets at a discount from market value, either of which could adversely affect our business, financial condition and results of operations. Further, our ability to sell assets may be impaired if other market participants are seeking to sell similar assets at the same time, which could occur in a liquidity or other market crisis. Additionally, if we experience cash flow mismatches, deposit run-off or market constraints resulting from our inability to convert assets to cash or access capital markets, our liquidity could be severely impacted. During periods of market uncertainty, our level of client deposits has in recent years tended to increase; however, because these deposits have high potential run-off rates, we
Risk Factors (continued)
100 BNY Mellon

have historically deposited these so-called excess deposits with central banks and in other highly liquid and low-yielding instruments.
If we are unable to continue to fund our assets through deposits or access capital markets on favorable terms or if we suffer an increase in our borrowing costs or otherwise fail to manage our liquidity effectively, our liquidity, net interest margin, financial results and condition may be materially adversely affected. In certain cases, this could require us to raise additional capital through the issuance of preferred or common stock, which could dilute the ownership of existing stockholders and/or reduce our common stock dividend to preserve capital. For a further discussion of our liquidity, see “Liquidity and dividends.”
The Parent is a non-operating holding company, and as a result, is dependent on dividends from its subsidiaries and extensions of credit from its IHC to meet its obligations, including with respect to its securities, and to provide funds for share repurchases and payment of dividends to its stockholders.
The Parent is a non-operating holding company, whose principal assets and sources of income are its principal U.S. bank subsidiaries—The Bank of New York Mellon and BNY Mellon, N.A.—and its other subsidiaries, including the IHC. The Parent is a legal entity separate and distinct from its banks, the IHC and other subsidiaries. Therefore, the Parent primarily relies on dividends, interest, distributions, and other payments from its subsidiaries, including extensions of credit from the IHC, to meet its obligations, including with respect to its securities, and to provide funds for share repurchases and payment of common and preferred dividends to its stockholders, to the extent declared by the Board of Directors.
There are various limitations on the extent to which our banks and other subsidiaries can finance or otherwise supply funds to the Parent (by dividend or otherwise) and certain of our affiliates. Each of these restrictions can reduce the amount of funds available to meet the Parent’s obligations. Many of our subsidiaries, including our bank subsidiaries, are subject to laws and regulations that restrict dividend payments or authorize regulatory bodies to block or reduce the flow of funds from those subsidiaries to the Parent or other subsidiaries. In addition, our bank
subsidiaries would not be permitted to distribute a dividend if doing so would constitute an unsafe and unsound practice or if the payment would reduce their capital to an inadequate level. Our subsidiaries may also choose to restrict dividend payments to the Parent in order to increase their own capital or liquidity levels. Our bank subsidiaries are also subject to restrictions on their ability to lend to or transact with non-bank affiliates, minimum regulatory capital and liquidity requirements, and restrictions on their ability to use funds deposited with them in bank or brokerage accounts to fund their businesses. See “Supervision and Regulation” and “Liquidity and dividends” and Note 19 of the Notes to Consolidated Financial Statements. Further, we evaluate and manage liquidity on a legal entity basis, which may place legal and other limitations on our ability to utilize liquidity from one legal entity to satisfy the liquidity requirements of another, including the Parent.
There are also limitations specific to the IHC’s ability to make distributions or extend credit to the Parent. The IHC is not permitted to pay dividends to the Parent if certain key capital, liquidity and operational risk indicators are breached, and if the resolution of the Parent is imminent, the committed lines of credit provided by the IHC to the Parent will automatically terminate, with all outstanding amounts becoming due. See “The application of our Title I preferred resolution strategy or resolution under the Title II orderly liquidation authority could adversely affect the Parent’s liquidity and financial condition and the Parent’s security holders.”
Because the Parent is a holding company, its rights and the rights of its creditors, including the holders of its securities, to a share of the assets of any subsidiary upon the liquidation or recapitalization of the subsidiary, will be subject to the prior claims of the subsidiary’s creditors (including, in the case of our banking subsidiaries, their depositors) except to the extent that the Parent may itself be a creditor with recognized claims against the subsidiary. The rights of holders of securities issued by the Parent to benefit from those distributions will also be junior to those prior claims. Consequently, securities issued by the Parent will be effectively subordinated to all existing and future liabilities of our subsidiaries.
Our ability to return capital to shareholders is subject to the discretion of our Board of Directors and may be limited by U.S. banking laws and
Risk Factors (continued)
BNY Mellon 101
regulations, including those governing capital and capital planning, applicable provisions of Delaware law and our failure to pay full and timely dividends on our preferred stock.
Holders of our common and preferred stock are only entitled to receive such dividends or other distributions of capital as our Board of Directors may declare out of funds legally available for such payments. Although we have historically declared cash dividends on our common and preferred stock, we are not required to do so. In addition to the Board of Directors’ approval, our ability to take certain actions, including our ability to declare dividends or repurchase our common stock, may be subject to limitations in connection with the CCAR process and the buffers under the Federal Reserve’s capital and TLAC rules. Through the CCAR process, we may be required to resubmit our capital plan in the event of a deterioration in the general financial markets or economy or changes in our risk profile (including a material change in business strategy or risk exposure), financial condition or corporate structure. For example, in connection with the coronavirus pandemic of 2020, the Federal Reserve required all banking institutions subject to CCAR, including us, to resubmit their capital plans based on updated supervisory scenarios released by the Federal Reserve, and imposed limitations on capital distributions and share repurchases by such banking institutions. See “– The coronavirus pandemic is adversely affecting us and creates significant risks and uncertainties for our business, and the ultimate impact of the pandemic on us will depend on future developments, which are highly uncertain and cannot be predicted.” The Federal Reserve is also able, outside the CCAR process, to restrict our ability to make capital distributions and subject us to other supervisory or enforcement actions.
Although the “non-objection” framework from CCAR no longer applies to BNY Mellon, we will continue to be subject to a rigorous evaluation of our capital planning processes. A Federal Reserve determination that our capital planning processes were weak could have a variety of adverse consequences, including, without limitation, ratings downgrades, ongoing heightened supervisory scrutiny, expenses associated with remediation activities, and potentially an enforcement action, as a result of failing to meet supervisory expectations.
A failure to increase dividends along with our competitors, or any reduction of, or elimination of, our common stock dividend would likely adversely affect the market price of our common stock, impact our return on equity and market perceptions of BNY Mellon.
Our ability to declare or pay dividends on, or purchase, redeem or otherwise acquire, shares of our common stock or any of our shares that rank junior to our preferred stock as to the payment of dividends and/or the distribution of any assets on any liquidation, dissolution or winding-up of BNY Mellon will be prohibited, subject to certain exceptions, in the event that we do not declare and pay in full dividends for the then-current dividend period (in the case of dividends) or most recently completed dividend period (in the case of repurchases) of our Series A preferred stock or the last preceding dividend period (in the case of dividends) or most recently completed dividend period (in the case of repurchases) of our Series D, Series E, Series F, Series G or Series H preferred stock.
In addition, regulatory capital rules that are or will be applicable to us including the U.S. capital rules risk-based capital requirements, the SLR, the stress capital buffer, the enhanced SLR, the TLAC rule and the U.S. G-SIB surcharge may limit or otherwise restrict how we utilize our capital, including common stock dividends and stock repurchases, and may require us to increase or alter the mix of our outstanding regulatory capital instruments.
Any requirement to increase our regulatory capital ratios or alter the composition of our capital could require us to liquidate assets or otherwise change our business and/or investment plans, which may negatively affect our financial results. Further, any requirement to maintain higher levels of capital may constrain our ability to return capital to shareholders either in the form of common stock dividends or stock repurchases.
Any material reduction in our credit ratings or the credit ratings of our principal bank subsidiaries, The Bank of New York Mellon or BNY Mellon, N.A., could increase the cost of funding and borrowing to us and our rated subsidiaries and have a material adverse effect on our business, financial condition and results of operations and on the value of the securities we issue.
Risk Factors (continued)
102 BNY Mellon
Our debt and preferred stock and the debt and deposits of our principal bank subsidiaries, The Bank of New York Mellon and BNY Mellon, N.A., are currently rated investment grade by the major rating agencies. These rating agencies regularly evaluate us and our rated subsidiaries. Their credit ratings are based on a number of factors, including our financial strength, performance, prospects and operations, as well as factors not entirely within our control, including conditions affecting the financial services industry generally and the U.S. government. Rating agencies employ different models and formulas to assess the financial strength of a rated company, and from time to time rating agencies have, in their discretion, altered these models. Changes to rating agency models, general economic conditions or other circumstances outside our control could negatively impact a rating agency’s judgment of the rating or outlook it assigns to us or our rated subsidiaries. As a result, we or our rated subsidiaries may not be able to maintain our respective credit ratings or outlook on our securities.
A material reduction in our credit ratings or the credit ratings of our rated subsidiaries, which can occur at any time without notice, could have a material adverse effect on our access to credit markets, the related cost of funding and borrowing, our credit spreads, our liquidity and on certain trading revenues, particularly in those businesses where counterparty creditworthiness is critical. In addition, in connection with certain over-the-counter derivatives contracts and other trading agreements, counterparties may require us or our rated subsidiaries to provide additional collateral or to terminate these contracts and agreements and collateral financing arrangements in the event of a credit ratings downgrade below certain ratings levels. The requirement to provide additional collateral or terminate these contracts and agreements could impair our liquidity by requiring us to find other sources of financing or to make significant cash payments or securities movements. A downgrade by any one rating agency, depending on the agency’s relative ratings of the firm at the time of the downgrade, may have an impact comparable to the impact of a downgrade by all rating agencies. If a rating agency downgrade were to occur during broader market instability, our options for responding to events may be more limited and more expensive, possibly significantly. An increase in the costs of our funding and borrowing, or an impairment of our liquidity, could have a material adverse effect on our results of operations and financial condition. A
material reduction in our credit ratings also could decrease the number of investors and counterparties willing or permitted to do business with or lend to us and adversely affect the value of the securities we have issued or may issue in the future.
We cannot predict what actions rating agencies may take, or what actions we may elect or be required to take in response thereto, which may adversely affect us. For further discussion on the impact of a credit rating downgrade, see “Disclosure of contingent features in OTC derivative instruments” in Note 23 of the Notes to Consolidated Financial Statements.
The application of our Title I preferred resolution strategy or resolution under the Title II orderly liquidation authority could adversely affect the Parent’s liquidity and financial condition and the Parent’s security holders.
In 2017, in connection with our single point of entry resolution strategy under Title I of the Dodd-Frank Act, the Parent entered into a binding support agreement with certain key subsidiaries to facilitate the provision of capital and liquidity resources to them in the event of material financial distress or failure. The support agreement requires the Parent to transfer cash and other liquid financial assets to the IHC on an ongoing basis, subject to certain amounts retained by the Parent to meet its near-term cash needs, in exchange for unsecured subordinated funding notes issued by the IHC as well as a committed line of credit to the Parent to service its near term obligations. The Parent’s and the IHC’s obligations under the support agreement are secured.
If our projected liquidity resources deteriorate so severely that resolution of the Parent becomes imminent, the committed line of credit the IHC provided to the Parent will automatically terminate, with all amounts outstanding becoming due and payable, and the support agreement will require the Parent to transfer most of its remaining assets (other than stock in subsidiaries and a cash reserve to fund bankruptcy expenses) to the IHC. As a result, during a period of severe financial stress, the Parent could become unable to meet its debt and payment obligations (including with respect to its securities), causing the Parent to seek protection under bankruptcy laws earlier than it otherwise would have.
If the Parent were to become subject to a bankruptcy proceeding and our single point of entry strategy is
Risk Factors (continued)
BNY Mellon 103
successful, our material entities will not be subject to insolvency proceedings and their creditors would not be expected to suffer losses, while the Parent’s security holders, including unsecured debt holders, could face significant losses, potentially including the loss of their entire investment. The single point of entry strategy, in which the Parent would be the only legal entity to enter resolution proceedings, is designed to result in greater risk of loss to holders of the Parent’s unsecured senior debt securities and other securities than would be the case under a different resolution strategy.
Further, if the single point of entry strategy is not successful, our liquidity and financial condition would be adversely affected and all security holders may, as a consequence, be in a worse position than if the strategy had not been implemented.
In addition, Title II of the Dodd-Frank Act established an orderly liquidation process in the event of the failure of a large systemically important financial institution, such as BNY Mellon, in order to avoid or mitigate serious adverse effects on the U.S. financial system. Specifically, if BNY Mellon is in default or danger of default, and certain specified conditions are met, the FDIC may be appointed receiver under the orderly liquidation authority, and we would be resolved under that authority instead of the U.S. Bankruptcy Code.
U.S. supervisors have indicated that a single point of entry strategy may be a desirable strategy to resolve a large financial institution such as BNY Mellon under Title II in a manner that would, similar to our preferred strategy under our Title I resolution plan, impose losses on shareholders, unsecured debt holders and other unsecured creditors of the Parent, while permitting the holding company’s subsidiaries to continue to operate and remain solvent. Under such a strategy, assuming the Parent entered resolution proceedings and its subsidiaries remained solvent, losses at the subsidiary level would be absorbed by the Parent and ultimately borne by the Parent’s security holders (including holders of the Parent’s unsecured debt securities), while third-party creditors of the Parent’s subsidiaries would not be expected to suffer losses. Accordingly, the Parent’s security holders (including holders of unsecured debt securities and other unsecured creditors) could face losses in excess of what otherwise would have been the case.
Strategic Risk
New lines of business, new products and services or transformational or strategic project initiatives may subject us to additional risks, and the failure to implement these initiatives could affect our results of operations.
From time to time, we may launch new lines of business, offer new products and services within existing lines of business or undertake transformational or strategic projects. There are substantial risks and uncertainties associated with these efforts. We invest significant time and resources in developing and marketing new lines of business, products and services and executing on our transformational and strategic initiatives. For example, we have devoted considerable resources to developing new technology solutions for our clients. If these technology solutions are not successful, it could adversely impact our reputation, business and results of operations. We have recently announced a strategic initiative to develop a multi-asset digital custody and administration platform for traditional and digital assets, including cryptocurrencies. Developing and providing new products and services, including those relating to digital assets, may increase our operational risk exposures.
Regulatory requirements can affect whether initiatives are able to be brought to market in a manner that is timely and attractive to our customers. Initial timetables for the development and introduction of new lines of business or new products or services and price and profitability targets may not be met. Furthermore, our revenues and costs may fluctuate because new businesses or products and services generally require startup costs while revenues may take time to develop, which may adversely impact our results of operations.
From time to time we undertake transformational or strategic project initiatives. Significant effort and resources are necessary to manage and oversee the successful completion of these initiatives. These initiatives often place significant demands on management and a limited number of employees with subject matter expertise and may involve significant costs to implement, as well as increase operational risk as employees learn to process transactions under new systems. The failure to properly execute on these transformational or strategic initiatives could adversely impact our business, reputation and results of operations.
Risk Factors (continued)
104 BNY Mellon

Legal, regulatory and reputational risks may also exist in connection with dealing with new products or markets, or clients and customers whose businesses focus on such products or markets, where there is regulatory uncertainty or different or conflicting regulations depending on the regulator or the jurisdiction. We may invest significant time and resources into the expansion of existing or creation of new compliance and risk management systems with respect to new products or markets.
We are subject to competition in all aspects of our business, which could negatively affect our ability to maintain or increase our profitability.
Many businesses in which we operate are intensely competitive around the world. Larger and more geographically diverse companies, and financial technology firms that invest substantial resources in developing and designing new technology (in particular digital and mobile technology) and that are not subject to the same level of regulation, may be able to offer financial products and services at more competitive prices than we are able to offer. Pricing pressures, as a result of the willingness of competitors to offer comparable or improved products or services at a lower price, may result in a reduction in the price we can charge for our products and services, which could, and in some cases has, negatively affected our ability to maintain or increase our profitability.
In addition, technological advances have made it possible for other types of non-depository institutions, such as financial technology firms, outsourcing companies and data processing companies, to offer a variety of products and services competitive with certain areas of our business. Competitors may develop technological advances that could negatively impact our transaction execution or the pricing of our clearing, settlement, payments and trading activities. In the future, financial technology firms may be able to provide traditional banking products and services by obtaining a bank-like charter, such as the OCC’s fintech charter, or offer cryptocurrencies.
Markets, and the manner in which our clients interact and transact within markets, can evolve quickly, particularly if new or disruptive technologies are introduced. Our failure to either anticipate, or participate in, the transformational change within a given market could result in potential negative financial impact. In addition, business continuity and
operational resiliency are competitive factors and any delay in our ability to maintain operations during, and recover quickly from, unexpected events could impact our ability to retain clients. Increased competition in any of these areas may require us to make additional capital investments in our businesses in order to remain competitive. For example, along with other financial institutions, we are researching ways to adapt robotic process automation and distributed ledger technology to bank services. If we are not able to adapt these technologies as successfully as our peers, we may become less competitive.
Furthermore, regulations could impact our ability to conduct certain of our businesses in a cost-effective manner or at all. The more restrictive laws and regulations applicable to the largest U.S. financial services institutions, including the U.S. capital rules, can put us at a competitive disadvantage relative to both our non-U.S. competitors and U.S. competitors not subject to the same laws and regulations. See “Supervision and Regulation.”
Our business may be adversely affected if we are unable to attract, retain and motivate employees.
Our success depends, in large part, on our ability to attract new employees, retain and motivate our existing employees, and continue to compensate our employees competitively amid heightened regulatory restrictions. Competition for the most skilled employees in most activities in which we engage can be intense, and we may not be able to recruit and retain key personnel.
We rely on certain employees with subject matter expertise to assist in the implementation of important initiatives. As technology and risk management increase in focus in the financial industry, competition for technologists and risk personnel has intensified, which could constrain our ability to execute on certain of our strategic initiatives.
Our ability to attract and retain key executives and other employees may be negatively affected by continuous changes to immigration policies and restrictions applicable to incentive and other compensation programs, including deferral, clawback requirements and other limits on incentive compensation. Some of these restrictions may not apply to some of our competitors and to other institutions with which we compete for talent, in
Risk Factors (continued)
BNY Mellon 105

particular as we are more often competing for personnel with financial technology providers and other entities that may not be publicly traded or regulated banking organizations that, in either case, may not have the same limitations on compensation as we do.
The loss of employees’ skills, knowledge of the market, industry experience, and the cost of finding replacements may hurt our business. If we are unable to continue to attract and retain highly qualified employees, our performance, including our competitive position, could be adversely affected.
Our strategic transactions present risks and uncertainties and could have an adverse effect on our business, financial condition and results of operations.
From time to time, to achieve our strategic objectives, we have acquired, disposed of, or invested in (including through joint venture relationships) companies and businesses and have entered into strategic alliances or other collaborations with third-party service providers to deliver products and services to clients, and may do so in the future. Our ability to pursue or complete strategic transactions is in certain instances subject to regulatory approval and we cannot be certain when or if, or on what terms and conditions, any required regulatory approvals would be granted. Moreover, to the extent we pursue a strategic transaction, there can be no guarantee that the transaction will close when anticipated, or at all. If a strategic transaction does not close, or if the strategic transaction fails to maximize shareholder value or required regulatory approval is not obtained, it could have an adverse effect on our business, financial condition and results of operations.
Each acquisition poses integration challenges, including successfully retaining and assimilating clients and key employees, capitalizing on certain revenue synergies and integrating the acquired company’s employees, culture, control functions, systems and technology. In some cases, acquisitions involve entry into new businesses or new geographic or other markets, and these situations also present risks and uncertainties in instances where we may be inexperienced in these new areas. We may be required to spend a significant amount of time and resources to integrate these acquisitions. The anticipated integration benefits may take longer to achieve than projected and the time and cost needed
to consolidate control functions, platforms and systems may significantly exceed our estimates. If we fail to successfully integrate strategic acquisitions, including doing so in a timely and cost-effective manner, we may not realize the expected benefits, which could have an adverse impact on our business, financial condition and results of operations. In addition, we may incur expenses, costs, losses, penalties, taxes and other liabilities related to the conduct of the acquired businesses prior to the date of our ownership (including in connection with the defense and/or settlement of legal and regulatory claims, investigations and proceedings) which may not be recoverable through indemnification or otherwise. If the purchase price we pay in an acquisition exceeds the fair value of assets acquired less the liabilities we assume, then we may need to recognize goodwill on our consolidated balance sheet. Goodwill is an intangible asset that is not eligible for inclusion in regulatory capital under applicable requirements. Further, if the value of the acquisition declines, we may be required to record an impairment charge.
Each disposition also poses challenges, including separating the disposed businesses, products and systems in a way that is cost-effective and is not disruptive to us or our customers. In addition, the inherent uncertainty involved in the process of evaluating, negotiating or executing a potential sale of one of our companies or businesses may cause the loss of key clients, employees and business partners which could have an adverse impact on our business, financial condition and results of operations.
Joint ventures, non-controlling investments, strategic alliances and other collaborations contain potentially increased financial, legal, reputational, operational, regulatory and/or compliance risks. We may be dependent on joint venture partners, firms with which we collaborate, controlling shareholders or management who may have business interests, strategies or goals that are inconsistent with ours. Business decisions or other actions or omissions of the joint venture partner, the firms with which we collaborate, controlling shareholders or management may adversely affect the value of our investment (or, in the case of strategic alliances or other collaborations, the value of our products or services), impact our results of operations, result in litigation or regulatory action against us and otherwise damage our reputation and brand.
Risk Factors (continued)
106 BNY Mellon

Additional Risks
Our businesses may be negatively affected by adverse events, publicity, government scrutiny or other reputational harm.
We are subject to reputational, legal and regulatory risk in the ordinary course of our business. Harm to our reputation can result from numerous sources, including adverse publicity or negative information, whether or not true, arising from events occurring at BNY Mellon, other financial institutions or in the financial markets, perceived failure to comply with legal and regulatory requirements or deliver appropriate standards of service and quality, or a failure to appropriately describe our products and services, the purported actions of our employees or the use of social media by our employees, alleged financial reporting irregularities involving ourselves or other large and well-known companies and perceived conflicts of interest. For example, a cybersecurity event impacting us or our customers’ data could have a negative impact on our reputation and customer confidence in BNY Mellon and our cybersecurity defenses and business continuity and resiliency capabilities. Our reputation could also be harmed by the failure of an affiliate, joint venture or a vendor or other third party with which we do business to comply with laws or regulations. Our reputation may be significantly damaged by adverse publicity or negative information regarding BNY Mellon, whether or not true, that may be published or broadcast by the media or posted on social media, non-mainstream news services or other internet forums. The speed and pervasiveness with which information can be disseminated through these channels, in particular social media, may magnify risks relating to negative publicity. Damage to our reputation could affect the confidence of clients, rating agencies, regulators, employees, stockholders and other stakeholders and could in turn have an impact on our business and results of operations.
Additionally, governmental scrutiny from regulators, tax authorities, legislative bodies and law enforcement agencies with respect to financial services companies has remained at elevated levels. Press coverage and other public statements, including information posted on social media or other internet forums, that allege some form of wrongdoing (including, in some cases, press coverage and public statements that do not directly involve BNY Mellon) often result in some type of investigation or in
lawsuits. Certain enforcement authorities have recently required admissions of wrongdoing, and in some cases, criminal pleas, as part of the resolution of matters brought by them against financial institutions. Any such resolution of a matter involving BNY Mellon could lead to increased exposure to civil litigation, could adversely affect our reputation and ability to do business in certain products and in certain jurisdictions and could have other negative effects.
Climate change concerns could adversely affect our business, affect client activity levels and damage our reputation.
Concerns over the long-term impacts of climate change have led and will continue to lead to governmental efforts around the world to mitigate those impacts. Consumers and businesses are also changing their behavior and business preferences as a result of these concerns. New governmental regulations or guidance relating to climate change, as well as changes in consumers’ and businesses’ behaviors and business preferences, may affect whether and on what terms and conditions we will engage in certain activities or offer certain products or services. Climate change may also have a negative impact on the financial condition of our clients, which may decrease revenues from those clients and increase the credit risk associated with loans and other credit exposures to those clients. In addition, our reputation may be damaged as a result of our involvement, or our clients’ involvement, in certain industries or projects associated with climate change and we could face pressure from individuals or groups to cease doing business in such industries or projects.
Impacts from natural disasters, climate change, acts of terrorism, pandemics, global conflicts and other geopolitical events may have a negative impact on our business and operations.
In conducting our business and maintaining and supporting our global operations, which includes clients, counterparties, vendors and other third parties, we are subject to risks of loss from the outbreak of hostilities, acts of terrorism, impacts from natural disasters, climate change, pandemics, such as the coronavirus, global conflicts or other similar catastrophic events that could have a negative impact on our business and operations. We may also be impacted by unfavorable political, economic, legal or
Risk Factors (continued)
BNY Mellon 107
other developments, including but not limited to social or political instability, changes in governmental policies or policies of central banks, sanctions, expropriation, nationalization, confiscation of assets, price, capital and exchange controls, the imposition of tariffs or other limitations on international trade and travel, and changes in laws and regulations.
While we have business continuity and disaster recovery plans in place, such events could still damage our facilities, disrupt or delay normal business operations (including communications, technology and physical access to our facilities), result in harm or cause travel limitations on our employees, with a similar impact on our clients, suppliers and counterparties. Notwithstanding our efforts to maintain business continuity and disaster recovery plans, to the extent a catastrophic event occurs and our remote work arrangements fail or are otherwise impaired, our ability to service and interact with our clients may suffer. If we are unable to implement and maintain remote work arrangements, including, for example, because of an internal or external failure of our information technology infrastructure or increased rates of employee illness or unavailability, our business continuity status would be adversely impacted and there would be a disruption to our businesses.
Catastrophic events, including those caused by climate change, could also negatively impact the purchase of our products and services if those events result in reduced capital markets activity, lower asset price levels, or disruptions in general economic activity, or in financial market settlement functions, which could negatively impact our business and results of operations. In addition, catastrophic events, including those caused by climate change, pandemics, such as the coronavirus, war, terror attacks, political unrest, global conflicts, efforts to combat terrorism and other potential military activities and outbreaks of hostilities may lead, and in some cases have led, to higher market volatility, as well as an increase in delinquencies, bankruptcies or defaults that could result in our experiencing higher levels of non-performing assets, net charge-offs and provisions for credit losses, negatively impacting our business and operations. Furthermore, we invest in renewable energy projects, which have been and may in the future be adversely affected by extreme weather events, natural disasters and other catastrophic events.
Tax law changes or challenges to our tax positions with respect to historical transactions may adversely affect our net income, effective tax rate and our overall results of operations and financial condition.
In the course of our business, we receive inquiries and challenges from both U.S. and non-U.S. tax authorities on the amount of taxes we owe. If we are not successful in defending these inquiries and challenges, we may be required to adjust the timing or amount of taxable income or deductions or the allocation of income among tax jurisdictions, all of which can require a greater provision for taxes or otherwise negatively affect earnings. Probabilities and outcomes are reviewed as events unfold, and adjustments to the reserves are made when necessary, but the reserves may prove inadequate because we cannot necessarily accurately predict the outcome of any challenge, settlement or litigation or the extent to which it will negatively affect us or our business. Future tax laws or the expiration of or changes in existing tax laws, or the interpretation of those laws worldwide, could also have a material impact on our business or net income. Our actions taken in response to, or reliance upon, such changes in the tax laws may impact our tax position in a manner that may result in lower earnings. In addition, upon any change in tax law, we must recognize the effect of the change on our deferred tax assets and liabilities. An increase in tax rates would likely result in an increase in our net deferred tax liabilities and a reduction in our net income in the period of enactment of the change. See Note 12 of the Notes to Consolidated Financial Statements for further information.
Changes in accounting standards governing the preparation of our financial statements and future events could have a material impact on our reported financial condition, results of operations, cash flows and other financial data.
From time to time, the Financial Accounting Standards Board (“FASB”), the SEC and bank regulators change the financial accounting and reporting standards governing the preparation of our financial statements or the interpretation of those standards. These changes are difficult to predict and can materially impact how we record and report our financial condition, results of operations, cash flows and other financial data. For example, the FASB issued a new accounting standard that was adopted effective Jan. 1, 2020 referred to as the Current Expected Credit Loss (“CECL”), requiring financial
Risk Factors (continued)
108 BNY Mellon
institutions to determine periodic estimates of lifetime expected credit losses on loans, and recognize the expected credit losses as allowance for credit losses. The ongoing impact of CECL will be significantly influenced by the composition, characteristics and quality of our loan portfolio and lending-related commitments, as well as prevailing economic conditions, expectations of future economic conditions, models and methodologies utilized. Should these factors materially change, we may be required to increase or decrease our allowance for credit losses, which may have a material adverse effect on our financial condition and results of operations. In some cases, the FASB, the SEC and bank regulators may change financial accounting and reporting standards governing the preparation of our financial statements or the interpretation of those standards that may require us to apply a new or revised standard retrospectively, potentially resulting in the restatement of our prior period financial statements and our related disclosures.
Additionally, our accounting policies and methods are fundamental to how we record and report our financial condition and results of operations. The preparation of financial statements in conformity with U.S. GAAP requires management to make estimates based upon assumptions and use judgments about future economic and market conditions which affect reported amounts and related disclosures in our financial statements. Amounts subject to estimates are items such as the allowance for credit losses, the fair value of financial instruments and derivatives, goodwill and other intangibles and litigation and regulatory contingencies. Among other effects, such changes in estimates could result in future impairments of goodwill and intangible assets and establishment of allowances for credit losses as well
as litigation and regulatory contingencies. Estimates of fair value are based upon assumptions believed to be reasonable but which are uncertain and involve significant judgments. In performing our annual goodwill test, we may use an income approach to estimate the fair values of each reporting unit. Estimated cash flows used in the income approach are based on management’s projections. Estimated cash flows extend far into the future, and, by their nature, are difficult to estimate over such an extended time frame. Factors that may significantly affect the cash flow estimates include, among others, market values of assets we manage, customer behaviors and attrition, changes in revenue growth trends, certain money market fee waiver practices, cost structures and technology, regulatory and legislative changes, specific industry or market sector conditions, competition and changes in interest rates. In the future, small changes in the assumptions, such as changes in the cash flow estimates, discount rate or long-term growth rate, or a prolonged macroeconomic downturn may produce a material non-cash goodwill impairment. If actual or subsequent events occur that are materially different than the assumptions, judgments and estimates we used, our reported financial condition, results of operation and cash flows may be materially negatively impacted. Recent distribution limitations for CCAR firms, including BNY Mellon, have been based on the average quarterly net income over the prior four quarters. If these or similar limitations are in place after the first quarter of 2021, a goodwill impairment charge could result in a lower limit on distributions, including common stock dividends and share repurchases. See “Recent Accounting Developments” for a discussion of recent developments to our accounting standards.
Risk Factors (continued)
BNY Mellon 109
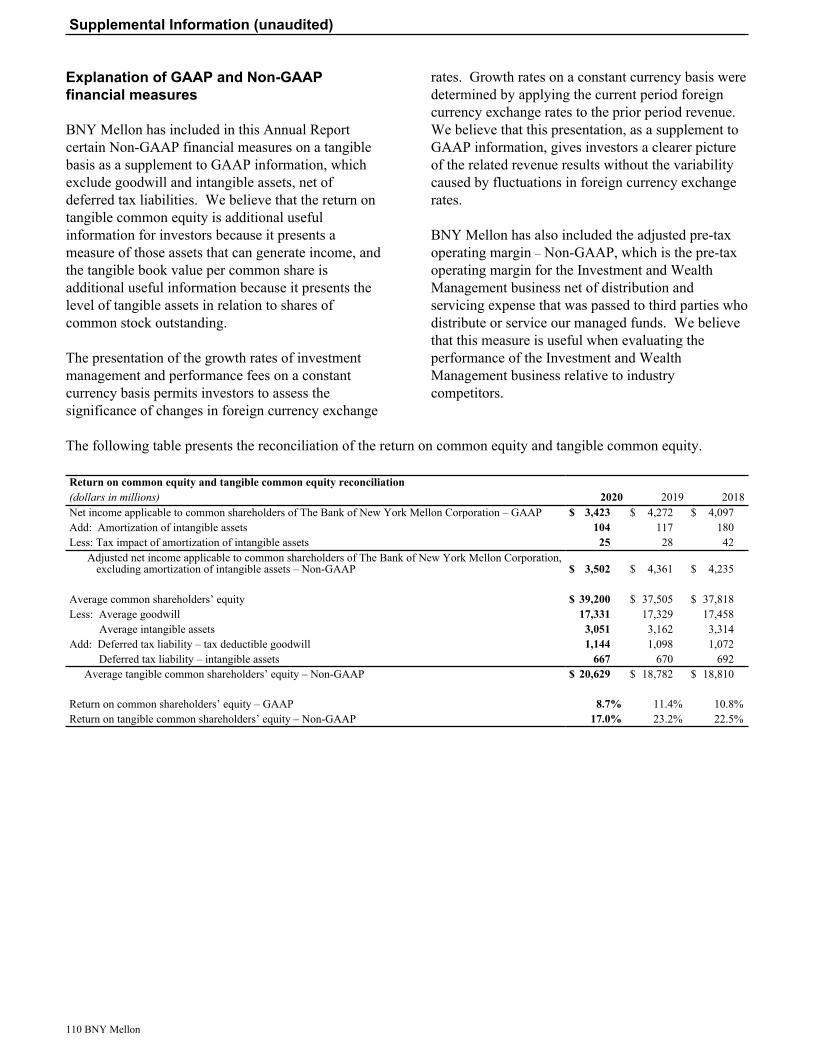
Explanation of GAAP and Non-GAAP financial measures
BNY Mellon has included in this Annual Report certain Non-GAAP financial measures on a tangible basis as a supplement to GAAP information, which exclude goodwill and intangible assets, net of deferred tax liabilities. We believe that the return on tangible common equity is additional useful information for investors because it presents a measure of those assets that can generate income, and the tangible book value per common share is additional useful information because it presents the level of tangible assets in relation to shares of common stock outstanding.
The presentation of the growth rates of investment management and performance fees on a constant currency basis permits investors to assess the significance of changes in foreign currency exchange
rates. Growth rates on a constant currency basis were determined by applying the current period foreign currency exchange rates to the prior period revenue. We believe that this presentation, as a supplement to GAAP information, gives investors a clearer picture of the related revenue results without the variability caused by fluctuations in foreign currency exchange rates.
BNY Mellon has also included the adjusted pre-tax operating margin – Non-GAAP, which is the pre-tax operating margin for the Investment and Wealth Management business net of distribution and servicing expense that was passed to third parties who distribute or service our managed funds. We believe that this measure is useful when evaluating the performance of the Investment and Wealth Management business relative to industry competitors.
The following table presents the reconciliation of the return on common equity and tangible common equity.
Return on common equity and tangible common equity reconciliation2020 2019 2018(dollars in millions)
Net income applicable to common shareholders of The Bank of New York Mellon Corporation – GAAP $ 3,423 $ 4,272 $ 4,097 Add: Amortization of intangible assets 104 117 180 Less: Tax impact of amortization of intangible assets 25 28 42
Adjusted net income applicable to common shareholders of The Bank of New York Mellon Corporation, excluding amortization of intangible assets – Non-GAAP $ 3,502 $ 4,361 $ 4,235
Average common shareholders’ equity $ 39,200 $ 37,505 $ 37,818 Less: Average goodwill 17,331 17,329 17,458
Average intangible assets 3,051 3,162 3,314 Add: Deferred tax liability – tax deductible goodwill 1,144 1,098 1,072
Deferred tax liability – intangible assets 667 670 692 Average tangible common shareholders’ equity – Non-GAAP $ 20,629 $ 18,782 $ 18,810
Return on common shareholders’ equity – GAAP 8.7% 11.4% 10.8% Return on tangible common shareholders’ equity – Non-GAAP 17.0% 23.2% 22.5%
Supplemental Information (unaudited)
110 BNY Mellon
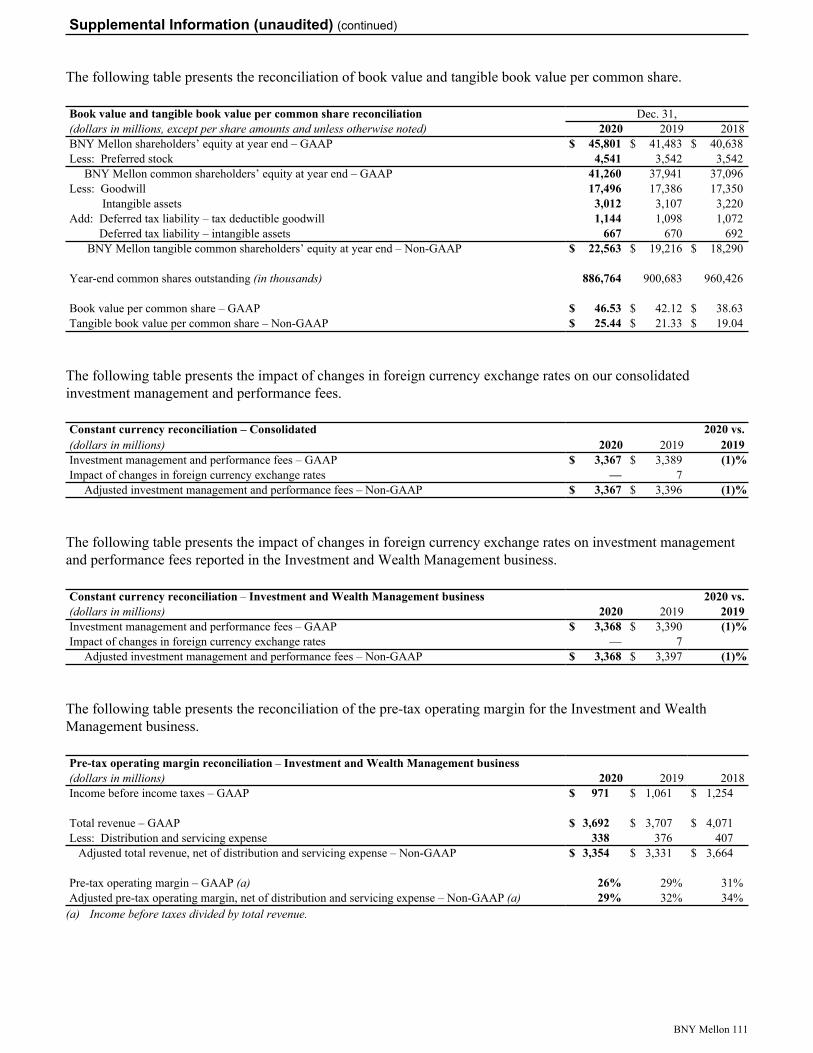
The following table presents the reconciliation of book value and tangible book value per common share.
Book value and tangible book value per common share reconciliation Dec. 31,(dollars in millions, except per share amounts and unless otherwise noted) 2020 2019 2018BNY Mellon shareholders’ equity at year end – GAAP $ 45,801 $ 41,483 $ 40,638 Less: Preferred stock 4,541 3,542 3,542
BNY Mellon common shareholders’ equity at year end – GAAP 41,260 37,941 37,096 Less: Goodwill 17,496 17,386 17,350
Intangible assets 3,012 3,107 3,220 Add: Deferred tax liability – tax deductible goodwill 1,144 1,098 1,072
Deferred tax liability – intangible assets 667 670 692 BNY Mellon tangible common shareholders’ equity at year end – Non-GAAP $ 22,563 $ 19,216 $ 18,290
Year-end common shares outstanding (in thousands) 886,764 900,683 960,426
Book value per common share – GAAP $ 46.53 $ 42.12 $ 38.63 Tangible book value per common share – Non-GAAP $ 25.44 $ 21.33 $ 19.04
The following table presents the impact of changes in foreign currency exchange rates on our consolidated investment management and performance fees.
Constant currency reconciliation – Consolidated 2020 vs.(dollars in millions) 2020 2019 2019Investment management and performance fees – GAAP $ 3,367 $ 3,389 (1) %Impact of changes in foreign currency exchange rates — 7
Adjusted investment management and performance fees – Non-GAAP $ 3,367 $ 3,396 (1) %
The following table presents the impact of changes in foreign currency exchange rates on investment management and performance fees reported in the Investment and Wealth Management business.
Constant currency reconciliation – Investment and Wealth Management business 2020 vs.(dollars in millions) 2020 2019 2019Investment management and performance fees – GAAP $ 3,368 $ 3,390 (1) %Impact of changes in foreign currency exchange rates — 7
Adjusted investment management and performance fees – Non-GAAP $ 3,368 $ 3,397 (1) %
The following table presents the reconciliation of the pre-tax operating margin for the Investment and Wealth Management business.
Pre-tax operating margin reconciliation – Investment and Wealth Management business(dollars in millions) 2020 2019 2018Income before income taxes – GAAP $ 971 $ 1,061 $ 1,254
Total revenue – GAAP $ 3,692 $ 3,707 $ 4,071 Less: Distribution and servicing expense 338 376 407
Adjusted total revenue, net of distribution and servicing expense – Non-GAAP $ 3,354 $ 3,331 $ 3,664
Pre-tax operating margin – GAAP (a) 26% 29% 31% Adjusted pre-tax operating margin, net of distribution and servicing expense – Non-GAAP (a) 29% 32% 34%
(a) Income before taxes divided by total revenue.
Supplemental Information (unaudited) (continued)
BNY Mellon 111
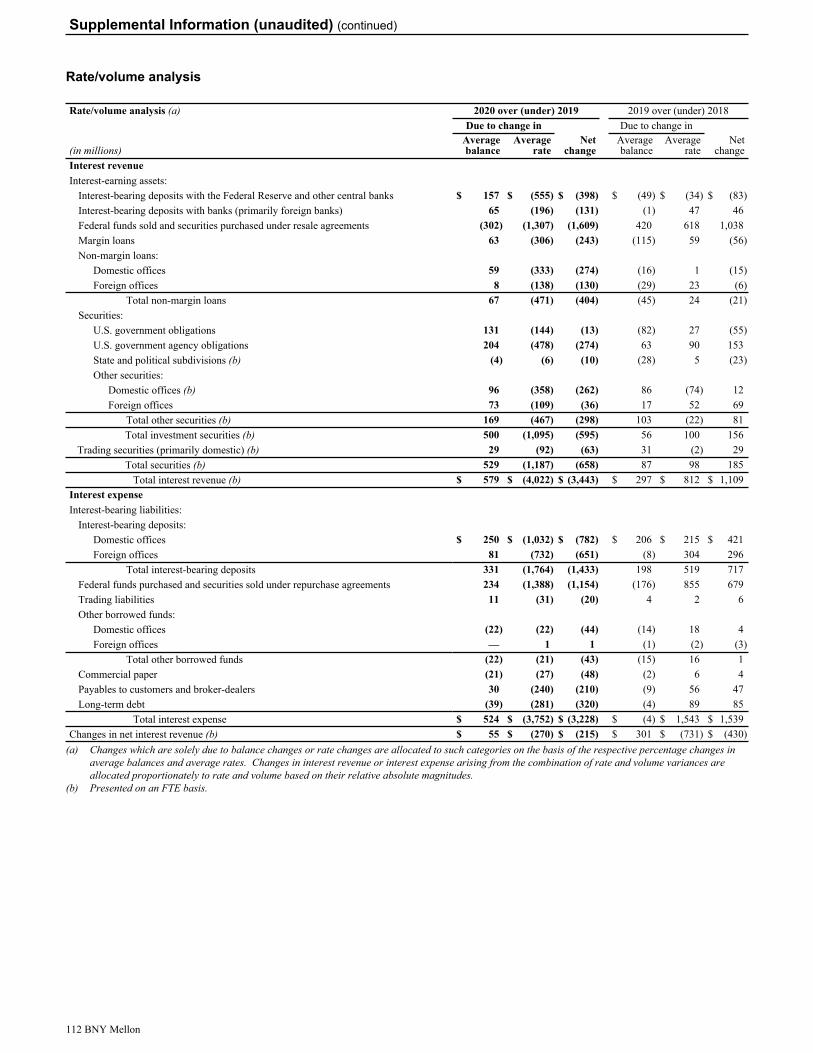
Rate/volume analysis
Rate/volume analysis (a) 2020 over (under) 2019 2019 over (under) 2018Due to change in Due to change in
(in millions)Averagebalance
Averagerate
Netchange
Averagebalance
Averagerate
Netchange
Interest revenueInterest-earning assets:
Interest-bearing deposits with the Federal Reserve and other central banks $ 157 $ (555) $ (398) $ (49) $ (34) $ (83) Interest-bearing deposits with banks (primarily foreign banks) 65 (196) (131) (1) 47 46 Federal funds sold and securities purchased under resale agreements (302) (1,307) (1,609) 420 618 1,038 Margin loans 63 (306) (243) (115) 59 (56) Non-margin loans:
Domestic offices 59 (333) (274) (16) 1 (15) Foreign offices 8 (138) (130) (29) 23 (6)
Total non-margin loans 67 (471) (404) (45) 24 (21) Securities:
U.S. government obligations 131 (144) (13) (82) 27 (55) U.S. government agency obligations 204 (478) (274) 63 90 153 State and political subdivisions (b) (4) (6) (10) (28) 5 (23) Other securities:
Domestic offices (b) 96 (358) (262) 86 (74) 12 Foreign offices 73 (109) (36) 17 52 69
Total other securities (b) 169 (467) (298) 103 (22) 81 Total investment securities (b) 500 (1,095) (595) 56 100 156
Trading securities (primarily domestic) (b) 29 (92) (63) 31 (2) 29 Total securities (b) 529 (1,187) (658) 87 98 185
Total interest revenue (b) $ 579 $ (4,022) $ (3,443) $ 297 $ 812 $ 1,109 Interest expenseInterest-bearing liabilities:
Interest-bearing deposits:Domestic offices $ 250 $ (1,032) $ (782) $ 206 $ 215 $ 421 Foreign offices 81 (732) (651) (8) 304 296
Total interest-bearing deposits 331 (1,764) (1,433) 198 519 717 Federal funds purchased and securities sold under repurchase agreements 234 (1,388) (1,154) (176) 855 679 Trading liabilities 11 (31) (20) 4 2 6 Other borrowed funds:
Domestic offices (22) (22) (44) (14) 18 4 Foreign offices — 1 1 (1) (2) (3)
Total other borrowed funds (22) (21) (43) (15) 16 1 Commercial paper (21) (27) (48) (2) 6 4 Payables to customers and broker-dealers 30 (240) (210) (9) 56 47 Long-term debt (39) (281) (320) (4) 89 85
Total interest expense $ 524 $ (3,752) $ (3,228) $ (4) $ 1,543 $ 1,539 Changes in net interest revenue (b) $ 55 $ (270) $ (215) $ 301 $ (731) $ (430)
(a) Changes which are solely due to balance changes or rate changes are allocated to such categories on the basis of the respective percentage changes in average balances and average rates. Changes in interest revenue or interest expense arising from the combination of rate and volume variances are allocated proportionately to rate and volume based on their relative absolute magnitudes.
(b) Presented on an FTE basis.
Supplemental Information (unaudited) (continued)
112 BNY Mellon

Some statements in this Annual Report are forward-looking. These include statements about the usefulness of Non-GAAP measures, the future results of BNY Mellon, our businesses, financial, liquidity and capital condition, results of operations, liquidity, risk and capital management and processes, goals, strategies, outlook, objectives, expectations (including those regarding our performance results, expenses, nonperforming assets, products, impacts of currency fluctuations, impacts of money market fee waivers, impacts of trends on our businesses, regulatory, technology, market, economic or accounting developments and the impacts of such developments on our businesses, legal proceedings and other contingencies), human capital management (including related ambitions, objectives, aims and goals), effective tax rate, net interest revenue, estimates (including those regarding expenses, losses inherent in our credit portfolios and capital ratios), intentions (including those regarding our capital returns and expenses, including our investments in technology and pension expense), targets, opportunities, potential actions, growth and initiatives, including the potential effects of the coronavirus pandemic on any of the foregoing.
In this report, any other report, any press release or any written or oral statement that BNY Mellon or its executives may make, words, such as “estimate,” “forecast,” “project,” “anticipate,” “likely,” “target,” “expect,” “intend,” “continue,” “seek,” “believe,” “plan,” “goal,” “could,” “should,” “would,” “may,” “might,” “will,” “strategy,” “synergies,” “opportunities,” “trends,” “ambition,” “objective,” “aim,” “future,” “potentially,” “outlook” and words of similar meaning, may signify forward-looking statements.
Actual results may differ materially from those expressed or implied as a result of a number of factors, including those discussed in “Risk Factors,” such as:• errors or delays in our operational and transaction
processing may materially adversely affect our business, financial condition, results of operations and reputation;
• our risk management framework, models and processes may not be effective in mitigating risk and reducing the potential for losses;
• the coronavirus pandemic is adversely affecting us and creates significant risks and uncertainties for our business, and the ultimate impact of the pandemic on us will depend on future
developments, which are highly uncertain and cannot be predicted;
• a communications or technology disruption or failure within our infrastructure or the infrastructure of third parties that results in a loss of information, delays our ability to access information or impacts our ability to provide services to our clients may materially adversely affect our business, financial condition and results of operations;
• a cybersecurity incident, or a failure to protect our computer systems, networks and information and our clients’ information against cybersecurity threats, could result in the theft, loss, unauthorized access to, disclosure, use or alteration of information, system or network failures, or loss of access to information. Any such incident or failure could adversely impact our ability to conduct our businesses, damage our reputation and cause losses;
• we are subject to extensive government rulemaking, policies, regulation and supervision that impact our operations. Changes to and introduction of new rules and regulations have, and in the future may, compel us to change how we manage our businesses, which could have a material adverse effect on our business, financial condition and results of operations;
• regulatory or enforcement actions or litigation could materially adversely affect our results of operations or harm our businesses or reputation;
• failure to satisfy regulatory standards, including “well capitalized” and “well managed” status or capital adequacy and liquidity rules more generally, could result in limitations on our activities and adversely affect our business and financial condition;
• a failure or circumvention of our controls and procedures could have a material adverse effect on our business, financial condition, results of operations and reputation;
• we are dependent on fee-based business for a substantial majority of our revenue and our fee-based revenues could be adversely affected by slowing in market activity, weak financial markets, underperformance and/or negative trends in savings rates or in investment preferences;
• weakness and volatility in financial markets and the economy generally may materially adversely affect our business, financial condition and results of operations;
Forward-looking Statements
BNY Mellon 113

• changes in interest rates and yield curves have had, and may in the future continue to have, a material adverse effect on our profitability;
• we may experience losses on securities related to volatile and illiquid market conditions, reducing our earnings and impacting our financial condition;
• transitions away from and the replacement of LIBOR and other interbank offered rates could adversely impact our business, financial condition and results of operations;
• following the end of the transition period, the UK and the EU have not agreed to alternatives to the “passporting rights,” which may result in negative effects on global economic conditions, global financial markets, and our business, financial condition and results of operations;
• the failure or perceived weakness of any of our significant clients or counterparties, many of whom are major financial institutions or sovereign entities, and our assumption of credit and counterparty risk, could expose us to loss and adversely affect our business;
• we could incur losses if our allowance for credit losses, including loan and lending-related commitment reserves, is inadequate or if our expectations of future economic conditions deteriorate;
• our business, financial condition and results of operations could be adversely affected if we do not effectively manage our liquidity;
• the Parent is a non-operating holding company, and as a result, is dependent on dividends from its subsidiaries and extensions of credit from its IHC to meet its obligations, including with respect to its securities, and to provide funds for share repurchases and payment of dividends to its stockholders;
• our ability to return capital to shareholders is subject to the discretion of our Board of Directors and may be limited by U.S. banking laws and regulations, including those governing capital and capital planning, applicable provisions of Delaware law and our failure to pay full and timely dividends on our preferred stock;
• any material reduction in our credit ratings or the credit ratings of our principal bank subsidiaries, The Bank of New York Mellon or BNY Mellon, N.A., could increase the cost of funding and borrowing to us and our rated subsidiaries and have a material adverse effect on our business, financial condition and results of operations and on the value of the securities we issue;
• the application of our Title I preferred resolution strategy or resolution under the Title II orderly liquidation authority could adversely affect the Parent’s liquidity and financial condition and the Parent’s security holders;
• new lines of business, new products and services or transformational or strategic project initiatives may subject us to additional risks, and the failure to implement these initiatives could affect our results of operations;
• we are subject to competition in all aspects of our business, which could negatively affect our ability to maintain or increase our profitability;
• our business may be adversely affected if we are unable to attract, retain and motivate employees;
• our strategic transactions present risks and uncertainties and could have an adverse effect on our business, financial condition and results of operations;
• our businesses may be negatively affected by adverse events, publicity, government scrutiny or other reputational harm;
• climate change concerns could adversely affect our business, affect client activity levels and damage our reputation;
• impacts from natural disasters, climate change, acts of terrorism, pandemics, global conflicts and other geopolitical events may have a negative impact on our business and operations;
• tax law changes or challenges to our tax positions with respect to historical transactions may adversely affect our net income, effective tax rate and our overall results of operations and financial condition; and
• changes in accounting standards governing the preparation of our financial statements and future events could have a material impact on our reported financial condition, results of operations, cash flows and other financial data.
Investors should consider all risk factors discussed in the 2020 Annual Report and any subsequent reports filed with the SEC by BNY Mellon pursuant to the Exchange Act. All forward-looking statements speak only as of the date on which such statements are made, and BNY Mellon undertakes no obligation to update any statement to reflect events or circumstances after the date on which such forward-looking statement is made or to reflect the occurrence of unanticipated events. The contents of BNY Mellon’s website or any other website referenced herein are not part of this report.
Forward-looking Statements (continued)
114 BNY Mellon
Assets under custody and/or administration (“AUC/A”) – Assets that we hold directly or indirectly on behalf of clients under a safekeeping or custody arrangement or for which we provide administrative services for clients. The following types of assets under administration are not and historically have not been included in AUC/A: performance and risk analytics, transfer agency and asset aggregation services. To the extent that we provide more than one AUC/A service for a client’s assets, the value of the asset is only counted once in the total amount of AUC/A.
Assets under management (“AUM”) – Includes assets beneficially owned by our clients or customers which we hold in various capacities that are either actively or passively managed, as well as the value of hedges supporting customer liabilities. These assets and liabilities are not on our balance sheet.
CAMELS – An international bank-rating system where bank supervisory authorities rate institutions according to six factors. The six factors are Capital adequacy, Asset quality, Management quality, Earnings, Liquidity and Sensitivity to market risk.
Collateral management – A comprehensive program designed to simplify collateralization and expedite securities transfers for buyers and sellers.
Credit valuation adjustment (“CVA”) – The market value of counterparty credit risk on OTC derivative transactions.
Debit valuation adjustment (“DVA”) – The market value of our credit risk on OTC derivative transactions.
Depositary Receipts – A negotiable security that generally represents a non-U.S. company’s publicly traded equity.
Economic capital – The amount of capital required to absorb potential losses and reflects the probability of remaining solvent with a target debt rating over a one-year time horizon.
Global systemically important bank (“G-SIB”) – A financial institution whose distress or disorderly failure, because of its size, complexity and systemic interconnectedness, would cause significant disruption to the wider financial system and economic activity.
Grantor Trust – A legal, passive entity through which pass-through securities are sold to investors.
High-quality liquid assets (“HQLA”) – Unencumbered assets of the types identified in the U.S. LCR rule, which the U.S. banking agencies describe as able to be convertible into cash with little or no expected loss of value during a period of liquidity stress.
Investment grade – Represents Moody’s long-term rating of Baa3 or better; and/or a Standard & Poor’s, Fitch or DBRS long-term rating of BBB- or better; or if unrated, an equivalent rating using our internal risk ratings. Instruments that fall below these levels are considered to be non-investment grade.
Real estate investment trust (“REIT”) – An investor-owned corporation, trust or association that sells shares to investors and invests in income-producing property.
Repurchase agreement (“Repo”) – An instrument used to raise short-term funds whereby securities are sold with an agreement for the seller to buy back the securities at a later date.
Reverse repurchase agreement – The purchase of securities with the agreement to sell them at a higher price at a specific future date.
Sub-custodian – A local provider (e.g., a bank) contracted to provide specific custodial-related services in a selected country or geographic area.
Glossary
BNY Mellon 115
Management of BNY Mellon is responsible for establishing and maintaining adequate internal control over financial reporting for BNY Mellon, as such term is defined in Rule 13a-15(f) under the Exchange Act.
BNY Mellon’s management, including its principal executive officer and principal financial officer, has assessed the effectiveness of BNY Mellon’s internal control over financial reporting as of December 31, 2020. In making this assessment, management used the criteria set forth by the Committee of Sponsoring Organizations of the Treadway Commission in Internal Control – Integrated Framework (2013). Based upon such assessment, management believes that, as of December 31, 2020, BNY Mellon’s internal control over financial reporting is effective based upon those criteria.
KPMG LLP, the independent registered public accounting firm that audited BNY Mellon’s 2020 financial statements included in this Annual Report under “Financial Statements” and “Notes to Consolidated Financial Statements,” has issued a report with respect to the effectiveness of BNY Mellon’s internal control over financial reporting. This report begins on page 117.
Report of Management on Internal Control Over Financial Reporting
116 BNY Mellon
Report of Independent Registered Public Accounting Firm
To the Shareholders and Board of DirectorsThe Bank of New York Mellon Corporation:
Opinion on Internal Control Over Financial Reporting
We have audited The Bank of New York Mellon Corporation and subsidiaries’ (BNY Mellon) internal control over financial reporting as of December 31, 2020, based on criteria established in Internal Control – Integrated Framework (2013) issued by the Committee of Sponsoring Organizations of the Treadway Commission. In our opinion, BNY Mellon maintained, in all material respects, effective internal control over financial reporting as of December 31, 2020, based on criteria established in Internal Control – Integrated Framework (2013) issued by the Committee of Sponsoring Organizations of the Treadway Commission.
We also have audited, in accordance with the standards of the Public Company Accounting Oversight Board (United States) (PCAOB), the consolidated balance sheets of BNY Mellon as of December 31, 2020 and 2019, the related consolidated statements of income, comprehensive income, cash flows, and changes in equity for each of the years in the three-year period ended December 31, 2020, and the related notes (collectively, the consolidated financial statements), and our report dated February 25, 2021 expressed an unqualified opinion on those consolidated financial statements.
Basis for Opinion
BNY Mellon’s management is responsible for maintaining effective internal control over financial reporting and for its assessment of the effectiveness of internal control over financial reporting, included in the accompanying Report of Management on Internal Control Over Financial Reporting. Our responsibility is to express an opinion on BNY Mellon’s internal control over financial reporting based on our audit. We are a public accounting firm registered with the PCAOB and are required to be independent with respect to BNY Mellon in accordance with the U.S. federal securities laws and the applicable rules and regulations of the Securities and Exchange Commission and the PCAOB.
We conducted our audit in accordance with the standards of the PCAOB. Those standards require that we plan and perform the audit to obtain reasonable assurance about whether effective internal control over financial reporting was maintained in all material respects. Our audit of internal control over financial reporting included obtaining an understanding of internal control over financial reporting, assessing the risk that a material weakness exists, and testing and evaluating the design and operating effectiveness of internal control based on the assessed risk. Our audit also included performing such other procedures as we considered necessary in the circumstances. We believe that our audit provides a reasonable basis for our opinion.
Definition and Limitations of Internal Control Over Financial Reporting
A company’s internal control over financial reporting is a process designed to provide reasonable assurance regarding the reliability of financial reporting and the preparation of financial statements for external purposes in accordance with generally accepted accounting principles. A company’s internal control over financial reporting includes those policies and procedures that (1) pertain to the maintenance of records that, in reasonable detail, accurately and fairly reflect the transactions and dispositions of the assets of the company; (2) provide reasonable assurance that transactions are recorded as necessary to permit preparation of financial statements in accordance with generally accepted accounting principles, and that receipts and expenditures of the company are being made
BNY Mellon 117

only in accordance with authorizations of management and directors of the company; and (3) provide reasonable assurance regarding prevention or timely detection of unauthorized acquisition, use, or disposition of the company’s assets that could have a material effect on the financial statements.
Because of its inherent limitations, internal control over financial reporting may not prevent or detect misstatements. Also, projections of any evaluation of effectiveness to future periods are subject to the risk that controls may become inadequate because of changes in conditions, or that the degree of compliance with the policies or procedures may deteriorate.
/s/ KPMG LLP
New York, New York February 25, 2021
118 BNY Mellon
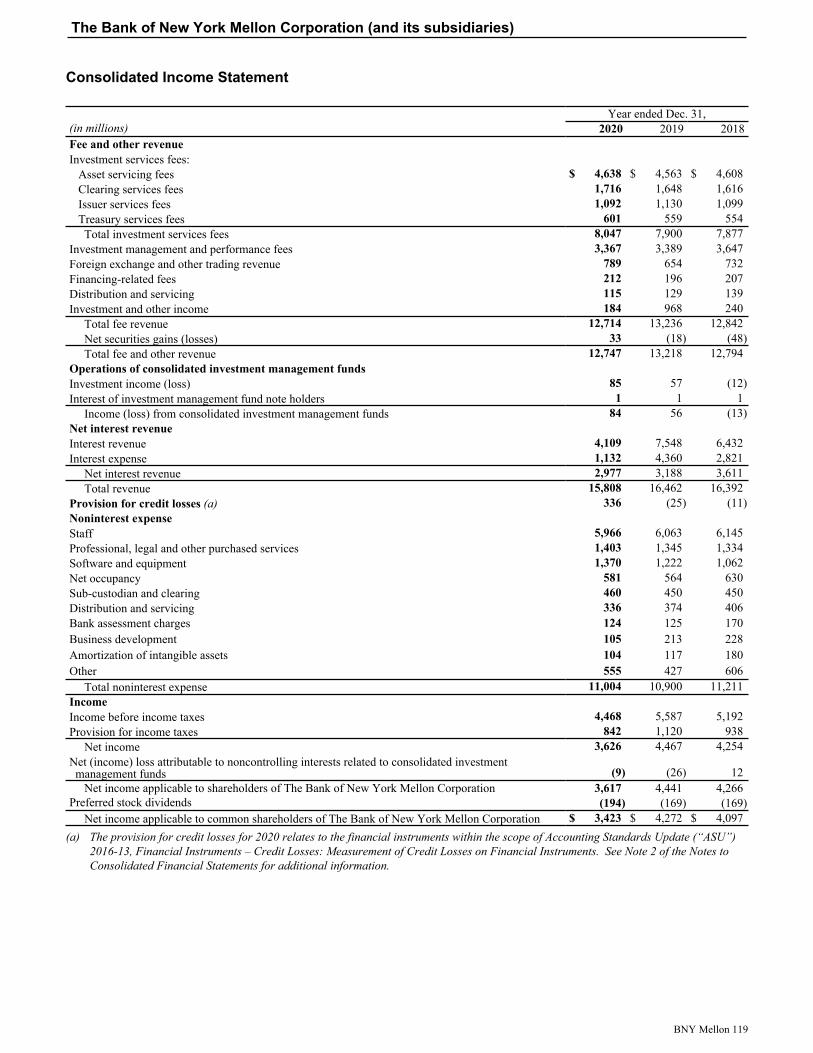
Consolidated Income Statement
Year ended Dec. 31,(in millions) 2020 2019 2018Fee and other revenueInvestment services fees:
Asset servicing fees $ 4,638 $ 4,563 $ 4,608 Clearing services fees 1,716 1,648 1,616 Issuer services fees 1,092 1,130 1,099 Treasury services fees 601 559 554 Total investment services fees 8,047 7,900 7,877
Investment management and performance fees 3,367 3,389 3,647 Foreign exchange and other trading revenue 789 654 732 Financing-related fees 212 196 207 Distribution and servicing 115 129 139 Investment and other income 184 968 240
Total fee revenue 12,714 13,236 12,842 Net securities gains (losses) 33 (18) (48) Total fee and other revenue 12,747 13,218 12,794
Operations of consolidated investment management fundsInvestment income (loss) 85 57 (12) Interest of investment management fund note holders 1 1 1
Income (loss) from consolidated investment management funds 84 56 (13) Net interest revenueInterest revenue 4,109 7,548 6,432 Interest expense 1,132 4,360 2,821
Net interest revenue 2,977 3,188 3,611 Total revenue 15,808 16,462 16,392
Provision for credit losses (a) 336 (25) (11) Noninterest expenseStaff 5,966 6,063 6,145 Professional, legal and other purchased services 1,403 1,345 1,334 Software and equipment 1,370 1,222 1,062 Net occupancy 581 564 630 Sub-custodian and clearing 460 450 450 Distribution and servicing 336 374 406 Bank assessment charges 124 125 170 Business development 105 213 228 Amortization of intangible assets 104 117 180 Other 555 427 606
Total noninterest expense 11,004 10,900 11,211 IncomeIncome before income taxes 4,468 5,587 5,192 Provision for income taxes 842 1,120 938
Net income 3,626 4,467 4,254 Net (income) loss attributable to noncontrolling interests related to consolidated investment management funds (9) (26) 12
Net income applicable to shareholders of The Bank of New York Mellon Corporation 3,617 4,441 4,266 Preferred stock dividends (194) (169) (169)
Net income applicable to common shareholders of The Bank of New York Mellon Corporation $ 3,423 $ 4,272 $ 4,097 (a) The provision for credit losses for 2020 relates to the financial instruments within the scope of Accounting Standards Update (“ASU”)
2016-13, Financial Instruments – Credit Losses: Measurement of Credit Losses on Financial Instruments. See Note 2 of the Notes to Consolidated Financial Statements for additional information.
The Bank of New York Mellon Corporation (and its subsidiaries)
BNY Mellon 119
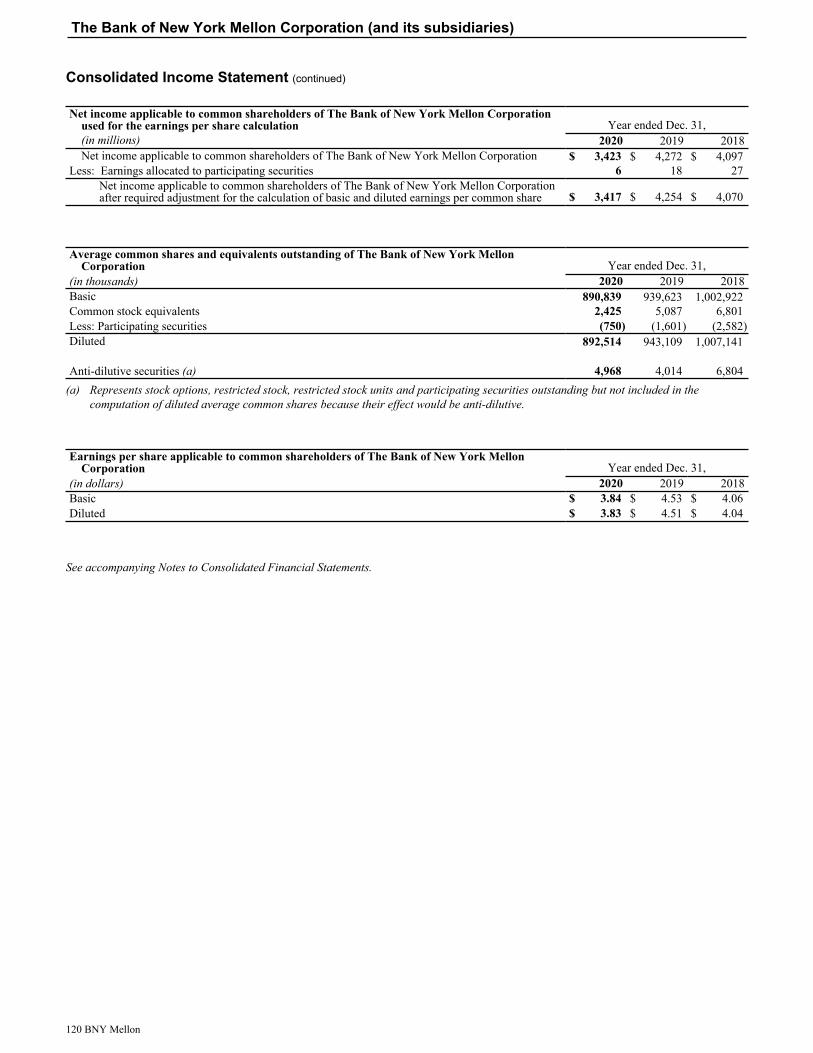
Consolidated Income Statement (continued)
Net income applicable to common shareholders of The Bank of New York Mellon Corporation used for the earnings per share calculation Year ended Dec. 31,(in millions) 2020 2019 2018Net income applicable to common shareholders of The Bank of New York Mellon Corporation $ 3,423 $ 4,272 $ 4,097
Less: Earnings allocated to participating securities 6 18 27 Net income applicable to common shareholders of The Bank of New York Mellon Corporation after required adjustment for the calculation of basic and diluted earnings per common share $ 3,417 $ 4,254 $ 4,070
Average common shares and equivalents outstanding of The Bank of New York Mellon Corporation Year ended Dec. 31,
(in thousands) 2020 2019 2018Basic 890,839 939,623 1,002,922 Common stock equivalents 2,425 5,087 6,801 Less: Participating securities (750) (1,601) (2,582) Diluted 892,514 943,109 1,007,141
Anti-dilutive securities (a) 4,968 4,014 6,804 (a) Represents stock options, restricted stock, restricted stock units and participating securities outstanding but not included in the
computation of diluted average common shares because their effect would be anti-dilutive.
Earnings per share applicable to common shareholders of The Bank of New York Mellon Corporation Year ended Dec. 31,
(in dollars) 2020 2019 2018Basic $ 3.84 $ 4.53 $ 4.06 Diluted $ 3.83 $ 4.51 $ 4.04
See accompanying Notes to Consolidated Financial Statements.
The Bank of New York Mellon Corporation (and its subsidiaries)
120 BNY Mellon
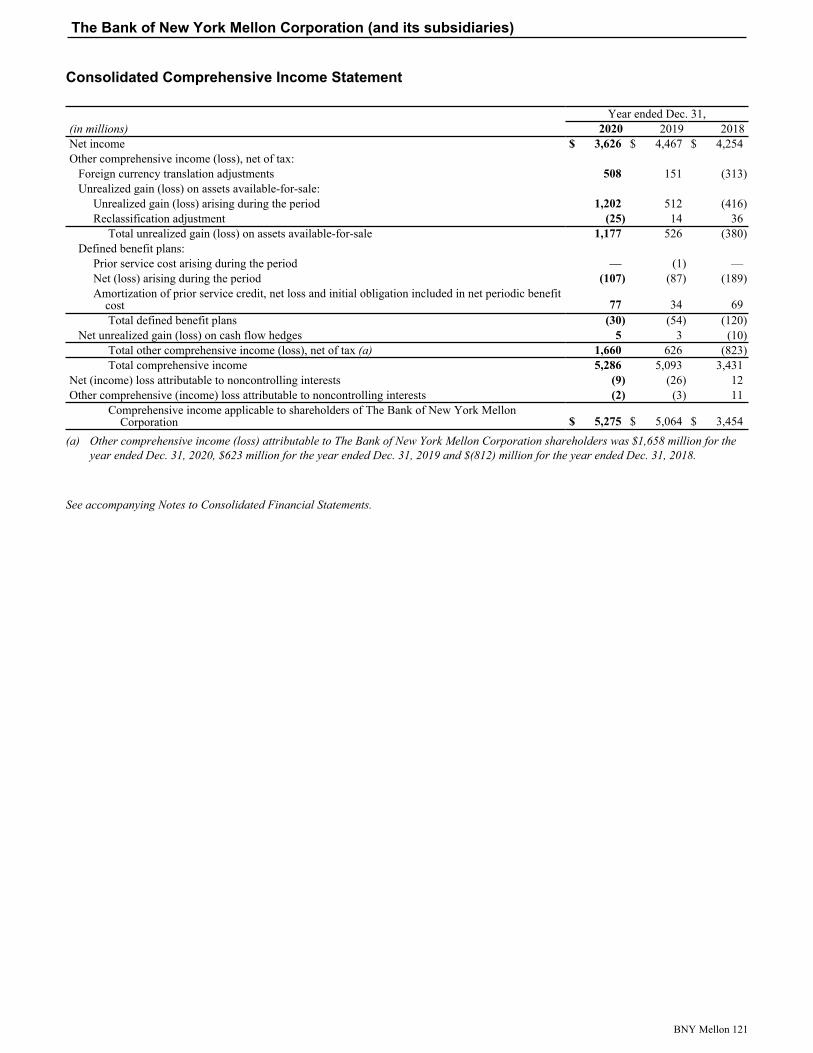
Consolidated Comprehensive Income Statement
Year ended Dec. 31,(in millions) 2020 2019 2018Net income $ 3,626 $ 4,467 $ 4,254 Other comprehensive income (loss), net of tax:
Foreign currency translation adjustments 508 151 (313) Unrealized gain (loss) on assets available-for-sale:
Unrealized gain (loss) arising during the period 1,202 512 (416) Reclassification adjustment (25) 14 36
Total unrealized gain (loss) on assets available-for-sale 1,177 526 (380) Defined benefit plans:
Prior service cost arising during the period — (1) — Net (loss) arising during the period (107) (87) (189) Amortization of prior service credit, net loss and initial obligation included in net periodic benefit
cost 77 34 69 Total defined benefit plans (30) (54) (120)
Net unrealized gain (loss) on cash flow hedges 5 3 (10) Total other comprehensive income (loss), net of tax (a) 1,660 626 (823) Total comprehensive income 5,286 5,093 3,431
Net (income) loss attributable to noncontrolling interests (9) (26) 12 Other comprehensive (income) loss attributable to noncontrolling interests (2) (3) 11
Comprehensive income applicable to shareholders of The Bank of New York Mellon Corporation $ 5,275 $ 5,064 $ 3,454
(a) Other comprehensive income (loss) attributable to The Bank of New York Mellon Corporation shareholders was $1,658 million for the year ended Dec. 31, 2020, $623 million for the year ended Dec. 31, 2019 and $(812) million for the year ended Dec. 31, 2018.
See accompanying Notes to Consolidated Financial Statements.
The Bank of New York Mellon Corporation (and its subsidiaries)
BNY Mellon 121
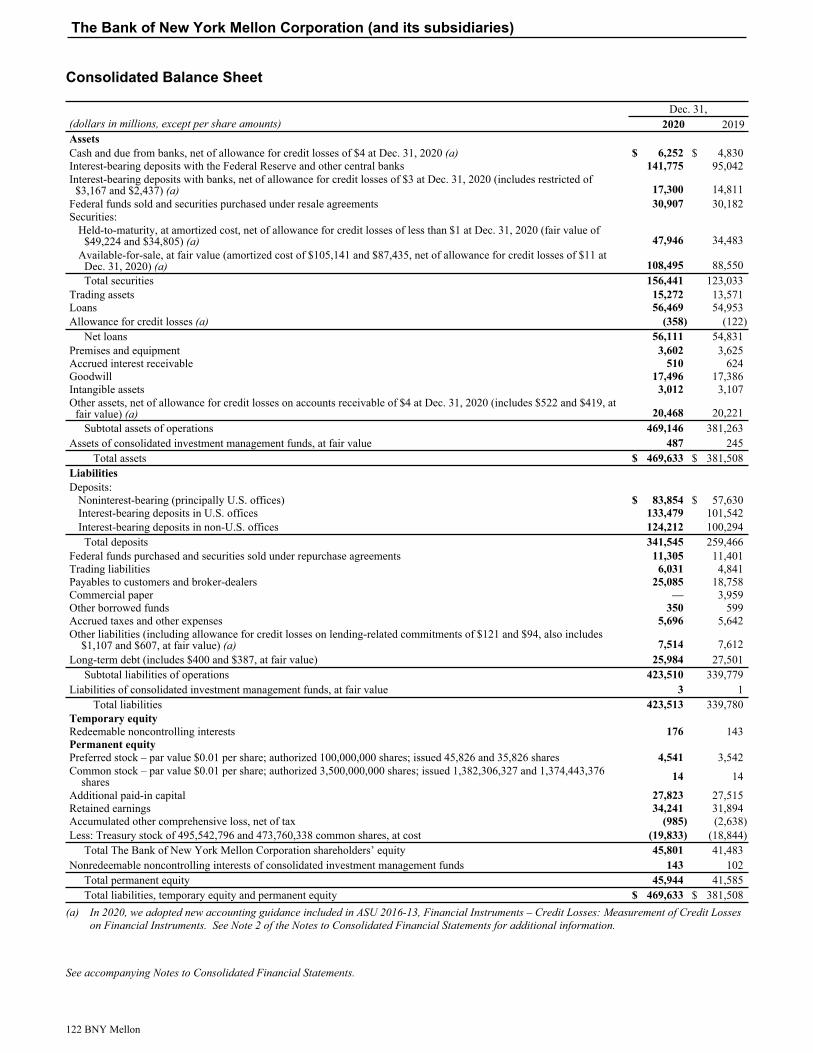
Consolidated Balance Sheet
Dec. 31,(dollars in millions, except per share amounts) 2020 2019AssetsCash and due from banks, net of allowance for credit losses of $4 at Dec. 31, 2020 (a) $ 6,252 $ 4,830 Interest-bearing deposits with the Federal Reserve and other central banks 141,775 95,042 Interest-bearing deposits with banks, net of allowance for credit losses of $3 at Dec. 31, 2020 (includes restricted of
$3,167 and $2,437) (a) 17,300 14,811 Federal funds sold and securities purchased under resale agreements 30,907 30,182 Securities:
Held-to-maturity, at amortized cost, net of allowance for credit losses of less than $1 at Dec. 31, 2020 (fair value of $49,224 and $34,805) (a) 47,946 34,483
Available-for-sale, at fair value (amortized cost of $105,141 and $87,435, net of allowance for credit losses of $11 at Dec. 31, 2020) (a) 108,495 88,550 Total securities 156,441 123,033
Trading assets 15,272 13,571 Loans 56,469 54,953 Allowance for credit losses (a) (358) (122)
Net loans 56,111 54,831 Premises and equipment 3,602 3,625 Accrued interest receivable 510 624 Goodwill 17,496 17,386 Intangible assets 3,012 3,107 Other assets, net of allowance for credit losses on accounts receivable of $4 at Dec. 31, 2020 (includes $522 and $419, at
fair value) (a) 20,468 20,221 Subtotal assets of operations 469,146 381,263
Assets of consolidated investment management funds, at fair value 487 245 Total assets $ 469,633 $ 381,508
LiabilitiesDeposits:
Noninterest-bearing (principally U.S. offices) $ 83,854 $ 57,630 Interest-bearing deposits in U.S. offices 133,479 101,542 Interest-bearing deposits in non-U.S. offices 124,212 100,294
Total deposits 341,545 259,466 Federal funds purchased and securities sold under repurchase agreements 11,305 11,401 Trading liabilities 6,031 4,841 Payables to customers and broker-dealers 25,085 18,758 Commercial paper — 3,959 Other borrowed funds 350 599 Accrued taxes and other expenses 5,696 5,642 Other liabilities (including allowance for credit losses on lending-related commitments of $121 and $94, also includes
$1,107 and $607, at fair value) (a) 7,514 7,612 Long-term debt (includes $400 and $387, at fair value) 25,984 27,501
Subtotal liabilities of operations 423,510 339,779 Liabilities of consolidated investment management funds, at fair value 3 1
Total liabilities 423,513 339,780 Temporary equityRedeemable noncontrolling interests 176 143 Permanent equityPreferred stock – par value $0.01 per share; authorized 100,000,000 shares; issued 45,826 and 35,826 shares 4,541 3,542 Common stock – par value $0.01 per share; authorized 3,500,000,000 shares; issued 1,382,306,327 and 1,374,443,376
shares 14 14
Additional paid-in capital 27,823 27,515 Retained earnings 34,241 31,894 Accumulated other comprehensive loss, net of tax (985) (2,638) Less: Treasury stock of 495,542,796 and 473,760,338 common shares, at cost (19,833) (18,844)
Total The Bank of New York Mellon Corporation shareholders’ equity 45,801 41,483 Nonredeemable noncontrolling interests of consolidated investment management funds 143 102
Total permanent equity 45,944 41,585 Total liabilities, temporary equity and permanent equity $ 469,633 $ 381,508
(a) In 2020, we adopted new accounting guidance included in ASU 2016-13, Financial Instruments – Credit Losses: Measurement of Credit Losses on Financial Instruments. See Note 2 of the Notes to Consolidated Financial Statements for additional information.
See accompanying Notes to Consolidated Financial Statements.
The Bank of New York Mellon Corporation (and its subsidiaries)
122 BNY Mellon
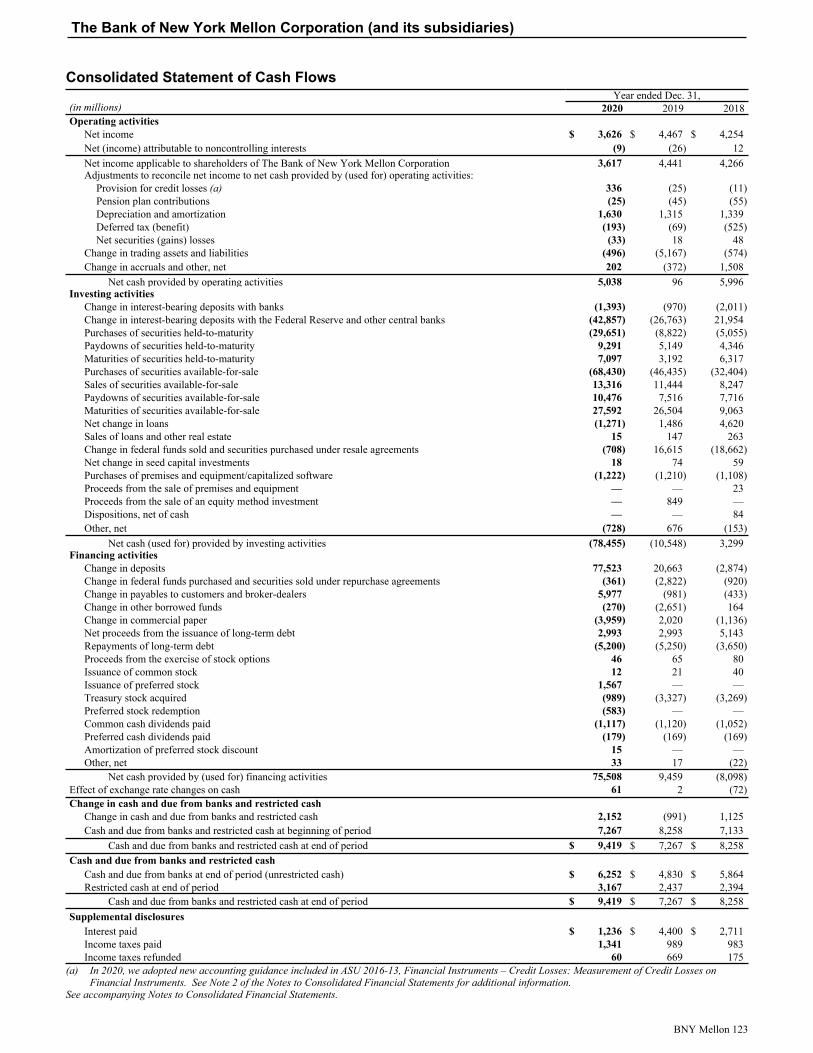
Consolidated Statement of Cash FlowsYear ended Dec. 31,
(in millions) 2020 2019 2018Operating activities
Net income $ 3,626 $ 4,467 $ 4,254 Net (income) attributable to noncontrolling interests (9) (26) 12 Net income applicable to shareholders of The Bank of New York Mellon Corporation 3,617 4,441 4,266 Adjustments to reconcile net income to net cash provided by (used for) operating activities:
Provision for credit losses (a) 336 (25) (11) Pension plan contributions (25) (45) (55) Depreciation and amortization 1,630 1,315 1,339 Deferred tax (benefit) (193) (69) (525) Net securities (gains) losses (33) 18 48
Change in trading assets and liabilities (496) (5,167) (574) Change in accruals and other, net 202 (372) 1,508
Net cash provided by operating activities 5,038 96 5,996 Investing activities
Change in interest-bearing deposits with banks (1,393) (970) (2,011) Change in interest-bearing deposits with the Federal Reserve and other central banks (42,857) (26,763) 21,954 Purchases of securities held-to-maturity (29,651) (8,822) (5,055) Paydowns of securities held-to-maturity 9,291 5,149 4,346 Maturities of securities held-to-maturity 7,097 3,192 6,317 Purchases of securities available-for-sale (68,430) (46,435) (32,404) Sales of securities available-for-sale 13,316 11,444 8,247 Paydowns of securities available-for-sale 10,476 7,516 7,716 Maturities of securities available-for-sale 27,592 26,504 9,063 Net change in loans (1,271) 1,486 4,620 Sales of loans and other real estate 15 147 263 Change in federal funds sold and securities purchased under resale agreements (708) 16,615 (18,662) Net change in seed capital investments 18 74 59 Purchases of premises and equipment/capitalized software (1,222) (1,210) (1,108) Proceeds from the sale of premises and equipment — — 23 Proceeds from the sale of an equity method investment — 849 — Dispositions, net of cash — — 84 Other, net (728) 676 (153)
Net cash (used for) provided by investing activities (78,455) (10,548) 3,299 Financing activities
Change in deposits 77,523 20,663 (2,874) Change in federal funds purchased and securities sold under repurchase agreements (361) (2,822) (920) Change in payables to customers and broker-dealers 5,977 (981) (433) Change in other borrowed funds (270) (2,651) 164 Change in commercial paper (3,959) 2,020 (1,136) Net proceeds from the issuance of long-term debt 2,993 2,993 5,143 Repayments of long-term debt (5,200) (5,250) (3,650) Proceeds from the exercise of stock options 46 65 80 Issuance of common stock 12 21 40 Issuance of preferred stock 1,567 — — Treasury stock acquired (989) (3,327) (3,269) Preferred stock redemption (583) — — Common cash dividends paid (1,117) (1,120) (1,052) Preferred cash dividends paid (179) (169) (169) Amortization of preferred stock discount 15 — — Other, net 33 17 (22)
Net cash provided by (used for) financing activities 75,508 9,459 (8,098) Effect of exchange rate changes on cash 61 2 (72) Change in cash and due from banks and restricted cash
Change in cash and due from banks and restricted cash 2,152 (991) 1,125 Cash and due from banks and restricted cash at beginning of period 7,267 8,258 7,133
Cash and due from banks and restricted cash at end of period $ 9,419 $ 7,267 $ 8,258 Cash and due from banks and restricted cash
Cash and due from banks at end of period (unrestricted cash) $ 6,252 $ 4,830 $ 5,864 Restricted cash at end of period 3,167 2,437 2,394
Cash and due from banks and restricted cash at end of period $ 9,419 $ 7,267 $ 8,258 Supplemental disclosures
Interest paid $ 1,236 $ 4,400 $ 2,711 Income taxes paid 1,341 989 983 Income taxes refunded 60 669 175
(a) In 2020, we adopted new accounting guidance included in ASU 2016-13, Financial Instruments – Credit Losses: Measurement of Credit Losses on Financial Instruments. See Note 2 of the Notes to Consolidated Financial Statements for additional information.
See accompanying Notes to Consolidated Financial Statements.
The Bank of New York Mellon Corporation (and its subsidiaries)
BNY Mellon 123
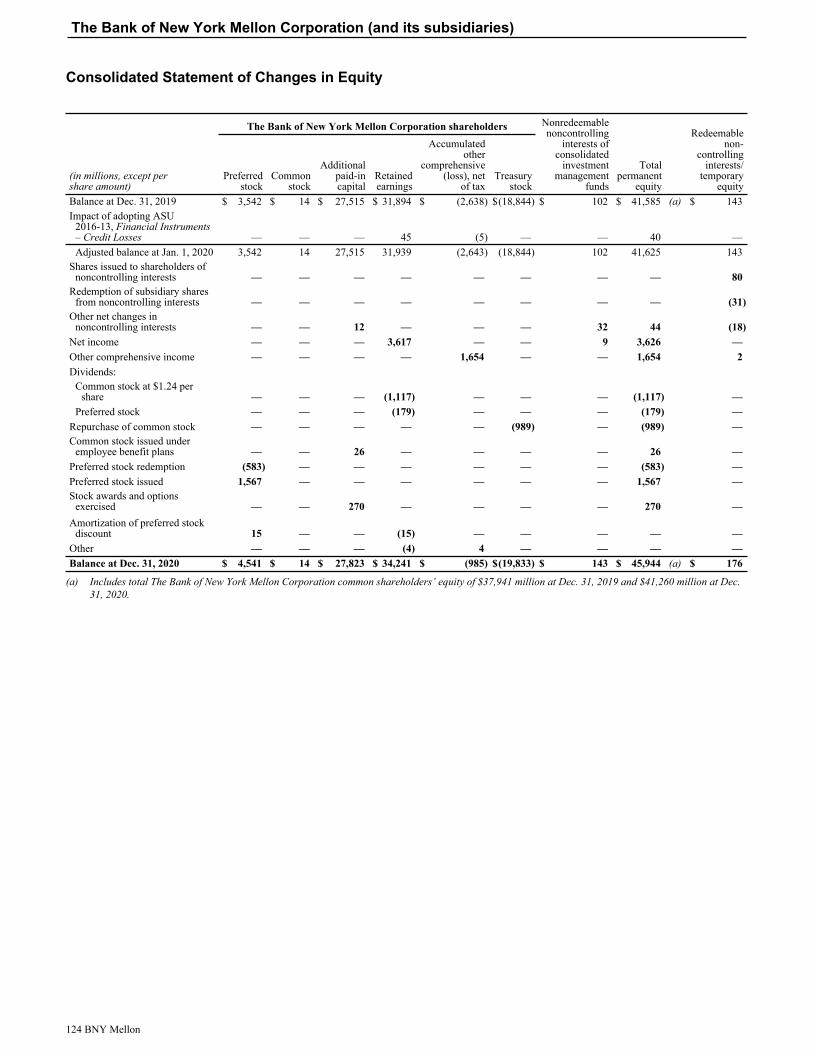
Consolidated Statement of Changes in Equity
The Bank of New York Mellon Corporation shareholders Nonredeemablenoncontrolling
interests ofconsolidated
investmentmanagement
funds
Totalpermanent
equity
Redeemablenon-
controllinginterests/
temporaryequity
(in millions, except pershare amount)
Preferred stock
Commonstock
Additionalpaid-incapital
Retainedearnings
Accumulated other
comprehensive (loss), net
of taxTreasury
stockBalance at Dec. 31, 2019 $ 3,542 $ 14 $ 27,515 $ 31,894 $ (2,638) $ (18,844) $ 102 $ 41,585 (a) $ 143 Impact of adopting ASU
2016-13, Financial Instruments – Credit Losses — — — 45 (5) — — 40 — Adjusted balance at Jan. 1, 2020 3,542 14 27,515 31,939 (2,643) (18,844) 102 41,625 143
Shares issued to shareholders of noncontrolling interests — — — — — — — — 80
Redemption of subsidiary shares from noncontrolling interests — — — — — — — — (31)
Other net changes in noncontrolling interests — — 12 — — — 32 44 (18)
Net income — — — 3,617 — — 9 3,626 — Other comprehensive income — — — — 1,654 — — 1,654 2 Dividends:
Common stock at $1.24 per share — — — (1,117) — — — (1,117) —
Preferred stock — — — (179) — — — (179) — Repurchase of common stock — — — — — (989) — (989) — Common stock issued under
employee benefit plans — — 26 — — — — 26 — Preferred stock redemption (583) — — — — — — (583) — Preferred stock issued 1,567 — — — — — — 1,567 — Stock awards and options
exercised — — 270 — — — — 270 — Amortization of preferred stock
discount 15 — — (15) — — — — — Other — — — (4) 4 — — — — Balance at Dec. 31, 2020 $ 4,541 $ 14 $ 27,823 $ 34,241 $ (985) $ (19,833) $ 143 $ 45,944 (a) $ 176
(a) Includes total The Bank of New York Mellon Corporation common shareholders’ equity of $37,941 million at Dec. 31, 2019 and $41,260 million at Dec. 31, 2020.
The Bank of New York Mellon Corporation (and its subsidiaries)
124 BNY Mellon
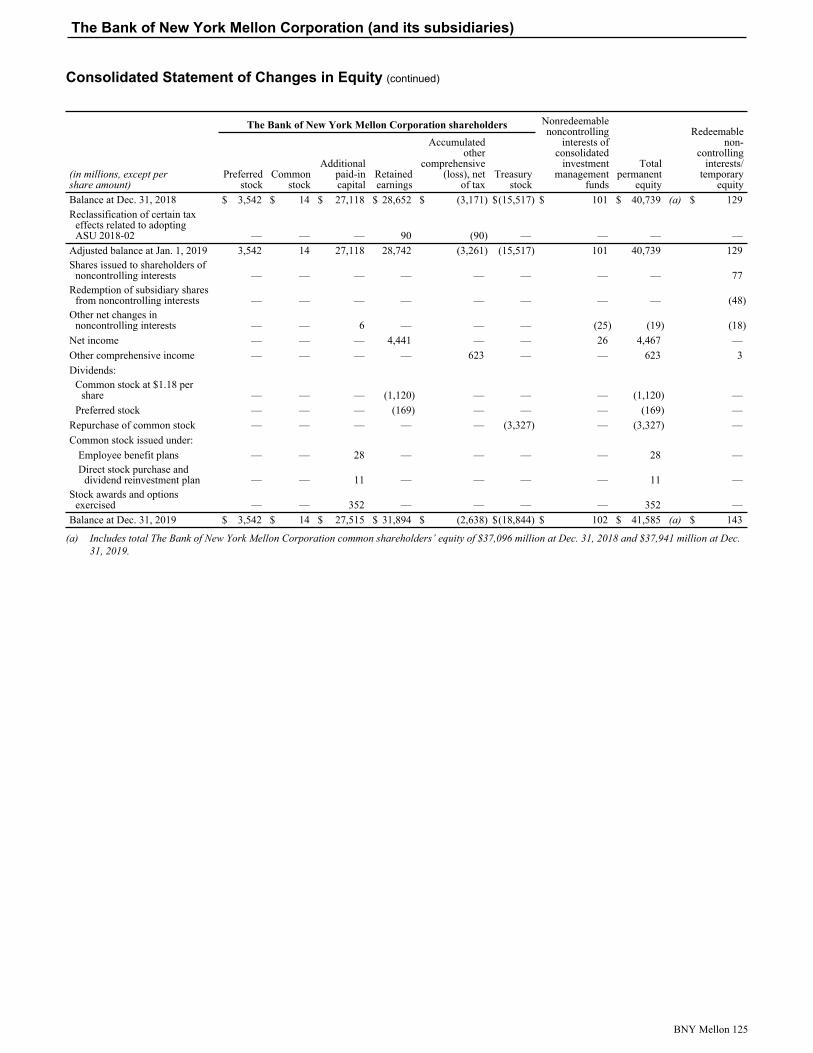
Consolidated Statement of Changes in Equity (continued)
The Bank of New York Mellon Corporation shareholders Nonredeemablenoncontrolling
interests ofconsolidated
investmentmanagement
funds
Totalpermanent
equity
Redeemablenon-
controllinginterests/
temporaryequity
(in millions, except pershare amount)
Preferred stock
Commonstock
Additionalpaid-incapital
Retainedearnings
Accumulated other
comprehensive (loss), net
of taxTreasury
stockBalance at Dec. 31, 2018 $ 3,542 $ 14 $ 27,118 $ 28,652 $ (3,171) $ (15,517) $ 101 $ 40,739 (a) $ 129 Reclassification of certain tax
effects related to adopting ASU 2018-02 — — — 90 (90) — — — —
Adjusted balance at Jan. 1, 2019 3,542 14 27,118 28,742 (3,261) (15,517) 101 40,739 129 Shares issued to shareholders of
noncontrolling interests — — — — — — — — 77 Redemption of subsidiary shares
from noncontrolling interests — — — — — — — — (48) Other net changes in
noncontrolling interests — — 6 — — — (25) (19) (18) Net income — — — 4,441 — — 26 4,467 — Other comprehensive income — — — — 623 — — 623 3 Dividends:
Common stock at $1.18 per share — — — (1,120) — — — (1,120) —
Preferred stock — — — (169) — — — (169) — Repurchase of common stock — — — — — (3,327) — (3,327) — Common stock issued under:
Employee benefit plans — — 28 — — — — 28 — Direct stock purchase and
dividend reinvestment plan — — 11 — — — — 11 — Stock awards and options
exercised — — 352 — — — — 352 — Balance at Dec. 31, 2019 $ 3,542 $ 14 $ 27,515 $ 31,894 $ (2,638) $ (18,844) $ 102 $ 41,585 (a) $ 143
(a) Includes total The Bank of New York Mellon Corporation common shareholders’ equity of $37,096 million at Dec. 31, 2018 and $37,941 million at Dec. 31, 2019.
The Bank of New York Mellon Corporation (and its subsidiaries)
BNY Mellon 125

Consolidated Statement of Changes in Equity (continued)
The Bank of New York Mellon Corporation shareholders Non-redeemablenoncontrolling
interests ofconsolidated
investmentmanagement
funds
Totalpermanent
equity
Redeemablenon-
controllinginterests/
temporaryequity
(in millions, except pershare amount)
Preferred stock
Commonstock
Additionalpaid-incapital
Retainedearnings
Accumulated other
comprehensive (loss), net
of taxTreasury
stockBalance at Dec. 31, 2017 $ 3,542 $ 14 $ 26,665 $ 25,635 $ (2,357) $ (12,248) $ 316 $ 41,567 (a) $ 179 Adjustment for the cumulative
effect of applying ASU 2014-09 for contract revenue — — — (55) — — — (55) —
Adjustment for the cumulative effect of applying ASU 2017-12 for derivatives and hedging — — — 27 (2) — — 25 — Adjusted balance at Jan. 1,
2018 3,542 14 26,665 25,607 (2,359) (12,248) 316 41,537 179 Shares issued to shareholders of
noncontrolling interests — — — — — — — — 61 Redemption of subsidiary shares
from noncontrolling interests — — — — — — — — (92) Other net changes in
noncontrolling interests — — 12 — — — (203) (191) (8) Net income (loss) — — — 4,266 — — (12) 4,254 — Other comprehensive (loss) — — — — (812) — — (812) (11) Dividends:
Common stock at $1.04 per share — — — (1,052) — — — (1,052) —
Preferred stock — — — (169) — — — (169) — Repurchase of common stock — — — — — (3,269) — (3,269) — Common stock issued under:
Employee benefit plans — — 31 — — — — 31 — Direct stock purchase and
dividend reinvestment plan — — 30 — — — — 30 — Stock awards and options
exercised — — 380 — — — — 380 — Balance at Dec. 31, 2018 $ 3,542 $ 14 $ 27,118 $ 28,652 $ (3,171) $ (15,517) $ 101 $ 40,739 (a) $ 129
(a) Includes total The Bank of New York Mellon Corporation common shareholders’ equity of $37,709 million at Dec. 31, 2017 and $37,096 million at Dec. 31, 2018.
See accompanying Notes to Consolidated Financial Statements.
The Bank of New York Mellon Corporation (and its subsidiaries)
126 BNY Mellon
Note 1–Summary of significant accounting and reporting policies
In this Annual Report, references to “our,” “we,” “us,” “BNY Mellon,” the “Company” and similar terms refer to The Bank of New York Mellon Corporation and its consolidated subsidiaries. The term “Parent” refers to The Bank of New York Mellon Corporation but not its subsidiaries.
Nature of operations
BNY Mellon is a global leader in providing a broad range of financial products and services in domestic and international markets. Through our two principal businesses, Investment Services and Investment and Wealth Management, we serve institutions, corporations and high-net-worth individuals. See Note 24 for the primary products and services of our principal businesses and other information.
Basis of presentation
The accounting and financial reporting policies of BNY Mellon, a global financial services company, conform to U.S. generally accepted accounting principles (“GAAP”) and prevailing industry practices.
In the opinion of management, all adjustments necessary for a fair presentation of financial position, results of operations and cash flows for the periods presented have been made. Certain immaterial reclassifications have been made to prior periods to place them on a basis comparable with current period presentation.
Use of estimates
The preparation of financial statements in conformity with U.S. GAAP requires management to make estimates based upon assumptions about future economic and market conditions which affect reported amounts and related disclosures in our financial statements. Our most significant estimates pertain to our allowance for credit losses, fair value of financial instruments and derivatives, goodwill and other intangibles and litigation and regulatory contingencies. Although our current estimates contemplate current conditions and how we expect them to change in the future, it is reasonably possible that actual conditions could be worse than anticipated in those estimates, which could materially affect our results of operations and financial condition.
Foreign currency translation
Assets and liabilities denominated in foreign currencies are translated to U.S. dollars at the rate of exchange on the balance sheet date. Transaction gains and losses are included in the income statement. Translation gains and losses on investments in foreign entities with functional currencies that are not the U.S. dollar are recorded as foreign currency translation adjustments in other comprehensive income (“OCI”). Revenue and expense transactions are translated at the applicable daily rate or the weighted average monthly exchange rate when applying the daily rate is not practical.
Acquired businesses
The income statement and balance sheet include results of acquired businesses accounted for under the acquisition method of accounting pursuant to Accounting Standards Codification (“ASC”) 805, Business Combinations and equity investments from the dates of acquisition. Contingent purchase consideration is measured at its fair value and recorded on the purchase date. Any subsequent changes in the fair value of a contingent consideration liability are recorded through the income statement.
Consolidation
We evaluate an entity for possible consolidation in accordance with ASC 810, Consolidation. We first determine whether or not we have variable interests in the entity, which are investments or other interests that absorb portions of an entity’s expected losses or receive portions of the entity’s expected returns. Our variable interests may include decision-maker or service provider fees, direct and indirect investments and investments made by related parties, including related parties under common control. If it is determined that we do not have a variable interest in the entity, no further analysis is required and the entity is not consolidated.
If we hold a variable interest in the entity, further analysis is performed to determine if the entity is a variable interest entity (“VIE”) or a voting model entity (“VME”).
We consider the underlying facts and circumstances of individual entities when assessing whether or not an entity is a VIE. An entity is determined to be a VIE if the equity investors:
Notes to Consolidated Financial Statements
BNY Mellon 127
• do not have sufficient equity at risk for the entity to finance its activities without additional subordinated financial support; or
• lack one or more of the following characteristics of a controlling financial interest: • the power, through voting rights or similar
rights, to direct the activities of an entity that most significantly impact the entity’s economic performance;
• the obligation to absorb the expected losses of the entity; and
• the right to receive the expected residual returns of the entity.
We reconsider and reassess whether or not we are the primary beneficiary of a VIE when governing documents or contractual arrangements are changed that would reallocate the obligation to absorb expected losses or receive expected residual returns between BNY Mellon and the other investors. This could occur when BNY Mellon disposes of any portion of its variable interests in the VIE, when we acquire additional variable interests in the VIE, when additional variable interests are issued to other investors or when other investors liquidate their variable interest in the VIE.
We consolidate a VIE if it is determined that we have a controlling financial interest in the entity. We have a controlling financial interest in a VIE when we have both (1) the power to direct the activities of the VIE that most significantly impact the VIE’s economic performance and (2) the obligation to absorb losses or the right to receive benefits of the VIE that could potentially be significant to that VIE.
For entities that do not meet the definition of a VIE, the entity is considered a VME. We consolidate these entities if we can exert control over the financial and operating policies of an investee, which can occur if we have a 50% or more voting interest in the entity.
See Note 14 for additional disclosures related to our variable interests.
Equity method investments, including renewable energy investments
Equity investments of less than a majority but at least 20% ownership are accounted for by the equity method and included in other assets. Earnings on these investments are reflected as investment services fees, investment management and performance fees
or investment and other income, as appropriate, in the period earned.
A loss in value of an equity investment that is determined to be other-than-temporary is recognized by reducing the carrying value of the equity investment to its fair value.
Renewable energy investment projects through limited liability companies are accounted for using the equity method of accounting. The hypothetical liquidation at book value (“HLBV”) methodology is used to determine the pre-tax loss that is recognized in each period. HLBV estimates the liquidation value at the beginning and end of each period, with the difference recognized as the amount of loss under the equity method.
The pre-tax losses are reported in investment and other income on the income statement. The corresponding tax benefits and credits are recorded as a reduction to provision for income taxes on the income statement.
See Note 8 for the amount of our renewable energy investments. Below are our most significant equity method investments, other than the investments in renewable energy.
Equity method investments at Dec. 31, 2020
(dollars in millions)Percentage ownership Book value
CIBC Mellon Global Securities Services Company (“CIBC Mellon”) 50% $ 698
Siguler Guff 20% $ 223
Restricted cash and securities
Cash and securities may be segregated under federal and other regulatory requirements and consists of excess client funds held by our broker-dealer entities. Restricted cash is included in interest-bearing deposits with banks on the balance sheet and with cash and due from banks when reconciling the beginning and end-of-period balances on the consolidated statement of cash flows.
Securities purchased under resale agreements and securities sold under repurchase agreements
Securities purchased under resale agreements and securities sold under repurchase agreements are accounted for as collateralized financings. Generally,
Notes to Consolidated Financial Statements (continued)
128 BNY Mellon
these agreements are recorded at the amounts at which the securities will be subsequently resold or repurchased, plus accrued interest.
Securities purchased under resale agreements are fully collateralized with high-quality liquid securities. Collateral requirements are monitored and additional collateral is received or provided, as required. As such, these transactions carry minimal credit risk and are generally not allocated an allowance for credit losses.
Where an enforceable netting agreement exists, resale and repurchase agreements executed with the same counterparty and the same maturity date are reported on a net basis on the balance sheet.
Securities – Debt
Debt securities are classified as available-for-sale, held-to-maturity or trading securities when they are purchased. Debt securities are classified as available-for-sale securities when we intend to hold the securities for an indefinite period of time or when the securities may be used for tactical asset/liability purposes and may be sold from time to time to effectively manage interest rate exposure, prepayment risk and liquidity needs. Debt securities are classified as held-to-maturity securities when we intend and have the ability to hold them until maturity. Debt securities are classified as trading securities when our intention is to resell the securities.
Available-for-sale securities are measured at fair value. The difference between fair value and amortized cost representing unrealized gains or losses on assets classified as available-for-sale is recorded net of tax as an addition to, or deduction from, OCI, unless an expected credit loss is recognized. If we determine that a credit loss exists, the amount is recognized as an allowance for credit losses in securities – available-for-sale, with a corresponding adjustment to the provision for credit losses and the non-credit portion of the unrealized loss is recognized in OCI. Realized gains and losses on sales of available-for-sale securities are reported on the income statement. The cost of debt securities sold is determined on a specific identification method. Held-to-maturity securities are measured at amortized cost. If we determine that a credit loss exists, the amount is recognized as an allowance for credit losses in securities – held-to-maturity, with a corresponding adjustment to the provision for credit losses.
The accounting policy for estimating credit losses related to securities held-to-maturity changed beginning in the first quarter of 2020 as a result of the adoption of ASU 2016-13, Financial Instruments – Credit Losses: Measurement of Credit Losses on Financial Instruments. This ASU also included targeted amendments with respect to credit losses for available-for-sale debt securities. Additional information regarding the Company’s policy for recognition of expected credit losses for securities available-for-sale and securities held-to-maturity is contained within “Allowance for credit losses – Securities – Debt” and “Allowance for credit losses – Other” below.
Trading securities are measured at fair value and included in trading assets on the balance sheet. Trading revenue includes both realized and unrealized gains and losses. The liability incurred on short-sale transactions, representing the obligation to deliver securities, is included in trading liabilities at fair value.
Income on securities purchased is adjusted for amortization of premium and accretion of discount on a level yield basis, generally over their contractual life.
For debt securities that are beneficial interests in securitized financial assets and are not high credit quality, ASC 325, Investments – Other, provides that cash flows be discounted at the current yield used to accrete the beneficial interest. A credit loss is recognized when there is an adverse change in expected cash flows.
If we intend to sell the security or it is more likely than not that we will be required to sell the security prior to recovery of its cost basis, the security is written down to fair value and the credit and non-credit components of the unrealized loss are recognized in earnings and subsequently accreted to interest income on an effective yield basis over the life of the security. Subsequent increases in the fair value of the security after the write-down are included in OCI.
The accounting policy for the determination of the fair value of financial instruments has been identified as a “critical accounting estimate” as it requires us to make numerous assumptions based on available market data. See Note 4 for these disclosures.
Notes to Consolidated Financial Statements (continued)
BNY Mellon 129

Securities – Equity
Investments in equity securities that do not result in consolidation and are not accounted for under the equity method are measured at fair value with changes in the fair value recognized through earnings, unless one of two available exceptions applies. The first exception, a scope exception, allows Federal Reserve Bank stock, Federal Home Loan Bank stock and exchange memberships to remain accounted for at cost, less impairment. The second practicability exception is an election available for equity investments that do not have readily determinable fair values. For certain investments where the Company has chosen the practicability exception, such investments are accounted for in other assets on the balance sheet at cost adjusted for impairment, if any, plus or minus observable price changes in orderly transactions for an identical or similar investment of the same issuer with any such changes reflected in investment and other income. Equity securities with readily determinable fair values are classified in trading assets with changes in fair value reflected in foreign exchange and other trading revenue.
Loans
Loans are reported at amortized cost, net of any unearned income and deferred fees and costs. Certain loan origination and upfront commitment fees, as well as certain direct loan origination and commitment costs, are deferred and amortized as a yield adjustment over the lives of the related loans. Loans held for sale are carried at the lower of cost or fair value.
Troubled debt restructurings/loan modifications
A modified loan is considered a troubled debt restructuring (“TDR”) if the debtor is experiencing financial difficulties and the creditor grants a concession to the debtor that would not otherwise be considered. A TDR may include a transfer of real estate or other assets from the debtor to the creditor, or a modification of the term of the loan. Credit losses related to TDRs are accounted for under an individual evaluation methodology (see “Allowance for credit losses” below). Credit losses for anticipated TDRs are accounted for similarly to TDRs and are identified when there is a reasonable expectation that a TDR will be executed with the borrower and when we expect the modification to
affect the timing or amount of payments and/or the payment term.
Due to the coronavirus pandemic, there have been two forms of relief provided for classifying loans as TDRs: The Coronavirus Aid, Relief, and Economic Security Act (the “CARES Act”) and the Interagency Guidance (as defined below). Financial institutions may account for eligible loan modifications either under the CARES Act or the Interagency Guidance. The Company has elected to apply both the CARES Act and the Interagency Guidance, as applicable, in providing borrowers with loan modification relief in response to the coronavirus pandemic.
The CARES Act, which became law on March 27, 2020, provides that financial institutions may, subject to certain conditions, elect to temporarily suspend the U.S. GAAP requirements with respect to loan modifications related to the coronavirus pandemic that were current as of Dec. 31, 2019 and that would otherwise be identified and treated as TDRs. On Dec. 27, 2020, the Consolidated Appropriations Act, 2021 was signed into law and extends the period established by the CARES Act under which consideration of TDR identification and accounting triggered by effects of the coronavirus pandemic are suspended. That period is extended one year to the earlier of Jan. 1, 2022, or 60 days after the date on which the national emergency terminates.
Various banking regulators issued guidance in the April 7, 2020 “Interagency Statement on Loan Modifications and Reporting for Financial Institutions Working with Customers Affected by the Coronavirus (revised)” (“Interagency Guidance”) on loan modification treatment pursuant to which financial institutions can apply the U.S. GAAP requirements for loan modifications. In accordance with this guidance, a loan modification is not considered a TDR if the modification is related to the coronavirus pandemic, the borrower had been current when the modification program was implemented, and the modification includes payment deferrals for not more than six months.
Nonperforming assets
Commercial loans are placed on nonaccrual status when principal or interest is past due 90 days or more, or when there is reasonable doubt that interest or principal will be collected.
Notes to Consolidated Financial Statements (continued)
130 BNY Mellon
When a first or second lien residential mortgage loan reaches 90 days delinquent, it is subject to an individual evaluation of credit loss and placed on nonaccrual status.
When a loan is placed on nonaccrual status, previously accrued and uncollected interest is reversed against current period interest revenue. Interest receipts on nonaccrual loans are recognized as interest revenue or are applied to principal when we believe the ultimate collectability of principal is in doubt. Nonaccrual loans generally are restored to an accrual basis when principal and interest become current and remain current for a specified period.
“Allowance for credit losses” below provides additional information regarding the individual evaluation of credit losses for nonperforming loans.
Allowance for credit losses
The accounting policy for estimating credit losses related to financial assets measured at amortized cost, including loans and lending-related commitments, changed beginning in the first quarter of 2020 as a result of the adoption of ASU 2016-13, Financial Instruments – Credit Losses: Measurement of Credit Losses on Financial Instruments. This ASU also included targeted amendments with respect to credit losses for available-for-sale debt securities. The accounting policy for determining the allowances has been identified as a “critical accounting estimate” as it requires us to make numerous complex and subjective estimates and assumptions relating to amounts which are judgmental and inherently uncertain.
Credit quality is monitored by management and is reflected within the allowance for credit losses. The allowance represents management’s estimate of expected credit losses over the expected contractual life of the financial instruments as of the balance sheet date. The allowance methodology is designed to provide procedural discipline in assessing the appropriateness of the allowance.
A quantitative methodology and qualitative framework is used to estimate the allowance for credit losses. The qualitative framework is described in further detail within “Allowance for credit losses – Other” below. The quantitative component of our estimate uses models and methodologies that categorize financial assets based on product type,
collateral type, and other credit trends and risk characteristics, including relevant information about past events, current conditions and reasonable and supportable forecasts of future economic conditions that affect the collectability of the recorded amounts. The allowance may be determined using various methods, including discounted cash flow methods, loss-rate methods, probability of default methods or other methods that we determine to be appropriate. We estimate our expected credit losses using the probability of default method for the majority of our financial assets. We measure expected credit losses of financial assets on a collective (pool) basis when similar risk characteristics exist. For a financial asset that does not share risk characteristics with other assets, expected credit losses are measured based on an individual evaluation method.
In our estimate, with the exception of our small home equity line of credit portfolio, available-for-sale debt securities, and individually evaluated financial assets, we utilize a multi-scenario macroeconomic forecast which includes a weighting of three scenarios: a baseline and upside and downside scenarios and allows us to develop our estimate using a wide span of economic variables. Our baseline scenario reflects a view on likely performance of each global region and the other two scenarios are designed relative to the baseline scenario. This approach incorporates a reasonable and supportable forecast period spanning the life of the asset, and this period includes both an initial estimated economic outlook component as well as a reversion component for each economic input variable. The length of each of the two components depends on the underlying financial instrument, scenario and underlying economic input variable. In general, the initial economic outlook period for each economic input variable under each scenario ranges between several months and two years. The speed at which the scenario-specific forecasts revert to long-term historical mean is based on observed historical patterns of mean reversion at the economic variable input level that are reflected in our model parameter estimates. Certain macroeconomic variables such as unemployment or home prices take longer to revert after a contraction, though specific recovery times are scenario-specific. Reversion will usually take longer the further away the scenario-specific forecast is from the historical mean. On a quarterly basis, within a developed governance structure, we update these scenarios for current economic conditions and may adjust the scenario weighting based on our economic outlook.
Notes to Consolidated Financial Statements (continued)
BNY Mellon 131

Allowance for credit losses – Loans and lending-related commitments
The allowance for credit losses on loans is presented as a valuation allowance to loans, and the allowance for credit losses on lending-related commitments is recorded in other liabilities. The components of the allowance for credit losses on loans and lending-related commitments consist of the following three elements:
• a pooled allowance component for higher risk-rated and pass-rated commercial and institutional credits;
• a pooled allowance component for residential mortgage loans; and
• an asset-specific allowance component involving individually evaluated credits of $1 million or greater.
The first element, a pooled allowance component for higher risk-rated and pass-rated commercial and institutional credits, is based on our expected credit loss model using the probability of default method, which has been adjusted for the forecast of economic conditions. Individual credit analyses are performed on such loans before being assigned a credit rating. All borrowers are collectively evaluated based on their credit rating. The loss expected in each loan incorporates the borrower’s credit rating, facility rating and maturity. The loss given default, derived from the facility rating, incorporates a recovery expectation, and for unfunded lending exposures, an estimate of the use of the facility at default (usage given default). The borrower’s probability of default is derived from the associated credit rating. The probability of default and the loss given default are applied to the estimated facility amount at default to determine the quantitative component of the allowance. For each of the different parameters, specific credit models are developed for each segment of our portfolio, including commercial loans and lease financing, commercial real estate, financial institutions and other. Segmentation is established based on risk characteristics of the loans and how risk is monitored. We use both internal and external data in the development of these parameters. In estimating the term of the exposures and resulting effect on the measurement of expected credit loss, we consider the impact of potential prepayments as well as the effect of borrower extension options. Borrower ratings are reviewed at least annually and are periodically mapped to third-party databases, including rating
agency and default and recovery databases, to ensure ongoing consistency and validity. Higher risk-rated loans and lending-related commitments are reviewed quarterly.
The second element, a pooled allowance component for residential mortgage loans, is determined by first segregating our mortgage pools into two categories: (i) our wealth management mortgages and (ii) our legacy mortgage portfolio disclosed as other residential mortgages. We then apply models to each portfolio to predict prepayments, default rates and loss severity. We consider historical loss experience and use a loan-level, multi-period default model which further segments each portfolio by product type, including first lien fixed rate mortgages, first lien adjustable rate mortgages, second lien mortgages and interest-only mortgages. We calculate the mortgage loss up to loan contractual maturity and embed a reasonable and supportable forecast and macroeconomic variable inputs which are described above. For home equity lines of credit, probability of default and loss given default are based on external data from third-party databases due to the small size of the portfolio and limited internal data. Our legacy mortgage portfolio and home equity line of credit portfolios represent small sub-segments of our mortgage loans.
The third element, individually evaluated credits, is based on individual analysis of loans of $1 million and greater which no longer share the risk characteristics with other loans. Factors we consider in measuring the extent of expected credit loss include the payment status, collateral value, the borrower’s financial condition, guarantor support, the probability of collecting scheduled principal and interest payments when due, anticipated modifications of payment structure or term for troubled borrowers, and recoveries if they can be reasonably estimated. We measure the expected credit loss as the difference between the amortized cost basis in the loan and the present value of the expected future cash flows from the borrower which is generally discounted at the loan’s effective interest rate, or the fair value of the collateral, if the loan is collateral dependent. We generally consider nonperforming loans as well as loans that have been or are anticipated to be modified under a troubled debt restructuring for individual evaluation given the risk characteristics of such loans.
Notes to Consolidated Financial Statements (continued)
132 BNY Mellon
Allowance for credit losses – Securities – Debt
When estimating expected credit losses, we segment our available-for-sale and held-to-maturity debt securities portfolios by major asset class. This is influenced by whether the security is structured or non-structured (i.e., direct obligation), as well as the issuer type.
Debt securities are classified as available-for-sale securities when we intend to hold the securities for an indefinite period of time or when the securities may be used for tactical asset/liability management purposes and may be sold from time to time to effectively manage interest rate exposure, prepayment risk and liquidity needs. Available-for-sale securities are measured at fair value. The difference between fair value and amortized cost represents the unrealized gains or losses on assets classified as available-for-sale, and is recorded net of tax as an addition to, or deduction from, OCI, unless we determine that this difference or a portion thereof represents an expected credit loss. If we determine that a credit loss exists, the amount is recognized as an allowance for credit losses in securities – available-for-sale, with a corresponding adjustment to the provision for credit losses. We evaluate credit losses at the individual security level and do not recognize credit losses if the fair value exceeds amortized cost, and if we determine that a credit loss exists, we limit the recognition of the loss to the difference between fair value and amortized cost. In our determination of whether an expected credit loss exists, we routinely conduct periodic reviews and examine various quantitative and qualitative factors that are unique to each portfolio, including the severity of the unrealized loss position, agency rating, credit enhancement, cash flow deterioration and other factors. The measurement of an expected credit loss is then based on the best estimate of the present value of cash flows to be collected from the debt security. Generally, cash flows are discounted at the effective interest rate implicit in the debt security. Changes to the present value of cash flows due to the passage of time are recognized within the allowance for credit losses.
We estimate expected credit losses for held-to-maturity debt securities using a similar methodology as described in the first allowance element within “Allowance for credit losses – Loans and lending-related commitments” above. The allowance for credit losses on held-to-maturity debt securities is
recorded in securities – held-to-maturity. The components of the credit loss calculation for each major portfolio or asset class include a probability of default and loss given default and their values depend on the forecast behavior of variables in the macroeconomic environment. For structured debt securities, we estimated expected credit losses at the individual security level and use a cash flow model to project principal losses. Generally, cash flows are discounted at the effective interest rate implicit in the debt security. The difference is reflected in the allowance for credit losses, and changes to the present value of cash flows due to the passage of time are recognized within the allowance for credit losses.
We currently do not require an estimate of expected credit losses to be measured and recorded for U.S. Treasury securities, agency debt securities, and other debt securities that meet certain conditions that are based on a combination of factors such as guarantees, credit ratings and other credit quality factors. These assets are monitored within our established governance structure on a recurring basis to determine if any changes are warranted.
Allowance for credit losses – Other financial instruments
We also estimate expected credit losses associated with margin loans, reverse repurchase agreements, security lending indemnifications, and deposits with third-party financial institutions using a similar methodology as described in the first allowance element within “Allowance for credit losses – Loans and lending-related commitments” above. The allowance for credit losses on reverse repurchase agreements is recorded in federal funds sold and securities purchased under resale agreements; the allowance for credit losses on securities lending indemnifications is recorded in other liabilities and the allowance for credit losses on deposits with third-party financial institutions is recorded in cash and due from banks or interest-bearing deposits with banks. Our reverse repurchase agreements are short term and subject to continuous over-collateralization by our counterparties and timely collateral replenishment, when necessary. As a result, we estimate the expected credit loss related to the uncollateralized portion of the asset at the balance sheet date, if any, and when there is a reasonable expectation that the counterparty will not replenish the collateral in compliance with the terms of the repurchase agreement. This method is also applied to margin
Notes to Consolidated Financial Statements (continued)
BNY Mellon 133
lending arrangements and securities lending indemnifications.
Allowance for credit losses – Other
We do not apply our credit loss measurement methodologies to accrued interest receivable balances related to our loan, debt securities and deposits with third-party financial institution assets given our nonaccrual policy that requires charge-off of interest receivable when deemed uncollectible. Accrued interest receivable related to these instruments is presented in total with other interest-bearing instruments in the consolidated balance sheet. Accrued interest receivable related to each major loan class is disclosed within our credit quality disclosure in Note 5.
Our policy for credit losses related to purchased financial assets requires an evaluation to be performed prior to the effective purchase date to determine if more than an insignificant decline in credit quality has occurred during the period between the origination and purchase date, or, in the case of debt securities, the period between the issuance and purchase date. If we purchase a financial asset with more than insignificant deterioration in credit quality, the measurement of expected credit loss is performed using the methodologies described above, and the credit loss is recorded as an allowance for credit losses on the purchase date. Subsequent to purchase, changes (favorable and unfavorable) in expected cash flows are recognized immediately in net income by adjusting the allowance. We evaluate various factors in the determination of whether a more than an insignificant decline in credit quality has occurred and these factors vary depending upon the type of asset purchased. Such factors include changes in risk rating and/or agency rating, collateral deterioration, payment status, purchase price, credit spreads and other factors. We did not purchase any such assets in 2020 and did not own such assets as of Dec. 31, 2020.
We apply a separate credit loss methodology to accounts receivables to estimate the expected credit losses associated with these short-term receivables which historically have not resulted in significant credit losses. The allowance for credit losses on accounts receivables is reflected in other assets.
The qualitative component of our estimate for the allowance for credit losses is intended to capture expected losses that may not have been fully captured
in the quantitative component. Through an established governance structure, management determines the qualitative allowance each period based on an evaluation of various internal and environmental factors which include: scenario weighting and sensitivity risk, credit concentration risk, economic conditions and other considerations. We may also make adjustments for idiosyncratic risks. Once determined in the aggregate, our qualitative allowance is then allocated to each of our financial instrument portfolios except for debt securities and those instruments carried in other assets based on the respective instruments’ quantitative allowance balances. The allocation of this additional allowance for credit losses is inherently judgmental, and the entire allowance for credit losses is available to absorb credit losses regardless of the nature of the loss.
Premises and equipment
Premises and equipment are carried at cost less accumulated depreciation and amortization. Depreciation and amortization is computed using the straight-line method over the estimated useful life of the owned asset and, for leasehold improvements, over the lesser of the remaining term of the leased facility or the estimated economic life of the improvement. For owned and capitalized assets, estimated useful lives range from two to 40 years. Maintenance and repairs are charged to expense as incurred, while major improvements are capitalized and amortized to operating expense over their identified useful lives.
Leasing
We determine if an arrangement is a lease at inception. Right-of-use (“ROU”) assets represent our right to use an underlying asset for the lease term and lease liabilities represent our obligation to make lease payments. The ROU assets and lease liabilities are recognized based on the present value of the future minimum lease payments over the lease term at commencement date or at lease modification date for certain lease modifications. For all leases, we use a discount rate that represents a collateralized incremental borrowing rate based on similar terms and information available at lease commencement date or at the modification date for certain lease modifications in determining the present value of lease payments. In addition to the lease payments, the determination of an ROU asset may also include
Notes to Consolidated Financial Statements (continued)
134 BNY Mellon
certain adjustments related to lease incentives and initial direct costs incurred. Options to extend or terminate a lease are included in the determination of the ROU asset and lease liability only when it is reasonably certain that we will exercise that option.
Lease expense for operating leases is recognized on a straight-line basis over the lease term, while the lease expense for finance leases is recognized using the effective interest method. ROU assets are reviewed for impairment when events or circumstances indicate that the carrying amount may not be recoverable. For operating leases, if deemed impaired, the ROU asset is written down and the remaining balance is subsequently amortized on a straight-line basis which results in lease expense recognition that is similar to finance leases.
For all leases, we have elected to account for the contractual lease and non-lease components as a single lease component and include them in the calculation of the lease liability. The non-lease variable components, such as maintenance expense and other variable costs, including non-index or rate escalations, have been excluded from the calculation and disclosed separately. Additionally, for certain equipment leases, we apply a portfolio approach to account for the operating lease ROU assets and liabilities.
For subleasing activities, the rental income is reported as part of net occupancy expense, as this activity is not a significant business activity and is part of the Company’s customary business practice.
For direct finance leases, unearned revenue is accreted over the lives of the leases in decreasing amounts to provide a constant rate of return on the net investment in the leases. We have leveraged lease transactions that were entered into prior to Dec. 31, 2018. These leases are grandfathered under ASC 842, Leases, which became effective Jan. 1, 2019, and will continue to be accounted for under the prior guidance unless the leases are subsequently modified. Revenue on leveraged leases is recognized on a basis to achieve a constant yield on the outstanding investment in the lease, net of the related deferred tax liability, in the years in which the net investment is positive. Gains and losses on residual values of leased equipment sold are included in investment and other income. Impairment of leveraged lease residual values that is deemed other-than-temporary is reflected in net interest revenue. Considering the
nature of these leases and the number of significant assumptions, there is risk associated with the income recognition on these leases should any of the assumptions change materially in future periods.
Software
We capitalize costs relating to acquired software and internal-use software development projects that provide new or significantly improved functionality. We capitalize projects that are expected to result in longer-term operational benefits, such as replacement systems or new applications that result in significantly increased operational efficiencies or functionality. All other costs incurred in connection with an internal-use software project are expensed as incurred. Capitalized software is recorded in other assets on the balance sheet. We record amortization of capitalized software in software and equipment expense on the income statement.
Identified intangible assets and goodwill
Identified intangible assets with estimable lives are amortized in a pattern consistent with the assets’ identifiable cash flows or using a straight-line method over their remaining estimated benefit periods if the pattern of cash flows is not estimable. Intangible assets with estimable lives are reviewed for possible impairment when events or changed circumstances may affect the underlying basis of the asset. Goodwill and intangibles with indefinite lives are not amortized, but are assessed annually for impairment, or more often if events and circumstances indicate it is more likely than not they may be impaired and to determine if the lives are no longer indefinite and should be amortized. The amount of goodwill impairment, if any, is determined by the excess of the carrying value of the reporting unit over its fair value. The accounting policy for valuing and impairment testing of identified intangible assets and goodwill has been identified as a “critical accounting estimate” as it requires us to make numerous complex and subjective estimates. See Note 7 for additional disclosures related to goodwill and intangible assets.
Investments in qualified affordable housing projects
Investments in qualified affordable housing projects through a limited liability entity are accounted for utilizing the proportional amortization method. Under the proportional amortization method, the initial cost of the investment is amortized to the
Notes to Consolidated Financial Statements (continued)
BNY Mellon 135
provision for income taxes in proportion to the tax credits and other tax benefits received. The net investment performance, including tax credits and other benefits received, is recognized in the income statement as a component of the provision for income taxes. Additionally, the value of the commitments to fund qualified affordable housing projects is included in other assets on the balance sheet and a liability is recorded for the unfunded portion.
Seed capital
Seed capital investments are generally classified as other assets and carried at fair value unless we are required to consolidate the investee due to having a controlling financial interest. Unrealized gains and losses on seed capital investments are recorded in investment and other income. Certain risk retention investments in our collateralized loan obligations (“CLOs”) are classified as available-for-sale securities.
Noncontrolling interests
Noncontrolling interests represent the portion of consolidated entities that are owned by parties other than BNY Mellon. Noncontrolling interests included in permanent equity are adjusted for the income or loss attributable to the noncontrolling interest holders and any distributions to those shareholders. Redeemable noncontrolling interests are reported as temporary equity and represent the redemption value resulting from equity-classified share-based payment arrangements that are currently redeemable or are expected to become redeemable. We recognize changes in the redemption value of the redeemable noncontrolling interests as they occur and adjust the carrying value to be equal to the redemption value.
Fee revenue
Investment Services and Investment and Wealth Management revenue is based on terms specified in a contract with a customer and are shown net of fee waivers and excludes any amounts collected on behalf of third parties. Revenue is recognized when, or as, a performance obligation is satisfied by transferring control of a good or service to a customer. A performance obligation may be satisfied over time or at a point in time. Revenue from a performance obligation satisfied over time is recognized by measuring our progress in satisfying the performance obligation in a manner that reflects
the transfer of goods and services to the customer. Revenue from a performance obligation satisfied at a point in time is recognized at the point in time the customer obtains control of the promised good or service. The amount of revenue recognized reflects the consideration we expect to be entitled to in exchange for the promised goods and services. Taxes assessed by a governmental authority, that are both imposed on, and concurrent with, a specific revenue-producing transaction, are collected from a customer and are excluded from revenue.
Performance fees are recognized in the period in which the performance fees are earned and become determinable. Performance fees are constrained until all uncertainties are resolved and reversal of previously recorded amounts is not probable. Performance fees are generally calculated as a percentage of the applicable portfolio’s performance in excess of a benchmark index or a peer group’s performance. When a portfolio underperforms its benchmark or fails to generate positive performance, subsequent years’ performance must generally exceed this shortfall prior to fees being earned. Amounts billable, which are subject to a clawback if future performance thresholds in current or future years are not met, are not recognized since the fees are potentially uncollectible. These fees are recognized when it is determined that they will be collected. When a multi-year performance contract provides that fees earned are billed ratably over the performance period, only the portion of the fees earned that are non-refundable are recognized.
Additionally, we recognize revenue from non-refundable, implementation fees under outsourcing contracts using a straight-line method, commencing in the period the ongoing services are performed through the expected term of the contractual relationship. Incremental direct set-up costs of implementation, up to the related customer margin or minimum fee revenue amount, are deferred and amortized over the same period that the related implementation fees are recognized. If a client terminates an outsourcing contract prematurely, the unamortized deferred incremental direct set-up costs and the unamortized deferred implementation fees related to that contract are recognized in the period the contract is terminated.
We record foreign exchange and other trading revenue, financing-related fees and other revenue when the services are provided and earned based on
Notes to Consolidated Financial Statements (continued)
136 BNY Mellon

contractual terms, when amounts are determined and collectability is reasonably assured.
Net interest revenue
Revenue on interest-earning assets and expense on interest-bearing liabilities are recognized based on the effective yield of the related financial instrument. The amortization of premiums and accretion of discounts are included in interest revenue and are adjusted for prepayments when they occur, such that, the effective yield remains constant throughout the contractual life of the security. Negative interest incurred on assets or charged on liabilities is presented as contra interest revenue and contra interest expense, respectively.
Pension
The measurement date for BNY Mellon’s pension plans is December 31. Plan assets are determined based on fair value generally representing observable market prices. The projected benefit obligation is determined based on the present value of projected benefit distributions at an assumed discount rate. The discount rate utilized is based on the yield curves of high-quality corporate bonds available in the marketplace. The net periodic pension expense or credit includes service costs (if applicable), interest costs based on an assumed discount rate, an expected return on plan assets based on an actuarially derived market-related value, amortization of prior service cost and amortization of prior years’ actuarial gains and losses.
Actuarial gains and losses include gains or losses related to changes in the amount of the projected benefit obligation or plan assets resulting from demographic or investment experience different than assumed, changes in the discount rate or other assumptions. To the extent an actuarial gain or loss exceeds 10% of the greater of the projected benefit obligation or the market-related value of plan assets, the excess is generally recognized over the future service periods of active employees. Benefit accruals under the U.S. pension plans and the largest foreign pension plan in the UK are frozen. Future unrecognized actuarial gains and losses for these frozen plans that exceed a threshold amount are amortized over the average future life expectancy of plan participants with a maximum of 15 years.
Our expected long-term rate of return on plan assets is based on anticipated returns for each applicable asset class. Anticipated returns are weighted for the expected allocation for each asset class and are based on forecasts for prospective returns in the equity and fixed-income markets, which should track the long-term historical returns for these markets. We also consider the growth outlook for U.S. and global economies, as well as current and prospective interest rates.
The market-related value utilized to determine the expected return on plan assets is based on the fair value of plan assets adjusted for the difference between expected returns and actual performance of plan assets. The difference between actual experience and expected returns on plan assets is included as an adjustment in the market-related value over a five-year period.
See Note 18 for additional disclosures related to pensions.
Stock-based compensation
Compensation expense relating to share-based payments is recognized in staff expense on the income statement, on a straight-line basis, over the applicable vesting period.
Certain stock compensation grants vest when the employee retires. New grants with this feature are expensed by the first date the employee is eligible to retire. We estimate forfeitures when recording compensation cost related to share-based payment awards.
Severance
BNY Mellon provides separation benefits for U.S.-based employees through The Bank of New York Mellon Corporation Supplemental Unemployment Benefit Plan. These benefits are provided to eligible employees separated from their jobs for business reasons not related to individual performance. Basic separation benefits are generally based on the employee’s years of continuous benefited service. Severance for employees based outside of the U.S. is determined in accordance with local agreements and legal requirements. Severance expense is recorded when management commits to an action that will result in separation and the amount of the liability can be reasonably estimated.
Notes to Consolidated Financial Statements (continued)
BNY Mellon 137
Income taxes
We record current tax liabilities or assets through charges or credits to the current tax provision for the estimated taxes payable or refundable for the current year. Deferred tax assets and liabilities are recorded for future tax consequences attributable to differences between the financial statement carrying amounts of assets and liabilities and their respective tax bases. Deferred tax assets and liabilities are measured using enacted tax rates expected to apply to taxable income in the years in which those temporary differences are expected to be recovered or settled. A deferred tax valuation allowance is established if it is more likely than not that all or a portion of the deferred tax assets will not be realized. A tax position that fails to meet a more-likely-than-not recognition threshold will result in either reduction of current or deferred tax assets, and/or recording of current or deferred tax liabilities. Interest and penalties related to income taxes are recorded as income tax expense.
Derivative financial instruments
Derivatives are recorded on the balance sheet at fair value and include futures, forwards, interest rate swaps, foreign currency swaps and options and similar products. Derivatives in an unrealized gain position are recognized as assets while derivatives in unrealized loss position are recognized as liabilities. Derivatives are reported net by counterparty and after consideration of cash collateral, to the extent subject to legally enforceable netting agreements. Derivatives designated and effective in qualifying hedging relationships are classified in other assets or other liabilities on the balance sheet. All other derivatives are classified within trading assets or trading liabilities on the balance sheet. Gains and losses on trading derivatives are generally included in foreign exchange and other trading revenue.
We enter into various derivative financial instruments for non-trading purposes primarily as part of our asset/liability management process. These non-trading derivatives are designated as one of three types of hedge activities: fair value, cash flow or net investment hedges. Gains and losses on derivatives associated with fair value hedges are recorded in income as well as any change in the value of the related hedged item associated with the designated risks being hedged. Gains and losses on cash flow hedges are recorded in OCI, until reclassified into earnings in the same period the hedged item impacts
earnings. Foreign currency transaction gains and losses related to a hedged net investment in a foreign operation, net of their tax effect, are recorded with cumulative foreign currency translation adjustments within OCI.
To qualify for hedge accounting, each hedge relationship is required to be highly effective at reducing the risk associated with the exposure being hedged, both prospectively and retrospectively. We formally document all relationships, including hedging instruments and hedged items, as well as our risk management objectives and strategy for undertaking each hedging transaction. At inception, the potential cause of ineffectiveness related to each of our hedges is assessed to determine if we can expect the hedge to be highly effective over the life of the transaction. At hedge inception, we document the methodology to be utilized for evaluating effectiveness on an ongoing basis, and we monitor ongoing hedge effectiveness at least quarterly.
For qualifying fair value hedges, changes in the fair value of the derivative, and changes in the value of the hedged item associated with the designated risks being hedged, are recognized in earnings. Certain amounts excluded from the assessment of effectiveness are recorded in OCI and recognized in earnings through an amortization approach over the life of the derivative. We discontinue hedge accounting prospectively when we determine that the hedge is no longer effective or the derivative expires, is sold, or management discontinues the derivative’s hedge designation. Subsequent gains and losses on these derivatives are included in foreign exchange and other trading revenue. For discontinued fair value hedges, the accumulated gain or loss on the hedged item is amortized on a yield basis over the remaining life of the hedged item.
For qualifying cash flow hedges, changes in the fair value of the derivative are recorded in OCI, until reclassified into earnings in the same period the hedged item impacts earnings. If the hedge relationship is terminated, then the change in value will be reclassified from OCI to earnings when the cash flows that were previously hedged affect earnings. If cash flow hedge accounting is discontinued as a result of a forecasted transaction no longer being probable to occur, then the amount reported in OCI is immediately reclassified to current earnings.
Notes to Consolidated Financial Statements (continued)
138 BNY Mellon
Derivative amounts affecting earnings are recognized in the same income statement line as the hedged item affects earnings, principally interest revenue, interest expense, other revenue and staff expense.
Foreign currency transaction gains and losses related to qualifying hedges of net investments in a foreign operation are recorded with cumulative foreign currency translation adjustments within OCI net of their tax effect. The Company evaluates effectiveness of its foreign currency derivatives designated as hedges of its net investments utilizing the forward rate method.
The determination of fair value of derivative financial instruments has been identified as a “critical accounting estimate.” See Note 23 for additional disclosures related to derivative financial instruments.
Earnings per common share
Earnings per common share is calculated using the two-class method under which earnings are allocated to common shareholders and holders of participating securities. Unvested stock-based compensation awards that contain non-forfeitable rights to dividends or dividend equivalents are considered participating securities under the two-class method.
Basic earnings per share is calculated by dividing net income allocated to common shareholders of BNY Mellon by the average number of common shares outstanding and vested stock-based compensation awards where recipients have satisfied either the explicit vesting terms or retirement-eligibility requirements.
Diluted earnings per common share is computed under the more dilutive of either the treasury stock method or the two-class method. We increase the average number of shares of common stock outstanding by the assumed number of shares of common stock that would be issued assuming the exercise of stock options and the issuance of shares related to stock-based compensation awards using the treasury stock method, if dilutive. Diluted earnings per share is calculated by dividing net income allocated to common shareholders of BNY Mellon by the adjusted average number of common shares outstanding.
Statement of cash flows
We have defined cash as cash and due from banks. Cash flows from hedging activities are classified in the same category as the items hedged. Distributions received from equity method investees are classified as cash inflows from operating activities on the statement of cash flows. Excess returns on investments of equity method investments are classified as cash flows from investing activities on the statement of cash flows.
Note 2–Accounting changes and new accounting guidance
The following accounting guidance was adopted in 2020.
ASU 2016-13, Financial Instruments – Credit Losses: Measurement of Credit Losses on Financial Instruments
In June 2016, the Financial Accounting Standards Board (“FASB”) issued an ASU, Financial Instruments – Credit Losses: Measurement of Credit Losses on Financial Instruments. This ASU introduces a new current expected credit losses model, which applies to financial assets subject to credit losses and measured at amortized cost, including held-to-maturity securities and certain off-balance sheet credit exposures. The guidance also changes current practice for the impairment model for available-for-sale debt securities by requiring the use of an allowance to record estimated credit losses and subsequent recoveries. The standard requires a cumulative effect of initial application to be recognized in retained earnings at the date of initial application.
In conjunction with adopting the new standard, we developed expected credit loss models and approaches that include consideration of multiple forecast scenarios and other methodologies. On Jan. 1, 2020, we adopted this new accounting guidance on a modified retrospective basis and recognized a $45 million after-tax increase in retained earnings, primarily attributable to a reduction to the allowance for credit losses for our commercial lending portfolios. The comparative financial information for prior periods has not been restated. See the Consolidated Balance Sheet and Notes 4 and 5 for the disclosures required by this ASU.
Notes to Consolidated Financial Statements (continued)
BNY Mellon 139
The table below presents the reconciliation of the allowance for credit losses (pre-tax).
Allowance for credit losses(in millions)Allowance for credit losses – Dec. 31, 2019 $ 216 Impact of adopting ASU 2016-13:
Securities 7 Loans (a) (69) Other 3 Total impact of adoption of ASU 2016-13 (59)
Reclassification of credit-related reserves on accounts receivable 4
Allowance for credit losses – Jan. 1, 2020 $ 161 (a) Includes $48 million related to loans and $21 million for
lending-related commitments.
ASU 2020-04, Reference Rate Reform: Facilitation of the Effects of Reference Rate Reform on Financial Reporting
In March 2020, the FASB issued an ASU, Reference Rate Reform: Facilitation of the Effects of Reference Rate Reform on Financial Reporting. This ASU provides temporary optional expedients and exceptions for applying U.S. GAAP to financial contracts, hedging relationships and other transactions affected by reference rate reform. Specifically, the ASU provides for the election to account for certain contract amendments related to reference rate reform as modifications rather than extinguishments without the requirement to assess the significance of the amendments. In addition, the ASU allows for certain practical expedients and elections to preserve hedge accounting uninterrupted during the Replacement of Interbank Offered Rates (“IBORs”) transition period. This ASU also permits an entity to make a one-time election to sell and/or transfer held-to-maturity securities that are affected by reference rate reform and were classified as held-to-maturity on or before Jan. 1, 2020.
The Company has elected to prospectively apply certain of the practical expedients related to contract modifications and hedge accounting relationships effective Oct. 1, 2020. The implementation of these elections did not have a material impact on BNY Mellon as they ease the administrative burden of accounting for contracts impacted by reference rate reform.
Note 3–Acquisitions and dispositions
We sometimes structure our acquisitions with both an initial payment and later contingent payments tied to
post-closing revenue or income growth. Contingent payments totaled $9 million in 2020.
At Dec. 31, 2020, we are potentially obligated to pay additional consideration which, using reasonable assumptions, we expect to be approximately $5 million over the next year.
Transactions in 2020
In the fourth quarter of 2020, BNY Mellon entered into agreements to sell two legal entities. Both transactions are expected to close in 2021. BNY Mellon recorded a total after-tax loss of $34 million on these pending transactions.
Transaction in 2019
On Nov. 8, 2019, BNY Mellon, along with the other holders of Promontory Interfinancial Network, LLC (“PIN”), completed the sale of their interests in PIN. BNY Mellon recorded an after-tax gain of $622 million on the sale of this equity investment.
Transactions in 2018
On Jan. 2, 2018, BNY Mellon completed the sale of CenterSquare Investment Management (“CenterSquare”), one of our Investment Management investment firms, and recorded a gain on this transaction. CenterSquare had approximately $10 billion in assets under management (“AUM”) in U.S. and global real estate and infrastructure investments. In addition, goodwill of $52 million was removed from the consolidated balance sheet as a result of this sale.
On June 29, 2018, BNY Mellon completed the exchange of its majority equity interest in Amherst Capital Management LLC for a minority equity stake in Amherst Holdings LLC. Goodwill of $13 million was removed from the consolidated balance sheet and a gain was recorded as a result of this sale.
Note 4–Securities
On Jan. 1, 2020, we adopted ASU 2016-13, Financial Instruments – Credit Losses: Measurement of Credit Losses on Financial Instruments. See Note 2 for the significant accounting policy related to securities.
The following tables present the amortized cost, the gross unrealized gains and losses and the fair value of securities at Dec. 31, 2020 and Dec. 31, 2019.
Notes to Consolidated Financial Statements (continued)
140 BNY Mellon
Securities at Dec. 31, 2020 Grossunrealized Fair
valueAmortized
cost(in millions) Gains LossesAvailable-for-sale:U.S. Treasury $ 23,557 $ 1,358 $ 21 $ 24,894 Agency residential mortgage-backed securities (“RMBS”)
21,919 479 51 22,347
Sovereign debt/sovereign guaranteed 12,202 190 1 12,391
Agency commercial mortgage-backed securities (“MBS”) 8,605 625 2 9,228
Supranational 7,086 75 1 7,160 Foreign covered bonds 6,658 68 1 6,725 Collateralized loan
obligations (“CLOs”) 4,706 7 10 4,703 Foreign government
agencies 4,086 49 — 4,135 U.S. government agencies 3,680 174 1 3,853 Other asset-backed
securities (“ABS”) 3,135 32 3 3,164 Non-agency commercial
MBS 2,864 159 6 3,017 Non-agency RMBS (a) 2,178 157 9 2,326 State and political
subdivisions 2,270 39 1 2,308 Corporate bonds 1,945 50 1 1,994 Commercial paper/
certificates of deposit (“CDs”) 249 — — 249
Other debt securities 1 — — 1 Total securities
available-for-sale (b)(c) $ 105,141 $ 3,462 $ 108 $ 108,495
Held-to-maturity:Agency RMBS $ 38,355 $ 1,055 $ 14 $ 39,396 U.S. Treasury 2,938 90 — 3,028 U.S. government agencies 2,816 4 6 2,814 Agency commercial MBS 2,659 105 2 2,762 Sovereign debt/sovereign
guaranteed 1,050 42 — 1,092 Non-agency RMBS 58 3 — 61 Supranational 55 — — 55 State and political
subdivisions 15 1 — 16 Total securities held-to-maturity $ 47,946 $ 1,300 $ 22 $ 49,224 Total securities $ 153,087 $ 4,762 $ 130 $ 157,719
(a) Includes $487 million that was included in the former Grantor Trust.
(b) In 2020, we adopted new accounting guidance included in ASU 2016-13, Financial Instruments – Credit Losses: Measurement of Credit Losses on Financial Instruments. The amortized cost of available-for-sale securities is net of the allowance for credit loss of $11 million. The allowance for credit loss primarily relates to CLOs. See Note 2 for additional information.
(c) Includes gross unrealized gains of $75 million and gross unrealized losses of $44 million recorded in accumulated other comprehensive income related to securities that were transferred from available-for-sale to held-to-maturity. The unrealized gains are primarily related to agency commercial MBS and losses are primarily related to agency RMBS and will be amortized into net interest revenue over the contractual lives of the securities.
Securities at Dec. 31, 2019 GrossunrealizedAmortized
costFair
value(in millions) Gains LossesAvailable-for-sale:Agency RMBS $ 27,022 $ 164 $ 143 $ 27,043 U.S. Treasury 14,979 472 20 15,431 Sovereign debt/sovereign
guaranteed 12,548 109 11 12,646 Agency commercial MBS 9,231 203 17 9,417 Foreign covered bonds 4,189 15 7 4,197 CLOs 4,078 1 16 4,063 Supranational 3,697 18 6 3,709 Foreign government
agencies 2,638 7 2 2,643 Non-agency commercial
MBS 2,134 46 2 2,178 Other ABS 2,141 7 5 2,143 U.S. government agencies 1,890 61 2 1,949 Non-agency RMBS (a) 1,038 202 7 1,233 State and political
subdivisions 1,017 27 — 1,044 Corporate bonds 832 21 — 853 Other debt securities 1 — — 1
Total securities available-for-sale (b) $ 87,435 $ 1,353 $ 238 $ 88,550
Held-to-maturity:Agency RMBS $ 27,357 $ 292 $ 46 $ 27,603 U.S. Treasury 3,818 28 3 3,843 Agency commercial MBS 1,326 21 3 1,344 U.S. government agencies 1,023 1 2 1,022 Sovereign debt/sovereign
guaranteed 756 31 — 787 Non-agency RMBS 80 4 1 83 Foreign covered bonds 79 — — 79 Supranational 27 — — 27 State and political
subdivisions 17 — — 17 Total securities held-to-
maturity $ 34,483 $ 377 $ 55 $ 34,805 Total securities $ 121,918 $ 1,730 $ 293 $ 123,355
(a) Includes $640 million that was included in the former Grantor Trust.
(b) Includes gross unrealized gains of $32 million and gross unrealized losses of $65 million recorded in accumulated other comprehensive income related to securities that were transferred from available-for-sale to held-to-maturity. The unrealized gains and losses are primarily related to agency RMBS and will be amortized into net interest revenue over the contractual lives of the securities.
The following table presents the realized gains, losses and impairments, on a gross basis.
Net securities gains (losses)(in millions) 2020 2019 2018Realized gross gains $ 46 $ 23 $ 8 Realized gross losses (13) (39) (55) Recognized gross impairments — (2) (1)
Total net securities gains (losses) $ 33 $ (18) $ (48)
Notes to Consolidated Financial Statements (continued)
BNY Mellon 141
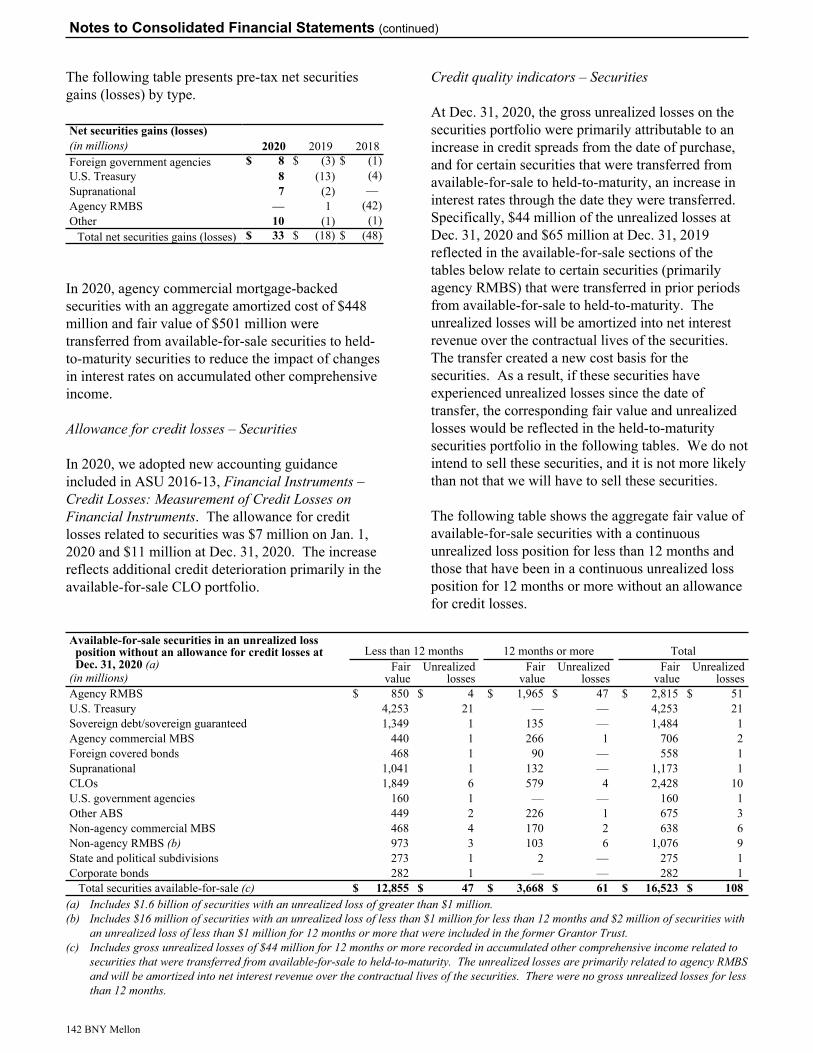
The following table presents pre-tax net securities gains (losses) by type.
Net securities gains (losses)(in millions) 2020 2019 2018Foreign government agencies $ 8 $ (3) $ (1) U.S. Treasury 8 (13) (4) Supranational 7 (2) — Agency RMBS — 1 (42) Other 10 (1) (1)
Total net securities gains (losses) $ 33 $ (18) $ (48)
In 2020, agency commercial mortgage-backed securities with an aggregate amortized cost of $448 million and fair value of $501 million were transferred from available-for-sale securities to held-to-maturity securities to reduce the impact of changes in interest rates on accumulated other comprehensive income.
Allowance for credit losses – Securities
In 2020, we adopted new accounting guidance included in ASU 2016-13, Financial Instruments – Credit Losses: Measurement of Credit Losses on Financial Instruments. The allowance for credit losses related to securities was $7 million on Jan. 1, 2020 and $11 million at Dec. 31, 2020. The increase reflects additional credit deterioration primarily in the available-for-sale CLO portfolio.
Credit quality indicators – Securities
At Dec. 31, 2020, the gross unrealized losses on the securities portfolio were primarily attributable to an increase in credit spreads from the date of purchase, and for certain securities that were transferred from available-for-sale to held-to-maturity, an increase in interest rates through the date they were transferred. Specifically, $44 million of the unrealized losses at Dec. 31, 2020 and $65 million at Dec. 31, 2019 reflected in the available-for-sale sections of the tables below relate to certain securities (primarily agency RMBS) that were transferred in prior periods from available-for-sale to held-to-maturity. The unrealized losses will be amortized into net interest revenue over the contractual lives of the securities. The transfer created a new cost basis for the securities. As a result, if these securities have experienced unrealized losses since the date of transfer, the corresponding fair value and unrealized losses would be reflected in the held-to-maturity securities portfolio in the following tables. We do not intend to sell these securities, and it is not more likely than not that we will have to sell these securities.
The following table shows the aggregate fair value of available-for-sale securities with a continuous unrealized loss position for less than 12 months and those that have been in a continuous unrealized loss position for 12 months or more without an allowance for credit losses.
Available-for-sale securities in an unrealized loss position without an allowance for credit losses at Dec. 31, 2020 (a)
Less than 12 months 12 months or more TotalFair
valueUnrealized
lossesFair
valueUnrealized
lossesFair
valueUnrealized
losses(in millions)Agency RMBS $ 850 $ 4 $ 1,965 $ 47 $ 2,815 $ 51 U.S. Treasury 4,253 21 — — 4,253 21 Sovereign debt/sovereign guaranteed 1,349 1 135 — 1,484 1 Agency commercial MBS 440 1 266 1 706 2 Foreign covered bonds 468 1 90 — 558 1 Supranational 1,041 1 132 — 1,173 1 CLOs 1,849 6 579 4 2,428 10 U.S. government agencies 160 1 — — 160 1 Other ABS 449 2 226 1 675 3 Non-agency commercial MBS 468 4 170 2 638 6 Non-agency RMBS (b) 973 3 103 6 1,076 9 State and political subdivisions 273 1 2 — 275 1 Corporate bonds 282 1 — — 282 1
Total securities available-for-sale (c) $ 12,855 $ 47 $ 3,668 $ 61 $ 16,523 $ 108 (a) Includes $1.6 billion of securities with an unrealized loss of greater than $1 million.(b) Includes $16 million of securities with an unrealized loss of less than $1 million for less than 12 months and $2 million of securities with
an unrealized loss of less than $1 million for 12 months or more that were included in the former Grantor Trust. (c) Includes gross unrealized losses of $44 million for 12 months or more recorded in accumulated other comprehensive income related to
securities that were transferred from available-for-sale to held-to-maturity. The unrealized losses are primarily related to agency RMBS and will be amortized into net interest revenue over the contractual lives of the securities. There were no gross unrealized losses for less than 12 months.
Notes to Consolidated Financial Statements (continued)
142 BNY Mellon
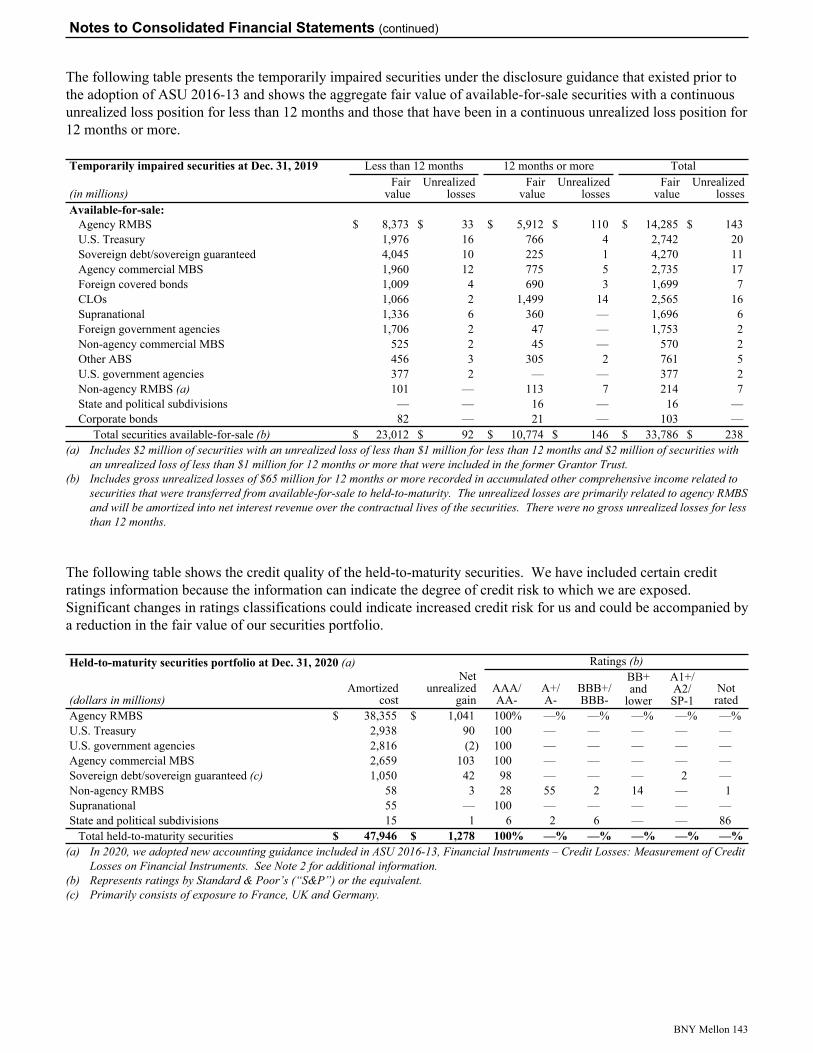
The following table presents the temporarily impaired securities under the disclosure guidance that existed prior to the adoption of ASU 2016-13 and shows the aggregate fair value of available-for-sale securities with a continuous unrealized loss position for less than 12 months and those that have been in a continuous unrealized loss position for 12 months or more.
Temporarily impaired securities at Dec. 31, 2019 Less than 12 months 12 months or more Total
(in millions)Fair
valueUnrealized
lossesFair
valueUnrealized
lossesFair
valueUnrealized
lossesAvailable-for-sale:
Agency RMBS $ 8,373 $ 33 $ 5,912 $ 110 $ 14,285 $ 143 U.S. Treasury 1,976 16 766 4 2,742 20 Sovereign debt/sovereign guaranteed 4,045 10 225 1 4,270 11 Agency commercial MBS 1,960 12 775 5 2,735 17 Foreign covered bonds 1,009 4 690 3 1,699 7 CLOs 1,066 2 1,499 14 2,565 16 Supranational 1,336 6 360 — 1,696 6 Foreign government agencies 1,706 2 47 — 1,753 2 Non-agency commercial MBS 525 2 45 — 570 2 Other ABS 456 3 305 2 761 5 U.S. government agencies 377 2 — — 377 2 Non-agency RMBS (a) 101 — 113 7 214 7 State and political subdivisions — — 16 — 16 — Corporate bonds 82 — 21 — 103 —
Total securities available-for-sale (b) $ 23,012 $ 92 $ 10,774 $ 146 $ 33,786 $ 238 (a) Includes $2 million of securities with an unrealized loss of less than $1 million for less than 12 months and $2 million of securities with
an unrealized loss of less than $1 million for 12 months or more that were included in the former Grantor Trust. (b) Includes gross unrealized losses of $65 million for 12 months or more recorded in accumulated other comprehensive income related to
securities that were transferred from available-for-sale to held-to-maturity. The unrealized losses are primarily related to agency RMBS and will be amortized into net interest revenue over the contractual lives of the securities. There were no gross unrealized losses for less than 12 months.
The following table shows the credit quality of the held-to-maturity securities. We have included certain credit ratings information because the information can indicate the degree of credit risk to which we are exposed. Significant changes in ratings classifications could indicate increased credit risk for us and could be accompanied by a reduction in the fair value of our securities portfolio.
Held-to-maturity securities portfolio at Dec. 31, 2020 (a) Ratings (b)Net
unrealized gain
BB+and
lower
A1+/A2/SP-1(dollars in millions)
Amortized cost
AAA/AA-
A+/A-
BBB+/BBB-
Notrated
Agency RMBS $ 38,355 $ 1,041 100% —% —% —% —% —% U.S. Treasury 2,938 90 100 — — — — — U.S. government agencies 2,816 (2) 100 — — — — — Agency commercial MBS 2,659 103 100 — — — — — Sovereign debt/sovereign guaranteed (c) 1,050 42 98 — — — 2 — Non-agency RMBS 58 3 28 55 2 14 — 1 Supranational 55 — 100 — — — — — State and political subdivisions 15 1 6 2 6 — — 86
Total held-to-maturity securities $ 47,946 $ 1,278 100% —% —% —% —% —% (a) In 2020, we adopted new accounting guidance included in ASU 2016-13, Financial Instruments – Credit Losses: Measurement of Credit
Losses on Financial Instruments. See Note 2 for additional information.(b) Represents ratings by Standard & Poor’s (“S&P”) or the equivalent.(c) Primarily consists of exposure to France, UK and Germany.
Notes to Consolidated Financial Statements (continued)
BNY Mellon 143
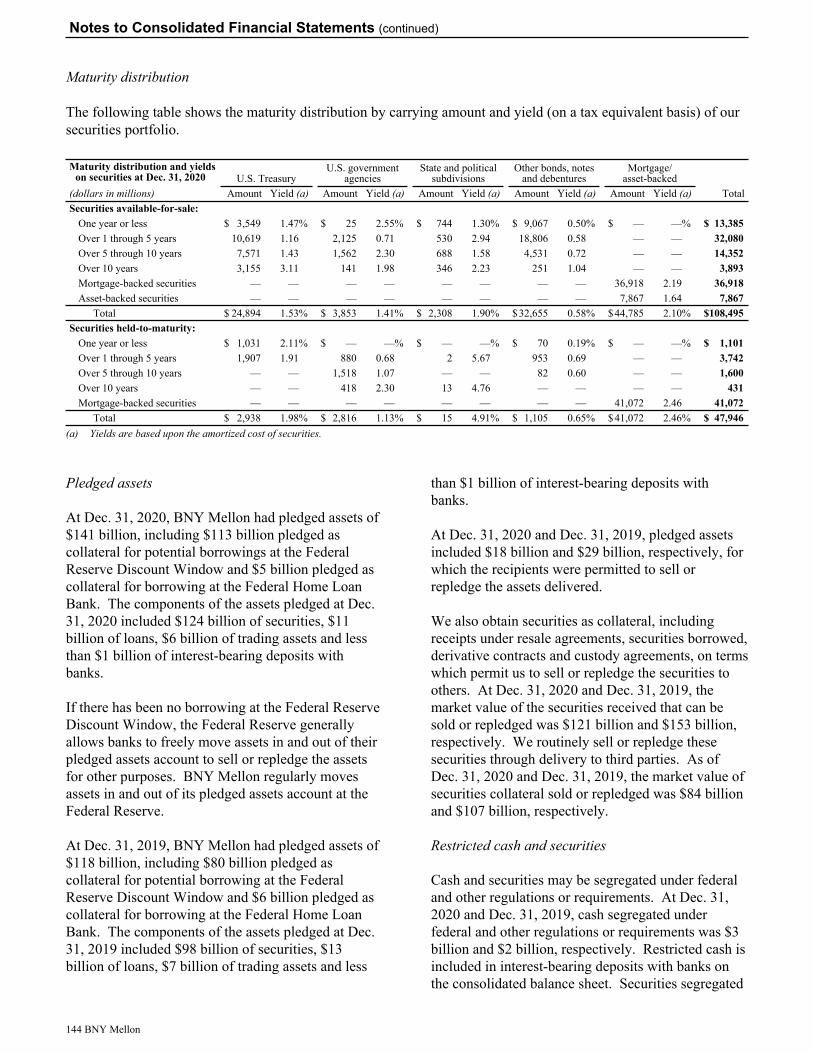
Maturity distribution
The following table shows the maturity distribution by carrying amount and yield (on a tax equivalent basis) of our securities portfolio.
Maturity distribution and yields on securities at Dec. 31, 2020 U.S. Treasury
U.S. governmentagencies
State and politicalsubdivisions
Other bonds, notes and debentures
Mortgage/asset-backed
(dollars in millions) Amount Yield (a) Amount Yield (a) Amount Yield (a) Amount Yield (a) Amount Yield (a) TotalSecurities available-for-sale:
One year or less $ 3,549 1.47% $ 25 2.55% $ 744 1.30% $ 9,067 0.50% $ — —% $ 13,385 Over 1 through 5 years 10,619 1.16 2,125 0.71 530 2.94 18,806 0.58 — — 32,080 Over 5 through 10 years 7,571 1.43 1,562 2.30 688 1.58 4,531 0.72 — — 14,352 Over 10 years 3,155 3.11 141 1.98 346 2.23 251 1.04 — — 3,893 Mortgage-backed securities — — — — — — — — 36,918 2.19 36,918 Asset-backed securities — — — — — — — — 7,867 1.64 7,867
Total $ 24,894 1.53% $ 3,853 1.41% $ 2,308 1.90% $ 32,655 0.58% $ 44,785 2.10% $ 108,495 Securities held-to-maturity:
One year or less $ 1,031 2.11% $ — —% $ — —% $ 70 0.19% $ — —% $ 1,101 Over 1 through 5 years 1,907 1.91 880 0.68 2 5.67 953 0.69 — — 3,742 Over 5 through 10 years — — 1,518 1.07 — — 82 0.60 — — 1,600 Over 10 years — — 418 2.30 13 4.76 — — — — 431 Mortgage-backed securities — — — — — — — — 41,072 2.46 41,072
Total $ 2,938 1.98% $ 2,816 1.13% $ 15 4.91% $ 1,105 0.65% $ 41,072 2.46% $ 47,946 (a) Yields are based upon the amortized cost of securities.
Pledged assets
At Dec. 31, 2020, BNY Mellon had pledged assets of $141 billion, including $113 billion pledged as collateral for potential borrowings at the Federal Reserve Discount Window and $5 billion pledged as collateral for borrowing at the Federal Home Loan Bank. The components of the assets pledged at Dec. 31, 2020 included $124 billion of securities, $11 billion of loans, $6 billion of trading assets and less than $1 billion of interest-bearing deposits with banks.
If there has been no borrowing at the Federal Reserve Discount Window, the Federal Reserve generally allows banks to freely move assets in and out of their pledged assets account to sell or repledge the assets for other purposes. BNY Mellon regularly moves assets in and out of its pledged assets account at the Federal Reserve.
At Dec. 31, 2019, BNY Mellon had pledged assets of $118 billion, including $80 billion pledged as collateral for potential borrowing at the Federal Reserve Discount Window and $6 billion pledged as collateral for borrowing at the Federal Home Loan Bank. The components of the assets pledged at Dec. 31, 2019 included $98 billion of securities, $13 billion of loans, $7 billion of trading assets and less
than $1 billion of interest-bearing deposits with banks.
At Dec. 31, 2020 and Dec. 31, 2019, pledged assets included $18 billion and $29 billion, respectively, for which the recipients were permitted to sell or repledge the assets delivered.
We also obtain securities as collateral, including receipts under resale agreements, securities borrowed, derivative contracts and custody agreements, on terms which permit us to sell or repledge the securities to others. At Dec. 31, 2020 and Dec. 31, 2019, the market value of the securities received that can be sold or repledged was $121 billion and $153 billion, respectively. We routinely sell or repledge these securities through delivery to third parties. As of Dec. 31, 2020 and Dec. 31, 2019, the market value of securities collateral sold or repledged was $84 billion and $107 billion, respectively.
Restricted cash and securities
Cash and securities may be segregated under federal and other regulations or requirements. At Dec. 31, 2020 and Dec. 31, 2019, cash segregated under federal and other regulations or requirements was $3 billion and $2 billion, respectively. Restricted cash is included in interest-bearing deposits with banks on the consolidated balance sheet. Securities segregated
Notes to Consolidated Financial Statements (continued)
144 BNY Mellon
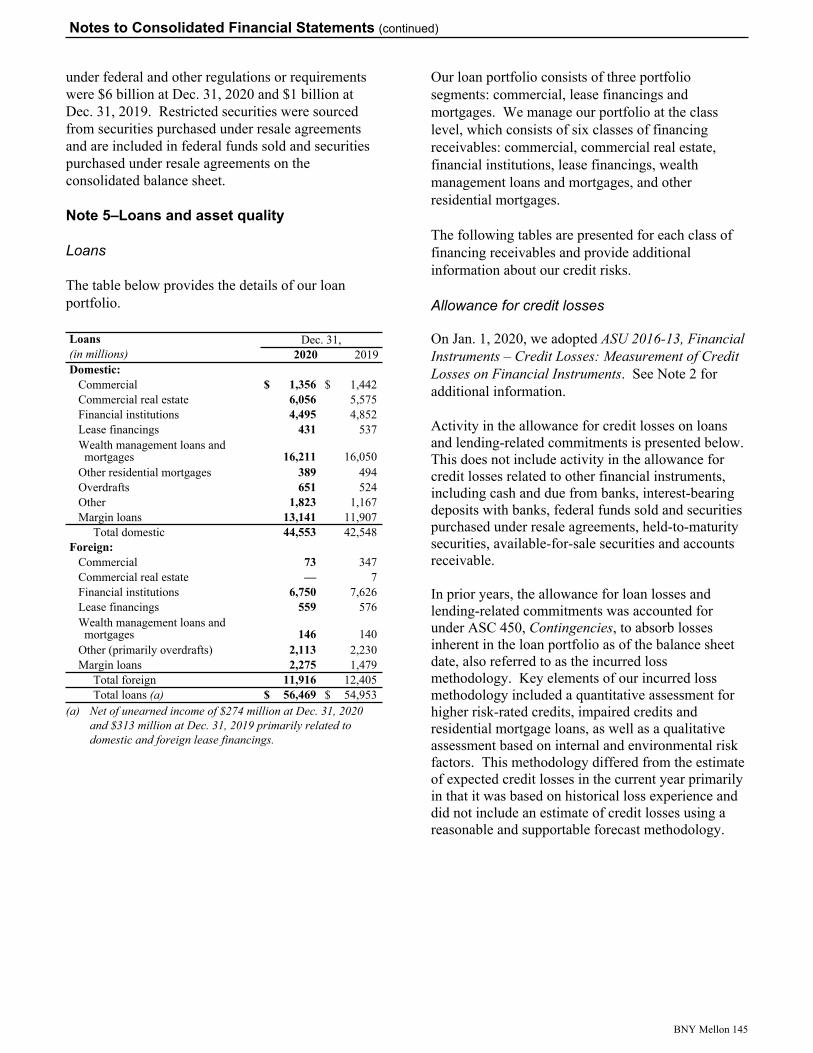
under federal and other regulations or requirements were $6 billion at Dec. 31, 2020 and $1 billion at Dec. 31, 2019. Restricted securities were sourced from securities purchased under resale agreements and are included in federal funds sold and securities purchased under resale agreements on the consolidated balance sheet.
Note 5–Loans and asset quality
Loans
The table below provides the details of our loan portfolio.
Loans Dec. 31,(in millions) 2020 2019Domestic:
Commercial $ 1,356 $ 1,442 Commercial real estate 6,056 5,575 Financial institutions 4,495 4,852 Lease financings 431 537 Wealth management loans and mortgages 16,211 16,050
Other residential mortgages 389 494 Overdrafts 651 524 Other 1,823 1,167 Margin loans 13,141 11,907
Total domestic 44,553 42,548 Foreign:
Commercial 73 347 Commercial real estate — 7 Financial institutions 6,750 7,626 Lease financings 559 576 Wealth management loans and mortgages 146 140
Other (primarily overdrafts) 2,113 2,230 Margin loans 2,275 1,479
Total foreign 11,916 12,405 Total loans (a) $ 56,469 $ 54,953
(a) Net of unearned income of $274 million at Dec. 31, 2020 and $313 million at Dec. 31, 2019 primarily related to domestic and foreign lease financings.
Our loan portfolio consists of three portfolio segments: commercial, lease financings and mortgages. We manage our portfolio at the class level, which consists of six classes of financing receivables: commercial, commercial real estate, financial institutions, lease financings, wealth management loans and mortgages, and other residential mortgages.
The following tables are presented for each class of financing receivables and provide additional information about our credit risks.
Allowance for credit losses
On Jan. 1, 2020, we adopted ASU 2016-13, Financial Instruments – Credit Losses: Measurement of Credit Losses on Financial Instruments. See Note 2 for additional information.
Activity in the allowance for credit losses on loans and lending-related commitments is presented below. This does not include activity in the allowance for credit losses related to other financial instruments, including cash and due from banks, interest-bearing deposits with banks, federal funds sold and securities purchased under resale agreements, held-to-maturity securities, available-for-sale securities and accounts receivable.
In prior years, the allowance for loan losses and lending-related commitments was accounted for under ASC 450, Contingencies, to absorb losses inherent in the loan portfolio as of the balance sheet date, also referred to as the incurred loss methodology. Key elements of our incurred loss methodology included a quantitative assessment for higher risk-rated credits, impaired credits and residential mortgage loans, as well as a qualitative assessment based on internal and environmental risk factors. This methodology differed from the estimate of expected credit losses in the current year primarily in that it was based on historical loss experience and did not include an estimate of credit losses using a reasonable and supportable forecast methodology.
Notes to Consolidated Financial Statements (continued)
BNY Mellon 145
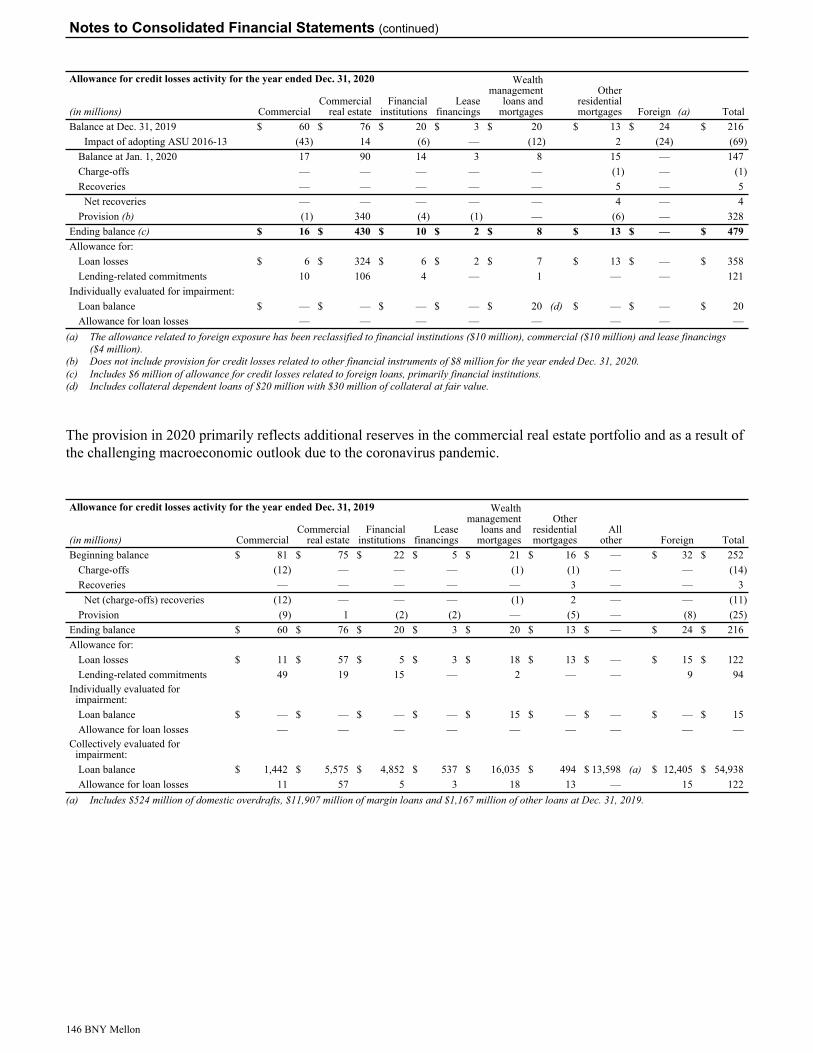
Allowance for credit losses activity for the year ended Dec. 31, 2020 Wealth management
loans and mortgages
Otherresidentialmortgages Foreign Total(in millions) Commercial
Commercialreal estate
Financialinstitutions
Leasefinancings (a)
Balance at Dec. 31, 2019 $ 60 $ 76 $ 20 $ 3 $ 20 $ 13 $ 24 $ 216 Impact of adopting ASU 2016-13 (43) 14 (6) — (12) 2 (24) (69)
Balance at Jan. 1, 2020 17 90 14 3 8 15 — 147 Charge-offs — — — — — (1) — (1) Recoveries — — — — — 5 — 5
Net recoveries — — — — — 4 — 4 Provision (b) (1) 340 (4) (1) — (6) — 328
Ending balance (c) $ 16 $ 430 $ 10 $ 2 $ 8 $ 13 $ — $ 479 Allowance for:
Loan losses $ 6 $ 324 $ 6 $ 2 $ 7 $ 13 $ — $ 358 Lending-related commitments 10 106 4 — 1 — — 121
Individually evaluated for impairment:Loan balance $ — $ — $ — $ — $ 20 (d) $ — $ — $ 20 Allowance for loan losses — — — — — — — —
(a) The allowance related to foreign exposure has been reclassified to financial institutions ($10 million), commercial ($10 million) and lease financings ($4 million).
(b) Does not include provision for credit losses related to other financial instruments of $8 million for the year ended Dec. 31, 2020.(c) Includes $6 million of allowance for credit losses related to foreign loans, primarily financial institutions.(d) Includes collateral dependent loans of $20 million with $30 million of collateral at fair value.
The provision in 2020 primarily reflects additional reserves in the commercial real estate portfolio and as a result of the challenging macroeconomic outlook due to the coronavirus pandemic.
Allowance for credit losses activity for the year ended Dec. 31, 2019 Wealth management
loans and mortgages
Otherresidentialmortgages
Allother Foreign Total(in millions) Commercial
Commercialreal estate
Financialinstitutions
Leasefinancings
Beginning balance $ 81 $ 75 $ 22 $ 5 $ 21 $ 16 $ — $ 32 $ 252 Charge-offs (12) — — — (1) (1) — — (14) Recoveries — — — — — 3 — — 3
Net (charge-offs) recoveries (12) — — — (1) 2 — — (11) Provision (9) 1 (2) (2) — (5) — (8) (25)
Ending balance $ 60 $ 76 $ 20 $ 3 $ 20 $ 13 $ — $ 24 $ 216 Allowance for:
Loan losses $ 11 $ 57 $ 5 $ 3 $ 18 $ 13 $ — $ 15 $ 122 Lending-related commitments 49 19 15 — 2 — — 9 94
Individually evaluated for impairment:Loan balance $ — $ — $ — $ — $ 15 $ — $ — $ — $ 15 Allowance for loan losses — — — — — — — — —
Collectively evaluated for impairment:Loan balance $ 1,442 $ 5,575 $ 4,852 $ 537 $ 16,035 $ 494 $ 13,598 (a) $ 12,405 $ 54,938 Allowance for loan losses 11 57 5 3 18 13 — 15 122
(a) Includes $524 million of domestic overdrafts, $11,907 million of margin loans and $1,167 million of other loans at Dec. 31, 2019.
Notes to Consolidated Financial Statements (continued)
146 BNY Mellon
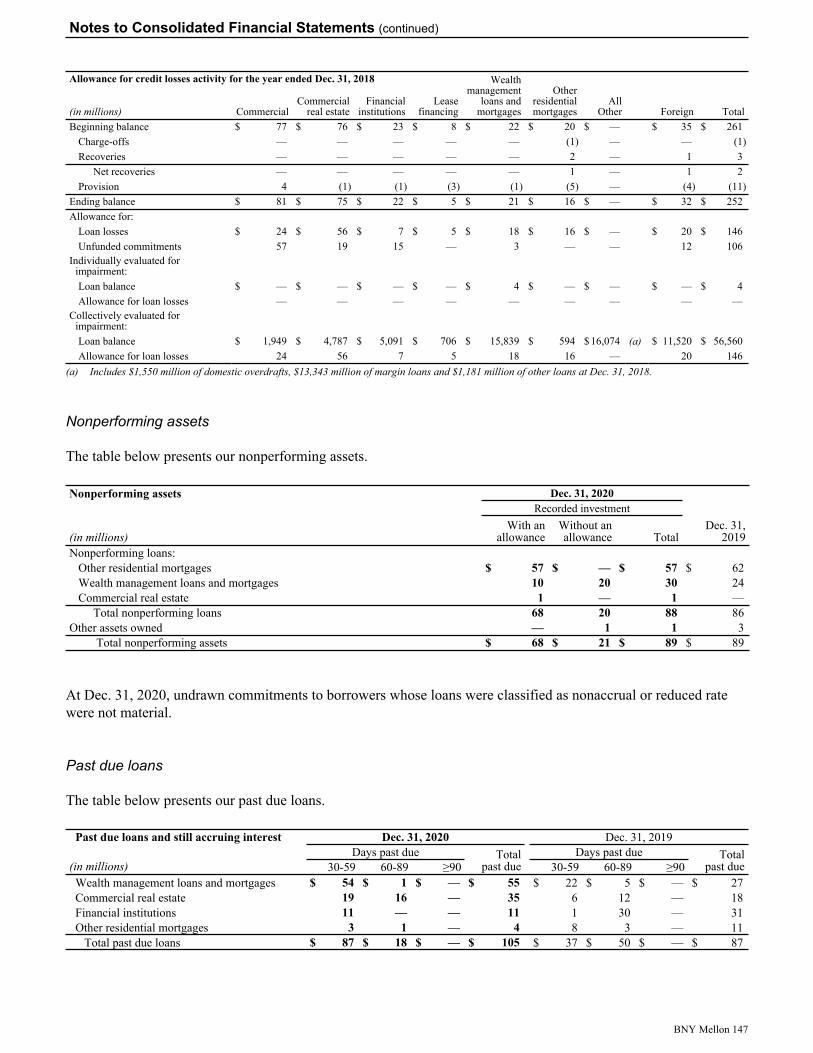
Allowance for credit losses activity for the year ended Dec. 31, 2018
Leasefinancing
Wealth management
loans and mortgages
Otherresidentialmortgages
AllOther Foreign Total(in millions) Commercial
Commercialreal estate
Financialinstitutions
Beginning balance $ 77 $ 76 $ 23 $ 8 $ 22 $ 20 $ — $ 35 $ 261 Charge-offs — — — — — (1) — — (1) Recoveries — — — — — 2 — 1 3
Net recoveries — — — — — 1 — 1 2 Provision 4 (1) (1) (3) (1) (5) — (4) (11)
Ending balance $ 81 $ 75 $ 22 $ 5 $ 21 $ 16 $ — $ 32 $ 252 Allowance for:
Loan losses $ 24 $ 56 $ 7 $ 5 $ 18 $ 16 $ — $ 20 $ 146 Unfunded commitments 57 19 15 — 3 — — 12 106
Individually evaluated for impairment:Loan balance $ — $ — $ — $ — $ 4 $ — $ — $ — $ 4 Allowance for loan losses — — — — — — — — —
Collectively evaluated for impairment:Loan balance $ 1,949 $ 4,787 $ 5,091 $ 706 $ 15,839 $ 594 $ 16,074 (a) $ 11,520 $ 56,560 Allowance for loan losses 24 56 7 5 18 16 — 20 146
(a) Includes $1,550 million of domestic overdrafts, $13,343 million of margin loans and $1,181 million of other loans at Dec. 31, 2018.
Nonperforming assets
The table below presents our nonperforming assets.
Nonperforming assets Dec. 31, 2020
Dec. 31, 2019
Recorded investmentWith an
allowanceWithout an allowance(in millions) Total
Nonperforming loans:Other residential mortgages $ 57 $ — $ 57 $ 62 Wealth management loans and mortgages 10 20 30 24 Commercial real estate 1 — 1 —
Total nonperforming loans 68 20 88 86 Other assets owned — 1 1 3
Total nonperforming assets $ 68 $ 21 $ 89 $ 89
At Dec. 31, 2020, undrawn commitments to borrowers whose loans were classified as nonaccrual or reduced rate were not material.
Past due loans
The table below presents our past due loans.
Past due loans and still accruing interest Dec. 31, 2020 Dec. 31, 2019 Days past due Total
past dueDays past due Total
past due(in millions) 30-59 60-89 ≥90 30-59 60-89 ≥90Wealth management loans and mortgages $ 54 $ 1 $ — $ 55 $ 22 $ 5 $ — $ 27 Commercial real estate 19 16 — 35 6 12 — 18 Financial institutions 11 — — 11 1 30 — 31 Other residential mortgages 3 1 — 4 8 3 — 11
Total past due loans $ 87 $ 18 $ — $ 105 $ 37 $ 50 $ — $ 87
Notes to Consolidated Financial Statements (continued)
BNY Mellon 147
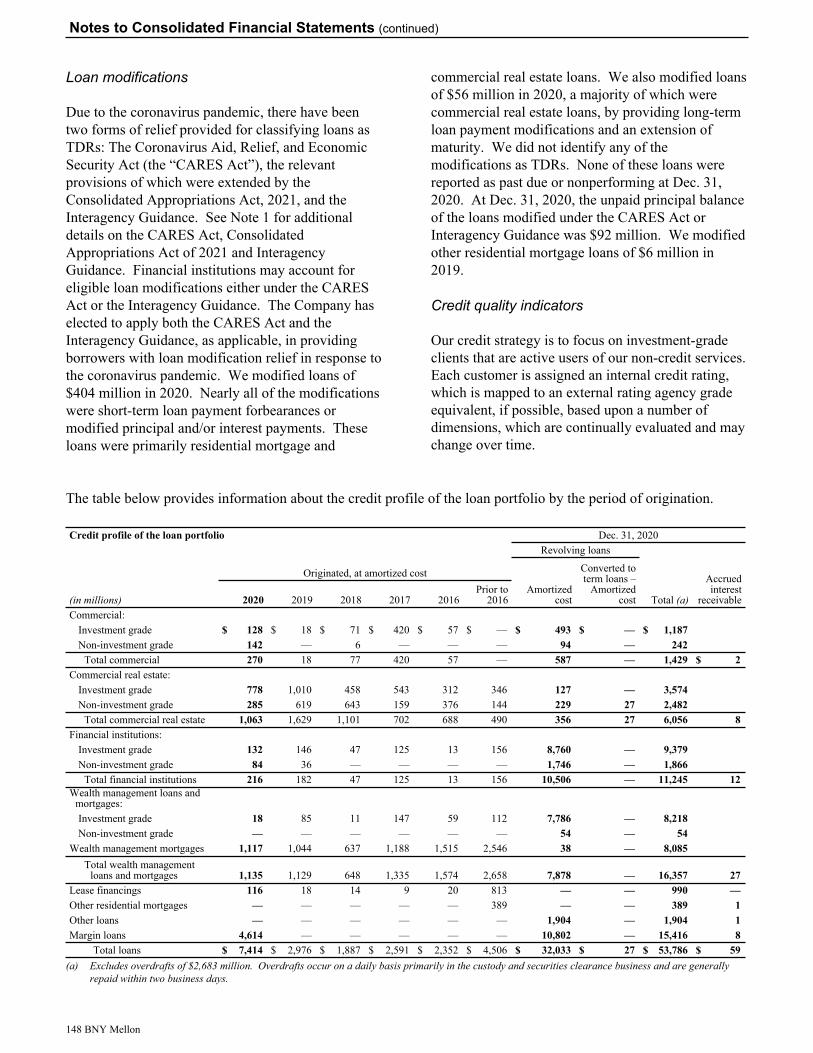
Loan modifications
Due to the coronavirus pandemic, there have been two forms of relief provided for classifying loans as TDRs: The Coronavirus Aid, Relief, and Economic Security Act (the “CARES Act”), the relevant provisions of which were extended by the Consolidated Appropriations Act, 2021, and the Interagency Guidance. See Note 1 for additional details on the CARES Act, Consolidated Appropriations Act of 2021 and Interagency Guidance. Financial institutions may account for eligible loan modifications either under the CARES Act or the Interagency Guidance. The Company has elected to apply both the CARES Act and the Interagency Guidance, as applicable, in providing borrowers with loan modification relief in response to the coronavirus pandemic. We modified loans of $404 million in 2020. Nearly all of the modifications were short-term loan payment forbearances or modified principal and/or interest payments. These loans were primarily residential mortgage and
commercial real estate loans. We also modified loans of $56 million in 2020, a majority of which were commercial real estate loans, by providing long-term loan payment modifications and an extension of maturity. We did not identify any of the modifications as TDRs. None of these loans were reported as past due or nonperforming at Dec. 31, 2020. At Dec. 31, 2020, the unpaid principal balance of the loans modified under the CARES Act or Interagency Guidance was $92 million. We modified other residential mortgage loans of $6 million in 2019.
Credit quality indicators
Our credit strategy is to focus on investment-grade clients that are active users of our non-credit services. Each customer is assigned an internal credit rating, which is mapped to an external rating agency grade equivalent, if possible, based upon a number of dimensions, which are continually evaluated and may change over time.
The table below provides information about the credit profile of the loan portfolio by the period of origination.
Credit profile of the loan portfolio Dec. 31, 2020Revolving loans
Originated, at amortized costAmortized
cost
Converted to term loans –
Amortized cost
Accruedinterest
receivable(in millions) 2020 2019 2018 2017 2016Prior to
2016 Total (a)Commercial:
Investment grade $ 128 $ 18 $ 71 $ 420 $ 57 $ — $ 493 $ — $ 1,187 Non-investment grade 142 — 6 — — — 94 — 242
Total commercial 270 18 77 420 57 — 587 — 1,429 $ 2 Commercial real estate:
Investment grade 778 1,010 458 543 312 346 127 — 3,574 Non-investment grade 285 619 643 159 376 144 229 27 2,482
Total commercial real estate 1,063 1,629 1,101 702 688 490 356 27 6,056 8 Financial institutions:
Investment grade 132 146 47 125 13 156 8,760 — 9,379 Non-investment grade 84 36 — — — — 1,746 — 1,866
Total financial institutions 216 182 47 125 13 156 10,506 — 11,245 12 Wealth management loans and
mortgages:Investment grade 18 85 11 147 59 112 7,786 — 8,218 Non-investment grade — — — — — — 54 — 54
Wealth management mortgages 1,117 1,044 637 1,188 1,515 2,546 38 — 8,085 Total wealth management
loans and mortgages 1,135 1,129 648 1,335 1,574 2,658 7,878 — 16,357 27 Lease financings 116 18 14 9 20 813 — — 990 — Other residential mortgages — — — — — 389 — — 389 1 Other loans — — — — — — 1,904 — 1,904 1 Margin loans 4,614 — — — — — 10,802 — 15,416 8
Total loans $ 7,414 $ 2,976 $ 1,887 $ 2,591 $ 2,352 $ 4,506 $ 32,033 $ 27 $ 53,786 $ 59 (a) Excludes overdrafts of $2,683 million. Overdrafts occur on a daily basis primarily in the custody and securities clearance business and are generally
repaid within two business days.
Notes to Consolidated Financial Statements (continued)
148 BNY Mellon

Commercial loans
The commercial loan portfolio is divided into investment grade and non-investment grade categories based on the assigned internal credit ratings, which are generally consistent with those of the public rating agencies. Customers with ratings consistent with BBB- (S&P)/Baa3 (Moody’s) or better are considered to be investment grade. Those clients with ratings lower than this threshold are considered to be non-investment grade.
Commercial real estate
Our income-producing commercial real estate facilities are focused on experienced owners and are structured with moderate leverage based on existing cash flows. Our commercial real estate lending activities also include construction and renovation facilities.
Financial institutions
Financial institution exposures are high quality, with 95% of the exposures meeting the investment grade equivalent criteria of our internal credit rating classification at Dec. 31, 2020. In addition, 74% of the financial institutions exposure is secured. For example, securities industry clients and asset managers often borrow against marketable securities held in custody. The exposure to financial institutions is generally short term, with 89% expiring within one year.
Wealth management loans and mortgages
Wealth management non-mortgage loans are not typically rated by external rating agencies. A majority of the wealth management loans are secured by the customers’ investment management accounts or custody accounts. Eligible assets pledged for these loans are typically investment grade fixed-income securities, equities and/or mutual funds. Internal ratings for this portion of the wealth management portfolio, therefore, would equate to investment grade external ratings. Wealth management loans are provided to select customers based on the pledge of other types of assets, including business assets, fixed assets or a modest amount of commercial real estate. For the loans collateralized by other assets, the credit quality of the obligor is carefully analyzed, but we do not consider this portfolio of loans to be investment grade.
Credit quality indicators for wealth management mortgages are not correlated to external ratings. Wealth management mortgages are typically loans to high-net-worth individuals, which are secured primarily by residential property. These loans are primarily interest-only, adjustable rate mortgages with a weighted-average loan-to-value ratio of 62% at origination. Delinquency rate is a key indicator of credit quality in the wealth management portfolio. At Dec. 31, 2020, less than 1% of the mortgages were past due.
At Dec. 31, 2020, the wealth management mortgage portfolio consisted of the following geographic concentrations: California – 22%; New York – 17%; Massachusetts – 10%; Florida – 8%; and other – 43%.
Lease financing
At Dec. 31, 2020, the lease financings portfolio consisted of exposures backed by well-diversified assets, primarily large-ticket transportation equipment and real estate. The largest component of our lease residual value exposure is freight-related rail cars. Assets are both domestic and foreign-based, with primary concentrations in the U.S. and Germany.
Other residential mortgages
The other residential mortgage portfolio primarily consists of 1-4 family residential mortgage loans and totaled $389 million at Dec. 31, 2020 and $494 million at Dec. 31, 2019. These loans are not typically correlated to external ratings. Included in this portfolio at Dec. 31, 2020 were $68 million of mortgage loans purchased in 2005, 2006 and the first quarter of 2007, of which 19% of the serviced loan balance was at least 60 days delinquent.
Overdrafts
Overdrafts primarily relate to custody and securities clearance clients and totaled $2.7 billion at Dec. 31, 2020 and Dec. 31, 2019. Overdrafts occur on a daily basis and are generally repaid within two business days.
Other loans
Other loans primarily include loans to consumers that are fully collateralized with equities, mutual funds and fixed-income securities.
Notes to Consolidated Financial Statements (continued)
BNY Mellon 149
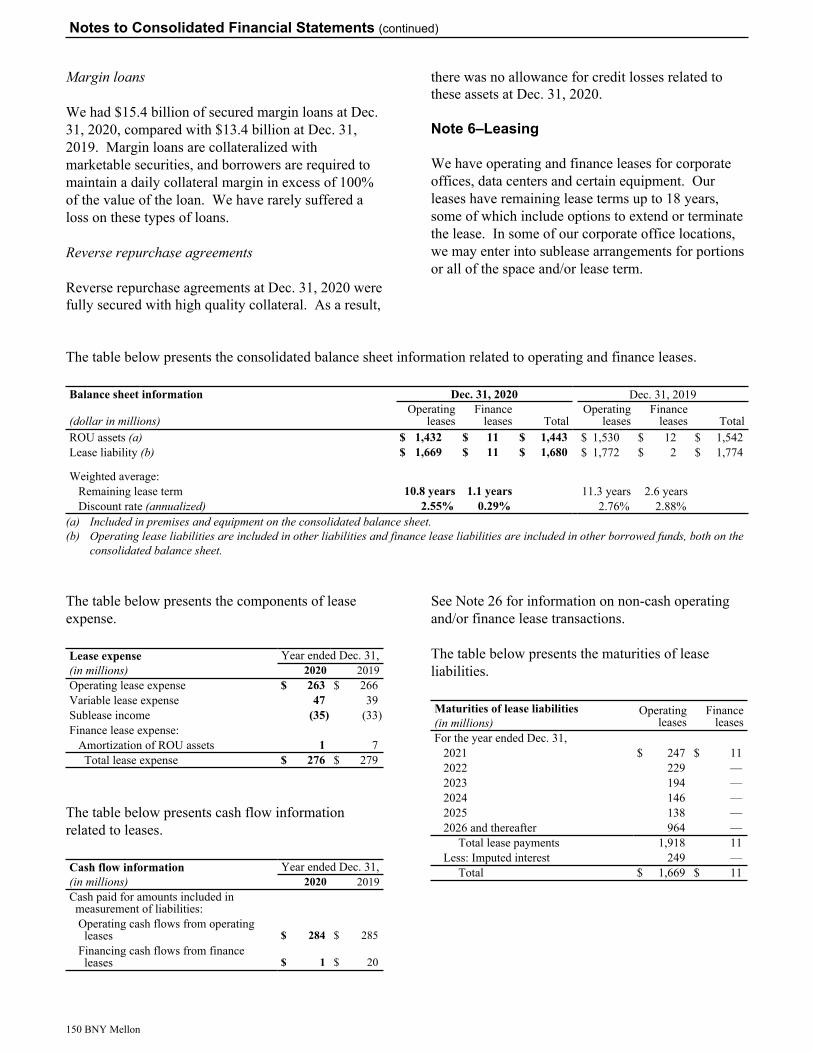
Margin loans
We had $15.4 billion of secured margin loans at Dec. 31, 2020, compared with $13.4 billion at Dec. 31, 2019. Margin loans are collateralized with marketable securities, and borrowers are required to maintain a daily collateral margin in excess of 100% of the value of the loan. We have rarely suffered a loss on these types of loans.
Reverse repurchase agreements
Reverse repurchase agreements at Dec. 31, 2020 were fully secured with high quality collateral. As a result,
there was no allowance for credit losses related to these assets at Dec. 31, 2020.
Note 6–Leasing
We have operating and finance leases for corporate offices, data centers and certain equipment. Our leases have remaining lease terms up to 18 years, some of which include options to extend or terminate the lease. In some of our corporate office locations, we may enter into sublease arrangements for portions or all of the space and/or lease term.
The table below presents the consolidated balance sheet information related to operating and finance leases.
Balance sheet information Dec. 31, 2020 Dec. 31, 2019
(dollar in millions)Operating
leasesFinance
leases TotalOperating
leasesFinance
leases TotalROU assets (a) $ 1,432 $ 11 $ 1,443 $ 1,530 $ 12 $ 1,542 Lease liability (b) $ 1,669 $ 11 $ 1,680 $ 1,772 $ 2 $ 1,774
Weighted average:Remaining lease term 10.8 years 1.1 years 11.3 years 2.6 yearsDiscount rate (annualized) 2.55% 0.29% 2.76% 2.88%
(a) Included in premises and equipment on the consolidated balance sheet.(b) Operating lease liabilities are included in other liabilities and finance lease liabilities are included in other borrowed funds, both on the
consolidated balance sheet.
The table below presents the components of lease expense.
Lease expense Year ended Dec. 31,(in millions) 2020 2019Operating lease expense $ 263 $ 266 Variable lease expense 47 39 Sublease income (35) (33) Finance lease expense:
Amortization of ROU assets 1 7 Total lease expense $ 276 $ 279
The table below presents cash flow information related to leases.
Cash flow information Year ended Dec. 31,(in millions) 2020 2019Cash paid for amounts included in measurement of liabilities:Operating cash flows from operating leases $ 284 $ 285
Financing cash flows from finance leases $ 1 $ 20
See Note 26 for information on non-cash operating and/or finance lease transactions.
The table below presents the maturities of lease liabilities.
Maturities of lease liabilities Operatingleases
Financeleases(in millions)
For the year ended Dec. 31,2021 $ 247 $ 11 2022 229 — 2023 194 — 2024 146 — 2025 138 — 2026 and thereafter 964 —
Total lease payments 1,918 11 Less: Imputed interest 249 —
Total $ 1,669 $ 11
Notes to Consolidated Financial Statements (continued)
150 BNY Mellon
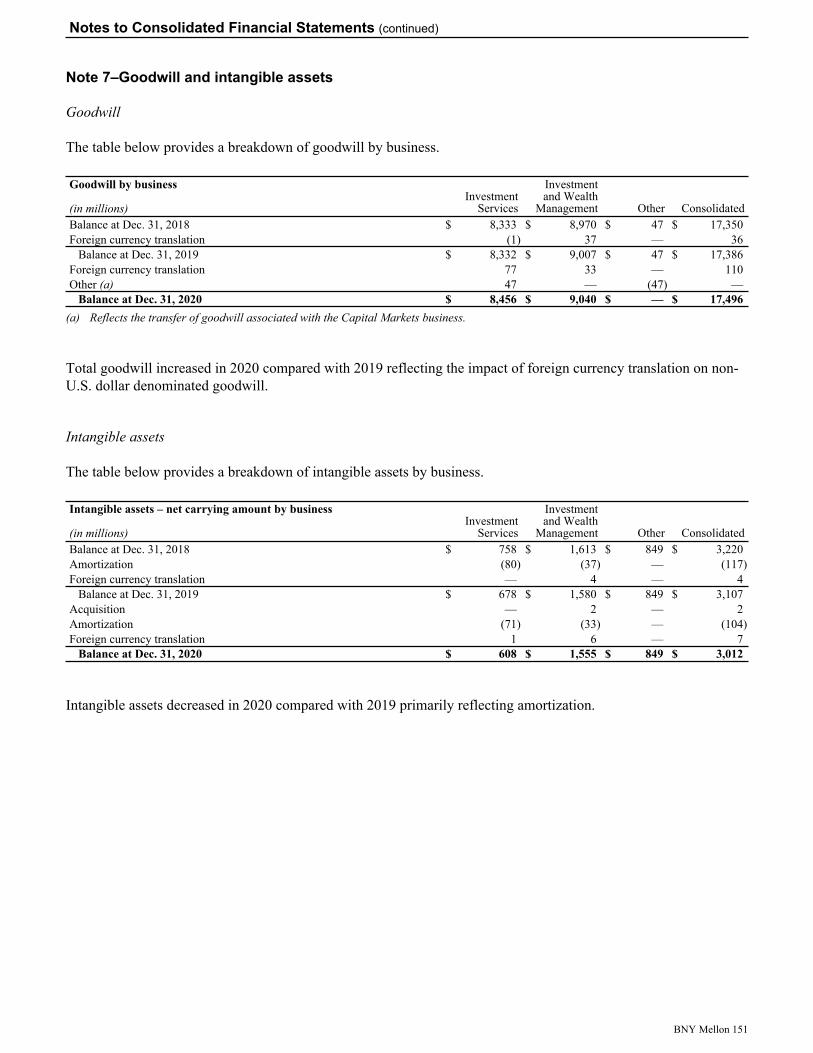
Note 7–Goodwill and intangible assets
Goodwill
The table below provides a breakdown of goodwill by business.
Goodwill by business
(in millions)Investment
Services
Investmentand Wealth
Management Other ConsolidatedBalance at Dec. 31, 2018 $ 8,333 $ 8,970 $ 47 $ 17,350 Foreign currency translation (1) 37 — 36
Balance at Dec. 31, 2019 $ 8,332 $ 9,007 $ 47 $ 17,386 Foreign currency translation 77 33 — 110 Other (a) 47 — (47) —
Balance at Dec. 31, 2020 $ 8,456 $ 9,040 $ — $ 17,496 (a) Reflects the transfer of goodwill associated with the Capital Markets business.
Total goodwill increased in 2020 compared with 2019 reflecting the impact of foreign currency translation on non-U.S. dollar denominated goodwill.
Intangible assets
The table below provides a breakdown of intangible assets by business.
Intangible assets – net carrying amount by business
(in millions)Investment
Services
Investmentand Wealth
Management Other ConsolidatedBalance at Dec. 31, 2018 $ 758 $ 1,613 $ 849 $ 3,220 Amortization (80) (37) — (117) Foreign currency translation — 4 — 4
Balance at Dec. 31, 2019 $ 678 $ 1,580 $ 849 $ 3,107 Acquisition — 2 — 2 Amortization (71) (33) — (104) Foreign currency translation 1 6 — 7
Balance at Dec. 31, 2020 $ 608 $ 1,555 $ 849 $ 3,012
Intangible assets decreased in 2020 compared with 2019 primarily reflecting amortization.
Notes to Consolidated Financial Statements (continued)
BNY Mellon 151
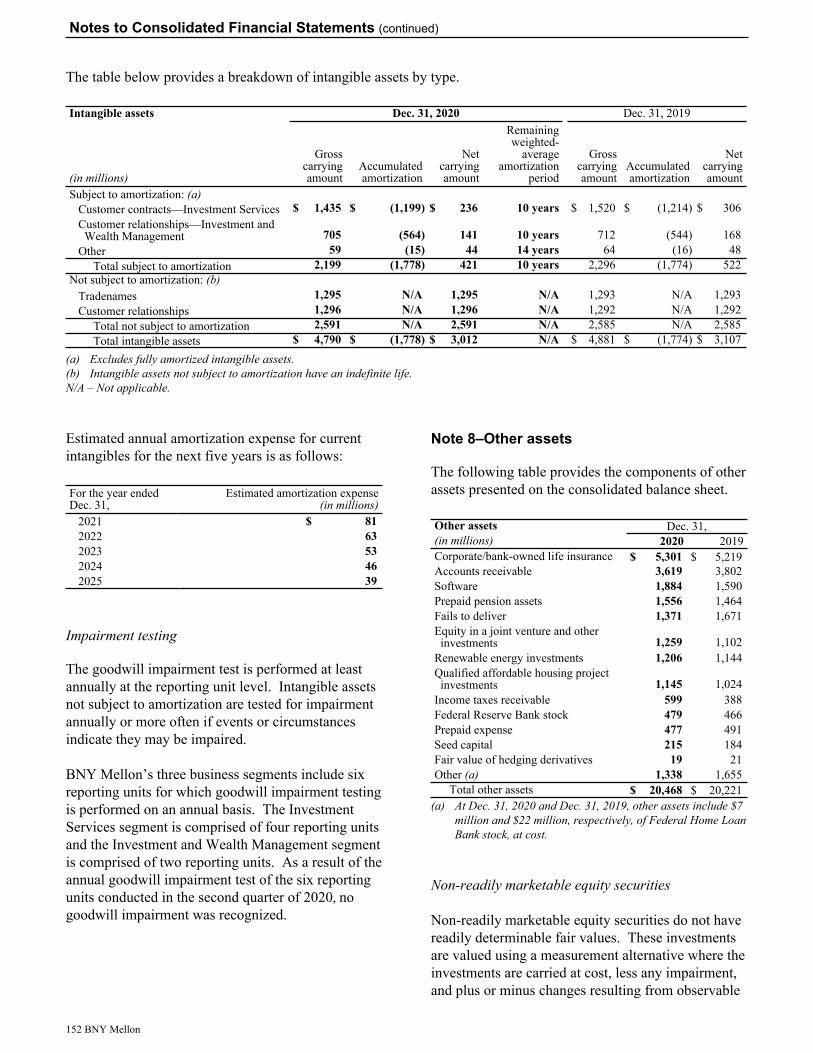
The table below provides a breakdown of intangible assets by type.
Intangible assets Dec. 31, 2020 Dec. 31, 2019
(in millions)
Grosscarryingamount
Accumulatedamortization
Netcarryingamount
Remainingweighted-
averageamortization
period
Grosscarryingamount
Accumulatedamortization
Netcarryingamount
Subject to amortization: (a)Customer contracts—Investment Services $ 1,435 $ (1,199) $ 236 10 years $ 1,520 $ (1,214) $ 306 Customer relationships—Investment and Wealth Management 705 (564) 141 10 years 712 (544) 168
Other 59 (15) 44 14 years 64 (16) 48 Total subject to amortization 2,199 (1,778) 421 10 years 2,296 (1,774) 522
Not subject to amortization: (b)Tradenames 1,295 N/A 1,295 N/A 1,293 N/A 1,293 Customer relationships 1,296 N/A 1,296 N/A 1,292 N/A 1,292
Total not subject to amortization 2,591 N/A 2,591 N/A 2,585 N/A 2,585 Total intangible assets $ 4,790 $ (1,778) $ 3,012 N/A $ 4,881 $ (1,774) $ 3,107
(a) Excludes fully amortized intangible assets.(b) Intangible assets not subject to amortization have an indefinite life.N/A – Not applicable.
Estimated annual amortization expense for current intangibles for the next five years is as follows:
For the year endedDec. 31,
Estimated amortization expense(in millions)
2021 $ 81 2022 63 2023 53 2024 46 2025 39
Impairment testing
The goodwill impairment test is performed at least annually at the reporting unit level. Intangible assets not subject to amortization are tested for impairment annually or more often if events or circumstances indicate they may be impaired.
BNY Mellon’s three business segments include six reporting units for which goodwill impairment testing is performed on an annual basis. The Investment Services segment is comprised of four reporting units and the Investment and Wealth Management segment is comprised of two reporting units. As a result of the annual goodwill impairment test of the six reporting units conducted in the second quarter of 2020, no goodwill impairment was recognized.
Note 8–Other assets
The following table provides the components of other assets presented on the consolidated balance sheet.
Other assets Dec. 31,(in millions) 2020 2019Corporate/bank-owned life insurance $ 5,301 $ 5,219 Accounts receivable 3,619 3,802 Software 1,884 1,590 Prepaid pension assets 1,556 1,464 Fails to deliver 1,371 1,671 Equity in a joint venture and other investments 1,259 1,102
Renewable energy investments 1,206 1,144 Qualified affordable housing project investments 1,145 1,024
Income taxes receivable 599 388 Federal Reserve Bank stock 479 466 Prepaid expense 477 491 Seed capital 215 184 Fair value of hedging derivatives 19 21 Other (a) 1,338 1,655
Total other assets $ 20,468 $ 20,221 (a) At Dec. 31, 2020 and Dec. 31, 2019, other assets include $7
million and $22 million, respectively, of Federal Home Loan Bank stock, at cost.
Non-readily marketable equity securities
Non-readily marketable equity securities do not have readily determinable fair values. These investments are valued using a measurement alternative where the investments are carried at cost, less any impairment, and plus or minus changes resulting from observable
Notes to Consolidated Financial Statements (continued)
152 BNY Mellon
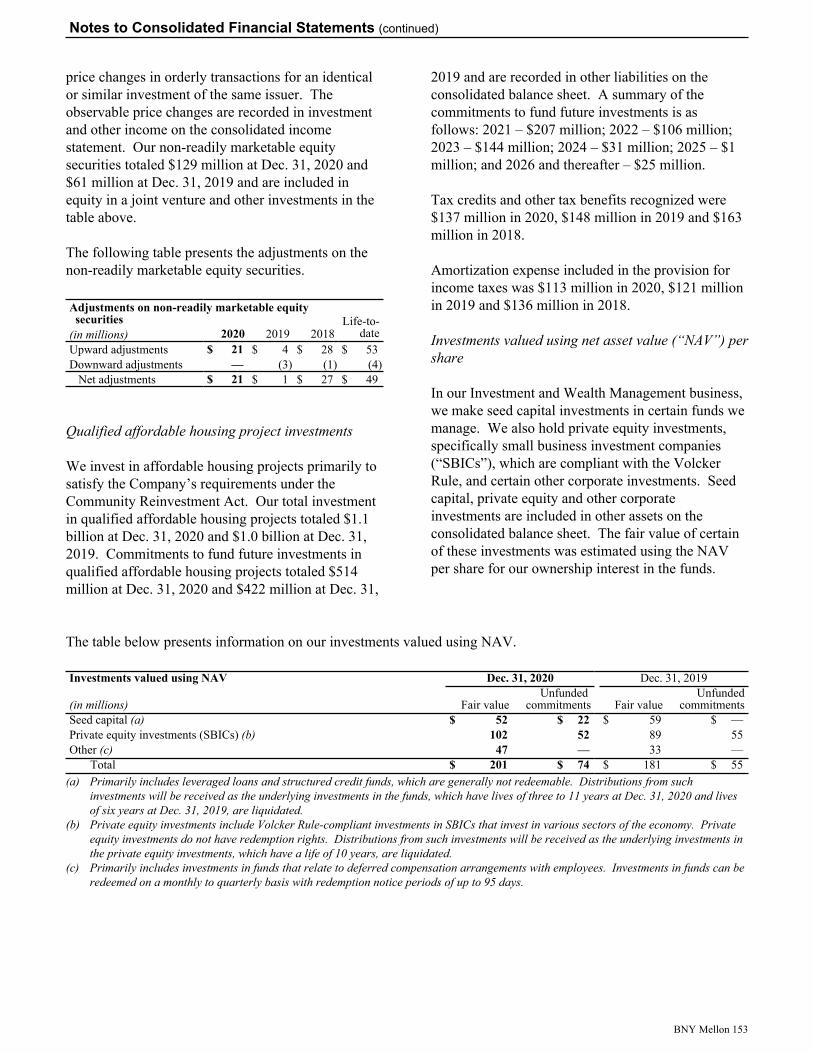
price changes in orderly transactions for an identical or similar investment of the same issuer. The observable price changes are recorded in investment and other income on the consolidated income statement. Our non-readily marketable equity securities totaled $129 million at Dec. 31, 2020 and $61 million at Dec. 31, 2019 and are included in equity in a joint venture and other investments in the table above.
The following table presents the adjustments on the non-readily marketable equity securities.
Adjustments on non-readily marketable equity securities Life-to-
date(in millions) 2020 2019 2018Upward adjustments $ 21 $ 4 $ 28 $ 53 Downward adjustments — (3) (1) (4)
Net adjustments $ 21 $ 1 $ 27 $ 49
Qualified affordable housing project investments
We invest in affordable housing projects primarily to satisfy the Company’s requirements under the Community Reinvestment Act. Our total investment in qualified affordable housing projects totaled $1.1 billion at Dec. 31, 2020 and $1.0 billion at Dec. 31, 2019. Commitments to fund future investments in qualified affordable housing projects totaled $514 million at Dec. 31, 2020 and $422 million at Dec. 31,
2019 and are recorded in other liabilities on the consolidated balance sheet. A summary of the commitments to fund future investments is as follows: 2021 – $207 million; 2022 – $106 million; 2023 – $144 million; 2024 – $31 million; 2025 – $1 million; and 2026 and thereafter – $25 million.
Tax credits and other tax benefits recognized were $137 million in 2020, $148 million in 2019 and $163 million in 2018.
Amortization expense included in the provision for income taxes was $113 million in 2020, $121 million in 2019 and $136 million in 2018.
Investments valued using net asset value (“NAV”) per share
In our Investment and Wealth Management business, we make seed capital investments in certain funds we manage. We also hold private equity investments, specifically small business investment companies (“SBICs”), which are compliant with the Volcker Rule, and certain other corporate investments. Seed capital, private equity and other corporate investments are included in other assets on the consolidated balance sheet. The fair value of certain of these investments was estimated using the NAV per share for our ownership interest in the funds.
The table below presents information on our investments valued using NAV.
Investments valued using NAV Dec. 31, 2020 Dec. 31, 2019
(in millions) Fair valueUnfunded
commitments Fair valueUnfunded
commitmentsSeed capital (a) $ 52 $ 22 $ 59 $ — Private equity investments (SBICs) (b) 102 52 89 55 Other (c) 47 — 33 —
Total $ 201 $ 74 $ 181 $ 55 (a) Primarily includes leveraged loans and structured credit funds, which are generally not redeemable. Distributions from such
investments will be received as the underlying investments in the funds, which have lives of three to 11 years at Dec. 31, 2020 and lives of six years at Dec. 31, 2019, are liquidated.
(b) Private equity investments include Volcker Rule-compliant investments in SBICs that invest in various sectors of the economy. Private equity investments do not have redemption rights. Distributions from such investments will be received as the underlying investments in the private equity investments, which have a life of 10 years, are liquidated.
(c) Primarily includes investments in funds that relate to deferred compensation arrangements with employees. Investments in funds can be redeemed on a monthly to quarterly basis with redemption notice periods of up to 95 days.
Notes to Consolidated Financial Statements (continued)
BNY Mellon 153
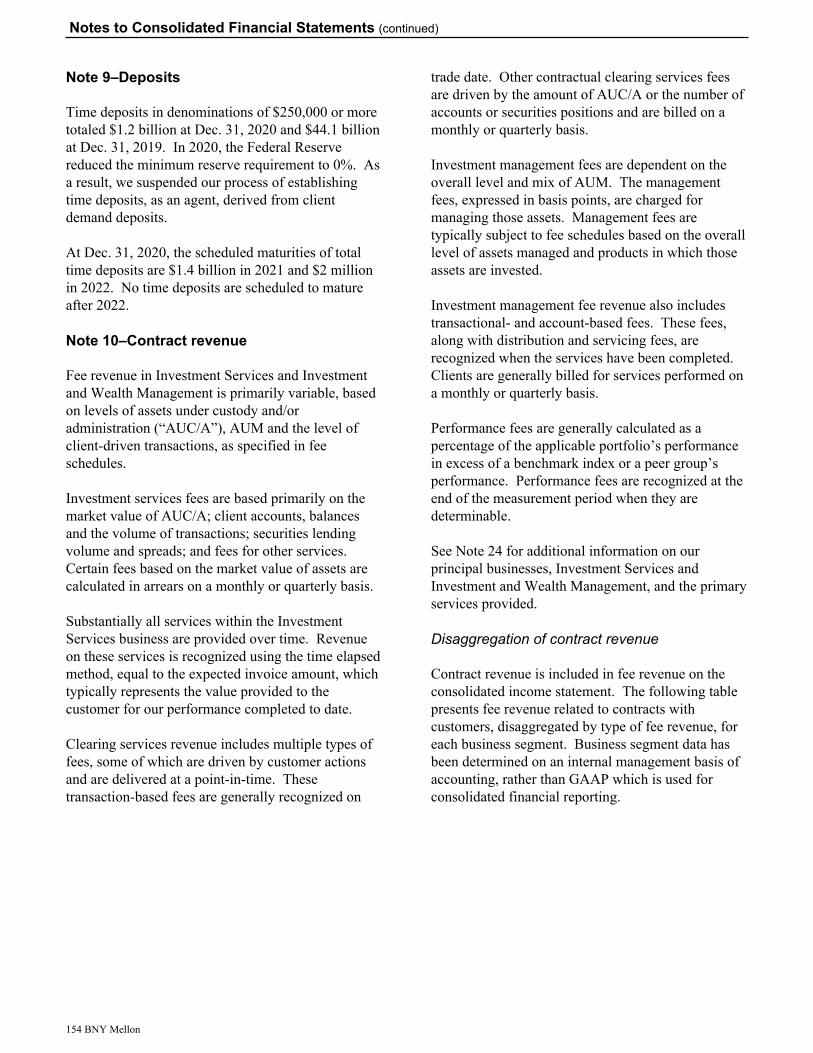
Note 9–Deposits
Time deposits in denominations of $250,000 or more totaled $1.2 billion at Dec. 31, 2020 and $44.1 billion at Dec. 31, 2019. In 2020, the Federal Reserve reduced the minimum reserve requirement to 0%. As a result, we suspended our process of establishing time deposits, as an agent, derived from client demand deposits.
At Dec. 31, 2020, the scheduled maturities of total time deposits are $1.4 billion in 2021 and $2 million in 2022. No time deposits are scheduled to mature after 2022.
Note 10–Contract revenue
Fee revenue in Investment Services and Investment and Wealth Management is primarily variable, based on levels of assets under custody and/or administration (“AUC/A”), AUM and the level of client-driven transactions, as specified in fee schedules.
Investment services fees are based primarily on the market value of AUC/A; client accounts, balances and the volume of transactions; securities lending volume and spreads; and fees for other services. Certain fees based on the market value of assets are calculated in arrears on a monthly or quarterly basis.
Substantially all services within the Investment Services business are provided over time. Revenue on these services is recognized using the time elapsed method, equal to the expected invoice amount, which typically represents the value provided to the customer for our performance completed to date.
Clearing services revenue includes multiple types of fees, some of which are driven by customer actions and are delivered at a point-in-time. These transaction-based fees are generally recognized on
trade date. Other contractual clearing services fees are driven by the amount of AUC/A or the number of accounts or securities positions and are billed on a monthly or quarterly basis.
Investment management fees are dependent on the overall level and mix of AUM. The management fees, expressed in basis points, are charged for managing those assets. Management fees are typically subject to fee schedules based on the overall level of assets managed and products in which those assets are invested.
Investment management fee revenue also includes transactional- and account-based fees. These fees, along with distribution and servicing fees, are recognized when the services have been completed. Clients are generally billed for services performed on a monthly or quarterly basis.
Performance fees are generally calculated as a percentage of the applicable portfolio’s performance in excess of a benchmark index or a peer group’s performance. Performance fees are recognized at the end of the measurement period when they are determinable.
See Note 24 for additional information on our principal businesses, Investment Services and Investment and Wealth Management, and the primary services provided.
Disaggregation of contract revenue
Contract revenue is included in fee revenue on the consolidated income statement. The following table presents fee revenue related to contracts with customers, disaggregated by type of fee revenue, for each business segment. Business segment data has been determined on an internal management basis of accounting, rather than GAAP which is used for consolidated financial reporting.
Notes to Consolidated Financial Statements (continued)
154 BNY Mellon
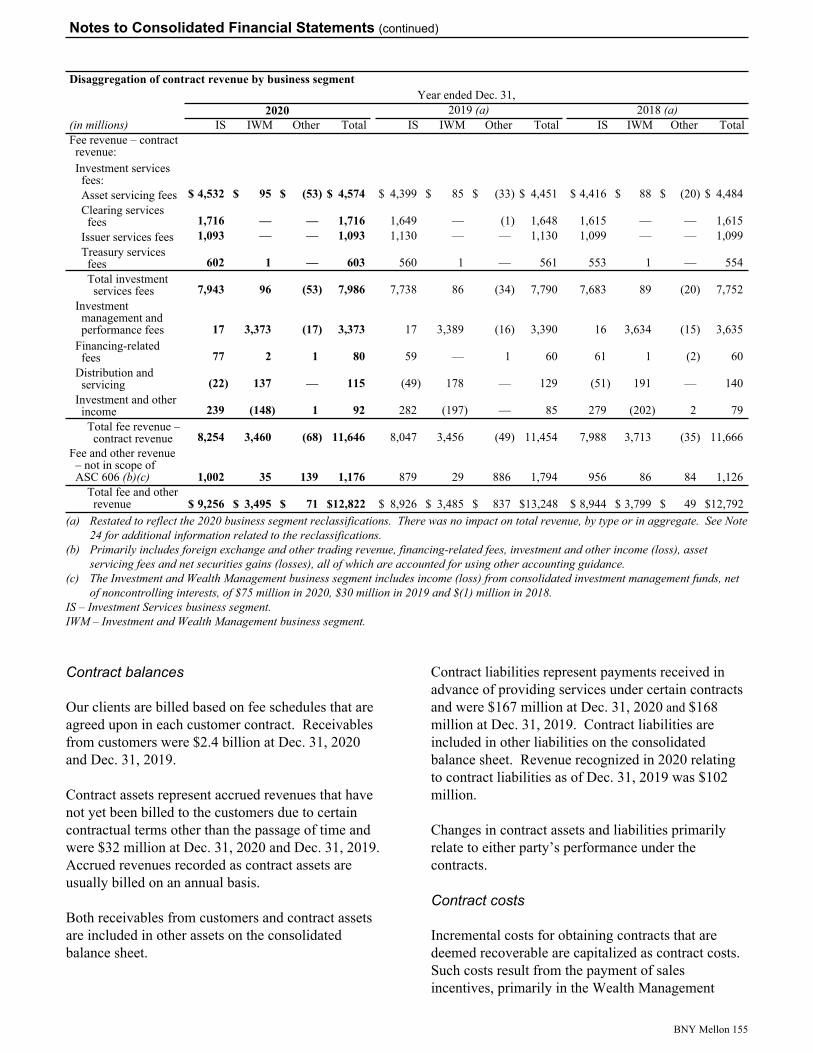
Disaggregation of contract revenue by business segmentYear ended Dec. 31,
2020 2019 (a) 2018 (a)(in millions) IS IWM Other Total IS IWM Other Total IS IWM Other TotalFee revenue – contract revenue:Investment services fees:Asset servicing fees $ 4,532 $ 95 $ (53) $ 4,574 $ 4,399 $ 85 $ (33) $ 4,451 $ 4,416 $ 88 $ (20) $ 4,484 Clearing services fees 1,716 — — 1,716 1,649 — (1) 1,648 1,615 — — 1,615
Issuer services fees 1,093 — — 1,093 1,130 — — 1,130 1,099 — — 1,099 Treasury services fees 602 1 — 603 560 1 — 561 553 1 — 554 Total investment services fees 7,943 96 (53) 7,986 7,738 86 (34) 7,790 7,683 89 (20) 7,752
Investment management and performance fees 17 3,373 (17) 3,373 17 3,389 (16) 3,390 16 3,634 (15) 3,635
Financing-related fees 77 2 1 80 59 — 1 60 61 1 (2) 60
Distribution and servicing (22) 137 — 115 (49) 178 — 129 (51) 191 — 140
Investment and other income 239 (148) 1 92 282 (197) — 85 279 (202) 2 79 Total fee revenue – contract revenue 8,254 3,460 (68) 11,646 8,047 3,456 (49) 11,454 7,988 3,713 (35) 11,666
Fee and other revenue – not in scope of ASC 606 (b)(c) 1,002 35 139 1,176 879 29 886 1,794 956 86 84 1,126
Total fee and other revenue $ 9,256 $ 3,495 $ 71 $ 12,822 $ 8,926 $ 3,485 $ 837 $ 13,248 $ 8,944 $ 3,799 $ 49 $ 12,792
(a) Restated to reflect the 2020 business segment reclassifications. There was no impact on total revenue, by type or in aggregate. See Note 24 for additional information related to the reclassifications.
(b) Primarily includes foreign exchange and other trading revenue, financing-related fees, investment and other income (loss), asset servicing fees and net securities gains (losses), all of which are accounted for using other accounting guidance.
(c) The Investment and Wealth Management business segment includes income (loss) from consolidated investment management funds, net of noncontrolling interests, of $75 million in 2020, $30 million in 2019 and $(1) million in 2018.
IS – Investment Services business segment.IWM – Investment and Wealth Management business segment.
Contract balances
Our clients are billed based on fee schedules that are agreed upon in each customer contract. Receivables from customers were $2.4 billion at Dec. 31, 2020 and Dec. 31, 2019.
Contract assets represent accrued revenues that have not yet been billed to the customers due to certain contractual terms other than the passage of time and were $32 million at Dec. 31, 2020 and Dec. 31, 2019. Accrued revenues recorded as contract assets are usually billed on an annual basis.
Both receivables from customers and contract assets are included in other assets on the consolidated balance sheet.
Contract liabilities represent payments received in advance of providing services under certain contracts and were $167 million at Dec. 31, 2020 and $168 million at Dec. 31, 2019. Contract liabilities are included in other liabilities on the consolidated balance sheet. Revenue recognized in 2020 relating to contract liabilities as of Dec. 31, 2019 was $102 million.
Changes in contract assets and liabilities primarily relate to either party’s performance under the contracts.
Contract costs
Incremental costs for obtaining contracts that are deemed recoverable are capitalized as contract costs. Such costs result from the payment of sales incentives, primarily in the Wealth Management
Notes to Consolidated Financial Statements (continued)
BNY Mellon 155
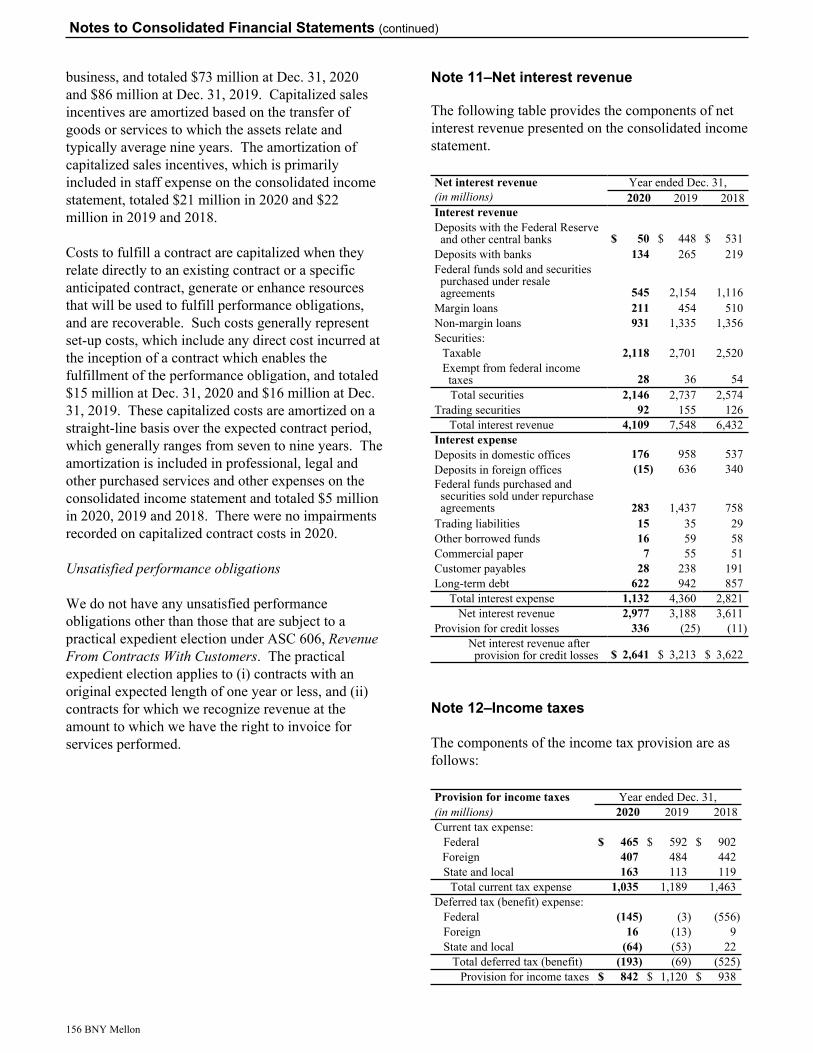
business, and totaled $73 million at Dec. 31, 2020 and $86 million at Dec. 31, 2019. Capitalized sales incentives are amortized based on the transfer of goods or services to which the assets relate and typically average nine years. The amortization of capitalized sales incentives, which is primarily included in staff expense on the consolidated income statement, totaled $21 million in 2020 and $22 million in 2019 and 2018.
Costs to fulfill a contract are capitalized when they relate directly to an existing contract or a specific anticipated contract, generate or enhance resources that will be used to fulfill performance obligations, and are recoverable. Such costs generally represent set-up costs, which include any direct cost incurred at the inception of a contract which enables the fulfillment of the performance obligation, and totaled $15 million at Dec. 31, 2020 and $16 million at Dec. 31, 2019. These capitalized costs are amortized on a straight-line basis over the expected contract period, which generally ranges from seven to nine years. The amortization is included in professional, legal and other purchased services and other expenses on the consolidated income statement and totaled $5 million in 2020, 2019 and 2018. There were no impairments recorded on capitalized contract costs in 2020.
Unsatisfied performance obligations
We do not have any unsatisfied performance obligations other than those that are subject to a practical expedient election under ASC 606, Revenue From Contracts With Customers. The practical expedient election applies to (i) contracts with an original expected length of one year or less, and (ii) contracts for which we recognize revenue at the amount to which we have the right to invoice for services performed.
Note 11–Net interest revenue
The following table provides the components of net interest revenue presented on the consolidated income statement.
Net interest revenue Year ended Dec. 31,(in millions) 2020 2019 2018Interest revenueDeposits with the Federal Reserve and other central banks $ 50 $ 448 $ 531
Deposits with banks 134 265 219 Federal funds sold and securities purchased under resale agreements 545 2,154 1,116
Margin loans 211 454 510 Non-margin loans 931 1,335 1,356 Securities:
Taxable 2,118 2,701 2,520 Exempt from federal income taxes 28 36 54 Total securities 2,146 2,737 2,574
Trading securities 92 155 126 Total interest revenue 4,109 7,548 6,432
Interest expenseDeposits in domestic offices 176 958 537 Deposits in foreign offices (15) 636 340 Federal funds purchased and securities sold under repurchase agreements 283 1,437 758
Trading liabilities 15 35 29 Other borrowed funds 16 59 58 Commercial paper 7 55 51 Customer payables 28 238 191 Long-term debt 622 942 857
Total interest expense 1,132 4,360 2,821 Net interest revenue 2,977 3,188 3,611
Provision for credit losses 336 (25) (11) Net interest revenue after provision for credit losses $ 2,641 $ 3,213 $ 3,622
Note 12–Income taxes
The components of the income tax provision are as follows:
Provision for income taxes Year ended Dec. 31,(in millions) 2020 2019 2018Current tax expense:
Federal $ 465 $ 592 $ 902 Foreign 407 484 442 State and local 163 113 119
Total current tax expense 1,035 1,189 1,463 Deferred tax (benefit) expense:
Federal (145) (3) (556) Foreign 16 (13) 9 State and local (64) (53) 22
Total deferred tax (benefit) (193) (69) (525) Provision for income taxes $ 842 $ 1,120 $ 938
Notes to Consolidated Financial Statements (continued)
156 BNY Mellon
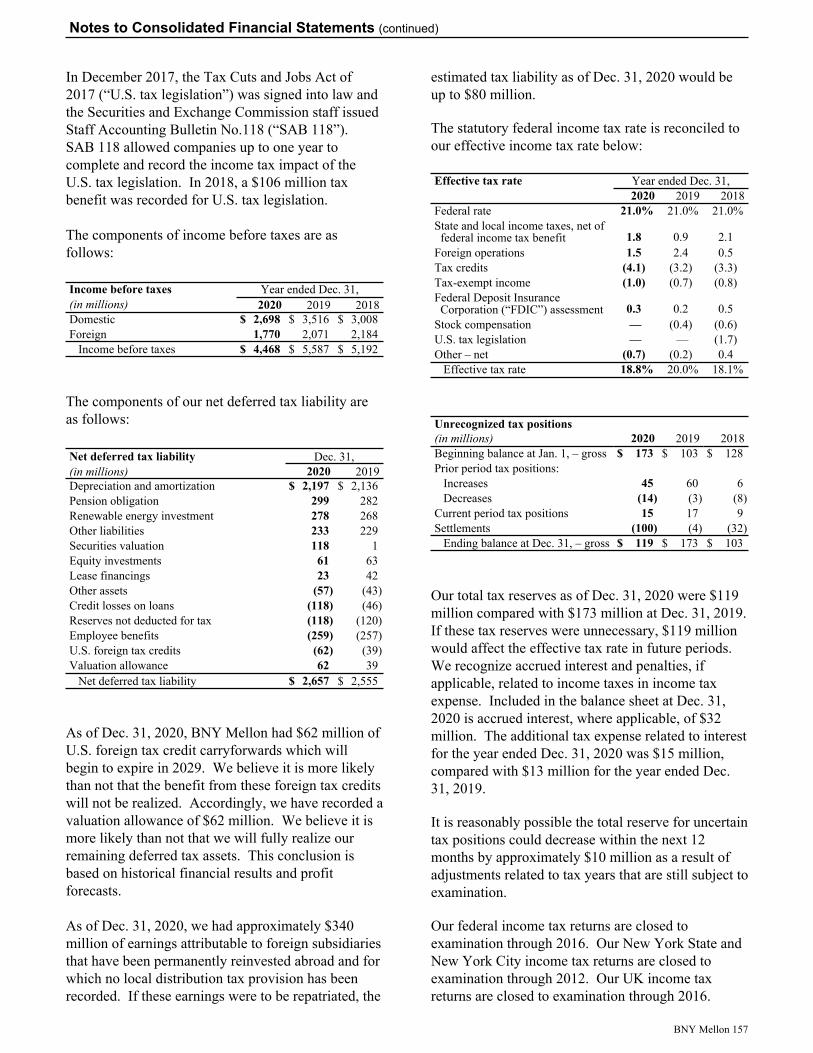
In December 2017, the Tax Cuts and Jobs Act of 2017 (“U.S. tax legislation”) was signed into law and the Securities and Exchange Commission staff issued Staff Accounting Bulletin No.118 (“SAB 118”). SAB 118 allowed companies up to one year to complete and record the income tax impact of the U.S. tax legislation. In 2018, a $106 million tax benefit was recorded for U.S. tax legislation.
The components of income before taxes are as follows:
Income before taxes Year ended Dec. 31,(in millions) 2020 2019 2018Domestic $ 2,698 $ 3,516 $ 3,008 Foreign 1,770 2,071 2,184
Income before taxes $ 4,468 $ 5,587 $ 5,192
The components of our net deferred tax liability are as follows:
Net deferred tax liability Dec. 31,(in millions) 2020 2019Depreciation and amortization $ 2,197 $ 2,136 Pension obligation 299 282 Renewable energy investment 278 268 Other liabilities 233 229 Securities valuation 118 1 Equity investments 61 63 Lease financings 23 42 Other assets (57) (43) Credit losses on loans (118) (46) Reserves not deducted for tax (118) (120) Employee benefits (259) (257) U.S. foreign tax credits (62) (39) Valuation allowance 62 39
Net deferred tax liability $ 2,657 $ 2,555
As of Dec. 31, 2020, BNY Mellon had $62 million of U.S. foreign tax credit carryforwards which will begin to expire in 2029. We believe it is more likely than not that the benefit from these foreign tax credits will not be realized. Accordingly, we have recorded a valuation allowance of $62 million. We believe it is more likely than not that we will fully realize our remaining deferred tax assets. This conclusion is based on historical financial results and profit forecasts.
As of Dec. 31, 2020, we had approximately $340 million of earnings attributable to foreign subsidiaries that have been permanently reinvested abroad and for which no local distribution tax provision has been recorded. If these earnings were to be repatriated, the
estimated tax liability as of Dec. 31, 2020 would be up to $80 million.
The statutory federal income tax rate is reconciled to our effective income tax rate below:
Effective tax rate Year ended Dec. 31,2020 2019 2018
Federal rate 21.0% 21.0% 21.0% State and local income taxes, net of federal income tax benefit 1.8 0.9 2.1
Foreign operations 1.5 2.4 0.5 Tax credits (4.1) (3.2) (3.3) Tax-exempt income (1.0) (0.7) (0.8) Federal Deposit Insurance Corporation (“FDIC”) assessment 0.3 0.2 0.5
Stock compensation — (0.4) (0.6) U.S. tax legislation — — (1.7) Other – net (0.7) (0.2) 0.4
Effective tax rate 18.8% 20.0% 18.1%
Unrecognized tax positions(in millions) 2020 2019 2018Beginning balance at Jan. 1, – gross $ 173 $ 103 $ 128 Prior period tax positions:
Increases 45 60 6 Decreases (14) (3) (8)
Current period tax positions 15 17 9 Settlements (100) (4) (32)
Ending balance at Dec. 31, – gross $ 119 $ 173 $ 103
Our total tax reserves as of Dec. 31, 2020 were $119 million compared with $173 million at Dec. 31, 2019. If these tax reserves were unnecessary, $119 million would affect the effective tax rate in future periods. We recognize accrued interest and penalties, if applicable, related to income taxes in income tax expense. Included in the balance sheet at Dec. 31, 2020 is accrued interest, where applicable, of $32 million. The additional tax expense related to interest for the year ended Dec. 31, 2020 was $15 million, compared with $13 million for the year ended Dec. 31, 2019. It is reasonably possible the total reserve for uncertain tax positions could decrease within the next 12 months by approximately $10 million as a result of adjustments related to tax years that are still subject to examination. Our federal income tax returns are closed to examination through 2016. Our New York State and New York City income tax returns are closed to examination through 2012. Our UK income tax returns are closed to examination through 2016.
Notes to Consolidated Financial Statements (continued)
BNY Mellon 157
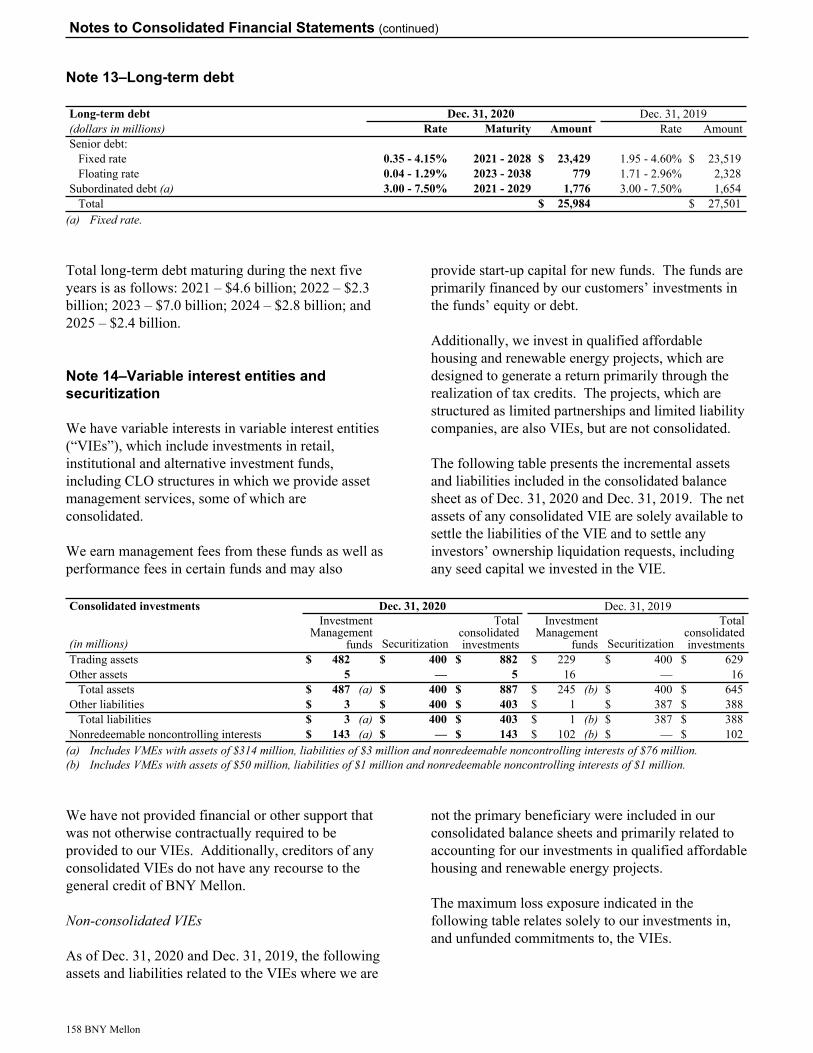
Note 13–Long-term debt
Long-term debt Dec. 31, 2020 Dec. 31, 2019(dollars in millions) Rate Maturity Amount Rate AmountSenior debt:
Fixed rate 0.35 - 4.15% 2021 - 2028 $ 23,429 1.95 - 4.60% $ 23,519 Floating rate 0.04 - 1.29% 2023 - 2038 779 1.71 - 2.96% 2,328
Subordinated debt (a) 3.00 - 7.50% 2021 - 2029 1,776 3.00 - 7.50% 1,654 Total $ 25,984 $ 27,501
(a) Fixed rate.
Total long-term debt maturing during the next five years is as follows: 2021 – $4.6 billion; 2022 – $2.3 billion; 2023 – $7.0 billion; 2024 – $2.8 billion; and 2025 – $2.4 billion.
Note 14–Variable interest entities and securitization
We have variable interests in variable interest entities (“VIEs”), which include investments in retail, institutional and alternative investment funds, including CLO structures in which we provide asset management services, some of which are consolidated.
We earn management fees from these funds as well as performance fees in certain funds and may also
provide start-up capital for new funds. The funds are primarily financed by our customers’ investments in the funds’ equity or debt.
Additionally, we invest in qualified affordable housing and renewable energy projects, which are designed to generate a return primarily through the realization of tax credits. The projects, which are structured as limited partnerships and limited liability companies, are also VIEs, but are not consolidated.
The following table presents the incremental assets and liabilities included in the consolidated balance sheet as of Dec. 31, 2020 and Dec. 31, 2019. The net assets of any consolidated VIE are solely available to settle the liabilities of the VIE and to settle any investors’ ownership liquidation requests, including any seed capital we invested in the VIE.
Consolidated investments Dec. 31, 2020 Dec. 31, 2019
(in millions)
InvestmentManagement
funds Securitization
Totalconsolidatedinvestments
InvestmentManagement
funds Securitization
Totalconsolidatedinvestments
Trading assets $ 482 $ 400 $ 882 $ 229 $ 400 $ 629 Other assets 5 — 5 16 — 16
Total assets $ 487 (a) $ 400 $ 887 $ 245 (b) $ 400 $ 645 Other liabilities $ 3 $ 400 $ 403 $ 1 $ 387 $ 388
Total liabilities $ 3 (a) $ 400 $ 403 $ 1 (b) $ 387 $ 388 Nonredeemable noncontrolling interests $ 143 (a) $ — $ 143 $ 102 (b) $ — $ 102
(a) Includes VMEs with assets of $314 million, liabilities of $3 million and nonredeemable noncontrolling interests of $76 million.(b) Includes VMEs with assets of $50 million, liabilities of $1 million and nonredeemable noncontrolling interests of $1 million.
We have not provided financial or other support that was not otherwise contractually required to be provided to our VIEs. Additionally, creditors of any consolidated VIEs do not have any recourse to the general credit of BNY Mellon.
Non-consolidated VIEs
As of Dec. 31, 2020 and Dec. 31, 2019, the following assets and liabilities related to the VIEs where we are
not the primary beneficiary were included in our consolidated balance sheets and primarily related to accounting for our investments in qualified affordable housing and renewable energy projects.
The maximum loss exposure indicated in the following table relates solely to our investments in, and unfunded commitments to, the VIEs.
Notes to Consolidated Financial Statements (continued)
158 BNY Mellon
Non-consolidated VIEs Dec. 31, 2020 Dec. 31, 2019
(in millions) Assets LiabilitiesMaximum
loss exposure Assets LiabilitiesMaximum
loss exposureSecurities – Available-for-sale (a) $ 217 $ — $ 217 $ 208 $ — $ 208 Other 2,565 514 3,096 2,400 422 2,822
(a) Includes investments in the Company’s sponsored CLOs.
Note 15–Shareholders’ equity
Common stock
BNY Mellon has 3.5 billion authorized shares of common stock with a par value of $0.01 per share. At Dec. 31, 2020, 886,763,531 shares of common stock were outstanding.
Common stock repurchase program
In June 2019, in connection with the Federal Reserve’s non-objection to our 2019 capital plan, BNY Mellon announced a share repurchase plan providing for the repurchase of up to $3.94 billion of common stock starting in the third quarter of 2019 and continuing through the second quarter of 2020.
In March 2020, we and the other members of the Financial Services Forum announced the temporary suspension of share repurchases until the end of the second quarter of 2020 to preserve capital and liquidity in order to further the objective of using capital and liquidity to support clients and customers. In June 2020, the Federal Reserve announced that it required participating Comprehensive Capital Analysis and Review (“CCAR”) firms, including us, to update and resubmit their capital plans and that, as a result, unless otherwise approved by the Federal Reserve, participating firms were not permitted to conduct open market common stock repurchases in the third quarter of 2020. In September 2020, the Federal Reserve extended the limitation on open market common stock repurchases through the fourth quarter of 2020. During the third and fourth quarters of 2020, participating CCAR firms were also subject to limitations on common stock dividends.
In December 2020, the Federal Reserve released the results of the second round of CCAR stress tests during 2020 and extended the restriction on common stock dividends and open market common share
repurchases applicable to participating CCAR firms, including us, to the first quarter of 2021, with certain modifications. Under the modified restrictions, the Company must maintain the current dividend rate and may pay common stock dividends and make open market common share repurchases that, in the aggregate, do not exceed an amount equal to the average of its net income for the four preceding calendar quarters. In December 2020, in connection with the Federal Reserve’s release of these results, the Company announced a share repurchase plan approved by its Board of Directors. The 2020 share repurchase program provides for the repurchase of up to approximately $4.451 billion from the third quarter of 2020 through the third quarter of 2021. Any repurchases during that period will be made in a manner consistent with any applicable distribution limitations imposed by the Federal Reserve. This new share repurchase plan replaces all previously authorized share repurchase plans.
The Company has declared its common stock dividend for the first quarter of 2021 and is authorized during the quarter to conduct open market common share repurchases in an amount up to approximately $625 million under the Federal Reserve’s modified distribution limitation.
Share repurchases may be executed through open market repurchases, in privately negotiated transactions or by other means, including through repurchase plans designed to comply with Rule 10b5-1 and other derivative, accelerated share repurchase and other structured transactions. In 2020, we repurchased 21.8 million common shares at an average price of $45.42 per common share for a total of $989 million. At Dec. 31, 2020, the maximum dollar value of shares that can be purchased under the 2020 share repurchase program, including employee benefit plan repurchases, totaled $4.4 billion.
Notes to Consolidated Financial Statements (continued)
BNY Mellon 159

Preferred stock
The Parent has 100 million authorized shares of preferred stock with a par value of $0.01 per share. The following table summarizes the Parent’s preferred stock issued and outstanding at Dec. 31, 2020 and Dec. 31, 2019.
Preferred stock summary (a) Total shares issued and outstanding
Carrying value (b)(in millions)
Dec. 31, 2020
Dec. 31, 2019
Dec. 31, 2020
Dec. 31, 2019Per annum dividend rate
Series A Greater of (i) three-month LIBOR plus 0.565% for the related distribution period; or (ii) 4.000% 5,001 5,001 $ 500 $ 500
Series C 5.2% — 5,825 — 568 Series D 4.50% to but excluding June 20, 2023, then a floating rate equal to the
three-month LIBOR plus 2.46% 5,000 5,000 494 494 Series E 4.950% to but excluding June 20, 2020, then a floating rate equal to
the three-month LIBOR plus 3.42% 10,000 10,000 990 990 Series F 4.625% to but excluding Sept. 20, 2026, then a floating rate equal to
the three-month LIBOR plus 3.131% 10,000 10,000 990 990 Series G 4.700% to but excluding Sept. 20, 2025, then a floating rate equal to
the five-year treasury rate plus 4.358% 10,000 — 990 — Series H 3.700% to but excluding March 20, 2026, then a floating rate equal to
the five-year treasury rate plus 3.352% 5,825 — 577 — Total 45,826 35,826 $ 4,541 $ 3,542
(a) All outstanding preferred stock is noncumulative perpetual preferred stock with a liquidation preference of $100,000 per share.(b) The carrying value of the Series C, Series D, Series E, Series F, Series G and Series H preferred stock is recorded net of issuance costs.
Holders of the Series A preferred stock are entitled to receive dividends, if declared by the Parent’s Board of Directors, on each March 20, June 20, September 20 and December 20. Holders of the Series D preferred stock are entitled to receive dividends, if declared by the Parent’s Board of Directors, on each June 20 and December 20, to but excluding June 20, 2023; and on each March 20, June 20, September 20 and December 20, from and including June 20, 2023. Holders of the Series E preferred stock are entitled to receive dividends, if declared by the Parent’s Board of Directors, on each June 20 and December 20, to and including June 20, 2020; and on each March 20, June 20, September 20 and December 20, from and including Sept. 20, 2020. Holders of the Series F preferred stock are entitled to receive dividends, if declared by the Parent’s Board of Directors, on each March 20 and September 20, to and including Sept. 20, 2026; and on each March 20, June 20, September 20 and December 20, from and including Dec. 20, 2026. Holders of the Series G preferred stock are entitled to receive dividends, if declared by the Parent’s Board of Directors, on each March 20 and September 20. Holders of the Series H preferred stock are entitled to receive dividends, if declared by the Parent’s Board of Directors, on each March 20, June 20, September 20 and December 20, commencing on March 20, 2021.
BNY Mellon’s ability to declare or pay dividends on, or purchase, redeem or otherwise acquire, shares of our common stock or any of our shares that rank junior to the preferred stock as to the payment of dividends and/or the distribution of any assets on any liquidation, dissolution or winding-up of the Parent will be prohibited, subject to certain restrictions, in the event that we do not declare and pay in full preferred dividends for the then current dividend period (in the case of dividends) or most recently completed dividend period (in the case of repurchases) of the Series A preferred stock or the last preceding dividend period (in the case of dividends) or most recently completed dividend period (in the case of repurchases) of the Series D, Series E, Series F, Series G and Series H preferred stock.
All of the outstanding shares of the Series A preferred stock are owned by Mellon Capital IV, a 100% owned financing subsidiary of the Parent, which will pass through any dividend on the Series A preferred stock to the holders of its Normal Preferred Capital Securities. The Parent’s obligations under the trust and other agreements relating to Mellon Capital IV have the effect of providing a full and unconditional guarantee, on a subordinated basis, of payments due on the Normal Preferred Capital Securities. All of the outstanding shares of the Series D, Series E, Series F, Series G and Series H preferred stock are held by the
Notes to Consolidated Financial Statements (continued)
160 BNY Mellon

depositary of the depositary shares, which will pass through the applicable portion of any dividend on the Series D, Series E, Series F, Series G and Series H preferred stock to the holders of record of their respective depositary shares.
In December 2020, the Parent redeemed all outstanding shares of its Series C preferred stock, $100,000 liquidation preference per share. Deferred fees of approximately $15 million were realized as preferred stock dividends upon redemption.
The table below presents the dividends paid on the Parent’s preferred stock.
Preferred dividends paid
(dollars in millions, except per share amounts)
Depositary shares
per share
2020 2019 2018
Per shareTotal
dividend Per shareTotal
dividend Per shareTotal
dividendSeries A 100 (a) $ 4,055.55 $ 20 $ 4,055.55 $ 20 $ 4,055.55 $ 20 Series C 4,000 5,200.00 46 (b) 5,200.00 31 5,200.00 31 Series D 100 4,500.00 22 4,500.00 22 4,500.00 22 Series E 100 4,359.63 44 4,950.00 50 4,950.00 50 Series F 100 4,625.00 46 4,625.00 46 4,625.00 46 Series G 100 1,579.72 16 N/A N/A N/A N/A
Total $ 194 $ 169 $ 169 (a) Represents Normal Preferred Capital Securities.(b) Includes deferred fees of approximately $15 million related to the redemption of the Series C preferred stock.N/A – Not applicable.
The preferred stock is not subject to the operation of a sinking fund and is not convertible into, or exchangeable for, shares of our common stock or any other class or series of our other securities. We may redeem the Series A preferred stock, in whole or in part, at our option. We may also, at our option, redeem the shares of the Series D preferred stock on any dividend payment date, in whole or in part, on or after the dividend payment date in June 2023, the Series E preferred stock on any dividend payment date, in whole or in part, the Series F preferred stock on any dividend payment date, in whole or in part, on or after the dividend payment date in September 2026, the Series G preferred stock on any dividend payment date, in whole or in part, on or after the dividend payment date in September 2025, and the Series H preferred stock on any dividend payment date, in whole or in part, on or after the dividend payment date in March 2026. The Series D, Series E, Series F, Series G or Series H preferred stock can be redeemed, in whole but not in part, at any time within 90 days following a regulatory capital treatment event. Redemption of the preferred stock is subject to the prior approval of the Federal Reserve.
Temporary equity
Temporary equity was $176 million at Dec. 31, 2020 and $143 million at Dec. 31, 2019. Temporary equity represents the redemption value recorded for redeemable noncontrolling interests resulting from equity-classified share-based payment arrangements that are currently redeemable or are expected to become redeemable.
Capital adequacy
Regulators establish certain levels of capital for bank holding companies (“BHCs”) and banks, including BNY Mellon and our bank subsidiaries, in accordance with established quantitative measurements. For the Parent to maintain its status as a financial holding company, our U.S. bank subsidiaries and BNY Mellon must, among other things, qualify as “well capitalized.” As of Dec. 31, 2020 and Dec. 31, 2019, BNY Mellon and our U.S. bank subsidiaries were “well capitalized.”
Notes to Consolidated Financial Statements (continued)
BNY Mellon 161
The regulatory capital ratios of our consolidated and largest bank subsidiary, The Bank of New York Mellon, are shown below.
Consolidated and largest bank subsidiary regulatory capital ratios (a) Dec. 31,
2020 2019Consolidated regulatory capital ratios:
Common Equity Tier 1 (“CET1”) ratio 13.1% 11.5% Tier 1 capital ratio 15.8 13.7 Total capital ratio 16.7 14.4 Tier 1 leverage ratio 6.3 6.6 Supplementary leverage ratio
(“SLR”) (b)(c) 8.6 6.1
The Bank of New York Mellon regulatory capital ratios:CET1 ratio 17.1% 15.1% Tier 1 capital ratio 17.1 15.1 Total capital ratio 17.3 15.2 Tier 1 leverage ratio 6.4 6.9 SLR (b) 8.5 6.4
(a) For our CET1, Tier 1 capital and Total capital ratios, our effective capital ratios under U.S. capital rules are the lower of the ratios as calculated under the Standardized and Advanced Approaches, which for the periods noted above was the Advanced Approaches. The Tier 1 leverage ratio is based on Tier 1 capital and quarterly average total assets. For BNY Mellon to qualify as “well capitalized,” its Tier 1 capital and Total capital ratios must be at least 6% and 10%, respectively. For The Bank of New York Mellon, our largest bank subsidiary, to qualify as “well capitalized,” its CET1, Tier 1 capital, Total capital and Tier 1 leverage ratios must be at least 6.5%, 8%, 10% and 5%, respectively.
(b) The SLR is based on Tier 1 capital and total leverage exposure, which includes certain off-balance sheet exposures. The SLR at Dec. 31, 2020 reflects the exclusion of certain central bank deposits from total leverage exposure. For The Bank of New York Mellon to qualify as “well capitalized,” its SLR must be at least 6%.
(c) The consolidated SLR at Dec. 31, 2020 reflects the temporary exclusion of U.S. Treasury securities from the total leverage exposure.
Failure to satisfy regulatory standards, including “well capitalized” status or capital adequacy rules more generally, could result in limitations on our activities and adversely affect our financial condition. If a BHC such as BNY Mellon, or a bank such as The Bank of New York Mellon or BNY Mellon, N.A., fails to qualify as “adequately capitalized,” regulatory sanctions and limitations will be imposed.
The following table presents our capital components and risk-weighted assets (“RWAs”) determined under the Standardized and Advanced Approaches, the average assets used for leverage capital purposes and leverage exposure used for SLR purposes.
Regulatory capital ratio components Dec. 31,(in millions) 2020 2019CET1:
Common shareholders’ equity $ 41,260 $ 37,941 Adjustments for:
Goodwill and intangible assets (a) (18,697) (18,725) Net pension fund assets (319) (272) Equity method investments (306) (311) Deferred tax assets (54) (46) Other (9) (47)
Total CET1 21,875 18,540 Other Tier 1 capital:
Preferred stock 4,541 3,542 Other (106) (86)
Total Tier 1 capital $ 26,310 $ 21,996
Tier 2 capital:Subordinated debt $ 1,248 $ 1,248 Allowance for credit losses 490 216 Other (10) (11)
Total Tier 2 capital – Standardized Approach 1,728 1,453
Excess of expected credit losses 247 — Less: Allowance for credit losses 490 216
Total Tier 2 capital – Advanced Approaches $ 1,485 $ 1,237
Total capital:Standardized Approach $ 28,038 $ 23,449 Advanced Approaches $ 27,795 $ 23,233
Risk-weighted assets:Standardized Approach $ 163,848 $ 148,695 Advanced Approaches:
Credit Risk $ 98,262 $ 95,490 Market Risk 4,226 4,020 Operational Risk 63,938 61,388
Total Advanced Approaches $ 166,426 $ 160,898
Average assets for Tier 1 leverage ratio $ 417,982 $ 334,869
Total leverage exposure for SLR $ 304,823 $ 362,452 (a) Reduced by deferred tax liabilities associated with
intangible assets and tax deductible goodwill.
The following table presents the amount of capital by which BNY Mellon and our largest bank subsidiary, The Bank of New York Mellon, exceeded the capital thresholds determined under U.S. capital rules.
Capital above thresholds at Dec. 31, 2020
(in millions) Consolidated (a)
The Bank of New York
MellonCET1 $ 7,729 $ 13,324 (a)Tier 1 capital 9,667 11,343 (a)Total capital 7,824 8,979 (a)Tier 1 leverage ratio 9,591 5,072 (b)SLR 11,069 6,580 (b)
(a) Based on minimum required standards, with applicable buffers.
(b) Based on well capitalized standards.
Notes to Consolidated Financial Statements (continued)
162 BNY Mellon
Note 16–Other comprehensive income (loss)
Components of other comprehensive income (loss)
Year ended Dec. 31,2020 2019 2018
(in millions)Pre-taxamount
Tax(expense)
benefitAfter-tax
amountPre-taxamount
Tax(expense)
benefitAfter-tax
amountPre-taxamount
Tax(expense)
benefitAfter-tax
amountForeign currency translation:
Foreign currency translation adjustments arising during the period (a) $ 441 $ 67 $ 508 $ 135 $ 16 $ 151 $ (157) $ (156) $ (313) Total foreign currency translation 441 67 508 135 16 151 (157) (156) (313)
Unrealized gain (loss) on assets available-for-sale:Unrealized gain (loss) arising during the period 1,573 (371) 1,202 680 (168) 512 (542) 126 (416) Reclassification adjustment (b) (33) 8 (25) 18 (4) 14 48 (12) 36
Net unrealized gain (loss) on assets available-for-sale 1,540 (363) 1,177 698 (172) 526 (494) 114 (380)
Defined benefit plans:Prior service cost arising during the period — — — (1) — (1) — — — Net (loss) arising during the period (138) 31 (107) (121) 34 (87) (244) 55 (189) Amortization of prior service credit, net loss and
initial obligation included in net periodic benefit cost (b) 95 (18) 77 52 (18) 34 93 (24) 69 Total defined benefit plans (43) 13 (30) (70) 16 (54) (151) 31 (120)
Unrealized gain (loss) on cash flow hedges:Unrealized hedge gain (loss) arising during the
period 5 (1) 4 16 (7) 9 (15) 4 (11) Reclassification of net (gain) loss to net income:
Interest rate contracts – interest expense — — — (7) 2 (5) — — — Foreign exchange (“FX”) contracts – other
revenue — — — — — — (2) — (2) FX contracts – staff expense 1 — 1 (3) 2 (1) 4 (1) 3
Total reclassifications to net income 1 — 1 (10) 4 (6) 2 (1) 1 Net unrealized gain (loss) on cash flow hedges 6 (1) 5 6 (3) 3 (13) 3 (10) Total other comprehensive income (loss) $ 1,944 $ (284) $ 1,660 $ 769 $ (143) $ 626 $ (815) $ (8) $ (823)
(a) Includes the impact of hedges of net investments in foreign subsidiaries. See Note 23 for additional information.(b) The reclassification adjustment related to the unrealized gain (loss) on assets available-for-sale is recorded as net securities gains on the consolidated
income statement. The amortization of prior service credit, net loss and initial obligation included in net periodic benefit cost is recorded as other expense on the consolidated income statement.
Changes in accumulated other comprehensive income (loss) attributable to The Bank of New York Mellon Corporation shareholders
Unrealized gain (loss) on assets
available-for-sale
Unrealized gain (loss) on
cash flow hedges
Total accumulatedother comprehensive
income (loss), net of tax(in millions)
Foreign currency
translation Pensions
Other post-retirement
benefits2017 ending balance $ (1,613) $ (887) $ (50) $ 186 $ 7 $ (2,357) Adjustment for the cumulative effect of applying
ASU 2017-12 for derivatives and hedging — — — (2) — (2) Adjusted balance at Jan. 1, 2018 (1,613) (887) (50) 184 7 (2,359)
Change in 2018 (302) (118) (2) (380) (10) (812) 2018 ending balance $ (1,915) $ (1,005) $ (52) $ (196) $ (3) $ (3,171)
Adjustment for the cumulative effect of applying ASU 2018-02 for income taxes 115 (213) — 6 2 (90) Adjusted balance at Jan. 1, 2019 (1,800) (1,218) (52) (190) (1) (3,261)
Change in 2019 148 (57) 3 526 3 623 2019 ending balance (1,652) (1,275) (49) 336 2 (2,638) Impact of adopting ASU 2016-03, Financial
Instruments – Credit Losses — — — (5) — (5) Adjusted balance at Jan. 1, 2020 (1,652) (1,275) (49) 331 2 (2,643)
Change in 2020 506 (24) (6) 1,177 5 1,658 2020 ending balance $ (1,146) $ (1,299) $ (55) $ 1,508 $ 7 $ (985)
Notes to Consolidated Financial Statements (continued)
BNY Mellon 163
Note 17–Stock-based compensation
Our Long-Term Incentive Plans provide for the issuance of restricted stock, restricted stock units (“RSUs”) and other stock-based awards, including options, to employees and directors of BNY Mellon. At Dec. 31, 2020, under the Long-Term Incentive Plan approved in April 2019, we may issue 30,425,882 new stock-based awards, all of which may be issued as restricted stock or RSUs. Stock-based compensation expense related to retirement eligibility vesting totaled $43 million in 2020, $84 million in 2019 and $93 million in 2018.
Restricted stock, RSUs and Performance share units
Restricted stock and RSUs are granted under our long-term incentive plans at no cost to the recipient. These awards are subject to forfeiture until certain restrictions have lapsed, including continued employment, for a specified period. The recipient of a share of restricted stock is entitled to voting rights and generally is entitled to dividends on the common stock. An RSU entitles the recipient to receive a share of common stock after the applicable restrictions lapse. The recipient generally is entitled to receive cash payments equivalent to any dividends paid on the underlying common stock during the period the RSU is outstanding but does not receive voting rights.
The fair value of restricted stock and RSUs is equal to the fair market value of our common stock on the date of grant. The expense is recognized over the vesting period, which is generally zero to four years. The total compensation expense recognized for restricted stock and RSUs was $188 million in 2020, $222 million in 2019 and $270 million in 2018. The total income tax benefit recognized in the consolidated income statement related to compensation costs was $45 million in 2020, $53 million in 2019 and $65 million in 2018.
BNY Mellon’s Executive Committee members were granted a target award of 402,486 performance share units (“PSUs”) in 2020, 576,855 in 2019 and 362,798 in 2018. The awards cliff vest in three years with the number of shares that vest determined based on a payout table that references performance conditions related to average revenue growth and average operating margin, both as adjusted and subject to Human Resources and Compensation Committee discretion. These awards are classified as equity and
marked-to-market to earnings as a result of this discretion. The following table summarizes our non-vested PSU, restricted stock and RSU activity for 2020.
Non-vested PSU, restricted stock and RSU activity
Number ofshares (a)
Weighted-average fair
value at grant date
Non-vested PSUs, restricted stock and RSUs at Dec. 31, 2019 12,733,298 $ 50.77
Granted 6,158,398 45.52 Vested (5,451,413) 48.36 Forfeited (903,384) 49.29 Non-vested PSUs, restricted stock and RSUs at Dec. 31, 2020 12,536,899 $ 49.35
(a) Includes dividend shares earned on the Executive Committee PSUs and Board of Director’s stock awards.
As of Dec. 31, 2020, $238 million of total unrecognized compensation costs related to non-vested PSUs, restricted stock and RSUs is expected to be recognized over a weighted-average period of 2.3 years. The total fair value of restricted stock, RSUs and PSUs that vested was $263 million in 2020, $278 million in 2019 and $289 million in 2018. The actual excess tax benefit (expense) realized for the tax deductions from shares vested totaled $(4) million in 2020, $11 million in 2019 and $26 million in 2018. The tax benefits were recognized in the provision for income taxes. Subsidiary Long-Term Incentive Plans BNY Mellon also has several subsidiary Long-Term Incentive Plans which have issued restricted subsidiary shares to certain employees. These share awards are subject to forfeiture until certain restrictions have lapsed, including continued employment for a specified period of time. The shares are generally non-voting and non-dividend paying. Once the restrictions lapse, which generally occurs in three to five years, the shares can only be sold, at the option of the employee, to BNY Mellon at a price based generally on the fair value of the subsidiary at the time of repurchase. In certain instances BNY Mellon has an election to call the shares.
Stock options
Our Long-Term Incentive Plans provide for the issuance of stock options at fair market value at the
Notes to Consolidated Financial Statements (continued)
164 BNY Mellon
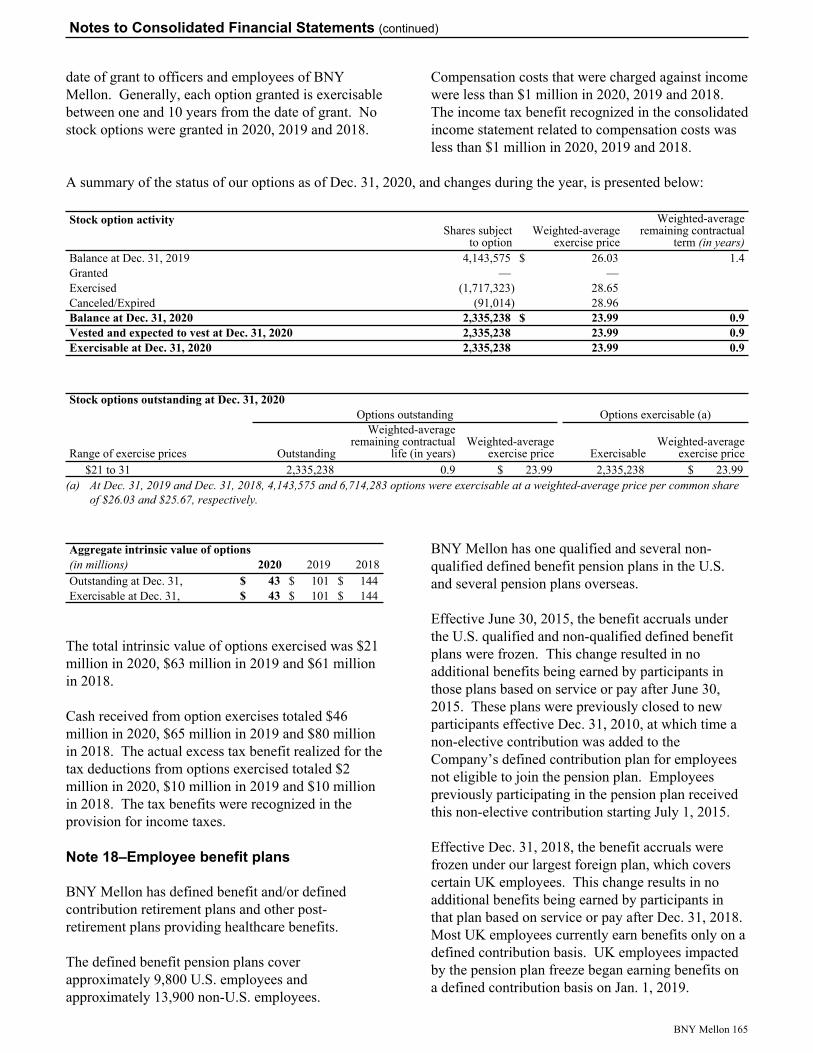
date of grant to officers and employees of BNY Mellon. Generally, each option granted is exercisable between one and 10 years from the date of grant. No stock options were granted in 2020, 2019 and 2018.
Compensation costs that were charged against income were less than $1 million in 2020, 2019 and 2018. The income tax benefit recognized in the consolidated income statement related to compensation costs was less than $1 million in 2020, 2019 and 2018.
A summary of the status of our options as of Dec. 31, 2020, and changes during the year, is presented below:
Stock option activityShares subject
to optionWeighted-average
exercise price
Weighted-average remaining contractual
term (in years)Balance at Dec. 31, 2019 4,143,575 $ 26.03 1.4Granted — — Exercised (1,717,323) 28.65 Canceled/Expired (91,014) 28.96 Balance at Dec. 31, 2020 2,335,238 $ 23.99 0.9Vested and expected to vest at Dec. 31, 2020 2,335,238 23.99 0.9Exercisable at Dec. 31, 2020 2,335,238 23.99 0.9
Stock options outstanding at Dec. 31, 2020Options outstanding Options exercisable (a)
Range of exercise prices Outstanding
Weighted-average remaining contractual
life (in years)Weighted-average
exercise price ExercisableWeighted-average
exercise price$21 to 31 2,335,238 0.9 $ 23.99 2,335,238 $ 23.99
(a) At Dec. 31, 2019 and Dec. 31, 2018, 4,143,575 and 6,714,283 options were exercisable at a weighted-average price per common share of $26.03 and $25.67, respectively.
Aggregate intrinsic value of options(in millions) 2020 2019 2018Outstanding at Dec. 31, $ 43 $ 101 $ 144 Exercisable at Dec. 31, $ 43 $ 101 $ 144
The total intrinsic value of options exercised was $21 million in 2020, $63 million in 2019 and $61 million in 2018.
Cash received from option exercises totaled $46 million in 2020, $65 million in 2019 and $80 million in 2018. The actual excess tax benefit realized for the tax deductions from options exercised totaled $2 million in 2020, $10 million in 2019 and $10 million in 2018. The tax benefits were recognized in the provision for income taxes.
Note 18–Employee benefit plans
BNY Mellon has defined benefit and/or defined contribution retirement plans and other post-retirement plans providing healthcare benefits.
The defined benefit pension plans cover approximately 9,800 U.S. employees and approximately 13,900 non-U.S. employees.
BNY Mellon has one qualified and several non-qualified defined benefit pension plans in the U.S. and several pension plans overseas.
Effective June 30, 2015, the benefit accruals under the U.S. qualified and non-qualified defined benefit plans were frozen. This change resulted in no additional benefits being earned by participants in those plans based on service or pay after June 30, 2015. These plans were previously closed to new participants effective Dec. 31, 2010, at which time a non-elective contribution was added to the Company’s defined contribution plan for employees not eligible to join the pension plan. Employees previously participating in the pension plan received this non-elective contribution starting July 1, 2015.
Effective Dec. 31, 2018, the benefit accruals were frozen under our largest foreign plan, which covers certain UK employees. This change results in no additional benefits being earned by participants in that plan based on service or pay after Dec. 31, 2018. Most UK employees currently earn benefits only on a defined contribution basis. UK employees impacted by the pension plan freeze began earning benefits on a defined contribution basis on Jan. 1, 2019.
Notes to Consolidated Financial Statements (continued)
BNY Mellon 165
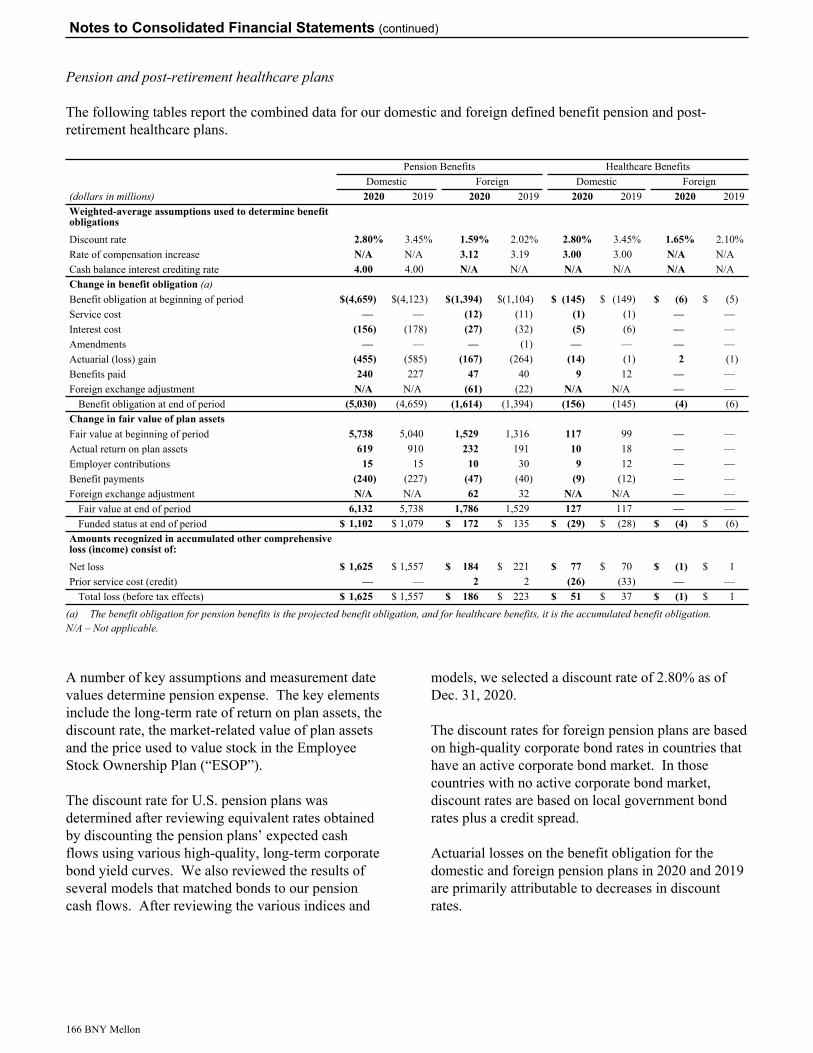
Pension and post-retirement healthcare plans
The following tables report the combined data for our domestic and foreign defined benefit pension and post-retirement healthcare plans.
Pension Benefits Healthcare BenefitsDomestic Foreign Domestic Foreign
(dollars in millions) 2020 2019 2020 2019 2020 2019 2020 2019Weighted-average assumptions used to determine benefit obligationsDiscount rate 2.80% 3.45% 1.59% 2.02% 2.80% 3.45% 1.65% 2.10% Rate of compensation increase N/A N/A 3.12 3.19 3.00 3.00 N/A N/ACash balance interest crediting rate 4.00 4.00 N/A N/A N/A N/A N/A N/AChange in benefit obligation (a)Benefit obligation at beginning of period $ (4,659) $ (4,123) $ (1,394) $ (1,104) $ (145) $ (149) $ (6) $ (5) Service cost — — (12) (11) (1) (1) — — Interest cost (156) (178) (27) (32) (5) (6) — — Amendments — — — (1) — — — — Actuarial (loss) gain (455) (585) (167) (264) (14) (1) 2 (1) Benefits paid 240 227 47 40 9 12 — — Foreign exchange adjustment N/A N/A (61) (22) N/A N/A — —
Benefit obligation at end of period (5,030) (4,659) (1,614) (1,394) (156) (145) (4) (6) Change in fair value of plan assetsFair value at beginning of period 5,738 5,040 1,529 1,316 117 99 — — Actual return on plan assets 619 910 232 191 10 18 — — Employer contributions 15 15 10 30 9 12 — — Benefit payments (240) (227) (47) (40) (9) (12) — — Foreign exchange adjustment N/A N/A 62 32 N/A N/A — —
Fair value at end of period 6,132 5,738 1,786 1,529 127 117 — — Funded status at end of period $ 1,102 $ 1,079 $ 172 $ 135 $ (29) $ (28) $ (4) $ (6)
Amounts recognized in accumulated other comprehensive loss (income) consist of:Net loss $ 1,625 $ 1,557 $ 184 $ 221 $ 77 $ 70 $ (1) $ 1 Prior service cost (credit) — — 2 2 (26) (33) — —
Total loss (before tax effects) $ 1,625 $ 1,557 $ 186 $ 223 $ 51 $ 37 $ (1) $ 1
(a) The benefit obligation for pension benefits is the projected benefit obligation, and for healthcare benefits, it is the accumulated benefit obligation.N/A – Not applicable.
A number of key assumptions and measurement date values determine pension expense. The key elements include the long-term rate of return on plan assets, the discount rate, the market-related value of plan assets and the price used to value stock in the Employee Stock Ownership Plan (“ESOP”).
The discount rate for U.S. pension plans was determined after reviewing equivalent rates obtained by discounting the pension plans’ expected cash flows using various high-quality, long-term corporate bond yield curves. We also reviewed the results of several models that matched bonds to our pension cash flows. After reviewing the various indices and
models, we selected a discount rate of 2.80% as of Dec. 31, 2020.
The discount rates for foreign pension plans are based on high-quality corporate bond rates in countries that have an active corporate bond market. In those countries with no active corporate bond market, discount rates are based on local government bond rates plus a credit spread.
Actuarial losses on the benefit obligation for the domestic and foreign pension plans in 2020 and 2019 are primarily attributable to decreases in discount rates.
Notes to Consolidated Financial Statements (continued)
166 BNY Mellon
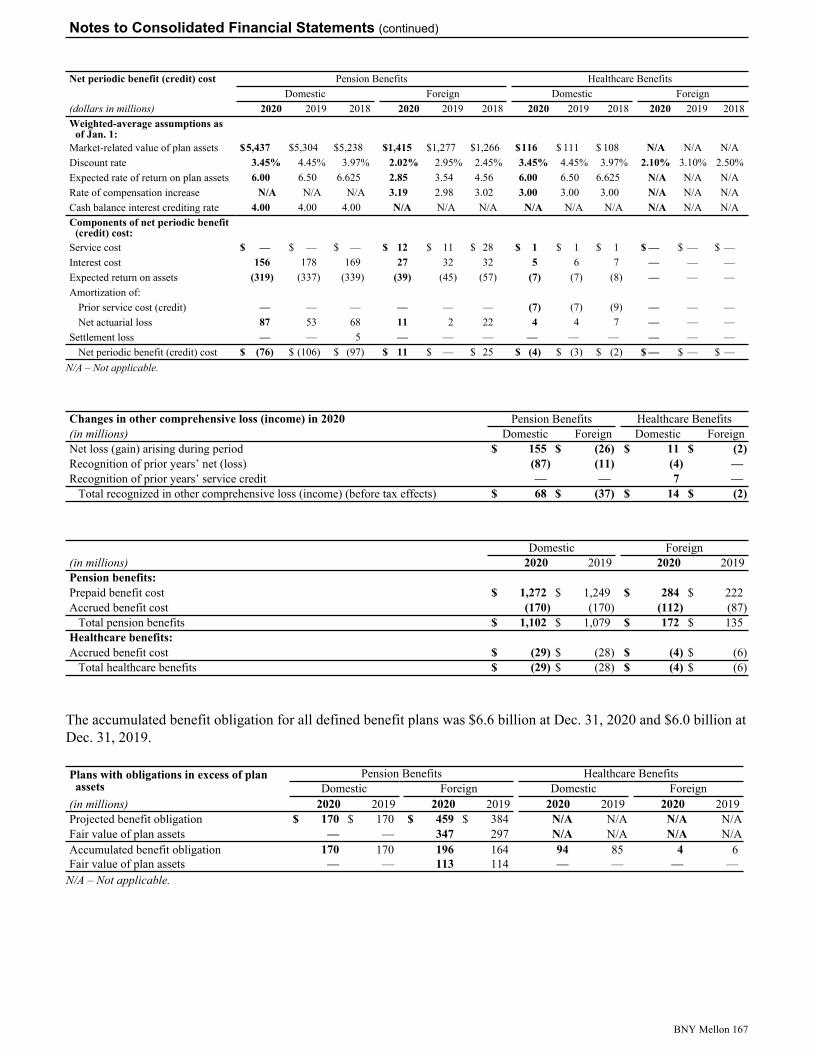
Net periodic benefit (credit) cost Pension Benefits Healthcare BenefitsDomestic Foreign Domestic Foreign
(dollars in millions) 2020 2019 2018 2020 2019 2018 2020 2019 2018 2020 2019 2018Weighted-average assumptions as
of Jan. 1:Market-related value of plan assets $ 5,437 $ 5,304 $ 5,238 $ 1,415 $ 1,277 $ 1,266 $ 116 $ 111 $ 108 N/A N/A N/ADiscount rate 3.45% 4.45% 3.97% 2.02% 2.95% 2.45% 3.45% 4.45% 3.97% 2.10% 3.10% 2.50% Expected rate of return on plan assets 6.00 6.50 6.625 2.85 3.54 4.56 6.00 6.50 6.625 N/A N/A N/ARate of compensation increase N/A N/A N/A 3.19 2.98 3.02 3.00 3.00 3.00 N/A N/A N/ACash balance interest crediting rate 4.00 4.00 4.00 N/A N/A N/A N/A N/A N/A N/A N/A N/AComponents of net periodic benefit
(credit) cost:Service cost $ — $ — $ — $ 12 $ 11 $ 28 $ 1 $ 1 $ 1 $ — $ — $ — Interest cost 156 178 169 27 32 32 5 6 7 — — — Expected return on assets (319) (337) (339) (39) (45) (57) (7) (7) (8) — — — Amortization of:
Prior service cost (credit) — — — — — — (7) (7) (9) — — — Net actuarial loss 87 53 68 11 2 22 4 4 7 — — —
Settlement loss — — 5 — — — — — — — — — Net periodic benefit (credit) cost $ (76) $ (106) $ (97) $ 11 $ — $ 25 $ (4) $ (3) $ (2) $ — $ — $ —
N/A – Not applicable.
Changes in other comprehensive loss (income) in 2020 Pension Benefits Healthcare Benefits(in millions) Domestic Foreign Domestic ForeignNet loss (gain) arising during period $ 155 $ (26) $ 11 $ (2) Recognition of prior years’ net (loss) (87) (11) (4) — Recognition of prior years’ service credit — — 7 —
Total recognized in other comprehensive loss (income) (before tax effects) $ 68 $ (37) $ 14 $ (2)
Domestic Foreign(in millions) 2020 2019 2020 2019Pension benefits:Prepaid benefit cost $ 1,272 $ 1,249 $ 284 $ 222 Accrued benefit cost (170) (170) (112) (87)
Total pension benefits $ 1,102 $ 1,079 $ 172 $ 135 Healthcare benefits:Accrued benefit cost $ (29) $ (28) $ (4) $ (6)
Total healthcare benefits $ (29) $ (28) $ (4) $ (6)
The accumulated benefit obligation for all defined benefit plans was $6.6 billion at Dec. 31, 2020 and $6.0 billion at Dec. 31, 2019.
Plans with obligations in excess of plan assets
Pension Benefits Healthcare BenefitsDomestic Foreign Domestic Foreign
(in millions) 2020 2019 2020 2019 2020 2019 2020 2019Projected benefit obligation $ 170 $ 170 $ 459 $ 384 N/A N/A N/A N/AFair value of plan assets — — 347 297 N/A N/A N/A N/AAccumulated benefit obligation 170 170 196 164 94 85 4 6 Fair value of plan assets — — 113 114 — — — —
N/A – Not applicable.
Notes to Consolidated Financial Statements (continued)
BNY Mellon 167
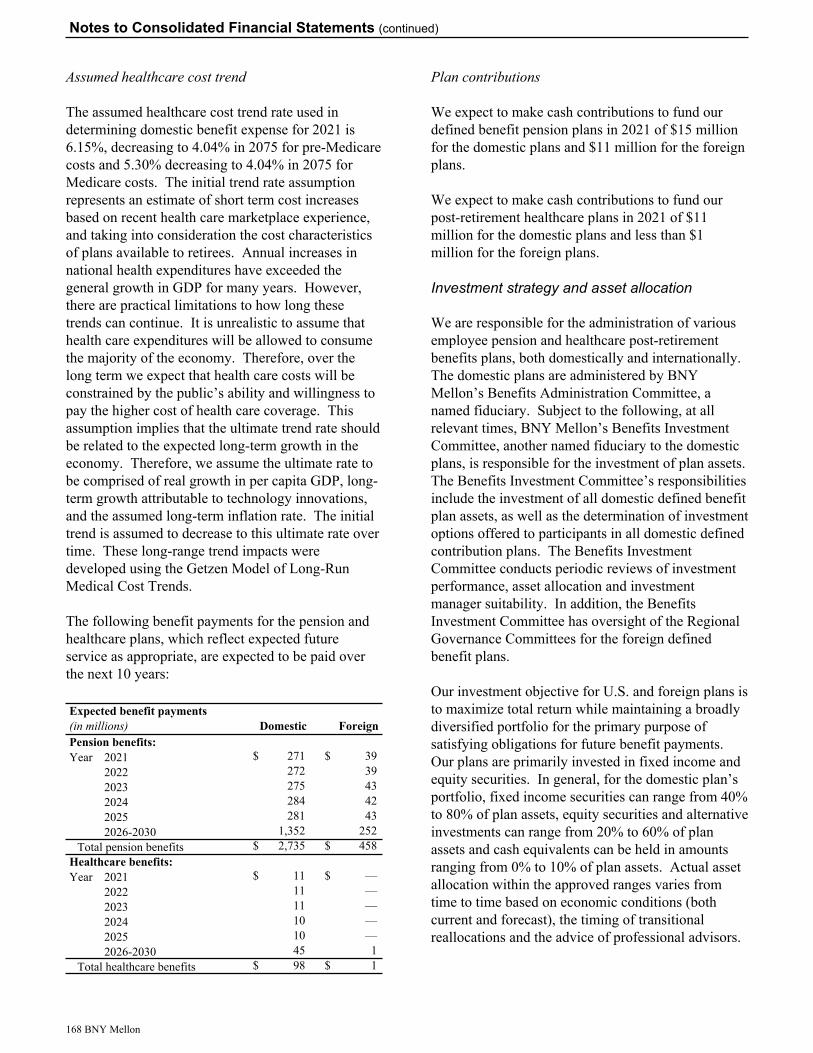
Assumed healthcare cost trend
The assumed healthcare cost trend rate used in determining domestic benefit expense for 2021 is 6.15%, decreasing to 4.04% in 2075 for pre-Medicare costs and 5.30% decreasing to 4.04% in 2075 for Medicare costs. The initial trend rate assumption represents an estimate of short term cost increases based on recent health care marketplace experience, and taking into consideration the cost characteristics of plans available to retirees. Annual increases in national health expenditures have exceeded the general growth in GDP for many years. However, there are practical limitations to how long these trends can continue. It is unrealistic to assume that health care expenditures will be allowed to consume the majority of the economy. Therefore, over the long term we expect that health care costs will be constrained by the public’s ability and willingness to pay the higher cost of health care coverage. This assumption implies that the ultimate trend rate should be related to the expected long-term growth in the economy. Therefore, we assume the ultimate rate to be comprised of real growth in per capita GDP, long-term growth attributable to technology innovations, and the assumed long-term inflation rate. The initial trend is assumed to decrease to this ultimate rate over time. These long-range trend impacts were developed using the Getzen Model of Long-Run Medical Cost Trends.
The following benefit payments for the pension and healthcare plans, which reflect expected future service as appropriate, are expected to be paid over the next 10 years:
Expected benefit payments(in millions) Domestic ForeignPension benefits:Year 2021 $ 271 $ 39
2022 272 39 2023 275 43 2024 284 42 2025 281 43 2026-2030 1,352 252
Total pension benefits $ 2,735 $ 458 Healthcare benefits:Year 2021 $ 11 $ —
2022 11 — 2023 11 — 2024 10 — 2025 10 — 2026-2030 45 1
Total healthcare benefits $ 98 $ 1
Plan contributions
We expect to make cash contributions to fund our defined benefit pension plans in 2021 of $15 million for the domestic plans and $11 million for the foreign plans.
We expect to make cash contributions to fund our post-retirement healthcare plans in 2021 of $11 million for the domestic plans and less than $1 million for the foreign plans.
Investment strategy and asset allocation
We are responsible for the administration of various employee pension and healthcare post-retirement benefits plans, both domestically and internationally. The domestic plans are administered by BNY Mellon’s Benefits Administration Committee, a named fiduciary. Subject to the following, at all relevant times, BNY Mellon’s Benefits Investment Committee, another named fiduciary to the domestic plans, is responsible for the investment of plan assets. The Benefits Investment Committee’s responsibilities include the investment of all domestic defined benefit plan assets, as well as the determination of investment options offered to participants in all domestic defined contribution plans. The Benefits Investment Committee conducts periodic reviews of investment performance, asset allocation and investment manager suitability. In addition, the Benefits Investment Committee has oversight of the Regional Governance Committees for the foreign defined benefit plans.
Our investment objective for U.S. and foreign plans is to maximize total return while maintaining a broadly diversified portfolio for the primary purpose of satisfying obligations for future benefit payments. Our plans are primarily invested in fixed income and equity securities. In general, for the domestic plan’s portfolio, fixed income securities can range from 40% to 80% of plan assets, equity securities and alternative investments can range from 20% to 60% of plan assets and cash equivalents can be held in amounts ranging from 0% to 10% of plan assets. Actual asset allocation within the approved ranges varies from time to time based on economic conditions (both current and forecast), the timing of transitional reallocations and the advice of professional advisors.
Notes to Consolidated Financial Statements (continued)
168 BNY Mellon
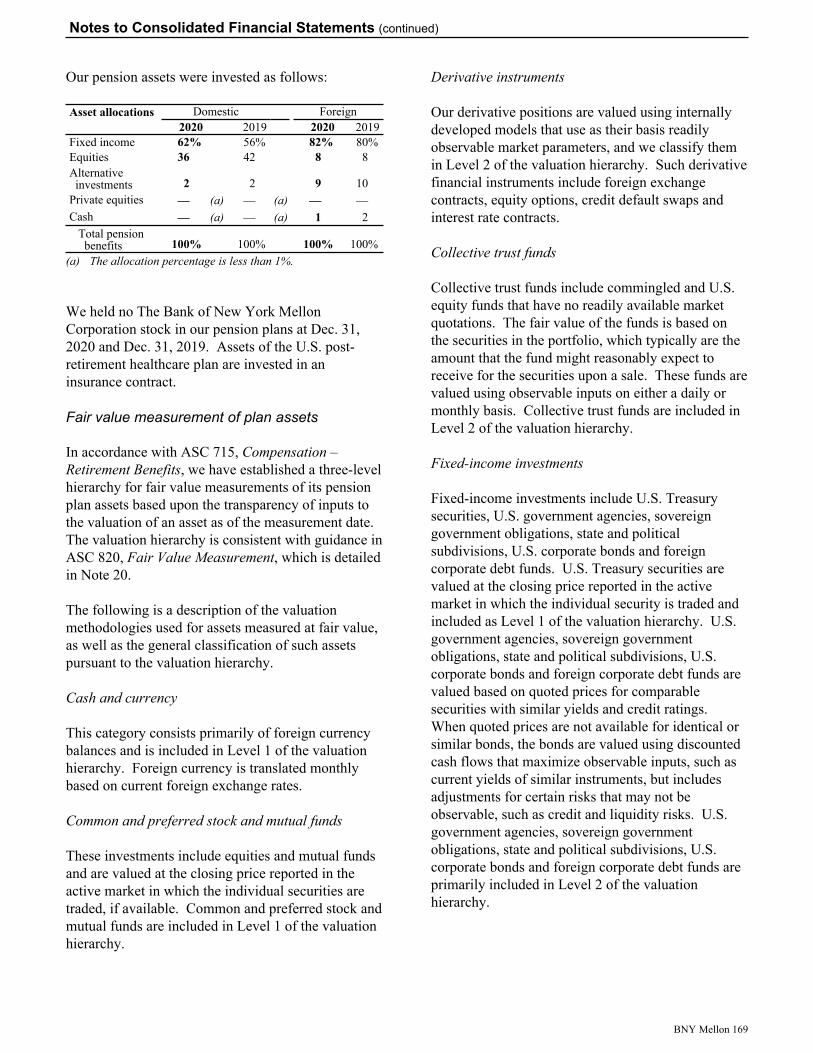
Our pension assets were invested as follows:
Asset allocations Domestic Foreign2020 2019 2020 2019
Fixed income 62% 56% 82% 80% Equities 36 42 8 8 Alternative investments 2 2 9 10
Private equities — (a) — (a) — — Cash — (a) — (a) 1 2
Total pension benefits 100% 100% 100% 100%
(a) The allocation percentage is less than 1%.
We held no The Bank of New York Mellon Corporation stock in our pension plans at Dec. 31, 2020 and Dec. 31, 2019. Assets of the U.S. post-retirement healthcare plan are invested in an insurance contract.
Fair value measurement of plan assets
In accordance with ASC 715, Compensation – Retirement Benefits, we have established a three-level hierarchy for fair value measurements of its pension plan assets based upon the transparency of inputs to the valuation of an asset as of the measurement date. The valuation hierarchy is consistent with guidance in ASC 820, Fair Value Measurement, which is detailed in Note 20.
The following is a description of the valuation methodologies used for assets measured at fair value, as well as the general classification of such assets pursuant to the valuation hierarchy.
Cash and currency
This category consists primarily of foreign currency balances and is included in Level 1 of the valuation hierarchy. Foreign currency is translated monthly based on current foreign exchange rates.
Common and preferred stock and mutual funds
These investments include equities and mutual funds and are valued at the closing price reported in the active market in which the individual securities are traded, if available. Common and preferred stock and mutual funds are included in Level 1 of the valuation hierarchy.
Derivative instruments
Our derivative positions are valued using internally developed models that use as their basis readily observable market parameters, and we classify them in Level 2 of the valuation hierarchy. Such derivative financial instruments include foreign exchange contracts, equity options, credit default swaps and interest rate contracts.
Collective trust funds
Collective trust funds include commingled and U.S. equity funds that have no readily available market quotations. The fair value of the funds is based on the securities in the portfolio, which typically are the amount that the fund might reasonably expect to receive for the securities upon a sale. These funds are valued using observable inputs on either a daily or monthly basis. Collective trust funds are included in Level 2 of the valuation hierarchy.
Fixed-income investments
Fixed-income investments include U.S. Treasury securities, U.S. government agencies, sovereign government obligations, state and political subdivisions, U.S. corporate bonds and foreign corporate debt funds. U.S. Treasury securities are valued at the closing price reported in the active market in which the individual security is traded and included as Level 1 of the valuation hierarchy. U.S. government agencies, sovereign government obligations, state and political subdivisions, U.S. corporate bonds and foreign corporate debt funds are valued based on quoted prices for comparable securities with similar yields and credit ratings. When quoted prices are not available for identical or similar bonds, the bonds are valued using discounted cash flows that maximize observable inputs, such as current yields of similar instruments, but includes adjustments for certain risks that may not be observable, such as credit and liquidity risks. U.S. government agencies, sovereign government obligations, state and political subdivisions, U.S. corporate bonds and foreign corporate debt funds are primarily included in Level 2 of the valuation hierarchy.
Notes to Consolidated Financial Statements (continued)
BNY Mellon 169
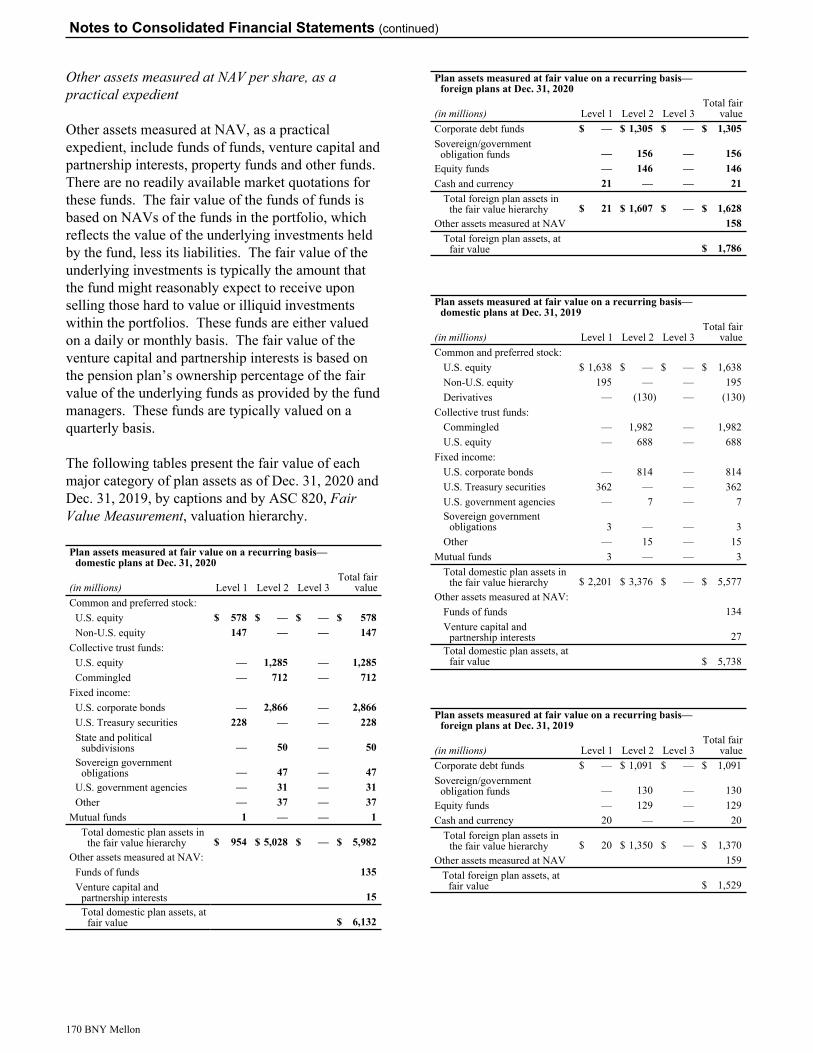
Other assets measured at NAV per share, as a practical expedient
Other assets measured at NAV, as a practical expedient, include funds of funds, venture capital and partnership interests, property funds and other funds. There are no readily available market quotations for these funds. The fair value of the funds of funds is based on NAVs of the funds in the portfolio, which reflects the value of the underlying investments held by the fund, less its liabilities. The fair value of the underlying investments is typically the amount that the fund might reasonably expect to receive upon selling those hard to value or illiquid investments within the portfolios. These funds are either valued on a daily or monthly basis. The fair value of the venture capital and partnership interests is based on the pension plan’s ownership percentage of the fair value of the underlying funds as provided by the fund managers. These funds are typically valued on a quarterly basis.
The following tables present the fair value of each major category of plan assets as of Dec. 31, 2020 and Dec. 31, 2019, by captions and by ASC 820, Fair Value Measurement, valuation hierarchy.
Plan assets measured at fair value on a recurring basis—domestic plans at Dec. 31, 2020
(in millions) Level 1 Level 2 Level 3Total fair
valueCommon and preferred stock:
U.S. equity $ 578 $ — $ — $ 578 Non-U.S. equity 147 — — 147
Collective trust funds:U.S. equity — 1,285 — 1,285 Commingled — 712 — 712
Fixed income:U.S. corporate bonds — 2,866 — 2,866 U.S. Treasury securities 228 — — 228 State and political
subdivisions — 50 — 50 Sovereign government
obligations — 47 — 47 U.S. government agencies — 31 — 31 Other — 37 — 37
Mutual funds 1 — — 1 Total domestic plan assets in
the fair value hierarchy $ 954 $ 5,028 $ — $ 5,982 Other assets measured at NAV:
Funds of funds 135 Venture capital and
partnership interests 15 Total domestic plan assets, at
fair value $ 6,132
Plan assets measured at fair value on a recurring basis—foreign plans at Dec. 31, 2020
(in millions) Level 1 Level 2 Level 3Total fair
valueCorporate debt funds $ — $ 1,305 $ — $ 1,305 Sovereign/government
obligation funds — 156 — 156 Equity funds — 146 — 146 Cash and currency 21 — — 21
Total foreign plan assets in the fair value hierarchy $ 21 $ 1,607 $ — $ 1,628
Other assets measured at NAV 158 Total foreign plan assets, at
fair value $ 1,786
Plan assets measured at fair value on a recurring basis—domestic plans at Dec. 31, 2019
(in millions) Level 1 Level 2 Level 3Total fair
valueCommon and preferred stock:
U.S. equity $ 1,638 $ — $ — $ 1,638 Non-U.S. equity 195 — — 195 Derivatives — (130) — (130)
Collective trust funds:Commingled — 1,982 — 1,982 U.S. equity — 688 — 688
Fixed income:U.S. corporate bonds — 814 — 814 U.S. Treasury securities 362 — — 362 U.S. government agencies — 7 — 7 Sovereign government
obligations 3 — — 3 Other — 15 — 15
Mutual funds 3 — — 3 Total domestic plan assets in
the fair value hierarchy $ 2,201 $ 3,376 $ — $ 5,577 Other assets measured at NAV:
Funds of funds 134 Venture capital and
partnership interests 27 Total domestic plan assets, at
fair value $ 5,738
Plan assets measured at fair value on a recurring basis—foreign plans at Dec. 31, 2019
(in millions) Level 1 Level 2 Level 3Total fair
valueCorporate debt funds $ — $ 1,091 $ — $ 1,091 Sovereign/government
obligation funds — 130 — 130 Equity funds — 129 — 129 Cash and currency 20 — — 20
Total foreign plan assets in the fair value hierarchy $ 20 $ 1,350 $ — $ 1,370
Other assets measured at NAV 159 Total foreign plan assets, at
fair value $ 1,529
Notes to Consolidated Financial Statements (continued)
170 BNY Mellon
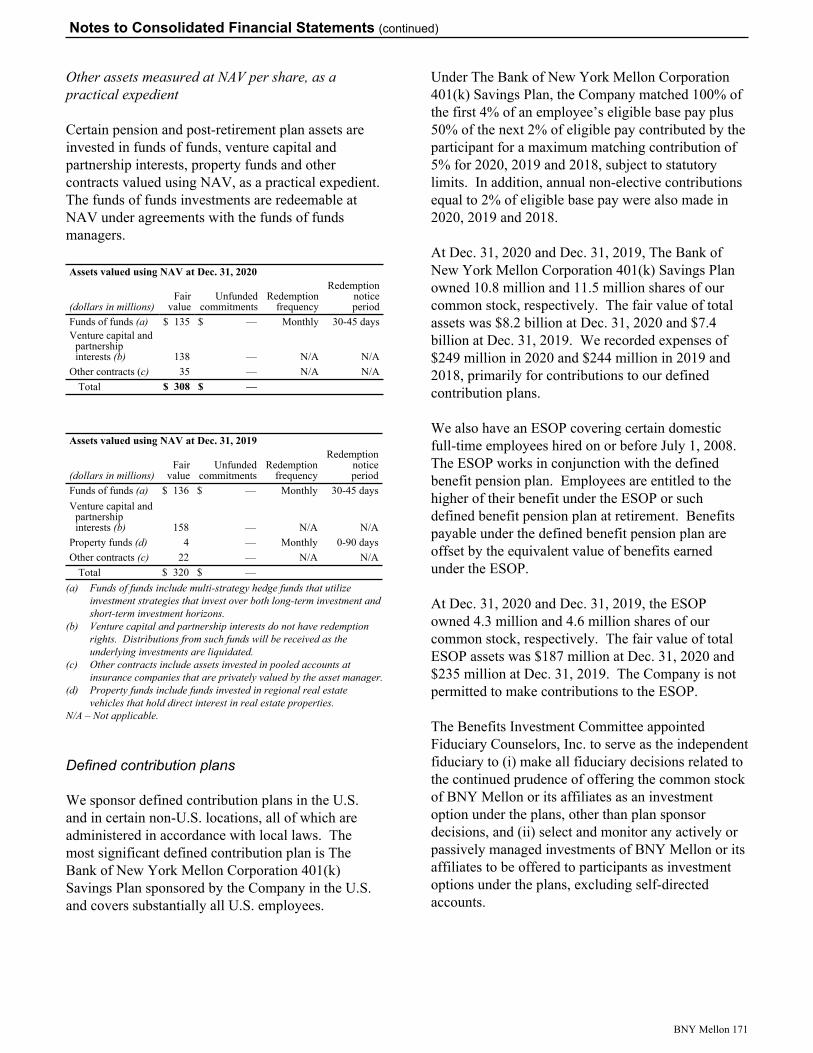
Other assets measured at NAV per share, as a practical expedient
Certain pension and post-retirement plan assets are invested in funds of funds, venture capital and partnership interests, property funds and other contracts valued using NAV, as a practical expedient. The funds of funds investments are redeemable at NAV under agreements with the funds of funds managers.
Assets valued using NAV at Dec. 31, 2020
(dollars in millions)Fair
valueUnfunded
commitmentsRedemption
frequency
Redemption notice period
Funds of funds (a) $ 135 $ — Monthly 30-45 daysVenture capital and
partnership interests (b) 138 — N/A N/A
Other contracts (c) 35 — N/A N/ATotal $ 308 $ —
Assets valued using NAV at Dec. 31, 2019
(dollars in millions)Fair
valueUnfunded
commitmentsRedemption
frequency
Redemption notice period
Funds of funds (a) $ 136 $ — Monthly 30-45 daysVenture capital and
partnership interests (b) 158 — N/A N/A
Property funds (d) 4 — Monthly 0-90 daysOther contracts (c) 22 — N/A N/A
Total $ 320 $ — (a) Funds of funds include multi-strategy hedge funds that utilize
investment strategies that invest over both long-term investment and short-term investment horizons.
(b) Venture capital and partnership interests do not have redemption rights. Distributions from such funds will be received as the underlying investments are liquidated.
(c) Other contracts include assets invested in pooled accounts at insurance companies that are privately valued by the asset manager.
(d) Property funds include funds invested in regional real estate vehicles that hold direct interest in real estate properties.
N/A – Not applicable.
Defined contribution plans
We sponsor defined contribution plans in the U.S. and in certain non-U.S. locations, all of which are administered in accordance with local laws. The most significant defined contribution plan is The Bank of New York Mellon Corporation 401(k) Savings Plan sponsored by the Company in the U.S. and covers substantially all U.S. employees.
Under The Bank of New York Mellon Corporation 401(k) Savings Plan, the Company matched 100% of the first 4% of an employee’s eligible base pay plus 50% of the next 2% of eligible pay contributed by the participant for a maximum matching contribution of 5% for 2020, 2019 and 2018, subject to statutory limits. In addition, annual non-elective contributions equal to 2% of eligible base pay were also made in 2020, 2019 and 2018.
At Dec. 31, 2020 and Dec. 31, 2019, The Bank of New York Mellon Corporation 401(k) Savings Plan owned 10.8 million and 11.5 million shares of our common stock, respectively. The fair value of total assets was $8.2 billion at Dec. 31, 2020 and $7.4 billion at Dec. 31, 2019. We recorded expenses of $249 million in 2020 and $244 million in 2019 and 2018, primarily for contributions to our defined contribution plans.
We also have an ESOP covering certain domestic full-time employees hired on or before July 1, 2008. The ESOP works in conjunction with the defined benefit pension plan. Employees are entitled to the higher of their benefit under the ESOP or such defined benefit pension plan at retirement. Benefits payable under the defined benefit pension plan are offset by the equivalent value of benefits earned under the ESOP.
At Dec. 31, 2020 and Dec. 31, 2019, the ESOP owned 4.3 million and 4.6 million shares of our common stock, respectively. The fair value of total ESOP assets was $187 million at Dec. 31, 2020 and $235 million at Dec. 31, 2019. The Company is not permitted to make contributions to the ESOP.
The Benefits Investment Committee appointed Fiduciary Counselors, Inc. to serve as the independent fiduciary to (i) make all fiduciary decisions related to the continued prudence of offering the common stock of BNY Mellon or its affiliates as an investment option under the plans, other than plan sponsor decisions, and (ii) select and monitor any actively or passively managed investments of BNY Mellon or its affiliates to be offered to participants as investment options under the plans, excluding self-directed accounts.
Notes to Consolidated Financial Statements (continued)
BNY Mellon 171

Note 19–Company financial information (Parent Corporation)
In connection with our single point of entry resolution strategy, we have established an intermediate holding company (“IHC”) to facilitate the provision of capital and liquidity resources to certain key subsidiaries in the event of material financial distress or failure. In 2017, we entered into a binding support agreement with those key subsidiaries and other related entities that requires the IHC to provide that support. The support agreement requires the Parent to transfer cash and other liquid financial assets to the IHC on an ongoing basis, subject to certain amounts retained by the Parent to meet its near-term cash needs. The Parent’s and the IHC’s obligations under the support agreement are secured. The IHC has provided unsecured subordinated funding notes to the Parent as well as a committed line of credit that allows the Parent to draw funds necessary to service near-term obligations. As a result, during business-as-usual circumstances, the Parent is expected to continue to have access to the funds necessary to pay dividends, repurchase common stock, service its debt and satisfy its other obligations. If our projected liquidity resources deteriorate so severely that resolution of the Parent becomes imminent, the committed line of credit the IHC provided to the Parent will automatically terminate, with all amounts outstanding becoming due and payable, and the support agreement will require the Parent to transfer most of its remaining assets (other than stock in subsidiaries and a cash reserve to fund bankruptcy expenses) to the IHC. As a result, during a period of severe financial stress, the Parent could become unable to meet its debt and payment obligations (including with respect to its securities), causing the Parent to seek protection under bankruptcy laws earlier than it otherwise would have.
Our bank subsidiaries are subject to dividend limitations under the federal and state banking laws. Under these statutes, prior regulatory consent is required for dividends in any year that would exceed the bank’s net profits for such year combined with retained net profits for the prior two years. Additionally, such bank subsidiaries may not declare dividends in excess of net profits on hand, as defined, after deducting the amount by which the principal amount of all loans, on which interest is past due for a period of six months or more, exceeds the allowance for credit losses.
The payment of dividends also is limited by minimum capital requirements and buffers imposed on banks. As of Dec. 31, 2020, our bank subsidiaries exceeded these requirements.
Subsequent to Dec. 31, 2020, our U.S. bank subsidiaries could declare dividends to the Parent of approximately $803 million, without the need for a regulatory waiver. In addition, at Dec. 31, 2020, non-bank subsidiaries of the Parent had liquid assets of approximately $1.6 billion.
The bank subsidiaries declared dividends of $1.5 billion in 2020, $3.2 billion in 2019 and $3.8 billion in 2018. The Federal Reserve and the Office of the Comptroller of the Currency have issued additional guidelines that require BHCs and national banks to continually evaluate the level of cash dividends in relation to their respective operating income, capital needs, asset quality and overall financial condition.
The Federal Reserve policy with respect to the payment of cash dividends by BHCs provides that, as a matter of prudent banking, a BHC should not maintain a rate of cash dividends unless its net income available to common shareholders has been sufficient to fully fund the dividends, and the prospective rate of earnings retention appears to be consistent with the holding company’s capital needs, asset quality and overall financial condition. The Federal Reserve can also prohibit a dividend if payment would constitute an unsafe or unsound banking practice.
In March 2020, we and the other members of the Financial Services Forum announced the temporary suspension of share repurchases until the end of the second quarter of 2020 to preserve capital and liquidity in order to further the objective of using capital and liquidity to support clients and customers. In June 2020, the Federal Reserve announced that it required participating CCAR firms, including us, to update and resubmit their capital plans and that, as a result, unless otherwise approved by the Federal Reserve, participating firms were not permitted to conduct open market common stock repurchases in the third quarter of 2020 or to increase their common stock dividends. In September 2020, the Federal Reserve extended the limitation on open market common stock repurchases and increases in common stock dividends through the fourth quarter of 2020.
Notes to Consolidated Financial Statements (continued)
172 BNY Mellon
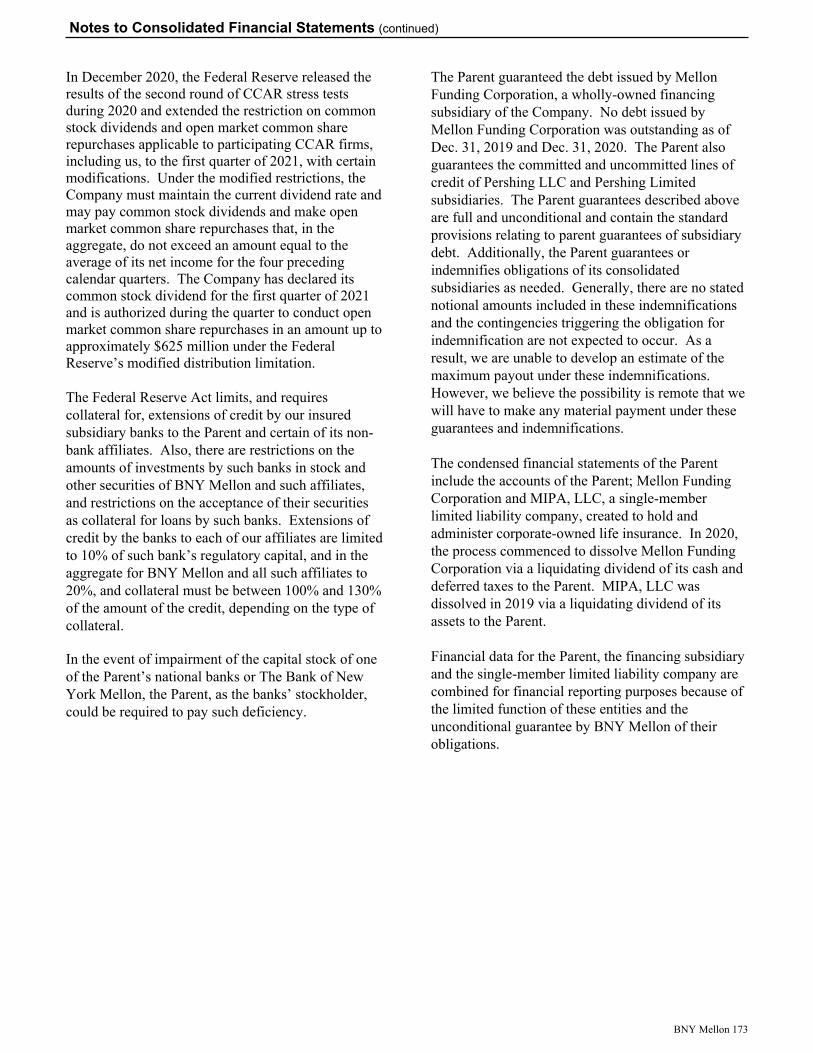
In December 2020, the Federal Reserve released the results of the second round of CCAR stress tests during 2020 and extended the restriction on common stock dividends and open market common share repurchases applicable to participating CCAR firms, including us, to the first quarter of 2021, with certain modifications. Under the modified restrictions, the Company must maintain the current dividend rate and may pay common stock dividends and make open market common share repurchases that, in the aggregate, do not exceed an amount equal to the average of its net income for the four preceding calendar quarters. The Company has declared its common stock dividend for the first quarter of 2021 and is authorized during the quarter to conduct open market common share repurchases in an amount up to approximately $625 million under the Federal Reserve’s modified distribution limitation.
The Federal Reserve Act limits, and requires collateral for, extensions of credit by our insured subsidiary banks to the Parent and certain of its non-bank affiliates. Also, there are restrictions on the amounts of investments by such banks in stock and other securities of BNY Mellon and such affiliates, and restrictions on the acceptance of their securities as collateral for loans by such banks. Extensions of credit by the banks to each of our affiliates are limited to 10% of such bank’s regulatory capital, and in the aggregate for BNY Mellon and all such affiliates to 20%, and collateral must be between 100% and 130% of the amount of the credit, depending on the type of collateral.
In the event of impairment of the capital stock of one of the Parent’s national banks or The Bank of New York Mellon, the Parent, as the banks’ stockholder, could be required to pay such deficiency.
The Parent guaranteed the debt issued by Mellon Funding Corporation, a wholly-owned financing subsidiary of the Company. No debt issued by Mellon Funding Corporation was outstanding as of Dec. 31, 2019 and Dec. 31, 2020. The Parent also guarantees the committed and uncommitted lines of credit of Pershing LLC and Pershing Limited subsidiaries. The Parent guarantees described above are full and unconditional and contain the standard provisions relating to parent guarantees of subsidiary debt. Additionally, the Parent guarantees or indemnifies obligations of its consolidated subsidiaries as needed. Generally, there are no stated notional amounts included in these indemnifications and the contingencies triggering the obligation for indemnification are not expected to occur. As a result, we are unable to develop an estimate of the maximum payout under these indemnifications. However, we believe the possibility is remote that we will have to make any material payment under these guarantees and indemnifications.
The condensed financial statements of the Parent include the accounts of the Parent; Mellon Funding Corporation and MIPA, LLC, a single-member limited liability company, created to hold and administer corporate-owned life insurance. In 2020, the process commenced to dissolve Mellon Funding Corporation via a liquidating dividend of its cash and deferred taxes to the Parent. MIPA, LLC was dissolved in 2019 via a liquidating dividend of its assets to the Parent.
Financial data for the Parent, the financing subsidiary and the single-member limited liability company are combined for financial reporting purposes because of the limited function of these entities and the unconditional guarantee by BNY Mellon of their obligations.
Notes to Consolidated Financial Statements (continued)
BNY Mellon 173
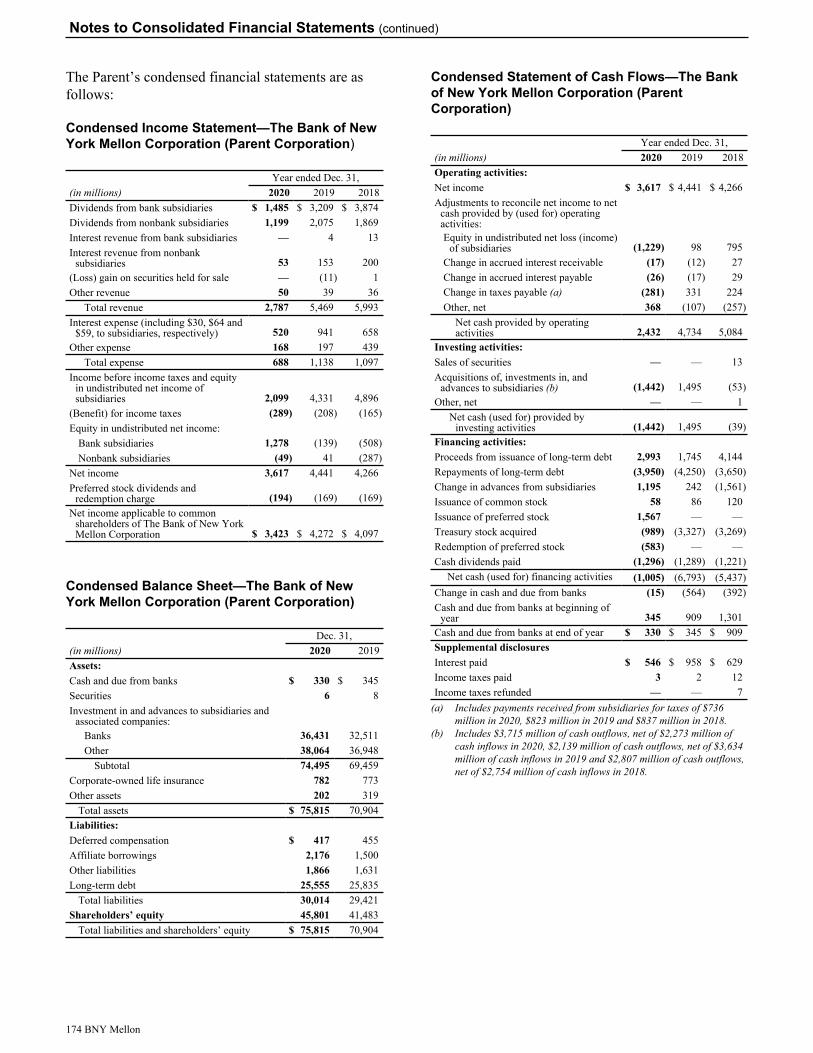
The Parent’s condensed financial statements are as follows:
Condensed Income Statement—The Bank of New York Mellon Corporation (Parent Corporation)
Year ended Dec. 31,(in millions) 2020 2019 2018Dividends from bank subsidiaries $ 1,485 $ 3,209 $ 3,874 Dividends from nonbank subsidiaries 1,199 2,075 1,869 Interest revenue from bank subsidiaries — 4 13 Interest revenue from nonbank
subsidiaries 53 153 200 (Loss) gain on securities held for sale — (11) 1 Other revenue 50 39 36
Total revenue 2,787 5,469 5,993 Interest expense (including $30, $64 and
$59, to subsidiaries, respectively) 520 941 658 Other expense 168 197 439
Total expense 688 1,138 1,097 Income before income taxes and equity
in undistributed net income of subsidiaries 2,099 4,331 4,896
(Benefit) for income taxes (289) (208) (165) Equity in undistributed net income:
Bank subsidiaries 1,278 (139) (508) Nonbank subsidiaries (49) 41 (287)
Net income 3,617 4,441 4,266 Preferred stock dividends and
redemption charge (194) (169) (169) Net income applicable to common
shareholders of The Bank of New York Mellon Corporation $ 3,423 $ 4,272 $ 4,097
Condensed Balance Sheet—The Bank of New York Mellon Corporation (Parent Corporation)
Dec. 31,(in millions) 2020 2019Assets:Cash and due from banks $ 330 $ 345 Securities 6 8 Investment in and advances to subsidiaries and
associated companies:Banks 36,431 32,511 Other 38,064 36,948
Subtotal 74,495 69,459 Corporate-owned life insurance 782 773 Other assets 202 319
Total assets $ 75,815 70,904 Liabilities:Deferred compensation $ 417 455 Affiliate borrowings 2,176 1,500 Other liabilities 1,866 1,631 Long-term debt 25,555 25,835
Total liabilities 30,014 29,421 Shareholders’ equity 45,801 41,483
Total liabilities and shareholders’ equity $ 75,815 70,904
Condensed Statement of Cash Flows—The Bank of New York Mellon Corporation (Parent Corporation)
Year ended Dec. 31,(in millions) 2020 2019 2018Operating activities:Net income $ 3,617 $ 4,441 $ 4,266 Adjustments to reconcile net income to net
cash provided by (used for) operating activities:Equity in undistributed net loss (income)
of subsidiaries (1,229) 98 795 Change in accrued interest receivable (17) (12) 27 Change in accrued interest payable (26) (17) 29 Change in taxes payable (a) (281) 331 224 Other, net 368 (107) (257)
Net cash provided by operating activities 2,432 4,734 5,084
Investing activities:Sales of securities — — 13 Acquisitions of, investments in, and
advances to subsidiaries (b) (1,442) 1,495 (53) Other, net — — 1
Net cash (used for) provided by investing activities (1,442) 1,495 (39)
Financing activities:Proceeds from issuance of long-term debt 2,993 1,745 4,144 Repayments of long-term debt (3,950) (4,250) (3,650) Change in advances from subsidiaries 1,195 242 (1,561) Issuance of common stock 58 86 120 Issuance of preferred stock 1,567 — — Treasury stock acquired (989) (3,327) (3,269) Redemption of preferred stock (583) — — Cash dividends paid (1,296) (1,289) (1,221)
Net cash (used for) financing activities (1,005) (6,793) (5,437) Change in cash and due from banks (15) (564) (392) Cash and due from banks at beginning of
year 345 909 1,301 Cash and due from banks at end of year $ 330 $ 345 $ 909 Supplemental disclosuresInterest paid $ 546 $ 958 $ 629 Income taxes paid 3 2 12 Income taxes refunded — — 7
(a) Includes payments received from subsidiaries for taxes of $736 million in 2020, $823 million in 2019 and $837 million in 2018.
(b) Includes $3,715 million of cash outflows, net of $2,273 million of cash inflows in 2020, $2,139 million of cash outflows, net of $3,634 million of cash inflows in 2019 and $2,807 million of cash outflows, net of $2,754 million of cash inflows in 2018.
Notes to Consolidated Financial Statements (continued)
174 BNY Mellon

Note 20–Fair value measurement
Fair value is defined as the price that would be received to sell an asset, or paid to transfer a liability, in an orderly transaction between market participants at the measurement date. A three-level hierarchy for fair value measurements is utilized based upon the transparency of inputs to the valuation of an asset or liability as of the measurement date. BNY Mellon’s own creditworthiness is considered when valuing liabilities.
Fair value focuses on exit price in an orderly transaction (that is, not a forced liquidation or distressed sale) between market participants at the measurement date under current market conditions. If there has been a significant decrease in the volume and level of activity for the asset or liability, a change in valuation technique or the use of multiple valuation techniques may be appropriate. In such instances, determining the price at which willing market participants would transact at the measurement date under current market conditions depends on the facts and circumstances and requires the use of significant judgment. The objective is to determine from weighted indicators of fair value a reasonable point within the range that is most representative of fair value under current market conditions.
Determination of fair value
We have established processes for determining fair values. Fair value is based upon quoted market prices in active markets, where available. For financial instruments where quotes from recent exchange transactions are not available, we determine fair value based on discounted cash flow analysis, comparison to similar instruments and the use of financial models. Discounted cash flow analysis is dependent upon estimated future cash flows and the level of interest rates. Model-based pricing uses inputs of observable prices, where available, for interest rates, foreign exchange rates, option volatilities and other factors. Models are benchmarked and validated by an independent internal risk management function. Our valuation process takes into consideration factors such as counterparty credit quality, liquidity, concentration concerns and observability of model parameters. Valuation adjustments may be made to record financial instruments at fair value.
Most derivative contracts are valued using models which are calibrated to observable market data and
employ standard market pricing theory for their valuations. Valuation models incorporate counterparty credit risk by discounting each trade’s expected exposures to the counterparty using the counterparty’s credit spreads, as implied by the credit default swap market. We also adjust expected liabilities to the counterparty using BNY Mellon’s own credit spreads, as implied by the credit default swap market. Accordingly, the valuation of our derivative positions is sensitive to the current changes in our own credit spreads, as well as those of our counterparties.
In certain cases, recent prices may not be observable for instruments that trade in inactive or less active markets. Upon evaluating the uncertainty in valuing financial instruments subject to liquidity issues, we make an adjustment to their value. The determination of the liquidity adjustment includes the availability of external quotes, the time since the latest available quote and the price volatility of the instrument.
Certain parameters in some financial models are not directly observable and, therefore, are based on management’s estimates and judgments. These financial instruments are normally traded less actively. We apply valuation adjustments to mitigate the possibility of error and revision in the model-based estimate value. Examples include products where parameters such as correlation and recovery rates are unobservable.
The methods described above for instruments that trade in inactive or less active markets may produce a current fair value calculation that may not be indicative of net realizable value or reflective of future fair values. We believe our methods of determining fair value are appropriate and consistent with other market participants. However, the use of different methodologies or different assumptions to value certain financial instruments could result in a different estimate of fair value.
Valuation hierarchy
A three-level valuation hierarchy is used for disclosure of fair value measurements based upon the transparency of inputs to the valuation of an asset or liability as of the measurement date. The three levels are described below.
Level 1: Inputs to the valuation methodology are quoted prices (unadjusted) for identical assets or
Notes to Consolidated Financial Statements (continued)
BNY Mellon 175
liabilities in active markets. Level 1 assets and liabilities include certain debt and equity securities, derivative financial instruments actively traded on exchanges and highly liquid government bonds.
Level 2: Observable inputs other than Level 1 prices, for example, quoted prices for similar assets and liabilities in active markets, quoted prices for identical or similar assets or liabilities in markets that are not active, and inputs that are observable or can be corroborated, either directly or indirectly, for substantially the full term of the financial instrument. Level 2 assets and liabilities include debt instruments that are traded less frequently than exchange-traded securities and derivative financial instruments whose model inputs are observable in the market or can be corroborated by market-observable data. Examples in this category are MBS, corporate debt securities and over-the-counter (“OTC”) derivative contracts.
Level 3: Inputs to the valuation methodology are unobservable and significant to the fair value measurement.
A financial instrument’s categorization within the valuation hierarchy is based upon the lowest level of input that is significant to the fair value measurement.
Valuation methodology
Following is a description of the valuation methodologies used for instruments measured at fair value, as well as the general classification of such instruments pursuant to the valuation hierarchy.
Securities
We determine fair value primarily based on pricing sources with reasonable levels of price transparency. Where quoted prices are available in an active market, we classify the securities within Level 1 of the valuation hierarchy. Securities include both long and short positions. Level 1 securities include U.S. Treasury and certain sovereign debt securities that are actively traded in highly liquid OTC markets, money market funds and exchange-traded equities.
If quoted market prices are not available, fair values are primarily determined using pricing models using observable trade data, market data, quoted prices of securities with similar characteristics or discounted cash flows. Examples of such instruments, which would generally be classified within Level 2 of the
valuation hierarchy, include MBS, state and political subdivisions, certain sovereign debt, corporate bonds and foreign covered bonds.
Specifically, the pricing sources obtain recent transactions for similar types of securities (e.g., vintage, position in the securitization structure) and ascertain variables such as discount rate and speed of prepayment for the types of transaction and apply such variables to similar types of bonds. We view these as observable transactions in the current marketplace and classify such securities as Level 2. Pricing sources discontinue pricing any specific security whenever they determine there is insufficient observable data to provide a good faith opinion on price.
In certain cases where there is limited activity or less transparency around inputs to the valuation, we classify those securities in Level 3 of the valuation hierarchy. As of Dec. 31, 2020, we have no instruments included in Level 3 of the valuation hierarchy.
At Dec. 31, 2020, approximately 99% of our securities were valued by pricing sources with reasonable levels of price transparency. The remaining securities were generally valued using observable inputs. Additional disclosures of securities are provided in Note 4.
Derivative financial instruments
We classify exchange-traded derivative financial instruments valued using quoted prices in Level 1 of the valuation hierarchy. Examples include exchange-traded equity and foreign exchange options. Since few other classes of derivative contracts are listed on an exchange, most of our derivative positions are valued using models that use as their basis readily observable market parameters, and we classify them in Level 2 of the valuation hierarchy. Such derivative financial instruments include swaps and options, foreign exchange spot and forward contracts and credit default swaps.
Derivatives valued using models with significant unobservable market parameters in markets that lack two-way flow are classified in Level 3 of the valuation hierarchy. Examples may include long-dated swaps and options, where parameters may be unobservable for longer maturities; and certain highly structured products, where correlation risk is
Notes to Consolidated Financial Statements (continued)
176 BNY Mellon

unobservable. As of Dec. 31, 2020, we have no Level 3 derivatives. Additional disclosures of derivative instruments are provided in Note 23.
Seed capital
In our Investment and Wealth Management business, we make seed capital investments in certain funds we manage. Seed capital is generally included in other assets on the consolidated balance sheet. When applicable, we value seed capital based on the published NAV of the fund.
For other types of investments in funds, we consider all of the rights and obligations inherent in our ownership interest, including the reported NAV as well as other factors that affect the fair value of our interest in the fund.
Interests in securitizations
For the interests in securitizations that are classified in trading assets—equity instruments and long-term debt—we use discounted cash flow models, which generally include assumptions of projected finance charges related to the securitized assets, estimated net credit losses, prepayment assumptions and estimates
of payments to third-party investors. When available, we compare our fair value estimates and assumptions to market activity and to the actual results of the securitized portfolio.
Other assets measured at NAV
We hold private equity investments, specifically SBICs, which are compliant with the Volcker Rule. There are no readily available market quotations for these investment partnerships. The fair value of the SBICs is based on our ownership percentage of the fair value of the underlying investments as provided by the partnership managers. These investments are typically valued on a quarterly basis. Our SBIC private equity investments are valued at NAV as a practical expedient for fair value.
The following tables present the financial instruments carried at fair value at Dec. 31, 2020 and Dec. 31, 2019, by caption on the consolidated balance sheet and by the three-level valuation hierarchy. We have included credit ratings information in certain of the tables because the information indicates the degree of credit risk to which we are exposed, and significant changes in ratings classifications could result in increased risk for us.
Notes to Consolidated Financial Statements (continued)
BNY Mellon 177
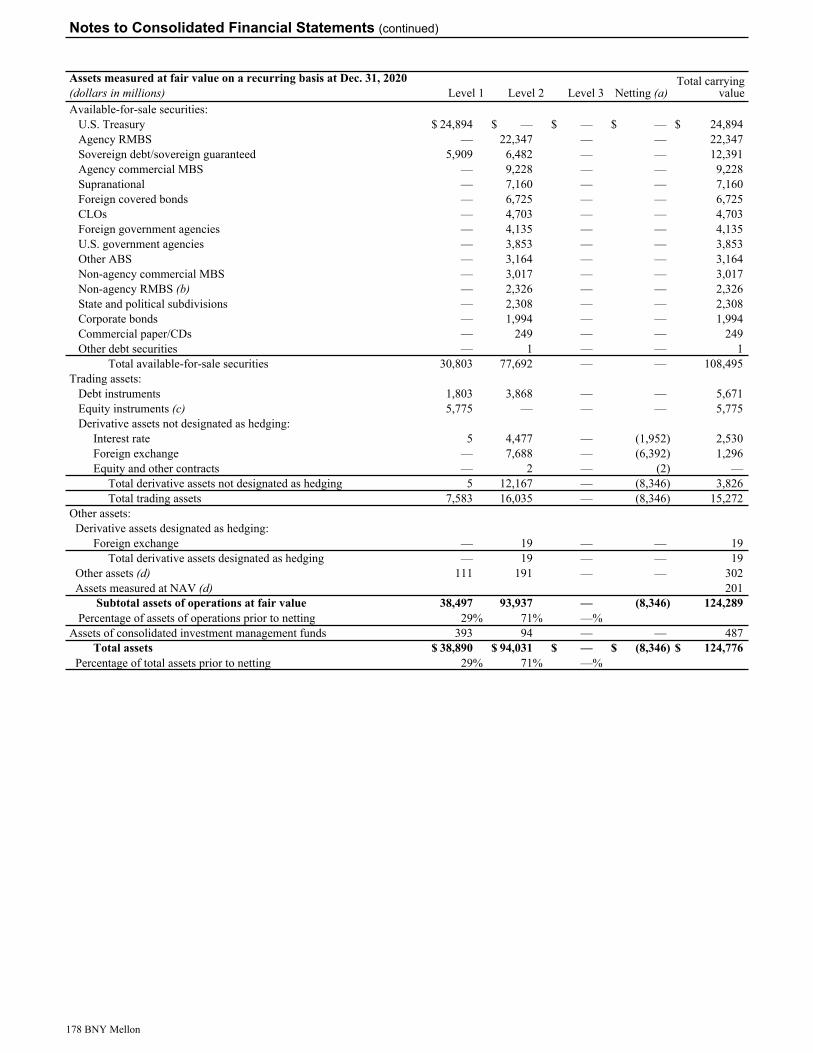
Assets measured at fair value on a recurring basis at Dec. 31, 2020 Total carryingvalue(dollars in millions) Level 1 Level 2 Level 3 Netting (a)
Available-for-sale securities:U.S. Treasury $ 24,894 $ — $ — $ — $ 24,894 Agency RMBS — 22,347 — — 22,347 Sovereign debt/sovereign guaranteed 5,909 6,482 — — 12,391 Agency commercial MBS — 9,228 — — 9,228 Supranational — 7,160 — — 7,160 Foreign covered bonds — 6,725 — — 6,725 CLOs — 4,703 — — 4,703 Foreign government agencies — 4,135 — — 4,135 U.S. government agencies — 3,853 — — 3,853 Other ABS — 3,164 — — 3,164 Non-agency commercial MBS — 3,017 — — 3,017 Non-agency RMBS (b) — 2,326 — — 2,326 State and political subdivisions — 2,308 — — 2,308 Corporate bonds — 1,994 — — 1,994 Commercial paper/CDs — 249 — — 249 Other debt securities — 1 — — 1
Total available-for-sale securities 30,803 77,692 — — 108,495 Trading assets:
Debt instruments 1,803 3,868 — — 5,671 Equity instruments (c) 5,775 — — — 5,775 Derivative assets not designated as hedging:
Interest rate 5 4,477 — (1,952) 2,530 Foreign exchange — 7,688 — (6,392) 1,296 Equity and other contracts — 2 — (2) —
Total derivative assets not designated as hedging 5 12,167 — (8,346) 3,826 Total trading assets 7,583 16,035 — (8,346) 15,272
Other assets:Derivative assets designated as hedging:
Foreign exchange — 19 — — 19 Total derivative assets designated as hedging — 19 — — 19
Other assets (d) 111 191 — — 302 Assets measured at NAV (d) 201
Subtotal assets of operations at fair value 38,497 93,937 — (8,346) 124,289 Percentage of assets of operations prior to netting 29% 71% —%
Assets of consolidated investment management funds 393 94 — — 487 Total assets $ 38,890 $ 94,031 $ — $ (8,346) $ 124,776
Percentage of total assets prior to netting 29% 71% —%
Notes to Consolidated Financial Statements (continued)
178 BNY Mellon
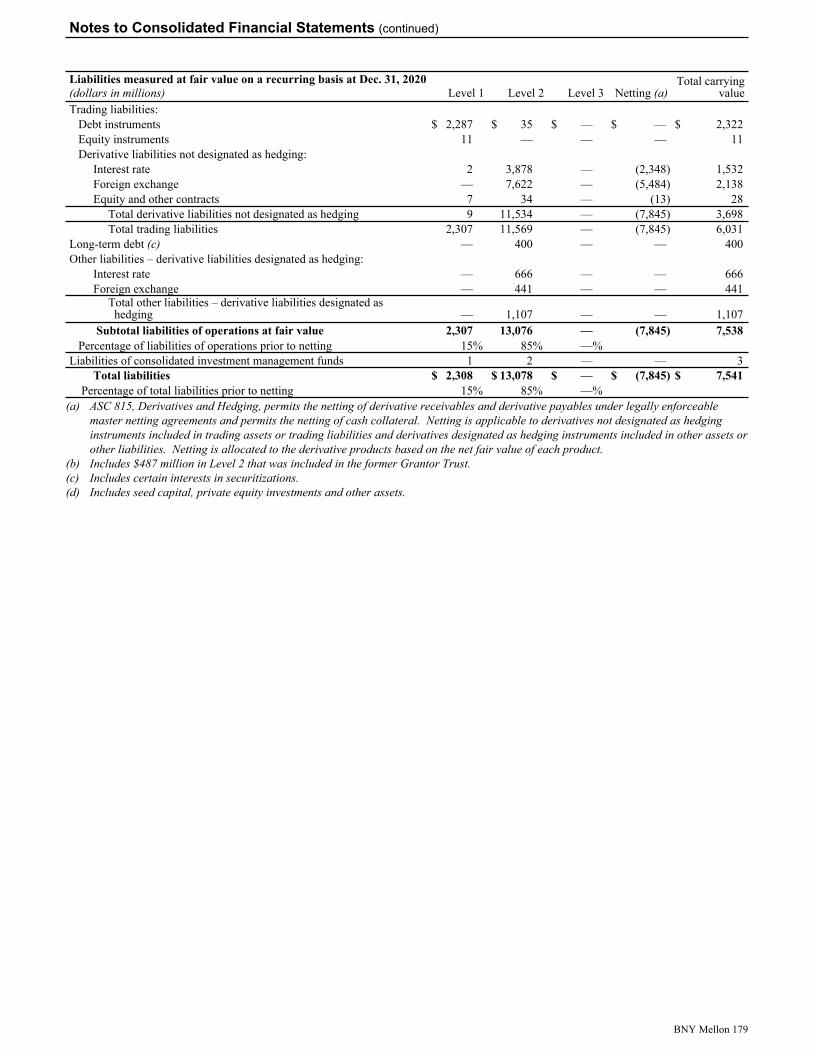
Liabilities measured at fair value on a recurring basis at Dec. 31, 2020 Total carryingvalue(dollars in millions) Level 1 Level 2 Level 3 Netting (a)
Trading liabilities:Debt instruments $ 2,287 $ 35 $ — $ — $ 2,322 Equity instruments 11 — — — 11 Derivative liabilities not designated as hedging:
Interest rate 2 3,878 — (2,348) 1,532 Foreign exchange — 7,622 — (5,484) 2,138 Equity and other contracts 7 34 — (13) 28
Total derivative liabilities not designated as hedging 9 11,534 — (7,845) 3,698 Total trading liabilities 2,307 11,569 — (7,845) 6,031
Long-term debt (c) — 400 — — 400 Other liabilities – derivative liabilities designated as hedging:
Interest rate — 666 — — 666 Foreign exchange — 441 — — 441
Total other liabilities – derivative liabilities designated as hedging — 1,107 — — 1,107
Subtotal liabilities of operations at fair value 2,307 13,076 — (7,845) 7,538 Percentage of liabilities of operations prior to netting 15% 85% —%
Liabilities of consolidated investment management funds 1 2 — — 3 Total liabilities $ 2,308 $ 13,078 $ — $ (7,845) $ 7,541
Percentage of total liabilities prior to netting 15% 85% —% (a) ASC 815, Derivatives and Hedging, permits the netting of derivative receivables and derivative payables under legally enforceable
master netting agreements and permits the netting of cash collateral. Netting is applicable to derivatives not designated as hedging instruments included in trading assets or trading liabilities and derivatives designated as hedging instruments included in other assets or other liabilities. Netting is allocated to the derivative products based on the net fair value of each product.
(b) Includes $487 million in Level 2 that was included in the former Grantor Trust. (c) Includes certain interests in securitizations.(d) Includes seed capital, private equity investments and other assets.
Notes to Consolidated Financial Statements (continued)
BNY Mellon 179
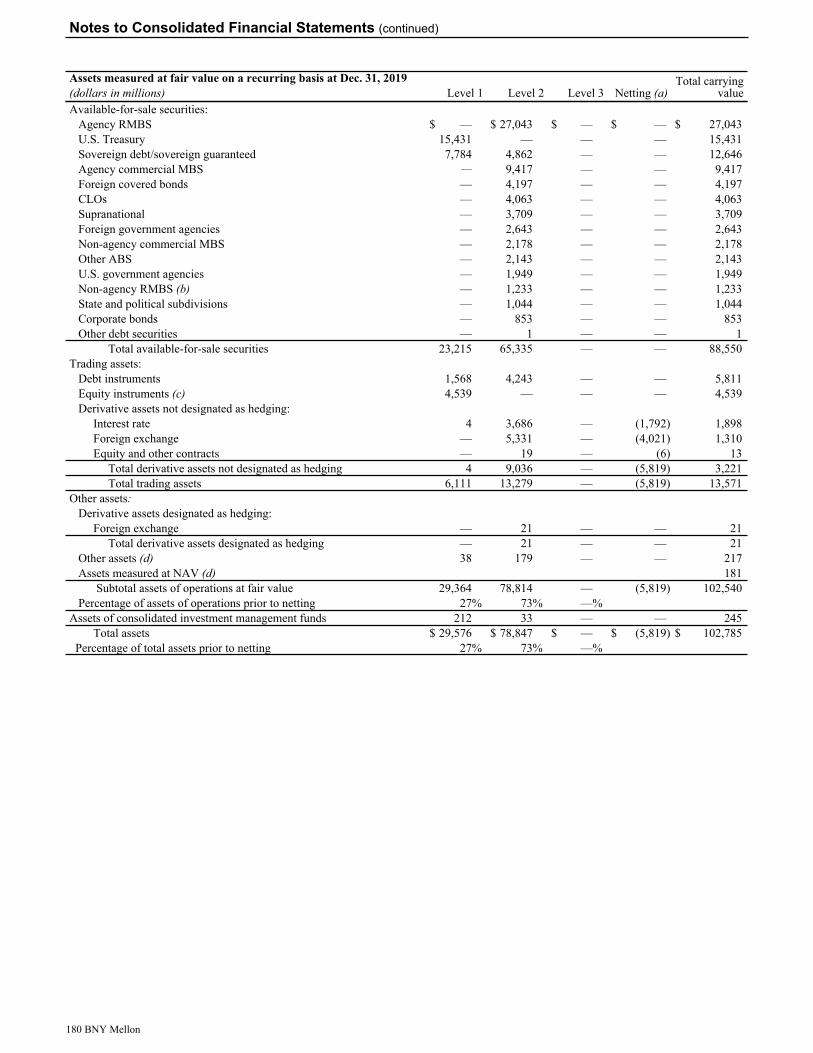
Assets measured at fair value on a recurring basis at Dec. 31, 2019 Total carryingvalue(dollars in millions) Level 1 Level 2 Level 3 Netting (a)
Available-for-sale securities:Agency RMBS $ — $ 27,043 $ — $ — $ 27,043 U.S. Treasury 15,431 — — — 15,431 Sovereign debt/sovereign guaranteed 7,784 4,862 — — 12,646 Agency commercial MBS — 9,417 — — 9,417 Foreign covered bonds — 4,197 — — 4,197 CLOs — 4,063 — — 4,063 Supranational — 3,709 — — 3,709 Foreign government agencies — 2,643 — — 2,643 Non-agency commercial MBS — 2,178 — — 2,178 Other ABS — 2,143 — — 2,143 U.S. government agencies — 1,949 — — 1,949 Non-agency RMBS (b) — 1,233 — — 1,233 State and political subdivisions — 1,044 — — 1,044 Corporate bonds — 853 — — 853 Other debt securities — 1 — — 1
Total available-for-sale securities 23,215 65,335 — — 88,550 Trading assets:
Debt instruments 1,568 4,243 — — 5,811 Equity instruments (c) 4,539 — — — 4,539 Derivative assets not designated as hedging:
Interest rate 4 3,686 — (1,792) 1,898 Foreign exchange — 5,331 — (4,021) 1,310 Equity and other contracts — 19 — (6) 13
Total derivative assets not designated as hedging 4 9,036 — (5,819) 3,221 Total trading assets 6,111 13,279 — (5,819) 13,571
Other assets:Derivative assets designated as hedging:
Foreign exchange — 21 — — 21 Total derivative assets designated as hedging — 21 — — 21
Other assets (d) 38 179 — — 217 Assets measured at NAV (d) 181
Subtotal assets of operations at fair value 29,364 78,814 — (5,819) 102,540 Percentage of assets of operations prior to netting 27% 73% —%
Assets of consolidated investment management funds 212 33 — — 245 Total assets $ 29,576 $ 78,847 $ — $ (5,819) $ 102,785
Percentage of total assets prior to netting 27% 73% —%
Notes to Consolidated Financial Statements (continued)
180 BNY Mellon

Liabilities measured at fair value on a recurring basis at Dec. 31, 2019 Total carryingvalue(dollars in millions) Level 1 Level 2 Level 3 Netting (a)
Trading liabilities:Debt instruments $ 1,477 $ 107 $ — $ — $ 1,584 Equity instruments 73 — — — 73 Derivative liabilities not designated as hedging:
Interest rate 6 3,244 — (1,986) 1,264 Foreign exchange — 5,340 — (3,428) 1,912 Equity and other contracts 3 6 — (1) 8
Total derivative liabilities not designated as hedging 9 8,590 — (5,415) 3,184 Total trading liabilities 1,559 8,697 — (5,415) 4,841
Long-term debt (c) — 387 — — 387 Other liabilities – derivative liabilities designated as hedging:
Interest rate — 350 — — 350 Foreign exchange — 257 — — 257
Total other liabilities – derivative liabilities designated as hedging — 607 — — 607
Subtotal liabilities of operations at fair value 1,559 9,691 — (5,415) 5,835 Percentage of liabilities of operations prior to netting 14% 86% —%
Liabilities of consolidated investment management funds 1 — — — 1 Total liabilities $ 1,560 $ 9,691 $ — $ (5,415) $ 5,836
Percentage of total liabilities prior to netting 14% 86% —% (a) ASC 815, Derivatives and Hedging, permits the netting of derivative receivables and derivative payables under legally enforceable
master netting agreements and permits the netting of cash collateral. Netting is applicable to derivatives not designated as hedging instruments included in trading assets or trading liabilities and derivatives designated as hedging instruments included in other assets or other liabilities. Netting is allocated to the derivative products based on the net fair value of each product.
(b) Includes $640 million in Level 2 that was included in the former Grantor Trust. (c) Includes certain interests in securitizations.(d) Includes seed capital, private equity investments and other assets.
Notes to Consolidated Financial Statements (continued)
BNY Mellon 181
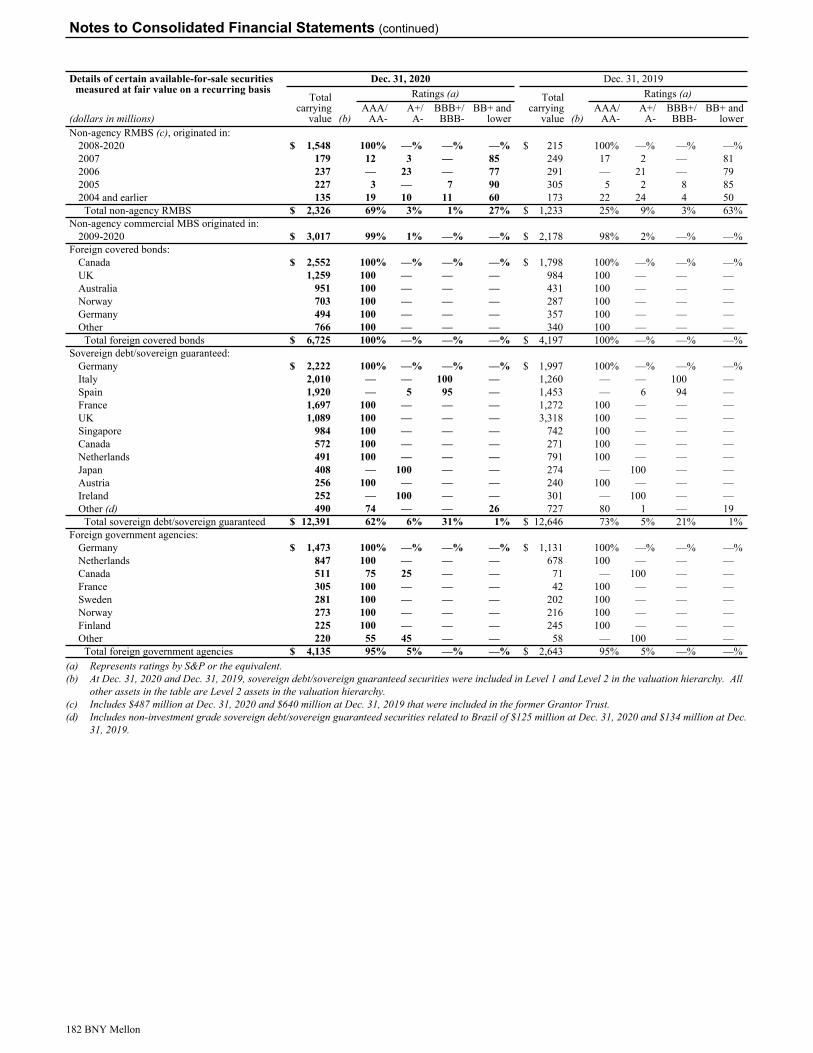
Details of certain available-for-sale securities measured at fair value on a recurring basis
Dec. 31, 2020 Dec. 31, 2019
Totalcarrying
value
Ratings (a) Totalcarrying
value
Ratings (a)AAA/
AA-A+/
A-BBB+/
BBB-BB+ and
lowerAAA/
AA-A+/
A-BBB+/
BBB-BB+ and
lower(dollars in millions) (b) (b)Non-agency RMBS (c), originated in:
2008-2020 $ 1,548 100% —% —% —% $ 215 100% —% —% —% 2007 179 12 3 — 85 249 17 2 — 81 2006 237 — 23 — 77 291 — 21 — 79 2005 227 3 — 7 90 305 5 2 8 85 2004 and earlier 135 19 10 11 60 173 22 24 4 50
Total non-agency RMBS $ 2,326 69% 3% 1% 27% $ 1,233 25% 9% 3% 63% Non-agency commercial MBS originated in:
2009-2020 $ 3,017 99% 1% —% —% $ 2,178 98% 2% —% —% Foreign covered bonds:
Canada $ 2,552 100% —% —% —% $ 1,798 100% —% —% —% UK 1,259 100 — — — 984 100 — — — Australia 951 100 — — — 431 100 — — — Norway 703 100 — — — 287 100 — — — Germany 494 100 — — — 357 100 — — — Other 766 100 — — — 340 100 — — —
Total foreign covered bonds $ 6,725 100% —% —% —% $ 4,197 100% —% —% —% Sovereign debt/sovereign guaranteed:
Germany $ 2,222 100% —% —% —% $ 1,997 100% —% —% —% Italy 2,010 — — 100 — 1,260 — — 100 — Spain 1,920 — 5 95 — 1,453 — 6 94 — France 1,697 100 — — — 1,272 100 — — — UK 1,089 100 — — — 3,318 100 — — — Singapore 984 100 — — — 742 100 — — — Canada 572 100 — — — 271 100 — — — Netherlands 491 100 — — — 791 100 — — — Japan 408 — 100 — — 274 — 100 — — Austria 256 100 — — — 240 100 — — — Ireland 252 — 100 — — 301 — 100 — — Other (d) 490 74 — — 26 727 80 1 — 19
Total sovereign debt/sovereign guaranteed $ 12,391 62% 6% 31% 1% $ 12,646 73% 5% 21% 1% Foreign government agencies:
Germany $ 1,473 100% —% —% —% $ 1,131 100% —% —% —% Netherlands 847 100 — — — 678 100 — — — Canada 511 75 25 — — 71 — 100 — — France 305 100 — — — 42 100 — — — Sweden 281 100 — — — 202 100 — — — Norway 273 100 — — — 216 100 — — — Finland 225 100 — — — 245 100 — — — Other 220 55 45 — — 58 — 100 — —
Total foreign government agencies $ 4,135 95% 5% —% —% $ 2,643 95% 5% —% —% (a) Represents ratings by S&P or the equivalent.(b) At Dec. 31, 2020 and Dec. 31, 2019, sovereign debt/sovereign guaranteed securities were included in Level 1 and Level 2 in the valuation hierarchy. All
other assets in the table are Level 2 assets in the valuation hierarchy.(c) Includes $487 million at Dec. 31, 2020 and $640 million at Dec. 31, 2019 that were included in the former Grantor Trust.(d) Includes non-investment grade sovereign debt/sovereign guaranteed securities related to Brazil of $125 million at Dec. 31, 2020 and $134 million at Dec.
31, 2019.
Notes to Consolidated Financial Statements (continued)
182 BNY Mellon
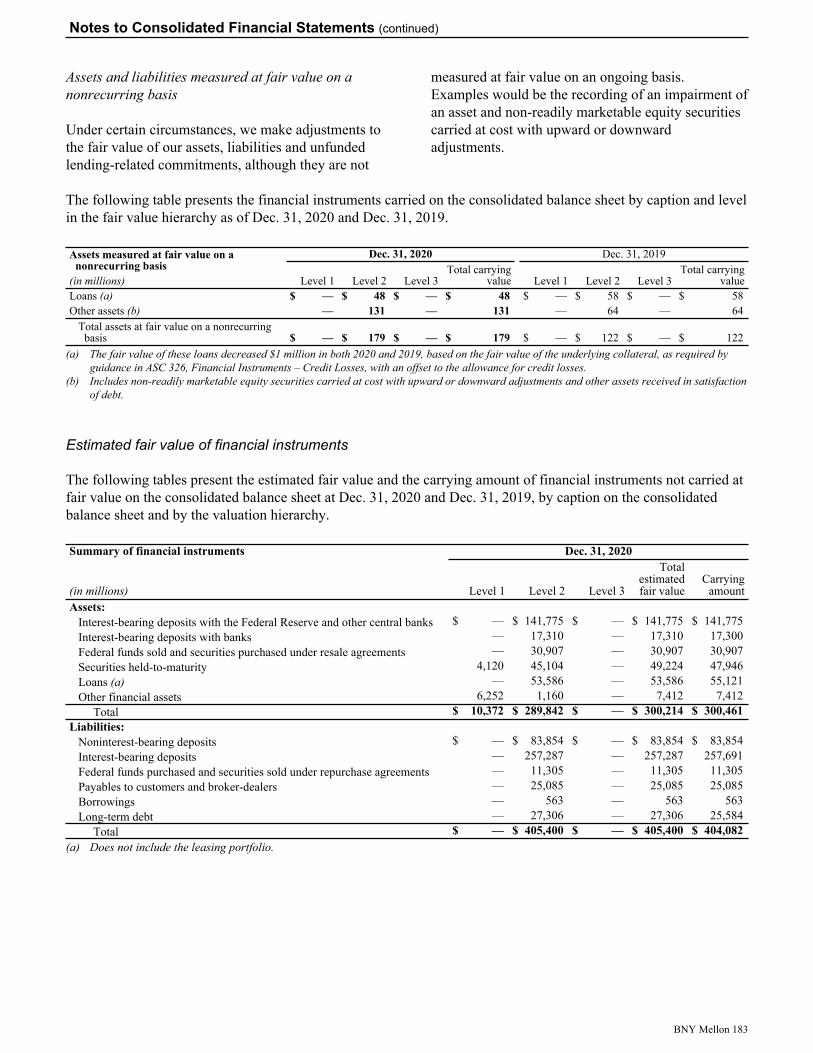
Assets and liabilities measured at fair value on a nonrecurring basis
Under certain circumstances, we make adjustments to the fair value of our assets, liabilities and unfunded lending-related commitments, although they are not
measured at fair value on an ongoing basis. Examples would be the recording of an impairment of an asset and non-readily marketable equity securities carried at cost with upward or downward adjustments.
The following table presents the financial instruments carried on the consolidated balance sheet by caption and level in the fair value hierarchy as of Dec. 31, 2020 and Dec. 31, 2019.
Assets measured at fair value on a nonrecurring basis
Dec. 31, 2020 Dec. 31, 2019Total carrying
valueTotal carrying
value(in millions) Level 1 Level 2 Level 3 Level 1 Level 2 Level 3Loans (a) $ — $ 48 $ — $ 48 $ — $ 58 $ — $ 58 Other assets (b) — 131 — 131 — 64 — 64
Total assets at fair value on a nonrecurring basis $ — $ 179 $ — $ 179 $ — $ 122 $ — $ 122
(a) The fair value of these loans decreased $1 million in both 2020 and 2019, based on the fair value of the underlying collateral, as required by guidance in ASC 326, Financial Instruments – Credit Losses, with an offset to the allowance for credit losses.
(b) Includes non-readily marketable equity securities carried at cost with upward or downward adjustments and other assets received in satisfaction of debt.
Estimated fair value of financial instruments
The following tables present the estimated fair value and the carrying amount of financial instruments not carried at fair value on the consolidated balance sheet at Dec. 31, 2020 and Dec. 31, 2019, by caption on the consolidated balance sheet and by the valuation hierarchy.
Summary of financial instruments Dec. 31, 2020
(in millions) Level 1 Level 2 Level 3
Totalestimatedfair value
Carryingamount
Assets:Interest-bearing deposits with the Federal Reserve and other central banks $ — $ 141,775 $ — $ 141,775 $ 141,775 Interest-bearing deposits with banks — 17,310 — 17,310 17,300 Federal funds sold and securities purchased under resale agreements — 30,907 — 30,907 30,907 Securities held-to-maturity 4,120 45,104 — 49,224 47,946 Loans (a) — 53,586 — 53,586 55,121 Other financial assets 6,252 1,160 — 7,412 7,412
Total $ 10,372 $ 289,842 $ — $ 300,214 $ 300,461 Liabilities:
Noninterest-bearing deposits $ — $ 83,854 $ — $ 83,854 $ 83,854 Interest-bearing deposits — 257,287 — 257,287 257,691 Federal funds purchased and securities sold under repurchase agreements — 11,305 — 11,305 11,305 Payables to customers and broker-dealers — 25,085 — 25,085 25,085 Borrowings — 563 — 563 563 Long-term debt — 27,306 — 27,306 25,584
Total $ — $ 405,400 $ — $ 405,400 $ 404,082 (a) Does not include the leasing portfolio.
Notes to Consolidated Financial Statements (continued)
BNY Mellon 183

Summary of financial instruments Dec. 31, 2019
(in millions) Level 1 Level 2 Level 3
Total estimatedfair value
Carryingamount
Assets:Interest-bearing deposits with the Federal Reserve and other central banks $ — $ 95,042 $ — $ 95,042 $ 95,042 Interest-bearing deposits with banks — 14,832 — 14,832 14,811 Federal funds sold and securities purchased under resale agreements — 30,182 — 30,182 30,182 Securities held-to-maturity 4,630 30,175 — 34,805 34,483 Loans (a) — 54,194 — 54,194 53,718 Other financial assets 4,830 1,233 — 6,063 6,063
Total $ 9,460 $ 225,658 $ — $ 235,118 $ 234,299 Liabilities:
Noninterest-bearing deposits $ — $ 57,630 $ — $ 57,630 $ 57,630 Interest-bearing deposits — 200,846 — 200,846 201,836 Federal funds purchased and securities sold under repurchase agreements — 11,401 — 11,401 11,401 Payables to customers and broker-dealers — 18,758 — 18,758 18,758 Commercial paper — 3,959 — 3,959 3,959 Borrowings — 917 — 917 917 Long-term debt — 27,858 — 27,858 27,114
Total $ — $ 321,369 $ — $ 321,369 $ 321,615 (a) Does not include the leasing portfolio.
Note 21–Fair value option
We elected fair value as an alternative measurement for selected financial assets and liabilities that are not otherwise required to be measured at fair value, including the assets and liabilities of consolidated investment management funds and certain long-term debt. The following table presents the assets and liabilities of consolidated investment management funds, at fair value.
Assets and liabilities of consolidated investment management funds, at fair value
Dec. 31,(in millions) 2020 2019Assets of consolidated investment
management funds:Trading assets $ 482 $ 229 Other assets 5 16
Total assets of consolidated investment management funds $ 487 $ 245
Liabilities of consolidated investment management funds:Other liabilities 3 1
Total liabilities of consolidated investment management funds $ 3 $ 1
BNY Mellon values the assets and liabilities of its consolidated investment management funds using quoted prices for identical assets or liabilities in active markets or observable inputs such as quoted
prices for similar assets or liabilities. Quoted prices for either identical or similar assets or liabilities in inactive markets may also be used. Accordingly, fair value best reflects the interests BNY Mellon holds in the economic performance of the consolidated investment management funds. Changes in the value of the assets and liabilities are recorded in the consolidated income statement as investment income of consolidated investment management funds and in the interest of investment management fund note holders, respectively.
We have elected the fair value option on $240 million of long-term debt. The fair value of this long-term debt was $400 million at Dec. 31, 2020 and $387 million at Dec. 31, 2019. The long-term debt is valued using observable market inputs and is included in Level 2 of the valuation hierarchy.
The following table presents the changes in fair value of long-term debt recorded in foreign exchange and other trading revenue in the consolidated income statement.
Change in fair value of long-term debt (a)Year ended Dec. 31,
(in millions) 2020 2019 2018Foreign exchange and other trading
revenue $ (13) $ (16) $ (4) (a) The changes in fair value are approximately offset by an
economic hedge included in foreign exchange and other trading revenue.
Notes to Consolidated Financial Statements (continued)
184 BNY Mellon
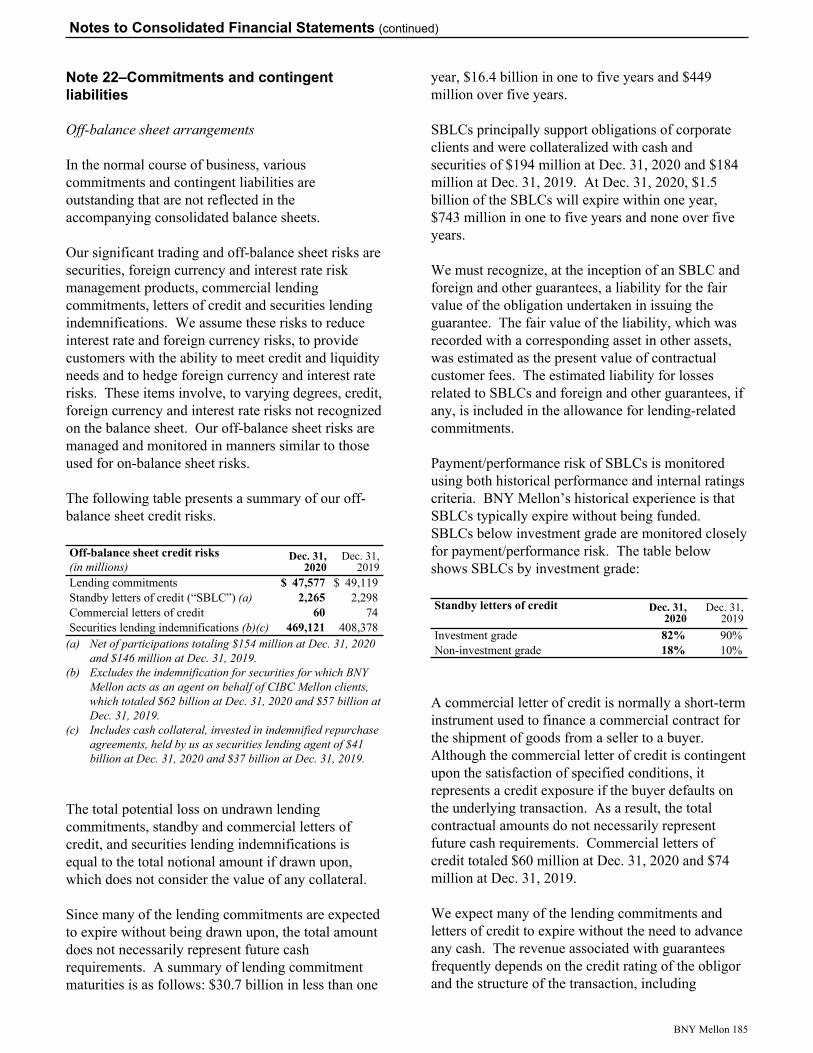
Note 22–Commitments and contingent liabilities
Off-balance sheet arrangements
In the normal course of business, various commitments and contingent liabilities are outstanding that are not reflected in the accompanying consolidated balance sheets.
Our significant trading and off-balance sheet risks are securities, foreign currency and interest rate risk management products, commercial lending commitments, letters of credit and securities lending indemnifications. We assume these risks to reduce interest rate and foreign currency risks, to provide customers with the ability to meet credit and liquidity needs and to hedge foreign currency and interest rate risks. These items involve, to varying degrees, credit, foreign currency and interest rate risks not recognized on the balance sheet. Our off-balance sheet risks are managed and monitored in manners similar to those used for on-balance sheet risks.
The following table presents a summary of our off-balance sheet credit risks.
Off-balance sheet credit risks Dec. 31, 2020
Dec. 31, 2019(in millions)
Lending commitments $ 47,577 $ 49,119 Standby letters of credit (“SBLC”) (a) 2,265 2,298 Commercial letters of credit 60 74 Securities lending indemnifications (b)(c) 469,121 408,378
(a) Net of participations totaling $154 million at Dec. 31, 2020 and $146 million at Dec. 31, 2019.
(b) Excludes the indemnification for securities for which BNY Mellon acts as an agent on behalf of CIBC Mellon clients, which totaled $62 billion at Dec. 31, 2020 and $57 billion at Dec. 31, 2019.
(c) Includes cash collateral, invested in indemnified repurchase agreements, held by us as securities lending agent of $41 billion at Dec. 31, 2020 and $37 billion at Dec. 31, 2019.
The total potential loss on undrawn lending commitments, standby and commercial letters of credit, and securities lending indemnifications is equal to the total notional amount if drawn upon, which does not consider the value of any collateral.
Since many of the lending commitments are expected to expire without being drawn upon, the total amount does not necessarily represent future cash requirements. A summary of lending commitment maturities is as follows: $30.7 billion in less than one
year, $16.4 billion in one to five years and $449 million over five years.
SBLCs principally support obligations of corporate clients and were collateralized with cash and securities of $194 million at Dec. 31, 2020 and $184 million at Dec. 31, 2019. At Dec. 31, 2020, $1.5 billion of the SBLCs will expire within one year, $743 million in one to five years and none over five years.
We must recognize, at the inception of an SBLC and foreign and other guarantees, a liability for the fair value of the obligation undertaken in issuing the guarantee. The fair value of the liability, which was recorded with a corresponding asset in other assets, was estimated as the present value of contractual customer fees. The estimated liability for losses related to SBLCs and foreign and other guarantees, if any, is included in the allowance for lending-related commitments.
Payment/performance risk of SBLCs is monitored using both historical performance and internal ratings criteria. BNY Mellon’s historical experience is that SBLCs typically expire without being funded. SBLCs below investment grade are monitored closely for payment/performance risk. The table below shows SBLCs by investment grade:
Standby letters of credit Dec. 31, 2020
Dec. 31, 2019
Investment grade 82% 90% Non-investment grade 18% 10%
A commercial letter of credit is normally a short-term instrument used to finance a commercial contract for the shipment of goods from a seller to a buyer. Although the commercial letter of credit is contingent upon the satisfaction of specified conditions, it represents a credit exposure if the buyer defaults on the underlying transaction. As a result, the total contractual amounts do not necessarily represent future cash requirements. Commercial letters of credit totaled $60 million at Dec. 31, 2020 and $74 million at Dec. 31, 2019.
We expect many of the lending commitments and letters of credit to expire without the need to advance any cash. The revenue associated with guarantees frequently depends on the credit rating of the obligor and the structure of the transaction, including
Notes to Consolidated Financial Statements (continued)
BNY Mellon 185
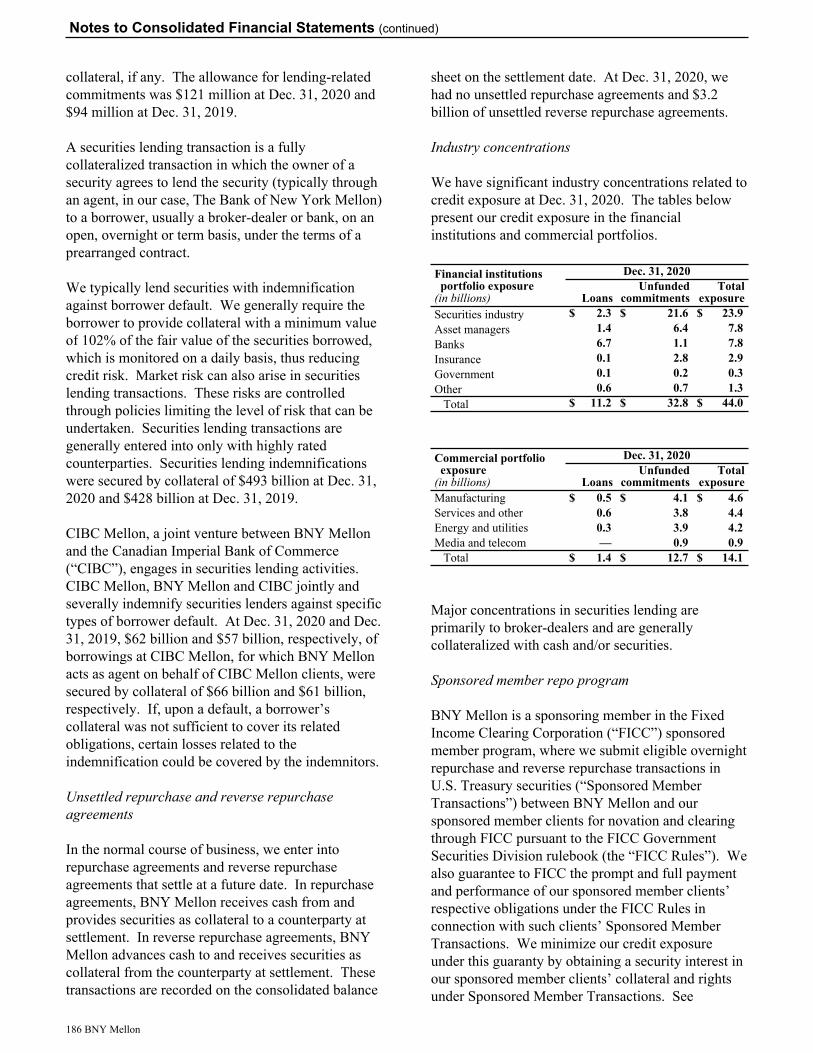
collateral, if any. The allowance for lending-related commitments was $121 million at Dec. 31, 2020 and $94 million at Dec. 31, 2019.
A securities lending transaction is a fully collateralized transaction in which the owner of a security agrees to lend the security (typically through an agent, in our case, The Bank of New York Mellon) to a borrower, usually a broker-dealer or bank, on an open, overnight or term basis, under the terms of a prearranged contract.
We typically lend securities with indemnification against borrower default. We generally require the borrower to provide collateral with a minimum value of 102% of the fair value of the securities borrowed, which is monitored on a daily basis, thus reducing credit risk. Market risk can also arise in securities lending transactions. These risks are controlled through policies limiting the level of risk that can be undertaken. Securities lending transactions are generally entered into only with highly rated counterparties. Securities lending indemnifications were secured by collateral of $493 billion at Dec. 31, 2020 and $428 billion at Dec. 31, 2019.
CIBC Mellon, a joint venture between BNY Mellon and the Canadian Imperial Bank of Commerce (“CIBC”), engages in securities lending activities. CIBC Mellon, BNY Mellon and CIBC jointly and severally indemnify securities lenders against specific types of borrower default. At Dec. 31, 2020 and Dec. 31, 2019, $62 billion and $57 billion, respectively, of borrowings at CIBC Mellon, for which BNY Mellon acts as agent on behalf of CIBC Mellon clients, were secured by collateral of $66 billion and $61 billion, respectively. If, upon a default, a borrower’s collateral was not sufficient to cover its related obligations, certain losses related to the indemnification could be covered by the indemnitors.
Unsettled repurchase and reverse repurchase agreements
In the normal course of business, we enter into repurchase agreements and reverse repurchase agreements that settle at a future date. In repurchase agreements, BNY Mellon receives cash from and provides securities as collateral to a counterparty at settlement. In reverse repurchase agreements, BNY Mellon advances cash to and receives securities as collateral from the counterparty at settlement. These transactions are recorded on the consolidated balance
sheet on the settlement date. At Dec. 31, 2020, we had no unsettled repurchase agreements and $3.2 billion of unsettled reverse repurchase agreements.
Industry concentrations
We have significant industry concentrations related to credit exposure at Dec. 31, 2020. The tables below present our credit exposure in the financial institutions and commercial portfolios.
Financial institutionsportfolio exposure
(in billions)
Dec. 31, 2020
LoansUnfunded
commitmentsTotal
exposureSecurities industry $ 2.3 $ 21.6 $ 23.9 Asset managers 1.4 6.4 7.8 Banks 6.7 1.1 7.8 Insurance 0.1 2.8 2.9 Government 0.1 0.2 0.3 Other 0.6 0.7 1.3
Total $ 11.2 $ 32.8 $ 44.0
Commercial portfolioexposure
(in billions)
Dec. 31, 2020
LoansUnfunded
commitmentsTotal
exposureManufacturing $ 0.5 $ 4.1 $ 4.6 Services and other 0.6 3.8 4.4 Energy and utilities 0.3 3.9 4.2 Media and telecom — 0.9 0.9
Total $ 1.4 $ 12.7 $ 14.1
Major concentrations in securities lending are primarily to broker-dealers and are generally collateralized with cash and/or securities.
Sponsored member repo program
BNY Mellon is a sponsoring member in the Fixed Income Clearing Corporation (“FICC”) sponsored member program, where we submit eligible overnight repurchase and reverse repurchase transactions in U.S. Treasury securities (“Sponsored Member Transactions”) between BNY Mellon and our sponsored member clients for novation and clearing through FICC pursuant to the FICC Government Securities Division rulebook (the “FICC Rules”). We also guarantee to FICC the prompt and full payment and performance of our sponsored member clients’ respective obligations under the FICC Rules in connection with such clients’ Sponsored Member Transactions. We minimize our credit exposure under this guaranty by obtaining a security interest in our sponsored member clients’ collateral and rights under Sponsored Member Transactions. See
Notes to Consolidated Financial Statements (continued)
186 BNY Mellon
“Offsetting assets and liabilities” in Note 23 for additional information on our repurchase and reverse repurchase agreements.
Indemnification arrangements
We have provided standard representations for underwriting agreements, acquisition and divestiture agreements, sales of loans and commitments, and other similar types of arrangements and customary indemnification for claims and legal proceedings related to providing financial services that are not otherwise included above. Insurance has been purchased to mitigate certain of these risks. Generally, there are no stated or notional amounts included in these indemnifications and the contingencies triggering the obligation for indemnification are not expected to occur. Furthermore, often counterparties to these transactions provide us with comparable indemnifications. We are unable to develop an estimate of the maximum payout under these indemnifications for several reasons. In addition to the lack of a stated or notional amount in a majority of such indemnifications, we are unable to predict the nature of events that would trigger indemnification or the level of indemnification for a certain event. We believe, however, that the possibility that we will have to make any material payments for these indemnifications is remote. At Dec. 31, 2020 and Dec. 31, 2019, we have not recorded any material liabilities under these arrangements.
Clearing and settlement exchanges
We are a noncontrolling equity investor in, and/or member of, several industry clearing or settlement exchanges through which foreign exchange, securities, derivatives or other transactions settle. Certain of these industry clearing and settlement exchanges require their members to guarantee their obligations and liabilities and/or to provide liquidity support in the event other members do not honor their obligations. We believe the likelihood that a clearing or settlement exchange (of which we are a member) would become insolvent is remote. Additionally, certain settlement exchanges have implemented loss allocation policies that enable the exchange to allocate settlement losses to the members of the exchange. It is not possible to quantify such mark-to-market loss until the loss occurs. Any ancillary costs that occur as a result of any mark-to-market loss cannot be quantified. In addition, we also sponsor
clients as members on clearing and settlement exchanges and guarantee their obligations. At Dec. 31, 2020 and Dec. 31, 2019, we did not record any material liabilities under these arrangements.
Legal proceedings
In the ordinary course of business, The Bank of New York Mellon Corporation and its subsidiaries are routinely named as defendants in or made parties to pending and potential legal actions. We also are subject to governmental and regulatory examinations, information-gathering requests, investigations and proceedings (both formal and informal). Claims for significant monetary damages are often asserted in many of these legal actions, while claims for disgorgement, restitution, penalties and/or other remedial actions or sanctions may be sought in governmental and regulatory matters. It is inherently difficult to predict the eventual outcomes of such matters given their complexity and the particular facts and circumstances at issue in each of these matters. However, on the basis of our current knowledge and understanding, we do not believe that judgments, settlements or orders, if any, arising from these matters (either individually or in the aggregate, after giving effect to applicable reserves and insurance coverage) will have a material adverse effect on the consolidated financial position or liquidity of BNY Mellon, although they could have a material effect on our results of operations in a given period.
In view of the inherent unpredictability of outcomes in litigation and regulatory matters, particularly where (i) the damages sought are substantial or indeterminate, (ii) the proceedings are in the early stages, or (iii) the matters involve novel legal theories or a large number of parties, as a matter of course there is considerable uncertainty surrounding the timing or ultimate resolution of litigation and regulatory matters, including a possible eventual loss, fine, penalty or business impact, if any, associated with each such matter. In accordance with applicable accounting guidance, we establish accruals for litigation and regulatory matters when those matters proceed to a stage where they present loss contingencies that are both probable and reasonably estimable. In such cases, there may be a possible exposure to loss in excess of any amounts accrued. We regularly monitor such matters for developments that could affect the amount of the accrual, and will adjust the accrual amount as appropriate. If the loss contingency in question is not both probable and
Notes to Consolidated Financial Statements (continued)
BNY Mellon 187
reasonably estimable, we do not establish an accrual and the matter continues to be monitored for any developments that would make the loss contingency both probable and reasonably estimable. We believe that our accruals for legal proceedings are appropriate and, in the aggregate, are not material to the consolidated financial position of BNY Mellon, although future accruals could have a material effect on the results of operations in a given period. In addition, if we have the potential to recover a portion of an estimated loss from a third party, we record a receivable up to the amount of the accrual that is probable of recovery.
For certain of those matters described here for which a loss contingency may, in the future, be reasonably possible (whether in excess of a related accrued liability or where there is no accrued liability), BNY Mellon is currently unable to estimate a range of reasonably possible loss. For those matters described here where BNY Mellon is able to estimate a reasonably possible loss, the aggregate range of such reasonably possible loss is up to $730 million in excess of the accrued liability (if any) related to those matters. For matters where a reasonably possible loss is denominated in a foreign currency, our estimate is adjusted quarterly based on prevailing exchange rates. We do not consider potential recoveries when estimating reasonably possible losses.
The following describes certain judicial, regulatory and arbitration proceedings involving BNY Mellon:
Mortgage-Securitization Trusts ProceedingsThe Bank of New York Mellon has been named as a defendant in a number of legal actions brought by MBS investors alleging that the trustee has expansive duties under the governing agreements, including the duty to investigate and pursue breach of representation and warranty claims against other parties to the MBS transactions. Three actions commenced in December 2014, December 2015 and February 2017 are pending in New York federal court; and one action commenced in May 2016 is pending in New York state court.
Matters Related to R. Allen StanfordIn late December 2005, Pershing LLC (“Pershing”) became a clearing firm for Stanford Group Co. (“SGC”), a registered broker-dealer that was part of a group of entities ultimately controlled by R. Allen Stanford (“Stanford”). Stanford International Bank, also controlled by Stanford, issued certificates of
deposit (“CDs”). Some investors allegedly wired funds from their SGC accounts to purchase CDs. In 2009, the Securities and Exchange Commission charged Stanford with operating a Ponzi scheme in connection with the sale of CDs, and SGC was placed into receivership. Alleged purchasers of CDs have filed two putative class action proceedings against Pershing: one in November 2009 in Texas federal court, and one in May 2016 in New Jersey federal court. After dismissals, three lawsuits remain against Pershing in Louisiana and New Jersey federal courts, which were filed in January 2010, October 2015 and May 2016. The purchasers allege that Pershing, as SGC’s clearing firm, assisted Stanford in a fraudulent scheme and assert contractual, statutory and common law claims. In March 2019, a group of investors filed a putative class action against The Bank of New York Mellon in New Jersey federal court, making the same allegations as in the prior actions brought against Pershing. All the cases that have been brought in federal court against Pershing and the case brought against The Bank of New York Mellon have been consolidated in Texas federal court for discovery purposes. In July 2020, after being enjoined from pursuing claims before the Financial Industry Regulatory Authority, Inc. (“FINRA”), an investment firm filed an action against Pershing in Texas federal court. FINRA arbitration proceedings also have been initiated by alleged purchasers asserting similar claims.
Brazilian Postalis LitigationBNY Mellon Servicos Financeiros DTVM S.A. (“DTVM”), a subsidiary that provides asset services in Brazil, acts as administrator for certain investment funds in which a public pension fund for postal workers called Postalis-Instituto de Seguridade Social dos Correios e Telégrafos (“Postalis”) invested. On Aug. 22, 2014, Postalis sued DTVM in Rio de Janeiro, Brazil for losses related to a Postalis fund for which DTVM is administrator. Postalis alleges that DTVM failed to properly perform duties, including to conduct due diligence of and exert control over the manager. On March 12, 2015, Postalis filed a lawsuit in Rio de Janeiro against DTVM and BNY Mellon Administração de Ativos Ltda. (“Ativos”) alleging failure to properly perform duties relating to another fund of which DTVM is administrator and Ativos is manager. On Dec. 14, 2015, Associacão dos Profissionais dos Correios (“ADCAP”), a Brazilian postal workers association, filed a lawsuit in São Paulo against DTVM and other defendants alleging that DTVM improperly contributed to Postalis
Notes to Consolidated Financial Statements (continued)
188 BNY Mellon
investment losses. On March 20, 2017, the lawsuit was dismissed without prejudice, and ADCAP has appealed that decision. On Dec. 17, 2015, Postalis filed three lawsuits in Rio de Janeiro against DTVM and Ativos alleging failure to properly perform duties with respect to investments in several other funds. On Feb. 4, 2016, Postalis filed a lawsuit in Brasilia against DTVM, Ativos and BNY Mellon Alocação de Patrimônio Ltda. (“Alocação de Patrimônio”), an investment management subsidiary, alleging failure to properly perform duties and liability for losses with respect to investments in various funds of which the defendants were administrator and/or manager. On Jan. 16, 2018, the Brazilian Federal Prosecution Service (“MPF”) filed a civil lawsuit in São Paulo against DTVM alleging liability for Postalis losses based on alleged failures to properly perform certain duties as administrator to certain funds in which Postalis invested or as controller of Postalis’s own investment portfolio. On April 18, 2018, the court dismissed the lawsuit without prejudice, and the MPF has appealed that decision. In addition, the Tribunal de Contas da Uniao (“TCU”), an administrative tribunal, has initiated two proceedings with the purpose of determining liability for losses to two investment funds administered by DTVM in which Postalis was the exclusive investor. On Sept. 9, 2020, TCU rendered a decision in one of the proceedings, finding DTVM and two former Postalis directors jointly and severally liable for approximately $45 million. TCU also imposed on DTVM a fine of approximately $2 million. DTVM has filed an administrative appeal of the decision. On Oct. 4, 2019, Postalis and another pension fund filed a request for arbitration in São Paulo against DTVM and Ativos alleging liability for losses to an investment fund for which DTVM was administrator and Ativos was manager. On Oct. 25, 2019, Postalis filed a lawsuit in Rio de Janeiro against DTVM and Alocação de Patrimônio, alleging liability for losses in another fund for which DTVM was administrator and Alocação de Patrimônio and Ativos were managers. On June 19, 2020, a lawsuit was filed in federal court in Rio de Janeiro against DTVM, Postalis, and various other defendants alleging liability against DTVM for certain Postalis losses in an investment fund of which DTVM was administrator.
Brazilian Silverado LitigationDTVM acts as administrator for the Fundo de Investimento em Direitos Creditórios Multisetorial Silverado Maximum (“Silverado Maximum Fund”),
which invests in commercial credit receivables. On June 2, 2016, the Silverado Maximum Fund sued DTVM in its capacity as administrator, along with Deutsche Bank S.A. - Banco Alemão in its capacity as custodian and Silverado Gestão e Investimentos Ltda. in its capacity as investment manager. The Fund alleges that each of the defendants failed to fulfill its respective duty, and caused losses to the Fund for which the defendants are jointly and severally liable.
German Tax MattersGerman authorities are investigating past “cum/ex” trading, which involved the purchase of equity securities on or shortly before the dividend date, but settled after that date, potentially resulting in an unwarranted refund of withholding tax. German authorities have taken the view that past cum/ex trading may have resulted in tax avoidance or evasion. European subsidiaries of BNY Mellon have been informed by German authorities about investigations into potential cum/ex trading by certain third-party investment funds, where one of the subsidiaries had acquired entities that served as depositary and/or fund manager for those third-party investment funds. We have received information requests from the authorities relating to pre-acquisition activity and are cooperating fully with those requests. In August 2019, the District Court of Bonn ordered that one of these subsidiaries be joined as a secondary party in connection with the prosecution of unrelated individual defendants. Trial commenced in September 2019. In March 2020, the court stated that it would refrain from taking action against the subsidiary in order to expedite the conclusion of the trial. The court convicted the unrelated individual defendants, and determined that the cum/ex trading activities of the relevant third-party investment funds were unlawful. In November and December 2020, we received secondary liability notices from the German tax authorities totaling approximately $150 million related to pre-acquisition activity in various funds for which the entities we acquired were depositary and/or fund manager. We have appealed the notices. In connection with the acquisition of the subject entities, we obtained an indemnity for liabilities from the sellers that we intend to pursue as necessary.
Note 23–Derivative instruments
We use derivatives to manage exposure to market risk, including interest rate risk, equity price risk and
Notes to Consolidated Financial Statements (continued)
BNY Mellon 189
foreign currency risk, as well as credit risk. Our trading activities are focused on acting as a market-maker for our customers and facilitating customer trades in compliance with the Volcker Rule.
The notional amounts for derivative financial instruments express the dollar volume of the transactions; however, credit risk is much smaller. We perform credit reviews and enter into netting agreements and collateral arrangements to minimize the credit risk of derivative financial instruments. We enter into offsetting positions to reduce exposure to foreign currency, interest rate and equity price risk.
Use of derivative financial instruments involves reliance on counterparties. Failure of a counterparty to honor its obligation under a derivative contract is a risk we assume whenever we engage in a derivative contract. There were no counterparty default losses recorded in 2020.
Hedging derivatives
We utilize interest rate swap agreements to manage our exposure to interest rate fluctuations. We enter into fair value hedges as an interest rate risk management strategy to reduce fair value variability by converting certain fixed rate interest payments associated with available-for-sale securities and long-term debt to floating interest rates. We also utilize interest rate swaps and forward exchange contracts as cash flow hedges to manage our exposure to interest rate and foreign exchange rate changes.
The available-for-sale securities hedged consist of U.S. Treasury, agency and non-agency commercial MBS, sovereign debt/sovereign guaranteed, corporate bonds and foreign covered bonds. At Dec. 31, 2020, $17.4 billion par value of available-for-sale securities were hedged with interest rate swaps designated as fair value hedges that had notional values of $17.5 billion.
The fixed rate long-term debt instruments hedged generally have original maturities of five to 30 years. In fair value hedging relationships, fixed rate debt is hedged with “receive fixed rate, pay variable rate” swaps. At Dec. 31, 2020, $13.9 billion par value of debt was hedged with interest rate swaps designated as fair value hedges that had notional values of $13.9 billion.
In addition, we utilize forward foreign exchange contracts as hedges to mitigate foreign exchange exposures. We use forward foreign exchange contracts as cash flow hedges to convert certain forecasted non-U.S. dollar revenue and expenses into U.S. dollars. We use forward foreign exchange contracts with maturities of 15 months or less as cash flow hedges to hedge our foreign exchange exposure to currencies such as Indian rupee, British pound, Euro, Hong Kong dollar, Polish zloty and Singapore dollar used in revenue and expense transactions for entities that have the U.S. dollar as their functional currency. As of Dec. 31, 2020, the hedged forecasted foreign currency transactions and designated forward foreign exchange contract hedges were $346 million (notional), with a pre-tax gain of $10 million recorded in accumulated OCI. This gain will be reclassified to earnings over the next 12 months.
We also utilize forward foreign exchange contracts as fair value hedges of the foreign exchange risk associated with available-for-sale securities. Forward points are designated as an excluded component and amortized into earnings over the hedge period. The unamortized derivative value associated with the excluded component is recognized in accumulated OCI. At Dec. 31, 2020, $148 million par value of available-for-sale securities was hedged with foreign currency forward contracts that had a notional value of $148 million.
Forward foreign exchange contracts are also used to hedge the value of our net investments in foreign subsidiaries. These forward foreign exchange contracts have maturities of less than one year. The derivatives employed are designated as hedges of changes in value of our foreign investments due to exchange rates. The change in fair market value of these forward foreign exchange contracts is reported within foreign currency translation adjustments in shareholders’ equity, net of tax. At Dec. 31, 2020, forward foreign exchange contracts with notional amounts totaling $8.2 billion were designated as net investment hedges.
In addition to forward foreign exchange contracts, we also designate non-derivative financial instruments as hedges of our net investments in foreign subsidiaries. Those non-derivative financial instruments designated as hedges of our net investments in foreign subsidiaries were all long-term liabilities of BNY Mellon and, at Dec. 31, 2020, had a combined U.S. dollar equivalent carrying value of $187 million.
Notes to Consolidated Financial Statements (continued)
190 BNY Mellon
The following table presents the pre-tax gains (losses) related to our fair value and cash flow hedging activities recognized in the consolidated income statement.
Income statement impact of fair value and cash flow hedges
(in millions)Location of gains (losses) 2020 2019 2018
Interest rate fair value hedges of available-for-sale securitiesDerivative Interest revenue $ (627) $ (795) $ 284 Hedged item Interest revenue 624 788 (273)
Interest rate fair value hedges of long-term debtDerivative Interest expense 587 486 (328) Hedged item Interest expense (586) (483) 330
Foreign exchange fair value hedges of available-for-sale securitiesDerivative (a) Other revenue (9) 9 (2) Hedged item Other revenue 11 (8) 2
Cash flow hedge of interest rate riskGain reclassified from OCI into income Interest expense — 7 —
Cash flow hedges of forecasted FX exposuresGain reclassified from OCI into income Other revenue — — 2 (Loss) gain reclassified from OCI into income Staff expense (1) 3 (4)
(Loss) gain recognized in the consolidated income statement due to fair value and cash flow hedging relationships $ (1) $ 7 $ 11
(a) Includes gains of $1 million in 2020 and $2 million in 2019 and a (loss) of $1 million in 2018 associated with the amortization of the excluded component. At Dec. 31, 2020 and Dec. 31, 2019, the remaining accumulated OCI balance associated with the excluded component was de minimis.
The following table presents the impact of hedging derivatives used in net investment hedging relationships.
Impact of derivative instruments used in net investment hedging relationships(in millions)
Derivatives in net investment hedging relationships
Gain or (loss) recognized in accumulated OCI on derivatives
Year ended Dec. 31, Location of gain or (loss) reclassified from accumulated OCI into income
Gain or (loss) reclassified from accumulated OCI into income
Year ended Dec. 31,2020 2019 2018 2020 2019 2018
FX contracts $ (284) $ (19) $ 535 Net interest revenue $ — $ — $ —
The following table presents information on the hedged items in fair value hedging relationships.
Hedged items in fair value hedging relationships Carrying amount of hedged asset or liability
Hedge accounting basis adjustment increase (decrease) (a)
Dec. 31, Dec. 31,(in millions) 2020 2019 2020 2019Available-for-sale securities (b)(c) $ 17,536 $ 13,792 $ 1,428 $ 687 Long-term debt $ 14,784 $ 13,945 $ 783 $ 116
(a) Includes $177 million and $53 million of basis adjustment increases on discontinued hedges associated with available-for-sale securities at Dec. 31, 2020 and Dec. 31, 2019, respectively, and $118 million and $200 million of basis adjustment decreases on discontinued hedges associated with long-term debt at Dec. 31, 2020 and Dec. 31, 2019, respectively.
(b) Excludes hedged items where only foreign currency risk is the designated hedged risk, as the basis adjustments related to foreign currency hedges will not reverse through the consolidated income statement in future periods. The carrying amount excluded for available-for-sale securities was $148 million at Dec. 31, 2020 and $142 million at Dec. 31, 2019.
(c) Carrying amount represents the amortized cost.
Notes to Consolidated Financial Statements (continued)
BNY Mellon 191
The following table summarizes the notional amount and carrying values of our total derivative portfolio at Dec. 31, 2020 and Dec. 31, 2019.
Impact of derivative instruments on the balance sheetNotional value
Asset derivativesfair value
Liability derivativesfair value
Dec. 31, 2020
Dec. 31, 2019
Dec. 31, 2020
Dec. 31, 2019
Dec. 31, 2020
Dec. 31, 2019(in millions)
Derivatives designated as hedging instruments: (a)(b)Interest rate contracts $ 31,360 $ 28,365 $ — $ — $ 666 $ 350 Foreign exchange contracts 8,706 8,390 19 21 441 257
Total derivatives designated as hedging instruments $ 19 $ 21 $ 1,107 $ 607 Derivatives not designated as hedging instruments: (b)(c)Interest rate contracts $ 198,865 $ 306,790 $ 4,482 $ 3,690 $ 3,880 $ 3,250 Foreign exchange contracts 813,003 848,961 7,688 5,331 7,622 5,340 Equity contracts 5,142 3,189 2 19 37 5 Credit contracts 165 165 — — 4 4
Total derivatives not designated as hedging instruments $ 12,172 $ 9,040 $ 11,543 $ 8,599 Total derivatives fair value (d) $ 12,191 $ 9,061 $ 12,650 $ 9,206 Effect of master netting agreements (e) (8,346) (5,819) (7,845) (5,415)
Fair value after effect of master netting agreements $ 3,845 $ 3,242 $ 4,805 $ 3,791 (a) The fair value of asset derivatives and liability derivatives designated as hedging instruments is recorded as other assets and other
liabilities, respectively, on the consolidated balance sheet.(b) For derivative transactions settled at clearing organizations, cash collateral exchanged is deemed a settlement of the derivative each
day. The settlement reduces the gross fair value of derivative assets and liabilities and results in a corresponding decrease in the effect of master netting agreements, with no impact to the consolidated balance sheet.
(c) The fair value of asset derivatives and liability derivatives not designated as hedging instruments is recorded as trading assets and trading liabilities, respectively, on the consolidated balance sheet.
(d) Fair values are on a gross basis, before consideration of master netting agreements, as required by ASC 815, Derivatives and Hedging.(e) Effect of master netting agreements includes cash collateral received and paid of $1,552 million and $1,051 million, respectively, at
Dec. 31, 2020, and $1,022 million and $618 million, respectively, at Dec. 31, 2019.
Trading activities (including trading derivatives)
Our trading activities are focused on acting as a market-maker for our customers, facilitating customer trades and risk-mitigating economic hedging in compliance with the Volcker Rule. The change in the fair value of the derivatives utilized in our trading activities is recorded in foreign exchange and other trading revenue on the consolidated income statement.
The following table presents our foreign exchange and other trading revenue.
Foreign exchange and other trading revenue Year ended Dec. 31,
(in millions) 2020 2019 2018Foreign exchange $ 776 $ 577 $ 663 Other trading revenue 13 77 69
Total foreign exchange and other trading revenue $ 789 $ 654 $ 732
Foreign exchange revenue includes income from purchasing and selling foreign currencies and currency forwards, futures and options. Other trading
revenue reflects results from trading in cash instruments, including fixed income and equity securities and non-foreign exchange derivatives.
We also use derivative financial instruments as risk-mitigating economic hedges, which are not formally designated as accounting hedges. This includes hedging the foreign currency, interest rate or market risks inherent in some of our balance sheet exposures, such as seed capital investments and deposits, as well as certain investment management fee revenue streams. We also use total return swaps to economically hedge obligations arising from the Company’s deferred compensation plan whereby the participants defer compensation and earn a return linked to the performance of investments they select. The gains or losses on these total return swaps are recorded in staff expense on the consolidated income statement and were gains of $22 million in 2020 and $36 million in 2019 and a loss of $20 million in 2018.
We manage trading risk through a system of position limits, a value-at-risk (“VaR”) methodology based on historical simulation and other market sensitivity measures. Risk is monitored and reported to senior
Notes to Consolidated Financial Statements (continued)
192 BNY Mellon
management by a separate unit, independent from trading, on a daily basis. Based on certain assumptions, the VaR methodology is designed to capture the potential overnight pre-tax dollar loss from adverse changes in fair values of all trading positions. The calculation assumes a one-day holding period, utilizes a 99% confidence level and incorporates non-linear product characteristics. The VaR model is one of several statistical models used to develop economic capital results, which are allocated to lines of business for computing risk-adjusted performance.
VaR methodology does not evaluate risk attributable to extraordinary financial, economic or other occurrences. As a result, the risk assessment process includes a number of stress scenarios based upon the risk factors in the portfolio and management’s assessment of market conditions. Additional stress scenarios based upon historical market events are also performed. Stress tests may incorporate the impact of reduced market liquidity and the breakdown of historically observed correlations and extreme scenarios. VaR and other statistical measures, stress testing and sensitivity analysis are incorporated into other risk management materials.
Counterparty credit risk and collateral
We assess the credit risk of our counterparties through regular examination of their financial statements, confidential communication with the management of those counterparties and regular monitoring of publicly available credit rating information. This and other information is used to develop proprietary credit rating metrics used to assess credit quality.
Collateral requirements are determined after a comprehensive review of the credit quality of each counterparty. Collateral is generally held or pledged in the form of cash and/or highly liquid government securities. Collateral requirements are monitored and adjusted daily.
Additional disclosures concerning derivative financial instruments are provided in Note 20.
Disclosure of contingent features in OTC derivative instruments
Certain OTC derivative contracts and/or collateral agreements contain credit risk-contingent features
triggered upon a rating downgrade in which the counterparty has the right to request additional collateral or the right to terminate the contracts in a net liability position.
The following table shows the aggregate fair value of OTC derivative contracts in net liability positions that contained credit risk-contingent features and the value of collateral that has been posted.
Dec. 31, 2020
Dec. 31, 2019(in millions)
Aggregate fair value of OTC derivatives in net liability positions (a) $ 5,235 $ 3,442
Collateral posted $ 5,568 $ 3,671 (a) Before consideration of cash collateral.
The aggregate fair value of OTC derivative contracts containing credit risk-contingent features can fluctuate from quarter to quarter due to changes in market conditions, composition of counterparty trades, new business or changes to the contingent features.
The Bank of New York Mellon, our largest banking subsidiary, enters into the substantial majority of our OTC derivative contracts and/or collateral agreements. As such, the contingent features may be triggered if The Bank of New York Mellon’s long-term issuer rating were downgraded.
The following table shows the fair value of contracts falling under early termination provisions that were in net liability positions for three key ratings triggers.
Potential close-out exposures (fair value) (a)Dec. 31,
2020Dec. 31,
2019(in millions)If The Bank of New York Mellon’s rating changed to: (b)
A3/A- $ 79 $ 56 Baa2/BBB $ 813 $ 608 Ba1/BB+ $ 2,859 $ 2,084
(a) The amounts represent potential total close-out values if The Bank of New York Mellon’s long-term issuer rating were to immediately drop to the indicated levels, and do not reflect collateral posted.
(b) Represents ratings by Moody’s/S&P.
If The Bank of New York Mellon’s debt rating had fallen below investment grade on Dec. 31, 2020 and Dec. 31, 2019, existing collateral arrangements would have required us to post additional collateral of $41 million and $63 million, respectively.
Notes to Consolidated Financial Statements (continued)
BNY Mellon 193
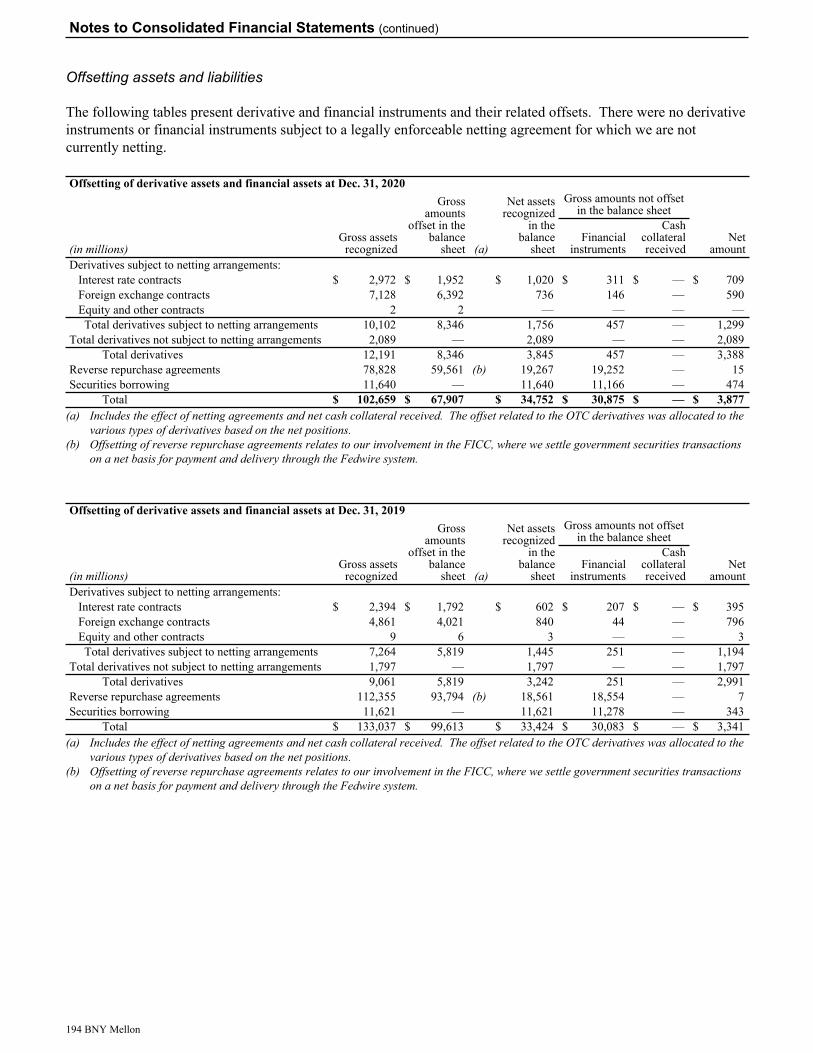
Offsetting assets and liabilities
The following tables present derivative and financial instruments and their related offsets. There were no derivative instruments or financial instruments subject to a legally enforceable netting agreement for which we are not currently netting.
Offsetting of derivative assets and financial assets at Dec. 31, 2020
Gross assets recognized
Gross amounts
offset in the balance
sheet
Net assets recognized
in the balance
sheet
Gross amounts not offset in the balance sheet
(in millions) (a)Financial
instruments
Cash collateral received
Net amount
Derivatives subject to netting arrangements:Interest rate contracts $ 2,972 $ 1,952 $ 1,020 $ 311 $ — $ 709 Foreign exchange contracts 7,128 6,392 736 146 — 590 Equity and other contracts 2 2 — — — — Total derivatives subject to netting arrangements 10,102 8,346 1,756 457 — 1,299
Total derivatives not subject to netting arrangements 2,089 — 2,089 — — 2,089 Total derivatives 12,191 8,346 3,845 457 — 3,388
Reverse repurchase agreements 78,828 59,561 (b) 19,267 19,252 — 15 Securities borrowing 11,640 — 11,640 11,166 — 474
Total $ 102,659 $ 67,907 $ 34,752 $ 30,875 $ — $ 3,877 (a) Includes the effect of netting agreements and net cash collateral received. The offset related to the OTC derivatives was allocated to the
various types of derivatives based on the net positions.(b) Offsetting of reverse repurchase agreements relates to our involvement in the FICC, where we settle government securities transactions
on a net basis for payment and delivery through the Fedwire system.
Offsetting of derivative assets and financial assets at Dec. 31, 2019
Gross assets recognized
Gross amounts
offset in the balance
sheet
Net assets recognized
in the balance
sheet
Gross amounts not offset in the balance sheet
(in millions) (a)Financial
instruments
Cash collateral received
Net amount
Derivatives subject to netting arrangements:Interest rate contracts $ 2,394 $ 1,792 $ 602 $ 207 $ — $ 395 Foreign exchange contracts 4,861 4,021 840 44 — 796 Equity and other contracts 9 6 3 — — 3 Total derivatives subject to netting arrangements 7,264 5,819 1,445 251 — 1,194
Total derivatives not subject to netting arrangements 1,797 — 1,797 — — 1,797 Total derivatives 9,061 5,819 3,242 251 — 2,991
Reverse repurchase agreements 112,355 93,794 (b) 18,561 18,554 — 7 Securities borrowing 11,621 — 11,621 11,278 — 343
Total $ 133,037 $ 99,613 $ 33,424 $ 30,083 $ — $ 3,341 (a) Includes the effect of netting agreements and net cash collateral received. The offset related to the OTC derivatives was allocated to the
various types of derivatives based on the net positions.(b) Offsetting of reverse repurchase agreements relates to our involvement in the FICC, where we settle government securities transactions
on a net basis for payment and delivery through the Fedwire system.
Notes to Consolidated Financial Statements (continued)
194 BNY Mellon
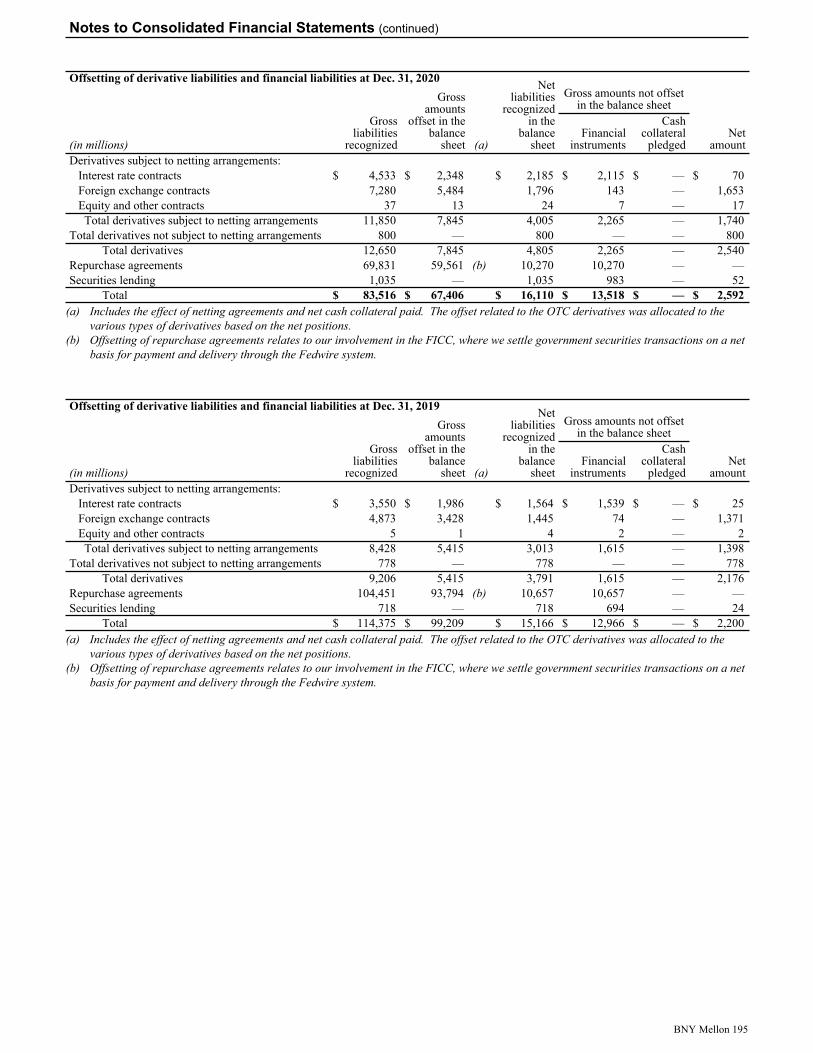
Offsetting of derivative liabilities and financial liabilities at Dec. 31, 2020 Net liabilities
recognized in the
balance sheet
Gross liabilities
recognized
Gross amounts
offset in the balance
sheet
Gross amounts not offset in the balance sheet
(in millions) (a)Financial
instruments
Cash collateral
pledgedNet
amountDerivatives subject to netting arrangements:
Interest rate contracts $ 4,533 $ 2,348 $ 2,185 $ 2,115 $ — $ 70 Foreign exchange contracts 7,280 5,484 1,796 143 — 1,653 Equity and other contracts 37 13 24 7 — 17 Total derivatives subject to netting arrangements 11,850 7,845 4,005 2,265 — 1,740
Total derivatives not subject to netting arrangements 800 — 800 — — 800 Total derivatives 12,650 7,845 4,805 2,265 — 2,540
Repurchase agreements 69,831 59,561 (b) 10,270 10,270 — — Securities lending 1,035 — 1,035 983 — 52
Total $ 83,516 $ 67,406 $ 16,110 $ 13,518 $ — $ 2,592 (a) Includes the effect of netting agreements and net cash collateral paid. The offset related to the OTC derivatives was allocated to the
various types of derivatives based on the net positions.(b) Offsetting of repurchase agreements relates to our involvement in the FICC, where we settle government securities transactions on a net
basis for payment and delivery through the Fedwire system.
Offsetting of derivative liabilities and financial liabilities at Dec. 31, 2019 Net liabilities
recognized in the
balance sheet
Gross liabilities
recognized
Gross amounts
offset in the balance
sheet
Gross amounts not offset in the balance sheet
(in millions) (a)Financial
instruments
Cash collateral
pledgedNet
amountDerivatives subject to netting arrangements:
Interest rate contracts $ 3,550 $ 1,986 $ 1,564 $ 1,539 $ — $ 25 Foreign exchange contracts 4,873 3,428 1,445 74 — 1,371 Equity and other contracts 5 1 4 2 — 2 Total derivatives subject to netting arrangements 8,428 5,415 3,013 1,615 — 1,398
Total derivatives not subject to netting arrangements 778 — 778 — — 778 Total derivatives 9,206 5,415 3,791 1,615 — 2,176
Repurchase agreements 104,451 93,794 (b) 10,657 10,657 — — Securities lending 718 — 718 694 — 24
Total $ 114,375 $ 99,209 $ 15,166 $ 12,966 $ — $ 2,200 (a) Includes the effect of netting agreements and net cash collateral paid. The offset related to the OTC derivatives was allocated to the
various types of derivatives based on the net positions.(b) Offsetting of repurchase agreements relates to our involvement in the FICC, where we settle government securities transactions on a net
basis for payment and delivery through the Fedwire system.
Notes to Consolidated Financial Statements (continued)
BNY Mellon 195
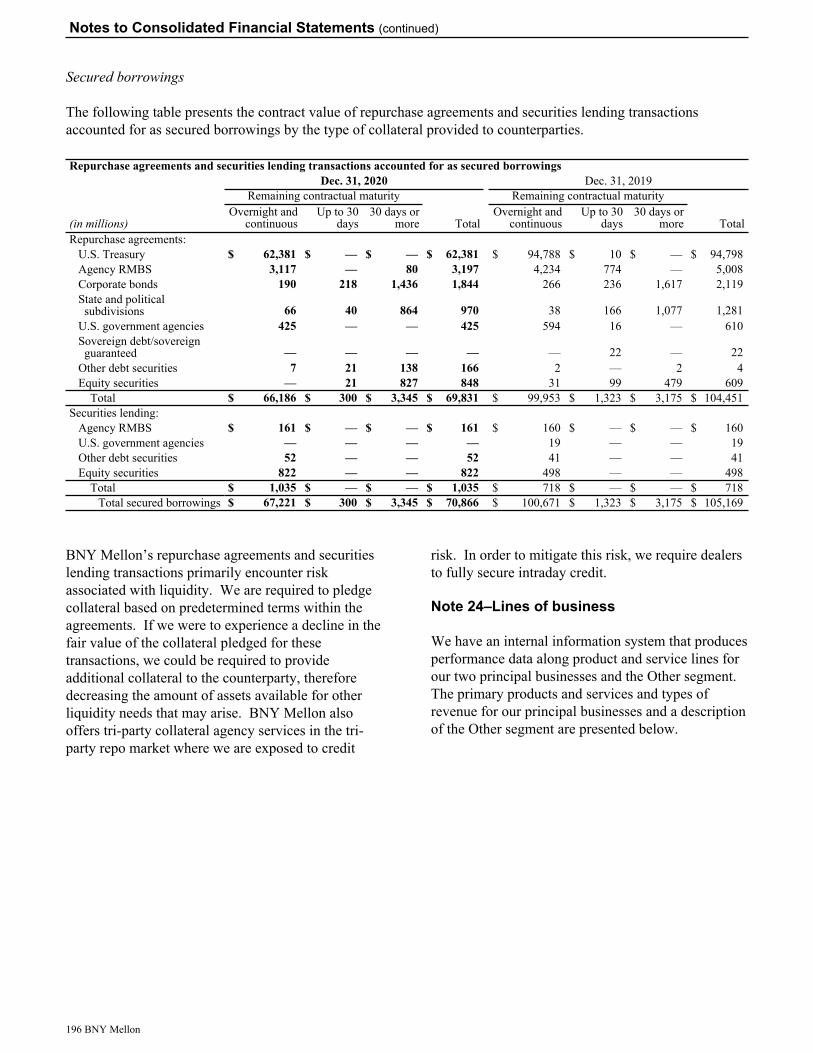
Secured borrowings
The following table presents the contract value of repurchase agreements and securities lending transactions accounted for as secured borrowings by the type of collateral provided to counterparties.
Repurchase agreements and securities lending transactions accounted for as secured borrowingsDec. 31, 2020 Dec. 31, 2019
Remaining contractual maturity
Total
Remaining contractual maturity
Total(in millions)Overnight and
continuousUp to 30
days30 days or
moreOvernight and
continuousUp to 30
days30 days or
moreRepurchase agreements:
U.S. Treasury $ 62,381 $ — $ — $ 62,381 $ 94,788 $ 10 $ — $ 94,798 Agency RMBS 3,117 — 80 3,197 4,234 774 — 5,008 Corporate bonds 190 218 1,436 1,844 266 236 1,617 2,119 State and political subdivisions 66 40 864 970 38 166 1,077 1,281
U.S. government agencies 425 — — 425 594 16 — 610 Sovereign debt/sovereign guaranteed — — — — — 22 — 22
Other debt securities 7 21 138 166 2 — 2 4 Equity securities — 21 827 848 31 99 479 609
Total $ 66,186 $ 300 $ 3,345 $ 69,831 $ 99,953 $ 1,323 $ 3,175 $ 104,451 Securities lending:
Agency RMBS $ 161 $ — $ — $ 161 $ 160 $ — $ — $ 160 U.S. government agencies — — — — 19 — — 19 Other debt securities 52 — — 52 41 — — 41 Equity securities 822 — — 822 498 — — 498
Total $ 1,035 $ — $ — $ 1,035 $ 718 $ — $ — $ 718 Total secured borrowings $ 67,221 $ 300 $ 3,345 $ 70,866 $ 100,671 $ 1,323 $ 3,175 $ 105,169
BNY Mellon’s repurchase agreements and securities lending transactions primarily encounter risk associated with liquidity. We are required to pledge collateral based on predetermined terms within the agreements. If we were to experience a decline in the fair value of the collateral pledged for these transactions, we could be required to provide additional collateral to the counterparty, therefore decreasing the amount of assets available for other liquidity needs that may arise. BNY Mellon also offers tri-party collateral agency services in the tri-party repo market where we are exposed to credit
risk. In order to mitigate this risk, we require dealers to fully secure intraday credit.
Note 24–Lines of business
We have an internal information system that produces performance data along product and service lines for our two principal businesses and the Other segment. The primary products and services and types of revenue for our principal businesses and a description of the Other segment are presented below.
Notes to Consolidated Financial Statements (continued)
196 BNY Mellon

Investment Services business
Line of business Primary products and services Primary types of revenueAsset Servicing Custody, Trust & Depositary, accounting,
ETF services, middle-office solutions, transfer agency, services for private equity and real estate funds, foreign exchange, securities lending, liquidity/lending services, prime brokerage and data analytics
– Asset servicing fees (includes securities lending revenue)
– Net interest revenue– Foreign exchange revenue– Financing-related fees
Pershing Clearing and custody, investment, wealth and retirement solutions, technology and enterprise data management, trading services and prime brokerage
– Clearing services fees– Net interest revenue
Issuer Services Corporate Trust (trustee, paying agency, fiduciary, escrow and other financial services) and Depositary Receipts (issuer services and support for brokers and investors)
– Issuer services fees– Net interest revenue– Foreign exchange revenue
Treasury Services Integrated cash management solutions including payments, foreign exchange, liquidity management, receivables processing and payables management and trade finance and processing
– Treasury services fees – Net interest revenue– Foreign exchange revenue
Clearance and Collateral Management Clearance (including U.S. government and global clearing services) and Global Collateral Management (including tri-party services)
– Asset servicing fees– Net interest revenue
Investment and Wealth Management business
Line of business Primary products and services Primary types of revenueInvestment Management Diversified investment management
strategies and distribution of investment products
– Investment management fees – Performance fees– Distribution and servicing fees
Wealth Management Investment management, custody, wealth and estate planning, private banking services, investment services and information management
– Investment management fees– Net interest revenue
Other segment Description Primary types of revenueIncludes leasing portfolio, corporate treasury activities, including our securities portfolio, derivatives and other trading activity, corporate and bank-owned life insurance, renewable energy investments and certain business exits
– Foreign exchange and other trading revenue
– Net gain (loss) on securities– Investment and other income– Net interest revenue (expense)
Notes to Consolidated Financial Statements (continued)
BNY Mellon 197
Business accounting principles
Our business data has been determined on an internal management basis of accounting, rather than GAAP which is used for consolidated financial reporting. These measurement principles are designed so that reported results of the businesses will track their economic performance.
Business results are subject to reclassification when organizational changes are made, or for refinements in revenue and expense allocation methodologies. Refinements are typically reflected on a prospective basis. In 2020, we reclassified the results of certain services provided between the segments from noninterest expense to fee and other revenue. The intersegment activity is eliminated in the Other segment and relates to services that are also provided to third parties and provides consistency with the reporting of the revenues. This adjustment had no impact on income before taxes of the businesses. Also in 2020, we reclassified the results related to certain lending activities from the Wealth Management business to the Pershing business. These loans were originated by the Wealth Management business as a service to Pershing clients. This resulted in an increase in total revenue, noninterest expense and income before taxes in the Pershing business and corresponding decrease in the Wealth Management business. Prior periods were restated for both reclassifications.
The accounting policies of the businesses are the same as those described in Note 1.
The results of our businesses are presented and analyzed on an internal management reporting basis.
• Revenue amounts reflect fee and other revenue generated by each business and include revenue for services provided between the segments that are also provided to third parties. Fee and other revenue transferred between businesses under revenue transfer agreements is included within other revenue in each business.
• Revenues and expenses associated with specific client bases are included in those businesses. For
example, foreign exchange activity associated with clients using custody products is included in Investment Services.
• Net interest revenue is allocated to businesses based on the yields on the assets and liabilities generated by each business. We employ a funds transfer pricing system that matches funds with the specific assets and liabilities of each business based on their interest sensitivity and maturity characteristics.
• The provision for credit losses associated with the respective credit portfolios is reflected in each business segment.
• Incentives expense related to restricted stock and RSUs is allocated to the businesses.
• Support and other indirect expenses, including services provided between segments that are not provided to third parties or not subject to a revenue transfer agreement, are allocated to businesses based on internally developed methodologies and reflected in noninterest expense.
• Recurring FDIC expense is allocated to the businesses based on average deposits generated within each business.
• Litigation expense is generally recorded in the business in which the charge occurs.
• Management of the securities portfolio is a shared service contained in the Other segment. As a result, gains and losses associated with the valuation of the securities portfolio are generally included in the Other segment.
• Client deposits serve as the primary funding source for our securities portfolio. We typically allocate all interest revenue to the businesses generating the deposits. Accordingly, accretion related to the portion of the securities portfolio restructured in 2009 has been included in the results of the businesses.
• Balance sheet assets and liabilities and their related income or expense are specifically assigned to each business. Businesses with a net liability position have been allocated assets.
• Goodwill and intangible assets are reflected within individual businesses.
Notes to Consolidated Financial Statements (continued)
198 BNY Mellon
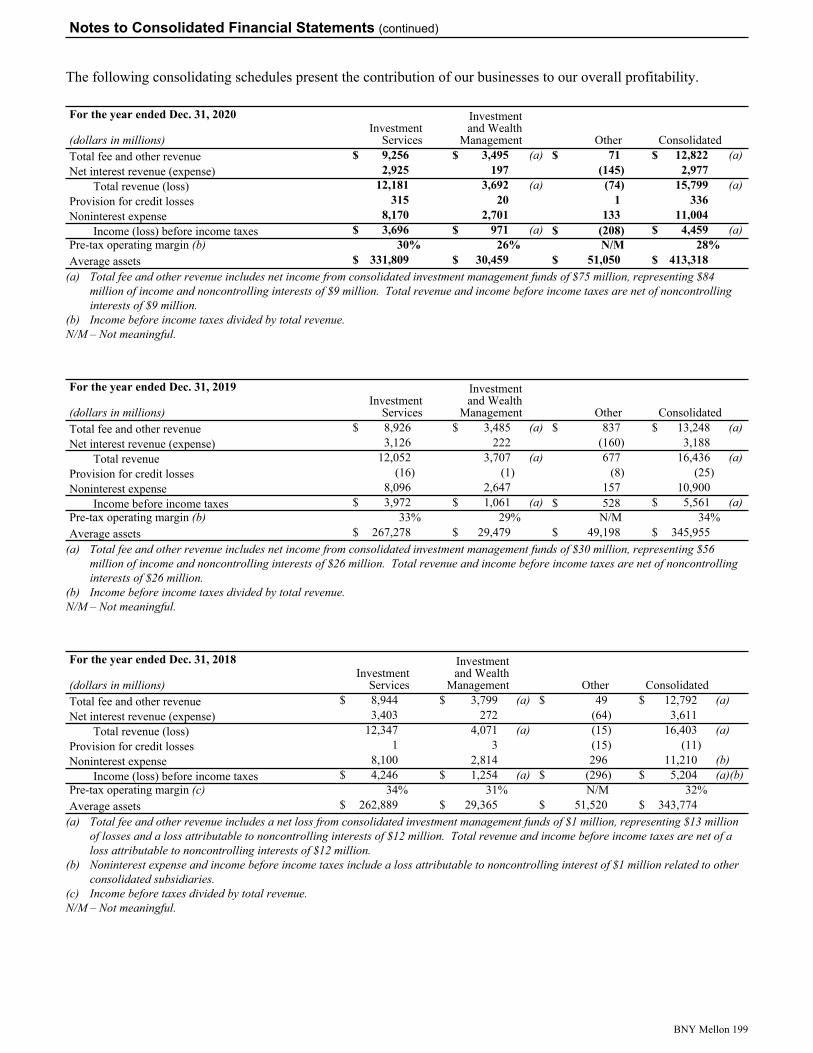
The following consolidating schedules present the contribution of our businesses to our overall profitability.
For the year ended Dec. 31, 2020Investment
Services
Investment and Wealth
Management Other Consolidated(dollars in millions)Total fee and other revenue $ 9,256 $ 3,495 (a) $ 71 $ 12,822 (a)Net interest revenue (expense) 2,925 197 (145) 2,977
Total revenue (loss) 12,181 3,692 (a) (74) 15,799 (a)Provision for credit losses 315 20 1 336 Noninterest expense 8,170 2,701 133 11,004
Income (loss) before income taxes $ 3,696 $ 971 (a) $ (208) $ 4,459 (a)Pre-tax operating margin (b) 30% 26% N/M 28% Average assets $ 331,809 $ 30,459 $ 51,050 $ 413,318
(a) Total fee and other revenue includes net income from consolidated investment management funds of $75 million, representing $84 million of income and noncontrolling interests of $9 million. Total revenue and income before income taxes are net of noncontrolling interests of $9 million.
(b) Income before income taxes divided by total revenue.N/M – Not meaningful.
For the year ended Dec. 31, 2019Investment
Services
Investment and Wealth
Management Other Consolidated(dollars in millions)Total fee and other revenue $ 8,926 $ 3,485 (a) $ 837 $ 13,248 (a)Net interest revenue (expense) 3,126 222 (160) 3,188
Total revenue 12,052 3,707 (a) 677 16,436 (a)Provision for credit losses (16) (1) (8) (25) Noninterest expense 8,096 2,647 157 10,900
Income before income taxes $ 3,972 $ 1,061 (a) $ 528 $ 5,561 (a)Pre-tax operating margin (b) 33% 29% N/M 34% Average assets $ 267,278 $ 29,479 $ 49,198 $ 345,955
(a) Total fee and other revenue includes net income from consolidated investment management funds of $30 million, representing $56 million of income and noncontrolling interests of $26 million. Total revenue and income before income taxes are net of noncontrolling interests of $26 million.
(b) Income before income taxes divided by total revenue.N/M – Not meaningful.
For the year ended Dec. 31, 2018Investment
Services
Investment and Wealth
Management Other Consolidated(dollars in millions)Total fee and other revenue $ 8,944 $ 3,799 (a) $ 49 $ 12,792 (a)Net interest revenue (expense) 3,403 272 (64) 3,611
Total revenue (loss) 12,347 4,071 (a) (15) 16,403 (a)Provision for credit losses 1 3 (15) (11) Noninterest expense 8,100 2,814 296 11,210 (b)
Income (loss) before income taxes $ 4,246 $ 1,254 (a) $ (296) $ 5,204 (a)(b)Pre-tax operating margin (c) 34% 31% N/M 32% Average assets $ 262,889 $ 29,365 $ 51,520 $ 343,774
(a) Total fee and other revenue includes a net loss from consolidated investment management funds of $1 million, representing $13 million of losses and a loss attributable to noncontrolling interests of $12 million. Total revenue and income before income taxes are net of a loss attributable to noncontrolling interests of $12 million.
(b) Noninterest expense and income before income taxes include a loss attributable to noncontrolling interest of $1 million related to other consolidated subsidiaries.
(c) Income before taxes divided by total revenue.N/M – Not meaningful.
Notes to Consolidated Financial Statements (continued)
BNY Mellon 199
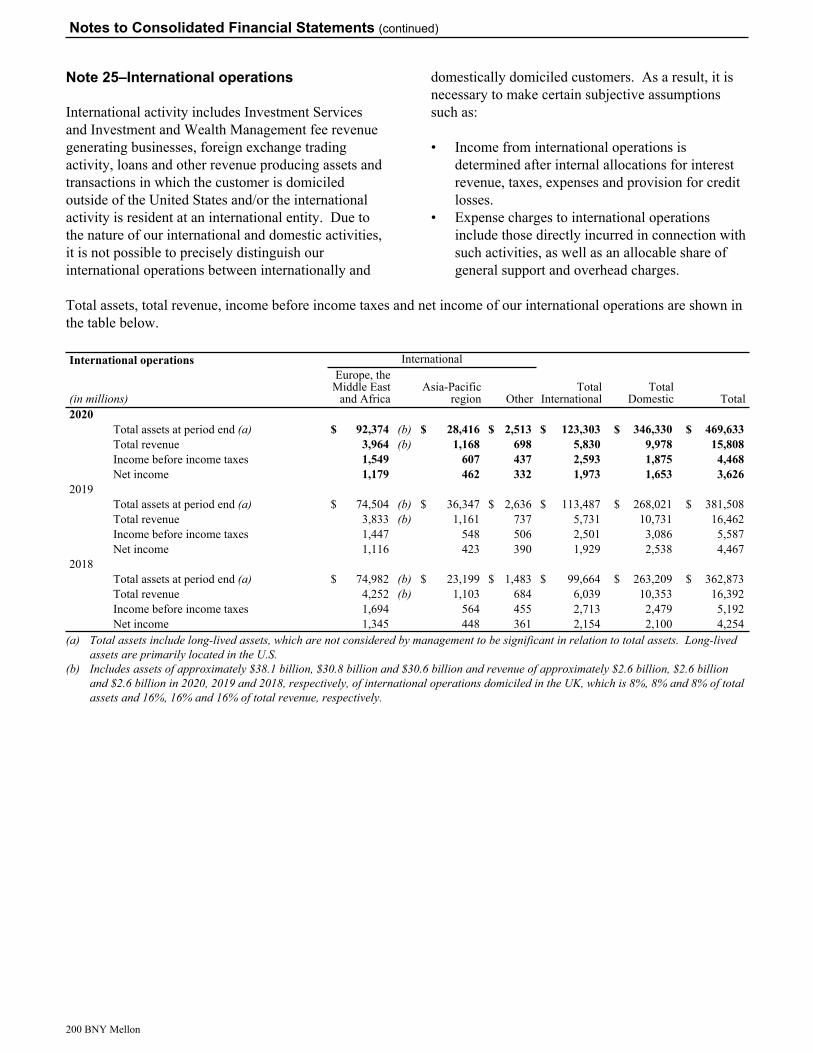
Note 25–International operations
International activity includes Investment Services and Investment and Wealth Management fee revenue generating businesses, foreign exchange trading activity, loans and other revenue producing assets and transactions in which the customer is domiciled outside of the United States and/or the international activity is resident at an international entity. Due to the nature of our international and domestic activities, it is not possible to precisely distinguish our international operations between internationally and
domestically domiciled customers. As a result, it is necessary to make certain subjective assumptions such as:
• Income from international operations is determined after internal allocations for interest revenue, taxes, expenses and provision for credit losses.
• Expense charges to international operations include those directly incurred in connection with such activities, as well as an allocable share of general support and overhead charges.
Total assets, total revenue, income before income taxes and net income of our international operations are shown in the table below.
International operations International
TotalInternational
TotalDomestic(in millions)
Europe, the Middle East
and AfricaAsia-Pacific
region Other Total2020
Total assets at period end (a) $ 92,374 (b) $ 28,416 $ 2,513 $ 123,303 $ 346,330 $ 469,633 Total revenue 3,964 (b) 1,168 698 5,830 9,978 15,808 Income before income taxes 1,549 607 437 2,593 1,875 4,468 Net income 1,179 462 332 1,973 1,653 3,626
2019Total assets at period end (a) $ 74,504 (b) $ 36,347 $ 2,636 $ 113,487 $ 268,021 $ 381,508 Total revenue 3,833 (b) 1,161 737 5,731 10,731 16,462 Income before income taxes 1,447 548 506 2,501 3,086 5,587 Net income 1,116 423 390 1,929 2,538 4,467
2018Total assets at period end (a) $ 74,982 (b) $ 23,199 $ 1,483 $ 99,664 $ 263,209 $ 362,873 Total revenue 4,252 (b) 1,103 684 6,039 10,353 16,392 Income before income taxes 1,694 564 455 2,713 2,479 5,192 Net income 1,345 448 361 2,154 2,100 4,254
(a) Total assets include long-lived assets, which are not considered by management to be significant in relation to total assets. Long-lived assets are primarily located in the U.S.
(b) Includes assets of approximately $38.1 billion, $30.8 billion and $30.6 billion and revenue of approximately $2.6 billion, $2.6 billion and $2.6 billion in 2020, 2019 and 2018, respectively, of international operations domiciled in the UK, which is 8%, 8% and 8% of total assets and 16%, 16% and 16% of total revenue, respectively.
Notes to Consolidated Financial Statements (continued)
200 BNY Mellon
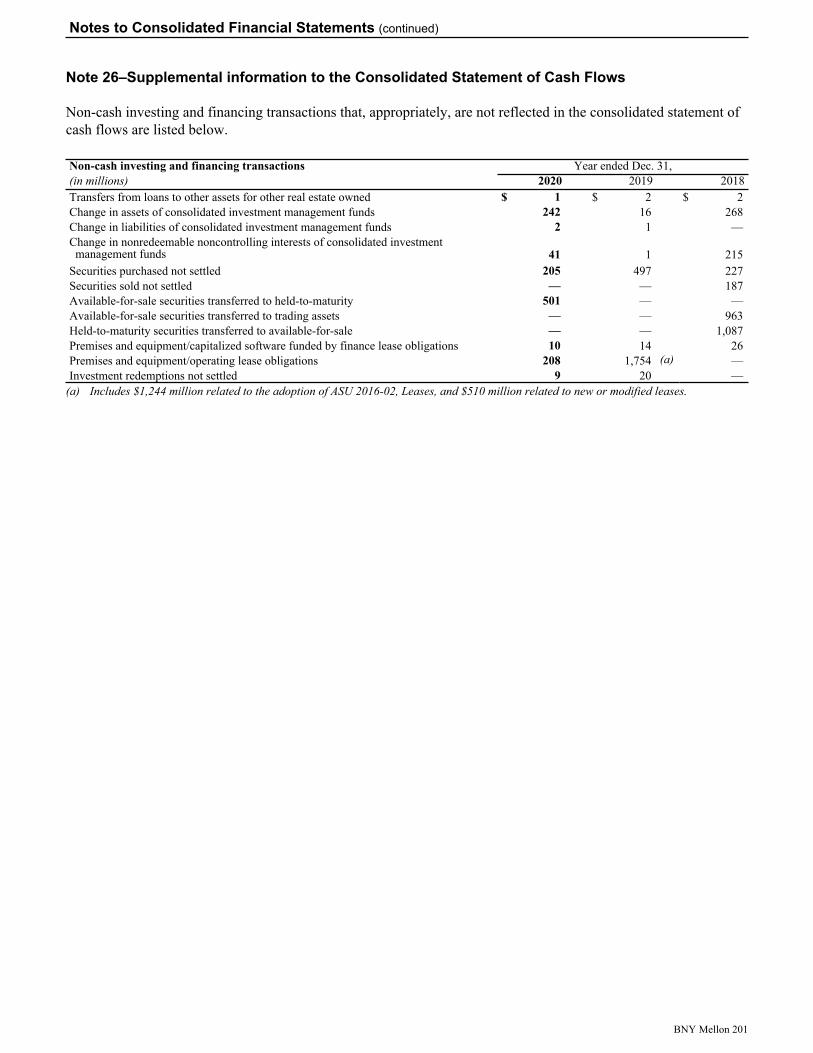
Note 26–Supplemental information to the Consolidated Statement of Cash Flows
Non-cash investing and financing transactions that, appropriately, are not reflected in the consolidated statement of cash flows are listed below.
Non-cash investing and financing transactions Year ended Dec. 31,(in millions) 2020 2019 2018Transfers from loans to other assets for other real estate owned $ 1 $ 2 $ 2 Change in assets of consolidated investment management funds 242 16 268 Change in liabilities of consolidated investment management funds 2 1 — Change in nonredeemable noncontrolling interests of consolidated investment management funds 41 1 215
Securities purchased not settled 205 497 227 Securities sold not settled — — 187 Available-for-sale securities transferred to held-to-maturity 501 — — Available-for-sale securities transferred to trading assets — — 963 Held-to-maturity securities transferred to available-for-sale — — 1,087 Premises and equipment/capitalized software funded by finance lease obligations 10 14 26 Premises and equipment/operating lease obligations 208 1,754 (a) — Investment redemptions not settled 9 20 —
(a) Includes $1,244 million related to the adoption of ASU 2016-02, Leases, and $510 million related to new or modified leases.
Notes to Consolidated Financial Statements (continued)
BNY Mellon 201
Report of Independent Registered Public Accounting Firm
To the Shareholders and Board of DirectorsThe Bank of New York Mellon Corporation:
Opinion on the Consolidated Financial Statements
We have audited the accompanying consolidated balance sheets of The Bank of New York Mellon Corporation and subsidiaries (BNY Mellon) as of December 31, 2020 and 2019, the related consolidated statements of income, comprehensive income, cash flows, and changes in equity for each of the years in the three-year period ended December 31, 2020, and the related notes (collectively, the consolidated financial statements). In our opinion, the consolidated financial statements present fairly, in all material respects, the financial position of BNY Mellon as of December 31, 2020 and 2019, and the results of its operations and its cash flows for each of the years in the three-year period ended December 31, 2020, in conformity with U.S. generally accepted accounting principles.
We also have audited, in accordance with the standards of the Public Company Accounting Oversight Board (United States) (PCAOB), BNY Mellon’s internal control over financial reporting as of December 31, 2020, based on criteria established in Internal Control – Integrated Framework (2013) issued by the Committee of Sponsoring Organizations of the Treadway Commission, and our report dated February 25, 2021 expressed an unqualified opinion on the effectiveness of BNY Mellon’s internal control over financial reporting.
Basis for Opinion
These consolidated financial statements are the responsibility of BNY Mellon’s management. Our responsibility is to express an opinion on these consolidated financial statements based on our audits. We are a public accounting firm registered with the PCAOB and are required to be independent with respect to BNY Mellon in accordance with the U.S. federal securities laws and the applicable rules and regulations of the Securities and Exchange Commission and the PCAOB.
We conducted our audits in accordance with the standards of the PCAOB. Those standards require that we plan and perform the audit to obtain reasonable assurance about whether the consolidated financial statements are free of material misstatement, whether due to error or fraud. Our audits included performing procedures to assess the risks of material misstatement of the consolidated financial statements, whether due to error or fraud, and performing procedures that respond to those risks. Such procedures included examining, on a test basis, evidence regarding the amounts and disclosures in the consolidated financial statements. Our audits also included evaluating the accounting principles used and significant estimates made by management, as well as evaluating the overall presentation of the consolidated financial statements. We believe that our audits provide a reasonable basis for our opinion.
Critical Audit Matters
The critical audit matters communicated below are matters arising from the current period audit of the consolidated financial statements that were communicated or required to be communicated to the audit committee and that: (1) relate to accounts or disclosures that are material to the consolidated financial statements and (2) involved our especially challenging, subjective, or complex judgments. The communication of critical audit matters does not alter in any way our opinion on the consolidated financial statements, taken as
202 BNY Mellon
a whole, and we are not, by communicating the critical audit matters below, providing separate opinions on the critical audit matters or on the accounts or disclosures to which they relate.
Quantitative component of BNY Mellon’s pooled allowance for credit losses for loans and lending-related commitments related to higher risk-rated credits and pass-rated credits
As discussed in Notes 1, 2 and 5 to the consolidated financial statements, BNY Mellon’s allowance for credit losses, for loans and lending-related commitments (ACL), is presented as a valuation allowance to loans, and is recorded in other liabilities for lending-related commitments. At December 31, 2020, BNY Mellon had an allowance for loan losses of $358 million and an allowance for lending-related commitments of $121 million. BNY Mellon utilizes a quantitative methodology and qualitative framework for determining the ACL for loans and lending-related commitments that share similar risk characteristics (pooled allowance). In estimating the quantitative component, BNY Mellon uses models and methodologies that categorize financial assets based on product type, collateral type, and other credit trends and risk characteristics, including relevant information about past events, current conditions and reasonable and supportable forecasts of future economic conditions that affect the collectability of the recorded amounts. The quantitative component of the ACL for loans and lending-related commitments consists of the following three elements: (1) a pooled allowance for higher risk-rated credits and pass-rated credits; (2) a pooled allowance for residential mortgage loans; and (3) an asset-specific allowance involving individually evaluated credits of $1 million or greater. In estimating the quantitative component of the pooled allowance for higher risk-rated credits and pass-rated credits, BNY Mellon uses a methodology that applies the probability of default (PD) and loss given default (LGD) to the estimated facility amount at default. The loss expected in each loan incorporates the loan’s risk rating. The methodology incorporates a multi-scenario macroeconomic forecast of economic input variables over a reasonable and supportable forecast period spanning the life of the asset. The reasonable and supportable forecast period includes both an initial estimated economic outlook component as well as a reversion component for each economic input variable. In order to capture the unique risks of the portfolios within the PD and LGD models, and the model used to estimate the facility amount at default, BNY Mellon segments the portfolio into major components, including commercial loans and lease financing, commercial real estate, financial institutions, residential mortgages, and other. A portion of the ACL is comprised of qualitative adjustments, based on various internal and external factors, intended to capture expected losses not reflected in the quantitative models but that are likely to impact the measurement of estimated credit losses.
We identified the assessment of the quantitative component of the pooled allowance for higher risk-rated credits and pass-rated credits as a critical audit matter. A high degree of audit effort, including specialized skills and knowledge, and subjective and complex auditor judgment was involved in the assessment of the pooled allowance for higher risk-rated credits and pass-rated credits due to significant measurement uncertainty. Specifically, the assessment encompassed the evaluation of the methodology, including the methods and models used to estimate the PD and LGD, the macroeconomic forecast scenarios and related economic input variables and weighting of each scenario, the reasonable and supportable forecast period, and loan risk ratings. The assessment also included an evaluation of the conceptual soundness and performance of the PD, LGD, and macroeconomic forecast models. In addition, auditor judgment was required to evaluate the sufficiency of audit evidence obtained.
The following are the primary procedures we performed to address this critical audit matter. We evaluated the design and tested the operating effectiveness of certain internal controls related to BNY Mellon’s measurement of the pooled allowance for higher risk-rated credits and pass-rated credits, including controls related to the:
• development and approval of the ACL methodology
• development of the PD, LGD, and macroeconomic forecast models
• performance monitoring of the PD, LGD, and macroeconomic forecast models
BNY Mellon 203

• determination and measurement of the significant factors and assumptions used in the PD, LGD, and macroeconomic forecast models
• determination of the multi-scenario macroeconomic forecasts and their respective weights
• assessment of loan risk ratings
• computation, analysis, and approval of the ACL results, trends, and ratios.
We evaluated BNY Mellon’s process to develop the pooled allowance for higher risk-rated credits and pass- rated credits by testing certain sources of data, factors, and assumptions that BNY Mellon used, and considered the relevance and reliability of such data, factors, and assumptions. In addition, we involved credit risk professionals with specialized skills and knowledge, who assisted in:
• evaluating BNY Mellon’s pooled allowance for higher risk-rated credits and pass-rated credits for compliance with U.S. generally accepted accounting principles
• evaluating judgments made by BNY Mellon relative to the development and performance monitoring of the PD, LGD, and macroeconomic forecast models by comparing them to relevant company-specific metrics and trends and the applicable industry and regulatory practices
• assessing the conceptual soundness and performance testing of the PD, LGD, and macroeconomic forecast models by inspecting the model documentation to determine whether the models are suitable for their intended use
• assessing the macroeconomic forecast scenarios and economic input variables through comparison to publicly available forecasts
• testing the reasonable and supportable forecast period to evaluate the length of the period by comparing to specific portfolio risk characteristics and trends
• testing individual loan risk ratings for a selection of higher risk-rated credits and pass-rated credits by evaluating the financial performance of the borrower, sources of repayment, and any relevant guarantees or underlying collateral.
We also assessed the sufficiency of the audit evidence obtained related to the pooled allowance for higher risk-rated credits and pass-rated credits by evaluating the:
• cumulative results of the audit procedures
• qualitative aspects of BNY Mellon’s accounting practices
• potential bias in the accounting estimate.
Identification and measurement of accruals for litigation and regulatory contingencies
As discussed in Note 22 to the consolidated financial statements, BNY Mellon establishes accruals for litigation and regulatory matters when those matters present loss contingencies that are both probable and reasonably estimable. BNY Mellon has disclosed that for those matters described where BNY Mellon is able to estimate reasonably possible losses, the aggregate range of such reasonably possible losses at December 31, 2020 is up to $730 million in excess of the accrued liability (if any) related to those matters.
We identified the assessment of the identification and measurement of BNY Mellon’s accruals for litigation and regulatory contingencies as a critical audit matter. Due to the measurement uncertainty, subjective and complex auditor judgment was required to evaluate the sufficiency of audit evidence obtained. Specifically, this assessment included the evaluation of the subjective estimates used to determine the range of
204 BNY Mellon
possible exposure and the probability of the predicted outcome based on the particular facts and circumstances at issue in each of the matters.
The following are the primary procedures we performed to address this critical audit matter. We evaluated the design and tested the operating effectiveness of certain internal controls related to BNY Mellon’s process to identify, evaluate and measure accruals for litigation and regulatory contingencies and the reasonably possible losses. We performed inquiries of BNY Mellon to gain an understanding of any asserted or unasserted litigation, claims and assessments, and significant changes in individual accruals for litigation and regulatory contingencies. We performed inquiries of BNY Mellon’s regulators and examined regulatory reports to gain an understanding of developments of regulatory activity and related matters that may result in the assessment of regulatory fines or penalties. We obtained and read letters received directly from BNY Mellon’s internal legal counsel and a selection of external legal counsel that identified and described BNY Mellon’s potential exposure to certain legal or regulatory proceedings. For cases that have settled, we performed back-testing analyses of BNY Mellon’s litigation and regulatory contingency accruals recorded compared to amounts paid. We assessed the accrual for litigation and regulatory contingencies and evaluated the cumulative results of the procedures performed to assess the sufficiency of audit evidence obtained. We also evaluated the information included within the disclosures.
/s/ KPMG LLP
We have served as BNY Mellon’s auditor since 2007.
New York, New York February 25, 2021
BNY Mellon 205

Effective February 25, 2021DirectorsLinda Z. Cook Jeffrey A. Goldstein Elizabeth E. RobinsonPartner and Managing Director of Senior Advisor, Canapi Ventures, a venture Retired Global Treasurer ofEIG Global Energy Partners, an investment firm, capital fund; and Advisor Emeritus, Hellman & The Goldman Sachs Group, Inc.and Chief Executive Officer of Harbour Friedman LLC, a private equity firm Global financial services companyEnergy, Ltd., an energy investment vehicle
Ralph Izzo Samuel C. Scott IIIJoseph J. Echevarria Chairman, President and Chief Executive Officer, Retired Chairman, President and Chairman Public Service Enterprise Group Incorporated Chief Executive Officer ofThe Bank of New York Mellon Corporation Diversified energy holding company Ingredion Incorporated (formerly CornRetired Chief Executive Officer of Products International, Inc.)Deloitte LLP Edmund F. (Ted) Kelly Global ingredient solutions providerGlobal provider of audit, consulting, financial Retired Chairman ofadvisory, risk management, tax and related Liberty Mutual Group Frederick O. Terrellservices Multi-line insurance company Senior Advisor at Centerbridge Partners, LP
Private investment management firmThomas P. (Todd) Gibbons Jennifer B. MorganChief Executive Officer Global Head of Portfolio Transformation and Alfred W. (Al) ZollarThe Bank of New York Mellon Corporation Talent at The Blackstone Group Inc. Executive Partner at
Global investment firm Siris Capital Group, LLCPrivate equity firm
Executive Committee and Other Executive OfficersJolen Anderson * Senthil Kumar * Brian RuaneGlobal Head of Human Resources Chief Risk Officer Chief Executive Officer, BNY Mellon
Government Securities Services Corp. andPaul Camp Kurtis R. Kurimsky * Clearance and Collateral ManagementChief Executive Officer, Treasury Services Corporate Controller
Akash Shah *James T. Crowley Francis (Frank) La Salla * Head of Strategy and Global Client ManagementChief Executive Officer, Pershing Chief Executive Officer, Issuer Services
Hanneke Smits *Bridget E. Engle * J. Kevin McCarthy * Chief Executive Officer, Investment ManagementHead of Operations and Technology General Counsel
Robin Vince *Thomas P. (Todd) Gibbons * Emily Portney * Chief Executive Officer, Global MarketChief Executive Officer Chief Financial Officer Infastructure
Hani A. Kablawi * Roman Regelman * Adam VosChairman of International Chief Executive Officer, Asset Servicing and Chief Executive Officer, Markets
Head of DigitalCatherine Keating * James S. WienerChief Executive Officer, Wealth Management Head of Balance Sheet and Capital Strategy
* Designated as an Executive Officer.
Directors, Executive Committee and Other Executive Officers
206 BNY Mellon
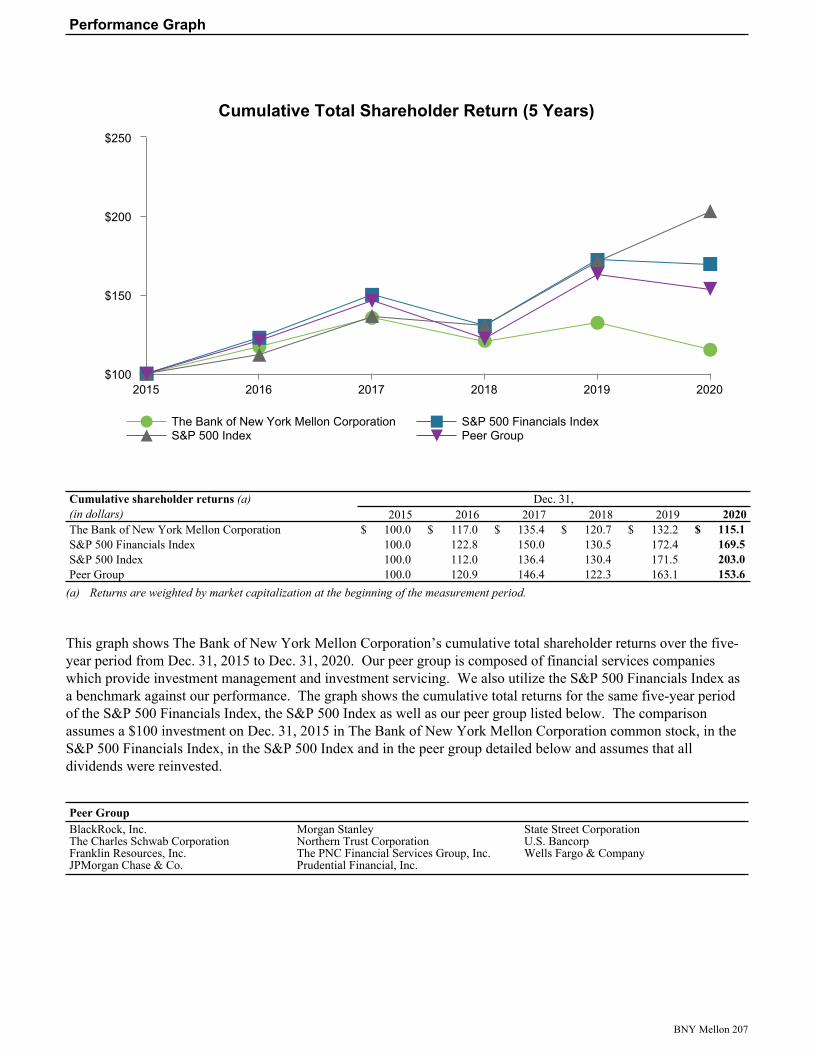
Cumulative Total Shareholder Return (5 Years)
The Bank of New York Mellon Corporation S&P 500 Financials IndexS&P 500 Index Peer Group
2015 2016 2017 2018 2019 2020$100
$150
$200
$250
Cumulative shareholder returns (a) Dec. 31,(in dollars) 2015 2016 2017 2018 2019 2020The Bank of New York Mellon Corporation $ 100.0 $ 117.0 $ 135.4 $ 120.7 $ 132.2 $ 115.1 S&P 500 Financials Index 100.0 122.8 150.0 130.5 172.4 169.5 S&P 500 Index 100.0 112.0 136.4 130.4 171.5 203.0 Peer Group 100.0 120.9 146.4 122.3 163.1 153.6
(a) Returns are weighted by market capitalization at the beginning of the measurement period.
This graph shows The Bank of New York Mellon Corporation’s cumulative total shareholder returns over the five-year period from Dec. 31, 2015 to Dec. 31, 2020. Our peer group is composed of financial services companies which provide investment management and investment servicing. We also utilize the S&P 500 Financials Index as a benchmark against our performance. The graph shows the cumulative total returns for the same five-year period of the S&P 500 Financials Index, the S&P 500 Index as well as our peer group listed below. The comparison assumes a $100 investment on Dec. 31, 2015 in The Bank of New York Mellon Corporation common stock, in the S&P 500 Financials Index, in the S&P 500 Index and in the peer group detailed below and assumes that all dividends were reinvested.
Peer GroupBlackRock, Inc.The Charles Schwab CorporationFranklin Resources, Inc.JPMorgan Chase & Co.
Morgan StanleyNorthern Trust CorporationThe PNC Financial Services Group, Inc.Prudential Financial, Inc.
State Street CorporationU.S. BancorpWells Fargo & Company
Performance Graph
BNY Mellon 207