bny mellon 2009 annual report
TRANSCRIPT
BNY Mellon 2009 Annual Report
STRENGTH. GLOBALLY.
2009 2008
(26)
141,455$
1,443
(24)(33)
1,386$
1.21$0.01
(0.02)
1.20$
13,573$11,523
79%79%33% (c)
928$20.2$
(270)(813)$
—
(1,083)
(1)(283)
(1,367)$
(0.23)—
(0.93)$
(1.16)$
7,687$9,563
62%78%32%
1,115$22.3$
12.1%10.516.013.7
5.2
13.2%9.4
16.910.6
3.8
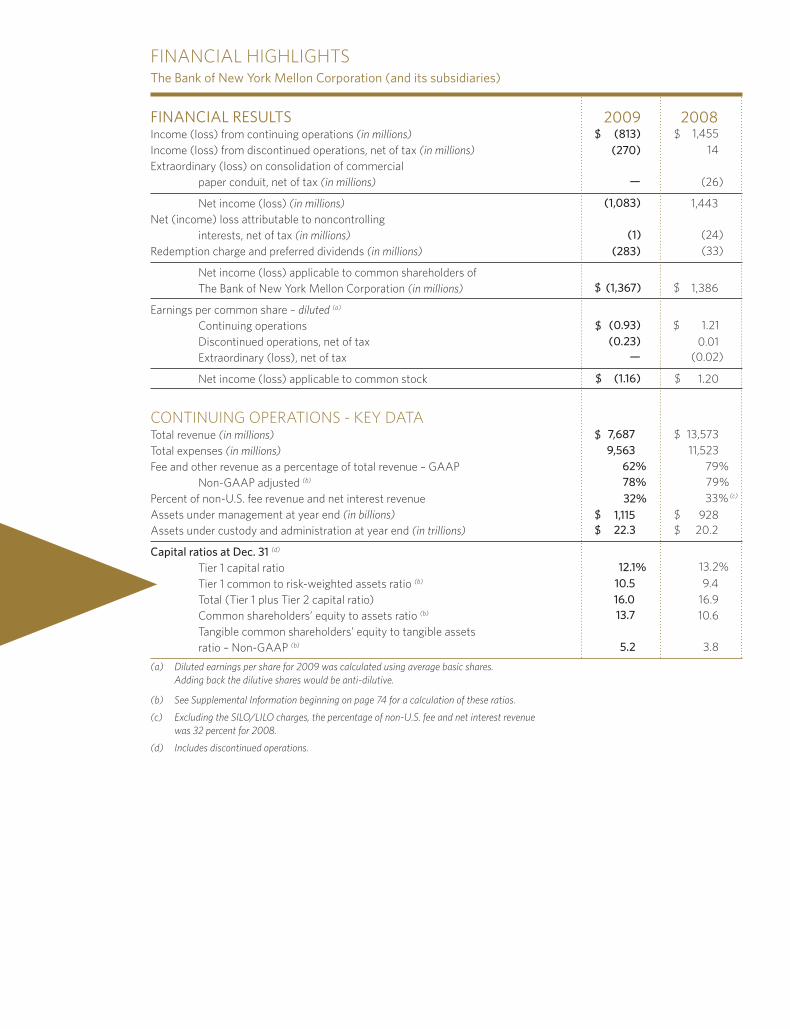
FINANCIAL HIGHLIGHTSThe Bank of New York Mellon Corporation (and its subsidiaries)
FINANCIAL RESULTSIncome (loss) from continuing operations (in millions) Income (loss) from discontinued operations, net of tax (in millions) Extraordinary (loss) on consolidation of commercial paper conduit, net of tax (in millions)
Net income (loss) (in millions) Net (income) loss attributable to noncontrolling interests, net of tax (in millions) Redemption charge and preferred dividends (in millions)
Net income (loss) applicable to common shareholders of The Bank of New York Mellon Corporation (in millions)
Earnings per common share – diluted (a)
Continuing operations Discontinued operations, net of tax Extraordinary (loss), net of tax
Net income (loss) applicable to common stock
CONTINUING OPERATIONS - KEY DATATotal revenue (in millions) Total expenses (in millions) Fee and other revenue as a percentage of total revenue – GAAP Non-GAAP adjusted (b) Percent of non-U.S. fee revenue and net interest revenue Assets under management at year end (in billions) Assets under custody and administration at year end (in trillions)
Capital ratios at Dec. 31 (d)
Tier 1 capital ratio Tier 1 common to risk-weighted assets ratio (b) Total (Tier 1 plus Tier 2 capital ratio) Common shareholders’ equity to assets ratio (b) Tangible common shareholders’ equity to tangible assets ratio – Non-GAAP (b) (a) Diluted earnings per share for 2009 was calculated using average basic shares. Adding back the dilutive shares would be anti-dilutive.
(b) See Supplemental Information beginning on page 74 for a calculation of these ratios.
(c) Excluding the SILO/LILO charges, the percentage of non-U.S. fee and net interest revenue was 32 percent for 2008.
(d) Includes discontinued operations.

TO OUR SHAREHOLDERS
As BNY Mellon marked its milestone 225th year, the global economy was in the grip of the biggest downturn in 80 years. It was an extraordinarily challenging environment for the financial services industry and a year of transition for your company.
Although we have outperformed both our peer group and the S&P Financials since the beginning of the financial crisis, during 2009 our total shareholder return trailed both benchmarks and we reported a net loss for the year. The loss reflected write-downs on investment securities and actions we took to materially de-risk our balance sheet. These actions should benefit our performance going forward and, while prudent, the net loss was disappointing for a company focused on outperforming.
Financial institutions spent 2009 beginning the arduous process of stabilization, balance sheet cleanup, recapitalization and refocusing for the future. At BNY Mellon, we focused on three priorities that are critical to our long-term success: meeting the needs of our clients, reducing risk and managing expenses. Our progress in these areas in 2009 has helped position your company for the eventual economic recovery. Specifically:
MEETING THE NEEDS OF OUR CLIENTS• We stabilized revenue following a significant decline in revenue in the first quarter, and ended the year with marked improvement in several of our core businesses, particularly Asset Management.• Won $1.2 trillion in new assets under custody in Asset Servicing.• Further strengthened our asset management capabilities through improved fund investment performance and the acquisition of Insight Investment Management, a London-based specialist in liability-driven investment solutions, active fixed income and alternatives. We also acquired a 20 percent interest in Siguler Guff Asset Management, a multi-strategy private equity firm based in New York.• Continued to build share in corporate trust, clearing, broker-dealer services and hedge fund servicing.• Had 16 consecutive quarters of net positive client asset flows in Wealth Management.• Outperformed our merger revenue synergy targets.• Achieved No. 1 rankings in client satisfaction among our peers in the Global Investor and R&M global custody surveys and met our revenue retention target.
REDUCING RISK• Sold or restructured $13.5 billion of lower-quality securities in our investment portfolio to materially de-risk our balance sheet.• Reduced our credit exposure by $14.7 billion or 15 percent.• Resolved the court case with Russia’s Federal Customs Service.• Sold Mellon United National Bank, our Miami-based bank.
MANAGING EXPENSES• Reduced operating expense by 17 percent through cost reduction programs and merger-related synergies.• Exceeded merger expense synergy targets.• Reduced incentive expense as a percentage of revenue for the second consecutive year.• Took a $139 million restructuring charge in the fourth quarter to allow us to continue to drive efficiencies in future quarters.
In addition, we passed the U.S. government stress test and repaid the U.S. government’s $3 billion TARP investment — becoming one of the first banks to do so — providing American taxpayers with a very good return of 12 percent (annualized) on their investment. We also raised $1.4 billion in new common equity, maintained strong capital ratios and continued to enjoy the highest debt ratings among all U.S. banks. In fact, we ended the year with materially stronger capital ratios than when we entered it.
LOOKING FORWARD
We know that you, our shareholders, expect stronger results, and so do we. We are very levered to higher interest rates and improving financial markets globally. We are focused on achieving higher revenue growth, enhancing efficiency and reducing risk.
There are three areas of focus:
• Growing revenue. We expect good growth prospects as the global economy continues to recover. Rising short-term interest rates would have an extremely positive impact on our earnings. A rise in the overnight rate would have a positive impact on our net interest revenue and fees in our Asset and Wealth Management and securities servicing businesses. Improving equity markets would benefit our Asset Management and Wealth Management fees. As securitization markets reopen, our Corporate Trust business will benefit. Increases in merger and acquisition
* Revenue on an operating basis as defined on page 76.
activity benefit all our businesses, particularly Shareowner Services. Greater cross-border financial flows will power Asset Servicing.
• We are also actively executing on opportunities to consolidate global market share in our securities servicing businesses, as demonstrated by the recently announced, $2.31 billion acquisition of Global Investment Servicing (GIS), a leading provider of fund accounting/ administration, transfer agency, custody and outsourcing solutions for fund managers and financial advisors. The acquisition should be accretive in the first year and provide attractive returns for our shareholders, particularly given the opportunities for excellent, achievable revenue synergies.
• Growing margins by improving our operating models. We are taking actions to provide better economics to our shareholders. Across the company, we are looking at which jobs really need to be performed in major metropolitan areas and which could be done equally well or better in one of our global growth centers. Parallel to this, we are continuing our ongoing reengineering and process automation efforts to drive further efficiencies and strengthen our ability to deliver positive operating leverage.
• Continue to limit risk on our balance sheet. We are continually working to right-size our largest credit exposures and reduce certain non-core loan portfolios.
We will always focus intently on maintaining strong internal controls and upholding the highest ethical standards.
During 2009, we targeted our philanthropic efforts to needy families and workforce development, efforts designed to ensure we make a positive impact on our communities. In response to the disaster in Haiti, employees and the company contributed more than $900,000 to help those in need. We are also making progress in minimizing our company’s impact on the environment.
With the stability of the global financial system at stake, our company is contributing to an industry effort to bring about meaningful regulatory reform. The challenge is to do this thoughtfully, without compromising the ability of American financial companies to lend or compete globally, as the health of our industry is essential to creating jobs and supporting the recovery. In my opinion, there should be four priorities in the U.S.:• First, to prevent another Lehman-type event, it’s imperative that lawmakers pass legislation
this year creating a resolution authority. No financial institution should be too big to fail, and we need laws to allow for an orderly wind down.• Second, to close many of the gaps in regulatory oversight that exist today, we need to establish a federal systemic risk authority to monitor risks across all financial markets and firms.• Third, the financial crisis clearly exposed the fact that many financial institutions did not have adequate capital or liquidity to survive a major recession. We are supportive of creating higher minimum standards achieved in a way that ensures a competitive, level playing field globally.• Finally, given the central role our terribly flawed mortgage system played in creating the credit crisis, it is my hope that the government will restructure and exit this business.
During this anniversary year, your company achieved another important milestone. Since 2007, we surveyed our employees each year to measure their level of engagement. We use an approach that allows us to compare our results to some of the world’s best companies in a variety of industries. Companies with high levels of engagement typically enjoy better client service, better productivity and lower turnover and are more likely to attract and retain top talent. They also tend to earn greater total returns to shareholders over time. In 2009, BNY Mellon achieved — a year early — its 2010 goal of top-quartile performance in overall employee engagement compared with other compa-nies. Our continued upward trend is very encouraging, considering the global economic and industry challenges we faced this past year, and it validates our success in creating a diverse, inclusive and supportive culture where the best people globally want to work and have opportunities for professional growth.
A special thank you to our employees around the globe, who have demonstrated amazing client focus and teamwork. I also offer my gratitude to our directors for their extraordinary support, dedication and contributions to strengthen our company. Finally, thank you to our shareholders for your continued confidence in the future of this great company. Know that your company is well positioned for the economic recovery and energized to outperform.
Yours sincerely,
Robert P. KellyChairman and Chief Executive Officer
HIGHLIGHTS OF OUR BUSINESS
Asset Management (18 percent of 2009 total revenue) **Assets under management at year end were $1,045 billion, an increase of 21 percent from the prior year; our pre-tax income totaled $582 million, excluding intan-gible amortization, and increased 21 percent over 2008. In response to the challenging operating environment, we continue to manage our expense base carefully.
Our investment boutiques are delivering good relative investment returns for clients, with investment perfor-mance strengthening across most of our investment strategies. Product innovation remains an area of major focus. Our multi-boutique platform provides us with the breadth and depth of investment capabilities to deliver a wide range of solutions to a diverse client base across the world.
BNY Mellon Asset Management is the 11th largest global asset manager, serving institutional and retail clients and their advisors, including corporations, governments, pension plans, endowments, foundations, sovereign wealth funds and retail intermediaries. In 2009, we continued our strong international growth, with revenue from non-U.S. clients accounting for about 41 percent of asset management revenue. We also furthered our international expansion, completing the acquisition of Insight Investment, the leading active manager of liability-driven investment strategies in the UK. Additionally, we acquired a 20 percent stake in Siguler Guff, a multi-strategy private equity firm. In the U.S., we are a leading cash manager, major mutual fund and separately managed accounts provider through the Dreyfus brand.
Wealth Management (6 percent of 2009 total revenue)**In Wealth Management, client assets totaled $154 billion at year end, reflecting 16 consecutive quarters of positive long-term asset flows and record new busi-ness in family office and mortgage services. Despite a challenging market environment, Wealth Management maintained an outstandingly high client retention rate of 97 percent and continued to receive strong marks for service in its annual client satisfaction surveys. Consistent with its focus on the highest-quality service and advice, Wealth Management also implemented significant enhancements to its investment resources and strategies, banking capabilities and client reporting platforms.
Asset Servicing (33 percent of 2009 total revenue) **Asset Servicing restored growth in core fees, despite challenging market conditions, and continued to deliver outstanding client service and maintain client loyalty. In 2009, we outperformed our peer group of the world’s largest global custodians in the Global Investor and R&M surveys of custody clients and met our revenue retention target of 98 percent through the completion of the merger integration. Assets under custody and administration grew by 10 percent from the prior year, reflecting the positive impact of $1.2 trillion in total business wins.
Our recently announced acquisition in the fund services space will broaden our product offering, strengthening our fund accounting and administration offering to U.S. mutual fund clients, adding a more global mix of alternative investor service clients and adding top-tier transfer agency and sub-accounting platforms.
Broker-Dealer Services continued to gain significant market share, benefiting from the market disruption and innovative new solutions for the evolving tri-party marketplace. We were named Broker/Dealer Custody and Clearance Provider of the Year by ICFA magazine and were the only provider to receive top ratings in all regional categories in Global Custodian magazine’s survey of tri-party securities financing services users.
In foreign exchange, we dominated Global Investor magazine’s 2009 Foreign Exchange survey, ranking first in 20 of 24 categories, including Best FX Service Overall and Best Research.
Issuer Services (19 percent of 2009 total revenue) **Despite significant market headwinds in 2009, Issuer Services made impressive gains in its debt- and equity-linked businesses through a focus on innovative product and service initiatives that will serve the long-term interests of our clients.
Corporate Trust once again was named the No. 1 overall trustee during a year in which the business earned several mandates from government-sponsored programs in the U.S. and abroad and outperformed its closest competitors across nearly every debt segment globally. It launched the Global Environmental Markets platform, a universal custody and trade settlement platform for carbon credits, and added new capabili-ties that greatly enhance its services and transparency tools for the structured and public finance markets.

Depositary Receipts extended its leading market position with the launch of several new Depositary Receipt indices and received emeafinance magazine’s award for Best EMEA (Europe, Middle East and Africa) Depositary Receipt House, in a region where it acts as sponsored depositary bank for nearly 70 percent of all DR programs. During a year in which the world expe-rienced the largest historical outflow of equity capital, Depositary Receipts established 750 new “unspon-sored” DR programs across 35 countries, attracting more than $2 billion in inflows as U.S. investors sought ways to diversify their portfolios.
Shareowner Services maintained its position as the largest stock transfer services provider in the U.S. and earned the highest overall client satisfaction score in full-service employee stock option administration in Group 5’s annual stock plan services survey.
Clearing Services (12 percent of 2009 total revenue) **Clearing Services experienced higher pre-tax earnings growth attributable to strong expense management and robust trading profits, especially in fixed income in the early part of the year. Revenue was slightly lower due
to the continued low-interest-rate environment, which resulted in lower money market fees, and to lower trading volumes and lower asset-based fees. Pershing continued to build its market share and value proposi-tion among broker-dealers and registered investment advisors through the delivery of expanded investment and technology solutions, including its NetX360 platform, recognized as a game-changing technology in the industry.
Treasury Services (12 percent of 2009 total revenue) **Treasury Services completed its platforms and systems integration, setting the stage for an entirely new client portal that will provide integrated access to all of BNY Mellon’s treasury services offerings in a tech-nologically enriched environment. During the year, Treasury Services significantly expanded its presence in Asia, recorded important global remittance wins in the U.S. and Asia and introduced a number of notable electronic payments innovations. We also received growing recognition for leadership in the delivery of trade finance, white label systems and other treasury services solutions.
** Excludes the Other Segment. See page 22.
Financial SectionTHE BANK OF NEW YORK MELLON CORPORATION
2009 ANNUAL REPORTTABLE OF CONTENTS
Page
Financial Summary . . . . . . . . . . . . . . . . . . . . . . . . . . . . . . . . . . . . . . . . . . . . . . . . . . . . . . . . . . . . . . . 6
Management’s Discussion and Analysis of Financial Condition and Results of Operations:Results of operations . . . . . . . . . . . . . . . . . . . . . . . . . . . . . . . . . . . . . . . . . . . . . . . . . . . . . . . . . . . 8
General . . . . . . . . . . . . . . . . . . . . . . . . . . . . . . . . . . . . . . . . . . . . . . . . . . . . . . . . . . . . . . . . . 8Overview . . . . . . . . . . . . . . . . . . . . . . . . . . . . . . . . . . . . . . . . . . . . . . . . . . . . . . . . . . . . . . . . 8Impact of the current market environment on our business and regulatory events . . . . . . . . 92009 and subsequent events . . . . . . . . . . . . . . . . . . . . . . . . . . . . . . . . . . . . . . . . . . . . . . . . . 10Summary of financial results . . . . . . . . . . . . . . . . . . . . . . . . . . . . . . . . . . . . . . . . . . . . . . . . . 12Fee and other revenue . . . . . . . . . . . . . . . . . . . . . . . . . . . . . . . . . . . . . . . . . . . . . . . . . . . . . . 14Net interest revenue . . . . . . . . . . . . . . . . . . . . . . . . . . . . . . . . . . . . . . . . . . . . . . . . . . . . . . . . 17Noninterest expense . . . . . . . . . . . . . . . . . . . . . . . . . . . . . . . . . . . . . . . . . . . . . . . . . . . . . . . 20Income taxes . . . . . . . . . . . . . . . . . . . . . . . . . . . . . . . . . . . . . . . . . . . . . . . . . . . . . . . . . . . . . 21Extraordinary loss – consolidation of commercial paper conduits . . . . . . . . . . . . . . . . . . . . 22Business segments review . . . . . . . . . . . . . . . . . . . . . . . . . . . . . . . . . . . . . . . . . . . . . . . . . . . 22International operations . . . . . . . . . . . . . . . . . . . . . . . . . . . . . . . . . . . . . . . . . . . . . . . . . . . . . 35Critical accounting estimates . . . . . . . . . . . . . . . . . . . . . . . . . . . . . . . . . . . . . . . . . . . . . . . . . 38Consolidated balance sheet review . . . . . . . . . . . . . . . . . . . . . . . . . . . . . . . . . . . . . . . . . . . . 45Support agreements . . . . . . . . . . . . . . . . . . . . . . . . . . . . . . . . . . . . . . . . . . . . . . . . . . . . . . . . 59Liquidity and dividends . . . . . . . . . . . . . . . . . . . . . . . . . . . . . . . . . . . . . . . . . . . . . . . . . . . . . 59Commitments and obligations . . . . . . . . . . . . . . . . . . . . . . . . . . . . . . . . . . . . . . . . . . . . . . . . 62Off-balance sheet arrangements . . . . . . . . . . . . . . . . . . . . . . . . . . . . . . . . . . . . . . . . . . . . . . 63Capital . . . . . . . . . . . . . . . . . . . . . . . . . . . . . . . . . . . . . . . . . . . . . . . . . . . . . . . . . . . . . . . . . . 64Risk management . . . . . . . . . . . . . . . . . . . . . . . . . . . . . . . . . . . . . . . . . . . . . . . . . . . . . . . . . 67Trading activities and risk management . . . . . . . . . . . . . . . . . . . . . . . . . . . . . . . . . . . . . . . . 70Foreign exchange and other trading . . . . . . . . . . . . . . . . . . . . . . . . . . . . . . . . . . . . . . . . . . . 71Asset/liability management . . . . . . . . . . . . . . . . . . . . . . . . . . . . . . . . . . . . . . . . . . . . . . . . . . 71Business continuity . . . . . . . . . . . . . . . . . . . . . . . . . . . . . . . . . . . . . . . . . . . . . . . . . . . . . . . . 72
Supplemental information – Explanation of Non-GAAP financial measures (unaudited) . . . . . . 74Supplemental information – Rate/volume analysis (unaudited) . . . . . . . . . . . . . . . . . . . . . . . . . . 78Recent accounting and regulatory developments . . . . . . . . . . . . . . . . . . . . . . . . . . . . . . . . . . . . . 79Selected quarterly data (unaudited) . . . . . . . . . . . . . . . . . . . . . . . . . . . . . . . . . . . . . . . . . . . . . . . . 82Forward-looking statements . . . . . . . . . . . . . . . . . . . . . . . . . . . . . . . . . . . . . . . . . . . . . . . . . . . . . 83Glossary . . . . . . . . . . . . . . . . . . . . . . . . . . . . . . . . . . . . . . . . . . . . . . . . . . . . . . . . . . . . . . . . . . . . . 85Report of management on internal control over financial reporting . . . . . . . . . . . . . . . . . . . . . . . 89Report of independent registered public accounting firm . . . . . . . . . . . . . . . . . . . . . . . . . . . . . . . 90
Financial Statements and Notes:Consolidated Income Statement . . . . . . . . . . . . . . . . . . . . . . . . . . . . . . . . . . . . . . . . . . . . . . . . . . 91Consolidated Balance Sheet . . . . . . . . . . . . . . . . . . . . . . . . . . . . . . . . . . . . . . . . . . . . . . . . . . . . . 93Consolidated Statement of Cash Flows . . . . . . . . . . . . . . . . . . . . . . . . . . . . . . . . . . . . . . . . . . . . . 94Consolidated Statement of Changes in Equity . . . . . . . . . . . . . . . . . . . . . . . . . . . . . . . . . . . . . . . 95Notes to Consolidated Financial Statements . . . . . . . . . . . . . . . . . . . . . . . . . . . . . . . . . . . . . . . . . 97
Report of Independent Registered Public Accounting Firm . . . . . . . . . . . . . . . . . . . . . . . . . . . . . . 156
Directors, Senior Management and Executive Committee . . . . . . . . . . . . . . . . . . . . . . . . . . . . . . . 157
Performance Graph . . . . . . . . . . . . . . . . . . . . . . . . . . . . . . . . . . . . . . . . . . . . . . . . . . . . . . . . . . . . . . 158
Corporate Information . . . . . . . . . . . . . . . . . . . . . . . . . . . . . . . . . . . . . . . . . . . . . . . . . Inside back cover
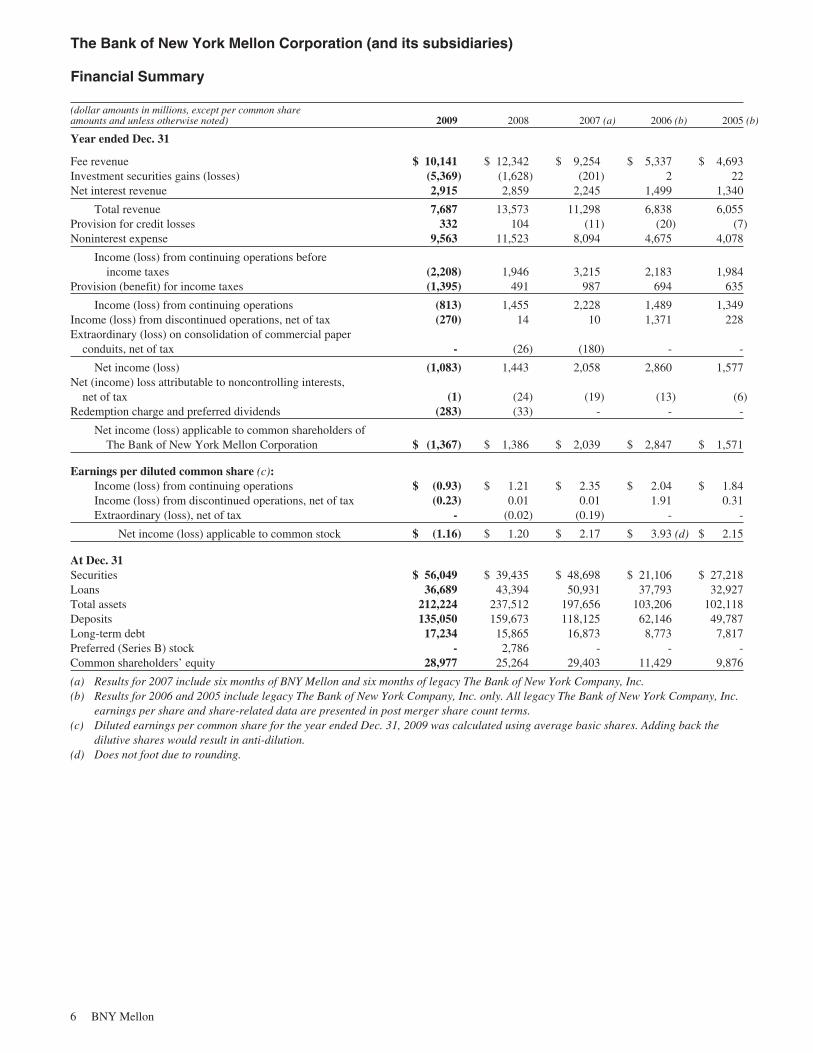
The Bank of New York Mellon Corporation (and its subsidiaries)
Financial Summary
(dollar amounts in millions, except per common shareamounts and unless otherwise noted) 2009 2008 2007 (a) 2006 (b) 2005 (b)
Year ended Dec. 31
Fee revenue $ 10,141 $ 12,342 $ 9,254 $ 5,337 $ 4,693Investment securities gains (losses) (5,369) (1,628) (201) 2 22Net interest revenue 2,915 2,859 2,245 1,499 1,340
Total revenue 7,687 13,573 11,298 6,838 6,055Provision for credit losses 332 104 (11) (20) (7)Noninterest expense 9,563 11,523 8,094 4,675 4,078
Income (loss) from continuing operations beforeincome taxes (2,208) 1,946 3,215 2,183 1,984
Provision (benefit) for income taxes (1,395) 491 987 694 635
Income (loss) from continuing operations (813) 1,455 2,228 1,489 1,349Income (loss) from discontinued operations, net of tax (270) 14 10 1,371 228Extraordinary (loss) on consolidation of commercial paper
conduits, net of tax - (26) (180) - -
Net income (loss) (1,083) 1,443 2,058 2,860 1,577Net (income) loss attributable to noncontrolling interests,
net of tax (1) (24) (19) (13) (6)Redemption charge and preferred dividends (283) (33) - - -
Net income (loss) applicable to common shareholders ofThe Bank of New York Mellon Corporation $ (1,367) $ 1,386 $ 2,039 $ 2,847 $ 1,571
Earnings per diluted common share (c):Income (loss) from continuing operations $ (0.93) $ 1.21 $ 2.35 $ 2.04 $ 1.84Income (loss) from discontinued operations, net of tax (0.23) 0.01 0.01 1.91 0.31Extraordinary (loss), net of tax - (0.02) (0.19) - -
Net income (loss) applicable to common stock $ (1.16) $ 1.20 $ 2.17 $ 3.93 (d) $ 2.15
At Dec. 31Securities $ 56,049 $ 39,435 $ 48,698 $ 21,106 $ 27,218Loans 36,689 43,394 50,931 37,793 32,927Total assets 212,224 237,512 197,656 103,206 102,118Deposits 135,050 159,673 118,125 62,146 49,787Long-term debt 17,234 15,865 16,873 8,773 7,817Preferred (Series B) stock - 2,786 - - -Common shareholders’ equity 28,977 25,264 29,403 11,429 9,876
(a) Results for 2007 include six months of BNY Mellon and six months of legacy The Bank of New York Company, Inc.(b) Results for 2006 and 2005 include legacy The Bank of New York Company, Inc. only. All legacy The Bank of New York Company, Inc.
earnings per share and share-related data are presented in post merger share count terms.(c) Diluted earnings per common share for the year ended Dec. 31, 2009 was calculated using average basic shares. Adding back the
dilutive shares would result in anti-dilution.(d) Does not foot due to rounding.
6 BNY Mellon
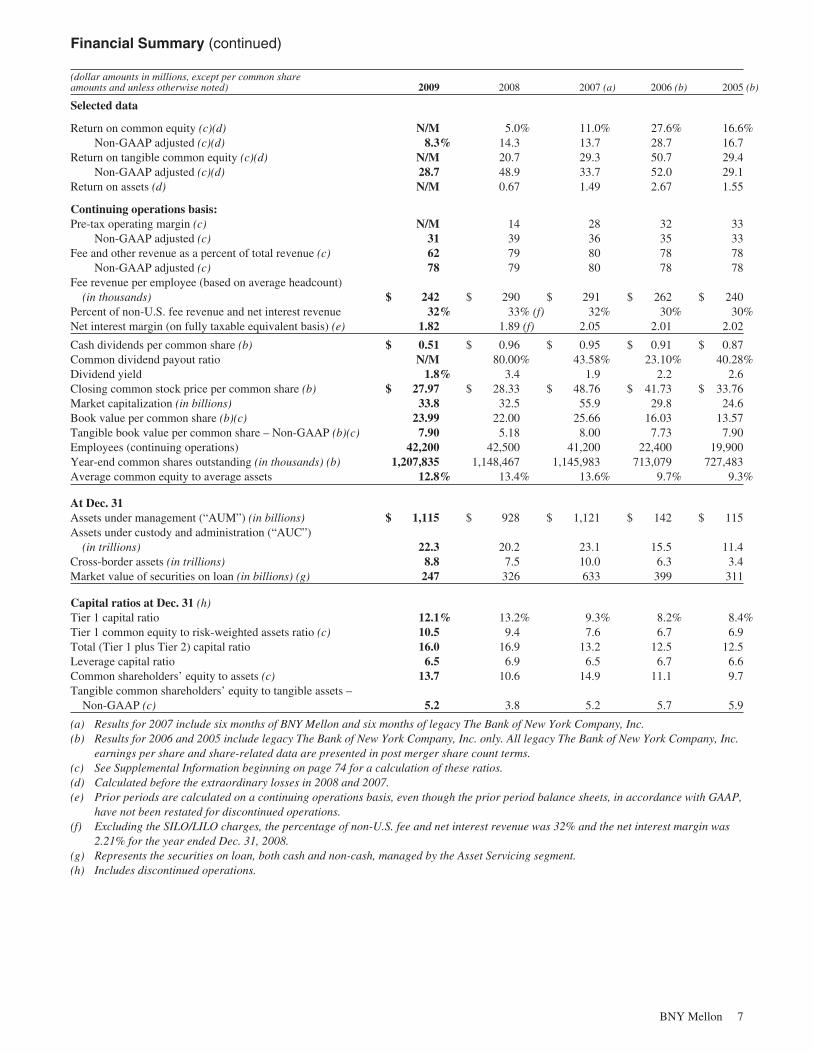
Financial Summary (continued)
(dollar amounts in millions, except per common shareamounts and unless otherwise noted) 2009 2008 2007 (a) 2006 (b) 2005 (b)
Selected data
Return on common equity (c)(d) N/M 5.0% 11.0% 27.6% 16.6%Non-GAAP adjusted (c)(d) 8.3% 14.3 13.7 28.7 16.7
Return on tangible common equity (c)(d) N/M 20.7 29.3 50.7 29.4Non-GAAP adjusted (c)(d) 28.7 48.9 33.7 52.0 29.1
Return on assets (d) N/M 0.67 1.49 2.67 1.55
Continuing operations basis:Pre-tax operating margin (c) N/M 14 28 32 33
Non-GAAP adjusted (c) 31 39 36 35 33Fee and other revenue as a percent of total revenue (c) 62 79 80 78 78
Non-GAAP adjusted (c) 78 79 80 78 78Fee revenue per employee (based on average headcount)
(in thousands) $ 242 $ 290 $ 291 $ 262 $ 240Percent of non-U.S. fee revenue and net interest revenue 32% 33% (f) 32% 30% 30%Net interest margin (on fully taxable equivalent basis) (e) 1.82 1.89 (f) 2.05 2.01 2.02
Cash dividends per common share (b) $ 0.51 $ 0.96 $ 0.95 $ 0.91 $ 0.87Common dividend payout ratio N/M 80.00% 43.58% 23.10% 40.28%Dividend yield 1.8% 3.4 1.9 2.2 2.6Closing common stock price per common share (b) $ 27.97 $ 28.33 $ 48.76 $ 41.73 $ 33.76Market capitalization (in billions) 33.8 32.5 55.9 29.8 24.6Book value per common share (b)(c) 23.99 22.00 25.66 16.03 13.57Tangible book value per common share – Non-GAAP (b)(c) 7.90 5.18 8.00 7.73 7.90Employees (continuing operations) 42,200 42,500 41,200 22,400 19,900Year-end common shares outstanding (in thousands) (b) 1,207,835 1,148,467 1,145,983 713,079 727,483Average common equity to average assets 12.8% 13.4% 13.6% 9.7% 9.3%
At Dec. 31Assets under management (“AUM”) (in billions) $ 1,115 $ 928 $ 1,121 $ 142 $ 115Assets under custody and administration (“AUC”)
(in trillions) 22.3 20.2 23.1 15.5 11.4Cross-border assets (in trillions) 8.8 7.5 10.0 6.3 3.4Market value of securities on loan (in billions) (g) 247 326 633 399 311
Capital ratios at Dec. 31 (h)Tier 1 capital ratio 12.1% 13.2% 9.3% 8.2% 8.4%Tier 1 common equity to risk-weighted assets ratio (c) 10.5 9.4 7.6 6.7 6.9Total (Tier 1 plus Tier 2) capital ratio 16.0 16.9 13.2 12.5 12.5Leverage capital ratio 6.5 6.9 6.5 6.7 6.6Common shareholders’ equity to assets (c) 13.7 10.6 14.9 11.1 9.7Tangible common shareholders’ equity to tangible assets –
Non-GAAP (c) 5.2 3.8 5.2 5.7 5.9
(a) Results for 2007 include six months of BNY Mellon and six months of legacy The Bank of New York Company, Inc.(b) Results for 2006 and 2005 include legacy The Bank of New York Company, Inc. only. All legacy The Bank of New York Company, Inc.
earnings per share and share-related data are presented in post merger share count terms.(c) See Supplemental Information beginning on page 74 for a calculation of these ratios.(d) Calculated before the extraordinary losses in 2008 and 2007.(e) Prior periods are calculated on a continuing operations basis, even though the prior period balance sheets, in accordance with GAAP,
have not been restated for discontinued operations.(f) Excluding the SILO/LILO charges, the percentage of non-U.S. fee and net interest revenue was 32% and the net interest margin was
2.21% for the year ended Dec. 31, 2008.(g) Represents the securities on loan, both cash and non-cash, managed by the Asset Servicing segment.(h) Includes discontinued operations.
BNY Mellon 7
Management’s Discussion and Analysis of Financial Condition and Results of Operations
Results of Operations
General
In this Annual Report, references to “our,” “we,” “us,”“BNY Mellon,” the “Company,” and similar terms forperiods on or after July 1, 2007 refer to The Bank ofNew York Mellon Corporation and references to“our,” “we,” “us,” the “Company,” and similar termsprior to July 1, 2007 refer to The Bank of New YorkCompany, Inc.
BNY Mellon’s actual results of future operations maydiffer from those estimated or anticipated in certainforward-looking statements contained herein forreasons which are discussed below and under theheading “Forward-looking Statements.” When used inthis Annual Report, words such as “estimate,”“forecast,” “project,” “anticipate,” “confident,”“target,” “expect,” “intend,” “continue,” “seek,”“believe,” “plan,” “goal,” “could,” “should,” “may,”“will,” “strategy,” “synergies,” “opportunities,”“trends,” and words of similar meaning, signifyforward-looking statements in addition to statementsspecifically identified as forward-looking statements.
Certain business terms used in this document aredefined in the Glossary.
The following should be read in conjunction with theConsolidated Financial Statements included in thisAnnual Report. Investors should also read the sectionentitled “Forward-looking statements.”
How we reported results
On July 1, 2007, The Bank of New York Company,Inc. and Mellon Financial Corporation (“MellonFinancial”) merged into The Bank of New YorkMellon Corporation (together with its consolidatedsubsidiaries, “BNY Mellon”), with BNY Mellonbeing the surviving entity.
The merger transaction resulted in The Bank of NewYork Company, Inc. shareholders receiving 0.9434shares of BNY Mellon’s common stock for each shareof The Bank of New York Company, Inc. commonstock outstanding at the closing date of the merger.All legacy The Bank of New York Company, Inc.earnings per share and common stock outstandingamounts in this Annual Report have been restated toreflect this exchange ratio. For accounting andfinancial reporting purposes the merger was accountedfor as a purchase of Mellon Financial by The Bank ofNew York Company, Inc.
Results for 2007 reflect six months of BNY Mellonand six months of legacy The Bank of New YorkCompany, Inc. Results prior to 2007 reflect legacyThe Bank of New York Company, Inc. only.
All information in this Annual Report is reported on acontinuing operations basis, unless otherwise noted.For a description of discontinued operations, seeNote 4 in the Notes to Consolidated FinancialStatements.
Throughout this Annual Report, certain measures,which are noted, exclude certain items. BNY Mellonbelieves that these measures are useful to investorsbecause they permit a focus on period-to-periodcomparisons, which relate to our ability to enhancerevenues and limit expenses in circumstances wheresuch matters are within our control. We also presentcertain amounts on a fully taxable equivalent (“FTE”)basis. We believe that this presentation allows forcomparison of amounts arising from both taxable andtax-exempt sources and is consistent with industrypractice. The adjustment to a FTE basis has no impacton net income. See “Supplemental information –Explanation of Non-GAAP financial measures”beginning on page 74 for a reconciliation of financialmeasures presented in accordance with GAAP toadjusted Non-GAAP financial measures.
Overview
BNY Mellon is the corporate brand of The Bank ofNew York Mellon Corporation (NYSE symbol: BK).BNY Mellon is a global leader in providing acomprehensive array of services that enableinstitutions and individuals to manage and servicetheir financial assets in more than 100 marketsworldwide. We strive to be the global provider ofchoice for asset and wealth management andinstitutional services and be recognized for our broadand deep capabilities, superior client service andconsistent outperformance versus peers. Our globalclient base consists of financial institutions,corporations, government agencies, high-net-worthindividuals, families, endowments and foundationsand related entities. At Dec. 31, 2009, we had $22.3trillion in assets under custody and administration and$1.1 trillion in assets under management, serviced$12.0 trillion in outstanding debt and, on average,processed $1.6 trillion of global payments per day.
BNY Mellon’s businesses benefit during periods ofglobal growth in financial assets and concentration of
8 BNY Mellon
Results of Operations (continued)
wealth, and also benefit from the globalization of theinvestment process. Over the long term, our financialgoals are focused on deploying capital to acceleratethe long-term growth of our businesses and onachieving superior total returns to shareholders bygenerating first quartile earnings per share growthover time relative to a group of peer companies.
Key components of our strategy include: providingsuperior client service versus peers; strong investmentperformance (relative to investment benchmarks);above median revenue growth (relative to peercompanies for each of our businesses); an increasingpercentage of revenue and income derived fromoutside the U.S.; successful integration ofacquisitions; competitive margins; and positiveoperating leverage. We have established Tier 1 capitalas our principal capital measure and have establisheda targeted minimum ratio of Tier 1 capital to risk-weighted assets of 10%.
Impact of the current market environment onour business and regulatory events
In 2009, market related factors continued to impactthe results in our core businesses. Total revenue wasimpacted by: a low interest rate environment, whichresulted in lower net interest and fee revenue; lowerforeign exchange (“FX”) volumes; and lower averageequity markets as reflected by a 22% decrease in thedaily average S&P 500 Index and a 15% decrease inthe daily average FTSE 100 Index.
Our Asset and Wealth Management businesses werenegatively impacted by global weakness in marketvalues as a result of a decline in the daily averages ofthe S&P 500 and the FTSE 100 indices comparedwith 2008. Our asset and wealth management feerevenue was also negatively impacted by outflows inthe alternative asset class as investors reduced theirrisk profiles and higher money market fee waivers asa result of low interest rates.
FX revenues returned to more normalized levels in2009 from the record levels of 2008, reflecting lowervolatility and spreads.
Results in our securities lending business continue tobe impacted by narrower spreads and lower marketvaluations, as well as overall de-leveraging in thefinancial markets compared with 2008. Spreadscontinued to narrow throughout 2009 and by the endof 2009 returned to more historic levels.
Market conditions in 2009 resulted in a reduction inthe volume of global fixed income securities issuanceswhich impacted the level of new business in ourCorporate Trust business.
The weakness in the equity markets in 2009 resultedin a lower level of corporate actions which impactedour Depositary Receipts and Shareowner Servicesbusinesses.
The current low interest rate environment continues toadversely impact our net interest revenue andcorresponding net interest margin, as well as moneymarket mutual fund and money market fund relateddistribution fees. At Dec. 31, 2009, we estimate thatan immediate 100 basis point increase in overnightinterest rates from those currently in effect wouldincrease annual pre-tax income by approximately$500 million. The increase to pre-tax income wouldbenefit both fee revenue and net interest revenue.
Evolving regulatory environment
The current economic and political environment hasled to legislative and regulatory initiatives that addressthe financial services industry’s monitoring of risk,capital requirements and executive compensationpolicies. The Obama Administration, Congress andU.S. and foreign regulators are currently considering avariety of proposals that would modify the regulationof the financial services industry and increase costs.The initiatives that would have the greatest impact onour business are described below.
The Federal Deposit Insurance Corporation (“FDIC”)adopted a final rule requiring insured depositoryinstitutions to prepay their estimated quarterly regularrisk-based assessments for the fourth quarter of 2009and for all 2010, 2011 and 2012. On Dec. 30, 2009,The Bank of New York Mellon and BNY Mellon,N.A., our two principal banks, prepaid an aggregate of$295 million for their estimated quarterly risk-basedassessments for these periods.
Also, in 2009, BNY Mellon recorded a payment of aspecial emergency deposit assessment of 5 basispoints on each FDIC-insured depository institution’stotal assets, minus its Tier 1 capital, as of June 30,2009, subject to a cap of 10 basis points of averageassessable domestic deposits for the second quarter of2009. The special assessment resulted in a pre-taxcharge of $61 million, which was recorded as otherexpense.
BNY Mellon 9
Results of Operations (continued)
In January 2010, President Obama proposed a“Financial Crisis Responsibility Fee” which wouldapply to banks, thrifts, insurance companies andbroker-dealers with more than $50 billion inconsolidated assets. The fee is intended to recoup thecost of the Troubled Asset Relief Program (“TARP”)to the U.S. Government. As currently proposed, thefee would go into effect on June 30, 2010 and wouldremain in force for 10 years or longer. The fee wouldbe calculated on total assets excluding Tier 1 capitaland assessed deposits. Based on the amount of assetson our balance sheet at Dec. 31, 2009, we estimatethat we would be responsible for payingapproximately $200 million annually under thisproposal, if enacted as currently proposed.
Financial regulatory reform continues to be a toppriority for the Obama Administration. The U.S.House of Representatives (the “House”) passed the“Wall Street Reform and Consumer Protection Act”on Dec. 11, 2009. The U.S. Senate has not yet passedlegislation in this area. The Senate BankingCommittee draft bill, “Restoring American FinancialStability Act of 2009,” is still in draft form andcurrently under discussion. Both legislative productsfocus on measures to improve financial stability,provide for more effective bank supervision, enhancethe regulation of consumer financial products andservices through the establishment of a ConsumerFinancial Protection Agency and allow for bettercoordination between regulatory agencies. TheHouse’s bill would establish a Systemic DissolutionFund to help wind down financial institutions whennecessary. The fund would be pre-funded by FDICassessments on large financial companies with assetsexceeding $50 billion, to pay for the resolution of abank holding company, a systemically importantfinancial company, an insurance company or anyother financial company. The Senate BankingCommittee’s draft proposal has a similar resolutionmechanism and sets the threshold at $10 billion ormore.
2009 and subsequent events
Investment securities portfolio restructuring
Consistent with our ongoing strategy to reducebalance sheet risk, and reflecting the improvement inthe fixed income markets in the second half of 2009,we sold or restructured a significant portion of ourwatch list investment securities portfolio. The watchlist includes those securities we view as having ahigher risk of impairment charge.
The sales and restructuring impacted approximately$13.5 billion (pre-restructuring amortized cost) ofinvestment securities. The investment securities salesand restructuring resulted in a net charge ofapproximately $4.8 billion (pre-tax) in 2009. Themajority of the restructured securities were retainedon our balance sheet in a certificate issued by aGrantor Trust.
The charge for restructuring the securities portfoliohad a minimal impact on our tangible capital ratio, asapproximately 90% of the charge had previously beenreflected in tangible capital.
As a result of the restructuring, we expect net interestrevenue to be positively impacted by approximately$200 million in 2010.
Settlement with the Russian Federal Customs Service
In October 2009, the Federal Customs Service of theRussian Federation (the “Customs Service”) and TheBank of New York Mellon, a subsidiary of BNYMellon, settled the litigation filed by the CustomsService in the Arbitrazh Court of the City of Moscow.
Under the terms of the settlement agreement, theCustoms Service agreed to withdraw its $22.5 billionlawsuit, the proceedings were terminated by theArbitrazh Court, and the Customs Service and TheBank of New York Mellon exchanged mutualreleases. Without any admission of liability, The Bankof New York Mellon agreed to pay $14 million in trialcosts and expenses to the Customs Service inconsideration for the settlement.
Acquisition of Insight Investment Management
In November 2009, we acquired Insight InvestmentManagement Limited (“Insight”) for £235 million(approximately $377 million of cash and stock).Based in London, Insight specializes in liability-driven investment solutions, active fixed income andalternative investments. Its clients include some of theUK’s largest pension schemes, corporates, insurancecompanies and local authorities, along with a growingnumber of non-UK clients and some of the best-known financial services and intermediary companies.At acquisition, Insight had approximately $138 billionin assets under management. Insight is included in theAsset Management segment.
10 BNY Mellon

Results of Operations (continued)
Siguler Guff & Company, LLC investment
In November 2009, BNY Mellon acquired a 20%minority interest in Siguler Guff & Company, LLC(and certain related entities) (“Siguler Guff”), a multi-strategy private equity firm with approximately $8billion in assets under management and committedcapital.
Agreement to acquire Global Investment Servicing,Inc.
In February 2010, BNY Mellon announced adefinitive agreement to acquire Global InvestmentServicing, Inc. (“GIS”) from PNC for cash of $2.31billion. GIS provides a comprehensive suite ofproducts which includes subaccounting, fundaccounting/administration, custody, managed accountservices and alternative investment services. GIS isbased in Wilmington, Delaware and hasapproximately 4,500 employees in locations acrossthe U.S. and Europe.
GIS has approximately $855 billion in assets underadministration, including $460 billion in assets undercustody. BNY Mellon plans to raise between$700-800 million in equity as part of the transaction.The transaction is expected to close in the thirdquarter of 2010, subject to necessary regulatoryapprovals. At closing, GIS will be included in theInstitutional Services sector.
Repurchased preferred stock and warrant related toTARP
In June 2009, BNY Mellon repurchased the 3 millionshares of its Series B preferred stock issued to theU.S. Treasury in October 2008 as part of the TARPCapital Purchase Program. BNY Mellon paid the U.S.Treasury $3.0 billion, which reflects the liquidationvalue of the preferred stock.
Related to this repurchase, we recorded an after-taxredemption charge of $196.5 million in 2009,representing the difference between the amortized costof the preferred stock and the repurchase price. BNYMellon paid the U.S. Treasury an aggregate ofapproximately $95 million in dividends on the SeriesB preferred shares from Oct. 28, 2008 through therepurchase date.
On Aug. 5, 2009, BNY Mellon repurchased thewarrant issued to the U.S. Treasury in connection withthe TARP Capital Purchase Program. The warrant was
for 14,516,129 shares of our common stock. Therepurchase price was $136 million.
Common stock and debt offerings
In 2009, BNY Mellon issued 48 million shares ofcommon stock in a public offering, at a weighted-average price of $28.75 per common share, for a totalof $1.4 billion. In addition to the common stockoffering, during 2009 BNY Mellon issued $2.75billion of non-guaranteed senior debt in publicofferings comprised of $1.75 billion of 5-year notesand $1 billion of 10-year notes. The proceeds from theequity and debt offerings were used for generalcorporate purposes, which included funding therepurchase of the preferred stock related to TARP.BNY Mellon also issued approximately $600 millionof FDIC-guaranteed debt, as described in “FDICTemporary Liquidity Guarantee Program,” below.
Regulatory stress test
On May 7, 2009, the regulators released the results ofthe stress test administered under the SupervisoryCapital Assessment Program conducted during thefirst quarter of 2009. The results concluded that BNYMellon was not required to raise additional capital,and under the test’s adverse scenario our capital ratiosstrengthened further.
Discontinued operations
In July 2009, we announced an agreement to sellMellon United National Bank (“MUNB”) located inFlorida. As a result, we adopted discontinuedoperations accounting for MUNB. It was determinedthat this business no longer fit our strategic focus onour asset management and securities servicingbusinesses. MUNB was sold on Jan. 15, 2010. Thebusiness was formerly included in the Other segment.In 2009, we recorded an after-tax loss on discontinuedoperations of $270 million primarily reflecting loanwrite-downs and the elimination of $82 million ofgoodwill.
The income statements for all periods in this AnnualReport have been restated to reflect the discontinuedoperations treatment of MUNB. The restatementresulted in a reduction to previously reported levels ofnet interest revenue and the net interest margin; aslight reduction in both treasury services and other feerevenue; a reduction in the provision for credit losses;a reduction in noninterest expense; and a change incontinuing earnings per share.
BNY Mellon 11
Results of Operations (continued)
FDIC Temporary Liquidity Guarantee Program
In October 2008, the FDIC announced the TemporaryLiquidity Guarantee Program (“TLGP”). Thisprogram:
Š Guarantees certain types of senior unsecureddebt issued by participating U.S. bank holdingcompanies, U.S. savings and loan holdingcompanies and FDIC-insured depositoryinstitutions between Oct. 14, 2008 and Oct. 31,2009, including promissory notes, commercialpaper and any unsecured portion of senior debt.In 2009, BNY Mellon issued approximately$600 million of FDIC-guaranteed debt maturingJune 29, 2012 under this program, which wasthe maximum amount of the debt permissible forit under the TLGP; and
Š Provides full FDIC deposit insurance coveragefor funds held by participating FDIC-insureddepository institutions in noninterest-bearingtransaction deposit accounts until Dec. 31, 2009,extended until June 30, 2010. On Nov. 2, 2009,BNY Mellon elected to opt out of the six monthextension of this program. Our participation inthe program ended on Dec. 31, 2009.
Summary of financial results
We reported a net loss from continuing operationsapplicable to the common shareholders of BNYMellon of $1.1 billion, or $0.93 per diluted commonshare in 2009. This compares with net income of $1.4billion, or diluted earnings per common share of $1.21in 2008 and $2.2 billion, or diluted earnings percommon share of $2.35, in 2007.
In 2009, the net loss applicable to commonshareholders, including discontinued operations,totaled $1.4 billion, or $1.16 per diluted commonshare, compared with net income of $1.4 billion, or$1.20 per diluted common share, in 2008 and $2.0billion, or $2.17 per diluted common share, in 2007.
Highlights of 2009 results
Š Assets under custody and administration(“AUC”) totaled $22.3 trillion at Dec. 31, 2009compared with $20.2 trillion at Dec. 31, 2008reflecting higher market values and newbusiness wins. (See the Institutional Servicessector on page 28.)
Š Assets under management (“AUM”) totaled$1.115 trillion at Dec. 31, 2009 compared with$928 billion at Dec. 31, 2008. The impact ofacquisitions and higher market values werepartially offset by money market outflows. (Seethe Asset and Wealth Management sector onpage 24.)
Š Securities servicing revenue totaled $5.0 billionin 2009 compared with $6.1 billion in 2008.Continued new business wins were more thanoffset by lower securities lending revenue, lowermoney market related distribution fees, lowermarket values throughout most of 2009 and alower level of fixed income issuances globally.See the Institutional Services sector on page 28.)
Š Securities lending fee revenue totaled $259million in 2009 compared with $789 million in2008. The decrease reflects narrower spreadsand lower loan balances due to de-leveraging inthe financial markets. Securities lending assetstotaled $247 billion at Dec. 31, 2009 comparedwith $326 billion at Dec. 31, 2008. (See theInstitutional Services sector on page 28.)
Š Asset and wealth management fees, includingperformance fees totaled $2.6 billion in 2009compared with $3.2 billion in 2008. Thedecrease reflects global weakness in marketvalues throughout most of 2009, a reduction inmoney market related fees due to outflows inmoney market products and higher fee waivers,partially offset by new business and theacquisition of Insight. (See the AssetManagement and Wealth Management segmentsbeginning on page 26.)
Š Foreign exchange and other trading activitiesrevenue totaled $1.0 billion in 2009 comparedwith a record $1.5 billion in 2008. The decreaseprimarily resulted from lower foreign exchangerevenue driven by a 21% decline in volumes.(See Fee and other revenue beginning onpage 14.)
Š Investment securities (pre-tax) net losses of $5.4billion in 2009 were primarily driven by theinvestment securities portfolio restructuringdescribed above. (See Consolidated balancesheet review beginning on page 45.)
Š Net interest revenue totaled $2.9 billion in 2009essentially unchanged compared with 2008.Results in 2009 reflect historically low interestrates and our strategy to reinvest in high quality,relatively short duration assets, while results in2008 were impacted by $489 million ofsale-in-lease out (“SILO”)/lease-in-lease out
12 BNY Mellon
Results of Operations (continued)
(“LILO”) charges. (See Net interest revenuebeginning on page 17.)
Š The provision for credit losses was $332 millionin 2009 compared with $104 million in 2008.The increase primarily relates to a highernumber of downgrades in 2009 and deteriorationin certain industry sectors. (See Asset qualityand allowance for credit losses beginning onpage 54.)
Š Noninterest expense totaled $9.6 billion in 2009compared with $11.5 billion in 2008. Thedecrease reflects lower support agreementcharges, lower compensation and incentiveexpense, lower M&I charges as well as thebenefit of merger-related expense synergies.(See Noninterest expense beginning onpage 20.)
Š Merger and integration (“M&I”) expenses were$233 million (pre-tax), or $0.12 per dilutedcommon share in 2009. (See Noninterestexpense beginning on page 20.)
Š We recorded an after-tax redemption charge of$196.5 million related to the repurchase of theSeries B preferred stock issued to the U.S.Treasury as part of the TARP Capital PurchaseProgram and $86.5 million for dividends/accretion on the Series B preferred stock. Theseitems decreased earnings per share by $0.24 perdiluted common share in 2009.
Š The unrealized net of tax loss on our investmentsecurities portfolio was $619 million at Dec. 31,2009 compared with $4.0 billion at Dec. 31,2008. The decrease primarily resulted from thesale and restructuring of a portion of thewatchlist investment securities portfolio andgeneral improvements in the fixed incomemarkets. (See Consolidated balance sheet reviewbeginning on page 45.)
Š The Tier 1 capital ratio at Dec. 31, 2009 was12.1% compared with 13.2% at Dec. 31, 2008.The decrease in the Tier 1 capital ratio primarilyreflects the charge related to the restructuring ofthe investment securities portfolio and therepayment of the Series B preferred stock,partially offset by the common stock issuancesin 2009 and lower risk-weighted assets.
Results for 2008
Results for 2008 were significantly impacted by themerger with Mellon Financial. The merger increasedasset servicing revenue, asset and wealth managementrevenue, foreign exchange and other trading activities,treasury services revenue, distribution and servicingrevenue and had a lesser impact on issuer servicesrevenue. Noninterest expense was also significantlyimpacted by the merger. Results for 2008 alsoincluded:
Š Securities write-downs of $1.6 billion (pre-tax),primarily relating to negative marketassumptions in the housing industry;
Š Support agreements provided to clients whichresulted in an $894 million (pre-tax) charge;
Š A charge relating to certain SILOs/LILOs of$489 million (pre-tax) as well as the settlementof several audit cycles;
Š M&I expenses of $483 million (pre-tax);Š A restructuring charge of $181 million (pre-tax)
related to global workforce reduction initiatives;and
Š The consolidation of the assets of our bank-sponsored commercial paper conduit, Old SlipFunding, LLC (“Old Slip”) which resulted in anextraordinary after-tax loss of $26 million.
Results for 2007
Results for 2007 were primarily impacted by themerger with Mellon Financial in July 2007. Themerger increased asset servicing revenue, asset andwealth management fees, foreign exchange and othertrading activities, net interest revenue and noninterestexpense. Issuer services revenue increased, primarilyas a result of the acquisition of the corporate trustbusiness of J. P. Morgan Chase.
Results for 2007 also included the consolidation of theassets of our bank-sponsored commercial paperconduit, Three Rivers Funding Corporation (“TRFC”)which resulted in an extraordinary after-tax loss of$180 million.
BNY Mellon 13
Results of Operations (continued)
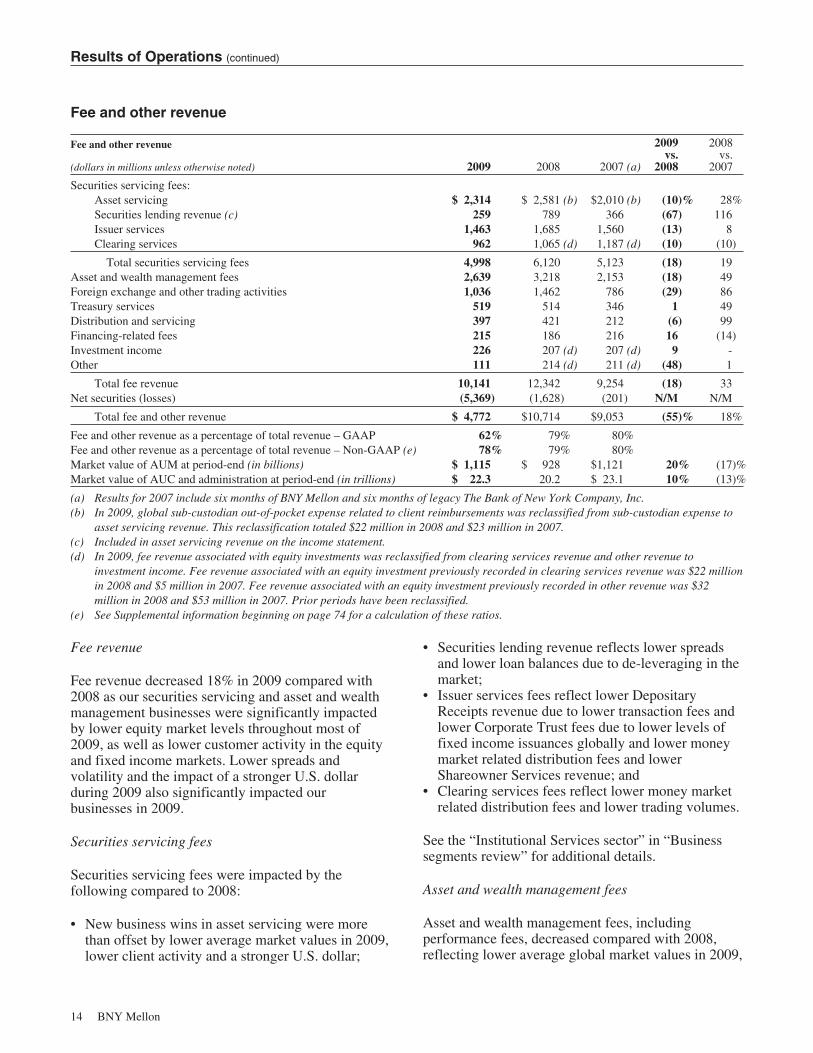
Fee and other revenue
Fee and other revenue
(dollars in millions unless otherwise noted) 2009 2008 2007 (a)
2009vs.
2008
2008vs.
2007
Securities servicing fees:Asset servicing $ 2,314 $ 2,581 (b) $2,010 (b) (10)% 28%Securities lending revenue (c) 259 789 366 (67) 116Issuer services 1,463 1,685 1,560 (13) 8Clearing services 962 1,065 (d) 1,187 (d) (10) (10)
Total securities servicing fees 4,998 6,120 5,123 (18) 19Asset and wealth management fees 2,639 3,218 2,153 (18) 49Foreign exchange and other trading activities 1,036 1,462 786 (29) 86Treasury services 519 514 346 1 49Distribution and servicing 397 421 212 (6) 99Financing-related fees 215 186 216 16 (14)Investment income 226 207 (d) 207 (d) 9 -Other 111 214 (d) 211 (d) (48) 1
Total fee revenue 10,141 12,342 9,254 (18) 33Net securities (losses) (5,369) (1,628) (201) N/M N/M
Total fee and other revenue $ 4,772 $10,714 $9,053 (55)% 18%
Fee and other revenue as a percentage of total revenue – GAAP 62% 79% 80%Fee and other revenue as a percentage of total revenue – Non-GAAP (e) 78% 79% 80%Market value of AUM at period-end (in billions) $ 1,115 $ 928 $1,121 20% (17)%Market value of AUC and administration at period-end (in trillions) $ 22.3 20.2 $ 23.1 10% (13)%
(a) Results for 2007 include six months of BNY Mellon and six months of legacy The Bank of New York Company, Inc.(b) In 2009, global sub-custodian out-of-pocket expense related to client reimbursements was reclassified from sub-custodian expense to
asset servicing revenue. This reclassification totaled $22 million in 2008 and $23 million in 2007.(c) Included in asset servicing revenue on the income statement.(d) In 2009, fee revenue associated with equity investments was reclassified from clearing services revenue and other revenue to
investment income. Fee revenue associated with an equity investment previously recorded in clearing services revenue was $22 millionin 2008 and $5 million in 2007. Fee revenue associated with an equity investment previously recorded in other revenue was $32million in 2008 and $53 million in 2007. Prior periods have been reclassified.
(e) See Supplemental information beginning on page 74 for a calculation of these ratios.
Fee revenue
Fee revenue decreased 18% in 2009 compared with2008 as our securities servicing and asset and wealthmanagement businesses were significantly impactedby lower equity market levels throughout most of2009, as well as lower customer activity in the equityand fixed income markets. Lower spreads andvolatility and the impact of a stronger U.S. dollarduring 2009 also significantly impacted ourbusinesses in 2009.
Securities servicing fees
Securities servicing fees were impacted by thefollowing compared to 2008:
• New business wins in asset servicing were morethan offset by lower average market values in 2009,lower client activity and a stronger U.S. dollar;
• Securities lending revenue reflects lower spreadsand lower loan balances due to de-leveraging in themarket;
• Issuer services fees reflect lower DepositaryReceipts revenue due to lower transaction fees andlower Corporate Trust fees due to lower levels offixed income issuances globally and lower moneymarket related distribution fees and lowerShareowner Services revenue; and
• Clearing services fees reflect lower money marketrelated distribution fees and lower trading volumes.
See the “Institutional Services sector” in “Businesssegments review” for additional details.
Asset and wealth management fees
Asset and wealth management fees, includingperformance fees, decreased compared with 2008,reflecting lower average global market values in 2009,
14 BNY Mellon

Results of Operations (continued)
lower money market related fees due to increased feewaivers and short-term outflows, and a stronger U.S.dollar, partially offset by new business. See the “Assetand Wealth Management sector” in “Businesssegments review” for additional details regarding thedrivers of asset and wealth management fees.
Total AUM for the Asset and Wealth Managementsector were $1.1 trillion at Dec. 31, 2009, comparedwith $928 billion at Dec. 31, 2008. The increaseresulted from the Insight acquisition and marketappreciation, offset in part by $49 billion of netmoney market outflows and $6 billion of net long-term outflows. Long-term outflows in 2009 reflect$20 billion of outflows through September, primarilyoffset by $14 billion of inflows in the fourth quarter.The S&P 500 index was 1115 at Dec. 31, 2009compared with 903 at Dec. 31, 2008, a 23% increase.
Foreign exchange and other trading activities
Foreign exchange and other trading activities revenue,which is primarily reported in the Asset Servicingsegment, decreased $426 million, or 29%, from arecord $1.5 billion in 2008. The decrease primarilyresulted from lower foreign exchange revenue drivenby lower volumes and a lower valuation of the creditdefault swaps used to economically hedge the loanportfolio. Foreign exchange volumes were down in2009, decreasing approximately 21% from theelevated levels experienced during the credit crisis in2008.
Treasury services
Treasury services, which are primarily reported in theTreasury Services segment, include fees related tofunds transfer, cash management, and liquiditymanagement. Treasury services fees increased $5million from 2008 resulting from higher globalpayment volumes.
Distribution and servicing fees
Distribution and servicing fees earned from mutualfunds are primarily based on average assets in thefunds and the sales of funds that we manage oradminister and are primarily reported in the AssetManagement segment. These fees, which include12b-1 fees, fluctuate with the overall level of netsales, the relative mix of sales between share classesand the funds’ market values.
The $24 million decrease in distribution and servicingfee revenue in 2009 compared with 2008 primarily
reflects lower money market related fees. The impactof distribution and servicing fees on income in anyone period can be more than offset by distribution andservicing expense paid to other financialintermediaries to cover their costs for distribution andservicing of mutual funds. Distribution and servicingexpense is recorded as noninterest expense on theincome statement.
Financing-related fees
Financing-related fees, which are primarily reportedin the Treasury Services segment, include capitalmarkets fees, loan commitment fees and credit-relatedtrade fees. Financing-related fees increased $29million from 2008. The increase primarily reflectshigher fees on capital market products.
Investment income
Investment income(in millions) 2009 2008 2007 (a)
Corporate/bank-owned lifeinsurance $151 $145 $111
Lease residual gains 90 89 -Seed capital gains (losses) 31 (82) (35)Private equity gains (losses) (18) 1 67Equity investment income (loss) (28) 54 64
Total investment income $226 $207 $207
(a) Results for 2007 include six months of BNY Mellon and sixmonths of legacy The Bank of New York Company, Inc.
Investment income, which is primarily reported in theOther and Asset Management segments, includesincome from insurance contracts, lease residual gainsand losses, gains and losses on seed capitalinvestments and private equity investments, andequity investment income (loss). The increasecompared to 2008 reflects higher seed capital gainsand income from corporate/bank-owned lifeinsurance, partially offset by the write-down of certainequity investments and losses on private equityinvestments.
Other revenue
Other revenue(in millions) 2009 2008 2007 (a)
Asset-related gains $ 76 $ 45 $ 9Expense reimbursements from
joint ventures 31 29 58Other income (loss) 4 140 144
Total other revenue $111 $214 $211
(a) Results for 2007 include six months of BNY Mellon and sixmonths of legacy The Bank of New York Company, Inc.
BNY Mellon 15
Results of Operations (continued)
Other revenue includes asset-related gains, expensereimbursements from joint ventures and other income(loss). Asset-related gains include loan, real estate andother asset dispositions. Expense reimbursementsfrom joint ventures relate to expenses incurred byBNY Mellon on behalf of joint ventures. Otherincome (loss) primarily includes foreign currencytranslation, other investments and variousmiscellaneous revenues.
Total other revenue decreased compared with 2008primarily reflecting a lower level of foreign currencytranslation, partially offset by a gain on the sale ofVISA shares recorded in 2009.
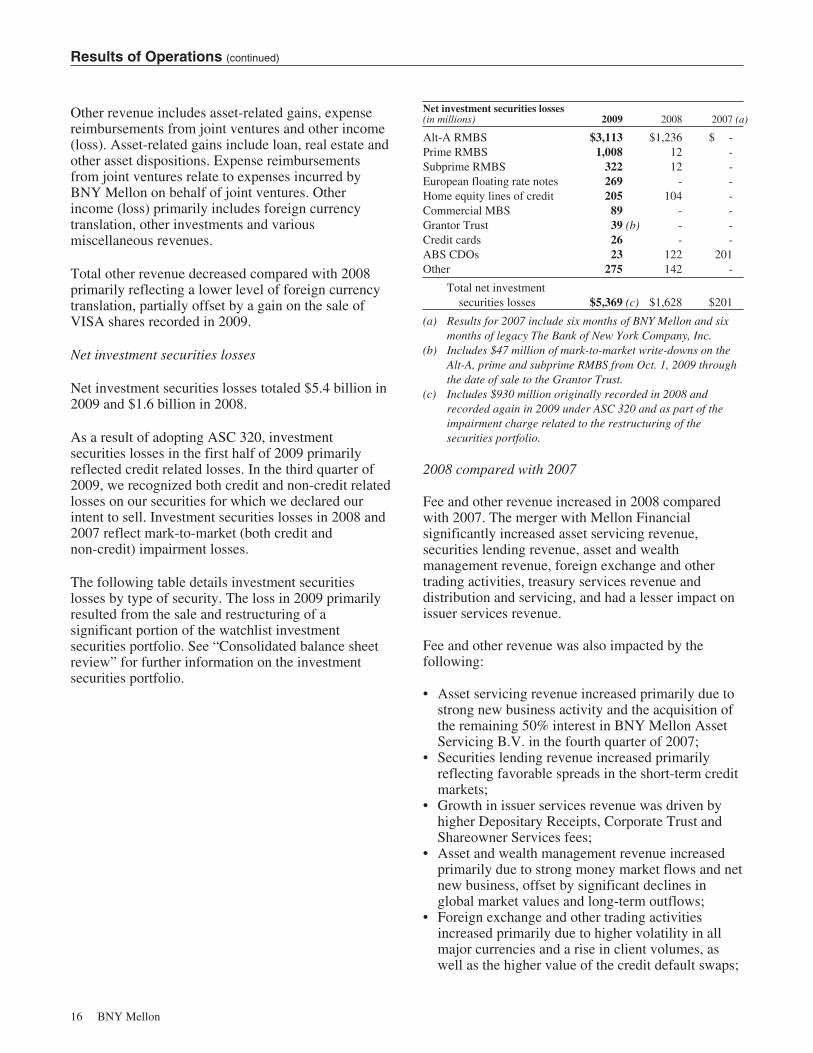
Net investment securities losses
Net investment securities losses totaled $5.4 billion in2009 and $1.6 billion in 2008.
As a result of adopting ASC 320, investmentsecurities losses in the first half of 2009 primarilyreflected credit related losses. In the third quarter of2009, we recognized both credit and non-credit relatedlosses on our securities for which we declared ourintent to sell. Investment securities losses in 2008 and2007 reflect mark-to-market (both credit andnon-credit) impairment losses.
The following table details investment securitieslosses by type of security. The loss in 2009 primarilyresulted from the sale and restructuring of asignificant portion of the watchlist investmentsecurities portfolio. See “Consolidated balance sheetreview” for further information on the investmentsecurities portfolio.
Net investment securities losses(in millions) 2009 2008 2007 (a)
Alt-A RMBS $3,113 $1,236 $ -Prime RMBS 1,008 12 -Subprime RMBS 322 12 -European floating rate notes 269 - -Home equity lines of credit 205 104 -Commercial MBS 89 - -Grantor Trust 39 (b) - -Credit cards 26 - -ABS CDOs 23 122 201Other 275 142 -
Total net investmentsecurities losses $5,369 (c) $1,628 $201
(a) Results for 2007 include six months of BNY Mellon and sixmonths of legacy The Bank of New York Company, Inc.
(b) Includes $47 million of mark-to-market write-downs on theAlt-A, prime and subprime RMBS from Oct. 1, 2009 throughthe date of sale to the Grantor Trust.
(c) Includes $930 million originally recorded in 2008 andrecorded again in 2009 under ASC 320 and as part of theimpairment charge related to the restructuring of thesecurities portfolio.
2008 compared with 2007
Fee and other revenue increased in 2008 comparedwith 2007. The merger with Mellon Financialsignificantly increased asset servicing revenue,securities lending revenue, asset and wealthmanagement revenue, foreign exchange and othertrading activities, treasury services revenue anddistribution and servicing, and had a lesser impact onissuer services revenue.
Fee and other revenue was also impacted by thefollowing:
• Asset servicing revenue increased primarily due tostrong new business activity and the acquisition ofthe remaining 50% interest in BNY Mellon AssetServicing B.V. in the fourth quarter of 2007;
• Securities lending revenue increased primarilyreflecting favorable spreads in the short-term creditmarkets;
• Growth in issuer services revenue was driven byhigher Depositary Receipts, Corporate Trust andShareowner Services fees;
• Asset and wealth management revenue increasedprimarily due to strong money market flows and netnew business, offset by significant declines inglobal market values and long-term outflows;
• Foreign exchange and other trading activitiesincreased primarily due to higher volatility in allmajor currencies and a rise in client volumes, aswell as the higher value of the credit default swaps;
16 BNY Mellon
Results of Operations (continued)
• Treasury services revenue increased primarilyresulting from higher processing volumes in globalpayment and cash management services; and
• Distribution and servicing fees increased primarilyreflecting strong money market inflows.
Net interest revenue
Net interest revenue
(dollars in millions) 2009 2008 2007 (a)
2009vs.
2008
2008vs.
2007
Net interest revenue (non-FTE) $ 2,915 $ 2,859 $ 2,245 2% 27%Tax equivalent adjustment 18 21 12 N/M N/M
Net interest revenue (FTE) 2,933 2,880 2,257 2% 28%SILO/LILO charges - 489 - N/M N/M
Net interest revenue excluding SILO/LILO charges (FTE) – Non-GAAP $ 2,933 $ 3,369 $ 2,257 (13)% 49%
Average interest-earning assets $160,955 $152,201 (b) $110,034 (b) 6% 38%Net interest margin (FTE) 1.82% 1.89% 2.05% (7)bps (16)bpsNet interest margin (FTE) excluding SILO/LILO charges (FTE) – Non-GAAP 1.82% 2.21% 2.05% (39)bps 16bps
(a) Results for 2007 include six months of BNY Mellon and six months of legacy The Bank of New York Company, Inc.(b) Excludes discontinued operations.
Net interest revenue on an FTE basis totaled $2.9billion in 2009, essentially unchanged from 2008,which included a $489 million charge related to SILO/LILOs. Excluding the SILO/LILO charges, netinterest revenue decreased compared with 2008 as lowinterest rates resulted in a decline in the value ofinterest-free balances and lower spreads, offset in partby an increase in average interest-earning assetsdriven by client deposits.
The net interest margin was 1.82% in 2009 comparedwith 1.89% in 2008, which was negatively impactedby the SILO/LILO charges. The net interest margin,excluding the SILO/LILO charges, was 2.21% in2008. In 2009, net interest revenue and the relatedmargin were impacted by persistently low interestrates globally, and our strategy to reinvest in highquality, relatively short-duration assets.
Average interest-earning assets were $161 billion in2009, compared with $152 billion in 2008 and $110billion in 2007. The increase in 2009 from 2008 wasdriven by higher levels of client deposits. Reflectingour strategy to invest in high quality relatively short-duration assets, average interest-earning cash ondeposit with the Federal Reserve and other centralbanks and interbank investments increased to $71.3
billion in 2009, from $60.1 billion in 2008 and $32.2billion in 2007. Average securities also increased to$53.2 billion in 2009, up from $45.5 billion in 2008and $37.0 billion in 2007. Average loans decreased to$36.4 billion in 2009, compared with $46.6 billion in2008 and $40.8 billion in 2007.
The restructuring of the investment securities portfolioin 2009 is expected to positively impact net interestrevenue by approximately $200 million in 2010.
2008 compared with 2007
The increase in net interest revenue in 2008 comparedto 2007 primarily resulted from the merger withMellon Financial, a higher level of noninterest-bearing deposits which resulted in a higher level ofinterest-earning assets, wider spreads and theaccretion of unrealized losses on investmentsecurities. This growth was partially offset by theSILO/LILO charges recorded in 2008.
The net interest margin was 1.89% in 2008 comparedwith 2.05% in 2007. The decrease primarily reflectsthe SILO/LILO charges recorded in 2008. Excludingthe SILO/LILO charges, the net interest marginincreased 16 basis points compared with 2007,primarily reflecting wider spreads.
BNY Mellon 17
Results of Operations (continued)
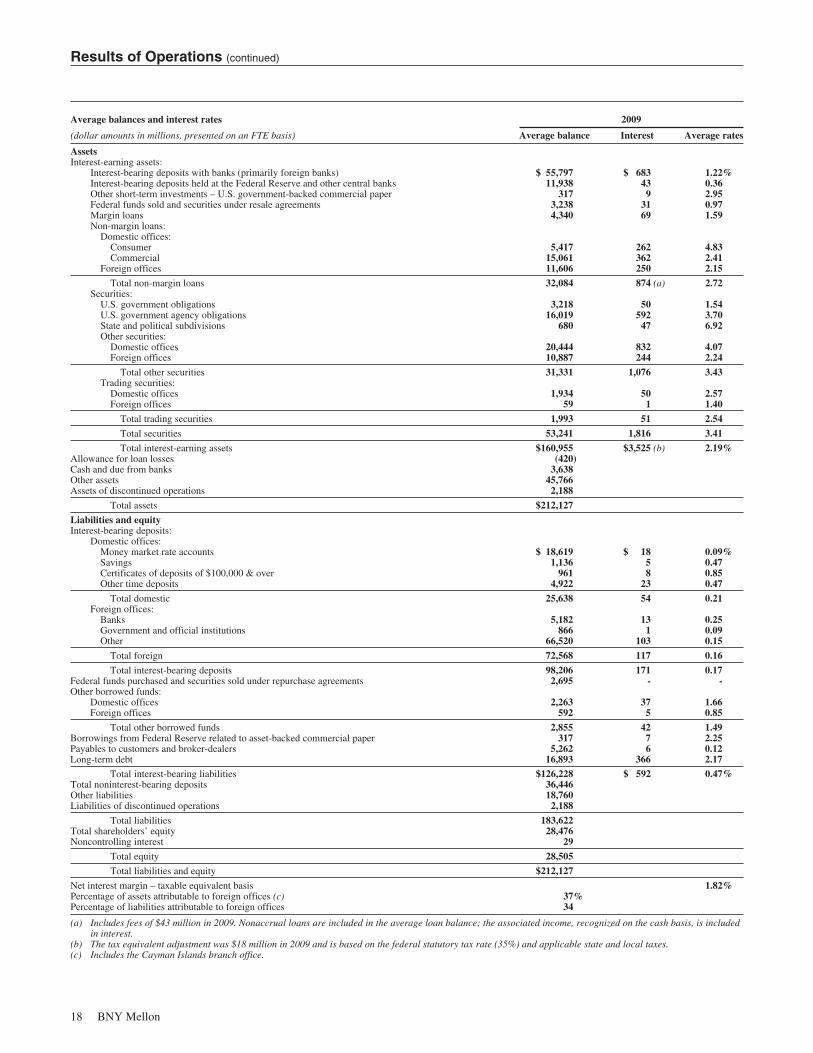
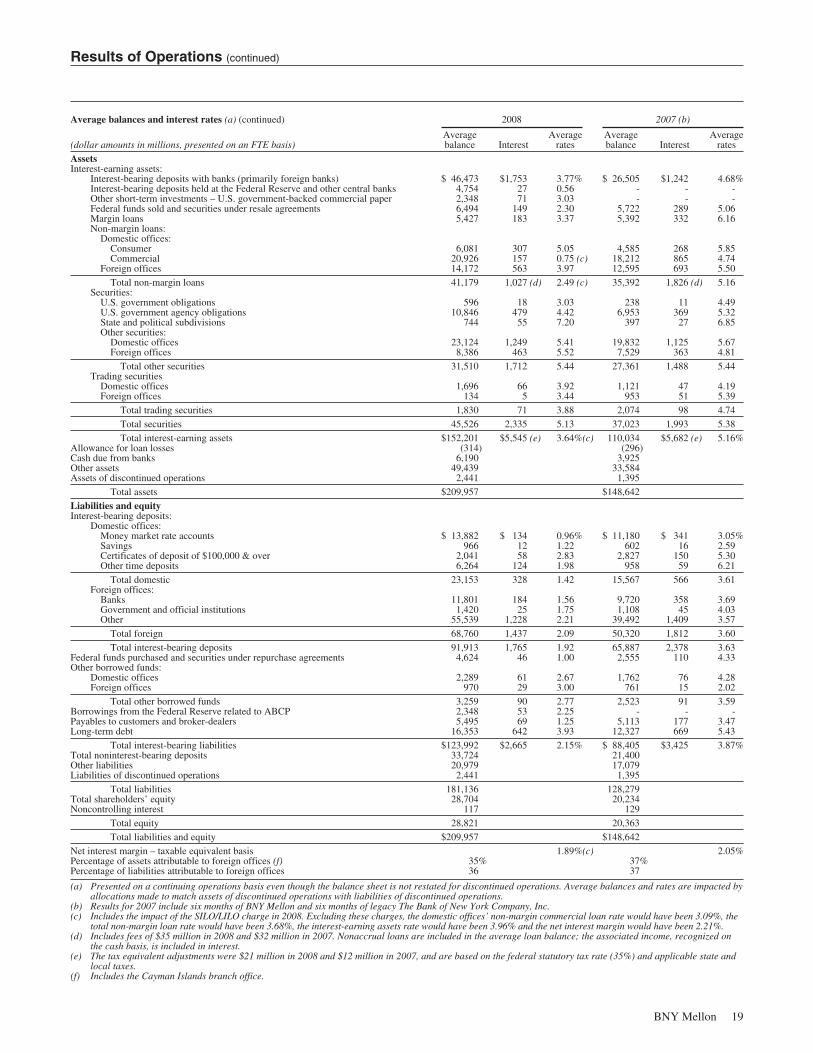
Average balances and interest rates 2009
(dollar amounts in millions, presented on an FTE basis) Average balance Interest Average rates
AssetsInterest-earning assets:
Interest-bearing deposits with banks (primarily foreign banks) $ 55,797 $ 683 1.22%Interest-bearing deposits held at the Federal Reserve and other central banks 11,938 43 0.36Other short-term investments – U.S. government-backed commercial paper 317 9 2.95Federal funds sold and securities under resale agreements 3,238 31 0.97Margin loans 4,340 69 1.59Non-margin loans:
Domestic offices:Consumer 5,417 262 4.83Commercial 15,061 362 2.41
Foreign offices 11,606 250 2.15
Total non-margin loans 32,084 874 (a) 2.72Securities:
U.S. government obligations 3,218 50 1.54U.S. government agency obligations 16,019 592 3.70State and political subdivisions 680 47 6.92Other securities:
Domestic offices 20,444 832 4.07Foreign offices 10,887 244 2.24
Total other securities 31,331 1,076 3.43Trading securities:
Domestic offices 1,934 50 2.57Foreign offices 59 1 1.40
Total trading securities 1,993 51 2.54
Total securities 53,241 1,816 3.41
Total interest-earning assets $160,955 $3,525 (b) 2.19%Allowance for loan losses (420)Cash and due from banks 3,638Other assets 45,766Assets of discontinued operations 2,188
Total assets $212,127
Liabilities and equityInterest-bearing deposits:
Domestic offices:Money market rate accounts $ 18,619 $ 18 0.09%Savings 1,136 5 0.47Certificates of deposits of $100,000 & over 961 8 0.85Other time deposits 4,922 23 0.47
Total domestic 25,638 54 0.21Foreign offices:
Banks 5,182 13 0.25Government and official institutions 866 1 0.09Other 66,520 103 0.15
Total foreign 72,568 117 0.16
Total interest-bearing deposits 98,206 171 0.17Federal funds purchased and securities sold under repurchase agreements 2,695 - -Other borrowed funds:
Domestic offices 2,263 37 1.66Foreign offices 592 5 0.85
Total other borrowed funds 2,855 42 1.49Borrowings from Federal Reserve related to asset-backed commercial paper 317 7 2.25Payables to customers and broker-dealers 5,262 6 0.12Long-term debt 16,893 366 2.17
Total interest-bearing liabilities $126,228 $ 592 0.47%Total noninterest-bearing deposits 36,446Other liabilities 18,760Liabilities of discontinued operations 2,188
Total liabilities 183,622Total shareholders’ equity 28,476Noncontrolling interest 29
Total equity 28,505
Total liabilities and equity $212,127
Net interest margin – taxable equivalent basis 1.82%Percentage of assets attributable to foreign offices (c) 37%Percentage of liabilities attributable to foreign offices 34
(a) Includes fees of $43 million in 2009. Nonaccrual loans are included in the average loan balance; the associated income, recognized on the cash basis, is includedin interest.
(b) The tax equivalent adjustment was $18 million in 2009 and is based on the federal statutory tax rate (35%) and applicable state and local taxes.(c) Includes the Cayman Islands branch office.
18 BNY Mellon
Results of Operations (continued)
Average balances and interest rates (a) (continued) 2008 2007 (b)
(dollar amounts in millions, presented on an FTE basis)Averagebalance Interest
Averagerates
Averagebalance Interest
Averagerates
AssetsInterest-earning assets:
Interest-bearing deposits with banks (primarily foreign banks) $ 46,473 $1,753 3.77% $ 26,505 $1,242 4.68%Interest-bearing deposits held at the Federal Reserve and other central banks 4,754 27 0.56 - - -Other short-term investments – U.S. government-backed commercial paper 2,348 71 3.03 - - -Federal funds sold and securities under resale agreements 6,494 149 2.30 5,722 289 5.06Margin loans 5,427 183 3.37 5,392 332 6.16Non-margin loans:
Domestic offices:Consumer 6,081 307 5.05 4,585 268 5.85Commercial 20,926 157 0.75 (c) 18,212 865 4.74
Foreign offices 14,172 563 3.97 12,595 693 5.50
Total non-margin loans 41,179 1,027 (d) 2.49 (c) 35,392 1,826 (d) 5.16Securities:
U.S. government obligations 596 18 3.03 238 11 4.49U.S. government agency obligations 10,846 479 4.42 6,953 369 5.32State and political subdivisions 744 55 7.20 397 27 6.85Other securities:
Domestic offices 23,124 1,249 5.41 19,832 1,125 5.67Foreign offices 8,386 463 5.52 7,529 363 4.81
Total other securities 31,510 1,712 5.44 27,361 1,488 5.44Trading securities
Domestic offices 1,696 66 3.92 1,121 47 4.19Foreign offices 134 5 3.44 953 51 5.39
Total trading securities 1,830 71 3.88 2,074 98 4.74
Total securities 45,526 2,335 5.13 37,023 1,993 5.38
Total interest-earning assets $152,201 $5,545 (e) 3.64%(c) 110,034 $5,682 (e) 5.16%Allowance for loan losses (314) (296)Cash due from banks 6,190 3,925Other assets 49,439 33,584Assets of discontinued operations 2,441 1,395
Total assets $209,957 $148,642
Liabilities and equityInterest-bearing deposits:
Domestic offices:Money market rate accounts $ 13,882 $ 134 0.96% $ 11,180 $ 341 3.05%Savings 966 12 1.22 602 16 2.59Certificates of deposit of $100,000 & over 2,041 58 2.83 2,827 150 5.30Other time deposits 6,264 124 1.98 958 59 6.21
Total domestic 23,153 328 1.42 15,567 566 3.61Foreign offices:
Banks 11,801 184 1.56 9,720 358 3.69Government and official institutions 1,420 25 1.75 1,108 45 4.03Other 55,539 1,228 2.21 39,492 1,409 3.57
Total foreign 68,760 1,437 2.09 50,320 1,812 3.60
Total interest-bearing deposits 91,913 1,765 1.92 65,887 2,378 3.63Federal funds purchased and securities under repurchase agreements 4,624 46 1.00 2,555 110 4.33Other borrowed funds:
Domestic offices 2,289 61 2.67 1,762 76 4.28Foreign offices 970 29 3.00 761 15 2.02
Total other borrowed funds 3,259 90 2.77 2,523 91 3.59Borrowings from the Federal Reserve related to ABCP 2,348 53 2.25 - - -Payables to customers and broker-dealers 5,495 69 1.25 5,113 177 3.47Long-term debt 16,353 642 3.93 12,327 669 5.43
Total interest-bearing liabilities $123,992 $2,665 2.15% $ 88,405 $3,425 3.87%Total noninterest-bearing deposits 33,724 21,400Other liabilities 20,979 17,079Liabilities of discontinued operations 2,441 1,395
Total liabilities 181,136 128,279Total shareholders’ equity 28,704 20,234Noncontrolling interest 117 129
Total equity 28,821 20,363
Total liabilities and equity $209,957 $148,642
Net interest margin – taxable equivalent basis 1.89%(c) 2.05%Percentage of assets attributable to foreign offices (f) 35% 37%Percentage of liabilities attributable to foreign offices 36 37
(a) Presented on a continuing operations basis even though the balance sheet is not restated for discontinued operations. Average balances and rates are impacted byallocations made to match assets of discontinued operations with liabilities of discontinued operations.
(b) Results for 2007 include six months of BNY Mellon and six months of legacy The Bank of New York Company, Inc.(c) Includes the impact of the SILO/LILO charge in 2008. Excluding these charges, the domestic offices’ non-margin commercial loan rate would have been 3.09%, the
total non-margin loan rate would have been 3.68%, the interest-earning assets rate would have been 3.96% and the net interest margin would have been 2.21%.(d) Includes fees of $35 million in 2008 and $32 million in 2007. Nonaccrual loans are included in the average loan balance; the associated income, recognized on
the cash basis, is included in interest.(e) The tax equivalent adjustments were $21 million in 2008 and $12 million in 2007, and are based on the federal statutory tax rate (35%) and applicable state and
local taxes.(f) Includes the Cayman Islands branch office.
BNY Mellon 19
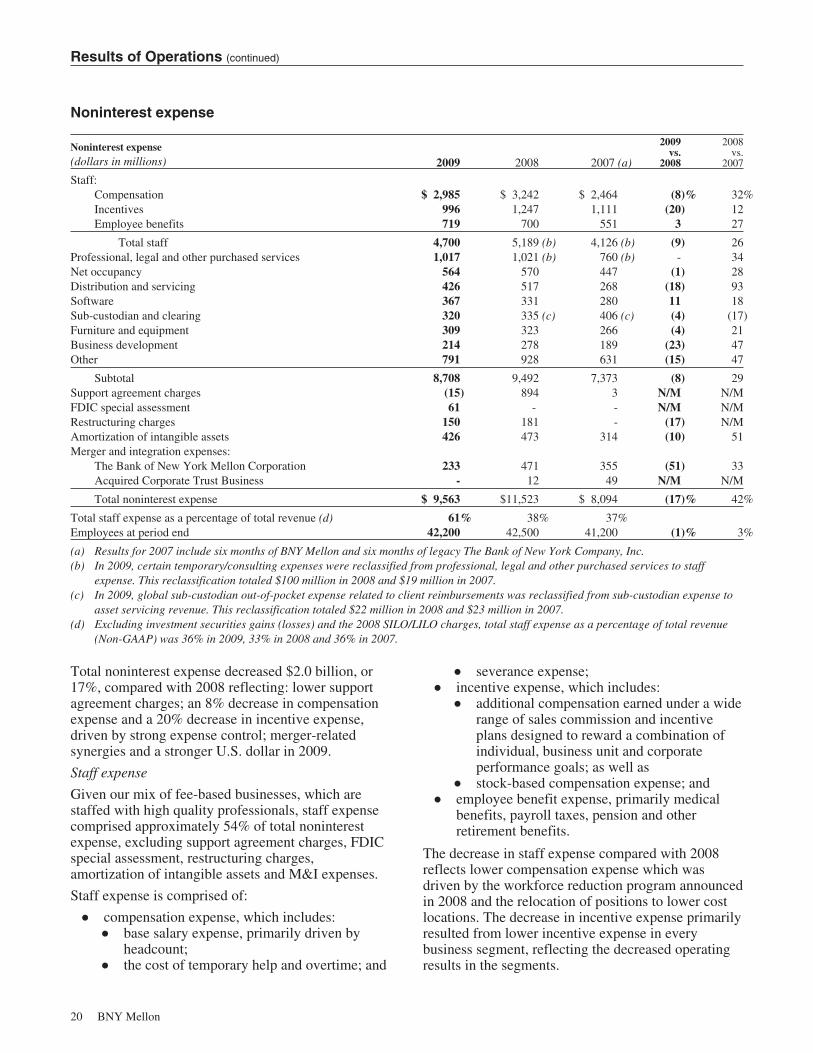
Results of Operations (continued)
Noninterest expense
Noninterest expense
2009 2008 2007 (a)
2009vs.
2008
2008vs.
2007(dollars in millions)
Staff:Compensation $ 2,985 $ 3,242 $ 2,464 (8)% 32%Incentives 996 1,247 1,111 (20) 12Employee benefits 719 700 551 3 27
Total staff 4,700 5,189 (b) 4,126 (b) (9) 26Professional, legal and other purchased services 1,017 1,021 (b) 760 (b) - 34Net occupancy 564 570 447 (1) 28Distribution and servicing 426 517 268 (18) 93Software 367 331 280 11 18Sub-custodian and clearing 320 335 (c) 406 (c) (4) (17)Furniture and equipment 309 323 266 (4) 21Business development 214 278 189 (23) 47Other 791 928 631 (15) 47
Subtotal 8,708 9,492 7,373 (8) 29Support agreement charges (15) 894 3 N/M N/MFDIC special assessment 61 - - N/M N/MRestructuring charges 150 181 - (17) N/MAmortization of intangible assets 426 473 314 (10) 51Merger and integration expenses:
The Bank of New York Mellon Corporation 233 471 355 (51) 33Acquired Corporate Trust Business - 12 49 N/M N/M
Total noninterest expense $ 9,563 $11,523 $ 8,094 (17)% 42%
Total staff expense as a percentage of total revenue (d) 61% 38% 37%Employees at period end 42,200 42,500 41,200 (1)% 3%
(a) Results for 2007 include six months of BNY Mellon and six months of legacy The Bank of New York Company, Inc.(b) In 2009, certain temporary/consulting expenses were reclassified from professional, legal and other purchased services to staff
expense. This reclassification totaled $100 million in 2008 and $19 million in 2007.(c) In 2009, global sub-custodian out-of-pocket expense related to client reimbursements was reclassified from sub-custodian expense to
asset servicing revenue. This reclassification totaled $22 million in 2008 and $23 million in 2007.(d) Excluding investment securities gains (losses) and the 2008 SILO/LILO charges, total staff expense as a percentage of total revenue
(Non-GAAP) was 36% in 2009, 33% in 2008 and 36% in 2007.
Total noninterest expense decreased $2.0 billion, or17%, compared with 2008 reflecting: lower supportagreement charges; an 8% decrease in compensationexpense and a 20% decrease in incentive expense,driven by strong expense control; merger-relatedsynergies and a stronger U.S. dollar in 2009.
Staff expense
Given our mix of fee-based businesses, which arestaffed with high quality professionals, staff expensecomprised approximately 54% of total noninterestexpense, excluding support agreement charges, FDICspecial assessment, restructuring charges,amortization of intangible assets and M&I expenses.
Staff expense is comprised of:
Š compensation expense, which includes:Š base salary expense, primarily driven by
headcount;Š the cost of temporary help and overtime; and
Š severance expense;Š incentive expense, which includes:
Š additional compensation earned under a widerange of sales commission and incentiveplans designed to reward a combination ofindividual, business unit and corporateperformance goals; as well as
Š stock-based compensation expense; andŠ employee benefit expense, primarily medical
benefits, payroll taxes, pension and otherretirement benefits.
The decrease in staff expense compared with 2008reflects lower compensation expense which wasdriven by the workforce reduction program announcedin 2008 and the relocation of positions to lower costlocations. The decrease in incentive expense primarilyresulted from lower incentive expense in everybusiness segment, reflecting the decreased operatingresults in the segments.
20 BNY Mellon
Results of Operations (continued)
Non-staff expense
Non-staff expense includes certain expenses that varywith the levels of business activity and levels ofexpensed business investments, fixed infrastructurecosts and expenses associated with corporate activitiesrelated to technology, compliance, productivityinitiatives and corporate development.
Non-staff expense, excluding support agreementcharges, FDIC special assessment, restructuringcharges, amortization of intangible assets and M&Iexpense totaled $4.0 billion in 2009 compared with$4.3 billion in 2008. The decrease primarily reflectsdeclines in nearly every expense category. Thedecreases in non-staff expense reflect overall expensecontrol. The decrease in other expense also reflectscharges recorded in 2008 related to credit monitoringcharges for lost tapes and the write-down of seedcapital investments related to a formerly affiliatedhedge fund manager.
For additional information on support agreements, seethe Support agreements section.
For additional information on the FDIC specialassessment, see the Impact of the current marketenvironment on our business and regulatory eventssection.
As part of an ongoing effort to improve efficiency anddevelop a global operating model that provides thehighest quality of service to our clients, BNY Melloncontinues to execute on its global location strategy.This strategy includes migrating positions to ourglobal growth centers and the elimination of certainpositions.
In 2009, we recorded a pre-tax restructuring charge of$139 million related to our global location strategy.This charge was comprised of $102 million forseverance costs and $37 million for asset write-offsand other costs. We also recorded additional pre-taxrestructuring charges of $11 million associated withour workforce reduction program announced in 2008.See Note 13 of the Notes to Consolidated FinancialStatements for additional information regardingrestructuring charges.
In 2009, we incurred $233 million of M&I expensesrelated to the merger with Mellon Financial,comprised of the following:
Š Integration/conversion costs – includingconsulting, system conversions and staff ($160million);
Š Personnel related costs – including severance,retention, relocation expenses, acceleratedvesting of stock options and restricted stockexpense ($57 million); and
Š One-time costs – including facilities relatedcosts, asset write-offs, vendor contractmodifications, rebranding and net gains andlosses on disposals ($16 million).
2008 compared with 2007
Total noninterest expense was $11.5 billion in 2008,an increase of $3.4 billion or 42% compared with2007. The increase primarily reflects the merger withMellon Financial partially offset by the sale of theexecution businesses and also included the followingactivity:
Š an $894 million charge related to supportagreements related to BNY Mellon’s voluntarysupport of clients invested in money marketmutual funds, cash sweep funds and similarcollective funds, managed by our affiliates,impacted by the bankruptcy of Lehman BrothersHoldings, Inc. (“Lehman”);
Š the acquisition of the remaining 50% interest inBNY Mellon Asset Servicing B.V. in the fourthquarter of 2007;
Š a $181 million restructuring charge related toour global workforce reduction program;
Š a $50 million charge related to credit monitoringfor lost tapes; and
Š M&I expenses of $471 million related to themerger with Mellon Financial, comprised of thefollowing: integration/conversion costs ($302million); personnel related costs ($151 million);and one-time costs ($18 million).
Income taxes
BNY Mellon recorded an income tax benefit, on acontinuing operations basis, of $1.4 billion (63.2%effective tax rate) in 2009 compared to tax provisionsof $491 million (25.2% effective tax rate) in 2008 and$987 million (30.7% effective tax rate) in 2007. The2009 effective tax rate on our loss from continuingoperations is higher than the 35% federal statutoryrate because of additional tax benefits from a tax losson mortgages, the final SILO/LILO tax settlement,investment securities losses and a higher proportion oflower taxed foreign earnings. The lower effective taxrate in 2008 compared with 2007 primarily resultedfrom lower domestic earnings and a higher proportionof income earned in lower taxed foreign jurisdictions.
BNY Mellon 21
Results of Operations (continued)
Excluding the impact of investment securities losses,M&I expenses, FDIC special assessment,restructuring charges and benefits from discrete taxitems primarily related to a tax loss on mortgages andtax settlements, the effective tax rate for 2009 was29.8%. Excluding the impact of investment securitieslosses, M&I expenses, restructuring charges, supportagreement charges and the SILO/LILO/tax settlement,the effective tax rate for 2008 was 32.8%. Excludingthe impact of the investment securities losses andM&I expenses, the effective tax rate for 2007 was32.3%.
Income of certain foreign subsidiaries is not currentlysubject to U.S. income tax as a result of the activefinancing deferral provision. This provision expiredfor tax years beginning on Jan. 1, 2010. Absent anextension, income that qualifies for the activefinancing provision may require U.S. tax to berecorded. BNY Mellon is in the process of evaluatingthe impact if the law is not extended.
Extraordinary loss - consolidation ofcommercial paper conduits
At the end of 2008 and 2007, we called the first lossnotes of Old Slip and TRFC, respectively, making usthe primary beneficiary and triggering theconsolidation of these commercial paper conduits.The consolidation of these conduits resulted in therecognition of extraordinary losses (non-cashaccounting charges) of $26 million after-tax, or $0.02per common share in 2008, associated with Old Slip,and $180 million after-tax, or $0.19 per commonshare in 2007, associated with TRFC.
Business segments review
The results of our business segments are presentedand analyzed along the following business lines:
Š Asset ManagementŠ Wealth ManagementŠ Asset ServicingŠ Issuer ServicesŠ Clearing ServicesŠ Treasury ServicesŠ Other
We have an internal information system that producesperformance data for our seven business segmentsalong product and service lines.
For information on the accounting principles of ourbusiness segments, the primary types of revenuegenerated by each segment and the basis on which our
segments are reported and analyzed, see Note 28 ofthe Notes to Consolidated Financial Statements.
Our business segments continued to face a difficultoperating environment in 2009. Lower equity marketsand decreases in corporate actions and fixed incomeissuances in 2009 significantly and adverselyimpacted revenues in our asset and wealthmanagement and securities servicing businesses. Newbusiness across these segments partially offset theadverse impact of the markets. Fee waivers and lowermoney market related distribution fees in 2009decreased revenue in the Asset Management, IssuerServices and Clearing Services segments. The lowinterest rate environment in 2009, compared with2008, as well as a decline in the value of interest-freebalances and narrowing spreads resulted in lower netinterest revenue in the Asset Servicing and TreasuryServices segments. Net interest revenue in 2008included SILO/LILO charges of $489 million whichwere recorded in the Other segment.
Investment securities losses in 2009, 2008 and 2007were primarily recorded in the Other segment. Strongexpense control and the impact of merger-relatedsynergies resulted in lower noninterest expense inevery segment compared with 2008. Also in 2008, weelected to support clients impacted by the Lehmanbankruptcy, as well as clients impacted by thedeclining value of certain structured investmentvehicle (“SIV”) securities. These support agreementshad a significant impact on the 2008 results of theAsset Management and Asset Servicing segments.Restructuring charges recorded in 2009 and 2008were recorded in the Other segment. In addition, M&Iexpenses are a corporate level item and are thereforerecorded in the Other segment.
The merger with Mellon Financial had a considerableimpact on the comparison of business segment resultsfrom 2008 to 2007. The merger significantly impactedthe Asset Management, Wealth Management andAsset Servicing segments and, to a lesser extent, theIssuer Services, Treasury Services and the Othersegments.
The following table presents the value of certainmarket indices at period end and on an average basis.
22 BNY Mellon
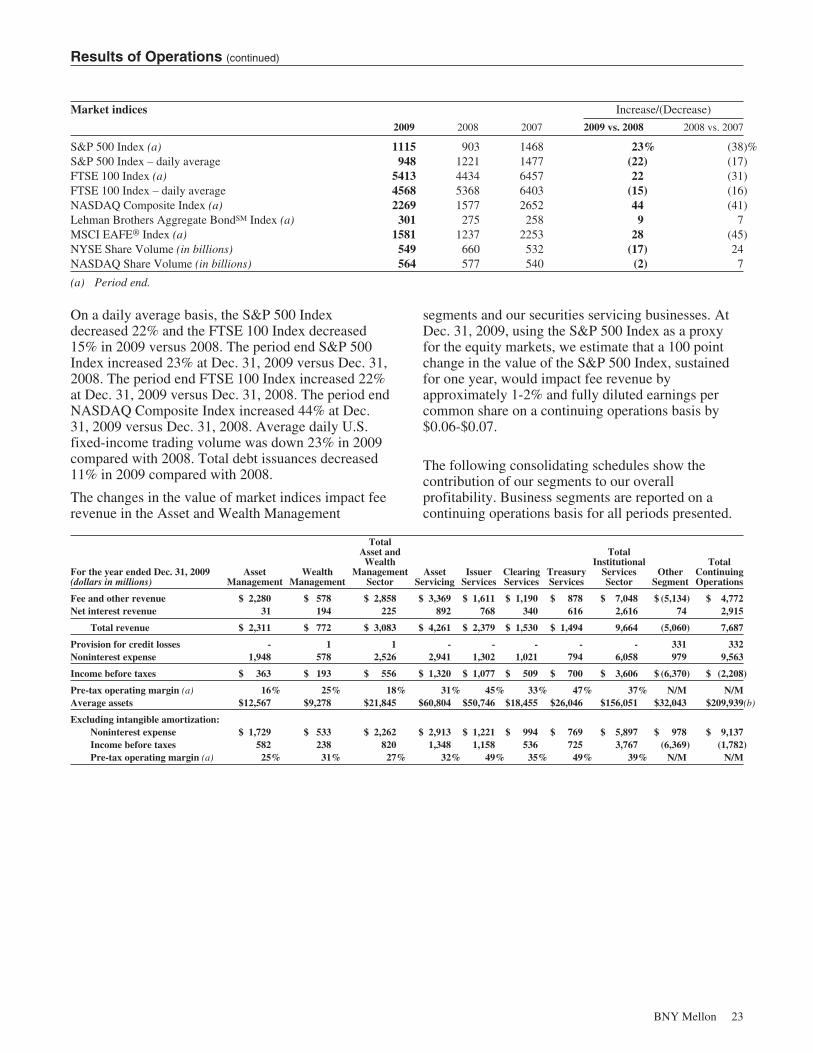
Results of Operations (continued)
Market indices Increase/(Decrease)
2009 2008 2007 2009 vs. 2008 2008 vs. 2007
S&P 500 Index (a) 1115 903 1468 23% (38)%S&P 500 Index – daily average 948 1221 1477 (22) (17)FTSE 100 Index (a) 5413 4434 6457 22 (31)FTSE 100 Index – daily average 4568 5368 6403 (15) (16)NASDAQ Composite Index (a) 2269 1577 2652 44 (41)Lehman Brothers Aggregate BondSM Index (a) 301 275 258 9 7MSCI EAFE® Index (a) 1581 1237 2253 28 (45)NYSE Share Volume (in billions) 549 660 532 (17) 24NASDAQ Share Volume (in billions) 564 577 540 (2) 7
(a) Period end.
On a daily average basis, the S&P 500 Indexdecreased 22% and the FTSE 100 Index decreased15% in 2009 versus 2008. The period end S&P 500Index increased 23% at Dec. 31, 2009 versus Dec. 31,2008. The period end FTSE 100 Index increased 22%at Dec. 31, 2009 versus Dec. 31, 2008. The period endNASDAQ Composite Index increased 44% at Dec.31, 2009 versus Dec. 31, 2008. Average daily U.S.fixed-income trading volume was down 23% in 2009compared with 2008. Total debt issuances decreased11% in 2009 compared with 2008.
The changes in the value of market indices impact feerevenue in the Asset and Wealth Management
segments and our securities servicing businesses. AtDec. 31, 2009, using the S&P 500 Index as a proxyfor the equity markets, we estimate that a 100 pointchange in the value of the S&P 500 Index, sustainedfor one year, would impact fee revenue byapproximately 1-2% and fully diluted earnings percommon share on a continuing operations basis by$0.06-$0.07.
The following consolidating schedules show thecontribution of our segments to our overallprofitability. Business segments are reported on acontinuing operations basis for all periods presented.
For the year ended Dec. 31, 2009(dollars in millions)
AssetManagement
WealthManagement
TotalAsset and
WealthManagement
SectorAsset
ServicingIssuer
ServicesClearingServices
TreasuryServices
TotalInstitutional
ServicesSector
OtherSegment
TotalContinuingOperations
Fee and other revenue $ 2,280 $ 578 $ 2,858 $ 3,369 $ 1,611 $ 1,190 $ 878 $ 7,048 $ (5,134) $ 4,772Net interest revenue 31 194 225 892 768 340 616 2,616 74 2,915
Total revenue $ 2,311 $ 772 $ 3,083 $ 4,261 $ 2,379 $ 1,530 $ 1,494 9,664 (5,060) 7,687
Provision for credit losses - 1 1 - - - - - 331 332Noninterest expense 1,948 578 2,526 2,941 1,302 1,021 794 6,058 979 9,563
Income before taxes $ 363 $ 193 $ 556 $ 1,320 $ 1,077 $ 509 $ 700 $ 3,606 $ (6,370) $ (2,208)
Pre-tax operating margin (a) 16% 25% 18% 31% 45% 33% 47% 37% N/M N/MAverage assets $12,567 $9,278 $21,845 $60,804 $50,746 $18,455 $26,046 $156,051 $32,043 $209,939(b)
Excluding intangible amortization:Noninterest expense $ 1,729 $ 533 $ 2,262 $ 2,913 $ 1,221 $ 994 $ 769 $ 5,897 $ 978 $ 9,137Income before taxes 582 238 820 1,348 1,158 536 725 3,767 (6,369) (1,782)Pre-tax operating margin (a) 25% 31% 27% 32% 49% 35% 49% 39% N/M N/M
BNY Mellon 23
Results of Operations (continued)
For the year ended Dec. 31, 2008
(dollars in millions)Asset
ManagementWealth
Management
Total Assetand Wealth
ManagementSector
AssetServicing
IssuerServices
ClearingServices
TreasuryServices
TotalInstitutional
ServicesSector
OtherSegment
TotalContinuingOperations
Fee and other revenue $ 2,794 $ 624 $ 3,418 $ 4,416 $ 1,851 $ 1,292 $ 977 $ 8,536 $ (1,240) $ 10,714Net interest revenue 75 200 275 1,086 710 321 730 2,847 (263) 2,859
Total revenue 2,869 824 3,693 5,502 2,561 1,613 1,707 11,383 (1,503) 13,573
Provision for credit losses - - - - - - - - 104 104Noninterest expense 2,641 634 3,275 3,783 1,413 1,130 840 7,166 1,082 11,523
Income before taxes $ 228 $ 190 $ 418 $ 1,719 $ 1,148 $ 483 $ 867 $ 4,217 $ (2,689) $ 1,946
Pre-tax operating margin (a) 8% 23% 11% 31% 45% 30% 51% 37% N/M 14%Average assets $13,267 $10,044 $23,311 $59,150 $35,169 $18,358 $25,603 $138,280 $45,925 $207,516 (b)
Excluding intangible amortization:Noninterest expense $ 2,386 $ 580 $ 2,966 $ 3,759 $ 1,332 $ 1,104 $ 813 $ 7,008 $ 1,076 $ 11,050Income before taxes 483 244 727 1,743 1,229 509 894 4,375 (2,683) 2,419Pre-tax operating margin (a) 17% 30% 20% 32% 48% 32% 52% 38% N/M 18%
For the year ended Dec. 31, 2007 (c)
(dollars in millions)Asset
ManagementWealth
Management
Total Assetand Wealth
ManagementSector
AssetServicing
IssuerServices
ClearingServices
TreasuryServices
TotalInstitutional
ServicesSector
OtherSegment
TotalContinuingOperations
Fee and other revenue $ 1,872 $ 423 $ 2,295 $ 2,957 $ 1,660 $ 1,130 $ 741 $ 6,488 $ 270 $ 9,053Net interest revenue 10 111 121 693 567 303 521 2,084 40 2,245
Total revenue 1,882 534 2,416 3,650 2,227 1,433 1,262 8,572 310 11,298
Provision for credit losses - - - - - - - - (11) (11)Noninterest expense 1,372 413 1,785 2,497 1,159 1,047 663 5,366 943 8,094
Income before taxes $ 510 $ 121 $ 631 $ 1,153 $ 1,068 $ 386 $ 599 $ 3,206 $ (622) $ 3,215
Pre-tax operating margin (a) 27% 23% 26% 32% 48% 27% 47% 37% N/M 28%Average assets $ 7,636 $ 5,702 $13,338 $38,016 $25,658 $14,967 $18,497 $ 97,138 $36,771 $147,247 (b)
Excluding intangible amortization:Noninterest expense $ 1,226 $ 385 $ 1,611 $ 2,482 $ 1,084 $ 1,023 $ 649 $ 5,238 $ 931 $ 7,780Income before taxes 656 149 805 1,168 1,143 410 613 3,334 (610) 3,529Pre-tax operating margin (a) 35% 28% 33% 32% 51% 29% 49% 39% N/M 31%
(a) Income before taxes divided by total revenue.(b) Including average assets of discontinued operations of $2,188 million in 2009, $2,441 million in 2008 and $1,395 million in 2007, consolidated average assets were $212,127
million in 2009, $209,957 million in 2008 and $148,642 million in 2007.(c) Results for 2007 include six months of BNY Mellon and six months of legacy The Bank of New York Company, Inc.
Asset and Wealth Management Sector
Asset and Wealth Management fee revenue isdependent on the overall level and mix of AUM andthe management fees expressed in basis points (one-hundredth of one percent) charged for managing thoseassets. Assets under management were $1.1 trillion atDec. 31, 2009, an increase of 20% compared with$928 billion at Dec. 31, 2008. The increase primarilyreflects the Insight acquisition and marketappreciation, offset in part by money market outflows.
The overall level of AUM for a given period isdetermined by:
Š the beginning level of AUM;Š the net flows of new assets during the period
resulting from new business wins and existingclient enrichments reduced by the loss of clientsand withdrawals; and
Š the impact of market price appreciation ordepreciation, the impact of any acquisitions ordivestitures and foreign exchange rates.
These components are shown in the changes in marketvalue of AUM table below. The mix of AUM isdetermined principally by client asset allocationdecisions among equities, fixed income, alternativeinvestments and overlay, and money market products.The trend of this mix is shown in the AUM at periodend, by product type, table below.
Managed equity assets typically generate higherpercentage fees than money market and fixed-incomeassets. Also, actively managed assets typicallygenerate higher management fees than indexed orpassively managed assets of the same type.
Management fees are typically subject to feeschedules based on the overall level of assets managedfor a single client or by individual asset class andstyle. This is most prevalent for institutional assetswhere amounts we manage for individual clients aretypically large.
24 BNY Mellon
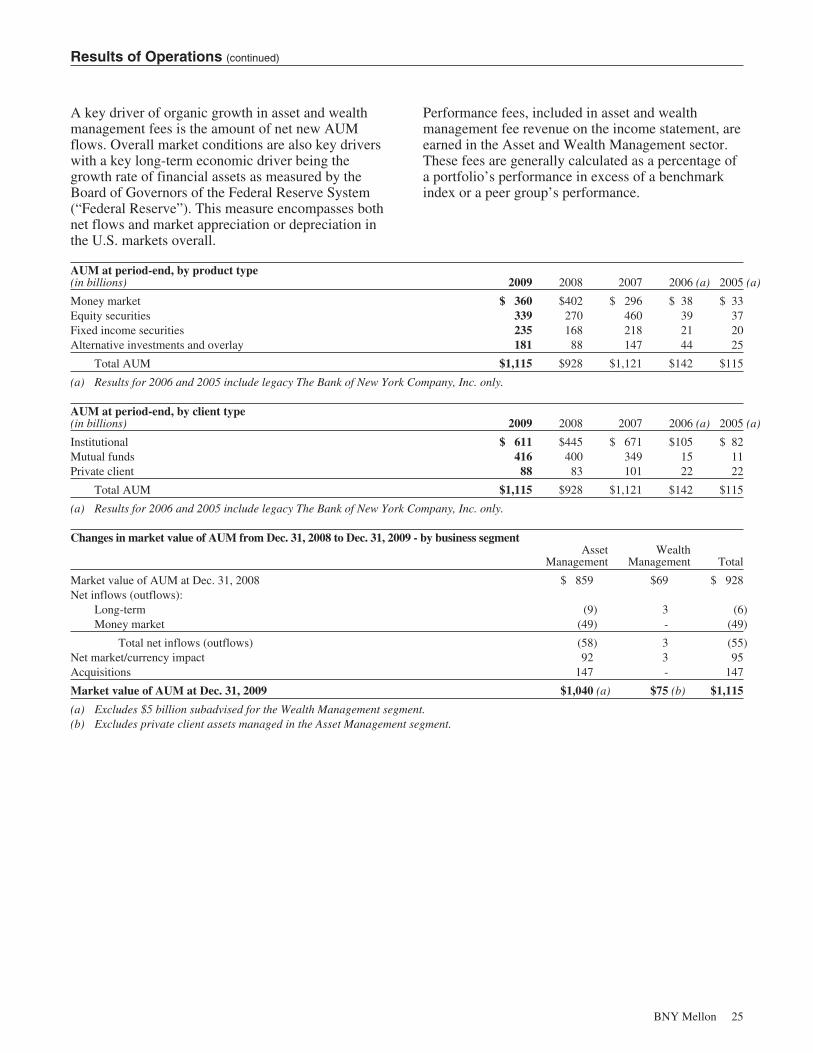
Results of Operations (continued)
A key driver of organic growth in asset and wealthmanagement fees is the amount of net new AUMflows. Overall market conditions are also key driverswith a key long-term economic driver being thegrowth rate of financial assets as measured by theBoard of Governors of the Federal Reserve System(“Federal Reserve”). This measure encompasses bothnet flows and market appreciation or depreciation inthe U.S. markets overall.
Performance fees, included in asset and wealthmanagement fee revenue on the income statement, areearned in the Asset and Wealth Management sector.These fees are generally calculated as a percentage ofa portfolio’s performance in excess of a benchmarkindex or a peer group’s performance.
AUM at period-end, by product type(in billions) 2009 2008 2007 2006 (a) 2005 (a)
Money market $ 360 $402 $ 296 $ 38 $ 33Equity securities 339 270 460 39 37Fixed income securities 235 168 218 21 20Alternative investments and overlay 181 88 147 44 25
Total AUM $1,115 $928 $1,121 $142 $115
(a) Results for 2006 and 2005 include legacy The Bank of New York Company, Inc. only.
AUM at period-end, by client type(in billions) 2009 2008 2007 2006 (a) 2005 (a)
Institutional $ 611 $445 $ 671 $105 $ 82Mutual funds 416 400 349 15 11Private client 88 83 101 22 22
Total AUM $1,115 $928 $1,121 $142 $115
(a) Results for 2006 and 2005 include legacy The Bank of New York Company, Inc. only.
Changes in market value of AUM from Dec. 31, 2008 to Dec. 31, 2009 - by business segmentAsset
ManagementWealth
Management Total
Market value of AUM at Dec. 31, 2008 $ 859 $69 $ 928Net inflows (outflows):
Long-term (9) 3 (6)Money market (49) - (49)
Total net inflows (outflows) (58) 3 (55)Net market/currency impact 92 3 95Acquisitions 147 - 147
Market value of AUM at Dec. 31, 2009 $1,040 (a) $75 (b) $1,115
(a) Excludes $5 billion subadvised for the Wealth Management segment.(b) Excludes private client assets managed in the Asset Management segment.
BNY Mellon 25
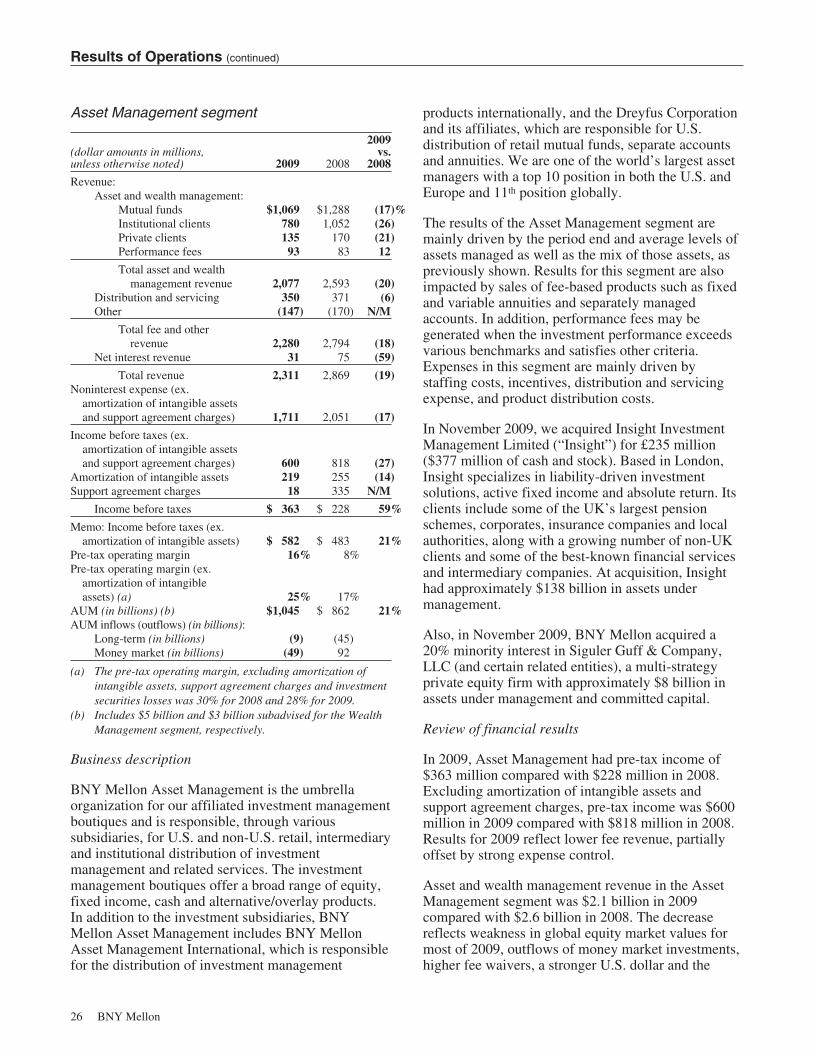
Results of Operations (continued)
Asset Management segment
(dollar amounts in millions,unless otherwise noted) 2009 2008
2009vs.
2008
Revenue:Asset and wealth management:
Mutual funds $1,069 $1,288 (17)%Institutional clients 780 1,052 (26)Private clients 135 170 (21)Performance fees 93 83 12
Total asset and wealthmanagement revenue 2,077 2,593 (20)
Distribution and servicing 350 371 (6)Other (147) (170) N/M
Total fee and otherrevenue 2,280 2,794 (18)
Net interest revenue 31 75 (59)
Total revenue 2,311 2,869 (19)Noninterest expense (ex.
amortization of intangible assetsand support agreement charges) 1,711 2,051 (17)
Income before taxes (ex.amortization of intangible assetsand support agreement charges) 600 818 (27)
Amortization of intangible assets 219 255 (14)Support agreement charges 18 335 N/M
Income before taxes $ 363 $ 228 59%
Memo: Income before taxes (ex.amortization of intangible assets) $ 582 $ 483 21%
Pre-tax operating margin 16% 8%Pre-tax operating margin (ex.
amortization of intangibleassets) (a) 25% 17%
AUM (in billions) (b) $1,045 $ 862 21%AUM inflows (outflows) (in billions):
Long-term (in billions) (9) (45)Money market (in billions) (49) 92
(a) The pre-tax operating margin, excluding amortization ofintangible assets, support agreement charges and investmentsecurities losses was 30% for 2008 and 28% for 2009.
(b) Includes $5 billion and $3 billion subadvised for the WealthManagement segment, respectively.
Business description
BNY Mellon Asset Management is the umbrellaorganization for our affiliated investment managementboutiques and is responsible, through varioussubsidiaries, for U.S. and non-U.S. retail, intermediaryand institutional distribution of investmentmanagement and related services. The investmentmanagement boutiques offer a broad range of equity,fixed income, cash and alternative/overlay products.In addition to the investment subsidiaries, BNYMellon Asset Management includes BNY MellonAsset Management International, which is responsiblefor the distribution of investment management
products internationally, and the Dreyfus Corporationand its affiliates, which are responsible for U.S.distribution of retail mutual funds, separate accountsand annuities. We are one of the world’s largest assetmanagers with a top 10 position in both the U.S. andEurope and 11th position globally.
The results of the Asset Management segment aremainly driven by the period end and average levels ofassets managed as well as the mix of those assets, aspreviously shown. Results for this segment are alsoimpacted by sales of fee-based products such as fixedand variable annuities and separately managedaccounts. In addition, performance fees may begenerated when the investment performance exceedsvarious benchmarks and satisfies other criteria.Expenses in this segment are mainly driven bystaffing costs, incentives, distribution and servicingexpense, and product distribution costs.
In November 2009, we acquired Insight InvestmentManagement Limited (“Insight”) for £235 million($377 million of cash and stock). Based in London,Insight specializes in liability-driven investmentsolutions, active fixed income and absolute return. Itsclients include some of the UK’s largest pensionschemes, corporates, insurance companies and localauthorities, along with a growing number of non-UKclients and some of the best-known financial servicesand intermediary companies. At acquisition, Insighthad approximately $138 billion in assets undermanagement.
Also, in November 2009, BNY Mellon acquired a20% minority interest in Siguler Guff & Company,LLC (and certain related entities), a multi-strategyprivate equity firm with approximately $8 billion inassets under management and committed capital.
Review of financial results
In 2009, Asset Management had pre-tax income of$363 million compared with $228 million in 2008.Excluding amortization of intangible assets andsupport agreement charges, pre-tax income was $600million in 2009 compared with $818 million in 2008.Results for 2009 reflect lower fee revenue, partiallyoffset by strong expense control.
Asset and wealth management revenue in the AssetManagement segment was $2.1 billion in 2009compared with $2.6 billion in 2008. The decreasereflects weakness in global equity market values formost of 2009, outflows of money market investments,higher fee waivers, a stronger U.S. dollar and the
26 BNY Mellon
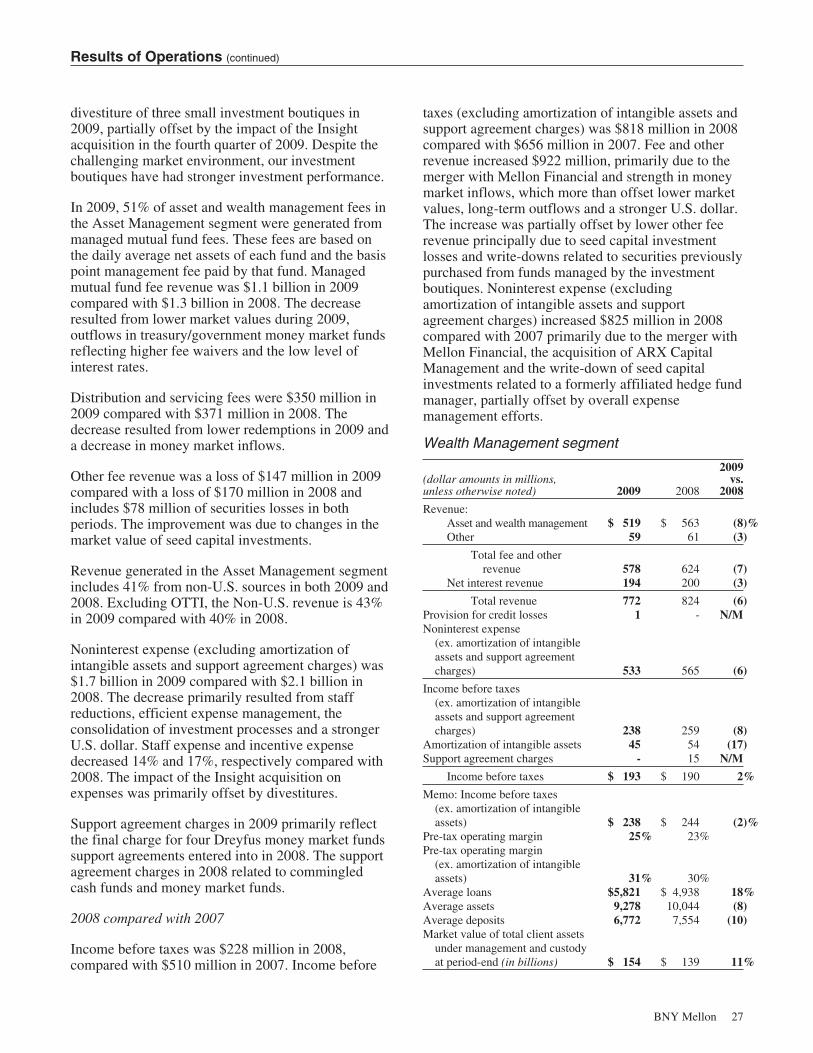
Results of Operations (continued)
divestiture of three small investment boutiques in2009, partially offset by the impact of the Insightacquisition in the fourth quarter of 2009. Despite thechallenging market environment, our investmentboutiques have had stronger investment performance.
In 2009, 51% of asset and wealth management fees inthe Asset Management segment were generated frommanaged mutual fund fees. These fees are based onthe daily average net assets of each fund and the basispoint management fee paid by that fund. Managedmutual fund fee revenue was $1.1 billion in 2009compared with $1.3 billion in 2008. The decreaseresulted from lower market values during 2009,outflows in treasury/government money market fundsreflecting higher fee waivers and the low level ofinterest rates.
Distribution and servicing fees were $350 million in2009 compared with $371 million in 2008. Thedecrease resulted from lower redemptions in 2009 anda decrease in money market inflows.
Other fee revenue was a loss of $147 million in 2009compared with a loss of $170 million in 2008 andincludes $78 million of securities losses in bothperiods. The improvement was due to changes in themarket value of seed capital investments.
Revenue generated in the Asset Management segmentincludes 41% from non-U.S. sources in both 2009 and2008. Excluding OTTI, the Non-U.S. revenue is 43%in 2009 compared with 40% in 2008.
Noninterest expense (excluding amortization ofintangible assets and support agreement charges) was$1.7 billion in 2009 compared with $2.1 billion in2008. The decrease primarily resulted from staffreductions, efficient expense management, theconsolidation of investment processes and a strongerU.S. dollar. Staff expense and incentive expensedecreased 14% and 17%, respectively compared with2008. The impact of the Insight acquisition onexpenses was primarily offset by divestitures.
Support agreement charges in 2009 primarily reflectthe final charge for four Dreyfus money market fundssupport agreements entered into in 2008. The supportagreement charges in 2008 related to commingledcash funds and money market funds.
2008 compared with 2007
Income before taxes was $228 million in 2008,compared with $510 million in 2007. Income before
taxes (excluding amortization of intangible assets andsupport agreement charges) was $818 million in 2008compared with $656 million in 2007. Fee and otherrevenue increased $922 million, primarily due to themerger with Mellon Financial and strength in moneymarket inflows, which more than offset lower marketvalues, long-term outflows and a stronger U.S. dollar.The increase was partially offset by lower other feerevenue principally due to seed capital investmentlosses and write-downs related to securities previouslypurchased from funds managed by the investmentboutiques. Noninterest expense (excludingamortization of intangible assets and supportagreement charges) increased $825 million in 2008compared with 2007 primarily due to the merger withMellon Financial, the acquisition of ARX CapitalManagement and the write-down of seed capitalinvestments related to a formerly affiliated hedge fundmanager, partially offset by overall expensemanagement efforts.
Wealth Management segment
(dollar amounts in millions,unless otherwise noted) 2009 2008
2009vs.
2008
Revenue:Asset and wealth management $ 519 $ 563 (8)%Other 59 61 (3)
Total fee and otherrevenue 578 624 (7)
Net interest revenue 194 200 (3)
Total revenue 772 824 (6)Provision for credit losses 1 - N/MNoninterest expense
(ex. amortization of intangibleassets and support agreementcharges) 533 565 (6)
Income before taxes(ex. amortization of intangibleassets and support agreementcharges) 238 259 (8)
Amortization of intangible assets 45 54 (17)Support agreement charges - 15 N/M
Income before taxes $ 193 $ 190 2%
Memo: Income before taxes(ex. amortization of intangibleassets) $ 238 $ 244 (2)%
Pre-tax operating margin 25% 23%Pre-tax operating margin
(ex. amortization of intangibleassets) 31% 30%
Average loans $5,821 $ 4,938 18%Average assets 9,278 10,044 (8)Average deposits 6,772 7,554 (10)Market value of total client assets
under management and custodyat period-end (in billions) $ 154 $ 139 11%
BNY Mellon 27

Results of Operations (continued)
Business description
In the Wealth Management segment, we offer a fullarray of investment management, wealth and estateplanning and private banking solutions to help clientsprotect, grow and transfer their wealth. Clients includehigh net worth individuals, families, endowments andfoundations and related entities. BNY Mellon WealthManagement is a top ten U.S. wealth manager with$154 billion in client assets. We serve our clientsthrough an expansive network of office sites in 17states and 3 countries, including 16 of the top 25domestic wealth markets.
The results of the Wealth Management segment aredriven by the level and mix of assets managed andunder custody, and the level of activity in clientaccounts. Net interest revenue is determined by thelevel of interest rate spread between loans anddeposits. Expenses of this segment are driven mainlyby staff expense in the investment management, sales,service and support groups.
Review of financial results
Income before taxes was $193 million in 2009compared with $190 million in 2008. Income beforetaxes (excluding amortization of intangible assets andsupport agreement charges) was $238 million in 2009compared with $259 million in 2008. Resultscompared with 2008 reflect new business and strongexpense control, which was offset by unfavorablemarket conditions during most of 2009.
Total fee and other revenue was $578 million in 2009compared with $624 million in 2008. Organic growthwas more than offset by lower average equity marketlevels and lower capital market fees.
Client assets under management and custody were$154 billion at Dec. 31, 2009, an increase of $15billion, or 11%, compared with $139 billion at Dec.31, 2008. The increase was due to higher period endmarket levels and positive asset flows. Wealthmanagement has generated 16 consecutive quarters ofpositive long-term asset flows.
Net interest revenue decreased $6 million in 2009compared with 2008. The impact of high quality loangrowth was more than offset by deposit spreadtightening due to the low interest rate environment.Average loan levels were up $883 million, or 18%,due to net new business and growth in the mortgageportfolio.
Noninterest expense (excluding amortization ofintangible assets and support agreement charges)decreased $32 million, or 6%, compared with 2008,primarily reflecting savings due to workforcereductions, strong expense control and the impact ofmerger-related synergies.
2008 compared with 2007
Income before taxes was $190 million in 2008compared with $121 million in 2007. Income beforetaxes (excluding amortization of intangible assets andsupport agreement charges), increased $110 million.Fee and other revenue increased $201 million due tothe merger with Mellon Financial, record newbusiness, organic growth and higher capital marketsrelated fees, partially offset by sharp declines in theequity markets in 2008. Net interest revenue increased$89 million as a result of the merger with MellonFinancial, higher deposit levels, improved depositspreads and higher loan levels due to growth in themortgage portfolio. Noninterest expense (excludingamortization of intangible assets and supportagreement charges) increased $180 million due to themerger with Mellon Financial and the annual meritsalary increase, partially offset by merger-relatedsynergies and strong expense control.
Institutional Services Sector
As of Dec. 31, 2009, our assets under custody andadministration totaled $22.3 trillion, a 10% increasefrom $20.2 trillion at Dec. 31, 2008. The increase inassets under custody and administration primarilyreflects higher market values and new business wins.Equity securities were 32% and fixed-incomesecurities were 68% of the market value of assetsunder custody and administration at Dec. 31, 2009,compared with 25% equity securities and 75% fixed-income securities at Dec. 31, 2008. The shift incomposition of assets under custody from Dec. 31,2008 to Dec. 31, 2009 was primarily due to anincrease in equity valuations. Assets under custodyand administration at Dec. 31, 2009 consisted ofassets related to the custody, mutual funds, andcorporate trust businesses of $18.2 trillion, broker-dealer services assets of $2.6 trillion, and all otherassets of $1.5 trillion.
Market value of securities on loan at Dec. 31, 2009decreased to $247 billion from $326 billion at Dec.31, 2008. The decrease reflects de-leveraging in thefinancial markets.
28 BNY Mellon

Results of Operations (continued)
In February 2010, we announced a definitive agreement to acquire Global Investment Servicing, Inc. from PNC.See the 2009 and subsequent events section for additional information.
Assets under custody and administration trend2009 2008 2007 2006 (a) 2005 (a)
Market value of assets under custody and administration at period-end(in trillions) (b) $22.3 $20.2 $23.1 $15.5 $11.4
Market value of securities on loan at period-end (in billions) (c) $ 247 $ 326 $ 633 $ 399 $ 311
(a) Results for 2006 and 2005 include legacy The Bank of New York Company, Inc. only.(b) Includes the assets under custody or administration of CIBC Mellon Global Securities Services Company, a joint venture with the
Canadian Imperial Bank of Commerce, of $905 billion at Dec. 31, 2009, $697 billion at Dec. 31, 2008 and $989 billion at Dec. 31,2007.
(c) Represents the total amount of securities on loan, both cash and non-cash, managed by the Asset Servicing segment.
Asset Servicing segment
(dollar amounts in millions,unless otherwise noted) 2009 2008
2009vs.
2008
Revenue:Securities servicing fees-
asset servicing $ 2,215 $ 2,496 (11)%Securities lending revenue 221 717 (69)Foreign exchange and other
trading activities 757 1,051 (28)Other 176 152 16
Total fee and otherrevenue 3,369 4,416 (24)
Net interest revenue 892 1,086 (18)
Total revenue 4,261 5,502 (23)Noninterest expense (ex.
amortization of intangibleassets and support agreementcharges) 2,946 3,218 (8)
Income before taxes (ex.amortization of intangibleassets and support agreementcharges) 1,315 2,284 (42)
Amortization of intangible assets 28 24 17Support agreement charges (33) 541 N/M
Income before taxes $ 1,320 $ 1,719 (23)%
Memo: Income before taxes ex.amortization of intangibleassets $ 1,348 $ 1,743 (23)%
Pre-tax operating margin 31% 31%Pre-tax operating margin (ex.
amortization of intangibleassets) 32% 32%
Market value of securities onloan at period-end (in billions) $ 247 $ 326 (24)%
Average assets $60,804 $59,150 3%Average deposits 52,907 52,659 -
Business description
The Asset Servicing segment includes global custody,global fund services, securities lending, globalliquidity services, outsourcing, government securitiesclearance, collateral management and credit-relatedservices and other linked revenues, principally foreignexchange. Clients include corporate and publicretirement funds, foundations and endowments andglobal financial institutions including banks, broker-dealers, investment managers, insurance companiesand mutual funds.
The results of the Asset Servicing segment are drivenby a number of factors which include the level oftransactional activity, the extent of services provided,including custody, accounting, fund administration,daily valuations, performance measurement and riskanalytics, securities lending, investment managerbackoffice outsourcing, and the market value of assetsunder administration and custody. Market interestrates impact both securities lending revenue and theearnings on client deposit balances. Broker-dealer feesdepend on the level of activity in the fixed income andequity markets and the financing needs of customers,which are typically higher when the equity and fixed-income markets are active. Also, tri-party repoarrangements continue to remain a key revenue driverin broker-dealer services. Foreign exchange tradingrevenues are influenced by the volume of clienttransactions and the spread realized on thesetransactions, market volatility in major currencies, thelevel of cross-border assets held in custody for clients,the level and nature of underlying cross-borderinvestments and other transactions undertaken bycorporate and institutional clients. Segment expensesare principally driven by staffing levels andtechnology investments necessary to processtransaction volumes.
BNY Mellon 29
Results of Operations (continued)
We are one of the leading global securities servicingproviders with a total of $22.3 trillion of assets undercustody and administration at Dec. 31, 2009. Wecontinue to maintain our number one ranking in twomajor global custody surveys. We are one of thelargest providers of fund services in the world,servicing $4.4 trillion in assets. We also service 44%of the funds in the U.S. exchange-traded fundsmarketplace. We are the largest custodian for U.S.corporate and public pension plans. BNY MellonAsset Servicing services 46% of the top 50endowments.
We are a leading custodian in the U.K. and service30% of U.K. pensions. European asset servicingcontinues to grow across all products, reflectingsignificant cross-border investment and capital flow.In securities lending, we are one of the largest lendersof U.S. Treasury securities and depositary receipts andservice a lending pool of $2.4 trillion in 30 marketsaround the world. We are one of the largest globalproviders of performance and risk analytics with $8.2trillion in assets under measurement.
Our broker-dealer services business is a leader inglobal clearance, clearing equity and fixed incometransactions in more than 100 markets. We clear over55% of U.S. Government securities transactions. Weare a leading collateral management agent with $1.5trillion in tri-party balances worldwide at Dec. 31,2009.
Review of financial results
Income before taxes was $1.3 billion in 2009compared with $1.7 billion in 2008. Income beforetaxes, excluding amortization of intangible assets andsupport agreement charges, was $1.3 billion in 2009compared with $2.3 billion in 2008. The decreasecompared with 2008 reflects lower securities lendingrevenue and foreign exchange revenue, reflecting thechallenging market environment for volume andspread related businesses in 2009, and historically lowinterest rates, partially offset by strong expensecontrol. Asset servicing continued to win newbusiness in 2009, including $1.2 trillion in 2009.
Total fee and other revenue decreased $1.0 billion in2009 compared with 2008 driven by lower securitieslending revenue, lower foreign exchange and othertrading activities and lower market values for most of2009, and a stronger U.S. dollar. This decrease waspartially offset by new business.
Securities lending revenue decreased $496 millioncompared to 2008. The decrease primarily reflectslower spreads and lower loan balances due tode-leveraging in the financial markets. Spreadsdecreased 80% at Dec. 31, 2009 compared with Dec.31, 2008, reflecting normalization to historic levels.The market value of securities on loan decreased $79billion compared with Dec. 31, 2008.
Foreign exchange and other trading activity decreased$294 million compared with 2008, primarily reflectinga 21% decline in volumes.
Net interest revenue decreased $194 million comparedwith 2008, primarily driven by lower spreads resultingfrom the low interest rate environment throughout2009.
Revenue generated in the Asset Servicing segmentincludes 37% from non-U.S. sources in 2009compared with 40% in 2008.
Noninterest expense (excluding amortization ofintangible assets and support agreement charges)decreased $272 million compared with 2008. Thedecrease in expenses primarily reflects a decrease incompensation expense due to lower incentives, strongoverall expense control and a stronger U.S. dollar.Incentive expense decreased 36% in 2009 comparedwith 2008. Partially offsetting the decrease was highertechnology expenses.
2008 compared with 2007
Income before taxes was $1.7 billion in 2008,compared with $1.2 billion in 2007. Income beforetaxes (excluding amortization of intangible assets andsupport agreement charges) was $2.3 billion in 2008compared with $1.2 billion in 2007. Fee and otherrevenue increased $1.5 billion, primarily due to themerger with Mellon Financial, net new business, crosssells and organic growth, higher securities lendingrevenue and foreign exchange and other tradingactivities and the impact of the fourth quarter 2007acquisition of the remaining 50% interest in BNYMellon Asset Servicing B.V. Net interest revenueincreased $393 million primarily driven by the mergerwith Mellon Financial, strong deposit growth andincreased deposit spreads. Noninterest expense(excluding amortization of intangible assets andsupport agreement charges) increased $739 millionprimarily due the merger with Mellon Financial, theacquisition of the remaining 50% interest in BNYMellon Asset Servicing B.V., the 2008 annual merit
30 BNY Mellon
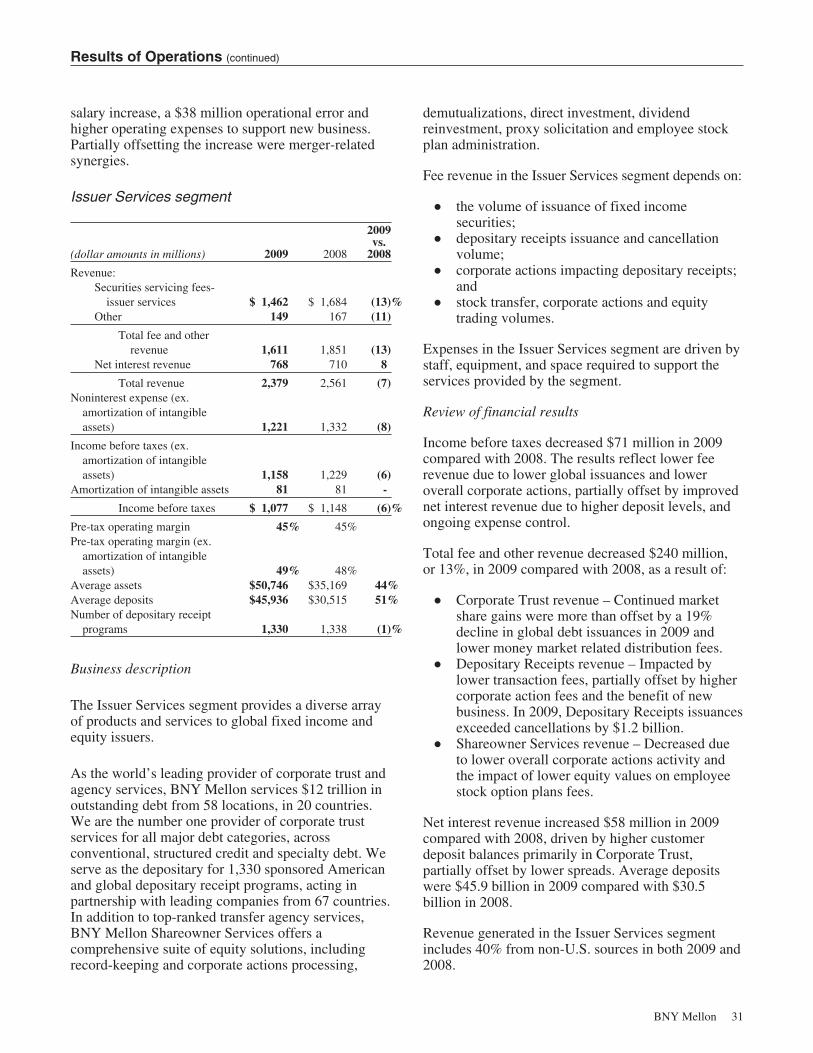
Results of Operations (continued)
salary increase, a $38 million operational error andhigher operating expenses to support new business.Partially offsetting the increase were merger-relatedsynergies.
Issuer Services segment
(dollar amounts in millions) 2009 2008
2009vs.
2008
Revenue:Securities servicing fees-
issuer services $ 1,462 $ 1,684 (13)%Other 149 167 (11)
Total fee and otherrevenue 1,611 1,851 (13)
Net interest revenue 768 710 8
Total revenue 2,379 2,561 (7)Noninterest expense (ex.
amortization of intangibleassets) 1,221 1,332 (8)
Income before taxes (ex.amortization of intangibleassets) 1,158 1,229 (6)
Amortization of intangible assets 81 81 -
Income before taxes $ 1,077 $ 1,148 (6)%
Pre-tax operating margin 45% 45%Pre-tax operating margin (ex.
amortization of intangibleassets) 49% 48%
Average assets $50,746 $35,169 44%Average deposits $45,936 $30,515 51%Number of depositary receipt
programs 1,330 1,338 (1)%
Business description
The Issuer Services segment provides a diverse arrayof products and services to global fixed income andequity issuers.
As the world’s leading provider of corporate trust andagency services, BNY Mellon services $12 trillion inoutstanding debt from 58 locations, in 20 countries.We are the number one provider of corporate trustservices for all major debt categories, acrossconventional, structured credit and specialty debt. Weserve as the depositary for 1,330 sponsored Americanand global depositary receipt programs, acting inpartnership with leading companies from 67 countries.In addition to top-ranked transfer agency services,BNY Mellon Shareowner Services offers acomprehensive suite of equity solutions, includingrecord-keeping and corporate actions processing,
demutualizations, direct investment, dividendreinvestment, proxy solicitation and employee stockplan administration.
Fee revenue in the Issuer Services segment depends on:
Š the volume of issuance of fixed incomesecurities;
Š depositary receipts issuance and cancellationvolume;
Š corporate actions impacting depositary receipts;and
Š stock transfer, corporate actions and equitytrading volumes.
Expenses in the Issuer Services segment are driven bystaff, equipment, and space required to support theservices provided by the segment.
Review of financial results
Income before taxes decreased $71 million in 2009compared with 2008. The results reflect lower feerevenue due to lower global issuances and loweroverall corporate actions, partially offset by improvednet interest revenue due to higher deposit levels, andongoing expense control.
Total fee and other revenue decreased $240 million,or 13%, in 2009 compared with 2008, as a result of:
Š Corporate Trust revenue – Continued marketshare gains were more than offset by a 19%decline in global debt issuances in 2009 andlower money market related distribution fees.
Š Depositary Receipts revenue – Impacted bylower transaction fees, partially offset by highercorporate action fees and the benefit of newbusiness. In 2009, Depositary Receipts issuancesexceeded cancellations by $1.2 billion.
Š Shareowner Services revenue – Decreased dueto lower overall corporate actions activity andthe impact of lower equity values on employeestock option plans fees.
Net interest revenue increased $58 million in 2009compared with 2008, driven by higher customerdeposit balances primarily in Corporate Trust,partially offset by lower spreads. Average depositswere $45.9 billion in 2009 compared with $30.5billion in 2008.
Revenue generated in the Issuer Services segmentincludes 40% from non-U.S. sources in both 2009 and2008.
BNY Mellon 31
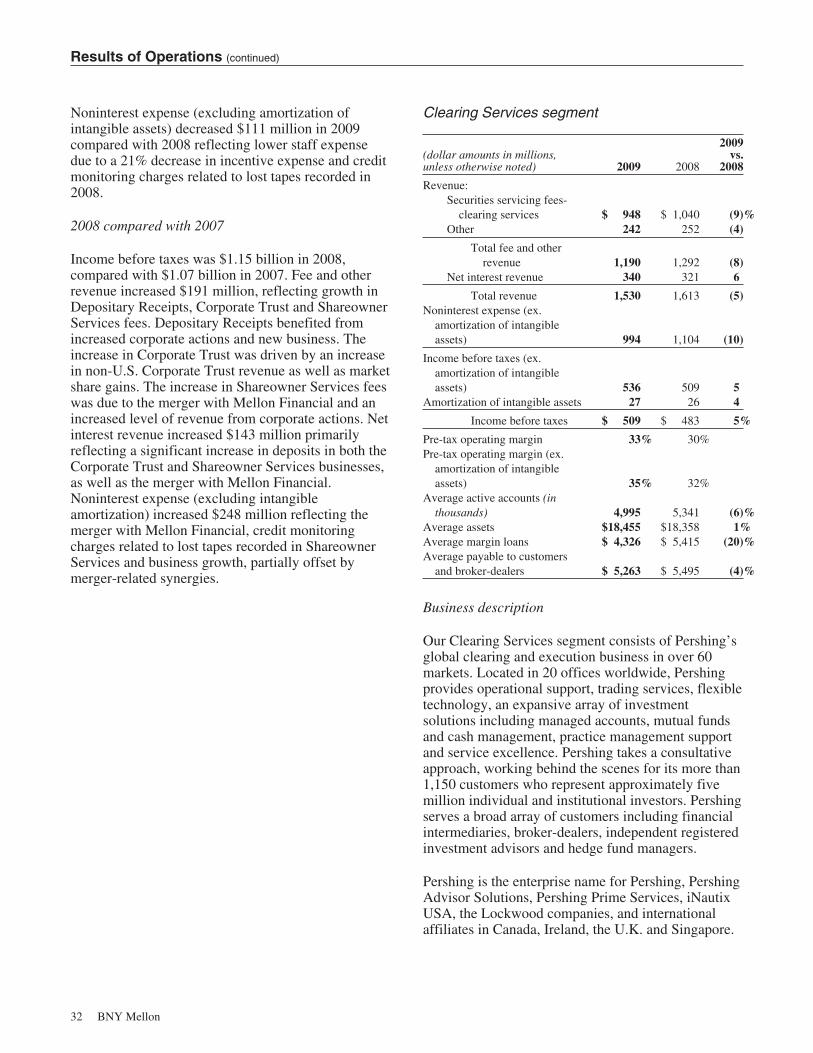
Results of Operations (continued)
Noninterest expense (excluding amortization ofintangible assets) decreased $111 million in 2009compared with 2008 reflecting lower staff expensedue to a 21% decrease in incentive expense and creditmonitoring charges related to lost tapes recorded in2008.
2008 compared with 2007
Income before taxes was $1.15 billion in 2008,compared with $1.07 billion in 2007. Fee and otherrevenue increased $191 million, reflecting growth inDepositary Receipts, Corporate Trust and ShareownerServices fees. Depositary Receipts benefited fromincreased corporate actions and new business. Theincrease in Corporate Trust was driven by an increasein non-U.S. Corporate Trust revenue as well as marketshare gains. The increase in Shareowner Services feeswas due to the merger with Mellon Financial and anincreased level of revenue from corporate actions. Netinterest revenue increased $143 million primarilyreflecting a significant increase in deposits in both theCorporate Trust and Shareowner Services businesses,as well as the merger with Mellon Financial.Noninterest expense (excluding intangibleamortization) increased $248 million reflecting themerger with Mellon Financial, credit monitoringcharges related to lost tapes recorded in ShareownerServices and business growth, partially offset bymerger-related synergies.
Clearing Services segment
(dollar amounts in millions,unless otherwise noted) 2009 2008
2009vs.
2008
Revenue:Securities servicing fees-
clearing services $ 948 $ 1,040 (9)%Other 242 252 (4)
Total fee and otherrevenue 1,190 1,292 (8)
Net interest revenue 340 321 6
Total revenue 1,530 1,613 (5)Noninterest expense (ex.
amortization of intangibleassets) 994 1,104 (10)
Income before taxes (ex.amortization of intangibleassets) 536 509 5
Amortization of intangible assets 27 26 4
Income before taxes $ 509 $ 483 5%
Pre-tax operating margin 33% 30%Pre-tax operating margin (ex.
amortization of intangibleassets) 35% 32%
Average active accounts (inthousands) 4,995 5,341 (6)%
Average assets $18,455 $18,358 1%Average margin loans $ 4,326 $ 5,415 (20)%Average payable to customers
and broker-dealers $ 5,263 $ 5,495 (4)%
Business description
Our Clearing Services segment consists of Pershing’sglobal clearing and execution business in over 60markets. Located in 20 offices worldwide, Pershingprovides operational support, trading services, flexibletechnology, an expansive array of investmentsolutions including managed accounts, mutual fundsand cash management, practice management supportand service excellence. Pershing takes a consultativeapproach, working behind the scenes for its more than1,150 customers who represent approximately fivemillion individual and institutional investors. Pershingserves a broad array of customers including financialintermediaries, broker-dealers, independent registeredinvestment advisors and hedge fund managers.
Pershing is the enterprise name for Pershing, PershingAdvisor Solutions, Pershing Prime Services, iNautixUSA, the Lockwood companies, and internationalaffiliates in Canada, Ireland, the U.K. and Singapore.
32 BNY Mellon
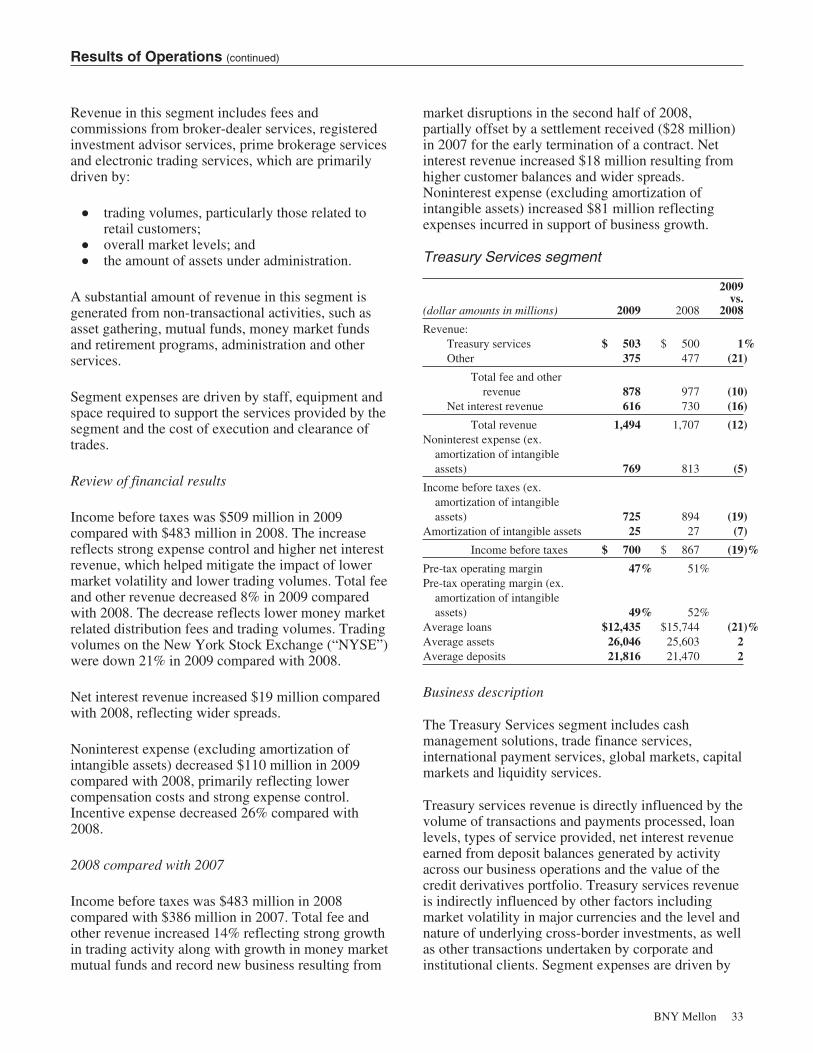
Results of Operations (continued)
Revenue in this segment includes fees andcommissions from broker-dealer services, registeredinvestment advisor services, prime brokerage servicesand electronic trading services, which are primarilydriven by:
Š trading volumes, particularly those related toretail customers;
Š overall market levels; andŠ the amount of assets under administration.
A substantial amount of revenue in this segment isgenerated from non-transactional activities, such asasset gathering, mutual funds, money market fundsand retirement programs, administration and otherservices.
Segment expenses are driven by staff, equipment andspace required to support the services provided by thesegment and the cost of execution and clearance oftrades.
Review of financial results
Income before taxes was $509 million in 2009compared with $483 million in 2008. The increasereflects strong expense control and higher net interestrevenue, which helped mitigate the impact of lowermarket volatility and lower trading volumes. Total feeand other revenue decreased 8% in 2009 comparedwith 2008. The decrease reflects lower money marketrelated distribution fees and trading volumes. Tradingvolumes on the New York Stock Exchange (“NYSE”)were down 21% in 2009 compared with 2008.
Net interest revenue increased $19 million comparedwith 2008, reflecting wider spreads.
Noninterest expense (excluding amortization ofintangible assets) decreased $110 million in 2009compared with 2008, primarily reflecting lowercompensation costs and strong expense control.Incentive expense decreased 26% compared with2008.
2008 compared with 2007
Income before taxes was $483 million in 2008compared with $386 million in 2007. Total fee andother revenue increased 14% reflecting strong growthin trading activity along with growth in money marketmutual funds and record new business resulting from
market disruptions in the second half of 2008,partially offset by a settlement received ($28 million)in 2007 for the early termination of a contract. Netinterest revenue increased $18 million resulting fromhigher customer balances and wider spreads.Noninterest expense (excluding amortization ofintangible assets) increased $81 million reflectingexpenses incurred in support of business growth.
Treasury Services segment
(dollar amounts in millions) 2009 2008
2009vs.
2008
Revenue:Treasury services $ 503 $ 500 1%Other 375 477 (21)
Total fee and otherrevenue 878 977 (10)
Net interest revenue 616 730 (16)
Total revenue 1,494 1,707 (12)Noninterest expense (ex.
amortization of intangibleassets) 769 813 (5)
Income before taxes (ex.amortization of intangibleassets) 725 894 (19)
Amortization of intangible assets 25 27 (7)
Income before taxes $ 700 $ 867 (19)%
Pre-tax operating margin 47% 51%Pre-tax operating margin (ex.
amortization of intangibleassets) 49% 52%
Average loans $12,435 $15,744 (21)%Average assets 26,046 25,603 2Average deposits 21,816 21,470 2
Business description
The Treasury Services segment includes cashmanagement solutions, trade finance services,international payment services, global markets, capitalmarkets and liquidity services.
Treasury services revenue is directly influenced by thevolume of transactions and payments processed, loanlevels, types of service provided, net interest revenueearned from deposit balances generated by activityacross our business operations and the value of thecredit derivatives portfolio. Treasury services revenueis indirectly influenced by other factors includingmarket volatility in major currencies and the level andnature of underlying cross-border investments, as wellas other transactions undertaken by corporate andinstitutional clients. Segment expenses are driven by
BNY Mellon 33
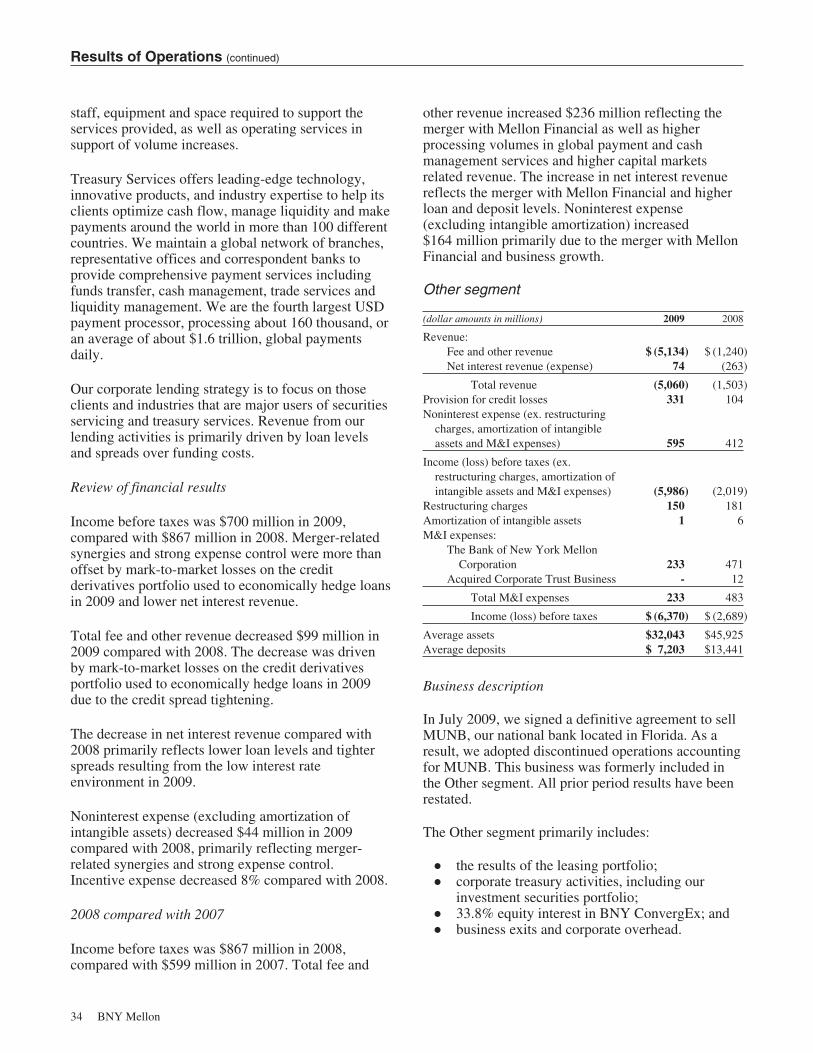
Results of Operations (continued)
staff, equipment and space required to support theservices provided, as well as operating services insupport of volume increases.
Treasury Services offers leading-edge technology,innovative products, and industry expertise to help itsclients optimize cash flow, manage liquidity and makepayments around the world in more than 100 differentcountries. We maintain a global network of branches,representative offices and correspondent banks toprovide comprehensive payment services includingfunds transfer, cash management, trade services andliquidity management. We are the fourth largest USDpayment processor, processing about 160 thousand, oran average of about $1.6 trillion, global paymentsdaily.
Our corporate lending strategy is to focus on thoseclients and industries that are major users of securitiesservicing and treasury services. Revenue from ourlending activities is primarily driven by loan levelsand spreads over funding costs.
Review of financial results
Income before taxes was $700 million in 2009,compared with $867 million in 2008. Merger-relatedsynergies and strong expense control were more thanoffset by mark-to-market losses on the creditderivatives portfolio used to economically hedge loansin 2009 and lower net interest revenue.
Total fee and other revenue decreased $99 million in2009 compared with 2008. The decrease was drivenby mark-to-market losses on the credit derivativesportfolio used to economically hedge loans in 2009due to the credit spread tightening.
The decrease in net interest revenue compared with2008 primarily reflects lower loan levels and tighterspreads resulting from the low interest rateenvironment in 2009.
Noninterest expense (excluding amortization ofintangible assets) decreased $44 million in 2009compared with 2008, primarily reflecting merger-related synergies and strong expense control.Incentive expense decreased 8% compared with 2008.
2008 compared with 2007
Income before taxes was $867 million in 2008,compared with $599 million in 2007. Total fee and
other revenue increased $236 million reflecting themerger with Mellon Financial as well as higherprocessing volumes in global payment and cashmanagement services and higher capital marketsrelated revenue. The increase in net interest revenuereflects the merger with Mellon Financial and higherloan and deposit levels. Noninterest expense(excluding intangible amortization) increased$164 million primarily due to the merger with MellonFinancial and business growth.
Other segment
(dollar amounts in millions) 2009 2008
Revenue:Fee and other revenue $ (5,134) $ (1,240)Net interest revenue (expense) 74 (263)
Total revenue (5,060) (1,503)Provision for credit losses 331 104Noninterest expense (ex. restructuring
charges, amortization of intangibleassets and M&I expenses) 595 412
Income (loss) before taxes (ex.restructuring charges, amortization ofintangible assets and M&I expenses) (5,986) (2,019)
Restructuring charges 150 181Amortization of intangible assets 1 6M&I expenses:
The Bank of New York MellonCorporation 233 471
Acquired Corporate Trust Business - 12
Total M&I expenses 233 483
Income (loss) before taxes $ (6,370) $ (2,689)
Average assets $32,043 $45,925Average deposits $ 7,203 $13,441
Business description
In July 2009, we signed a definitive agreement to sellMUNB, our national bank located in Florida. As aresult, we adopted discontinued operations accountingfor MUNB. This business was formerly included inthe Other segment. All prior period results have beenrestated.
The Other segment primarily includes:
Š the results of the leasing portfolio;Š corporate treasury activities, including our
investment securities portfolio;Š 33.8% equity interest in BNY ConvergEx; andŠ business exits and corporate overhead.
34 BNY Mellon

Results of Operations (continued)
Revenue primarily reflects:
Š net interest revenue from the leasing portfolio;Š any residual interest income resulting from
transfer pricing algorithms relative to actualresults;
Š fee and other revenue from corporate and bank-owned life insurance; and
Š gains (losses) associated with the valuation ofinvestment securities and other assets.
Noninterest expense includes:
Š M&I expenses;Š restructuring charges;Š direct expenses supporting leasing, investing and
funding activities; andŠ certain corporate overhead not directly
attributable to the operations of other segments.
Review of financial results
Income before taxes was a loss of $6.4 billion in 2009compared with a loss of $2.7 billion in 2008.
The Other segment includes the following activity in2009:
Š a $5.3 billion (pre-tax) loss on investmentsecurities primarily due to the restructuring ofthe investment securities portfolio, recorded infee and other revenue;
Š a provision for credit losses of $331 million;Š a $61 million (pre-tax) FDIC special assessment,
recorded in other expense;Š a $139 million pre-tax restructuring charge
relating to our global location strategy; andŠ M&I expenses of $233 million associated with
the Mellon Financial merger. See Noninterestexpense for additional information on M&Iexpenses.
2008 compared with 2007
Income before taxes was a loss of $2.7 billion in 2008compared with a loss of $622 million in 2007. Totalfee and other revenue decreased primarily due tohigher investment securities losses. Net interestrevenue decreased primarily due to a $489 million(pre-tax) SILO/ LILO settlement. The provision forcredit losses increased reflecting an increase innonperforming loans as well as higher net charge-offsin 2008.
International operations
Our primary international activities consist ofsecurities servicing, asset management and globalpayment services.
Our clients include some of the world’s largestpension funds and institutions, local authorities,treasuries, family offices and individual investors.Through our global network of offices, we havedeveloped a deep understanding of local requirementsand cultural needs and we pride ourselves in providingdedicated service through our multilingual sales,marketing and client service teams.
We conduct business through subsidiaries, branches,and representative offices in 34 countries. We havemajor operational centers based in Brussels, Cork,Dublin, Luxembourg, Singapore, throughout theUnited Kingdom including London, Manchester,Brentwood, Edinburgh and Poole, and Chennai andPune in India.
BNY Mellon is a leading global custodian. At Dec.31, 2009, our cross-border assets under custody were$8.8 trillion compared with $7.5 trillion at Dec. 31,2008. This increase primarily reflects higher marketvalues as the FTSE 100 and MSCI EAFE® indicesincreased 22% and 28%, respectively.
BNY Mellon Asset Management operates on a multi-boutique model bringing investors the skills of ourspecialist boutique asset managers, which togethermanage investments spanning virtually all assetclasses.
We are one of the largest global asset managers,ranking 4th in the institutional marketplace and are the7th largest asset manager active in Europe. Throughthe acquisition of Insight, we have become a marketleader in the field of liability-driven investments.
At Dec. 31, 2009, approximately 32% of BNYMellon’s AUM were managed by our internationaloperations, compared with 18% in 2008. The increaseprimarily resulted from our 2009 acquisitions ofInsight and Siguler Guff and improved marketvaluations.
We serve as the depositary for 1,330 sponsoredAmerican and global depositary receipt programs,acting in partnership with leading companies from 67countries. As the world’s leading provider of
BNY Mellon 35
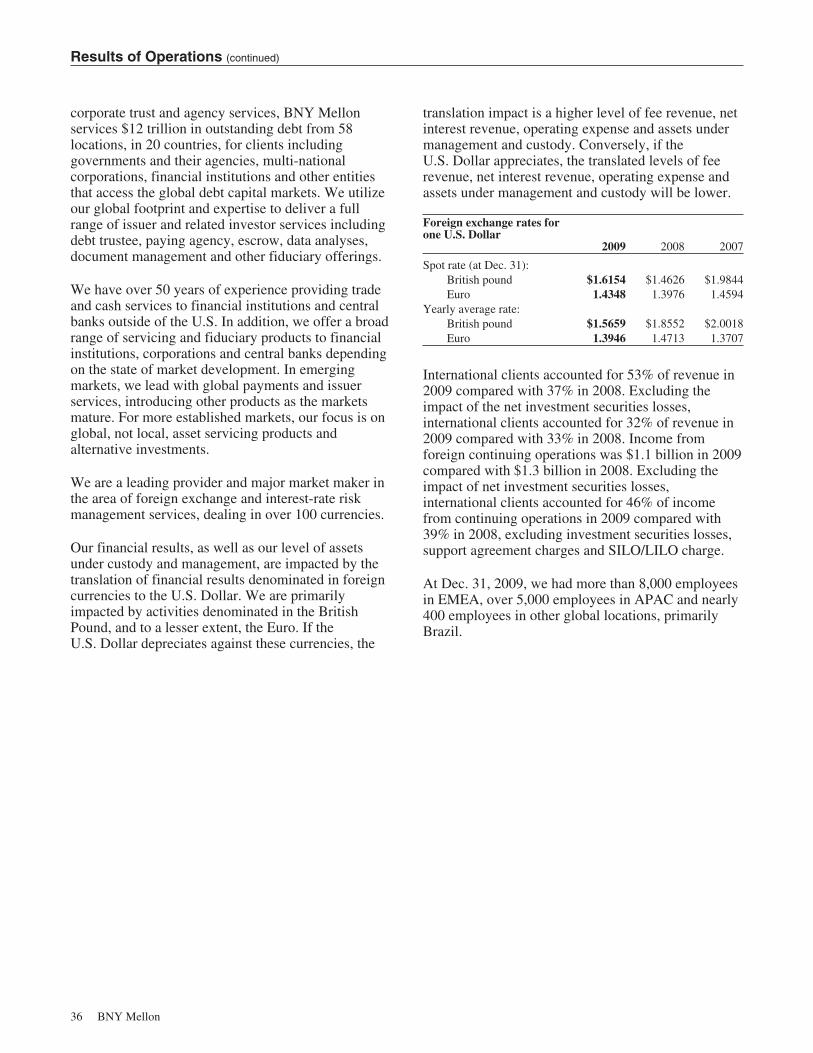
Results of Operations (continued)
corporate trust and agency services, BNY Mellonservices $12 trillion in outstanding debt from 58locations, in 20 countries, for clients includinggovernments and their agencies, multi-nationalcorporations, financial institutions and other entitiesthat access the global debt capital markets. We utilizeour global footprint and expertise to deliver a fullrange of issuer and related investor services includingdebt trustee, paying agency, escrow, data analyses,document management and other fiduciary offerings.
We have over 50 years of experience providing tradeand cash services to financial institutions and centralbanks outside of the U.S. In addition, we offer a broadrange of servicing and fiduciary products to financialinstitutions, corporations and central banks dependingon the state of market development. In emergingmarkets, we lead with global payments and issuerservices, introducing other products as the marketsmature. For more established markets, our focus is onglobal, not local, asset servicing products andalternative investments.
We are a leading provider and major market maker inthe area of foreign exchange and interest-rate riskmanagement services, dealing in over 100 currencies.
Our financial results, as well as our level of assetsunder custody and management, are impacted by thetranslation of financial results denominated in foreigncurrencies to the U.S. Dollar. We are primarilyimpacted by activities denominated in the BritishPound, and to a lesser extent, the Euro. If theU.S. Dollar depreciates against these currencies, the
translation impact is a higher level of fee revenue, netinterest revenue, operating expense and assets undermanagement and custody. Conversely, if theU.S. Dollar appreciates, the translated levels of feerevenue, net interest revenue, operating expense andassets under management and custody will be lower.
Foreign exchange rates forone U.S. Dollar
2009 2008 2007
Spot rate (at Dec. 31):British pound $1.6154 $1.4626 $1.9844Euro 1.4348 1.3976 1.4594
Yearly average rate:British pound $1.5659 $1.8552 $2.0018Euro 1.3946 1.4713 1.3707
International clients accounted for 53% of revenue in2009 compared with 37% in 2008. Excluding theimpact of the net investment securities losses,international clients accounted for 32% of revenue in2009 compared with 33% in 2008. Income fromforeign continuing operations was $1.1 billion in 2009compared with $1.3 billion in 2008. Excluding theimpact of net investment securities losses,international clients accounted for 46% of incomefrom continuing operations in 2009 compared with39% in 2008, excluding investment securities losses,support agreement charges and SILO/LILO charge.
At Dec. 31, 2009, we had more than 8,000 employeesin EMEA, over 5,000 employees in APAC and nearly400 employees in other global locations, primarilyBrazil.
36 BNY Mellon

Results of Operations (continued)
International financial data
Foreign activity includes asset and wealthmanagement and securities servicing fee revenuegenerating businesses, foreign exchange trading
activity, loans and other revenue producing assets andtransactions in which the customer is domiciledoutside of the United States and/or the foreign activityis resident at a foreign entity.
Foreign revenue, income before income taxes, net income and assets from foreign operations on a continuingoperations basis are shown in the table below.
Internationaloperations
2009 2008 2007 (a)
(in millions) Revenue
Incomebefore
taxes
Incomefrom
continuingoperations
Totalassets (b) Revenue
Incomebeforetaxes
Incomefrom
continuingoperations
Totalassets (b) Revenue
Incomebeforetaxes
Incomefrom
continuingoperations
Totalassets (b)
Domestic $3,615 $(3,615) $(1,901) (c) $ 145,008 $ 8,566 $ 140 $ 136 (c) $183,565 $ 7,621 $2,031 $1,408 $137,179Foreign:
EMEA (e) 2,825 (d) 863 667 58,011 (d) 3,604 (d) 1,176 859 49,037 (d) 2,780 743 509 52,722APAC 669 287 222 5,588 796 338 247 3,527 553 247 172 5,209Other 578 257 199 1,375 607 292 213 1,383 344 194 139 2,546
Total foreign 4,072 1,407 1,088 64,974 5,007 1,806 1,319 53,947 3,677 1,184 820 60,477
Total $7,687 $(2,208) $ (813) $209,982 (f) $13,573 $1,946 $1,455 $237,512 $11,298 $3,215 $2,228 $197,656
(a) Results for 2007 include six months of BNY Mellon and six months of legacy The Bank of New York Company, Inc.(b) Total assets include long-lived assets, which are not considered by management to be significant in relation to total assets. Long-lived assets are
primarily located in the U.S.(c) Domestic income from continuing operations in 2009 and 2008 was reduced by investment securities losses. Domestic income from continuing
operations in 2008 was also reduced by SILO/LILO charges and support agreement charges.(d) Includes revenue of approximately $1.6 billion and $2.0 billion, and assets of approximately $43.0 billion and $27.1 billion, in 2009 and 2008,
respectively, of international operations domiciled in the U.K., which is 21% and 14% of total revenue and 20% and 11% of total assets, respectively.(e) In 2009, excludes the $269 million of securities losses on the European floating rate note.(f) Presented on a continuing operations basis.
In 2009, revenues from EMEA were $2.8 billion,compared with $3.6 billion in 2008 and $2.8 billion in2007. Revenues from EMEA were down 22% for2009 compared to 2008. The decrease in 2009primarily reflects lower market values. Revenue fromEMEA in 2009 was spread across most of oursegments. Asset Servicing generated 46%, IssuerServices 22%, Asset Management 21%, TreasuryServices 6% and Clearing Services 5% of revenuesfrom EMEA. Income from continuing operations fromEMEA was $667 million in 2009 compared with $859million in 2008 and $509 million in 2007.
Revenues from APAC were $669 million in 2009compared with $796 million in 2008 and $553 millionin 2007. The decrease in APAC revenue in 2009resulted from lower market values, reduced securitieslending volume and the effect of a low interest rate
environment. Revenue from APAC in 2009 wasgenerated by the following segments: AssetManagement 30%, Treasury Services 26%, AssetServicing 23%, Issuer Services 18% and ClearingServices 3%. Income from continuing operations fromAPAC was $222 million in 2009 compared with $247million in 2008 and $172 million in 2007.
Income from continuing operations from EMEA andAPAC were driven by the same factors affectingrevenue. In addition, income from continuingoperations from EMEA in 2009 compared with 2008was negatively impacted by the strength of theU.S. Dollar versus the Euro and British Pound.Income from continuing operations from EMEA in2008 compared with 2007 was negatively impacted bythe strength of the U.S. Dollar versus the BritishPound.
BNY Mellon 37
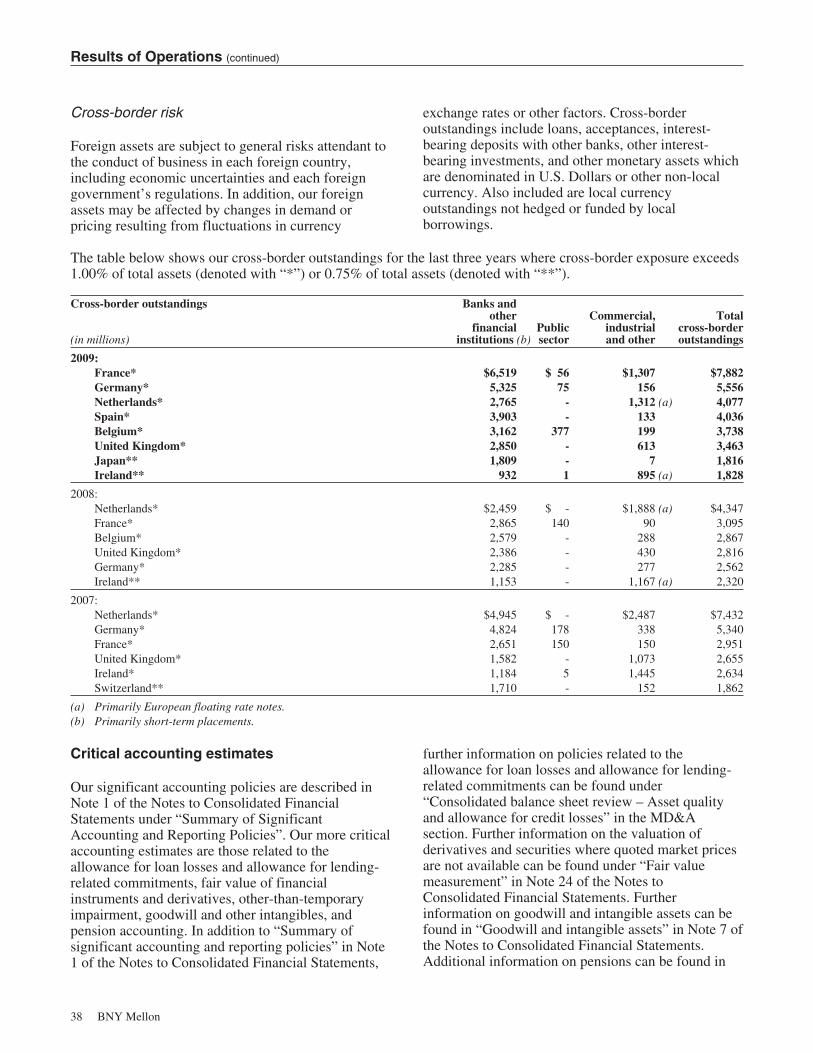
Results of Operations (continued)
Cross-border risk
Foreign assets are subject to general risks attendant tothe conduct of business in each foreign country,including economic uncertainties and each foreigngovernment’s regulations. In addition, our foreignassets may be affected by changes in demand orpricing resulting from fluctuations in currency
exchange rates or other factors. Cross-borderoutstandings include loans, acceptances, interest-bearing deposits with other banks, other interest-bearing investments, and other monetary assets whichare denominated in U.S. Dollars or other non-localcurrency. Also included are local currencyoutstandings not hedged or funded by localborrowings.
The table below shows our cross-border outstandings for the last three years where cross-border exposure exceeds1.00% of total assets (denoted with “*”) or 0.75% of total assets (denoted with “**”).
Cross-border outstandings
(in millions)
Banks andother
financialinstitutions (b)
Publicsector
Commercial,industrialand other
Totalcross-borderoutstandings
2009:France* $6,519 $ 56 $1,307 $7,882Germany* 5,325 75 156 5,556Netherlands* 2,765 - 1,312 (a) 4,077Spain* 3,903 - 133 4,036Belgium* 3,162 377 199 3,738United Kingdom* 2,850 - 613 3,463Japan** 1,809 - 7 1,816Ireland** 932 1 895 (a) 1,828
2008:Netherlands* $2,459 $ - $1,888 (a) $4,347France* 2,865 140 90 3,095Belgium* 2,579 - 288 2,867United Kingdom* 2,386 - 430 2,816Germany* 2,285 - 277 2,562Ireland** 1,153 - 1,167 (a) 2,320
2007:Netherlands* $4,945 $ - $2,487 $7,432Germany* 4,824 178 338 5,340France* 2,651 150 150 2,951United Kingdom* 1,582 - 1,073 2,655Ireland* 1,184 5 1,445 2,634Switzerland** 1,710 - 152 1,862
(a) Primarily European floating rate notes.(b) Primarily short-term placements.
Critical accounting estimates
Our significant accounting policies are described inNote 1 of the Notes to Consolidated FinancialStatements under “Summary of SignificantAccounting and Reporting Policies”. Our more criticalaccounting estimates are those related to theallowance for loan losses and allowance for lending-related commitments, fair value of financialinstruments and derivatives, other-than-temporaryimpairment, goodwill and other intangibles, andpension accounting. In addition to “Summary ofsignificant accounting and reporting policies” in Note1 of the Notes to Consolidated Financial Statements,
further information on policies related to theallowance for loan losses and allowance for lending-related commitments can be found under“Consolidated balance sheet review – Asset qualityand allowance for credit losses” in the MD&Asection. Further information on the valuation ofderivatives and securities where quoted market pricesare not available can be found under “Fair valuemeasurement” in Note 24 of the Notes toConsolidated Financial Statements. Furtherinformation on goodwill and intangible assets can befound in “Goodwill and intangible assets” in Note 7 ofthe Notes to Consolidated Financial Statements.Additional information on pensions can be found in
38 BNY Mellon
Results of Operations (continued)
“Employee benefit plans” in Note 21 of the Notes toConsolidated Financial Statements.
Allowance for loan losses and allowance forlending-related commitments
The allowance for loan losses and allowance forlending-related commitments consist of threeelements: (1) an allowance for impaired credits; (2) anallowance for higher risk rated loans and exposuresand pass rated loans and exposures; and (3) anunallocated allowance based on general economicconditions and certain risk factors in our individualportfolio and markets. Further discussion of the threeelements can be found under Asset quality andallowance for credit losses in Consolidated balancesheet review.
The allowance for loan losses and allowance forlending-related commitments representsmanagement’s estimate of probable losses inherent inour credit portfolio. This evaluation process is subjectto numerous estimates and judgments. Probability ofdefault ratings are assigned based on internal ratingsafter analyzing the credit quality of each borrower/counterparty. Our internal ratings are generallyconsistent with external ratings agencies defaultdatabases. Loss given default ratings are driven by thecollateral, structure, and seniority of each individualasset and are consistent with external loss givendefault/recovery databases. The portion of theallowance related to impaired credits is based on thepresent value of expected future cash flows; however,as a practical expedient, it may be based on thecredit’s observable market price. Additionally, it maybe based on the fair value of collateral if the credit iscollateral dependent. Changes in the estimates ofprobability of default, risk ratings, loss given default/recovery rates, and cash flows could have a directimpact on the allocated allowance for loan losses.
To the extent actual results differ from forecasts ormanagement’s judgment, the allowance for creditlosses may be greater or less than future charge-offs.
It is difficult to quantify the impact of changes inforecasts on our allowance for loan losses andallowance for lending-related commitments.Nevertheless, we believe the following discussionmay enable investors to better understand thevariables that drive the allowance for loan losses andallowance for lending-related commitments.
A key variable in determining the allowance ismanagement’s judgment in determining the size of the
unallocated allowance. At Dec. 31, 2009, theunallocated allowance was $26 million, or 4% of thetotal allowance. At Dec. 31, 2009, if the unallocatedallowance, as a percentage of the total allowance, was5% higher, the allowance would have increased byapproximately $34 million.
The credit rating assigned to each credit is anothersignificant variable in determining the allowance. Ifeach credit were rated one grade better, the allowancewould have decreased by $144 million, while if eachcredit were rated one grade worse, the allowancewould have increased by $191 million. Similarly, ifthe loss given default were one rating worse, theallowance would have increased by $73 million, whileif the loss given default were one rating better, theallowance would have decreased by $65 million. Forimpaired credits, if the net carrying value of the loanswas 10% higher or lower, the allowance would havedecreased or increased by $3 million, respectively.
Fair value of financial instruments
We adopted guidance related to Fair ValueMeasurement included in ASC 820 and Fair ValueOption included in ASC 825 effective Jan. 1, 2008.ASC 820 defines fair value, establishes a frameworkfor measuring fair value, and expands disclosuresabout assets and liabilities measured at fair value. Thestandard also established a three-level hierarchy forfair value measurements based upon the transparencyof inputs to the valuation of an asset or liability as ofthe measurement date.
Effective Jan. 1, 2009, we adopted guidance related to“Determining Fair Value When the Volume and Levelof Activity for the Asset or Liability HaveSignificantly Decreased and Identifying TransactionsThat Are not Orderly”, included in ASC 820. ThisASC provides guidance on how to determine the fairvalue when the volume and level of activity for theasset or liability have significantly decreased andreemphasizes that the objective of a fair valuemeasurement remains an exit price notion. In thosecircumstances, further analysis of transactions orquoted prices is needed, and a significant adjustmentto the transactions or quoted prices may be necessaryto estimate fair value in accordance with ASC 820. Italso requires additional disclosures for instrumentswithin the scope of ASC 820 to include inputs andvaluation techniques used, change in valuationtechniques and related inputs, if any, and moredisaggregated information relating to debt and equitysecurities.
BNY Mellon 39
Results of Operations (continued)
The amended standard provides a consistent definitionof fair value, which focuses on exit price in an orderlytransaction (that is, not a forced liquidation ordistressed sale) between market participants at themeasurement date under current market conditions. Ifthere has been a significant decrease in the volumeand level of activity for the asset or liability, a changein valuation technique or the use of multiple valuationtechniques may be appropriate. In such instances,determining the price at which willing marketparticipants would transact at the measurement dateunder current market conditions depends on the factsand circumstances and requires the use of significantjudgment. The objective is to determine fromweighted indicators of fair value a reasonable pointwithin the range that is most representative of fairvalue under current market conditions.
Fair value – Securities
Level 1 – Securities
Recent quoted prices from exchange transactions areused for debt and equity securities that are activelytraded on exchanges and for U.S. Treasury securitiesand U.S. Government securities that are activelytraded in highly liquid over the counter markets. Weinclude these securities in Level 1 of the ASC 820hierarchy.
Level 2 – Securities
For securities where quotes from recent transactionsare not available for identical securities, we determinefair value primarily based on pricing sources withreasonable levels of price transparency. The pricingsources employ financial models or obtaincomparisons to similar instruments to arrive at“consensus” prices.
Specifically, the pricing sources obtain recenttransactions for similar types of securities (e.g.,vintage, position in the securitization structure) andascertain variables such as discount rate and speed ofprepayment for the type of transaction and apply suchvariables to similar types of bonds. We view these asobservable transactions in the current market placeand classify such securities as Level 2. Theydiscontinue pricing any specific security wheneverthey determine there is insufficient observable data toprovide a good faith opinion on price.
Securities included in this category that were affectedby the lack of market liquidity in 2009 include our
Alt-A residential mortgage-backed securities(“RMBS”), prime RMBS, subprime RMBS andcommercial mortgage-backed securities.
In addition, we have significant investments in moreactively traded agency RMBS and other types ofsecurities such as FDIC insured paper and sovereigndebt. The pricing sources derive the prices for thesesecurities largely from quotes they obtain from threemajor inter-dealer brokers. The pricing sourcesreceive their daily observed trade price and otherinformation feeds from the inter-dealer brokers.
For securities with bond insurance, the financialstrength of the insurance provider is analyzed and thatinformation is included in the fair value assessmentfor such securities.
The pricing sources did not discontinue pricing forany securities in our investment securities portfolio atDec. 31, 2009.
The prices provided by pricing sources are subject toreview and challenges by industry participants,including ourselves.
Level 3 – Securities
Where we have used our own cash flow models andestimates to value the securities, we classify them inLevel 3 of the ASC 820 hierarchy. Our Level 3securities represent less than 1% of our securitiesrecorded at fair value.
More than 99% of our securities are valued by pricingsources with reasonable levels of price transparency.Less than 1% of our securities are priced based onnon-binding dealer quotes and are included in Level 3of the fair value hierarchy.
See Note 24 to the Notes to Consolidated FinancialStatements for details of our securities by ASC 820hierarchy level.
Fair value – Derivative financial instruments
Level 1 – Derivative financial instruments
We include derivative financial instruments that areactively traded on exchanges, principally foreignexchange futures and forward contracts, in Level 1 ofthe ASC 820 hierarchy.
40 BNY Mellon
Results of Operations (continued)
Level 2 – Derivative financial instruments
The majority of our derivative financial instrumentsare priced using internally developed models that useobservable inputs for interest rates, pay-downs (bothactual and expected), foreign exchange rates, optionvolatilities and other factors. The valuation processtakes into consideration factors such as counterpartycredit quality, liquidity, concentration concerns, andresults of stress tests.
Substantially all of our model-priced derivativefinancial instruments are included in Level 2 of theASC 820 hierarchy.
Level 3 – Derivative financial instruments
Certain interest rate swaps with counterparties that arehighly structured entities require significant judgmentand analysis to adjust the value determined bystandard pricing models. These interest rate swaps areincluded in Level 3 of the ASC 820 hierarchy andcompose less than 1% of our derivative financialinstruments at fair value.
To test the appropriateness of the valuations, wesubject the models to review and approval by anindependent internal risk management function,benchmark the models against similar instruments andvalidate model estimates to actual cash transactions.In addition, we perform detailed reviews and analysesof profit and loss. Valuation adjustments aredetermined and controlled by a function independentof the area initiating the risk position. As markets andproducts develop and the pricing for certain productsbecomes more transparent, we refine our valuationmethods. Any changes to the valuation models arereviewed by management to ensure the changes arejustified.
To confirm that our valuation policies are consistentwith exit prices as prescribed by ASC 820, wereviewed our derivative valuations using recenttransactions in the marketplace, pricing services andthe results of similar types of transactions. As a resultof maximizing observable inputs as required by ASC820, in 2008 we began to reflect external credit ratingsas well as observable credit default swap spreads forboth ourselves as well as our counterparties whenmeasuring the fair value of our derivative positions.Accordingly, the valuation of our derivative positionsis sensitive to the current changes in our own creditspreads, as well as those of our counterparties.
For details of our derivative financial instruments byASC 820 hierarchy level, see Note 24 to the Notes toConsolidated Financial Statements.
Fair value option
ASC 825 provides the option to elect fair value as analternative measurement basis for selected financialassets, financial liabilities, unrecognized firmcommitments, and written loan commitments whichare not subject to fair value under other accountingstandards. Under ASC 825, fair value is used for boththe initial and subsequent measurement of thedesignated assets, liabilities and commitments, withthe changes in fair value recognized in income. AtDec. 31, 2009, we applied the fair value option to$110 million of unfunded loan commitments. Theseunfunded loan commitments are valued using quotesfrom dealers in the loan markets, and are included inLevel 3 of the ASC 820 hierarchy. See Note 25 to theNotes to Consolidated Financial Statements foradditional disclosure regarding the fair value option.
Fair value – Judgments
In times of illiquid markets and financial stress, actualprices and valuations may significantly diverge fromresults predicted by models. In addition, other factorscan affect our estimate of fair value, including marketdislocations, incorrect model assumptions, andunexpected correlations. These valuation methodscould expose us to materially different results shouldthe models used or underlying assumptions beinaccurate. See Basis of Presentation in Note 1 to theNotes to Consolidated Financial Statements.
Other-than-temporary impairment
In April 2009, the FASB issued new guidanceincluded in ASC 320 which modifies the other-than-temporary impairment (“OTTI”) model forinvestments in debt securities. Under this guidance, adebt security is considered impaired if its fair value isless than its amortized cost basis. An OTTI istriggered if (1) the intent is to sell the security, (2) thesecurity will more likely than not have to be soldbefore the impairment is recovered, or (3) theamortized cost basis is not expected to be recovered.When an entity does not intend to sell the securitybefore recovery of its cost basis, it will recognize thecredit component of an OTTI of a debt security inearnings and the remaining portion in othercomprehensive income.
BNY Mellon 41
Results of Operations (continued)
For each non-agency RMBS, which includes Alt-A,subprime and prime RMBS, not backed by thegovernment, in the investment portfolio (including butnot limited to those whose fair value is less than theiramortized cost basis), an extensive, regular review isconducted to determine if an OTTI has occurred. Todetermine if the unrealized loss for non-agencyRMBS is other-than-temporary, we project totalestimated defaults of the underlying assets(mortgages) and multiply that calculated amount byan estimate of realizable value upon sale of theseassets in the marketplace (severity) in order todetermine the projected collateral loss. We alsoevaluate the current credit enhancement underlyingthe bond to determine the impact on cash flows. If wedetermine that a given RMBS position will be subjectto a write-down or loss, we record the expected creditloss as a charge to earnings.
During 2009, given the weakness in the housingmarket and broader economy, we adjusted ournon-agency RMBS estimated default and loss severityassumptions to increase estimated defaults anddecrease the amount we expect to receive to cover thevalue of the original loan. See Note 5 of the Notes toConsolidated Financial Statements for projectedweighted-average default rates and loss severities forrecent vintages of Alt-A, subprime and prime RMBS.If actual delinquencies, default rates and loss severityassumptions worsen, we would expect additionalimpairment losses to be recorded in future periods.
Net investment securities losses in 2009 were $5.4billion. These losses reflect both credit and non-credit-related losses on our investment securities portfolio,including securities for which we declared our intentto sell or restructure. If we were to increase ordecrease each of our loss severity and projecteddefault rates by 100 basis points on each of thepositions in our Alt-A, subprime and prime RMBSportfolios and the securities portfolio held by theGrantor Trust, credit-related impairment charges onthese securities would have increased by $3 million(pre-tax) or decreased by $1 million (pre-tax) in 2009.
In addition, we assess OTTI for an appropriate subsetof our investment securities subject to guidanceincluded in ASC 325 – Investments – Other by testingfor an adverse change in cash flows. Any unrealizedloss on a security identified as other-than-temporarilyimpaired under ASC 325 analysis is charged toearnings.
Upon acquisition of a security, BNY Mellon decideswhether it is within the scope of ASC 325 or if it willbe evaluated for impairment under ASC 320.Subsequently, if the security is downgraded, we donot alter this decision.
ASC 325 is an interpretation of ASC 320 for certaindebt securities which are beneficial interests insecuritized financial assets. Specifically, ASC 325provides incremental impairment guidance for asubset of the debt securities within the scope of ASC320. For securities where there is no debt rating atacquisition, and the security is a beneficial interest insecuritized financial assets, we use the ASC 325impairment model. For securities where there is nodebt rating at acquisition and the security is not abeneficial interest in securitized financial assets weuse the ASC 320 impairment model.
Goodwill and other intangibles
We record all assets and liabilities acquired inpurchase acquisitions, including goodwill, indefinite-lived intangibles and other intangibles, at fair value asrequired by ASC 805 Business Combinations andASC 350 Intangibles – Goodwill and Other. Theinitial recording of goodwill and intangibles requiressubjective judgments concerning estimates of the fairvalue of the acquired assets and liabilities. Goodwill($16.2 billion at Dec. 31, 2009) and indefinite-livedintangible assets ($2.7 billion at Dec. 31, 2009) arenot amortized but are subject to tests for impairmentannually or more often if events or circumstancesindicate they may be impaired. Other intangible assetsare amortized over their estimated useful lives and aresubject to impairment if events or circumstancesindicate a possible inability to realize the carryingamount.
BNY Mellon’s business segments are the reportingunits for which annual goodwill impairment testing isdone in accordance with ASC 350. The goodwillimpairment test is performed in two steps. The firststep compares the estimated fair value of the segmentwith its carrying amount, including goodwill. If theestimated fair value of the segment exceeds itscarrying amount, goodwill of the segment isconsidered not impaired. However, if the carryingamount of the segment exceeds its estimated fairvalue, a second step would be performed that wouldcompare the implied fair value of the segment’sgoodwill with the carrying amount of that goodwill.An impairment loss would be recorded to the extentthat the carrying amount of goodwill exceeds itsimplied fair value.
42 BNY Mellon
Results of Operations (continued)
Fair value may be determined using market prices,comparison to similar assets, market multiples,discounted cash flow analysis and other determinants.Estimated cash flows extend far into the future and, bytheir nature, are difficult to estimate over such anextended time-frame. Factors that may significantlyaffect the estimates include, among others,competitive forces, customer behaviors and attrition,changes in revenue growth trends, cost structures andtechnology, changes in discount rates, and specificindustry or market sector conditions.
The carrying amount of goodwill in each of our sixsegments in continuing operations was tested in 2008and 2009 using observable market data whenavailable to estimate fair values. In addition, materialevents and circumstances that might be indicators ofpossible impairment were assessed during interimperiods. These included the changing businessclimate, regulatory and legal factors, recoverability oflong-lived assets, changes in our competitors, and theearnings outlook for our segments. BNY Mellon’smarket capitalization exceeded its net book value atthe end of each quarter of 2008 and 2009.
The fair values of the Asset Management and WealthManagement segments are largely impacted bymanagement and performance fees from AUM. Dueto lower stock market values in early 2009, AUM haddeclined slightly from 2008 and there were fewer saletransactions of comparable public businesses. Whilemanagement takes responsibility for its financialstatements and the underlying fair value estimates, weengaged an independent business valuation specialistin early 2009 to estimate the fair values of these twosegments. Their valuations incorporated both incomeand market based analyses and indicated fair valuesmore than 15% greater than their respective carryingamounts. The AUM in the fourth quarter of 2009 was20% greater than the fourth quarter of 2008 and therewere no factors of potential impairment, so additionalinterim testing was not necessary.
The fair values of our other four segments wereestimated for the 2009 test using discounted cash flowanalyses since there were few comparable publiccompany transactions in 2009. These incorporated ourforecasts and longer term earnings growth estimatesby segment and discount rates ranging from 11.5% to15.5% that incorporated measured stock pricevolatilities of the segments’ principal public companycompetitors and a 6.5% average excess return overrisk-free rates. The estimated fair values of each ofthese four segments was substantially in excess of
carrying amounts, as they had been in prior yearimpairment tests.
In the second quarter of 2009, we wrote off theremaining goodwill and intangibles in MUNB, whichwas carried in discontinued operations since 2008when we decided to exit this banking subsidiary inFlorida, when BNY Mellon committed to sell it at aprice less than its carrying amount. The sale ofMUNB was completed on Jan 15, 2010.
Goodwill and intangible assets could be subject toimpairment in future periods if economic conditionsthat impact our segments worsen. Impairment wouldbe a non-cash charge.
Indefinite-lived intangible assets are evaluated forimpairment at least annually by comparing their fairvalues, estimated using discounted cash flow analyses,to their carrying values. Other intangible assets ($2.9billion at Dec. 31, 2009) are evaluated for impairmentif events and circumstances indicate a possibleimpairment. Such evaluation of other intangible assetsis initially based on undiscounted cash flowprojections.
Other key judgments in accounting for intangiblesinclude useful life and classification between goodwilland indefinite-lived intangibles or other intangibleswhich require amortization. See Note 7 of the Notes toConsolidated Financial Statements for additionalinformation regarding intangible assets. At Dec. 31,2009, we had $21.8 billion of goodwill, indefinite-lived intangibles, and other intangible assets.
Pension accounting
BNY Mellon has defined benefit pension planscovering approximately 26,000 U.S. employees andapproximately 2,000 non-U.S. employees.
BNY Mellon has two qualified and severalnon-qualified defined benefit pension plans in theU.S. and eight overseas. As of Dec. 31, 2009, the U.S.plans accounted for 84% of the projected benefitobligation. The pension credit for BNY Mellon planswas $17 million in 2009, compared with $20 millionin 2008 and $4 million in 2007 (which includes sixmonths of BNY Mellon and six months of legacyThe Bank of New York Company, Inc. only).
The Retirement Plan of The Bank of New YorkCompany, Inc. and the Mellon Bank Retirement Planwere merged into The Bank of New York Mellon
BNY Mellon 43

Results of Operations (continued)
Corporation Pension Plan effective Dec. 31, 2008.The merger resulted in an additional pension credit of$6 million in 2009.
In addition to its pension plans, BNY Mellon has anEmployee Stock Ownership Plan (“ESOP”). Benefitspayable under The Bank of New York MellonCorporation Pension Plan are offset by the equivalentvalue of benefits earned under the ESOP foremployees who participated in the legacy RetirementPlan of the Bank of New York Company, Inc.
A net pension expense of approximately $48 millionis expected to be recorded by BNY Mellon in 2010,assuming currency exchange rates at Dec. 31, 2009.
Effective Jan. 1, 2009, the U.S. pension plans wereamended to change the benefit formula forparticipants under age 50 as of Dec. 31, 2008 and fornew participants to a cash balance formula for serviceearned on and after Jan. 1, 2009. This change wasmade to unify the future benefits earned by theemployees of the legacy organizations and resulted inan additional pension credit of $3 million in 2009.Plan participants who were age 50 or older as ofDec. 31, 2008 will continue to earn benefits under theformula of the legacy plan in which they participatedas of that date.
BNY Mellon made a discretionary contribution of$300 million to The Bank of New York MellonCorporation Pension Plan during 2009. Pensionexpense was re-measured to reflect this contributionresulting in an additional pension credit of $4 millionin 2009.
A number of key assumption and measurement datevalues determine pension expense. The key elementsinclude the long-term rate of return on plan assets, thediscount rate, the market-related value of plan assets,and the price used to value stock in the ESOP.
Since 2007, these key elements have varied asfollows:
(dollars in millions, except pershare amounts) 2010 2009 2008 2007
Domestic plans:Long-term rate of return on
plan assets 8.00% 8.00% 8.00% 8.00%Discount rate 6.21 6.38 6.38 6.00Market-related value of
plan assets (a) $3,860 $3,651 $3,706 $1,352ESOP stock price (a) 27.97 33.12 47.15 34.85
Net U.S. pension credit/(expense) N/A $ 32 $ 39 $ 16 (b)
All other net pension credit/(expense) N/A (15) (19) (12) (c)
Total net pension credit/(expense) N/A $ 17 $ 20 $ 4
(a) Market-related value of plan assets and ESOP stock priceare for the beginning of the plan year. See “Summary ofSignificant Accounting and Reporting Policies” in Note 1 ofthe Notes to Consolidated Financial Statements.
(b) Includes a $21 million credit for legacy Mellon Financialplans based on a discount rate of 6.25% as of July 1, 2007,and a long-term rate of return on plan assets of 8.25%.
(c) Includes $4 million of expense for legacy Mellon Financial’sforeign plans.
The discount rate for U.S. pension plans wasdetermined after reviewing equivalent rates obtainedby discounting the pension plans’ expected cash flowsusing various high quality long-term corporate bondyield curves. We also reviewed the results of severalmodels that matched bonds to our pension cash flows.After reviewing the various indices and models, weselected a discount rate of 6.21% as of Dec. 31, 2009.
The discount rates for foreign pension plans are basedon high quality corporate bond rates in countries thathave an active corporate bond market. In thosecountries with no active corporate bond market,discount rates are based on local government bondrates plus a credit spread.
Our expected long-term rate of return on plan assets isbased on anticipated returns for each applicable assetclass. Anticipated returns are weighted for theexpected allocation for each asset class. Anticipatedreturns are based on forecasts for prospective returnsin the equity and fixed income markets, which shouldtrack the long-term historical returns for thesemarkets.
We also consider the growth outlook for U.S. andglobal economies, as well as current and prospectiveinterest rates.
44 BNY Mellon
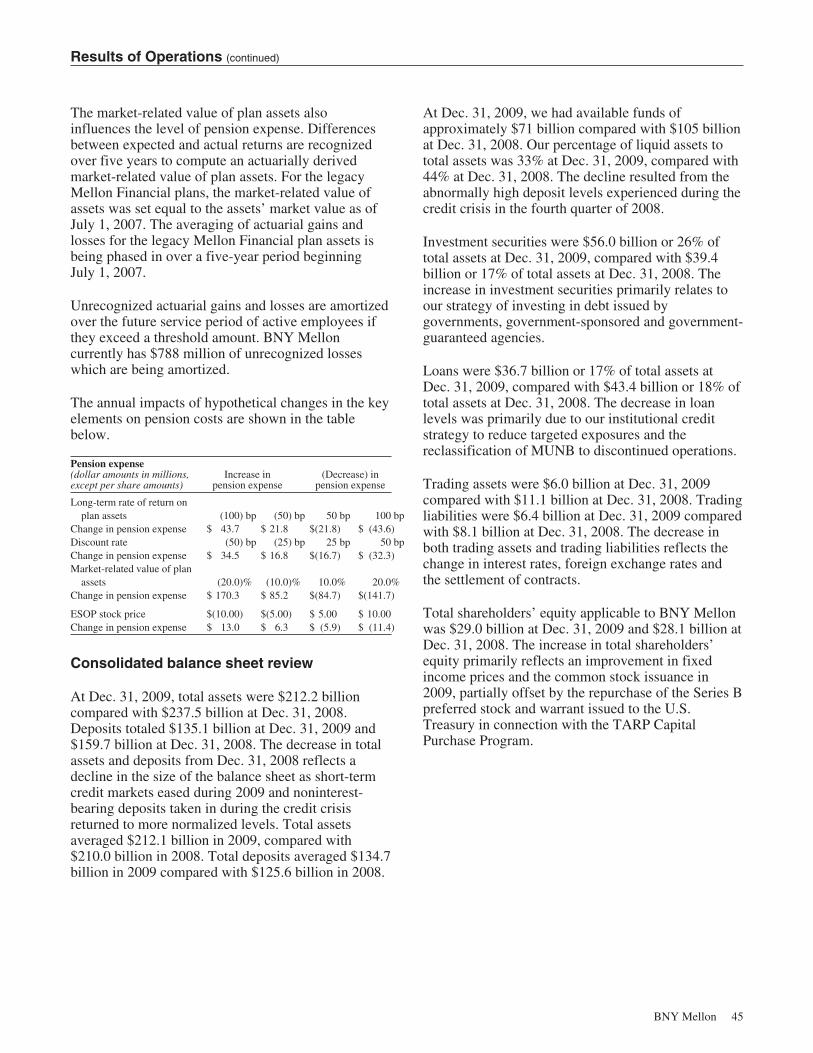
Results of Operations (continued)
The market-related value of plan assets alsoinfluences the level of pension expense. Differencesbetween expected and actual returns are recognizedover five years to compute an actuarially derivedmarket-related value of plan assets. For the legacyMellon Financial plans, the market-related value ofassets was set equal to the assets’ market value as ofJuly 1, 2007. The averaging of actuarial gains andlosses for the legacy Mellon Financial plan assets isbeing phased in over a five-year period beginningJuly 1, 2007.
Unrecognized actuarial gains and losses are amortizedover the future service period of active employees ifthey exceed a threshold amount. BNY Melloncurrently has $788 million of unrecognized losseswhich are being amortized.
The annual impacts of hypothetical changes in the keyelements on pension costs are shown in the tablebelow.
Pension expense(dollar amounts in millions,except per share amounts)
Increase inpension expense
(Decrease) inpension expense
Long-term rate of return onplan assets (100) bp (50) bp 50 bp 100 bp
Change in pension expense $ 43.7 $ 21.8 $(21.8) $ (43.6)Discount rate (50) bp (25) bp 25 bp 50 bpChange in pension expense $ 34.5 $ 16.8 $(16.7) $ (32.3)Market-related value of plan
assets (20.0)% (10.0)% 10.0% 20.0%Change in pension expense $ 170.3 $ 85.2 $(84.7) $(141.7)
ESOP stock price $(10.00) $(5.00) $ 5.00 $ 10.00Change in pension expense $ 13.0 $ 6.3 $ (5.9) $ (11.4)
Consolidated balance sheet review
At Dec. 31, 2009, total assets were $212.2 billioncompared with $237.5 billion at Dec. 31, 2008.Deposits totaled $135.1 billion at Dec. 31, 2009 and$159.7 billion at Dec. 31, 2008. The decrease in totalassets and deposits from Dec. 31, 2008 reflects adecline in the size of the balance sheet as short-termcredit markets eased during 2009 and noninterest-bearing deposits taken in during the credit crisisreturned to more normalized levels. Total assetsaveraged $212.1 billion in 2009, compared with$210.0 billion in 2008. Total deposits averaged $134.7billion in 2009 compared with $125.6 billion in 2008.
At Dec. 31, 2009, we had available funds ofapproximately $71 billion compared with $105 billionat Dec. 31, 2008. Our percentage of liquid assets tototal assets was 33% at Dec. 31, 2009, compared with44% at Dec. 31, 2008. The decline resulted from theabnormally high deposit levels experienced during thecredit crisis in the fourth quarter of 2008.
Investment securities were $56.0 billion or 26% oftotal assets at Dec. 31, 2009, compared with $39.4billion or 17% of total assets at Dec. 31, 2008. Theincrease in investment securities primarily relates toour strategy of investing in debt issued bygovernments, government-sponsored and government-guaranteed agencies.
Loans were $36.7 billion or 17% of total assets atDec. 31, 2009, compared with $43.4 billion or 18% oftotal assets at Dec. 31, 2008. The decrease in loanlevels was primarily due to our institutional creditstrategy to reduce targeted exposures and thereclassification of MUNB to discontinued operations.
Trading assets were $6.0 billion at Dec. 31, 2009compared with $11.1 billion at Dec. 31, 2008. Tradingliabilities were $6.4 billion at Dec. 31, 2009 comparedwith $8.1 billion at Dec. 31, 2008. The decrease inboth trading assets and trading liabilities reflects thechange in interest rates, foreign exchange rates andthe settlement of contracts.
Total shareholders’ equity applicable to BNY Mellonwas $29.0 billion at Dec. 31, 2009 and $28.1 billion atDec. 31, 2008. The increase in total shareholders’equity primarily reflects an improvement in fixedincome prices and the common stock issuance in2009, partially offset by the repurchase of the Series Bpreferred stock and warrant issued to the U.S.Treasury in connection with the TARP CapitalPurchase Program.
BNY Mellon 45
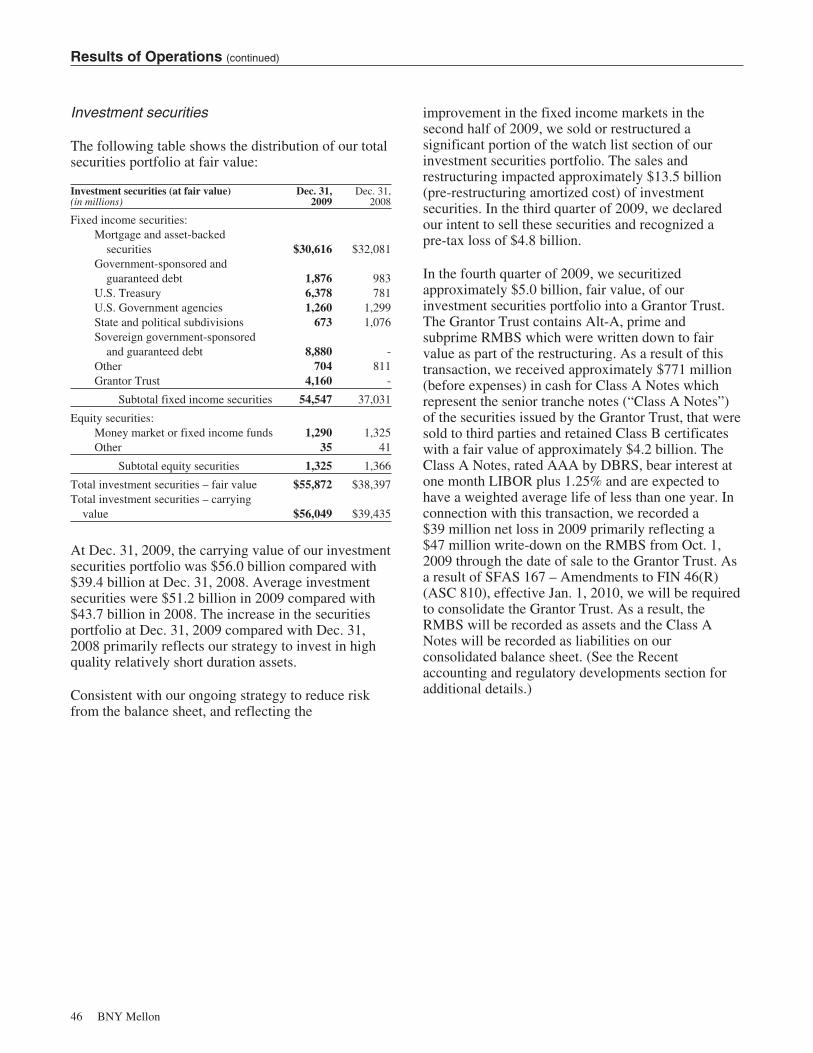
Results of Operations (continued)
Investment securities
The following table shows the distribution of our totalsecurities portfolio at fair value:
Investment securities (at fair value)(in millions)
Dec. 31,2009
Dec. 31,2008
Fixed income securities:Mortgage and asset-backed
securities $30,616 $32,081Government-sponsored and
guaranteed debt 1,876 983U.S. Treasury 6,378 781U.S. Government agencies 1,260 1,299State and political subdivisions 673 1,076Sovereign government-sponsored
and guaranteed debt 8,880 -Other 704 811Grantor Trust 4,160 -
Subtotal fixed income securities 54,547 37,031
Equity securities:Money market or fixed income funds 1,290 1,325Other 35 41
Subtotal equity securities 1,325 1,366
Total investment securities – fair value $55,872 $38,397Total investment securities – carrying
value $56,049 $39,435
At Dec. 31, 2009, the carrying value of our investmentsecurities portfolio was $56.0 billion compared with$39.4 billion at Dec. 31, 2008. Average investmentsecurities were $51.2 billion in 2009 compared with$43.7 billion in 2008. The increase in the securitiesportfolio at Dec. 31, 2009 compared with Dec. 31,2008 primarily reflects our strategy to invest in highquality relatively short duration assets.
Consistent with our ongoing strategy to reduce riskfrom the balance sheet, and reflecting the
improvement in the fixed income markets in thesecond half of 2009, we sold or restructured asignificant portion of the watch list section of ourinvestment securities portfolio. The sales andrestructuring impacted approximately $13.5 billion(pre-restructuring amortized cost) of investmentsecurities. In the third quarter of 2009, we declaredour intent to sell these securities and recognized apre-tax loss of $4.8 billion.
In the fourth quarter of 2009, we securitizedapproximately $5.0 billion, fair value, of ourinvestment securities portfolio into a Grantor Trust.The Grantor Trust contains Alt-A, prime andsubprime RMBS which were written down to fairvalue as part of the restructuring. As a result of thistransaction, we received approximately $771 million(before expenses) in cash for Class A Notes whichrepresent the senior tranche notes (“Class A Notes”)of the securities issued by the Grantor Trust, that weresold to third parties and retained Class B certificateswith a fair value of approximately $4.2 billion. TheClass A Notes, rated AAA by DBRS, bear interest atone month LIBOR plus 1.25% and are expected tohave a weighted average life of less than one year. Inconnection with this transaction, we recorded a$39 million net loss in 2009 primarily reflecting a$47 million write-down on the RMBS from Oct. 1,2009 through the date of sale to the Grantor Trust. Asa result of SFAS 167 – Amendments to FIN 46(R)(ASC 810), effective Jan. 1, 2010, we will be requiredto consolidate the Grantor Trust. As a result, theRMBS will be recorded as assets and the Class ANotes will be recorded as liabilities on ourconsolidated balance sheet. (See the Recentaccounting and regulatory developments section foradditional details.)
46 BNY Mellon

Results of Operations (continued)
The following table provides a rollforward of the investment securities portfolio from Dec. 31, 2008 to Dec. 31,2009.
Investment securities portfolio rollforward of2009 activity
(dollar amounts in millions)
Amortizedcost at
12/31/08
Paydowns/accretion/
other Purchases Restructuring
Proceedsfromsales
Netsecurities
gain/(loss)
ASC 320reversal (c)
Amortizedcost at
12/31/09
Watch list:European floating rate notes (b) $ 7,582 $ (364) $ - $ - $ (767) $ (269) $ - $ 6,182Commercial MBS 2,846 (67) - - (291) (89) - 2,399Prime RMBS 6,725 (1,642) - (2,069) (86) (1,008) 12 1,932Alt-A RMBS 7,499 (996) - (2,603) (949) (3,113) 1,054 892Subprime RMBS 1,578 (131) - (128) (222) (322) 13 788Credit cards 747 (73) - - (22) (26) - 626Home equity lines of credit 558 (97) - - (279) (205) 23 -Other 717 (10) 115 - (92) (298) 44 476
Total Watch list 28,252 (3,380) 115 (4,800) (2,708) (5,330) 1,146 13,295Grantor Trust Class B certificates - 45 - 4,814 (771) (39) (a) - 4,049Agency MBS 11,561 (4,252) 11,469 - - - - 18,778Sovereign debt/sovereign guaranteed - 403 8,342 - - - - 8,745U.S. Treasury 746 (212) 5,824 - - - - 6,358FDIC-insured debt 949 1 1,013 - - - - 1,963U.S. Government agencies 1,259 (24) - - - - - 1,235Other 3,244 (1,920) 1,669 - (496) - - 2,497
Total investment securities $46,011 $(9,339) $28,432 $ 14 $(3,975) $(5,369) $1,146 $56,920
(a) Includes $47 million of mark-to-market write-downs on the Alt-A, prime and subprime securities from Oct. 1, 2009 through the date ofsale to the Grantor Trust.
(b) Includes commercial MBS, RMBS and other securities.(c) Reversal of the non-credit component of OTTI recorded in 2008 under previous accounting guidance.
Investment securities portfolio Dec. 31, 2009
(dollar amounts in millions)Amortized
costFair
value
Fair valueas a % of
amortizedcost (a)
Unrealizedgain/(loss)
Ratings
AAA/AA-
A+/A-
BBB+/BBB-
BB+ andlower
Notrated
Watch list:European floating rate notes $ 6,182 $ 5,503 88% $ (679) 97% 3% -% -% -%Commercial MBS 2,399 2,302 96 (97) 93 4 3 - -Prime RMBS 1,932 1,684 86 (248) 60 23 5 12 -Alt-A RMBS 892 779 67 (113) 27 15 1 57 -Subprime RMBS 788 470 60 (318) 75 14 5 6 -Credit cards 626 610 95 (16) 1 98 1 - -Other 476 465 56 (11) - - 16 76 8
Total Watch list (b) 13,295 11,813 84 (1,482) 77 12 2 9 -Grantor Trust Class B certificates 4,049 4,160 60 111 - - - - 100Agency MBS 18,778 19,016 99 238 100 - - - -Sovereign debt/sovereign guaranteed 8,745 8,753 100 8 100 - - - -U.S. Treasury 6,358 6,378 100 20 100 - - - -FDIC-insured debt 1,963 2,003 98 40 100 - - - -U.S. Government agencies 1,235 1,260 98 25 100 - - - -Other 2,497 2,489 100 (8) 69 11 7 1 12
Total investment securities $56,920 $55,872 92% $(1,048) 86% 3% 1% 2% 8%
(a) Amortized cost before impairments(b) The “Watch list” includes those securities we view as having a higher risk of impairment charges.
BNY Mellon 47
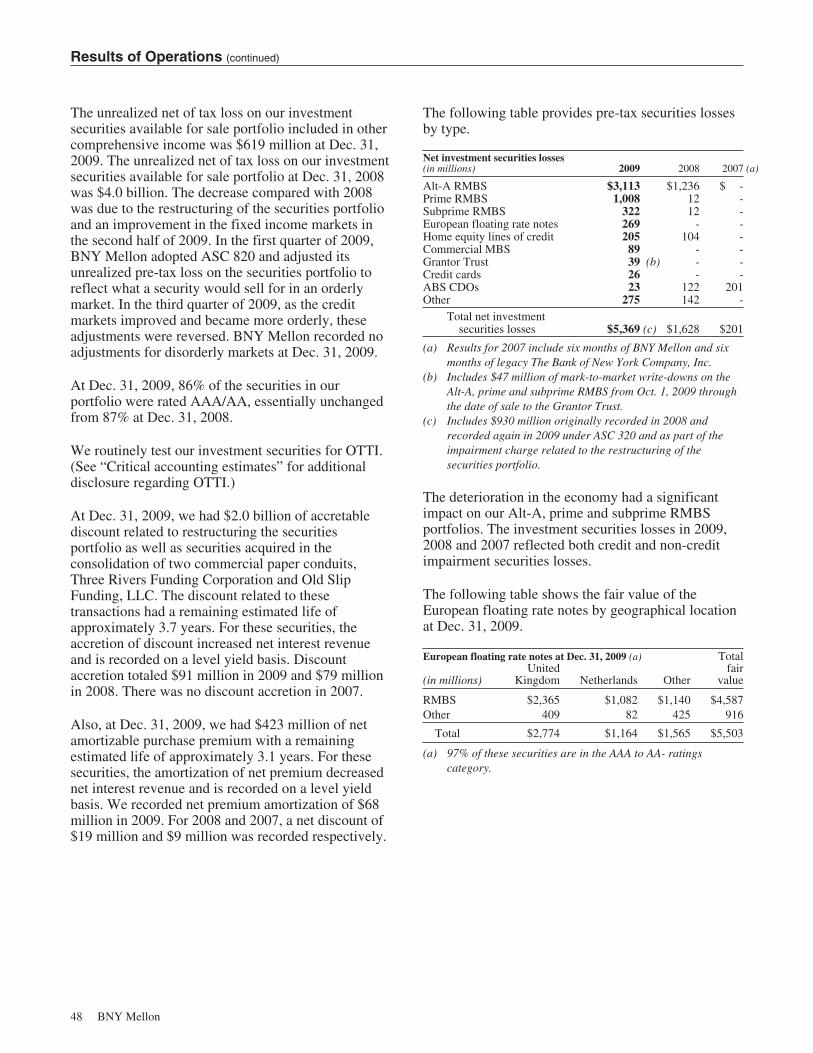
Results of Operations (continued)
The unrealized net of tax loss on our investmentsecurities available for sale portfolio included in othercomprehensive income was $619 million at Dec. 31,2009. The unrealized net of tax loss on our investmentsecurities available for sale portfolio at Dec. 31, 2008was $4.0 billion. The decrease compared with 2008was due to the restructuring of the securities portfolioand an improvement in the fixed income markets inthe second half of 2009. In the first quarter of 2009,BNY Mellon adopted ASC 820 and adjusted itsunrealized pre-tax loss on the securities portfolio toreflect what a security would sell for in an orderlymarket. In the third quarter of 2009, as the creditmarkets improved and became more orderly, theseadjustments were reversed. BNY Mellon recorded noadjustments for disorderly markets at Dec. 31, 2009.
At Dec. 31, 2009, 86% of the securities in ourportfolio were rated AAA/AA, essentially unchangedfrom 87% at Dec. 31, 2008.
We routinely test our investment securities for OTTI.(See “Critical accounting estimates” for additionaldisclosure regarding OTTI.)
At Dec. 31, 2009, we had $2.0 billion of accretablediscount related to restructuring the securitiesportfolio as well as securities acquired in theconsolidation of two commercial paper conduits,Three Rivers Funding Corporation and Old SlipFunding, LLC. The discount related to thesetransactions had a remaining estimated life ofapproximately 3.7 years. For these securities, theaccretion of discount increased net interest revenueand is recorded on a level yield basis. Discountaccretion totaled $91 million in 2009 and $79 millionin 2008. There was no discount accretion in 2007.
Also, at Dec. 31, 2009, we had $423 million of netamortizable purchase premium with a remainingestimated life of approximately 3.1 years. For thesesecurities, the amortization of net premium decreasednet interest revenue and is recorded on a level yieldbasis. We recorded net premium amortization of $68million in 2009. For 2008 and 2007, a net discount of$19 million and $9 million was recorded respectively.
The following table provides pre-tax securities lossesby type.
Net investment securities losses(in millions) 2009 2008 2007 (a)
Alt-A RMBS $3,113 $1,236 $ -Prime RMBS 1,008 12 -Subprime RMBS 322 12 -European floating rate notes 269 - -Home equity lines of credit 205 104 -Commercial MBS 89 - -Grantor Trust 39 (b) - -Credit cards 26 - -ABS CDOs 23 122 201Other 275 142 -
Total net investmentsecurities losses $5,369 (c) $1,628 $201
(a) Results for 2007 include six months of BNY Mellon and sixmonths of legacy The Bank of New York Company, Inc.
(b) Includes $47 million of mark-to-market write-downs on theAlt-A, prime and subprime RMBS from Oct. 1, 2009 throughthe date of sale to the Grantor Trust.
(c) Includes $930 million originally recorded in 2008 andrecorded again in 2009 under ASC 320 and as part of theimpairment charge related to the restructuring of thesecurities portfolio.
The deterioration in the economy had a significantimpact on our Alt-A, prime and subprime RMBSportfolios. The investment securities losses in 2009,2008 and 2007 reflected both credit and non-creditimpairment securities losses.
The following table shows the fair value of theEuropean floating rate notes by geographical locationat Dec. 31, 2009.
European floating rate notes at Dec. 31, 2009 (a) Total
(in millions)United
Kingdom Netherlands Otherfair
value
RMBS $2,365 $1,082 $1,140 $4,587Other 409 82 425 916
Total $2,774 $1,164 $1,565 $5,503
(a) 97% of these securities are in the AAA to AA- ratingscategory.
48 BNY Mellon
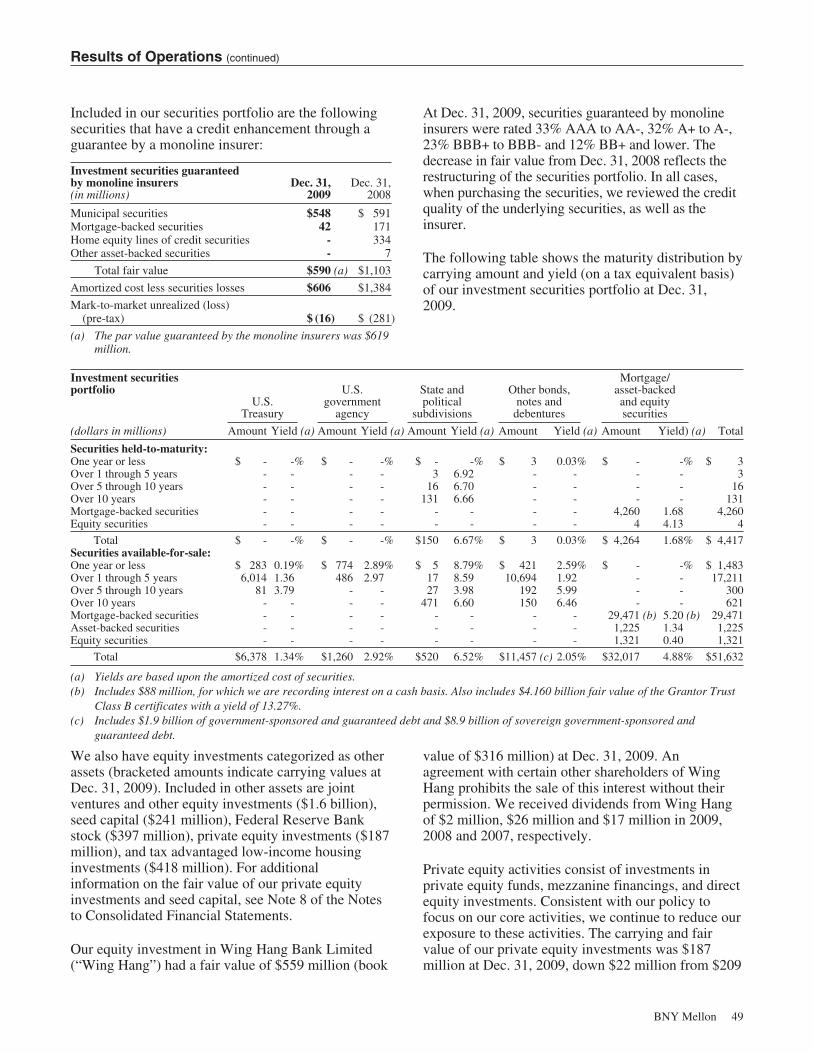
Results of Operations (continued)
Included in our securities portfolio are the followingsecurities that have a credit enhancement through aguarantee by a monoline insurer:
Investment securities guaranteedby monoline insurers(in millions)
Dec. 31,2009
Dec. 31,2008
Municipal securities $548 $ 591Mortgage-backed securities 42 171Home equity lines of credit securities - 334Other asset-backed securities - 7
Total fair value $590 (a) $1,103
Amortized cost less securities losses $606 $1,384
Mark-to-market unrealized (loss)(pre-tax) $ (16) $ (281)
(a) The par value guaranteed by the monoline insurers was $619million.
At Dec. 31, 2009, securities guaranteed by monolineinsurers were rated 33% AAA to AA-, 32% A+ to A-,23% BBB+ to BBB- and 12% BB+ and lower. Thedecrease in fair value from Dec. 31, 2008 reflects therestructuring of the securities portfolio. In all cases,when purchasing the securities, we reviewed the creditquality of the underlying securities, as well as theinsurer.
The following table shows the maturity distribution bycarrying amount and yield (on a tax equivalent basis)of our investment securities portfolio at Dec. 31,2009.
Investment securitiesportfolio
U.S.Treasury
U.S.government
agency
State andpolitical
subdivisions
Other bonds,notes and
debentures
Mortgage/asset-backedand equitysecurities
(dollars in millions) Amount Yield (a) Amount Yield (a) Amount Yield (a) Amount Yield (a) Amount Yield) (a) Total
Securities held-to-maturity:One year or less $ - -% $ - -% $ - -% $ 3 0.03% $ - -% $ 3Over 1 through 5 years - - - - 3 6.92 - - - - 3Over 5 through 10 years - - - - 16 6.70 - - - - 16Over 10 years - - - - 131 6.66 - - - - 131Mortgage-backed securities - - - - - - - - 4,260 1.68 4,260Equity securities - - - - - - - - 4 4.13 4
Total $ - -% $ - -% $150 6.67% $ 3 0.03% $ 4,264 1.68% $ 4,417Securities available-for-sale:One year or less $ 283 0.19% $ 774 2.89% $ 5 8.79% $ 421 2.59% $ - -% $ 1,483Over 1 through 5 years 6,014 1.36 486 2.97 17 8.59 10,694 1.92 - - 17,211Over 5 through 10 years 81 3.79 - - 27 3.98 192 5.99 - - 300Over 10 years - - - - 471 6.60 150 6.46 - - 621Mortgage-backed securities - - - - - - - - 29,471 (b) 5.20 (b) 29,471Asset-backed securities - - - - - - - - 1,225 1.34 1,225Equity securities - - - - - - - - 1,321 0.40 1,321
Total $6,378 1.34% $1,260 2.92% $520 6.52% $11,457 (c) 2.05% $32,017 4.88% $51,632
(a) Yields are based upon the amortized cost of securities.(b) Includes $88 million, for which we are recording interest on a cash basis. Also includes $4.160 billion fair value of the Grantor Trust
Class B certificates with a yield of 13.27%.(c) Includes $1.9 billion of government-sponsored and guaranteed debt and $8.9 billion of sovereign government-sponsored and
guaranteed debt.
We also have equity investments categorized as otherassets (bracketed amounts indicate carrying values atDec. 31, 2009). Included in other assets are jointventures and other equity investments ($1.6 billion),seed capital ($241 million), Federal Reserve Bankstock ($397 million), private equity investments ($187million), and tax advantaged low-income housinginvestments ($418 million). For additionalinformation on the fair value of our private equityinvestments and seed capital, see Note 8 of the Notesto Consolidated Financial Statements.
Our equity investment in Wing Hang Bank Limited(“Wing Hang”) had a fair value of $559 million (book
value of $316 million) at Dec. 31, 2009. Anagreement with certain other shareholders of WingHang prohibits the sale of this interest without theirpermission. We received dividends from Wing Hangof $2 million, $26 million and $17 million in 2009,2008 and 2007, respectively.
Private equity activities consist of investments inprivate equity funds, mezzanine financings, and directequity investments. Consistent with our policy tofocus on our core activities, we continue to reduce ourexposure to these activities. The carrying and fairvalue of our private equity investments was $187million at Dec. 31, 2009, down $22 million from $209
BNY Mellon 49
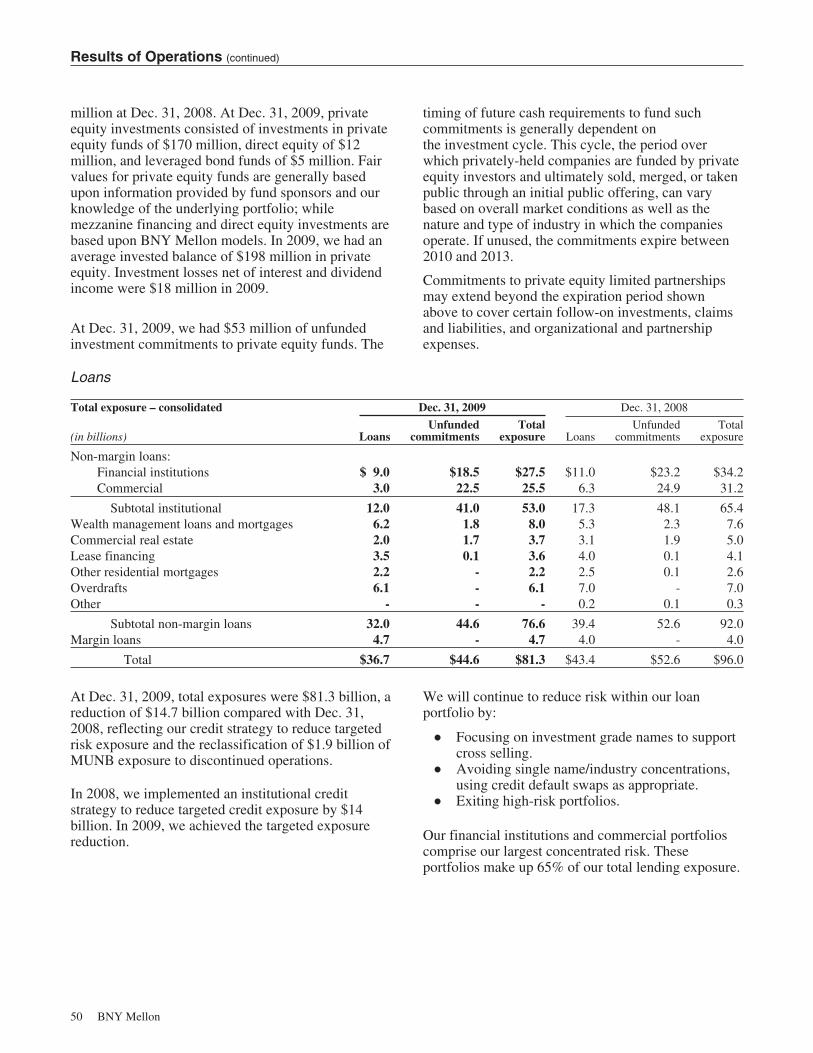
Results of Operations (continued)
million at Dec. 31, 2008. At Dec. 31, 2009, privateequity investments consisted of investments in privateequity funds of $170 million, direct equity of $12million, and leveraged bond funds of $5 million. Fairvalues for private equity funds are generally basedupon information provided by fund sponsors and ourknowledge of the underlying portfolio; whilemezzanine financing and direct equity investments arebased upon BNY Mellon models. In 2009, we had anaverage invested balance of $198 million in privateequity. Investment losses net of interest and dividendincome were $18 million in 2009.
At Dec. 31, 2009, we had $53 million of unfundedinvestment commitments to private equity funds. The
timing of future cash requirements to fund suchcommitments is generally dependent onthe investment cycle. This cycle, the period overwhich privately-held companies are funded by privateequity investors and ultimately sold, merged, or takenpublic through an initial public offering, can varybased on overall market conditions as well as thenature and type of industry in which the companiesoperate. If unused, the commitments expire between2010 and 2013.
Commitments to private equity limited partnershipsmay extend beyond the expiration period shownabove to cover certain follow-on investments, claimsand liabilities, and organizational and partnershipexpenses.
Loans
Total exposure – consolidated Dec. 31, 2009 Dec. 31, 2008
(in billions) LoansUnfunded
commitmentsTotal
exposure LoansUnfunded
commitmentsTotal
exposure
Non-margin loans:Financial institutions $ 9.0 $18.5 $27.5 $11.0 $23.2 $34.2Commercial 3.0 22.5 25.5 6.3 24.9 31.2
Subtotal institutional 12.0 41.0 53.0 17.3 48.1 65.4Wealth management loans and mortgages 6.2 1.8 8.0 5.3 2.3 7.6Commercial real estate 2.0 1.7 3.7 3.1 1.9 5.0Lease financing 3.5 0.1 3.6 4.0 0.1 4.1Other residential mortgages 2.2 - 2.2 2.5 0.1 2.6Overdrafts 6.1 - 6.1 7.0 - 7.0Other - - - 0.2 0.1 0.3
Subtotal non-margin loans 32.0 44.6 76.6 39.4 52.6 92.0Margin loans 4.7 - 4.7 4.0 - 4.0
Total $36.7 $44.6 $81.3 $43.4 $52.6 $96.0
At Dec. 31, 2009, total exposures were $81.3 billion, areduction of $14.7 billion compared with Dec. 31,2008, reflecting our credit strategy to reduce targetedrisk exposure and the reclassification of $1.9 billion ofMUNB exposure to discontinued operations.
In 2008, we implemented an institutional creditstrategy to reduce targeted credit exposure by $14billion. In 2009, we achieved the targeted exposurereduction.
We will continue to reduce risk within our loanportfolio by:
Š Focusing on investment grade names to supportcross selling.
Š Avoiding single name/industry concentrations,using credit default swaps as appropriate.
Š Exiting high-risk portfolios.
Our financial institutions and commercial portfolioscomprise our largest concentrated risk. Theseportfolios make up 65% of our total lending exposure.
50 BNY Mellon
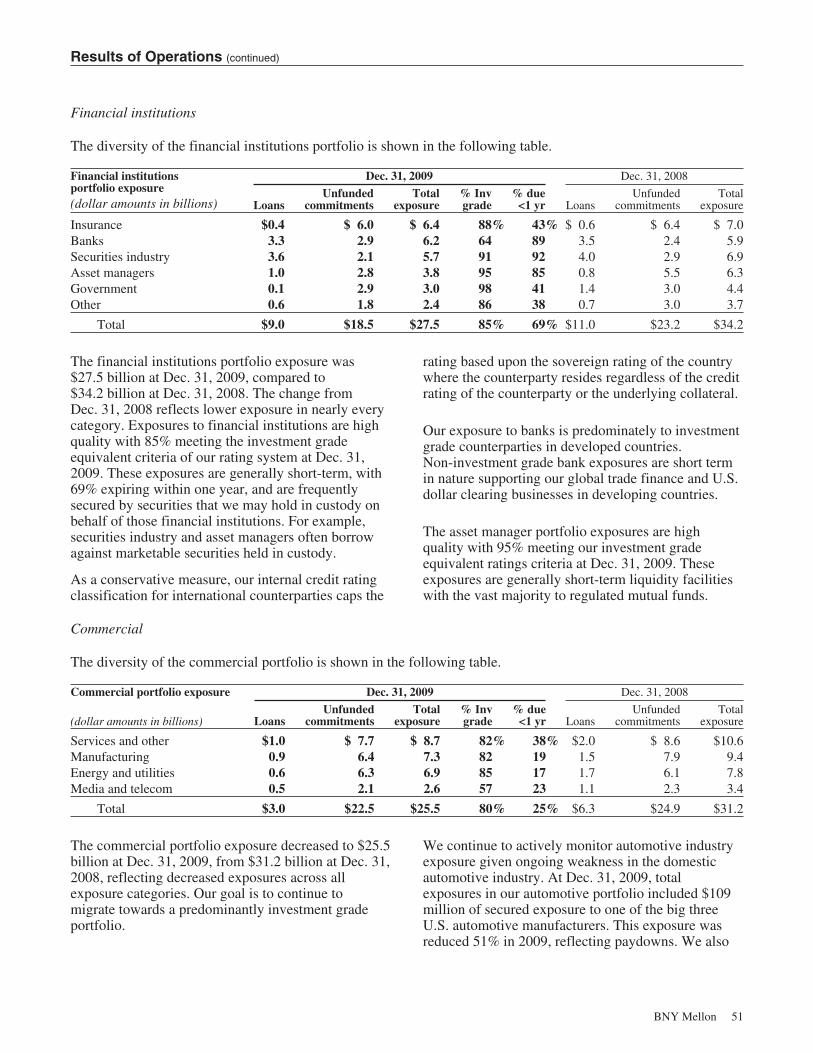
Results of Operations (continued)
Financial institutions
The diversity of the financial institutions portfolio is shown in the following table.
Financial institutionsportfolio exposure(dollar amounts in billions)
Dec. 31, 2009 Dec. 31, 2008
LoansUnfunded
commitmentsTotal
exposure% Invgrade
% due<1 yr Loans
Unfundedcommitments
Totalexposure
Insurance $0.4 $ 6.0 $ 6.4 88% 43% $ 0.6 $ 6.4 $ 7.0Banks 3.3 2.9 6.2 64 89 3.5 2.4 5.9Securities industry 3.6 2.1 5.7 91 92 4.0 2.9 6.9Asset managers 1.0 2.8 3.8 95 85 0.8 5.5 6.3Government 0.1 2.9 3.0 98 41 1.4 3.0 4.4Other 0.6 1.8 2.4 86 38 0.7 3.0 3.7
Total $9.0 $18.5 $27.5 85% 69% $11.0 $23.2 $34.2
The financial institutions portfolio exposure was$27.5 billion at Dec. 31, 2009, compared to$34.2 billion at Dec. 31, 2008. The change fromDec. 31, 2008 reflects lower exposure in nearly everycategory. Exposures to financial institutions are highquality with 85% meeting the investment gradeequivalent criteria of our rating system at Dec. 31,2009. These exposures are generally short-term, with69% expiring within one year, and are frequentlysecured by securities that we may hold in custody onbehalf of those financial institutions. For example,securities industry and asset managers often borrowagainst marketable securities held in custody.
As a conservative measure, our internal credit ratingclassification for international counterparties caps the
rating based upon the sovereign rating of the countrywhere the counterparty resides regardless of the creditrating of the counterparty or the underlying collateral.
Our exposure to banks is predominately to investmentgrade counterparties in developed countries.Non-investment grade bank exposures are short termin nature supporting our global trade finance and U.S.dollar clearing businesses in developing countries.
The asset manager portfolio exposures are highquality with 95% meeting our investment gradeequivalent ratings criteria at Dec. 31, 2009. Theseexposures are generally short-term liquidity facilitieswith the vast majority to regulated mutual funds.
Commercial
The diversity of the commercial portfolio is shown in the following table.
Commercial portfolio exposure Dec. 31, 2009 Dec. 31, 2008
(dollar amounts in billions) LoansUnfunded
commitmentsTotal
exposure% Invgrade
% due<1 yr Loans
Unfundedcommitments
Totalexposure
Services and other $1.0 $ 7.7 $ 8.7 82% 38% $2.0 $ 8.6 $10.6Manufacturing 0.9 6.4 7.3 82 19 1.5 7.9 9.4Energy and utilities 0.6 6.3 6.9 85 17 1.7 6.1 7.8Media and telecom 0.5 2.1 2.6 57 23 1.1 2.3 3.4
Total $3.0 $22.5 $25.5 80% 25% $6.3 $24.9 $31.2
The commercial portfolio exposure decreased to $25.5billion at Dec. 31, 2009, from $31.2 billion at Dec. 31,2008, reflecting decreased exposures across allexposure categories. Our goal is to continue tomigrate towards a predominantly investment gradeportfolio.
We continue to actively monitor automotive industryexposure given ongoing weakness in the domesticautomotive industry. At Dec. 31, 2009, totalexposures in our automotive portfolio included $109million of secured exposure to one of the big threeU.S. automotive manufacturers. This exposure wasreduced 51% in 2009, reflecting paydowns. We also
BNY Mellon 51
Results of Operations (continued)
had $81 million of exposure to four automotivesuppliers at Dec. 31, 2009. This exposure hasdecreased 52% from Dec. 31, 2008, as a result ofpaydowns and loan sales.
The table below summarizes the percent of thefinancial institutions and commercial exposures thatare investment grade for the previous three years.
Percent of the portfolios Dec. 31, Dec. 31, Dec. 31,that are investment grade 2009 2008 2007
Financial institutions 85% 90% 88%Commercial 80% 80% 82%
Wealth management loans and mortgages
Wealth Management loans and mortgages areprimarily composed of loans to high-net-worthindividuals, which are secured by residential propertyand marketable securities. Wealth managementmortgages are primarily interest-only adjustable ratemortgages with an average loan to value ratio of 64%at origination. Less than 1% of the mortgages in thewealth management portfolio were past due atDec. 31, 2009. The increase in total wealthmanagement loans and mortgages in 2009 primarilyrelates to increased mortgage activity.
At Dec. 31, 2009, the private wealth mortgageportfolio was comprised of the following geographicconcentrations: New York – 22%; Massachusetts –17%; California – 17%; Florida – 9%; and other –35%.
Commercial real estate
Real estate facilities are focused on experiencedowners and are structured with moderate leveragebased on existing cash flows. Our commercial realestate lending activities include both constructionfacilities and medium-term loans. Our client baseconsists of experienced developers and long-termholders of real estate assets. Loans are approved onthe basis of existing or projected cash flow, andsupported by appraisals and a knowledge of localmarket conditions. Development loans are structuredwith moderate leverage, and in most instances,involve some level of recourse to the developer. Ourcommercial real estate exposure totaled $3.7 billion atDec. 31, 2009 compared with $5.0 billion at Dec. 31,2008. This reduction primarily reflects thereclassification of the commercial real estate portfolioat MUNB to discontinued operations. At Dec. 31,2009, approximately 73% of our commercial real
estate portfolio is secured. The secured portfolio isdiverse by project type with approximately 53%secured by residential buildings, approximately 28%secured by office buildings, approximately 8%secured by retail properties, and approximately 11%secured by other categories. Approximately 94% ofthe unsecured portfolio is allocated to investmentgrade real estate investment trusts (“REITs”) underrevolving credit agreements.
At Dec. 31, 2009, our commercial real estate portfoliois comprised of the following geographicconcentrations: New York metro – 51%; investmentgrade REITs – 28%; and other – 21%.
Lease financings
The leasing portfolio consisted of non-airlineexposures of $3.4 billion and $228 million of airlineexposures at Dec. 31, 2009. We reduced airlineexposure by 5% in 2009. Approximately 90% of thenon-airline exposure is investment grade. At Dec. 31,2009, we carried no automotive exposure in ourleasing portfolio.
At Dec. 31, 2009, our $228 million of exposure to theairline industry consisted of a $15 million real estatelease exposure, as well as the airline-leasing portfoliowhich included $77 million to major U.S. carriers,$121 million to foreign airlines and $15 million toU.S. regionals.
The airline industry continued to face difficultoperating conditions in 2009. A weak economicoutlook for 2010 continues to have a dampening effecton aircraft values in the secondary market. Because ofthese factors, we continue to maintain a sizableallowance for loan losses against these exposures andto closely monitor the portfolio.
At Dec. 31, 2009, the non-airline portion of theleasing portfolio consisted of $3.4 billion of exposuresbacked by well-diversified assets, primarily large-ticket transportation equipment. The largestcomponent is rail, consisting of both passenger andfreight trains. Assets are both domestic and foreign-based, with primary concentrations in the UnitedStates and European countries. Excluding airlineleasing, counterparty rating equivalents at Dec. 31,2009, were as follows:
Š 14% of the counterparties are AA or better;Š 37% are A;Š 46% are BBB; andŠ 3% are non-investment grade
52 BNY Mellon
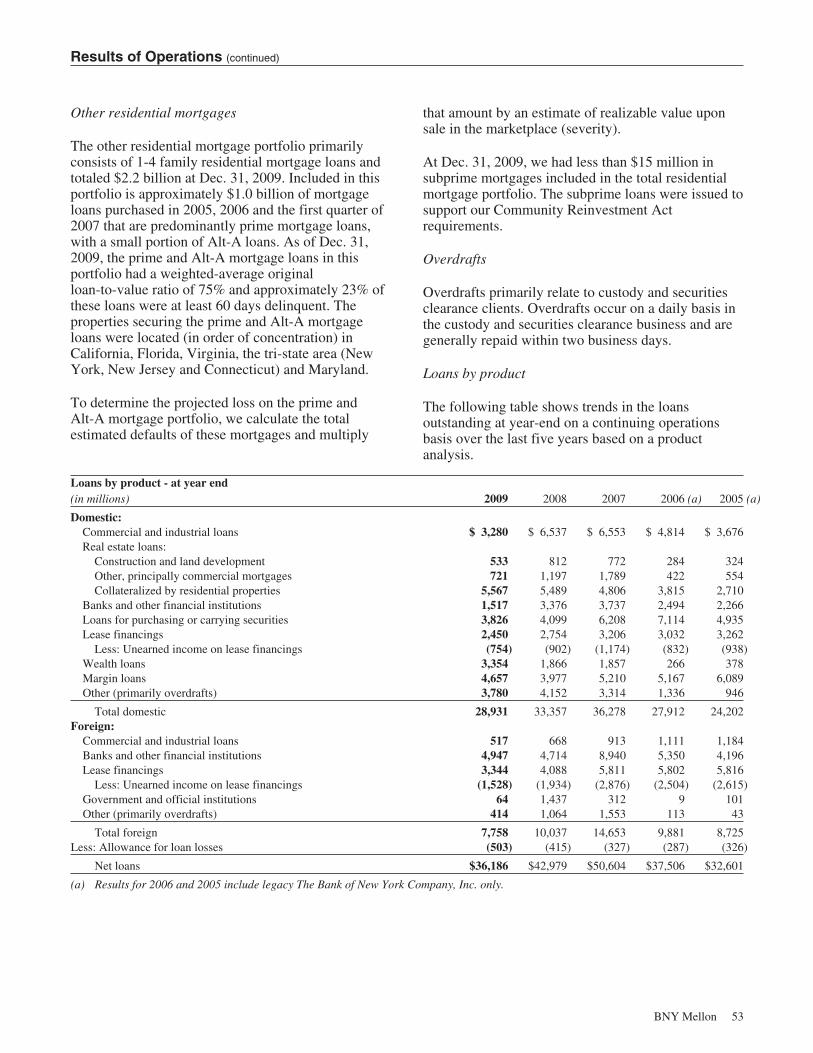
Results of Operations (continued)
Other residential mortgages
The other residential mortgage portfolio primarilyconsists of 1-4 family residential mortgage loans andtotaled $2.2 billion at Dec. 31, 2009. Included in thisportfolio is approximately $1.0 billion of mortgageloans purchased in 2005, 2006 and the first quarter of2007 that are predominantly prime mortgage loans,with a small portion of Alt-A loans. As of Dec. 31,2009, the prime and Alt-A mortgage loans in thisportfolio had a weighted-average originalloan-to-value ratio of 75% and approximately 23% ofthese loans were at least 60 days delinquent. Theproperties securing the prime and Alt-A mortgageloans were located (in order of concentration) inCalifornia, Florida, Virginia, the tri-state area (NewYork, New Jersey and Connecticut) and Maryland.
To determine the projected loss on the prime andAlt-A mortgage portfolio, we calculate the totalestimated defaults of these mortgages and multiply
that amount by an estimate of realizable value uponsale in the marketplace (severity).
At Dec. 31, 2009, we had less than $15 million insubprime mortgages included in the total residentialmortgage portfolio. The subprime loans were issued tosupport our Community Reinvestment Actrequirements.
Overdrafts
Overdrafts primarily relate to custody and securitiesclearance clients. Overdrafts occur on a daily basis inthe custody and securities clearance business and aregenerally repaid within two business days.
Loans by product
The following table shows trends in the loansoutstanding at year-end on a continuing operationsbasis over the last five years based on a productanalysis.
Loans by product - at year end(in millions) 2009 2008 2007 2006 (a) 2005 (a)
Domestic:Commercial and industrial loans $ 3,280 $ 6,537 $ 6,553 $ 4,814 $ 3,676Real estate loans:
Construction and land development 533 812 772 284 324Other, principally commercial mortgages 721 1,197 1,789 422 554Collateralized by residential properties 5,567 5,489 4,806 3,815 2,710
Banks and other financial institutions 1,517 3,376 3,737 2,494 2,266Loans for purchasing or carrying securities 3,826 4,099 6,208 7,114 4,935Lease financings 2,450 2,754 3,206 3,032 3,262
Less: Unearned income on lease financings (754) (902) (1,174) (832) (938)Wealth loans 3,354 1,866 1,857 266 378Margin loans 4,657 3,977 5,210 5,167 6,089Other (primarily overdrafts) 3,780 4,152 3,314 1,336 946
Total domestic 28,931 33,357 36,278 27,912 24,202Foreign:
Commercial and industrial loans 517 668 913 1,111 1,184Banks and other financial institutions 4,947 4,714 8,940 5,350 4,196Lease financings 3,344 4,088 5,811 5,802 5,816
Less: Unearned income on lease financings (1,528) (1,934) (2,876) (2,504) (2,615)Government and official institutions 64 1,437 312 9 101Other (primarily overdrafts) 414 1,064 1,553 113 43
Total foreign 7,758 10,037 14,653 9,881 8,725Less: Allowance for loan losses (503) (415) (327) (287) (326)
Net loans $36,186 $42,979 $50,604 $37,506 $32,601
(a) Results for 2006 and 2005 include legacy The Bank of New York Company, Inc. only.
BNY Mellon 53
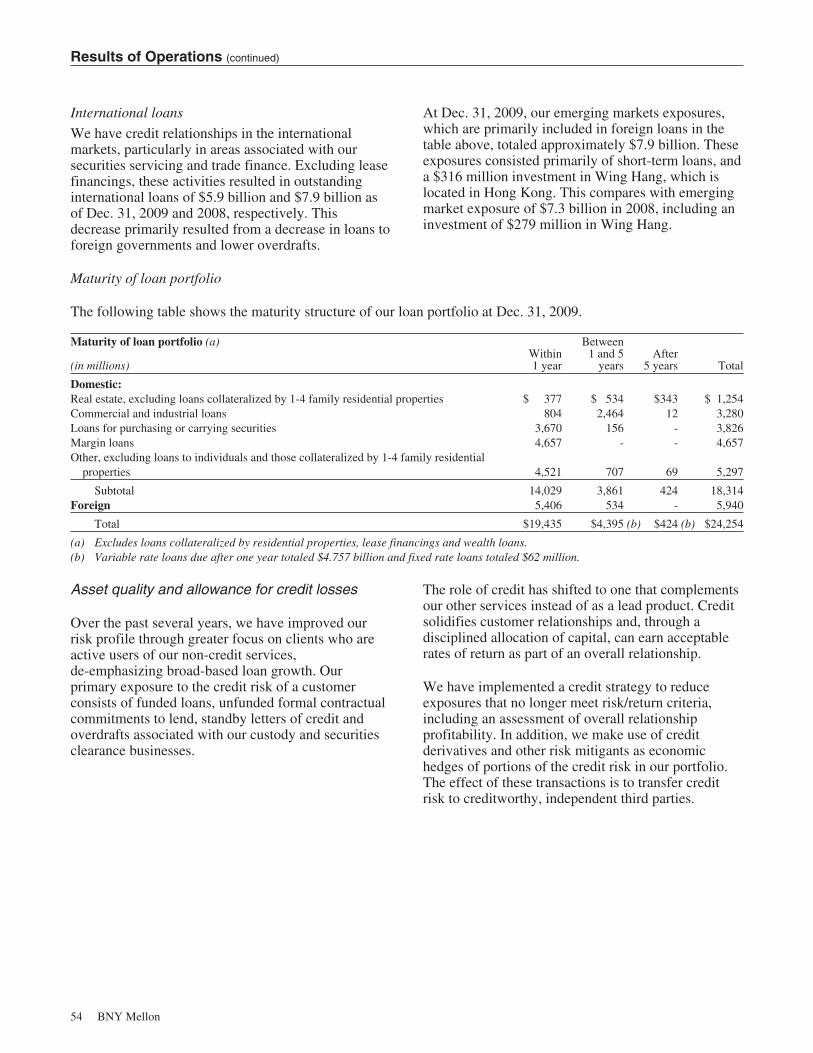
Results of Operations (continued)
International loans
We have credit relationships in the internationalmarkets, particularly in areas associated with oursecurities servicing and trade finance. Excluding leasefinancings, these activities resulted in outstandinginternational loans of $5.9 billion and $7.9 billion asof Dec. 31, 2009 and 2008, respectively. Thisdecrease primarily resulted from a decrease in loans toforeign governments and lower overdrafts.
At Dec. 31, 2009, our emerging markets exposures,which are primarily included in foreign loans in thetable above, totaled approximately $7.9 billion. Theseexposures consisted primarily of short-term loans, anda $316 million investment in Wing Hang, which islocated in Hong Kong. This compares with emergingmarket exposure of $7.3 billion in 2008, including aninvestment of $279 million in Wing Hang.
Maturity of loan portfolio
The following table shows the maturity structure of our loan portfolio at Dec. 31, 2009.
Maturity of loan portfolio (a)
(in millions)Within1 year
Between1 and 5
yearsAfter
5 years Total
Domestic:Real estate, excluding loans collateralized by 1-4 family residential properties $ 377 $ 534 $343 $ 1,254Commercial and industrial loans 804 2,464 12 3,280Loans for purchasing or carrying securities 3,670 156 - 3,826Margin loans 4,657 - - 4,657Other, excluding loans to individuals and those collateralized by 1-4 family residential
properties 4,521 707 69 5,297
Subtotal 14,029 3,861 424 18,314Foreign 5,406 534 - 5,940
Total $19,435 $4,395 (b) $424 (b) $24,254
(a) Excludes loans collateralized by residential properties, lease financings and wealth loans.(b) Variable rate loans due after one year totaled $4.757 billion and fixed rate loans totaled $62 million.
Asset quality and allowance for credit losses
Over the past several years, we have improved ourrisk profile through greater focus on clients who areactive users of our non-credit services,de-emphasizing broad-based loan growth. Ourprimary exposure to the credit risk of a customerconsists of funded loans, unfunded formal contractualcommitments to lend, standby letters of credit andoverdrafts associated with our custody and securitiesclearance businesses.
The role of credit has shifted to one that complementsour other services instead of as a lead product. Creditsolidifies customer relationships and, through adisciplined allocation of capital, can earn acceptablerates of return as part of an overall relationship.
We have implemented a credit strategy to reduceexposures that no longer meet risk/return criteria,including an assessment of overall relationshipprofitability. In addition, we make use of creditderivatives and other risk mitigants as economichedges of portions of the credit risk in our portfolio.The effect of these transactions is to transfer creditrisk to creditworthy, independent third parties.
54 BNY Mellon

Results of Operations (continued)
Activity in allowance for credit losses
The following table details changes in our allowance for credit losses for the last five years:
Allowance for credit losses activity(in millions) 2009 2008 2007 (a) 2006 (a) 2005 (a)
Margin loans $ 4,657 $ 3,977 $ 5,210 $ 5,167 $ 6,089Non-margin loans 32,032 39,417 45,721 32,626 26,838
Total loans at Dec. 31, 36,689 43,394 50,931 37,793 32,927Average loans outstanding 36,424 48,132 41,515 33,612 32,069
Allowance for credit losses:Balance, Jan. 1,
Domestic $ 461 $ 354 $ 328 $ 363 $ 481Foreign 6 24 7 11 27Unallocated 62 116 102 96 119
Total 529 494 437 470 627
Charge-offs:Commercial (124) (30) (22) (27) (144)Commercial real estate (31) (15) - - -Other residential mortgage (60) (20) - - -Foreign - (17) (19) (2) (10)Wealth management (1) (1) - - -Leasing - - (36) - -Other - - (1) - -
Total charge-offs (216) (83) (78) (29) (154)Recoveries:
Commercial - 2 1 3 1Foreign - 4 1 7 3Leasing 1 3 13 4 -Other 1 1 - 2 -
Total recoveries 2 10 15 16 4
Net charge-offs (214) (73) (63) (13) (150)Provision for credit losses 332 104 (11) (20) (7)Transferred to discontinued operations (19) 27 1 - -Acquisitions/dispositions and other - (23) 130 - -
Balance, Dec. 31,Domestic 598 461 354 328 363Foreign 4 6 24 7 11Unallocated 26 62 116 102 96
Total allowance, Dec. 31, (b) $ 628 $ 529 $ 494 $ 437 $ 470
Allowance for loan losses $ 503 $ 415 $ 327 $ 287 $ 326Allowance for lending related commitments 125 114 167 150 144Net charge-offs to average loans outstanding 0.59% 0.15% 0.15% 0.04% 0.47%Net charge-offs to total allowance for credit losses 34.08 13.80 12.75 2.97 31.91Allowance for loan losses as a percent of total loans 1.37 0.96 0.64 0.76 0.99Allowance for loan losses as a percent of non-margin loans 1.57 1.05 0.72 0.88 1.21Total allowance for credit losses as a percent of total loans 1.71 1.22 0.97 1.16 1.43Total allowance for credit losses as a percent of non-margin loans 1.96 1.34 1.08 1.34 1.75
(a) Charge-offs, recoveries and the provision for 2007 include six months of BNY Mellon and six months of legacy The Bank of New YorkCompany, Inc. These categories for 2006 and 2005 reflect legacy The Bank of New York Company, Inc.
(b) The allowance for credit losses at Dec. 31, 2009 excludes discontinued operations. The allowance for credit losses includesdiscontinued operations of $35 million at Dec. 31, 2008 and $17 million at Dec. 31, 2007.
BNY Mellon 55
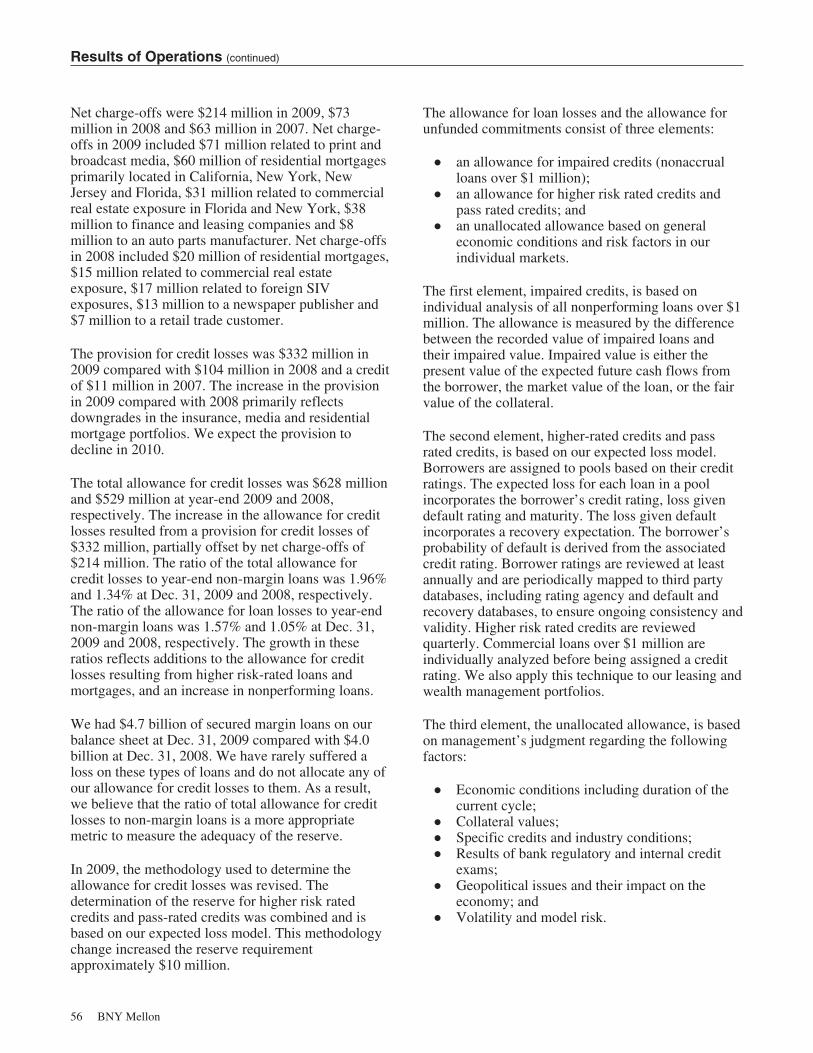
Results of Operations (continued)
Net charge-offs were $214 million in 2009, $73million in 2008 and $63 million in 2007. Net charge-offs in 2009 included $71 million related to print andbroadcast media, $60 million of residential mortgagesprimarily located in California, New York, NewJersey and Florida, $31 million related to commercialreal estate exposure in Florida and New York, $38million to finance and leasing companies and $8million to an auto parts manufacturer. Net charge-offsin 2008 included $20 million of residential mortgages,$15 million related to commercial real estateexposure, $17 million related to foreign SIVexposures, $13 million to a newspaper publisher and$7 million to a retail trade customer.
The provision for credit losses was $332 million in2009 compared with $104 million in 2008 and a creditof $11 million in 2007. The increase in the provisionin 2009 compared with 2008 primarily reflectsdowngrades in the insurance, media and residentialmortgage portfolios. We expect the provision todecline in 2010.
The total allowance for credit losses was $628 millionand $529 million at year-end 2009 and 2008,respectively. The increase in the allowance for creditlosses resulted from a provision for credit losses of$332 million, partially offset by net charge-offs of$214 million. The ratio of the total allowance forcredit losses to year-end non-margin loans was 1.96%and 1.34% at Dec. 31, 2009 and 2008, respectively.The ratio of the allowance for loan losses to year-endnon-margin loans was 1.57% and 1.05% at Dec. 31,2009 and 2008, respectively. The growth in theseratios reflects additions to the allowance for creditlosses resulting from higher risk-rated loans andmortgages, and an increase in nonperforming loans.
We had $4.7 billion of secured margin loans on ourbalance sheet at Dec. 31, 2009 compared with $4.0billion at Dec. 31, 2008. We have rarely suffered aloss on these types of loans and do not allocate any ofour allowance for credit losses to them. As a result,we believe that the ratio of total allowance for creditlosses to non-margin loans is a more appropriatemetric to measure the adequacy of the reserve.
In 2009, the methodology used to determine theallowance for credit losses was revised. Thedetermination of the reserve for higher risk ratedcredits and pass-rated credits was combined and isbased on our expected loss model. This methodologychange increased the reserve requirementapproximately $10 million.
The allowance for loan losses and the allowance forunfunded commitments consist of three elements:
Š an allowance for impaired credits (nonaccrualloans over $1 million);
Š an allowance for higher risk rated credits andpass rated credits; and
Š an unallocated allowance based on generaleconomic conditions and risk factors in ourindividual markets.
The first element, impaired credits, is based onindividual analysis of all nonperforming loans over $1million. The allowance is measured by the differencebetween the recorded value of impaired loans andtheir impaired value. Impaired value is either thepresent value of the expected future cash flows fromthe borrower, the market value of the loan, or the fairvalue of the collateral.
The second element, higher-rated credits and passrated credits, is based on our expected loss model.Borrowers are assigned to pools based on their creditratings. The expected loss for each loan in a poolincorporates the borrower’s credit rating, loss givendefault rating and maturity. The loss given defaultincorporates a recovery expectation. The borrower’sprobability of default is derived from the associatedcredit rating. Borrower ratings are reviewed at leastannually and are periodically mapped to third partydatabases, including rating agency and default andrecovery databases, to ensure ongoing consistency andvalidity. Higher risk rated credits are reviewedquarterly. Commercial loans over $1 million areindividually analyzed before being assigned a creditrating. We also apply this technique to our leasing andwealth management portfolios.
The third element, the unallocated allowance, is basedon management’s judgment regarding the followingfactors:
Š Economic conditions including duration of thecurrent cycle;
Š Collateral values;Š Specific credits and industry conditions;Š Results of bank regulatory and internal credit
exams;Š Geopolitical issues and their impact on the
economy; andŠ Volatility and model risk.
56 BNY Mellon

Results of Operations (continued)
Based on an evaluation of these three elements,including individual credits, historical credit losses,and global economic factors, we have allocated ourallowance for credit losses on a continuing operationsbasis as follows:
Allocation of allowance2009 (a) 2008 (a) 2007 (a) 2006 (b) 2005 (b)
Commercial 41% 47% 49% 64% 66%Other residential
mortgages 25 15 5 4 5Financial institutions 13 10 8 3 3Wealth
management (c) 9 5 3 2 5Commercial real
estate 7 10 7 2 2Foreign 1 1 5 2 2Unallocated 4 12 23 23 17
Total 100% 100% 100% 100% 100%
(a) Excludes discontinued operations. The allowance for creditlosses includes discontinued operations in 2008 and 2007.
(b) Reflects legacy The Bank of New York Company, Inc. only.(c) Includes the allowance for wealth management mortgages.
The allocation of allowance for credit losses isinherently judgmental, and the entire allowance forcredit losses is available to absorb credit lossesregardless of the nature of the loss. The unallocatedallowance reflects various factors in the current creditenvironment and is also available to, among otherthings, absorb further deterioration across all of ourportfolios resulting from the current economicenvironment. The unallocated allowance for creditlosses was 4% at Dec. 31, 2009, a decrease from 12%at Dec. 31, 2008.
Nonperforming assets
The following table shows the distribution of nonperforming assets at the end of each of the last five years.
Nonperforming assets at Dec. 31(dollar in millions) 2009 2008 2007 2006 (a) 2005 (a)
Loans:Other residential mortgages $ 190 $ 97 $ 20 $ 2 $ -Financial institutions 172 41 24 - -Commercial 65 14 15 26 12Commercial real estate 61 130 40 - -Wealth management 58 2 - - -Foreign - - 87 9 13Other - - - - 1
Total nonperforming loans 546 284 186 37 26Other assets owned 4 8 4 1 13
Total nonperforming assets $ 550 (b) $ 292 (b) $ 190 (b) $ 38 $ 39
Nonperforming assets ratio 1.5% 0.7% 0.4% 0.1% 0.1%Allowance for loan losses/nonperforming loans 92.1 146.1 175.8 775.7 1,253.8Allowance for loan losses/nonperforming assets 91.5 142.1 172.1 755.3 835.9Total allowance for credit losses/nonperforming loans 115.0 186.3 265.6 1,181.1 1,807.7Total allowance for credit losses/nonperforming assets 114.2 181.2 260.0 1,150.0 1,205.1
(a) Reflects legacy The Bank of New York Company, Inc. only.(b) Nonperforming assets at Dec. 31, 2009 exclude discontinued operations. Nonperforming assets at Dec. 31, 2008 and Dec. 31, 2007
include discontinued operations of $96 million and $18 million, respectively.
Nonperforming assets were $550 million at Dec. 31,2009, an increase of $258 million compared withDec. 31, 2008. The increase primarily resulted from$137 million in the insurance portfolio, $108 millionin the media portfolio, $99 million in other residentialmortgages, an increase of $62 million in loans towealth management clients, $37 million to real estate
investment companies, $27 million to mortgagecompanies and $21 million to a finance/leasingcompany. Partially offsetting this increase was$96 million that was transferred to discontinuedoperations, $95 million of charge-offs and $49 millionof loan payments/sales.
BNY Mellon 57
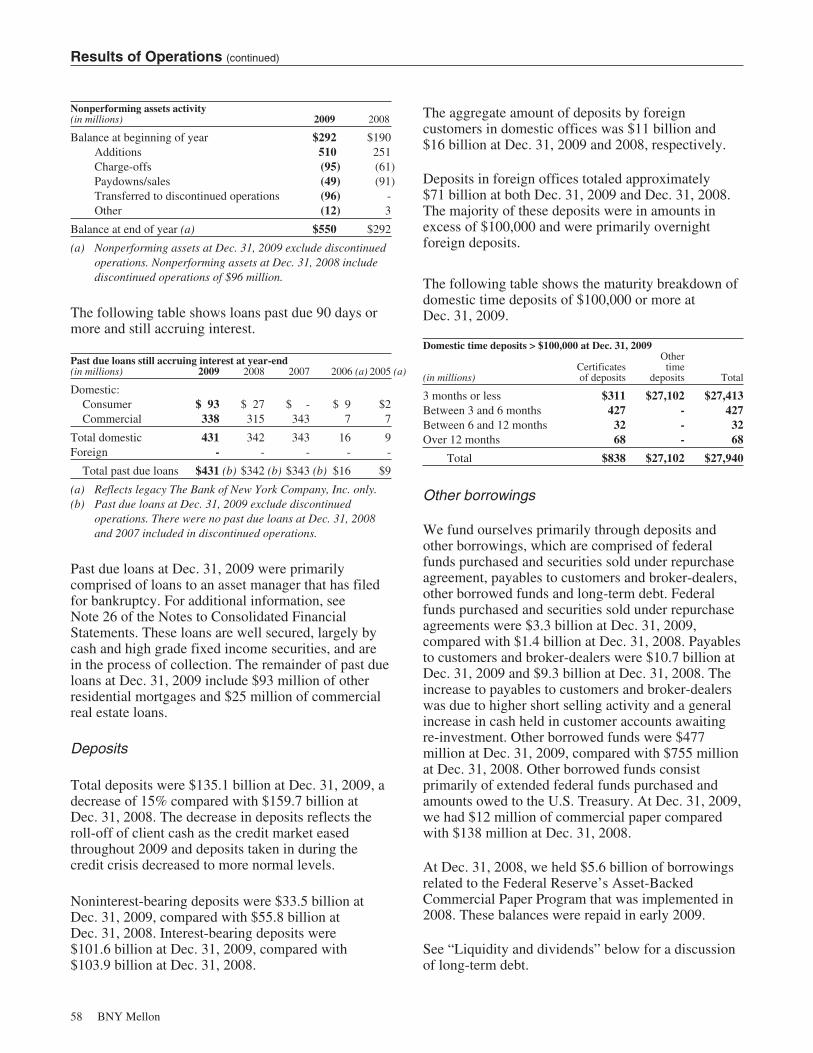
Results of Operations (continued)
Nonperforming assets activity(in millions) 2009 2008
Balance at beginning of year $292 $190Additions 510 251Charge-offs (95) (61)Paydowns/sales (49) (91)Transferred to discontinued operations (96) -Other (12) 3
Balance at end of year (a) $550 $292
(a) Nonperforming assets at Dec. 31, 2009 exclude discontinuedoperations. Nonperforming assets at Dec. 31, 2008 includediscontinued operations of $96 million.
The following table shows loans past due 90 days ormore and still accruing interest.
Past due loans still accruing interest at year-end(in millions) 2009 2008 2007 2006 (a) 2005 (a)
Domestic:Consumer $ 93 $ 27 $ - $ 9 $2Commercial 338 315 343 7 7
Total domestic 431 342 343 16 9Foreign - - - - -
Total past due loans $431 (b) $342 (b) $343 (b) $16 $9
(a) Reflects legacy The Bank of New York Company, Inc. only.(b) Past due loans at Dec. 31, 2009 exclude discontinued
operations. There were no past due loans at Dec. 31, 2008and 2007 included in discontinued operations.
Past due loans at Dec. 31, 2009 were primarilycomprised of loans to an asset manager that has filedfor bankruptcy. For additional information, seeNote 26 of the Notes to Consolidated FinancialStatements. These loans are well secured, largely bycash and high grade fixed income securities, and arein the process of collection. The remainder of past dueloans at Dec. 31, 2009 include $93 million of otherresidential mortgages and $25 million of commercialreal estate loans.
Deposits
Total deposits were $135.1 billion at Dec. 31, 2009, adecrease of 15% compared with $159.7 billion atDec. 31, 2008. The decrease in deposits reflects theroll-off of client cash as the credit market easedthroughout 2009 and deposits taken in during thecredit crisis decreased to more normal levels.
Noninterest-bearing deposits were $33.5 billion atDec. 31, 2009, compared with $55.8 billion atDec. 31, 2008. Interest-bearing deposits were$101.6 billion at Dec. 31, 2009, compared with$103.9 billion at Dec. 31, 2008.
The aggregate amount of deposits by foreigncustomers in domestic offices was $11 billion and$16 billion at Dec. 31, 2009 and 2008, respectively.
Deposits in foreign offices totaled approximately$71 billion at both Dec. 31, 2009 and Dec. 31, 2008.The majority of these deposits were in amounts inexcess of $100,000 and were primarily overnightforeign deposits.
The following table shows the maturity breakdown ofdomestic time deposits of $100,000 or more atDec. 31, 2009.
Domestic time deposits > $100,000 at Dec. 31, 2009
(in millions)Certificatesof deposits
Othertime
deposits Total
3 months or less $311 $27,102 $27,413Between 3 and 6 months 427 - 427Between 6 and 12 months 32 - 32Over 12 months 68 - 68
Total $838 $27,102 $27,940
Other borrowings
We fund ourselves primarily through deposits andother borrowings, which are comprised of federalfunds purchased and securities sold under repurchaseagreement, payables to customers and broker-dealers,other borrowed funds and long-term debt. Federalfunds purchased and securities sold under repurchaseagreements were $3.3 billion at Dec. 31, 2009,compared with $1.4 billion at Dec. 31, 2008. Payablesto customers and broker-dealers were $10.7 billion atDec. 31, 2009 and $9.3 billion at Dec. 31, 2008. Theincrease to payables to customers and broker-dealerswas due to higher short selling activity and a generalincrease in cash held in customer accounts awaitingre-investment. Other borrowed funds were $477million at Dec. 31, 2009, compared with $755 millionat Dec. 31, 2008. Other borrowed funds consistprimarily of extended federal funds purchased andamounts owed to the U.S. Treasury. At Dec. 31, 2009,we had $12 million of commercial paper comparedwith $138 million at Dec. 31, 2008.
At Dec. 31, 2008, we held $5.6 billion of borrowingsrelated to the Federal Reserve’s Asset-BackedCommercial Paper Program that was implemented in2008. These balances were repaid in early 2009.
See “Liquidity and dividends” below for a discussionof long-term debt.
58 BNY Mellon
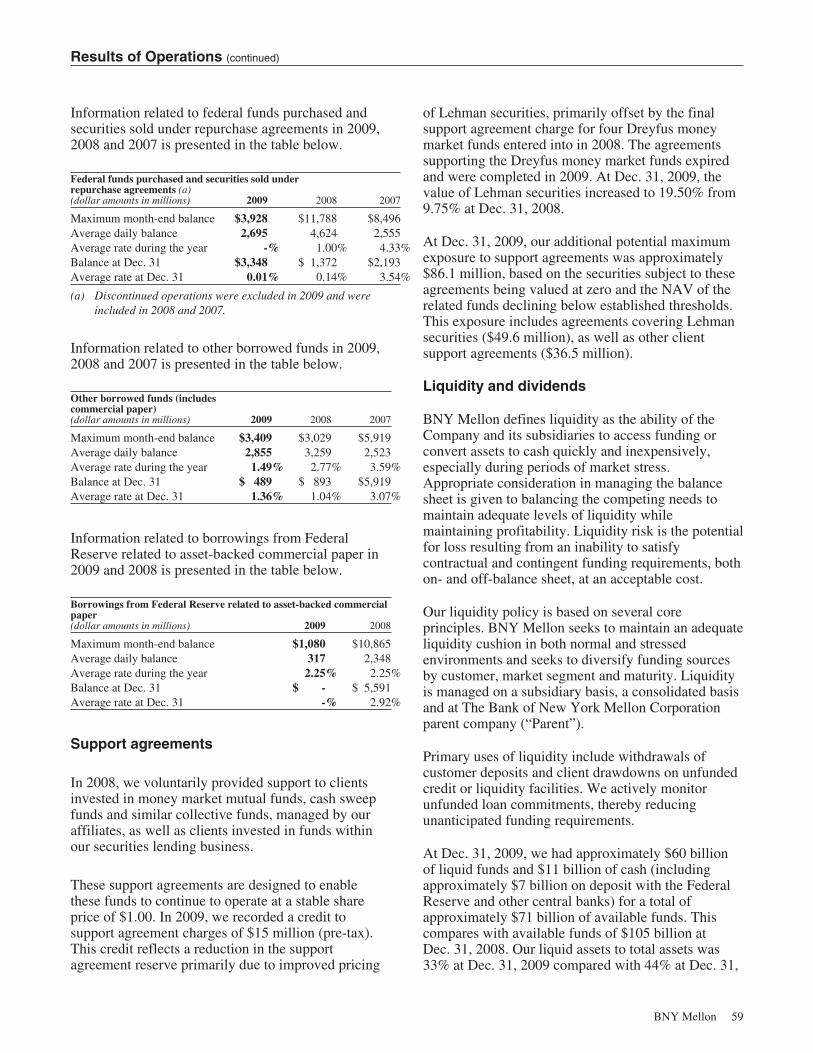
Results of Operations (continued)
Information related to federal funds purchased andsecurities sold under repurchase agreements in 2009,2008 and 2007 is presented in the table below.
Federal funds purchased and securities sold underrepurchase agreements (a)(dollar amounts in millions) 2009 2008 2007
Maximum month-end balance $3,928 $11,788 $8,496Average daily balance 2,695 4,624 2,555Average rate during the year -% 1.00% 4.33%Balance at Dec. 31 $3,348 $ 1,372 $2,193Average rate at Dec. 31 0.01% 0.14% 3.54%
(a) Discontinued operations were excluded in 2009 and wereincluded in 2008 and 2007.
Information related to other borrowed funds in 2009,2008 and 2007 is presented in the table below.
Other borrowed funds (includescommercial paper)(dollar amounts in millions) 2009 2008 2007
Maximum month-end balance $3,409 $3,029 $5,919Average daily balance 2,855 3,259 2,523Average rate during the year 1.49% 2.77% 3.59%Balance at Dec. 31 $ 489 $ 893 $5,919Average rate at Dec. 31 1.36% 1.04% 3.07%
Information related to borrowings from FederalReserve related to asset-backed commercial paper in2009 and 2008 is presented in the table below.
Borrowings from Federal Reserve related to asset-backed commercialpaper(dollar amounts in millions) 2009 2008
Maximum month-end balance $1,080 $10,865Average daily balance 317 2,348Average rate during the year 2.25% 2.25%Balance at Dec. 31 $ - $ 5,591Average rate at Dec. 31 -% 2.92%
Support agreements
In 2008, we voluntarily provided support to clientsinvested in money market mutual funds, cash sweepfunds and similar collective funds, managed by ouraffiliates, as well as clients invested in funds withinour securities lending business.
These support agreements are designed to enablethese funds to continue to operate at a stable shareprice of $1.00. In 2009, we recorded a credit tosupport agreement charges of $15 million (pre-tax).This credit reflects a reduction in the supportagreement reserve primarily due to improved pricing
of Lehman securities, primarily offset by the finalsupport agreement charge for four Dreyfus moneymarket funds entered into in 2008. The agreementssupporting the Dreyfus money market funds expiredand were completed in 2009. At Dec. 31, 2009, thevalue of Lehman securities increased to 19.50% from9.75% at Dec. 31, 2008.
At Dec. 31, 2009, our additional potential maximumexposure to support agreements was approximately$86.1 million, based on the securities subject to theseagreements being valued at zero and the NAV of therelated funds declining below established thresholds.This exposure includes agreements covering Lehmansecurities ($49.6 million), as well as other clientsupport agreements ($36.5 million).
Liquidity and dividends
BNY Mellon defines liquidity as the ability of theCompany and its subsidiaries to access funding orconvert assets to cash quickly and inexpensively,especially during periods of market stress.Appropriate consideration in managing the balancesheet is given to balancing the competing needs tomaintain adequate levels of liquidity whilemaintaining profitability. Liquidity risk is the potentialfor loss resulting from an inability to satisfycontractual and contingent funding requirements, bothon- and off-balance sheet, at an acceptable cost.
Our liquidity policy is based on several coreprinciples. BNY Mellon seeks to maintain an adequateliquidity cushion in both normal and stressedenvironments and seeks to diversify funding sourcesby customer, market segment and maturity. Liquidityis managed on a subsidiary basis, a consolidated basisand at The Bank of New York Mellon Corporationparent company (“Parent”).
Primary uses of liquidity include withdrawals ofcustomer deposits and client drawdowns on unfundedcredit or liquidity facilities. We actively monitorunfunded loan commitments, thereby reducingunanticipated funding requirements.
At Dec. 31, 2009, we had approximately $60 billionof liquid funds and $11 billion of cash (includingapproximately $7 billion on deposit with the FederalReserve and other central banks) for a total ofapproximately $71 billion of available funds. Thiscompares with available funds of $105 billion atDec. 31, 2008. Our liquid assets to total assets was33% at Dec. 31, 2009 compared with 44% at Dec. 31,
BNY Mellon 59
Results of Operations (continued)
2008. The decrease from Dec. 31, 2008 primarilyreflects lower cash balances, primarily deposits withthe Federal Reserve and other central banks, resultingfrom the decline in noninterest-bearing deposits as thebalance sheet returned to expected levels during 2009.
On an average basis for 2009 and 2008, non-coresources of funds such as money market rate accounts,certificates of deposit greater than $100,000, federalfunds purchased and other borrowings were$25.1 billion and $23.8 billion, respectively. Theincrease primarily reflects a higher level of moneymarket rate accounts, partially offset by lower levelsof federal funds purchased and certificates of depositsgreater than $100,000. Average foreign deposits,primarily from our European-based securitiesservicing business, were $72.6 billion in 2009compared with $68.8 billion in 2008. The increase inforeign deposits primarily reflects greater liquidityfrom our corporate trust business. Domestic savingsand other time deposits averaged $6.1 billion in 2009compared with $7.2 billion in 2008. The 2008 averageincluded the impact of a large government deposit.
Average payables to customers and broker-dealerswere $5.3 billion in 2009 and $5.5 billion in 2008.Long-term debt averaged $16.9 billion in 2009 and$16.4 billion in 2008. The increase in long-term debtprimarily reflects the issuance of senior debt, partiallyoffset by maturities. Average noninterest-bearingdeposits increased to $36.4 billion in 2009 from$33.7 billion in 2008, primarily reflecting a significantincrease in customer deposits in late 2008 during thecredit crisis.
The Parent has five major sources of liquidity:
Š cash on hand;Š dividends from its subsidiaries;Š access to the commercial paper market;Š a revolving credit agreement with third party
financial institutions; andŠ access to the long-term debt markets.
As a result of charges related to the restructuring ofthe securities portfolios, The Bank of New YorkMellon and BNY Mellon, N.A. will require consentfrom our regulators prior to paying a dividend.Despite this limitation, management estimates thatliquidity at the Parent will continue to be sufficient tomeet BNY Mellon’s ongoing quarterly dividendrequirement. Based on projections, we currentlyexpect this restriction to be lifted in the fourth quarterof 2010. At Dec. 31, 2009, our other bank
subsidiaries had the ability to pay dividends ofapproximately $136 million to the Parent without theneed for a regulatory waiver. In addition, at Dec. 31,2009, nonbank subsidiaries of the Parent had liquidassets of approximately $1.1 billion.
Any increase in BNY Mellon’s ongoing quarterlydividends would require consultation with the FederalReserve.
Restrictions on our ability to obtain funds from oursubsidiaries are discussed in more detail in Note 22 ofthe Notes to Consolidated Financial Statements.
In 2009 and 2008, the Parent’s average commercialpaper borrowings were $186 million and $34 million,respectively. The Parent had cash of $4.4 billion atDec. 31, 2009, compared with $5.0 billion at Dec. 31,2008. Commercial paper outstandings issued by theParent were $12 million and $16 million at Dec. 31,2009 and 2008, respectively. Net of commercial paperoutstanding, the Parent’s cash position at Dec. 31,2009 decreased by $596 million compared withDec. 31, 2008. The decrease in cash held by theParent reflected the repurchase of the preferred stockand warrant issued to the U.S. Treasury as part of theTARP Capital Purchase Program, primarily offset bycommon stock and debt offerings in 2009. TheParent’s liquidity target is to have sufficient cash onhand to meet its obligations over the next 18 monthswithout the need to receive dividends from its banksubsidiaries or issue debt. As of Dec. 31, 2009, theliquidity target was exceeded.
We currently have a $226 million credit agreementwith 10 financial institutions that matures in October2011. The fee on this facility depends on our creditrating and at Dec. 31, 2009 was 6 basis points. Thecredit agreement requires us to maintain:
Š shareholder’s equity of $5 billion;Š a ratio of Tier 1 capital plus the allowance for
credit losses to nonperforming assets of at least2.5;
Š a double leverage ratio less than 130%; andŠ adequate capitalization of all our banks for
regulatory purposes.
We are currently in compliance with these covenants.There were no borrowings under this facility atDec. 31, 2009.
We also have the ability to access the capital markets.In July 2007, we filed a shelf registration statement on
60 BNY Mellon
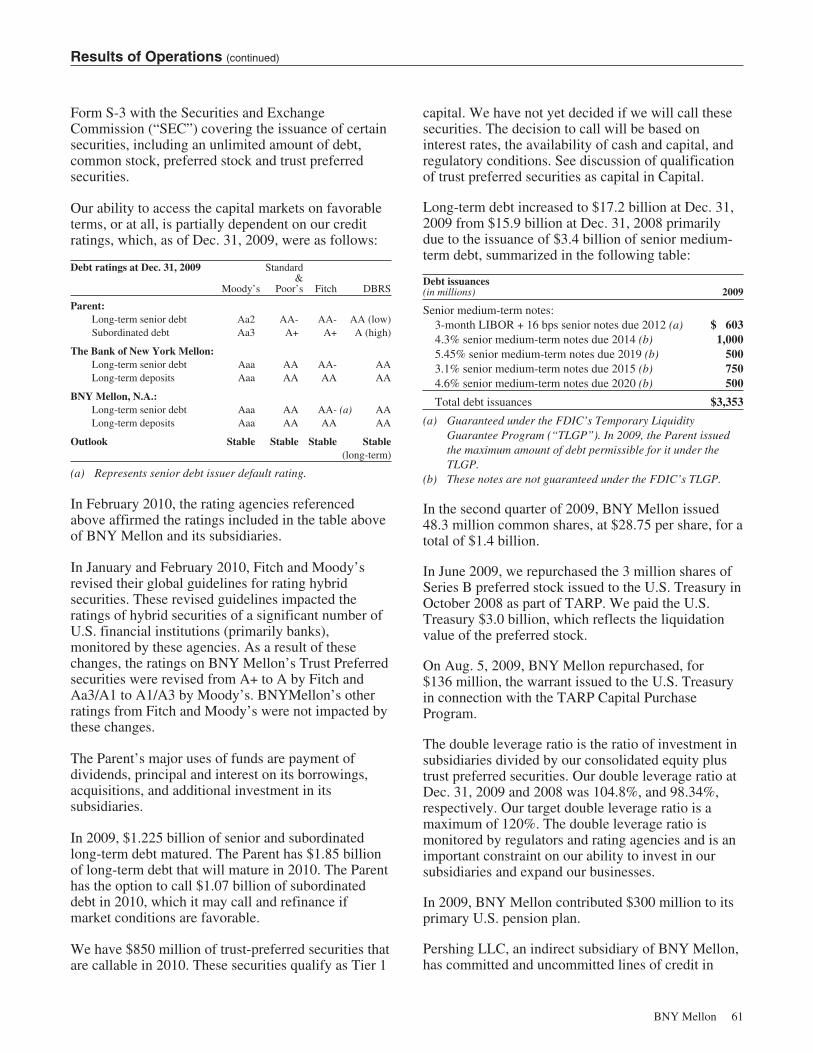
Results of Operations (continued)
Form S-3 with the Securities and ExchangeCommission (“SEC”) covering the issuance of certainsecurities, including an unlimited amount of debt,common stock, preferred stock and trust preferredsecurities.
Our ability to access the capital markets on favorableterms, or at all, is partially dependent on our creditratings, which, as of Dec. 31, 2009, were as follows:
Debt ratings at Dec. 31, 2009
Moody’s
Standard&
Poor’s Fitch DBRS
Parent:Long-term senior debt Aa2 AA- AA- AA (low)Subordinated debt Aa3 A+ A+ A (high)
The Bank of New York Mellon:Long-term senior debt Aaa AA AA- AALong-term deposits Aaa AA AA AA
BNY Mellon, N.A.:Long-term senior debt Aaa AA AA- (a) AALong-term deposits Aaa AA AA AA
Outlook Stable Stable Stable Stable(long-term)
(a) Represents senior debt issuer default rating.
In February 2010, the rating agencies referencedabove affirmed the ratings included in the table aboveof BNY Mellon and its subsidiaries.
In January and February 2010, Fitch and Moody’srevised their global guidelines for rating hybridsecurities. These revised guidelines impacted theratings of hybrid securities of a significant number ofU.S. financial institutions (primarily banks),monitored by these agencies. As a result of thesechanges, the ratings on BNY Mellon’s Trust Preferredsecurities were revised from A+ to A by Fitch andAa3/A1 to A1/A3 by Moody’s. BNYMellon’s otherratings from Fitch and Moody’s were not impacted bythese changes.
The Parent’s major uses of funds are payment ofdividends, principal and interest on its borrowings,acquisitions, and additional investment in itssubsidiaries.
In 2009, $1.225 billion of senior and subordinatedlong-term debt matured. The Parent has $1.85 billionof long-term debt that will mature in 2010. The Parenthas the option to call $1.07 billion of subordinateddebt in 2010, which it may call and refinance ifmarket conditions are favorable.
We have $850 million of trust-preferred securities thatare callable in 2010. These securities qualify as Tier 1
capital. We have not yet decided if we will call thesesecurities. The decision to call will be based oninterest rates, the availability of cash and capital, andregulatory conditions. See discussion of qualificationof trust preferred securities as capital in Capital.
Long-term debt increased to $17.2 billion at Dec. 31,2009 from $15.9 billion at Dec. 31, 2008 primarilydue to the issuance of $3.4 billion of senior medium-term debt, summarized in the following table:
Debt issuances(in millions) 2009
Senior medium-term notes:3-month LIBOR + 16 bps senior notes due 2012 (a) $ 6034.3% senior medium-term notes due 2014 (b) 1,0005.45% senior medium-term notes due 2019 (b) 5003.1% senior medium-term notes due 2015 (b) 7504.6% senior medium-term notes due 2020 (b) 500
Total debt issuances $3,353
(a) Guaranteed under the FDIC’s Temporary LiquidityGuarantee Program (“TLGP”). In 2009, the Parent issuedthe maximum amount of debt permissible for it under theTLGP.
(b) These notes are not guaranteed under the FDIC’s TLGP.
In the second quarter of 2009, BNY Mellon issued48.3 million common shares, at $28.75 per share, for atotal of $1.4 billion.
In June 2009, we repurchased the 3 million shares ofSeries B preferred stock issued to the U.S. Treasury inOctober 2008 as part of TARP. We paid the U.S.Treasury $3.0 billion, which reflects the liquidationvalue of the preferred stock.
On Aug. 5, 2009, BNY Mellon repurchased, for$136 million, the warrant issued to the U.S. Treasuryin connection with the TARP Capital PurchaseProgram.
The double leverage ratio is the ratio of investment insubsidiaries divided by our consolidated equity plustrust preferred securities. Our double leverage ratio atDec. 31, 2009 and 2008 was 104.8%, and 98.34%,respectively. Our target double leverage ratio is amaximum of 120%. The double leverage ratio ismonitored by regulators and rating agencies and is animportant constraint on our ability to invest in oursubsidiaries and expand our businesses.
In 2009, BNY Mellon contributed $300 million to itsprimary U.S. pension plan.
Pershing LLC, an indirect subsidiary of BNY Mellon,has committed and uncommitted lines of credit in
BNY Mellon 61

Results of Operations (continued)
place for liquidity purposes which are guaranteed bythe Parent. The committed line of credit of $905million extended by 15 financial institutions maturesin March 2010. We expect that this line of credit willbe renewed. In 2009, the average borrowing againstthis line of credit was $178 million. Additionally,Pershing has another committed line of credit for $125million extended by one financial institution thatmatures in September 2010. The average borrowingagainst this line of credit was $39 million during2009.
Pershing LLC has four separate uncommitted lines ofcredit, amounting to $875 million in aggregate. In2009, average daily borrowing under these lines was$187 million in aggregate.
The committed line of credit maintained by PershingLLC requires the Parent to maintain:
Š shareholders equity of $5 billion;Š a ratio of Tier 1 capital plus the allowance for
credit losses to nonperforming assets of at least2.5; and
Š a double leverage ratio less than 130%.
We are currently in compliance with these covenants.
Pershing Limited, an indirect U.K.-based subsidiaryof BNY Mellon, has committed and uncommittedlines in place for liquidity purposes, which areguaranteed by the Parent. The committed line of creditof $171 million extended by four financial institutionsmatures in March 2010. We expect this line to berenewed. In 2009, there were no borrowings againstthese lines of credit. Pershing Limited has threeseparate uncommitted lines of credit amounting to$250 million in aggregate. In 2009, average dailyborrowing under these lines was $16 million inaggregate.
Statement of cash flows
Cash provided by operating activities was $3.8 billionin 2009, compared with $2.9 billion in 2008 and $4.0billion in 2007. In 2009, earnings, excluding thenon-cash impact of investment securities losses,depreciation and amortization and accruals and otherbalances, partially offset by deferred tax benefits and
changes in trading activities were a significant sourceof funds. The cash flows from operations in 2008were principally the result of earnings. The cash flowsfrom operations in 2007 were principally the result ofearnings and changes in trading activities.
In 2009, cash provided by investing activities was$23.1 billion compared to $56.0 billion used forinvesting activities in 2008 and $21.6 billion used forinvesting activities in 2007. In 2009, interest-bearingdeposits with the Federal Reserve and other centralbanks was a significant source of funds, partiallyoffset by purchases of securities available for sale. In2008, interest-bearing deposits at the Federal Reserveand other central banks and interest-bearing depositswith banks were a significant use of funds, and federalfunds sold and securities purchased under resaleagreements and loans to customers were a significantsource of funds. In 2007, cash was used to increaseour investment in securities. Interest-bearing deposits,loans to customers and Federal funds sold andsecurities purchased under resale agreements wereuses of funds in 2007.
In 2009, cash used for financing activities was $28.0billion, compared to $51.8 billion provided byfinancing activities in 2008 and $21.5 billion providedby financing activities in 2007. In 2009, change indeposits, other borrowed funds and the repurchase ofthe Series B preferred stock and the warrant weresignificant uses of funds, partially offset by proceedsfrom the issuance of long term debt and commonstock, and the change in federal funds purchased andsecurities sold under repurchase agreements. In 2008,deposits and other funds borrowed, partially offset byuse of funds for the repayments of long-term debt andcommercial paper were the primary source of funds.In 2007, sources of funds included deposits and theissuance of long-term debt.
Commitments and obligations
We have contractual obligations to make fixed anddeterminable payments to third parties as indicated inthe table below. The table excludes certain obligationssuch as trade payables and trading liabilities, wherethe obligation is short-term or subject to valuationbased on market factors.
62 BNY Mellon
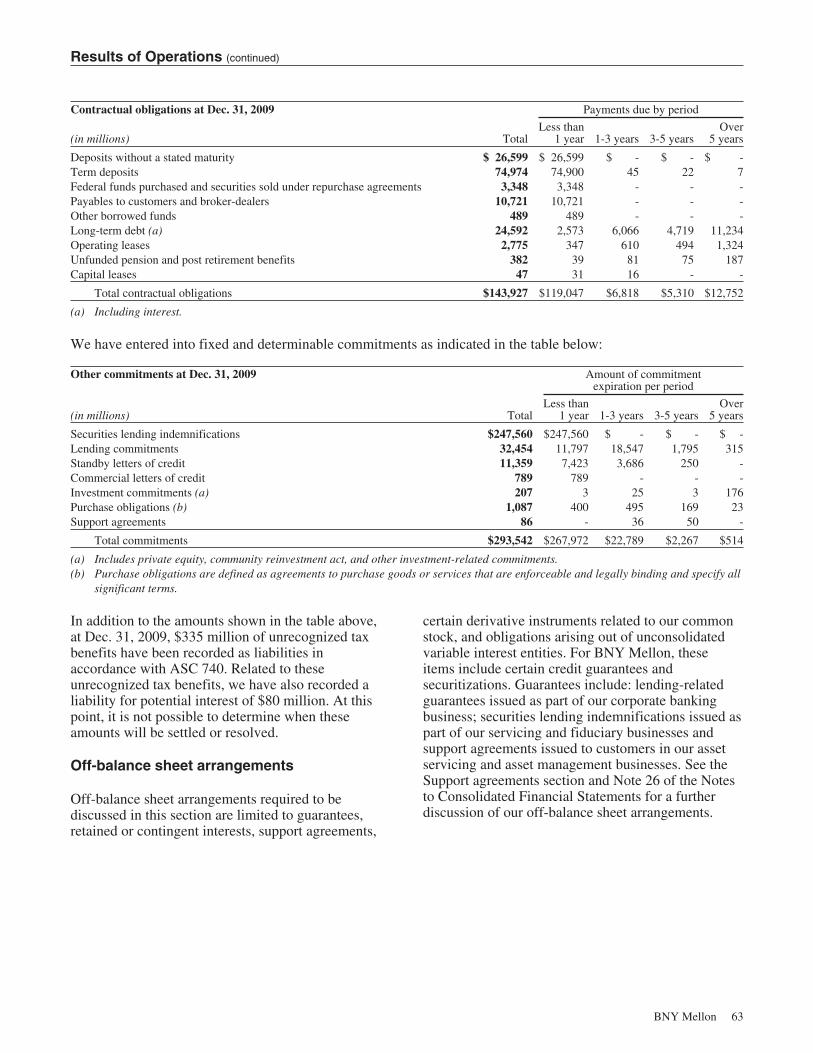
Results of Operations (continued)
Contractual obligations at Dec. 31, 2009 Payments due by period
(in millions) TotalLess than
1 year 1-3 years 3-5 yearsOver
5 years
Deposits without a stated maturity $ 26,599 $ 26,599 $ - $ - $ -Term deposits 74,974 74,900 45 22 7Federal funds purchased and securities sold under repurchase agreements 3,348 3,348 - - -Payables to customers and broker-dealers 10,721 10,721 - - -Other borrowed funds 489 489 - - -Long-term debt (a) 24,592 2,573 6,066 4,719 11,234Operating leases 2,775 347 610 494 1,324Unfunded pension and post retirement benefits 382 39 81 75 187Capital leases 47 31 16 - -
Total contractual obligations $143,927 $119,047 $6,818 $5,310 $12,752
(a) Including interest.
We have entered into fixed and determinable commitments as indicated in the table below:
Other commitments at Dec. 31, 2009 Amount of commitmentexpiration per period
(in millions) TotalLess than
1 year 1-3 years 3-5 yearsOver
5 years
Securities lending indemnifications $247,560 $247,560 $ - $ - $ -Lending commitments 32,454 11,797 18,547 1,795 315Standby letters of credit 11,359 7,423 3,686 250 -Commercial letters of credit 789 789 - - -Investment commitments (a) 207 3 25 3 176Purchase obligations (b) 1,087 400 495 169 23Support agreements 86 - 36 50 -
Total commitments $293,542 $267,972 $22,789 $2,267 $514
(a) Includes private equity, community reinvestment act, and other investment-related commitments.(b) Purchase obligations are defined as agreements to purchase goods or services that are enforceable and legally binding and specify all
significant terms.
In addition to the amounts shown in the table above,at Dec. 31, 2009, $335 million of unrecognized taxbenefits have been recorded as liabilities inaccordance with ASC 740. Related to theseunrecognized tax benefits, we have also recorded aliability for potential interest of $80 million. At thispoint, it is not possible to determine when theseamounts will be settled or resolved.
Off-balance sheet arrangements
Off-balance sheet arrangements required to bediscussed in this section are limited to guarantees,retained or contingent interests, support agreements,
certain derivative instruments related to our commonstock, and obligations arising out of unconsolidatedvariable interest entities. For BNY Mellon, theseitems include certain credit guarantees andsecuritizations. Guarantees include: lending-relatedguarantees issued as part of our corporate bankingbusiness; securities lending indemnifications issued aspart of our servicing and fiduciary businesses andsupport agreements issued to customers in our assetservicing and asset management businesses. See theSupport agreements section and Note 26 of the Notesto Consolidated Financial Statements for a furtherdiscussion of our off-balance sheet arrangements.
BNY Mellon 63
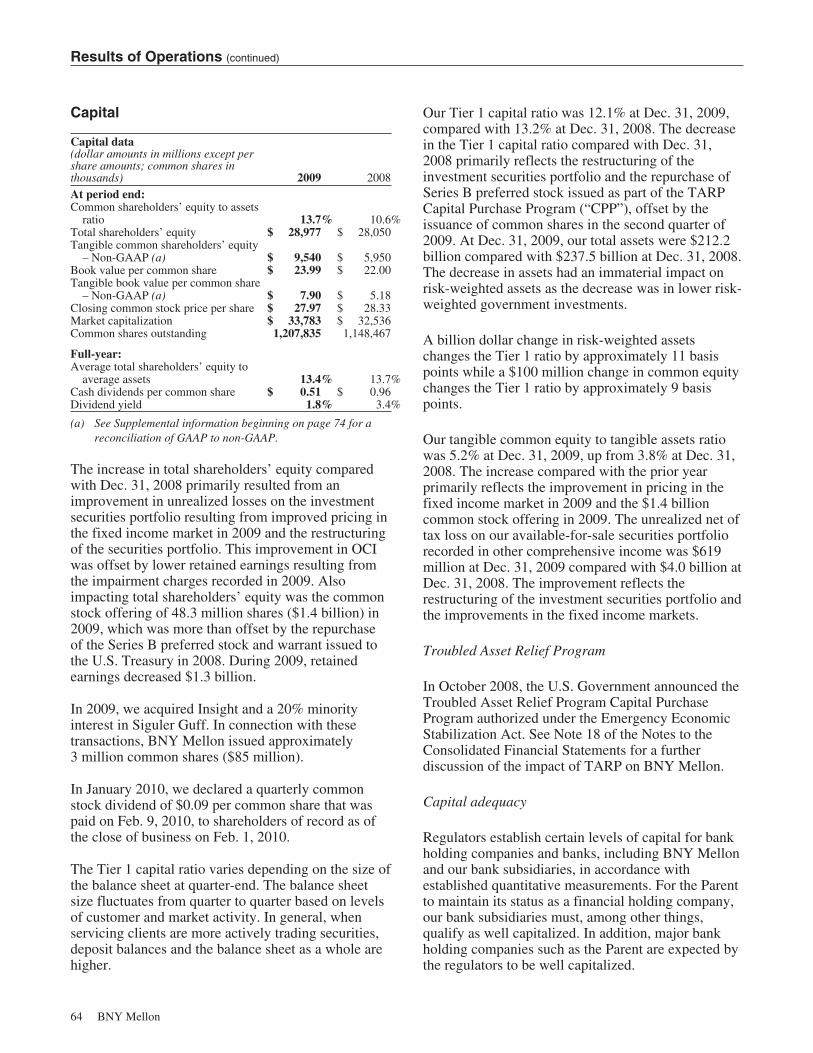
Results of Operations (continued)
Capital
Capital data(dollar amounts in millions except pershare amounts; common shares inthousands) 2009 2008At period end:Common shareholders’ equity to assets
ratio 13.7% 10.6%Total shareholders’ equity $ 28,977 $ 28,050Tangible common shareholders’ equity
– Non-GAAP (a) $ 9,540 $ 5,950Book value per common share $ 23.99 $ 22.00Tangible book value per common share
– Non-GAAP (a) $ 7.90 $ 5.18Closing common stock price per share $ 27.97 $ 28.33Market capitalization $ 33,783 $ 32,536Common shares outstanding 1,207,835 1,148,467
Full-year:Average total shareholders’ equity to
average assets 13.4% 13.7%Cash dividends per common share $ 0.51 $ 0.96Dividend yield 1.8% 3.4%
(a) See Supplemental information beginning on page 74 for areconciliation of GAAP to non-GAAP.
The increase in total shareholders’ equity comparedwith Dec. 31, 2008 primarily resulted from animprovement in unrealized losses on the investmentsecurities portfolio resulting from improved pricing inthe fixed income market in 2009 and the restructuringof the securities portfolio. This improvement in OCIwas offset by lower retained earnings resulting fromthe impairment charges recorded in 2009. Alsoimpacting total shareholders’ equity was the commonstock offering of 48.3 million shares ($1.4 billion) in2009, which was more than offset by the repurchaseof the Series B preferred stock and warrant issued tothe U.S. Treasury in 2008. During 2009, retainedearnings decreased $1.3 billion.
In 2009, we acquired Insight and a 20% minorityinterest in Siguler Guff. In connection with thesetransactions, BNY Mellon issued approximately3 million common shares ($85 million).
In January 2010, we declared a quarterly commonstock dividend of $0.09 per common share that waspaid on Feb. 9, 2010, to shareholders of record as ofthe close of business on Feb. 1, 2010.
The Tier 1 capital ratio varies depending on the size ofthe balance sheet at quarter-end. The balance sheetsize fluctuates from quarter to quarter based on levelsof customer and market activity. In general, whenservicing clients are more actively trading securities,deposit balances and the balance sheet as a whole arehigher.
Our Tier 1 capital ratio was 12.1% at Dec. 31, 2009,compared with 13.2% at Dec. 31, 2008. The decreasein the Tier 1 capital ratio compared with Dec. 31,2008 primarily reflects the restructuring of theinvestment securities portfolio and the repurchase ofSeries B preferred stock issued as part of the TARPCapital Purchase Program (“CPP”), offset by theissuance of common shares in the second quarter of2009. At Dec. 31, 2009, our total assets were $212.2billion compared with $237.5 billion at Dec. 31, 2008.The decrease in assets had an immaterial impact onrisk-weighted assets as the decrease was in lower risk-weighted government investments.
A billion dollar change in risk-weighted assetschanges the Tier 1 ratio by approximately 11 basispoints while a $100 million change in common equitychanges the Tier 1 ratio by approximately 9 basispoints.
Our tangible common equity to tangible assets ratiowas 5.2% at Dec. 31, 2009, up from 3.8% at Dec. 31,2008. The increase compared with the prior yearprimarily reflects the improvement in pricing in thefixed income market in 2009 and the $1.4 billioncommon stock offering in 2009. The unrealized net oftax loss on our available-for-sale securities portfoliorecorded in other comprehensive income was $619million at Dec. 31, 2009 compared with $4.0 billion atDec. 31, 2008. The improvement reflects therestructuring of the investment securities portfolio andthe improvements in the fixed income markets.
Troubled Asset Relief Program
In October 2008, the U.S. Government announced theTroubled Asset Relief Program Capital PurchaseProgram authorized under the Emergency EconomicStabilization Act. See Note 18 of the Notes to theConsolidated Financial Statements for a furtherdiscussion of the impact of TARP on BNY Mellon.
Capital adequacy
Regulators establish certain levels of capital for bankholding companies and banks, including BNY Mellonand our bank subsidiaries, in accordance withestablished quantitative measurements. For the Parentto maintain its status as a financial holding company,our bank subsidiaries must, among other things,qualify as well capitalized. In addition, major bankholding companies such as the Parent are expected bythe regulators to be well capitalized.
64 BNY Mellon
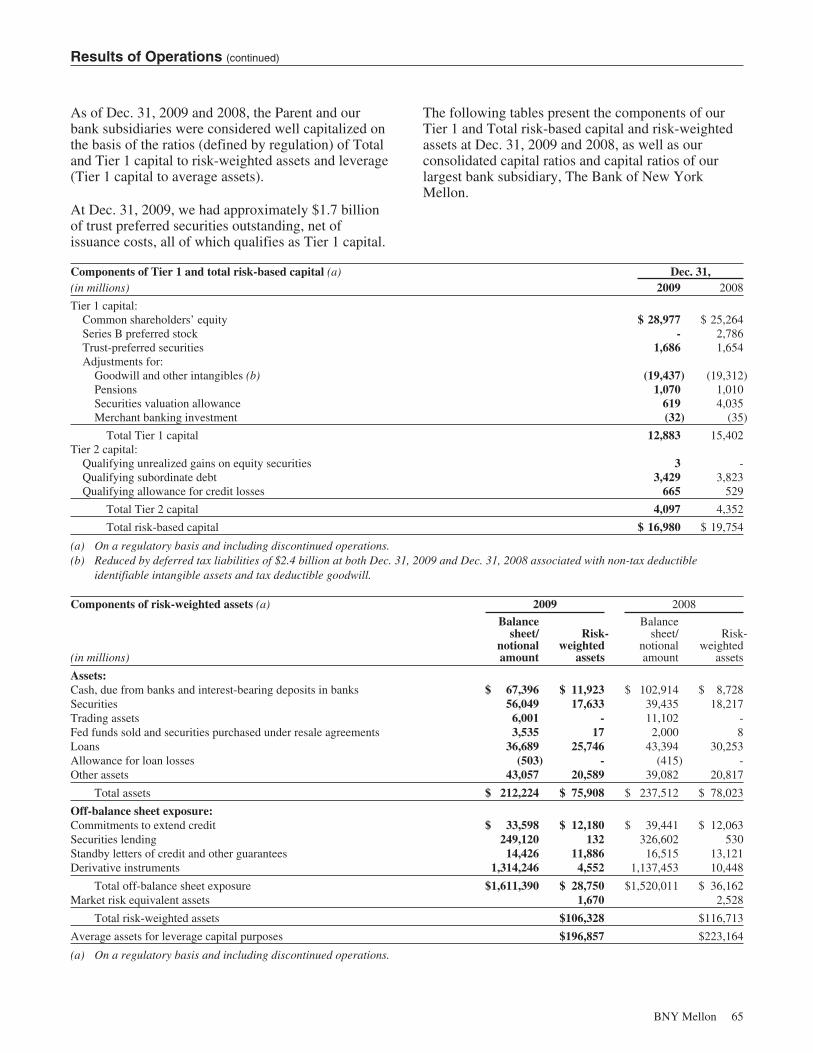
Results of Operations (continued)
As of Dec. 31, 2009 and 2008, the Parent and ourbank subsidiaries were considered well capitalized onthe basis of the ratios (defined by regulation) of Totaland Tier 1 capital to risk-weighted assets and leverage(Tier 1 capital to average assets).
At Dec. 31, 2009, we had approximately $1.7 billionof trust preferred securities outstanding, net ofissuance costs, all of which qualifies as Tier 1 capital.
The following tables present the components of ourTier 1 and Total risk-based capital and risk-weightedassets at Dec. 31, 2009 and 2008, as well as ourconsolidated capital ratios and capital ratios of ourlargest bank subsidiary, The Bank of New YorkMellon.
Components of Tier 1 and total risk-based capital (a) Dec. 31,(in millions) 2009 2008
Tier 1 capital:Common shareholders’ equity $ 28,977 $ 25,264Series B preferred stock - 2,786Trust-preferred securities 1,686 1,654Adjustments for:
Goodwill and other intangibles (b) (19,437) (19,312)Pensions 1,070 1,010Securities valuation allowance 619 4,035Merchant banking investment (32) (35)
Total Tier 1 capital 12,883 15,402Tier 2 capital:
Qualifying unrealized gains on equity securities 3 -Qualifying subordinate debt 3,429 3,823Qualifying allowance for credit losses 665 529
Total Tier 2 capital 4,097 4,352
Total risk-based capital $ 16,980 $ 19,754
(a) On a regulatory basis and including discontinued operations.(b) Reduced by deferred tax liabilities of $2.4 billion at both Dec. 31, 2009 and Dec. 31, 2008 associated with non-tax deductible
identifiable intangible assets and tax deductible goodwill.
Components of risk-weighted assets (a) 2009 2008
(in millions)
Balancesheet/
notionalamount
Risk-weighted
assets
Balancesheet/
notionalamount
Risk-weighted
assets
Assets:Cash, due from banks and interest-bearing deposits in banks $ 67,396 $ 11,923 $ 102,914 $ 8,728Securities 56,049 17,633 39,435 18,217Trading assets 6,001 - 11,102 -Fed funds sold and securities purchased under resale agreements 3,535 17 2,000 8Loans 36,689 25,746 43,394 30,253Allowance for loan losses (503) - (415) -Other assets 43,057 20,589 39,082 20,817
Total assets $ 212,224 $ 75,908 $ 237,512 $ 78,023
Off-balance sheet exposure:Commitments to extend credit $ 33,598 $ 12,180 $ 39,441 $ 12,063Securities lending 249,120 132 326,602 530Standby letters of credit and other guarantees 14,426 11,886 16,515 13,121Derivative instruments 1,314,246 4,552 1,137,453 10,448
Total off-balance sheet exposure $1,611,390 $ 28,750 $1,520,011 $ 36,162Market risk equivalent assets 1,670 2,528
Total risk-weighted assets $106,328 $116,713
Average assets for leverage capital purposes $196,857 $223,164
(a) On a regulatory basis and including discontinued operations.
BNY Mellon 65
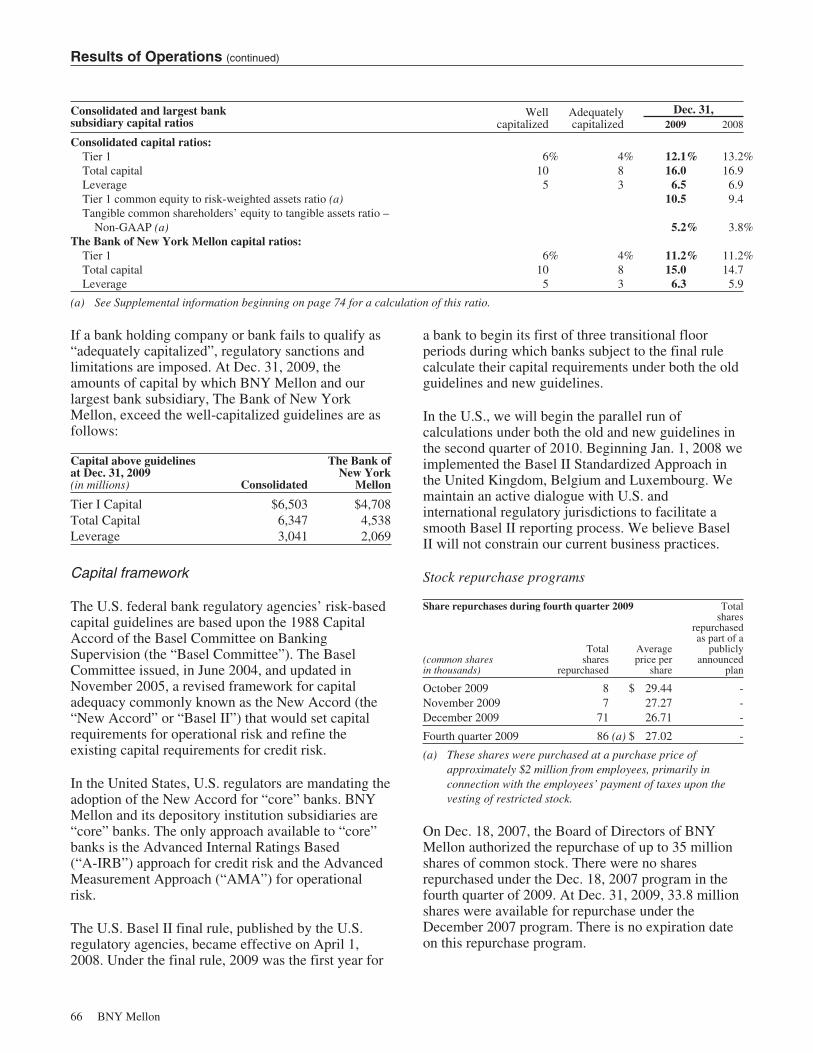
Results of Operations (continued)
Consolidated and largest banksubsidiary capital ratios
Wellcapitalized
Adequatelycapitalized
Dec. 31,2009 2008
Consolidated capital ratios:Tier 1 6% 4% 12.1% 13.2%Total capital 10 8 16.0 16.9Leverage 5 3 6.5 6.9Tier 1 common equity to risk-weighted assets ratio (a) 10.5 9.4Tangible common shareholders’ equity to tangible assets ratio –
Non-GAAP (a) 5.2% 3.8%The Bank of New York Mellon capital ratios:
Tier 1 6% 4% 11.2% 11.2%Total capital 10 8 15.0 14.7Leverage 5 3 6.3 5.9
(a) See Supplemental information beginning on page 74 for a calculation of this ratio.
If a bank holding company or bank fails to qualify as“adequately capitalized”, regulatory sanctions andlimitations are imposed. At Dec. 31, 2009, theamounts of capital by which BNY Mellon and ourlargest bank subsidiary, The Bank of New YorkMellon, exceed the well-capitalized guidelines are asfollows:
Capital above guidelinesat Dec. 31, 2009(in millions) Consolidated
The Bank ofNew York
Mellon
Tier I Capital $6,503 $4,708Total Capital 6,347 4,538Leverage 3,041 2,069
Capital framework
The U.S. federal bank regulatory agencies’ risk-basedcapital guidelines are based upon the 1988 CapitalAccord of the Basel Committee on BankingSupervision (the “Basel Committee”). The BaselCommittee issued, in June 2004, and updated inNovember 2005, a revised framework for capitaladequacy commonly known as the New Accord (the“New Accord” or “Basel II”) that would set capitalrequirements for operational risk and refine theexisting capital requirements for credit risk.
In the United States, U.S. regulators are mandating theadoption of the New Accord for “core” banks. BNYMellon and its depository institution subsidiaries are“core” banks. The only approach available to “core”banks is the Advanced Internal Ratings Based(“A-IRB”) approach for credit risk and the AdvancedMeasurement Approach (“AMA”) for operationalrisk.
The U.S. Basel II final rule, published by the U.S.regulatory agencies, became effective on April 1,2008. Under the final rule, 2009 was the first year for
a bank to begin its first of three transitional floorperiods during which banks subject to the final rulecalculate their capital requirements under both the oldguidelines and new guidelines.
In the U.S., we will begin the parallel run ofcalculations under both the old and new guidelines inthe second quarter of 2010. Beginning Jan. 1, 2008 weimplemented the Basel II Standardized Approach inthe United Kingdom, Belgium and Luxembourg. Wemaintain an active dialogue with U.S. andinternational regulatory jurisdictions to facilitate asmooth Basel II reporting process. We believe BaselII will not constrain our current business practices.
Stock repurchase programs
Share repurchases during fourth quarter 2009 Totalshares
repurchasedas part of a
publiclyannounced
plan(common sharesin thousands)
Totalshares
repurchased
Averageprice per
share
October 2009 8 $ 29.44 -November 2009 7 27.27 -December 2009 71 26.71 -
Fourth quarter 2009 86 (a) $ 27.02 -
(a) These shares were purchased at a purchase price ofapproximately $2 million from employees, primarily inconnection with the employees’ payment of taxes upon thevesting of restricted stock.
On Dec. 18, 2007, the Board of Directors of BNYMellon authorized the repurchase of up to 35 millionshares of common stock. There were no sharesrepurchased under the Dec. 18, 2007 program in thefourth quarter of 2009. At Dec. 31, 2009, 33.8 millionshares were available for repurchase under theDecember 2007 program. There is no expiration dateon this repurchase program.
66 BNY Mellon
Results of Operations (continued)
In June 2009, we completed a public offering of48.3 million shares of common stock at a weighted-average price of $28.75 per common share, for a totalof $1.4 billion. In November 2009, we issued2.0 million shares of common stock to HBOSInsurance & Investment Group Limited in connectionwith our acquisition of Insight that was exempt fromregistration under the Securities Act of 1933, pursuantto Section 4(2) thereof. Also in November 2009, weissued 1 million shares of common stock inconnection with our acquisition of a 20% minorityinterest in Siguler Guff to Siguler Guff’s sellingshareholders. This issuance was also exempt fromregistration under the Securities Act of 1933, pursuantto Section 4(2) thereof.
Risk management
The understanding, identification and management ofrisk are essential elements for the successfulmanagement of BNY Mellon. Our primary riskexposures are:
Type of risk Description
Credit The possible loss we would suffer if any of ourborrowers or other counterparties were todefault on their obligations to us. Credit riskarises primarily from lending, trading, andsecurities servicing activities.
Market The risk of loss due to adverse changes in thefinancial markets. Market risk arises fromderivative financial instruments, such as futures,forwards, swaps and options, and other financialinstruments, including loans, securities,deposits, and other borrowings. Our marketrisks are primarily interest rate and foreignexchange risk, equity risk and credit risk.
Operational The risk of loss resulting from inadequate orfailed internal processes, human factors andsystems, or from external events.
Risk management and oversight begins with theBoard of Directors and two key Board committees:the Risk Committee and the Audit Committee.
The Risk Committee is comprised entirely ofindependent directors and meets on a regular basis toreview and assess our risks, and to control processeswith respect to such risks, and our risk managementand fiduciary policies and activities. The delegation ofpolicy formulation and day-to-day oversight is to ourChief Risk Officer, who, together with the ChiefAuditor and Chief Compliance Officer, helps ensurean effective risk management structure. The functions
of the Risk Committee are described in more detail inits charter, a copy of which is available on ourwebsite, www.bnymellon.com.
The Audit Committee is also comprised entirely ofindependent directors, all of whom have beendetermined by the Board to have banking andfinancial management expertise within the meaning ofthe FDIC rules and to be financially literate within themeaning of the NYSE listing standards as interpretedby the Board, and two of whom have been determined(based upon education and experience as a principalaccounting or financial officer or public accountant, orexperience actively supervising a principal accountingor financial officer or public accountant) to be auditcommittee financial experts as set out in the rules andregulations under the Securities Exchange Act of1934, as amended (the “Exchange Act”), and to haveaccounting or related financial management expertisewithin the meaning of the NYSE listing standards asinterpreted by the Board. The Audit Committee meetson a regular basis to perform, among other things, anoversight review of the integrity of our financialstatements and financial reporting process,compliance with legal and regulatory requirements,our independent registered public accountant’squalifications and independence, and the performanceof our independent registered public accountant andour internal audit function. The Audit Committee alsoreviews management’s assessment of the adequacy ofinternal controls. The functions of the AuditCommittee are described in more detail in its charter,a copy of which is available on our website,www.bnymellon.com.
The Senior Risk Management Committee is thesenior-most management body that approves BNYMellon’s risk appetite and tolerances and sets strategicdirection and policy and provides oversight for therisk management, compliance and ethics framework.
Our risk management framework is designed to:
Š Provide that risks are identified, monitored,reported, and priced properly;
Š Define and communicate the types and amountof risk to take;
Š Communicate to the appropriate managementlevel, the type and amount of risk taken;
Š Maintain a risk management organization that isindependent of the risk taking activities; and
Š Promote a strong risk management culture thatencourages a focus on risk-adjustedperformance.
BNY Mellon 67
Results of Operations (continued)
Credit risk
To balance the value of our activities with the creditrisk incurred in pursuing them, we set and monitorinternal credit limits for activities that entail creditrisk, most often on the size of the exposure and themaximum maturity of credit extended. For creditexposures driven by changing market rates and prices,exposure measures include an add-on for suchpotential changes.
We manage credit risk at both the individual exposurelevel as well as at the portfolio level. Credit risk at theindividual exposure level is managed through ourcredit approval system of Divisional PortfolioManagers (“DPMs”) and the Chief Credit Officer(“CCO”). The DPMs and CCO are responsible forapproving the size, terms and maturity of all creditexposures as well as the ongoing monitoring of theexposures. In addition, they are responsible forassigning and maintaining the risk ratings on eachexposure.
Credit risk management at the portfolio level issupported by the Portfolio Management Division(“PMD”) within the Risk Management andCompliance Sector. The PMD is responsible forcalculating two fundamental credit measures. First, weproject a statistically expected credit loss, used to helpdetermine the appropriate loan loss reserve and tomeasure customer profitability. Expected lossconsiders three basic components: the estimated sizeof the exposure whenever default might occur, theprobability of default before maturity, and the severityof the loss we would incur, commonly called “lossgiven default.” For corporate banking, where most ofour credit risk is created, unfunded commitments areassigned a usage given default percentage. Borrowers/Counterparties are assigned ratings by DPMs and theCCO on an 18-grade scale, which translates to ascaled probability of default. Additionally,transactions are assigned loss-given-default ratings(on a 12-grade scale) that reflect the transactions’structures including the effects of guarantees,collateral, and relative seniority of position.
The second fundamental measurement of credit riskcalculated by the PMD is called economic capital. Oureconomic capital model estimates the capital requiredto support the overall credit risk portfolio. Using aMonte Carlo simulation engine and measures ofcorrelation among borrower defaults, the economic
model examines extreme and highly unlikelyscenarios of portfolio credit loss in order to estimatecredit related capital, and then allocates that capital toindividual borrowers and exposures. The credit relatedcapital calculation supports a second tier of policystandards and limits by serving as an input to bothprofitability analysis and concentration limits ofcapital at risk with any one borrower, industry orcountry.
The PMD is responsible for the calculationmethodologies and the estimates of the inputs used inthose methodologies for the determination of expectedloss and economic capital. These methodologies andinput estimates are regularly evaluated to ensure theirappropriateness and accuracy. As new techniques anddata become available, the PMD attempts toincorporate, where appropriate, those techniques ordata.
Credit risk is intrinsic to much of the banking businessand necessary to its smooth functioning. However,BNY Mellon seeks to limit both on and off-balancesheet credit risk through prudent underwriting and theuse of capital only where risk-adjusted returnswarrant. We seek to manage risk and improve ourportfolio diversification through syndications, assetsales, credit enhancements, credit derivatives, andactive collateralization and netting agreements. Inaddition, we have a separate Credit Risk Reviewgroup, which is part of Internal Audit, made up ofexperienced loan review officers who perform timelyreviews of the loan files and credit ratings assigned tothe loans.
Market risk
Our market risk governance structure is comprised ofsenior executives who review market risk activities,risk measurement methodologies and risk limits,approve new products and provide direction for ourmarket risk profile. The Head of Enterprise-widemarket risk reports to the Chief Risk Officer. TheAsset/Liability Management Committee, which is partof this structure, oversees the market risk managementprocess for interest rate risk related to asset/liabilitymanagement activities. Our market risk governancestructure is supported by a comprehensive riskmanagement process that is designed to help identify,measure, and manage market risk, as discussed under“Trading activities and risk management” and “Asset/liability management” below and in Note 27 of theNotes to Consolidated Financial Statements.
68 BNY Mellon

Results of Operations (continued)
Operational risk
Overview
In providing a comprehensive array of products andservices, we are exposed to operational risk.Operational risk may result from, but is not limited to,errors related to transaction processing, breaches ofthe internal control system and compliancerequirements, fraud by employees or persons outsideBNY Mellon or business interruption due to systemfailures or other events. Operational risk also includespotential legal or regulatory actions that could arise asa result of noncompliance with applicable laws and/orregulatory requirements. In the case of an operationalevent, we could suffer a financial loss as well asdamage to our reputation.
To address these risks, we maintain comprehensivepolicies and procedures and an internal controlframework designed to provide a sound operationalenvironment. These controls have been designed tomanage operational risk at appropriate levels givenour financial strength, the business environment andmarkets in which we operate, the nature of ourbusinesses, and considering factors such ascompetition and regulation. Our internal auditors andinternal control group monitor and test the overalleffectiveness of the internal control and financialreporting systems on an ongoing basis.
We have also established procedures that are designedto ensure that policies relating to conduct, ethics andbusiness practices are followed on a uniform basis.Among the procedures designed to ensureeffectiveness are our “Code of Conduct”, “KnowYour Customer”, and compliance training programs.
Operational risk management
We have established operational risk management asan independent risk discipline. The Operational RiskManagement (“ORM”) Group reports to the ChiefRisk Officer. The organizational framework foroperational risk is based upon a strong risk culturethat incorporates both governance and riskmanagement activities comprising:
Š Board Oversight and Governance—The RiskCommittee of the Board approves and overseesour operational risk management strategy inaddition to credit and market risk. The RiskCommittee meets regularly to review andapprove operational risk management initiatives,
discuss key risk issues, and review theeffectiveness of the risk management systems.
Š Business Line Accountability—Businessmanagers are responsible for maintaining aneffective system of internal controlscommensurate with their risk profiles and inaccordance with BNY Mellon policies andprocedures.
Š ORM Group—The ORM Group is responsiblefor developing risk management policies andtools for assessing, measuring, monitoring andmanaging operational risk for BNY Mellon. Theprimary objectives of the ORM group are topromote effective risk management, identifyemerging risks, create incentives for generatingcontinuous improvement in controls, and tooptimize capital.
Global compliance
Our global compliance function provides leadership,guidance, and oversight to help business units identifyapplicable laws and regulations and implementeffective measures to meet the specific requirements.Compliance takes a proactive approach byanticipating evolving regulatory standards andremaining aware of industry best practices, legislativeinitiatives, competitive issues, and public expectationsand perceptions. The function uses its global reach todisseminate information about compliance-relatedmatters throughout BNY Mellon. The ChiefCompliance and Ethics Officer reports to the ChiefRisk Officer, is a member of all critical committees ofBNY Mellon and provides regular updates to theAudit Committee of the Board of Directors.
Internal audit
Our internal audit function reports directly to theAudit Committee of the Board of Directors. Internalaudit utilizes a risk-based approach to its audit activitycovering the risks in the operational, compliance,regulatory, technology, fraud, processing and otherkey risk areas of BNY Mellon. Internal Audit hasunrestricted access to BNY Mellon and regularlyparticipates in key committees of BNY Mellon.
Economic capital
BNY Mellon has implemented a methodology toquantify economic capital. We define economiccapital as the capital required to protect againstunexpected economic losses over a one-year period at
BNY Mellon 69
Results of Operations (continued)
a level consistent with the solvency of a firm with atarget debt rating. We quantify economic capitalrequirements for the risks inherent in our businessactivities using statistical modeling techniques andthen aggregate them at the consolidated level. Acapital reduction, or diversification benefit, is appliedto reflect the unlikely event of experiencing anextremely large loss in each type of risk at the sametime. Economic capital levels are directly related toour risk profile. As such, it has become a part of ourinternal capital assessment process and, along withregulatory capital, is a key component to ensuring thatthe actual level of capital is commensurate with ourrisk profile, and is sufficient to provide the financialflexibility to undertake future strategic businessinitiatives.
The framework and methodologies to quantify each ofour risk-types have been developed by the PMD andare designed to be consistent with our riskmanagement principles. The framework has beenapproved by senior management and has beenreviewed by the Risk Committee of the Board ofDirectors. Due to the evolving nature of quantificationtechniques, we expect to continue to refine themethodologies used to estimate our economic capitalrequirements.
Trading activities and risk management
Our trading activities are focused on acting as amarket maker for our customers. The risk from thesemarket-making activities and from our own positionsis managed by our traders and limited in totalexposure through a system of position limits, avalue-at-risk (“VAR”) methodology based on a MonteCarlo simulation, stop loss advisory triggers, andother market sensitivity measures. See Note 27 of theNotes to Consolidated Financial Statements foradditional information on the VAR methodology.
The following tables indicate the calculated VARamounts for the trading portfolio for the years endedDec. 31, 2009 and 2008.
VAR (a)
(in millions)
2009
Average Minimum Maximum Dec. 31
Interest rate $ 5.8 $ 2.8 $11.7 $ 6.9Foreign exchange 2.4 0.8 5.6 1.0Equity 2.7 1.3 8.1 1.6Credit 2.9 0.7 7.5 0.7Diversification (6.1) N/M N/M (2.1)Overall portfolio 7.7 3.9 13.5 8.1
VAR (a)
(in millions)
2008
Average Minimum Maximum Dec. 31
Interest rate $ 6.6 $ 2.5 $14.6 $ 4.9Foreign exchange 2.1 0.8 5.7 1.5Equity 3.4 1.0 9.8 8.7Credit 4.7 1.9 10.7 7.5Diversification (6.7) N/M N/M (7.9)Overall portfolio 10.1 4.6 18.9 14.7
(a) VAR figures do not reflect the impact of the credit valuationadjustment guidance in ASC 820. This is consistent with theRegulatory treatment.
N/M - Because the minimum and maximum may occur on differentdays for different risk components, it is not meaningful tocompute a portfolio diversification effect.
During 2009, interest rate risk generated 42% ofaverage VAR, credit risk generated 21% of averageVAR, equity risk generated 20% of average VAR, andforeign exchange risk accounted for 17% of averageVAR. During 2009, our daily trading loss did notexceed our calculated VAR amount of the overallportfolio on any given day.
BNY Mellon monitors a volatility index of globalcurrency using a basket of 30 major currencies. In2009, the volatility of this index decreased from theabnormally high levels experienced in 2008.
The extraordinary financial environment and theconsequent volatility experienced in the last half of2008 and the first half of 2009 contributed to elevatedtrading earnings during those periods, evidenced bythe number of days where revenue exceeded $5million. As the global economy stabilized, volatilitydeclined, and trading performance returned to a morenormalized level.
The following table of total daily trading revenue orloss captures this performance and illustrates thenumber of trading days in which our trading revenueor loss fell within particular ranges during the pastyear.
Distribution of trading revenues (losses) (a)Quarter ended
Dec. 31,2008
March 31,2009
June 30,2009
Sept. 30,2009
Dec. 31,2009
Revenue range(in millions): Number of days
Less than $(2.5) 1 1 2 - 1$(2.5) - $0 - 1 2 5 5$0 - $2.5 6 5 11 16 13$2.5 - $5.0 14 21 23 24 22More than $5.0 41 33 26 19 21
(a) Distribution of trading revenues (losses) does not reflect the impact ofthe credit valuation adjustment guidance in ASC 820. This isconsistent with the Regulatory treatment.
70 BNY Mellon
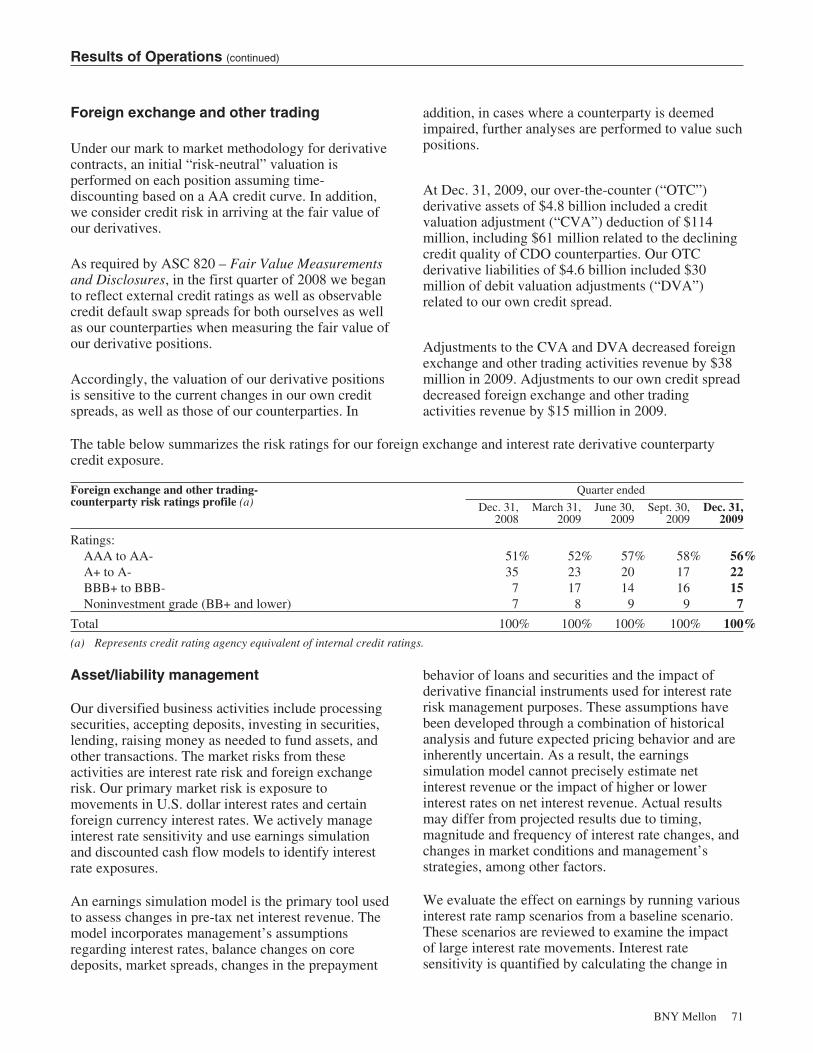
Results of Operations (continued)
Foreign exchange and other trading
Under our mark to market methodology for derivativecontracts, an initial “risk-neutral” valuation isperformed on each position assuming time-discounting based on a AA credit curve. In addition,we consider credit risk in arriving at the fair value ofour derivatives.
As required by ASC 820 – Fair Value Measurementsand Disclosures, in the first quarter of 2008 we beganto reflect external credit ratings as well as observablecredit default swap spreads for both ourselves as wellas our counterparties when measuring the fair value ofour derivative positions.
Accordingly, the valuation of our derivative positionsis sensitive to the current changes in our own creditspreads, as well as those of our counterparties. In
addition, in cases where a counterparty is deemedimpaired, further analyses are performed to value suchpositions.
At Dec. 31, 2009, our over-the-counter (“OTC”)derivative assets of $4.8 billion included a creditvaluation adjustment (“CVA”) deduction of $114million, including $61 million related to the decliningcredit quality of CDO counterparties. Our OTCderivative liabilities of $4.6 billion included $30million of debit valuation adjustments (“DVA”)related to our own credit spread.
Adjustments to the CVA and DVA decreased foreignexchange and other trading activities revenue by $38million in 2009. Adjustments to our own credit spreaddecreased foreign exchange and other tradingactivities revenue by $15 million in 2009.
The table below summarizes the risk ratings for our foreign exchange and interest rate derivative counterpartycredit exposure.
Foreign exchange and other trading-counterparty risk ratings profile (a)
Quarter ended
Dec. 31,2008
March 31,2009
June 30,2009
Sept. 30,2009
Dec. 31,2009
Ratings:AAA to AA- 51% 52% 57% 58% 56%A+ to A- 35 23 20 17 22BBB+ to BBB- 7 17 14 16 15Noninvestment grade (BB+ and lower) 7 8 9 9 7
Total 100% 100% 100% 100% 100%(a) Represents credit rating agency equivalent of internal credit ratings.
Asset/liability management
Our diversified business activities include processingsecurities, accepting deposits, investing in securities,lending, raising money as needed to fund assets, andother transactions. The market risks from theseactivities are interest rate risk and foreign exchangerisk. Our primary market risk is exposure tomovements in U.S. dollar interest rates and certainforeign currency interest rates. We actively manageinterest rate sensitivity and use earnings simulationand discounted cash flow models to identify interestrate exposures.
An earnings simulation model is the primary tool usedto assess changes in pre-tax net interest revenue. Themodel incorporates management’s assumptionsregarding interest rates, balance changes on coredeposits, market spreads, changes in the prepayment
behavior of loans and securities and the impact ofderivative financial instruments used for interest raterisk management purposes. These assumptions havebeen developed through a combination of historicalanalysis and future expected pricing behavior and areinherently uncertain. As a result, the earningssimulation model cannot precisely estimate netinterest revenue or the impact of higher or lowerinterest rates on net interest revenue. Actual resultsmay differ from projected results due to timing,magnitude and frequency of interest rate changes, andchanges in market conditions and management’sstrategies, among other factors.
We evaluate the effect on earnings by running variousinterest rate ramp scenarios from a baseline scenario.These scenarios are reviewed to examine the impactof large interest rate movements. Interest ratesensitivity is quantified by calculating the change in
BNY Mellon 71

Results of Operations (continued)
pre-tax net interest revenue between the scenariosover a 12-month measurement period.
The following table shows net interest revenuesensitivity for BNY Mellon:
Estimated changes in net interest revenue Dec. 31, 2009
(dollar amounts in millions) $ %
up 200 bps vs. baseline $318 10.9%up 100 bps vs. baseline 259 8.8
The baseline scenario’s Fed Funds rate in the Dec. 31,2009 analysis was 0.25%. The 100 basis point rampscenario assumes short-term rates change 25 basispoints in each of the next four quarters and the 200basis point ramp scenario assumes a 50 basis point perquarter change. Both the up 200 basis point and the up100 basis point Dec. 31, 2009 scenarios assume10-year rates rising 196 and 96 basis points,respectively.
These scenarios do not reflect strategies thatmanagement could employ to limit the impact asinterest rate expectations change. The previous tablerelies on certain critical assumptions regarding thebalance sheet and depositors’ behavior related tointerest rate fluctuations and the prepayment andextension risk in certain of our assets. To the extentthat actual behavior is different from that assumed inthe models, there could be a change in interest ratesensitivity.
We also project future cash flows from our assets andliabilities over a long-term horizon and then discountthese cash flows using instantaneous parallel shocksto interest rates. The aggregation of these discountedcash flows is the Economic Value of Equity (“EVE”).The following table shows how the EVE wouldchange in response to changes in interest rates:
Estimated changes in EVE at Dec. 31, 2009
Rate change:up 200 bps vs. baseline (1.3)%up 100 bps vs. baseline (0.7)
These results do not reflect strategies thatmanagement could employ to limit the impact asinterest rate expectations change.
The asymmetrical accounting treatment of the impactof a change in interest rates on our balance sheet maycreate a situation in which an increase in interest ratescan adversely affect reported equity and regulatory
capital, even though economically there may be noimpact on our economic capital position. For example,an increase in rates will result in a decline in the valueof our fixed income investment portfolio, which willbe reflected through a reduction in othercomprehensive income in our shareholders’ equity,thereby affecting our tangible common equity(“TCE”) ratios. Under current accounting rules, to theextent the fair value option provided in ASC 825 isnot applied, there is no corresponding change on ourfixed liabilities, even though economically theseliabilities are more valuable as rates rise.
We project the impact of this change using the sameinterest rate shock assumptions described earlier andcompare the projected mark-to-market on theinvestment securities portfolio at Dec. 31, 2009, underthe higher rate environments versus a stable ratescenario. The table below shows the impact of achange in interest rates on the TCE ratio:
Estimated changes in the TCE ratio at Dec. 31, 2009(in basis points)
up 200 bps vs. baseline (91)up 100 bps vs. baseline (47)
These results do not reflect strategies thatmanagement could employ to limit the impact asinterest rate expectations change.
To manage foreign exchange risk, we fund foreigncurrency-denominated assets with liability instrumentsdenominated in the same currency. We utilize variousforeign exchange contracts if a liability denominatedin the same currency is not available or desired, and tominimize the earnings impact of translation gains orlosses created by investments in foreign markets. Theforeign exchange risk related to the interest ratespread on foreign currency-denominated asset/liabilitypositions is managed as part of our trading activities.We use forward foreign exchange contracts to protectthe value of our net investment in foreign operations.At Dec. 31, 2009, net investments in foreignoperations totaled approximately $6.0 billion andwere spread across 14 foreign currencies.
Business continuity
We are prepared for events that could damage ourphysical facilities, cause delay or disruptions tooperational functions, including telecommunicationsnetworks, or impair our clients, vendors, andcounterparties. Key elements of our businesscontinuity strategies are extensive planning and
72 BNY Mellon
Results of Operations (continued)
testing, and diversity of business operations, datacenters and telecommunications infrastructure.
We have established multiple geographically diverselocations for our funds transfer and broker-dealerservices operational units, which provide redundantfunctionality to facilitate uninterrupted operations.
Our securities clearing, mutual fund accounting andcustody, securities lending, master trust, UnitInvestment Trust, corporate trust, stock transfer, itemprocessing, wealth management and treasury unitshave common functionality in multiple sites designedto facilitate continuance of operations or rapidrecovery. In addition, we have recovery positions forover 13,900 employees on a global basis of whichover 7,700 are proprietary.
We continue to enhance geographic diversity forbusiness operations by moving additional personnel togrowth centers outside of existing major urbancenters. We replicate 100% of our critical productioncomputer data to multiple recovery data centers.
We have an active telecommunications diversityprogram. All major buildings and data centers havediverse telecommunications carriers. The data centershave multiple fiber optic rings and have been designedso that there is no single point of failure. All majorbuildings have been designed with diversetelecommunications access and connect to at least twogeographically dispersed connection points. We havean active program to audit circuits for route diversityand to test customer back-up connections.
In 2003, the Federal Reserve, OCC and SEC jointlypublished the Interagency Paper, “Sound Practices to
Strengthen the Resilience of the U.S. FinancialSystem” (“Sound Practices Paper”). The purpose ofthe document was to define the guidelines for thefinancial services industry and other interested partiesregarding “best practices” related to businesscontinuity planning. Under these guidelines we are akey clearing and settlement organization required tomeet a higher standard for business continuity.
We believe we have substantially met all of therequirements of the Sound Practices Paper. As a coreclearing and settlement organization, we believe thatwe are at the forefront of the industry in improvingbusiness continuity practices.
We are committed to seeing that requirements forbusiness continuity are met not just within our ownfacilities, but also within those of vendors and serviceproviders whose operation is critical to our safety andsoundness. To that end, we have a Service ProviderManagement Office whose function is to review newand existing service providers and vendors to see thatthey meet our standards for business continuity, aswell as for information security, financial stability,and personnel practices, etc.
We have developed a comprehensive plan to preparefor the possibility of a flu pandemic, which anticipatessignificant reduced staffing levels and will provide forincreased remote working by staff for one or moreperiods lasting several weeks.
Although we are committed to observing bestpractices as well as meeting regulatory requirements,geopolitical uncertainties and other external factorswill continue to create risk that cannot always beidentified and anticipated.
BNY Mellon 73
Supplemental Information (unaudited)
Explanation of Non-GAAP financial measures
BNY Mellon has included in this Annual Reportcertain Non-GAAP financial measures based upontangible common shareholders’ equity. BNY Mellonbelieves that the ratio of tangible commonshareholders’ equity to tangible assets is a measure ofcapital strength that adds additional useful informationto investors supplementing the Tier 1 capital ratiowhich is utilized by regulatory authorities. Unlike theTier 1 ratio, the tangible common shareholders’ equityratio fully incorporates those changes in investmentsecurities valuations which are reflected inshareholders’ equity. In addition, this ratio isexpressed as a percentage of the actual book value ofassets, as opposed to a percentage of a risk-basedreduced value established in accordance withregulatory requirements, although BNY Mellon in itscalculation has excluded certain assets which aregiven a zero percent risk-weighting for regulatorypurposes. This ratio is also informative to investors inBNY Mellon’s common stock because, unlike the Tier1 capital ratio, it excludes preferred stock and trustpreferred securities issued by BNY Mellon. Further,BNY Mellon believes that the return on tangiblecommon equity measure, which excludes goodwilland intangible assets net of deferred tax liabilities, is auseful additional measure for investors because itpresents a measure of BNY Mellon’s performance inreference to those assets which are productive ingenerating income.
BNY Mellon has provided a measure of tangible bookvalue per share, which it believes provides additionaluseful information as to the level of such assets inrelation to shares of common stock outstanding. BNYMellon has presented revenue measures whichexclude the effect of investment securities gains(losses) and SILO/LILO charges; expense measureswhich exclude restructuring charges, an FDIC specialassessment, support agreement charges, asset-basedtaxes, M&I expenses and intangible amortizationexpense; and measures which utilize net incomeexcluding tax items such as the benefit of taxsettlements and discrete tax benefits related to a taxloss on mortgages. Return on equity measures andoperating margin measures which exclude some or allof these items are also presented. BNY Mellonbelieves that these measures are useful to investorsbecause they permit a focus on period to periodcomparisons which relate to the ability of BNYMellon to enhance revenues and limit expenses incircumstances where such matters are within BNYMellon’s control. The excluded items in general relate
to situations where accounting rules require certainongoing charges as a result of prior transactions, orwhere valuation or other accounting/regulatoryrequirements require charges unrelated to operationalinitiatives. M&I expenses relate to our CorporateTrust Acquisition in 2006 and to the merger withMellon Financial Corporation in 2007. M&I expensesgenerally continue for approximately three years afterthe transaction and can vary on a year-to-year basisdepending on the stage of the integration. BNYMellon believes that the exclusion of M&I expensesprovides investors with a focus on BNY Mellon’sbusiness as it would appear on a consolidated going-forward basis, after such M&I expenses have ceased,typically after approximately three years. Futureperiods will not reflect such M&I expenses, and thusmay be more easily compared to our current results ifM&I expenses are excluded. With regard to theexclusion of investment securities gains (losses), BNYMellon’s primary businesses are Asset and WealthManagement and Institutional Services. Themanagement of these sectors is evaluated on the basisof the ability of these businesses to generate fee andnet interest revenue and to control expenses, and noton the results of BNY Mellon’s investment securitiesportfolio. Management of the investment securitiesportfolio is a shared service contained in the Othersegment. The primary objective of the investmentsecurities portfolio is to generate net interest revenuefrom the liquidity generated by BNY Mellon’sprocessing businesses. BNY Mellon does notgenerally originate or trade the securities in theinvestment securities portfolio. As a result, BNYMellon believes that presenting measures that excludeinvestment securities gains (losses) from its results, asa supplement to GAAP information, gives investors aclearer picture of the results of its primary businesses.The SILO/LILO charges relate to a one-timesettlement with the IRS of tax structured leasetransactions in 2008. BNY Mellon believes thatexcluding the SILO/LILO charges from net interestrevenue provides investors with a clearer impact ofthe net interest margin generated on our interest-earning assets. Restructuring charges relate tomigrating positions to global growth centers and theelimination of certain positions. Excluding thediscrete tax benefits related to a tax loss on mortgagespermits investors to calculate the tax impact of BNYMellon’s primary businesses.
In this Annual Report, certain amounts are presentedon an FTE basis. We believe that this presentationprovides comparability of amounts arising from bothtaxable and tax-exempt sources, and is consistent with
74 BNY Mellon
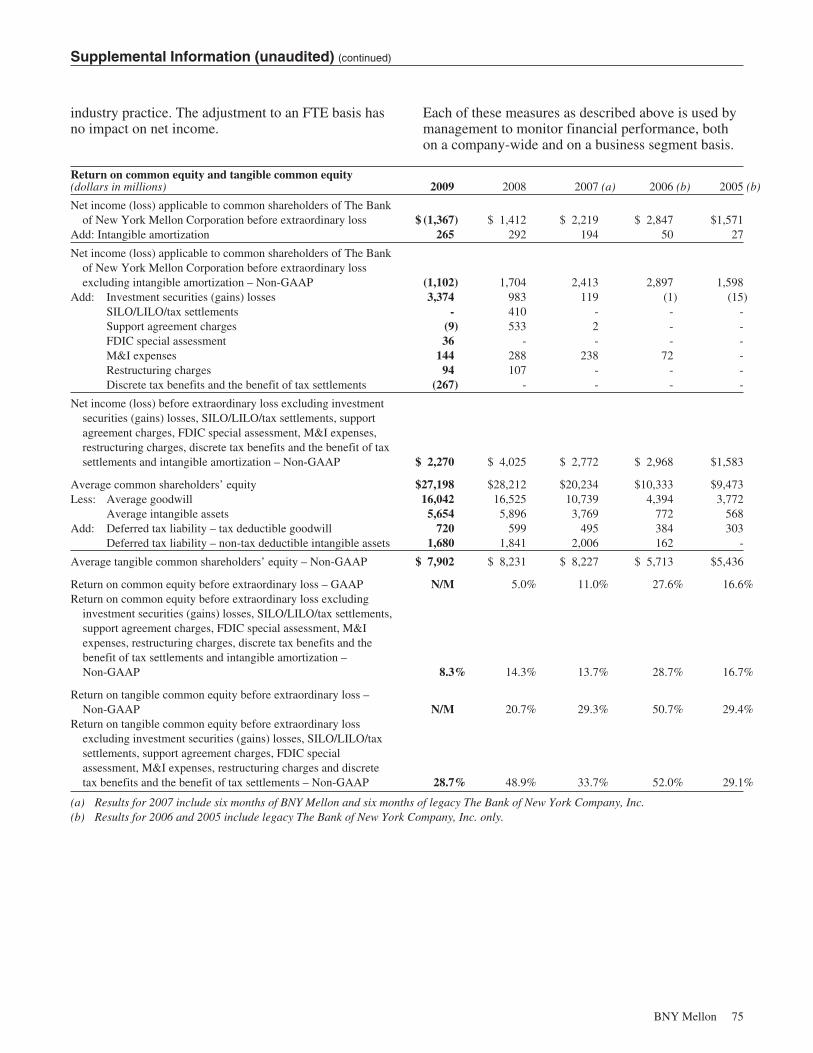
Supplemental Information (unaudited) (continued)
industry practice. The adjustment to an FTE basis hasno impact on net income.
Each of these measures as described above is used bymanagement to monitor financial performance, bothon a company-wide and on a business segment basis.
Return on common equity and tangible common equity(dollars in millions) 2009 2008 2007 (a) 2006 (b) 2005 (b)
Net income (loss) applicable to common shareholders of The Bankof New York Mellon Corporation before extraordinary loss $ (1,367) $ 1,412 $ 2,219 $ 2,847 $1,571
Add: Intangible amortization 265 292 194 50 27
Net income (loss) applicable to common shareholders of The Bankof New York Mellon Corporation before extraordinary lossexcluding intangible amortization – Non-GAAP (1,102) 1,704 2,413 2,897 1,598
Add: Investment securities (gains) losses 3,374 983 119 (1) (15)SILO/LILO/tax settlements - 410 - - -Support agreement charges (9) 533 2 - -FDIC special assessment 36 - - - -M&I expenses 144 288 238 72 -Restructuring charges 94 107 - - -Discrete tax benefits and the benefit of tax settlements (267) - - - -
Net income (loss) before extraordinary loss excluding investmentsecurities (gains) losses, SILO/LILO/tax settlements, supportagreement charges, FDIC special assessment, M&I expenses,restructuring charges, discrete tax benefits and the benefit of taxsettlements and intangible amortization – Non-GAAP $ 2,270 $ 4,025 $ 2,772 $ 2,968 $1,583
Average common shareholders’ equity $27,198 $28,212 $20,234 $10,333 $9,473Less: Average goodwill 16,042 16,525 10,739 4,394 3,772
Average intangible assets 5,654 5,896 3,769 772 568Add: Deferred tax liability – tax deductible goodwill 720 599 495 384 303
Deferred tax liability – non-tax deductible intangible assets 1,680 1,841 2,006 162 -
Average tangible common shareholders’ equity – Non-GAAP $ 7,902 $ 8,231 $ 8,227 $ 5,713 $5,436
Return on common equity before extraordinary loss – GAAP N/M 5.0% 11.0% 27.6% 16.6%Return on common equity before extraordinary loss excluding
investment securities (gains) losses, SILO/LILO/tax settlements,support agreement charges, FDIC special assessment, M&Iexpenses, restructuring charges, discrete tax benefits and thebenefit of tax settlements and intangible amortization –Non-GAAP 8.3% 14.3% 13.7% 28.7% 16.7%
Return on tangible common equity before extraordinary loss –Non-GAAP N/M 20.7% 29.3% 50.7% 29.4%
Return on tangible common equity before extraordinary lossexcluding investment securities (gains) losses, SILO/LILO/taxsettlements, support agreement charges, FDIC specialassessment, M&I expenses, restructuring charges and discretetax benefits and the benefit of tax settlements – Non-GAAP 28.7% 48.9% 33.7% 52.0% 29.1%
(a) Results for 2007 include six months of BNY Mellon and six months of legacy The Bank of New York Company, Inc.(b) Results for 2006 and 2005 include legacy The Bank of New York Company, Inc. only.
BNY Mellon 75

Supplemental Information (unaudited) (continued)
Reconciliation of income (loss) from continuing operationsbefore income taxes – pre-tax operating margin(dollars in millions) 2009 2008 2007 (a) 2006 (b) 2005 (b)
Income (loss) from continuing operations before income taxes – GAAP $ (2,208) $ 1,946 $ 3,215 $2,183 $1,984Add: Investment securities (gains) losses 5,369 1,628 201 (2) (22)
SILO/LILO charges - 489 - - -Support agreement charges (15) 894 3 - -FDIC special assessment 61 - - - -M&I expenses 233 483 404 106 -Restructuring charges 150 181 - - -Asset-based taxes 20 - - - -Intangible amortization 426 473 314 76 40
Income (loss) from continuing operations before income taxesexcluding investment securities (gains) losses, SILO/LILO charges,support agreement charges, FDIC special assessment, M&Iexpenses, restructuring charges, asset-based taxes and intangibleamortization – Non-GAAP $ 4,036 $ 6,094 $ 4,137 $2,363 $2,002
Fee and other revenue – GAAP $ 4,772 $10,714 $ 9,053 $5,339 $4,715Net interest revenue – GAAP $ 2,915 $ 2,859 $ 2,245 $1,499 $1,340
Total revenue – GAAP 7,687 13,573 11,298 6,838 6,055Add: Investment securities (gains) losses 5,369 1,628 201 (2) (22)
SILO/LILO charges - 489 - - -
Total revenue excluding investment securities (gains) losses andSILO/LILO charges – Non-GAAP $13,056 $15,690 $11,499 $6,836 $6,033
Pre-tax operating margin (c) N/M 14% 28% 32% 33%Pre-tax operating margin, excluding investment securities (gains)
losses, SILO/LILO charges, support agreement charges, FDICspecial assessment, M&I expenses, restructuring charges, asset-based taxes and intangible amortization – Non-GAAP (c) 31% 39% 36% 35% 33%
(a) Results for 2007 include six months of BNY Mellon and six months of legacy The Bank of New York Company, Inc.(b) Results for 2006 and 2005 include legacy The Bank of New York Company, Inc. only.(c) Income (loss) before taxes divided by total revenue.
Reconciliation of fee and other revenueas a percent of total revenue(dollars in millions) 2009 2008 2007 (a) 2006 (b) 2005 (b)
Fee and other revenue – GAAP $ 4,772 $10,714 $ 9,053 $5,339 $4,715Less: Investment securities gains (losses) (5,369) (1,628) (201) 2 22
Fee and other revenue excluding investment securities gains(losses) – Non-GAAP 10,141 12,342 9,254 5,337 4,693
Net interest revenue – GAAP 2,915 2,859 2,245 1,499 1,340Add: SILO/LILO charges - 489 - - -
Net interest revenue excluding SILO/LILO charges – Non-GAAP 2,915 3,348 2,245 1,499 1,340
Total revenue – GAAP $ 7,687 $13,573 $11,298 $6,838 $6,055Total revenue excluding investment securities gains (losses)
and SILO/LILO charges – Non-GAAP $13,056 $15,690 $11,499 $6,836 $6,033
Fee and other revenue as a percentage of total revenue 62% 79% 80% 78% 78%Fee and other revenue as a percentage of total revenue excluding
investment securities gains (losses) and SILO/LILO charges –Non-GAAP 78% 79% 80% 78% 78%
(a) Results for 2007 include six months of BNY Mellon and six months of legacy The Bank of New York Company, Inc.(b) Results for 2006 and 2005 include legacy The Bank of New York Company, Inc. only.
76 BNY Mellon

Supplemental Information (unaudited) (continued)
Equity to assets and book value per common share(dollars in millions, except per shareamounts and unless otherwise noted) 2009 2008 2007 2006 (a) 2005 (a)
Common shareholders’ equity at period end – GAAP $ 28,977 $ 25,264 $ 29,403 $ 11,429 $ 9,876Less: Goodwill 16,249 15,898 16,331 5,008 3,619
Intangible assets 5,588 5,856 6,402 1,453 811Add: Deferred tax liability – tax deductible goodwill 720 599 495 384 303
Deferred tax liability – non-tax deductibleintangible assets 1,680 1,841 2,006 162 -
Tangible common shareholders’ equity at period end– Non-GAAP $ 9,540 $ 5,950 $ 9,171 $ 5,514 $ 5,749
Total assets at period end – GAAP $ 212,224 $ 237,512 $ 197,656 $103,206 $102,118Less: Goodwill 16,249 15,898 16,331 5,008 3,619
Intangible assets 5,588 5,856 6,402 1,453 811Cash on deposit with the Federal Reserve and
other central banks (b) 7,375 53,278 80 - -U.S. Government-backed commercial
paper (b) - 5,629 - - -
Tangible total assets at period end – Non-GAAP $ 183,012 $ 156,851 $ 174,843 $ 96,745 $ 97,688
Common shareholders’ equity to assets – GAAP 13.7% 10.6% 14.9% 11.1% 9.7%Tangible common shareholders’ equity to tangible
assets – Non-GAAP 5.2% 3.8% 5.2% 5.7% 5.9%
Period end common shares outstanding (in thousands) 1,207,835 1,148,467 1,145,983 713,079 727,483
Book value per common share $ 23.99 $ 22.00 $ 25.66 $ 16.03 $ 13.57Tangible book value per common share – Non-GAAP $ 7.90 $ 5.18 $ 8.00 $ 7.73 $ 7.90
(a) The 2006 and 2005 share-related data includes legacy The Bank of New York Company, Inc. only and is presented in post mergershare count terms.
(b) Assigned a zero percent risk weighting by the regulators.
Calculation of the Tier 1 common equityto risk-weighted assets ratio (a)(dollars in millions) 2009 2008 2007 2006 (b) 2005 (b)
Total Tier 1 capital $ 12,883 $ 15,402 $ 11,259 $ 6,350 $ 6,643Less: Trust preferred securities 1,686 1,654 2,030 1,150 1,150
Series B preferred stock - 2,786 - - -
Total Tier 1 common equity $ 11,197 $ 10,962 $ 9,229 $ 5,200 $ 5,493
Total risk-weighted assets $106,328 $116,713 $120,866 $77,567 $79,282Tier 1 common equity to risk-weighted assets ratio 10.5% 9.4% 7.6% 6.7% 6.9%
(a) On a regulatory basis. Includes discontinued operations.(b) Results for 2006 and 2005 include legacy The Bank of New York Company, Inc. only.
BNY Mellon 77

Supplemental Information (unaudited) (continued)
Rate/volume analysis
Rate/Volume analysis (a) 2009 over (under) 2008 2008 over (under) 2007
Due to change in Due to change in
(dollar amounts in millions, presented on an FTE basis)Averagebalance
Averagerate
Netchange
Averagebalance
Averagerate
Netchange
Interest revenueInterest-earning assets:
Interest-bearing deposits with banks (primarily foreign banks) $ 295 $(1,365) $(1,070) $ 792 $ (281) $ 511Interest-bearing deposits with the Federal Reserve and other
central banks 29 (13) 16 - 27 27Other short-term investments – U.S. government-backed
commercial paper (60) (2) (62) - 71 71Federal funds sold and securities under resale agreements (55) (63) (118) 35 (175) (140)Margin loans (31) (83) (114) 2 (151) (149)Non-margin loans:
Domestic offices:Consumer (32) (13) (45) 79 (40) 39Commercial (55) 260 205 110 (818) (708)
Foreign offices (89) (224) (313) 79 (209) (130)Total non-margin loans (176) 23 (153) 268 (1,067) (799)
Securities:U.S. government obligations 44 (12) 32 12 (5) 7U.S. government agency obligations 201 (88) 113 180 (70) 110State and political subdivisions (5) (3) (8) 25 3 28Other securities:
Domestic offices (132) (285) (417) 178 (54) 124Foreign offices 111 (330) (219) 44 56 100Total other securities (21) (615) (636) 222 2 224
Trading securities:Domestic offices 8 (24) (16) 23 (4) 19Foreign offices (2) (2) (4) (33) (13) (46)
Total trading securities 6 (26) (20) (10) (17) (27)Total securities 225 (744) (519) 429 (87) 342Total interest revenue $ 227 $(2,247) $(2,020) $1,526 $(1,663) $(137)
Interest expenseInterest-bearing deposits
Domestic offices:Money market rate accounts $ 34 $ (150) $ (116) $ 67 $ (274) $(207)Savings 2 (9) (7) 7 (11) (4)Certificates of deposits of $100,000 & over (21) (29) (50) (34) (58) (92)Other time deposits (22) (79) (101) 130 (65) 65
Total domestic (7) (267) (274) 170 (408) (238)Foreign offices:
Banks (69) (102) (171) 65 (239) (174)Government and official institutions (7) (17) (24) 10 (30) (20)Other 204 (1,329) (1,125) 460 (641) (181)
Total foreign 128 (1,448) (1,320) 535 (910) (375)Total interest-bearing deposits 121 (1,715) (1,594) 705 (1,318) (613)
Federal funds purchased and securities sold under repurchaseagreements (14) (32) (46) 55 (119) (64)
Other borrowed funds:Domestic offices (2) (22) (24) 18 (33) (15)Foreign offices (8) (16) (24) 5 9 14
Total other borrowed funds (10) (38) (48) 23 (24) (1)Borrowings from Federal Reserve related to asset-backed
commercial paper (46) - (46) - 53 53Payables to customers and broker-dealers (3) (60) (63) 12 (120) (108)Long-term debt 21 (297) (276) 185 (212) (27)
Total interest expense $ 69 $(2,142) $(2,073) $ 980 $(1,740) $(760)Changes in net interest revenue $ 158 $ (105) $ 53 $ 546 $ 77 $ 623
(a) Changes which are solely due to balance changes or rate changes are allocated to such categories on the basis of the respectivepercentage changes in average balances and average rates. Changes in interest revenue or interest expense arising from thecombination of rate and volume variances are allocated proportionately to rate and volume based on their relative absolutemagnitudes.
78 BNY Mellon
Recent Accounting and Regulatory Developments
SFAS No. 166—Accounting for Transfers ofFinancial Assets
In June 2009, the FASB issued SFAS No. 166,“Accounting for Transfers of Financial Assets, anamendment to FASB Statement No. 140.” Thisstatement removed (1) the concept of a qualifyingspecial purpose entity (“QSPE”) from SFAS No. 140(ASC 860—Transfers and Servicing) and (2) theexceptions from applying FASB Interpretatation No.(“FIN”) 46 (R) (ASC 810—Consolidation) to QSPEs.This statement amends SFAS No. 140 (ASC 860) torevise and clarify the derecognition requirements fortransfers of financial assets and the initialmeasurement of beneficial interests that are receivedas proceeds by a transferor in connection withtransfers of financial assets. This statement alsorequires additional disclosure about transfers offinancial assets and a transferor’s continuinginvolvement with such transferred financial assets.This statement was effective Jan. 1, 2010, at whichtime any QSPEs will be evaluated for consolidation inaccordance with SFAS No. 167, which amends FIN46 (R) (ASC 810). However, the amendments on howto account for transfers of financial assets will applyprospectively to transfers occurring on or after theeffective date. Accordingly, the Grantor Trust intowhich we securitized certain of our investmentsecurities will no longer qualify as a QSPE, resultingin approximately $0.7 billion being added to oursecurities portfolio.
SFAS No. 167—Amendments to FIN 46 (R) (ASC 810)
In June 2009, the FASB issued SFAS No. 167,“Amendments to FASB Interpretation No. 46 (R).”This statement amends FIN 46 (R) (ASC 810) torequire ongoing assessments to determine whether anentity is a variable interest entity (“VIE”) and whetheran enterprise is the primary beneficiary of a VIE. Thisstatement also amends the guidance for determiningwhich enterprise, if any, is the primary beneficiary ofa VIE by requiring the enterprise to initially perform aqualitative analysis to determine if the enterprise’svariable interest or interests give it a controllingfinancial interest. Consolidation is based on acompany’s ability to direct the activities of the entitythat most significantly impact the entity’s economicperformance. If a company has control and the right toreceive benefits or the obligation to absorb losseswhich could potentially be significant to the VIE, thenconsolidation is required. This statement also requiresadditional disclosures about an enterprise’sinvolvement in a VIE, including a requirement for
sponsors of a VIE to disclose information even if theydo not hold a significant variable interest in the VIE.This statement was effective Jan. 1, 2010 and isexpected to primarily impact our asset managementbusinesses.
The new statement does not change the economic riskrelated to these businesses and therefore, BNYMellon’s computation of economic capital required byour businesses will not change.
On Jan. 27, 2010, the FASB approved an ASU“Amendments to Statement No. 167 for CertainInvestment Funds” which defers the requirements ofStatement No. 167 for asset managers’ interests inentities that apply the specialized accounting guidancefor investment companies or that have the attributes ofinvestment companies and for interests in moneymarket funds. This amendment became effective Jan.1, 2010.
The new statement will increase the size of ourbalance sheet by approximately $3.0 billion for theconsolidation of certain asset management fundssponsored by BNY Mellon’s Alcentra subsidiary andcertain seed capital investments. In addition, as notedin the preceding section, the Grantor Trust will lose itsQSPE status and be consolidated.
In January 2010, the Office of the Comptroller of theCurrency, Board of Governors of the Federal ReserveSystem, Federal Deposit Insurance Corporation, andthe Office of Thrift Supervision issued a final rulerequiring banks to hold capital for assets consolidatedunder FAS No. 166 and FAS No. 167. The final ruleallows for (1) opting for a two-quarter delay throughJune 30, 2010, of recognition of the effect on risk-weighted assets and allowance for loan lossesincludable in Tier 2 capital that results fromimplementation of FAS 167 and (2) a phase-in ofthose effects for the quarters ending Sept. 30, 2010and Dec. 31, 2010. We currently expect that theimplementation of FAS 167 will impact the March 31,2010 Tier 1 capital ratio by approximately 25 basispoints.
ASU 2010-6—Improving Disclosures About FairValue Measurements
In January 2010, the FASB issued ASU 2010-6,“Improving Disclosures about Fair ValueMeasurements.” This amends ASC 820 to clarifyexisting requirements regarding disclosures of inputs
BNY Mellon 79

Recent Accounting and Regulatory Developments (continued)
and valuation techniques and levels of disaggregation.This ASU also requires the following new disclosures:(1) significant transfers in and out of Levels 1 and 2and the reasons that such transfers were made; and(2) additional disclosures in the reconciliation ofLevel 3 activity, including information on a grossbasis for purchases, sales, issuances and settlements.This ASU is required in interim and annual financialstatements and is effective March 31, 2010, except forthe disclosures about Level 3 purchases, sales,issuances and settlements in the rollforward activityfor fair value measurements, which will be effectiveMarch 31, 2011.
Adoption of new accounting standards
For a discussion of the adoption of new accountingstandards, see Note 2 to the Notes to ConsolidatedFinancial Statements.
Regulatory developments
Proposed capital requirements
In September 2009, the U.S. Department of theTreasury issued a policy statement “Principles forReforming the U.S. and International RegulatoryCapital Framework for Banking Firms.” Thisstatement sets forth core principles that the Treasurybelieves would shape a new international capitalaccord to better protect the safety and soundness ofindividual banking firms and the stability of the globalfinancial system and economy. These core principlesinclude: (a) capital requirements should be designedto protect the stability of the financial system, not justthe solvency of individual banking firms; (b) capitalrequirements for all banks should be increased andthose that could pose a threat to overall financialstability should be higher than others; (c) there shouldbe a greater emphasis on higher quality forms ofcapital (common equity should constitute a “largemajority” of a bank’s Tier 1 capital); (d) risk-basedcapital requirements should be a function of therelative risk; (e) the procyclicality of the regulatorycapital and accounting regimes should be reduced(hold a larger buffer over banks’ minimum capitalrequirements during good times); (f) banks should besubject to a simple, non-risk-based leverageconstraint; (g) banks should be subject to aconservative, explicit liquidity standard; and(h) stricter capital and liquidity requirements for thebanking system should not be allowed to result in there-emergence of an under-regulated non-bank
financial sector that poses a threat to financialstability.
The U.S. Department of the Treasury issued thisstatement to facilitate the process of reaching adomestic and then international consensus on a newregulatory capital and liquidity regime for globalbanking firms. The Department of the Treasury seeksto reach a comprehensive international agreement onthe new global framework by Dec. 31, 2010, withimplementation of the reforms effective Dec. 31,2012.
Basel Committee—Proposed capital and liquidityreforms
On Dec. 17, 2009, the Basel Committee issued twoconsultative documents proposing reforms to bankcapital and liquidity regulation, which are intended toaddress lessons learned from the financial crisis thatbegan in 2007. The document titled “Strengtheningthe Resilience of the Banking Sector”, which proposesreforms to bank capital, and the document titled“International Framework for Liquidity RiskManagement, Standards and Monitoring” arediscussed below.
The proposal included in the document titled“Strengthening the Resilience of the Banking Sector”would significantly revise the definitions of Tier 1capital and Tier 2 capital, with the most significantchanges being to Tier 1 capital. Among other things,the proposal would disqualify certain capitalinstruments—including U.S.-style trust preferredsecurities and other instruments that effectively paycumulative distributions—from Tier 1 capital status.
The liquidity proposals included in the documenttitled “International Framework for Liquidity RiskManagement, Standards and Monitoring”, wouldimpose two measures of liquidity risk exposure, onebased on a 30-day time horizon and the otheraddressing longer-term structural liquidity mismatchesover a one-year time period.
IFRS
International Financial Reporting Standards (“IFRS”)are a set of standards and interpretations adopted bythe International Accounting Standards Board. TheSEC is currently considering a potential IFRSadoption process in the U.S., which would, in the nearterm, provide domestic issuers with an alternative
80 BNY Mellon

Recent Accounting and Regulatory Developments (continued)
accounting method and ultimately could replace U.S.GAAP reporting requirements with IFRS reportingrequirements. The intention of this adoption would beto provide the capital markets community with asingle set of high-quality, globally acceptedaccounting standards. The adoption of IFRS for U.S.companies with global operations would allow forstreamlined reporting, allow for easier access toforeign capital markets and investments, and facilitatecross-border acquisitions, ventures or spin-offs.
In November 2008, the SEC proposed a “roadmap”for phasing in mandatory IFRS filings by U.S. publiccompanies beginning for years ending on or after Dec.15, 2014. The roadmap is conditional on progresstowards milestones that would demonstrateimprovements in both the infrastructure ofinternational standard setting and the preparation of
the U.S. financial reporting community. The SEC willmonitor progress of these milestones between nowand 2011, when the SEC plans to consider requiringU.S. public companies to adopt IFRS. The commentperiod on this proposed roadmap ended on April 20,2009.
While the SEC decides whether IFRS will be requiredto be used in the preparation of our consolidatedfinancial statements, a number of countries havemandated the use of IFRS by BNY Mellon’ssubsidiaries in their statutory reports. BNY Mellon’soperations in the Netherlands are required to preparetheir statutory financial statements in accordance withIFRS. Other subsidiaries in Canada, Brazil and Japanwill be required to use IFRS for statutory reporting.The use of IFRS is currently optional in the UnitedKingdom.
BNY Mellon 81

Selected Quarterly Data (unaudited)
Quarter ended
(dollar amounts in millions, except per shareamounts)
2009 2008
Dec. 31 Sept. 30 June 30 March 31 Dec. 31 Sept. 30 June 30 March 31
Consolidated income statementTotal fee and other revenue $ 2,595 $ (2,216) $ 2,257 $ 2,136 $ 1,817 $ 2,926 $ 2,989 $ 2,982Net interest revenue 724 716 700 775 1,047 681 388 743
Total revenue 3,319 (1,500) 2,957 2,911 2,864 3,607 3,377 3,725Provision for credit losses 65 147 61 59 54 23 13 14Noninterest expense 2,582 2,318 2,383 2,280 2,859 3,319 2,743 2,602
Income (loss) from continuing operations beforeincome taxes and extraordinary (loss) 672 (3,965) 513 572 (49) 265 621 1,109
Provision (benefit) for income taxes (41) (1,527) 12 161 (137) (42) 312 358
Income (loss) from continuing operations 713 (2,438) 501 411 88 307 309 751Income (loss) from discontinued operations,
net of tax (119) (19) (91) (41) 4 - 6 4Extraordinary (loss) on consolidation of
commercial paper conduit, net of tax - - - - (26) - - -
Net income (loss) 594 (2,457) 410 370 66 307 315 755Net (income) loss attributable to noncontrolling
interests, net of tax (1) (1) 2 (1) (5) (4) (6) (9)Redemption charge and preferred dividends - - (236) (47) (33) - - -
Net income (loss) applicable to commonshareholders of The Bank of New York MellonCorporation $ 593 $ (2,458) $ 176 $ 322 $ 28 $ 303 $ 309 $ 746
Basic earnings per shareContinuing operations $ 0.59 $ (2.04) $ 0.23 $ 0.31 $ 0.04 $ 0.26 $ 0.26 $ 0.65Discontinued operations (0.10) (0.02) (0.08) (0.04) - - - -Extraordinary (loss) - - - - (0.02) - - -
Net income (loss) applicable to common stock $ 0.49 $ (2.05) (a) $ 0.15 $ 0.28 (a) $ 0.02 $ 0.26 $ 0.27 (a) $ 0.65
Diluted earnings per shareContinuing operations $ 0.59 $ (2.04) $ 0.23 $ 0.31 $ 0.04 $ 0.26 $ 0.26 $ 0.64Discontinued operations (0.10) (0.02) (0.08) (0.04) - - - -Extraordinary (loss) - - - - (0.02) - - -
Net income (loss) applicable to common stock $ 0.49 $ (2.05) (a) $ 0.15 $ 0.28 (a) $ 0.02 $ 0.26 $ 0.27 (a) $ 0.65 (a)
Average balancesInterest-bearing deposits with banks $ 55,467 $ 54,343 $ 56,917 $ 56,505 $ 78,680 $ 43,999 $ 43,361 $ 38,658Securities (b) 55,573 53,889 51,903 43,465 40,057 42,864 44,384 47,531Loans (b) 35,239 34,535 37,029 38,958 48,326 45,435 45,633 47,024Total interest-earning assets (b) 164,075 155,159 157,265 167,427 181,639 142,062 142,032 142,863Total assets 214,205 205,786 208,533 220,119 243,962 198,827 195,997 200,790Deposits (b) 133,395 128,552 131,748 145,034 147,455 118,969 118,232 117,732Long-term debt 17,863 17,393 16,793 15,493 15,467 15,993 16,841 17,125Common shareholders’ equity 28,843 28,144 26,566 25,189 26,812 27,996 28,507 29,551
Net interest margin (FTE) (b) 1.77% 1.85% 1.80% 1.87% 2.32% 1.92% 1.11% 2.09%Annualized return on common equity (b) 9.8% N/M 4.0% 5.8% 0.8% (c) 4.3% 4.3% 10.1%Pre-tax operating margin (b) 20% N/M 17% 20% (2)% 7% 18% 30%
Common stock data (d)Market price per share range:
High $ 29.94 $ 31.57 $ 33.62 $ 29.28 $ 36.07 $ 43.00 $ 46.89 $ 49.40Low 25.80 26.11 23.75 15.44 20.49 21.33 36.92 38.70Average 27.38 28.70 28.41 24.72 28.80 35.62 42.71 45.32Period end close 27.97 28.99 29.31 28.25 28.33 32.58 37.83 41.73
Dividends per common share 0.09 0.09 0.09 0.24 0.24 0.24 0.24 0.24Market capitalization (e) $ 33,783 $ 34,911 $ 35,255 $ 32,585 $ 32,536 $ 37,388 $ 43,356 $ 47,732
(a) Amount does not foot due to rounding.(b) Continuing operations basis.(c) Calculated before extraordinary loss.(d) At Dec. 31, 2009, there were 27,727 shareholders registered with our stock transfer agent, compared with 29,428 at Dec. 31, 2008 and 28,904 at Dec.
31, 2007. In addition, there were approximately 41,106 of BNY Mellon’s current and former employees at Dec. 31, 2009, who participate in BNYMellon’s 401(k) Retirement Savings Plans. All shares of BNY Mellon’s common stock held by the Plans for its participants are registered in the namesof The Bank of New York Mellon Corporation and Fidelity Management Trust Company, as trustee.
(e) At period end.
82 BNY Mellon
Forward-Looking Statements
Some statements in this document are forward-looking. These include all statements about the futureresults of BNY Mellon; projected business growth;statements with respect to the merger of The Bank ofNew York Company, Inc., and Mellon Financial withand into BNY Mellon; BNY Mellon’s plans, areas offocus and long-term financial goals; the effects ofpending and proposed legislation and regulation,including the Federal Reserve and Financial StabilityBoards’ proposals on compensation policies and theproposed Financial Crisis Responsibility Fee; theeffects of our investment securities portfoliorestructuring, including statements with respect to netinterest revenue and consolidation of the GrantorTrust; our planned acquisition of GIS, including thetiming of the transaction, our position in the market,the potential for synergies and any plans to raiseequity in connection with the transaction; expectationswith respect to reductions in our workforce;expectations with respect to our expenses; impact ofU.S. tax law on income of certain foreign subsidiaries;the impact of changes in the value of market indices;expectations with respect to fees and assets, factorsaffecting the performance of our segments; statementson our targeted customers; descriptions of our criticalaccounting estimates, including management’sestimates of probable losses; management’s judgmentin determining the size of unallocated allowances, theeffect of credit ratings on allowances, estimates andcash flow models; judgments and analyses withrespect to interest rate swaps, estimates of fair value,other-than-temporary impairment, goodwill and otherintangibles; and long-term financial goals, objectivesand strategies. In addition, these forward-lookingstatements relate to: the expected increase in thepercentage of revenue and income from outside theU.S.; reasons why our businesses are compatible withour strategies and goals; growth in our segments andassets; globalization of the investment process;targeted capital ratios; the impact of the events in theglobal markets; deposit levels; expectations withrespect to earnings per share; assumptions withrespect to pension plans, including discount rates,costs, expected future returns, contributions andbenefit payments; statements with respect to our intentto sell or hold securities; expectations with respect toour future exposure to private equity activities;statements on our fund commitments and institutionalcredit strategies; goals with respect to our commercialloan portfolio; descriptions of our allowance for creditlosses and loan losses; statements with respect to thetiming of current restrictions on dividends, ourliquidity targets and ability to pay dividends;expectations with respect to capital, including
anticipated repayment and call of outstanding debtand issuance of replacement securities; expectationswith respect to our lines of credit; our goal ofmigrating to a predominantly investment grade creditportfolio; the effect of a change in risk-weightedassets or common equity on Tier 1 capital, the effectof a change in interest rates on our earnings and theeffect of a change in the value of the S&P 500 Index;the impact of 2009 acquisitions on earnings per share;statements on our target double leverage ratios andour target Tier 1 capital ratio; expectations withrespect to securities lending guarantees expiringwithout the need to advance cash; expectations withrespect to the well capitalized status of BNY Mellonand its bank subsidiaries; the effects of theimplementation of Basel II; compliance with therequirements of the Sound Practices Paper;descriptions of our risk management framework;qualifications of our economic capital; statementswith respect to our risk management methodologies;descriptions of our earnings simulation models andassumptions; statements with respect to our disasterpreparedness and our business continuity plans;additional consideration with respect to acquisitions;and effect of geopolitical factors and other externalfactors; timing and impact of adoption of recentaccounting pronouncements; ability to realize benefitof deferred tax assets including carryovers;calculations of the fair value of our option grants;statements with respect to unrecognized compensationcosts; our assessment of the adequacy of our accrualsfor tax liabilities; amount of dividends banksubsidiaries can pay without regulatory waiver; theexpected outcome and impact of judgments andsettlements, if any, arising from pending or potentiallegal or regulatory proceedings, and matters relatingto the information returns and withholding tax.
In this report, any other report, any press release orany written or oral statement that BNY Mellon or itsexecutives may make, words, such as “estimate,”“forecast,” “project,” “anticipate,” “confident,”“target,” “expect,” “intend,” “seek,” “believe,” “plan,”“goal,” “could,” “should,” “may,” “will,” “strategy,”“synergies,” “opportunities,” “trends” and words ofsimilar meaning, signify forward-looking statements.
Factors that could cause BNY Mellon’s results todiffer materially from those described in the forward-looking statements, as well as other uncertaintiesaffecting future results and the value of BNYMellon’s stock and factors which represent riskassociated with the business and operations of BNYMellon, can be found in the “Risk Factors” section ofBNY Mellon’s Annual Report on Form 10-K for the
BNY Mellon 83

Forward-Looking Statements (continued)
year ended Dec. 31, 2009, and any subsequent reportsfiled with the SEC by BNY Mellon pursuant to theExchange Act.
Forward-looking statements, including discussionsand projections of future results of operations anddiscussions of future plans contained in the MD&A,are based on management’s current expectations andassumptions that involve risk and uncertainties andthat are subject to change based on various importantfactors (some of which are beyond BNY Mellon’scontrol), including adverse changes in marketconditions, and the timing of such changes, and theactions that management could take in response tothese changes. Actual results may differ materiallyfrom those expressed or implied as a result of theserisks and uncertainties and the risks and uncertainties
described in the documents referred to in thepreceding paragraph. The “Risk Factors” discussed inthe Form 10-K could cause or contribute to suchdifferences. Investors should consider all risksmentioned elsewhere in this document and insubsequent reports filed by BNY Mellon with theCommission pursuant to the Exchange Act, as well asother uncertainties affecting future results and thevalue of BNY Mellon’s stock.
All forward-looking statements speak only as of thedate on which such statements are made, and BNYMellon undertakes no obligation to update anystatement to reflect events or circumstances after thedate on which such forward-looking statement ismade or to reflect the occurrence of unanticipatedevents.
84 BNY Mellon
Glossary
Accumulated Benefit Obligation (“ABO”)—Theactuarial present value of benefits (vested andnon-vested) attributed to employee services rendered.
Alt-A securities—A mortgage risk categorization thatfalls between prime and subprime. Borrowers behindthese mortgages will typically have clean credithistories but the mortgage itself will generally haveissues that increase its risk profile such as inadequatedocumentation of the borrower’s income or higherloan-to-value and debt-to-income ratios.
Alternative investments—Usually refers toinvestments in hedge funds, leveraged loans,subordinated and distressed debt, real estate andforeign currency overlay. Many hedge funds pursuestrategies that are uncommon relative to mutual funds.Examples of alternative investment strategies are:long-short equity, event driven, statistical arbitrage,fixed income arbitrage, convertible arbitrage, shortbias, global macro, and equity market neutral.
APAC—Asia-Pacific region.
Assets Under Custody And Administration(“AUC”)—Assets beneficially owned by our clientsor customers which we hold in various capacities forwhich various services are provided such as; custody,accounting, administration valuations andperformance measurement. These assets are not onour balance sheet.
ASC—Accounting Standards Codification.
Assets Under Management (“AUM”)—Assetsbeneficially owned by our clients or customers whichwe hold in various capacities that are either actively orpassively managed. These assets are not on ourbalance sheet.
bp—basis point.
Collateral management—A comprehensive programdesigned to simplify collateralization and expeditesecurities transfers for buyers and sellers. BNYMellon acting as an independent collateral manager ispositioned between the buyer and seller to provide aconvenient, flexible, and efficient service to ensureproper collateralization throughout the term of thetransaction. The service includes verification ofsecurities eligibility and maintenance of marginrequirements.
Collateralized Debt Obligations (“CDOs”)—A typeof asset-backed security and structured credit product
constructed from a portfolio of fixed-income assets.CDOs are divided into different tranches and lossesare applied in reverse order of seniority.
Collateralized loan obligation (“CLO”)—A debtsecurity backed by a pool of commercial loans.
Collective trust fund—An investment fund formedfrom the pooling of investments by investors.
Credit derivatives—Contractual agreements thatprovide insurance against a credit event of one ormore referenced credits. The nature of the credit eventis established by the buyer and seller at the inceptionof the transaction. Such events include bankruptcy,insolvency and failure to meet payment obligationswhen due. The buyer of the credit derivative pays aperiodic fee in return for a contingent payment by theseller (insurer) following a credit event.
Credit risk—The risk of loss due to borrower orcounterparty default.
Currency swaps—An agreement to exchangestipulated amounts of one currency for anothercurrency.
Depositary Receipts (“DR”)—A negotiable securitythat generally represents a non-U.S. company’spublicly traded equity. Although typicallydenominated in U.S. dollars, DRs can also bedenominated in Euros. DRs are eligible to trade on allU.S. stock exchanges and many European stockexchanges. American Depositary Receipts (“ADR”)trade only in the U.S.
Derivative—A contract or agreement whose value isderived from changes in interest rates, foreignexchange rates, prices of securities or commodities,credit worthiness for credit default swaps or financialor commodity indices.
Discontinued operations—The operating results of acomponent of an entity, as defined by ASC 205, thatare removed from continuing operations when thatcomponent has been disposed of or it is management’sintention to sell the component.
Double leverage—The situation that exists when aholding company’s equity investments in wholly-owned subsidiaries (including goodwill andintangibles) exceed its equity capital. Double leverageis created when a bank holding company issues debtand downstreams the proceeds to a subsidiary as anequity investment.
BNY Mellon 85
Glossary (continued)
Economic Value of Equity (“EVE”)—Anaggregation of discounted future cash flows of assetsand liabilities over a long-term horizon.
EMEA—Europe, the Middle East and Africa.
Exchange traded fund—Each share of an exchangetraded fund tracks a basket of stocks in some index orbenchmark, providing investors with a vehicle thatclosely parallels the performance of these benchmarkswhile allowing for intraday trading.
FASB—Financial Accounting Standards Board.
FDIC—Federal Deposit Issuance Corporation.
Foreign currency options—Similar to interest rateoptions except they are based on foreign exchangerates. Also, see interest rate options in this glossary.
Foreign currency swaps—An agreement toexchange stipulated amounts of one currency foranother currency at one or more future dates.
Foreign exchange contracts—Contracts that providefor the future receipt or delivery of foreign currency atpreviously agreed-upon terms.
Forward rate agreements—Contracts to exchangepayments on a specified future date, based on amarket change in interest rates from trade date tocontract settlement date.
Fully Taxable Equivalent (“FTE”)—Basis forcomparison of yields on assets having ordinarytaxability with assets for which special tax exemptionsapply. The FTE adjustment reflects an increase in theinterest yield or return on a tax-exempt asset to a levelthat would be comparable had the asset been fullytaxable.
Generally Accepted Accounting Principles(“GAAP”)—Accounting rules and conventionsdefining acceptable practices in preparing financialstatements in the U.S. The FASB is the primarysource of accounting rules.
Grantor Trust—A legal, passive entity throughwhich pass-through securities are sold to investors.
Hedge fund—A fund, usually used by wealthyindividuals and institutions, which is allowed to useaggressive strategies that are unavailable to mutualfunds, including selling short, leverage, program
trading, swaps, arbitrage, and derivatives. Hedgefunds are exempt from many of the rules andregulations governing mutual funds, which allowthem to accomplish aggressive investing goals. Legalrequirements in many countries allow only certainsophisticated investors to participate in hedge funds.
Home Equity Line of Credit (“HELOC”)—A lineof credit extended to a homeowner who uses theborrower’s home as collateral.
Impairment—When an asset’s market value is lessthan its carrying value.
Interest rate options, including caps and floors—Contracts to modify interest rate risk in exchange forthe payment of a premium when the contract isinitiated. As a writer of interest rate options, wereceive a premium in exchange for bearing the risk ofunfavorable changes in interest rates. Conversely, as apurchaser of an option, we pay a premium for theright, but not the obligation, to buy or sell a financialinstrument or currency at predetermined terms in thefuture.
Interest rate sensitivity—The exposure of netinterest income to interest rate movements.
Interest rate swaps—Contracts in which a series ofinterest rate flows in a single currency is exchangedover a prescribed period. Interest rate swaps are themost common type of derivative contract that we usein our asset/liability management activities. Anexample of a situation in which we would utilize aninterest rate swap would be to convert our fixed-ratedebt to a variable rate. By entering into a swap, theprincipal amount of a debt remains unchanged, but theinterest stream changes.
Investment grade loans and commitments—Thosewhere the customer has a Moody’s long-term rating ofBaa3 or better; and/or a Standard & Poor’s long-termrating of BBB- or better; or if unrated, an equivalentrating using our internal risk ratings.
Joint venture—A company or entity owned andoperated by a group of companies for a specificbusiness purpose, no one of which has a majorityinterest.
Lease-In-Lease-Out (“LILO”) transaction—Atransaction in which a person or entity leases propertyfrom the owner for a specified time period and thenleases the property back to that owner for a shortertime period. The obligations of the property owner as
86 BNY Mellon

Glossary (continued)
sublessee are usually secured by deposits, letters ofcredit, or marketable securities.
Leverage ratio—Tier 1 capital divided by leverageassets. Leverage assets are defined as quarterlyaverage total assets, net of goodwill, intangibles andcertain other items as required by the Federal Reserve.
Liquidity risk—The risk of being unable to fund ourportfolio of assets at appropriate maturities and rates,and the risk of being unable to liquidate a position in atimely manner at a reasonable price.
Loans for purchasing or carrying securities—Loans primarily to brokers and dealers in securities.
Margin loans—A loan that is used to purchase sharesof stock. The shares purchased are used as collateralfor the loan.
Mark-to-market exposure—A measure, at a point intime, of the value of a derivative or foreign exchangecontract in the open market. When the mark-to-marketis positive, it indicates the counterparty owes us and,therefore, creates a repayment risk for us. When themark-to-market is negative, we owe the counterparty.In this situation, we do not have repayment risk.
Market risk—The potential loss in value ofportfolios and financial instruments caused bymovements in market variables, such as interest andforeign exchange rates, credit spreads, and equity andcommodity prices.
Master netting agreement—An agreement betweentwo counterparties that have multiple contracts witheach other that provides for the net settlement of allcontracts through a single payment in the event ofdefault or termination of any one contract.
Mortgage-Backed Security (“MBS”)—An asset-backed security whose cash flows are backed by theprincipal and interest payments of a set of mortgageloans.
N/A—Not applicable.
N/M—Not meaningful.
Net interest margin—The result of dividing netinterest revenue by average interest-earning assets.
Operating leverage—The rate of increase in revenueto the rate of increase in expenses.
Operational risk—The risk of loss resulting frominadequate or failed processes or systems, humanfactors, or external events.
Performance fees—Fees received by an investmentadvisor based upon the fund’s performance for theperiod relative to various predetermined benchmarks.
Prime securities—A classification of securitiescollateralized by loans to borrowers who have a high-value and/or a good credit history.
Private equity/venture capital—Investment instart-up companies or those in the early processes ofdeveloping products and services with perceived,long-term growth potential.
Pre-tax operating margin—Income before taxes fora period divided by total revenue for that period.
Projected Benefit Obligation (“PBO”)—Theactuarial present value of all benefits accrued onemployee service rendered prior to the calculationdate, including allowance for future salary increases ifthe pension benefit is based on future compensationlevels.
Qualified Special Purpose Entity (“QSPE”)—Aspecial purpose entity whose activities are strictlylimited to holding and servicing financial assets andmeet the requirements set forth in ASC 860. Aqualified special purpose entity is generally notrequired to be consolidated by any party.
Real Estate Investment Trust (“REIT”)— Aninvestor-owned corporation, trust or association thatsells shares to investors and invests in income-producing property.
Residential Mortgage-Backed Security(“RMBS”)—An asset-backed security whose cashflows are backed by principal and interest payments ofa set of residential mortgage loans.
Restructuring charges—Typically result from theconsolidation and/or relocation of operations.Restructuring charges may be incurred in connectionwith a business combination, a change in anenterprise’s strategic plan, or a managerial response todeclines in demand.
Return on assets—Income divided by average assets.
Return on common equity—Income divided byaverage common shareholders’ equity.
BNY Mellon 87

Glossary (continued)
Return on tangible common equity—Income,excluding intangible amortization, divided by averagetangible common shareholders’ equity.
Sale-In-Lease-Out (“SILO”) transaction—Atransaction in which an entity sells its property to acorporation. The corporation simultaneously leasesthe property back to the entity for a shorter period oftime. The SILO arrangement typically involves aservice contract which guarantees a fixed return to thecorporation.
Securities lending transaction—A fullycollateralized transaction in which the owner of asecurity agrees to lend the security through an agent(The Bank of New York Mellon) to a borrower,usually a broker/dealer or bank, on an open, overnightor term basis, under the terms of a prearrangedcontract, which generally matures in less than 90 days.
Structured Investment Vehicle (“SIV”)—A fundwhich borrows money by issuing short-term securitiesat low interest and then lends money by buying long-term securities at higher interest.
Sub-custodian—A local provider (e.g., a bank)contracted to provide specific custodial relatedservices in a selected country or geographic area.Services generally include holding foreign securitiesin safekeeping, facilitating settlements and reportingholdings to the custodian.
Subprime securities—A classification of securitiescollateralized by loans to borrowers who have atarnished or limited credit history. Subprime securitiescarry increased credit risk and subsequently carryhigher interest rates.
Tangible common shareholders’ equity to tangibleassets ratio (“TCE”)—Common shareholders’ equityless goodwill and intangible assets adjusted fordeferred tax liabilities associated with tax deductiblegoodwill and non-tax deductible intangible assetsdivided by period-end total assets less goodwill,intangible assets, deposits with the Federal Reserve
and other central banks, and U.S. government-backedcommercial paper.
Tangible common shareholders’ equity—Commonequity less goodwill and intangible assets adjusted fordeferred tax liabilities associated with non-taxdeductible intangible assets and tax deductiblegoodwill.
Tier 1 and total capital—Includes commonshareholders’ equity (excluding certain components ofcomprehensive income), Series B preferred stock,qualifying trust preferred securities, less goodwill andcertain intangible assets adjusted for deferred taxliabilities associated with non-tax deductibleintangible assets and tax deductible goodwill and adeduction for certain non-financial equity investmentsand disallowed deferred tax assets. Total capitalincludes Tier 1 capital, qualifying unrealized equitysecurities gains, qualifying subordinated debt and theallowance for credit losses.
Tier 1 common equity to risk-weighted assetsratio—Tier 1 capital excluding trust preferredsecurities and preferred stock divided by risk-weighted assets.
Unfunded commitments—Legally bindingagreements to provide a defined level of financinguntil a specified future date.
Value-at-Risk (“VAR”)—A measure of the dollaramount of potential loss at a specified confidencelevel from adverse market movements in an ordinarymarket environment.
Variable Interest Entity (“VIE”)—An entity that:(1) lacks enough equity investment at risk to permitthe entity to finance its activities without additionalfinancial support from other parties; (2) has equityowners that lack the right to make significantdecisions affecting the entity’s operations; and/or(3) has equity owners that do not have an obligation toabsorb or the right to receive the entity’s losses orreturn.
88 BNY Mellon

Report of Management on Internal Control Over Financial Reporting
Management of BNY Mellon is responsible forestablishing and maintaining adequate internal controlover financial reporting for BNY Mellon, as such termis defined in Rule 13a-15(f) under the Exchange Act.
BNY Mellon’s management, including its principalexecutive officer and principal financial officer, hasassessed the effectiveness of BNY Mellon’s internalcontrol over financial reporting as of December 31,2009. In making this assessment, management usedthe criteria set forth by the Committee of SponsoringOrganizations of the Treadway Commission inInternal Control—Integrated Framework. Based upon
such assessment, management believes that, as ofDecember 31, 2009, BNY Mellon’s internal controlover financial reporting is effective based upon thosecriteria.
KPMG LLP, the independent registered publicaccounting firm that audited BNY Mellon’s 2009financial statements included in this Annual Reportunder “Financial Statements and Notes,” has issued areport with respect to the effectiveness of BNYMellon’s internal control over financial reporting.This report appears on page 90.
BNY Mellon 89
Report of Independent Registered Public Accounting Firm
The Board of Directors and ShareholdersThe Bank of New York Mellon Corporation:
We have audited The Bank of New York Mellon Corporation’s (“BNY Mellon”) internal control over financialreporting as of December 31, 2009, based on criteria established in Internal Control—Integrated Frameworkissued by the Committee of Sponsoring Organizations of the Treadway Commission (COSO). BNY Mellon’smanagement is responsible for maintaining effective internal control over financial reporting and for itsassessment of the effectiveness of internal control over financial reporting, included in the accompanying Reportof Management on Internal Control over Financial Reporting. Our responsibility is to express an opinion on BNYMellon’s internal control over financial reporting based on our audit.
We conducted our audit in accordance with the standards of the Public Company Accounting Oversight Board(United States). Those standards require that we plan and perform the audit to obtain reasonable assurance aboutwhether effective internal control over financial reporting was maintained in all material respects. Our auditincluded obtaining an understanding of internal control over financial reporting, assessing the risk that a materialweakness exists, and testing and evaluating the design and operating effectiveness of internal control based on theassessed risk. Our audit also included performing such other procedures as we considered necessary in thecircumstances. We believe that our audit provides a reasonable basis for our opinion.
A company’s internal control over financial reporting is a process designed to provide reasonable assuranceregarding the reliability of financial reporting and the preparation of financial statements for external purposes inaccordance with generally accepted accounting principles. A company’s internal control over financial reportingincludes those policies and procedures that (1) pertain to the maintenance of records that, in reasonable detail,accurately and fairly reflect the transactions and dispositions of the assets of the company; (2) provide reasonableassurance that transactions are recorded as necessary to permit preparation of financial statements in accordancewith generally accepted accounting principles, and that receipts and expenditures of the company are being madeonly in accordance with authorizations of management and directors of the company; and (3) provide reasonableassurance regarding prevention or timely detection of unauthorized acquisition, use, or disposition of thecompany’s assets that could have a material effect on the financial statements.
Because of its inherent limitations, internal control over financial reporting may not prevent or detectmisstatements. Also, projections of any evaluation of effectiveness to future periods are subject to the risk thatcontrols may become inadequate because of changes in conditions, or that the degree of compliance with thepolicies or procedures may deteriorate.
In our opinion, BNY Mellon maintained, in all material respects, effective internal control over financial reportingas of December 31, 2009, based on criteria established in Internal Control—Integrated Framework issued by theCommittee of Sponsoring Organizations of the Treadway Commission.
We also have audited, in accordance with the standards of the Public Company Accounting Oversight Board(United States), the consolidated balance sheets of BNY Mellon as of December 31, 2009 and 2008, and therelated consolidated statements of income, changes in equity, and cash flows for each of the years in the three-yearperiod ended December 31, 2009, and our report dated February 26, 2010 expressed an unqualified opinion onthose consolidated financial statements.
New York, New YorkFebruary 26, 2010
90 BNY Mellon

The Bank of New York Mellon Corporation (and its subsidiaries)
Consolidated Income Statement
Year ended Dec. 31,
(in millions) 2009 2008 2007 (a)
Fee and other revenueSecurities servicing fees:
Asset servicing $ 2,573 $ 3,370 (b) $2,376 (b)Issuer services 1,463 1,685 1,560Clearing services 962 1,065 (c) 1,187 (c)
Total securities servicing fees 4,998 6,120 5,123Asset and wealth management fees 2,639 3,218 2,153Foreign exchange and other trading activities 1,036 1,462 786Treasury services 519 514 346Distribution and servicing 397 421 212Financing-related fees 215 186 216Investment income 226 207 (c) 207 (c)Other 111 214 (c) 211 (c)
Total fee revenue 10,141 12,342 9,254Net securities gains (losses) – including other-than-temporary impairment (5,552) (1,628) (201)Noncredit related losses on securities not expected to be sold (recognized in OCI) 183 - -
Net securities gains (losses) (5,369) (1,628) (201)
Total fee and other revenue 4,772 10,714 9,053Net interest revenueInterest revenue 3,507 5,524 5,670Interest expense 592 2,665 3,425
Net interest revenue 2,915 2,859 2,245Provision for credit losses 332 104 (11)
Net interest revenue after provision for credit losses 2,583 2,755 2,256Noninterest expenseStaff 4,700 5,189 (d) 4,126 (d)Professional, legal and other purchased services 1,017 1,021 (d) 760 (d)Net occupancy 564 570 447Distribution and servicing 426 517 268Software 367 331 280Sub-custodian and clearing 320 335 (b) 406 (b)Furniture and equipment 309 323 266Business development 214 278 189Other 837 1,822 (e) 634
Subtotal 8,754 10,386 7,376Amortization of intangible assets 426 473 314Restructuring charges 150 181 -Merger and integration expenses:
The Bank of New York Mellon Corporation 233 471 355Acquired Corporate Trust Business - 12 49
Total noninterest expense 9,563 11,523 8,094
IncomeIncome (loss) from continuing operations before income taxes (2,208) 1,946 3,215Provision (benefit) for income taxes (1,395) 491 987
Income (loss) from continuing operations (813) 1,455 2,228Discontinued operations:
Income (loss) from discontinued operations (421) 28 13Provision (benefit) for income taxes (151) 14 3
Income (loss) from discontinued operations, net of tax (270) 14 10Extraordinary (loss) on consolidation of commercial paper conduits, net of tax - (26) (180)
Net income (loss) (1,083) 1,443 2,058Net (income) loss attributable to noncontrolling interests, net of tax (1) (24) (19)Redemption charge and preferred dividends (283) (33) -
Net income (loss) applicable to common shareholders of The Bank of New York MellonCorporation $ (1,367) $ 1,386 $2,039
BNY Mellon 91

The Bank of New York Mellon Corporation (and its subsidiaries)
Consolidated Income Statement (continued)
Earnings per common share applicable to the common shareholders’of The Bank of New York Mellon Corporation Year ended Dec. 31,
(in dollars) 2009 2008 2007 (a)
Basic:Income (loss) from continuing operations $ (0.93) $ 1.21 $ 2.37Income (loss) from discontinued operations, net of tax (0.23) 0.01 0.01Extraordinary (loss), net of tax - (0.02) (0.19)
Net income (loss) applicable to common stock (f) $ (1.16) $ 1.20 $ 2.19
Diluted: (g)Income (loss) from continuing operations $ (0.93) $ 1.21 $ 2.35Income (loss) from discontinued operations, net of tax (0.23) 0.01 0.01Extraordinary (loss), net of tax - (0.02) (0.19)
Net income (loss) applicable to common stock (f) $ (1.16) $ 1.20 $ 2.17
Average common shares and equivalents outstanding Year ended Dec. 31,
(in thousands) 2009 2008 2007 (a)
Basic 1,178,907 1,142,239 923,199Common stock equivalents - 10,383 11,505Participating securities - (4,264) (4,028)
Diluted 1,178,907 (g) 1,148,358 930,676
Anti-dilutive securities (h) 98,112 83,763 67,171
Reconciliation of net income (loss) from continuing operations applicable to thecommon shareholders’ of The Bank of New York Mellon Corporation Year ended Dec. 31,
(in millions) 2009 2008 2007 (a)
Income (loss) from continuing operations $ (813) $ 1,455 $ 2,228Net (income) loss attributable to noncontrolling interests, net of tax (1) (24) (19)
Income (loss) from continuing operations attributable to The Bank of New York MellonCorporation (814) 1,431 2,209
Redemption charge and preferred dividends (283) (33) -
Income (loss) from continuing operations applicable to common shareholders of The Bankof New York Mellon Corporation, net of tax (1,097) 1,398 2,209
Income (loss) from discontinued operations, net of tax (270) 14 10Extraordinary (loss), net of tax - (26) (180)
Net income (loss) applicable to the common shareholders of The Bank of New YorkMellon Corporation $ (1,367) $ 1,386 $ 2,039
(a) Results for 2007 include six months of BNY Mellon and six months of legacy The Bank of New York Company, Inc.(b) In 2009, global sub-custodian out-of-pocket expense related to client reimbursements was reclassified from sub-custodian expense to
asset servicing revenue. This reclassification totaled $22 million in 2008 and $23 million in 2007.(c) In 2009, fee revenue associated with equity investments was reclassified from clearing services revenue and other revenue to
investment income. Fee revenue associated with an equity investment previously recorded in clearing services revenue was $22 millionin 2008 and $5 million in 2007. Fee revenue associated with an equity investment previously recorded in other revenue was $32million in 2008 and $53 million in 2007. Prior periods have been reclassified.
(d) In 2009, certain temporary/consulting expenses were reclassified from professional, legal and other purchased services to staffexpense. This reclassification totaled $100 million in 2008 and $19 million in 2007.
(e) Includes support agreement charges of $894 million in 2008.(f) Basic and diluted earnings per share under the two-class method were calculated after deducting earnings allocated to participating
securities of $- million in 2009, $9.7 million in 2008 and $17.3 million in 2007.(g) Diluted earnings per share for the year ended Dec. 31, 2009, was calculated using average basic shares. Adding back the dilutive
shares would be anti-dilutive.(h) Represents stock options, restricted stock, restricted stock units, participating securities and warrants outstanding that are not
included in the computation of diluted average common shares because their effect would be anti-dilutive.
See accompanying Notes to Consolidated Financial Statements.
92 BNY Mellon
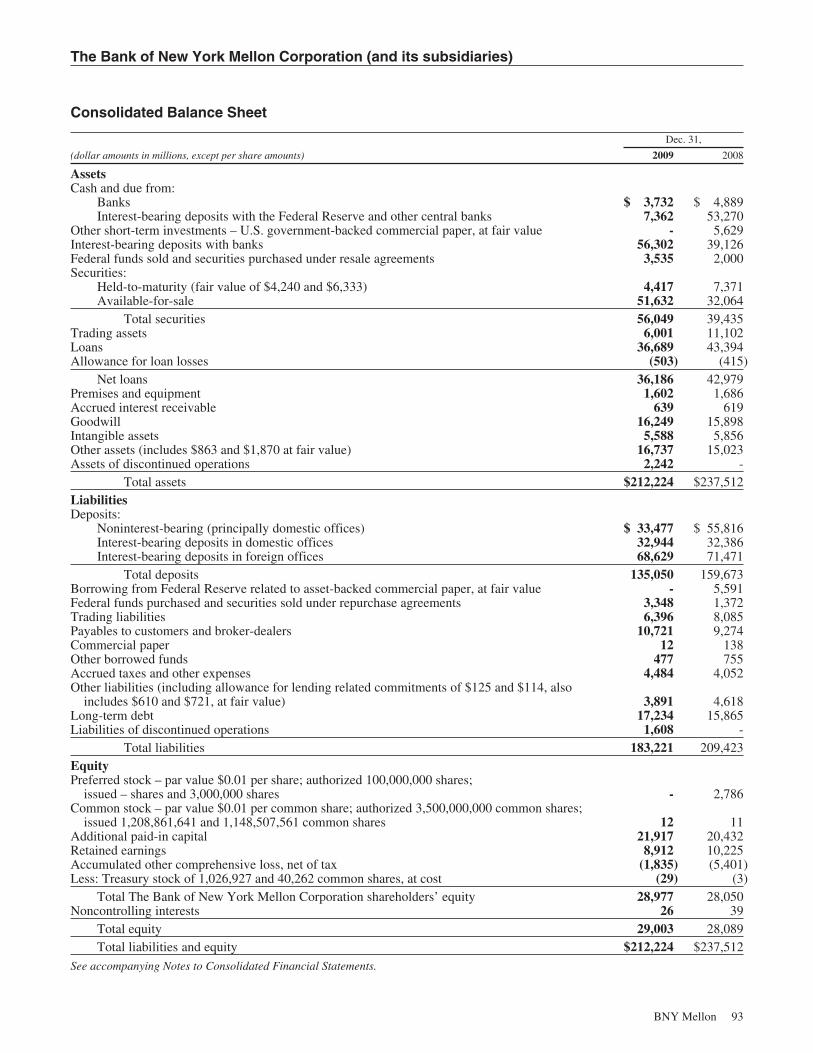
The Bank of New York Mellon Corporation (and its subsidiaries)
Consolidated Balance Sheet
Dec. 31,
(dollar amounts in millions, except per share amounts) 2009 2008
AssetsCash and due from:
Banks $ 3,732 $ 4,889Interest-bearing deposits with the Federal Reserve and other central banks 7,362 53,270
Other short-term investments – U.S. government-backed commercial paper, at fair value - 5,629Interest-bearing deposits with banks 56,302 39,126Federal funds sold and securities purchased under resale agreements 3,535 2,000Securities:
Held-to-maturity (fair value of $4,240 and $6,333) 4,417 7,371Available-for-sale 51,632 32,064
Total securities 56,049 39,435Trading assets 6,001 11,102Loans 36,689 43,394Allowance for loan losses (503) (415)
Net loans 36,186 42,979Premises and equipment 1,602 1,686Accrued interest receivable 639 619Goodwill 16,249 15,898Intangible assets 5,588 5,856Other assets (includes $863 and $1,870 at fair value) 16,737 15,023Assets of discontinued operations 2,242 -
Total assets $212,224 $237,512LiabilitiesDeposits:
Noninterest-bearing (principally domestic offices) $ 33,477 $ 55,816Interest-bearing deposits in domestic offices 32,944 32,386Interest-bearing deposits in foreign offices 68,629 71,471
Total deposits 135,050 159,673Borrowing from Federal Reserve related to asset-backed commercial paper, at fair value - 5,591Federal funds purchased and securities sold under repurchase agreements 3,348 1,372Trading liabilities 6,396 8,085Payables to customers and broker-dealers 10,721 9,274Commercial paper 12 138Other borrowed funds 477 755Accrued taxes and other expenses 4,484 4,052Other liabilities (including allowance for lending related commitments of $125 and $114, also
includes $610 and $721, at fair value) 3,891 4,618Long-term debt 17,234 15,865Liabilities of discontinued operations 1,608 -
Total liabilities 183,221 209,423EquityPreferred stock – par value $0.01 per share; authorized 100,000,000 shares;
issued – shares and 3,000,000 shares - 2,786Common stock – par value $0.01 per common share; authorized 3,500,000,000 common shares;
issued 1,208,861,641 and 1,148,507,561 common shares 12 11Additional paid-in capital 21,917 20,432Retained earnings 8,912 10,225Accumulated other comprehensive loss, net of tax (1,835) (5,401)Less: Treasury stock of 1,026,927 and 40,262 common shares, at cost (29) (3)
Total The Bank of New York Mellon Corporation shareholders’ equity 28,977 28,050Noncontrolling interests 26 39
Total equity 29,003 28,089Total liabilities and equity $212,224 $237,512
See accompanying Notes to Consolidated Financial Statements.
BNY Mellon 93
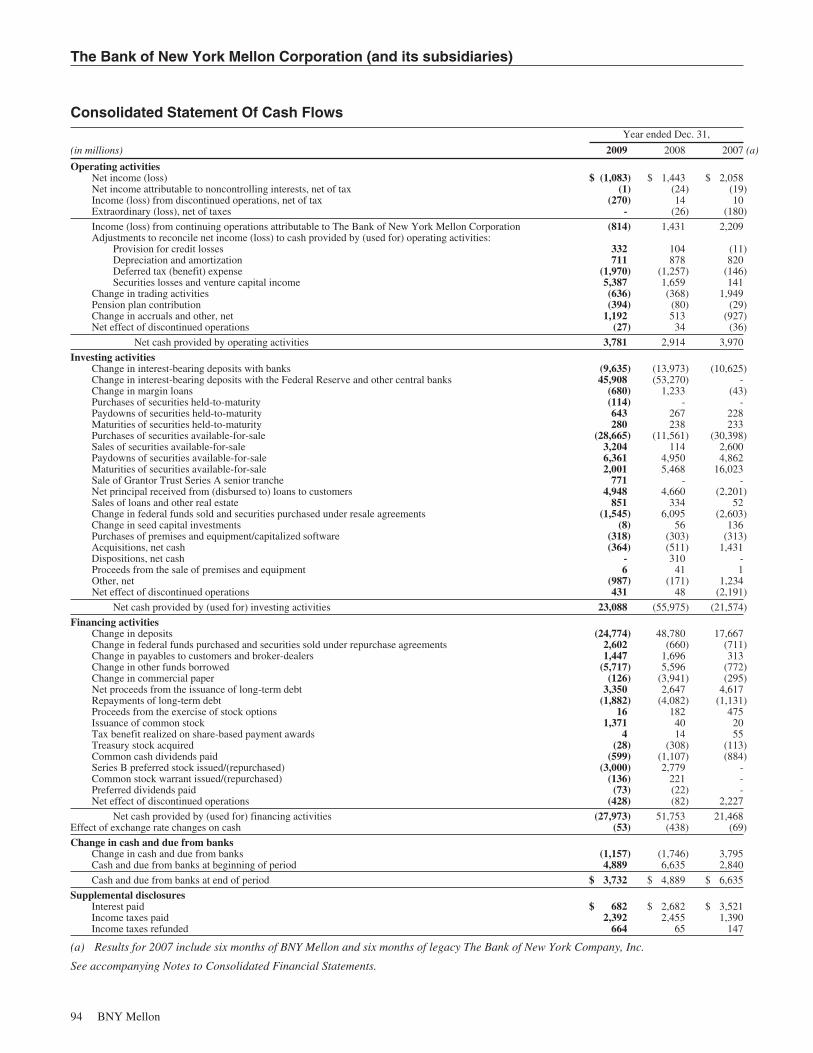
The Bank of New York Mellon Corporation (and its subsidiaries)
Consolidated Statement Of Cash FlowsYear ended Dec. 31,
(in millions) 2009 2008 2007 (a)
Operating activitiesNet income (loss) $ (1,083) $ 1,443 $ 2,058Net income attributable to noncontrolling interests, net of tax (1) (24) (19)Income (loss) from discontinued operations, net of tax (270) 14 10Extraordinary (loss), net of taxes - (26) (180)
Income (loss) from continuing operations attributable to The Bank of New York Mellon Corporation (814) 1,431 2,209Adjustments to reconcile net income (loss) to cash provided by (used for) operating activities:
Provision for credit losses 332 104 (11)Depreciation and amortization 711 878 820Deferred tax (benefit) expense (1,970) (1,257) (146)Securities losses and venture capital income 5,387 1,659 141
Change in trading activities (636) (368) 1,949Pension plan contribution (394) (80) (29)Change in accruals and other, net 1,192 513 (927)Net effect of discontinued operations (27) 34 (36)
Net cash provided by operating activities 3,781 2,914 3,970
Investing activitiesChange in interest-bearing deposits with banks (9,635) (13,973) (10,625)Change in interest-bearing deposits with the Federal Reserve and other central banks 45,908 (53,270) -Change in margin loans (680) 1,233 (43)Purchases of securities held-to-maturity (114) - -Paydowns of securities held-to-maturity 643 267 228Maturities of securities held-to-maturity 280 238 233Purchases of securities available-for-sale (28,665) (11,561) (30,398)Sales of securities available-for-sale 3,204 114 2,600Paydowns of securities available-for-sale 6,361 4,950 4,862Maturities of securities available-for-sale 2,001 5,468 16,023Sale of Grantor Trust Series A senior tranche 771 - -Net principal received from (disbursed to) loans to customers 4,948 4,660 (2,201)Sales of loans and other real estate 851 334 52Change in federal funds sold and securities purchased under resale agreements (1,545) 6,095 (2,603)Change in seed capital investments (8) 56 136Purchases of premises and equipment/capitalized software (318) (303) (313)Acquisitions, net cash (364) (511) 1,431Dispositions, net cash - 310 -Proceeds from the sale of premises and equipment 6 41 1Other, net (987) (171) 1,234Net effect of discontinued operations 431 48 (2,191)
Net cash provided by (used for) investing activities 23,088 (55,975) (21,574)
Financing activitiesChange in deposits (24,774) 48,780 17,667Change in federal funds purchased and securities sold under repurchase agreements 2,602 (660) (711)Change in payables to customers and broker-dealers 1,447 1,696 313Change in other funds borrowed (5,717) 5,596 (772)Change in commercial paper (126) (3,941) (295)Net proceeds from the issuance of long-term debt 3,350 2,647 4,617Repayments of long-term debt (1,882) (4,082) (1,131)Proceeds from the exercise of stock options 16 182 475Issuance of common stock 1,371 40 20Tax benefit realized on share-based payment awards 4 14 55Treasury stock acquired (28) (308) (113)Common cash dividends paid (599) (1,107) (884)Series B preferred stock issued/(repurchased) (3,000) 2,779 -Common stock warrant issued/(repurchased) (136) 221 -Preferred dividends paid (73) (22) -Net effect of discontinued operations (428) (82) 2,227
Net cash provided by (used for) financing activities (27,973) 51,753 21,468Effect of exchange rate changes on cash (53) (438) (69)
Change in cash and due from banksChange in cash and due from banks (1,157) (1,746) 3,795Cash and due from banks at beginning of period 4,889 6,635 2,840
Cash and due from banks at end of period $ 3,732 $ 4,889 $ 6,635
Supplemental disclosuresInterest paid $ 682 $ 2,682 $ 3,521Income taxes paid 2,392 2,455 1,390Income taxes refunded 664 65 147
(a) Results for 2007 include six months of BNY Mellon and six months of legacy The Bank of New York Company, Inc.
See accompanying Notes to Consolidated Financial Statements.
94 BNY Mellon
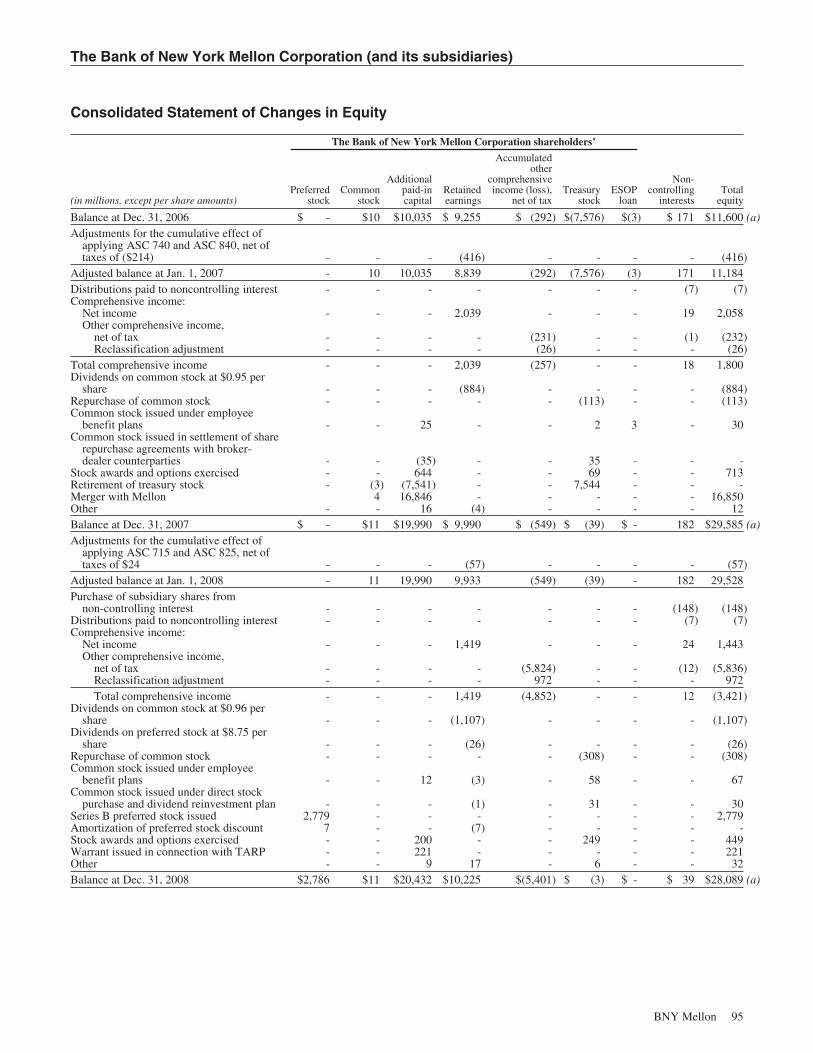
The Bank of New York Mellon Corporation (and its subsidiaries)
Consolidated Statement of Changes in Equity
The Bank of New York Mellon Corporation shareholders’
(in millions, except per share amounts)Preferred
stockCommon
stock
Additionalpaid-incapital
Retainedearnings
Accumulatedother
comprehensiveincome (loss),
net of taxTreasury
stockESOP
loan
Non-controlling
interestsTotal
equity
Balance at Dec. 31, 2006 $ - $10 $10,035 $ 9,255 $ (292) $(7,576) $(3) $ 171 $11,600 (a)Adjustments for the cumulative effect of
applying ASC 740 and ASC 840, net oftaxes of ($214) - - - (416) - - - - (416)
Adjusted balance at Jan. 1, 2007 - 10 10,035 8,839 (292) (7,576) (3) 171 11,184Distributions paid to noncontrolling interest - - - - - - - (7) (7)Comprehensive income:
Net income - - - 2,039 - - - 19 2,058Other comprehensive income,
net of tax - - - - (231) - - (1) (232)Reclassification adjustment - - - - (26) - - - (26)
Total comprehensive income - - - 2,039 (257) - - 18 1,800Dividends on common stock at $0.95 per
share - - - (884) - - - - (884)Repurchase of common stock - - - - - (113) - - (113)Common stock issued under employee
benefit plans - - 25 - - 2 3 - 30Common stock issued in settlement of share
repurchase agreements with broker-dealer counterparties - - (35) - - 35 - - -
Stock awards and options exercised - - 644 - - 69 - - 713Retirement of treasury stock - (3) (7,541) - - 7,544 - - -Merger with Mellon 4 16,846 - - - - - 16,850Other - - 16 (4) - - - - 12Balance at Dec. 31, 2007 $ - $11 $19,990 $ 9,990 $ (549) $ (39) $ - 182 $29,585 (a)Adjustments for the cumulative effect of
applying ASC 715 and ASC 825, net oftaxes of $24 - - - (57) - - - - (57)
Adjusted balance at Jan. 1, 2008 - 11 19,990 9,933 (549) (39) - 182 29,528Purchase of subsidiary shares from
non-controlling interest - - - - - - - (148) (148)Distributions paid to noncontrolling interest - - - - - - - (7) (7)Comprehensive income:
Net income - - - 1,419 - - - 24 1,443Other comprehensive income,
net of tax - - - - (5,824) - - (12) (5,836)Reclassification adjustment - - - - 972 - - - 972Total comprehensive income - - - 1,419 (4,852) - - 12 (3,421)
Dividends on common stock at $0.96 pershare - - - (1,107) - - - - (1,107)
Dividends on preferred stock at $8.75 pershare - - - (26) - - - - (26)
Repurchase of common stock - - - - - (308) - - (308)Common stock issued under employee
benefit plans - - 12 (3) - 58 - - 67Common stock issued under direct stock
purchase and dividend reinvestment plan - - - (1) - 31 - - 30Series B preferred stock issued 2,779 - - - - - - - 2,779Amortization of preferred stock discount 7 - - (7) - - - - -Stock awards and options exercised - - 200 - - 249 - - 449Warrant issued in connection with TARP - - 221 - - - - - 221Other - - 9 17 - 6 - - 32Balance at Dec. 31, 2008 $2,786 $11 $20,432 $10,225 $(5,401) $ (3) $ - $ 39 $28,089 (a)
BNY Mellon 95
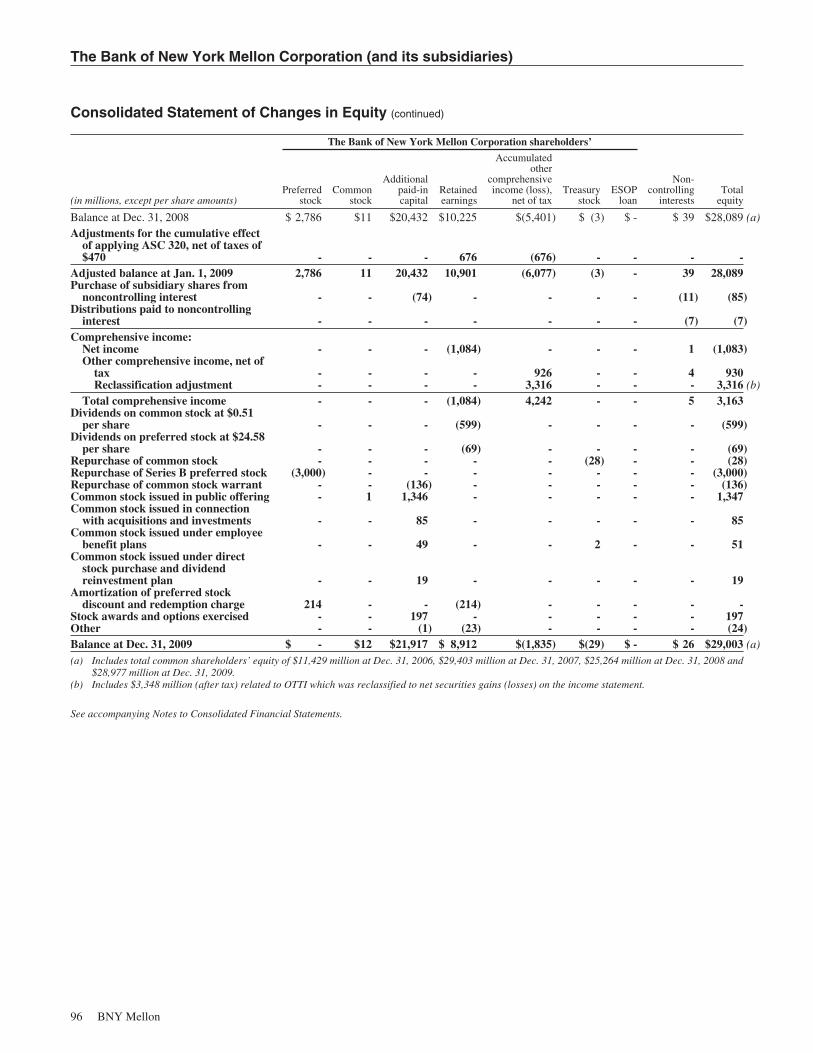
The Bank of New York Mellon Corporation (and its subsidiaries)
Consolidated Statement of Changes in Equity (continued)
The Bank of New York Mellon Corporation shareholders’
(in millions, except per share amounts)Preferred
stockCommon
stock
Additionalpaid-incapital
Retainedearnings
Accumulatedother
comprehensiveincome (loss),
net of taxTreasury
stockESOP
loan
Non-controlling
interestsTotal
equity
Balance at Dec. 31, 2008 $ 2,786 $11 $20,432 $10,225 $(5,401) $ (3) $ - $ 39 $28,089 (a)Adjustments for the cumulative effect
of applying ASC 320, net of taxes of$470 - - - 676 (676) - - - -
Adjusted balance at Jan. 1, 2009 2,786 11 20,432 10,901 (6,077) (3) - 39 28,089Purchase of subsidiary shares from
noncontrolling interest - - (74) - - - - (11) (85)Distributions paid to noncontrolling
interest - - - - - - - (7) (7)Comprehensive income:
Net income - - - (1,084) - - - 1 (1,083)Other comprehensive income, net of
tax - - - - 926 - - 4 930Reclassification adjustment - - - - 3,316 - - - 3,316 (b)
Total comprehensive income - - - (1,084) 4,242 - - 5 3,163Dividends on common stock at $0.51
per share - - - (599) - - - - (599)Dividends on preferred stock at $24.58
per share - - - (69) - - - - (69)Repurchase of common stock - - - - - (28) - - (28)Repurchase of Series B preferred stock (3,000) - - - - - - - (3,000)Repurchase of common stock warrant - - (136) - - - - - (136)Common stock issued in public offering - 1 1,346 - - - - - 1,347Common stock issued in connection
with acquisitions and investments - - 85 - - - - - 85Common stock issued under employee
benefit plans - - 49 - - 2 - - 51Common stock issued under direct
stock purchase and dividendreinvestment plan - - 19 - - - - - 19
Amortization of preferred stockdiscount and redemption charge 214 - - (214) - - - - -
Stock awards and options exercised - - 197 - - - - - 197Other - - (1) (23) - - - - (24)Balance at Dec. 31, 2009 $ - $12 $21,917 $ 8,912 $(1,835) $(29) $ - $ 26 $29,003 (a)(a) Includes total common shareholders’ equity of $11,429 million at Dec. 31, 2006, $29,403 million at Dec. 31, 2007, $25,264 million at Dec. 31, 2008 and
$28,977 million at Dec. 31, 2009.(b) Includes $3,348 million (after tax) related to OTTI which was reclassified to net securities gains (losses) on the income statement.
See accompanying Notes to Consolidated Financial Statements.
96 BNY Mellon
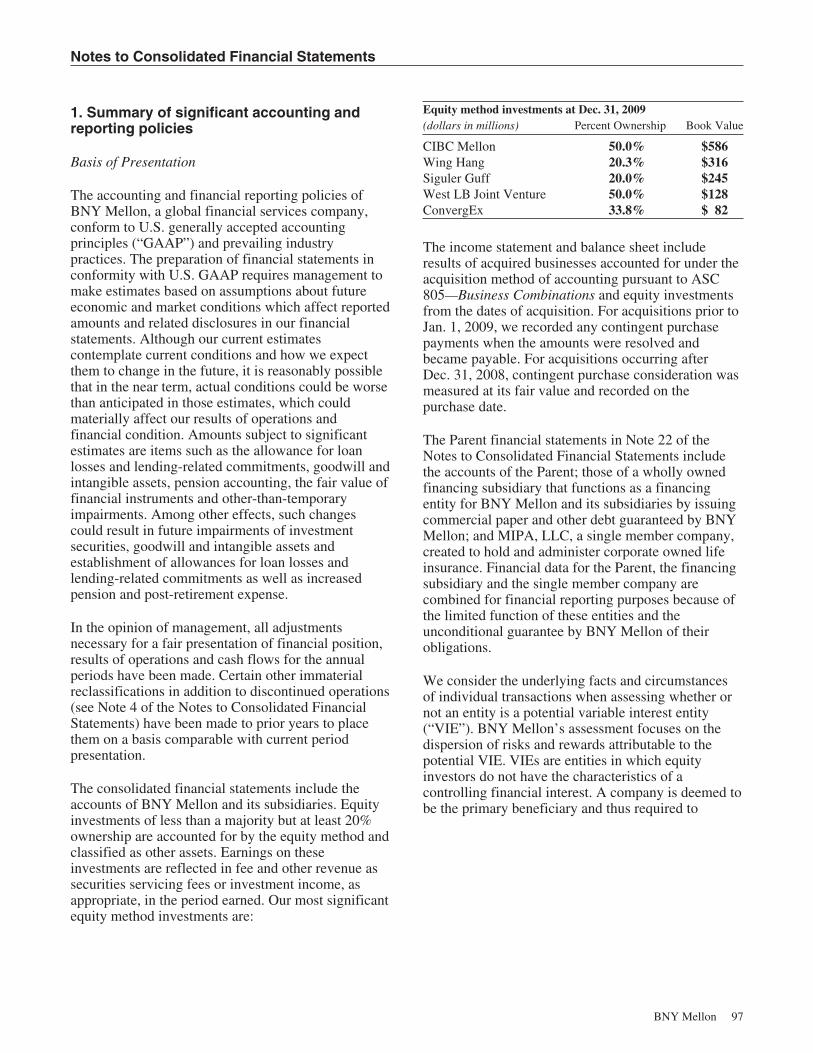
Notes to Consolidated Financial Statements
1. Summary of significant accounting andreporting policies
Basis of Presentation
The accounting and financial reporting policies ofBNY Mellon, a global financial services company,conform to U.S. generally accepted accountingprinciples (“GAAP”) and prevailing industrypractices. The preparation of financial statements inconformity with U.S. GAAP requires management tomake estimates based on assumptions about futureeconomic and market conditions which affect reportedamounts and related disclosures in our financialstatements. Although our current estimatescontemplate current conditions and how we expectthem to change in the future, it is reasonably possiblethat in the near term, actual conditions could be worsethan anticipated in those estimates, which couldmaterially affect our results of operations andfinancial condition. Amounts subject to significantestimates are items such as the allowance for loanlosses and lending-related commitments, goodwill andintangible assets, pension accounting, the fair value offinancial instruments and other-than-temporaryimpairments. Among other effects, such changescould result in future impairments of investmentsecurities, goodwill and intangible assets andestablishment of allowances for loan losses andlending-related commitments as well as increasedpension and post-retirement expense.
In the opinion of management, all adjustmentsnecessary for a fair presentation of financial position,results of operations and cash flows for the annualperiods have been made. Certain other immaterialreclassifications in addition to discontinued operations(see Note 4 of the Notes to Consolidated FinancialStatements) have been made to prior years to placethem on a basis comparable with current periodpresentation.
The consolidated financial statements include theaccounts of BNY Mellon and its subsidiaries. Equityinvestments of less than a majority but at least 20%ownership are accounted for by the equity method andclassified as other assets. Earnings on theseinvestments are reflected in fee and other revenue assecurities servicing fees or investment income, asappropriate, in the period earned. Our most significantequity method investments are:
Equity method investments at Dec. 31, 2009(dollars in millions) Percent Ownership Book Value
CIBC Mellon 50.0% $586Wing Hang 20.3% $316Siguler Guff 20.0% $245West LB Joint Venture 50.0% $128ConvergEx 33.8% $ 82
The income statement and balance sheet includeresults of acquired businesses accounted for under theacquisition method of accounting pursuant to ASC805—Business Combinations and equity investmentsfrom the dates of acquisition. For acquisitions prior toJan. 1, 2009, we recorded any contingent purchasepayments when the amounts were resolved andbecame payable. For acquisitions occurring afterDec. 31, 2008, contingent purchase consideration wasmeasured at its fair value and recorded on thepurchase date.
The Parent financial statements in Note 22 of theNotes to Consolidated Financial Statements includethe accounts of the Parent; those of a wholly ownedfinancing subsidiary that functions as a financingentity for BNY Mellon and its subsidiaries by issuingcommercial paper and other debt guaranteed by BNYMellon; and MIPA, LLC, a single member company,created to hold and administer corporate owned lifeinsurance. Financial data for the Parent, the financingsubsidiary and the single member company arecombined for financial reporting purposes because ofthe limited function of these entities and theunconditional guarantee by BNY Mellon of theirobligations.
We consider the underlying facts and circumstancesof individual transactions when assessing whether ornot an entity is a potential variable interest entity(“VIE”). BNY Mellon’s assessment focuses on thedispersion of risks and rewards attributable to thepotential VIE. VIEs are entities in which equityinvestors do not have the characteristics of acontrolling financial interest. A company is deemed tobe the primary beneficiary and thus required to
BNY Mellon 97

Notes to Consolidated Financial Statements (continued)
consolidate a VIE, if BNY Mellon has a variableinterest (or combination of variable interests) that willabsorb a majority of the VIE’s expected losses, thatwill receive a majority of the VIE’s expected residualreturns, or both. A “variable interest” is a contractual,ownership or other interest that changes with changesin the fair value of the VIE’s net assets. “Expectedlosses” and “expected residual returns” are measuresof variability in the expected cash flows of a VIE.When we transfer financial assets in a securitization toa VIE, the VIE must represent a qualifying specialpurpose entity (QSPE) or we would continue toconsolidate the transferred financial assets. QSPEstatus is achieved when all conditions specified inASC 860—Transfers and Servicing are met. Thoseconditions focus on whether the entity isdemonstrably distinct from BNY Mellon, limited toonly permitted activities, limited on what assets theQSPE may hold, and limited on sales or otherdispositions of assets. We also obtain the requiredtrue-sale opinions from outside counsel on allsecuritizations. We have determined that all of oursecuritization trusts are QSPEs.
Nature of operations
BNY Mellon is a global leader in providing a broadrange of financial products and services in domesticand international markets. Through our seven businesssegments (Asset Management, Wealth Management,Asset Servicing, Issuer Services, Clearing Services,Treasury Services and Other), we serve the followingmajor classes of customers—institutions,corporations, and high net worth individuals. Forinstitutions and corporations, we provide thefollowing services:
Š investment management;
Š trust and custody;
Š foreign exchange;
Š securities lending;
Š depositary receipts;
Š corporate trust;
Š shareowner services;
Š global payment/cash management; and
Š banking services.
For individuals, we provide mutual funds, separateaccounts, wealth management and private bankingservices. BNY Mellon’s asset management businessesprovide investment products in many asset classes andinvestment styles on a global basis.
Trading account securities, available-for-salesecurities, and held-to-maturity securities
Securities are accounted for under ASC 320Investments—Debt and Equity Securities. Securitiesare generally classified in the trading,available-for-sale investment or the held-to-maturityinvestment securities portfolios when they arepurchased. Securities are classified as tradingsecurities when our intention is to resell. Securities areclassified as available-for-sale securities when weintend to hold the securities for an indefinite period oftime or when the securities may be used for tacticalasset/liability purposes and may be sold from time totime to effectively manage interest rate exposure,prepayment risk and liquidity needs. Securities areclassified as held-to-maturity securities when weintend to hold them until maturity. Seed capitalinvestments are classified as other assets, tradingsecurities or available- for-sale securities, dependingon the nature of the investment and management’sintent.
Trading securities are stated at fair value. Tradingrevenue includes both realized and unrealized gainsand losses. The liability incurred on short-saletransactions, representing the obligation to deliversecurities, is included in trading liabilities at fairvalue.
Available-for-sale securities are stated at fair value.The difference between fair value and amortized costrepresenting unrealized gains or losses on assetsclassified as available-for-sale, are recorded net of taxas an addition to or deduction from othercomprehensive income, unless a security is deemed tohave an other than temporary impairment (“OTTI”).Gains and losses on sales of available-for-salesecurities are reported in the income statement. Thecost of debt and equity securities sold is determinedon a specific identification and average cost method,respectively. Unrealized gains and losses on seedcapital investments classified as other assets arerecorded in investment income. Held-to-maturitysecurities are stated at cost.
Income on securities purchased is adjusted foramortization of premium and accretion of discount ona level yield basis, unless a security is other-than-temporarily impaired.
Effective 2009, the Company adopted FAS 115-2 andFAS 124-2 “Recognition and Presentation of Other-Than-Temporary Impairments” (included in ASC 320)which changed the accounting disclosure for OTTI.
98 BNY Mellon
Notes to Consolidated Financial Statements (continued)
Under this new guidance, only the credit componentof an OTTI of a debt security is recognized inearnings and the noncredit component is recognized inother comprehensive income (“OCI”) when we do notintend to sell the security and it is more likely than notthat BNY Mellon will not be required to sell thesecurity prior to recovery.
For held-to-maturity debt securities, the amount ofOTTI recorded in OCI for the non-credit portion of aprevious OTTI is amortized prospectively, as anincrease to the carrying amount of the security, overthe remaining life of the security on the basis of thetiming of future estimated cash flows of the securities.Effective with the adoption of the new accountingguidance in 2009, management is required to assertthat it does not have the intent to sell the security andthat it is more likely than not it will not have to sellthe security before recovery of its cost basis in ordernot to be required to recognize non-credit componentof an OTTI in earnings.
If we intend to sell the security or it is more likelythan not that BNY Mellon will be required to sell thesecurity prior to recovery, the non-credit componentof OTTI is recognized in earnings and subsequentlyaccreted to interest income on an effective yield basisover the life of the security.
ASC 325 Investments—Other provides additionalspecific guidance for unrated investments which arebeneficial interests in securitized financial assets.BNY Mellon decides whether a security is within thescope of ASC 325 upon its acquisition and does notalter this decision if the security is subsequentlydowngraded. Under ASC 325, the excess of futureestimated cash flows over the initial carrying amountof the investment is accreted to interest income overthe life of the investment using the effective yieldmethod.
We routinely conduct periodic reviews to identify andevaluate each investment security to determinewhether OTTI has occurred. We examine variousfactors when determining whether an impairment,representing the fair value of a security being belowits amortized cost, is other than temporary. Thefollowing are examples of factors that BNY Mellonconsiders:
Š The length of time and the extent to which thefair value has been less than the amortized costbasis;
Š Whether management has an intent to sell thesecurity;
Š Whether the decline in fair value is attributableto specific adverse conditions affecting aparticular investment;
Š Whether the decline in fair value is attributableto specific conditions, such as conditions in anindustry or in a geographic area;
Š Whether a debt security has been downgradedby a rating agency;
Š Whether a debt security exhibits cash flowdeterioration; and
Š For each non-agency RMBS, we compare theremaining credit enhancement that protects theindividual security from losses against theprojected losses of principal and/or interestexpected to come from the underlying mortgagecollateral, to determine whether such creditlosses might directly impact the relevantsecurity.
The accounting policies for the determination of thefair value of financial instruments and OTTI havebeen identified as “critical accounting estimates” asthey require us to make numerous assumptions basedon available market data.
Loans and leases
Loans are reported net of any unearned discount. Loanorigination and upfront commitment fees, as well ascertain direct loan origination and commitment costs,are deferred and amortized as a yield adjustment overthe lives of the related loans. Deferred fees and costsare netted against outstanding loan balances. Loansheld for sale are carried at the lower of aggregate costor fair value.
Unearned revenue on direct financing leases isaccreted over the lives of the leases in decreasingamounts to provide a constant rate of return on the netinvestment in the leases. Revenue on leveraged leasesis recognized on a basis to achieve a constant yield onthe outstanding investment in the lease, net of therelated deferred tax liability, in the years in which thenet investment is positive. Gains and losses onresidual values of leased equipment sold are includedin investment income. Considering the nature of theseleases and the number of significant assumptions,there is risk associated with the income recognition onthese leases should any of the assumptions changematerially in future periods.
BNY Mellon 99

Notes to Consolidated Financial Statements (continued)
Nonperforming assets
Commercial loans are placed on nonaccrual statuswhen principal or interest is past due 90 days or more,or when there is reasonable doubt that interest orprincipal will be collected. Residential mortgage loansare generally placed on nonaccrual status when, in ourjudgment, collection is in doubt or the loans are 90days or more delinquent, subject to an impairmenttest. When a loan is placed on nonaccrual status,previously accrued and uncollected interest is reversedagainst current period interest revenue. Interestreceipts on nonaccrual and impaired loans arerecognized as interest revenue or are applied toprincipal when we believe the ultimate collectibilityof principal is in doubt. Nonaccrual loans generallyare restored to an accrual basis when principal andinterest become current.
A loan is considered to be impaired, as defined byASC 310—Accounting by Creditors for Impairment ofa Loan, when it is probable that we will be unable tocollect all principal and interest amounts dueaccording to the contractual terms of the loanagreement. An impairment allowance is measured onloans greater than $1 million and which meet thedefinition of an impaired loan per ASC 310. Impairedloans greater than $1 million are required to bemeasured based upon the loan’s market price, thepresent value of expected future cash flows,discounted at the loan’s initial effective interest rate,or at fair value of the collateral if the loan is collateraldependent. If the loan valuation is less than therecorded value of the loan, an impairment allowanceis established by either an allocation of the allowancefor credit losses or by a provision for credit losses.Impairment allowances are not needed when therecorded investment in an impaired loan is less thanthe loan valuation.
Allowance for loans losses and allowance for lendingrelated commitments
The allowance for loans losses, shown as a valuationallowance to loans, and the allowance for lendingrelated commitments are referred to as BNY Mellon’sallowance for credit exposure. The accounting policyfor the determination of the adequacy of theallowances has been identified as a “criticalaccounting estimate” as it requires us to makenumerous complex and subjective estimates andassumptions relating to amounts which are inherentlyuncertain.
The allowance for loans losses is maintained to absorblosses inherent in the loan portfolio as of the balancesheet date based on our judgment. The allowancedetermination methodology is designed to provideprocedural discipline in assessing the appropriatenessof the allowance. Credit losses are charged against theallowance. Recoveries are added to the allowance.
The methodology for determining the allowance forlending related commitments considers the samefactors as the allowance for loan losses, as well as anestimate of the probability of drawdown.
Premises and equipment
Premises and equipment are carried at cost lessaccumulated depreciation and amortization.Depreciation and amortization is computed using thestraight-line method over the estimated useful life ofthe owned asset and, for leasehold improvements,over the lesser of the remaining term of the leasedfacility or the estimated economic life of theimprovement. For owned and capitalized assets,estimated useful lives range from 2 to 40 years.Maintenance and repairs are charged to expense asincurred, while major improvements are capitalizedand amortized to operating expense over theiridentified useful lives.
Software
BNY Mellon capitalizes costs relating to acquiredsoftware and internal-use software developmentprojects that provide new or significantly improvedfunctionality. We capitalize projects that are expectedto result in longer term operational benefits, such asreplacement systems or new applications that result insignificantly increased operational efficiencies orfunctionality. All other costs incurred in connectionwith an internal-use software project are expensed asincurred. Capitalized software is recorded in otherassets.
Identified intangible assets and goodwill
Identified intangible assets with estimable lives areamortized in a pattern consistent with the assets’identifiable cash flows or using a straight-line methodover their remaining estimated benefit periods if thepattern of cash flows is not estimable. Intangibleassets with estimable lives are reviewed for possibleimpairment when events or changed circumstancesmay affect the underlying basis of the asset. Goodwilland intangibles with indefinite lives are not amortized,
100 BNY Mellon
Notes to Consolidated Financial Statements (continued)
but are assessed at least annually for impairment. Theaccounting policy for valuing and impairment testingof identified intangible assets and goodwill has beenidentified as a “critical accounting estimate” as itrequires us to make numerous complex and subjectiveestimates.
Fee revenue
We record security servicing fees, asset and wealthmanagement fees, foreign exchange and other tradingactivities, treasury services, financing-related fees,distribution and servicing, and other revenue when theservices are provided and earned based on contractualterms, when amounts are determined and collectibilityis reasonably assured.
Additionally, we recognize revenue fromnon-refundable, up-front implementation fees underoutsourcing contracts using a straight-line method,commencing in the period the ongoing services areperformed through the expected term of thecontractual relationship. Incremental direct set-upcosts of implementation, up to the relatedimplementation fee or minimum fee revenue amount,are deferred and amortized over the same period thatthe related implementation fees are recognized. If aclient terminates an outsourcing contract prematurely,the unamortized deferred incremental direct set-upcosts and the unamortized deferred up-frontimplementation fees related to that contract arerecognized in the period the contract is terminated.
Performance fees are recognized in the period inwhich the performance fees are earned and becomedeterminable. Performance fees are generallycalculated as a percentage of the applicable portfolio’sperformance in excess of a benchmark index or a peergroup’s performance. For hedge fund investments, aninvestment management performance fee is calculatedas a percentage of the applicable portfolio’s positivereturns. When a portfolio underperforms itsbenchmark or fails to generate positive performancein the instance of a hedge fund investment, subsequentyears’ performance must generally exceed thisshortfall prior to fees being earned. Amounts billablein subsequent years and which are subject to aclawback if performance thresholds in those years arenot met are not recognized since the fees arepotentially uncollectible. These fees are recognizedwhen it is determined that they will be collected.When a multi-year performance contract provides thatfees earned are billed ratably over the performanceperiod, only the portion of the fees earned that arenon-refundable are recognized.
Net interest revenue
Revenue on interest-earning assets and expense oninterest-bearing liabilities is recognized based on theeffective yield of the related financial instrument.
Foreign currency translation
Assets and liabilities denominated in foreigncurrencies are translated to U.S. dollars at the rate ofexchange on the balance sheet date. Transaction gainsand losses are included in the income statement.Translation gains and losses on investments in foreignentities with functional currencies that are not the U.S.dollar are recorded as foreign currency translationadjustments in other comprehensive results. Revenueand expense accounts are translated monthly at anaverage monthly exchange rate.
Pension
The measurement date for BNY Mellon’s pensionplans is Dec. 31. Plan assets are determined based onfair value generally representing observable marketprices. The projected benefit obligation is determinedbased on the present value of projected benefitdistributions at an assumed discount rate. Thediscount rate utilized is based on the yield of highquality corporate bonds available in the marketplace.The net periodic pension expense or credit includesservice costs, interest costs based on an assumeddiscount rate, an expected return on plan assets basedon an actuarially derived market-related value andamortization of prior years’ actuarial gains and losses.
Actuarial gains and losses include the impact of planamendments, gains or losses related to changes in theamount of the projected benefit obligation or planassets resulting from experience different from theassumed rate of return, changes in the discount rate orother assumptions. To the extent an actuarial gain orloss exceeds 10 percent of the greater of the projectedbenefit obligation or the market-related value of planassets, the excess is recognized over the future serviceperiods of active employees.
The market-related value utilized to determine theexpected return on plan assets is based on the fairvalue of plan assets adjusted for the differencebetween expected returns and actual performance ofplan assets. The difference between actual experienceand expected returns on plan assets is included as anadjustment in the market-related value over a five-year period.
BNY Mellon 101

Notes to Consolidated Financial Statements (continued)
BNY Mellon’s accounting policy regarding pensionshas been identified as a “critical accounting estimate”as it is regarded to be critical to the presentation of ourfinancial statements since it requires management tomake numerous complex and subjective assumptionsrelating to amounts which are inherently uncertain.
Severance
BNY Mellon provides separation benefits through TheBank of New York Mellon Corporation SeparationPlan, The Bank of New York Company, Inc.Separation Plan or the Mellon Financial CorporationDisplacement Program to eligible employeesseparated or displaced from their jobs for businessreasons not related to individual performance. Basicseparation benefits are based on the employee’s yearsof continuous benefited service. Separation expense isrecorded when management commits to an action thatwill result in separation and the amount of the liabilitycan be reasonably estimated.
Income taxes
We record current tax liabilities or assets throughcharges or credits to the current tax provision for theestimated taxes payable or refundable for the currentyear. Deferred tax assets and liabilities are recordedfor future tax consequences attributable to differencesbetween the financial statement carrying amounts ofassets and liabilities and their respective tax bases.Deferred tax assets and liabilities are measured usingenacted tax rates expected to apply to taxable incomein the years in which those temporary differences areexpected to be recovered or settled. A deferred taxvaluation allowance is established if it is more likelythan not that all or a portion of the deferred tax assetswill not be realized. A tax position that fails to meet amore-likely-than-not recognition threshold will resultin either reduction of current or deferred tax assets,and/or recording of current or deferred tax liabilities.Interest and penalties related to income taxes arerecorded as income tax expense.
Derivative financial instruments
Derivative contracts, such as futures contracts,forwards, interest rate swaps, foreign currency swapsand options and similar products used in tradingactivities are recorded at fair value. Gains and lossesare included in foreign exchange and other tradingactivities in fee and other revenue. Unrealized gainsand losses are reported on a gross basis in tradingaccount assets and trading liabilities, after taking intoconsideration master netting agreements.
We enter into various derivative financial instrumentsfor non-trading purposes primarily as part of our asset/liability management (“ALM”) process. Thesederivatives are designated as fair value and cash flowhedges of certain assets and liabilities when we enterinto the derivative contracts. Gains and lossesassociated with fair value hedges are recorded inincome as well as any change in the value of therelated hedged item. Gains and losses on cash flowhedges are recorded in other comprehensive income.Foreign currency transaction gains and losses relatedto a hedged net investment in a foreign operation, netof their tax effect, are recorded with cumulativeforeign currency translation adjustments within othercomprehensive income.
We formally document all relationships betweenhedging instruments and hedged items, as well as ourrisk-management objectives and strategy forundertaking various hedge transactions. This processincludes linking all derivatives that are designated asfair value hedges to specific assets or liabilities on thebalance sheet.
We formally assess, both at the hedge’s inception andon an ongoing basis, whether the derivatives that areused in hedging transactions are highly effective andwhether those derivatives are expected to remainhighly effective in future periods. We evaluateineffectiveness in terms of amounts that could impacta hedge’s ability to qualify for hedge accounting andthe risk that the hedge could result in more than a deminimis amount of ineffectiveness. At inception, thepotential causes of ineffectiveness related to each ofour hedges is assessed to determine if we can expectthe hedge to be highly effective over the life of thetransaction and to determine the method forevaluating effectiveness on an ongoing basis.
Recognizing that changes in the value of derivativesused for hedging or the value of hedged items couldresult in significant ineffectiveness, we have processesin place that are designed to identify and evaluatesuch changes when they occur. Quarterly, we performa quantitative effectiveness assessment and record anyineffectiveness in current earnings.
We discontinue hedge accounting prospectively whenwe determine that a derivative is no longer aneffective hedge, the derivative expires, is sold, ormanagement discontinues the derivative’s hedgedesignation. Subsequent gains and losses on thesederivatives are included in foreign exchange and othertrading activities. For fair value hedges, the
102 BNY Mellon

Notes to Consolidated Financial Statements (continued)
accumulated gain or loss on the hedged item isamortized on a yield basis over the remaining life ofthe hedged item. Accumulated gains and losses, net oftax effect, from cash flow hedges are reclassified fromother comprehensive income and recognized incurrent earnings in other revenue upon receipt of thehedged cash flow.
The accounting policy for the determination of the fairvalue of derivative financial instruments has beenidentified as a “critical accounting estimate” as itrequires us to make numerous assumptions based onthe available market data.
Statement of cash flows
We have defined cash, as cash and due from banks.Cash flows from hedging activities are classified inthe same category as the items hedged.
Stock options
We are using the “modified prospective” methodincluded in ASC 718 Compensation—StockCompensation. Under this method, compensation costis recognized for all share-based payments grantedafter Jan. 1, 2006 and for all awards granted toemployees prior to Jan. 1, 2006 that were unvested onJan 1, 2006. Stock option grants are amortized usingthe straight-line method.
Certain of our stock compensation grants vest whenthe employee retires. ASC 718 requires thecompletion of expensing of new grants with thisfeature by the first date the employee is eligible toretire. For grants prior to Jan. 1, 2006, we willcontinue to expense them over their stated vestingperiod.
2. Accounting changes and new accountingguidance
Noncontrolling interests and selected implementationquestions
In December 2007, the FASB issued new guidance onnoncontrolling interests included in ASC 810—Consolidation. This amends previous guidance toestablish accounting and reporting standards for thenoncontrolling interest in a subsidiary (i.e., minorityinterest) and for the deconsolidation of a subsidiary.This guidance applies to all entities that prepareconsolidated financial statements. This guidanceclarifies that a noncontrolling interest in a subsidiary
is part of the equity of the controlling group and isreported on the balance sheet within the equity sectionseparately from BNY Mellon’s equity as a distinctitem. The equity section of the balance sheet isrequired to present equity attributable to bothcontrolling and noncontrolling interests. The carryingamount of the noncontrolling interest is adjusted toreflect the change in ownership interest, and anydifference between the amount by which thenoncontrolling interests are adjusted and the fair valueof the consideration paid or received is recognizeddirectly in equity attributable to the noncontrollinginterest (i.e., as additional paid in capital). Anytransaction that results in the loss of control of asubsidiary is considered a remeasurement event withany retained interest remeasured at fair value. Thegain or loss recognized in income includes both therealized gain or loss related to the portion of theownership interest sold and the gain or loss on theremeasurement to fair value of the retained interest.
We adopted this guidance on Jan. 1, 2009. Thisguidance required retrospective application. As aresult, effective Jan. 1, 2009, we reclassified $39million of minority interest from liabilities to equityon our balance sheet. Net income attributable tononcontrolling interests was $1 million in 2009, $24million in 2008 and $19 million in 2007.
Business combinations
In December 2007, the FASB issued new guidance onbusiness combinations included in ASC 805—Business Combinations. This guidance requires allacquisitions of businesses to be measured at the fairvalue of the net assets acquired rather than the costallocation process specified in previous guidance. Theadoption of this guidance did not have a significantimpact on our financial position or results ofoperations. However, any business combinationentered into beginning in 2009 may significantlyimpact our financial position and results of operationscompared with how it would have been recordedunder prior GAAP. Earnings volatility could result,depending on the terms of the acquisition. Thisstatement requires transaction costs, such as legal,investment banking, and due diligence costs, to beexpensed as incurred and requires earn outcontingencies to be measured at fair value. Theaccounting requirements of this guidance are appliedon a prospective basis for all transactions completedsubsequent to Dec. 31, 2008.
BNY Mellon 103
Notes to Consolidated Financial Statements (continued)
Participating securities
In June 2008, the FASB issued new guidance,included in ASC 260—Earnings Per Share, ondetermining whether instruments granted in share-based payment transactions are participating securitiesprior to vesting and, therefore, need to be included inthe earnings allocation in computing earnings pershare (“EPS”) under the two-class method. Thisguidance applies to the calculation of EPS for share-based payment awards with rights to dividends ordividend equivalents. Unvested share-based paymentawards that contain non-forfeitable rights to dividendsor dividend equivalents (whether paid or unpaid) areparticipating securities and are included in thecomputation of EPS pursuant to the two-class method.This guidance was effective Jan. 1, 2009. Theadoption reduced basic EPS by approximately $0.01for the year ended Dec. 31, 2008. All prior period EPSdata was adjusted to conform to the provisions of thisguidance.
Useful life of intangible assets
In April 2008, the FASB issued new guidance on thedetermination of the useful life of intangible assets,included in ASC 350—Intangibles—Goodwill andOther. This guidance amended the factors that shouldbe considered in renewal or extension assumptionsused to determine the useful life and initial fair valueof recognized intangible assets. The new guidancebecame effective Jan. 1, 2009.
BNY Mellon estimates the fair value of intangibleassets at acquisition generally on the basis of anincome approach using discounted estimated cashflows. For customer relationship and customercontract intangibles, the expected renewals bycustomers are included in estimating the period overwhich cash flows will be generated to BNY Mellon.Estimates of customer renewals are generally basedupon the historical information of the acquiredintangible assets, and also consider BNY Mellon’sown historical experience with similar types ofcustomer relationships and contracts. In the absence ofhistorical information or our own experience, we useassumptions market participants would expect to useconsistent with the highest and best use of the assets.
Intangibles are amortized over the periods of and in apattern that is consistent with the identifiable cashflows, or on a straight-line method over the benefitperiod if the pattern of cash flows is not estimable.
The initial application of this guidance did not impactBNY Mellon as it already considers expectedcustomer renewals or extensions in cash flowestimates used to estimate fair values and useful lives.BNY Mellon does not capitalize any costs incurredthat may contribute to the renewal or extension of anycustomer relationship and contract intangibles.
Other-than-temporary impairment
In April 2009, the FASB issued new guidance onrecognition and presentation of other-than-temporaryimpairments, included in ASC 320—Investments —Debt and Equity Securities. This new guidancereplaced the “intent and ability” indication in previousguidance by specifying that (a) if a company does nothave the intent to sell a debt security prior to recoveryand (b) it is more likely than not that it will not haveto sell the debt security prior to recovery, the securitywould not be considered other-than-temporarilyimpaired unless there is a credit loss. When an entitydoes not intend to sell the security and it is morelikely than not that the entity will not have to sell thesecurity before recovery of its cost basis, it willrecognize the credit component of an other-than-temporary impairment of a debt security in earningsand the remaining portion in other comprehensiveincome. For held-to-maturity debt securities, theamount of OTTI recorded in OCI for the non-creditportion of a previous OTTI should be amortizedprospectively over the remaining life of the securityon the basis of the timing of future estimated cashflows of the security.
ASC 320 requires entities to initially apply theprovisions of the standard to previously other-than-temporarily impaired debt securities (i.e. debtsecurities that the entity does not intend to sell andthat the entity is not more likely than not required tosell before recovery) existing as of the date of initialadoption by making a cumulative-effect adjustment tothe opening balance of retained earnings in the periodof adoption. The cumulative-effect adjustmentreclassifies the noncredit portion of a previouslyother-than-temporarily impaired debt security held asof the date of initial adoption to accumulated OCIfrom retained earnings.
This guidance also amends the previous disclosureprovisions of ASC 320 for both debt and equitysecurities. It requires disclosures in interim and annualperiods for major security types identified on the basisof how an entity manages, monitors and measures itssecurities and the nature and risks of the security. We
104 BNY Mellon
Notes to Consolidated Financial Statements (continued)
adopted this new guidance effective Jan 1, 2009. As aresult of adopting this guidance, BNY Mellonrecorded a cumulative-effect adjustment as of thebeginning of the first quarter of 2009 of $676 million(after-tax) to reclassify the non-credit component ofthe previously recognized OTTI from retainedearnings to accumulated OCI (for those securitieswhere management did not intend to sell the securityand it was not more likely than not that BNY Mellonwould have been required to sell the securities beforerecovery). Additionally, the new accountingprescribed for recording OTTI on debt securitiesincreased net income by $126 million and dilutedearnings per common share by $0.11 in 2009.
Nonactive markets
In April 2009, the FASB issued new guidance ondetermining fair value when the volume and level ofactivity for the asset or liability have significantlydecreased and identifying transactions that are notorderly, included in ASC 820—Fair ValueMeasurements and Disclosures. The fair value of anasset, when the market is not active, is the price thatwould be received to sell the asset in an orderlytransaction (that is, not a forced liquidation ordistressed sale) between market participants at themeasurement date under current market conditions(that is, the inactive market). Entities need to concludewhether a transaction was orderly based on the weightof evidence. When estimating fair value, more weightis placed on transactions that BNY Mellon concludesare orderly and less weight on transactions for whichwe do not have sufficient information to concludewhether the transaction is orderly. This new guidancealso amends the disclosure provisions of ASC 820 torequire entities to disclose on interim and annualperiods the inputs and valuation techniques used tomeasure fair value.
ASU 2009-5—Measuring Liabilities at Fair Value
In August 2009, the FASB issued AccountingStandards Update (“ASU”) 2009-5, “MeasuringLiabilities at Fair Value.” This update providesamendments to ASC 820 for the fair valuemeasurement of liabilities. This new guidanceprovides clarification that in circumstances in which aquoted market price in an active market for theidentical liability is not available, a reporting entity isrequired to measure fair value using the followingtechniques: (1) a valuation technique that uses thequoted price of the identical liability when traded asan asset, and quoted prices for similar liabilities or
similar liabilities when traded as assets, or (2) anothervaluation technique that is consistent with theprinciples of ASC 820. In applying the abovetechniques, an entity must maximize the use ofrelevant observable inputs and minimize the use ofunobservable inputs. If applicable, an entity must alsoapply the guidance in ASC 820 for identifyingtransactions that are not orderly and for determiningfair value when the volume and level of activity for anasset or liability have significantly decreased. Thisguidance was effective Oct. 1, 2009 and did not havea significant impact on BNY Mellon.
ASU 2009-12—Investments in Certain Entities thatCalculate Net Asset Value per Share
In September 2009, the FASB issued ASU 2009-12,“Fair Value Measurements and Disclosures:Investments in Certain Entities That Calculate NetAsset Value per Share (or Its Equivalent),” (Topic820). ASU 2009-12 offers guidance on how to use anet asset value per share to estimate the fair value oninvestments in investment vehicles such as hedgefunds, private equity funds, real estate funds, venturecapital funds, offshore fund vehicles and fund offunds. Investors may use net asset value to estimatethe fair value of investments in investment companiesthat do not have a readily determinable fair value ifthe investees have the attributes of investmentcompanies and the net asset values or their equivalentsare calculated consistent with the AICPA Audit andAccounting Guide, Investment Companies, whichgenerally requires investments to be measured at fairvalue. This approach is deemed to be a “practicalexpedient” for investors in investment companies asthe GAAP fair-value measurement framework definesan asset’s fair value as its current exit price. ASU2009-12 has limitations and disclosure requirementsabout the nature and terms of the investments withinthe scope of the new guidance. ASU 2009-12 waseffective Dec. 31, 2009. Note 8 reflects thesedisclosure requirements.
Adopted in 2008
Fair value measurements
We adopted guidance related to “Fair valuemeasurements” included in ASC 820, effective Jan. 1,2008. This guidance defined fair value as the amountthat would be exchanged to sell an asset or transfer aliability, in an orderly transaction between marketparticipants. It also established a three-level hierarchybased on the transparency of the inputs to the
BNY Mellon 105

Notes to Consolidated Financial Statements (continued)
valuations of an asset or liability. In addition, thisguidance requires us to consider the effect of our owncredit standing in determining the fair value of ourliabilities. The requirements of ASC 820 were appliedprospectively, except in certain situations, which wererecorded as an adjustment to beginning retainedearnings in 2008. See Note 24 of the Notes toConsolidated Financial Statements.
Fair value option
ASC 825 provides companies with an irrevocableoption to elect fair value as the measurement basis forselected financial assets, financial liabilities,unrecognized firm commitments and written loancommitments which are not subject to fair value underother accounting standards. There was a one-timeelection available to apply this standard to existingfinancial instruments as of Jan 1. 2008. We elected thefair value option for $390 million of existing loansand unfunded loan commitments. The firstre-measurement of existing financial instruments forwhich the option was elected was recorded as anadjustment to retained earnings.
As a result of adopting the fair value option on theseloans and commitments, we recorded an aggregatecharge to retained earnings as of Jan. 1, 2008, of $36million, after tax. See Note 25 of the Notes toConsolidated Financial Statements.
3. Acquisitions and dispositions
We sometimes structure our acquisitions with both aninitial payment and later contingent payments tied topost-closing revenue or income growth. Foracquisitions completed prior to Jan. 1, 2009, werecord the fair value of contingent payments as anadditional cost of the entity acquired in the period thatthe payment becomes probable. For acquisitionscompleted after Jan. 1, 2009, subsequent changes inthe fair value of a contingent consideration liabilitywill be recorded through the income statement.Contingent payments totaled $36 million in 2009.
At Dec. 31, 2009, we were potentially obligated topay additional consideration which, using reasonableassumptions for the performance of the acquiredcompanies and joint ventures based on contractualagreements, could range from approximately $80million to $130 million over the next four years.
Potential contingent additional consideration of $7million was recorded as goodwill at Dec. 31, 2009.
Acquisitions in 2009
In November 2009, we acquired Insight InvestmentManagement Limited (“Insight”) for £235 million($377 million of cash and stock). Based in London,Insight specializes in liability-driven investmentsolutions, active fixed income and alternativeinvestments. Its clients include some of the UK’slargest pension schemes, corporates, insurancecompanies and local authorities. Insight had $138billion in assets under management at acquisition.Goodwill related to this acquisition is non-taxdeductible and totaled $202 million. Intangible assets(primarily customer contracts) related to thetransaction, with a life up to 11 years, totaled $111million. The impact of this acquisition is not expectedto be material to earnings per share in 2010.
In November 2009, BNY Mellon acquired a 20%minority interest in Siguler Guff & Company, LLC(and certain related entities), a multi-strategy privateequity firm with approximately $8 billion in assetsunder management and committed capital. The impactof this acquisition is not expected to be material toearnings per share.
Divestitures in 2009
On Jan. 15, 2010, BNY Mellon sold MUNB, ournational bank subsidiary located in Florida. Theresults for MUNB were classified as discontinuedoperations. See Note 4 for additional information onthe MUNB transaction.
Acquisitions in 2008
In January 2008, we acquired ARX CapitalManagement (“ARX”). ARX is a leading independentasset management business, headquartered in Rio deJaneiro, Brazil. The impact of this acquisition was notmaterial to earnings per share.
On Dec. 31, 2008, we acquired the Australian(Ankura Capital) and U.K. (Blackfriars AssetManagement) businesses from our Asset Managementjoint venture with WestLB. The impact of thisacquisition was not material to earnings per share.
Dispositions in 2008
In February 2008, we sold our B-Trade and G-Tradeexecution businesses to BNY ConvergEx Group.These businesses were sold at book value. Theexecution businesses contributed approximately $215
106 BNY Mellon
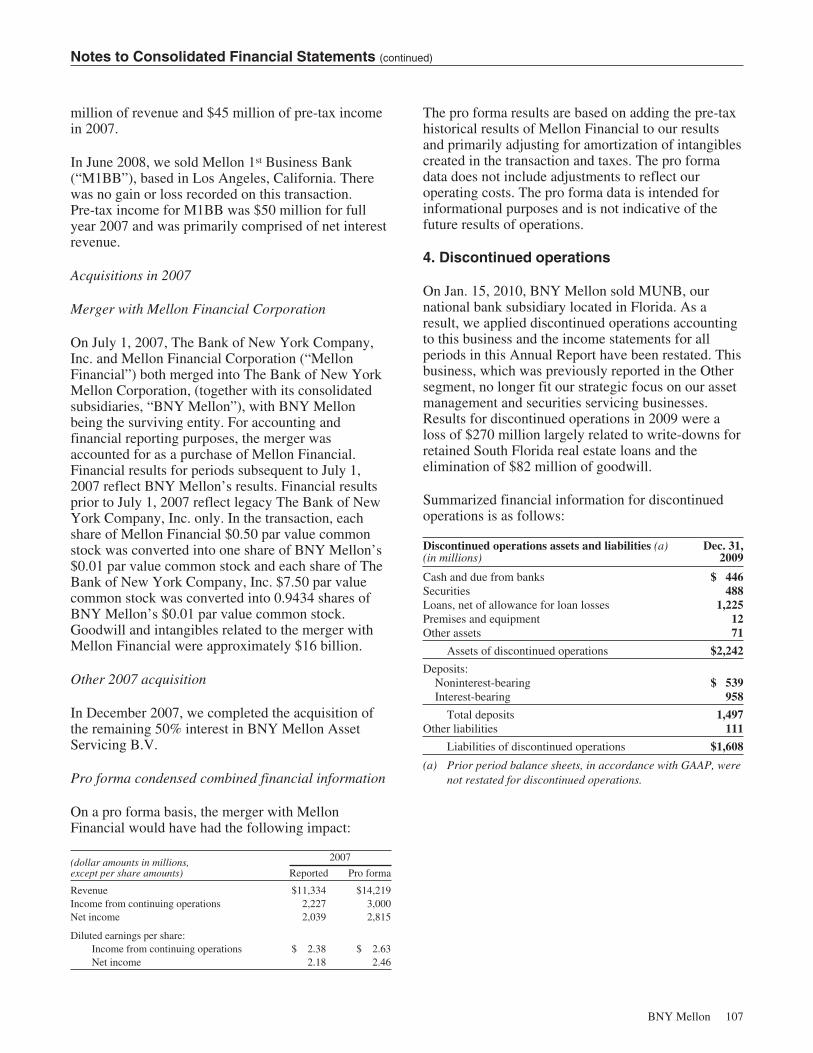
Notes to Consolidated Financial Statements (continued)
million of revenue and $45 million of pre-tax incomein 2007.
In June 2008, we sold Mellon 1st Business Bank(“M1BB”), based in Los Angeles, California. Therewas no gain or loss recorded on this transaction.Pre-tax income for M1BB was $50 million for fullyear 2007 and was primarily comprised of net interestrevenue.
Acquisitions in 2007
Merger with Mellon Financial Corporation
On July 1, 2007, The Bank of New York Company,Inc. and Mellon Financial Corporation (“MellonFinancial”) both merged into The Bank of New YorkMellon Corporation, (together with its consolidatedsubsidiaries, “BNY Mellon”), with BNY Mellonbeing the surviving entity. For accounting andfinancial reporting purposes, the merger wasaccounted for as a purchase of Mellon Financial.Financial results for periods subsequent to July 1,2007 reflect BNY Mellon’s results. Financial resultsprior to July 1, 2007 reflect legacy The Bank of NewYork Company, Inc. only. In the transaction, eachshare of Mellon Financial $0.50 par value commonstock was converted into one share of BNY Mellon’s$0.01 par value common stock and each share of TheBank of New York Company, Inc. $7.50 par valuecommon stock was converted into 0.9434 shares ofBNY Mellon’s $0.01 par value common stock.Goodwill and intangibles related to the merger withMellon Financial were approximately $16 billion.
Other 2007 acquisition
In December 2007, we completed the acquisition ofthe remaining 50% interest in BNY Mellon AssetServicing B.V.
Pro forma condensed combined financial information
On a pro forma basis, the merger with MellonFinancial would have had the following impact:
(dollar amounts in millions,except per share amounts)
2007
Reported Pro forma
Revenue $11,334 $14,219Income from continuing operations 2,227 3,000Net income 2,039 2,815
Diluted earnings per share:Income from continuing operations $ 2.38 $ 2.63Net income 2.18 2.46
The pro forma results are based on adding the pre-taxhistorical results of Mellon Financial to our resultsand primarily adjusting for amortization of intangiblescreated in the transaction and taxes. The pro formadata does not include adjustments to reflect ouroperating costs. The pro forma data is intended forinformational purposes and is not indicative of thefuture results of operations.
4. Discontinued operations
On Jan. 15, 2010, BNY Mellon sold MUNB, ournational bank subsidiary located in Florida. As aresult, we applied discontinued operations accountingto this business and the income statements for allperiods in this Annual Report have been restated. Thisbusiness, which was previously reported in the Othersegment, no longer fit our strategic focus on our assetmanagement and securities servicing businesses.Results for discontinued operations in 2009 were aloss of $270 million largely related to write-downs forretained South Florida real estate loans and theelimination of $82 million of goodwill.
Summarized financial information for discontinuedoperations is as follows:
Discontinued operations assets and liabilities (a)(in millions)
Dec. 31,2009
Cash and due from banks $ 446Securities 488Loans, net of allowance for loan losses 1,225Premises and equipment 12Other assets 71
Assets of discontinued operations $2,242
Deposits:Noninterest-bearing $ 539Interest-bearing 958
Total deposits 1,497Other liabilities 111
Liabilities of discontinued operations $1,608
(a) Prior period balance sheets, in accordance with GAAP, werenot restated for discontinued operations.
BNY Mellon 107
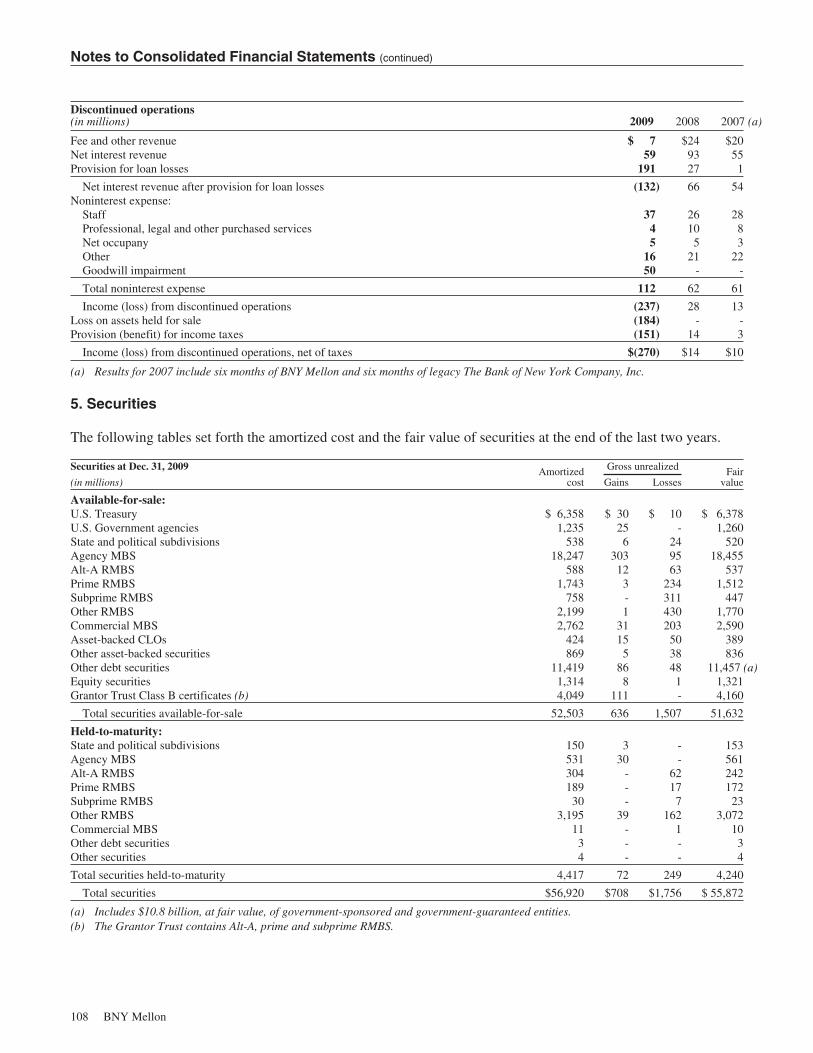
Notes to Consolidated Financial Statements (continued)
Discontinued operations(in millions) 2009 2008 2007 (a)
Fee and other revenue $ 7 $24 $20Net interest revenue 59 93 55Provision for loan losses 191 27 1
Net interest revenue after provision for loan losses (132) 66 54Noninterest expense:
Staff 37 26 28Professional, legal and other purchased services 4 10 8Net occupany 5 5 3Other 16 21 22Goodwill impairment 50 - -
Total noninterest expense 112 62 61
Income (loss) from discontinued operations (237) 28 13Loss on assets held for sale (184) - -Provision (benefit) for income taxes (151) 14 3
Income (loss) from discontinued operations, net of taxes $(270) $14 $10
(a) Results for 2007 include six months of BNY Mellon and six months of legacy The Bank of New York Company, Inc.
5. Securities
The following tables set forth the amortized cost and the fair value of securities at the end of the last two years.
Securities at Dec. 31, 2009 Amortizedcost
Gross unrealized Fairvalue(in millions) Gains Losses
Available-for-sale:U.S. Treasury $ 6,358 $ 30 $ 10 $ 6,378U.S. Government agencies 1,235 25 - 1,260State and political subdivisions 538 6 24 520Agency MBS 18,247 303 95 18,455Alt-A RMBS 588 12 63 537Prime RMBS 1,743 3 234 1,512Subprime RMBS 758 - 311 447Other RMBS 2,199 1 430 1,770Commercial MBS 2,762 31 203 2,590Asset-backed CLOs 424 15 50 389Other asset-backed securities 869 5 38 836Other debt securities 11,419 86 48 11,457 (a)Equity securities 1,314 8 1 1,321Grantor Trust Class B certificates (b) 4,049 111 - 4,160
Total securities available-for-sale 52,503 636 1,507 51,632
Held-to-maturity:State and political subdivisions 150 3 - 153Agency MBS 531 30 - 561Alt-A RMBS 304 - 62 242Prime RMBS 189 - 17 172Subprime RMBS 30 - 7 23Other RMBS 3,195 39 162 3,072Commercial MBS 11 - 1 10Other debt securities 3 - - 3Other securities 4 - - 4
Total securities held-to-maturity 4,417 72 249 4,240
Total securities $56,920 $708 $1,756 $ 55,872
(a) Includes $10.8 billion, at fair value, of government-sponsored and government-guaranteed entities.(b) The Grantor Trust contains Alt-A, prime and subprime RMBS.
108 BNY Mellon

Notes to Consolidated Financial Statements (continued)
Securities at Dec. 31, 2008 Amortizedcost
Gross unrealized Fairvalue(in millions) Gains Losses
Available-for-sale:U.S. Treasury $ 746 $ 36 $ 1 $ 781U.S. Government agencies 1,259 40 - 1,299State and political subdivisions 896 8 21 883Agency RMBS 10,862 211 174 10,899Alt-A RMBS 5,164 21 2,223 2,962Prime RMBS 6,437 - 1,733 4,704Subprime RMBS 1,512 - 575 937Other RMBS 2,997 - 596 2,401Commercial MBS 3,275 - 803 2,472Asset-backed CLOs 604 2 166 440Other asset-backed securities 1,612 - 479 1,133Other debt securities 1,884 36 130 1,790Equity securities 1,392 - 29 1,363
Total securities available-for-sale 38,640 354 6,930 32,064
Held-to-maturity:State and political subdivisions 193 2 2 193Agency RMBS 699 24 1 722Alt-A RMBS 2,335 - 562 1,773Prime RMBS 288 - 48 240Subprime RMBS 66 - 16 50Other RMBS 3,770 - 432 3,338Commercial MBS 13 - 3 10Other debt securities 4 - - 4Other securities 3 - - 3
Total securities held-to-maturity 7,371 26 1,064 6,333
Total securities $46,011 $380 $7,994 $38,397
In conjunction with the restructuring of the investmentsecurities portfolio, in 2009, we changed our intent tohold to maturity $1.7 billion of securities included inthe held-to-maturity classification and recordedmark-to-market losses, both credit and non-credit, onthese securities in the income statement. Thesesecurities have experienced a decrease in the creditquality of the underlying collateral or a significantincrease in the risk-weight used for regulatory capitalpurposes.
Temporarily impaired securities
At Dec. 31, 2009, almost all of the unrealized lossesare attributable to credit spreads widening and interest
rate fluctuations since purchase. We do not intend tosell these securities and it is not more likely than notthat we will have to sell.
The following tables show the aggregate related fairvalue of investments with a continuous unrealized lossposition for less than 12 months and those that havebeen in a continuous unrealized loss position forgreater than 12 months, including debt securities forwhich a portion of other-than-temporary impairmenthas been recognized in OCI.
BNY Mellon 109
Notes to Consolidated Financial Statements (continued)
Temporarily impaired securities Less than 12 months 12 months or more Total
(in millions)Fair
valueUnrealized
lossesFair
valueUnrealized
lossesFair
valueUnrealized
losses
Dec. 31, 2009:Available-for-sale:
U.S. Treasury $1,226 $ 9 $ 176 $ 1 $ 1,402 $ 10State and political subdivisions 50 13 171 11 221 24Agency MBS 7,297 76 2,061 19 9,358 95Alt-A RMBS - - 311 63 311 63Prime RMBS 5 1 1,480 233 1,485 234Subprime RMBS 1 2 446 309 447 311Other RMBS - - 1,764 430 1,764 430Commercial MBS - - 1,290 203 1,290 203Asset-backed CLOs 18 6 274 44 292 50Other asset-backed securities - - 706 38 706 38Other debt securities 33 - 8,804 48 8,837 48Equity securities 16 - 3 1 19 1
Total securities available-for-sale $8,646 $107 $17,486 $1,400 $26,132 $ 1,507
Held-to-maturity:Alt-A RMBS $ 2 $ 1 $ 221 $ 61 $ 223 $ 62Prime RMBS - - 172 17 172 17Subprime RMBS - - 23 7 23 7Other RMBS - - 3,072 162 3,072 162Commercial MBS - - 10 1 10 1
Total securities held-to-maturity $ 2 $ 1 $ 3,498 $ 248 $ 3,500 $ 249
Total temporarily impaired securities $8,648 $108 $20,984 $1,648 $29,632 $1,756 (a)
Dec. 31, 2008:Available-for-sale:
U.S. Treasury $ - $ - $ 30 $ 1 $ 30 $ 1State and political subdivisions 247 8 264 13 511 21Agency RMBS - - 4,370 174 4,370 174Alt-A RMBS 145 64 1,891 2,159 2,036 2,223Prime RMBS 375 102 4,291 1,631 4,666 1,733Subprime RMBS 129 58 808 517 937 575Other RMBS 39 - 2,362 596 2,401 596Commercial MBS 136 55 2,295 748 2,431 803Asset-backed CLOs 70 50 349 116 419 166Other asset-backed securities 89 3 989 476 1,078 479Other debt securities 67 8 199 122 266 130Other equity securities 10 6 33 23 43 29
Total securities available-for-sale $1,307 $354 $17,881 $6,576 $19,188 $ 6,930
Held-to-maturity:State and political subdivisions $ - $ - $ 63 $ 2 $ 63 $ 2Agency RMBS - - 25 1 25 1Alt-A RMBS 172 75 1,575 487 1,747 562Prime RMBS - - 240 48 240 48Subprime RMBS - - 50 16 50 16Other RMBS - - 3,338 432 3,338 432Commercial MBS - - 10 3 10 3
Total securities held-to-maturity $ 172 $ 75 $ 5,301 $ 989 $ 5,473 $ 1,064
Total temporarily impaired securities $1,479 $429 $23,182 $7,565 $24,661 $ 7,994
(a) Includes other-than-temporarily impaired securities in which portions of the other-than-temporary impairment loss remains in OCI.
110 BNY Mellon
Notes to Consolidated Financial Statements (continued)
The amortized cost and fair value of securities at Dec. 31, 2009, by contractual maturity, are as follows:
Securities by contractual maturity at Dec. 31, 2009 Available-for-sale Held-to-maturity
(in millions)Amortized
costFair
valueAmortized
costFair
value
Due in one year or less $ 1,457 $ 1,483 $ 3 $ 3Due after one year through five years 17,132 17,211 3 3Due after five years through ten years 293 300 16 16Due after ten years 668 621 131 134Mortgage-backed securities 30,346 (a) 29,471 (a) 4,260 4,080Asset-backed securities 1,293 1,225 - -Equity securities 1,314 1,321 4 4
Total securities $ 52,503 $ 51,632 $4,417 $4,240
(a) Includes the Grantor Trust Class B certificates with an amortized cost of $4.049 billion and a fair value of $4.160 billion.
The realized gross gains, realized gross losses, andrecognized gross impairments are as follows:
Net securities losses(in millions) 2009 2008 2007
Realized gross gains $ 130 $ 10 $ 29Realized gross losses (1,648) (531) (230)Recognized gross impairments (3,851) (1,107) -
Total net securities losses $(5,369) $(1,628) $(201)
Other-than-temporary impairment
For certain debt securities which have no debt ratingat acquisition and are beneficial interests insecuritized financial assets under ASC 325, OTTIoccurs when we determine that there has been anadverse change in cash flows and the present value ofthose remaining cash flows is less than the presentvalue of the remaining cash flows estimated at thesecurity’s acquisition date (or last estimated cash flowrevision date).
We routinely conduct periodic reviews to identify andevaluate each investment security to determinewhether OTTI has occurred. Economic models areused to determine whether an OTTI has occurred onthese securities. While all securities are considered,the securities primarily impacted by OTTI testing arenon-agency RMBS. For each non-agency RMBS inthe investment portfolio (including but not limited tothose whose fair value is less than their amortized costbasis), an extensive, regular review is conducted todetermine if an OTTI has occurred. Various inputs tothe economic models are used to determine if anunrealized loss on non-agency RMBS is other-than-temporary. The most significant inputs are:
Š Default rate—the number of mortgage loansexpected to go into default over the life of the
transaction, which is driven by the roll rate ofloans in each performance bucket that willultimately migrate to default; and
Š Severity—the loss expected to be realized whena loan defaults
To determine if the unrealized loss for non-agencyRMBS is other-than-temporary, we project totalestimated defaults of the underlying assets(mortgages) and multiply that calculated amount byan estimate of realizable value upon sale of theseassets in the marketplace (severity) in order todetermine the projected collateral loss. We alsoevaluate the current credit enhancement underlyingthe bond to determine the impact on cash flows. If wedetermine that a given RMBS position will be subjectto a write-down or loss, we record the expected creditloss as a charge to earnings.
In addition, we have estimated the expected loss bytaking into account observed performance of theunderlying securities, industry studies, marketforecasts, as well as our view of the economic outlookof the collateral.
The table below shows the projected weighted-average default rates and loss severities for the recent-vintage (i.e. 2007, 2006 and late 2005) non-agencyRMBS and the Grantor Trust portfolios at Dec. 31,2009 and Dec. 31, 2008.
Projected weighted-average default rates and severitiesDec. 31, 2009 Dec. 31, 2008
Default Rate Severity Default Rate Severity
Alt-A 43% 50% 28% 43%Subprime 74% 69% 56% 59%Prime 19% 44% 14% 31%
BNY Mellon 111
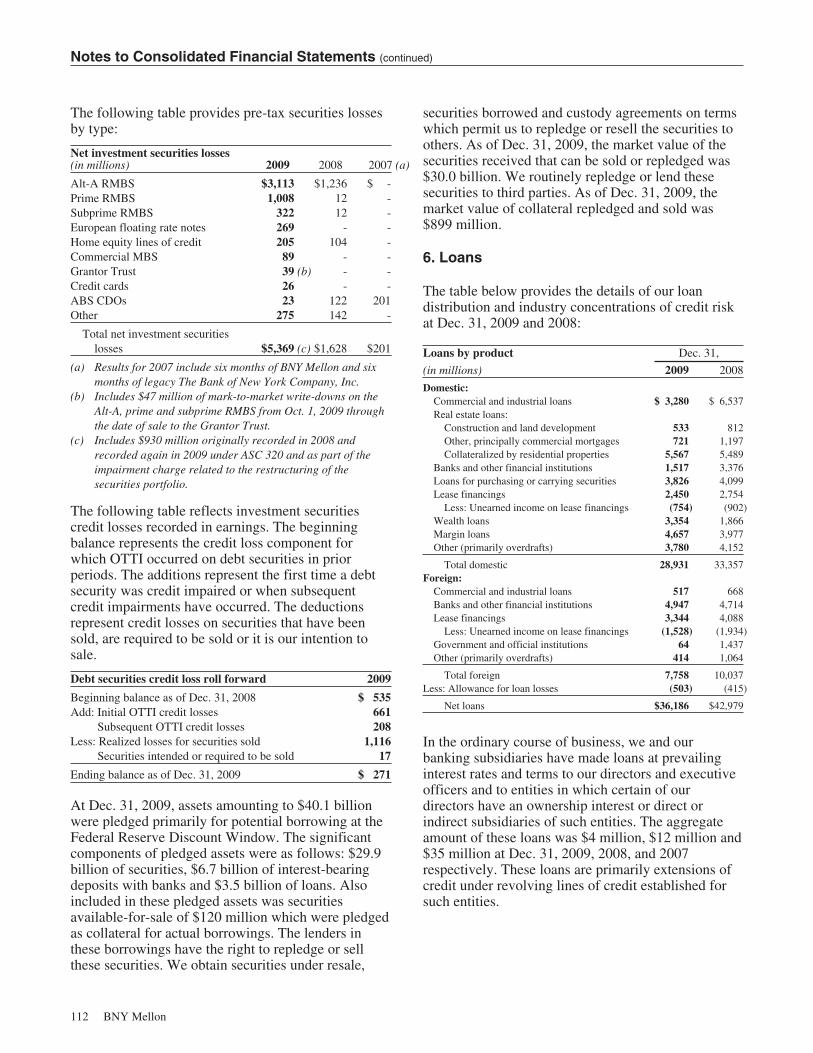
Notes to Consolidated Financial Statements (continued)
The following table provides pre-tax securities lossesby type:
Net investment securities losses(in millions) 2009 2008 2007 (a)
Alt-A RMBS $3,113 $1,236 $ -Prime RMBS 1,008 12 -Subprime RMBS 322 12 -European floating rate notes 269 - -Home equity lines of credit 205 104 -Commercial MBS 89 - -Grantor Trust 39 (b) - -Credit cards 26 - -ABS CDOs 23 122 201Other 275 142 -
Total net investment securitieslosses $5,369 (c) $1,628 $201
(a) Results for 2007 include six months of BNY Mellon and sixmonths of legacy The Bank of New York Company, Inc.
(b) Includes $47 million of mark-to-market write-downs on theAlt-A, prime and subprime RMBS from Oct. 1, 2009 throughthe date of sale to the Grantor Trust.
(c) Includes $930 million originally recorded in 2008 andrecorded again in 2009 under ASC 320 and as part of theimpairment charge related to the restructuring of thesecurities portfolio.
The following table reflects investment securitiescredit losses recorded in earnings. The beginningbalance represents the credit loss component forwhich OTTI occurred on debt securities in priorperiods. The additions represent the first time a debtsecurity was credit impaired or when subsequentcredit impairments have occurred. The deductionsrepresent credit losses on securities that have beensold, are required to be sold or it is our intention tosale.
Debt securities credit loss roll forward 2009
Beginning balance as of Dec. 31, 2008 $ 535Add: Initial OTTI credit losses 661
Subsequent OTTI credit losses 208Less: Realized losses for securities sold 1,116
Securities intended or required to be sold 17
Ending balance as of Dec. 31, 2009 $ 271
At Dec. 31, 2009, assets amounting to $40.1 billionwere pledged primarily for potential borrowing at theFederal Reserve Discount Window. The significantcomponents of pledged assets were as follows: $29.9billion of securities, $6.7 billion of interest-bearingdeposits with banks and $3.5 billion of loans. Alsoincluded in these pledged assets was securitiesavailable-for-sale of $120 million which were pledgedas collateral for actual borrowings. The lenders inthese borrowings have the right to repledge or sellthese securities. We obtain securities under resale,
securities borrowed and custody agreements on termswhich permit us to repledge or resell the securities toothers. As of Dec. 31, 2009, the market value of thesecurities received that can be sold or repledged was$30.0 billion. We routinely repledge or lend thesesecurities to third parties. As of Dec. 31, 2009, themarket value of collateral repledged and sold was$899 million.
6. Loans
The table below provides the details of our loandistribution and industry concentrations of credit riskat Dec. 31, 2009 and 2008:
Loans by product Dec. 31,
(in millions) 2009 2008
Domestic:Commercial and industrial loans $ 3,280 $ 6,537Real estate loans:
Construction and land development 533 812Other, principally commercial mortgages 721 1,197Collateralized by residential properties 5,567 5,489
Banks and other financial institutions 1,517 3,376Loans for purchasing or carrying securities 3,826 4,099Lease financings 2,450 2,754
Less: Unearned income on lease financings (754) (902)Wealth loans 3,354 1,866Margin loans 4,657 3,977Other (primarily overdrafts) 3,780 4,152
Total domestic 28,931 33,357Foreign:
Commercial and industrial loans 517 668Banks and other financial institutions 4,947 4,714Lease financings 3,344 4,088
Less: Unearned income on lease financings (1,528) (1,934)Government and official institutions 64 1,437Other (primarily overdrafts) 414 1,064
Total foreign 7,758 10,037Less: Allowance for loan losses (503) (415)
Net loans $36,186 $42,979
In the ordinary course of business, we and ourbanking subsidiaries have made loans at prevailinginterest rates and terms to our directors and executiveofficers and to entities in which certain of ourdirectors have an ownership interest or direct orindirect subsidiaries of such entities. The aggregateamount of these loans was $4 million, $12 million and$35 million at Dec. 31, 2009, 2008, and 2007respectively. These loans are primarily extensions ofcredit under revolving lines of credit established forsuch entities.
112 BNY Mellon
Notes to Consolidated Financial Statements (continued)
Transactions in the allowance for credit losses aresummarized as follows:
Allowance for credit losses
(in millions)
Allowancefor loan
losses
Allowancefor lending-
relatedcommitments
Allowancefor credit
losses
Balance at Dec. 31, 2006 (a) $ 287 $150 $ 437Acquisition 43 87 130Charge-offs: (b)
Commercial (16) (6) (22)Leasing (36) - (36)Foreign (19) - (19)Other (1) - (1)
Total charge-offs (72) (6) (78)Recoveries: (b)
Commercial 1 - 1Leasing 13 - 13Foreign 1 - 1
Total recoveries 15 - 15
Net charge-offs (57) (6) (63)Provision for credit losses (b) 54 (65) (11)Transferred to discontinued
operations - 1 1
Balance at Dec. 31, 2007 $ 327 $167 $ 494 (c)
Charge-offs:Commercial (30) - (30)Commercial real estate (15) - (15)Foreign (17) - (17)Other residential mortgages (20) - (20)Wealth management (1) - (1)
Total charge-offs (83) - (83)Recoveries:
Commercial 2 - 2Leasing 3 - 3Foreign 4 - 4Other 1 - 1
Total recoveries 10 - 10
Net charge-offs (73) - (73)Disposition/other (21) (2) (23)Provision for credit losses 154 (50) 104Transferred to discontinued
operations 28 (1) 27
Balance at Dec. 31, 2008 $ 415 $114 $ 529 (c)
Charge-offs:Commercial (124) - (124)Commercial real estate (31) - (31)Other residential mortgages (60) - (60)Wealth management (1) - (1)
Total charge-offs (216) - (216)Recoveries:
Leasing 1 - 1Other 1 - 1
Total recoveries 2 - 2
Net charge-offs (214) - (214)Provision for credit losses 319 13 332Transferred to discontinued
operations (17) (2) (19)
Balance at Dec. 31, 2009 (c) $ 503 $125 $ 628 (c)
(a) Reflects legacy The Bank of New York Company, Inc. only.(b) Reflects six months of BNY Mellon and six months of legacy The Bank
of New York Company, Inc.(c) The allowance for credit losses at Dec. 31, 2009 excludes
discontinued operations. The allowance for credit losses includesdiscontinued operations of $35 million at Dec. 31, 2008 and $17million at Dec. 31, 2007.
The table below sets forth information about ournonperforming assets and impaired loans.
Nonperforming assets and impaired loansDec. 31,
(in millions) 2009 2008 2007
Loans:Other residential mortgages $190 $ 97 $ 20Financial institutions 172 41 24Commercial 65 14 15Commercial real estate 61 130 40Wealth management 58 2 -
Total domestic 546 284 99Foreign - - 87
Total nonperforming loans 546 284 186Other assets owned 4 8 4
Total nonperforming assets (a) $550 $292 $190
Impaired loans with an allowance $303 $165 $141Impaired loans without an
allowance (b) 42 21 17
Total impaired loans (c) $345 $186 $158Allowance for impaired loans (d) $ 51 $ 51 $ 34Average balance of impaired loans
during the year 216 178 27Interest income recognized on
impaired loans during the year 2 - -
(a) Nonperforming assets at Dec. 31, 2009 exclude discontinuedoperations. Nonperforming assets at Dec. 31, 2008 and Dec.31, 2007 include discontinued operations of $96 million and$18 million, respectively.
(b) When the discounted cash flows, collateral value or marketprice equals or exceeds the carrying value of the loan, thenthe loan does not require an allowance under the accountingstandard related to impaired loans.
(c) Total impaired loans at Dec. 31, 2009 exclude discontinuedoperations. Total impaired loans include discontinuedoperations of $93 million at Dec. 31, 2008 and $17 million atDec. 31, 2007.
(d) The allowance for impaired loans is included in theallowance for loan losses.
Past due loans still accruing interest at year-end(in millions) 2009 2008 2007
Domestic:Consumer $ 93 $ 27 $ -Commercial 338 315 343
Total domestic 431 342 343Foreign - - -
Total past due loans (a) $431 $342 $343
(a) Past due loans at Dec. 31, 2009 exclude discontinuedoperations. There were no past due loans at Dec. 31, 2008and 2007 included in discontinued operations.
BNY Mellon 113

Notes to Consolidated Financial Statements (continued)
Lost interest Dec. 31,
(in millions) 2009 2008 2007
Amount by which interest incomerecognized on nonperforming loansexceeded reversals:
Total $ 2 $ - $1Foreign 1 - -
Amount by which interest incomewould have increased ifnonperforming loans at year-end hadbeen performing for the entire year:
Total (a) $10 $12 $6Foreign 1 - 2
(a) Lost interest excludes discontinued operations for 2009. Lostinterest includes discontinued operations of $5 million in2008 and less than $1 million in 2007.
At Dec. 31, 2009, undrawn commitments to borrowerswhose loans were classified as nonaccrual or reducedrate were not material.
We use the discounted cash flow method as theprimary method for valuing impaired loans.
7. Goodwill and intangible assets
Goodwill
The level of goodwill increased in 2009 due to foreignexchange translation on non-U.S. dollar denominatedgoodwill and the Insight acquisition, partially offsetby the transfer of goodwill to discontinued operations.Goodwill impairment testing is performed annually atthe business segment level.
The table below provides a breakdown of goodwill by business segment.
Goodwill by segment(in millions)
AssetManagement
WealthManagement
AssetServicing
IssuerServices
ClearingServices
TreasuryServices Other Total
Balance at Dec. 31, 2007 $7,054 $2,362 $3,291 $2,413 $1,119 $ 92 $ - $16,331Acquisitions/dispositions 184 - (11) 52 (50) - (178) (3)Transfer between segments (a) - (255) - - - - 255 -Foreign exchange translation (501) - (162) (4) (51) - - (718)Other (b) 481 (413) 242 2 (116) 31 61 288
Balance at Dec. 31, 2008 $7,218 $1,694 $3,360 $2,463 $ 902 $123 $ 138 $15,898Acquisitions 202 - - - - - - 202Foreign exchange translation 174 - 37 14 15 - - 240Transferred to discontinued
operations - - - - - - (128) (c) (128)Other (b) 15 9 - 11 1 4 (3) 37
Balance at Dec. 31, 2009 $7,609 $1,703 $3,397 $2,488 $ 918 $127 $ 7 $16,249
(a) Transfer reflects the movements of M1BB and MUNB to the Other segment from the Wealth Management segment.(b) Other changes in goodwill include purchase price adjustments and certain other reclassifications.(c) Includes a $50 million goodwill impairment recorded in the first quarter of 2009. No goodwill impairment was recorded in 2008 or
2007.
Intangible assets
Intangible assets not subject to amortization are testedannually for impairment or more often if events orcircumstances indicate they may be impaired. Thedecrease in intangible assets in 2009 compared with2008 resulted from intangible amortization partiallyoffset by the Insight acquisition and foreign exchangetranslation on non-U.S. dollar denominated intangibleassets.
Intangible amortization expense was $426 million,$473 million and $314 million in 2009, 2008 and2007 respectively. No impairment losses wererecorded on intangible assets in 2009 or 2008.
The table below provides a breakdown of intangibleassets by business segment.
114 BNY Mellon

Notes to Consolidated Financial Statements (continued)
Intangible assets—net carrying amount by segment
(in millions)Asset
ManagementWealth
ManagementAsset
ServicingIssuer
ServicesClearingServices
TreasuryServices Other Total
Net carrying amount atDec. 31, 2007 $3,364 $ 643 $ 505 $919 $710 $261 $ - $6,402
Acquisitions/dispositions 27 - (2) 19 10 - (22) 32Transfer between segments - (37) - - - - 37 -Amortization (255) (60) (a) (24) (80) (26) (27) (10) (a) (482) (a)Foreign exchange translation (130) - (12) (6) (7) - - (155)Other (b) (411) (206) (165) (18) 12 (5) 852 59
Net carrying amount atDec. 31, 2008 $2,595 $ 340 $ 302 $834 $699 $229 $857 $5,856
Acquisitions 111 - - 11 - - - 122Amortization (219) (45) (28) (81) (27) (25) (1) (426)Foreign exchange translation 44 - 1 2 2 (1) - 48Transferred to discontinued
operations - - - - - - (4) (4)Other (b) (1) - 6 (13) - - - (8)
Net carrying amount atDec. 31, 2009 $2,530 $ 295 $ 281 $753 $674 $203 $852 $5,588
(a) Includes discontinued operations.(b) Other changes in intangible assets primarily reflect reclassifications.
Intangible assets Dec. 31, 2009 Dec. 31, 2008
(in millions)
Grosscarryingamount
Accumulatedamortization
Netcarryingamount
Remainingweightedaverage
amortizationperiod
Grosscarryingamount
Accumulatedamortization
Netcarryingamount
Subject to amortization:Customer relationships-Asset
and Wealth Management $2,060 $ (724) $1,336 13 yrs. $1,923 $(463) $1,460Customer contracts-Institutional
services 2,039 (561) 1,478 14 yrs. 2,051 (413) 1,638Deposit premiums 49 (41) 8 2 yrs. 68 (43) 25Other 98 (30) 68 7 yrs. 89 (20) 69
Total subject to amortization $4,246 $(1,356) $2,890 13 yrs. $4,131 $(939) $3,192Not subject to amortization: (a)
Trade name $1,368 N/A $1,368 N/A $1,358 N/A $1,358Customer relationships 1,320 N/A 1,320 N/A 1,306 N/A 1,306Other 10 N/A 10 N/A - N/A -
Total not subject toamortization $2,698 N/A $2,698 N/A $2,664 N/A $2,664
Total intangible assets $6,944 $(1,356) $5,588 N/A $6,795 $(939) $5,856
(a) Intangible assets not subject to amortization have an indefinite life.
Estimated annual amortization expense for currentintangibles for the next five years is as follows:
For the year endedDec. 31,
Estimated amortizationexpense (in millions)
2010 $3892011 3632012 3392013 2932014 262
BNY Mellon 115
Notes to Consolidated Financial Statements (continued)
8. Other assets
Other assetsDec. 31,
(in millions) 2009 2008
Corporate/bank owned life insurance $ 3,900 $ 3,781Accounts receivable 3,528 3,715Equity in joint ventures and other
investments (a) 2,816 2,421Income taxes receivable 1,867 342Prepaid expenses 1,089 (b) 422Fails to deliver 911 1,394Prepaid pension assets 714 371Software 595 607Due from customers on acceptances 502 265Margin deposits 459 1,275Other 356 430
Total other assets $16,737 $15,023
(a) Includes Federal Reserve Bank stock of $397 million and$342 million, respectively, at cost.
(b) Includes $295 million related to the prepayment of thequarterly fees to the FDIC.
Seed capital and private equity investments valuedusing net asset value per share
In our Asset Management segment, we manageinvestment assets, including equities, fixed income,money market and alternative investment funds forinstitutions and other investors; as part of that activitywe make seed capital investments in certain funds.Seed capital is included in trading assets, securitiesavailable-for-sale and other assets depending on thenature of the investment. BNY Mellon also holdsprivate equity investments which consist ofinvestments in private equity funds, mezzaninefinancings and direct equity investments. Privateequity investments are included in other assets.Consistent with our policy to focus on our coreactivities, we continue to reduce our exposure toprivate equity investments.
The fair value of these investments has been estimatedusing the net asset value (“NAV”) per share of BNYMellon’s ownership interest in the funds. The tablebelow presents information about BNY Mellon’sinvestments in seed capital and private equityinvestments.
Seed capital and private equity investments valued using NAV – Dec. 31, 2009(dollar amounts in millions) Fair value Unfunded commitments Redemption frequency Redemption notice period
Hedge funds (a) $172 $ - Monthly-quarterly 3 - 45 daysPrivate equity funds (b) 187 53 N/A N/AOther funds (c) 263 - Monthly-yearly (c)
Total $622 $53
(a) Hedge funds include multi-strategy funds that utilize a variety of investment strategies and equity long-short hedge funds that includevarious funds that invest over both long-term investment and short-term investment horizons.
(b) Private equity funds primarily include numerous venture capital funds that invest in various sectors of the economy. Private equityfunds do not have redemption rights. Distributions from such funds will be received as the underlying investments in the funds areliquidated.
(c) Other funds primarily include: an absolute return unit trust investing in global currencies and interest rate strategies with a monthlyredemption frequency and no notice period; a global special situations fund investing in distressed debt with a quarterly redemptionfrequency and no notice period; an emerging markets fund that invests in emerging market bonds and other debt instruments with noredemption provisions; an event-driven offshore fund of funds that employs a variety of event-driven strategies and techniques with ayearly redemption frequency and 90 days notice; as well as various other market neutral, leveraged loans, real estate and structuredcredit funds.
9. Deposits
The aggregate amount of time deposits indenominations of $100,000 or greater wasapproximately $34.0 billion at Dec. 31, 2009 and$57.1 billion at Dec. 31, 2008. At Dec. 31, 2009, thescheduled maturities of all time deposits for the years2010 through 2014 and 2015 and thereafter are asfollows: $34.1 billion; $30 million; $15 million; $2million; $21 million; and $7 million, respectively.
10. Other fee revenue
In 2009, other fee revenue included $76 million ofasset related gains, and $31 million of expensereimbursement from joint ventures. Asset relatedgains in 2009 include the $39 million gain associatedwith the sale of VISA shares.
In 2008, other fee revenue included $45 million ofasset related gains and $29 million of expensereimbursement from joint ventures. Asset related
116 BNY Mellon
Notes to Consolidated Financial Statements (continued)
gains in 2008 included a $42 million gain associatedwith the initial public offering by VISA.
In 2007, other fee revenue included $58 million ofexpense reimbursements from joint ventures, $41million of net economic value payments related to theAcquired Corporate Trust Business, and a $28 millionsettlement received for early termination of a contractwith a clearing business.
11. Net interest revenue
Net interest revenue(in millions) 2009 2008 2007 (a)
Interest revenueNon-margin loans $ 874 $1,027 $1,826Margin loans 69 183 332Securities:
Taxable 1,718 2,210 1,865Exempt from federal income
taxes 30 35 18
Total securities 1,748 2,245 1,883Other short-term
investments—U.S.government-backedcommercial paper 9 71 -
Deposits in banks 683 1,753 1,242Deposits with the Federal
Reserve and other centralbanks 43 27 -
Federal funds sold andsecurities purchased underresale agreements 31 149 289
Trading assets 50 69 98
Total interest revenue 3,507 5,524 5,670
Interest expenseDeposits in domestic offices 54 328 566Deposits in foreign offices 117 1,437 1,812Borrowings from Federal
Reserve related to ABCP 7 53 -Federal funds purchased and
securities sold underrepurchase agreements - 46 110
Other borrowed funds 42 90 91Customer payables 6 69 177Long-term debt 366 642 669
Total interest expense 592 2,665 3,425
Net interest revenue $2,915 $2,859 $2,245
(a) Results for 2007 include six months of BNY Mellon and sixmonths of legacy The Bank of New York Company, Inc.
12. Selected noninterest expense categories
The following table provides a breakdown of certainexpense categories presented on the consolidatedincome statement.
Selected noninterest expense categories(in millions) 2009 2008 2007 (a)
Sub-custodian $203 $ 255 (b) $223 (b)Clearing 117 80 183
Total sub-custodian andclearing $320 $ 335 (b) $406 (b)
Communications $115 $ 127 $108Support agreement charges (15) 894 3Other 737 (c) 801 523
Total other $837 $1,822 $634
(a) Results for 2007 include six months of BNY Mellon and sixmonths of legacy The Bank of New York Company, Inc.
(b) In 2009, global sub-custodian out-of-pocket expense relatedto client reimbursements was reclassified from sub-custodianexpense to asset servicing revenue. This reclassificationtotaled $22 million in 2008 and $23 million in 2007.
(c) Includes $61 million of FDIC special assessment recorded in2009.
In 2008, we recorded support agreement charges of$894 million. In response to market events in 2008,we voluntarily provided support to clients invested inmoney market mutual funds, cash sweep funds andsimilar collective funds managed by our affiliatesimpacted by the Lehman bankruptcy.
In 2009, we recorded a credit to support agreementcharges of $15 million. This credit reflects a reductionin the support agreement reserve primarily due toimproved pricing of Lehman securities, primarilyoffset by the final support agreement charge for fourDreyfus money market funds entered into in 2008.The agreements supporting the Dreyfus money marketfunds expired and were completed in 2009. At Dec.31, 2009, the value of Lehman securities increased to19.5% from 9.75% at Dec. 31, 2008.
13. Restructuring charges
Global location strategy
As part of an ongoing effort to improve efficiency anddevelop a global operating model that provides thehighest quality of service to our clients, BNY Melloncontinues to execute its global location strategy. Thisstrategy includes migrating positions to our globalgrowth centers and is expected to result in movingand/or eliminating over 2,300 positions in 2010. In thefourth quarter of 2009, we recorded a pre-taxrestructuring charge of $139 million, or $0.08 percommon share on a full-year basis. This charge wascomprised of $102 million for severance costs and$37 million primarily for asset write-offs, and expenserelated to the closing of offices.
BNY Mellon 117
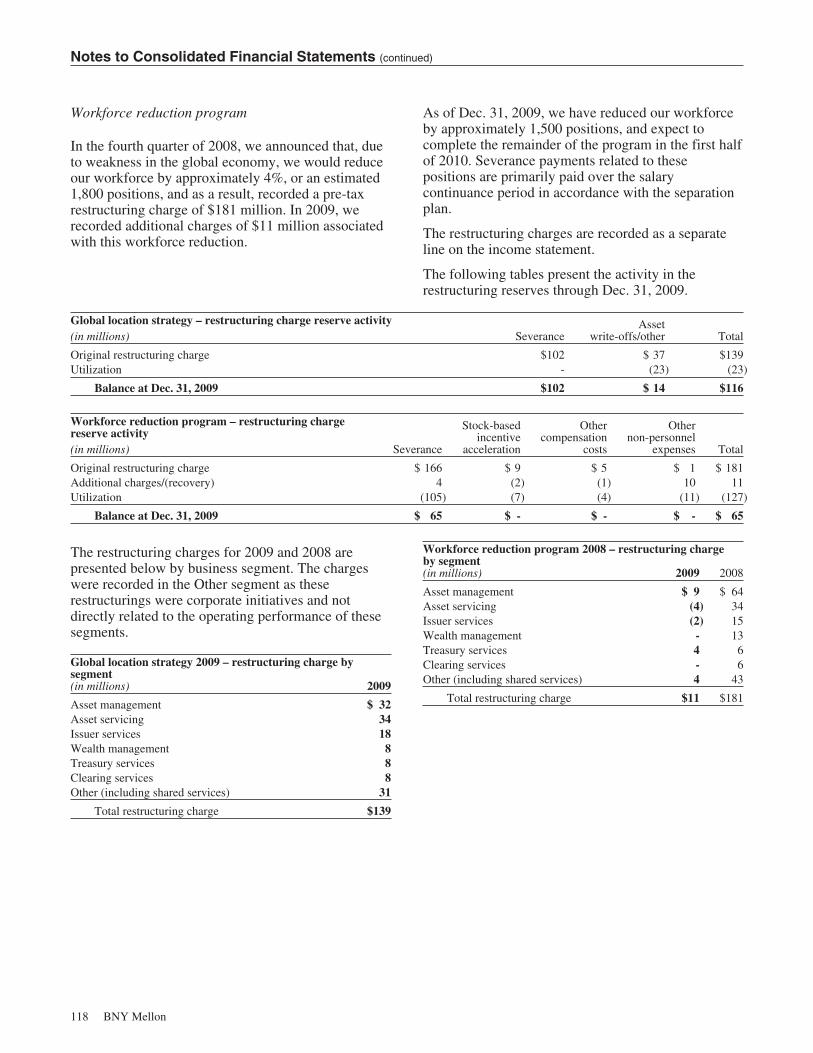
Notes to Consolidated Financial Statements (continued)
Workforce reduction program
In the fourth quarter of 2008, we announced that, dueto weakness in the global economy, we would reduceour workforce by approximately 4%, or an estimated1,800 positions, and as a result, recorded a pre-taxrestructuring charge of $181 million. In 2009, werecorded additional charges of $11 million associatedwith this workforce reduction.
As of Dec. 31, 2009, we have reduced our workforceby approximately 1,500 positions, and expect tocomplete the remainder of the program in the first halfof 2010. Severance payments related to thesepositions are primarily paid over the salarycontinuance period in accordance with the separationplan.
The restructuring charges are recorded as a separateline on the income statement.
The following tables present the activity in therestructuring reserves through Dec. 31, 2009.
Global location strategy – restructuring charge reserve activitySeverance
Assetwrite-offs/other Total(in millions)
Original restructuring charge $102 $ 37 $139Utilization - (23) (23)
Balance at Dec. 31, 2009 $102 $ 14 $116
Workforce reduction program – restructuring chargereserve activity
Severance
Stock-basedincentive
acceleration
Othercompensation
costs
Othernon-personnel
expenses Total(in millions)
Original restructuring charge $ 166 $ 9 $ 5 $ 1 $ 181Additional charges/(recovery) 4 (2) (1) 10 11Utilization (105) (7) (4) (11) (127)
Balance at Dec. 31, 2009 $ 65 $ - $ - $ - $ 65
The restructuring charges for 2009 and 2008 arepresented below by business segment. The chargeswere recorded in the Other segment as theserestructurings were corporate initiatives and notdirectly related to the operating performance of thesesegments.
Global location strategy 2009 – restructuring charge bysegment(in millions) 2009
Asset management $ 32Asset servicing 34Issuer services 18Wealth management 8Treasury services 8Clearing services 8Other (including shared services) 31
Total restructuring charge $139
Workforce reduction program 2008 – restructuring chargeby segment(in millions) 2009 2008
Asset management $ 9 $ 64Asset servicing (4) 34Issuer services (2) 15Wealth management - 13Treasury services 4 6Clearing services - 6Other (including shared services) 4 43
Total restructuring charge $11 $181
118 BNY Mellon

Notes to Consolidated Financial Statements (continued)
14. Income taxes
Provision (benefit) for incometaxes from continuingoperations
Year ended Dec. 31,
(in millions) 2009 2008 2007 (a)
Current taxes:Federal $ 289 $ 840 $ 788Foreign 185 488 237State and local 101 420 108
Total current tax expense 575 1,748 1,133
Deferred taxes:Federal (1,676) (860) (97)Foreign - (1) (9)State and local (294) (396) (40)
Total deferred tax expense(benefit) (1,970) (1,257) (146)
Provision (benefit) forincome taxes $(1,395) $ 491 $ 987
(a) Results for 2007 include six months of BNY Mellon and sixmonths of legacy The Bank of New York Company, Inc.
The components of income (loss) before taxes are asfollows:
Components of income (loss)before taxes
Year ended Dec. 31,
(in millions) 2009 2008 2007 (a)
Domestic $(3,022) $ 217 $2,144Foreign 814 1,729 1,071
Income (loss) before taxes $(2,208) $1,946 $3,215
(a) Results for 2007 include six months of BNY Mellon and sixmonths of legacy The Bank of New York Company, Inc.
The components of our net deferred tax liabilityincluded in accrued taxes and other expenses are asfollows:
Net deferred tax liability Dec. 31,
(in millions) 2009 2008
Depreciation and amortization $ 2,725 $ 2,666Lease financings 1,197 1,411Pension obligations 277 146Securities valuation (2,112) (2,360)Reserves not deducted for tax (736) (1,351)Credit losses on loans (368) (224)Net operating loss carryover (163) (189)Other assets (838) (468)Other liabilities 738 433
Net deferred tax liability $ 720 $ 64
We have federal net operating loss carryovers of $466million (for which we have recorded a $163 milliontax benefit) related to a separate filing of a group of
certain leasing subsidiaries which begin to expire in2023. We have not recorded a valuation allowancebecause we expect to realize our deferred tax assetsincluding these carryovers.
As of Dec. 31, 2009, we had approximately $1.9billion of earnings attributable to foreign subsidiariesthat have been permanently reinvested abroad and forwhich no provision has been recorded for income taxthat would occur if repatriated. It is not practicable atthis time to determine the income tax liability thatwould result upon repatriation of these earnings.
The following table presents a reconciliation of thestatutory federal income tax rate to our effectiveincome tax rate applicable to income from continuingoperations.
Effective tax rate Dec. 31,
2009 2008 2007
Federal rate 35.0% 35.0% 35.0%State and local income taxes, net of
federal income tax benefit 4.5 4.0 1.3Credit for low-income housing
investments 2.6 (2.7) (1.0)Tax-exempt income 2.9 (3.4) (1.6)Foreign operations 3.5 (13.0) (3.2)Tax settlements 4.0 6.8 -Tax loss on mortgages 10.8 - -Credit for synthetic fuel investments - 0.1 (0.7)Other – net (0.1) (1.6) 0.9
Effective rate 63.2% 25.2% 30.7%
FIN 48 Unrecognized taxpositions(in millions) 2009 2008 2007
Beginning balance at Jan. 1, – gross $189 $ 977 $842Unrecognized tax benefits acquired - (2) 44Prior period tax positions:
Increases 225 832 91Decreases (30) (155) (5)
Current period tax positions 10 75 5Settlements (58) (1,538) -Statute expiration (1) - -
Ending balance at Dec. 31, – gross $335 $ 189 $977
Our total tax reserves as of Dec. 31, 2009 were $335million compared with $189 million at Dec. 31, 2008.If these tax reserves were unnecessary, $335 millionwould affect the effective tax rate in future periods.We recognize accrued interest and penalties, ifapplicable, related to income taxes in income taxexpense. Included in the balance sheet at Dec. 31,2009 is accrued interest, where applicable, of $80million. The additional tax expense related to interestfor the year ended Dec. 31, 2009 was $89 million
BNY Mellon 119

Notes to Consolidated Financial Statements (continued)
compared with $248 million for the year endedDec. 31, 2008.
Our federal consolidated income tax returns are closedto examination through 2002. Our New York Stateand New York City return examinations have beencompleted through 2004. Our United Kingdomincome tax returns are closed through 2007.
15. Extraordinary (loss) – consolidation ofcommercial paper conduits
At the end of 2008 and 2007, we called the first lossnotes of Old Slip and TRFC, respectively, making usthe primary beneficiary and triggering theconsolidation of these commercial paper conduits.The consolidation of these conduits resulted in therecognition of extraordinary losses (non-cashaccounting charges) of $26 million after-tax, or $0.02per common share in 2008, associated with Old Slip,and $180 million after-tax, or $0.19 per commonshare in 2007, associated with TRFC.
16. Long-term debt
Long-term debt Dec. 31, 2009 Dec. 31, 2008
(in millions) Rate Maturity Amount Rate Amount
Senior debt:Fixed rate 3.10-6.92% 2011-2020 $ 7,949 3.25-6.38% $ 5,605Floating rate 0.05-0.69% 2010-2038 2,869 1.27-3.26% 2,704
Subordinated debt (a) 4.40-7.40% 2010-2033 4,795 3.27-7.40% 5,890Junior subordinated debentures (a) 5.95-7.78% 2026-2043 1,621 5.95-7.78% 1,666
Total $17,234 $15,865
(a) Fixed rate.
The aggregate amounts of notes and debentures thatmature during the five years 2010 through 2014 forBNY Mellon are as follows: $1.85 billion, $1.31billion, $3.45 billion, $1.51 billion and $2.29 billion.At Dec. 31, 2009, subordinated debt aggregating$1.61 billion was redeemable at our option as follows:$1.07 billion in 2010; $275 million in 2011; and $259million after 2011.
Junior subordinated debentures
Wholly owned subsidiaries of BNY Mellon (the“Trusts”) have issued cumulative Company-ObligatedMandatory Redeemable Trust Preferred Securities ofSubsidiary Trust Holding Solely Junior SubordinatedDebentures (“Trust Preferred Securities”). The sole
assets of each trust are our junior subordinateddeferrable interest debentures of BNY Mellon whosematurities and interest rates match the Trust PreferredSecurities. Our obligations under the agreements thatrelate to the Trust Preferred Securities, the Trusts andthe debentures constitute a full and unconditionalguarantee by us of the Trusts’ obligations under theTrust Preferred Securities. The assets for MellonCapital IV are currently (i) our remarketable 6.044%junior subordinated notes due 2043, and (ii) interestsin stock purchase contracts between Mellon CapitalIV and us. On the “stock purchase date”, as defined inthe prospectus supplement for the Trust PreferredSecurities of Mellon Capital IV, the sole assets of thetrust will be shares of a series of our non-cumulativeperpetual preferred stock.
120 BNY Mellon
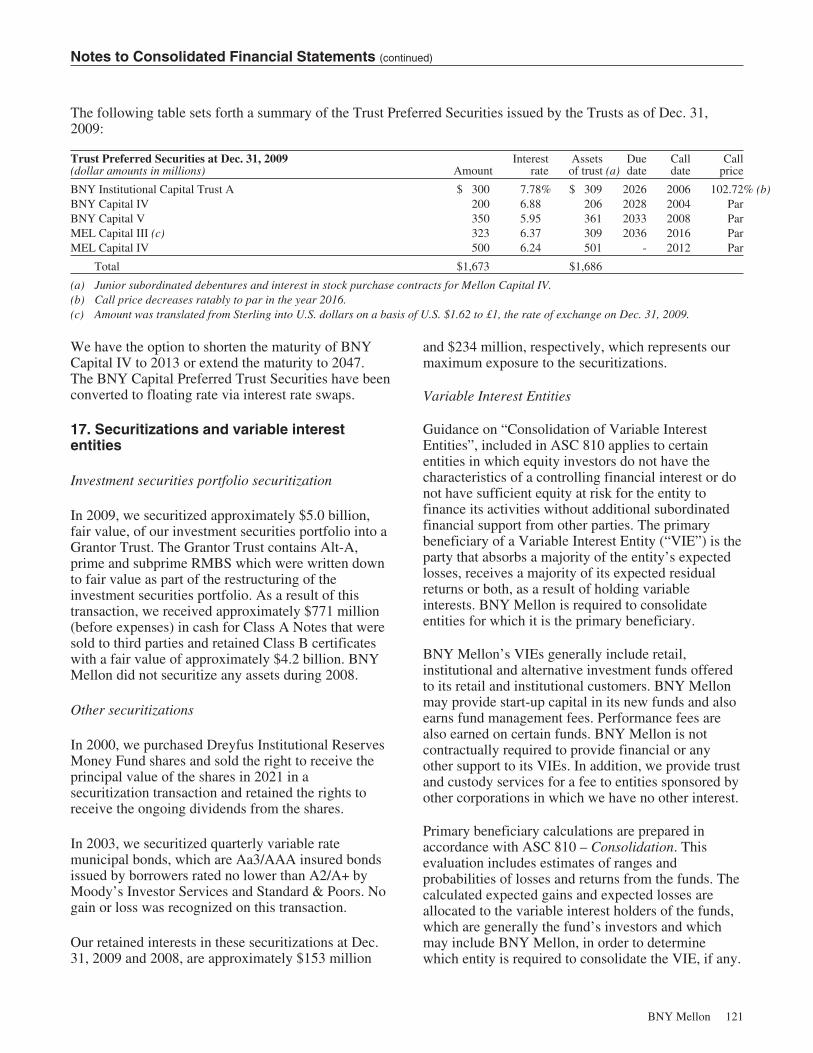
Notes to Consolidated Financial Statements (continued)
The following table sets forth a summary of the Trust Preferred Securities issued by the Trusts as of Dec. 31,2009:
Trust Preferred Securities at Dec. 31, 2009(dollar amounts in millions) Amount
Interestrate
Assetsof trust (a)
Duedate
Calldate
Callprice
BNY Institutional Capital Trust A $ 300 7.78% $ 309 2026 2006 102.72% (b)BNY Capital IV 200 6.88 206 2028 2004 ParBNY Capital V 350 5.95 361 2033 2008 ParMEL Capital III (c) 323 6.37 309 2036 2016 ParMEL Capital IV 500 6.24 501 - 2012 Par
Total $1,673 $1,686
(a) Junior subordinated debentures and interest in stock purchase contracts for Mellon Capital IV.(b) Call price decreases ratably to par in the year 2016.(c) Amount was translated from Sterling into U.S. dollars on a basis of U.S. $1.62 to £1, the rate of exchange on Dec. 31, 2009.
We have the option to shorten the maturity of BNYCapital IV to 2013 or extend the maturity to 2047.The BNY Capital Preferred Trust Securities have beenconverted to floating rate via interest rate swaps.
17. Securitizations and variable interestentities
Investment securities portfolio securitization
In 2009, we securitized approximately $5.0 billion,fair value, of our investment securities portfolio into aGrantor Trust. The Grantor Trust contains Alt-A,prime and subprime RMBS which were written downto fair value as part of the restructuring of theinvestment securities portfolio. As a result of thistransaction, we received approximately $771 million(before expenses) in cash for Class A Notes that weresold to third parties and retained Class B certificateswith a fair value of approximately $4.2 billion. BNYMellon did not securitize any assets during 2008.
Other securitizations
In 2000, we purchased Dreyfus Institutional ReservesMoney Fund shares and sold the right to receive theprincipal value of the shares in 2021 in asecuritization transaction and retained the rights toreceive the ongoing dividends from the shares.
In 2003, we securitized quarterly variable ratemunicipal bonds, which are Aa3/AAA insured bondsissued by borrowers rated no lower than A2/A+ byMoody’s Investor Services and Standard & Poors. Nogain or loss was recognized on this transaction.
Our retained interests in these securitizations at Dec.31, 2009 and 2008, are approximately $153 million
and $234 million, respectively, which represents ourmaximum exposure to the securitizations.
Variable Interest Entities
Guidance on “Consolidation of Variable InterestEntities”, included in ASC 810 applies to certainentities in which equity investors do not have thecharacteristics of a controlling financial interest or donot have sufficient equity at risk for the entity tofinance its activities without additional subordinatedfinancial support from other parties. The primarybeneficiary of a Variable Interest Entity (“VIE”) is theparty that absorbs a majority of the entity’s expectedlosses, receives a majority of its expected residualreturns or both, as a result of holding variableinterests. BNY Mellon is required to consolidateentities for which it is the primary beneficiary.
BNY Mellon’s VIEs generally include retail,institutional and alternative investment funds offeredto its retail and institutional customers. BNY Mellonmay provide start-up capital in its new funds and alsoearns fund management fees. Performance fees arealso earned on certain funds. BNY Mellon is notcontractually required to provide financial or anyother support to its VIEs. In addition, we provide trustand custody services for a fee to entities sponsored byother corporations in which we have no other interest.
Primary beneficiary calculations are prepared inaccordance with ASC 810 – Consolidation. Thisevaluation includes estimates of ranges andprobabilities of losses and returns from the funds. Thecalculated expected gains and expected losses areallocated to the variable interest holders of the funds,which are generally the fund’s investors and whichmay include BNY Mellon, in order to determinewhich entity is required to consolidate the VIE, if any.
BNY Mellon 121
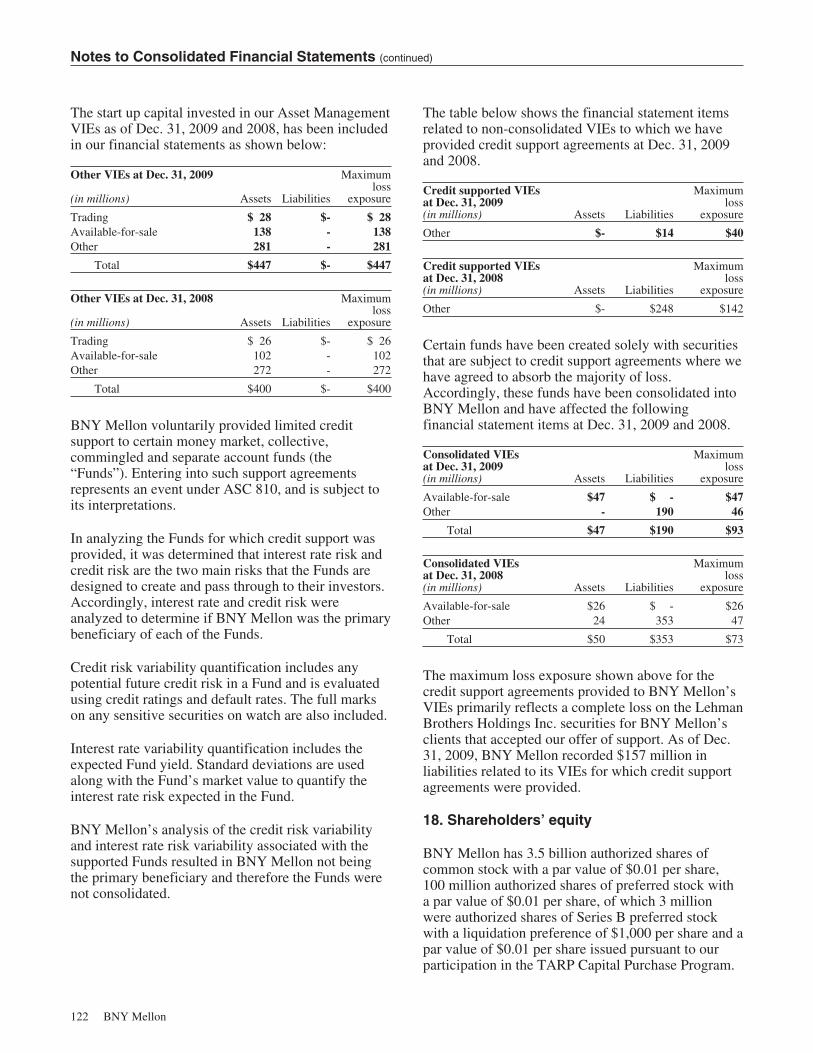
Notes to Consolidated Financial Statements (continued)
The start up capital invested in our Asset ManagementVIEs as of Dec. 31, 2009 and 2008, has been includedin our financial statements as shown below:
Other VIEs at Dec. 31, 2009
(in millions) Assets Liabilities
Maximumloss
exposure
Trading $ 28 $- $ 28Available-for-sale 138 - 138Other 281 - 281
Total $447 $- $447
Other VIEs at Dec. 31, 2008
(in millions) Assets Liabilities
Maximumloss
exposure
Trading $ 26 $- $ 26Available-for-sale 102 - 102Other 272 - 272
Total $400 $- $400
BNY Mellon voluntarily provided limited creditsupport to certain money market, collective,commingled and separate account funds (the“Funds”). Entering into such support agreementsrepresents an event under ASC 810, and is subject toits interpretations.
In analyzing the Funds for which credit support wasprovided, it was determined that interest rate risk andcredit risk are the two main risks that the Funds aredesigned to create and pass through to their investors.Accordingly, interest rate and credit risk wereanalyzed to determine if BNY Mellon was the primarybeneficiary of each of the Funds.
Credit risk variability quantification includes anypotential future credit risk in a Fund and is evaluatedusing credit ratings and default rates. The full markson any sensitive securities on watch are also included.
Interest rate variability quantification includes theexpected Fund yield. Standard deviations are usedalong with the Fund’s market value to quantify theinterest rate risk expected in the Fund.
BNY Mellon’s analysis of the credit risk variabilityand interest rate risk variability associated with thesupported Funds resulted in BNY Mellon not beingthe primary beneficiary and therefore the Funds werenot consolidated.
The table below shows the financial statement itemsrelated to non-consolidated VIEs to which we haveprovided credit support agreements at Dec. 31, 2009and 2008.
Credit supported VIEsat Dec. 31, 2009(in millions) Assets Liabilities
Maximumloss
exposure
Other $- $14 $40
Credit supported VIEsat Dec. 31, 2008(in millions) Assets Liabilities
Maximumloss
exposure
Other $- $248 $142
Certain funds have been created solely with securitiesthat are subject to credit support agreements where wehave agreed to absorb the majority of loss.Accordingly, these funds have been consolidated intoBNY Mellon and have affected the followingfinancial statement items at Dec. 31, 2009 and 2008.
Consolidated VIEsat Dec. 31, 2009(in millions) Assets Liabilities
Maximumloss
exposure
Available-for-sale $47 $ - $47Other - 190 46
Total $47 $190 $93
Consolidated VIEsat Dec. 31, 2008(in millions) Assets Liabilities
Maximumloss
exposure
Available-for-sale $26 $ - $26Other 24 353 47
Total $50 $353 $73
The maximum loss exposure shown above for thecredit support agreements provided to BNY Mellon’sVIEs primarily reflects a complete loss on the LehmanBrothers Holdings Inc. securities for BNY Mellon’sclients that accepted our offer of support. As of Dec.31, 2009, BNY Mellon recorded $157 million inliabilities related to its VIEs for which credit supportagreements were provided.
18. Shareholders’ equity
BNY Mellon has 3.5 billion authorized shares ofcommon stock with a par value of $0.01 per share,100 million authorized shares of preferred stock witha par value of $0.01 per share, of which 3 millionwere authorized shares of Series B preferred stockwith a liquidation preference of $1,000 per share and apar value of $0.01 per share issued pursuant to ourparticipation in the TARP Capital Purchase Program.
122 BNY Mellon
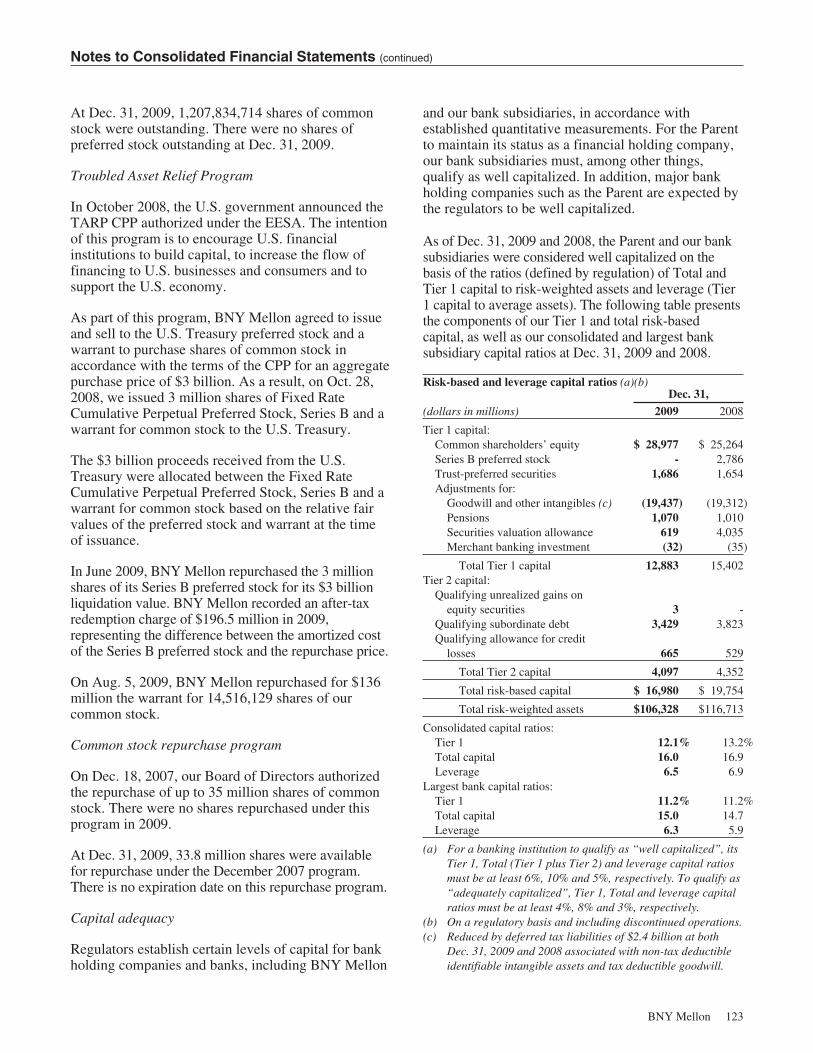
Notes to Consolidated Financial Statements (continued)
At Dec. 31, 2009, 1,207,834,714 shares of commonstock were outstanding. There were no shares ofpreferred stock outstanding at Dec. 31, 2009.
Troubled Asset Relief Program
In October 2008, the U.S. government announced theTARP CPP authorized under the EESA. The intentionof this program is to encourage U.S. financialinstitutions to build capital, to increase the flow offinancing to U.S. businesses and consumers and tosupport the U.S. economy.
As part of this program, BNY Mellon agreed to issueand sell to the U.S. Treasury preferred stock and awarrant to purchase shares of common stock inaccordance with the terms of the CPP for an aggregatepurchase price of $3 billion. As a result, on Oct. 28,2008, we issued 3 million shares of Fixed RateCumulative Perpetual Preferred Stock, Series B and awarrant for common stock to the U.S. Treasury.
The $3 billion proceeds received from the U.S.Treasury were allocated between the Fixed RateCumulative Perpetual Preferred Stock, Series B and awarrant for common stock based on the relative fairvalues of the preferred stock and warrant at the timeof issuance.
In June 2009, BNY Mellon repurchased the 3 millionshares of its Series B preferred stock for its $3 billionliquidation value. BNY Mellon recorded an after-taxredemption charge of $196.5 million in 2009,representing the difference between the amortized costof the Series B preferred stock and the repurchase price.
On Aug. 5, 2009, BNY Mellon repurchased for $136million the warrant for 14,516,129 shares of ourcommon stock.
Common stock repurchase program
On Dec. 18, 2007, our Board of Directors authorizedthe repurchase of up to 35 million shares of commonstock. There were no shares repurchased under thisprogram in 2009.
At Dec. 31, 2009, 33.8 million shares were availablefor repurchase under the December 2007 program.There is no expiration date on this repurchase program.
Capital adequacy
Regulators establish certain levels of capital for bankholding companies and banks, including BNY Mellon
and our bank subsidiaries, in accordance withestablished quantitative measurements. For the Parentto maintain its status as a financial holding company,our bank subsidiaries must, among other things,qualify as well capitalized. In addition, major bankholding companies such as the Parent are expected bythe regulators to be well capitalized.
As of Dec. 31, 2009 and 2008, the Parent and our banksubsidiaries were considered well capitalized on thebasis of the ratios (defined by regulation) of Total andTier 1 capital to risk-weighted assets and leverage (Tier1 capital to average assets). The following table presentsthe components of our Tier 1 and total risk-basedcapital, as well as our consolidated and largest banksubsidiary capital ratios at Dec. 31, 2009 and 2008.
Risk-based and leverage capital ratios (a)(b)Dec. 31,
(dollars in millions) 2009 2008
Tier 1 capital:Common shareholders’ equity $ 28,977 $ 25,264Series B preferred stock - 2,786Trust-preferred securities 1,686 1,654Adjustments for:
Goodwill and other intangibles (c) (19,437) (19,312)Pensions 1,070 1,010Securities valuation allowance 619 4,035Merchant banking investment (32) (35)
Total Tier 1 capital 12,883 15,402Tier 2 capital:
Qualifying unrealized gains onequity securities 3 -
Qualifying subordinate debt 3,429 3,823Qualifying allowance for credit
losses 665 529
Total Tier 2 capital 4,097 4,352
Total risk-based capital $ 16,980 $ 19,754
Total risk-weighted assets $106,328 $116,713
Consolidated capital ratios:Tier 1 12.1% 13.2%Total capital 16.0 16.9Leverage 6.5 6.9
Largest bank capital ratios:Tier 1 11.2% 11.2%Total capital 15.0 14.7Leverage 6.3 5.9
(a) For a banking institution to qualify as “well capitalized”, itsTier 1, Total (Tier 1 plus Tier 2) and leverage capital ratiosmust be at least 6%, 10% and 5%, respectively. To qualify as“adequately capitalized”, Tier 1, Total and leverage capitalratios must be at least 4%, 8% and 3%, respectively.
(b) On a regulatory basis and including discontinued operations.(c) Reduced by deferred tax liabilities of $2.4 billion at both
Dec. 31, 2009 and 2008 associated with non-tax deductibleidentifiable intangible assets and tax deductible goodwill.
BNY Mellon 123

Notes to Consolidated Financial Statements (continued)
At Dec. 31, 2009, we had approximately $1.7 billionof trust-preferred securities outstanding, net ofissuance costs, all of which qualified as Tier 1 capital.
If a bank holding company or bank fails to qualify as“adequately capitalized”, regulatory sanctions andlimitations are imposed. At Dec. 31, 2009, theamounts of capital by which BNY Mellon and our
largest bank subsidiary, The Bank of New YorkMellon, exceed the well capitalized guidelines are asfollows:Capital above guidelines at Dec. 31, 2009
(in millions) ConsolidatedThe Bank of
New York Mellon
Tier 1 capital $6,503 $4,708Total capital 6,347 4,538Leverage 3,041 2,069
19. Comprehensive results
Foreigncurrency
translation
ASC 820 Adjustments Unrealizedgain (loss)
on assetsavailable
for sale
Unrealizedgain (loss)
on cash flowhedges (a)
Totalaccumulated
unrealizedgain (loss)Pensions
Other post-retirement
benefits
2007 beginning balance, net of tax (expense) benefit $ (64) $ (194) $(76) $ 16 $ 26 $ (292)Change in 2007, net of tax (expense) benefit of $(36), $(41),
$(5), $218, $10 75 46 3 (339) (16) (231)Reclassification adjustment, net of tax (expense) benefit of $ -,
$ -, $- $13, $4 - - - (19) (7) (26)
2007 total unrealized gain (loss) 75 46 3 (358) (23) (257)
2007 ending balance, net of tax (expense) benefit $ 11 $ (148) $(73) $ (342) $ 3 $ (549)
Change in 2008, net of tax (expense) benefit of $(113), $566,$(6), $3,359, $(1) (374) (808) 7 (4,694) 45 (5,824)
Reclassification adjustment, net of tax (expense) benefit of$ -,$ -, $ -, $(645), $1 - - - 983 (11) 972
2008 total unrealized gain (loss) (374) (808) 7 (3,711) 34 (4,852)
2008 ending balance, net of tax (expense) benefit $(363) $ (956) $(66) $(4,053) $ 37 $(5,401)
Adjustments for the cumulative effect of applying ASC320, net of taxes of $-, $-, $-, $470, $- - - - (676) - (676)
Adjusted balance at Jan. 1, 2009 (363) (956) (66) (4,729) 37 (6,077)Change in 2009, net of tax (expense) benefit of $(82), $14,
$(34), $(489), $(1) 227 (46) (1) 762 (16) 926Reclassification adjustment, net of tax (expense) benefit $-,
$-, $-, $(2,022), $- - - - 3,348 (32) 3,316
2009 total unrealized gain (loss) 227 (46) (1) 4,110 (48) 4,242
2009 ending balance, net of tax (expense) benefit $(136) $(1,002) $(67) $ (619) $(11) $(1,835)
(a) Includes unrealized gain (loss) on foreign currency cash flow hedges of $(1) million, $7 million and $4 million at Dec. 31, 2009, Dec.31, 2008 and Dec. 31, 2007, respectively.
20. Stock–based compensation
Our Long-Term Incentive Plans provide for theissuance of stock options, restricted stock, restrictedstock units (RSUs) and other stock-based awards toemployees of BNY Mellon. At Dec. 31, 2009, underthe Long-Term Incentive Plan approved in April2008, we may issue 49,558,147 new options. Of thisamount, 23,365,162 shares may be issued as restrictedstock or RSUs. Stock option expense related toretirement eligibility vesting totaled $16 million in2009 and $32 million in 2008, respectively.
Stock options
Our Long-Term Incentive Plans provide for theissuance of stock options at fair market value at thedate of grant to officers and employees of BNYMellon. Generally, each option granted is exercisablebetween one and ten years from the date of grant.
The compensation cost that has been charged againstincome was $86 million, $108 million and $66 millionfor 2009, 2008 and 2007, respectively. The totalincome tax benefit recognized in the income statementwas $35 million, $44 million and $27 million for2009, 2008 and 2007, respectively.
124 BNY Mellon
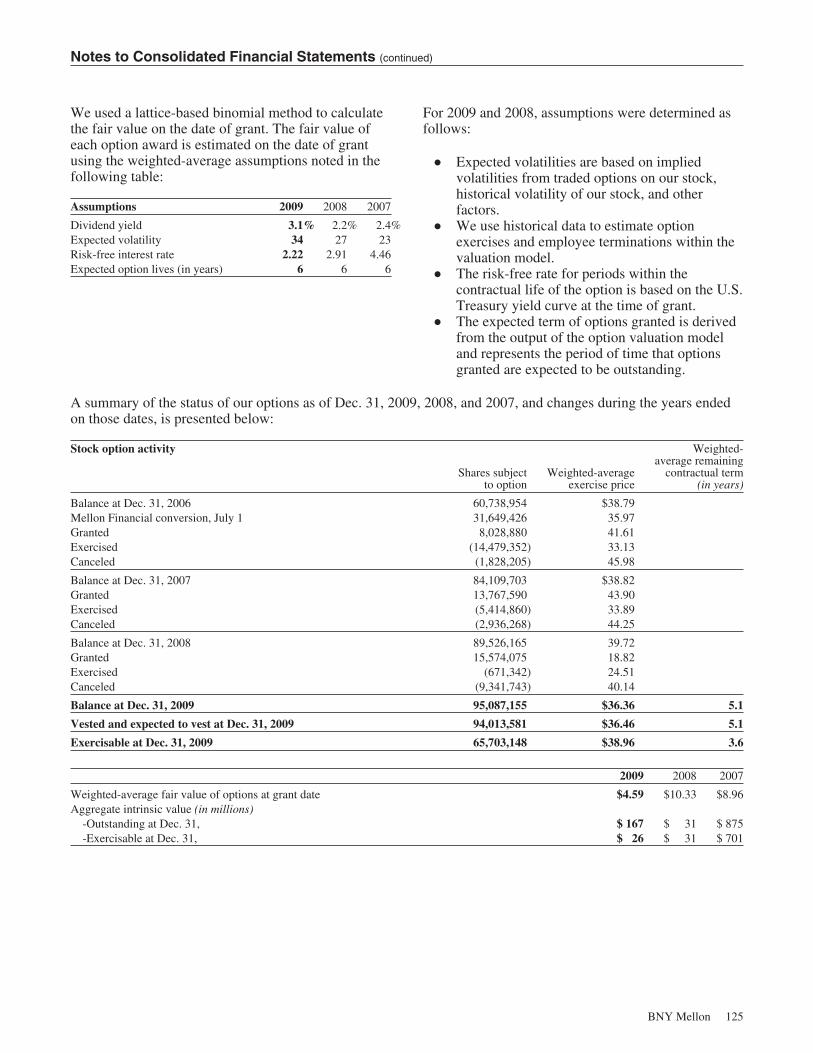
Notes to Consolidated Financial Statements (continued)
We used a lattice-based binomial method to calculatethe fair value on the date of grant. The fair value ofeach option award is estimated on the date of grantusing the weighted-average assumptions noted in thefollowing table:
Assumptions 2009 2008 2007
Dividend yield 3.1% 2.2% 2.4%Expected volatility 34 27 23Risk-free interest rate 2.22 2.91 4.46Expected option lives (in years) 6 6 6
For 2009 and 2008, assumptions were determined asfollows:
Š Expected volatilities are based on impliedvolatilities from traded options on our stock,historical volatility of our stock, and otherfactors.
Š We use historical data to estimate optionexercises and employee terminations within thevaluation model.
Š The risk-free rate for periods within thecontractual life of the option is based on the U.S.Treasury yield curve at the time of grant.
Š The expected term of options granted is derivedfrom the output of the option valuation modeland represents the period of time that optionsgranted are expected to be outstanding.
A summary of the status of our options as of Dec. 31, 2009, 2008, and 2007, and changes during the years endedon those dates, is presented below:
Stock option activity
Shares subjectto option
Weighted-averageexercise price
Weighted-average remaining
contractual term(in years)
Balance at Dec. 31, 2006 60,738,954 $38.79Mellon Financial conversion, July 1 31,649,426 35.97Granted 8,028,880 41.61Exercised (14,479,352) 33.13Canceled (1,828,205) 45.98
Balance at Dec. 31, 2007 84,109,703 $38.82Granted 13,767,590 43.90Exercised (5,414,860) 33.89Canceled (2,936,268) 44.25
Balance at Dec. 31, 2008 89,526,165 39.72Granted 15,574,075 18.82Exercised (671,342) 24.51Canceled (9,341,743) 40.14
Balance at Dec. 31, 2009 95,087,155 $36.36 5.1
Vested and expected to vest at Dec. 31, 2009 94,013,581 $36.46 5.1
Exercisable at Dec. 31, 2009 65,703,148 $38.96 3.6
2009 2008 2007
Weighted-average fair value of options at grant date $4.59 $10.33 $8.96Aggregate intrinsic value (in millions)
-Outstanding at Dec. 31, $ 167 $ 31 $ 875-Exercisable at Dec. 31, $ 26 $ 31 $ 701
BNY Mellon 125
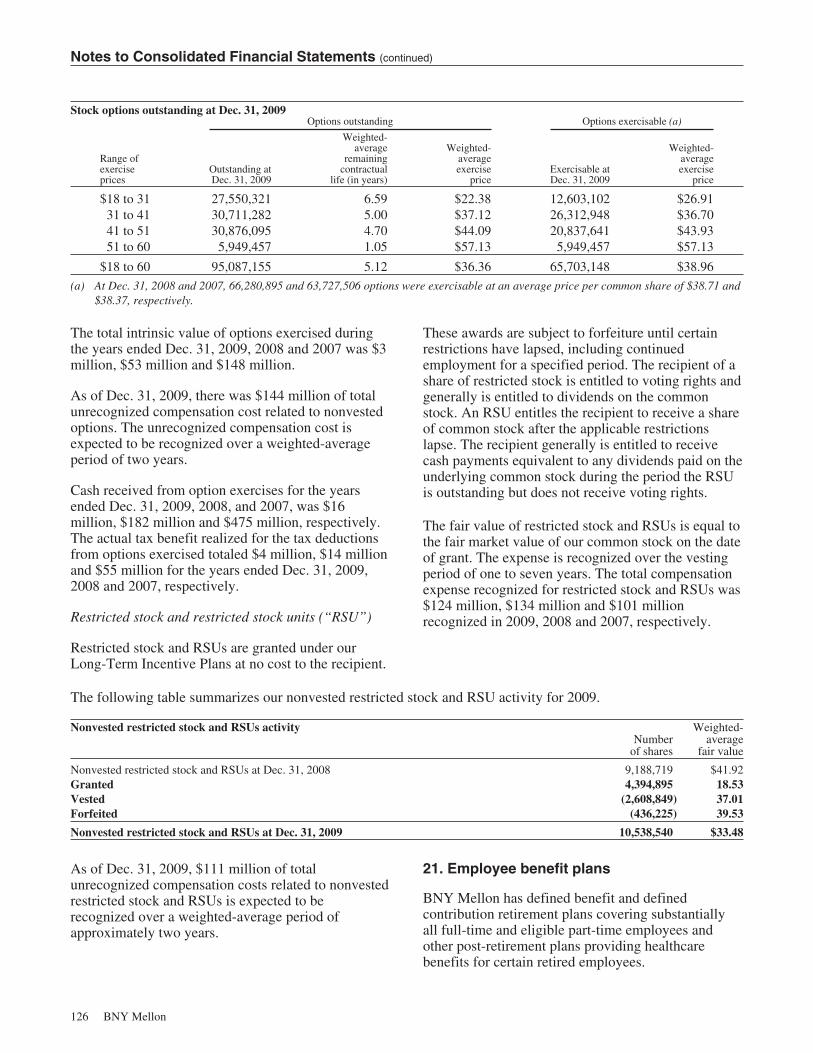
Notes to Consolidated Financial Statements (continued)
Stock options outstanding at Dec. 31, 2009Options outstanding Options exercisable (a)
Range ofexerciseprices
Outstanding atDec. 31, 2009
Weighted-average
remainingcontractual
life (in years)
Weighted-averageexercise
priceExercisable atDec. 31, 2009
Weighted-averageexercise
price
$18 to 31 27,550,321 6.59 $22.38 12,603,102 $26.9131 to 41 30,711,282 5.00 $37.12 26,312,948 $36.7041 to 51 30,876,095 4.70 $44.09 20,837,641 $43.9351 to 60 5,949,457 1.05 $57.13 5,949,457 $57.13
$18 to 60 95,087,155 5.12 $36.36 65,703,148 $38.96
(a) At Dec. 31, 2008 and 2007, 66,280,895 and 63,727,506 options were exercisable at an average price per common share of $38.71 and$38.37, respectively.
The total intrinsic value of options exercised duringthe years ended Dec. 31, 2009, 2008 and 2007 was $3million, $53 million and $148 million.
As of Dec. 31, 2009, there was $144 million of totalunrecognized compensation cost related to nonvestedoptions. The unrecognized compensation cost isexpected to be recognized over a weighted-averageperiod of two years.
Cash received from option exercises for the yearsended Dec. 31, 2009, 2008, and 2007, was $16million, $182 million and $475 million, respectively.The actual tax benefit realized for the tax deductionsfrom options exercised totaled $4 million, $14 millionand $55 million for the years ended Dec. 31, 2009,2008 and 2007, respectively.
Restricted stock and restricted stock units (“RSU”)
Restricted stock and RSUs are granted under ourLong-Term Incentive Plans at no cost to the recipient.
These awards are subject to forfeiture until certainrestrictions have lapsed, including continuedemployment for a specified period. The recipient of ashare of restricted stock is entitled to voting rights andgenerally is entitled to dividends on the commonstock. An RSU entitles the recipient to receive a shareof common stock after the applicable restrictionslapse. The recipient generally is entitled to receivecash payments equivalent to any dividends paid on theunderlying common stock during the period the RSUis outstanding but does not receive voting rights.
The fair value of restricted stock and RSUs is equal tothe fair market value of our common stock on the dateof grant. The expense is recognized over the vestingperiod of one to seven years. The total compensationexpense recognized for restricted stock and RSUs was$124 million, $134 million and $101 millionrecognized in 2009, 2008 and 2007, respectively.
The following table summarizes our nonvested restricted stock and RSU activity for 2009.
Nonvested restricted stock and RSUs activityNumber
of shares
Weighted-average
fair value
Nonvested restricted stock and RSUs at Dec. 31, 2008 9,188,719 $41.92Granted 4,394,895 18.53Vested (2,608,849) 37.01Forfeited (436,225) 39.53
Nonvested restricted stock and RSUs at Dec. 31, 2009 10,538,540 $33.48
As of Dec. 31, 2009, $111 million of totalunrecognized compensation costs related to nonvestedrestricted stock and RSUs is expected to berecognized over a weighted-average period ofapproximately two years.
21. Employee benefit plans
BNY Mellon has defined benefit and definedcontribution retirement plans covering substantiallyall full-time and eligible part-time employees andother post-retirement plans providing healthcarebenefits for certain retired employees.
126 BNY Mellon

Notes to Consolidated Financial Statements (continued)
Pension and post-retirement healthcare plans
The following tables report the combined data for our domestic and foreign defined benefit pension and postretirement healthcare plans.
Pension Benefits Healthcare Benefits
Domestic Foreign Domestic Foreign
(dollar amounts in millions) 2009 2008 2009 2008 2009 2008 2009 2008
Weighted-average assumptions used to determinebenefit obligations
Discount rate 6.21% 6.38% 5.74% 6.18% 6.21% 6.38% 5.85% 6.25%Rate of compensation increase 3.50 3.50 4.64 4.11 3.50 - - -
Change in benefit obligation (a)Benefit obligation at beginning of period $(2,559) $(2,349) $(365) $(497) $(269) $(250) $ (2) $ (8)Service cost (96) (84) (20) (27) (2) (3) - -Interest cost (160) (142) (24) (26) (16) (17) - -Employee contributions - - (1) (1) - - - -Amendments - 34 - - - (23) - -Actuarial gain (loss) (185) (161) (121) 56 21 9 - 4(Acquisitions) divestitures - 4 - - - - - -Benefits paid 165 139 10 9 24 15 - -Foreign exchange adjustment N/A N/A (34) 121 N/A N/A (1) 2
Benefit obligation at end of period (2,835) (2,559) (555) (365) (242) (269) (3) (2)
Change in fair value of plan assetsFair value at beginning of period 2,673 3,742 387 545 56 72 - -Actual return on plan assets 479 (952) 74 (71) 10 (16) - -Employer contributions 344 22 50 58 24 15 - -Employee contributions - - 1 1 - - - -Benefit payments (165) (139) (10) (9) (24) (15) - -Foreign exchange adjustment N/A N/A 38 (137) N/A N/A - -
Fair value at end of period 3,331 2,673 540 387 66 56 - -
Funded status at end of period $ 496 $ 114 $ (15) $ 22 $(176) $(213) $ (3) $ (2)
Amounts recognized in accumulated othercomprehensive (income) loss consist of:
Net loss (gain) $ 1,552 $ 1,573 $ 200 $ 129 $ 65 $ 95 $ (6) $ (6)Prior service cost (credit) (82) (96) - - (4) (4) - -Net initial obligation (asset) - - - - 12 15 - -
Total (before tax effects) $ 1,470 $ 1,477 $ 200 $ 129 $ 73 $ 106 $ (6) $ (6)
(a) The benefit obligation for pension benefits is the projected benefit obligation and for healthcare benefits, it is the accumulated benefit obligation.
Net periodic benefit cost (credit) Pension Benefits Healthcare Benefits
Domestic Foreign Domestic Foreign
(dollar amounts in millions) 2009 2008 2007 (a) 2009 2008 2007 (a) 2009 2008 2007 (a) 2009 2008 2007 (a)
Weighted-average assumptionsas of Jan. 1:
Market-related value of plan assets $3,651 $3,706 $1,352 $ 459 $ 542 $ 252 $ 77 $ 77 $ 72 N/A N/A N/ADiscount rate 6.38% 6.38% 6.00% 6.18% 5.75% 4.95% 6.38% 6.38% 6.00% 6.25% 5.80% 5.00%Expected rate of return on plan assets 8.00 8.00 8.00 6.40 7.28 6.40 8.00 8.00 8.00 N/A N/A N/ARate of compensation increase 3.50 3.50 3.75 4.11 4.43 4.46 N/A N/A N/A N/A N/A N/A
Components of net periodicbenefit cost (credit):
Service cost $ 96 $ 84 $ 61 $ 20 $ 27 $ 18 $ 2 $ 3 $ 1 $ - $ - $ -Interest cost 160 142 94 24 26 18 16 17 12 - - -Expected return on assets (295) (290) (190) (32) (37) (28) (6) (6) (5) - - -Amortization of:
Net initial obligation (asset) - - - - - - 4 4 4 - - -Prior service cost (credit) (14) (10) (10) - - - - - - - - -Net actuarial (gain) loss 26 11 27 3 3 4 5 5 8 (1) - -
Settlement (gain) loss 5 10 2 - - - - - - - - -Other (10) 14 - - - - - - - - - -
Net periodic benefit cost (credit) $ (32)(b)$ (39) $ (16) $ 15 $ 19 $ 12 $ 21 $ 23 $ 20 $ (1) $ - $ -
(a) Assumptions in effect as of July 1, 2007 for legacy Mellon Financial plans include a discount rate of 6.25% for domestic plans and discount rate of5.75% for foreign plans, an expected rate of return on plan assets of 8.25% and a rate of compensation increase of 3.25%.
(b) Includes discontinued operations.
BNY Mellon 127
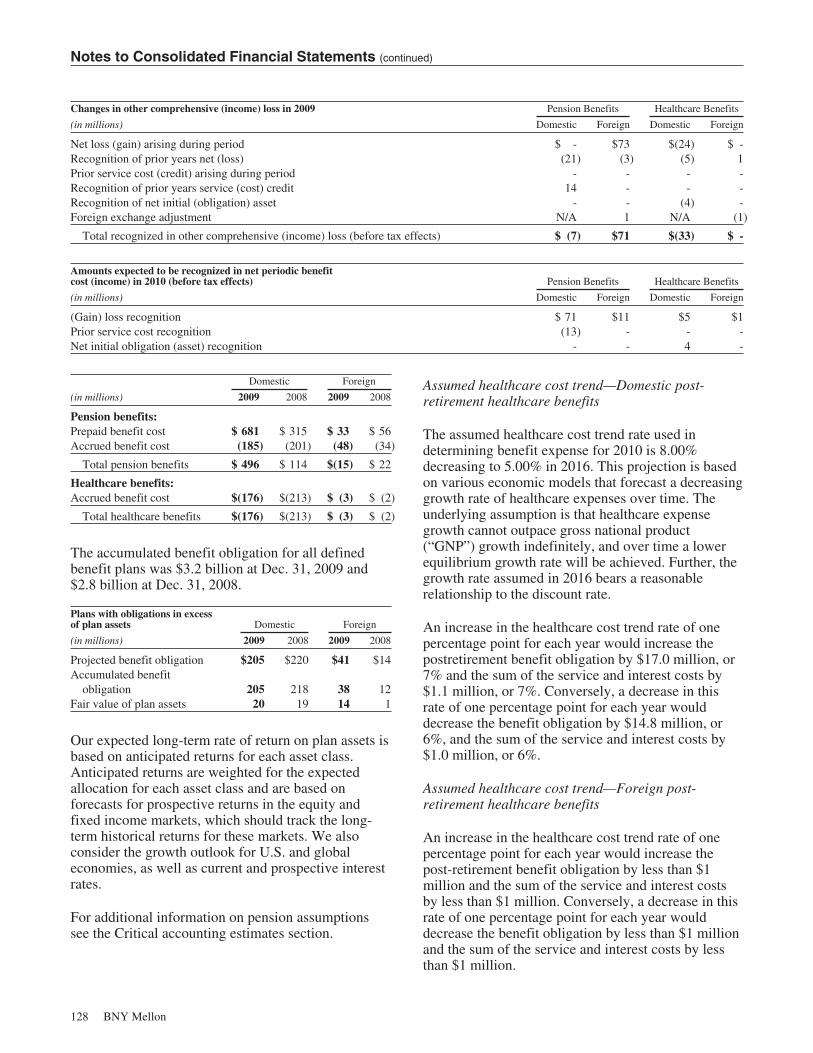
Notes to Consolidated Financial Statements (continued)
Changes in other comprehensive (income) loss in 2009 Pension Benefits Healthcare Benefits
(in millions) Domestic Foreign Domestic Foreign
Net loss (gain) arising during period $ - $73 $(24) $ -Recognition of prior years net (loss) (21) (3) (5) 1Prior service cost (credit) arising during period - - - -Recognition of prior years service (cost) credit 14 - - -Recognition of net initial (obligation) asset - - (4) -Foreign exchange adjustment N/A 1 N/A (1)
Total recognized in other comprehensive (income) loss (before tax effects) $ (7) $71 $(33) $ -
Amounts expected to be recognized in net periodic benefitcost (income) in 2010 (before tax effects) Pension Benefits Healthcare Benefits
(in millions) Domestic Foreign Domestic Foreign
(Gain) loss recognition $ 71 $11 $5 $1Prior service cost recognition (13) - - -Net initial obligation (asset) recognition - - 4 -
Domestic Foreign
(in millions) 2009 2008 2009 2008
Pension benefits:Prepaid benefit cost $ 681 $ 315 $ 33 $ 56Accrued benefit cost (185) (201) (48) (34)
Total pension benefits $ 496 $ 114 $(15) $ 22
Healthcare benefits:Accrued benefit cost $(176) $(213) $ (3) $ (2)
Total healthcare benefits $(176) $(213) $ (3) $ (2)
The accumulated benefit obligation for all definedbenefit plans was $3.2 billion at Dec. 31, 2009 and$2.8 billion at Dec. 31, 2008.
Plans with obligations in excessof plan assets Domestic Foreign
(in millions) 2009 2008 2009 2008
Projected benefit obligation $205 $220 $41 $14Accumulated benefit
obligation 205 218 38 12Fair value of plan assets 20 19 14 1
Our expected long-term rate of return on plan assets isbased on anticipated returns for each asset class.Anticipated returns are weighted for the expectedallocation for each asset class and are based onforecasts for prospective returns in the equity andfixed income markets, which should track the long-term historical returns for these markets. We alsoconsider the growth outlook for U.S. and globaleconomies, as well as current and prospective interestrates.
For additional information on pension assumptionssee the Critical accounting estimates section.
Assumed healthcare cost trend—Domestic post-retirement healthcare benefits
The assumed healthcare cost trend rate used indetermining benefit expense for 2010 is 8.00%decreasing to 5.00% in 2016. This projection is basedon various economic models that forecast a decreasinggrowth rate of healthcare expenses over time. Theunderlying assumption is that healthcare expensegrowth cannot outpace gross national product(“GNP”) growth indefinitely, and over time a lowerequilibrium growth rate will be achieved. Further, thegrowth rate assumed in 2016 bears a reasonablerelationship to the discount rate.
An increase in the healthcare cost trend rate of onepercentage point for each year would increase thepostretirement benefit obligation by $17.0 million, or7% and the sum of the service and interest costs by$1.1 million, or 7%. Conversely, a decrease in thisrate of one percentage point for each year woulddecrease the benefit obligation by $14.8 million, or6%, and the sum of the service and interest costs by$1.0 million, or 6%.
Assumed healthcare cost trend—Foreign post-retirement healthcare benefits
An increase in the healthcare cost trend rate of onepercentage point for each year would increase thepost-retirement benefit obligation by less than $1million and the sum of the service and interest costsby less than $1 million. Conversely, a decrease in thisrate of one percentage point for each year woulddecrease the benefit obligation by less than $1 millionand the sum of the service and interest costs by lessthan $1 million.
128 BNY Mellon
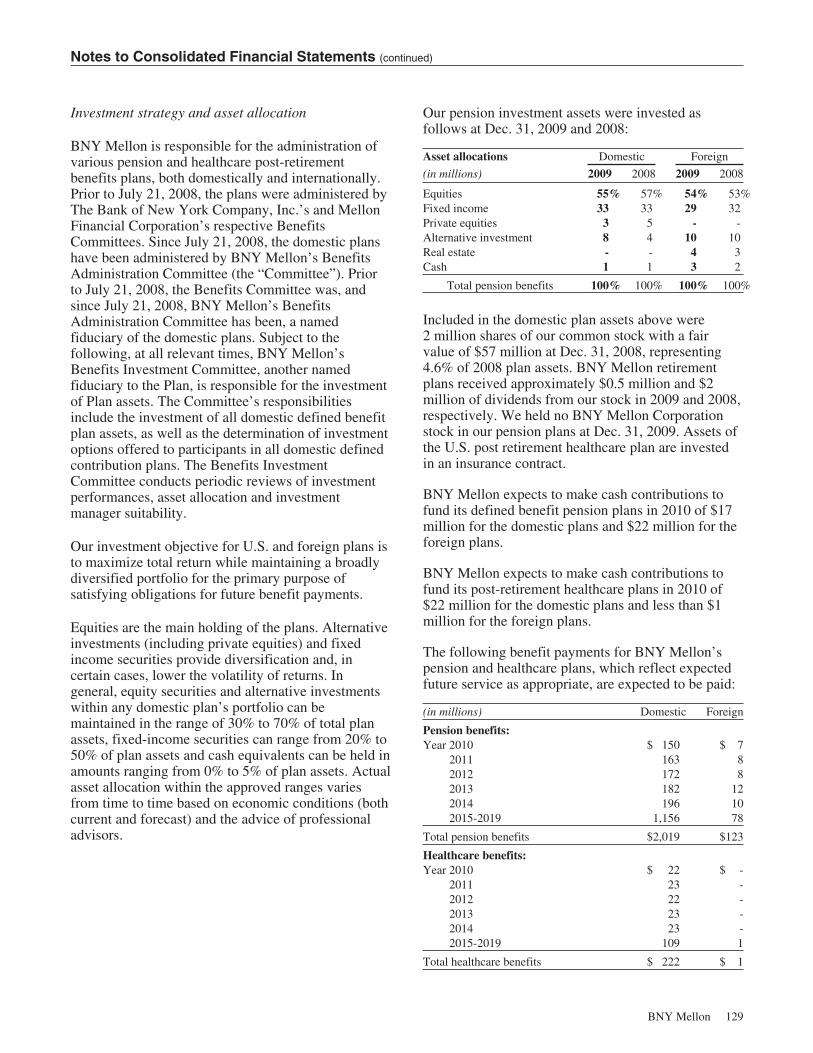
Notes to Consolidated Financial Statements (continued)
Investment strategy and asset allocation
BNY Mellon is responsible for the administration ofvarious pension and healthcare post-retirementbenefits plans, both domestically and internationally.Prior to July 21, 2008, the plans were administered byThe Bank of New York Company, Inc.’s and MellonFinancial Corporation’s respective BenefitsCommittees. Since July 21, 2008, the domestic planshave been administered by BNY Mellon’s BenefitsAdministration Committee (the “Committee”). Priorto July 21, 2008, the Benefits Committee was, andsince July 21, 2008, BNY Mellon’s BenefitsAdministration Committee has been, a namedfiduciary of the domestic plans. Subject to thefollowing, at all relevant times, BNY Mellon’sBenefits Investment Committee, another namedfiduciary to the Plan, is responsible for the investmentof Plan assets. The Committee’s responsibilitiesinclude the investment of all domestic defined benefitplan assets, as well as the determination of investmentoptions offered to participants in all domestic definedcontribution plans. The Benefits InvestmentCommittee conducts periodic reviews of investmentperformances, asset allocation and investmentmanager suitability.
Our investment objective for U.S. and foreign plans isto maximize total return while maintaining a broadlydiversified portfolio for the primary purpose ofsatisfying obligations for future benefit payments.
Equities are the main holding of the plans. Alternativeinvestments (including private equities) and fixedincome securities provide diversification and, incertain cases, lower the volatility of returns. Ingeneral, equity securities and alternative investmentswithin any domestic plan’s portfolio can bemaintained in the range of 30% to 70% of total planassets, fixed-income securities can range from 20% to50% of plan assets and cash equivalents can be held inamounts ranging from 0% to 5% of plan assets. Actualasset allocation within the approved ranges variesfrom time to time based on economic conditions (bothcurrent and forecast) and the advice of professionaladvisors.
Our pension investment assets were invested asfollows at Dec. 31, 2009 and 2008:
Asset allocations Domestic Foreign
(in millions) 2009 2008 2009 2008
Equities 55% 57% 54% 53%Fixed income 33 33 29 32Private equities 3 5 - -Alternative investment 8 4 10 10Real estate - - 4 3Cash 1 1 3 2
Total pension benefits 100% 100% 100% 100%
Included in the domestic plan assets above were2 million shares of our common stock with a fairvalue of $57 million at Dec. 31, 2008, representing4.6% of 2008 plan assets. BNY Mellon retirementplans received approximately $0.5 million and $2million of dividends from our stock in 2009 and 2008,respectively. We held no BNY Mellon Corporationstock in our pension plans at Dec. 31, 2009. Assets ofthe U.S. post retirement healthcare plan are investedin an insurance contract.
BNY Mellon expects to make cash contributions tofund its defined benefit pension plans in 2010 of $17million for the domestic plans and $22 million for theforeign plans.
BNY Mellon expects to make cash contributions tofund its post-retirement healthcare plans in 2010 of$22 million for the domestic plans and less than $1million for the foreign plans.
The following benefit payments for BNY Mellon’spension and healthcare plans, which reflect expectedfuture service as appropriate, are expected to be paid:
(in millions) Domestic Foreign
Pension benefits:Year 2010 $ 150 $ 7
2011 163 82012 172 82013 182 122014 196 102015-2019 1,156 78
Total pension benefits $2,019 $123
Healthcare benefits:Year 2010 $ 22 $ -
2011 23 -2012 22 -2013 23 -2014 23 -2015-2019 109 1
Total healthcare benefits $ 222 $ 1
BNY Mellon 129
Notes to Consolidated Financial Statements (continued)
Fair value measurement of plan investment assets
In accordance with ASC 715, BNY Mellon hasestablished a three-level hierarchy for fair valuemeasurements of its pension plan investment assetsbased upon the transparency of inputs to the valuationof an asset as of the measurement date. The valuationhierarchy is consistent with guidance in ASC 820which is detailed in Note 24 of the Notes to theFinancial Statements.
The following is a description of the valuationmethodologies used for instruments measured at fairvalue, as well as the general classification of suchinstruments pursuant to the valuation hierarchy.
Cash and currency
This category consists primarily of foreign currencybalances. Foreign currency is translated monthlybased on current exchange rates.
Master Trust
There is no readily available market quotation for thistrust. The trust’s fair value is based on the securities inthe trust which typically is the amount which the trustmight reasonably expect to receive for the securityupon a sale. This trust is valued on a daily basis. Thepension plan’s ownership in the trust is represented byunits of participation.
Common and preferred stock and exchange tradedfunds
These types of securities are valued at the closingprice reported in the active market in which theindividual securities are traded, if available. Wherethere is no readily available market quotations, wedetermine fair value primarily based on pricingsources with reasonable levels of price transparency.
Venture capital investments and non-registeredinvestment companies
There are no readily available market quotations forthese funds. The investment’s fair values are based onthe Plan’s ownership percentage of the fair value of
the underlying funds as provided by the fundmanagers. These funds are typically valued on aquarterly basis. The Plan’s venture capital investmentsand non-registered investments are valued at NAV asa practical expedient for fair value.
Collective trust funds
There are no readily available market quotations forthese funds. The fund’s fair value is based onsecurities in the portfolio which typically is theamount which the fund might reasonably expect toreceive for the security upon a sale. These funds areeither valued on a daily or monthly basis.
Corporate and government obligations
Certain corporate and government obligations arevalued at the closing price reported in the activemarket in which the bond is traded. Other corporateand government obligations are valued based onyields currently available on comparable securities ofissuers with similar credit ratings. When quoted pricesare not available for identical or similar bonds, thebond is valued using discounted cash flows thatmaximizes observable inputs, such as current yields ofsimilar instruments, but includes adjustments forcertain risks that may not be observable, such as creditand liquidity risks.
U.S. Treasury securities
Valued at the closing price reported in the activemarket in which the individual security is traded.
Hedge fund of funds
There are no readily available market quotations forthese funds. The fund’s fair value is based on NAVsof the funds in the portfolio which reflects the value ofthe underlying securities. The fair value of theunderlying securities is typically the amount whichthe fund might reasonably expect to receive for thesecurity upon a sale for those hard to value or illiquidsecurities within the hedge fund portfolio. Forsecurities that are readily valued, fair value is theclosing price at the end of the period. These funds arevalued on a monthly basis.
130 BNY Mellon
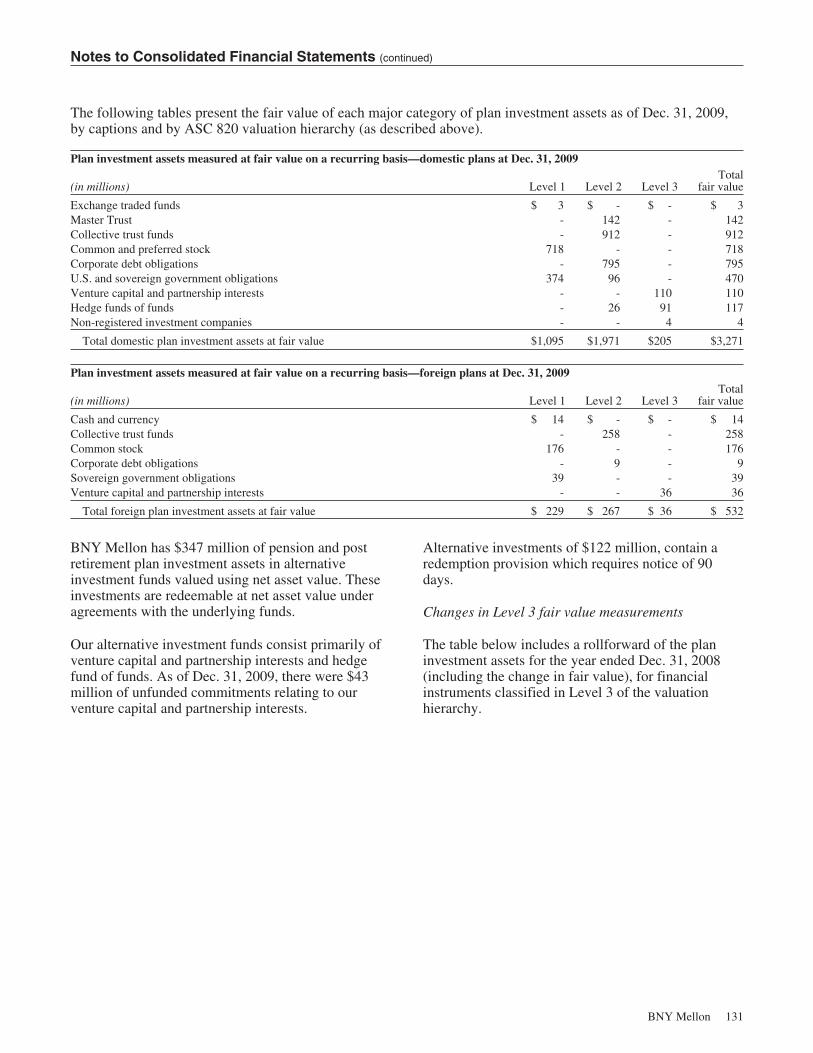
Notes to Consolidated Financial Statements (continued)
The following tables present the fair value of each major category of plan investment assets as of Dec. 31, 2009,by captions and by ASC 820 valuation hierarchy (as described above).
Plan investment assets measured at fair value on a recurring basis—domestic plans at Dec. 31, 2009
(in millions) Level 1 Level 2 Level 3Total
fair value
Exchange traded funds $ 3 $ - $ - $ 3Master Trust - 142 - 142Collective trust funds - 912 - 912Common and preferred stock 718 - - 718Corporate debt obligations - 795 - 795U.S. and sovereign government obligations 374 96 - 470Venture capital and partnership interests - - 110 110Hedge funds of funds - 26 91 117Non-registered investment companies - - 4 4
Total domestic plan investment assets at fair value $1,095 $1,971 $205 $3,271
Plan investment assets measured at fair value on a recurring basis—foreign plans at Dec. 31, 2009
(in millions) Level 1 Level 2 Level 3Total
fair value
Cash and currency $ 14 $ - $ - $ 14Collective trust funds - 258 - 258Common stock 176 - - 176Corporate debt obligations - 9 - 9Sovereign government obligations 39 - - 39Venture capital and partnership interests - - 36 36
Total foreign plan investment assets at fair value $ 229 $ 267 $ 36 $ 532
BNY Mellon has $347 million of pension and postretirement plan investment assets in alternativeinvestment funds valued using net asset value. Theseinvestments are redeemable at net asset value underagreements with the underlying funds.
Our alternative investment funds consist primarily ofventure capital and partnership interests and hedgefund of funds. As of Dec. 31, 2009, there were $43million of unfunded commitments relating to ourventure capital and partnership interests.
Alternative investments of $122 million, contain aredemption provision which requires notice of 90days.
Changes in Level 3 fair value measurements
The table below includes a rollforward of the planinvestment assets for the year ended Dec. 31, 2008(including the change in fair value), for financialinstruments classified in Level 3 of the valuationhierarchy.
BNY Mellon 131
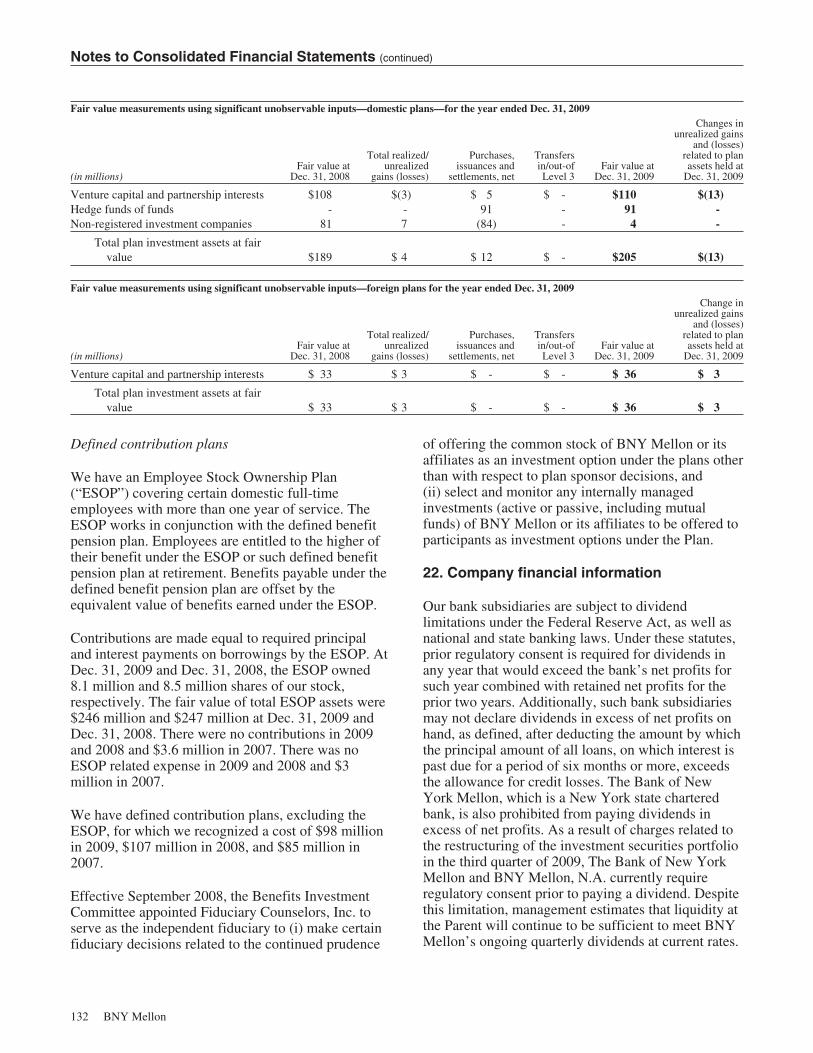
Notes to Consolidated Financial Statements (continued)
Fair value measurements using significant unobservable inputs—domestic plans—for the year ended Dec. 31, 2009
(in millions)Fair value at
Dec. 31, 2008
Total realized/unrealized
gains (losses)
Purchases,issuances and
settlements, net
Transfersin/out-ofLevel 3
Fair value atDec. 31, 2009
Changes inunrealized gains
and (losses)related to planassets held at
Dec. 31, 2009
Venture capital and partnership interests $108 $(3) $ 5 $ - $110 $(13)Hedge funds of funds - - 91 - 91 -Non-registered investment companies 81 7 (84) - 4 -
Total plan investment assets at fairvalue $189 $ 4 $ 12 $ - $205 $(13)
Fair value measurements using significant unobservable inputs—foreign plans for the year ended Dec. 31, 2009
(in millions)Fair value at
Dec. 31, 2008
Total realized/unrealized
gains (losses)
Purchases,issuances and
settlements, net
Transfersin/out-ofLevel 3
Fair value atDec. 31, 2009
Change inunrealized gains
and (losses)related to planassets held at
Dec. 31, 2009
Venture capital and partnership interests $ 33 $ 3 $ - $ - $ 36 $ 3
Total plan investment assets at fairvalue $ 33 $ 3 $ - $ - $ 36 $ 3
Defined contribution plans
We have an Employee Stock Ownership Plan(“ESOP”) covering certain domestic full-timeemployees with more than one year of service. TheESOP works in conjunction with the defined benefitpension plan. Employees are entitled to the higher oftheir benefit under the ESOP or such defined benefitpension plan at retirement. Benefits payable under thedefined benefit pension plan are offset by theequivalent value of benefits earned under the ESOP.
Contributions are made equal to required principaland interest payments on borrowings by the ESOP. AtDec. 31, 2009 and Dec. 31, 2008, the ESOP owned8.1 million and 8.5 million shares of our stock,respectively. The fair value of total ESOP assets were$246 million and $247 million at Dec. 31, 2009 andDec. 31, 2008. There were no contributions in 2009and 2008 and $3.6 million in 2007. There was noESOP related expense in 2009 and 2008 and $3million in 2007.
We have defined contribution plans, excluding theESOP, for which we recognized a cost of $98 millionin 2009, $107 million in 2008, and $85 million in2007.
Effective September 2008, the Benefits InvestmentCommittee appointed Fiduciary Counselors, Inc. toserve as the independent fiduciary to (i) make certainfiduciary decisions related to the continued prudence
of offering the common stock of BNY Mellon or itsaffiliates as an investment option under the plans otherthan with respect to plan sponsor decisions, and(ii) select and monitor any internally managedinvestments (active or passive, including mutualfunds) of BNY Mellon or its affiliates to be offered toparticipants as investment options under the Plan.
22. Company financial information
Our bank subsidiaries are subject to dividendlimitations under the Federal Reserve Act, as well asnational and state banking laws. Under these statutes,prior regulatory consent is required for dividends inany year that would exceed the bank’s net profits forsuch year combined with retained net profits for theprior two years. Additionally, such bank subsidiariesmay not declare dividends in excess of net profits onhand, as defined, after deducting the amount by whichthe principal amount of all loans, on which interest ispast due for a period of six months or more, exceedsthe allowance for credit losses. The Bank of NewYork Mellon, which is a New York state charteredbank, is also prohibited from paying dividends inexcess of net profits. As a result of charges related tothe restructuring of the investment securities portfolioin the third quarter of 2009, The Bank of New YorkMellon and BNY Mellon, N.A. currently requireregulatory consent prior to paying a dividend. Despitethis limitation, management estimates that liquidity atthe Parent will continue to be sufficient to meet BNYMellon’s ongoing quarterly dividends at current rates.
132 BNY Mellon
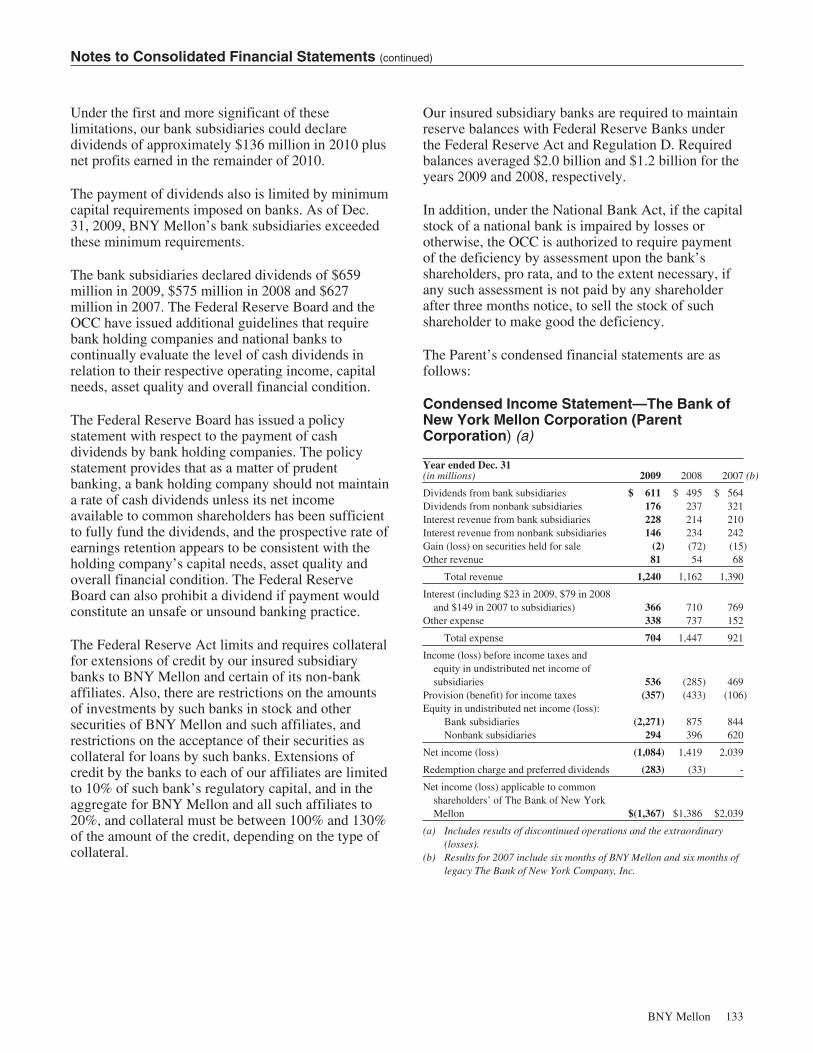
Notes to Consolidated Financial Statements (continued)
Under the first and more significant of theselimitations, our bank subsidiaries could declaredividends of approximately $136 million in 2010 plusnet profits earned in the remainder of 2010.
The payment of dividends also is limited by minimumcapital requirements imposed on banks. As of Dec.31, 2009, BNY Mellon’s bank subsidiaries exceededthese minimum requirements.
The bank subsidiaries declared dividends of $659million in 2009, $575 million in 2008 and $627million in 2007. The Federal Reserve Board and theOCC have issued additional guidelines that requirebank holding companies and national banks tocontinually evaluate the level of cash dividends inrelation to their respective operating income, capitalneeds, asset quality and overall financial condition.
The Federal Reserve Board has issued a policystatement with respect to the payment of cashdividends by bank holding companies. The policystatement provides that as a matter of prudentbanking, a bank holding company should not maintaina rate of cash dividends unless its net incomeavailable to common shareholders has been sufficientto fully fund the dividends, and the prospective rate ofearnings retention appears to be consistent with theholding company’s capital needs, asset quality andoverall financial condition. The Federal ReserveBoard can also prohibit a dividend if payment wouldconstitute an unsafe or unsound banking practice.
The Federal Reserve Act limits and requires collateralfor extensions of credit by our insured subsidiarybanks to BNY Mellon and certain of its non-bankaffiliates. Also, there are restrictions on the amountsof investments by such banks in stock and othersecurities of BNY Mellon and such affiliates, andrestrictions on the acceptance of their securities ascollateral for loans by such banks. Extensions ofcredit by the banks to each of our affiliates are limitedto 10% of such bank’s regulatory capital, and in theaggregate for BNY Mellon and all such affiliates to20%, and collateral must be between 100% and 130%of the amount of the credit, depending on the type ofcollateral.
Our insured subsidiary banks are required to maintainreserve balances with Federal Reserve Banks underthe Federal Reserve Act and Regulation D. Requiredbalances averaged $2.0 billion and $1.2 billion for theyears 2009 and 2008, respectively.
In addition, under the National Bank Act, if the capitalstock of a national bank is impaired by losses orotherwise, the OCC is authorized to require paymentof the deficiency by assessment upon the bank’sshareholders, pro rata, and to the extent necessary, ifany such assessment is not paid by any shareholderafter three months notice, to sell the stock of suchshareholder to make good the deficiency.
The Parent’s condensed financial statements are asfollows:
Condensed Income Statement—The Bank ofNew York Mellon Corporation (ParentCorporation) (a)
Year ended Dec. 31(in millions) 2009 2008 2007 (b)
Dividends from bank subsidiaries $ 611 $ 495 $ 564Dividends from nonbank subsidiaries 176 237 321Interest revenue from bank subsidiaries 228 214 210Interest revenue from nonbank subsidiaries 146 234 242Gain (loss) on securities held for sale (2) (72) (15)Other revenue 81 54 68
Total revenue 1,240 1,162 1,390
Interest (including $23 in 2009, $79 in 2008and $149 in 2007 to subsidiaries) 366 710 769
Other expense 338 737 152
Total expense 704 1,447 921
Income (loss) before income taxes andequity in undistributed net income ofsubsidiaries 536 (285) 469
Provision (benefit) for income taxes (357) (433) (106)Equity in undistributed net income (loss):
Bank subsidiaries (2,271) 875 844Nonbank subsidiaries 294 396 620
Net income (loss) (1,084) 1,419 2,039
Redemption charge and preferred dividends (283) (33) -
Net income (loss) applicable to commonshareholders’ of The Bank of New YorkMellon $(1,367) $1,386 $2,039
(a) Includes results of discontinued operations and the extraordinary(losses).
(b) Results for 2007 include six months of BNY Mellon and six months oflegacy The Bank of New York Company, Inc.
BNY Mellon 133
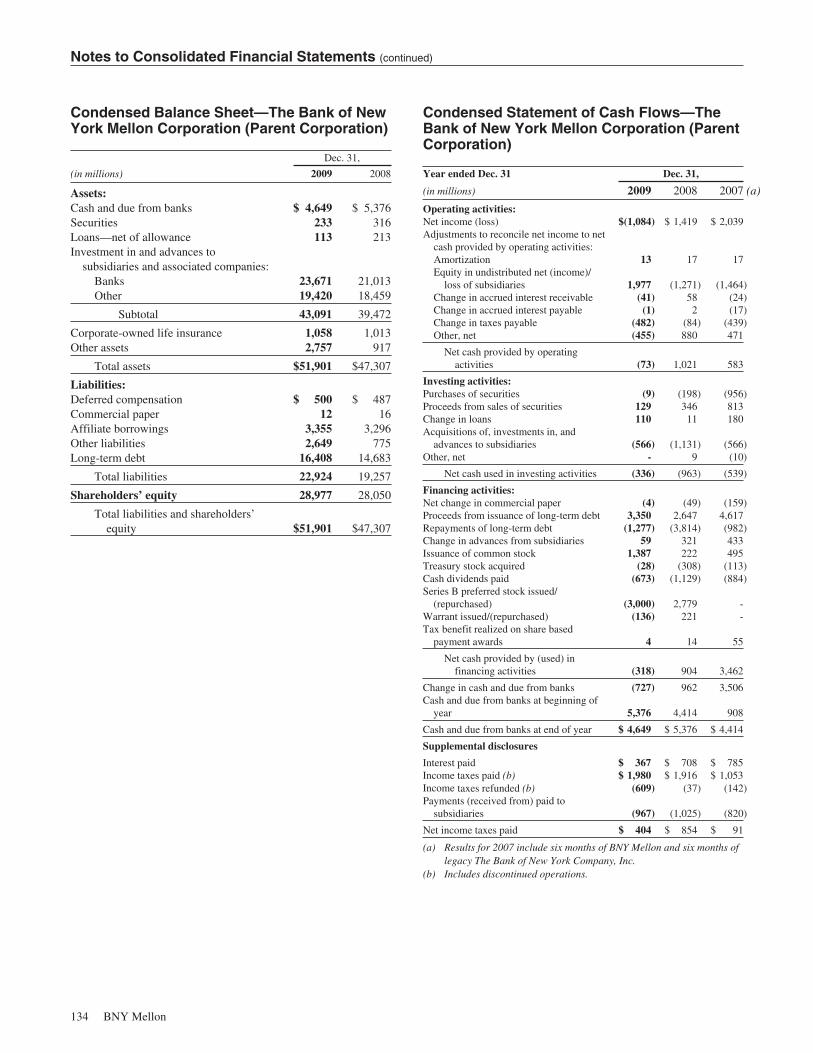
Notes to Consolidated Financial Statements (continued)
Condensed Balance Sheet—The Bank of NewYork Mellon Corporation (Parent Corporation)
Dec. 31,
(in millions) 2009 2008
Assets:Cash and due from banks $ 4,649 $ 5,376Securities 233 316Loans—net of allowance 113 213Investment in and advances to
subsidiaries and associated companies:Banks 23,671 21,013Other 19,420 18,459
Subtotal 43,091 39,472
Corporate-owned life insurance 1,058 1,013Other assets 2,757 917
Total assets $51,901 $47,307
Liabilities:Deferred compensation $ 500 $ 487Commercial paper 12 16Affiliate borrowings 3,355 3,296Other liabilities 2,649 775Long-term debt 16,408 14,683
Total liabilities 22,924 19,257
Shareholders’ equity 28,977 28,050
Total liabilities and shareholders’equity $51,901 $47,307
Condensed Statement of Cash Flows—TheBank of New York Mellon Corporation (ParentCorporation)
Year ended Dec. 31 Dec. 31,
(in millions) 2009 2008 2007 (a)
Operating activities:Net income (loss) $(1,084) $ 1,419 $ 2,039Adjustments to reconcile net income to net
cash provided by operating activities:Amortization 13 17 17Equity in undistributed net (income)/
loss of subsidiaries 1,977 (1,271) (1,464)Change in accrued interest receivable (41) 58 (24)Change in accrued interest payable (1) 2 (17)Change in taxes payable (482) (84) (439)Other, net (455) 880 471
Net cash provided by operatingactivities (73) 1,021 583
Investing activities:Purchases of securities (9) (198) (956)Proceeds from sales of securities 129 346 813Change in loans 110 11 180Acquisitions of, investments in, and
advances to subsidiaries (566) (1,131) (566)Other, net - 9 (10)
Net cash used in investing activities (336) (963) (539)
Financing activities:Net change in commercial paper (4) (49) (159)Proceeds from issuance of long-term debt 3,350 2,647 4,617Repayments of long-term debt (1,277) (3,814) (982)Change in advances from subsidiaries 59 321 433Issuance of common stock 1,387 222 495Treasury stock acquired (28) (308) (113)Cash dividends paid (673) (1,129) (884)Series B preferred stock issued/
(repurchased) (3,000) 2,779 -Warrant issued/(repurchased) (136) 221 -Tax benefit realized on share based
payment awards 4 14 55
Net cash provided by (used) infinancing activities (318) 904 3,462
Change in cash and due from banks (727) 962 3,506Cash and due from banks at beginning of
year 5,376 4,414 908
Cash and due from banks at end of year $ 4,649 $ 5,376 $ 4,414
Supplemental disclosures
Interest paid $ 367 $ 708 $ 785Income taxes paid (b) $ 1,980 $ 1,916 $ 1,053Income taxes refunded (b) (609) (37) (142)Payments (received from) paid to
subsidiaries (967) (1,025) (820)
Net income taxes paid $ 404 $ 854 $ 91
(a) Results for 2007 include six months of BNY Mellon and six months oflegacy The Bank of New York Company, Inc.
(b) Includes discontinued operations.
134 BNY Mellon
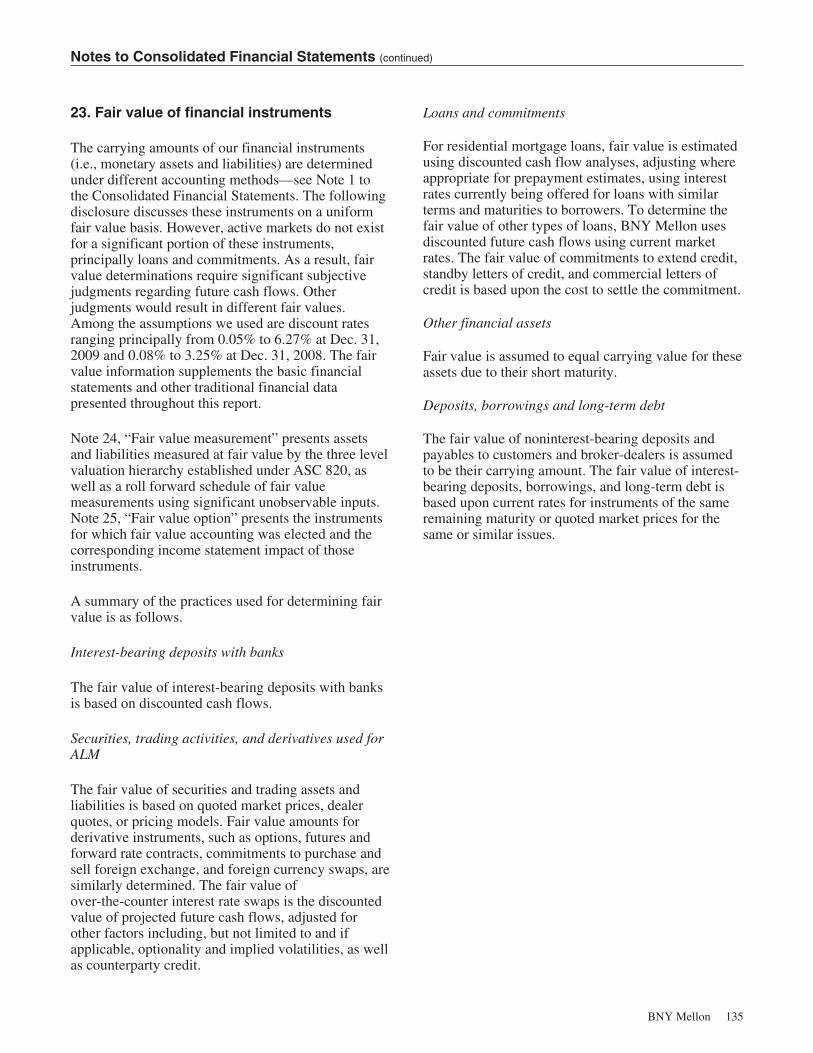
Notes to Consolidated Financial Statements (continued)
23. Fair value of financial instruments
The carrying amounts of our financial instruments(i.e., monetary assets and liabilities) are determinedunder different accounting methods—see Note 1 tothe Consolidated Financial Statements. The followingdisclosure discusses these instruments on a uniformfair value basis. However, active markets do not existfor a significant portion of these instruments,principally loans and commitments. As a result, fairvalue determinations require significant subjectivejudgments regarding future cash flows. Otherjudgments would result in different fair values.Among the assumptions we used are discount ratesranging principally from 0.05% to 6.27% at Dec. 31,2009 and 0.08% to 3.25% at Dec. 31, 2008. The fairvalue information supplements the basic financialstatements and other traditional financial datapresented throughout this report.
Note 24, “Fair value measurement” presents assetsand liabilities measured at fair value by the three levelvaluation hierarchy established under ASC 820, aswell as a roll forward schedule of fair valuemeasurements using significant unobservable inputs.Note 25, “Fair value option” presents the instrumentsfor which fair value accounting was elected and thecorresponding income statement impact of thoseinstruments.
A summary of the practices used for determining fairvalue is as follows.
Interest-bearing deposits with banks
The fair value of interest-bearing deposits with banksis based on discounted cash flows.
Securities, trading activities, and derivatives used forALM
The fair value of securities and trading assets andliabilities is based on quoted market prices, dealerquotes, or pricing models. Fair value amounts forderivative instruments, such as options, futures andforward rate contracts, commitments to purchase andsell foreign exchange, and foreign currency swaps, aresimilarly determined. The fair value ofover-the-counter interest rate swaps is the discountedvalue of projected future cash flows, adjusted forother factors including, but not limited to and ifapplicable, optionality and implied volatilities, as wellas counterparty credit.
Loans and commitments
For residential mortgage loans, fair value is estimatedusing discounted cash flow analyses, adjusting whereappropriate for prepayment estimates, using interestrates currently being offered for loans with similarterms and maturities to borrowers. To determine thefair value of other types of loans, BNY Mellon usesdiscounted future cash flows using current marketrates. The fair value of commitments to extend credit,standby letters of credit, and commercial letters ofcredit is based upon the cost to settle the commitment.
Other financial assets
Fair value is assumed to equal carrying value for theseassets due to their short maturity.
Deposits, borrowings and long-term debt
The fair value of noninterest-bearing deposits andpayables to customers and broker-dealers is assumedto be their carrying amount. The fair value of interest-bearing deposits, borrowings, and long-term debt isbased upon current rates for instruments of the sameremaining maturity or quoted market prices for thesame or similar issues.
BNY Mellon 135
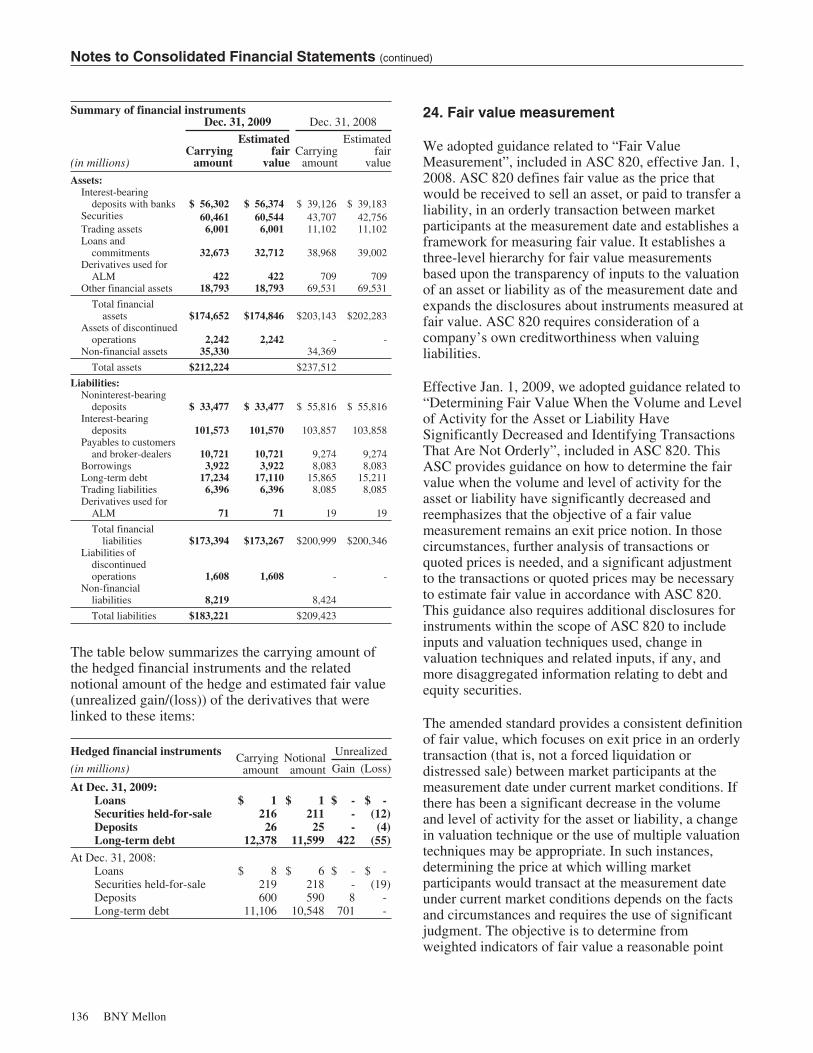
Notes to Consolidated Financial Statements (continued)
Summary of financial instrumentsDec. 31, 2009 Dec. 31, 2008
(in millions)Carrying
amount
Estimatedfair
valueCarrying
amount
Estimatedfair
value
Assets:Interest-bearing
deposits with banks $ 56,302 $ 56,374 $ 39,126 $ 39,183Securities 60,461 60,544 43,707 42,756Trading assets 6,001 6,001 11,102 11,102Loans and
commitments 32,673 32,712 38,968 39,002Derivatives used for
ALM 422 422 709 709Other financial assets 18,793 18,793 69,531 69,531
Total financialassets $174,652 $174,846 $203,143 $202,283
Assets of discontinuedoperations 2,242 2,242 - -
Non-financial assets 35,330 34,369
Total assets $212,224 $237,512
Liabilities:Noninterest-bearing
deposits $ 33,477 $ 33,477 $ 55,816 $ 55,816Interest-bearing
deposits 101,573 101,570 103,857 103,858Payables to customers
and broker-dealers 10,721 10,721 9,274 9,274Borrowings 3,922 3,922 8,083 8,083Long-term debt 17,234 17,110 15,865 15,211Trading liabilities 6,396 6,396 8,085 8,085Derivatives used for
ALM 71 71 19 19
Total financialliabilities $173,394 $173,267 $200,999 $200,346
Liabilities ofdiscontinuedoperations 1,608 1,608 - -
Non-financialliabilities 8,219 8,424
Total liabilities $183,221 $209,423
The table below summarizes the carrying amount ofthe hedged financial instruments and the relatednotional amount of the hedge and estimated fair value(unrealized gain/(loss)) of the derivatives that werelinked to these items:
Hedged financial instruments Carryingamount
Notionalamount
Unrealized
(in millions) Gain (Loss)
At Dec. 31, 2009:Loans $ 1 $ 1 $ - $ -Securities held-for-sale 216 211 - (12)Deposits 26 25 - (4)Long-term debt 12,378 11,599 422 (55)
At Dec. 31, 2008:Loans $ 8 $ 6 $ - $ -Securities held-for-sale 219 218 - (19)Deposits 600 590 8 -Long-term debt 11,106 10,548 701 -
24. Fair value measurement
We adopted guidance related to “Fair ValueMeasurement”, included in ASC 820, effective Jan. 1,2008. ASC 820 defines fair value as the price thatwould be received to sell an asset, or paid to transfer aliability, in an orderly transaction between marketparticipants at the measurement date and establishes aframework for measuring fair value. It establishes athree-level hierarchy for fair value measurementsbased upon the transparency of inputs to the valuationof an asset or liability as of the measurement date andexpands the disclosures about instruments measured atfair value. ASC 820 requires consideration of acompany’s own creditworthiness when valuingliabilities.
Effective Jan. 1, 2009, we adopted guidance related to“Determining Fair Value When the Volume and Levelof Activity for the Asset or Liability HaveSignificantly Decreased and Identifying TransactionsThat Are Not Orderly”, included in ASC 820. ThisASC provides guidance on how to determine the fairvalue when the volume and level of activity for theasset or liability have significantly decreased andreemphasizes that the objective of a fair valuemeasurement remains an exit price notion. In thosecircumstances, further analysis of transactions orquoted prices is needed, and a significant adjustmentto the transactions or quoted prices may be necessaryto estimate fair value in accordance with ASC 820.This guidance also requires additional disclosures forinstruments within the scope of ASC 820 to includeinputs and valuation techniques used, change invaluation techniques and related inputs, if any, andmore disaggregated information relating to debt andequity securities.
The amended standard provides a consistent definitionof fair value, which focuses on exit price in an orderlytransaction (that is, not a forced liquidation ordistressed sale) between market participants at themeasurement date under current market conditions. Ifthere has been a significant decrease in the volumeand level of activity for the asset or liability, a changein valuation technique or the use of multiple valuationtechniques may be appropriate. In such instances,determining the price at which willing marketparticipants would transact at the measurement dateunder current market conditions depends on the factsand circumstances and requires the use of significantjudgment. The objective is to determine fromweighted indicators of fair value a reasonable point
136 BNY Mellon
Notes to Consolidated Financial Statements (continued)
within the range that is most representative of fairvalue under current market conditions.
We also adopted guidance related to the fair valueoption for financial assets and financial liabilitiesincluded in ASC 825, effective Jan. 1, 2008. ASC 825provides an option to elect fair value as an alternativemeasurement basis for selected financial assets,financial liabilities, unrecognized firm commitmentsand written loan commitments which are not subjectto fair value under other accounting standards.
Determination of fair value
Following is a description of our valuationmethodologies for assets and liabilities measured atfair value. We have established processes fordetermining fair values. Fair value is based uponquoted market prices, where available. For financialinstruments where quotes from recent exchangetransactions are not available, we determine fair valuebased on discounted cash flow analysis, comparison tosimilar instruments, and the use of financial models.Discounted cash flow analysis is dependent uponestimated future cash flows and the level of interestrates. Model-based pricing uses inputs of observableprices for interest rates, foreign exchange rates, optionvolatilities and other factors. Models are benchmarkedand validated by an independent internal riskmanagement function. Our valuation process takesinto consideration factors such as counterparty creditquality, liquidity, concentration concerns,observability of model parameters and the results ofstress tests. Valuation adjustments may be made toensure that financial instruments are recorded at fairvalue.
Most derivative contracts are valued using internallydeveloped models which are calibrated to observablemarket data and employ standard market pricingtheory for their valuations. An initial “risk-neutral”valuation is performed on each position assumingtime-discounting based on an AA credit curve. Then,to arrive at a fair value that incorporates counterpartycredit risk, a credit adjustment is made to these resultsby discounting each trade’s expected exposures to thecounterparty using the counterparty’s credit spreads,as implied by the credit default swap market. We alsoadjust expected liabilities to the counterparty usingBNY Mellon’s own credit spreads, also implied by thecredit default swap market. Accordingly, the valuationof our derivative position is sensitive to the currentchanges in our own credit spreads as well as those ofour counterparties.
In certain cases, we may face additional costs to exitlarge risk positions or recent prices may not beobservable for instruments that trade in inactive orless active markets. The costs to exit large riskpositions are based on evaluating the negative changein the market during the time it would take for us tobring those positions to normal market levels for thoseinstruments. Upon evaluating the uncertainty invaluing financial instruments subject to liquidityissues, we make an adjustment to their value. Thedetermination of the liquidity adjustment includes theavailability of external quotes, the time since the latestavailable quote and the price volatility of theinstrument.
Certain parameters in some financial models are notdirectly observable and, therefore, are based onmanagements’ estimates and judgments. Thesefinancial instruments are normally traded lessactively. Examples include certain credit productswhere parameters such as correlation and recoveryrates are unobservable. We apply valuationadjustments to mitigate the possibility of error andrevision in the model based estimated value.
The methods described above may produce a currentfair value calculation that may not be indicative of netrealizable value or reflective of future fair values. Webelieve our methods of determining fair value areappropriate and consistent with other marketparticipants. However, the use of differentmethodologies or different assumptions to valuecertain financial instruments could result in a differentestimate of fair value.
Valuation hierarchy
ASC 820 establishes a three-level valuation hierarchyfor disclosure of fair value measurements based uponthe transparency of inputs to the valuation of an assetor liability as of the measurement date. The threelevels are described below.
Level 1: Inputs to the valuation methodology arequoted prices (unadjusted) for identical assets orliabilities in active markets. Level 1 assets andliabilities include debt and equity securities andderivative financial instruments actively traded onexchanges and U.S. Treasury securities and U.S.Government securities that are actively traded inhighly liquid over the counter markets.
Level 2: Observable inputs other than Level 1 prices,for example, quoted prices for similar assets and
BNY Mellon 137
Notes to Consolidated Financial Statements (continued)
liabilities in active markets, quoted prices for identicalor similar assets or liabilities in markets that are notactive, and inputs that are observable or can becorroborated, either directly or indirectly, forsubstantially the full term of the financial instrument.Level 2 assets and liabilities include debt instrumentsthat are traded less frequently than exchange tradedsecurities and derivative instruments whose modelinputs are observable in the market or can becorroborated by market observable data. Examples inthis category are certain variable and fixed rate agencyand non-agency securities, corporate debt securitiesand derivative contracts.
Level 3: Inputs to the valuation methodology areunobservable and significant to the fair valuemeasurement. Examples in this category includeinterests in certain securitized financial assets, certainprivate equity investments, and derivative contractsthat are highly structured or long-dated.
A financial instrument’s categorization within thevaluation hierarchy is based upon the lowest level ofinput that is significant to the fair value measurement.
Following is a description of the valuationmethodologies used for instruments measured at fairvalue, as well as the general classification of suchinstruments pursuant to the valuation hierarchy.
Loans and unfunded lending-related commitments
Where quoted market prices are not available, wegenerally base the fair value of loans and unfundedlending-related commitments on observable marketprices of similar instruments, including bonds, creditderivatives and loans with similar characteristics. Ifobservable market prices are not available, we basethe fair value on estimated cash flows adjusted forcredit risk which are discounted using an interest rateappropriate for the maturity of the applicable loans orthe unfunded commitments.
Unrealized gains and losses on unfunded lendingcommitments carried at fair value are classified inOther assets and Other liabilities, respectively. Loansand unfunded lending commitments carried at fairvalue are generally classified within Level 2 of thevaluation hierarchy.
Securities
Where quoted prices are available in an active market,we classify the securities within Level 1 of thevaluation hierarchy. Securities are defined as both
long and short positions. Level 1 securities includehighly liquid government bonds, certain mortgageproducts and exchange-traded equities.
If quoted market prices are not available, we estimatefair values using pricing models, quoted prices ofsecurities with similar characteristics, or discountedcash flows. Examples of such instruments, whichwould generally be classified within Level 2 of thevaluation hierarchy, include certain agency andnon-agency mortgage-backed securities, commercialmortgage-backed securities and European floating ratenotes.
For securities where quotes from recent transactionsare not available for identical securities, we determinefair value primarily based on pricing sources withreasonable levels of price transparency that employfinancial models or obtain comparison to similarinstruments to arrive at “consensus” prices.
Specifically, the pricing sources obtain recenttransactions for similar types of securities (e.g.,vintage, position in the securitization structure) andascertain variables such as discount rate and speed ofprepayment for the types of transaction and applysuch variables to similar types of bonds. We viewthese as observable transactions in the current marketplace and classify such securities as Level 2. Pricingsources discontinue pricing any specific securitywhenever they determine there is insufficientobservable data to provide a good faith opinion onprice.
In addition, we have significant investments in moreactively traded agency RMBS and the pricing sourcesderive the prices for these securities largely fromquotes they obtain from three major inter-dealerbrokers. The pricing sources receive their dailyobserved trade price and other information feeds fromthe interdealer brokers.
In 2009, we securitized approximately $5.0 billion,fair value, of our investment securities portfolio into aGrantor Trust. The Grantor Trust includes Alt-A,prime and subprime RMBS. We sold the Class ANotes and retained Class B certificates with a fairvalue of approximately $4.2 billion. The fair value ofthe retained securities was based on the observablemarket prices of the underlying securities and isconsidered Level 2 in the fair value hierarchy.
For securities with bond insurance, the financialstrength of the insurance provider is analyzed and that
138 BNY Mellon
Notes to Consolidated Financial Statements (continued)
information is included in the fair value assessmentfor such securities.
In certain cases where there is limited activity or lesstransparency around inputs to the valuation, weclassify those securities in Level 3 of the valuationhierarchy. Securities classified within Level 3 mayinclude certain asset-backed securities CLOs, andother retained interests in securitizations depending ontheir structure.
At Dec. 31, 2009, market prices were consistent withour internally modeled prices. As a result,approximately 99% of our securities were valued bypricing sources with reasonable levels of pricetransparency. Approximately 1% of our securitieswere priced based on economic models andnon-binding dealer quotes, and are included in Level 3of the ASC 820 hierarchy.
Other short-term U.S. government-backed commercialpaper and borrowings from Federal Reserve relatedto asset-backed commercial paper
At Dec. 31, 2009, there were no balances outstandingfor these instruments. At Dec. 31, 2008, theseinstruments were classified in Level 2 of the valuationhierarchy. The fair value of these instruments wasestimated using pricing models.
Derivatives
We classify exchange-traded derivatives valued usingquoted prices in Level 1 of the valuation hierarchy.Examples include exchanged-traded equity andforeign exchange options. Since few other classes ofderivative contracts are listed on an exchange, most ofour derivative positions are valued using internallydeveloped models that use as their basis readilyobservable market parameters and we classify them inLevel 2 of the valuation hierarchy. Such derivativesinclude basic interest rate swaps and options andcredit default swaps. Derivatives valued using modelswith significant unobservable market parameters andthat are traded less actively or in markets that lack twoway flow, are classified in Level 3 of the valuationhierarchy. Examples include long-dated interest rateor currency swaps, where swap rates may beunobservable for longer maturities; and certain creditproducts, where correlation and recovery rates areunobservable. Certain interest rate swaps withcounterparties that are highly structured entitiesrequire significant judgment and analysis to adjust thevalue determined by standard pricing models. The fair
value of these interest rate swaps compose less than1% of the fair value of our derivative financialinstruments. Additional disclosures of derivativeinstruments are provided in Note 27 of the Notes toConsolidated Financial Statements.
Seed capital
In our Asset Management segment we manageinvestment assets, including equities, fixed income,money market and alternative investment funds forinstitutions and other investors; as part of that activitywe make seed capital investments in certain funds.Seed capital is included in trading assets, securitiesavailable-for-sale and other assets, depending on thenature of the investment. When applicable, we valueseed capital based on the published net asset value(“NAV”) of the fund. We include funds in whichownership interests in the fund are publicly-traded inan active market and institutional funds in whichinvestors trade in and out daily in Level 1 of thevaluation hierarchy. We include open-end fundswhere investors are allowed to sell their ownershipinterest back to the fund less frequently than daily andwhere our interest in the fund contains no other rightsor obligations in Level 2 of the valuation hierarchy.However, we generally include investments in fundswhich allow investors to sell their ownership interestback to the fund less frequently than monthly in Level3, unless actual redemption prices are observable.
For other types of investments in funds, we considerall of the rights and obligations inherent in ourownership interest, including the reported NAV aswell as other factors that affect the fair value of ourinterest in the fund. To the extent the NAVmeasurements reported for the investments are basedon unobservable inputs or include other rights andobligations (e.g., obligation to meet cash calls), wegenerally classify them in Level 3 of the valuationhierarchy.
Certain interests in securitizations
For certain interests in securitizations which areclassified in securities available-for-sale and otherassets, we use discounted cash flow models whichgenerally include assumptions of projected financecharges related to the securitized assets, estimated netcredit losses, prepayment assumptions and estimatesof payments to third-party investors. When available,we compare our fair value estimates and assumptionsto market activity and to the actual results of thesecuritized portfolio. Changes in these assumptions
BNY Mellon 139
Notes to Consolidated Financial Statements (continued)
may significantly impact our estimate of fair value ofthe interests in securitizations; accordingly, wegenerally classify them in Level 3 of the valuationhierarchy.
Private equity investments
Our Other segment includes holdings of nonpublicprivate equity investment through funds managed bythird party investment managers and, to a lesserextent, direct investment in private equities.Nonpublic private equity investments generally lackquoted market prices, are less liquid and may be longterm; accordingly, we must apply significantjudgment in determining their fair value. We valueprivate equity investments initially based upon thetransaction price which we subsequently adjust toreflect expected exit values as evidenced by financingand sale transactions with third parties or throughongoing reviews by the investment managers.
The investment managers consider a number offactors in changes in valuation including currentoperating performance and future expectations of theparticular investment, industry valuations of
comparable public companies, changes in marketoutlook and the financing environment. Nonpublicprivate equity investments are included in Level 3 ofthe valuation hierarchy.
Private equity investments also include publicly heldequity investments, generally obtained through theinitial public offering of privately held equityinvestments. These equity investments are often heldin a partnership structure. Publicly held investmentsare marked-to-market at the quoted public value lessadjustments for regulatory or contractual salesrestrictions or adjustments to reflect the difficulty inselling a partnership interest.
Discounts for restrictions are quantified by analyzingthe length of the restriction period and the volatility ofthe equity security. These equity investments areprimarily classified in Level 2 of the valuationhierarchy.
The following tables present the financial instrumentscarried at fair value at Dec. 31, 2009 and 2008, bycaption on the consolidated balance sheet and by ASC820 valuation hierarchy (as described above).
140 BNY Mellon
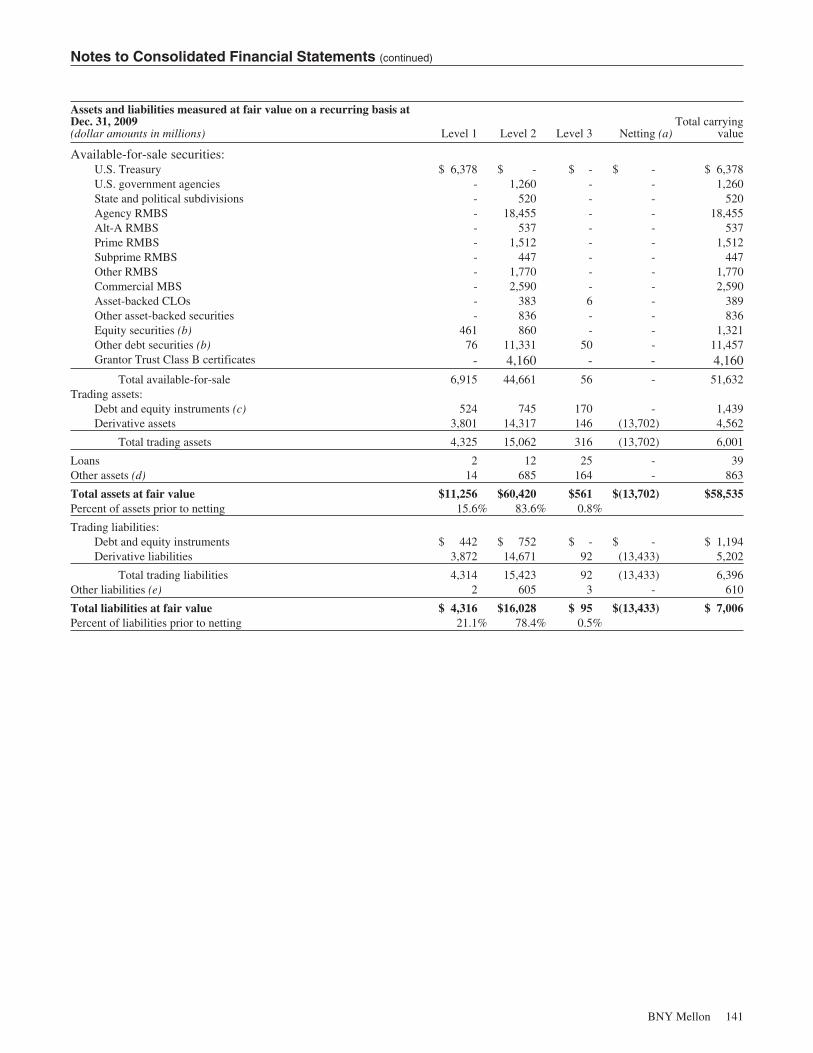
Notes to Consolidated Financial Statements (continued)
Assets and liabilities measured at fair value on a recurring basis atDec. 31, 2009(dollar amounts in millions) Level 1 Level 2 Level 3 Netting (a)
Total carryingvalue
Available-for-sale securities:U.S. Treasury $ 6,378 $ - $ - $ - $ 6,378U.S. government agencies - 1,260 - - 1,260State and political subdivisions - 520 - - 520Agency RMBS - 18,455 - - 18,455Alt-A RMBS - 537 - - 537Prime RMBS - 1,512 - - 1,512Subprime RMBS - 447 - - 447Other RMBS - 1,770 - - 1,770Commercial MBS - 2,590 - - 2,590Asset-backed CLOs - 383 6 - 389Other asset-backed securities - 836 - - 836Equity securities (b) 461 860 - - 1,321Other debt securities (b) 76 11,331 50 - 11,457Grantor Trust Class B certificates - 4,160 - - 4,160
Total available-for-sale 6,915 44,661 56 - 51,632Trading assets:
Debt and equity instruments (c) 524 745 170 - 1,439Derivative assets 3,801 14,317 146 (13,702) 4,562
Total trading assets 4,325 15,062 316 (13,702) 6,001
Loans 2 12 25 - 39Other assets (d) 14 685 164 - 863
Total assets at fair value $11,256 $60,420 $561 $(13,702) $58,535Percent of assets prior to netting 15.6% 83.6% 0.8%
Trading liabilities:Debt and equity instruments $ 442 $ 752 $ - $ - $ 1,194Derivative liabilities 3,872 14,671 92 (13,433) 5,202
Total trading liabilities 4,314 15,423 92 (13,433) 6,396Other liabilities (e) 2 605 3 - 610
Total liabilities at fair value $ 4,316 $16,028 $ 95 $(13,433) $ 7,006Percent of liabilities prior to netting 21.1% 78.4% 0.5%
BNY Mellon 141
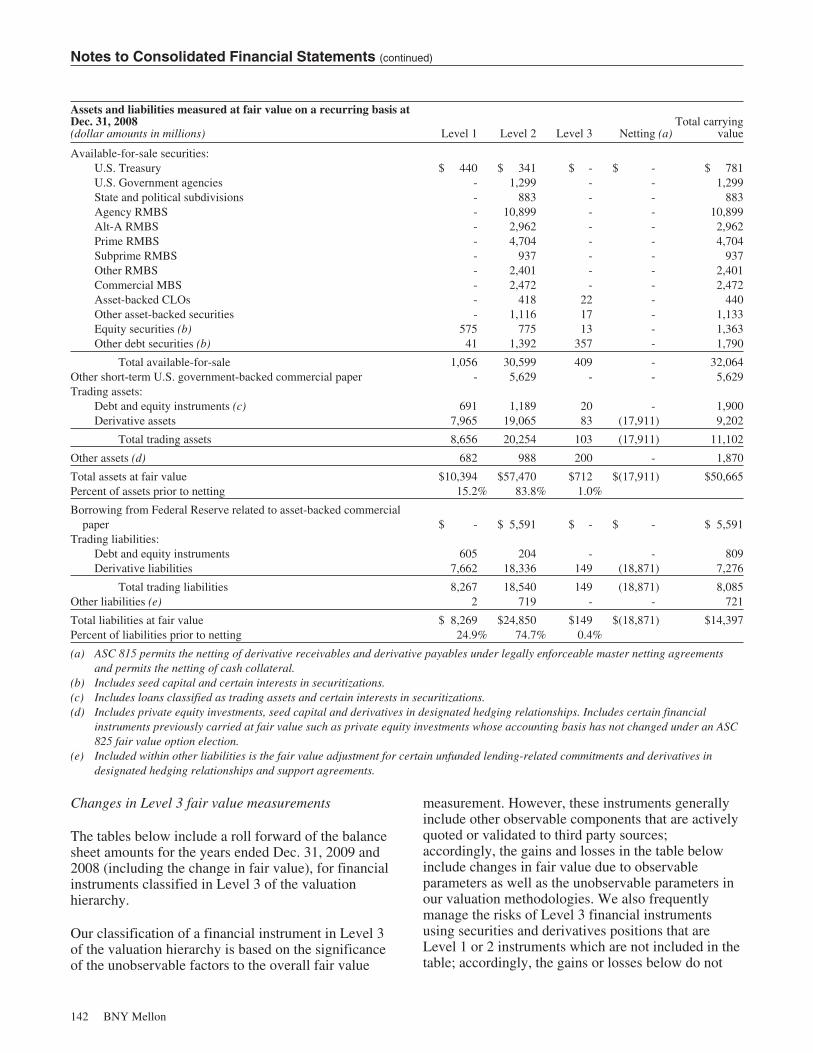
Notes to Consolidated Financial Statements (continued)
Assets and liabilities measured at fair value on a recurring basis atDec. 31, 2008(dollar amounts in millions) Level 1 Level 2 Level 3 Netting (a)
Total carryingvalue
Available-for-sale securities:U.S. Treasury $ 440 $ 341 $ - $ - $ 781U.S. Government agencies - 1,299 - - 1,299State and political subdivisions - 883 - - 883Agency RMBS - 10,899 - - 10,899Alt-A RMBS - 2,962 - - 2,962Prime RMBS - 4,704 - - 4,704Subprime RMBS - 937 - - 937Other RMBS - 2,401 - - 2,401Commercial MBS - 2,472 - - 2,472Asset-backed CLOs - 418 22 - 440Other asset-backed securities - 1,116 17 - 1,133Equity securities (b) 575 775 13 - 1,363Other debt securities (b) 41 1,392 357 - 1,790
Total available-for-sale 1,056 30,599 409 - 32,064Other short-term U.S. government-backed commercial paper - 5,629 - - 5,629Trading assets:
Debt and equity instruments (c) 691 1,189 20 - 1,900Derivative assets 7,965 19,065 83 (17,911) 9,202
Total trading assets 8,656 20,254 103 (17,911) 11,102
Other assets (d) 682 988 200 - 1,870
Total assets at fair value $10,394 $57,470 $712 $(17,911) $50,665Percent of assets prior to netting 15.2% 83.8% 1.0%
Borrowing from Federal Reserve related to asset-backed commercialpaper $ - $ 5,591 $ - $ - $ 5,591
Trading liabilities:Debt and equity instruments 605 204 - - 809Derivative liabilities 7,662 18,336 149 (18,871) 7,276
Total trading liabilities 8,267 18,540 149 (18,871) 8,085Other liabilities (e) 2 719 - - 721
Total liabilities at fair value $ 8,269 $24,850 $149 $(18,871) $14,397Percent of liabilities prior to netting 24.9% 74.7% 0.4%
(a) ASC 815 permits the netting of derivative receivables and derivative payables under legally enforceable master netting agreementsand permits the netting of cash collateral.
(b) Includes seed capital and certain interests in securitizations.(c) Includes loans classified as trading assets and certain interests in securitizations.(d) Includes private equity investments, seed capital and derivatives in designated hedging relationships. Includes certain financial
instruments previously carried at fair value such as private equity investments whose accounting basis has not changed under an ASC825 fair value option election.
(e) Included within other liabilities is the fair value adjustment for certain unfunded lending-related commitments and derivatives indesignated hedging relationships and support agreements.
Changes in Level 3 fair value measurements
The tables below include a roll forward of the balancesheet amounts for the years ended Dec. 31, 2009 and2008 (including the change in fair value), for financialinstruments classified in Level 3 of the valuationhierarchy.
Our classification of a financial instrument in Level 3of the valuation hierarchy is based on the significanceof the unobservable factors to the overall fair value
measurement. However, these instruments generallyinclude other observable components that are activelyquoted or validated to third party sources;accordingly, the gains and losses in the table belowinclude changes in fair value due to observableparameters as well as the unobservable parameters inour valuation methodologies. We also frequentlymanage the risks of Level 3 financial instrumentsusing securities and derivatives positions that areLevel 1 or 2 instruments which are not included in thetable; accordingly, the gains or losses below do not
142 BNY Mellon
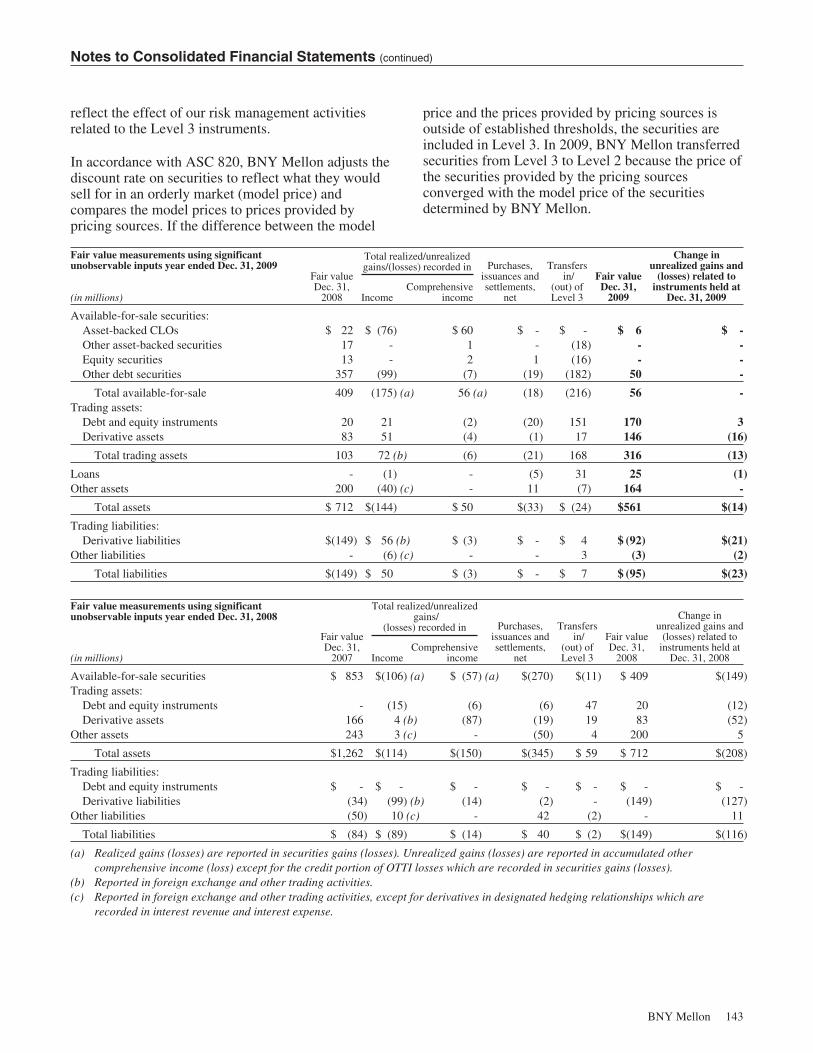
Notes to Consolidated Financial Statements (continued)
reflect the effect of our risk management activitiesrelated to the Level 3 instruments.
In accordance with ASC 820, BNY Mellon adjusts thediscount rate on securities to reflect what they wouldsell for in an orderly market (model price) andcompares the model prices to prices provided bypricing sources. If the difference between the model
price and the prices provided by pricing sources isoutside of established thresholds, the securities areincluded in Level 3. In 2009, BNY Mellon transferredsecurities from Level 3 to Level 2 because the price ofthe securities provided by the pricing sourcesconverged with the model price of the securitiesdetermined by BNY Mellon.
Fair value measurements using significantunobservable inputs year ended Dec. 31, 2009
Fair valueDec. 31,
2008
Total realized/unrealizedgains/(losses) recorded in Purchases,
issuances andsettlements,
net
Transfersin/
(out) ofLevel 3
Fair valueDec. 31,
2009
Change inunrealized gains and
(losses) related toinstruments held at
Dec. 31, 2009(in millions) IncomeComprehensive
income
Available-for-sale securities:Asset-backed CLOs $ 22 $ (76) $ 60 $ - $ - $ 6 $ -Other asset-backed securities 17 - 1 - (18) - -Equity securities 13 - 2 1 (16) - -Other debt securities 357 (99) (7) (19) (182) 50 -
Total available-for-sale 409 (175) (a) 56 (a) (18) (216) 56 -Trading assets:
Debt and equity instruments 20 21 (2) (20) 151 170 3Derivative assets 83 51 (4) (1) 17 146 (16)
Total trading assets 103 72 (b) (6) (21) 168 316 (13)
Loans - (1) - (5) 31 25 (1)Other assets 200 (40) (c) - 11 (7) 164 -
Total assets $ 712 $(144) $ 50 $(33) $ (24) $561 $(14)
Trading liabilities:Derivative liabilities $(149) $ 56 (b) $ (3) $ - $ 4 $ (92) $(21)
Other liabilities - (6) (c) - - 3 (3) (2)
Total liabilities $(149) $ 50 $ (3) $ - $ 7 $ (95) $(23)
Fair value measurements using significantunobservable inputs year ended Dec. 31, 2008
Fair valueDec. 31,
2007
Total realized/unrealizedgains/
(losses) recorded in Purchases,issuances andsettlements,
net
Transfersin/
(out) ofLevel 3
Fair valueDec. 31,
2008
Change inunrealized gains and
(losses) related toinstruments held at
Dec. 31, 2008(in millions) IncomeComprehensive
income
Available-for-sale securities $ 853 $(106) (a) $ (57) (a) $(270) $(11) $ 409 $(149)Trading assets:
Debt and equity instruments - (15) (6) (6) 47 20 (12)Derivative assets 166 4 (b) (87) (19) 19 83 (52)
Other assets 243 3 (c) - (50) 4 200 5
Total assets $1,262 $(114) $(150) $(345) $ 59 $ 712 $(208)
Trading liabilities:Debt and equity instruments $ - $ - $ - $ - $ - $ - $ -Derivative liabilities (34) (99) (b) (14) (2) - (149) (127)
Other liabilities (50) 10 (c) - 42 (2) - 11
Total liabilities $ (84) $ (89) $ (14) $ 40 $ (2) $(149) $(116)
(a) Realized gains (losses) are reported in securities gains (losses). Unrealized gains (losses) are reported in accumulated othercomprehensive income (loss) except for the credit portion of OTTI losses which are recorded in securities gains (losses).
(b) Reported in foreign exchange and other trading activities.(c) Reported in foreign exchange and other trading activities, except for derivatives in designated hedging relationships which are
recorded in interest revenue and interest expense.
BNY Mellon 143
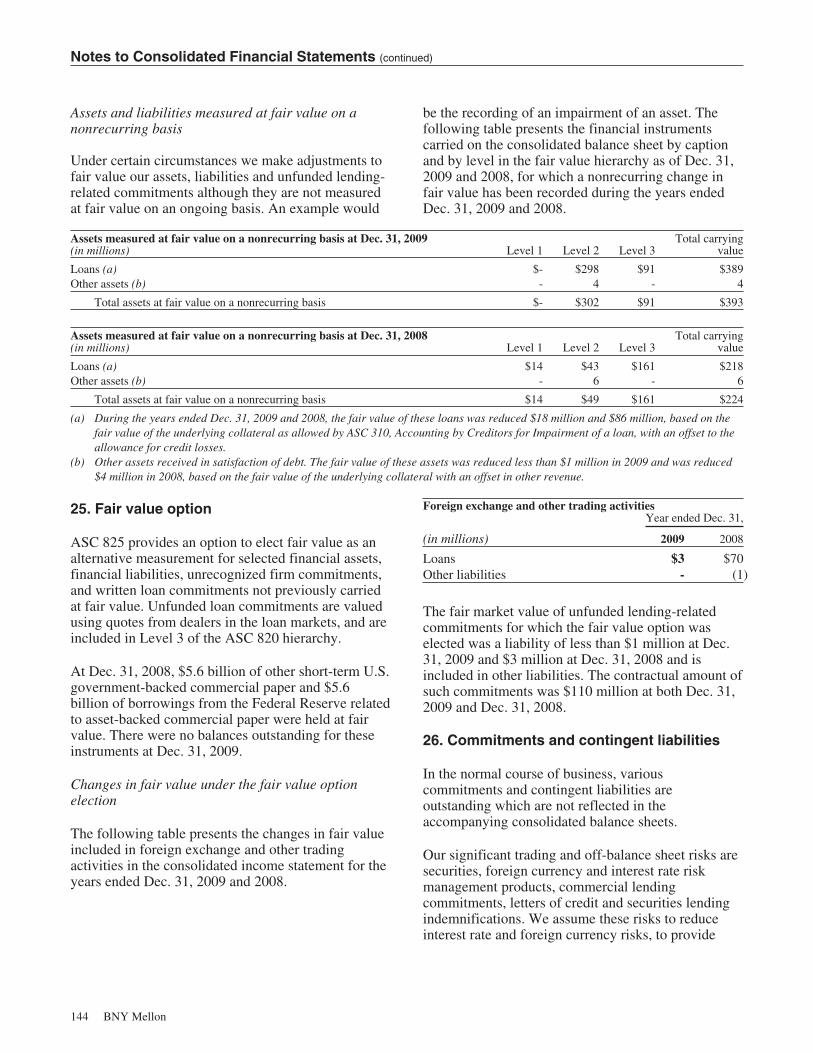
Notes to Consolidated Financial Statements (continued)
Assets and liabilities measured at fair value on anonrecurring basis
Under certain circumstances we make adjustments tofair value our assets, liabilities and unfunded lending-related commitments although they are not measuredat fair value on an ongoing basis. An example would
be the recording of an impairment of an asset. Thefollowing table presents the financial instrumentscarried on the consolidated balance sheet by captionand by level in the fair value hierarchy as of Dec. 31,2009 and 2008, for which a nonrecurring change infair value has been recorded during the years endedDec. 31, 2009 and 2008.
Assets measured at fair value on a nonrecurring basis at Dec. 31, 2009(in millions) Level 1 Level 2 Level 3
Total carryingvalue
Loans (a) $- $298 $91 $389Other assets (b) - 4 - 4
Total assets at fair value on a nonrecurring basis $- $302 $91 $393
Assets measured at fair value on a nonrecurring basis at Dec. 31, 2008(in millions) Level 1 Level 2 Level 3
Total carryingvalue
Loans (a) $14 $43 $161 $218Other assets (b) - 6 - 6
Total assets at fair value on a nonrecurring basis $14 $49 $161 $224
(a) During the years ended Dec. 31, 2009 and 2008, the fair value of these loans was reduced $18 million and $86 million, based on thefair value of the underlying collateral as allowed by ASC 310, Accounting by Creditors for Impairment of a loan, with an offset to theallowance for credit losses.
(b) Other assets received in satisfaction of debt. The fair value of these assets was reduced less than $1 million in 2009 and was reduced$4 million in 2008, based on the fair value of the underlying collateral with an offset in other revenue.
25. Fair value option
ASC 825 provides an option to elect fair value as analternative measurement for selected financial assets,financial liabilities, unrecognized firm commitments,and written loan commitments not previously carriedat fair value. Unfunded loan commitments are valuedusing quotes from dealers in the loan markets, and areincluded in Level 3 of the ASC 820 hierarchy.
At Dec. 31, 2008, $5.6 billion of other short-term U.S.government-backed commercial paper and $5.6billion of borrowings from the Federal Reserve relatedto asset-backed commercial paper were held at fairvalue. There were no balances outstanding for theseinstruments at Dec. 31, 2009.
Changes in fair value under the fair value optionelection
The following table presents the changes in fair valueincluded in foreign exchange and other tradingactivities in the consolidated income statement for theyears ended Dec. 31, 2009 and 2008.
Foreign exchange and other trading activities
(in millions)
Year ended Dec. 31,
2009 2008
Loans $3 $70Other liabilities - (1)
The fair market value of unfunded lending-relatedcommitments for which the fair value option waselected was a liability of less than $1 million at Dec.31, 2009 and $3 million at Dec. 31, 2008 and isincluded in other liabilities. The contractual amount ofsuch commitments was $110 million at both Dec. 31,2009 and Dec. 31, 2008.
26. Commitments and contingent liabilities
In the normal course of business, variouscommitments and contingent liabilities areoutstanding which are not reflected in theaccompanying consolidated balance sheets.
Our significant trading and off-balance sheet risks aresecurities, foreign currency and interest rate riskmanagement products, commercial lendingcommitments, letters of credit and securities lendingindemnifications. We assume these risks to reduceinterest rate and foreign currency risks, to provide
144 BNY Mellon
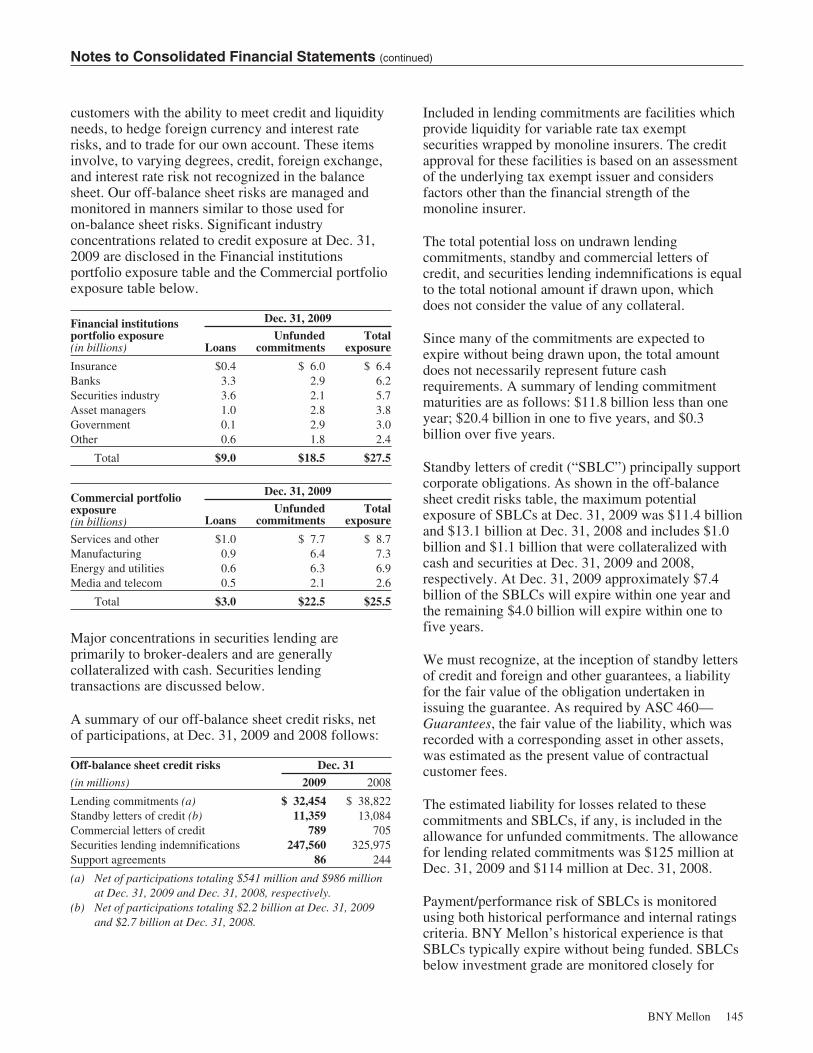
Notes to Consolidated Financial Statements (continued)
customers with the ability to meet credit and liquidityneeds, to hedge foreign currency and interest raterisks, and to trade for our own account. These itemsinvolve, to varying degrees, credit, foreign exchange,and interest rate risk not recognized in the balancesheet. Our off-balance sheet risks are managed andmonitored in manners similar to those used foron-balance sheet risks. Significant industryconcentrations related to credit exposure at Dec. 31,2009 are disclosed in the Financial institutionsportfolio exposure table and the Commercial portfolioexposure table below.
Financial institutionsportfolio exposure(in billions)
Dec. 31, 2009
LoansUnfunded
commitmentsTotal
exposure
Insurance $0.4 $ 6.0 $ 6.4Banks 3.3 2.9 6.2Securities industry 3.6 2.1 5.7Asset managers 1.0 2.8 3.8Government 0.1 2.9 3.0Other 0.6 1.8 2.4
Total $9.0 $18.5 $27.5
Commercial portfolioexposure(in billions)
Dec. 31, 2009
LoansUnfunded
commitmentsTotal
exposure
Services and other $1.0 $ 7.7 $ 8.7Manufacturing 0.9 6.4 7.3Energy and utilities 0.6 6.3 6.9Media and telecom 0.5 2.1 2.6
Total $3.0 $22.5 $25.5
Major concentrations in securities lending areprimarily to broker-dealers and are generallycollateralized with cash. Securities lendingtransactions are discussed below.
A summary of our off-balance sheet credit risks, netof participations, at Dec. 31, 2009 and 2008 follows:
Off-balance sheet credit risks Dec. 31
(in millions) 2009 2008
Lending commitments (a) $ 32,454 $ 38,822Standby letters of credit (b) 11,359 13,084Commercial letters of credit 789 705Securities lending indemnifications 247,560 325,975Support agreements 86 244
(a) Net of participations totaling $541 million and $986 millionat Dec. 31, 2009 and Dec. 31, 2008, respectively.
(b) Net of participations totaling $2.2 billion at Dec. 31, 2009and $2.7 billion at Dec. 31, 2008.
Included in lending commitments are facilities whichprovide liquidity for variable rate tax exemptsecurities wrapped by monoline insurers. The creditapproval for these facilities is based on an assessmentof the underlying tax exempt issuer and considersfactors other than the financial strength of themonoline insurer.
The total potential loss on undrawn lendingcommitments, standby and commercial letters ofcredit, and securities lending indemnifications is equalto the total notional amount if drawn upon, whichdoes not consider the value of any collateral.
Since many of the commitments are expected toexpire without being drawn upon, the total amountdoes not necessarily represent future cashrequirements. A summary of lending commitmentmaturities are as follows: $11.8 billion less than oneyear; $20.4 billion in one to five years, and $0.3billion over five years.
Standby letters of credit (“SBLC”) principally supportcorporate obligations. As shown in the off-balancesheet credit risks table, the maximum potentialexposure of SBLCs at Dec. 31, 2009 was $11.4 billionand $13.1 billion at Dec. 31, 2008 and includes $1.0billion and $1.1 billion that were collateralized withcash and securities at Dec. 31, 2009 and 2008,respectively. At Dec. 31, 2009 approximately $7.4billion of the SBLCs will expire within one year andthe remaining $4.0 billion will expire within one tofive years.
We must recognize, at the inception of standby lettersof credit and foreign and other guarantees, a liabilityfor the fair value of the obligation undertaken inissuing the guarantee. As required by ASC 460—Guarantees, the fair value of the liability, which wasrecorded with a corresponding asset in other assets,was estimated as the present value of contractualcustomer fees.
The estimated liability for losses related to thesecommitments and SBLCs, if any, is included in theallowance for unfunded commitments. The allowancefor lending related commitments was $125 million atDec. 31, 2009 and $114 million at Dec. 31, 2008.
Payment/performance risk of SBLCs is monitoredusing both historical performance and internal ratingscriteria. BNY Mellon’s historical experience is thatSBLCs typically expire without being funded. SBLCsbelow investment grade are monitored closely for
BNY Mellon 145

Notes to Consolidated Financial Statements (continued)
payment/performance risk. The table below showsSBLCs by investment grade:
Standby letters of credit Dec. 31,
2009 2008
Investment grade 83% 89%Noninvestment grade 17% 11%
A commercial letter of credit is normally a short-terminstrument used to finance a commercial contract forthe shipment of goods from a seller to a buyer.Although the commercial letter of credit is contingentupon the satisfaction of specified conditions, itrepresents a credit exposure if the buyer defaults onthe underlying transaction. As a result, the totalcontractual amounts do not necessarily representfuture cash requirements. Commercial letters of credittotaled $789 million at Dec. 31, 2009, compared with$705 million at Dec. 31, 2008.
A securities lending transaction is a fullycollateralized transaction in which the owner of asecurity agrees to lend the security (typically throughan agent, in our case, The Bank of New York Mellon)to a borrower, usually a broker-dealer or bank, on anopen, overnight or term basis, under the terms of aprearranged contract, which normally matures in lessthan 90 days. We generally lend securities withindemnification against broker default. Securitieslending transactions were collateralized at 102%primarily by cash and U.S. government securities,which is monitored daily, thus reducing credit risk.Market risk can also arise in securities lendingtransactions. These risks are controlled throughpolicies limiting the level of risk that can beundertaken. Securities lending transactions aregenerally entered into only with highly-ratedcounterparties. Securities lending indemnificationswere secured by collateral of $254 billion at Dec. 31,2009 and $335 billion at Dec. 31, 2008. We recorded$259 million of fee revenue from securities lendingtransactions in 2009 compared with $789 million in2008.
We expect many of these guarantees to expire withoutthe need to advance any cash. The revenue associatedwith guarantees frequently depends on the creditrating of the obligor and the structure of thetransaction, including collateral, if any.
Our potential exposure to support agreements wasapproximately $86 million at Dec. 31, 2009 compared
with $244 million at Dec. 31, 2008. Potential supportagreement exposure is determined based on thesecurities subject to these agreements being valued atzero and the NAV of the related funds decliningbelow established thresholds. This exposure includesagreements covering Lehman securities, as well asother client support agreements.
We provided services to three QSPEs at Dec. 31,2009. These QSPEs, as defined by ASC 860—Transfers and Servicing were designed to be passiveinvestment vehicles and therefore, we do notconsolidate them. See Note 17 of the Notes toConsolidated Financial Statements for additionalinformation.
Operating leases
Net rent expense for premises and equipment was$327 million in 2009, $362 million in 2008 and $276million in 2007.
At Dec. 31, 2009, we were obligated under variousnoncancelable lease agreements, some of whichprovide for additional rents based upon real estatetaxes, insurance, and maintenance and for variousrenewal options. A summary of the future minimumrental commitments under noncancelable operatingleases, net of related sublease revenue, is as follows:2010—$347 million; 2011—$325 million; 2012—$285 million; 2013—$265 million; 2014—$229million; and 2015 through 2029—$1.324 billion.
Other
We have provided standard representations forunderwriting agreements, acquisition and divestitureagreements, sales of loans and commitments, andother similar types of arrangements and customaryindemnification for claims and legal proceedingsrelated to providing financial services. Insurance hasbeen purchased to mitigate certain of these risks. Weare a minority equity investor in, and member of,several industry clearing or settlement exchangesthrough which foreign exchange, securities, or othertransactions settle. Certain of these industry clearingor settlement exchanges require their members toguarantee their obligations and liabilities or to providefinancial support in the event other partners do nothonor their obligations. It is not possible to estimate amaximum potential amount of payments that could berequired with such agreements.
146 BNY Mellon

Notes to Consolidated Financial Statements (continued)
Legal proceedings
In the ordinary course of business, BNY Mellon andits subsidiaries are routinely defendants in or parties toa number of pending and potential legal actions,including actions brought on behalf of various classesof claimants, and regulatory matters. Claims forsignificant monetary damages are asserted in certainof these actions and proceedings. In regulatoryenforcement matters, claims for disgorgement and theimposition of penalties and/or other remedialsanctions are possible. Due to the inherent difficultyof predicting the outcome of such matters, we cannotascertain what the eventual outcome of these matterswill be; however, on the basis of current knowledgeand after consultation with legal counsel, we do notbelieve that judgments or settlements, if any, arisingfrom pending or potential legal actions or regulatorymatters, either individually or in the aggregate, aftergiving effect to applicable reserves and insurancecoverage, will have a material adverse effect on theconsolidated financial position or liquidity of BNYMellon, although they could have a material effect onnet income for a given period. BNY Mellon intends todefend itself vigorously against all of the claimsasserted in these legal actions.
As previously disclosed in the Company’s Form 8-Kdated Oct. 23, 2009, the Federal Customs Service ofthe Russian Federation (the “Customs Service”) andThe Bank of New York Mellon, a subsidiary of BNYMellon, have settled the litigation filed by theCustoms Service seeking $22.5 billion. Pursuant to aSettlement and Release Agreement filed therewith, theCustoms Service withdrew its claim, the proceedingswere terminated by the Russian Arbitrazh Court, andthe Customs Service and The Bank of New YorkMellon exchanged mutual releases. Without anyadmission of liability, The Bank of New York Mellonagreed to pay $14 million in trial costs and expensesto the Customs Service in consideration for thesettlement.
As previously disclosed, The Bank of New YorkMellon filed a proof of claim on Jan. 18, 2008, in theChapter 11 bankruptcy of Sentinel ManagementGroup, Inc. (“Sentinel”), seeking to recoverapproximately $312 million loaned to Sentinel andsecured by securities and cash in an accountmaintained by Sentinel at The Bank of New YorkMellon. Pursuant to a Plan of Reorganizationconfirmed by the Bankruptcy Court on Dec. 8, 2008,$370 million of cash has been set aside as a reserve, tobe used by The Bank of New York Mellon if its proofof claim is allowed in the bankruptcy.
On March 3, 2008, the bankruptcy trustee filed anadversary complaint against The Bank of New YorkMellon seeking to disallow The Bank of New YorkMellon’s claim and seeking damages against TheBank of New York Mellon for allegedly aiding andabetting Sentinel insiders in misappropriatingcustomer assets and improperly using them ascollateral for the loan. As previously disclosed, theCommodities Futures Trading Commission (“CFTC”)has been investigating The Bank of New York Mellonin connection with its relationship to Sentinel. Also aspreviously disclosed, The Bank of New York Mellonhas received a notice from the Division ofEnforcement (the “Division”) of the CFTC indicatingthat the Division is considering a recommendation tothe Commission that it file a civil enforcement actionagainst The Bank of New York Mellon for possibleviolations of the Commodity Exchange Act and CFTCregulations. The Bank of New York Mellon respondedto the CFTC on Jan. 29, 2010 explaining why itbelieves an enforcement action is unwarranted.
As previously disclosed, BNY Mellon is required tofile information and withholding tax returns with theIRS for its various business lines. In 2007, wediscovered certain inconsistencies in supportingdocumentation and records for BNY Mellon’scorporate trust business and other business lines, andinitiated an extensive company-wide review. Wedisclosed this matter to the IRS on a voluntary basisand we continue to cooperate with the IRS in itsreview of this matter. BNY Mellon has recorded a $13million reserve as of Dec. 31, 2009, which representsits estimate of the potential tax reportinginconsistencies based on the remediation status anddiscussions with the IRS to date.
As previously disclosed, in 2001 we entered into atransaction that involved the payment of U.K.corporate income taxes that were credited against ourU.S. corporate income tax liability. On Aug. 17, 2009,we received a Statutory Notice of Deficiencydisallowing tax benefits for the 2001 and 2002 taxyears related to this transaction. The total exposure onthis transaction for all years (2001-2006) isapproximately $900 million, including interest. OnNov. 10, 2009, BNY Mellon filed a petition with theU.S. Tax Court contesting the disallowance of thebenefits. A final decision is not expected before 2011.
BNY Mellon believes the tax benefits associated withthe transaction were consistent with statutory andjudicial authority existing at the time the transactionwas entered into. In the event BNY Mellon is
BNY Mellon 147
Notes to Consolidated Financial Statements (continued)
unsuccessful in defending its position, the IRS hasagreed not to assess underpayment penalties.
Based on a probability assessment of various potentialoutcomes, we currently believe our accruals for taxliabilities are adequate for all open years. Probabilitiesand outcomes are reviewed as events unfold, andadjustments to the tax liabilities are made whenappropriate.
As previously disclosed, BNY Mellon self-disclosedto the SEC, in April 2008, that Mellon FinancialMarkets LLC (“MFM”) placed orders on behalf ofissuers to purchase their own Auction Rate Securities(“ARS”). The SEC and certain state authorities,including the Texas State Securities Board, FloridaOffice of Financial Regulation, and the New YorkAttorney General are investigating these transactions.MFM is cooperating fully with the investigations.
As previously disclosed, BNY Capital Markets, Inc.(now BNY Mellon Capital Markets LLC, “BNYMCM”) entered into a letter of Acceptance, Waiverand Consent with the Financial Industry RegulatoryAuthority, Inc. (“FINRA”) relating to the sale of ARSin April 2009. Two institutional customers notincluded in the FINRA settlement filed lawsuits inFebruary and April 2009 and one such customer filedan arbitration proceeding against BNY MCM inDecember 2008, alleging misrepresentations andomissions in the sale of ARS to them.
As previously disclosed, BNY Mellon became awareof circumstances suggesting that employees of MellonSecurities LLC (“Mellon Securities”), which executesorders to purchase and sell securities on behalf ofMellon Investor Services LLC, failed to comply withcertain best execution and regulatory requirements inconnection with agency cross trades. BNY Mellonself-disclosed this matter to FINRA and the SEC on avoluntary basis. In June 2009, the SEC obtained aformal order of investigation. Mellon Securities iscooperating fully with the investigation. We arecurrently in discussions with the SEC staff concerninga resolution to this matter. There can be no assurancewe will be able to reach an agreement.
As previously disclosed, a number of participants inthe securities lending program, which is associatedwith BNY Mellon’s asset servicing business, havefiled or threatened lawsuits against BNY Mellon or itsaffiliates. The lawsuits were filed on various dates in2008 and 2009. The participants allege that they haveincurred losses, including losses related toinvestments in Sigma Finance Inc. and Lehman
Brothers Holdings, Inc., and seek damages as to thoselosses. Certain of these cases seek to proceed as classactions. The participants assert contractual, statutory,and common law claims, including claims fornegligence and breach of fiduciary duty.
As previously disclosed, Bernard L. Madoff haspleaded guilty to engaging in a massive investmentfraud through his company, Bernard L. MadoffInvestment Securities LLC (“Madoff”). Ivy AssetManagement LLC (“Ivy”), a subsidiary of BNYMellon that primarily manages funds-of-hedge-funds,has not had any funds-of-funds investments withMadoff since 2000. Several investment managerscontracted with Ivy as a sub-advisor and one pensionfund contracted with Ivy as investment manager; aportion of these funds were invested with Madoff andlikely suffered losses as a result of the Madoff fraud.
In 2008 and 2009, BNY Mellon and its affiliates,including Ivy, received subpoenas and documentrequests in connection with a number of regulatoryinquiries regarding Madoff and have been cooperatingwith these inquiries.
BNY Mellon or its affiliates have been named in anumber of civil lawsuits filed in December 2008 andon various dates in 2009 relating to certain investmentfunds that invested money with Madoff. Ivy acted as asub-advisor to the managers of some of those funds.Plaintiffs allege that the funds suffered losses inconnection with the Madoff investments. Plaintiffsassert various causes of action against BNY Mellon orits affiliates, and other parties, including securities andcommon-law fraud. Certain of the cases seek toproceed as class actions and/or to assert derivativeclaims on behalf of the funds.
As previously disclosed, The Bank of New YorkMellon has been named as a defendant in a number ofputative class actions and non-class actions broughtby numerous plaintiffs, in connection with its role asindenture trustee for debt issued by affiliates ofMedical Capital Corporation (“Medical Capital”). Theactions, filed in late 2009, allege that The Bank ofNew York Mellon breached its fiduciary andcontractual obligations to the holders of theunderlying securities, and seek unspecified damages.In a separate action, the SEC has alleged that MedicalCapital, along with certain of its affiliates andprincipals, engaged in securities fraud. The courtordered the appointment of a permanent receiver overMedical Capital. The Bank of New York Mellon isnot a party to the SEC action.
148 BNY Mellon

Notes to Consolidated Financial Statements (continued)
Beginning in December 2009, certain governmentalauthorities requested information or served subpoenason BNY Mellon, seeking information relating toforeign exchange trades executed in connection withcustody services BNY Mellon provides to certaingovernmental entities and public pension plans. BNYMellon is cooperating with these inquiries.
27. Derivative instruments
We use derivatives to manage exposure to marketrisk, interest rate risk, credit risk and foreign currencyrisk, to generate profits from proprietary trading andto assist customers with their risk managementobjectives.
The notional amounts for derivative financialinstruments express the dollar volume of thetransactions; however, credit risk is much smaller. Weperform credit reviews and enter into nettingagreements to minimize the credit risk of foreigncurrency and interest rate risk management products.We enter into offsetting positions to reduce exposureto foreign exchange and interest rate risk.
Use of derivative financial instruments involvesreliance on counterparties. Failure of a counterparty tohonor its obligation under a derivative contract is arisk we assume whenever we engage in a derivativecontract. In 2009 and 2008, counterparty defaultlosses on both trading and hedging derivatives were$4 million and $20 million, respectively.
Hedging derivatives
We utilize interest rate swap agreements to manageour exposure to interest rate fluctuations. For hedgesof fixed-rate loans, asset-backed securities, depositsand long-term debt, the hedge documentationspecifies the terms of the hedged items and theinterest rate swaps and indicates that the derivative ishedging a fixed-rate item and is a fair value hedge,that the hedge exposure is to the changes in the fairvalue of the hedged item due to changes in benchmarkinterest rates, and that the strategy is to eliminate fairvalue variability by converting fixed-rate interestpayments to LIBOR.
The fixed rate loans hedged generally have an originalmaturity of 10 to 11 years and are not callable. Theseloans are hedged with “pay fixed rate, receive variablerate” swaps with similar notional amounts, maturities,and fixed rate coupons. The swaps are not callable. AtDec. 31, 2009, $1 million of loans were hedged with
interest rate swaps, which had notional values of $1million.
The securities hedged have an original weightedaverage life of 10 years or less and are generallycallable six months prior to maturity. These securitiesare hedged with “pay fixed rate, receive variable rate”swaps of the same maturity, repricing and fixed ratecoupon. At Dec. 31, 2009, $211 million of securitieswere hedged with interest rate swaps that had notionalvalues of $211 million.
The fixed rate deposits hedged generally have originalmaturities of 5 to 11 years and are not callable. Thesedeposits are hedged with receive fixed rate, payvariable rate swaps of similar maturity, repricing andfixed rate coupon. The swaps are not callable. AtDec. 31, 2009, $25 million of deposits were hedgedwith interest rate swaps that had notional values of$25 million.
The fixed rate long-term debt hedged generally haveoriginal maturities of 5 to 30 years. We issue bothcallable and non-callable debt. The non-callable debtis hedged with simple interest rate swaps similar tothose described for deposits. Callable debt is hedgedwith callable swaps where the call dates of the swapsexactly match the call dates of the debt. At Dec. 31,2009, $12.1 billion of debt was hedged with interestrate swaps that had notional values of $11.6 billion.
In addition, we enter into foreign exchange hedges.We use forward foreign exchange contracts withmaturities of 12 months or less to hedge our Sterling,Euro and Indian Rupee foreign exchange exposurewith respect to forecasted revenue transactions innon-U.S. entities that have the U.S. dollar as theirfunctional currency. As of Dec. 31, 2009, the hedgedforecasted foreign currency transactions and linkedFX forward hedges were $109 million (notional), with$0.3 million of pre-tax losses recorded in othercomprehensive income. These losses are expected tobe reclassified to income over the next nine months.
We also use forward foreign exchange contracts withoriginal maturities of 10 months or less to hedge ourEuro and Japanese Yen foreign exchange exposurewith respect to forecasted foreign currency netrevenue where we cannot elect hedge accounting. AtDec. 31, 2009, these economic hedges had a U.S.dollar equivalent notional value of $37 million, with$3.6 million of pre-tax losses from those FX forwardhedges recorded in foreign exchange and other tradingactivities.
BNY Mellon 149
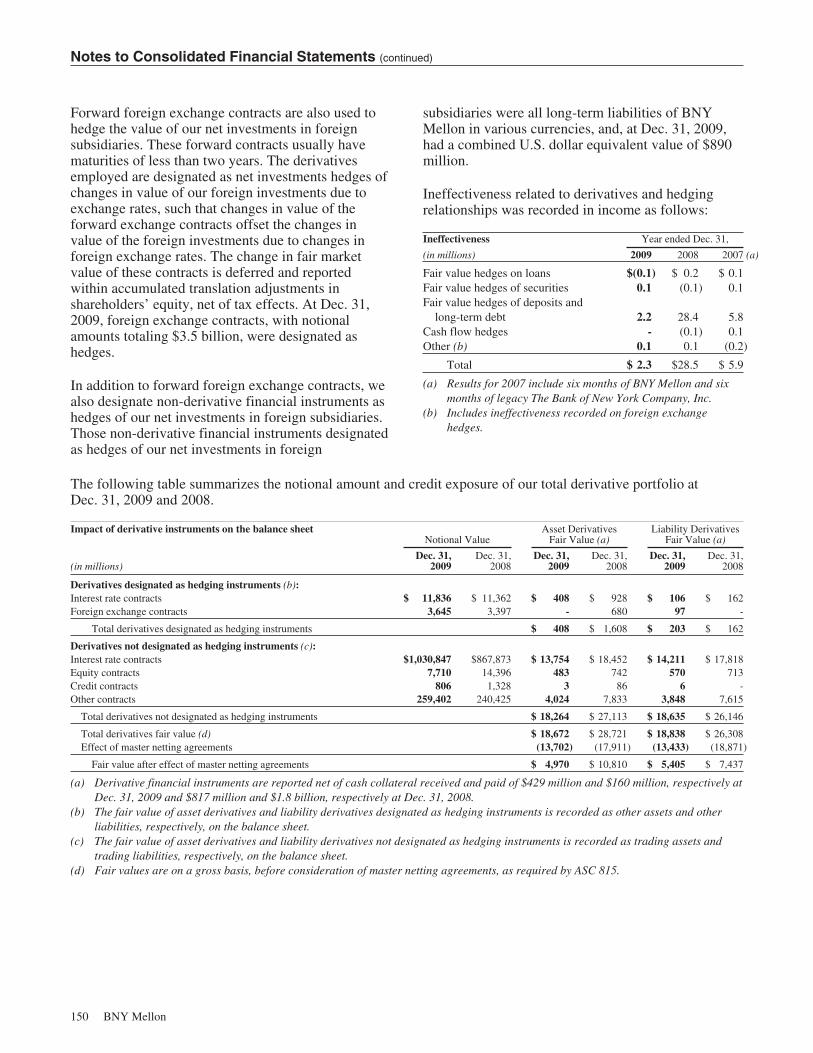
Notes to Consolidated Financial Statements (continued)
Forward foreign exchange contracts are also used tohedge the value of our net investments in foreignsubsidiaries. These forward contracts usually havematurities of less than two years. The derivativesemployed are designated as net investments hedges ofchanges in value of our foreign investments due toexchange rates, such that changes in value of theforward exchange contracts offset the changes invalue of the foreign investments due to changes inforeign exchange rates. The change in fair marketvalue of these contracts is deferred and reportedwithin accumulated translation adjustments inshareholders’ equity, net of tax effects. At Dec. 31,2009, foreign exchange contracts, with notionalamounts totaling $3.5 billion, were designated ashedges.
In addition to forward foreign exchange contracts, wealso designate non-derivative financial instruments ashedges of our net investments in foreign subsidiaries.Those non-derivative financial instruments designatedas hedges of our net investments in foreign
subsidiaries were all long-term liabilities of BNYMellon in various currencies, and, at Dec. 31, 2009,had a combined U.S. dollar equivalent value of $890million.
Ineffectiveness related to derivatives and hedgingrelationships was recorded in income as follows:
Ineffectiveness Year ended Dec. 31,
(in millions) 2009 2008 2007 (a)
Fair value hedges on loans $(0.1) $ 0.2 $ 0.1Fair value hedges of securities 0.1 (0.1) 0.1Fair value hedges of deposits and
long-term debt 2.2 28.4 5.8Cash flow hedges - (0.1) 0.1Other (b) 0.1 0.1 (0.2)
Total $ 2.3 $28.5 $ 5.9
(a) Results for 2007 include six months of BNY Mellon and sixmonths of legacy The Bank of New York Company, Inc.
(b) Includes ineffectiveness recorded on foreign exchangehedges.
The following table summarizes the notional amount and credit exposure of our total derivative portfolio atDec. 31, 2009 and 2008.
Impact of derivative instruments on the balance sheetNotional Value
Asset DerivativesFair Value (a)
Liability DerivativesFair Value (a)
(in millions)Dec. 31,
2009Dec. 31,
2008Dec. 31,
2009Dec. 31,
2008Dec. 31,
2009Dec. 31,
2008
Derivatives designated as hedging instruments (b):Interest rate contracts $ 11,836 $ 11,362 $ 408 $ 928 $ 106 $ 162Foreign exchange contracts 3,645 3,397 - 680 97 -
Total derivatives designated as hedging instruments $ 408 $ 1,608 $ 203 $ 162
Derivatives not designated as hedging instruments (c):Interest rate contracts $1,030,847 $867,873 $ 13,754 $ 18,452 $ 14,211 $ 17,818Equity contracts 7,710 14,396 483 742 570 713Credit contracts 806 1,328 3 86 6 -Other contracts 259,402 240,425 4,024 7,833 3,848 7,615
Total derivatives not designated as hedging instruments $ 18,264 $ 27,113 $ 18,635 $ 26,146
Total derivatives fair value (d) $ 18,672 $ 28,721 $ 18,838 $ 26,308Effect of master netting agreements (13,702) (17,911) (13,433) (18,871)
Fair value after effect of master netting agreements $ 4,970 $ 10,810 $ 5,405 $ 7,437
(a) Derivative financial instruments are reported net of cash collateral received and paid of $429 million and $160 million, respectively atDec. 31, 2009 and $817 million and $1.8 billion, respectively at Dec. 31, 2008.
(b) The fair value of asset derivatives and liability derivatives designated as hedging instruments is recorded as other assets and otherliabilities, respectively, on the balance sheet.
(c) The fair value of asset derivatives and liability derivatives not designated as hedging instruments is recorded as trading assets andtrading liabilities, respectively, on the balance sheet.
(d) Fair values are on a gross basis, before consideration of master netting agreements, as required by ASC 815.
150 BNY Mellon

Notes to Consolidated Financial Statements (continued)
At Dec. 31, 2009 approximately $619 billion(notional) of interest rate contracts will mature withinone year, $244 billion between one and five years, andthe balance after five years. At Dec. 31, 2009approximately $250 billion (notional) of foreign
exchange contracts will mature within one year, $8billion between one and five years, and the balanceafter five years.
Impact of derivative instruments on the income statement(in millions)
Derivatives in fair value hedgingrelationships
Location of gain (loss)recognized in income on
derivatives
Amount ofgain (loss) recognized in
income on derivativesYear ended Dec. 31,
Location of gain (loss)recognized in income on
hedged item
Amount of gain(loss) recognizedin hedged item
Year ended Dec. 31,2009 2008 2009 2008
Interest rate contracts Net interest revenue $(406) $632 Net interest revenue $408 $(603)
Derivatives in cash flowhedging relationships
Amount ofgain (loss)
recognized in OCIon derivative
(effective portion)Year ended Dec. 31,
Location of gain(loss) reclassifiedfrom accumulatedOCI into income
(effective portion)
Amount of gain(loss) reclassifiedfrom accumulatedOCI into income
(effective portion)Year ended Dec. 31,
Location of gain(loss) recognized in
income on derivatives(ineffective portion andamount excluded fromeffectiveness testing)
Amount of gain (loss)recognized in income on
derivatives (ineffectivenessportion and amount
excluded fromeffectiveness testing)Year ended Dec. 31,
2009 2008 2009 2008 2009 2008
Interest rate contracts $ - $30.0 Net interest revenue $25.9 $ 3.3 Net interest revenue $- $(0.1)FX contracts (1.4) 14.4 Other revenue 5.9 7.5 Other revenue - -
Total $(1.4) $44.4 $31.8 $10.8 $- $(0.1)
Derivatives in netinvestment hedgingrelationships
Amount ofgain (loss)
recognized in OCIon derivatives
(effective portion)Year ended Dec. 31,
Location of gain(loss) reclassifiedfrom accumulatedOCI into income
(effective portion)
Amount of gain(loss) reclassifiedfrom accumulatedOCI into income
(effective portion)Year ended Dec. 31,
Location of gain(loss) recognized in
income on derivative(ineffective portion andamount excluded fromeffectiveness testing)
Amount of gain (loss)Recognized in income on
derivatives (Ineffectivenessportion and amount
excluded fromeffectiveness testing)Year ended Dec. 31,
2009 2008 2009 2008 2009 2008
FX contracts $(298) $848 Net interest revenue $- $- Other revenue $0.1 $0.1
Trading activities (including trading derivatives)
Our trading activities are focused on acting as amarket maker for our customers. The risk from thesemarket-making activities and from our own positionsis managed by our traders and limited in totalexposure as described below.
We manage trading risk through a system of positionlimits, a value-at-risk (“VAR”) methodology based onMonte Carlo simulations, stop loss advisory triggers,and other market sensitivity measures. Risk ismonitored and reported to senior management by aseparate unit on a daily basis. Based on certainassumptions, the VAR methodology is designed tocapture the potential overnight pre-tax dollar lossfrom adverse changes in fair values of all tradingpositions. The calculation assumes a one-day holding
period for most instruments, utilizes a 99% confidencelevel, and incorporates the non-linear characteristicsof options. The VAR model is one of severalstatistical models used to develop economic capitalresults, which are allocated to lines of business forcomputing risk-adjusted performance.
As the VAR methodology does not evaluate riskattributable to extraordinary financial, economic orother occurrences, the risk assessment processincludes a number of stress scenarios based upon therisk factors in the portfolio and management’sassessment of market conditions. Additional stressscenarios based upon historic market events are alsoperformed. Stress tests, by their design, incorporatethe impact of reduced liquidity and the breakdown ofobserved correlations. The results of these stress testsare reviewed weekly with senior management.
BNY Mellon 151
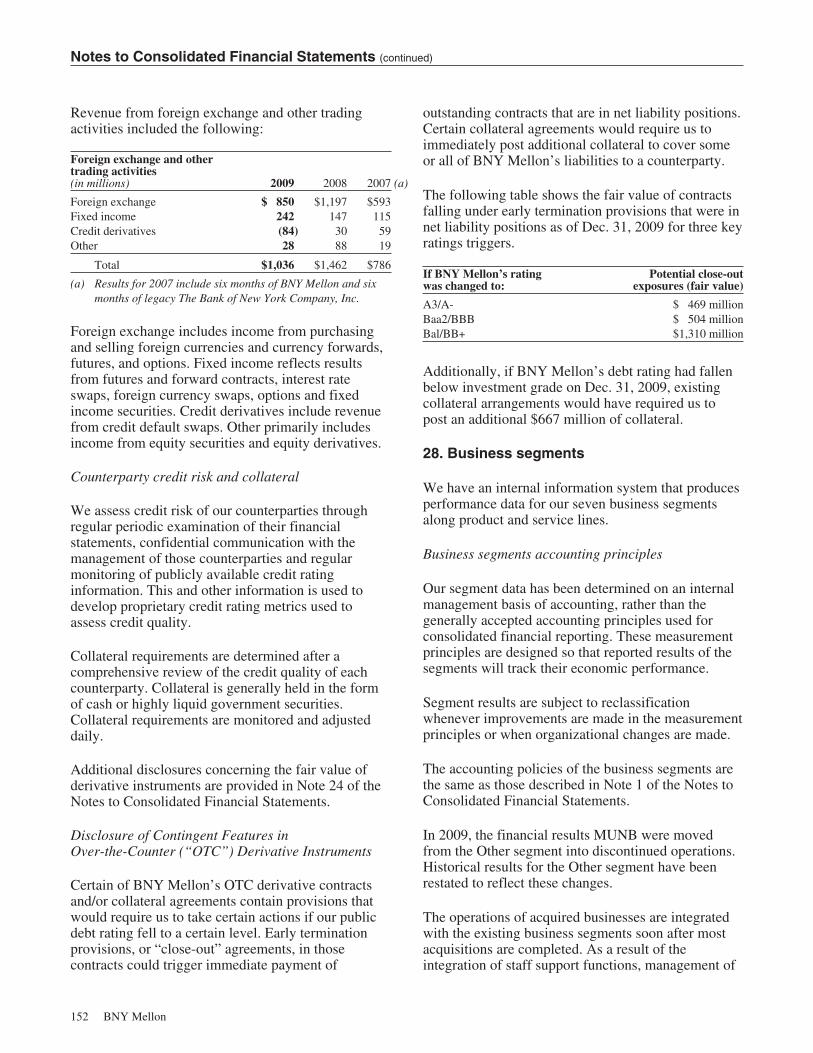
Notes to Consolidated Financial Statements (continued)
Revenue from foreign exchange and other tradingactivities included the following:
Foreign exchange and othertrading activities(in millions) 2009 2008 2007 (a)
Foreign exchange $ 850 $1,197 $593Fixed income 242 147 115Credit derivatives (84) 30 59Other 28 88 19
Total $1,036 $1,462 $786
(a) Results for 2007 include six months of BNY Mellon and sixmonths of legacy The Bank of New York Company, Inc.
Foreign exchange includes income from purchasingand selling foreign currencies and currency forwards,futures, and options. Fixed income reflects resultsfrom futures and forward contracts, interest rateswaps, foreign currency swaps, options and fixedincome securities. Credit derivatives include revenuefrom credit default swaps. Other primarily includesincome from equity securities and equity derivatives.
Counterparty credit risk and collateral
We assess credit risk of our counterparties throughregular periodic examination of their financialstatements, confidential communication with themanagement of those counterparties and regularmonitoring of publicly available credit ratinginformation. This and other information is used todevelop proprietary credit rating metrics used toassess credit quality.
Collateral requirements are determined after acomprehensive review of the credit quality of eachcounterparty. Collateral is generally held in the formof cash or highly liquid government securities.Collateral requirements are monitored and adjusteddaily.
Additional disclosures concerning the fair value ofderivative instruments are provided in Note 24 of theNotes to Consolidated Financial Statements.
Disclosure of Contingent Features inOver-the-Counter (“OTC”) Derivative Instruments
Certain of BNY Mellon’s OTC derivative contractsand/or collateral agreements contain provisions thatwould require us to take certain actions if our publicdebt rating fell to a certain level. Early terminationprovisions, or “close-out” agreements, in thosecontracts could trigger immediate payment of
outstanding contracts that are in net liability positions.Certain collateral agreements would require us toimmediately post additional collateral to cover someor all of BNY Mellon’s liabilities to a counterparty.
The following table shows the fair value of contractsfalling under early termination provisions that were innet liability positions as of Dec. 31, 2009 for three keyratings triggers.
If BNY Mellon’s ratingwas changed to:
Potential close-outexposures (fair value)
A3/A- $ 469 millionBaa2/BBB $ 504 millionBal/BB+ $1,310 million
Additionally, if BNY Mellon’s debt rating had fallenbelow investment grade on Dec. 31, 2009, existingcollateral arrangements would have required us topost an additional $667 million of collateral.
28. Business segments
We have an internal information system that producesperformance data for our seven business segmentsalong product and service lines.
Business segments accounting principles
Our segment data has been determined on an internalmanagement basis of accounting, rather than thegenerally accepted accounting principles used forconsolidated financial reporting. These measurementprinciples are designed so that reported results of thesegments will track their economic performance.
Segment results are subject to reclassificationwhenever improvements are made in the measurementprinciples or when organizational changes are made.
The accounting policies of the business segments arethe same as those described in Note 1 of the Notes toConsolidated Financial Statements.
In 2009, the financial results MUNB were movedfrom the Other segment into discontinued operations.Historical results for the Other segment have beenrestated to reflect these changes.
The operations of acquired businesses are integratedwith the existing business segments soon after mostacquisitions are completed. As a result of theintegration of staff support functions, management of
152 BNY Mellon

Notes to Consolidated Financial Statements (continued)
customer relationships, operating processes and thefinancial impact of funding acquisitions, we cannot
precisely determine the impact of acquisitions onincome before taxes and therefore do not report it.
We provide segment data for seven segments, with certain segments combined into sector groupings as shownbelow:
Sector/Segment Primary types of revenueAsset and Wealth Management sector
Asset Management segment Š Asset and wealth management fees from:Mutual fundsInstitutional clientsPrivate clientsPerformance fees
Š Distribution and servicing fees
Wealth Management segment Š Wealth management fees from high-net-worthindividuals, families, endowments andfoundations and related entities.
Institutional Services sector
Asset Servicing segment Š Asset servicing fees, including:Institutional trust and custody feesBroker-dealer servicesSecurities lending
Š Foreign exchange
Issuer Services segment Š Issuer services fees, including:Corporate trustDepositary receiptsEmployee investment plan servicesShareowner services
Clearing Services segment Š Clearing services fees, including:Broker-dealer servicesRegistered investment advisor services
Treasury Services segment Š Treasury services fees, including:Global payment servicesWorking capital solutions
Š Financing-related fees
Other segment Š Leasing operationsŠ Corporate treasury activitiesŠ Global markets and institutional banking
servicesŠ Business exitsŠ M&I expenses
BNY Mellon 153
Notes to Consolidated Financial Statements (continued)
Business segment information is reported on acontinuing operations basis for all periods presented.See Note 4 of the Notes to Consolidated FinancialStatements for a discussion of discontinuedoperations.
The results of our business segments are presentedand analyzed on an internal management reportingbasis:
Š Revenue amounts reflect fee and other revenuegenerated by each segment. Fee and otherrevenue transferred between segments underrevenue transfer agreements is included withinother revenue in each segment.
Š Revenues and expenses associated with specificclient bases are included in those segments. Forexample, foreign exchange activity associatedwith clients using custody products is allocatedto the Asset Servicing segment.
Š Net interest revenue is allocated to segmentsbased on the yields on the assets and liabilitiesgenerated by each segment. We employ a fundstransfer pricing system that matches funds withthe specific assets and liabilities of each segmentbased on their interest sensitivity and maturitycharacteristics.
Š Support and other indirect expenses areallocated to segments based on internally-developed methodologies.
Š The FDIC special emergency deposit assessmentis considered a corporate charge and wastherefore recorded in the Other segment.Recurring FDIC expense is allocated tosegments based on average deposits generatedwithin each segment.
Š Management of the investment securitiesportfolio is a shared service contained in theOther segment. As a result, gains and lossesassociated with the valuation of the securitiesportfolio are included in the Other segment.
Š Support agreement charges are recorded in thesegment in which the charges occurred.
Š The restructuring charges recorded in 2009 and2008 resulted from corporate initiatives andtherefore were recorded in the Other segment.
Š Balance sheet assets and liabilities and theirrelated income or expense are specificallyassigned to each segment. Segments with a netliability position have been allocated assets.
Š Goodwill and intangible assets are reflectedwithin individual business segments.
Š M&I expenses are a corporate level item and aretherefore recorded in the Other segment.
Š The operations of Mellon Financial are includedfrom July 1, 2007, the effective date of themerger.
The merger with Mellon Financial had a considerableimpact on the comparison of business segment resultsfrom 2008 compared with 2007. The mergersignificantly impacted the Asset Management, WealthManagement and Asset Servicing segments and, to alesser extent, the Issuer Services, Treasury Servicesand the Other segments.
Total revenue includes approximately $1.6 billion and$2.0 billion in 2009 and 2008, respectively, ofinternational operations domiciled in the U.K. whichis 21% and 14% of total revenue, respectively.
154 BNY Mellon

Notes to Consolidated Financial Statements (continued)
The following consolidating schedules show the contribution of our segments to our overall profitability.
For the year ended Dec. 31, 2009
(dollars in millions)Asset
ManagementWealth
Management
Total Assetand Wealth
ManagementSector
AssetServicing
IssuerServices
ClearingServices
TreasuryServices
TotalInstitutional
ServicesSector
OtherSegment
TotalContinuingOperations
Fee and other revenue $ 2,280 $ 578 $ 2,858 $ 3,369 $ 1,611 $ 1,190 $ 878 $ 7,048 $ (5,134) $ 4,772Net interest revenue 31 194 225 892 768 340 616 2,616 74 2,915
Total revenue $ 2,311 $ 772 $ 3,083 $ 4,261 $ 2,379 $ 1,530 $ 1,494 9,664 (5,060) 7,687
Provision for creditlosses - 1 1 - - - - - 331 332
Noninterest expense 1,948 578 2,526 2,941 1,302 1,021 794 6,058 979 9,563
Income before taxes $ 363 $ 193 $ 556 $ 1,320 $ 1,077 $ 509 $ 700 $ 3,606 $ (6,370) $ (2,208)
Pre-tax operatingmargin (a) 16% 25% 18% 31% 45% 33% 47% 37% N/M N/M
Average assets $12,567 $9,278 $21,845 $60,804 $50,746 $18,455 $26,046 $156,051 $32,043 $209,939 (b)
For the year ended Dec. 31, 2008
(dollars in millions)Asset
ManagementWealth
Management
Total Assetand Wealth
ManagementSector
AssetServicing
IssuerServices
ClearingServices
TreasuryServices
TotalInstitutional
ServicesSector
OtherSegment
TotalContinuingOperations
Fee and other revenue $ 2,794 $ 624 $ 3,418 $ 4,416 $ 1,851 $ 1,292 $ 977 $ 8,536 $ (1,240) $ 10,714Net interest revenue 75 200 275 1,086 710 321 730 2,847 (263) 2,859
Total revenue 2,869 824 3,693 5,502 2,561 1,613 1,707 11,383 (1,503) 13,573
Provision for credit losses - - - - - - - - 104 104Noninterest expense 2,641 634 3,275 3,783 1,413 1,130 840 7,166 1,082 11,523
Income before taxes $ 228 $ 190 $ 418 $ 1,719 $ 1,148 $ 483 $ 867 $ 4,217 $ (2,689) $ 1,946
Pre-tax operating margin (a) 8% 23% 11% 31% 45% 30% 51% 37% N/M 14%Average assets $13,267 $10,044 $23,311 $59,150 $35,169 $18,358 $25,603 $138,280 $45,925 $207,516 (b)
For the year ended Dec. 31, 2007 (c)
(dollars in millions)Asset
ManagementWealth
Management
Total Assetand Wealth
ManagementSector
AssetServicing
IssuerServices
ClearingServices
TreasuryServices
TotalInstitutional
ServicesSector
OtherSegment
TotalContinuingOperations
Fee and other revenue $1,872 $ 423 $ 2,295 $ 2,957 $ 1,660 $ 1,130 $ 741 $ 6,488 $ 270 $ 9,053Net interest revenue 10 111 121 693 567 303 521 2,084 40 2,245
Total revenue 1,882 534 2,416 3,650 2,227 1,433 1,262 8,572 310 11,298
Provision for credit losses - - - - - - - - (11) (11)Noninterest expense 1,372 413 1,785 2,497 1,159 1,047 663 5,366 943 8,094
Income before taxes $ 510 $ 121 $ 631 $ 1,153 $ 1,068 $ 386 $ 599 $ 3,206 $ (622) $ 3,215
Pre-tax operating margin (a) 27% 23% 26% 32% 48% 27% 47% 37% N/M 28%Average assets $7,636 $5,702 $13,338 $38,016 $25,658 $14,967 $18,497 $97,138 $36,771 $147,247 (b)
(a) Income before taxes divided by total revenue(b) Including average assets of discontinued operations of $2,188 million in 2009, $2,441 million in 2008 and $1,395 million in 2007,
consolidated average assets were $212,127 million for 2009, $209,957 million for 2008 and $148,642 million for 2007.(c) Results for 2007 include six months of BNY Mellon and six months legacy The Bank of New York Company, Inc.
BNY Mellon 155
Report of Independent Registered Public Accounting Firm
The Board of Directors and ShareholdersThe Bank of New York Mellon Corporation:
We have audited the accompanying consolidated balance sheets of The Bank of New York Mellon Corporationand subsidiaries (“BNY Mellon”) as of December 31, 2009 and 2008, and the related consolidated statements ofincome, changes in equity, and cash flows for each of the years in the three-year period ended December 31, 2009.These consolidated financial statements are the responsibility of BNY Mellon’s management. Our responsibility isto express an opinion on these consolidated financial statements based on our audits.
We conducted our audits in accordance with the standards of the Public Company Accounting Oversight Board(United States). Those standards require that we plan and perform the audit to obtain reasonable assurance aboutwhether the financial statements are free of material misstatement. An audit includes examining, on a test basis,evidence supporting the amounts and disclosures in the financial statements. An audit also includes assessing theaccounting principles used and significant estimates made by management, as well as evaluating the overallfinancial statement presentation. We believe that our audits provide a reasonable basis for our opinion.
In our opinion, the consolidated financial statements referred to above present fairly, in all material respects, thefinancial position of BNY Mellon as of December 31, 2009 and 2008, and the results of their operations and theircash flows for each of the years in the three-year period ended December 31, 2009, in conformity withU.S. generally accepted accounting principles.
As discussed in Note 2 to the consolidated financial statements, in 2009, BNY Mellon changed their methods ofaccounting for other-than-temporary impairments and, in 2008, changed their methods of accounting for fair valuemeasurements and elected the fair value option for certain financial assets.
We also have audited, in accordance with the standards of the Public Company Accounting Oversight Board(United States), BNY Mellon’s internal control over financial reporting as of December 31, 2009, based on criteriaestablished in Internal Control—Integrated Framework issued by the Committee of Sponsoring Organizations ofthe Treadway Commission (COSO), and our report dated February 26, 2010 expressed an unqualified opinion onthe effectiveness of BNY Mellon’s internal control over financial reporting.
New York, New YorkFebruary 26, 2010
156 BNY Mellon

Directors, Senior Management and Executive Committee
Directors
Ruth E. BruchRetired Senior Vice President andChief Information OfficerKellogg CompanyCereal and convenience foods
Nicholas M. DonofrioRetired Executive Vice President,Innovation and TechnologyIBM CorporationDeveloper, manufacturer and providerof advanced information technologiesand services
Gerald L. HassellPresidentThe Bank of New York MellonCorporation
Edmund F. (Ted) KellyChairman, President and ChiefExecutive OfficerLiberty Mutual GroupMulti-line insurance company
Robert P. KellyChairman and Chief Executive OfficerThe Bank of New York MellonCorporation
Richard J. KoganRetired Chairman, President and ChiefExecutive OfficerSchering-Plough CorporationInternational research-baseddevelopment and manufacturing
Michael J. KowalskiChairman and Chief Executive OfficerTiffany & Co.International designer, manufacturerand distributor of jewelry and finegoods
John A. Luke, Jr.Chairman and Chief Executive OfficerMeadWestvaco CorporationManufacturer of paper, packaging andspecialty chemicals
Robert MehrabianChairman, President and ChiefExecutive OfficerTeledyne Technologies, Inc.Advanced industrial technologies
Mark A. NordenbergChancellor and Chief Executive OfficerUniversity of PittsburghMajor public research university
Catherine A. ReinRetired Senior Executive VicePresident and Chief AdministrativeOfficerMetLife, Inc.Insurance and financial servicescompany
William C. RichardsonPresident and Chief Executive OfficerEmeritusThe W. K. Kellogg FoundationPrivate foundation
Samuel C. Scott IIIRetired Chairman, President and ChiefExecutive OfficerCorn Products International, Inc.Global producers of corn-refinedproducts and ingredients
John P. SurmaChairman and Chief Executive OfficerUnited States Steel CorporationSteel manufacturing
Wesley W. von SchackRetired Chairman, President and ChiefExecutive OfficerEnergy East CorporationEnergy services company
Senior Management
Robert P. KellyChairman and Chief Executive Officer
Gerald L. HassellPresident
Executive Committee
Richard F. BruecknerChief Executive Officer,Pershing LLC
Arthur CertosimoChief Executive Officer,Broker-Dealer Services andAlternative Investment Services
Steven G. ElliottSenior Vice Chairman
Thomas P. (Todd) GibbonsChief Financial Officer
Timothy F. KeaneyCo-Chief Executive Officer,BNY Mellon Asset Servicing
Carl KrasikGeneral Counsel
David F. LamereChief Executive Officer,BNY Mellon Wealth Management
Jonathan LittleVice Chairman, BNY Mellon AssetManagementChairman, BNY Mellon AssetManagement International
Ronald P. O’HanleyChief Executive Officer,BNY Mellon Asset Management
James P. PalermoCo-Chief Executive Officer,BNY Mellon Asset Servicing
Karen B. PeetzChief Executive Officer,Financial Markets and TreasuryServices
Lisa B. PetersChief Human Resources Officer
Brian G. RoganChief Risk Officer
Kurt D. WoetzelChief Information Officer
BNY Mellon 157
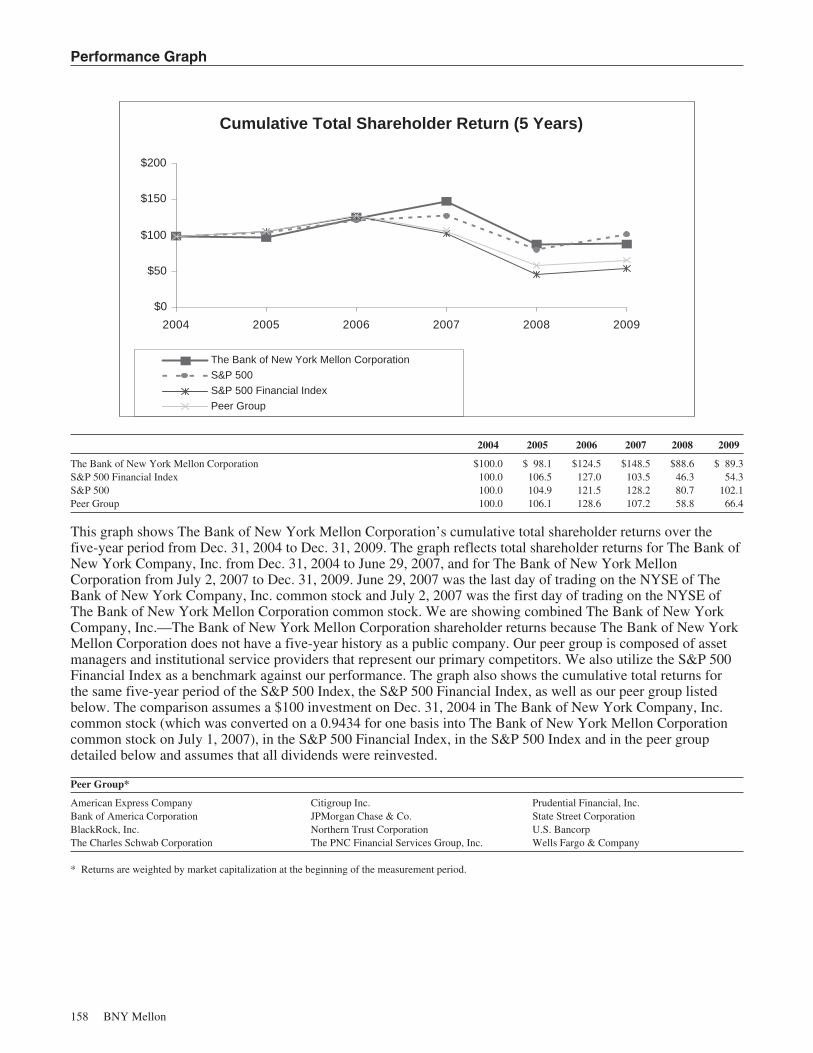
Performance Graph
Cumulative Total Shareholder Return (5 Years)
$0
$50
$100
$150
$200
2004 2005 2006 2007 2008 2009
The Bank of New York Mellon Corporation
S&P 500
S&P 500 Financial Index
Peer Group
2004 2005 2006 2007 2008 2009
The Bank of New York Mellon Corporation $100.0 $ 98.1 $124.5 $148.5 $88.6 $ 89.3S&P 500 Financial Index 100.0 106.5 127.0 103.5 46.3 54.3S&P 500 100.0 104.9 121.5 128.2 80.7 102.1Peer Group 100.0 106.1 128.6 107.2 58.8 66.4
This graph shows The Bank of New York Mellon Corporation’s cumulative total shareholder returns over thefive-year period from Dec. 31, 2004 to Dec. 31, 2009. The graph reflects total shareholder returns for The Bank ofNew York Company, Inc. from Dec. 31, 2004 to June 29, 2007, and for The Bank of New York MellonCorporation from July 2, 2007 to Dec. 31, 2009. June 29, 2007 was the last day of trading on the NYSE of TheBank of New York Company, Inc. common stock and July 2, 2007 was the first day of trading on the NYSE ofThe Bank of New York Mellon Corporation common stock. We are showing combined The Bank of New YorkCompany, Inc.—The Bank of New York Mellon Corporation shareholder returns because The Bank of New YorkMellon Corporation does not have a five-year history as a public company. Our peer group is composed of assetmanagers and institutional service providers that represent our primary competitors. We also utilize the S&P 500Financial Index as a benchmark against our performance. The graph also shows the cumulative total returns forthe same five-year period of the S&P 500 Index, the S&P 500 Financial Index, as well as our peer group listedbelow. The comparison assumes a $100 investment on Dec. 31, 2004 in The Bank of New York Company, Inc.common stock (which was converted on a 0.9434 for one basis into The Bank of New York Mellon Corporationcommon stock on July 1, 2007), in the S&P 500 Financial Index, in the S&P 500 Index and in the peer groupdetailed below and assumes that all dividends were reinvested.
Peer Group*
American Express Company Citigroup Inc. Prudential Financial, Inc.Bank of America Corporation JPMorgan Chase & Co. State Street CorporationBlackRock, Inc. Northern Trust Corporation U.S. BancorpThe Charles Schwab Corporation The PNC Financial Services Group, Inc. Wells Fargo & Company
* Returns are weighted by market capitalization at the beginning of the measurement period.
158 BNY Mellon

TRANSFER AGENT AND REGISTRARBNY Mellon Shareowner Services 480 Washington Boulevard Jersey City, NJ 07310 www.bnymellon.com/shareowner
SHAREHOLDER SERVICES BNY Mellon Shareowner Services maintains the records for our registered shareholders and can provide a variety of services at no charge such as those involving: • Change of name or address• Consolidation of accounts • Duplicate mailings • Dividend reinvestment enrollment • Direct deposit of dividends • Transfer of stock to another person For assistance from BNY Mellon Shareowner Services, visit www.bnymellon.com/shareowner/isd or call +1 800 205 7699.
DIRECT STOCK PURCHASE AND DIVIDEND REINVESTMENT PLAN The Direct Stock Purchase and Dividend Reinvestment Plan provides a way to purchase shares of common stock directly from BNY Mellon at the current market value. Nonshareholders may purchase their first shares of BNY Mellon’s common stock through the Plan, and sharehold-ers may increase their shareholding by reinvesting cash dividends and through optional cash investments. Plan details are in a prospectus, which may be viewed online at www.bnymellon.com/shareowner/isd or obtained in a hard copy by calling +1 866 353 7849.
ELECTRONIC DEPOSIT OF DIVIDENDS Registered shareholders may have quarterly dividends paid on BNY Mellon’s common stock deposited elec-tronically to their checking or savings accounts, free of charge. To have your dividends deposited electronically, go to www.bnymellon.com/shareowner/isd to set up your account(s) for direct deposit. If you prefer, you may also send a written request by e-mail to [email protected] or by mail to BNY Mellon Shareowner Services, P.O. Box 358016, Pittsburgh, PA 15252-8016. For more information, call +1 800 205 7699.
SHAREHOLDER ACCOUNT ACCESS By Internet 24 hours a day/7 days a weekwww.bnymellon.com/shareowner/isd Shareholders can register to receive shareholder information electronically by enrolling in MLink. To enroll, access www.bnymellon.com/shareowner/isd and follow two easy steps.
By phone 24 hours a day/7 days a week Toll-free in the U.S. +1 800 205 7699 Outside the U.S. +1 201 680 6578 Telecommunications Device for the Deaf (TDD) lines Toll-free in the U.S. +1 800 231 5469 Outside the U.S. +1 201 680 6610
By mail BNY Mellon Shareowner ServicesP.O. Box 358016 Pittsburgh, PA 15252-8016
The contents of the listed Internet sites are not incorporated in this Annual Report.
CORPORATE INFORMATION
BNY Mellon is the corporate brand of The Bank of New York Mellon Corporation. BNY Mellon is a global financial services company focused on helping clients manage and service their financial assets, operating in 34 countries and serving more than 100 markets. The company is a leading provider of financial services for institutions, corporations and high-net-worth individuals, providing superior asset management and wealth management, asset servicing, issuer services, clearing services and treasury services through a worldwide client-focused team. At December 31, 2009, the company had $22.3 trillion in assets under custody and administration, $1.1 trillion in assets under management, serviced $12 trillion in outstanding debt and processed global payments averaging $1.6 trillion per day. Additional information is available at www.bnymellon.com.
CORPORATE HEADQUARTERSOne Wall Street, New York, NY 10286, + 1 212 495 1784 www.bnymellon.com
ANNUAL MEETING The Annual Meeting of Shareholders will be held in Pittsburgh, PA, at the Omni William Penn Hotel, 530 William Penn Place, at 9 a.m. Tuesday, April 13, 2010.
EXCHANGE LISTING BNY Mellon’s common stock is traded on the New York Stock Exchange under the trading symbol BK. BNY Capital IV 6.875% Preferred Trust Securities Series E (symbol BKPrE) and BNY Capital V 5.95% Preferred Trust Securities Series F (symbol BKPrF) are also listed on the New York Stock Exchange. STOCK PRICES Prices for BNY Mellon’s common stock can be viewed at www.bnymellon.com/investorrelations.
CORPORATE GOVERNANCE Corporate governance information is available online at www.bnymellon.com/governance.
CORPORATE SOCIAL RESPONSIBILITY Information about BNY Mellon’s commitment to corporate social responsibility, including our Equal Employment Opportunity/Affirmative Action policies, is available at www.bnymellon.com/csr. To obtain a copy of BNY Mellon’s Corporate Social Responsibility Report, e-mail [email protected].
INVESTOR RELATIONS Visit www.bnymellon.com/investorrelations or call +1 212 635 1855.
DIVIDEND PAYMENTS Subject to approval of the board of directors, dividends are paid on BNY Mellon’s common stock on or about the 10th day of February, May, August and November.
FORM 10-K AND SHAREHOLDER PUBLICATIONS For a free copy of BNY Mellon’s Annual Report on Form 10-K or quarterly reports on Form 10-Q as filed with the Securities and Exchange Commission, send a written request by e-mail to [email protected] or by mail to the Secretary of The Bank of New York Mellon Corporation, One Wall Street, New York, NY 10286.
The 2009 Annual Report, as well as Forms 10-K, 10-Q and 8-K and quarterly earnings and other news releases can be viewed and printed at www.bnymellon.com/investorrelations.

The Bank of New York Mellon CorporationOne Wall StreetNew York, NY 10286+1 212 495 1784
www.bnymellon.com